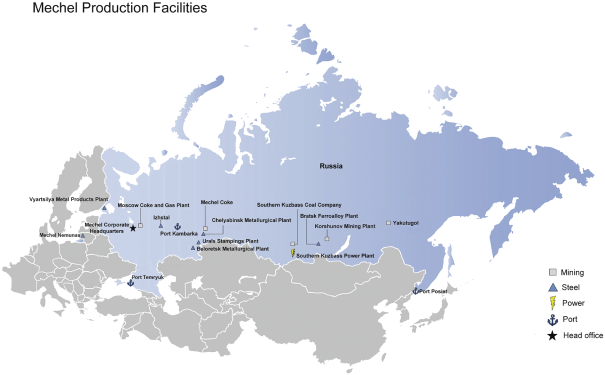
REGISTRATION STATEMENT PURSUANT TO SECTION 12(b) OR (g) OF THE SECURITIES EXCHANGE ACT OF 1934 |
ANNUAL REPORT PURSUANT TO SECTION 13 OR 15(d) OF THE SECURITIES EXCHANGE ACT OF 1934 |
TRANSITION REPORT PURSUANT TO SECTION 13 OR 15(d) OF THE SECURITIES EXCHANGE ACT OF 1934 |
SHELL COMPANY REPORT PURSUANT TO SECTION 13 OR 15(d) OF THE SECURITIES EXCHANGE ACT OF 1934 |
Title of Each Class |
Trading Symbol(s) |
Name of Each Exchange on Which Registered | ||
ADS REPRESENTING TWO |
||||
10 RUSSIAN RUBLES PER SHARE |
(1) | |||
, EACH PREFERRED ADS REPRESENTING ONE-HALF OF A PREFERRED SHARE |
||||
10 RUSSIAN RUBLES PER SHARE |
(2) |
Large accelerated filer ☐ | Non-accelerated filer ☐ |
Emerging growth company |
† | The term “new or revised financial accounting standard” refers to any update issued by the Financial Accounting Standards Board to its Accounting Standards Codification after April 5, 2012. |
U.S. GAAP ☐ |
the International Accounting Standards Board ☒ |
Other | ☐ |
(1) | Listed, not for trading or quotation purposes, but only in connection with the registration of common ADSs pursuant to the requirements of the Securities and Exchange Commission. |
(2) | Listed, not for trading or quotation purposes, but only in connection with the registration of preferred ADSs pursuant to the requirements of the Securities and Exchange Commission. |
6 |
||||||
7 |
||||||
Item 1. |
9 |
|||||
Item 2. |
9 |
|||||
Item 3. |
9 |
|||||
Item 4. |
62 |
|||||
Item 4A. |
132 |
|||||
Item 5. |
132 |
|||||
Item 6. |
167 |
|||||
Item 7. |
177 |
|||||
Item 8. |
178 |
|||||
Item 9. |
183 |
|||||
Item 10. |
183 |
|||||
Item 11. |
218 |
|||||
Item 12. |
219 |
|||||
Item 13. |
222 |
|||||
Item 14. |
223 |
|||||
Item 15. |
223 |
|||||
Item 16A. |
225 |
|||||
Item 16B. |
225 |
|||||
Item 16C. |
225 |
|||||
Item 16D. |
226 |
|||||
Item 16E. |
226 |
|||||
Item 16F. |
227 |
|||||
Item 16G. |
227 |
|||||
Item 16H. |
228 |
|||||
Item 16I. |
228 |
|||||
Item 17. |
229 |
|||||
Item 18. |
229 |
|||||
Item 19. |
230 |
|||||
232 |
Name as Used in This Document |
Official Name |
Location | ||
Mining |
||||
Mechel Mining |
Mechel Mining AO | Russia, Moscow | ||
Southern Kuzbass Coal Company |
Southern Kuzbass Coal Company PJSC | Russia, Kemerovo region | ||
Yakutugol |
Yakutugol Joint-Stock Holding Company | Russia, Sakha Republic | ||
Korshunov Mining Plant |
Korshunov Mining Plant PAO | Russia, Irkutsk region | ||
Moscow Coke and Gas Plant |
Moscow Coke and Gas Plant AO | Russia, Moscow region | ||
Mechel Coke |
Mechel Coke OOO | Russia, Chelyabinsk region | ||
Port Posiet |
Trade Port Posiet AO | Russia, Primorsky Krai | ||
Port Temryuk |
Port Mechel Temryuk OOO | Russia, Krasnodar Krai | ||
Steel |
||||
Chelyabinsk Metallurgical Plant |
Chelyabinsk Metallurgical Plant PAO | Russia, Chelyabinsk region | ||
Izhstal |
Izhstal PAO | Russia, Republic of Udmurtia | ||
Urals Stampings Plant |
Urals Stampings Plant PAO | Russia, Chelyabinsk region | ||
Beloretsk Metallurgical Plant |
Beloretsk Metallurgical Plant AO | Russia, Republic of Bashkortostan | ||
Vyartsilya Metal Products Plant |
Vyartsilya Metal Products Plant AO | Russia, Republic of Karelia | ||
Mechel Nemunas |
Mechel Nemunas UAB | Lithuania, Kaunas | ||
Bratsk Ferroalloy Plant |
Bratsk Ferroalloy Plant OOO | Russia, Irkutsk region | ||
Port Kambarka |
Port Kambarka AO | Russia, Republic of Udmurtia | ||
Power |
||||
Southern Kuzbass Power Plant |
Southern Kuzbass Power Plant PAO | Russia, Kemerovo region | ||
Kuzbass Power Sales Company |
Kuzbass Power Sales Company PAO | Russia, Kemerovo region | ||
Mechel Energo |
Mechel Energo OOO |
Russia, Chelyabinsk region | ||
Marketing and Distribution |
||||
Mechel Carbon |
Mechel Carbon AG | Switzerland, Baar | ||
Mechel Service Global |
Mechel Service Global B.V. | Netherlands, the Hague | ||
Mechel Service |
Mechel Service OOO | Russia, Moscow | ||
Other |
||||
Mecheltrans |
Mecheltrans OOO | Russia, Moscow |
• | Further development of situation with COVID-19 outbreak may result in lower demand for our products, negatively impact our revenues and adversely affect our results of operations. |
• | COVID-19 quarantine measures, including any import restrictions, may affect our ability to use the logistics infrastructure and deliver our products to the customers. |
• | COVID-19 outbreak may result in inability of the group to receive goods and services from suppliers that we need for our day-to-day |
• | Our operations could get disrupted if any of our employees test positive for COVID-19 after returning to office or the production plants, which in turn could have an adverse effect on our ability to continue operations. |
• | Our internal controls over financial reporting can be affected by the COVID-19 outbreak, which may result in our inability to prevent or detect misstatements. |
• | With further development of COVID-19, IT infrastructure and resources can become scarcely available to us due to shortage, remote working and limited capacity of existing infrastructure. |
• | We have a portion of non-restructured debt and there is substantial doubt about our ability to continue as a going concern. |
• | We have experienced and may continue to experience liquidity shortages and a working capital deficit. |
• | Our creditors had accelerated and in the future may accelerate amounts due under our loan agreements, which may result in loss of our assets, including fixed assets and shares in our subsidiaries, adversely affect our ability to conduct our business and result in a significant decline in the value of our shares and ADSs. |
• | We may fail to comply with the terms of the restructured indebtedness or be unable to complete restructuring. |
• | We have a substantial amount of outstanding indebtedness with restrictive covenants and most shares and certain assets in our subsidiaries are pledged. |
• | We may become subject to bankruptcy procedures, which may result in the inability of holders of our shares and ADSs to recover some or all of their investments. |
• | If we fail to fulfill payment obligations under the group’s lease agreements, our lessors may require the return of the leased assets, which could materially adversely affect our business, financial condition, results of operations and prospects. |
• | We operate in cyclical industries, and any local or global downturn, whether or not primarily affecting the mining and/or steel industries, may have an adverse effect on our business, financial condition, results of operations and prospects. |
• | The steel and mining industries are highly competitive, and we may not be able to compete successfully. |
• | Our business is capital intensive, if we are not able to finance our capital investment program this may have a material adverse effect on our business and our ability to comply with applicable regulations. |
• | Successful implementation of our strategy to expand our coal sales depends on our ability to increase our export sales and further development of transportation infrastructure. |
• | Changes in our estimates of mineral resources and reserves or failure to implement mine development plans could result in lower than expected revenues, higher than expected costs or decreased operating margins. |
• | Our business could be materially adversely affected if we fail to obtain or extend necessary subsoil licenses or fail to comply with the terms of our subsoil licenses. |
• | Increasing energy, raw materials, transportation and labor costs could adversely affect our operating margins. |
• | We are subject to mining and steelmaking operational risks associated with the exploration, development and production of natural resources, as well as the process of steelmaking, any of which could result in production shortfalls or damage to persons or property. |
• | More stringent environmental laws and regulations or more stringent enforcement or findings that we have violated environmental laws and regulations could result in higher compliance costs and significant fines and penalties, or require significant capital investment, or even result in the suspension of our operations. |
• | Failure to comply with existing laws and regulations could result in substantial additional compliance costs or various sanctions which could materially adversely affect our business, financial condition, results of operations and prospects. |
• | The concentration of our shares with our largest shareholders will limit your ability to influence corporate matters and transactions with largest shareholders may present conflicts of interest, potentially resulting in the entering into transactions on less favorable terms than could be obtained on arm’s length basis. |
• | The suspension of trading and potential delisting of our ADSs could adversely affect the liquidity and the market price of our shares and ADSs. |
• | The price of our shares and ADSs could be volatile and could drop unexpectedly, making it difficult for investors to resell our shares or ADSs at or above the price paid. |
• | The depositary may be required to take certain actions due to Russian law requirements which could adversely impact the liquidity and the value of the shares and ADSs. |
• | Voting rights with respect to the shares represented by our ADSs are limited by the terms of the relevant deposit agreement for the ADSs and relevant requirements of Russian law. |
• | ADS holders may not be able to benefit from the United States-Russia income tax treaty and capital gains from the sale of ADSs may be subject to withholding tax in Russia. |
• | Holders of ADSs may have limited recourse against us and our directors and executive officers. |
• | Emerging markets such as Russia are subject to greater risks than more developed markets, and financial turmoil in developed or other emerging markets could have a material adverse effect on our business and could cause the value of our shares and ADSs to fluctuate widely. |
• | Geopolitical disagreements between Russia and Ukraine and sanctions imposed as a result thereof could adversely affect our business, financial condition and results of operations. |
• | Sanctions, as well as other politically related disagreements and allegations between Russia and other countries, may have a material adverse effect on our business, liquidity and financial condition, as well as value of our shares and ADSs. |
• | Political and governmental instability could materially adversely affect our business, financial condition, results of operations and prospects and the value of our shares and ADSs. |
• | Weaknesses relating to the Russian legal system and legislation create an uncertain investment climate. |
• | Selective government action could have a material adverse effect on the investment climate in Russia and on our business, financial condition, results of operations and prospects and the value of our shares and ADSs. |
• | Due to still-developing law and practice related to minority shareholder protection in Russia, the ability of holders of our shares and ADSs to bring, or recover in, an action against us may be limited. |
• | strategies, outlook and growth prospects; |
• | the ability to maintain and generate sufficient cash and other liquid resources to meet our operating and debt service requirements; |
• | our ability to comply with the covenants and restrictions imposed by the existing and future financing arrangements and our ability to attract new financing or refinancing, as well as to restructure the debt; |
• | the impact of competition; |
• | capital expenditures; |
• | demand for our products; |
• | economic outlook and industry trends; |
• | transactions with related parties; |
• | regulatory compliance; |
• | developments in our markets; |
• | future plans and potential for future growth; |
• | the results of any legal procedures; |
• | the impact of regulatory initiatives; and |
• | the strength of our competitors. |
Year Ended December 31, |
||||||||||||||||||||
2021 |
2020 |
2019 |
2018 |
2017 |
||||||||||||||||
(In millions of Russian rubles, unless stated otherwise) |
||||||||||||||||||||
Consolidated statement of profit or loss and other comprehensive income data: |
||||||||||||||||||||
Revenue from contracts with customers |
402,074 | 265,454 | 287,153 | 303,795 | 291,543 | |||||||||||||||
Cost of sales |
(223,993 | ) | (170,605 | ) | (183,086 | ) | (174,058 | ) | (158,196 | ) | ||||||||||
|
|
|
|
|
|
|
|
|
|
|||||||||||
Gross profit |
178,081 | 94,849 | 104,067 | 129,737 | 133,347 | |||||||||||||||
Total selling, distribution and operating income and (expenses), net |
(75,415 | ) | (74,924 | ) | (69,867 | ) | (78,591 | ) | (76,367 | ) | ||||||||||
|
|
|
|
|
|
|
|
|
|
|||||||||||
Operating profit |
102,666 | 19,925 | 34,200 | 51,146 | 56,980 | |||||||||||||||
Total other income and (expense), net |
(13,536 | ) | (57,550 | ) | (15,212 | ) | (27,596 | ) | (37,331 | ) | ||||||||||
Profit (loss) before tax from continuing operations |
89,130 | (37,625 | ) | 18,988 | 23,550 | 19,649 | ||||||||||||||
Income tax expense |
(6,511 | ) | (2,528 | ) | (7,913 | ) | (2,653 | ) | (1,844 | ) | ||||||||||
Profit (loss) from continuing operations |
82,619 | (40,153 | ) | 11,075 | 20,897 | 17,805 | ||||||||||||||
Profit (loss) after tax from discontinued operations |
— | 41,609 | (6,790 | ) | (7,361 | ) | (5,235 | ) | ||||||||||||
Profit |
82,619 | 1,456 | 4,285 | 13,536 | 12,570 | |||||||||||||||
Less: profit attributable to non-controlling interests |
2,049 | 648 | 1,876 | 908 | 1,013 | |||||||||||||||
|
|
|
|
|
|
|
|
|
|
|||||||||||
Profit attributable to equity shareholders of Mechel |
80,570 | 808 | 2,409 | 12,628 | 11,557 | |||||||||||||||
|
|
|
|
|
|
|
|
|
|
|||||||||||
Profit |
82,619 | 1,456 | 4,285 | 13,536 | 12,570 | |||||||||||||||
Exchange differences on translation of foreign operations |
(152 | ) | 2,042 | (1,771 | ) | (9 | ) | 313 | ||||||||||||
|
|
|
|
|
|
|
|
|
|
|||||||||||
Re-measurement of defined benefit plans |
1,070 | 200 | (867 | ) | 487 | 145 | ||||||||||||||
Net (loss) gain on equity instruments designated at fair value through other comprehensive income |
(27 | ) | 53 | — | — | — | ||||||||||||||
Total comprehensive income, net of tax |
83 510 | 3,751 | 1,647 | 14,014 | 13,028 |
Year Ended December 31, |
||||||||||||||||||||
2021 |
2020 |
2019 |
2018 |
2017 |
||||||||||||||||
(In millions of Russian rubles, unless stated otherwise) |
||||||||||||||||||||
Total comprehensive income attributable to non-controlling interests |
2,066 | 652 | 1,857 | 918 | 1,016 | |||||||||||||||
|
|
|
|
|
|
|
|
|
|
|||||||||||
Total comprehensive income (loss) attributable to equity shareholders of Mechel |
81,444 | 3,099 | (210 | ) | 13,096 | 12,012 | ||||||||||||||
|
|
|
|
|
|
|
|
|
|
|||||||||||
Earnings (loss) per share from continuing operations (Russian rubles per share), basic and diluted |
199 | (99 | ) | 22 | 48 | 40 | ||||||||||||||
|
|
|
|
|
|
|
|
|
|
|||||||||||
Earnings (loss) per share from discontinued operations (Russian rubles per share), basic and diluted |
— | 101 | (16 | ) | (18 | ) | (12 | ) | ||||||||||||
|
|
|
|
|
|
|
|
|
|
|||||||||||
Earnings per share (Russian rubles per share) attributable to common equity shareholders, basic and diluted |
199 | 2 | 6 | 30 | 28 | |||||||||||||||
Dividends declared per common share (Russian rubles per share) |
— | — | — | — | — | |||||||||||||||
|
|
|
|
|
|
|
|
|
|
|||||||||||
Dividends declared per preferred share (Russian rubles per share) |
— | 1.17 | 3.48 | 18.21 | 16.66 | |||||||||||||||
|
|
|
|
|
|
|
|
|
|
|||||||||||
Weighted average number of common shares |
404,776,126 | 412,589,910 | 416,256,510 | 416,270,745 | 416,270,745 | |||||||||||||||
Mining segment statement of profit (loss) data (1) : |
||||||||||||||||||||
Revenue from contracts with customers |
164,973 | 105,283 | 121,227 | 125,653 | 134,846 | |||||||||||||||
Cost of sales |
(61,783 | ) | (53,842 | ) | (57,547 | ) | (53,384 | ) | (46,722 | ) | ||||||||||
|
|
|
|
|
|
|
|
|
|
|||||||||||
Gross profit |
103,191 | 51,441 | 63,680 | 72,269 | 88,124 | |||||||||||||||
Total selling, distribution and operating income and (expenses), net |
(35,193 | ) | (37,333 | ) | (36,905 | ) | (38,178 | ) | (40,050 | ) | ||||||||||
|
|
|
|
|
|
|
|
|
|
|||||||||||
Operating profit |
67,999 | 14,108 | 26,775 | 34,091 | 48,074 | |||||||||||||||
|
|
|
|
|
|
|
|
|
|
|||||||||||
Steel segment statement of profit (loss) data (1) : |
||||||||||||||||||||
Revenue from contracts with customers |
268,426 | 173,510 | 180,919 | 193,764 | 180,382 | |||||||||||||||
Cost of sales |
(205,898 | ) | (143,480 | ) | (153,433 | ) | (149,349 | ) | (146,369 | ) | ||||||||||
|
|
|
|
|
|
|
|
|
|
|||||||||||
Gross profit |
62,529 | 30,030 | 27,486 | 44,416 | 34,013 | |||||||||||||||
Total selling, distribution and operating income and (expenses), net |
(25,081 | ) | (23,510 | ) | (20,399 | ) | (24,602 | ) | (24,859 | ) | ||||||||||
|
|
|
|
|
|
|
|
|
|
|||||||||||
Operating profit |
37,447 | 6,520 | 7,087 | 19,814 | 9,154 | |||||||||||||||
|
|
|
|
|
|
|
|
|
|
|||||||||||
Power segment statement of profit (loss) data (1) : |
||||||||||||||||||||
Revenue from contracts with customers |
45,419 | 43,457 | 44,327 | 43,245 | 42,562 | |||||||||||||||
Cost of sales |
(31,396 | ) | (29,368 | ) | (31,269 | ) | (30,807 | ) | (29,907 | ) | ||||||||||
|
|
|
|
|
|
|
|
|
|
|||||||||||
Gross profit |
14,022 | 14,089 | 13,058 | 12,438 | 12,655 | |||||||||||||||
Total selling, distribution and operating income and (expenses), net |
(15,133 | ) | (14,397 | ) | (11,642 | ) | (15,811 | ) | (11,457 | ) | ||||||||||
|
|
|
|
|
|
|
|
|
|
|||||||||||
Operating (loss) profit |
(1,111 | ) | (308 | ) | 1,416 | (3,374 | ) | 1,198 | ||||||||||||
|
|
|
|
|
|
|
|
|
|
|||||||||||
Consolidated statement of financial position data (at period end): |
||||||||||||||||||||
Total assets |
237,530 | 193,840 | 312,505 | 317,625 | 319,127 | |||||||||||||||
Equity attributable to equity shareholders of Mechel |
(162,943 | ) | (244,289 | ) | (245,228 | ) | (243,041 | ) | (253,066 | ) | ||||||||||
Equity attributable to non-controlling interests |
15,665 | 13,618 | 11,631 | 9,846 | 8,933 | |||||||||||||||
Loans and borrowings, including interest payable, fines and penalties on overdue amounts of RUB 14,856 million, RUB 13,227 million, RUB 11,111 million, RUB 9,877 million and RUB 41,992 million as of December 31, 2021, 2020, 2019, 2018 and 2017, respectively |
283,382 | 314,836 | 381,317 | 412,294 | 422,533 | |||||||||||||||
Non-current loans and borrowings |
100 | 2,201 | 7,205 | 6,538 | 17,360 |
Year Ended December 31, |
||||||||||||||||||||
2021 |
2020 |
2019 |
2018 |
2017 |
||||||||||||||||
(In millions of Russian rubles, unless stated otherwise) |
||||||||||||||||||||
Consolidated statement of cash flows data: |
||||||||||||||||||||
Net cash provided by operating activities |
73,538 | 37,949 | 57,658 | 68,118 | 63,282 | |||||||||||||||
Net cash (used in) provided by investing activities |
(5,452 | ) | 84,383 | (5,921 | ) | (5,647 | ) | (7,138 | ) | |||||||||||
Net cash used in financing activities |
(49,191 | ) | (126,104 | ) | (48,357 | ) | (63,286 | ) | (55,737 | ) | ||||||||||
Non-IFRS measures(2) : |
||||||||||||||||||||
Consolidated Adjusted EBITDA |
118,907 | 41,051 | 53,092 | 74,554 | 78,594 | |||||||||||||||
Mining Segment Adjusted EBITDA |
75,574 | 26,259 | 39,669 | 44,855 | 59,494 | |||||||||||||||
Steel Segment Adjusted EBITDA |
43,362 | 13,154 | 12,170 | 27,676 | 18,300 | |||||||||||||||
Power Segment Adjusted EBITDA |
1,633 | 2,349 | 1,409 | 1,413 | 2,241 |
(1) | Segment revenues and cost of sales include intersegment sales. |
(2) | Adjusted EBITDA represents profit (loss) attributable to equity shareholders of Mechel before depreciation and amortization, foreign exchange (gain) loss, net, finance costs, finance income, net result on the disposal of non-current assets, impairment of goodwill and other non-current assets, net, write-off of trade and other receivables and payables, net, allowance for expected credit losses, provision (reversal of provision) for doubtful accounts, change in provision for inventories at net realizable value, (profit) loss after tax from discontinued operations, net result on the disposal of subsidiaries, profit (loss) attributable to non-controlling interests, income tax expense (benefit), effect of pension obligations, other fines and penalties and other one-off items. Income tax, deferred tax and provision for fines and penalties related to the consolidated group of taxpayers and certain other assets and liabilities are not allocated to segments as they are managed on the group basis. |
Year Ended December 31, |
||||||||||||||||||||
2021 |
2020 |
2019 |
2018 |
2017 |
||||||||||||||||
(In millions of Russian rubles) |
||||||||||||||||||||
Consolidated Adjusted EBITDA reconciliation: |
||||||||||||||||||||
Profit attributable to equity shareholders of Mechel |
80,570 | 808 | 2,409 | 12,628 | 11,557 | |||||||||||||||
|
|
|
|
|
|
|
|
|
|
|||||||||||
Add: |
||||||||||||||||||||
Depreciation and amortization |
13,357 | 14,286 | 13,410 | 12,216 | 12,762 | |||||||||||||||
Foreign exchange (gain) loss, net |
(7,891 | ) | 36,388 | (18,288 | ) | 24,187 | (3,768 | ) | ||||||||||||
Finance costs |
23,371 | 25,145 | 33,863 | 37,514 | 42,989 | |||||||||||||||
Finance income |
(676 | ) | (3,504 | ) | (590 | ) | (33,943 | ) | (633 | ) | ||||||||||
Net result on the disposal of non-current assets, impairment of goodwill and other non-current assets, net, write-off of trade and other receivables and payables, net, allowance for expected credit losses, provision (reversal of provision) for doubtful accounts and change in provision for inventories at net realizable value |
2,250 | 3,626 | 3,646 | 9,035 | 5,571 | |||||||||||||||
(Profit) loss after tax from discontinued operations |
— | (41,609 | ) | 6,790 | 7,361 | 5,235 | ||||||||||||||
Net result on the disposal of subsidiaries |
(1,130 | ) | 23 | — | (3 | ) | (470 | ) | ||||||||||||
Profit attributable to non-controlling interests |
2,049 | 648 | 1,876 | 908 | 1,013 | |||||||||||||||
Income tax expense |
6,511 | 2,528 | 7,913 | 2,653 | 1,844 | |||||||||||||||
Effect of pension obligations |
(33 | ) | 169 | 188 | 492 | (46 | ) | |||||||||||||
Other fines and penalties |
522 | 3,001 | 1,874 | 1,506 | 2,539 | |||||||||||||||
Other one-off items |
7 | (458 | ) | — | — | — | ||||||||||||||
|
|
|
|
|
|
|
|
|
|
|||||||||||
Consolidated Adjusted EBITDA |
118,907 | 41,051 | 53,092 | 74,554 | 78,594 | |||||||||||||||
|
|
|
|
|
|
|
|
|
|
Year Ended December 31, |
||||||||||||||||||||
2021 |
2020 |
2019 |
2018 |
2017 |
||||||||||||||||
(In millions of Russian rubles) |
||||||||||||||||||||
Mining Segment Adjusted EBITDA reconciliation: |
||||||||||||||||||||
Profit attributable to equity shareholders of Mechel |
57,953 | 38,742 | 4,253 | 11,304 | 16,801 | |||||||||||||||
|
|
|
|
|
|
|
|
|
|
|||||||||||
Add: |
||||||||||||||||||||
Depreciation and amortization |
6,574 | 7,463 | 6,775 | 5,977 | 6,513 | |||||||||||||||
Foreign exchange (gain) loss, net |
(402 | ) | 7,400 | (3,423 | ) | 9,182 | (3,911 | ) | ||||||||||||
Finance costs |
9,633 | 12,408 | 19,164 | 24,616 | 29,925 | |||||||||||||||
Finance income |
(2,561 | ) | (2,289 | ) | (901 | ) | (24,345 | ) | (1,810 | ) | ||||||||||
Net result on the disposal of non-current assets, impairment of goodwill and other non-current assets, net, write-off of trade and other receivables and payables, net, allowance for expected credit losses, provision (reversal of provision) for doubtful accounts and change in provision for inventories at net realizable value |
886 | 3,485 | 5,467 | 4,118 | 3,772 | |||||||||||||||
(Profit) loss after tax from discontinued operations |
— | (41,651 | ) | 6,962 | 7,513 | 5,304 | ||||||||||||||
Net result on the disposal of subsidiaries |
— | — | — | (3 | ) | (470 | ) | |||||||||||||
Profit attributable to non-controlling interests |
690 | 110 | 701 | 183 | 407 | |||||||||||||||
Income tax expense (benefit) |
2,781 | (149 | ) | 20 | 5,913 | 2,104 | ||||||||||||||
Effect of pension obligations |
(77 | ) | 118 | 138 | 459 | (71 | ) | |||||||||||||
Other fines and penalties |
92 | 880 | 513 | (62 | ) | 930 | ||||||||||||||
Other one-off items |
5 | (258 | ) | — | — | — | ||||||||||||||
|
|
|
|
|
|
|
|
|
|
|||||||||||
Mining Segment Adjusted EBITDA |
75,574 | 26,259 | 39,669 | 44,855 | 59,494 | |||||||||||||||
|
|
|
|
|
|
|
|
|
|
|||||||||||
Steel Segment Adjusted EBITDA reconciliation: |
||||||||||||||||||||
Profit (loss) attributable to equity shareholders of Mechel |
25,053 | (34,383 | ) | 5,938 | 693 | (4,533 | ) | |||||||||||||
|
|
|
|
|
|
|
|
|
|
|||||||||||
Add: |
||||||||||||||||||||
Depreciation and amortization |
6,314 | 6,335 | 6,153 | 5,738 | 5,800 | |||||||||||||||
Foreign exchange (gain) loss, net |
(7,480 | ) | 28,928 | (14,841 | ) | 14,969 | 144 | |||||||||||||
Finance costs |
15,741 | 14,403 | 14,839 | 13,825 | 14,136 | |||||||||||||||
Finance income |
(628 | ) | (3,306 | ) | (450 | ) | (9,874 | ) | (717 | ) | ||||||||||
Net result on the disposal of non-current assets, impairment of goodwill and other non-current assets, net, write-off of trade and other receivables and payables, net, allowance for expected credit losses, provision (reversal of provision) for doubtful accounts and change in provision for inventories at net realizable value |
(775 | ) | 4 | (1,835 | ) | 1,416 | 1,315 | |||||||||||||
(Profit) loss after tax from discontinued operations |
— | — | (39 | ) | (18 | ) | — | |||||||||||||
Net result on the disposal of subsidiaries |
(1,130 | ) | 23 | — | — | — | ||||||||||||||
Profit attributable to non-controlling interests |
1,084 | 217 | 996 | 637 | 417 | |||||||||||||||
Income tax expense (benefit) |
4,798 | 676 | 503 | (531 | ) | 203 | ||||||||||||||
Effect of pension obligations |
39 | 46 | 47 | 30 | 22 | |||||||||||||||
Other fines and penalties |
294 | 291 | 859 | 788 | 1,512 | |||||||||||||||
Other one-off items |
52 | (80 | ) | — | — | — | ||||||||||||||
|
|
|
|
|
|
|
|
|
|
|||||||||||
Steel Segment Adjusted EBITDA |
43,362 | 13,154 | 12,170 | 27,676 | 18,300 | |||||||||||||||
|
|
|
|
|
|
|
|
|
|
Year Ended December 31, |
||||||||||||||||||||
2021 |
2020 |
2019 |
2018 |
2017 |
||||||||||||||||
(In millions of Russian rubles) |
||||||||||||||||||||
Power Segment Adjusted EBITDA reconciliation: |
||||||||||||||||||||
(Loss) profit attributable to equity shareholders of Mechel |
(1,697 | ) | (1,081 | ) | 351 | (2,631 | ) | 39 | ||||||||||||
|
|
|
|
|
|
|
|
|
|
|||||||||||
Add: |
||||||||||||||||||||
Depreciation and amortization |
469 | 488 | 482 | 500 | 448 | |||||||||||||||
Foreign exchange (gain) loss, net |
(8 | ) | 59 | (24 | ) | 37 | (2 | ) | ||||||||||||
Finance costs |
546 | 447 | 653 | 581 | 880 | |||||||||||||||
Finance income |
(36 | ) | (23 | ) | (31 | ) | (1,231 | ) | (57 | ) | ||||||||||
Net result on the disposal of non-current assets, impairment of goodwill and other non-current assets, net, write-off of trade and other receivables and payables, net, allowance for expected credit losses, provision (reversal of provision) for doubtful accounts and change in provision for inventories at net realizable value |
2,140 | 138 | 12 | 3,501 | 481 | |||||||||||||||
(Profit) loss after tax from discontinued operations |
— | — | (132 | ) | (133 | ) | (69 | ) | ||||||||||||
Net result on the disposal of subsidiaries |
— | — | — | — | — | |||||||||||||||
Loss attributable to non-controlling interests |
275 | 321 | 180 | 87 | 189 | |||||||||||||||
Income tax expense (benefit) |
(140 | ) | (34 | ) | 333 | (83 | ) | 229 | ||||||||||||
Effect of pension obligations |
5 | 5 | 4 | 4 | 3 | |||||||||||||||
Other fines and penalties |
129 | 2,148 | (419 | ) | 781 | 98 | ||||||||||||||
Other one-off items |
(50 | ) | (119 | ) | — | — | — | |||||||||||||
|
|
|
|
|
|
|
|
|
|
|||||||||||
Power Segment Adjusted EBITDA |
1,633 | 2,349 | 1,409 | 1,413 | 2,241 | |||||||||||||||
|
|
|
|
|
|
|
|
|
|
• | Adjusted EBITDA does not reflect the impact of depreciation and amortization on our operating performance. The assets of our businesses which are being depreciated and/or amortized (including, for example, our mineral reserves) will have to be replaced in the future and such depreciation and amortization expense may approximate the cost to replace these assets in the future. By excluding such expense from Adjusted EBITDA, Adjusted EBITDA does not reflect our future cash requirements for such replacements. |
• | Adjusted EBITDA does not reflect the impact of foreign exchange gains and losses, which may recur. |
• | Adjusted EBITDA does not reflect the impact of finance income and finance costs, which are significant and could further increase if we incur more debt, on our operating performance. |
• | Adjusted EBITDA does not reflect the impact of the net result on the disposal of non-current assets on our operating performance, which may recur. |
• | Adjusted EBITDA does not reflect the impact of impairment of goodwill and other non-current assets, net, which may recur. |
• | Adjusted EBITDA does not reflect the impact of write-off of trade and other receivables and payables, net, which may recur. |
• | Adjusted EBITDA does not reflect the impact of allowance for expected credit losses, provision (reversal of provision) for doubtful accounts, which may recur. |
• | Adjusted EBITDA does not reflect the impact of change in provision for inventories at net realizable value, which may recur. |
• | Adjusted EBITDA does not reflect the impact of profits and losses after tax from discontinued operations. |
• | Adjusted EBITDA does not reflect the impact of net result on the disposal of subsidiaries. |
• | Adjusted EBITDA does not reflect the impact of profits and losses attributable to non-controlling interests on our operating performance. |
• | Adjusted EBITDA does not reflect the impact of income tax expenses and benefits on our operating performance. |
• | Adjusted EBITDA does not reflect the impact of effect of pension obligations. |
• | Adjusted EBITDA does not reflect the impact of other fines and penalties. |
• | Adjusted EBITDA does not reflect the impact of other one-off items. |
• | Other companies in our industry may calculate Adjusted EBITDA differently or may use it for different purposes than we do, limiting its usefulness as a comparative measure. |
• | to avoid the unjustified reduction of production volumes and product range at Southern Kuzbass Coal Company; |
• | to provide, to the extent possible, equal supply terms to all customers without discrimination against companies not forming part of this group of companies; |
• | not to restrict other companies from supplying coking coal to the same geographical area of operations; and |
• | to notify the FAS prior to any increase in domestic prices of coking coal and coking coal concentrate, if such increase amounts to more than 10% of the relevant price used 180 days before the date such increase is planned to take place, with submission to the FAS of the financial and economic reasoning for the planned increase of prices. |
• | investor perception of us as a company; |
• | actual or anticipated fluctuations in our revenues or operating results; |
• | announcement of intended acquisitions, disposals or financings, or speculation about such acquisitions, disposals or financings; |
• | changes in our dividend policy, which could result from changes in our cash flow and capital position; |
• | sales of blocks of our common shares, common ADSs, preferred shares or preferred ADSs by significant shareholders; |
• | terms and timing of any refinancing or restructuring of our indebtedness; |
• | actual or potential litigation involving us; |
• | changes in financial estimates and recommendations by securities research analysts; |
• | fluctuations in Russian and international capital markets, including those due to events in other emerging markets and the ongoing impact of the COVID-19 pandemic; |
• | the performance of other companies operating in similar industries; |
• | regulatory developments in the markets where we operate, especially Russia and the European Union; |
• | international political and economic conditions, including the effects of fluctuations in foreign exchange rates, interest rates and oil prices and other events such as terrorist attacks, military operations, changes in governments and relations between countries, international sanctions, in particular against Russian companies and individuals, natural disasters and the uncertainty related to these developments; |
• | news or analyst reports related to markets or industries in which we operate; and |
• | general investor perception of investing in Russia. |
• | inconsistencies among federal laws, including among decrees, orders and regulations issued by the Russian President, the Russian Government, federal ministries and regulatory authorities and among regional and local laws, rules and regulations; |
• | limited judicial and administrative guidance on interpreting Russian legislation; |
• | gaps in the regulatory structure due to the delay or absence of implementing legislation; |
• | uncertainties in interpretation of Russian legislation and corporate law generally by Russian courts; |
• | a high degree of discretion or arbitrariness on the part of governmental authorities; and |
• | still-developing bankruptcy procedures that are subject to abuse. See “— Risks Relating to Our Financial Condition and Financial Reporting — We may become subject to bankruptcy procedures, which may result in the inability of holders of our shares and ADSs to recover some or all of their investments.” |
• | this decision-making capability is provided for in the charter of the effective subsidiary or in a contract between such entities; and |
• | the effective parent gives obligatory directions to the effective subsidiary based on the above-mentioned decision-making capability. |
• | decisions with respect to a reorganization; |
• | consent or subsequent approval by shareholders of a “major transaction,” which involves property in excess of 50% of the balance sheet value of the company’s assets calculated according to the Russian accounting standards, regardless of whether the transaction is actually consummated (including those which are simultaneously interested party transactions), except for transactions undertaken in the ordinary course of business; |
• | the amendment of the company’s charter or approval of a new version of the company’s charter that limits shareholder rights; and |
• | the amendment of the public company’s charter which eliminates indication that the company is public, simultaneously with the decision on applying to the CBR on release from obligation to disclose information under the laws of the Russian Federation on securities and the decision on applying for delisting of shares and securities convertible into shares. |
• | income tax; |
• | value-added tax (“ VAT |
• | mineral extraction tax; |
• | excise tax; and |
• | property and land taxes. |
Subsidiary (Location) (1) |
Surface |
Underground | ||
Yakutugol (Sakha Republic, Russia) |
Neryungrinsky Open Pit | |||
Kangalassky Open Pit | ||||
Dzhebariki-Khaya Open Pit | ||||
Southern Kuzbass Coal Company (Kuzbass, Russia) |
Sibirginsky Open Pit Tomusinsky Open Pit Olzherassky Open Pit Krasnogorsky Open Pit |
V.I. Lenina Underground Sibirginskaya Underground Olzherasskaya- Novaya Underground |
(1) | Information on the percentage ownership of each mining property is presented in “Item 5. Operating and Financial Review and Prospects — Business Structure.” |
2021 |
2020 |
2019 |
||||||||||||||||||||||
Tonnes |
% of Production |
Tonnes |
% of Production |
Tonnes |
% of Production |
|||||||||||||||||||
(In millions of tonnes) (1) |
||||||||||||||||||||||||
Coking Coal |
||||||||||||||||||||||||
Yakutugol |
4.0 | 5.1 | 4.8 | |||||||||||||||||||||
Elgaugol OOO (2) |
— | 0.8 | 2.8 | |||||||||||||||||||||
Southern Kuzbass Coal Company |
3.1 | 4.5 | 4.3 | |||||||||||||||||||||
|
|
|
|
|
|
|||||||||||||||||||
Total Coking Coal |
7.1 | 62.3 | % | 10.4 | 60.8 | % | 11.9 | 63.0 | % | |||||||||||||||
Steam Coal |
||||||||||||||||||||||||
Yakutugol |
0.4 | 0.5 | 1.0 | |||||||||||||||||||||
Elgaugol OOO (2) |
— | 0.4 | 1.5 | |||||||||||||||||||||
Southern Kuzbass Coal Company |
2.2 | 3.8 | 3.3 | |||||||||||||||||||||
|
|
|
|
|
|
|||||||||||||||||||
Total Steam Coal |
2.6 | 22.8 | % | 4.7 | 27.5 | % | 5.8 | 30.7 | % | |||||||||||||||
Anthracite |
||||||||||||||||||||||||
Yakutugol |
— | — | — | |||||||||||||||||||||
Southern Kuzbass Coal Company |
1.7 | 2.0 | 1.2 | |||||||||||||||||||||
|
|
|
|
|
|
|||||||||||||||||||
Total Anthracite |
1.7 | 14.9 | % | 2.0 | 11.7 | % | 1.2 | 6.3 | % | |||||||||||||||
|
|
|
|
|
|
|
|
|
|
|
|
|||||||||||||
Total Coal |
11.4 | 100 | % | 17.1 | 100 | % | 18.9 | 100 | % | |||||||||||||||
|
|
|
|
|
|
|
|
|
|
|
|
(1) | Volumes are reported on a wet basis. |
(2) | We disposed of the Elga coal complex in April 2020. See “Item 5. Operating and Financial Review and Prospects — Business Structure — Recent acquisitions and disposals.” |
2021 |
2020 |
2019 |
||||||||||||||||||||||
Tonnes |
% of Production |
Tonnes |
% of Production |
Tonnes |
% of Production |
|||||||||||||||||||
(In millions of tonnes) |
||||||||||||||||||||||||
Coking Coal |
||||||||||||||||||||||||
Yakutugol |
2.5 | 25.8 | % | 2.4 | 18.5 | % | 2.7 | 18 | % | |||||||||||||||
Elgaugol OOO (1) |
— | — | 0.4 | 3.1 | % | 1.4 | 9 | % | ||||||||||||||||
Southern Kuzbass Coal Company |
2.0 | 20.6 | % | 3.2 | 24.6 | % | 3.1 | 20 | % | |||||||||||||||
|
|
|
|
|
|
|
|
|
|
|
|
|||||||||||||
Total Coking Coal |
4.5 | 46.4 | % | 6.0 | 46.2 | % | 7.2 | 47 | % | |||||||||||||||
PCI |
||||||||||||||||||||||||
Yakutugol |
— | — | — | — | — | — | ||||||||||||||||||
Southern Kuzbass Coal Company |
1.1 | 11.3 | % | 1.8 | 13.8 | % | 1.5 | 10 | % | |||||||||||||||
|
|
|
|
|
|
|
|
|
|
|
|
|||||||||||||
Total PCI |
1.1 | 11.3 | % | 1.8 | 13.8 | % | 1.5 | 10 | % | |||||||||||||||
Anthracite |
||||||||||||||||||||||||
Yakutugol |
— | — | — | — | — | — | ||||||||||||||||||
Southern Kuzbass Coal Company |
1.1 | 11.3 | % | 1.3 | 10.0 | % | 1.0 | 7 | % | |||||||||||||||
|
|
|
|
|
|
|
|
|
|
|
|
|||||||||||||
Total Anthracite |
1.1 | 11.3 | % | 1.3 | 10.0 | % | 1.0 | 7 | % | |||||||||||||||
Steam Coal |
||||||||||||||||||||||||
Yakutugol |
1.6 | 16.5 | % | 1.9 | 14.7 | % | 2.4 | 16 | % | |||||||||||||||
Elgaugol OOO (1) |
— | — | 0.5 | 3.8 | % | 1.9 | 13 | % | ||||||||||||||||
Southern Kuzbass Coal Company |
1.4 | 14.5 | % | 1.5 | 11.5 | % | 1.1 | 7 | % | |||||||||||||||
|
|
|
|
|
|
|
|
|
|
|
|
|||||||||||||
Total Steam Coal |
3.0 | 31.0 | % | 3.9 | 30.0 | % | 5.4 | 36 | % | |||||||||||||||
|
|
|
|
|
|
|
|
|
|
|
|
|||||||||||||
Total Coal |
9.7 | 100 | % | 13.0 | 100 | % | 15.1 | 100 | % | |||||||||||||||
|
|
|
|
|
|
|
|
|
|
|
|
(1) | We disposed of the Elga coal complex in April 2020. See “Item 5. Operating and Financial Review and Prospects — Business Structure — Recent acquisitions and disposals.” |
Mine |
License (plot) |
Area (sq. km) |
Mining Method |
Life of Mine |
License Expiry Date |
Status (1) |
Year Production Commenced |
Surface Land Use Rights |
||||||||||||||||||||
Neryungrinsky Open Pit |
(Moshchny seam) |
15.3 | Open pit | 2029 | Dec 2024 | In production | 1979 | Ownership | ||||||||||||||||||||
Kangalassky Open Pit |
(Kangalassk) |
7.7 | Open pit | 2629 | Dec 2027 | In production | 1962 | Ownership | ||||||||||||||||||||
Dzhebariki-Khaya Open Pit |
(Dzhebariki- Khaya) |
1.1 | Open pit | 2026 | Dec 2023 | In production | 2017 | Ownership |
(1) | “In production” refers to sites that are currently producing coal. |
2021 |
2020 |
2019 |
||||||||||||||||||||||
Mine |
Tonnes |
% of Total Production |
Tonnes |
% of Total Production |
Tonnes |
% of Total Production |
||||||||||||||||||
(In millions of tonnes) (1) |
||||||||||||||||||||||||
Coking Coal |
||||||||||||||||||||||||
Neryungrinsky Open Pit |
4.0 | 5.1 | 4.8 | |||||||||||||||||||||
|
|
|
|
|
|
|||||||||||||||||||
Total Coking Coal |
4.0 | 90.9 | % | 5.1 | 91.1 | % | 4.8 | 82.8 | % | |||||||||||||||
|
|
|
|
|
|
|
|
|
|
|
|
|||||||||||||
Steam Coal |
||||||||||||||||||||||||
Neryungrinsky Open Pit |
0.0 | 0.0 | 0.5 | |||||||||||||||||||||
Dzhebariki-Khaya Open Pit |
0.2 | 0.3 | 0.3 | |||||||||||||||||||||
Kangalassky Open Pit |
0.2 | 0.2 | 0.2 | |||||||||||||||||||||
|
|
|
|
|
|
|||||||||||||||||||
Total Steam Coal |
0.4 | 9.1 | % | 0.5 | 8.9 | % | 1.0 | 17.2 | % | |||||||||||||||
|
|
|
|
|
|
|
|
|
|
|
|
|||||||||||||
Total Coal |
4.4 | 100 | % | 5.6 | 100 | % | 5.8 | 100 | % | |||||||||||||||
|
|
|
|
|
|
|
|
|
|
|
|
(1) | Volumes are reported on a wet basis. |
Coal Type |
Region |
2021 |
2020 |
2019 |
||||||||||||
(In thousands of tonnes) |
||||||||||||||||
Coking coal |
Asia | 2,026.9 | 2,131.9 | 2,418.5 | ||||||||||||
Russia | 49.8 | 0.0 | 0.0 | |||||||||||||
CIS | 0.0 | 0.0 | 1.0 | |||||||||||||
Europe | 0.0 | 0.0 | 0.0 | |||||||||||||
|
|
|
|
|
|
|||||||||||
Total |
2,076.7 | 2,131.9 | 2,419.5 | |||||||||||||
Steam coal |
Russia | 449.2 | 593.0 | 563.7 | ||||||||||||
Asia | 0.0 | 211.7 | 108.8 | |||||||||||||
|
|
|
|
|
|
|||||||||||
Total |
449.2 | 804.7 | 672.5 | |||||||||||||
Middlings |
Russia | 665.1 | 512.1 | 218.8 | ||||||||||||
Asia | 831.9 | 1,382.2 | 1,173.8 | |||||||||||||
|
|
|
|
|
|
|||||||||||
Total |
1,497.0 | 1,894.3 | 1,392.6 | |||||||||||||
|
|
|
|
|
|
|||||||||||
Total |
4,022.9 | 4,830.9 | 4,484.6 | |||||||||||||
|
|
|
|
|
|
Mine |
License (plot) |
Area (sq. km) |
Mining Method |
Life of Mine |
License Expiry Date |
Status (1) |
Year Production Commenced |
Surface Land Use Rights | ||||||||||||||
Krasnogorsky Open Pit |
22.4 | Open pit | 2052 | Dec 2038 | In production | 1954 | Lease | |||||||||||||||
2.8 | Nov 2025 | In production | 2012 | Lease | ||||||||||||||||||
Olzherassky Open Pit |
10.1 | Open pit | 2047 | Dec 2029 | In production | 1980 | Lease | |||||||||||||||
(2) |
3.5 | Dec 2024 | Development | n/a | Lease | |||||||||||||||||
(Berezovsk-2, Berezovsk, Olzherassk) |
4.8 | Dec 2024 | In production | 2007 | Lease | |||||||||||||||||
7.4 | Aug 2035 | Development | n/a | Lease | ||||||||||||||||||
Tomusinsky Open Pit |
(3) |
6.7 | Open pit | 2026 | Dec 2025 | In production | 1959 | Lease | ||||||||||||||
Sibirginsky Open Pit |
16.4 | Open pit | 2047 | Dec 2032 | In production | 1970 | Lease | |||||||||||||||
(New-Uregolsk) (2)(4) |
2.4 | Apr 2031 | Development | n/a | Lease | |||||||||||||||||
Sibirginskaya Underground |
|
|
5.9 |
Underground |
|
2055 |
Dec 2024 |
In production |
|
2002 |
Lease | |||||||||||
(Sibirginsk-2, Sibirginsk, Kureinsk) |
0.9 | Dec 2032 | In production | 2014 | Lease | |||||||||||||||||
(Sibirginsk-3) |
7.6 | Aug 2035 | Development | n/a | Lease |
Mine |
License (plot) |
Area (sq. km) |
Mining Method |
Life of Mine |
License Expiry Date |
Status (1) |
Year Production Commenced |
Surface Land Use Rights | ||||||||||||||
V.I. Lenina Underground |
10.0 | Underground | 2056 | Dec 2032 | In production | 1953 | Lease | |||||||||||||||
(2) |
1.2 | Feb 2033 | Development | n/a | Lease, Ownership | |||||||||||||||||
Olzherasskaya-Novaya Underground |
1.2 | Underground | 2070 | Apr 2026 | In production | 2008 | Lease | |||||||||||||||
(Olzherassk-2, Raspadsk) |
0.2 | Jan 2030 | In production | 2010 | Lease | |||||||||||||||||
(Razvedochny, Raspadsk) |
14.6 | Nov 2025 | In production | 2010 | Lease | |||||||||||||||||
Olzherasskaya-Glubokaya Underground |
19.2 | Underground | 2211 | Nov 2025 | Development | n/a | — | |||||||||||||||
Usinskaya Underground |
(2) |
3.6 | Underground | 2071 | Dec 2033 | Conservation | n/a | Ownership |
(1) | “In production” refers to sites that are currently producing coal. “Development” refers to sites where preliminary work is being carried out. “Conservation” refers to sites where no mining activity is conducted, but measures for mine conservation are being taken. |
(2) | We do not comply with the material terms of the subsoil license. See “Item 3. Key Information — Risk Factors — Risks Relating to Our Business and Industry — Our business could be materially adversely affected if we fail to obtain or extend necessary subsoil licenses or fail to comply with the terms of our subsoil licenses.” |
(3) | License held by Tomusinsky Open Pit, a subsidiary of Southern Kuzbass Coal Company. |
(4) | In 2021, project documentation was updated due to non-compliance with production obligations. |
2021 |
2020 |
2019 |
||||||||||||||||||||||
Mine |
Tonnes |
% of Total Production |
Tonnes |
% of Total Production |
Tonnes |
% of Total Production |
||||||||||||||||||
(In millions of tonnes) (1) |
||||||||||||||||||||||||
Coking Coal |
||||||||||||||||||||||||
Sibirginsky Open Pit |
0.5 | 1.5 | 1.7 | |||||||||||||||||||||
Tomusinsky Open Pit |
0.5 | 0.5 | 0.5 | |||||||||||||||||||||
V.I. Lenina Underground |
0.5 | 0.4 | 0.4 | |||||||||||||||||||||
Sibirginskaya Underground |
0.8 | 0.9 | 0.4 | |||||||||||||||||||||
Olzherassky Open Pit |
0.8 | 1.2 | 1.3 | |||||||||||||||||||||
|
|
|
|
|
|
|||||||||||||||||||
Total Coking Coal |
3.1 | 44.3 | % | 4.5 | 43.7 | % | 4.3 | 49.4 | % | |||||||||||||||
|
|
|
|
|
|
|
|
|
|
|
|
|||||||||||||
Steam Coal |
||||||||||||||||||||||||
Krasnogorsky Open Pit |
1.1 | 2.6 | 1.8 | |||||||||||||||||||||
Sibirginsky Open Pit |
0.4 | 0.8 | 0.5 | |||||||||||||||||||||
Olzherassky Open Pit |
0.1 | 0.0 | 0.0 | |||||||||||||||||||||
Olzherasskaya-Novaya Underground |
0.4 | 0.0 | 0.7 | |||||||||||||||||||||
Tomusinsky Open Pit |
0.2 | 0.4 | 0.3 | |||||||||||||||||||||
|
|
|
|
|
|
|||||||||||||||||||
Total Steam Coal |
2.2 | 31.4 | % | 3.8 | 36.9 | % | 3.3 | 36.8 | % | |||||||||||||||
|
|
|
|
|
|
|
|
|
|
|
|
|||||||||||||
Anthracite |
||||||||||||||||||||||||
Krasnogorsky Open Pit |
1.7 | 2.0 | 1.2 | |||||||||||||||||||||
Sibirginsky Open Pit |
— | — | — | |||||||||||||||||||||
Olzherassky Open Pit |
— | — | — | |||||||||||||||||||||
Olzherasskaya-Novaya Underground |
— | — | — | |||||||||||||||||||||
Tomusinsky Open Pit |
— | — | — | |||||||||||||||||||||
|
|
|
|
|
|
|||||||||||||||||||
Total Anthracite |
1.7 | 24.3 | % | 2.0 | 19.4 | % | 1.2 | 13.8 | % | |||||||||||||||
|
|
|
|
|
|
|
|
|
|
|
|
|||||||||||||
Total Coal |
7.0 | 100 | % | 10.3 | 100 | % | 8.8 | 100 | % | |||||||||||||||
|
|
|
|
|
|
|
|
|
|
|
|
(1) | Volumes are reported on a wet basis. |
Coal Type |
Region |
2021 |
2020 |
2019 |
||||||||||||
(In thousands of tonnes) |
||||||||||||||||
Coking coal |
Asia | 393.5 | 752.9 | 554.8 | ||||||||||||
Russia | 253.5 | 1,075.7 | 1,013.6 | |||||||||||||
|
|
|
|
|
|
|||||||||||
Total |
647.0 | 1,828.6 | 1,568.4 | |||||||||||||
Anthracite |
Europe | 336.9 | 557.2 | 367.7 | ||||||||||||
Asia | 811.5 | 490.8 | 171.8 | |||||||||||||
Russia | 6.5 | 6.4 | 8.1 | |||||||||||||
CIS | 0.0 | 0.0 | 0.0 | |||||||||||||
|
|
|
|
|
|
|||||||||||
Total |
1,154.9 | 1,054.4 | 547.6 | |||||||||||||
PCI |
Asia | 1,082.2 | 1,757.0 | 1,287.7 | ||||||||||||
Europe | 0.0 | 94.2 | 129.3 | |||||||||||||
|
|
|
|
|
|
|||||||||||
Total |
1,082.2 | 1,851.2 | 1,417.0 | |||||||||||||
Steam coal |
Asia | 154.7 | 49.8 | 456.3 | ||||||||||||
Europe | 15.9 | 121.6 | 85.1 | |||||||||||||
Russia | 0.3 | 0.2 | 3.0 | |||||||||||||
|
|
|
|
|
|
|||||||||||
Total |
170.9 | 171.6 | 544.4 | |||||||||||||
Middlings |
Asia | 25.1 | 0.0 | 0.0 | ||||||||||||
Russia | 0.0 | 0.0 | 0.0 | |||||||||||||
|
|
|
|
|
|
|||||||||||
Total |
25.1 | 0.0 | 0.0 | |||||||||||||
|
|
|
|
|
|
|||||||||||
Total |
3,080.1 | 4,905.8 | 4,077.4 | |||||||||||||
|
|
|
|
|
|
Plant |
Products | |
Moscow Coke and Gas Plant |
Coke +60 mm, Coke +40 mm, Coke 25-40 mm, Coke nut 10-25 mm, Coke breeze 0-10 mm, Coal benzene, Coal tar, Coke gas | |
Mechel Coke |
Coke +40 mm, Coke +25 mm, Coke 25-40 mm, Coke nut 10-25 mm, Coke breeze 0-10 mm, Coal benzene, Coal tar, Ammonium sulfate, Coke gas |
2021 |
2020 |
2019 |
||||||||||
(Coke and chemical products in thousands of tonnes) (Coke gas in millions of cubic meters) |
||||||||||||
Mechel Coke |
||||||||||||
Coke (6% moisture) |
2,055 | 2,031 | 2,014 | |||||||||
Chemical products |
134 | 125 | 116 | |||||||||
Coke gas |
639 | 652 | 720 | |||||||||
Moscow Coke and Gas Plant |
||||||||||||
Coke (6% moisture) |
830 | 696 | 601 | |||||||||
Chemical products |
39 | 31 | 32 | |||||||||
Coke gas |
395 | 308 | 261 | |||||||||
Total |
||||||||||||
Coke (6% moisture) |
2,885 | 2,727 | 2,615 | |||||||||
|
|
|
|
|
|
|||||||
Chemical products |
173 | 156 | 148 | |||||||||
|
|
|
|
|
|
|||||||
Coke gas |
1,034 | 960 | 981 | |||||||||
|
|
|
|
|
|
2021 |
2020 |
2019 |
||||||||||
(In thousands of tonnes) |
||||||||||||
Coke |
1,213 | 933 | 945 | |||||||||
Chemical products |
149 | 136 | 136 |
Production Area |
Capacity in 2021 |
Capacity Utilization Rate in 2021 |
Planned Increase (2022-2024) |
|||||||||
(In thousands of tonnes) |
||||||||||||
Coke (6% moisture) |
867 | 95.7 | % | — |
Production Area |
Capacity in 2021 |
Capacity Utilization Rate in 2021 |
Planned Increase (2022-2024) |
|||||||||
(In thousands of tonnes) |
||||||||||||
Coke (6% moisture) |
2,730 | 75.3 | % | — |
Mine |
License (plot) |
Area (sq. km) |
Mining Method |
Life of Mine |
License Expiry Date |
Status (1) |
Year Production Commenced |
Surface Land Use Rights | ||||||||||||||
Korshunovsky Open Pit |
4.3 | Open pit | 2029 | Dec 2026 | In production | 1965 | Lease | |||||||||||||||
Rudnogorsky Open Pit |
5.3 | Open pit | 2030 | Jan 2028 | In production | 1984 | Ownership |
(1) | “In production” refers to sites that are currently producing iron ore. |
2021 |
2020 |
2019 |
||||||||||||||||||||||
Mine |
Tonnes |
Grade (% Fe) |
Tonnes |
Grade (% Fe) |
Tonnes |
Grade (% Fe) |
||||||||||||||||||
(In millions of tonnes) (1) |
||||||||||||||||||||||||
Korshunovsky Open Pit |
2.8 | 21.2 | % | 3.4 | 22.7 | % | 3.2 | 24.8 | % | |||||||||||||||
Rudnogorsky Open Pit |
3.1 | 25.4 | % | 3.6 | 30.5 | % | 3.3 | 34.0 | % | |||||||||||||||
Total ore production |
5.9 | 23.4 | % | 7.0 | 26.7 | % | 6.5 | 29.4 | % | |||||||||||||||
|
|
|
|
|
|
|
|
|
|
|
|
|||||||||||||
Iron ore concentrate production |
1.4 | 62.4 | % | 2.1 | 62.4 | % | 2.5 | 62.7 | % | |||||||||||||||
|
|
|
|
|
|
|
|
|
|
|
|
(1) | Volumes are reported on a wet basis. |
Deposit |
License (plot) |
Area (sq. km) |
Mining Method |
License Expiry Date |
Status (1) |
Year Production Commenced |
Surface Land Use Rights | |||||||||||||
Pionerskoye |
03034 (Pionersk) | 9.95 | Open pit | Mar 2033 | Exploration | n/a | Lease | |||||||||||||
Sivaglinskoye |
03153 (Sivaglinsk) | 2.23 | Open pit | Oct 2023 | Exploration | n/a | Lease | |||||||||||||
Sutamskaya area (2) |
03158 (Sutamskaya area) | 731.3 | Open pit | Mar 2037 | No activity | n/a | — |
(1) | “Exploration” refers to sites where drilling for calculation of mineral reserves is being carried out. |
(2) | We do not comply with the material terms of the subsoil license. See “Item 3. Key Information — Risk Factors — Risks Relating to Our Business and Industry — Our business could be materially adversely affected if we fail to obtain or extend necessary subsoil licenses or fail to comply with the terms of our subsoil licenses.” |
Product |
2021 |
2020 |
2019 |
2021 |
2020 |
2019 |
||||||||||||||||||
(In thousands of tonnes) (1) |
(% of total sales, including intra-group) |
|||||||||||||||||||||||
Coking coal concentrate |
2,723.7 | 3,960.5 | 3,987.8 | 62.5 | % | 70.4 | % | 69.4 | % | |||||||||||||||
Steam coal and middlings |
2,142.2 | 2,875.2 | 2,616.3 | 71.0 | % | 71.5 | % | 81.6 | % | |||||||||||||||
PCI and Anthracite |
2,237.2 | 2,905.6 | 1,965.0 | 93.1 | % | 94.1 | % | 91.3 | % | |||||||||||||||
Iron ore concentrate |
38.4 | 38.8 | 192.7 | 2.8 | % | 1.8 | % | 7.5 | % | |||||||||||||||
Coke |
1,212.7 | 933.1 | 945.2 | 44.3 | % | 35.5 | % | 37.4 | % | |||||||||||||||
Chemical products |
148.9 | 135.5 | 135.7 | 87.4 | % | 87.9 | % | 91.4 | % |
(1) | Includes resale of mining segment products purchased from third parties. |
2021 |
2020 |
2019 |
||||||||||||||||||||||
Product |
Amount |
% of Revenues |
Amount |
% of Revenues |
Amount |
% of Revenues |
||||||||||||||||||
(In millions of Russian rubles, except for percentages) |
||||||||||||||||||||||||
Coking coal concentrate |
32,341.4 | 29.2 | % | 24,975.8 | 35.2 | % | 35,462.5 | 42.5 | % | |||||||||||||||
Domestic Sales |
9.7 | % | 20.5 | % | 20.3 | % | ||||||||||||||||||
Export |
90.3 | % | 79.5 | % | 79.7 | % | ||||||||||||||||||
Steam coal |
3,289.8 | 3.0 | % | 3,288.7 | 4.7 | % | 5,107.2 | 6.1 | % | |||||||||||||||
Domestic Sales |
33.2 | % | 40.3 | % | 23.9 | % | ||||||||||||||||||
Export |
66.8 | % | 59.7 | % | 76.1 | % | ||||||||||||||||||
PCI and Anthracite |
24,092.3 | 21.7 | % | 18,740.2 | 26.4 | % | 15,767.3 | 18.9 | % | |||||||||||||||
Domestic Sales |
0.3 | % | 0.3 | % | 0.5 | % | ||||||||||||||||||
Export |
99.7 | % | 99.7 | % | 99.5 | % | ||||||||||||||||||
Middlings |
11,319.8 | 10.2 | % | 7,319.8 | 10.3 | % | 6,180.9 | 7.4 | % | |||||||||||||||
Domestic Sales |
34.1 | % | 19.7 | % | 11.1 | % | ||||||||||||||||||
Export |
65.9 | % | 80.3 | % | 88.9 | % | ||||||||||||||||||
Coke |
32,681.9 | 29.5 | % | 12,722.5 | 18.0 | % | 15,195.8 | 18.2 | % | |||||||||||||||
Domestic Sales |
35.4 | % | 24.8 | % | 30.2 | % | ||||||||||||||||||
Export |
64.6 | % | 75.2 | % | 69.8 | % | ||||||||||||||||||
Chemical products |
4,653.2 | 4.2 | % | 2,060.2 | 2.9 | % | 2,774.1 | 3.3 | % | |||||||||||||||
Domestic Sales |
84.7 | % | 76.4 | % | 72.9 | % | ||||||||||||||||||
Export |
15.3 | % | 23.6 | % | 27.1 | % | ||||||||||||||||||
Iron ore concentrate |
650.8 | 0.6 | % | 412.8 | 0.6 | % | 1,179.0 | 1.4 | % | |||||||||||||||
Domestic Sales |
93.8 | % | 100.0 | % | 100.0 | % | ||||||||||||||||||
Export |
6.2 | % | 0.0 | % | 0.0 | % | ||||||||||||||||||
Other (1) |
1,762.2 | 1.6 | % | 1,361.1 | 1.9 | % | 1,849.9 | 2.2 | % | |||||||||||||||
|
|
|
|
|
|
|
|
|
|
|
|
|||||||||||||
Total |
110,791.4 | 100.0 | % | 70,881.1 | 100.0 | % | 83,516.7 | 100.0 | % | |||||||||||||||
|
|
|
|
|
|
|
|
|
|
|
|
|||||||||||||
Domestic Sales |
23.0 | % | 20.1 | % | 21.5 | % | ||||||||||||||||||
Export |
77.0 | % | 79.9 | % | 78.5 | % |
(1) | Includes revenues from transportation, distribution, construction and other miscellaneous services provided to local customers. |
Region (1) |
2021 |
2020 |
2019 |
|||||||||
Asia |
56.1 | % | 60.1 | % | 60.8 | % | ||||||
Russia |
23.1 | % | 20.1 | % | 21.5 | % | ||||||
Europe |
12.7 | % | 16.8 | % | 15.3 | % | ||||||
CIS |
8.1 | % | 3.0 | % | 2.4 | % | ||||||
Other |
0.0 | % | 0.0 | % | 0.0 | % | ||||||
|
|
|
|
|
|
|||||||
Total |
100.0 | % | 100.0 | % | 100.0 | % | ||||||
|
|
|
|
|
|
(1) | The regional breakdown of sales is based on the geographic location of our customers, and not on the location of the end users of our products, as our customers are often distributors that resell and, in some cases, further export our products. |
Customer |
% of Total Mining Segment Sales |
Product |
% of Total Products Sales |
|||||||
Metinvest International SA |
6.6 | % | Coke | 22.5 | % | |||||
Sojitz Corporation |
5.6 | % | Coking coal concentrate | 16.3 | % | |||||
PCI and Anthracite | 4.1 | % | ||||||||
Aminco International Limited |
4.1 | % | PCI and Anthracite | 10.5 | % | |||||
Coking coal concentrate | 4.4 | % | ||||||||
Steam coal | 13.5 | % | ||||||||
Middlings | 1.5 | % | ||||||||
Pointer Investment Limited |
4.0 | % | PCI and Anthracite | 10.0 | % | |||||
Middlings | 8.2 | % | ||||||||
Coking coal concentrate | 2.2 | % | ||||||||
Steam coal | 11.9 | % | ||||||||
Minmetals South-East Asia Corporation Pte Ltd |
3.9 | % | Coking coal concentrate | 9.7 | % |
Group |
Company |
Coking Coal Production (Thousands of Tonnes) |
% of Coking Coal Production by Volume |
|||||||
EVRAZ plc |
Raspadskaya PAO |
23,255 | 22.9 | % | ||||||
CC Kolmar LLC |
GOK Denisovskiy JSC |
5,615 | 5.5 | % | ||||||
GOK Inaglinskiy JSC |
5,248 | 5.2 | % | |||||||
Kolmar Total |
10,863 | 10.7 | % | |||||||
Severstal PAO |
Vorkutaugol AO |
8,797 | 8.6 | % | ||||||
Mechel PAO |
Yakutugol JSHC |
3,961 | 3.9 | % | ||||||
Southern Kuzbass Coal Company PJSC |
3,056 | 3.0 | % | |||||||
Mechel Total |
7,017 | 6.9 | % | |||||||
UMMC-Holding Corp |
UMMC (CC Kuzbassrazrezugol AO) |
6,921 | 6.8 | % | ||||||
Other |
44,941 | 44.1 | % | |||||||
|
|
|
|
|||||||
Total |
101,794 | 100.0 | % | |||||||
|
|
|
|
Company |
Measured Resources |
Indicated Resources |
Total |
% in Open Pit |
||||||||||||
(In thousands of tonnes) |
||||||||||||||||
Yakutugol |
188,781 | 71,256 | 260,037 | 100.0 | % | |||||||||||
Southern Kuzbass Coal Company |
1,482,364 | 1,622 | 1,483,986 | 24.4 | % | |||||||||||
|
|
|
|
|
|
|
|
|||||||||
Total |
1,671,145 | 72,878 | 1,744,023 | 35.6 | % | |||||||||||
|
|
|
|
|
|
|
|
Company |
Category |
Coking Coal |
Steam Coal |
Anthracite |
Lignite |
Total |
||||||||||||||||||
(In thousands of tonnes) |
||||||||||||||||||||||||
Measured | 76,714 | 4,556 | — | 107,511 | 188,781 | |||||||||||||||||||
Indicated | 0 | 0 | — | 71,256 | 71,256 | |||||||||||||||||||
|
|
|
|
|
|
|
|
|
|
|||||||||||||||
Yakutugol |
Total | 76,714 | 4,556 | — | 178,767 | 260,037 | ||||||||||||||||||
Measured | 992,330 | 395,061 | 94,973 | 0 | 1,482,364 | |||||||||||||||||||
Indicated | 1,219 | 178 | 225 | 0 | 1,622 | |||||||||||||||||||
|
|
|
|
|
|
|
|
|
|
|||||||||||||||
Southern Kuzbass Coal Company |
Total | 993,549 | 395,239 | 95,198 | 0 | 1,483,986 | ||||||||||||||||||
Measured | 1,069,044 | 399,617 | 94,973 | 107,511 | 1,671,145 | |||||||||||||||||||
Indicated | 1,219 | 178 | 225 | 71,256 | 72,878 | |||||||||||||||||||
|
|
|
|
|
|
|
|
|
|
|||||||||||||||
Total |
1,070,263 | 399,795 | 95,198 | 178,767 | 1,744,023 | |||||||||||||||||||
|
|
|
|
|
|
|
|
|
|
Mine |
Measured Resources |
Indicated Resources |
Total |
Heat Value (1) |
% Sulfur |
|||||||||||||||
(In thousands of tonnes) |
(In kcal/kg) |
|||||||||||||||||||
Neryungrinsky Open Pit |
81,270 | 0 | 81,270 | 8,348 | 0.22 | |||||||||||||||
Kangalassky Open Pit |
65,205 | 20,475 | 85,680 | 6,763 | 0.46 | |||||||||||||||
Dzhebariki-Khaya Open Pit |
42,306 | 50,781 | 93,087 | 7,500 | 0.23 | |||||||||||||||
|
|
|
|
|
|
|||||||||||||||
Total |
188,781 | 71,256 | 260,037 | |||||||||||||||||
|
|
|
|
|
|
(1) | Heat value is reported on a moisture- and ash-free basis. |
Mine |
Measured Resources |
Indicated Resources |
Total |
Heat Value (1) |
% Sulfur |
|||||||||||||||
(In thousands of tonnes) |
(In kcal/kg) |
|||||||||||||||||||
Krasnogorsky Open Pit |
170,774 | 225 | 170,999 | 8,192 | 0.33 | |||||||||||||||
Olzherassky Open Pit |
68,717 | 1,397 | 70,114 | 8,521 | 0.30 | |||||||||||||||
Tomusinsky Open Pit |
7,632 | — | 7,632 | 8,572 | 0.30 | |||||||||||||||
Sibirginsky Open Pit |
112,850 | — | 112,850 | 8,591 | 0.30 | |||||||||||||||
Sibirginskaya Underground |
150,904 | — | 150,904 | 8,491 | 0.39 | |||||||||||||||
V.I. Lenina Underground |
693,156 | — | 693,156 | 8,606 | 0.40 | |||||||||||||||
Olzherasskaya-Novaya Underground |
208,508 | — | 208,508 | 7,887 | 0.18 | |||||||||||||||
Usinskaya Underground |
69,823 | — | 69,823 | — | — | |||||||||||||||
|
|
|
|
|
|
|||||||||||||||
Total |
1,482,364 | 1,622 | 1,483,986 | |||||||||||||||||
|
|
|
|
|
|
(1) | Heat value is reported on a moisture- and ash-free basis. |
Mine |
Measured Resources |
Indicated Resources |
Total |
Grade (Fe%) |
||||||||||||
(In thousands of tonnes) |
||||||||||||||||
Korshunovsky Open Pit |
38,048 | 0 | 38,048 | 24.2 | ||||||||||||
Rudnogorsky Open Pit |
40,826 | 2,184 | 43,010 | 30.4 | ||||||||||||
Sivaglinsky Development Open Pit |
0 | 7,289 | 7,289 | 55.1 | ||||||||||||
Pionersky Development Open Pit (1) |
18,644 | 54,345 | 72,989 | 37.8 | ||||||||||||
|
|
|
|
|
|
|
|
|||||||||
Total |
97,518 | 63,818 | 161,336 | 32.9 | ||||||||||||
|
|
|
|
|
|
|
|
(1) | Inferred resources (inferred resources are not converted to reserves) amounted to 89.5 million tonnes. |
Company |
Proven Reserves (1) |
Probable Reserves (1) |
Total |
% in Open Pit |
||||||||||||
(In thousands of tonnes) |
||||||||||||||||
Yakutugol |
90,249 | 0 | 90,249 | 100.0 | % | |||||||||||
Southern Kuzbass Coal Company |
293,926 | 231,578 | 525,504 | 62.6 | % | |||||||||||
|
|
|
|
|
|
|
|
|||||||||
Total |
384,175 | 231,578 | 615,753 | 68.0 | % | |||||||||||
|
|
|
|
|
|
|
|
(1) | Reserves include adjustments for loss and dilution modifying factors. |
Company |
Category |
Coking Coal |
Steam Coal |
Anthracite |
Lignite |
Total (1) |
||||||||||||||||||
(In thousands of tonnes) |
||||||||||||||||||||||||
Proven | 72,781 | 7,841 | — | 9,627 | 90,249 | |||||||||||||||||||
Probable | 0 | 0 | — | 0 | 0 | |||||||||||||||||||
|
|
|
|
|
|
|
|
|
|
|||||||||||||||
Yakutugol |
Total | 72,781 | 7,841 | — | 9,627 | 90,249 | ||||||||||||||||||
Proven | 118,054 | 123,345 | 52,528 | 0 | 293,926 | |||||||||||||||||||
Probable | 112,880 | 88,965 | 29,733 | 0 | 231,578 | |||||||||||||||||||
|
|
|
|
|
|
|
|
|
|
|||||||||||||||
Southern Kuzbass Coal Company |
Total | 230,934 | 212,310 | 82,261 | 0 | 525,504 | ||||||||||||||||||
Proven | 190,835 | 131,186 | 52,528 | 9,627 | 384,175 | |||||||||||||||||||
Probable | 112,880 | 88,965 | 29,733 | 0 | 231,578 | |||||||||||||||||||
|
|
|
|
|
|
|
|
|
|
|||||||||||||||
Total |
303,715 | 220,151 | 82,261 | 9,627 | 615,753 | |||||||||||||||||||
|
|
|
|
|
|
|
|
|
|
(1) | Reserves include adjustments for loss and dilution modifying factors. |
Mine |
Proven Reserves |
Probable Reserves |
Total (1)(2) |
Heat Value (3) |
% Sulfur |
|||||||||||||||
(In thousands of tonnes) |
(In kcal/kg) |
|||||||||||||||||||
Neryungrinsky Open Pit (4)(5) |
80,622 | 0 | 80,622 | 8,348 | 0.22 | |||||||||||||||
Kangalassky Open Pit (5) |
8,051 | 0 | 8,051 | 6,763 | 0.46 | |||||||||||||||
Dzhebariki-Khaya Open Pit (5) |
1,576 | 0 | 1,576 | 7,500 | 0.23 | |||||||||||||||
|
|
|
|
|
|
|||||||||||||||
Total |
90,249 | 0 | 90,249 | |||||||||||||||||
|
|
|
|
|
|
(1) | Reserves reported on a wet in-situ basis and include adjustments for loss and dilution modifying factors. |
(2) | These reserves amounts are based on the quantities that could be extracted economically using current operating costs and certain estimated future prices. In estimating the reserves, we used the following average prices: $77 per tonne (FCA basis) for coking coal concentrate and $34 per tonne (FCA basis) for raw steam coal. |
(3) | Heat value is reported on a moisture- and ash-free basis. |
(4) | Mined coking coal is processed at Neryungrinskaya Washing Plant with a weighted average yield of coking coal concentrate of 56%. |
(5) | Steam coal is sold as ROM without processing. |
Mine |
Proven Reserves |
Probable Reserves |
Total (1)(2)(3)(4) |
Heat Value (5) |
% Sulfur |
|||||||||||||||
(In thousands of tonnes) |
(In kcal/kg) |
|||||||||||||||||||
Krasnogorsky Open Pit |
89,803 | 53,288 | 143,091 | 8,192 | 0.33 | |||||||||||||||
Olzherassky Open Pit |
40,919 | 28,965 | 69,884 | 8,521 | 0.30 | |||||||||||||||
Tomusinsky Open Pit |
4,636 | 0 | 4,636 | 8,572 | 0.30 | |||||||||||||||
Sibirginsky Open Pit |
55,543 | 55,357 | 110,900 | 8,591 | 0.30 | |||||||||||||||
Sibirginskaya Underground |
33,566 | 17,940 | 51,506 | 8,491 | 0.39 | |||||||||||||||
V.I. Lenina Underground |
18,365 | 30,498 | 48,863 | 8,606 | 0.40 | |||||||||||||||
Olzherasskaya-Novaya Underground |
51,095 | 45,529 | 96,624 | 7,887 | 0.18 | |||||||||||||||
|
|
|
|
|
|
|||||||||||||||
Total |
293,926 | 231,578 | 525,504 | |||||||||||||||||
|
|
|
|
|
|
(1) | Reserves reported on a wet in-situ basis and include adjustments for loss and dilution modifying factors. |
(2) | These reserves amounts are based on the quantities that could be extracted economically using current operating costs and certain estimated future prices. In estimating the reserves, we used the following |
average prices (FCA basis): $77 per tonne for coking coal concentrate, $71 per tonne for anthracite and $35 per tonne for raw steam coal. |
(3) | Reserves are presented on an assumed 100% basis. |
(4) | Mined coal is processed at Sibir Washing Plant, Kuzbasskaya Washing Plant, Tomusinskaya Washing Plant, Sibirginskaya Processing Unit and Krasnogorskaya Washing Plant with a total weighted average yield of 79%, 75%, 87%, 90% and 62%, respectively. |
(5) | Heat value is reported on a moisture- and ash-free basis. |
Mine |
Proven Reserves |
Probable Reserves |
Total (1)(2)(3) |
Grade (Fe%) (4) |
||||||||||||
(In thousands of tonnes) |
||||||||||||||||
Korshunovsky Open Pit |
41,145 | 0 | 41,145 | 23.8 | ||||||||||||
Rudnogorsky Open Pit |
44,170 | 2,200 | 46,370 | 29.2 | ||||||||||||
Sivaglinsky Development Open Pit |
0 | 5,375 | 5,375 | 55.1 | ||||||||||||
|
|
|
|
|
|
|
|
|||||||||
Total |
85,315 | 7,575 | 92,890 | 28.3 | ||||||||||||
|
|
|
|
|
|
|
|
(1) | Reserves reported on a wet in-situ basis and include adjustments for loss and dilution modifying factors. |
(2) | These reserves amounts are based on the quantities that could be extracted economically using current operating costs and certain estimated future prices. In estimating the reserves, we used the average price of $103 per tonne (FCA basis) for iron ore concentrate. |
(3) | Reserves are presented on an assumed 100% basis. |
(4) | Mined iron ore is processed at the Korshunovsky concentrating plant with a weighted average yield of iron ore concentrate of 33%. |
Product |
2021 |
2020 |
2019 |
|||||||||
(In thousands of tonnes) |
||||||||||||
Pig Iron |
3,163 | 3,529 | 3,326 | |||||||||
Semi-Finished Steel Products, including: |
1,054 | 838 | 862 | |||||||||
Carbon and Low-Alloyed Semi-Finished Products |
887 | 826 | 850 | |||||||||
Long Steel Products, including: |
2,220 | 2,321 | 2,293 | |||||||||
Stainless Long Products |
11 | 11 | 11 | |||||||||
Alloyed Long Products |
187 | 29 | 26 | |||||||||
Rebar |
1,018 | 1,026 | 1,047 | |||||||||
Rails |
49 | 288 | 280 | |||||||||
Structural Shapes |
441 | 477 | 415 | |||||||||
Wire Rod |
200 | 160 | 159 | |||||||||
Low-Alloyed Engineering Steel |
313 | 330 | 355 | |||||||||
Flat Steel Products, including: |
290 | 323 | 323 | |||||||||
Stainless Flat Products |
7 | 12 | 17 | |||||||||
Carbon and Low-Alloyed Flat Products |
283 | 311 | 306 | |||||||||
Forgings, including: |
40 | 39 | 39 | |||||||||
Stainless Forgings |
1 | 1 | 1 | |||||||||
Alloyed Forgings |
29 | 27 | 26 | |||||||||
Carbon and Low-Alloyed Forgings |
10 | 11 | 12 | |||||||||
Stampings |
69 | 39 | 108 | |||||||||
Wire Products, including: |
524 | 504 | 529 | |||||||||
Wire |
489 | 466 | 475 | |||||||||
Ropes |
35 | 32 | 35 |
Production Area |
Capacity in 2021 |
Capacity Utilization Rate in 2021 |
Planned Increase (2022-2024) |
|||||||||
(In thousands of tonnes, except for percentages) |
||||||||||||
Sintering |
4,665 | 85.8 | % | — | ||||||||
Pig iron |
3,912 | 80.8 | % | — | ||||||||
Steelmaking |
3,783 | 88.0 | % | — | ||||||||
Rolling |
3,567 | 85.7 | % | — |
Production Area |
Capacity in 2021 |
Capacity Utilization Rate in 2021 |
Planned Increase (2022-2024) |
|||||||||
(In thousands of tonnes, except for percentages) |
||||||||||||
Steelmaking |
212 | 92.6 | % | 34 | ||||||||
Rolling |
379 | 95.8 | % | 4 | ||||||||
Wire products |
13 | 100.9 | % | — |
Production Area |
Capacity in 2021 |
Capacity Utilization Rate in 2021 |
Planned Increase (2022-2024) |
|||||||||
(In thousands of tonnes, except for percentages) |
||||||||||||
Rolling |
486 | 101.2 | % | 54 | ||||||||
Wire products |
493 | 99.3 | % | 44 |
Production Area |
Capacity in 2021 |
Capacity Utilization Rate in 2021 |
Planned Increase (2022-2024) |
|||||||||
(In thousands of tonnes, except for percentages) |
||||||||||||
Wire products |
63 | 85.7 | % | — |
Production Area |
Capacity in 2021 |
Capacity Utilization Rate in 2021 |
Planned Increase (2022-2024) |
|||||||||
(In thousands of tonnes, except for percentages) |
||||||||||||
Stampings and forgings |
91 | 120.6 | % | 45 |
Production Area |
Capacity in 2021 |
Capacity Utilization Rate in 2021 |
Planned Increase (2022-2024) |
|||||||||
(In thousands of tonnes, except for percentages) |
||||||||||||
Wire products |
74 | 57.7 | % | — |
Production Area |
Capacity in 2021 |
Capacity Utilization Rate in 2021 |
Planned Increase (2022-2024) |
|||||||||
(In thousands of tonnes, except for percentages) |
||||||||||||
Ferrosilicon (65% silicon content in the alloy) |
87.3 | 89.1 | % | — |
2021 |
2020 |
2019 |
||||||||||||||||||||||
Product |
Amount |
% of Revenues |
Amount |
% of Revenues |
Amount |
% of Revenues |
||||||||||||||||||
(In millions of Russian rubles, except for percentages) |
||||||||||||||||||||||||
Pig Iron |
97.5 | 0.1 | % | 260.7 | 0.2 | % | 76.3 | 0.0 | % | |||||||||||||||
Semi-Finished Steel Products, including: |
6,361.0 | 2.4 | % | 181.1 | 0.1 | % | 137.0 | 0.1 | % | |||||||||||||||
Carbon and Low-Alloyed Semi-Finished Products |
6,266.7 | 2.4 | % | 165.0 | 0.1 | % | 88.6 | 0.1 | % | |||||||||||||||
Long Steel Products, including: |
149,514.6 | 57.0 | % | 98,907.7 | 59.3 | % | 97,692.2 | 55.9 | % | |||||||||||||||
Stainless Long Products |
2,465.2 | 1.0 | % | 1,726.1 | 1.0 | % | 2,703.1 | 1.6 | % | |||||||||||||||
Other Long Products |
70,834.8 | 27.0 | % | 51,944.2 | 31.1 | % | 50,045.9 | 28.6 | % | |||||||||||||||
Rebar |
71,141.9 | 27.1 | % | 41,665.0 | 25.0 | % | 42,268.0 | 24.2 | % | |||||||||||||||
Wire Rod |
5,072.7 | 1.9 | % | 3,572.4 | 2.2 | % | 2,675.2 | 1.5 | % | |||||||||||||||
Flat Steel Products, including: |
36,828.3 | 14.0 | % | 23,055.7 | 13.8 | % | 23,371.5 | 13.4 | % | |||||||||||||||
Stainless Flat Products |
3,561.6 | 1.3 | % | 3,608.6 | 2.2 | % | 4,025.0 | 2.3 | % | |||||||||||||||
Carbon and Low-Alloyed Flat Products |
33,266.7 | 12.7 | % | 19,447.1 | 11.6 | % | 19,346.5 | 11.1 | % | |||||||||||||||
Forgings, including: |
4,967.1 | 1.9 | % | 3,414.0 | 2.0 | % | 3,212.9 | 1.8 | % | |||||||||||||||
Stainless Forgings |
698.8 | 0.3 | % | 403.0 | 0.2 | % | 427.0 | 0.2 | % | |||||||||||||||
Other Forgings |
4,268.3 | 1.6 | % | 3,011.0 | 1.8 | % | 2,785.9 | 1.6 | % | |||||||||||||||
Stampings |
8,002.7 | 3.0 | % | 5,036.7 | 3.0 | % | 11,604.7 | 6.6 | % | |||||||||||||||
Wire Products, including: |
40,355.5 | 15.4 | % | 25,971.3 | 15.6 | % | 27,086.4 | 15.5 | % | |||||||||||||||
Wire |
26,277.8 | 10.0 | % | 16,364.6 | 9.8 | % | 17,417.8 | 10.0 | % | |||||||||||||||
Ropes |
4,547.6 | 1.8 | % | 3,467.1 | 2.1 | % | 3,532.8 | 2.0 | % | |||||||||||||||
Other Wire Products |
9,530.1 | 3.6 | % | 6,139.6 | 3.7 | % | 6,135.8 | 3.5 | % | |||||||||||||||
Steel Pipes |
5,029.3 | 1.9 | % | 3,380.4 | 2.0 | % | 3,281.4 | 1.9 | % | |||||||||||||||
Ferrosilicon |
7,418.5 | 2.8 | % | 3,159.4 | 1.9 | % | 3,228.5 | 1.8 | % | |||||||||||||||
Other |
3,925.8 | 1.5 | % | 3,517.7 | 2.1 | % | 5,159.5 | 3.0 | % | |||||||||||||||
|
|
|
|
|
|
|
|
|
|
|
|
|||||||||||||
Total |
262,500.3 | 100.0 | % | 166,884.7 | 100.0 | % | 174,850.4 | 100.0 | % | |||||||||||||||
|
|
|
|
|
|
|
|
|
|
|
|
Region (1) |
2021 |
2020 |
2019 |
|||||||||
Russia |
62.8 | % | 68.8 | % | 71.0 | % | ||||||
Europe |
18.1 | % | 16.4 | % | 15.8 | % | ||||||
CIS |
15.0 | % | 13.0 | % | 11.1 | % | ||||||
Asia |
2.2 | % | 1.6 | % | 1.9 | % | ||||||
Middle East (2) |
1.7 | % | 0.0 | % | 0.0 | % | ||||||
Other |
0.1 | % | 0.1 | % | 0.1 | % | ||||||
United States |
0.1 | % | 0.1 | % | 0.1 | % | ||||||
|
|
|
|
|
|
|||||||
Total |
100.0 | % | 100.0 | % | 100.0 | % | ||||||
|
|
|
|
|
|
(1) | The regional breakdown of sales is based on the geographic location of our customers, and not on the location of the end users of our products, as our customers are often distributors that resell and, in some cases, further export our products. |
(2) | Our steel segment sales to Middle East primarily go to United Arab Emirates, which accounted for 80.5% of the total steel segment sales to Middle East in 2021. We did not have any direct sales to Iran and Syria in 2021, and we have no plans to make such direct sales in the future. |
Product |
2021 |
2020 |
2019 |
|||||||||
(In millions of Russian rubles, except for percentages) |
||||||||||||
Pig Iron |
97.5 | 260.7 | 76.3 | |||||||||
Domestic Sales |
100.0 | % | 100.0 | % | 100.0 | % | ||||||
Export |
0.0 | % | 0.0 | % | 0.0 | % | ||||||
Semi-Finished Steel Products |
6,361.0 | 181.1 | 137.0 | |||||||||
Domestic Sales |
36.6 | % | 100.0 | % | 100.0 | % | ||||||
Export |
63.4 | % | 0.0 | % | 0.0 | % | ||||||
Long Steel Products |
149,514.6 | 98,907.7 | 97,692.2 | |||||||||
Domestic Sales |
83.4 | % | 86.7 | % | 88.8 | % | ||||||
Export |
16.6 | % | 13.3 | % | 11.2 | % | ||||||
Flat Steel Products |
36,828.3 | 23,055.7 | 23,371.5 | |||||||||
Domestic Sales |
84.7 | % | 88.3 | % | 86.5 | % | ||||||
Export |
15.3 | % | 11.7 | % | 13.5 | % | ||||||
Forgings |
4,967.1 | 3,414.0 | 3,212.9 | |||||||||
Domestic Sales |
52.2 | % | 43.2 | % | 48.2 | % | ||||||
Export |
47.8 | % | 56.8 | % | 51.8 | % | ||||||
Stampings |
8,002.7 | 5,036.7 | 11,604.7 | |||||||||
Domestic Sales |
95.5 | % | 97.0 | % | 94.7 | % | ||||||
Export |
4.5 | % | 3.0 | % | 5.3 | % | ||||||
Wire Products |
40,355.5 | 25,971.3 | 27,086.4 | |||||||||
Domestic Sales |
86.7 | % | 87.6 | % | 86.6 | % | ||||||
Export |
13.3 | % | 12.4 | % | 13.4 | % | ||||||
Steel Pipes |
5,029.3 | 3,380.4 | 3,281.4 | |||||||||
Domestic Sales |
93.5 | % | 93.5 | % | 93.2 | % | ||||||
Export |
6.5 | % | 6.5 | % | 6.8 | % | ||||||
Ferrosilicon |
7,418.5 | 3,159.4 | 3,228.5 | |||||||||
Domestic Sales |
32.5 | % | 29.9 | % | 39.9 | % | ||||||
Export |
67.5 | % | 70.1 | % | 60.1 | % | ||||||
Other |
3,925.8 | 3,517.7 | 5,159.5 | |||||||||
Domestic Sales |
97.5 | % | 97.2 | % | 98.5 | % | ||||||
Export |
2.5 | % | 2.8 | % | 1.5 | % | ||||||
|
|
|
|
|
|
|||||||
Total |
262,500.3 | 166,884.7 | 174,850.4 | |||||||||
|
|
|
|
|
|
|||||||
Domestic Sales |
81.7 | % | 85.8 | % | 87.3 | % | ||||||
Export |
18.3 | % | 14.2 | % | 12.7 | % |
Use by Industry |
Construction |
Metals Trading |
Ferrous Metallurgy |
Engineering and Metalworking |
Vehicles Manufacturing |
Railways Construction and Repair |
Other Industries (1) |
|||||||||||||||||||||
Semi-Finished Steel Products |
0.0 | % | 0.2 | % | 1.6 | % | 0.0 | % | 0.1 | % | 0.0 | % | 98.1 | % | ||||||||||||||
Long Steel Products |
24.1 | % | 27.7 | % | 15.3 | % | 4.9 | % | 5.9 | % | 1.0 | % | 21.1 | % | ||||||||||||||
Flat Steel Products |
8.2 | % | 22.4 | % | 54.0 | % | 3.3 | % | 3.5 | % | 0.1 | % | 8.5 | % | ||||||||||||||
Forgings |
0.0 | % | 60.7 | % | 16.3 | % | 19.6 | % | 3.2 | % | 0.0 | % | 0.2 | % | ||||||||||||||
Stampings |
0.0 | % | 4.6 | % | 0.1 | % | 12.7 | % | 82.5 | % | 0.0 | % | 0.1 | % | ||||||||||||||
Wire Products |
16.6 | % | 31.5 | % | 24.7 | % | 4.1 | % | 1.8 | % | 5.0 | % | 16.3 | % | ||||||||||||||
Steel Pipes |
12.5 | % | 63.4 | % | 13.5 | % | 1.8 | % | 0.1 | % | 1.2 | % | 7.5 | % |
(1) | Including mining and power industries and consumer goods sector. |
• | Novolipetsk Steel PAO NLMK (hot-rolled and cold-rolled), galvanized products and slabs, as well as long products. The company’s production facilities are located in Lipetsk (NLMK), in the Sverdlovsk region (long products producer NLMK-Ural and wire products producer NLMK-Metalware) and in the Kaluga region (long products producer NLMK-Kaluga). NLMK exported 53.8% of its steel products in 2021. Domestically, NLMK’s largest customers are in the construction and oil and gas industries, followed by companies in the automotive sector. NLMK also controls iron ore producer Stoilensky GOK and coke producer Altai-Koks. |
• | Magnitogorsk Iron & Steel Works PAO MMK |
• | EVRAZ plc EVRAZ |
• | Severstal PAO Severstal |
• | Metalloinvest Holding Company AO Metalloinvest OEMK |
• | Reinforcement bars (“rebar”) 6-40 millimeters range. In 2021, the largest domestic rebar producers were NLMK (22.1%), Novostal-M (15.2%), EVRAZ (11.2%), Mechel (10.6%), MMK (4.9%) and Severstal (4.6%). |
• | Wire rod Novostal-M (29.7%), Mechel (17.5%), NLMK (14.5%), MMK (11.4%), EVRAZ (9.5%), Severstal (8.4%) and Tula-Steel (7.6%). |
Manufacturer |
Production |
Market Share by Production Volume |
||||||
(In thousands of tonnes, except for percentages) |
||||||||
EVRAZ |
4,658 | 21.4 | % | |||||
NLMK |
2,738 | 12.6 | % | |||||
Novostal-M |
2,732 | 12.6 | % | |||||
Mechel |
2,570 | 11.8 | % | |||||
MMK |
1,611 | 7.4 | % | |||||
Severstal |
1,105 | 5.1 | % | |||||
Metalloinvest |
962 | 4.4 | % | |||||
Other |
5,377 | 24.7 | % | |||||
|
|
|
|
|||||
Total |
21,753 | 100.0 | % | |||||
|
|
|
|
Manufacturer |
Production |
Market Share by Production Volume |
||||||
(In thousands of tonnes, except for percentages) |
||||||||
Novostal-M |
1,185 | 29.7 | % | |||||
Mechel |
699 | 17.5 | % | |||||
NLMK |
581 | 14.5 | % | |||||
MMK |
458 | 11.4 | % | |||||
EVRAZ |
379 | 9.5 | % | |||||
Severstal |
336 | 8.4 | % | |||||
Tula-Steel |
303 | 7.6 | % | |||||
Other |
56 | 1.4 | % | |||||
|
|
|
|
|||||
Total |
3,997 | 100.0 | % | |||||
|
|
|
|
(1) | Including wire rod further processed into wire and other products within the same holding company. |
Manufacturer |
Production |
Market Share by Production Volume |
||||||
(In thousands of tonnes, except for percentages) |
||||||||
NLMK |
2,147 | 22.1 | % | |||||
Novostal-M |
1,476 | 15.2 | % | |||||
EVRAZ |
1,088 | 11.2 | % | |||||
Mechel |
1,034 | 10.6 | % | |||||
MMK |
480 | 4.9 | % | |||||
Severstal |
451 | 4.6 | % | |||||
Other |
3,057 | 31.4 | % | |||||
|
|
|
|
|||||
Total |
9,733 | 100.0 | % | |||||
|
|
|
|
Manufacturer |
Production |
Market Share by Production Volume |
||||||
(In thousands of tonnes, except for percentages) |
||||||||
VMZ Red October |
17.6 | 70.0 | % | |||||
Mechel |
6.4 | 25.6 | % | |||||
Other |
1.1 | 4.4 | % | |||||
|
|
|
|
|||||
Total |
25.1 | 100.0 | % | |||||
|
|
|
|
Manufacturer |
Production |
Market Share by Production Volume |
||||||
(In thousands of tonnes, except for percentages) |
||||||||
Severstal-Metiz |
560.7 | 19.7 | % | |||||
Mechel |
467.9 | 16.5 | % | |||||
MMK-Metiz |
459.5 | 16.1 | % | |||||
NLMK-Metalware |
284.0 | 10.0 | % | |||||
EVRAZ |
229.0 | 8.1 | % | |||||
Other |
840.2 | 29.6 | % | |||||
|
|
|
|
|||||
Total |
2,841.3 | 100.0 | % | |||||
|
|
|
|
Manufacturer |
Production |
Market Share by Production Volume |
||||||
(In thousands of tonnes, except for percentages) |
||||||||
Severstal-Metiz |
46.5 | 50.1 | % | |||||
Mechel |
27.8 | 30.0 | % | |||||
MMK-Metiz |
18.5 | 19.9 | % | |||||
|
|
|
|
|||||
Total |
92.8 | 100.0 | % | |||||
|
|
|
|
• | Kuznetsk Ferroalloys AO Kuznetsk Ferroalloys |
• | Chelyabinsk Electrometallurgical Plant AO ChEMK |
• | Yurginsk Ferroalloy Plant AO Yurginsk Ferroalloy Plant |
Manufacturer |
Region |
Production |
Market Share by Production Volume |
|||||||||
(In thousands of tonnes, except for percentages) |
||||||||||||
Kuznetsk Ferroalloys |
Kemerovo | 281.9 | 49.9 | % | ||||||||
ChEMK |
Chelyabinsk | 88.9 | 15.7 | % | ||||||||
Yurginsk Ferroalloy Plant |
Kemerovo | 86.3 | 15.3 | % | ||||||||
Bratsk Ferroalloy Plant |
Irkutsk | 81.3 | 14.4 | % | ||||||||
NLMK |
Lipetsk | 26.4 | 4.7 | % | ||||||||
|
|
|
|
|||||||||
Total |
564.8 | 100.0 | % | |||||||||
|
|
|
|
2021 |
2020 |
2019 |
||||||||||
(In million kWh) |
||||||||||||
Electricity |
2,685.1 | 3,151.2 | 3,395.3 |
Generation Unit No. |
Year of Manufacture |
Month and Year of Commissioning at Southern Kuzbass Power Plant |
Installed Capacity (MW) |
Electricity Production in 2021 (million kWh) |
||||||||||||
VK-50-2 |
1950 | April 1951 | 53 | 115.2 | ||||||||||||
VK-50-2 |
1950 | November 1951 | 53 | — | ||||||||||||
VK-50-2 |
1950 | August 1952 | 53 | 154.1 | ||||||||||||
VK-50-2 |
1952 | February 1953 | 53 | 88.3 | ||||||||||||
T-115-8,8 |
1996 | December 2003 | 113 | 135.3 | ||||||||||||
T-88/106-90 |
1953 | July 1954 | 88 | 352.7 | ||||||||||||
VK-50-2 |
1954 | December 1954 | 53 | 49.8 | ||||||||||||
T-88/106-90 |
1953 | September 1956 | 88 | 319.1 | ||||||||||||
|
|
|
|
|||||||||||||
Total |
554 | 1,214.5 | ||||||||||||||
|
|
|
|
Planned Increase in Capacity and/or Other Improvement |
Approximate Total Planned Expenditures (1) |
Year of Project Launch |
Estimated Year of Completion |
|||||||||||
(In millions of Russian rubles) |
||||||||||||||
Mining Segment |
||||||||||||||
Maintenance expenditures |
Maintaining current coal and iron ore mining and coal and iron ore concentrate production | 33,280 | 2022 | 2024 | ||||||||||
Steel Segment |
||||||||||||||
Maintenance expenditures |
Maintaining current output capacity | 18,683 | 2022 | 2024 | ||||||||||
Beloretsk Metallurgical Plant |
||||||||||||||
Modernization of steel-wire-rope production |
Installation of new drawing equipment | 1,297 | 2016 | 2023 | ||||||||||
Power segment |
||||||||||||||
Maintenance expenditures |
Maintaining current output capacity | 2,223 | 2022 | 2024 | ||||||||||
Transport division |
||||||||||||||
Maintenance expenditures |
Maintaining current output capacity | 1,346 | 2022 | 2024 | ||||||||||
Port Posiet |
||||||||||||||
Technical modernization of Port Posiet |
Increase of cargo-handling capacity to 9.0 million tonnes per annum | 4,928 | 2009 | 2022 |
(1) | We estimate that approximately RUB 705.0 million of planned expenditures were spent on the aforementioned projects in 2021. In 2021, we spent RUB 4,705.2 million in total on capital expenditures. |
• | implement formal environmental management systems that are aligned with applicable international standards; |
• | identify, assess, monitor, control and manage significant environmental risks; |
• | establish clear and meaningful environmental objectives and targets aimed at continuous improvement; |
• | implement, maintain and regularly test emergency response plans; |
• | identify potential environmental emergencies; and |
• | comply with all applicable laws and regulations and when practicable, strive to exceed those requirements. |
• | the use of subsoil, which is described in more detail in “— Subsoil Licensing in Russia” below; |
• | the use of water resources; |
• | the emission and discharge of pollutants into the environment; |
• | the handling of waste of a I-IV hazard class; |
• | the handling of industrial explosives; |
• | operation of explosive and fire and chemically hazardous production facilities of a I-III hazard class; |
• | fire control and security; |
• | medical operations; |
• | mine surveying; |
• | loading and unloading operations; |
• | transportation activities; |
• | collection, processing, storage and sale of ferrous and non-ferrous scrap; |
• | works with information classified as state secret; |
• | manufacturing of equipment for nuclear facility; and |
• | operation of radiation source. |
• | other than in respect to financial organizations, such as banks, an acquisition by a person (or its group) of more than 25% of the voting shares of a Russian joint-stock company (or one-third of the interests in a Russian limited liability company), except upon incorporation, and the subsequent increase of these stakes to more than 50% of the total number of the voting shares and more than 75% of the voting shares (one-half and two-thirds of the interests in a Russian limited liability company), or acquisition |
by a person (or its group) of ownership or rights of use with respect to the core production assets (other than land and non-industrial buildings, constructions, premises and parts thereof or constructions in progress) and/or intangible assets of an entity which are located in Russia if the balance sheet value of such assets exceeds 20% of the total balance sheet value of the core production and intangible assets of such entity, or obtaining rights to determine the conditions of business activity of a Russian entity or to exercise the powers of its executive body by a person (or its group), or an acquisition by a person (or its group) of more than 50% of the voting shares (interests) of a foreign entity, which has supplied goods, works and/or services to Russia in an amount exceeding RUB 1 billion in the preceding year, or other rights to determine the conditions of business activity of such entity or to exercise the powers of its executive body, if, in any of the above cases, the aggregate asset value of an acquirer and its group together with a target and its group (excluding the asset value of the seller and its group, if as a result of the acquisition the seller and its group cease to determine the conditions of business activity of the target) exceeds RUB 7 billion and at the same time the total asset value of the target and its group exceeds RUB 400 million, or the total annual revenues of such acquirer and its group, and the target and its group for the preceding calendar year exceed RUB 10 billion and at the same time the total asset value of the target and its group exceeds RUB 400 million; |
• | mergers and consolidations of entities, other than financial organizations, if their aggregate asset value (the aggregate asset value of the groups of persons to which they belong) exceeds RUB 7 billion, or total annual revenues of such entities (or groups of persons to which they belong) for the preceding calendar year exceed RUB 10 billion; |
• | founding of a business entity, if its charter capital is paid by the shares (or limited liability company interests) and/or the assets (other than cash) of another business entity (other than financial organization) or the newly founded business entity acquires shares (or limited liability company interests) and/or the assets (other than cash) of another business entity based on a transfer act or a separation balance sheet and rights in respect of such shares (or limited liability company interests) and/or assets (excluding monetary funds) as specified above, at the same time provided that the aggregate asset value of the founders (or group of persons to which they belong) and the business entities (or groups of persons to which they belong) which shares (or limited liability company interests) and/or assets (other than cash) are contributed to the charter capital of the newly founded business entity exceeds RUB 7 billion, or total annual revenues of the founders (or group of persons to which they belong) and the business entities (or groups of persons to which they belong) which shares (or limited liability company interests) and/or assets are contributed to the charter capital of the newly founded business entity for the preceding calendar year exceed RUB 10 billion; and |
• | entering into joint venture agreements between competitors, if their aggregate asset value (the aggregate asset value of the groups of persons to which they belong) exceeds RUB 7 billion, or total annual revenues of such entities (or groups of persons to which they belong) for the preceding calendar year exceed RUB 10 billion. |
• | establishing and maintaining monopolistically high or monopolistically low prices of goods; |
• | withdrawing goods from circulation, if the result of such withdrawal is an increase in the price of goods; |
• | imposing contractual terms upon a counterparty which are unprofitable for the counterparty or not related to with the subject matter of agreement (i.e., terms that are economically or technologically unjustified); |
• | reducing or terminating, without economical or technological justification, production of goods if there is a demand for the goods or orders for their delivery have been placed and it is possible to produce them profitably; |
• | refusing or evading, without economical or technological justification, to enter into a contract with customers in cases when the production or delivery of the relevant goods is possible; |
• | establishing without economical, technological or other justification different prices for the same goods; |
• | establishing unjustifiably high or unjustifiably low price of a financial service by a financial organization; |
• | creating discriminatory conditions; |
• | creating barriers to entry into the market for the relevant goods or forcing other companies to leave the market; |
• | violating pricing procedures established by law; and |
• | manipulating prices in the wholesale and/or retail electricity (capacity) markets. |
• | liquidation of the enterprise or downsizing of staff; |
• | failure of the employee to comply with the position’s requirements due to incompetence, as confirmed by the results of an attestation; |
• | repeated failure of the employee to fulfill his or her work duties without valid reason, provided that the employee has been disciplined previously; |
• | entering the workplace under the influence of alcohol, narcotics or other intoxicating substances; |
• | a single gross breach by an employee of his or her work duties, including truancy; |
• | disclosure of state secrets or other confidential information, which an employee has come to know during fulfillment of his professional duties; |
• | embezzlement, willful damage or destruction of assets, and misappropriation as confirmed by a court decision or a decision by another competent governmental authority; |
• | failure to comply with safety requirements in the workplace if such failure to comply caused injuries, casualties or catastrophe; and |
• | provision by the employee of false documents upon entry into the employment contract. |
• | negotiate collective contracts and agreements such as those between the trade unions and employers, federal, regional and local governmental authorities and other entities; |
• | monitor compliance with labor laws, collective contracts and other agreements; |
• | access work sites and offices, and request information relating to labor issues from the management of companies and state and municipal authorities; |
• | represent their members and other employees in individual and collective labor disputes with management; |
• | organize and participate in strikes; |
• | monitor redundancy of employees and seek action by municipal authorities to delay or suspend mass layoffs; and |
• | appoint representatives of employees authorized to participate in meetings of the collegial management body with a consultative vote. |
• | legal restrictions as to rendering redundant employees elected or appointed to the management of trade unions; |
• | protection from disciplinary punishment or dismissal on the initiative of the employer without prior consent of the management of the trade union and, in certain circumstances, the consent of the relevant trade union association; |
• | retention of job positions for those employees who stop working due to their election to the management of trade unions; |
• | protection from dismissal for employees who previously served in the management of a trade union for two years after the termination of the office term, except where a company is liquidated or the employer is otherwise entitled to dismiss the employee; and |
• | provision of necessary equipment, premises and vehicles by the employer for use by the trade union free of charge, if provided for by a collective contract or other agreement. |
• | the mining segment, comprising production and sale of coal (metallurgical and steam), coke and chemical products and iron ore concentrate, which supplies raw materials to our steel and power |
segments and also sells substantial amounts of raw materials to third parties, and includes logistical assets, such as our seaports on the Sea of Japan and on the Sea of Azov, and our railway transportation assets; |
• | the steel segment, comprising production and sale of semi-finished steel products, long products of a wide range of steel grades, carbon and stainless flat products, high value-added metal products, including wire products, stampings and forgings, structural shapes, rails and others, and ferrosilicon, as well as our river port on the Kama River, a tributary of the Volga River; and |
• | the power segment, comprising generation and sale of electricity and heat energy, which supplies electricity and heat energy to our mining and steel segments and also sells a portion of electricity and heat energy to third parties. |
Name |
Location of Assets |
Product/Business |
Date Control Acquired/Date of Incorporation |
Voting Interest (1) |
||||||||||||
Mining Segment |
||||||||||||||||
Southern Kuzbass Coal Company |
Russia | |
Coking coal, steam coal, anthracite and PCI |
January 1999 | 99.1% | |||||||||||
Korshunov Mining Plant |
Russia | Iron ore concentrate | October 2003 | 90.0% | ||||||||||||
Port Posiet |
Russia | |
Seaport: coal warehousing and transshipment |
February 2004 | 97.8% | |||||||||||
Mechel Coke |
Russia | Coke and chemical products | June 2006 | 100.0% | ||||||||||||
Moscow Coke and Gas Plant |
Russia | Coke and chemical products | October 2006 | 99.5% | ||||||||||||
Yakutugol |
Russia | Coking coal, steam coal | October 2007 | 100.0% | ||||||||||||
Port Temryuk |
Russia | |
Seaport: coal and metal transshipment |
March 2008 | 100.0% | |||||||||||
Steel Segment |
||||||||||||||||
Chelyabinsk Metallurgical Plant |
Russia | |
Semi-finished products, long and flat steel products |
December 2001 | 93.7% | |||||||||||
Vyartsilya Metal Products Plant |
Russia | Wire products | May 2002 | 93.3% | ||||||||||||
Beloretsk Metallurgical Plant |
Russia | |
Long steel products, wire products |
June 2002 | 91.4% |
|||||||||||
Urals Stampings Plant |
Russia | Stampings and forgings | April 2003 | 90.0% | ||||||||||||
Mechel Nemunas |
Lithuania | Wire products | October 2003 | 100.0% | ||||||||||||
Izhstal |
Russia | |
Long steel products, semi- finished products |
May 2004 | 90.0% | |||||||||||
Port Kambarka |
Russia | River port | April 2005 | 90.4% | ||||||||||||
Bratsk Ferroalloy Plant |
Russia | Ferrosilicon | August 2007 | 100.0% | ||||||||||||
Power Segment |
||||||||||||||||
Mechel Energo |
Russia | Power sales | February 2004 | 100.0% | ||||||||||||
Southern Kuzbass Power Plant |
Russia | Power generation | April 2007 | 98.3% | ||||||||||||
Kuzbass Power Sales Company |
Russia | Electricity distribution | June 2007 | 72.1% |
(1) | The percentages provided in this table are as of December 31, 2021. Some of our Russian subsidiaries have preferred shares outstanding that have voting rights similar to the common shares rights if dividends on those shares have not been paid. We have calculated voting interests by including these preferred shares for subsidiaries where dividends have not been paid. |
• | The mining segment supplied approximately 28% of the steel segment’s iron ore feed requirements, 100% of the steel segment’s coke requirements and 82% of the power segment’s coal requirements; |
• | The steel segment supplies wires, ropes, wire products and other metal products to the mining segment for use in its day-to-day |
• | Our co-generation facilities supplied approximately 26% of our group’s overall electricity requirements. |
Year Ended December 31, |
||||||||||||||||||||||||
2021 |
2020 |
2019 |
||||||||||||||||||||||
Amount |
% of Revenues |
Amount |
% of Revenues |
Amount |
% of Revenues |
|||||||||||||||||||
(In millions of Russian rubles, except for percentages) |
||||||||||||||||||||||||
Revenue from contracts with customers |
402,074 | 100.0 | % | 265,454 | 100.0 | % | 287,153 | 100.0 | % | |||||||||||||||
Cost of sales |
(223,993 | ) | (55.7 | %) | (170,605 | ) | (64.3 | %) | (183,086 | ) | (63.8 | %) | ||||||||||||
|
|
|
|
|
|
|
|
|
|
|
|
|||||||||||||
Gross profit |
178,081 | 44.3 | % | 94,849 | 35.7 | % | 104,067 | 36.2 | % | |||||||||||||||
Total selling, distribution and operating income and (expenses), net |
(75,415 | ) | (18.8 | %) | (74,924 | ) | (28.2 | %) | (69,867 | ) | (24.3 | %) | ||||||||||||
|
|
|
|
|
|
|
|
|
|
|
|
|||||||||||||
Operating profit |
102,666 | 25.5 | % | 19,925 | 7.5 | % | 34,200 | 11.9 | % | |||||||||||||||
Total other income and (expense), net |
(13,536 | ) | (3.4 | %) | (57,550 | ) | (21.7 | %) | (15,212 | ) | (5.3 | %) | ||||||||||||
|
|
|
|
|
|
|
|
|
|
|
|
|||||||||||||
Profit (loss) before tax from continuing operations |
89,130 | 22.2 | % | (37,625 | ) | (14.2 | %) | 18,988 | 6.6 | % | ||||||||||||||
Income tax expense |
(6,511 | ) | (1.6 | %) | (2,528 | ) | (1.0 | %) | (7,913 | ) | (2.8 | %) | ||||||||||||
|
|
|
|
|
|
|
|
|
|
|
|
|||||||||||||
Profit (loss) from continuing operations |
82,619 | 20.5 | % | (40,153 | ) | (15.2 | %) | 11,075 | 3.9 | % | ||||||||||||||
Profit (loss) after tax from discontinued operations |
— | 0.0 | % | 41,609 | 15.7 | % | (6,790 | ) | (2.4 | %) | ||||||||||||||
|
|
|
|
|
|
|
|
|
|
|
|
|||||||||||||
Profit |
82,619 | 20.5 | % | 1,456 | 0.5 | % | 4,285 | 1.5 | % | |||||||||||||||
|
|
|
|
|
|
|
|
|
|
|
|
|||||||||||||
Less: profit attributable to non-controlling interests |
2,049 | 0.5 | % | 648 | 0.2 | % | 1,876 | 0.7 | % | |||||||||||||||
|
|
|
|
|
|
|
|
|
|
|
|
|||||||||||||
Profit attributable to equity shareholders of Mechel |
80,570 | 20.0 | % | 808 | 0.3 | % | 2,409 | 0.8 | % | |||||||||||||||
|
|
|
|
|
|
|
|
|
|
|
|
Year Ended December 31, |
||||||||
Revenues by Segment |
2021 |
2020 |
||||||
(In millions of Russian rubles, except for percentages) |
||||||||
Mining segment |
||||||||
To third parties |
110,791 | 70,881 | ||||||
To power segment |
1,967 | 1,518 | ||||||
To steel segment |
52,215 | 32,884 | ||||||
|
|
|
|
|||||
Total |
164,973 | 105,283 | ||||||
|
|
|
|
|||||
Steel segment |
||||||||
To third parties |
262,500 | 166,885 | ||||||
To power segment |
4,081 | 3,993 | ||||||
To mining segment |
1,845 | 2,633 | ||||||
|
|
|
|
|||||
Total |
268,426 | 173,511 | ||||||
|
|
|
|
|||||
Power segment |
||||||||
To third parties |
28,783 | 27,688 | ||||||
To steel segment |
11,522 | 10,775 | ||||||
To mining segment |
5,114 | 4,994 | ||||||
|
|
|
|
|||||
Total |
45,419 | 43,457 | ||||||
|
|
|
|
|||||
Eliminations |
76,744 | 56,797 | ||||||
|
|
|
|
|||||
Consolidated revenues |
402,074 | 265,454 | ||||||
|
|
|
|
|||||
% from mining segment |
27.6 | % | 26.7 | % | ||||
% from steel segment |
65.3 | % | 62.9 | % | ||||
% from power segment |
7.1 | % | 10.4 | % |
Year Ended December 31, 2021 |
Year Ended December 31, 2020 |
|||||||||||||||
Cost of Sales and Gross Profit by Segment |
Amount |
% of Segment Revenues |
Amount |
% of Segment Revenues |
||||||||||||
(In millions of Russian rubles, except for percentages) |
||||||||||||||||
Mining segment |
||||||||||||||||
Cost of sales |
61,783 | 37.4 | % | 53,842 | 51.1 | % | ||||||||||
Gross profit |
103,191 | 62.6 | % | 51,441 | 48.9 | % | ||||||||||
Steel segment |
||||||||||||||||
Cost of sales |
205,898 | 76.7 | % | 143,480 | 82.7 | % | ||||||||||
Gross profit |
62,529 | 23.3 | % | 30,030 | 17.3 | % | ||||||||||
Power segment |
||||||||||||||||
Cost of sales |
31,396 | 69.1 | % | 29,368 | 67.6 | % | ||||||||||
Gross profit |
14,022 | 30.9 | % | 14,089 | 32.4 | % |
In thousands of tonnes |
Cash cost, in thousands of Russian rubles per tonne |
In millions of Russian rubles |
||||||||||
Coal — Southern Kuzbass Coal Company — sales to third parties |
3,080 | 2.6 | 7,944 | |||||||||
Coal — Southern Kuzbass Coal Company — intersegment sales |
1,038 | 2.6 | 2,677 | |||||||||
Coal — Yakutugol — sales to third parties |
4,023 | 2.7 | 10,725 | |||||||||
Coal — Yakutugol — intersegment sales |
— | 2.7 | — | |||||||||
Iron ore — Korshunov Mining Plant — sales to third parties |
38 | 5.0 | 194 | |||||||||
Iron ore — Korshunov Mining Plant — intersegment sales |
1,294 | 5.0 | 6,521 | |||||||||
Coke — Moscow Coke and Gas Plant — sales to third parties (1) |
817 | 17.5 | 14,264 | |||||||||
Coke — Moscow Coke and Gas Plant — intersegment sales |
— | 17.5 | — | |||||||||
Coke — Mechel Coke — sales to third parties (2) |
396 | 11.0 | 4,374 | |||||||||
Coke — Mechel Coke — intersegment sales |
1,525 | 11.0 | 16,846 | |||||||||
Depreciation and amortization |
4,285 | |||||||||||
Change in provision for inventories at net realizable value |
(334 | ) | ||||||||||
Cost of coal produced by third companies and re-sold by our trading subsidiaries, including intersegment sales |
23 | |||||||||||
Stockholding year to year movements, costs of other products and services (coking products, washing services) and costs of other subsidiaries (3) |
(5,735 | ) | ||||||||||
|
|
|||||||||||
Total mining segment cost of sales |
61,783 | |||||||||||
|
|
(1) | Cash costs per tonne for coke were reduced by by-products credits. The amount of by-products credits in the total cash costs per tonne was RUB 495, or 3%, at Moscow Coke and Gas Plant in the year ended December 31, 2021. |
(2) | Cash costs per tonne for coke were reduced by by-products credits. The amount of by-products credits in the total cash costs per tonne was RUB 847, or 8%, at Mechel Coke in the year ended December 31, 2021. |
(3) | Costs of other products and services were increased by the amount of by-products credits of RUB 869 million in the year ended December 31, 2021. |
In thousands of tonnes |
Cash cost, in thousands of Russian rubles per tonne |
In millions of Russian rubles |
||||||||||
Coal — Southern Kuzbass Coal Company — sales to third parties |
4,906 | 2.1 | 10,171 | |||||||||
Coal — Southern Kuzbass Coal Company — intersegment sales |
1,331 | 2.1 | 2,759 | |||||||||
Coal — Yakutugol — sales to third parties |
4,831 | 2.3 | 11,079 | |||||||||
Coal — Yakutugol — intersegment sales |
— | 2.3 | — | |||||||||
Iron ore — Korshunov Mining Plant — sales to third parties |
39 | 2.9 | 111 | |||||||||
Iron ore — Korshunov Mining Plant — intersegment sales |
2,091 | 2.9 | 5,992 | |||||||||
Coke — Moscow Coke and Gas Plant — sales to third parties (1) |
693 | 9.2 | 6,370 | |||||||||
Coke — Moscow Coke and Gas Plant — intersegment sales |
— | 9.2 | — | |||||||||
Coke — Mechel Coke — sales to third parties (2) |
240 | 6.2 | 1,501 | |||||||||
Coke — Mechel Coke — intersegment sales |
1,701 | 6.2 | 10,630 | |||||||||
Depreciation and amortization |
4,767 | |||||||||||
Change in provision for inventories at net realizable value |
(474 | ) | ||||||||||
Cost of coal produced by third companies and re-sold by our trading subsidiaries, including intersegment sales |
18 | |||||||||||
Stockholding year to year movements, costs of other products and services (coking products, washing services) and costs of other subsidiaries (3) |
918 | |||||||||||
|
|
|||||||||||
Total mining segment cost of sales |
53,842 | |||||||||||
|
|
(1) | Cash costs per tonne for coke were reduced by by-products credits. The amount of by-products credits in the total cash costs per tonne was RUB 352, or 4%, at Moscow Coke and Gas Plant in the year ended December 31, 2020. |
(2) | Cash costs per tonne for coke were reduced by by-products credits. The amount of by-products credits in the total cash costs per tonne was RUB 724, or 12%, at Mechel Coke in the year ended December 31, 2020. |
(3) | Costs of other products and services were increased by the amount of by-products credits of RUB 681 million in the year ended December 31, 2020. |
Year Ended December 31, 2021 |
Year Ended December 31, 2020 |
|||||||||||||||
Selling, Distribution and Operating Income and (Expenses), Net by Segment |
Amount |
% of Segment Revenues |
Amount |
% of Segment Revenues |
||||||||||||
(In millions of Russian rubles, except for percentages) |
||||||||||||||||
Mining segment |
||||||||||||||||
Selling and distribution expenses |
25,291 | 15.3 | % | 23,768 | 22.6 | % | ||||||||||
Impairment of goodwill and other non-current assets, net |
1,391 | 0.8 | % | 3,829 | 3.6 | % | ||||||||||
Reversal of provision for expected credit losses |
(273 | ) | (0.2 | %) | (14 | ) | (0.0 | %) | ||||||||
Taxes other than income taxes |
2,251 | 1.4 | % | 2,517 | 2.4 | % | ||||||||||
Administrative and other operating expenses |
7,193 | 4.4 | % | 7,451 | 7.1 | % | ||||||||||
Other operating income |
(660 | ) | (0.4 | %) | (218 | ) | (0.2 | %) | ||||||||
|
|
|
|
|
|
|
|
|||||||||
Total |
35,193 | 21.4 | % | 37,333 | 35.5 | % | ||||||||||
|
|
|
|
|
|
|
|
|||||||||
Steel segment |
||||||||||||||||
Selling and distribution expenses |
17,549 | 6.5 | % | 14,702 | 8.5 | % | ||||||||||
Reversal of an impairment of other non-current assets and impairment of goodwill and other non-current assets, net |
(644 | ) | (0.2 | %) | 67 | 0.0 | % | |||||||||
Allowance for expected credit losses |
491 | 0.2 | % | 106 | 0.1 | % | ||||||||||
Taxes other than income taxes |
1,223 | 0.5 | % | 1,159 | 0.7 | % | ||||||||||
Administrative and other operating expenses |
8,231 | 3.1 | % | 8,090 | 4.7 | % | ||||||||||
Other operating income |
(1,768 | ) | (0.7 | %) | (614 | ) | (0.4 | %) | ||||||||
|
|
|
|
|
|
|
|
|||||||||
Total |
25,081 | 9.3 | % | 23,510 | 13.5 | % | ||||||||||
|
|
|
|
|
|
|
|
|||||||||
Power segment |
||||||||||||||||
Selling and distribution expenses |
11,882 | 26.2 | % | 11,524 | 26.5 | % | ||||||||||
Impairment of goodwill and other non-current assets, net |
2,152 | 4.7 | % | 1 | 0.0 | % | ||||||||||
(Reversal of provision) allowance for expected credit losses |
(17 | ) | (0.0 | %) | 57 | 0.1 | % | |||||||||
Taxes other than income taxes |
68 | 0.1 | % | 86 | 0.2 | % | ||||||||||
Administrative and other operating expenses |
1,089 | 2.4 | % | 2,896 | 6.7 | % | ||||||||||
Other operating income |
(41 | ) | (0.1 | %) | (167 | ) | (0.4 | %) | ||||||||
|
|
|
|
|
|
|
|
|||||||||
Total |
15,133 | 33.3 | % | 14,397 | 33.1 | % | ||||||||||
|
|
|
|
|
|
|
|
Year Ended December 31, 2021 |
Year Ended December 31, 2020 |
|||||||||||||||
Operating Profit (Loss) by Segment |
Amount |
% of Segment Revenues |
Amount |
% of Segment Revenues |
||||||||||||
(In millions of Russian rubles, except for percentages) |
||||||||||||||||
Mining segment |
67,999 | 41.2 | % | 14,108 | 13.4 | % | ||||||||||
Steel segment |
37,447 | 14.0 | % | 6,520 | 3.8 | % | ||||||||||
Power segment |
(1,111 | ) | (2.4 | %) | (308 | ) | (0.7 | %) | ||||||||
Elimination of intersegment unrealized profit (1) |
(1,669 | ) | (395 | ) | ||||||||||||
|
|
|
|
|||||||||||||
Consolidated operating profit |
102,666 | 19,925 | ||||||||||||||
|
|
|
|
(1) | Our management evaluates the performance of our segments before the elimination of unrealized profit in inventory balances of segments that was generated by the segments but not recognized as profit in our consolidated financial statements until the sale of such inventories to third parties. Therefore, we present our segments before such elimination, and such elimination is presented separately. The increase in intersegment unrealized profit adjustment in the year ended December 31, 2021 as compared to the year ended December 31, 2020 was due to an increase in gross profit of mining and steel segments in 2021. |
Year Ended December 31, 2021 |
Year Ended December 31, 2020 |
|||||||||||||||
Other Income and Expense, Net |
Amount |
% of Revenues |
Amount |
% of Revenues |
||||||||||||
(In millions of Russian rubles, except for percentages) |
||||||||||||||||
Finance income |
676 | 0,2 | % | 3,504 | 1.3 | % | ||||||||||
Finance costs |
(23,371 | ) | (5.8 | )% | (25,145 | ) | (9.5 | )% | ||||||||
Foreign exchange gain (loss) |
7,891 | 2.0 | % | (36,388 | ) | (13.7 | )% | |||||||||
Share of (loss) profit of an associate |
(7 | ) | 0.0 | % | 20 | 0.0 | % | |||||||||
Other income |
1,341 | 0.33 | % | 718 | 0.3 | % | ||||||||||
Other expenses |
(66 | ) | (0.0 | )% | (259 | ) | (0.1 | )% | ||||||||
|
|
|
|
|
|
|
|
|||||||||
Total |
(13,536 | ) | (3.4 | )% | (57,550 | ) | (21.7 | )% | ||||||||
|
|
|
|
|
|
|
|
Year Ended December 31, |
||||||||
2021 |
2020 |
|||||||
(In millions of Russian rubles) |
||||||||
Net cash provided by operating activities |
73,538 | 37,949 | ||||||
Net cash (used in) provided by investing activities |
(5,452 | ) | 84,383 | |||||
Net cash used in financing activities |
(49,191 | ) | (126,104 | ) |
• | an increase in accrued taxes and other liabilities of RUB 10,583 million; and |
• | an increase in advances received of RUB 8,149 million of Mechel Service, Urals Stampings Plant, Southern Kuzbass Coal Company and Mechel Carbon. |
• | an increase in inventories of RUB 24,079 million mainly due to an increase in goods for resale, raw materials, work in progress and finished goods of Mechel Service, Chelyabinsk Metallurgical Plant, Urals Stampings Plant, Izhstal, Mechel Service Stahlhandel Austria GmbH and Beloretsk Metallurgical Plant; |
• | an increase in accounts receivable of RUB 8,692 million due to an increase in sales prices in the year ended December 31, 2021; |
• | an increase in other assets of RUB 2,224 million primarily due to an increase in input, recoverable and deferred VAT and other taxes receivable mainly by Mechel Coke and Moscow Coke and Gas Plant; and |
• | |
• | an increase in accounts payable of RUB 1,137 million of Chelyabinsk Metallurgical Plant, Mechel Coke, Southern Kuzbass Coal Company and Mechel Energo; |
• | an increase in advances received of RUB 995 million of Mechel Service, Chelyabinsk Metallurgical Plant and Izhstal; and |
• | an increase in accrued taxes and other liabilities of RUB 4,580 million. |
• | an increase in inventories of RUB 5,283 million mainly due to an increase in work in progress, finished goods and goods for resale of Chelyabinsk Metallurgical Plant, Southern Kuzbass Coal Company, Bratsk Ferroalloy Plant and Mechel Service Stahlhandel Austria GmbH; |
• | an increase in other assets of RUB 1,474 million primarily due to an increase in advances paid mainly by Mechel Carbon, Chelyabinsk Metallurgical Plant, Mecheltrans and Mechel Service; and |
• | |
Year Ended December 31, |
||||||||
Estimated Liquidity |
2021 |
2020 |
||||||
(In millions of Russian rubles) |
||||||||
Cash and cash equivalents, including restricted cash of RUB 205 million and RUB 284 million as of December 31, 2021 and 2020, respectively |
17,701 | 1,706 | ||||||
Undrawn credit facilities |
4,159 | 5,959 | ||||||
|
|
|
|
|||||
Total estimated liquidity |
21,860 | 7,665 | ||||||
|
|
|
|
Payments Due by Period |
||||||||||||||||||||
Contractual Obligations and Commercial Commitments |
Total |
Less Than 1 Year |
2-3 Years |
4-5 Years |
More Than 5 Years |
|||||||||||||||
(In millions of Russian rubles) |
||||||||||||||||||||
Short-term borrowings and current portion of long-term debt, including interest and fines and penalties on loans and borrowings (1) |
283,382 | 283,382 | — | — | — | |||||||||||||||
Long-term debt obligations, net of current portion, including interest on loans and borrowings (1) |
100 | — | 32 | 68 | — | |||||||||||||||
Contractual commitments to land leases related to exploration and use of mineral deposit |
44,738 | 1,599 | 3,192 | 2,995 | 36,952 | |||||||||||||||
Trade and other payables (2) |
32,638 | 32,638 | — | — | — | |||||||||||||||
Other financial liabilities |
3,292 | 788 | 917 | 891 | 696 | |||||||||||||||
Rehabilitation provision (3) |
4,354 | 312 | 663 | 652 | 2,727 | |||||||||||||||
Pension obligations |
4,527 | 553 | 676 | 650 | 2,648 | |||||||||||||||
Short-term lease liabilities |
8,553 | 8,553 | — | — | — | |||||||||||||||
Long-term lease liabilities |
11,669 | — | 1,556 | 996 | 9,117 | |||||||||||||||
Contractual commitments to acquire plant, property and equipment (4) |
14,607 | 7,477 | 4,576 | 2,554 | — | |||||||||||||||
Contractual commitments to acquire raw materials and for delivery of goods and services (5) |
109,414 | 75,502 | 12,936 | 10,688 | 10,288 | |||||||||||||||
Estimated interest expense (6) |
69,562 | 19,340 | 31,219 | 19,003 | — | |||||||||||||||
Estimated average interest rate (6) |
7.1 | % | 7.6 | % | 7.1 | % | 6.6 | % | — | |||||||||||
|
|
|
|
|
|
|
|
|
|
|||||||||||
Total Contractual Obligations and Commercial Commitments |
586,836 | 430,144 | 55,767 | 38,497 | 62,428 | |||||||||||||||
|
|
|
|
|
|
|
|
|
|
(1) | In the year ended December 31, 2021, our loan interest expense was RUB 20,063 million and we paid out RUB 18,173 million of loan interest. In the year ended December 31, 2021, we recognized RUB 947 million penalties on credit facilities, which were not paid. |
(2) | Includes accounts payable for capital expenditures. |
(3) | See note 21 to the consolidated financial statements. |
(4) | Obligation to be paid within one year in accordance with the contractual terms. See note 14 to the consolidated financial statements. |
(5) | Includes RUB 50 million commitments related to short-term leases. See note 9.2 to the consolidated financial statements. |
(6) | Interest expense is estimated for a five-year period based on (1) estimated cash flows, (2) forecasted LIBOR, EURIBOR, the CBR key rate where applicable, (3) actual long-term contract interest rates and fixed rates in accordance with the contractual obligations, (4) potential revolving credit facilities. |
Restrictive Covenant |
Requirement |
Actual as of December 31, 2021 |
||||
Mechel’s Net Debt (1) to EBITDA ratio |
Shall not exceed 6.0:1 | 2.47:1 | ||||
Mechel’s Total Debt to EBITDA ratio |
Shall not exceed 6.0:1 | 2.50:1 | ||||
Mechel’s EBITDA (2) to Net Interest Expense ratio |
Shall not be less than 2.0:1 | 5.39:1 | ||||
Mechel’s EBITDA to Consolidated Financial Expense ratio |
Shall not be less than 2.0:1 | 5.34:1 | ||||
Mechel’s Cash flow from operating activities to EBITDA ratio |
Shall not be less than 0.80:1 | 0.62:1 | ||||
Mechel’s EBITDA to Revenue ratio |
Shall not be less than 0.15:1 | 0.30:1 |
(1) | Net Debt and Total Debt are calculated according to the respective definitions set by the loan agreements. Generally, Total Debt includes outstanding loans, lease, bonds and other financial liability balances; Net Debt is equal to Total Debt less cash and cash equivalents. |
(2) | EBITDA is calculated according to the respective definitions set by the loan agreements and may differ from the disclosed Consolidated Adjusted EBITDA. |
Name |
Year of Birth |
Position | ||
Igor V. Zyuzin |
1960 | Chairman | ||
Alexander N. Shokhin (1)(6) |
1951 | Deputy Chairman | ||
Oleg V. Korzhov (4) |
1970 | Director, Chief Executive Officer, Chairman of Management Board | ||
Victor A. Trigubko |
1956 | Director, Adviser to the Chief Executive Officer, Member of Management Board | ||
Irina N. Ipeeva |
1963 | Director, Deputy Chief Executive Officer for Legal Affairs, Member of Management Board | ||
Alexander N. Kotsky (1)(2)(4) |
1957 | Director | ||
Alexander D. Orishchin (1)(2)(3)(4) |
1932 | Director | ||
Yuriy N. Malyshev (3)(4)(5) |
1939 | Director | ||
Georgy G. Petrov (1)(2)(3) |
1948 | Director |
(1) | Independent Director under the applicable NYSE regulations and Russian regulations. |
(2) | Member of the Audit Committee of the Board of Directors. |
(3) | Member of the Committee on Appointments and Remuneration. |
(4) | Member of the Committee on Investments and Strategic Planning. |
(5) | Independent Director based on the decision of our Board of Directors. |
(6) | Alexander N. Shokhin resigned from our Board of Directors, effective from March 16, 2022. |
Name |
Year of Birth |
Position | ||
Oleg V. Korzhov |
1970 | Chief Executive Officer, Director, Chairman of Management Board | ||
Victor A. Trigubko |
1956 | Adviser to the Chief Executive Officer, Director, Member of Management Board | ||
Irina N. Ipeeva |
1963 | Deputy Chief Executive Officer for Legal Affairs, Director, Member of Management Board | ||
Valery A. Sheverdin |
1963 | Deputy Chief Executive Officer for Security, Member of Management Board | ||
Nelli R. Galeeva |
1973 | Deputy Chief Executive Officer for Finance, Member of Management Board | ||
Dmitry S. Voytkus |
1986 | Deputy Chief Executive Officer for Financial Control, Member of Management Board | ||
Ekaterina A. Silaeva |
1975 | Deputy Chief Executive Officer for Human Resources, Member of Management Board | ||
Andrey Yu. Pazynich |
1961 | Chief Executive Officer of Mechel Mining Management | ||
Andrey A. Ponomarev |
1977 | Chief Executive Officer of Mechel-Steel Management | ||
Denis N. Graf |
1978 | Chief Executive Officer of Mechel Energo | ||
Alexey V. Lebedev |
1974 | Chief Executive Officer of Mecheltrans Management, Deputy Chief Executive Officer for Operations |
• | the quality and integrity of our financial statements; |
• | our compliance with legal and regulatory requirements; |
• | the independent auditor’s qualifications and independence; and |
• | the performance of our internal audit function and independent auditor. |
• | Sub-committee on metallurgical production strategy, with members Alexander Orishchin and Oleg Korzhov; and |
• | Sub-committee on mining production strategy, with members Yuriy Malyshev and Alexander Kotsky. |
• | the Charter; |
• | the Bylaw on the Board of Directors; |
• | the Bylaw on the General Meeting of Shareholders; |
• | the Bylaw on the General Director; |
• | the Bylaw on the Collegial Executive Body (Management Board); |
• | the Bylaw on the Internal Audit Department; |
• | the Code of Business Conduct and Ethics; |
• | the Bylaw on the Prohibition and Prevention of Insider Trading; |
• | the Bylaw on the Disclosure of Information that may Significantly Impact the Market Value of our Shares; |
• | the Bylaw on Information Policy; |
• | the Bylaw on Appointments and Remuneration Committee of the Board of Directors; |
• | the Bylaw on Investments and Strategic Planning Committee of the Board of Directors; |
• | the Bylaw on the Audit Committee of the Board of Directors; |
• | the Internal Audit Policy; |
• | the Code of Corporate Governance; and |
• | the Bylaw on Dividend Policy. |
2021 |
2020 |
2019 |
||||||||||||||||||||||||||
Segment |
Primary Location |
Total Employees |
% Unionized |
Total Employees |
% Unionized |
Total Employees |
% Unionized |
|||||||||||||||||||||
Mining |
|
Russia, Switzerland, Singapore |
16,374 | 61 | % | 16,932 | 63 | % | 19,845 | 61 | % | |||||||||||||||||
Steel |
|
Russia, Europe, CIS |
30,019 | 53 | % | 31,739 | 53 | % | 32,222 | 56 | % | |||||||||||||||||
Power |
Russia | 3,341 | 29 | % | 3,606 | 34 | % | 3,535 | 36 | % | ||||||||||||||||||
Other |
Various | 1,680 | 2 | % | 574 | 9 | % | 580 | 9 | % | ||||||||||||||||||
|
|
|
|
|
|
|
|
|
|
|
|
|||||||||||||||||
Total |
51,414 | 52 | % | 52,851 | 55 | % | 56,182 | 56 | % | |||||||||||||||||||
|
|
|
|
|
|
|
|
|
|
|
|
• | Employees of Chelyabinsk Metallurgical Plant, Beloretsk Metallurgical Plant, Korshunov Mining Plant, Moscow Coke and Gas Plant, Mechel Coke, Izhstal, Bratsk Ferroalloy Plant, Mechel Materials, Southern Urals Nickel Plant and Pugachevsky Open Pit are members of the Ore Mining and Smelting Trade Union of Russia. |
• | Employees of Urals Stampings Plant are members of the Russian Trade Union of Mechanical Engineers, employees of Chelyabinsk branch of Urals Stampings Plant are members of the Ore Mining and Smelting Trade Union of Russia. |
• | Employees of Southern Kuzbass Coal Company and its subsidiaries Tomusinsky Open Pit and Vzryvprom are members of the Russian Independent Trade Union of Coal Industry Workers and of the Independent Trade Union of Miners of Russia. |
• | Employees of Yakutugol, Neryungri Car Fleet and Mechel-Remservice are members of the Russian Independent Trade Union of Coal Industry Workers. |
• | Employees of Mechel Energo are members of the Ore Mining and Smelting Trade Union of Russia. |
• | Employees of Port Posiet are members of the Russian Stevedores’ Trade Union. |
• | Employees of Mecheltrans’ separate business unit in the city of Myski are members of the Russian Independent Trade Union of Coal Industry Workers. |
• | Employees of Southern Kuzbass Power Plant are members of the All-Russian Power Industry Trade Union and of the Russian Independent Trade Union of Coal Industry Workers. |
• | Employees of Kuzbass Power Sales Company are members of the All-Russian Power Industry Trade Union. |
• | Employees of Mechel Nemunas are members of the Trade Union Nemunas. |
Directors and Executive Officers |
Number of Common Shares |
% of Common Shares |
Number of Preferred Shares |
% of Preferred Shares |
% of Total Voting Power |
|||||||||||||||
Oleg V. Korzhov |
* | * | * | * | * | |||||||||||||||
Alexander N. Kotsky |
* | * | * | * | * | |||||||||||||||
Andrey A. Ponomarev |
* | * | * | * | * | |||||||||||||||
Alexey V. Lebedev |
* | * | * | * | * | |||||||||||||||
Victor A. Trigubko |
* | * | — | — | * | |||||||||||||||
Irina N. Ipeeva |
* | * | — | — | * | |||||||||||||||
Nelli R. Galeeva |
* | * | — | — | * | |||||||||||||||
|
|
|
|
|
|
|
|
|
|
|||||||||||
Total |
* | * | * | * | * | |||||||||||||||
|
|
|
|
|
|
|
|
|
|
* | Represents beneficial ownership of less than one percent of such class. |
Name of Beneficial Owner |
Number of Common Shares |
% of Common Shares |
||||||
Igor V. Zyuzin (1) |
205,335,808 | 49.33 | % | |||||
Irina V. Zyuzina (2) |
81,739,899 | 19.64 | % | |||||
Ksenia I. Zyuzina (3) |
86,430,261 | 20.76 | % | |||||
Other (4)(5) |
201,728,842 | 48.46 | % |
(1) | Mr. Zyuzin is the Chairman of our Board of Directors. See “Item 6. Directors, Senior Management and Employees — Directors and Executive Officers.” Mr. Zyuzin may be deemed to be the beneficial owner of approximately 49.33% of our common shares through (i) his record ownership of 26.48% of our common shares; (ii) his ownership of 93.56% of the outstanding equity interests in JSC IC BASK (“ BASK BASK-MED BASK-MED BASK-MED BASK-MED Coalmetbank Skyblock Spetstekhleasing MetHol |
(2) | Mrs. Irina Zyuzina may be deemed to be the beneficial owner of approximately 19.64% of our common shares through (i) her record ownership of 0.48% of our common shares; (ii) her ownership of 34% of the outstanding equity interests in MetHol, which is the record owner of 18.68% of our common shares; (iii) her ownership of 95% of the outstanding equity interests in BASK-MED, BASK-MED |
(3) | Ms. Ksenia Zyuzina may be deemed to be the beneficial owner of approximately 20.76% of our common shares through (i) her record ownership of 0.0001% of our common shares; (ii) her ownership of 33% of the outstanding equity interests in MetHol, which is the record owner of 18.68% of our common shares; (iii) her ownership of 100% of the outstanding equity interests in Swan Agency Limited (“ Swan Roderika Met Shipping |
(vii) her indirect ownership of 7.89% of the outstanding equity interests in Skyblock, which is the record owner of 0.17% of our common shares; and (viii) her indirect ownership of 7.89% of the outstanding equity interests in Yakutugol, which is the record owner of 2.60% of our common shares. Further information regarding the shareholdings of Ms. Ksenia Zyuzina is available in the Schedule 13D and amendments thereto filed by her with the SEC. |
(4) | According to Deutsche Bank Trust Company Americas, as of December 31, 2021, 22,510,228 common ADSs and 10,266,755 GDSs were outstanding, representing 15.75% of our total issued common shares. |
(5) | We believe our directors and executive officers as a group, other than Mr. Zyuzin and his family members, as of December 31, 2021, beneficially owned less than 1% of our shares. |
• | our charter capital has been paid in full; |
• | the value of our net assets, calculated under the Russian accounting standards, is not less (and would not become less as a result of the proposed dividend payment) than the sum of our charter capital, our reserve fund and the difference between the liquidation value and the par value of our issued and outstanding preferred shares; |
• | we have repurchased all shares from shareholders having the right to demand repurchase; and |
• | we are not, and would not become, insolvent as the result of the proposed dividend payment. |
• | disclosure of semi-annual and annual reports containing information about us, our shareholders, registrar and depositary, the structure of our management bodies, the members of the board of directors and management board, our branches and representative offices, our subsidiaries and affiliates, our shares and auditors, important developments during the reporting period, accounting statements prepared in accordance with the Russian accounting standards, consolidated statements prepared in accordance with IFRS and other information about our financial and business activity; |
• | disclosure of any information concerning material facts and other official disclosures, including, among other things, our reorganization; certain changes in the amount of our assets; decisions on share issuances; certain changes in ownership and shareholding; information about controlled organizations which are material to us or organizations controlling us; conclusion of agreement with our controlled or controlling organization, where we are required to buy securities issued by such controlled or controlling organization; as well as shareholder and management bodies resolutions; |
• | notifying Moscow Exchange about the disclosure of aforementioned information; |
• | disclosure of the documents that we have received in connection with any of the following: |
• | a voluntary offer (including any competing offer) to acquire us; |
• | a mandatory offer (including any competing offer) to acquire us; |
• | execution by shareholders of a shareholders’ agreement; |
• | a notification of the intention to file a legal claim to challenge the decision of the general meeting of shareholders, to seek damages award for losses suffered by Mechel, to invalidate the transaction; |
• | a notice of the right of shareholders to sell their shares to the person that has acquired more than 95% of our common shares; and |
• | a request that minority shareholders sell their shares to the person that has acquired more than 95% of our common shares; |
• | disclosure of information on various stages of securities placement, issuance and registration through publication of certain data as required by the securities legislation; |
• | disclosure of our charter and internal corporate governance documents; |
• | disclosure of our annual report and annual financial statements prepared in accordance with the Russian accounting standards and our annual and interim IFRS financial statements; |
• | disclosure on a semi-annual and annual basis of a list of our affiliated companies and individuals; |
• | disclosure of a list of information which is considered an insider information and approved by the company (“ insider information |
• | disclosure of insider information; and |
• | disclosure of other information as required by applicable Russian securities legislation. |
• | approval of charter amendments or of a new version of the charter; |
• | reorganizations or liquidations; |
• | election and early removal of the members of the board of directors; |
• | determination of the number, nominal value and type of authorized shares and rights granted by such shares; |
• | changes in the company’s charter capital; |
• | appointment and early removal of the members of the counting commission; |
• | approval of our independent auditor; |
• | consent or subsequent approval of certain interested party transactions and major transactions; |
• | distribution of profits and losses, including approval of dividends payment; |
• | decisions on our participation in commercial or industrial groups or other associations of commercial entities; |
• | redemption by the company of issued shares in cases provided for by the Joint-Stock Companies Law; |
• | approval of certain internal documents regulating the activity of our governing bodies; |
• | decision on filing of an application for delisting of our shares or securities convertible into shares; and |
• | other issues, as provided by the Joint-Stock Companies Law and our charter. |
• | approval of charter amendments or of a new version of the charter; |
• | reorganizations or liquidations; |
• | determination of the number, nominal value and category (type) of authorized shares and the rights granted by such shares; |
• | repurchase by the company of its issued shares; |
• | any issuance of shares or securities convertible into common shares by closed subscription; |
• | issuance by open subscription of common shares or securities convertible into common shares, in each case, constituting 25% or more of the number of issued and outstanding common shares; |
• | consent or subsequent approval of a major transaction the subject matter of which is property with the value exceeding 50% of the balance sheet value of the company’s assets; and |
• | decision on filing of an application for delisting of our shares or securities convertible into shares. |
• | election of the members of the board of directors; |
• | approval of distribution of profits, including approval of annual dividends and losses, if any; and |
• | appointment of an independent auditor. |
• | election of the members of the board of directors; and |
• | approval of a company’s independent auditor for statutory accounts. |
• | by personally participating in the discussion of agenda items and voting thereon; |
• | by sending an authorized representative to participate in the discussion of agenda items and to vote thereon; |
• | by absentee ballot; |
• | by delegating the right to fill out the absentee ballot to an authorized representative; or |
• | by sending information about their willingness to the nominee holder for further transfer to the registrar in accordance with the requirements of Russian securities law. |
• | determination of our business priorities and development strategy, approval of our annual and quarterly budgets (financial plans), development of our investment policy, review of the results of our financial and operational activities; |
• | convening of annual and extraordinary general shareholders’ meetings, except in certain circumstances specified in the Joint-Stock Companies Law; |
• | approval of the agenda of the general shareholders’ meeting and determination of the record date for shareholders entitled to participate in a general shareholders’ meeting; |
• | placement of our bonds and other securities excluding shares; |
• | determination of the price of our property and of our securities to be placed or repurchased, as provided for by the Joint-Stock Companies Law; |
• | repurchase of our shares, bonds and other securities in certain cases provided for by the Joint-Stock Companies Law; |
• | appointment of the general director and members of the management board, and early termination of their powers and the establishment of their compensation; |
• | recommendations to the general shareholders’ meeting on the amount of a dividend and the payment procedure thereof; |
• | determination of the fees payable for the services of an independent auditor; |
• | the use of our reserve fund and other funds; |
• | the creation and liquidation of branches and representative offices; |
• | approval of internal documents, except for those documents whose approval falls within the competence of our shareholders or general director; |
• | consent or subsequent approval of major and interested party transactions in the cases provided for by the Joint-Stock Companies Law; |
• | approval of the procedures of internal control over financial and business operations of the company; |
• | control over establishment of the risk management system; |
• | increasing our charter capital by issuing additional shares within the limits of the authorized charter capital, except in certain circumstance specified in our charter; |
• | approval of decisions on securities issuances and of the prospectus relating to such securities issuances, as well as of reports on the results of such securities issuances, amendments thereto; |
• | approval of our share registrar and the terms of the agreement with it; |
• | decision on filing of an application for listing of our shares or securities convertible into shares; |
• | decision on disposal by the company of its issued shares; |
• | approval of transactions for the acquisition, disposal and encumbrance of shares and stakes in the charter capitals of other companies, including approval of the material terms of such transactions; |
• | approval of transactions exceeding 10% (but not more than 25%) of the balance sheet value of the company’s assets according to accounting statements on the last reporting date, except for transactions referred to the competence of the Management Board; |
• | appointment and termination of the corporate secretary of the company; |
• | approval of our annual report and annual financial statements; and |
• | other issues, as provided for by the Joint-Stock Companies Law and our charter. |
• | developing and submitting to the board of directors long-term plans for the implementation of the company’s priorities and proposals regarding its development strategy; |
• | reporting to the board of directors on the realization of investment projects in the amount of more than $30 million; |
• | developing and submitting to the board of directors investment projects in the amount of more than $50 million; |
• | submitting to the board of directors proposals on bonds placement and acquisitions; |
• | submitting to the board of directors proposals on participation (obtaining or increasing participation) or giving up (reducing) our participation in other entities; |
• | approving annual and long-term investment programs; |
• | approving transactions related to disposal by the company of non-current assets with a value of between 10% to 25% of the balance sheet value of the company’s assets, except for transactions provided by our charter and interested party transactions; |
• | making certain decisions regarding the exercise of our rights as a shareholder or a participant of other entities; |
• | making recommendations on certain matters relating to the management of our affiliates included in the list approved by our management board; |
• | developing and establishing methods of compensation and monetary motivation for our employees; and |
• | other issues related to our day-to-day |
• | performing the routine management of our operations; |
• | exercising the right of first signature on financial documents; |
• | managing our property to provide for our current operations within the limits established by our charter and prevailing Russian legislation within its powers; |
• | representing our interests both in Russia and abroad; |
• | approving staff, executing labor contracts with our employees and rewarding and disciplining employees; |
• | entering into transactions on our behalf within its powers; |
• | issuing powers of attorney on our behalf; |
• | opening and closing our bank accounts; |
• | organizing our accounting and reporting process; |
• | issuing orders and instructions binding on all our employees; |
• | organizing the implementation of resolutions of our general shareholders’ meeting and our board of directors; and |
• | performing other functions necessary to achieve our aims and to provide for our normal operations, in compliance with prevailing legislation and our charter, except for the functions laid upon our other management bodies by the Joint-Stock Companies Law and our charter. |
• | failure to comply with the requirements of our charter, resolutions of the general shareholders’ meeting or the board of directors or our internal documents; |
• | in the cases stipulated by the employment agreement with the general director; and |
• | in other events provided by current legislation. |
• | act as parties to, beneficiaries in, representatives or agents in the transaction; |
• | control another legal entity that is a party, beneficiary, representative or agent in the transaction; or |
• | act as members of any management body of the company which is a party, beneficiary, representative or agent in the transaction, or members of any governing body of the managing organization of such company. |
• | major transactions involving property ranging from 25% to 50% of the balance sheet value of the company’s assets require unanimous approval by all members of the board of directors or, if unanimity is not reached, a majority of the voting stock held by shareholders participating in the meeting; and |
• | major transactions involving property in excess of 50% of the balance sheet value of the company’s assets require a three-quarters majority of the voting stock held by shareholders participating in the meeting. |
• | transactions related to the placement of shares or other securities convertible into shares; |
• | transactions entered into in the course of property rights transfer in a reorganization; |
• | transactions mandatory for companies pursuant to the federal laws (settlements under such transactions are effected at fixed prices and tariffs set by the relevant governmental authorities); and |
• | other cases set out in the Joint-Stock Companies Law. |
• | A person intending to acquire more than 30% of the total number of a public company’s common shares and voting preferred shares (including, for such purposes, shares already owned by such person and its affiliates), will be entitled to make a public offer to other holders of the corresponding categories (types) of shares of the public company (the “ voluntary offer |
• | A person that has acquired more than 30% of the total number of a public company’s common shares and voting preferred shares (including, for such purposes, shares already owned by such person and its affiliates) will be required to make, within 35 days of such shares being recorded in the name of such person or the moment when the person learnt, or should have learnt that it individually or together with its affiliates owned the relevant number of the shares, a public offer for other shares of the same class and for securities convertible into such shares (the “ mandatory offer |
stock exchange or their trading history is less than six month. The public offer price may not be less than the highest price at which the offeror or its affiliates purchased or undertook to purchase the relevant shares or securities over the six-month period before the offer was sent to the public company. From the moment of acquisition of more than 30% of the total number of the shares until the moment of sending of an offer to the public company, the person making the offer and its affiliates will be able to vote only 30% of the common shares and voting preferred shares of the public company (regardless of the size of their actual holdings). These rules are also applied (or reapplied) to acquisitions resulting in a person and its affiliates owning more than 50% and 75% of a public company’s outstanding common shares and voting preferred shares. |
• | A person that, as a result of such a voluntary or mandatory offer, becomes (individually or together with its affiliates) the owner of more than 95% of the total number of the public company’s common shares and voting preferred shares, must buy out the remaining shares of the public company as well as other securities convertible into such shares upon request of the holders of such shares or other securities, and may require such holders to sell such shares and other securities convertible into such shares. The price for the shares and other securities convertible into such shares should be determined in the manner described above for a mandatory offer, but it may not be less than (i) the price of the preceding acquisition of the public company’s shares or other securities convertible into such shares under the voluntary or mandatory offer as a result of which the offeror and its affiliates acquired over 95% of the total number of the public company’s common shares and voting preferred shares; or (ii) the highest price at which after the expiration date of the voluntary or mandatory offer the offeror or its affiliates acquired or undertook to acquire such shares or other securities convertible into such shares of the public company. The offeror is entitled to require the holders of the remaining shares of the public company, as well as other securities convertible into such shares, to sell such shares and other securities, provided that the offeror acquired not less than 10% of the total number of shares or other securities of the public company as a result of acceptance by other shareholders of the voluntary or mandatory offer as described above. |
• | An offer of the kind described in the preceding three paragraphs must be accompanied by a bank guarantee of payment. Prior notice of the offer must be filed with the CBR which may order amendments to the terms of the offer (including price) in order to bring them into compliance with the requirements of the current legislation. |
• | Once a voluntary or mandatory offer has been made, competing offers for the same securities can be made by third parties and, in certain circumstances, acceptance of the initial offer may be withdrawn by the security holders who choose to accept such competing offer. From the date of receipt of a voluntary or mandatory offer by the public company until 20 days after its expiration the public company’s general shareholders’ meeting will have the sole power to make decisions on charter capital increase by way of issuance of additional shares within the number and category (type) of authorized shares, issuance of securities convertible into shares, including options of a public company, consent or subsequent approval of certain transactions or a number of related transactions, involving the acquisition or disposal, or a possibility of disposal (whether directly or indirectly), of property having a value of 10% or more of the balance sheet value of the assets of a public company as determined under the Russian accounting standards as of the last reporting date preceding the transaction, with the exception of, inter alia |
• | liable, under the laws of the United States, for U.S. federal income tax (other than taxes in respect only of income from sources in the United States or capital situated therein) by reason of the holder’s domicile, residence, citizenship, place of incorporation, or any other similar criterion (and, for income derived by a partnership, trust or estate, residence is determined in accordance with the residence of the person liable to tax with respect to such income); and |
• | not also a resident of the Russian Federation for purposes of the United States-Russia income tax treaty. |
Service |
Fees (In U.S. dollars) | |
Issuance of common ADSs |
Up to $0.05 per common ADS | |
Cancellation of common ADSs |
Up to $0.05 per common ADS | |
Distribution of cash dividends or other cash distributions |
Up to $0.02 per common ADS | |
Distribution of common ADSs pursuant to (1) stock dividends, free stock distributions or (2) exercises of rights to purchase additional common ADSs or distribution of proceeds thereof |
Up to $0.05 per common ADS | |
Distribution of securities other than common ADSs or rights to purchase additional common ADSs or the distribution of proceeds thereof |
Up to $0.05 per common ADS | |
Common ADR transfer, combination or split-up fee |
$1.50 per transfer | |
Share register inspection annual fee |
$0.01 per common ADS | |
Operation and maintenance annual fee |
$0.02 per common ADS* |
* | This fee, when combined with the fees for cash distributions, shall not exceed $0.02 per common ADS per year. |
Service |
Fees (In U.S. dollars) | |
Issuance of preferred ADSs |
Up to $0.05 per preferred ADS | |
Cancellation of preferred ADSs |
Up to $0.05 per preferred ADS | |
Distribution of cash dividends or other cash distributions |
Up to $0.02 per preferred ADS | |
Distribution of preferred ADSs pursuant to (1) stock dividends, free stock distributions or (2) exercises of rights to purchase additional preferred ADSs or distribution of proceeds thereof |
Up to $0.05 per preferred ADS | |
Distribution of securities other than preferred ADSs or rights to purchase additional preferred ADSs or the distribution of proceeds thereof |
Up to $0.05 per preferred ADS | |
Preferred ADR transfer, combination or split-up fee |
$1.50 per transfer | |
Share register inspection annual fee |
$0.01 per preferred ADS | |
Operation and maintenance annual fee |
$0.02 per preferred ADS* |
* | This fee, when combined with the fees for cash distributions, shall not exceed $0.02 per preferred ADS per year. |
Year Ended December 31, |
||||||||||||
Category |
2021 |
2020 |
2019 |
|||||||||
(In U.S. dollars) |
||||||||||||
NYSE listing fees |
94,422 |
91,878 |
88,854 |
Non-payment of principal or interest (yes/no) |
Cross-default (yes/no) |
Breach of financial covenants (1) (yes/no) |
Breach of non- financial covenants (1) (yes/no) |
|||||||||||||
VTB Bank |
no |
yes |
no |
yes |
||||||||||||
Gazprombank |
no |
yes |
yes |
yes |
||||||||||||
Universal Rolling Mill Facility Agreement |
yes |
yes |
yes |
yes |
||||||||||||
Other (2) |
yes |
yes |
yes |
yes |
(1) |
The breaches provided in this table are as of December 31, 2021. |
(2) |
Includes export credit facility agreements. |
(a) |
Disclosure Controls and Procedures |
(b) |
Management’s Annual Report on Internal Control over Financial Reporting |
• |
pertain to the maintenance of records that in reasonable detail accurately and fairly reflect the transactions and dispositions of our assets; |
• |
provide reasonable assurance that transactions are recorded as necessary to permit preparation of financial statements in accordance with generally accepted accounting principles, and that our receipts and expenditures are being made only in accordance with authorizations of our management and members of our Board of Directors; and |
• |
provide reasonable assurance regarding prevention or timely detection of unauthorized acquisition, use, or disposition of our assets that could have a material effect on our financial statements. |
(c) |
Report of Independent Registered Public Accounting Firm |
(d) |
Changes in Internal Control over Financial Reporting |
Year Ended December 31, |
||||||||
2021 |
2020 |
|||||||
(In millions of Russian rubles, net of VAT) |
||||||||
Audit Fees |
128.9 |
128.9 |
||||||
Audit-related Fees |
0.7 |
0.7 |
||||||
Tax Fees |
0.3 |
1.2 |
||||||
Other Fees |
1.4 |
0.2 |
||||||
Total |
131.3 |
131.0 |
||||||
NYSE Corporate Governance Rules for U.S. Companies |
Our Corporate Governance Practices | |
A majority of directors must be independent, as determined by the board. (Section 303A.01 and 02). |
Russian law does not require to maintain a majority of independent directors. In 2021, our Board of Directors consisted of nine members, five of whom were recognized as independent. Currently, due to the recent resignation of one of our directors, our Board of Directors consists of eight members, four of whom are recognized as independent. | |
Non-management directors must meet at regularly scheduled executive sessions without management. (Section 303A.03). |
Our Bylaw on the Board of Directors, which is posted in the “Corporate Governance” section of our corporate website, provides that before each meeting of the board of directors, independent directors shall hold a consultation in the absence of management. | |
Listed companies must have a nominating/corporate governance and a compensation committee, each composed entirely of independent directors and having a written charter specifying the committee’s purpose and responsibilities, as well as annual performance evaluation of the committee. (Section 303A.04 and 05). |
We have a Committee on Appointments and Remuneration, which has three independent members. The Bylaw on Appointments and Remuneration Committee of the Board of Directors is posted in the “Corporate Governance” section of our corporate website. | |
Listed companies must have an audit committee that satisfies the requirements of Rule 10A-3 under the Exchange Act. (Section 303A.06). |
We comply with this requirement. | |
Audit committee must have a minimum of three members and have a written charter specifying the committee’s purpose, an annual performance evaluation and its duties and responsibilities. (Section 303A.07(a) and (b)). |
Our Audit Committee has three members. The Bylaw on the Audit Committee of the Board of Directors is posted in the “Corporate Governance” section of our corporate website. | |
Listed companies must have an internal audit function. (Section 303A.07(c)). |
We have an Internal Audit Department. The summary of the Bylaw on the Internal Audit Department is posted in the “Corporate Governance” section of our corporate website. | |
Shareholders must be given the opportunity to vote on all equity compensation plans and material revisions thereto. (Section 303A.08). |
As a Russian company, we are subject to the mandatory requirements of the Russian Joint-Stock Companies Law. The items on which shareholders can vote cannot be altered. |
NYSE Corporate Governance Rules for U.S. Companies |
Our Corporate Governance Practices | |
Listed companies must adopt and disclose corporate governance guidelines. (Section 303A.09). |
Our corporate governance guidelines are reflected in our various corporate documents, such as the Bylaw on the Board of Directors and the Code of Corporate Governance, all of which are posted in the “Corporate Governance” section of our corporate website. | |
Listed companies must adopt and disclose a code of business conduct and ethics for directors, officers and employees, and promptly disclose any waivers of the code for directors or executive officers. (Section 303A.10). |
Our Code of Business Conduct and Ethics is posted in the “Corporate Governance” section of our corporate website. |
F-2 |
||||
F-3 |
||||
F-6 |
||||
F-8 |
||||
F-9 |
||||
F-12 |
||||
F-14 |
Exhibit No. |
Description | |
1.1 |
||
2.1 |
||
4.1 |
||
4.2 |
||
4.3 |
||
4.4 |
||
4.5 |
||
4.6 |
||
8.1 |
||
12.1 |
||
12.2 |
Exhibit No. |
Description | |
13.1 |
||
13.2 |
||
15.1 |
||
15.2 |
||
15.3 |
||
15.4 |
||
15.5 |
||
101 |
The following financial information formatted in Inline eXtensible Business Reporting Language (XBRL): (i) Consolidated Statement of Profit or Loss and Other Comprehensive Income for the years ended December 31, 2021, 2020 and 2019, (ii) Consolidated Statement of Financial Position as of December 31, 2021 and 2020, (iii) Consolidated Statement of Changes in Equity for the years ended December 31, 2021, 2020 and 2019, (iv) Consolidated Statement of Cash Flows for the years ended December 31, 2021, 2020 and 2019, and (v) Notes to the Consolidated Financial Statements. | |
104 |
Cover Page Interactive Data File (formatted as Inline XBRL and contained in Exhibit 101). |
* |
We undertake to furnish supplementally to the Securities and Exchange Commission upon request a copy of any omitted information, schedule or exhibit to such agreement. |
MECHEL PAO | ||
By: |
/s/ OLEG V. KORZHOV | |
Name: Oleg V. Korzhov | ||
Title: Chief Executive Officer |
F-3 |
||||
F-6 |
||||
F-8 |
||||
F-9 |
||||
F-12 |
||||
F-14 |
Impairment assessments for goodwill and other non-current assets and impairment reversal assessments for other non-current assets | ||
Description of the Matter |
As of December 31, 2021, the Company’s goodwill balance was 9,612 million rubles and its other non-current assets, including property, plant and equipment, right-of-use non-current assets are tested for impairment and reversal of a previously recognized impairment when indicators exist in accordance with IAS 36 Impairment of Assets. This involves estimating the recoverable amount of the cash-generating units, which are determined using discounted cash flow-based methods. These fair value estimates are sensitive to significant assumptions, such as discount rates, forecasts of coal and steel product prices and sales volumes, terminal growth rates and operating costs.Auditing management’s impairment tests was complex given the judgment and estimation uncertainty involved in concluding on key assumptions used in the determination of the recoverable amount of the cash generating units as described above. These assumptions are forward-looking and could be affected by future market or economic conditions. | |
How We Addressed the Matter in Our Audit |
We obtained an understanding, evaluated the design and tested the operating effectiveness of controls over the impairment testing process. For example, we tested controls over management’s review of key assumptions including the discount rates, forecasts of coal and steel product prices and sales volumes, terminal growth rates and operating costs. Our procedures also included, among others, evaluating the reasonableness of key assumptions used by management, such as discount rates, forecasts of coal and steel product prices and sales volumes, terminal growth rates and operating costs as the recoverable amounts are most sensitive to changes in these assumptions. In evaluating the assumptions used by management, we, with the assistance of our valuation specialists, considered the current and past performance of the cash-generating units, the consistency with external market and industry data, the results of sensitivity analyses we performed and whether these assumptions were consistent with evidence obtained in other areas of the audit. We assessed the adequacy of the disclosures related to impairment tests in the consolidated financial statements. |
Realizability of deferred tax assets | ||
Description of the Matter |
As stated in Note 18 to the consolidated financial statements, as of December 31, 2021, a deferred tax asset on accumulated tax losses carryforward of 4,405 million rubles was recognized. In 2021, the consolidated group of taxpayers consisted of twenty Russian subsidiaries of the Company operating under an agreement that terminates on January 1, 2023. The consolidated group of taxpayers has accumulated significant tax losses since its establishment and as a result, the Company must determine what portion of accumulated tax losses to recognize as a deferred tax asset based on the availability of future taxable profits. Auditing management’s analysis of the realizability of the deferred tax assets was complex given the subjective judgments and estimation uncertainty regarding the likely timing and the amount of future taxable profits to be generated to support the utilization of the existing accumulated losses of the consolidated group of taxpayers before expiration. The key assumptions used by management in determining future taxable profits included revenue and cost forecasts (coal and steel product prices and sales volumes and operating costs) that are forward-looking and could be affected by future market or economic conditions. | |
How We Addressed the Matter in Our Audit |
We obtained an understanding, evaluated the design and tested the operating effectiveness of controls over management’s assessment of the realizability of deferred tax assets from accumulated tax losses of the consolidated group of taxpayers. For example, we tested controls over management’s projections of future taxable profits and review of key assumptions such as revenue and cost forecasts (coal and steel product prices and sales volumes and operating costs). To test the adequacy of management’s assessment of realizability of deferred tax assets, our procedures included, among others, evaluation of key assumptions used by management to develop projections of future taxable profits of the consolidated group of taxpayers such as revenue and cost forecasts (coal and steel product prices and sales volumes and operating costs). In evaluating management’s assumptions, we considered the current and past performance of the consolidated group of taxpayers, the consistency with external market and industry data, the results of sensitivity analyses we performed and whether these assumptions were consistent with evidence obtained in other areas of the audit. Valuation specialists were involved to assist in evaluating the appropriateness of key assumptions as described above used to develop the prospective financial information). We assessed the adequacy of the disclosures related to deferred income taxes on the accumulated tax losses of the consolidated group of taxpayers in the consolidated financial statements. |
Notes |
Year ended December 31, 2021 |
Year ended December 31, 2020 |
Year ended December 31, 2019 |
|||||||||||||
Continuing operations |
||||||||||||||||
Revenue from contracts with customers |
25 | |||||||||||||||
Cost of sales |
( |
) | ( |
) | ( |
) | ||||||||||
|
|
|
|
|
|
|||||||||||
Gross profit |
25 | |||||||||||||||
|
|
|
|
|
|
|||||||||||
Selling and distribution expenses |
( |
) | ( |
) | ( |
) | ||||||||||
Impairment of goodwill and other non-current assets, net |
16 | ( |
) | ( |
) | ( |
) | |||||||||
Allowance for expected credit losses |
11, 13 | ( |
) | ( |
) | ( |
) | |||||||||
Taxes other than income taxes |
( |
) | ( |
) | ( |
) | ||||||||||
Administrative and other operating expenses |
23.1 | ( |
) | ( |
) | ( |
) | |||||||||
Other operating income |
23.3 | |||||||||||||||
|
|
|
|
|
|
|||||||||||
Total selling, distribution and operating income and (expenses), net |
( |
) | ( |
) |
( |
) | ||||||||||
|
|
|
|
|
|
|||||||||||
Operating profit |
||||||||||||||||
|
|
|
|
|
|
|||||||||||
Finance income |
23.4 | |||||||||||||||
Finance costs |
23.4 | ( |
) | ( |
) | ( |
) | |||||||||
Foreign exchange gain (loss), net |
( |
) | ||||||||||||||
Share of (loss) profit of associates, net |
6 | ( |
) | |||||||||||||
Other income |
23.5 | |||||||||||||||
Other expenses |
23.5 | ( |
) | ( |
) | ( |
) | |||||||||
|
|
|
|
|
|
|||||||||||
Total other income and (expense), net |
( |
) | ( |
) |
( |
) | ||||||||||
|
|
|
|
|
|
|||||||||||
Profit (loss) before tax from continuing operations |
( |
) |
||||||||||||||
Income tax expense |
18 | ( |
) | ( |
) | ( |
) | |||||||||
|
|
|
|
|
|
|||||||||||
Profit (loss) from continuing operations |
( |
) |
||||||||||||||
Discontinued operations |
||||||||||||||||
Profit (loss) after tax from discontinued operations |
24 | ( |
) | |||||||||||||
|
|
|
|
|
|
|||||||||||
Profit |
||||||||||||||||
|
|
|
|
|
|
|||||||||||
Attributable to: |
||||||||||||||||
Equity shareholders of Mechel PAO |
||||||||||||||||
Non-controlling interests |
Notes |
Year ended December 31, 2021 |
Year ended December 31, 2020 |
Year ended December 31, 2019 |
|||||||||||||
Other comprehensive income |
||||||||||||||||
Other comprehensive (loss) income that may be reclassified to profit or loss in subsequent periods, net of tax |
( |
) |
( |
) | ||||||||||||
Exchange differences on translation of foreign operations |
( |
) | ( |
) | ||||||||||||
Other comprehensive income (loss) not to be reclassified to profit or loss in subsequent periods, net of tax |
( |
) | ||||||||||||||
Net (loss) gain on equity instruments designated at fair value through other comprehensive income |
( |
) | — | |||||||||||||
Re-measurement of defined benefit plans |
20 | ( |
) | |||||||||||||
|
|
|
|
|
|
|||||||||||
Other comprehensive income (loss), net of tax |
( |
) | ||||||||||||||
|
|
|
|
|
|
|||||||||||
Total comprehensive income, net of tax |
||||||||||||||||
|
|
|
|
|
|
|||||||||||
Attributable to: |
||||||||||||||||
Equity shareholders of Mechel PAO |
( |
) | ||||||||||||||
Non-controlling interests |
||||||||||||||||
Earnings per share |
||||||||||||||||
Weighted average number of common shares |
22 | |||||||||||||||
Earnings per share (Russian rubles per share) attributable to common equity shareholders – basic and diluted |
22 | |||||||||||||||
Earnings (loss) per share from continuing operations (Russian rubles per share) – basic and diluted |
22 | ( |
) | |||||||||||||
Earnings (loss) per share from discontinued operations (Russian rubles per share) – basic and diluted |
22 | ( |
) |
Notes |
December 31, 2021 |
December 31, 2020 |
||||||||
Assets |
||||||||||
Non-current assets |
||||||||||
Property, plant and equipment |
14, 16 | |||||||||
Right-of-use |
9.2 | |||||||||
Mineral licenses |
15 | |||||||||
Goodwill and other intangible assets |
15, 16 |
|||||||||
Other non-current assets |
12 | |||||||||
Investments in associates |
6 | |||||||||
Non-current financial assets |
||||||||||
Deferred tax assets |
18 | |||||||||
|
|
|
|
|||||||
Total non-current assets |
||||||||||
|
|
|
|
|||||||
Current assets |
||||||||||
Inventories |
10 | |||||||||
Income tax receivables |
||||||||||
Other current assets |
12 | |||||||||
Trade and other receivables |
11 | |||||||||
Other current financial assets |
9.4 | |||||||||
Cash and cash equivalents |
13 | |||||||||
|
|
|
|
|||||||
Total current assets |
||||||||||
|
|
|
|
|||||||
Total assets |
||||||||||
|
|
|
|
|||||||
Equity and liabilities |
||||||||||
Equity |
||||||||||
Common shares |
22 | |||||||||
Preferred shares |
22 | |||||||||
Treasury shares |
22 | ( |
) | ( |
) | |||||
Additional paid-in capital |
22 | |||||||||
Accumulated other comprehensive income |
||||||||||
Accumulated deficit |
( |
) | ( |
) | ||||||
|
|
|
|
|||||||
Equity attributable to equity shareholders of Mechel PAO |
( |
) | ( |
) | ||||||
Non-controlling interests |
||||||||||
|
|
|
|
|||||||
Total equity |
( |
) | ( |
) | ||||||
|
|
|
|
|||||||
Non-current liabilities |
||||||||||
Loans and borrowings |
9.1 | |||||||||
Lease liabilities |
9.2 | |||||||||
Other non-current financial liabilities |
9.5 | |||||||||
Other non-current liabilities |
||||||||||
Pension obligations |
20 | |||||||||
Provisions |
21 | |||||||||
Deferred tax liabilities |
18 | |||||||||
|
|
|
|
|||||||
Total non-current liabilities |
||||||||||
|
|
|
|
|||||||
Current liabilities |
||||||||||
Loans and borrowings |
9.1 | |||||||||
Lease liabilities |
9.2 | |||||||||
Trade and other payables |
17 | |||||||||
Other current financial liabilities |
9.5 | |||||||||
Income tax payable |
||||||||||
Taxes and similar charges payable other than income tax |
19 | |||||||||
Advances received |
25 | |||||||||
Other current liabilities |
||||||||||
Pension obligations |
20 | |||||||||
Provisions |
21 | |||||||||
|
|
|
|
|||||||
Total current liabilities |
||||||||||
|
|
|
|
|||||||
Total liabilities |
||||||||||
|
|
|
|
|||||||
Total equity and liabilities |
||||||||||
|
|
|
|
Attributable to equity shareholders of the parent |
||||||||||||||||||||||||||||||||||||||||||||||||||||
Common shares |
Preferred shares |
Treasury shares |
Additional paid-in capital |
Accumu-lated other comprehen- sive income (loss) |
Accumu- lated deficit |
Equity attributable to share- holders of Mechel PAO |
Non- controlling interests |
Total equity |
||||||||||||||||||||||||||||||||||||||||||||
Notes |
Quantity |
Amount |
Quantity |
Amount |
Quantity |
Amount |
||||||||||||||||||||||||||||||||||||||||||||||
As of January 1, 2019 |
— |
— |
( |
) |
( |
) |
( |
) | ||||||||||||||||||||||||||||||||||||||||||||
|
|
|
|
|
|
|
|
|
|
|
|
|
|
|
|
|
|
|
|
|
|
|
|
|||||||||||||||||||||||||||||
Profit |
— | — | — | — | — | — | — | — | ||||||||||||||||||||||||||||||||||||||||||||
Other comprehensive income (loss) |
||||||||||||||||||||||||||||||||||||||||||||||||||||
Re-measurement of defined benefit plans |
20 | — | — | — | — | — | — | — | ( |
) | — | ( |
) | ( |
) | ( |
) | |||||||||||||||||||||||||||||||||||
Exchange differences on translation of foreign operations |
— | — | — | — | — | — | — | ( |
) | — | ( |
) | — | ( |
) | |||||||||||||||||||||||||||||||||||||
|
|
|
|
|
|
|
|
|
|
|
|
|
|
|
|
|
|
|
|
|
|
|
|
|||||||||||||||||||||||||||||
Total comprehensive income (loss) |
— |
— |
— |
— |
— |
— |
— |
( |
) |
( |
) |
|||||||||||||||||||||||||||||||||||||||||
|
|
|
|
|
|
|
|
|
|
|
|
|
|
|
|
|
|
|
|
|
|
|
|
|||||||||||||||||||||||||||||
Sale of preferred shares kept as treasury shares by the Group |
22 | — | — | — | — | — | — | — | ||||||||||||||||||||||||||||||||||||||||||||
Reacquired common shares |
22 | — | — | — | — | ( |
) | ( |
) | — | — | — | ( |
) | — | ( |
) | |||||||||||||||||||||||||||||||||||
Dividends declared to equity shareholders of Mechel PAO |
22 | — | — | — | — | — | — | — | — | ( |
) | ( |
) | — | ( |
) | ||||||||||||||||||||||||||||||||||||
|
|
|
|
|
|
|
|
|
|
|
|
|
|
|
|
|
|
|
|
|
|
|
|
|||||||||||||||||||||||||||||
As of December 31, 2019 |
( |
) |
( |
) |
( |
) |
( |
) |
( |
) |
( |
) | ||||||||||||||||||||||||||||||||||||||||
|
|
|
|
|
|
|
|
|
|
|
|
|
|
|
|
|
|
|
|
|
|
|
|
Attributable to e quity shareholders of the parent |
||||||||||||||||||||||||||||||||||||||||||||||||||||
Common shares |
Preferred shares |
Treasury shares |
Additional paid-in capital |
Accumu- lated other comprehen- sive income (loss) |
Accumu- lated deficit |
Equity attributable to share- holders of Mechel PAO |
Non- controlling interests |
Total equity |
||||||||||||||||||||||||||||||||||||||||||||
Notes |
Quantity |
Amount |
Quantity |
Amount |
Quantity |
Amount |
||||||||||||||||||||||||||||||||||||||||||||||
As of January 1, 2020 |
( |
) |
( |
) |
( |
) |
( |
) |
( |
) |
( |
) | ||||||||||||||||||||||||||||||||||||||||
|
|
|
|
|
|
|
|
|
|
|
|
|
|
|
|
|
|
|
|
|
|
|
|
|||||||||||||||||||||||||||||
Profit |
— | — | — | — | — | — | — | — | ||||||||||||||||||||||||||||||||||||||||||||
Other comprehensive income |
||||||||||||||||||||||||||||||||||||||||||||||||||||
Re-measurement of equity instruments designated at fair value through OCI |
— | — | — | — | — | — | — | — | — | |||||||||||||||||||||||||||||||||||||||||||
Re-measurement of defined benefit plans |
20 | — | — | — | — | — | — | — | — | |||||||||||||||||||||||||||||||||||||||||||
Exchange differences on translation of foreign operations |
— | — | — | — | — | — | — | — | — | |||||||||||||||||||||||||||||||||||||||||||
|
|
|
|
|
|
|
|
|
|
|
|
|
|
|
|
|
|
|
|
|
|
|
|
|||||||||||||||||||||||||||||
Total comprehensive income |
— |
— |
— |
— |
— |
— |
— |
|||||||||||||||||||||||||||||||||||||||||||||
|
|
|
|
|
|
|
|
|
|
|
|
|
|
|
|
|
|
|
|
|
|
|
|
|||||||||||||||||||||||||||||
Transfer of actuarial gains (losses) due to disposal of discontinued operations |
— | — | — | — | — | — | — | ( |
) | — | — | — |
||||||||||||||||||||||||||||||||||||||||
Reacquired common shares |
22 | — | — | — | — | ( |
) | ( |
) | — | — | — | ( |
) | — | ( |
) | |||||||||||||||||||||||||||||||||||
Dividends declared to equity shareholders of Mechel PAO |
22 | — | — | — | — | — | — | — | — | ( |
) | ( |
) | — | ( |
) | ||||||||||||||||||||||||||||||||||||
Sale and purchase of non-controlling interests |
22 | — | — | — | — | — | — | ( |
) | — | — | ( |
) | |||||||||||||||||||||||||||||||||||||||
|
|
|
|
|
|
|
|
|
|
|
|
|
|
|
|
|
|
|
|
|
|
|
|
|||||||||||||||||||||||||||||
As of December 31, 2020 |
( |
) |
( |
) |
( |
) |
( |
) |
( |
) | ||||||||||||||||||||||||||||||||||||||||||
|
|
|
|
|
|
|
|
|
|
|
|
|
|
|
|
|
|
|
|
|
|
|
|
Attributable to equity shareholders of the parent |
||||||||||||||||||||||||||||||||||||||||||||||||||||
Common shares |
Preferred shares |
Treasury shares |
Additional paid-in capital |
Accumu- lated other comprehen- sive income (loss) |
Accumu- lated deficit |
Equity attributable to share- holders of Mechel PAO |
Non- controlling interests |
Total equity |
||||||||||||||||||||||||||||||||||||||||||||
Notes |
Quantity |
Amount |
Quantity |
Amount |
Quantity |
Amount |
||||||||||||||||||||||||||||||||||||||||||||||
As of January 1, 2021 |
( |
) |
( |
) |
( |
) |
( |
) |
( |
) | ||||||||||||||||||||||||||||||||||||||||||
|
|
|
|
|
|
|
|
|
|
|
|
|
|
|
|
|
|
|
|
|
|
|
|
|||||||||||||||||||||||||||||
Profit |
— | — | — | — | — | — | — | — | ||||||||||||||||||||||||||||||||||||||||||||
Other comprehensive income |
||||||||||||||||||||||||||||||||||||||||||||||||||||
Re-measurement of equity instruments designated at fair value through OCI |
— | — | — | — | — | — | — | ( |
) | — | ( |
) | — | ( |
) | |||||||||||||||||||||||||||||||||||||
Re-measurement of defined benefit plans |
20 | — | — | — | — | — | — | — | — | |||||||||||||||||||||||||||||||||||||||||||
Exchange differences on translation of foreign operations |
— | — | — | — | — | — | — | ( |
) | — | ( |
) | — | ( |
) | |||||||||||||||||||||||||||||||||||||
|
|
|
|
|
|
|
|
|
|
|
|
|
|
|
|
|
|
|
|
|
|
|
|
|||||||||||||||||||||||||||||
Total comprehensive income |
— |
— |
— |
— |
— |
— |
— |
|||||||||||||||||||||||||||||||||||||||||||||
|
|
|
|
|
|
|
|
|
|
|
|
|
|
|
|
|
|
|
|
|
|
|
|
|||||||||||||||||||||||||||||
Dividends declared to equity shareholders of Mechel PAO |
22 | — | — | — | — | — | — | — | — | ( |
) | ( |
) | — | ( |
) | ||||||||||||||||||||||||||||||||||||
Dividends declared to non-controlling interests |
22 | — | — | — | — | — | — | — | — | — | — | ( |
) | ( |
) | |||||||||||||||||||||||||||||||||||||
|
|
|
|
|
|
|
|
|
|
|
|
|
|
|
|
|
|
|
|
|
|
|
|
|||||||||||||||||||||||||||||
As of December 31, 2021 |
( |
) |
( |
) |
( |
) |
( |
) |
( |
) | ||||||||||||||||||||||||||||||||||||||||||
|
|
|
|
|
|
|
|
|
|
|
|
|
|
|
|
|
|
|
|
|
|
|
|
Year ended December 31, |
||||||||||||||||
Notes |
2021 |
2020 |
2019 |
|||||||||||||
Cash flows from operating activities |
||||||||||||||||
Profit (loss) |
( |
) | ||||||||||||||
Profit (loss) after tax from discontinued operations |
24 | ( |
) | |||||||||||||
|
|
|
|
|
|
|||||||||||
Profit |
||||||||||||||||
Adjustments to reconcile profit to net cash provided by operating activities |
||||||||||||||||
Depreciation and amortisation |
||||||||||||||||
Foreign exchange (gain) loss, net |
( |
) | ( |
) | ||||||||||||
Deferred income tax (benefit) expense |
18 | ( |
) | |||||||||||||
Allowance for expected credit losses |
||||||||||||||||
Gain on restructuring and forgiveness of trade and other payables and write-off of trade and other payables with expired legal term |
( |
) | ( |
) | ( |
) | ||||||||||
Write-off of inventories to net realisable value |
||||||||||||||||
Impairment of goodwill and other non-current assets, net and loss on write-off of non-current assets |
||||||||||||||||
Finance income |
( |
) | ( |
) | ( |
) | ||||||||||
Finance costs |
23.4, 24 | |||||||||||||||
Provisions for legal claims, income tax and other taxes and other provisions |
( |
) | ||||||||||||||
Gain on sale of discontinued operations |
24 | – | ( |
) | – |
|||||||||||
Gain on disposal of a subsidiary |
( |
) | – | – | ||||||||||||
Other |
( |
) | ( |
) | ||||||||||||
Changes in working capital items |
||||||||||||||||
Trade and other receivables |
( |
) | ( |
) | ||||||||||||
Inventories |
( |
) | ( |
) | ( |
) | ||||||||||
Trade and other payables |
( |
) | ||||||||||||||
Advances received |
||||||||||||||||
Taxes payable and other liabilities |
||||||||||||||||
Other assets |
( |
) | ( |
) | ||||||||||||
Income tax paid |
( |
( |
) | ( |
) | |||||||||||
|
|
|
|
|
|
|||||||||||
Net cash provided by operating activities |
||||||||||||||||
|
|
|
|
|
|
Year ended December 31, |
||||||||||||||||
Notes |
2021 |
2020 |
2019 |
|||||||||||||
Cash flows from investing activities |
||||||||||||||||
Interest received |
||||||||||||||||
Royalty and other proceeds associated with disposal of subsidiaries |
||||||||||||||||
Proceeds from loans issued and other investments |
||||||||||||||||
Proceeds from disposal of the discontinued operations, net of cash disposed of |
24 | — | ||||||||||||||
Cash disposed of due to disposal of subsidiary |
( |
) | — | |||||||||||||
Proceeds from disposals of property, plant and equipment |
||||||||||||||||
Purchases of property, plant and equipment and intangible assets |
( |
) | ( |
) | ( |
) | ||||||||||
|
|
|
|
|
|
|||||||||||
Net cash (used in) provided by investing activities |
( |
) | ( |
) | ||||||||||||
|
|
|
|
|
|
|||||||||||
Cash flows from financing activities |
||||||||||||||||
Proceeds from loans and borrowings, including proceeds from factoring arrangement of |
13 | |||||||||||||||
Repayment of loans and borrowings, including payments from factoring arrangement of RUB |
13 | ( |
) | ( |
) | ( |
) | |||||||||
Repurchase of common shares |
22 | ( |
) | — | ||||||||||||
Sale and purchase of non-controlling interest in subsidiaries |
22 | — | ||||||||||||||
Dividends paid to shareholders of Mechel PAO |
13 | ( |
) | ( |
) | ( |
) | |||||||||
Dividends paid to non-controlling interests |
13 | ( |
) | ( |
) | ( |
) | |||||||||
Interest paid, including fines and penalties |
13 | ( |
) | ( |
) | ( |
) | |||||||||
Payment of principal portion of lease liabilities |
13 | ( |
) | ( |
) | ( |
) | |||||||||
Sale and leaseback transactions |
13 | ( |
) | |||||||||||||
Acquisition of assets under deferred payment terms |
13 | ( |
) | ( |
) | ( |
) | |||||||||
Deferred consideration paid for the acquisition of subsidiaries in prior periods |
13 | ( |
) | |||||||||||||
|
|
|
|
|
|
|||||||||||
Net cash used in financing activities |
( |
) |
( |
) |
( |
) | ||||||||||
|
|
|
|
|
|
|||||||||||
Foreign exchange (loss) gain on cash and cash equivalents, net |
( |
) | ( |
) | ( |
) | ||||||||||
Changes in allowance for expected credit losses on cash and cash equivalents |
13 | ( |
) | ( |
) | |||||||||||
|
|
|
|
|
|
|||||||||||
Net increase (decrease) in cash and cash equivalents |
( |
) |
||||||||||||||
Cash and cash equivalents at beginning of period |
13 | |||||||||||||||
|
|
|
|
|
|
|||||||||||
Cash and cash equivalents, net of overdrafts at beginning of period |
13 | ( |
) |
|||||||||||||
|
|
|
|
|
|
|||||||||||
Cash and cash equivalents at end of period |
13 | |||||||||||||||
|
|
|
|
|
|
|||||||||||
Cash and cash equivalents, net of overdrafts at end of period |
13 | ( |
) |
|||||||||||||
|
|
|
|
|
|
1. |
Corporate information |
(a) |
Information |
Name of subsidiary |
Registered in |
Core business |
Date control acquired /date of incorporation / established |
Interest in voting stock held by the Group at December 31, 2021 |
||||||||
Southern Kuzbass Coal Company (SKCC) |
Russia | Coal mining | % | |||||||||
Chelyabinsk Metallurgical Plant (CMP) |
Russia | Steel products | % | |||||||||
Vyartsilya Metal Products Plant (VMPP) |
Russia | Steel products | % | |||||||||
Beloretsk Metallurgical Plant (BMP) |
Russia | Steel products | % | |||||||||
Urals Stampings Plant (USP) |
Russia | Steel products | % | |||||||||
Korshunov Mining Plant (KMP) |
Russia | Iron ore mining | % | |||||||||
Mechel Nemunas (MN) |
Lithuania | Steel products | % | |||||||||
Mechel Energo |
Russia | Power sales | % | |||||||||
Port Posiet |
Russia | Transshipment | % | |||||||||
Izhstal |
Russia | Steel products | % | |||||||||
Port Kambarka |
Russia | Transshipment | % | |||||||||
Mechel Service |
Russia | Trading | % | |||||||||
Mechel Coke |
Russia | Coke production | % | |||||||||
Moscow Coke and Gas Plant (Moskoks) |
Russia | Coke production | % | |||||||||
Southern Kuzbass Power Plant (SKPP) |
Russia | Power generation | % | |||||||||
Kuzbass Power Sales Company (KPSC) |
Russia | Electricity distribution | % | |||||||||
Bratsk Ferroalloy Plant (BFP) |
Russia | Ferrosilicon production | % | |||||||||
Yakutugol |
Russia | Coal mining | % | |||||||||
Port Temryuk |
Russia | Transshipment | % | |||||||||
Mechel Carbon AG |
Switzerland | Trading | % | |||||||||
HBL Holding GmbH (HBL) |
Germany | Trading | % | |||||||||
Mechel Service Stahlhandel Austria GmbH and its subsidiaries |
Austria | Trading | % |
(b) |
Business |
(c) |
Authorisation for issuance |
2. |
Basis of preparation of the consolidated financial statements |
(a) |
Basis of preparation |
(b) |
Basis of consolidation |
• |
Power over the investee (i.e., existing rights that give it the current ability to direct the relevant activities of the investee); |
• |
Exposure, or rights, to variable returns from its involvement with the investee; |
• |
The ability to use its power over the investee to affect its returns. |
3. |
Summary of significant accounting policies |
(a) |
Business combinations and goodwill |
(b) |
Investments in associates |
(c) |
Current versus non-current classification |
• | Expected to be realised or intended to be sold or consumed in the normal operating cycle; |
• | Held primarily for the purpose of trading; |
• | Expected to be realised within twelve months after the reporting period; or |
• | Cash or cash equivalent unless restricted from being exchanged or used to settle a liability for at least twelve months after the reporting period. |
• |
It is expected to be settled in the normal operating cycle; |
• |
It is held primarily for the purpose of trading; |
• |
It is due to be settled within twelve months after the reporting period; or |
• |
There is no unconditional right to defer the settlement of the liability for at least twelve months after the reporting period. |
(d) |
Fair value measurement |
• | In the principal market for the asset or liability; or |
• | In the absence of a principal market, in the most advantageous market for the asset or liability. |
• | Level 1 – quoted (unadjusted) market prices in active markets for identical assets or liabilities; |
• | Level 2 – valuation techniques for which the lowest level input that is significant to the fair value measurement is directly or indirectly observable; |
• | Level 3 – valuation techniques for which the lowest level input that is significant to the fair value measurement is unobservable. |
(e) |
Revenue from contracts with customers |
(f) |
Taxes |
• |
When the deferred tax liability arises from the initial recognition of goodwill or an asset or liability in a transaction that is not a business combination and, at the time of the transaction, affects neither the accounting profit nor taxable profit or loss. |
• |
In respect of taxable temporary differences associated with investments in subsidiaries, associates and interests in joint arrangements, when the timing of the reversal of the temporary differences can be controlled and it is probable that the temporary differences will not reverse in the foreseeable future. |
• |
When the deferred tax asset relating to the deductible temporary difference arises from the initial recognition of an asset or liability in a transaction that is not a business combination and, at the time of the transaction, affects neither the accounting profit nor taxable profit or loss. |
• |
In respect of deductible temporary differences associated with investments in subsidiaries, associates and interests in joint arrangements, deferred tax assets are recognised only to the extent that it is probable that the temporary differences will reverse in the foreseeable future and taxable profit will be available against which the temporary differences can be utilized. |
(g) |
Foreign currencies |
(i) |
Transactions and balances |
(ii) |
Group companies |
(h) |
Non-current assets held for sale and discontinued operations |
• | Represents a separate major line of business or geographical area of operations; |
• | Is part of a single co-ordinated plan to dispose of a separate major line of business or geographical area of operations; or |
• | Is a subsidiary acquired exclusively with a view to resale. |
(i) |
Mineral licenses |
(j) |
Property, plant and equipment |
(a) | It is probable that the future economic benefit associated with the stripping activity will flow to the entity; |
(b) | The entity can identify the component of the ore body for which access has been improved; |
(c) | The costs relating to the stripping activity associated with that component can be measured reliably. |
Category of asset |
Useful economic lives estimates, years |
|||
Buildings and constructions |
||||
Operating machinery and equipment |
||||
Transportation vehicles |
||||
Other equipment |
(k) |
Leases |
Category of asset |
Years |
|||
Buildings and constructions |
||||
Operating machinery and equipment |
||||
Transportation vehicles |
(l) |
Borrowing costs |
(m) |
Intangible assets |
(n) |
Financial instruments — initial recognition and subsequent measurement |
(i) |
Financial assets |
• | Financial assets at amortised cost; |
• | Financial assets at fair value through OCI with recycling of cumulative gains and losses (debt instruments); |
• | Financial assets designated at fair value through OCI with no recycling of cumulative gains and losses upon derecognition (equity instruments); |
• | Financial assets at fair value through profit or loss. |
• | The financial asset is held within a business model with the objective to hold financial assets in order to collect contractual cash flows; and |
• | The contractual terms of the financial asset give rise on specified dates to cash flows that are SPPI on the principal amount outstanding. |
• | The financial asset is held within a business model with the objective of both holding to collect contractual cash flows and selling; and |
• | The contractual terms of the financial asset give rise on specified dates to cash flows that are solely payments of principal and interest on the principal amount outstanding. |
• | The rights to receive cash flows from the asset have expired; or |
• | The Group has transferred its rights to receive cash flows from the asset or has assumed an obligation to pay the received cash flows in full without material delay to a third party under a “pass-through” arrangement; and either (a) the Group has transferred substantially all the risks and rewards of the asset, or (b) the Group has neither transferred nor retained substantially all the risks and rewards of the asset, but has transferred control of the asset. |
• | Financial assets — Note 9. |
• | Trade and other receivables — Note 11. |
• |
The customer is more than 90 days past due on its contractual payments; |
• |
International rating agencies have classified the customer in the default rating class; |
• |
The customer meets the unlikeliness-to-pay |
• |
The customer is insolvent; |
• |
The customer is in breach of financial covenants; and |
• |
It is becoming likely that the customer will enter bankruptcy. |
(ii) |
Financial liabilities |
(iii) |
Interest income |
(o) |
Derivative financial instruments |
(p) |
Inventories |
(q) |
Impairment of non-current assets |
• | Intangible assets — Note 15. |
• | Property, plant and equipment — Note 14. |
• | Impairment of goodwill and other non-current assets — Note 16. |
(r) |
Cash and cash equivalents |
(s) |
Provisions |
(t) |
Pensions and other post-employment benefits |
(u) |
Government grants |
(v) |
Treasury shares |
(w) |
Significant accounting estimates, assumptions and judgments |
• |
Mineral licenses (Note 3 (i)); |
• |
Property, plant and equipment (Note 3 (j)); |
• |
Deferred tax assets (Note 3 (f)); |
• |
Non-current assets held for sale and discontinued operations (Note 3 (h)); |
• |
Inventories (Note 3 (p)); |
• |
Impairment of non-current assets (Note 3 (q)); |
• |
Pensions and other post-employment benefits (Note 3 (t)); |
• |
Provisions (Note 3 (s)); |
• |
Fair value measurement (Note 3 (d)). |
(x) |
Reclassifications and rounding |
(y) |
New and amended standards and interpretations adopted by the Group |
• | Amendments to IFRS 9, IAS 39, IFRS 7, IFRS 4 and IFRS 16 — Interest Rate Benchmark Reform |
• |
Amendments to IAS 1 — Classification of Liabilities as Current or Non-current Deferral of Effective Date |
• |
Amendments to IAS 1 and IFRS Practice Statement 2 — Disclosure of Accounting policies |
• |
Amendments to IAS 8 — Definition of Accounting Estimates |
• |
Amendments to IAS 12 — Deferred Tax related to Assets and Liabilities arising from a Single Transaction |
• |
Amendments to IAS 16 — Property, Plant and Equipment: Proceeds before Intended Use |
• |
Amendments to IAS 37 — Onerous Contracts — Costs of Fulfilling a Contract |
• |
Amendments to IFRS 3 — Reference to the Conceptual Framework |
• |
Amendments to IFRS 16 — COVID-19-Related |
• |
Annual Improvements to IFRSs 2018-2020 — amendments to IFRS 9 — Fees in the ‘10 per cent’ test for derecognition of financial liabilities |
4. |
Going concern |
5. |
Material partly-owned subsidiaries |
Name |
At December 31, 2021 |
At December 31, 2020 |
||||||
SKCC and subsidiaries (Hereinafter SKCC and subsidiaries are represented by Southern Kuzbass Coal Company (SKCC), Tomusinsky Open Pit Mine (TOPM), Tomusinsky Energoupravlenie) |
% | % | ||||||
Kuzbass Power Sales Company (KPSC) |
% | % | ||||||
Chelyabinsk Metallurgical Plant (CMP) (Note 22) |
% | % | ||||||
Beloretsk Metallurgical Plant (BMP) |
% | % | ||||||
Korshunov Mining Plant (KMP) |
% | % | ||||||
Urals Stampings Plant (USP) (Note 22) |
% | % | ||||||
Izhstal |
% | % |
SKCC and subsidiaries |
KPSC |
CMP |
BMP |
KMP |
USP |
Izhstal |
||||||||||||||||||||||
Revenue from contracts with customers |
||||||||||||||||||||||||||||
Cost of sales |
( |
) | ( |
) | ( |
) | ( |
) | ( |
) | ( |
) | ( |
) | ||||||||||||||
Total selling, distribution and operating expenses, net |
( |
) | ( |
) | ( |
) | ( |
) | ( |
) | ( |
) | ( |
) | ||||||||||||||
Total other income and (expense), net |
( |
) | ( |
) | ( |
) | ||||||||||||||||||||||
|
|
|
|
|
|
|
|
|
|
|
|
|
|
|||||||||||||||
Profit before tax |
||||||||||||||||||||||||||||
Income tax (expense) benefit |
( |
) | ( |
) | ( |
) | ( |
) | ( |
) | ( |
) | ||||||||||||||||
|
|
|
|
|
|
|
|
|
|
|
|
|
|
|||||||||||||||
Profit for the period |
||||||||||||||||||||||||||||
|
|
|
|
|
|
|
|
|
|
|
|
|
|
|||||||||||||||
Total comprehensive income |
||||||||||||||||||||||||||||
|
|
|
|
|
|
|
|
|
|
|
|
|
|
|||||||||||||||
Attributable to non-controlling interests |
SKCC and subsidiaries |
KPSC |
CMP |
BMP |
KMP |
USP |
Izhstal |
||||||||||||||||||||||
Revenue from contracts with customers |
||||||||||||||||||||||||||||
Cost of sales |
( |
) | ( |
) | ( |
) | ( |
) | ( |
) | ( |
) | ( |
) | ||||||||||||||
Total selling, distribution and operating expenses, net |
( |
) | ( |
) | ( |
) | ( |
) | ( |
) | ( |
) | ( |
) | ||||||||||||||
Total other income and (expense), net |
( |
) | ( |
) | ( |
) | ||||||||||||||||||||||
|
|
|
|
|
|
|
|
|
|
|
|
|
|
|||||||||||||||
(Loss) profit before tax |
( |
) |
( |
) | ||||||||||||||||||||||||
Income tax benefit (expense) |
( |
) | ( |
) | ( |
) | ( |
) | ( |
) | ||||||||||||||||||
|
|
|
|
|
|
|
|
|
|
|
|
|
|
|||||||||||||||
(Loss) profit for the period |
( |
) |
( |
) | ||||||||||||||||||||||||
|
|
|
|
|
|
|
|
|
|
|
|
|
|
|||||||||||||||
Total comprehensive (loss) income |
( |
) |
( |
) | ||||||||||||||||||||||||
|
|
|
|
|
|
|
|
|
|
|
|
|
|
|||||||||||||||
Attributable to non-controlling interests |
( |
) | ( |
) |
SKCC and subsidiaries |
KPSC |
CMP |
BMP |
KMP |
USP |
Izhstal |
||||||||||||||||||||||
Revenue from contracts with customers |
|
|||||||||||||||||||||||||||
Cost of sales |
( |
) | ( |
) | ( |
) | ( |
) | ( |
) | ( |
) | ( |
) | ||||||||||||||
Total selling, distribution and operating expenses, net |
( |
) | ( |
) | ( |
) | ( |
) | ( |
) | ( |
) | ||||||||||||||||
Total other income and (expense), net |
( |
) | ( |
) | ||||||||||||||||||||||||
Profit before tax |
||||||||||||||||||||||||||||
Income tax (expense) benefit |
( |
) | ( |
) | ( |
) | ( |
) | ( |
) | ( |
) | ||||||||||||||||
Profit for the period |
||||||||||||||||||||||||||||
Total comprehensive income |
||||||||||||||||||||||||||||
Attributable to non-controlling interests |
SKCC and subsidiaries |
KPSC |
CMP |
BMP |
KMP |
USP |
Izhstal |
||||||||||||||||||||||
Current assets |
||||||||||||||||||||||||||||
Non-current assets |
||||||||||||||||||||||||||||
Current liabilities |
( |
) | ( |
) | ( |
) | ( |
) | ( |
) | ( |
) | ( |
) | ||||||||||||||
Non-current liabilities |
( |
) | ( |
) | ( |
) | ( |
) | ( |
) | ( |
) | ( |
) | ||||||||||||||
Total equity |
( |
) |
( |
) |
( |
) |
( |
) |
( |
) |
||||||||||||||||||
Attributable to: |
||||||||||||||||||||||||||||
Equity shareholders of Mechel PAO |
( |
) | ( |
) | ( |
) | ( |
) | ( |
) | ||||||||||||||||||
Non-controlling interests |
( |
) | ( |
) | ( |
) | ( |
) | ( |
) | ( |
) |
SKCC and subsidiaries |
KPSC |
CMP |
BMP |
KMP |
USP |
Izhstal |
||||||||||||||||||||||
Current assets |
|
|||||||||||||||||||||||||||
Non-current assets |
||||||||||||||||||||||||||||
Current liabilities |
( |
) | ( |
) | ( |
) | ( |
) | ( |
) | ( |
) | ( |
) | ||||||||||||||
Non-current liabilities |
( |
) | ( |
) | ( |
) | ( |
) | ( |
) | ( |
) | ( |
) | ||||||||||||||
|
|
|
|
|
|
|
|
|
|
|
|
|
|
|||||||||||||||
Total equity |
( |
) |
( |
) |
( |
) |
( |
) |
( |
) |
||||||||||||||||||
|
|
|
|
|
|
|
|
|
|
|
|
|
|
|||||||||||||||
Attributable to: |
||||||||||||||||||||||||||||
Equity shareholders of Mechel PAO |
( |
) | ( |
) | ( |
) | ( |
) | ( |
) | ||||||||||||||||||
Non-controlling interests |
( |
) | ( |
) | ( |
) | ( |
) | ( |
) | ( |
) |
SKCC and subsidiaries |
KPSC |
CMP |
BMP |
KMP |
USP |
Izhstal |
||||||||||||||||||||||
Operating |
( |
) | ||||||||||||||||||||||||||
Investing |
( |
) | ( |
) | ( |
) | ( |
) | ( |
) | ||||||||||||||||||
Financing |
( |
) | ( |
) | ( |
) | ( |
) | ( |
) | ( |
) | ||||||||||||||||
|
|
|
|
|
|
|
|
|
|
|
|
|
|
|||||||||||||||
(Decrease) increase in cash and cash equivalents, net |
( |
) |
||||||||||||||||||||||||||
|
|
|
|
|
|
|
|
|
|
|
|
|
|
SKCC and subsidiaries |
KPSC |
CMP |
BMP |
KMP |
USP |
Izhstal |
||||||||||||||||||||||
Operating |
( |
) | ||||||||||||||||||||||||||
Investing |
( |
) | ( |
) | ( |
) | ( |
) | ( |
) | ( |
) | ||||||||||||||||
Financing |
( |
) | ( |
) | ( |
) | ( |
) | ( |
) | ( |
) | ||||||||||||||||
|
|
|
|
|
|
|
|
|
|
|
|
|
|
|||||||||||||||
(Decrease) increase in cash and cash equivalents, net |
( |
) |
( |
) |
( |
) |
( |
) |
( |
) | ||||||||||||||||||
|
|
|
|
|
|
|
|
|
|
|
|
|
|
SKCC and subsidiaries |
KPSC |
CMP |
BMP |
KMP |
USP |
Izhstal |
||||||||||||||||||||||
Operating |
( |
) | ||||||||||||||||||||||||||
Investing |
( |
) | ( |
) | ( |
) | ( |
) | ( |
) | ( |
) | ||||||||||||||||
Financing |
( |
) | ( |
) | ( |
) | ( |
) | ( |
) | ( |
) | ||||||||||||||||
|
|
|
|
|
|
|
|
|
|
|
|
|
|
|||||||||||||||
Increase (decrease) in cash and cash equivalents, net |
( |
) |
||||||||||||||||||||||||||
|
|
|
|
|
|
|
|
|
|
|
|
|
|
6. |
Investments in associates |
Percent of shares held at |
Investment carrying value at |
|||||||||||||||
Investee |
December 31, 2021 |
December 31, 2020 |
December 31, 2021 |
December 31, 2020 |
||||||||||||
TPTU (Mining segment) |
% | % | ||||||||||||||
TRMZ (Mining segment) |
% | % | ||||||||||||||
|
|
|
|
|||||||||||||
Total investments in associates |
||||||||||||||||
|
|
|
|
TPTU (Mining segment) |
TRMZ (Mining segment) |
Total |
||||||||||
January 1, 2019 |
||||||||||||
Share of profit |
||||||||||||
|
|
|
|
|
|
|||||||
December 31, 2019 |
||||||||||||
Share of profit |
||||||||||||
|
|
|
|
|
|
|||||||
December 31, 2020 |
||||||||||||
Share of loss |
( |
) | ( |
) | ( |
) | ||||||
|
|
|
|
|
|
|||||||
December 31, 2021 |
||||||||||||
|
|
|
|
|
|
7. |
Related party disclosures |
2021 |
2020 |
2019 |
||||||||||||||||||||||||||||||||||
Purchases |
Sales |
Other loss (income) |
Purchases |
Sales |
Other loss (income) |
Purchases |
Sales |
Other loss (income) |
||||||||||||||||||||||||||||
Associates |
— | — | — | |||||||||||||||||||||||||||||||||
Controlling shareholders and entities under control of the Group’s Controlling shareholders |
( |
) | ||||||||||||||||||||||||||||||||||
|
|
|
|
|
|
|
|
|
|
|
|
|
|
|
|
|
|
|||||||||||||||||||
Total |
( |
) |
||||||||||||||||||||||||||||||||||
|
|
|
|
|
|
|
|
|
|
|
|
|
|
|
|
|
|
December 31, 2021 |
December 31, 2020 |
|||||||||||||||
Financial and other assets |
Financial liabilities to |
Financial and other assets |
Financial liabilities to |
|||||||||||||
Associates |
( |
) | ( |
) | ||||||||||||
Controlling shareholders and entities under control of the Group’s Controlling shareholders |
( |
) | ( |
) | ||||||||||||
|
|
|
|
|
|
|
|
|||||||||
Total |
( |
) |
( |
) | ||||||||||||
|
|
|
|
|
|
|
|
(a) |
Controlling shareholders and entities under control of the Group’s Controlling shareholders |
(b) |
Compensation to key management personnel |
8. |
Fair value measurement |
December 31, 2021 |
December 31, 2020 |
|||||||||||||||||||
Level |
Carrying amount |
Fair value |
Carrying amount |
Fair value |
||||||||||||||||
Financial liabilities measured at amortised cost |
||||||||||||||||||||
Floating rate loans and borrowings |
3 |
|||||||||||||||||||
Bonds |
1 | |||||||||||||||||||
Fixed rate loans and borrowings |
3 |
|||||||||||||||||||
Other non-current financial liabilities (Note 9.5) |
3 |
|||||||||||||||||||
|
|
|
|
|
|
|
|
|||||||||||||
Total |
||||||||||||||||||||
|
|
|
|
|
|
|
|
9. |
Financial assets and financial liabilities |
9.1 |
Financial liabilities: loans and borrowings |
Short-term loans and borrowings and current portion of long-term loans and borrowings |
December 31, 2021 |
December 31, 2020 |
||||||||||||||
Interest rate, % |
Amounts outstanding |
Interest rate, % |
Amounts outstanding |
|||||||||||||
In Russian rubles |
||||||||||||||||
Russian state-controlled banks |
— | |||||||||||||||
In euro |
||||||||||||||||
Other banks and financial institutions |
||||||||||||||||
|
|
|
|
|
|
|
|
|
|
|
|
|
|
|
|
|
Current portion of long-term loans and borrowings |
||||||||||||||||
|
|
|
|
|||||||||||||
Total |
||||||||||||||||
|
|
|
|
Long-term loans and borrowings |
December 31, 2021 |
December 31, 2020 |
||||||||||||||
Interest rate, % |
Amounts outstanding |
Interest rate, % |
Amounts outstanding |
|||||||||||||
In Russian rubles |
||||||||||||||||
Banks and financial institutions |
||||||||||||||||
Bonds issue |
— | |||||||||||||||
Corporate lenders |
||||||||||||||||
|
|
|
|
|
|
|
|
|
|
|
|
|
|
|
|
|
In U.S. dollars |
||||||||||||||||
Banks and financial institutions |
||||||||||||||||
In euro |
||||||||||||||||
Banks and financial institutions |
||||||||||||||||
|
|
|
|
|
|
|
|
|
|
|
|
|
|
|
|
|
Current portion of long-term loans and borrowings |
( |
) | ( |
) | ||||||||||||
|
|
|
|
|||||||||||||
Total |
||||||||||||||||
|
|
|
|
Payable by |
||||
On demand |
||||
2022 (current portion) |
||||
2023 |
||||
2024 |
||||
2025 |
||||
2026 |
||||
|
|
|||
Total |
||||
|
|
(a) |
Credit facilities |
(b) |
Bonds |
(c) |
Pledges |
( d ) |
Covenants |
Restrictive covenants |
Requirement |
Actual as of December 31, 2021 |
||||
Group’s Net Debt to Adjusted EBITDA |
Shall not exceed | :1.0:1.0 | ||||
Group’s Total Debt to Adjusted EBITDA |
Shall not exceed | :1.0:1.0 | ||||
Group’s Adjusted EBITDA to Net Interest Expense |
Shall not be less than :1.0 |
:1.0 |
||||
Group’s Adjusted EBITDA to Consolidated Financial Expense |
Shall not be less than :1.0 |
:1.0 |
||||
Group’s Cash flow from operating activities to Adjusted EBITDA |
Shall not be less than | :1.0:1.0 | ||||
Group’s Adjusted EBITDA to Revenue |
Shall not be less than | :1.0:1.0 |
9.2 |
Leases |
Land |
Buildings and constructions |
Machinery and equipment |
Transportation vehicles |
Total |
||||||||||||||||
As of January 1, 2019 |
— |
— |
||||||||||||||||||
Adjustment on initial application of IFRS 16 |
||||||||||||||||||||
Additions as a result of new leases and capitalized leasehold improvements |
||||||||||||||||||||
Depreciation charge |
( |
) | ( |
) | ( |
) | ( |
) | ( |
) | ||||||||||
Effect of modification and changes of estimates in lease contracts |
||||||||||||||||||||
Impairment |
( |
) | — | ( |
) | ( |
) | ( |
) | |||||||||||
Transfer to own property, plant and equipment |
— | — | ( |
) | ( |
) | ( |
) | ||||||||||||
Exchange differences on translation of foreign operations |
( |
) | ( |
) | ( |
) | ( |
) | ( |
) | ||||||||||
|
|
|
|
|
|
|
|
|
|
|||||||||||
As of December 31, 2019 |
||||||||||||||||||||
|
|
|
|
|
|
|
|
|
|
|||||||||||
Additions as a result of new leases and capitalized leasehold improvements |
||||||||||||||||||||
Depreciation charge |
( |
) | ( |
) | ( |
) | ( |
) | ( |
) | ||||||||||
Effect of modification and changes of estimates in lease contracts |
( |
) | ( |
) | ( |
) | ||||||||||||||
Discontinued operations (Note 24) |
( |
) | ( |
) | — | ( |
) | ( |
) | |||||||||||
Impairment |
( |
) | — | ( |
) | ( |
) | ( |
) | |||||||||||
Transfer to own property, plant and equipment |
— | — | ( |
) | ( |
) | ( |
) | ||||||||||||
Exchange differences on translation of foreign operations |
||||||||||||||||||||
|
|
|
|
|
|
|
|
|
|
|||||||||||
As of December 31, 2020 |
||||||||||||||||||||
|
|
|
|
|
|
|
|
|
|
|||||||||||
Additions as a result of new leases and capitalized leasehold improvements |
||||||||||||||||||||
Depreciation charge |
( |
) | ( |
) | ( |
) | ( |
) | ( |
) | ||||||||||
Effect of modification and changes of estimates in lease contracts |
||||||||||||||||||||
Impairment |
( |
) | — | ( |
) | ( |
) | ( |
) | |||||||||||
Transfer to own property, plant and equipment |
— | — | ( |
) | ( |
) | ( |
) | ||||||||||||
Exchange differences on translation of foreign operations |
— | ( |
) | ( |
) | ( |
) | ( |
) | |||||||||||
|
|
|
|
|
|
|
|
|
|
|||||||||||
As of December , 2021 |
||||||||||||||||||||
|
|
|
|
|
|
|
|
|
|
2021 |
2020 |
2019 |
||||||||||
Lease liabilities as of January 1 |
||||||||||||
Adjustment on initial application of IFRS 16 |
— | — | ||||||||||
Additions as a result of new leases |
||||||||||||
Effect of modification and changes of estimates in lease contracts |
( |
) | ||||||||||
Interest expense |
||||||||||||
Lease settlements |
( |
) | ( |
) | ( |
) | ||||||
Discontinued operations (Note 24) |
— | ( |
) | — | ||||||||
Exchange differences on translation of foreign operations |
( |
) | ( |
) | ||||||||
|
|
|
|
|
|
|||||||
Lease liabilities as of December 31 |
||||||||||||
|
|
|
|
|
|
9.3 |
Financial instruments risk management objectives and policies |
Maturity |
||||||||||||||||||||||||||||
On demand |
Within 1 year |
More than 1 year but less than 2 years |
More than 2 years but less than 3 years |
More than 3 years but less than 4 years |
More than 4 years |
Total |
||||||||||||||||||||||
At December 31, 2021 |
||||||||||||||||||||||||||||
Loans and borrowings, including interest payable |
||||||||||||||||||||||||||||
Lease liabilities |
||||||||||||||||||||||||||||
Trade and other payables |
— | — | — | — | ||||||||||||||||||||||||
Other financial liabilities |
||||||||||||||||||||||||||||
Maturity |
||||||||||||||||||||||||||||
On demand |
Within 1 year |
More than 1 year but less than 2 years |
More than 2 years but less than 3 years |
More than 3 years but less than 4 years |
More than 4 years |
Total |
||||||||||||||||||||||
At December 31, 2020 |
||||||||||||||||||||||||||||
Loans and borrowings, including interest payable |
||||||||||||||||||||||||||||
Lease liabilities |
||||||||||||||||||||||||||||
Trade and other payables |
— | — | — | — | ||||||||||||||||||||||||
Other financial liabilities |
— |
December 31, 2021 |
December 31, 2020 |
|||||||
Restricted cash (excluding cash on hand) |
||||||||
Cash deposits (Note 13) |
||||||||
Trade and other receivables |
||||||||
Other financial assets |
||||||||
— Loans issued |
||||||||
— Bonds |
||||||||
|
|
|
|
|||||
Total |
||||||||
|
|
|
|
Assets and liabilities denominated in U.S. dollars |
December 31, 2021 |
December 31, 2020 |
||||||
Current assets |
||||||||
Trade and other receivables |
||||||||
Cash and cash equivalents |
||||||||
Current liabilities |
( |
) |
( |
) | ||||
Loans and borrowings |
( |
) | ( |
) | ||||
Trade and other payables |
( |
) | ( |
) |
Assets and liabilities denominated in euro |
December 31, 2021 |
December 31, 2020 |
||||||
Current assets |
||||||||
Trade and other receivables |
||||||||
Cash and cash equivalents |
||||||||
Non-current liabilities |
( |
) |
( |
) | ||||
Loans and borrowings |
( |
) | ||||||
Lease liabilities |
( |
) | ( |
) | ||||
Current liabilities |
( |
) | ( |
) | ||||
Loans and borrowings |
( |
) | ( |
) | ||||
Trade and other payables |
( |
) | ( |
) | ||||
Lease liabilities |
( |
) | ( |
) |
Change in U.S. dollar to Russian ruble exchange rate |
Effect ((decrease)/ increase) on profit before tax |
Change in Euro to Russian ruble exchange rate |
Effect ((decrease)/ increase) on profit before tax |
|||||||||||||
2019 |
+ |
% | ( |
) | + |
% | ( |
) | ||||||||
- |
% | - |
% | |||||||||||||
2020 |
+ |
% | ( |
) | + |
% | ( |
) | ||||||||
- |
% | - |
% | |||||||||||||
2021 |
+ |
% | ( |
) | + |
% | ( |
) | ||||||||
- |
% | - |
% |
Increase/decrease in the key rate of the Central Bank of Russian Federation (in percentage points) |
Effect ((decrease)/ increase) on profit before tax |
Increase/decrease in LIBOR (in percentage points) |
Effect ((decrease)/ increase) on profit before tax |
Increase/decrease in EURIBOR (in percentage points) |
Effect ((decrease)/ increase) on profit before tax |
|||||||||||||||||||
2019 |
+ |
( |
) | + |
( |
) | + |
( |
) | |||||||||||||||
- |
- |
- |
||||||||||||||||||||||
2020 |
+ |
( |
) | + |
( |
) | + |
( |
) | |||||||||||||||
- |
- |
- |
||||||||||||||||||||||
2021 |
+ |
( |
) | + |
( |
) | + |
( |
) | |||||||||||||||
- |
- |
- |
9.4 |
Other current financial assets |
9.5 |
Other current and non-current financial liabilities |
10. |
Inventories |
December 31, 2021 |
December 31, 2020 |
|||||||
Raw materials |
||||||||
Work in progress |
||||||||
Finished goods and goods for resale |
||||||||
|
|
|
|
|||||
Total inventories at the lower of cost and net realisable value |
||||||||
|
|
|
|
11. |
Trade and other receivables |
December 31, 2021 |
December 31, 2020 |
|||||||
Trade receivables, including from contracts with |
||||||||
— Domestic customers |
||||||||
— Foreign customers |
||||||||
Less allowance for expected credit losses on trade receivables |
( |
) | ( |
) | ||||
|
|
|
|
|||||
Total trade receivables |
||||||||
|
|
|
|
|||||
Other receivables |
||||||||
Less allowance for expected credit losses on other receivables |
( |
) | ( |
) | ||||
|
|
|
|
|||||
Total other receivables |
||||||||
|
|
|
|
|||||
Contract assets from contracts with domestic customers |
||||||||
|
|
|
|
|||||
Total accounts receivable |
||||||||
|
|
|
|
December 31, 2021 |
December 31, 2020 |
|||||||||||||||
Trade receivables |
Expected credit losses |
Trade receivables |
Expected credit losses |
|||||||||||||
Current |
( |
) | ( |
) | ||||||||||||
=<30 days |
( |
) | ( |
) | ||||||||||||
31-60 days |
( |
) | ( |
) | ||||||||||||
61-90 days |
( |
) | ( |
) | ||||||||||||
91-180 days |
( |
) | ( |
) | ||||||||||||
181-365 days |
( |
) | ( |
) | ||||||||||||
>1 year |
( |
) | ( |
) | ||||||||||||
|
|
|
|
|
|
|
|
|||||||||
Total trade receivables |
( |
) |
( |
) | ||||||||||||
|
|
|
|
|
|
|
|
Total |
||||
At January 1, 2019 |
||||
Charge |
||||
Utilised amounts |
( |
) | ||
Exchange rate difference |
( |
) | ||
|
|
|||
At December 31, 2019 |
||||
Charge |
||||
Utilised amounts |
( |
) | ||
Discontinued operations |
( |
) | ||
Exchange rate difference |
||||
|
|
|||
At December 31, 2020 |
||||
Charge |
||||
Utilised amounts |
( |
) | ||
Exchange rate difference |
( |
) | ||
|
|
|||
At December 31, 2021 |
||||
|
|
12. |
Other current and non-current assets |
December 31, 2021 |
December 31, 2020 |
|||||||
Other current assets |
||||||||
Prepayments and advances |
||||||||
Input, recoverable and deferred VAT and other taxes recoverable |
||||||||
Other current assets |
||||||||
|
|
|
|
|||||
Total prepayments and other current assets |
||||||||
|
|
|
|
December 31, 2021 |
December 31, 2020 |
|||||||
Other non-current assets |
||||||||
Deferred assets from sale and lease back |
||||||||
Other non-current assets |
||||||||
|
|
|
|
|||||
Total other non-current assets |
||||||||
|
|
|
|
13. |
Cash and cash equivalents |
December 31, 2021 |
December 31, 2020 |
|||||||
Cash on hand |
||||||||
Cash at banks, including: |
||||||||
— I n Russian rubles |
||||||||
— I n U.S. dollars |
||||||||
— I n euro |
||||||||
— I n other currencies |
||||||||
|
|
|
|
|||||
Total cash and cash equivalents |
||||||||
Less allowance for expected credit losses |
( |
) | ( |
) | ||||
|
|
|
|
|||||
Total cash and cash equivalents, net |
||||||||
|
|
|
|
Loans and borrowings |
Lease liabilities |
Fines and penalties on overdue leases |
Deferred payments for acquisition of assets |
Sale and leaseback transactions |
Put option of Gazprom- bank |
Dividends payable |
||||||||||||||||||||||
At January 1, 2019 |
||||||||||||||||||||||||||||
Cash flows |
( |
) | ( |
) | ( |
) | ( |
) | ( |
) | ||||||||||||||||||
Foreign exchange movement |
( |
) | ( |
) | ( |
) | ||||||||||||||||||||||
New leases |
– | |||||||||||||||||||||||||||
Interest accrued |
– | |||||||||||||||||||||||||||
Effect of restructuring of loans and leases |
( |
) | ( |
) | ||||||||||||||||||||||||
Other changes |
( |
) | ( |
) | ||||||||||||||||||||||||
|
|
|
|
|
|
|
|
|
|
|
|
|
|
|||||||||||||||
At December 31, 2019 |
||||||||||||||||||||||||||||
Cash flows |
( |
) | ( |
) | ( |
) | ( |
) | ||||||||||||||||||||
Foreign exchange movement |
||||||||||||||||||||||||||||
Non-cash offset (Note 9.2) |
( |
) | ||||||||||||||||||||||||||
Gain on sale of the discontinued operations |
( |
) | ( |
) | ( |
) | ( |
) | ||||||||||||||||||||
New leases |
||||||||||||||||||||||||||||
Interest accrued |
||||||||||||||||||||||||||||
Effect of restructuring of loans and leases |
( |
) | ( |
) | ||||||||||||||||||||||||
Other changes |
( |
) | ( |
) | ||||||||||||||||||||||||
|
|
|
|
|
|
|
|
|
|
|
|
|
|
|||||||||||||||
At December 31, 2020 |
||||||||||||||||||||||||||||
Cash flows |
( |
) | ( |
) | ( |
) | ( |
) | ( |
) | ( |
) | ||||||||||||||||
Foreign exchange movement |
( |
) | ( |
) | ||||||||||||||||||||||||
New leases |
||||||||||||||||||||||||||||
Interest accrued |
||||||||||||||||||||||||||||
Effect of restructuring of loans and leases |
( |
) | ( |
) | ||||||||||||||||||||||||
Other changes |
( |
) | ( |
) | ||||||||||||||||||||||||
|
|
|
|
|
|
|
|
|
|
|
|
|
|
|||||||||||||||
At December 31, 2021 |
||||||||||||||||||||||||||||
|
|
|
|
|
|
|
|
|
|
|
|
|
|
14. |
Property, plant and equipment |
Land |
Buildings and constructions |
Machinery and equipment |
Trans- portation vehicles |
Other equipment |
Construction- in-progress |
Mining assets |
Railway Ulak-Elga |
Total |
||||||||||||||||||||||||||||
Cost |
||||||||||||||||||||||||||||||||||||
At January 1, 2019 |
||||||||||||||||||||||||||||||||||||
Transfer to right-of-use |
— | — | ( |
) | ( |
) | — | — | — | — | ( |
) | ||||||||||||||||||||||||
Additions |
— | — | ||||||||||||||||||||||||||||||||||
Change in rehabilitation provision |
— | — | — | — | — | — | ||||||||||||||||||||||||||||||
Transfers |
( |
) | ( |
) | ( |
) | — |
|||||||||||||||||||||||||||||
Transfer to own property, plant and equipment |
— | — | — | — | — | — | ||||||||||||||||||||||||||||||
Disposals |
( |
) | ( |
) | ( |
) | ( |
) | ( |
) | ( |
) | — | — | ( |
) | ||||||||||||||||||||
Exchange differences on translation of foreign operations |
( |
) | ( |
) | ( |
) | ( |
) | ( |
) | ( |
) | — | — | ( |
) | ||||||||||||||||||||
|
|
|
|
|
|
|
|
|
|
|
|
|
|
|
|
|
|
|||||||||||||||||||
At December 31, 2019 |
||||||||||||||||||||||||||||||||||||
Additions |
— | — | ||||||||||||||||||||||||||||||||||
Change in rehabilitation provision |
— | — | — | — | — | — | ||||||||||||||||||||||||||||||
Transfers |
( |
) | — | — |
||||||||||||||||||||||||||||||||
Transfer to own property, plant and equipment |
— | — | — | — | — | — | ||||||||||||||||||||||||||||||
Disposals |
( |
) | ( |
) | ( |
) | ( |
) | ( |
) | ( |
) | ( |
) | — | ( |
) | |||||||||||||||||||
Discontinued operations (Note 24) |
— | ( |
) | ( |
) | ( |
) | ( |
) | ( |
) | ( |
) | ( |
) | ( |
) | |||||||||||||||||||
Exchange differences on translation of foreign operations |
— | — | ||||||||||||||||||||||||||||||||||
|
|
|
|
|
|
|
|
|
|
|
|
|
|
|
|
|
|
|||||||||||||||||||
At December 31, 2020 |
— |
|||||||||||||||||||||||||||||||||||
Additions |
— | — | ||||||||||||||||||||||||||||||||||
Change in rehabilitation provision |
— | ( |
) | — | — | — | — | ( |
) | — | ( |
) | ||||||||||||||||||||||||
Transfers |
— | ( |
) | — | — |
|||||||||||||||||||||||||||||||
Transfer to own property, plant and equipment |
— | — | — | — | — | — | ||||||||||||||||||||||||||||||
Disposals |
( |
) | ( |
) | ( |
) | ( |
) | ( |
) | ( |
) | — | — | ( |
) | ||||||||||||||||||||
Exchange differences on translation of foreign operations |
( |
) | ( |
) | ( |
) | ( |
) | ( |
) | ( |
) | — | — | ( |
) | ||||||||||||||||||||
|
|
|
|
|
|
|
|
|
|
|
|
|
|
|
|
|
|
|||||||||||||||||||
At December 31, 2021 |
— |
|||||||||||||||||||||||||||||||||||
|
|
|
|
|
|
|
|
|
|
|
|
|
|
|
|
|
|
Land |
Buildings and constructions |
Machinery and equipment |
Trans- portation vehicles |
Other equipment |
Construction- in-progress |
Mining assets |
Railway Ulak-Elga |
Total |
||||||||||||||||||||||||||||
Depreciation and impairment |
||||||||||||||||||||||||||||||||||||
At January 1, 2019 |
( |
) |
( |
) |
( |
) |
( |
) |
( |
) |
( |
) |
( |
) |
( |
) |
( |
) | ||||||||||||||||||
Transfer to right-of-use |
— | — | — | — | — | — | ||||||||||||||||||||||||||||||
Depreciation charge |
— | ( |
) | ( |
) | ( |
) | ( |
) | — | ( |
) | ( |
) | ( |
) | ||||||||||||||||||||
Transfers |
— | ( |
) | ( |
) | ( |
) | — | — |
|||||||||||||||||||||||||||
Transfer to own property, plant and equipment |
— | — | ( |
) | ( |
) | — | — | — | — | ( |
) | ||||||||||||||||||||||||
Disposals |
— | — | ||||||||||||||||||||||||||||||||||
Reversal of impairment/ (impairment) |
( |
) | ( |
) | ( |
) | — | |||||||||||||||||||||||||||||
Exchange differences on translation of foreign operations |
— | — | — | |||||||||||||||||||||||||||||||||
|
|
|
|
|
|
|
|
|
|
|
|
|
|
|
|
|
|
|||||||||||||||||||
At December 31, 2019 |
( |
) |
( |
) |
( |
) |
( |
) |
( |
) |
( |
) |
( |
) |
( |
) |
( |
) | ||||||||||||||||||
Depreciation charge |
— | ( |
) | ( |
) | ( |
) | ( |
) | — | ( |
) | ( |
) | ( |
) | ||||||||||||||||||||
Transfers |
— | ( |
) | ( |
) | ( |
) | ( |
) | ( |
) | — | — |
|||||||||||||||||||||||
Transfer to own property, plant and equipment |
— | — | ( |
) | ( |
) | — | — | — | — | ( |
) | ||||||||||||||||||||||||
Disposals |
— | — | ||||||||||||||||||||||||||||||||||
Discontinued operations (Note 24) |
— | — | ||||||||||||||||||||||||||||||||||
Impairment |
— | ( |
) | ( |
) | — | — | ( |
) | ( |
) | — | ( |
) | ||||||||||||||||||||||
Exchange differences on translation of foreign operations |
— | ( |
) | ( |
) | ( |
) | ( |
) | — | ( |
) | — | ( |
) | |||||||||||||||||||||
|
|
|
|
|
|
|
|
|
|
|
|
|
|
|
|
|
|
|||||||||||||||||||
At December 31, 2020 |
( |
) |
( |
) |
( |
) |
( |
) |
( |
) |
( |
) |
( |
) |
( |
) | ||||||||||||||||||||
Depreciation charge |
— | ( |
) | ( |
) | ( |
) | ( |
) | — | ( |
) | — | ( |
) | |||||||||||||||||||||
Transfers |
— | ( |
) | ( |
) | — | ( |
) | — | — | ||||||||||||||||||||||||||
Transfer to own property, plant and equipment |
— | — | ( |
) | ( |
) | — | — | — | — | ( |
) | ||||||||||||||||||||||||
Disposals |
— | — | ||||||||||||||||||||||||||||||||||
(Impairment)/reversal of impairment |
( |
) | ( |
) | ( |
) | — | ( |
) | — | ( |
) | ||||||||||||||||||||||||
Exchange differences on translation of foreign operations |
— | — | — | — | ||||||||||||||||||||||||||||||||
|
|
|
|
|
|
|
|
|
|
|
|
|
|
|
|
|
|
|||||||||||||||||||
At December 31, 2021 |
( |
) |
( |
) |
( |
) |
( |
) |
( |
) |
( |
) |
( |
) |
— |
( |
) | |||||||||||||||||||
|
|
|
|
|
|
|
|
|
|
|
|
|
|
|
|
|
|
|||||||||||||||||||
Net book value |
||||||||||||||||||||||||||||||||||||
At January 1, 2019 |
||||||||||||||||||||||||||||||||||||
|
|
|
|
|
|
|
|
|
|
|
|
|
|
|
|
|
|
|||||||||||||||||||
At December 31, 2019 |
||||||||||||||||||||||||||||||||||||
|
|
|
|
|
|
|
|
|
|
|
|
|
|
|
|
|
|
|||||||||||||||||||
At December 31, 2020 |
— |
|||||||||||||||||||||||||||||||||||
|
|
|
|
|
|
|
|
|
|
|
|
|
|
|
|
|
|
|||||||||||||||||||
At December 31, 2021 |
— |
|||||||||||||||||||||||||||||||||||
|
|
|
|
|
|
|
|
|
|
|
|
|
|
|
|
|
|
15. |
Mineral licenses, goodwill and other intangible assets |
Goodwill |
Mineral licenses |
Licenses and software |
Other intangible assets |
|||||||||||||
Cost |
||||||||||||||||
At January 1, 2019 |
||||||||||||||||
Additions |
— | — | ||||||||||||||
Disposals |
— | — | ( |
) | ( |
) | ||||||||||
Exchange differences on translation of foreign operations |
( |
) | — | ( |
) | |||||||||||
|
|
|
|
|
|
|
|
|||||||||
At December 31, 2019 |
||||||||||||||||
Additions |
— | — | ||||||||||||||
Disposals |
— | ( |
) | ( |
) | ( |
) | |||||||||
Discontinued operations (Note 24) |
— | ( |
) | — | ( |
) | ||||||||||
Exchange differences on translation of foreign operations |
— | |||||||||||||||
|
|
|
|
|
|
|
|
|||||||||
At December 31, 2020 |
||||||||||||||||
Additions |
— | — | ||||||||||||||
Disposals |
— | — | ( |
) | ( |
) | ||||||||||
Exchange differences on translation of foreign operations |
— | ( |
) | |||||||||||||
|
|
|
|
|
|
|
|
|||||||||
At December 31, 2021 |
||||||||||||||||
Amortisation and impairment |
||||||||||||||||
At January 1, 2019 |
( |
) |
( |
) |
( |
) |
( |
) | ||||||||
Impairment |
( |
) | ( |
) | — | — | ||||||||||
Amortisation |
— | ( |
) | ( |
) | ( |
) | |||||||||
Disposals |
— | — | ||||||||||||||
Exchange differences on translation of foreign operations |
— | — | ||||||||||||||
|
|
|
|
|
|
|
|
|||||||||
At December 31, 2019 |
( |
) |
( |
) |
( |
) |
( |
) | ||||||||
Impairmen t |
|
|
( |
) |
|
|
— |
|
|
|
— |
|
|
|
— |
|
Amortisation |
— | ( |
) | ( |
) | ( |
) | |||||||||
Disposals |
— | — | ||||||||||||||
Discontinued operations (Note 24) |
— | — | ||||||||||||||
Exchange differences on translation of foreign operations |
— | — | ( |
( |
||||||||||||
|
|
|
|
|
|
|
|
|||||||||
At December 31, 2020 |
( |
) |
( |
) |
( |
) |
( |
) | ||||||||
Amortisation |
— | ( |
) | ( |
) | ( |
) | |||||||||
Disposals |
— | — | ||||||||||||||
Exchange differences on translation of foreign operations |
— | — | — | |||||||||||||
|
|
|
|
|
|
|
|
|||||||||
At December 31, 2021 |
( |
) |
( |
) |
( |
) |
( |
) | ||||||||
|
|
|
|
|
|
|
|
|||||||||
Net book value |
||||||||||||||||
At January 1, 2019 |
||||||||||||||||
|
|
|
|
|
|
|
|
|||||||||
At December 31, 2019 |
||||||||||||||||
|
|
|
|
|
|
|
|
|||||||||
At December 31, 2020 |
||||||||||||||||
|
|
|
|
|
|
|
|
|||||||||
At December 31, 2021 |
||||||||||||||||
|
|
|
|
|
|
|
|
16. |
Impairment of goodwill and other non-current assets |
Goodwill |
||||||||||||
Cash generating units |
Segment |
December 31, 2021 |
December 31, 2020 |
|||||||||
Yakutugol |
Mining | |||||||||||
KPSC |
Power | |||||||||||
Port Posiet |
Mining | |||||||||||
CMP |
Steel | |||||||||||
SKCC |
Mining | |||||||||||
Port Temryuk |
Mining | |||||||||||
|
|
|
|
|||||||||
Total |
||||||||||||
|
|
|
|
Forecast period, years | ||||||||||
As of December 31, 2020 |
2021 |
2022 |
2023 |
2024 |
2025 | |||||
Inflation rate in Russia |
||||||||||
Inflation rate in European countries |
||||||||||
Pre-tax discount rate, % |
||||||||||
As of December 31, 2021 |
2022 |
2023 |
2024 |
2025 |
2026 | |||||
Inflation rate in Russia |
||||||||||
Inflation rate in European countries |
||||||||||
Pre-tax discount rate, % |
Cash generating units |
Segment |
Product, measurement unit |
Range of sales prices, FCA | |||
CMP | Steel | Rails (Rub, thousand/tn) |
Cash generating units |
Segment |
Product, measurement unit |
Range of sales prices, FCA | |||
CMP | Steel | Rebar (Rub, thousand/tn) | ||||
CMP | Steel | Billets (Rub, thousand/tn) | ||||
USP | Steel | Stampings (Rub, thousand/tn) | ||||
KMP | Mining | Iron ore (Rub, thousand/tn) | ||||
Yakutugol | Mining | Coking coal (Rub, thousand/tn) | ||||
Yakutugol | Mining | Steam coal (Rub, thousand/tn) | ||||
SKCC | Mining | Coking coal (Rub, thousand/tn) | ||||
SKCC | Mining | Anthracite (Rub, thousand/tn) | ||||
SKCC | Mining | Steam coal (Rub, thousand/tn) | ||||
BFP | Steel | Ferrosilicon (Rub, thousand/tn) | ||||
KPSC | Power | Electricity (Rub, thousand/kWh) |
Cash generating units |
Impairment loss on goodwill for the year ended December 31, 2020 |
|||
Yakutugol |
||||
|
|
|||
Total |
||||
|
|
Cash generating units |
Impairment loss on goodwill for the year ended December 31, 2019 |
|||
Yakutugol |
||||
|
|
|||
Total |
||||
|
|
Cash generating units |
Impairment loss on non-current assets identified as a result of impairment tests at December 31, 2021 |
|||
SKPP |
||||
KMP |
||||
Other |
||||
|
|
|||
Total |
||||
|
|
Cash generating units |
Gain from reversal of previously recognised impairment loss on non-current assetsat December 31, 2021 |
|||
BFP |
||||
|
|
|||
Total |
||||
|
|
Cash generating units |
Impairment loss on non-current assets identified as a result of impairment tests at December 31, 2020 |
|||
KMP |
||||
Other |
||||
|
|
|||
Total |
||||
|
|
Cash generating units |
Impairment loss on non-current assets identified as a result of impairment tests at December 31, 2019 |
|||
BFP |
||||
KMP |
||||
|
|
|||
Total |
||||
|
|
Cash generating units |
Gain from reversal of previously recognised impairment loss on non-current assetsat December 31, 2019 |
|||
Izhstal |
||||
|
|
|||
Total |
||||
|
|
17. |
Trade and other payables |
December 31, 2021 |
December 31, 2020 |
|||||||
Trade payables |
||||||||
Wages and salaries payable and other related obligations |
||||||||
Accounts payable for property, plant and equipment |
||||||||
Dividends payable, common shares |
||||||||
Dividends payable, preferred shares |
||||||||
Other payables |
||||||||
|
|
|
|
|||||
Total trade and other payables |
||||||||
|
|
|
|
18. |
Income tax |
Recognised in profit or loss from continuing operations |
2021 |
2020 |
2019 |
|||||||||
Current income tax |
||||||||||||
Current income tax charge |
( |
) | ( |
) | ( |
) | ||||||
Adjustments in respect of income tax, including income tax penalties and changes in uncertain income tax position |
( |
) | ||||||||||
Deferred tax |
||||||||||||
Relating to origination and reversal of temporary differences |
( |
) | ( |
) | ||||||||
|
|
|
|
|
|
|||||||
Income tax expense reported in the consolidated statement of profit or loss and other comprehensive income |
( |
) | ( |
) |
( |
) | ||||||
|
|
|
|
|
|
Notes |
2021 |
2020 |
2019 |
|||||||||||||
Profit (loss) before tax from continuing operations |
( |
) | ||||||||||||||
Loss before tax from discontinued operations |
24 | — | ( |
) | ( |
) | ||||||||||
|
|
|
|
|
|
|||||||||||
Accounting profit (loss) before tax |
( |
) |
||||||||||||||
|
|
|
|
|
|
|||||||||||
Income tax (expense) benefit at statutory income tax rate of |
( |
) | ( |
) | ||||||||||||
Adjustments: |
||||||||||||||||
Adjustments in respect of income tax, including income tax penalties and changes in uncertain income tax position |
( |
) | ||||||||||||||
Change in unrecognized tax losses |
( |
) | ( |
) | ||||||||||||
Non-deductible expenses for tax purposes |
( |
) | ( |
) | ( |
) | ||||||||||
Impairment of goodwill |
— | ( |
) | ( |
) | |||||||||||
Effect of restructuring and expense related to fines and penalties on reach of covenants in credit agreements |
— | ( |
) | — | ||||||||||||
Effect of different tax rates |
( |
) | ( |
) | ||||||||||||
Change in tax rate |
( |
) | ( |
) | ( |
) | ||||||||||
|
|
|
|
|
|
|||||||||||
At the effective income tax rate of |
( |
) | ( |
) |
( |
) | ||||||||||
|
|
|
|
|
|
|||||||||||
Income tax expense reported in the consolidated statement of profit or loss and other comprehensive income from continuing operations |
( |
) | ( |
) | ( |
) | ||||||||||
Income tax attributable to a discontinued operation |
24 | — | ( |
) | ( |
) | ||||||||||
|
|
|
|
|
|
|||||||||||
Total income tax expense |
( |
) | ( |
) |
( |
) | ||||||||||
|
|
|
|
|
|
January 1, 2021 |
Tax (expense) benefit during the period recognised in profit or loss |
Other |
December 31, 2021 |
|||||||||||||
Deferred tax assets |
||||||||||||||||
Property, plant, equipment and right-of-use |
( |
) | — | |||||||||||||
Rehabilitation provision |
( |
) | — | |||||||||||||
Inventories |
— | |||||||||||||||
Trade and other receivables |
— | |||||||||||||||
Loans and borrowings |
— | |||||||||||||||
Lease liabilities |
( |
) | ( |
) | ||||||||||||
Other financial liabilities |
( |
) | — | |||||||||||||
Trade and other payables and other liabilities |
( |
) | ( |
) | ||||||||||||
Accumulated tax losses carry-forwards |
( |
) | ( |
) | ||||||||||||
Other |
( |
) | ||||||||||||||
Deferred tax liabilities |
||||||||||||||||
Property, plant, equipment and right-of-use |
( |
) | ( |
) | ||||||||||||
Mineral licenses |
( |
) | — | ( |
) | |||||||||||
Inventories |
( |
) | ( |
) | — | ( |
) | |||||||||
Trade and other receivables |
( |
) | ( |
) | ( |
) | ||||||||||
Loans and borrowings |
( |
) | — | ( |
) | |||||||||||
Trade and other payables and other liabilities |
( |
) | ( |
) | ( |
) | ( |
) | ||||||||
|
|
|
|
|
|
|
|
|||||||||
Deferred tax assets (liabilities), net |
( |
) |
( |
) |
( |
) | ||||||||||
|
|
|
|
|
|
|
|
January 1, 2020 |
Tax (expense) benefit during the period recognised in profit or loss |
Disposals of subsidiaries |
Other |
December 31, 2020 |
||||||||||||||||
Deferred tax assets |
||||||||||||||||||||
Property, plant, equipment and right-of-use |
( |
) | — | |||||||||||||||||
Rehabilitation provision |
( |
) | — | |||||||||||||||||
Inventories |
( |
) | ( |
) | ||||||||||||||||
Trade and other receivables |
( |
) | — | — | ||||||||||||||||
Loans and borrowings |
( |
) | — | — | ||||||||||||||||
Lease liabilities |
( |
) | ( |
) | ||||||||||||||||
Other financial liabilities |
— | — | — | |||||||||||||||||
Trade and other payables and other liabilities |
( |
) | ||||||||||||||||||
Accumulated tax losses carry-forwards |
( |
) | ( |
) | ||||||||||||||||
Other |
( |
) | ||||||||||||||||||
Deferred tax liabilities |
||||||||||||||||||||
Property, plant, equipment and right-of-use |
( |
) | ( |
) | ( |
) | ||||||||||||||
Mineral licenses |
( |
) | — | ( |
) | |||||||||||||||
Inventories |
( |
) | — | ( |
) | ( |
) | |||||||||||||
Trade and other receivables |
( |
) | — | ( |
) | ( |
) | |||||||||||||
Loans and borrowings |
( |
) | ( |
) | — | — | ( |
) | ||||||||||||
Trade and other payables and other liabilities |
( |
) | ( |
) | ( |
) | ||||||||||||||
|
|
|
|
|
|
|
|
|
|
|||||||||||
Deferred tax assets (liabilities), net |
( |
) |
( |
) |
( |
) | ||||||||||||||
|
|
|
|
|
|
|
|
|
|
January 1, 2019 |
Adjustment on initial application of IFRS 16 |
January 1, 2019 adjusted for the effect of IFRS 16 |
Tax (expense) benefit during the period recognised in profit or loss |
Other |
December 31, 2019 |
|||||||||||||||||||
Deferred tax assets |
||||||||||||||||||||||||
Property, plant, equipment and right-of-use |
( |
) | — | |||||||||||||||||||||
Rehabilitation provision |
— | — | ||||||||||||||||||||||
Inventories |
— | ( |
) | ( |
) | |||||||||||||||||||
Trade and other receivables |
— | ( |
) | ( |
) | |||||||||||||||||||
Loans and borrowings |
— | — | ||||||||||||||||||||||
Lease liabilities |
( |
) | ||||||||||||||||||||||
Trade and other payables and other liabilities |
— | ( |
) | — | ||||||||||||||||||||
Accumulated tax losses carry-forwards |
— | ( |
) | ( |
) | |||||||||||||||||||
Other |
— | ( |
) | |||||||||||||||||||||
Deferred tax liabilities |
||||||||||||||||||||||||
Property, plant, equipment and right-of-use |
( |
) | ( |
) | ( |
) | ( |
) | ( |
) | ||||||||||||||
Mineral licenses |
( |
) | — | ( |
) | — | ( |
) | ||||||||||||||||
Inventories |
( |
) | — | ( |
) | ( |
) | ( |
) | |||||||||||||||
Trade and other receivables |
( |
) | — | ( |
) | ( |
) | ( |
) | |||||||||||||||
Loans and borrowings |
( |
) | — | ( |
) | — | ( |
) | ||||||||||||||||
Trade and other payables and other liabilities |
( |
) | — | ( |
) | ( |
) | ( |
) | |||||||||||||||
|
|
|
|
|
|
|
|
|
|
|
|
|||||||||||||
Deferred tax assets (liabilities), net |
( |
) |
( |
) |
( |
) |
( |
) | ||||||||||||||||
|
|
|
|
|
|
|
|
|
|
|
|
December 31, 2021 |
December 31, 2020 |
|||||||
Deferred tax assets |
||||||||
Deferred tax liabilities |
( |
) | ( |
) | ||||
|
|
|
|
|||||
Deferred tax liabilities, net |
( |
) |
( |
) | ||||
|
|
|
|
Deferred tax (expense) benefit during the period |
2021 |
2020 |
2019 |
|||||||||
Tax benefit (expense) attributable to continuing operation |
( |
) | ( |
) | ||||||||
Tax benefit (expense) attributable to discontinued operation |
— | ( |
) | |||||||||
|
|
|
|
|
|
|||||||
Tax benefit (expense) during the period recognised in profit or loss |
( |
) |
( |
) | ||||||||
|
|
|
|
|
|
19. |
Taxes and similar charges payable other than income tax |
December 31, 2021 |
December 31, 2020 |
|||||||
VAT payable |
||||||||
Payroll taxes |
||||||||
Property tax |
||||||||
Mineral extraction tax |
||||||||
Land tax |
||||||||
Land lease |
||||||||
Other |
||||||||
|
|
|
|
|||||
Total |
||||||||
|
|
|
|
20. |
Pensions and other post-employment and long-term benefit plans |
Defined benefit obligations |
Fair value of plan assets |
Pension obligations |
||||||||||
January 1, 2019 |
( |
) |
( |
) | ||||||||
|
|
|
|
|
|
|||||||
Current service cost |
( |
) | — | ( |
) | |||||||
Net interest expense |
( |
) | ( |
) | ||||||||
Remeasurement of other long-term benefit obligations |
( |
) | — | ( |
) | |||||||
Sub-total included in profit or loss |
( |
) |
( |
) | ||||||||
|
|
|
|
|
|
|||||||
Benefit paid |
( |
) |
||||||||||
|
|
|
|
|
|
|||||||
Exchange difference |
( |
) | ||||||||||
Actuarial changes arising from changes in demographic assumptions |
( |
) | — | ( |
) | |||||||
Actuarial changes arising from changes in financial assumptions |
( |
) | — | ( |
) | |||||||
Experience adjustments |
( |
) | — | ( |
) | |||||||
|
|
|
|
|
|
|||||||
Sub-total included in OCI |
( |
) |
( |
) |
( |
) | ||||||
|
|
|
|
|
|
|||||||
December 31, 2019 |
( |
) |
( |
) | ||||||||
|
|
|
|
|
|
Defined benefit obligations |
Fair value of plan assets |
Pension obligations |
||||||||||
January 1, 2020 |
( |
) |
( |
) | ||||||||
|
|
|
|
|
|
|||||||
Current service cost |
( |
) | — | ( |
) | |||||||
Net interest expense |
( |
) | ( |
) | ||||||||
Remeasurement of other long-term benefit obligations |
— | |||||||||||
Discontinued operations |
— | |||||||||||
Sub-total included in profit or loss |
( |
) |
( |
) | ||||||||
|
|
|
|
|
|
|||||||
Benefit paid |
( |
) |
||||||||||
|
|
|
|
|
|
|||||||
Exchange difference |
( |
) | ( |
) | ||||||||
Actuarial changes arising from changes in financial assumptions |
( |
) | — | ( |
) | |||||||
Experience adjustments |
— | |||||||||||
Discontinued operations |
( |
) | — | ( |
) | |||||||
|
|
|
|
|
|
|||||||
Sub-total included in OCI |
( |
) |
( |
) | ||||||||
|
|
|
|
|
|
|||||||
December 31, 2020 |
( |
) |
( |
) | ||||||||
|
|
|
|
|
|
Defined benefit obligations |
Fair value of plan assets |
Pension obligations |
||||||||||
January 1, 2021 |
( |
) |
( |
) | ||||||||
|
|
|
|
|
|
|||||||
Current service cost |
( |
) | ( |
) | ||||||||
Net interest expense |
( |
) | ( |
) | ||||||||
Remeasurement of other long-term benefit obligations |
||||||||||||
Sub-total included in profit or loss |
( |
) |
( |
) | ||||||||
|
|
|
|
|
|
|||||||
Benefit paid |
( |
) |
||||||||||
|
|
|
|
|
|
|||||||
Exchange difference |
( |
) | ||||||||||
Actuarial changes arising from changes in demographic assumptions |
||||||||||||
Actuarial changes arising from changes in financial assumptions |
||||||||||||
Experience adjustments |
||||||||||||
|
|
|
|
|
|
|||||||
Sub-total included in OCI |
( |
) |
||||||||||
|
|
|
|
|
|
|||||||
December 31, 2021 |
( |
) |
( |
) | ||||||||
|
|
|
|
|
|
December 31, 2021 |
December 31, 2020 |
|||||||
Debt instruments |
||||||||
Equity instruments |
||||||||
Property |
||||||||
Cash and cash equivalents |
||||||||
Other assets |
||||||||
|
|
|
|
|||||
Total plan assets |
||||||||
|
|
|
|
December 31, 2021 |
December 31, 2020 |
|||||||
Discount rate |
||||||||
Russian entities |
% | % | ||||||
German entities |
% | % | ||||||
Austrian entities |
% | % | ||||||
Inflation rates |
||||||||
Russian entities |
% | % | ||||||
Rate of compensation increase |
||||||||
Russian entities |
% | % | ||||||
German entities |
% | % | ||||||
Austrian entities |
% | % |
2021 |
2020 |
|||||||
Discount rate |
||||||||
|
( |
) | ( |
) | ||||
|
||||||||
Inflation rate |
||||||||
|
||||||||
|
( |
) | ( |
) | ||||
Rate of compensation increase |
||||||||
|
||||||||
|
( |
) | ( |
) | ||||
Turnover rate |
||||||||
|
( |
) | ( |
) | ||||
|
2021 |
2020 |
|||||||
Discount rate |
||||||||
|
( |
) |
( |
) | ||||
|
2021 |
2020 |
|||||||
Discount rate |
||||||||
|
( |
) |
( |
) | ||||
|
21. |
Provisions |
Rehabilitation provision |
Provisions for legal claims |
Provisions on taxes other than income tax, fines and penalties |
Other provisions |
Total |
||||||||||||||||
At January 1, 2021 |
||||||||||||||||||||
Arising |
— | |||||||||||||||||||
Utilised |
( |
) | — | ( |
) | ( |
) | |||||||||||||
Revision in estimated cash flow and discount rate change |
( |
) | — | — | — | ( |
) | |||||||||||||
Unused amounts reversed |
— | ( |
) | ( |
) | ( |
) | ( |
) | |||||||||||
Unwinding of discount |
— | — | ||||||||||||||||||
Exchange differences |
— | ( |
) | ( |
) | ( |
) | |||||||||||||
|
|
|
|
|
|
|
|
|
|
|||||||||||
At December 31, 2021 |
||||||||||||||||||||
|
|
|
|
|
|
|
|
|
|
|||||||||||
Current |
||||||||||||||||||||
Non-current |
— |
— |
22. |
Issued capital and reserves |
2021 |
2020 |
2019 |
||||||||||
Earnings per share |
||||||||||||
Weighted average number of common shares |
||||||||||||
Profit for the period attributable to Equity shareholders of Mechel PAO |
||||||||||||
|
|
|
|
|
|
|||||||
Earnings per share (Russian rubles per share) attributable to common equity shareholders — basic and diluted |
||||||||||||
|
|
|
|
|
|
|||||||
Profit (loss) for the period from continuing operations |
( |
) | ||||||||||
Less attributable to non-controlling interests |
||||||||||||
|
|
|
|
|
|
|||||||
Profit (loss) for the period attributable to Equity shareholders of Mechel PAO from continuing operations |
( |
) | ||||||||||
|
|
|
|
|
|
|||||||
Earnings (loss) per share from continuing operations (Russian rubles per share) — basic and diluted |
( |
) |
||||||||||
|
|
|
|
|
|
|||||||
Profit (loss) after tax for the period from discontinued operations |
— | ( |
) | |||||||||
|
|
|
|
|
|
|||||||
Earnings (loss) per share from discontinued operations (Russian rubles per share) — basic and diluted |
— |
( |
) | |||||||||
|
|
|
|
|
|
Shares outstanding |
Fraction of period (days) |
Weighted-average number of shares |
||||||||||
2019 |
||||||||||||
Common shares: January 1 — December 20 |
||||||||||||
Common shares: December 20 — December 23 |
||||||||||||
Common shares: December 23 — December 24 |
||||||||||||
Common shares: December 24 — December 25 |
||||||||||||
Common shares: December 25 — December 26 |
||||||||||||
Common shares: December 26 — December 31 |
||||||||||||
Common shares: December 31 — December 31 |
— | — | ||||||||||
|
|
|
|
|
|
|||||||
Total weighted average shares outstanding during the period |
||||||||||||
|
|
|
|
|
|
|||||||
2020 |
||||||||||||
Common shares: January 1 — September 29 |
||||||||||||
Common shares: September 29 — December 31 |
||||||||||||
|
|
|
|
|
|
|||||||
Total weighted average shares outstanding during the period |
||||||||||||
|
|
|
|
|
|
|||||||
2021 |
||||||||||||
Common shares: January 1 — December 31 |
||||||||||||
|
|
|
|
|
|
|||||||
Total weighted average shares outstanding during the period |
||||||||||||
|
|
|
|
|
|
23. |
Other income/expenses |
23.1 |
Administrative and other operating expenses |
2021 |
2020 |
2019 |
||||||||||
Wages, salaries and social security costs |
||||||||||||
Office and maintenance expenses |
||||||||||||
Audit and consulting services |
||||||||||||
Depreciation |
||||||||||||
Loss on write-off of non-current assets |
||||||||||||
Banking charges and services |
||||||||||||
Provision for legal claims, net |
||||||||||||
Consumables |
||||||||||||
Social expenses |
||||||||||||
Business trips |
||||||||||||
Expense relating to short-term leases (Note 9.2) |
||||||||||||
Write off of trade and other receivables |
— | |||||||||||
Other |
||||||||||||
|
|
|
|
|
|
|||||||
Total |
||||||||||||
|
|
|
|
|
|
23.2 |
Employee benefits expense |
2021 |
2020 |
2019 |
||||||||||
Included in cost of sales |
||||||||||||
Wages and salaries |
||||||||||||
Social security costs |
||||||||||||
Post-employment benefits |
||||||||||||
Included in selling and distribution expenses |
||||||||||||
Wages and salaries |
||||||||||||
Social security costs |
||||||||||||
Included in administrative and other operating expenses |
||||||||||||
Wages and salaries |
||||||||||||
Social security costs |
||||||||||||
|
|
|
|
|
|
|||||||
Total |
||||||||||||
|
|
|
|
|
|
23.3 |
Other operating income |
2021 |
2020 |
2019 |
||||||||||
Write-off of trade and other payables including payables with expired legal term |
— | — | ||||||||||
Curtailment and result of remeasurement of other long-term benefit obligations |
||||||||||||
Rental income |
||||||||||||
Net result from disposal of non-current assets |
||||||||||||
Subsidies received from the governmental authorities as a compensation for operating activities (energy tariffs) |
— | |||||||||||
Income from fines and penalties related to business contracts |
— | |||||||||||
Subsidies received from the governmental authorities to compensate losses of European group companies |
— | — | ||||||||||
Other |
||||||||||||
|
|
|
|
|
|
|||||||
Total |
||||||||||||
|
|
|
|
|
|
23.4 |
Finance income and finance costs |
2021 |
2020 |
2019 |
||||||||||
Effect of restructuring of loans and leases |
||||||||||||
Interest income on other financial assets |
||||||||||||
Income from the discounting of financial instruments |
||||||||||||
|
|
|
|
|
|
|||||||
Total |
||||||||||||
|
|
|
|
|
|
2021 |
2020 |
2019 |
||||||||||
Interest on loans and borrowings |
||||||||||||
Fines and penalties on overdue loans and borrowing payments and overdue interest payments |
||||||||||||
Interest expense on lease liabilities |
||||||||||||
Fines and penalties on overdue leases and trade payables |
||||||||||||
|
|
|
|
|
|
|||||||
Total finance costs related to loans, borrowings and |
||||||||||||
Unwinding of discount on rehabilitation provision |
||||||||||||
Interest expenses under pension liabilities |
||||||||||||
Expenses related to discounting of financial instruments |
||||||||||||
|
|
|
|
|
|
|||||||
Total |
||||||||||||
|
|
|
|
|
|
23.5 |
Other income and other expenses |
2021 |
2020 |
2019 |
||||||||||
Gain on disposal of a subsidiary |
— | — | ||||||||||
Gain on sales and purchases of foreign currencies |
— | |||||||||||
Reversal of unclaimed declared dividends to non-controlling interest upon expiration of limitation period |
— | |||||||||||
Write-off of trade and other payables with expired legal term |
— | |||||||||||
Other income |
||||||||||||
|
|
|
|
|
|
|||||||
Total |
||||||||||||
|
|
|
|
|
|
2021 |
2020 |
2019 |
||||||||||
Loss on sales and purchases of foreign currencies |
— | — | ||||||||||
Other non-operating expenses |
||||||||||||
|
|
|
|
|
|
|||||||
Total |
||||||||||||
|
|
|
|
|
|
24. |
Discontinued operations |
April 21, 2020 |
||||
Consideration paid by the buyer |
||||
Derecognition of put option from Gazprombank |
||||
Net assets disposed of |
( |
) | ||
|
|
|||
Gain on sale of discontinued operations |
||||
|
|
Year ended December 31, |
||||||||
2020 |
2019 |
|||||||
Revenue |
||||||||
Expenses |
( |
) | ( |
) | ||||
Finance costs |
( |
) | ( |
) | ||||
Foreign exchange (loss) gain, net |
( |
) | ||||||
|
|
|
|
|||||
Loss before tax from discontinued operations |
( |
) |
( |
) | ||||
Income tax expense |
( |
) | ( |
) | ||||
|
|
|
|
|||||
Loss after tax from discontinued operations |
( |
) |
( |
) | ||||
Gain on sale of discontinued operations |
— | |||||||
Income tax expense related to sale transaction |
— | — | ||||||
Net gain on sale of discontinued operations |
— | |||||||
|
|
|
|
|||||
Profit (loss) after tax for the period from discontinued operations |
( |
) | ||||||
|
|
|
|
Assets |
April 21, 2020 |
|||
Non-current assets |
||||
Property, plant and equipment |
||||
Right-of-use |
||||
Mineral licenses |
||||
Other non-current assets |
||||
|
|
|||
Total non-current assets |
||||
|
|
|||
Current assets |
||||
Inventories |
||||
Income tax receivables |
||||
Other current assets |
||||
Trade and other receivables |
||||
Cash and cash equivalents |
||||
|
|
|||
Total current assets |
||||
|
|
|||
Total assets |
||||
|
|
Liabilities |
April 21, 2020 |
|||
Non-current liabilities |
||||
Lease liabilities |
||||
Pension obligations |
||||
Provisions |
||||
Deferred tax liabilities |
||||
|
|
|||
Total non-current liabilities |
||||
|
|
|||
Current liabilities |
||||
Loans and borrowings |
||||
Trade and other payables |
||||
Lease liabilities |
||||
Taxes and similar charges payable other than income tax |
||||
Advances received |
||||
Pension obligations |
||||
Provisions |
||||
|
|
|||
Total current liabilities |
||||
|
|
|||
Total liabilities |
||||
|
|
|||
Net assets |
||||
|
|
Year ended December 31, |
||||||||
2020 |
2019 |
|||||||
Operating |
||||||||
Investing |
( |
) | ( |
) | ||||
Financing |
( |
) | ( |
) | ||||
|
|
|
|
|||||
Net cash inflow |
||||||||
|
|
|
|
25. |
Segment information |
• | Steel segment, comprising production and sales of semi-finished steel products, carbon and specialty long products, carbon and stainless flat products, value-added downstream metal products, including forgings, stampings, hardware, rails and ferrosilicon; |
• | Mining segment, comprising production and sales of coal (coking and steam) and middlings, coke and chemical products, and iron ore concentrate, which supplies raw materials to the Steel and Power segments and also sells substantial amounts of raw materials to third parties. The Elga coal complex included in mining segment was recognised as discontinued operation in 2020 (Note 24); |
• | Power segment, comprising generation and sales of electricity and heat power, which supplies electricity and heat power to the Steel and Mining segments and also sells a portion of electricity and heat power to third parties. |
As of December 31, 2021 and for the year then ended |
Mining |
Steel |
Power |
Adjustments and eliminations |
Consolidated |
|||||||||||||||
Revenue from contracts with external customers |
— | |||||||||||||||||||
Inter-segment revenue |
( |
) | — |
|||||||||||||||||
Gross profit |
( |
) | ||||||||||||||||||
Gross margin, % |
— | |||||||||||||||||||
Depreciation and amortisation |
( |
) | ( |
) | ( |
) | — | ( |
) | |||||||||||
Impairment of goodwill and other non-current assets, net |
( |
) | ( |
) | — | ( |
) | |||||||||||||
Operating profit (loss) |
( |
) | ( |
) | ||||||||||||||||
Share of loss of associates, net |
( |
) | — | — | — | ( |
) | |||||||||||||
Finance income |
— | |||||||||||||||||||
Inter-segment finance income |
( |
) | — | |||||||||||||||||
Finance costs |
( |
) | ( |
) | ( |
) | — | ( |
) | |||||||||||
Inter-segment finance costs |
( |
) | ( |
) | ( |
) | — | |||||||||||||
Income tax (expense) benefit |
( |
) | ( |
) | ( |
) | ||||||||||||||
Profit (loss) for the period |
( |
) | ( |
) | ||||||||||||||||
Segment assets |
||||||||||||||||||||
Segment liabilities |
||||||||||||||||||||
Investments in associates |
— | — | — |
As of December 31, 2020 and for the year then ended |
Mining |
Steel |
Power |
Adjustments and eliminations |
Consolidated |
|||||||||||||||
Revenue from contracts with external customers |
— | |||||||||||||||||||
Inter-segment revenue |
( |
) | — |
|||||||||||||||||
Gross profit |
( |
) | ||||||||||||||||||
Gross margin, % |
— | |||||||||||||||||||
Depreciation and amortisation |
( |
) | ( |
) | ( |
) | — | ( |
) | |||||||||||
Impairment of goodwill and other non-current assets, net |
( |
) | ( |
) | ( |
) | — | ( |
) | |||||||||||
Operating profit (loss) |
( |
) | ( |
) | ||||||||||||||||
Share of profit of associates, net |
— | — | — | |||||||||||||||||
Finance income |
— | |||||||||||||||||||
Inter-segment finance income |
( |
) | — |
|||||||||||||||||
Finance costs |
( |
) | ( |
) | ( |
) | — | ( |
) | |||||||||||
Inter-segment finance costs |
( |
) | ( |
) | ( |
) | — |
|||||||||||||
Income tax benefit (expense) |
( |
) | ( |
) | ( |
) | ||||||||||||||
Profit after tax for the period from discontinued operations |
— | — | ( |
) | ||||||||||||||||
Profit (loss) for the period |
( |
) | ( |
) | ( |
) | ||||||||||||||
Segment assets |
( |
) | ||||||||||||||||||
Segment liabilities |
||||||||||||||||||||
Investments in associates |
— | — | — |
As of December 31, 2019 and for the year then ended |
Mining |
Steel |
Power |
Adjustments and eliminations |
Consolidated |
|||||||||||||||
Revenue from contracts with external customers |
— | |||||||||||||||||||
Inter-segment revenue |
( |
) | — |
|||||||||||||||||
Gross profit |
( |
) | ||||||||||||||||||
Gross margin, % |
— | |||||||||||||||||||
Depreciation and amortisation |
( |
) | ( |
) | ( |
) | — | ( |
) | |||||||||||
Impairment of goodwill and other non-current assets, net |
( |
) | — | — | ( |
) | ||||||||||||||
Operating profit (loss) |
( |
) | ||||||||||||||||||
Share of profit of associates, net |
— | — | — | |||||||||||||||||
Finance income |
— | |||||||||||||||||||
Inter-segment finance income |
( |
) | — |
|||||||||||||||||
Finance costs |
( |
) | ( |
) | ( |
) | — | ( |
) | |||||||||||
Inter-segment finance costs |
( |
) | ( |
) | ( |
) | — |
|||||||||||||
Income tax expense |
( |
) | ( |
) | ( |
) | ( |
) | ( |
) | ||||||||||
(Loss) profit after tax for the period from discontinued operations |
( |
) | — | ( |
) | |||||||||||||||
Profit (loss) for the period |
( |
) | ||||||||||||||||||
Segment assets |
||||||||||||||||||||
Segment liabilities |
||||||||||||||||||||
Investments in associates |
— | — | — |
2021 |
2020 |
2019 |
||||||||||
Domestic |
||||||||||||
Russia |
||||||||||||
Other |
||||||||||||
|
|
|
|
|
|
|||||||
Total |
||||||||||||
Export |
||||||||||||
|
|
|
|
|
|
|||||||
Total revenue |
||||||||||||
|
|
|
|
|
|
2021 |
2020 |
20 19 |
||||||||||
Russia |
||||||||||||
Asia |
||||||||||||
Europe, including Turkey |
||||||||||||
CIS |
||||||||||||
Other regions |
||||||||||||
|
|
|
|
|
|
|||||||
Total |
||||||||||||
|
|
|
|
|
|
December 31, 2021 |
December 31, 2020 |
|||||||
Russia |
||||||||
Germany |
||||||||
Austria |
||||||||
Czech Republic |
||||||||
Other |
||||||||
|
|
|
|
|||||
Total |
||||||||
|
|
|
|
2021 |
2020 |
2019 |
||||||||||
Mining segment |
||||||||||||
Coal and middlings |
||||||||||||
Coke and chemical products |
||||||||||||
Iron ore concentrate |
||||||||||||
Other |
||||||||||||
Total |
||||||||||||
Steel segment |
||||||||||||
Long steel products |
||||||||||||
Hardware |
||||||||||||
Flat steel products |
||||||||||||
Forgings and stampings |
||||||||||||
Ferrosilicon |
||||||||||||
Semi-finished steel products |
||||||||||||
Steel pipes |
||||||||||||
Other |
||||||||||||
Total |
||||||||||||
Power segment |
||||||||||||
Electricity |
||||||||||||
Other |
||||||||||||
Total |
||||||||||||
Total revenue |
||||||||||||
26. |
Events after the reporting period |