UNITED STATES SECURITIES AND EXCHANGE COMMISSION
Washington, D.C. 20549
Form 10-K
x | ANNUAL REPORT PURSUANT TO SECTION 13 OR 15(d) OF THE SECURITIES EXCHANGE ACT OF 1934 |
For the fiscal year ended December 31, 2015
or
¨ | TRANSITION REPORT PURSUANT TO SECTION 13 OR 15(d) OF THE SECURITIES EXCHANGE ACT OF 1934 |
For the transition period from to
Commission file number 001-32373
LAS VEGAS SANDS CORP.
(Exact name of registrant as specified in its charter)
Nevada | 27-0099920 | |
(State or other jurisdiction of incorporation or organization) | (IRS Employer Identification No.) | |
3355 Las Vegas Boulevard South Las Vegas, Nevada | 89109 | |
(Address of principal executive offices) | (Zip Code) | |
Registrant’s telephone number, including area code:
(702) 414-1000
Securities registered pursuant to Section 12(b) of the Act:
Title of Each Class | Name of Each Exchange on Which Registered | |
Common Stock ($0.001 par value) | New York Stock Exchange | |
Securities registered pursuant to Section 12(g) of the Act:
None
Indicate by check mark if the registrant is a well-known seasoned issuer, as defined in Rule 405 of the Securities Act. Yes x No ¨
Indicate by check mark if the registrant is not required to file reports pursuant to Section 13 or Section 15(d) of the Act. Yes ¨ No x
Indicate by check mark whether the registrant (1) has filed all reports required to be filed by Section 13 or 15(d) of the Securities Exchange Act of 1934 during the preceding 12 months (or for such shorter period that the registrant was required to file such reports); and (2) has been subject to such filing requirements for the past 90 days. Yes x No ¨
Indicate by check mark whether the registrant has submitted electronically and posted on its corporate Web site, if any, every Interactive Data File required to be submitted and posted pursuant to Rule 405 of Regulation S-T during the preceding 12 months (or for such shorter period that the registrant was required to submit and post such files). Yes x No ¨
Indicate by check mark if disclosure of delinquent filers pursuant to Item 405 of Regulation S-K (§ 229.405 of this chapter) is not contained herein, and will not be contained, to the best of registrant’s knowledge, in definitive proxy or information statements incorporated by reference in Part III of this Form 10-K or any amendment to this Form 10-K. x
Indicate by check mark whether the registrant is a large accelerated filer, an accelerated filer, a non-accelerated filer, or a smaller reporting company. See the definitions of “large accelerated filer,” “accelerated filer” and “smaller reporting company” in Rule 12b-2 of the Exchange Act. (Check one):
Large accelerated filer | x | Accelerated filer | ¨ | |||
Non-Accelerated filer | ¨ (Do not check if a smaller reporting company) | Smaller reporting company | ¨ | |||
Indicate by check mark whether the registrant is a shell company (as defined in Rule 12b-2 of the Act). Yes ¨ No x
As of June 30, 2015, the last business day of the registrant’s most recently completed second fiscal quarter, the aggregate market value of the registrant’s common stock held by non-affiliates of the registrant was $19,152,622,288 based on the closing sale price on that date as reported on the New York Stock Exchange.
The Company had 794,694,494 shares of common stock outstanding as of February 22, 2016.
DOCUMENTS INCORPORATED BY REFERENCE | ||
Description of document | Part of the Form 10-K | |
Portions of the definitive Proxy Statement to be used in connection with the registrant’s 2016 Annual Meeting of Stockholders | Part III (Item 10 through Item 14) | |
1
Las Vegas Sands Corp.
Table of Contents
Page | |||
— | |||
— | |||
— | |||
— | |||
— | |||
— | |||
— | |||
— | |||
— | |||
— | |||
— | |||
— | |||
— | |||
— | |||
— | |||
— | |||
— | |||
— | |||
— | |||
— | |||
2
PART I
ITEM 1. — BUSINESS
Our Company
Las Vegas Sands Corp. (“LVSC,” or together with its subsidiaries “we” or the “Company”) is a Fortune 500 company and the leading global developer of destination properties (integrated resorts) that feature premium accommodations, world-class gaming, entertainment and retail, convention and exhibition facilities, celebrity chef restaurants and other amenities.
We currently own and operate integrated resorts in Asia and the United States. We believe that our geographic diversity, best-in-class properties and convention-based business model provide us with the best platform in the hospitality and gaming industry to continue generating substantial cash flow while simultaneously pursuing new development opportunities. Our unique convention-based marketing strategy allows us to attract business travelers during the slower mid-week periods while leisure travelers occupy our properties during the weekends. Our convention, trade show and meeting facilities combined with the on-site amenities offered at our Macao, Singapore and Las Vegas integrated resort properties provide flexible and expansive space for conventions, trade shows and other meetings.
In addition, our properties are differentiated by our high-end gaming facilities and significant retail offerings. The Paiza Club located at our properties is an important part of our VIP gaming marketing strategy. Our Paiza Clubs are exclusive invitation-only clubs available to our premium players that feature high-end services and amenities, including luxury accommodations, restaurants, lounges and private gaming salons. We also offer players club loyalty programs at our properties, which provide access to rewards, privileges and members-only events. Additionally, we believe that being in the retail mall business and, specifically, owning some of the largest retail properties in Asia will provide meaningful value for us, particularly as the retail market in Asia continues to grow. With the completion of the remaining retail space at Sands Cotai Central, we will own approximately 2.7 million square feet of gross retail space.
Through our 70.1% ownership of Sands China Ltd. (“SCL”), we own and operate a collection of integrated resort properties in the Macao Special Administrative Region (“Macao”) of the People’s Republic of China (“China”). These properties include The Venetian Macao Resort Hotel (“The Venetian Macao”), Sands Cotai Central, the Four Seasons Hotel Macao, Cotai Strip (the “Four Seasons Hotel Macao,” which is managed by Four Seasons Hotels, Inc.) and the Plaza Casino, which we own and operate (together with the Four Seasons Hotel Macao, the “Four Seasons Macao”) and the Sands Macao. We are also constructing The Parisian Macao, our latest integrated resort on Cotai, which is anticipated to open in the second half of 2016, subject to Macao government approval.
In Singapore, we own and operate the iconic Marina Bay Sands, which has become one of Singapore’s major tourist, business and retail destinations since its opening in 2010.
Our properties in the United States include The Venetian Resort Hotel Casino (“The Venetian Las Vegas”) and The Palazzo Resort Hotel Casino (“The Palazzo”), Five-Diamond luxury resorts on the Las Vegas Strip, as well as the Sands Expo and Convention Center (the “Sands Expo Center”) in Las Vegas, Nevada and the Sands Casino Resort Bethlehem (the “Sands Bethlehem”) in Bethlehem, Pennsylvania.
We pride ourselves on being an exemplary employer and an upstanding corporate citizen that helps improve the quality of life for our team members and the communities in which we operate. Through our Sands Cares program and other avenues, we are an active community partner offering assistance to charitable organizations and other worthy causes.
We are also committed to protecting the environment and to being a global leader in sustainable resort development. Through our Sands ECO360° Global Sustainability program, we develop and implement environmental practices for our existing and future resort developments to protect natural resources, offer our team members a safe and healthy work environment and enhance the resort experiences of our guests.
LVSC was incorporated in Nevada in August 2004. Our common stock is traded on the New York Stock Exchange (the “NYSE”) under the symbol “LVS.” Our principal executive office is located at 3355 Las Vegas Boulevard South,
3
Las Vegas, Nevada 89109 and our telephone number at that address is (702) 414-1000. Our website address is www.sands.com. The information on our website is not part of this Annual Report on Form 10-K.
Our Annual Reports on Form 10-K, Quarterly Reports on Form 10-Q, Current Reports on Form 8-K, proxy statements and other Securities and Exchange Commission (“SEC”) filings, and any amendments to those reports and any other filings that we file with or furnish to the SEC under the Securities Exchange Act of 1934 are made available free of charge on our website as soon as reasonably practicable after they are electronically filed with, or furnished to, the SEC and are also available at the SEC’s internet site address at www.sec.gov or in the SEC’s Public Reference Room at 100 F Street, NE, Washington D.C., 20549. Information related to the operation of the SEC’s Public Reference Room may be obtained by calling the SEC at 1-800-SEC-0330.
This Annual Report on Form 10-K contains certain forward-looking statements. See “Item 7 — Management’s Discussion and Analysis of Financial Condition and Results of Operations — Special Note Regarding Forward-Looking Statements.”
Our principal operating and developmental activities occur in three geographic areas: Macao, Singapore and the United States. Management reviews the results of operations for each of its operating segments, which generally are our integrated resort properties. In Macao, our operating segments are: The Venetian Macao; Sands Cotai Central; Four Seasons Macao; Sands Macao; and Other Asia (comprised primarily of our ferry operations and various other operations that are ancillary to our properties in Macao). In Singapore, our operating segment is Marina Bay Sands. In the United States, our operating segments are: The Venetian Las Vegas, which includes the Sands Expo Center; The Palazzo; and Sands Bethlehem. The Venetian Las Vegas and The Palazzo operating segments are managed as a single integrated resort and have been aggregated as one reportable segment (the “Las Vegas Operating Properties”), considering their similar economic characteristics, types of customers, types of services and products, the regulatory business environment of the operations within each segment and our organizational and management reporting structure. Management also reviews construction and development activities for each of its primary projects under development, in addition to its reportable segments noted above. See “Item 7 — Management Discussion and Analysis of Financial Condition and Results of Operations — Development Projects.” Our primary projects under development are The Parisian Macao, the remainder of Sands Cotai Central and the Four Seasons apart-hotel tower in Macao, and our Las Vegas condominium project (which construction currently is suspended) in the United States. For the Company's net revenues, net income and total assets by reportable segment for each of the three years during the period ended December 31, 2015, see “Item 8 — Financial Statements and Supplementary Data — Notes to Consolidated Financial Statements — Note 17 — Segment Information.”
Asia Operations
Macao
The Venetian Macao is the anchor property of our Cotai Strip development and is conveniently located approximately two miles from the Taipa Temporary Ferry Terminal on Macao’s Taipa Island. The Venetian Macao includes approximately 376,000 square feet of gaming space with approximately 635 table games and 1,965 slot machines. The Venetian Macao features a 39-floor luxury hotel tower with over 2,900 elegantly appointed luxury suites and the Shoppes at Venetian, approximately 921,000 square feet of unique retail shopping with more than 340 stores featuring many international brands and home to more than 50 restaurants and food outlets featuring an international assortment of cuisines. In addition, The Venetian Macao has approximately 1.2 million square feet of convention facilities and meeting room space, an 1,800-seat theater, the 15,000-seat CotaiArena that hosts world-class entertainment and sporting events and a Paiza Club.
Sands Cotai Central, which features four hotel towers, is located across the street from The Venetian Macao and Four Seasons Macao and is our largest integrated resort on the Cotai Strip. We opened the first tower under the Conrad and Holiday Inn brands in April 2012, the second and third towers under the Sheraton brand in September 2012 and January 2013, respectively, and a portion of the fourth tower under the St. Regis brand in December 2015. The property includes approximately 370,000 square feet of gaming space with approximately 505 table games and 1,872 slot machines. We are constructing the remainder of the fourth tower, which includes St. Regis-serviced and -branded apart-hotel units. Upon completion, Sands Cotai Central will consist of a 13.7 million-square-foot, 6,400-room integrated
4
resort complex featuring rooms, suites and apart-hotel units, approximately 800,000 square feet of retail, entertainment and dining space, over 550,000 square feet of meeting facilities and a multipurpose theater.
The Four Seasons Macao, which is located adjacent to The Venetian Macao, has approximately 105,000 square feet of gaming space with approximately 98 table games and 144 slot machines at its Plaza Casino. The Four Seasons Macao also has 360 elegantly appointed rooms and suites; several food and beverage offerings; and conference and banquet facilities. The Shoppes at Four Seasons includes approximately 259,000 square feet of retail space and is connected to the Shoppes at Venetian. The Four Seasons Macao also features 19 ultra-exclusive Paiza Mansions, which are individually designed and made available by invitation only.
The Sands Macao, the first U.S. operated Las Vegas-style casino in Macao, is situated near the Macao-Hong Kong Ferry Terminal on a waterfront parcel centrally located between Macao’s Gongbei border gate with China and Macao’s central business district. The Sands Macao includes approximately 216,000 square feet of gaming space with approximately 274 table games and 933 slot machines. The Sands Macao also includes a 289-suite hotel tower, spa facilities, several restaurants and entertainment areas, and a Paiza Club.
We operate the gaming areas within our Macao properties pursuant to a 20-year gaming subconcession that expires in June 2022. See “— Regulation and Licensing — Macao Concession and Our Subconcession.”
Singapore
Marina Bay Sands features approximately 2,600 rooms and suites located in three 55-story hotel towers. Atop the three towers is the Sands SkyPark, an extensive outdoor recreation area with a 150-meter infinity swimming pool and several dining options. The integrated resort offers approximately 160,000 square feet of gaming space with approximately 610 table games and 2,500 slot machines; The Shoppes at Marina Bay Sands, an enclosed retail, dining and entertainment complex with signature restaurants from world-renowned chefs; an event plaza and promenade; and an art/science museum. Marina Bay Sands also includes approximately 1.2 million square feet of meeting and convention space and two state-of-the-art theaters for top Broadway shows, concerts and gala events.
Asia Markets
Macao
Macao is the largest gaming market in the world and the only market in China to offer legalized casino gaming. According to Macao government statistics that are issued publicly on a monthly basis by the Gaming Inspection and Coordination Bureau (commonly referred to as the "DICJ"), annual gaming revenues were $29.0 billion in 2015, a 34.2% decrease compared to 2014.
Despite the recent decrease in gaming revenues, we expect that Macao will return to meaningful long-term growth and the 30.7 million visitors that Macao welcomed in 2015 will continue to increase over time. We believe this growth will be driven by a variety of factors, including the movement of Chinese citizens to urban centers in China, continued growth of the Chinese outbound tourism market, the increased utilization of existing transportation infrastructure, the introduction of new transportation infrastructure and the continued increase in hotel room inventory in Macao and neighboring Hengqin Island. Based on announced plans in Macao, over $13 billion of capital is expected to be invested by concessionaires and subconcessionaires in new resort development projects on Cotai with announced opening dates between 2016 and 2017, including our investment in The Parisian Macao. In total, these new projects will add over 8,000 incremental hotel rooms, along with other non-gaming offerings and gaming capacity. These new resorts should help increase the critical mass on Cotai and further drive Macao’s transformation into a leading business and leisure tourism hub in Asia.
Table games are the dominant form of gaming in Asia, with Baccarat being the most popular game. Despite the softer gaming market in Macao, we continued to enjoy Macao market-leading visitation and we remain focused on driving the high-margin mass market gaming segment, while providing luxury amenities and high service levels to our VIP and premium players. We intend to continue to introduce more modern and popular products that appeal to the Asian marketplace and believe that our high-quality gaming product has enabled us to capture a meaningful share of the overall Macao gaming market across all player segments.
5
Proximity to Major Asian Cities
More than 1.0 billion people are estimated to live within a three-hour flight from Macao and more than 3.0 billion people are estimated to live within a five-hour flight from Macao.
Visitors from Hong Kong, southeast China, Taiwan and other locations in Asia can reach Macao in a relatively short time, using a variety of transportation methods, and visitors from more distant locations in Asia can take advantage of short travel times by air to Zhuhai, Shenzhen, Guangzhou or Hong Kong (followed by a road, ferry or helicopter trip to Macao). In addition, numerous air carriers fly directly into Macao International Airport from many major cities in Asia.
Macao draws a significant number of customers who are visitors or residents of Hong Kong. One of the major methods of transportation to Macao from Hong Kong is the jetfoil ferry service, including our ferry service, CotaiJet. Macao is also accessible from Hong Kong by helicopter. In addition, the bridge linking Hong Kong, Macao and Zhuhai is expected to reduce the travel time between Hong Kong and Macao and is expected to begin a phased opening in 2017.
Competition in Macao
Gaming in Macao is administered by the government through concessions awarded to three different concessionaires and three subconcessionaires, of which we are one. No additional concessions have been granted by the Macao government since 2002; however, if the Macao government were to allow additional gaming operators in Macao through the grant of additional concessions or subconcessions, we would face additional competition.
Sociedade de Jogos de Macau S.A. (“SJM”) holds one of the three concessions and currently operates 17 facilities throughout Macao. Historically, SJM was the only gaming operator in Macao. Many of its gaming facilities are relatively small locations that are offered as amenities in hotels; however, some are large operations, including the Hotel Lisboa and The Grand Lisboa. In February 2014, SJM announced the development of Grand Lisboa Palace, a 2,000-room resort on Cotai that is scheduled to open in 2017.
Wynn Resorts (Macau), S.A. (“Wynn Resorts Macau”), a subsidiary of Wynn Resorts Limited, holds a concession and owns and operates the Wynn Macau and Encore at Wynn Macau, which opened in September 2006 and April 2010, respectively. In May 2012, the Macao government granted a land concession to Wynn Resorts Macau, allowing the casino operator to construct a full scale integrated resort in Cotai. The 1,700-room integrated resort, Wynn Palace, will be located behind the City of Dreams and currently is expected to open in 2016.
In 2006, an affiliate of Publishing and Broadcasting Limited (“PBL”) purchased Wynn Resorts Macau's subconcession right under its gaming concession, which permitted the PBL affiliate to receive a gaming subconcession from the Macao government. In May 2007, the PBL affiliate, Melco Crown Entertainment Limited ("Melco Crown"), opened the Crown Macao, later renamed Altira. In June 2009, Melco Crown opened the City of Dreams, an integrated casino resort located adjacent to our Sands Cotai Central, which includes Crown Towers, Hard Rock and Grand Hyatt hotels. In October 2015, Melco Crown and its joint venture partners opened Studio City, a 1,600-room casino resort on Cotai.
Galaxy Casino Company Limited (“Galaxy”) holds the third concession and has the ability to operate casino properties independent of our subconcession agreement with Galaxy and the Macao government. Galaxy currently operates six casinos in Macao, including StarWorld Hotel, which opened in October 2006, and Galaxy Macau, which is located near The Venetian Macao and opened in May 2011. In May 2015, Galaxy opened the second phase of its Galaxy Macau, which includes approximately 1,250 hotel rooms, as well as additional retail and convention and exhibition facilities.
MGM Grand Paradise Limited, a joint venture between MGM Resorts International and Pansy Ho Chiu-King, obtained a subconcession from SJM in April 2005, allowing the joint venture to conduct gaming operations in Macao. The MGM Grand Macau opened in December 2007 and is located on the Macao Peninsula adjacent to the Wynn Macau. In October 2012, MGM Grand Paradise Limited received a land concession from the Macao government to develop a casino resort in Cotai. MGM Cotai will be located behind Sands Cotai Central and currently is expected to open in the
6
first quarter of 2017. The casino resort is expected to include approximately 1,500 hotel rooms and other non-gaming amenities.
Our Macao operations also face competition from other gaming and resort destinations, both in Asia and globally.
Singapore
Singapore is regarded as having the most developed financial and transportation infrastructure in the Southeast Asia region. Singapore has established itself as a destination for both business and leisure visitors, offering convention and exhibition facilities as well as world-class shopping malls and hotel accommodations. In 2006, after a competitive bid process, the Singapore government awarded two concessions to develop and operate two integrated resorts. We were awarded the concession for the Marina Bay site, which is adjacent to Singapore’s central business district, and Genting International was awarded the second integrated resort site, located on Singapore’s Sentosa Island.
Based on figures released by the Singapore Tourism Board (the “STB”), Singapore welcomed 13.8 million international visitors during the eleven months ended November 30, 2015 (the latest information publicly available at the time of filing), a 0.4% increase compared to the same period in 2014. Tourism receipts are estimated to have reached 23.6 billion Singapore dollars (“SGD,” approximately $16.7 billion at exchange rates in effect on December 31, 2015) in 2014 (the latest information publicly available at the time of filing), a 0.4% increase compared to 2013. The Casino Regulatory Authority (the “CRA”), the gaming regulator in Singapore, does not disclose gaming revenue for the market and thus no official figure exists.
We believe Marina Bay Sands is ideally positioned within Singapore to cater to both business and leisure visitors. The integrated resort is centrally located within a 20-minute drive from Singapore’s Changi International Airport and near the Marina Bay Cruise Center, a deep-water cruise ship terminal, and Bayfront station, a mass rapid transit station. Marina Bay Sands is also located near several entertainment attractions, including the Gardens by the Bay botanical gardens and the Singapore Sports Hub, a sports complex featuring a 55,000-seat National Stadium, which opened in June 2014.
To date, the overall gaming market consists of a balanced contribution from both the VIP and mass gaming segments. Consistent with our experience in Macao, Baccarat is the preferred table game in both the VIP and mass gaming segments. Additionally, contributions from slot machines and from the mass gaming segment, including electronic table games offerings, have enhanced the early growth of the market. As Marina Bay Sands and the Singapore market as a whole continue to mature, we expect to broaden our visitor base to continue to capture visitors from around the world.
Proximity to Major Asian Cities
About 100 airlines operate in Singapore, connecting it to over 320 cities in 80 countries. In 2015, 55.5 million passengers passed through Singapore’s Changi Airport, a 2.5% increase as compared to 2014. The estimated population within a 5-hour flight of Singapore is more than 2.0 billion. Based on figures released by the STB, the largest source markets for visitors to Singapore for 2015 were Indonesia and China. The STB’s methodology for reporting visitor arrivals does not recognize Malaysian citizens entering Singapore by land, although this method of visitation is generally thought to be substantial.
Competition in Singapore
Gaming in Singapore is administered by the government through the award of licenses to two operators, of which we are one. Pursuant to the request for proposals to develop an integrated resort at Marina Bay, Singapore (the “Request for Proposal”), the CRA is required to ensure that there will not be more than two casino licenses during a ten-year exclusive period (the “Exclusivity Period,” that began on March 1, 2007).
Resorts World Sentosa, which is 100% owned by Genting Singapore and located on Sentosa Island, is primarily a family tourist destination connected to Singapore via a 500-meter long vehicular and pedestrian bridge. Apart from the casino, the resort includes six hotels, a Universal Studios theme park, the Marine Life Park, the Maritime Experiential
7
Museum, aquarium, conventions and exhibitions facilities, restaurants, as well as a Malaysian food street, and retail shops.
U.S. Operations
Las Vegas
Our Las Vegas Operating Properties form an integrated resort that includes The Venetian Las Vegas, The Palazzo and the Sands Expo Center.
The Venetian Las Vegas has 4,028 suites situated in a 3,015-suite, 35-story three-winged tower rising above the casino and the adjoining 1,013-suite, 12-story Venezia tower. The casino at The Venetian Las Vegas has approximately 120,000 square feet of gaming space and includes approximately 110 table games and 1,125 slot machines. The Venetian Las Vegas features a variety of amenities for its guests, including a Paiza Club, several theaters and a Canyon Ranch SpaClub.
The Palazzo features modern European ambience and design, and is directly connected to The Venetian Las Vegas and Sands Expo Center. The casino at The Palazzo has approximately 105,000 square feet of gaming space and includes approximately 130 table games and 950 slot machines. The Palazzo has a 50-floor luxury hotel tower with 3,064 suites and includes a Canyon Ranch SpaClub, a Paiza Club and a world-class theater.
The Venetian Las Vegas and The Palazzo feature two enclosed retail, dining and entertainment complexes, currently referred to as the Grand Canal Shoppes. The complex located within The Venetian Las Vegas (previously known as “The Grand Canal Shoppes”) and the complex located within The Palazzo (previously known as “The Shoppes at The Palazzo”) were sold to GGP Limited Partnership (“GGP”) in 2004 and 2008, respectively.
Sands Expo Center is one of the largest overall trade show and convention facilities in the United States (as measured by net leasable square footage), with approximately 1.2 million gross square feet of exhibit and meeting space. We also own an approximately 1.1 million-gross-square-foot meeting and conference facility that links Sands Expo Center to The Venetian Las Vegas and The Palazzo. Together, we offer approximately 2.3 million gross square feet of state-of-the-art exhibition and meeting facilities that can be configured to provide small, mid-size or large meeting rooms and/or accommodate large-scale multi-media events or trade shows.
Pennsylvania
We own and operate the Sands Bethlehem, a gaming, hotel, retail and dining complex located on the site of the historic Bethlehem Steel Works in Bethlehem, Pennsylvania. The Sands Bethlehem features approximately 145,000 square feet of gaming space that includes approximately 180 table games and more than 3,000 slot machines; a 300-room hotel tower; a 150,000-square-foot retail facility (“The Outlets at Sands Bethlehem”); an arts and cultural center; and a 50,000-square foot multipurpose event center.
We own 86% of the economic interest in the gaming, hotel and entertainment portion of Sands Bethlehem through our ownership interest in Sands Bethworks Gaming LLC (“Sands Bethworks Gaming”) and approximately 35% of the economic interest in the retail portion of Sands Bethlehem through our ownership interest in Sands Bethworks Retail LLC (“Sands Bethworks Retail”).
Las Vegas Market
The Las Vegas hotel/casino industry is highly competitive. Hotels on the Las Vegas Strip compete with other hotels on and off the Las Vegas Strip, including hotels in downtown Las Vegas. In addition, there are large projects in Las Vegas currently suspended or in the development stage and when opened may target the same customers as we do. We also compete with casinos located on Native American tribal lands. The proliferation of gaming in California and other areas located in the same region as our Las Vegas Operating Properties could have an adverse effect on our financial condition, results of operations and cash flows. Our Las Vegas Operating Properties also compete, to some extent, with other hotel/casino facilities in Nevada, with hotel/casino and other resort facilities elsewhere in the country and the world, and with internet gaming and state lotteries.
8
In addition, certain states have legalized, and others may legalize, casino gaming in specific areas. The continued proliferation of gaming venues could have a significant and adverse effect on our business. In particular, the legalization of casino gaming in or near major metropolitan areas from which we traditionally attract customers could have a material adverse effect on our business. The current global trend toward liberalization of gaming restrictions and the resulting proliferation of gaming venues could result in a decrease in the number of visitors to our Las Vegas Operating Properties, which could have an adverse effect on our financial condition, results of operations and cash flows. Also, on December 23, 2011, the U.S. Department of Justice (the “DOJ”) released an opinion on the application of the Wire Act to interstate transmission of wire communications, concluding that such communications that did not relate to a “sporting event or contest” fell outside the prohibition of the Wire Act. In concluding as such, the DOJ reversed earlier opinions that the Wire Act was not limited to such communications on sporting events or contests. Those states that permit these distribution channels may also expand the gaming offerings of their lotteries in a manner that could have an adverse effect on our business.
Las Vegas generally competes with trade show and convention facilities located in and around major U.S. cities. Within Las Vegas, the Sands Expo Center competes with the Las Vegas Convention Center (the “LVCC”), which currently has approximately 3.2 million gross square feet of convention and exhibit facilities. In addition to the LVCC, some of our Las Vegas competitors have convention and conference facilities that compete with our Las Vegas Operating Properties.
Competitors of our Las Vegas Operating Properties that can offer a hotel/casino experience that is integrated with substantial trade show and convention, conference and meeting facilities, could have an adverse effect on our competitive advantage in attracting trade show and convention, conference and meeting attendees.
Retail Mall Operations
We own and operate retail malls at our integrated resorts at The Venetian Macao, Four Seasons Macao, Sands Cotai Central, Marina Bay Sands and Sands Bethlehem. Upon completion of the remaining retail space at Sands Cotai Central, we will own approximately 2.7 million square feet of gross retail space. As further described in “Agreements Relating to the Malls in Las Vegas” below, the Grand Canal Shoppes were sold to GGP and are not owned or operated by us. Management believes that being in the retail mall business and, specifically, owning some of the largest retail properties in Asia will provide meaningful value for us, particularly as the retail market in Asia continues to grow.
Our malls are designed to complement our other unique amenities and service offerings provided by our integrated resorts. Our strategy is to seek out desirable tenants that appeal to our customers and provide a wide variety of shopping options. We generate our mall revenue primarily from leases with tenants through base minimum rents, overage rents and reimbursements for common area maintenance ("CAM") and other expenditures. For further information related to the financial performance of our malls, see “Part II — Item 7 — Management’s Discussion and Analysis of Financial Condition and Results of Operations.”
The tables below set forth certain information regarding our mall operations as of December 31, 2015. These tables do not reflect subsequent activity in 2016.
Mall Name | Total GLA(1) | Selected Significant Tenants | |||
Shoppes at Venetian | 780,165(2) | Zara, Swarovski, Vertu, Victoria’s Secret, Tiffany & Co., Uniqlo, Rolex, H&M | |||
Shoppes at Four Seasons | 259,394 | Versace, Brioni, Canali, Gucci, Dior, Armani, Bottega Veneta, Hugo Boss, Dolce & Gabbana | |||
Shoppes at Cotai Central | 331,499(3) | Marks & Spencer, Kid’s Cavern, Zara, Omega, Ralph Lauren, Nike, Chow Tai Fook | |||
The Shoppes at Marina Bay Sands | 644,719(4) | Louis Vuitton, Chanel, BVLGARI, Prada, Gucci, Zara, Burberry, Versace, Dior, Cartier | |||
The Outlets at Sands Bethlehem | 151,029 | Coach, Lenox, Tommy Hilfiger, Nine West, Guess, Under Armour, Puma | |||
(1) | Represents Gross Leasable Area in square feet. |
9
(2) | Excludes approximately 139,000 square feet of space on the fifth floor and 1,500 square feet of space on the third floor currently not on the market for lease. |
(3) | At completion, the Shoppes at Cotai Central will feature up to 600,000 square feet of gross leasable area. |
(4) | Excludes approximately 132,000 square feet of space operated by the Company. |
The following table reflects our tenant representation by category for our mall operations as of December 31, 2015:
Category | Square Feet | % of Square Feet | Representative Tenants | |||||
Fashion (luxury, women’s, men’s, mixed) | 823,804 | 39 | % | Louis Vuitton, Dior, Gucci, Versace, Chanel, Fendi | ||||
Restaurants and lounges | 411,185 | 20 | % | Bambu, Lei Garden, Todai, North, Café Deco | ||||
Multi-Brands | 238,657 | 11 | % | Duty-free shops, The Atrium | ||||
Fashion accessories and footwear | 163,590 | 8 | % | Coach, Salvatore Ferragamo, Tumi, Rimowa | ||||
Jewelry | 149,482 | 7 | % | BVLGARI, Omega, Cartier, Rolex, Tiffany & Co. | ||||
Health and beauty | 123,805 | 6 | % | Sephora, The Body Shop, Sa Sa | ||||
Banks and services | 59,477 | 3 | % | Bank of China, Citibank, ICBC | ||||
Lifestyle, sports and entertainment | 55,110 | 2 | % | Manchester United Experience, Adidas, Ferrari | ||||
Home furnishing and electronics | 38,987 | 2 | % | Samsung, Vertu, Zara Home | ||||
Specialty foods | 24,285 | 1 | % | The Chocolate Shop, Cold Storage Specialty | ||||
Arts and gifts | 13,187 | 1 | % | Emporio di Gondola, Milestone | ||||
Total | 2,101,569 | 100 | % | |||||
Advertising and Marketing
We advertise in many types of media, including television, internet, radio, newspapers, magazines and other out-of-home advertising (e.g., billboards), to promote general market awareness of our properties as unique vacation, business and convention destinations due to our first-class hotels, casinos, retail stores, restaurants and other amenities. We actively engage in direct marketing as allowed in various geographic regions, which is targeted at specific market segments, including the premium slot and table games markets.
Development Projects
We are continuing to develop our properties in Macao and the U.S. We also continue to aggressively pursue new development opportunities globally. See “Part II — Item 7 — Management’s Discussion and Analysis of Financial Condition and Results of Operations — Development Projects.”
Regulation and Licensing
Macao Concession and Our Subconcession
In June 2002, the Macao government granted one of three concessions to operate casinos in Macao to Galaxy. During December 2002, we entered into a subconcession agreement with Galaxy, which was approved by the Macao government. The subconcession agreement allows us to develop and operate certain casino projects in Macao, including Sands Macao, The Venetian Macao, Four Seasons Macao, Sands Cotai Central and The Parisian Macao (once opened), separately from Galaxy. Under the subconcession agreement, we are obligated to operate casino games of chance or games of other forms in Macao. We were also obligated to develop and open The Venetian Macao and a convention center by December 2007, and we were required to invest, or cause to be invested, at least 4.4 billion patacas
10
(approximately $551.2 million at exchange rates in effect on December 31, 2015) in various development projects in Macao by June 2009, which obligations we have fulfilled.
If the Galaxy concession is terminated for any reason, our subconcession will remain in effect. The subconcession may be terminated by agreement between Galaxy and us. Galaxy is not entitled to terminate the subconcession unilaterally; however, the Macao government, with the consent of Galaxy, may terminate the subconcession under certain circumstances. Galaxy has developed, and may continue to develop, hotel and casino projects separately from us.
We are subject to licensing and control under applicable Macao law and are required to be licensed by the Macao gaming authorities to operate a casino. We must pay periodic fees and taxes, and our gaming license is not transferable. We must periodically submit detailed financial and operating reports to the Macao gaming authorities and furnish any other information that the Macao gaming authorities may require. No person may acquire any rights over the shares or assets of Venetian Macau Limited (“VML”), SCL’s wholly owned subsidiary, without first obtaining the approval of the Macao gaming authorities. Similarly, no person may enter into possession of its premises or operate them through a management agreement or any other contract or through step in rights without first obtaining the approval of, and receiving a license from, the Macao gaming authorities. The transfer or creation of encumbrances over ownership of shares representing the share capital of VML or other rights relating to such shares, and any act involving the granting of voting rights or other stockholders’ rights to persons other than the original owners, would require the approval of the Macao government and the subsequent report of such acts and transactions to the Macao gaming authorities.
Our subconcession agreement requires, among other things: (i) approval of the Macao government for transfers of shares in VML, or of any rights over or inherent to such shares, including the grant of voting rights or other stockholder’s rights to persons other than the original owners, as well as for the creation of any charge, lien or encumbrance on such shares; (ii) approval of the Macao government for transfers of shares, or of any rights over such shares, in any of our direct or indirect stockholders, provided that such shares or rights are directly or indirectly equivalent to an amount that is equal to or higher than 5% of VML’s share capital; and (iii) that the Macao government be given notice of the creation of any encumbrance or the grant of voting rights or other stockholder’s rights to persons other than the original owners on shares in any of the direct or indirect stockholders in VML, provided that such shares or rights are equivalent to an amount that is equal to or higher than 5% of VML’s share capital. The requirements in provisions (ii) and (iii) above will not apply, however, to securities listed as tradable on a stock exchange.
The Macao gaming authorities may investigate any individual who has a material relationship to, or material involvement with, us to determine whether our suitability and/or financial capacity is affected by this individual. LVSC and SCL shareholders with 5% or more of the share capital, directors and some of our key employees must apply for and undergo a finding of suitability process and maintain due qualification during the subconcession term, and accept the persistent and long-term inspection and supervision exercised by the Macao government. VML is required to notify the Macao government immediately should VML become aware of any fact that may be material to the appropriate qualification of any shareholder who owns 5% of the share capital, or any officer, director or key employee. Changes in licensed positions must be reported to the Macao gaming authorities, and in addition to their authority to deny an application for a finding of suitability or licensure, the Macao gaming authorities have jurisdiction to disapprove a change in corporate position. If the Macao gaming authorities were to find one of our officers, directors or key employees unsuitable for licensing, we would have to sever all relationships with that person. In addition, the Macao gaming authorities may require us to terminate the employment of any person who refuses to file appropriate applications.
Any person who fails or refuses to apply for a finding of suitability after being ordered to do so by the Macao gaming authorities may be found unsuitable. Any stockholder found unsuitable who holds, directly or indirectly, any beneficial ownership of the common stock of a company incorporated in Macao and registered with the Macao Companies and Moveable Assets Registrar (a “Macao registered corporation”) beyond the period of time prescribed by the Macao gaming authorities may lose their rights to the shares. We will be subject to disciplinary action if, after we receive notice that a person is unsuitable to be a stockholder or to have any other relationship with us, we:
• | pay that person any dividend or interest upon its shares; |
• | allow that person to exercise, directly or indirectly, any voting right conferred through shares held by that person; |
11
• | pay remuneration in any form to that person for services rendered or otherwise; or |
• | fail to pursue all lawful efforts to require that unsuitable person to relinquish its shares. |
The Macao gaming authorities also have the authority to approve all persons owning or controlling the stock of any corporation holding a gaming license.
In addition, the Macao gaming authorities require prior approval for the creation of liens and encumbrances over VML’s assets and restrictions on stock in connection with any financing.
The Macao gaming authorities must give their prior approval to changes in control of VML through a merger, consolidation, stock or asset acquisition, management or consulting agreement or any act or conduct by any person whereby he or she obtains control. Entities seeking to acquire control of a Macao registered corporation must satisfy the Macao gaming authorities concerning a variety of stringent standards prior to assuming control. The Macao Gaming Commission may also require controlling stockholders, officers, directors and other persons having a material relationship or involvement with the entity proposing to acquire control, to be investigated and licensed as part of the approval process of the transaction.
The Macao gaming authorities may consider some management opposition to corporate acquisitions, repurchases of voting securities and corporate defense tactics affecting Macao gaming licensees, and the Macao registered corporations affiliated with such operations, to be injurious to stable and productive corporate gaming.
The Macao gaming authorities also have the power to supervise gaming licensees in order to:
• | assure the financial stability of corporate gaming operators and their affiliates; |
• | preserve the beneficial aspects of conducting business in the corporate form; and |
• | promote a neutral environment for the orderly governance of corporate affairs. |
The subconcession agreement requires the Macao gaming authorities’ prior approval of any recapitalization plan proposed by VML’s Board of Directors. The Chief Executive of Macao could also require VML to increase its share capital if he deemed it necessary.
The Macao government also has the right, after consultation with Galaxy, to unilaterally terminate the subconcession agreement at any time upon the occurrence of specified events of default, including:
• | the operation of gaming without permission or operation of business which does not fall within the business scope of the subconcession; |
• | the suspension of operations of our gaming business in Macao without reasonable grounds for more than seven consecutive days or more than fourteen non-consecutive days within one calendar year; |
• | the unauthorized transfer of all or part of our gaming operations in Macao; |
• | the failure to pay taxes, premiums, levies or other amounts payable to the Macao government; |
• | the failure to resume operations following the temporary assumption of operations by the Macao government; |
• | the repeated failure to comply with decisions of the Macao government; |
• | the failure to provide or supplement the guarantee deposit or the guarantees specified in the subconcession within the prescribed period; |
• | the bankruptcy or insolvency of VML; |
• | fraudulent activity by VML; |
• | serious and repeated violation by VML of the applicable rules for carrying out casino games of chance or games of other forms or the operation of casino games of chance or games of other forms; |
12
• | the grant to any other person of any managing power over VML; or |
• | the failure by a controlling shareholder in VML to dispose of its interest in VML following notice from the gaming authorities of another jurisdiction in which such controlling shareholder is licensed to operate casino games of chance to the effect that such controlling shareholder can no longer own shares in VML. |
In addition, we must comply with various covenants and other provisions under the subconcession, including obligations to:
• | ensure the proper operation and conduct of casino games; |
• | employ people with appropriate qualifications; |
• | operate and conduct casino games of chance in a fair and honest manner without the influence of criminal activities; |
• | safeguard and ensure Macao’s interests in tax revenue from the operation of casinos and other gaming areas; and |
• | maintain a specified level of insurance. |
The subconcession agreement also allows the Macao government to request various changes in the plans and specifications of our Macao properties and to make various other decisions and determinations that may be binding on us. For example, the Macao government has the right to require that we contribute additional capital to our Macao subsidiaries or that we provide certain deposits or other guarantees of performance in any amount determined by the Macao government to be necessary. VML is limited in its ability to raise additional capital by the need to first obtain the approval of the Macao gaming and governmental authorities before raising certain debt or equity.
If our subconcession is terminated in the event of a default, the casinos and gaming-related equipment would be automatically transferred to the Macao government without compensation to us and we would cease to generate any revenues from these operations. In many of these instances, the subconcession agreement does not provide a specific cure period within which any such events may be cured and, instead, we would rely on consultations and negotiations with the Macao government to give us an opportunity to remedy any such default.
The Sands Macao, The Venetian Macao, Four Seasons Macao and Sands Cotai Central are being, and The Parisian Macao will be, operated under our subconcession agreement. This subconcession excludes the following gaming activities: mutual bets, lotteries, raffles, interactive gaming and games of chance or other gaming, betting or gambling activities on ships or planes. Our subconcession is exclusively governed by Macao law. We are subject to the exclusive jurisdiction of the courts of Macao in case of any dispute or conflict relating to our subconcession.
Our subconcession agreement expires on June 26, 2022. Unless our subconcession is extended, on that date, the casinos and gaming-related equipment will automatically be transferred to the Macao government without compensation to us and we will cease to generate any revenues from these operations. Beginning on December 26, 2017, the Macao government may redeem our subconcession by giving us at least one year prior notice and by paying us fair compensation or indemnity. See “Item 1A — Risk Factors — Risks Associated with Our International Operations — We will stop generating any revenues from our Macao gaming operations if we cannot secure an extension of our subconcession in 2022 or if the Macao government exercises its redemption right."
Under our subconcession, we are obligated to pay to the Macao government an annual premium with a fixed portion and a variable portion based on the number and type of gaming tables employed and gaming machines operated by us. The fixed portion of the premium is equal to 30.0 million patacas (approximately $3.8 million at exchange rates in effect on December 31, 2015). The variable portion is equal to 300,000 patacas per gaming table reserved exclusively for certain kinds of games or players, 150,000 patacas per gaming table not so reserved and 1,000 patacas per electrical or mechanical gaming machine, including slot machines (approximately $37,578, $18,789 and $125, respectively, at exchange rates in effect on December 31, 2015), subject to a minimum of 45.0 million patacas (approximately $5.6 million at exchange rates in effect on December 31, 2015). We also have to pay a special gaming tax of 35% of gross gaming revenues and applicable withholding taxes. We must also contribute 4% of our gross gaming revenue to utilities
13
designated by the Macao government, a portion of which must be used for promotion of tourism in Macao. This percentage may be subject to change in the future.
Currently, the gaming tax in Macao is calculated as a percentage of gross gaming revenue; however, unlike Nevada, gross gaming revenue does not include deductions for credit losses. As a result, if we extend credit to our customers in Macao and are unable to collect on the related receivables from them, we have to pay taxes on our winnings from these customers even though we were unable to collect on the related receivables. If the laws are not changed, our business in Macao may not be able to realize the full benefits of extending credit to our customers.
In October 2013, we received an additional 5-year exemption from Macao’s corporate income tax on profits generated by the operation of casino games of chance for the five-year period ending December 31, 2018. In May 2014, we entered into an agreement with the Macao government effective through the end of 2018 that provides for an annual payment of 42.4 million patacas (approximately $5.3 million at exchange rates in effect on December 31, 2015) as a substitution for a 12% tax otherwise due from VML shareholders on dividend distributions. See “Item 1A — Risk Factors — Risks Associated with our International Operations — We are currently not required to pay corporate income taxes on our casino gaming operations in Macao. Additionally, we currently have an agreement with the Macao government that provides for a fixed annual payment that is a substitution for a 12% tax otherwise due from VML’s shareholders on dividends distributed from our Macao gaming operations. These tax arrangements expire at the end of 2018."
Development Agreement with Singapore Tourism Board
On August 23, 2006, our wholly owned subsidiary, Marina Bay Sands Pte. Ltd. (“MBS”), entered into a development agreement, as amended by a supplementary agreement on December 11, 2009 (the “Development Agreement”), with the STB to design, develop, construct and operate the Marina Bay Sands. The Development Agreement includes a concession for MBS to own and operate a casino within the integrated resort. In addition to the casino, the integrated resort includes, among other amenities, a hotel, a retail complex, a convention center and meeting room complex, theaters, restaurants and an art/science museum. MBS is one of two companies that have been awarded a concession to operate a casino in Singapore. Under the Request for Proposal, the Exclusivity Period provides that only two licensees will be granted the right to operate a casino in Singapore during the ten-year period. In connection with entering into the Development Agreement, MBS entered into a 60-year lease with the STB for the parcels underlying the project site and entered into an agreement with the Land Transport Authority of Singapore for the provision of necessary infrastructure for rapid transit systems and road works within and/or outside the project site. During the Exclusivity Period, the Company, which is currently the 100% indirect shareholder of MBS, must continue to be the single largest entity with direct or indirect controlling interest of at least 20% in MBS, unless otherwise approved by the CRA.
The term of the casino concession provided under the Development Agreement is for 30 years commencing from the date the Development Agreement was entered into, or August 23, 2006. In order to renew the casino concession, MBS must give notice to the STB and other relevant authorities in Singapore at least five years before its expiration in August 2036. The Singapore government may terminate the casino concession prior to its expiration in order to serve the best interests of the public, in which event fair compensation will be paid to MBS.
On April 26, 2010, MBS was issued a casino license for a three-year period, which required payment of a license fee of SGD 37.5 million (approximately $26.5 million at exchange rates in effect on December 31, 2015). On April 19, 2013, MBS was granted a license for a further three-year period expiring on April 25, 2016, which required payment of SGD 57.0 million (approximately $40.3 million at exchange rates in effect on December 31, 2015) as part of the renewal process. The license is amortized over its three-year term and is renewable upon submitting a renewal application, paying the applicable fee and meeting the renewal requirements as determined by the CRA. We have filed a renewal application and believe that we meet the renewal requirements as determined by the CRA; however, no assurance can be given that the license renewal will be granted or for what period of time it will be granted.
The Development Agreement contains, among other things, restrictions limiting the use of the leased land to the development and operation of the project, requirements that MBS obtain prior approval from the STB in order to subdivide the hotel and retail components of the project, and prohibitions on any such subdivision during the Exclusivity
14
Period. The Development Agreement also contains provisions relating to the construction of the project and associated deadlines for substantial completion and opening; the location of the casino within the project site and casino licensing issues; insurance requirements; and limitations on MBS’ ability to assign the lease or sub-lease any portion of the land during the Exclusivity Period. In addition, the Development Agreement contains events of default, including, among other things, the failure of MBS to perform its obligations under the Development Agreement and events of bankruptcy or dissolution.
The Development Agreement required MBS to invest at least SGD 3.85 billion (approximately $2.72 billion at exchange rates in effect on December 31, 2015) in the integrated resort, which was to be allocated in specified amounts among the casino, hotel, food and beverage outlets, retail areas, meeting, convention and exhibition facilities, key attractions, entertainment venues and public areas. This minimum investment requirement must be satisfied in full upon the earlier of eight years from the date of the Development Agreement or three years from the issuance of the casino license (issued in April 2010), which obligation has been fulfilled.
MBS was required to complete the construction of the Marina Bay Sands by August 22, 2014, in order to avoid an event of default under the Development Agreement that could result in a forfeiture of the lease for the land parcels underlying the integrated resort. Pursuant to the Development Agreement, MBS was permitted to open Marina Bay Sands in stages and in accordance with an agreed upon schedule. This schedule was met by MBS as confirmed by an audit conducted on behalf of the STB.
Employees whose job duties relate to the operations of the casino are required to be licensed by the relevant authorities in Singapore. MBS also must comply with comprehensive internal control standards or regulations concerning advertising; branch office operations; the location, floor plans and layout of the casino; casino operations including casino related financial transactions and patron disputes, issuance of credit and collection of debt, relationships with and permitted payments to junket operators; security and surveillance; casino access by Singaporeans and non-Singaporeans; compliance functions and the prevention of money laundering; periodic standard and other reports to the CRA; and those relating to social controls including the exclusion of certain persons from the casino.
There is a goods and services tax of 7% imposed on gross gaming revenue and a casino tax of 15% imposed on the gross gaming revenue from the casino after reduction for the amount of goods and services tax, except in the case of gaming by premium players, in which case a casino tax of 5% is imposed on the gross gaming revenue generated from such players after reduction for the amount of the goods and services tax. The tax rates will not be changed for a period of 15 years from March 1, 2007. The casino tax is deductible against the Singapore corporate taxable income of MBS. The provision for bad debts arising from the extension of credit granted to gaming patrons is not deductible against gross gaming revenue when calculating the casino tax, but is deductible for the purposes of calculating corporate income tax and the goods and services tax (subject to the prevailing law). MBS is permitted to extend casino credit to persons who are not Singapore citizens or permanent residents, but is not permitted to extend casino credit to Singapore citizens or permanent residents except to premium players.
The key constraint imposed on the casino under the Development Agreement is the total size of the gaming area, which must not be more than 15,000 square meters (approximately 161,000 square feet). The following are not counted towards the gaming area: back of house facilities, reception, restrooms, food and beverage areas, retail shops, stairs, escalators and lift lobbies leading to the gaming area, aesthetic and decorative displays, performance areas and major aisles. The casino located within Marina Bay Sands may not have more than 2,500 gaming machines, but there is no limit on the number of tables for casino games permitted in the casino.
On January 31, 2013, certain amendments to the Casino Control Act (the “Singapore Act”) became effective. Among the changes introduced by these amendments is a revision of the maximum financial penalty that may be imposed on a casino operator by way of disciplinary action on a number of grounds, including contravention of a provision of the Singapore Act or a condition of the casino license. Under the amended provisions, a casino operator may be subject to a financial penalty, for each ground of disciplinary action, of a sum not exceeding 10% of the annual gross gaming revenue (as defined in the Singapore Act) of the casino operator for the financial year immediately preceding the date the financial penalty is imposed.
The amendments to the Singapore Act also included an introduction of an additional factor to be considered by the CRA in determining future applications and/or renewals for a casino license. Applicants are required to be a suitable
15
person to develop, maintain and promote the integrated resort as a compelling tourist destination that meets prevailing market demand and industry standards and contributes to the tourism industry in Singapore. The Singapore government has established an evaluation panel that will assess applicants and report to the CRA on this aspect of the casino licensing requirements. We believe MBS’ iconic tourist destination in Singapore and the Far East is well-established at this time.
State of Nevada
The ownership and operation of casino gaming facilities in the State of Nevada are subject to the Nevada Gaming Control Act and the regulations promulgated thereunder (collectively, the “Nevada Act”) and various local regulations. Our gaming operations are also subject to the licensing and regulatory control of the Nevada Gaming Commission (the “Nevada Commission”), the Nevada Gaming Control Board (the “Nevada Board”) and the Clark County Liquor and Gaming Licensing Board (the “CCLGLB” and together with the Nevada Commission and the Nevada Board, the “Nevada Gaming Authorities”).
The laws, regulations and supervisory procedures of the Nevada Gaming Authorities are based upon declarations of public policy that are concerned with, among other things:
• | the prevention of unsavory or unsuitable persons from having a direct or indirect involvement with gaming at any time or in any capacity; |
• | the establishment and maintenance of responsible accounting practices and procedures; |
• | the maintenance of effective controls over the financial practices of licensees, including establishing minimum procedures for internal fiscal affairs and the safeguarding of assets and revenues, providing reliable record-keeping and requiring the filing of periodic reports with the Nevada Gaming Authorities; |
• | the prevention of cheating and fraudulent practices; and |
• | the establishment of a source of state and local revenues through taxation and licensing fees. |
Any change in such laws, regulations and procedures could have an adverse effect on our Las Vegas operations.
Las Vegas Sands, LLC (“LVSLLC”) is licensed by the Nevada Gaming Authorities to operate both The Venetian Las Vegas and The Palazzo as a single resort hotel as set forth in the Nevada Act. The gaming license requires the periodic payment of fees and taxes and is not transferable. LVSLLC is also registered as an intermediary company of Venetian Casino Resort, LLC (“VCR”). VCR is licensed as a manufacturer and distributor of gaming devices. LVSLLC and VCR are collectively referred to as the “licensed subsidiaries.” LVSC is registered with the Nevada Commission as a publicly traded corporation (the “registered corporation”). As such, we must periodically submit detailed financial and operating reports to the Nevada Gaming Authorities and furnish any other information that the Nevada Gaming Authorities may require. No person may become a stockholder of, or receive any percentage of the profits from, the licensed subsidiaries without first obtaining licenses and approvals from the Nevada Gaming Authorities. Additionally, the CCLGLB has taken the position that it has the authority to approve all persons owning or controlling the stock of any corporation controlling a gaming licensee. We, and the licensed subsidiaries, possess all state and local government registrations, approvals, permits and licenses required in order for us to engage in gaming activities at The Venetian Las Vegas and The Palazzo.
The Nevada Gaming Authorities may investigate any individual who has a material relationship to or material involvement with us or the licensed subsidiaries to determine whether such individual is suitable or should be licensed as a business associate of a gaming licensee. Officers, directors and certain key employees of the licensed subsidiaries must file applications with the Nevada Gaming Authorities and may be required to be licensed by the Nevada Gaming Authorities. Our officers, directors and key employees who are actively and directly involved in the gaming activities of the licensed subsidiaries may be required to be licensed or found suitable by the Nevada Gaming Authorities.
The Nevada Gaming Authorities may deny an application for licensing or a finding of suitability for any cause they deem reasonable. A finding of suitability is comparable to licensing; both require submission of detailed personal and financial information followed by a thorough investigation. The applicant for licensing or a finding of suitability, or the gaming licensee by whom the applicant is employed or for whom the applicant serves, must pay all the costs of
16
the investigation. Changes in licensed positions must be reported to the Nevada Gaming Authorities, and in addition to their authority to deny an application for a finding of suitability or licensure, the Nevada Gaming Authorities have jurisdiction to disapprove a change in a corporate position.
If the Nevada Gaming Authorities were to find an officer, director or key employee unsuitable for licensing or to have an inappropriate relationship with us or the licensed subsidiaries, we would have to sever all relationships with such person. In addition, the Nevada Commission may require us or the licensed subsidiaries to terminate the employment of any person who refuses to file appropriate applications. Determinations of suitability or questions pertaining to licensing are not subject to judicial review in Nevada.
We, and the licensed subsidiaries, are required to submit periodic detailed financial and operating reports to the Nevada Commission. Substantially all of our and our licensed subsidiaries’ material loans, leases, sales of securities and similar financing transactions must be reported to or approved by the Nevada Commission.
If it were determined that we or a licensed subsidiary violated the Nevada Act, the registration and gaming licenses we then hold could be limited, conditioned, suspended or revoked, subject to compliance with certain statutory and regulatory procedures. In addition, we and the persons involved could be subject to substantial fines for each separate violation of the Nevada Act at the discretion of the Nevada Commission. Further, a supervisor could be appointed by the Nevada Commission to operate the casinos, and, under certain circumstances, earnings generated during the supervisor’s appointment (except for the reasonable rental value of the casinos) could be forfeited to the State of Nevada. Limitation, conditioning or suspension of any gaming registration or license or the appointment of a supervisor could (and revocation of any gaming license would) have a material adverse effect on our gaming operations.
Any beneficial holder of our voting securities, regardless of the number of shares owned, may be required to file an application, be investigated, and have its suitability as a beneficial holder of our voting securities determined if the Nevada Commission has reason to believe that such ownership would otherwise be inconsistent with the declared policies of the State of Nevada. The applicant must pay all costs of investigation incurred by the Nevada Gaming Authorities in conducting any such investigation.
The Nevada Act requires any person who acquires more than 5% of our voting securities to report the acquisition to the Chairman of the Nevada Board. The Nevada Act requires that beneficial owners of more than 10% of our voting securities apply to the Nevada Commission for a finding of suitability within thirty days after the Chairman of the Nevada Board mails the written notice requiring such filing. Under certain circumstances, an “institutional investor” as defined in the Nevada Act, which acquires more than 10%, but not more than 25%, of our voting securities (subject to certain additional holdings as a result of certain debt restructurings), may apply to the Nevada Commission for a waiver of such finding of suitability if such institutional investor holds the voting securities only for investment purposes. Additionally, an institutional investor that has been granted such a waiver may acquire more than 25% but not more than 29% of our voting securities if such additional ownership results from a stock re-purchase program and such institutional investor does not purchase or otherwise acquire any additional voting securities that would result in an increase in its ownership percentage.
An institutional investor will be deemed to hold voting securities only for investment purposes if it acquires and holds the voting securities in the ordinary course of business as an institutional investment and not for the purpose of causing, directly or indirectly, the election of a majority of the members of our Board of Directors, any change in our corporate charter, by-laws, management, policies or our operations or any of our gaming affiliates, or any other action that the Nevada Commission finds to be inconsistent with holding our voting securities only for investment purposes. Activities that are deemed consistent with holding voting securities only for investment purposes include:
• | voting on all matters voted on by stockholders; |
• | making financial and other inquiries of management of the type normally made by securities analysts for informational purposes and not to cause a change in management, policies or operations; and |
• | such other activities as the Nevada Commission may determine to be consistent with such investment intent. |
17
If the beneficial holder of voting securities who must be found suitable is a corporation, partnership or trust, it must submit detailed business and financial information including a list of beneficial owners. The applicant is required to pay all costs of investigation.
Any person who fails or refuses to apply for a finding of suitability or a license within thirty days after being ordered to do so by the Nevada Commission or the Chairman of the Nevada Board may be found unsuitable. The same restrictions apply to a record owner if the record owner, after request, fails to identify the beneficial owner. Any stockholder found unsuitable who holds, directly or indirectly, any beneficial ownership of the common stock of a registered corporation beyond such period of time as may be prescribed by the Nevada Commission may be guilty of a criminal offense. We are subject to disciplinary action if, after we receive notice that a person is unsuitable to be a stockholder or to have any other relationship with us or a licensed subsidiary, we, or any of the licensed subsidiaries:
• | allow that person to exercise, directly or indirectly, any voting right conferred through securities held by that person; |
• | pay remuneration in any form to that person for services rendered or otherwise; or |
• | fail to pursue all lawful efforts to require such unsuitable person to relinquish his or her voting securities including, if necessary, the purchase for cash at fair market value. |
Our charter documents include provisions intended to help us comply with these requirements.
The Nevada Commission may, in its discretion, require the holder of any debt security of a registered corporation to file an application, be investigated and be found suitable to own the debt security of such registered corporation. If the Nevada Commission determines that a person is unsuitable to own such security, then pursuant to the Nevada Act, the registered corporation can be sanctioned, including the loss of its approvals, if without the prior approval of the Nevada Commission, it:
• | pays to the unsuitable person any dividend, interest, or any distribution whatsoever; |
• | recognizes any voting right by such unsuitable person in connection with such securities; or |
• | pays the unsuitable person remuneration in any form. |
We are required to maintain a current stock ledger in Nevada that may be examined by the Nevada Gaming Authorities at any time. If any securities are held in trust by an agent or by a nominee, the record holder may be required to disclose the identity of the beneficial owner to the Nevada Gaming Authorities and we are also required to disclose the identity of the beneficial owner to the Nevada Gaming Authorities. A failure to make such disclosure may be grounds for finding the record holder unsuitable. We are also required to render maximum assistance in determining the identity of the beneficial owner.
We cannot make a public offering of any securities without the prior approval of the Nevada Commission if the securities or the proceeds from the offering are intended to be used to construct, acquire or finance gaming facilities in Nevada, or to retire or extend obligations incurred for such purposes. On November 19, 2015, the Nevada Commission granted us prior approval to make public offerings for a period of three years, subject to certain conditions (the “shelf approval”). The shelf approval, however, may be rescinded for good cause without prior notice upon the issuance of an interlocutory stop order by the Chairman of the Nevada Board. The shelf approval does not constitute a finding, recommendation, or approval by the Nevada Commission or the Nevada Board as to the investment merits of any securities offered under the shelf approval. Any representation to the contrary is unlawful.
Changes in our control through a merger, consolidation, stock or asset acquisition, management or consulting agreement, or any act or conduct by any person whereby he or she obtains control, shall not occur without the prior approval of the Nevada Commission. Entities seeking to acquire control of a registered corporation must satisfy the Nevada Board and the Nevada Commission concerning a variety of stringent standards prior to assuming control of such registered corporation. The Nevada Commission may also require controlling stockholders, officers, directors and other persons having a material relationship or involvement with the entity proposing to acquire control, to be investigated and licensed as part of the approval process of the transaction.
18
The Nevada legislature has declared that some corporate acquisitions opposed by management, repurchases of voting securities and corporate defense tactics affecting Nevada gaming licensees, and registered corporations that are affiliated with those operations, may be injurious to stable and productive corporate gaming. The Nevada Commission has established a regulatory scheme to ameliorate the potentially adverse effects of these business practices upon Nevada’s gaming industry and to further Nevada’s policy to:
• | assure the financial stability of corporate gaming operators and their affiliates; |
• | preserve the beneficial aspects of conducting business in the corporate form; and |
• | promote a neutral environment for the orderly governance of corporate affairs. |
Approvals are, in certain circumstances, required from the Nevada Commission before we can make exceptional repurchases of voting securities above the current market price thereof and before a corporate acquisition opposed by management can be consummated.
The Nevada Act also requires prior approval of a plan of recapitalization proposed by the Board of Directors in response to a tender offer made directly to our stockholders for the purposes of acquiring control of the registered corporation.
License fees and taxes, computed in various ways depending upon the type of gaming or activity involved, are payable to the State of Nevada and to Clark County, Nevada. Depending upon the particular fee or tax involved, these fees and taxes are payable monthly, quarterly or annually and are based upon:
• | a percentage of the gross revenues received; |
• | the number of gaming devices operated; or |
• | the number of table games operated. |
The tax on gross revenues received is generally 6.75% for the State of Nevada and 0.55% for Clark County. In addition, an excise tax is paid by us on charges for admission to any facility where certain forms of live entertainment are provided. VCR is also required to pay certain fees and taxes to the State of Nevada as a licensed manufacturer and distributor.
Any person who is licensed, required to be licensed, registered, required to be registered, or under common control with such persons (collectively, “licensees”), and who proposes to become involved in a gaming operation outside of Nevada, is required to deposit with the Nevada Board, and thereafter maintain, a revolving fund in the amount of $10,000 to pay the expenses of any investigation by the Nevada Board into their participation in such foreign gaming operation. The revolving fund is subject to increase or decrease at the discretion of the Nevada Commission. Thereafter, licensees are also required to comply with certain reporting requirements imposed by the Nevada Act. Licensees are also subject to disciplinary action by the Nevada Commission if they knowingly violate any laws of any foreign jurisdiction pertaining to such foreign gaming operation, fail to conduct such foreign gaming operation in accordance with the standards of honesty and integrity required of Nevada gaming operations, engage in activities that are harmful to the State of Nevada or its ability to collect gaming taxes and fees, or employ a person in such foreign operation who has been denied a license or a finding of suitability in Nevada on the ground of personal unsuitability or who has been found guilty of cheating at gambling.
The sale of alcoholic beverages by the licensed subsidiaries on the casino premises and at the Sands Expo Center is subject to licensing, control and regulation by the applicable local authorities. Our licensed subsidiaries have obtained the necessary liquor licenses to sell alcoholic beverages. All licenses are revocable and are not transferable. The agencies involved have full power to limit, condition, suspend or revoke any such licenses, and any such disciplinary action could (and revocation of such licenses would) have a material adverse effect on our operations.
19
Commonwealth of Pennsylvania
Sands Bethworks Gaming is subject to the rules and regulations promulgated by the Pennsylvania Gaming Control Board (“PaGCB”) and the Pennsylvania Department of Revenue, the on-site direction of the Pennsylvania State Police and the requirements of other agencies.
On December 20, 2006, we were awarded one of two Category 2 “at large” gaming licenses available in Pennsylvania. A location in the Pocono Mountains was awarded the other Category 2 “at large” license. On the same day, two Category 2 licenses were awarded to applicants for locations in Philadelphia, a Category 2 license was awarded to an applicant in Pittsburgh, and six race tracks were awarded Category 1 licenses. One of the Philadelphia Category 2 licenses was revoked by the PaGCB in December 2010. The revocation was upheld in November 2011 by an intermediate appellate court in Pennsylvania and became final in March 2012 when the Pennsylvania Supreme Court denied a discretionary appeal from the intermediate appellate court’s ruling. On November 18, 2014, the PaGCB granted the application for licensure of the second Pennsylvania Category 2 licensee to Stadium Casino, LLC. The award of the license to Stadium Casino, LLC, through a contest with three other applicants, has been appealed to the Pennsylvania Supreme Court. A final resolution is expected in 2016.
The principal difference between Category 1 and Category 2 licenses is that the former is available only to certain race tracks. A Category 1 or Category 2 licensee is authorized to open with up to 3,000 slot machines and to increase to up to 5,000 slot machines upon approval of the PaGCB, which may not take effect earlier than six months after opening. The PaGCB also is permitted to award three Category 3 licenses. A Category 3 licensee is authorized to operate up to 600 slot machines and 50 table games or up to 500 slot machines without table games. To date, two Category 3 licenses have been awarded: the Valley Forge Convention Center in suburban Philadelphia and the Nemacolin Woodlands Resort in Fayette County, Pennsylvania. An additional Category 3 license may be issued, but not before July 2017, following a formal application process.
In July 2007, we paid a $50.0 million licensing fee to the Commonwealth of Pennsylvania and, in August 2007, were issued our gaming license by the PaGCB. Just prior to the opening of the casino at Sands Bethlehem, we were required to make a deposit of $5.0 million, which was reduced to $1.5 million in January 2010 when the law was amended, to cover weekly withdrawals of our share of the cost of regulation and the amount withdrawn must be replenished weekly.
In February 2010, we submitted a petition to the PaGCB to obtain a table games operation certificate to operate table games at Sands Bethlehem, based on a revision to the law in 2010 that authorized table games. The petition was approved in April 2010, we paid a $16.5 million table game licensing fee in May 2010 and were issued a table games certificate in June 2010. Table games operations commenced on July 18, 2010.
We must notify the PaGCB if we become aware of any proposed or contemplated change of control including more than 5% of the ownership interests of Sands Bethworks Gaming or of more than 5% of the ownership interests of any entity that owns, directly or indirectly, at least 20% of Sands Bethworks Gaming, including LVSC. The acquisition by a person or a group of persons acting in concert of more than 20% of the ownership interests of Sands Bethworks Gaming or of any entity that owns, directly or indirectly, at least 20% of Sands Bethworks Gaming, with the exception of the ownership interest of a person at the time of the original licensure when the license fee was paid, would be defined as a change of control under applicable Pennsylvania gaming law and regulations. Upon a change of control, the acquirer of the ownership interests would be required to qualify for licensure and to pay a new license fee of $50.0 million or a lesser “change of control” fee as determined by the PaGCB. In December 2007, the PaGCB adopted a $2.5 million fee to be assessed on an acquirer in connection with a change in control unless special circumstances dictate otherwise. The PaGCB retains the discretion to eliminate the need for qualification and may reduce the license fee upon a change of control. The PaGCB may provide up to 120 days for any person who is required to apply for a license and who is found not qualified to completely divest the person’s ownership interest.
Any person who acquires beneficial ownership of 5% or more of our voting securities will be required to apply to the PaGCB for licensure, obtain licensure and remain licensed. Licensure requires, among other things, that the applicant establish by clear and convincing evidence the applicant’s good character, honesty and integrity. Additionally, any trust that holds 5% or more of our voting securities is required to be licensed by the PaGCB and each individual who is a grantor, trustee or beneficiary of the trust is also required to be licensed by the PaGCB. Under certain
20
circumstances and under the regulations of the PaGCB, an “institutional investor” as defined under the regulations of the PaGCB, which acquires beneficial ownership of 5% or more, but less than 10%, of our voting securities, may not be required to be licensed by the PaGCB provided the institutional investor files an Institutional Notice of Ownership Form with the PaGCB Bureau of Licensing and has filed, and remains eligible to file, a statement of beneficial ownership on Schedule 13G with the SEC as a result of this ownership interest. In addition, any beneficial owner of our voting securities, regardless of the number of shares beneficially owned, may be required at the discretion of the PaGCB to file an application for licensure.
In the event a security holder is required to be found qualified and is not found qualified, the security holder may be required by the PaGCB to divest of the interest at a price not exceeding the cost of the interest.
Employees
We directly employ approximately 46,500 employees worldwide and hire temporary employees on an as-needed basis. Our employees are not covered by collective bargaining agreements, except as discussed below with respect to certain Sands Expo Center and Sands Bethlehem employees. We believe that we have good relations with our employees.
Certain unions have engaged in confrontational and obstructive tactics at some of our properties, including contacting potential customers, tenants and investors, objecting to various administrative approvals and picketing, and may continue these tactics in the future. Although we believe we will be able to operate despite such tactics, no assurance can be given that we will be able to do so or that the failure to do so would not have a material adverse effect on our financial condition, results of operations and cash flows. Although no assurances can be given, if employees decide to be represented by labor unions, management does not believe that such representation would have a material effect on our financial condition, results of operations and cash flows.
Certain culinary personnel are hired from time to time for trade shows and conventions at Sands Expo Center and are covered under a collective bargaining agreement between Local 226 and Sands Expo Center. This collective bargaining agreement expired in December 2000, but automatically renews on an annual basis. As a result, Sands Expo Center is operating under the terms of the expired bargaining agreement with respect to these employees.
Security officers at Sands Bethlehem recently voted to be represented by a labor union, the International Union, Security, Police, and Fire Professionals of America. We are currently negotiating a first collective bargaining agreement with the union and are hopeful that we will be able to reach agreement without any labor actions; however, the possibility of a disruption is always present in such circumstances.
Intellectual Property
Our intellectual property (“IP”) portfolio currently consists of copyrights, domain names and domain name system configurations, patents, trade secrets, trademarks, service marks and trade names. We believe that the name recognition, brand identification and image that we have developed through our intellectual properties attract customers to our facilities, drive customer loyalty and contribute to our success. We register and protect our intellectual property in the jurisdictions in which we operate or significantly advertise, as well as in countries in which we may operate in the future.
Agreements Relating to the Malls in Las Vegas
The Grand Canal Shoppes
In May 2004, we completed the sale of The Grand Canal Shoppes and leased to GGP 19 retail and restaurant spaces on the casino level of The Venetian Las Vegas for 89 years with annual rent of one dollar, and GGP assumed our interest as landlord under the various leases associated with these 19 spaces. In addition, we agreed with GGP to:
• | continue to be obligated to fulfill certain lease termination and asset purchase agreements; |
• | lease the portion of the theater space located within The Grand Canal Shoppes from GGP for a period of 25 years, subject to an additional 50 years of extension options, with initial fixed minimum rent of $3.3 million per year; |
21
• | lease the gondola retail store and the canal space located within The Grand Canal Shoppes from GGP (and by amendment the extension of the canal space extended into The Shoppes at The Palazzo) for a period of 25 years, subject to an additional 50 years of extension options, with initial fixed minimum rent of $3.5 million per year; and |
• | lease certain office space from GGP for a period of 10 years, subject to an additional 65 years of extension options, with initial annual rent of approximately $0.9 million. |
The lease payments relating to the theater, the canal space within The Grand Canal Shoppes and the office space from GGP are subject to automatic increases of 5% in the sixth lease year and each subsequent fifth lease year.
The Shoppes at The Palazzo
We contracted to sell The Shoppes at The Palazzo to GGP pursuant to a purchase and sale agreement dated as of April 12, 2004, as amended (the “Amended Agreement”). Under the Amended Agreement, we also leased to GGP certain restaurant and retail space on the casino level of The Palazzo for 89 years with annual rent of one dollar and GGP assumed our interest as landlord under the various space leases associated with these spaces. On June 24, 2011, we reached a settlement with GGP regarding the final purchase price. Under the terms of the settlement, we retained the $295.4 million of proceeds previously received and participate in certain potential future revenues earned by GGP.
Cooperation Agreement
Our business plan calls for each of The Venetian Las Vegas, The Palazzo, Sands Expo Center and the Grand Canal Shoppes, though separately owned, to be integrally related components of one facility (the “LV Integrated Resort”). In establishing the terms for the integrated operation of these components, the cooperation agreement sets forth agreements regarding, among other things, encroachments, easements, operating standards, maintenance requirements, insurance requirements, casualty and condemnation, joint marketing, and the sharing of some facilities and related costs. Subject to applicable law, the cooperation agreement binds all current and future owners of all portions of the LV Integrated Resort and has priority over the liens securing LVSLLC’s senior secured credit facility and in some or all respects any liens that may secure any indebtedness of the owners of any portion of the LV Integrated Resort. Accordingly, subject to applicable law, the obligations in the cooperation agreement will “run with the land” if any of the components change hands.
Operating Covenants. The cooperation agreement regulates certain aspects of the operation of the LV Integrated Resort. For example, under the cooperation agreement, we are obligated to operate The Venetian Las Vegas continuously and to use it exclusively in accordance with standards of first-class Las Vegas Boulevard-style hotels and casinos. We are also obligated to operate and use the Sands Expo Center exclusively in accordance with standards of first-class convention, trade show and exposition centers. The owners of the Grand Canal Shoppes are obligated to operate their property exclusively in accordance with standards of first-class restaurant and retail complexes. For so long as The Venetian Las Vegas is operated in accordance with a “Venetian” theme, the owner of the Grand Canal Shoppes must operate The Grand Canal Shoppes in accordance with the overall Venetian theme.
Maintenance and Repair. We must maintain The Venetian Las Vegas and The Palazzo as well as some common areas and common facilities that are to be shared with the Grand Canal Shoppes. The cost of maintenance of all shared common areas and common facilities is to be shared between us and the owners of the Grand Canal Shoppes. We must also maintain, repair and restore Sands Expo Center and certain common areas and common facilities located in Sands Expo Center. The owners of the Grand Canal Shoppes must maintain, repair and restore the Grand Canal Shoppes and certain common areas and common facilities located within.
Insurance. We and the owners of the Grand Canal Shoppes must maintain minimum types and levels of insurance, including property damage, general liability and business interruption insurance. The cooperation agreement establishes an insurance trustee to assist in the implementation of the insurance requirements.
Parking. The cooperation agreement also addresses issues relating to the use of the LV Integrated Resort’s parking facilities and easements for access. The Venetian Las Vegas, The Palazzo, Sands Expo Center and the Grand Canal Shoppes may use the parking spaces in the LV Integrated Resort’s parking facilities on a “first come, first served” basis. The LV Integrated Resort’s parking facilities are owned, maintained and operated by us, with the operating costs
22
proportionately allocated among and/or billed to the owners of the components of the LV Integrated Resort. Each party to the cooperation agreement has granted to the others non-exclusive easements and rights to use the roadways and walkways on each other’s properties for vehicular and pedestrian access to the parking garages.
Utility Easement. All property owners have also granted each other all appropriate and necessary easement rights to utility lines servicing the LV Integrated Resort.
Consents, Approvals and Disputes. If any current or future party to the cooperation agreement has a consent or approval right or has discretion to act or refrain from acting, the consent or approval of such party will only be granted and action will be taken or not taken only if a commercially reasonable owner would do so and such consent, approval, action or inaction would not have a material adverse effect on the property owned by such property owner. The cooperation agreement provides for the appointment of an independent expert to resolve some disputes between the parties, as well as for expedited arbitration for other disputes.
Sale of the Grand Canal Shoppes by GGP. We have a right of first offer in connection with any proposed sale of the Grand Canal Shoppes by GGP. We also have the right to receive notice of any default by GGP sent by any lender holding a mortgage on the Grand Canal Shoppes, if any, and the right to cure such default subject to our meeting certain net worth tests.
ITEM 1A. — RISK FACTORS
You should carefully consider the risk factors set forth below as well as the other information contained in this Annual Report on Form 10-K in connection with evaluating the Company. Additional risks and uncertainties not currently known to us or that we currently deem to be immaterial may also have a material adverse effect on our business, financial condition, results of operations and cash flows. Certain statements in “Risk Factors” are forward-looking statements. See “Item 7 — Management’s Discussion and Analysis of Financial Condition and Results of Operations — Special Note Regarding Forward-Looking Statements.”
Risks Related to Our Business
Our business is particularly sensitive to reductions in discretionary consumer and corporate spending as a result of downturns in the economy.
Consumer demand for hotel/casino resorts, trade shows and conventions and for the type of luxury amenities we offer is particularly sensitive to downturns in the economy and the corresponding impact on discretionary spending on leisure activities. Changes in discretionary consumer spending or corporate spending on conventions and business travel could be driven by many factors, such as: perceived or actual general economic conditions; any further weaknesses in the job or housing market, additional credit market disruptions; high energy, fuel and food costs; the increased cost of travel; the potential for bank failures; perceived or actual disposable consumer income and wealth; fears of recession and changes in consumer confidence in the economy; or fears of war and future acts of terrorism. These factors could reduce consumer and corporate demand for the luxury amenities and leisure activities we offer, thus imposing additional limits on pricing and harming our operations.
Our business is sensitive to the willingness of our customers to travel. Acts of terrorism, regional political events and developments in the conflicts in certain countries could cause severe disruptions in air travel that reduce the number of visitors to our facilities, resulting in a material adverse effect on our business, financial condition, results of operations and cash flows.
We are dependent on the willingness of our customers to travel. Only a small amount of our business is and will be generated by local residents. Most of our customers travel to reach our Macao, Singapore, Las Vegas and Pennsylvania properties. Acts of terrorism may severely disrupt domestic and international travel, which would result in a decrease in customer visits to Macao, Singapore, Las Vegas and Pennsylvania, including our properties. Regional political events, including those resulting in travelers perceiving areas as unstable or an unwillingness of governments to grant visas, regional conflicts or an outbreak of hostilities or war could have a similar effect on domestic and international travel. Management cannot predict the extent to which disruptions in air or other forms of travel as a result of any further
23
terrorist acts, regional political events, regional conflicts or outbreak of hostilities or war would have a material adverse effect on our business, financial condition, results of operations and cash flows.
We are subject to extensive regulation and the cost of compliance or failure to comply with such regulations that govern our operations in any jurisdiction where we operate may have a material adverse effect on our business, financial condition, results of operations and cash flows.
We are required to obtain and maintain licenses from various jurisdictions in order to operate certain aspects of our business, and we are subject to extensive background investigations and suitability standards in our gaming business. We also will become subject to regulation in any other jurisdiction where we choose to operate in the future. There can be no assurance that we will be able to obtain new licenses or renew any of our existing licenses, or that if such licenses are obtained, that such licenses will not be conditioned, suspended or revoked; and the loss, denial or non-renewal of any of our licenses could have a material adverse effect on our business, financial condition, results of operations and cash flows.
Our gaming operations and the ownership of our securities are subject to extensive regulation by the Nevada Commission, the Nevada Board and the CCLGLB. The Nevada Gaming Authorities have broad authority with respect to licensing and registration of our business entities and individuals investing in or otherwise involved with us.
Although we currently are registered with, and LVSLLC and VCR currently hold gaming licenses issued by, the Nevada Gaming Authorities, these authorities may, among other things, revoke the gaming license of any corporate entity or the registration of a registered corporation or any entity registered as a holding company of a corporate licensee for violations of gaming regulations.
In addition, the Nevada Gaming Authorities may, under certain circumstances, revoke the license or finding of suitability of any officer, director, controlling person, stockholder, noteholder or key employee of a licensed or registered entity. If our gaming licenses were revoked for any reason, the Nevada Gaming Authorities could require the closing of our casinos, which would have a material adverse effect on our business, financial condition, results of operations and cash flows. In addition, compliance costs associated with gaming laws, regulations or licenses are significant. Any change in the laws, regulations or licenses applicable to our business or gaming licenses could require us to make substantial expenditures or could otherwise have a material adverse effect on our business, financial condition, results of operations and cash flows.
A similar dynamic exists in all jurisdictions where we operate and a regulatory action against one of our operating entities in any gaming jurisdiction could impact our operations in other gaming jurisdictions where we do business. For a more complete description of the gaming regulatory requirements that have an effect on our business, see “Item 1 — Business — Regulation and Licensing.”
We are subject to regulations imposed by the Foreign Corrupt Practices Act (the “FCPA”), which generally prohibits U.S. companies and their intermediaries from making improper payments to foreign officials for the purpose of obtaining or retaining business. On February 9, 2011, LVSC received a subpoena from the SEC requesting that we produce documents relating to our compliance with the FCPA. We have also been advised by the DOJ that it is conducting a similar investigation. Any violation of the FCPA could have a material adverse effect on our business, financial condition, results of operations and cash flows. See “Item 8 — Financial Statements and Supplementary Data — Notes to Consolidated Financial Statements — Note 13 — Commitments and Contingencies — Litigation” for further description of the current status of this matter.
We also deal with significant amounts of cash in our operations and are subject to various reporting and anti-money laundering regulations. Recently, U.S. governmental authorities have evidenced an increased focus on the gaming industry and compliance with anti-money laundering laws and regulations. For instance, we are subject to regulation under the Currency and Foreign Transactions Reporting Act of 1970, commonly known as the "Bank Secrecy Act" (“BSA”), which, among other things, requires us to report to the Financial Crimes Enforcement Network (“FinCEN”) certain currency transactions in excess of applicable thresholds and certain suspicious activities where we know, suspect or have reason to suspect such transactions involve funds from illegal activity or are intended to violate federal law or regulations or are designed to evade reporting requirements or have no business or lawful purpose. In addition, under the BSA, we are subject to various other rules and regulations involving reporting, recordkeeping and
24
retention. Our compliance with the BSA is subject to periodic audits by the U.S. Treasury Department, and we may be subject to substantial civil and criminal penalties, including fines, if we fail to comply with applicable regulations. We are also subject to similar regulations in Singapore and Macao. Any such laws and regulations could change or could be interpreted differently in the future, or new laws and regulations could be enacted. Any violation of anti-money laundering laws or regulations, or any accusations of money laundering or regulatory investigations into possible money laundering activities, by any of our properties, employees or customers could have a material adverse effect on our business, financial condition, results of operations and cash flows.
There are significant risks associated with our ongoing and future construction projects, which could have a material adverse effect on our financial condition, results of operations and cash flows from these planned facilities.
Our ongoing and future construction projects, such as our Cotai Strip projects, entail significant risks. Construction activity requires us to obtain qualified contractors and subcontractors, the availability of which may be uncertain. Construction projects are subject to cost overruns and delays caused by events outside of our control or, in certain cases, our contractors’ control, such as shortages of materials or skilled labor, unforeseen engineering, environmental and/or geological problems, work stoppages, weather interference, unanticipated cost increases and unavailability of construction materials or equipment. Construction, equipment or staffing problems or difficulties in obtaining any of the requisite materials, licenses, permits, allocations and authorizations from governmental or regulatory authorities could increase the total cost, delay, jeopardize, prevent the construction or opening of our projects, or otherwise affect the design and features. Construction contractors or counterparties for our current projects may be required to bear certain cost overruns for which they are contractually liable, and if such counterparties are unable to meet their obligations, we may incur increased costs for such developments. See also "— Risks Associated with Our International Operations — VML may have financial and other obligations to foreign workers managed by its contractors under government labor quotas." In addition, the number of ongoing projects and their locations throughout the world present unique challenges and risks to our management structure. If our management is unable to manage successfully our worldwide construction projects, it could have a material adverse effect on our financial condition, results of operations and cash flows.
The anticipated costs and completion dates for our current projects are based on budgets, designs, development and construction documents and schedule estimates that we have prepared with the assistance of architects and other construction development consultants and that are subject to change as the design, development and construction documents are finalized and as actual construction work is performed. A failure to complete our projects on budget or on schedule may have a material adverse effect on our financial condition, results of operations and cash flows. The estimated costs to complete and open our remaining planned projects are currently not determinable with certainty and therefore may have a material adverse effect on our financial condition, results of operations and cash flows. See also “— Risks Associated with Our International Operations — We are currently required to build and open The Parisian Macao by November 2016 and complete Sands Cotai Central by December 2016. If we are unable to meet the respective deadlines and the deadlines for either development are not extended, we may lose the respective land concession, which would prohibit us from operating any facilities developed under such land concession."
Because we are currently dependent primarily upon our properties in three markets for all of our cash flow, we are subject to greater risks than competitors with more operating properties or that operate in more markets.
We currently do not have material operations other than our Macao, Singapore and Las Vegas properties. As a result, we are primarily dependent upon these properties for all of our cash.
Given that our operations are currently conducted primarily at properties in Macao, Singapore and Las Vegas and that a large portion of our planned development is in Macao, we will be subject to greater degrees of risk than competitors with more operating properties or that operate in more markets. The risks to which we will have a greater degree of exposure include the following:
• | local economic and competitive conditions; |
• | inaccessibility due to inclement weather, road construction or closure of primary access routes; |
• | decline in air passenger traffic due to higher ticket costs or fears concerning air travel; |
25
• | changes in local and state governmental laws and regulations, including gaming laws and regulations; |
• | natural or man-made disasters, or outbreaks of infectious diseases; |
• | changes in the availability of water; and |
• | a decline in the number of visitors to Macao, Singapore or Las Vegas. |
We depend on the continued services of key managers and employees. If we do not retain our key personnel or attract and retain other highly skilled employees, our business will suffer.
Our ability to maintain our competitive position is dependent to a large degree on the services of our senior management team, including Sheldon G. Adelson and our other executive officers. The loss of Mr. Adelson’s services or the services of our other senior managers, or the inability to attract and retain additional senior management personnel could have a material adverse effect on our business. Mr. Adelson’s employment agreement is scheduled to automatically renew for a one year term in December 2016, unless a timely notice of non-renewal is provided by either us or Mr. Adelson.
The interests of our principal stockholder in our business may be different from yours.
Mr. Adelson, his family members and trusts and other entities established for the benefit of Mr. Adelson and/or his family members (collectively our “Principal Stockholder’s family”) beneficially own approximately 54% of our outstanding common stock as of December 31, 2015. Accordingly, Mr. Adelson exercises significant influence over our business policies and affairs, including the composition of our Board of Directors and any action requiring the approval of our stockholders, including the adoption of amendments to our articles of incorporation and the approval of a merger or sale of substantially all of our assets. The concentration of ownership may also delay, defer or even prevent a change in control of our company and may make some transactions more difficult or impossible without the support of Mr. Adelson. The interests of Mr. Adelson may differ from your interests.
We are a parent company and our primary source of cash is and will be distributions from our subsidiaries.
We are a parent company with limited business operations of our own. Our main asset is the capital stock of our subsidiaries. We conduct most of our business operations through our direct and indirect subsidiaries. Accordingly, our primary sources of cash are dividends and distributions with respect to our ownership interests in our subsidiaries that are derived from the earnings and cash flow generated by our operating properties. Our subsidiaries might not generate sufficient earnings and cash flow to pay dividends or distributions in the future. Our subsidiaries’ payments to us will be contingent upon their earnings and upon other business considerations. In addition, our subsidiaries’ debt instruments and other agreements limit or prohibit certain payments of dividends or other distributions to us. We expect that future debt instruments for the financing of our other developments will contain similar restrictions.
The terms of our debt instruments and our current debt service obligations and substantial indebtedness may restrict our current and future operations, particularly our ability to timely refinance existing indebtedness, finance additional growth, respond to changes or take some actions that may otherwise be in our best interests.
Our current debt instruments contain, and any future debt instruments likely will contain, a number of restrictive covenants that impose significant operating and financial restrictions on us, including restrictions on our ability to:
• | incur additional debt, including providing guarantees or credit support; |
• | incur liens securing indebtedness or other obligations; |
• | dispose of assets; |
• | make certain acquisitions; |
• | pay dividends or make distributions and make other restricted payments, such as purchasing equity interests, repurchasing junior indebtedness or making investments in third parties; |
• | enter into sale and leaseback transactions; |
26
• | engage in any new businesses; |
• | issue preferred stock; and |
• | enter into transactions with our stockholders and our affiliates. |
In addition, our Macao, Singapore and U.S. credit agreements contain various financial covenants. See “Item 8 — Financial Statements and Supplementary Data — Notes to Consolidated Financial Statements — Note 8 — Long-Term Debt” for further description of these covenants.
As of December 31, 2015, we had $9.37 billion of long-term debt outstanding. This indebtedness could have important consequences to us. For example, it could:
• | make it more difficult for us to satisfy our debt service obligations; |
• | increase our vulnerability to general adverse economic and industry conditions; |
• | impair our ability to obtain additional financing in the future for working capital needs, capital expenditures, development projects, acquisitions or general corporate purposes; |
• | require us to dedicate a significant portion of our cash flow from operations to the payment of principal and interest on our debt, which would reduce the funds available for our operations and development projects; |
• | limit our flexibility in planning for, or reacting to, changes in the business and the industry in which we operate; |
• | place us at a competitive disadvantage compared to our competitors that have less debt; and |
• | subject us to higher interest expense in the event of increases in interest rates as a significant portion of our debt is, and will continue to be, at variable rates of interest. |
Subject to applicable laws, including gaming laws, and certain agreed upon exceptions, our debt is secured by liens on substantially all of our assets, except for our equity interests in our subsidiaries.
Our ability to timely refinance and replace our indebtedness in the future will depend upon general economic and credit market conditions, the particular circumstances of the gaming industry and prevalent regulations and our cash flow and operations, in each case as evaluated at the time of such potential refinancing or replacement. For example, we have a principal amount of $1.36 billion, $2.25 billion and $5.09 billion in long-term debt maturing during the years ending December 31, 2018, 2019 and 2020, respectively. If we are unable to refinance our indebtedness on a timely basis, we might be forced to seek alternate forms of financing, dispose of certain assets or minimize capital expenditures and other investments, or reduce dividend payments. There is no assurance that any of these alternatives would be available to us, if at all, on satisfactory terms, on terms that would not be disadvantageous to us, or on terms that would not require us to breach the terms and conditions of our existing or future debt agreements.
We may attempt to arrange additional financing to fund the balance of our Cotai Strip developments. If such additional financing is necessary, we cannot assure you that we will be able to obtain all the financing required for the construction and opening of our remaining planned projects on suitable terms, if at all.
We extend credit to a large portion of our customers and we may not be able to collect gaming receivables from our credit players.
We conduct our gaming activities on a credit and cash basis. Any such credit we extend is unsecured. Table games players typically are extended more credit than slot players, and high-stakes players typically are extended more credit than players who tend to wager lower amounts. High-end gaming is more volatile than other forms of gaming, and variances in win-loss results attributable to high-end gaming may have a significant positive or negative impact on cash flow and earnings in a particular quarter.
During the year ended December 31, 2015, approximately 23.1%, 33.1% and 67.4% of our table games drop at our Macao properties, Marina Bay Sands and our Las Vegas properties, respectively, was from credit-based wagering, while table games play at our Pennsylvania property was primarily conducted on a cash basis. We extend credit to those
27
customers whose level of play and financial resources warrant, in the opinion of management, an extension of credit. These large receivables could have a significant impact on our results of operations if deemed uncollectible.
While gaming debts evidenced by a credit instrument, including what is commonly referred to as a “marker,” and judgments on gaming debts are enforceable under the current laws of Nevada, and Nevada judgments on gaming debts are enforceable in all states under the Full Faith and Credit Clause of the U.S. Constitution, other jurisdictions around the world, including jurisdictions our gaming customers may come from, may determine that enforcement of gaming debts is against public policy. Although courts of some foreign nations will enforce gaming debts directly and the assets in the U.S. of foreign debtors may be reached to satisfy a judgment, judgments on gaming debts from courts in the U.S. and elsewhere are not binding on the courts of many foreign nations.
In particular, we expect that our Macao operations will be able to enforce gaming debts only in a limited number of jurisdictions, including Macao. To the extent our Macao gaming customers and junket operators are from other jurisdictions, our Macao operations may not have access to a forum in which it will be possible to collect all gaming receivables because, among other reasons, courts of many jurisdictions do not enforce gaming debts and our Macao operations may encounter forums that will refuse to enforce such debts. Moreover, under applicable law, our Macao operations remains obligated to pay taxes on uncollectible winnings from customers.
It is also possible that our Singapore operations may not be able to collect gaming debts in certain jurisdictions. To the extent our Singapore gaming customers’ assets are situated in such jurisdictions, our Singapore operations may not be able collect all gaming receivables because, among other reasons, courts of certain jurisdictions do not enforce gaming debts.
Even where gaming debts are enforceable, they may not be collectible. Our inability to collect gaming debts could have a significant adverse effect on our operating results.
Win rates for our gaming operations depend on a variety of factors, some beyond our control, and the winnings of our gaming customers could exceed our casino winnings.
The gaming industry is characterized by an element of chance. In addition to the element of chance, win rates are also affected by other factors, including players’ skill and experience, the mix of games played, the financial resources of players, the spread of table limits, the volume of bets played and the amount of time played. Our gaming profits are mainly derived from the difference between our casino winnings and the casino winnings of our gaming customers. Since there is an inherent element of chance in the gaming industry, we do not have full control over our winnings or the winnings of our gaming customers. If the winnings of our gaming customers exceed our winnings, we may record a loss from our gaming operations, which could have a material adverse effect on our business, financial condition, results of operations and cash flows.
We face the risk of fraud and cheating.
Our gaming customers may attempt or commit fraud or cheat in order to increase winnings. Acts of fraud or cheating could involve the use of counterfeit chips or other tactics, possibly in collusion with our employees. Internal acts of cheating could also be conducted by employees through collusion with dealers, surveillance staff, floor managers or other casino or gaming area staff. Failure to discover such acts or schemes in a timely manner could result in losses in our gaming operations. In addition, negative publicity related to such schemes could have an adverse effect on our reputation, potentially causing a material adverse effect on our business, financial condition, results of operations and cash flows.
A failure to establish and protect our IP rights could have a material adverse effect on our business, financial condition and results of operations.
We endeavor to establish and protect our IP rights and our goods and services through trademarks and service marks, copyrights, patents, trade secrets, domain names, licenses, other contractual provisions, nondisclosure agreements, and confidentiality and information-security measures and procedures. There can be no assurance, however, that the steps we take to protect our IP will be sufficient. If one of our marks becomes so well known by the public that its use is deemed generic, we may lose exclusive rights to such mark or be forced to rebrand. If a third party claims
28
our IP has infringed, currently infringes, or could in the future infringe upon its IP rights, we may need to cease use of such IP, defend our rights or take other steps. In addition, if third parties violate their obligations to us to maintain the confidentiality of our proprietary information or there is a security breach or lapse, or if third parties misappropriate or infringe upon our IP, our business may be affected. Our inability to adequately obtain, maintain or defend our IP rights for any reason could have a material adverse effect on our business, financial condition and results of operations.
Our insurance coverage may not be adequate to cover all possible losses that our properties could suffer. In addition, our insurance costs may increase and we may not be able to obtain the same insurance coverage, or the scope of insurance coverage we deem necessary, in the future.
We have comprehensive property and liability insurance policies for our properties in operation, as well as those in the course of construction, with coverage features and insured limits that we believe are customary in their breadth and scope. Market forces beyond our control may nonetheless limit the scope of the insurance coverage we can obtain or our ability to obtain coverage at reasonable rates. Certain types of losses, generally of a catastrophic nature, such as earthquakes, hurricanes and floods, or terrorist acts, or certain liabilities may be uninsurable or too expensive to justify obtaining insurance. As a result, we may not be successful in obtaining insurance without increases in cost or decreases in coverage levels. In addition, in the event of a substantial loss, the insurance coverage we carry may not be sufficient to pay the full market value or replacement cost of our lost investment or in some cases could result in certain losses being totally uninsured. As a result, we could lose some or all of the capital we have invested in a property, as well as the anticipated future revenue from the property, and we could remain obligated for debt or other financial obligations related to the property.
Our debt instruments and other material agreements require us to maintain a certain minimum level of insurance. Failure to satisfy these requirements could result in an event of default under these debt instruments or material agreements.
Conflicts of interest may arise because certain of our directors and officers are also directors of SCL.
In November 2009, our subsidiary, SCL, listed its ordinary shares on The Main Board of The Stock Exchange of Hong Kong Limited (the “SCL Offering”). We currently own 70.1% of the issued and outstanding ordinary shares of SCL. As a result of SCL having stockholders who are not affiliated with us, we and certain of our officers and directors who also serve as officers and/or directors of SCL may have conflicting fiduciary obligations to our stockholders and to the minority stockholders of SCL. Decisions that could have different implications for us and SCL, including contractual arrangements that we have entered into or may in the future enter into with SCL may give rise to the appearance of a potential conflict of interest.
Changes in tax laws and regulations could impact our financial condition, results of operations and cash flows.
We are subject to taxation and regulation by various government agencies, primarily in Macao, Singapore and the U.S. (federal, state and local levels). From time to time, U.S. federal, state, local and foreign governments make substantive changes to tax rules and the application of these rules, which could result in higher taxes than would be incurred under existing tax law or interpretation. In particular, government agencies may make changes that could reduce the profits that we can effectively realize from our non-U.S. operations. Like most U.S. companies, our effective income tax rate reflects the fact that income earned and reinvested outside the U.S. is taxed at local rates, which are often lower than U.S. tax rates. If changes in tax laws and regulations were to significantly increase the tax rates on non-U.S. income, these changes could increase our income tax expense and liability, and therefore, could have a material adverse effect on our effective income tax rate, financial condition, results of operations and cash flows.
Disruptions in the financial markets could have an adverse effect on our ability to raise additional financing.
Severe disruptions in the commercial credit markets in the past, have resulted in a tightening of credit markets worldwide. Liquidity in the global credit markets was severely contracted by these market disruptions, making it difficult and costly to obtain new lines of credit or to refinance existing debt. The effect of these disruptions was widespread and difficult to quantify. Any future disruptions in the commercial credit markets may impact liquidity in the global credit market as greatly, or even more, than in recent years.
29
Our business and financing plan may be dependent upon the completion of future financings. If the credit environment worsens, it may be difficult to obtain any additional financing or refinance or replace our existing debt on acceptable terms, which could have an adverse effect on our ability to complete our remaining planned development projects, and as a consequence, our results of operations and business plans. Should general economic conditions not improve, if we are unable to obtain sufficient funding or applicable government approvals such that completion of our planned projects is not probable, or should management decide to abandon certain projects, all or a portion of our investment to date in our planned projects could be lost and would result in an impairment charge.
Natural or man-made disasters, an outbreak of highly infectious disease, terrorist activity or war could adversely affect the number of visitors to our facilities and disrupt our operations, resulting in a material adverse effect on our business, financial condition, results of operations and cash flows.
So called “Acts of God,” such as typhoons, particularly in Macao, and other natural disasters, man-made disasters, outbreaks of highly infectious diseases, terrorist activity or war may result in decreases in travel to and from, and economic activity in, areas in which we operate, and may adversely affect the number of visitors to our properties. Any of these events also may disrupt our ability to staff our business adequately, could generally disrupt our operations and could have a material adverse effect on our business, financial condition, results of operations and cash flows. Although we have insurance coverage with respect to some of these events, we cannot assure you that any such coverage will be sufficient to indemnify us fully against all direct and indirect costs, including any loss of business that could result from substantial damage to, or partial or complete destruction of, any of our properties.
Our failure to maintain the integrity of our customer or company data could have a material adverse effect on our business, financial condition, results of operations and cash flows, and/or subject us to costs, fines or lawsuits.
We face global cybersecurity threats, which may range from uncoordinated individual attempts to sophisticated and targeted measures directed at us. Cyber-attacks and security breaches may include, but are not limited to, attempts to access information, including customer and company information, computer viruses, denial of service and other electronic security breaches.
Our business requires the collection and retention of large volumes of customer data, including credit card numbers and other personally identifiable information in various information systems that we maintain and in those maintained by third-parties with whom we contract to provide data services. We also maintain important internal company data such as personally identifiable information about our employees and information relating to our operations. The integrity and protection of that customer and company data is important to us. Our collection of such customer and company data is subject to extensive regulation by private groups such as the payment card industry as well as domestic and foreign governmental authorities, including gaming authorities. Our systems may be unable to satisfy applicable regulations or employee and customer expectations.
In addition, we have experienced a sophisticated criminal cybersecurity attack in the past, including a breach of our information technology systems, referred to in “Part II — Item 8 — Financial Statements and Supplementary Data — Notes to Consolidated Financial Statements — Note 13 — Commitments and Contingencies,” in which customer and company information was compromised and certain company data may have been destroyed, and we may experience additional cybersecurity attacks in the future, potentially with more frequency or sophistication. Our information systems and records, including those we maintain with our third-party service providers, may be subject to cybersecurity breaches, system failures, viruses, operator error or inadvertent releases of data. Our third-party information system service providers face risks relating to cybersecurity similar to ours, and we do not directly control any of such parties’ information security operations. A significant theft, loss or fraudulent use of customer or company data maintained by us or by a third-party service provider could have an adverse effect on our reputation, cause a material disruption to our operations and management team and result in remediation expenses and regulatory penalties. Such theft, loss or fraudulent use could also result in litigation by shareholders alleging that our protections against cyber-attacks were insufficient or by customers and other parties whose information was subject to such attacks. Any of these events could have a material adverse effect on our business, financial condition, results of operations and cash flows.
30
Because we own real property, we are subject to extensive environmental regulation, which creates uncertainty regarding future environmental expenditures and liabilities.
We have incurred and will continue to incur costs to comply with environmental requirements, such as those relating to discharges into the air, water and land, the handling and disposal of solid and hazardous waste and the cleanup of properties affected by hazardous substances. Under these and other environmental requirements, we may be required to investigate and clean up hazardous or toxic substances or chemical releases at our properties and may be held responsible to governmental entities or third parties, as an owner or operator, for property damage, personal injury and investigation and cleanup costs incurred by them in connection with any contamination. These laws typically impose cleanup responsibility and liability without regard to whether the owner or operator knew of or caused the presence of the contaminants. The costs of investigation, remediation or removal of those substances may be substantial, and the presence of those substances, or the failure to remediate a property properly, may impair our ability to use our properties.
Risks Associated with Our International Operations
We will stop generating any revenues from our Macao gaming operations if we cannot secure an extension of our subconcession in 2022 or if the Macao government exercises its redemption right.
Our subconcession agreement expires on June 26, 2022. Unless our subconcession is extended, all of VML’s casino premises and gaming-related equipment will be transferred automatically to the Macao government on that date without compensation to us and we will cease to generate revenues from these gaming operations. Beginning on December 26, 2017, the Macao government may redeem the subconcession agreement by providing us at least one year prior notice. In the event the Macao government exercises this redemption right, we are entitled to fair compensation or indemnity. The amount of this compensation or indemnity will be determined based on the amount of gaming and non-gaming revenue generated by The Venetian Macao during the tax year prior to the redemption multiplied by the number of remaining years before expiration of the subconcession. We cannot assure you that we will be able to renew or extend our subconcession agreement on terms favorable to us or at all. We also cannot assure you that if our subconcession is redeemed, the compensation paid will be adequate to compensate us for the loss of future revenues.
Our Macao subconcession can be terminated under certain circumstances without compensation to us, which would have a material adverse effect on our business, financial condition, results of operations and cash flows.
The Macao government has the right, after consultation with Galaxy, to unilaterally terminate our subconcession in the event of VML’s serious non-compliance with its basic obligations under the subconcession and applicable Macao laws. Upon termination of our subconcession, our casinos and gaming-related equipment would automatically be transferred to the Macao government without compensation to us and we would cease to generate any revenues from these operations. The loss of our subconcession would prohibit us from conducting gaming operations in Macao, which would have a material adverse effect on our business, financial condition, results of operations and cash flows.
Our Singapore concession can be terminated under certain circumstances without compensation to us, which would have a material adverse effect on our business, financial condition, results of operations and cash flows.
The Development Agreement between MBS and the STB contains events of default that could permit the STB to terminate the agreement without compensation to us. If the Development Agreement is terminated, we could lose our right to operate the Marina Bay Sands and our investment in Marina Bay Sands could be lost.
For a more complete description of the Singapore gaming regulatory requirements applicable to beneficial owners of our voting securities, see “Item 1 — Business — Regulation and Licensing — Development Agreement with Singapore Tourism Board.”
31
We are currently required to build and open The Parisian Macao by November 2016 and complete Sands Cotai Central by December 2016. If we are unable to meet the respective deadlines and the deadlines for either development are not extended, we may lose the respective land concession, which would prohibit us from operating any facilities developed under such land concession.
We received land concessions from the Macao government covering the sites on which The Venetian Macao, Four Seasons Macao, Sands Cotai Central and The Parisian Macao are located. The Macao government granted us extensions of the development deadline under the land concession for The Parisian Macao. Under the terms of the land concession, we must complete The Parisian Macao by November 15, 2016. See “— Risks Related to Our Business — Disruptions in the financial markets could have an adverse effect on our ability to raise additional financing,” “— Risks Related to Our Business — There are significant risks associated with our ongoing and future construction projects, which could have a material adverse effect on our financial condition, results of operations and cash flows from these planned facilities” and “— Conducting business in Macao and Singapore has certain political and economic risks, which may have a material adverse effect on our business, financial condition, results of operations and cash flows.” The land concession for Sands Cotai Central contains a similar requirement that the corresponding development be completed by December 31, 2016. Should we determine that we are unable to complete The Parisian Macao or Sands Cotai Central by their respective deadlines, we would then expect to apply for another extension from the Macao government. No assurance can be given that additional extensions will be granted. If we are unable to meet the current deadlines and the deadlines for either development are not extended, the Macao government has the right to unilaterally terminate our respective land concessions for The Parisian Macao or Sands Cotai Central. A loss of the land concession would prohibit us from operating any properties developed under the land concession for The Parisian Macao or Sands Cotai Central. As a result, we could record a charge for all or some portion of our $1.65 billion and $4.87 billion in capitalized costs and land premiums (net of amortization), as of December 31, 2015, for The Parisian Macao or Sands Cotai Central, respectively.
The number of visitors to Macao, particularly visitors from mainland China, may decline or travel to Macao may be disrupted.
Our VIP and mass market gaming customers typically come from nearby destinations in Asia, including mainland China, Hong Kong, South Korea and Japan. Increasingly, a significant number of gaming customers come to our casinos from mainland China. Any slowdown in economic growth or changes of China’s current restrictions on travel and currency movements could further disrupt the number of visitors from mainland China to our casinos in Macao as well as the amounts they are willing and able to spend while at our properties.
Policies and measures adopted from time to time by the Chinese government include restrictions imposed on exit visas granted to residents of mainland China for travel to Macao and Hong Kong. These measures have, and any future policy developments that may be implemented may have, the effect of reducing the number of visitors to Macao from mainland China, which could adversely impact tourism and the gaming industry in Macao.
Our Macao operations face intense competition, which could have a material adverse effect on our financial condition, results of operations and cash flows.
The hotel, resort and casino businesses are highly competitive. Our Macao operations currently compete with numerous other casinos located in Macao. Our competitors have announced additional Macao facilities with planned opening dates in 2016 and 2017. Increasing capacity of hotel rooms in Macao could add to the competitive dynamic of the market.
Our Macao operations will also compete to some extent with casinos located elsewhere in Asia, including Singapore, Philippines, new developments in Malaysia, Korea, Australia, New Zealand and elsewhere in the world, including Las Vegas, as well as online gaming and cruise ships that offer gaming. In addition, certain countries have legalized, and others may in the future legalize, casino gaming, including Japan, Taiwan and Thailand.
The proliferation of gaming venues, especially in Southeast Asia, could have a significant and adverse effect on our financial condition, results of operations and cash flows.
32
The Macao and Singapore governments could grant additional rights to conduct gaming in the future, which could have a material adverse effect on our financial condition, results of operations and cash flows.
We hold a subconcession under one of only three gaming concessions authorized by the Macao government to operate casinos in Macao. No additional concessions or subconcessions have been granted since 2002; however, if the Macao government were to allow additional gaming operators in Macao through the grant of additional concessions or subconcessions, we would face additional competition, which could have a material adverse effect on our financial condition, results of operations and cash flows.
We hold one of two licenses granted by the Singapore government to develop an integrated resort, including a casino. Under the Request for Proposal, the CRA is required to ensure that there will not be more than two casino licenses during a ten-year exclusive period that began on March 1, 2007. If the Singapore government were to license additional casinos, we would face additional competition, which could have a material adverse effect on our financial condition, results of operations and cash flows.
We compete for limited management and labor resources in Macao and Singapore, and policies of those governments may also affect our ability to employ imported managers or labor.
Our success depends in large part upon our ability to attract, retain, train, manage and motivate skilled managers and employees at our properties. The Macao government requires that we only hire Macao residents in our casinos for certain employee roles, including as dealers. In addition, we are required in Macao to obtain visas and work permits for managers and employees we seek to employ from other countries. There is significant competition in Macao and Singapore for managers and employees with the skills required to perform the services we offer and competition for these individuals in Macao is likely to increase as we open The Parisian Macao and as other competitors expand their operations.
We may have to seek managers and employees from other countries to adequately staff and manage our properties and certain Macao government policies affect our ability to use outside managers and employees in certain job classifications. Despite our coordination with the Macao labor and immigration authorities to assure that our management and labor needs are satisfied, we may not be able to recruit and retain a sufficient number of qualified managers or employees for our operations or the Macao labor and immigration authorities may not grant us the necessary visas or work permits.
If we are unable to obtain, attract, retain and train skilled managers and employees, and obtain any required visas or work permits for our skilled managers and employees, our ability to adequately manage and staff our existing properties and planned development projects could be impaired, which could have a material adverse effect on our business, financial condition, results of operations and cash flows.
Conducting business in Macao and Singapore has certain political and economic risks, which may have a material adverse effect on our business, financial condition, results of operations and cash flows.
Our operations in Macao include The Venetian Macao, Four Seasons Macao, Sands Cotai Central and Sands Macao, and we are constructing The Parisian Macao, which is currently anticipated to open in the second half of 2016, subject to Macao government approval. We also own and operate the Marina Bay Sands in Singapore. Accordingly, our business development plans, financial condition, results of operations and cash flows may be materially and adversely affected by significant political, social and economic developments in Macao and Singapore, and by changes in policies of the governments or changes in laws and regulations or their interpretations. Our operations in Macao and Singapore are also exposed to the risk of changes in laws and policies that govern operations of companies based in those countries. Jurisdictional tax laws and regulations may also be subject to amendment or different interpretation and implementation, thereby having an adverse effect on our profitability after tax. These changes may have a material adverse effect on our financial condition, results of operations and cash flows.
As we expect a significant number of consumers to continue to come to our Macao properties from mainland China, general economic conditions and policies in China could have a significant impact on our financial prospects. Any slowdown in economic growth, decline in economic conditions or changes to China’s current restrictions on travel and currency movements could disrupt the number of visitors from mainland China to our casinos in Macao as well as
33
the amounts they are willing to spend in our casinos. See “— The number of visitors to Macao, particularly visitors from mainland China, may decline or travel to Macao may be disrupted.”
Current Macao and Singapore laws and regulations concerning gaming and gaming concessions and licenses are, for the most part, fairly recent and there is little precedent on the interpretation of these laws and regulations. We believe that our organizational structure and operations are in compliance in all material respects with all applicable laws and regulations of Macao and Singapore. These laws and regulations are complex and a court or an administrative or regulatory body may in the future render an interpretation of these laws and regulations, or issue regulations, which differs from our interpretation and could have a material adverse effect on our financial condition, results of operations and cash flows.
In addition, our activities in Macao and Singapore are subject to administrative review and approval by various government agencies. We cannot assure you that we will be able to obtain all necessary approvals, which may have a material adverse effect on our long-term business strategy and operations. Macao and Singapore laws permit redress to the courts with respect to administrative actions; however, such redress is largely untested in relation to gaming issues.
The Macao government approved smoking control legislation, which prohibits smoking in casinos starting on October 6, 2014. The legislation, however, permits casinos to maintain designated smoking areas of up to 50% of the areas opened to the public, so long as such areas are within restricted access areas and comply with the conditions set out in the Dispatch of the Chief Executive, dated November 1, 2012, as amended by the Dispatch of the Chief Executive, dated June 3, 2014. Such legislation may deter potential gaming customers who are smokers from frequenting casinos in jurisdictions with smoking bans such as Macao. Such laws and regulations could change or could be interpreted differently in the future. We cannot predict the future likelihood or outcome of similar legislation or referendums in other jurisdictions where we operate or the magnitude of any decrease in revenues as a result of such regulations, though any smoking ban could have an adverse effect on our business, financial condition, results of operations and cash flows.
We are currently not required to pay corporate income taxes on our casino gaming operations in Macao. Additionally, we currently have an agreement with the Macao government that provides for a fixed annual payment that is a substitution for a 12% tax otherwise due from VML’s shareholders on dividends distributed from our Macao gaming operations. These tax arrangements expire at the end of 2018.
We have had the benefit of a corporate tax exemption in Macao, which exempts us from paying the 12% corporate income tax on profits generated by the operation of casino games. This exemption does not apply to our non-gaming activities. We will continue to benefit from this tax exemption through the end of 2018. Additionally, we entered into an agreement with the Macao government in May 2014, effective through the end of 2018 that provides for an annual payment that is a substitution for a 12% tax otherwise due from VML shareholders on dividend distributions paid from VML gaming profits. We intend to request five-year extensions of these tax arrangements; however, we cannot assure you that either of these tax arrangements will be extended beyond their expiration dates.
We are dependent upon gaming junket operators for a significant portion of our gaming revenues in Macao.
Junket operators, which promote gaming and draw high-roller customers to casinos, are responsible for a significant portion of our gaming revenues in Macao. With the increased number of gaming facilities in Macao, the competition for relationships with junket operators has increased. Our gaming revenue associated with junket operators is in decline and may continue to decline in the future. There can be no assurance that we will be able to maintain, or grow, our relationships with junket operators. If we are unable to maintain or grow our relationships with junket operators, or if the junket operators experience financial difficulties or are unable to develop or maintain relationships with our high-roller customers, our ability to grow our gaming revenues will be hampered.
If junket operators attempt to negotiate changes to our operational agreements, including higher commissions, it could result in higher costs for us, loss of business to a competitor or loss of relationships with junket operators. Given present market conditions in Macao and certain economic and other factors occurring in the region, junket operators may encounter difficulties in attracting patrons to come to Macao, and such junket operators may experience decreased liquidity, limiting their ability to grant credit to their patrons, resulting in decreased gaming volume at our Macao properties. Credit already extended by junket operators to their patrons may become increasingly difficult for
34
them to collect. This inability to attract sufficient patrons, grant credit and collect amounts due in a timely manner could negatively affect junket operator’s activities, cause junket operators to wind up or liquidate their operations or result in junket operators leaving Macao. The above factors affecting junket operators could have a material adverse effect on our business, financial condition, results of operations and cash flows.
In addition, the quality of junket operators with whom we have relationships is important to our reputation and our ability to continue to operate in compliance with our gaming licenses. While we strive for excellence in our associations with junket operators, we cannot assure you that the junket operators with whom we are associated will meet the high standards we insist upon. If a junket operator falls below our standards, we may suffer reputational harm, as well as worsening relationships with, and possible sanctions from, gaming regulators with authority over our operations. In the event a junket operator does not meet its financial obligations, there can be no assurance that we may not incur financial exposure.
Our business could be adversely affected by the limitations of the pataca exchange markets and restrictions on the export of the renminbi.
Our revenues in Macao are denominated in patacas, the legal currency of Macao, and Hong Kong dollars. The Macao pataca is pegged to the Hong Kong dollar and, in many cases, is used interchangeably with the Hong Kong dollar in Macao. Although currently permitted, we cannot assure you that patacas will continue to be freely exchangeable into U.S. dollars. Also, our ability to convert large amounts of patacas into U.S. dollars over a relatively short period may be limited.
We are currently prohibited from accepting wagers in renminbi, the legal currency of China. There are also restrictions on the remittance of the renminbi from mainland China and the amount of renminbi that can be converted into foreign currencies, including the pataca and Hong Kong dollar. Restrictions on the remittance of the renminbi from mainland China may impede the flow of gaming customers from mainland China to Macao, inhibit the growth of gaming in Macao and negatively impact our gaming operations. There is no assurance that mainland Chinese regulations will not be promulgated in the future that have the effect of restricting or eliminating the remittance of renminbi from mainland China. Further, if any new mainland Chinese regulations are promulgated in the future that have the effect of permitting or restricting (as the case may be) the remittance of renminbi from mainland China, then such remittances will need to be made subject to the specific requirements or restrictions set out in such rules.
On July 21, 2005, the People’s Bank of China announced that the renminbi will no longer be pegged to the U.S. dollar, but will be allowed to float in a band (and, to a limited extent, increase in value) against a basket of foreign currencies. We cannot assure you that the Hong Kong dollar will continue to be pegged to the U.S. dollar and the Macao pataca will continue to be pegged to the Hong Kong dollar or that the current peg rate for these currencies will remain at the same level. The floating of the renminbi and possible changes to the pegs of the Macao pataca and/or the Hong Kong dollar may result in severe fluctuations in the exchange rate for these currencies. Any change in such exchange rates could have a material adverse effect on our operations and on our ability to make payments on certain of our debt instruments. We do not currently hedge for foreign currency risk related to the renminbi or pataca; however, we maintain a significant amount of our operating funds in the same currencies in which we have obligations, thereby reducing our exposure to currency fluctuations.
Certain Nevada gaming laws apply to our gaming activities and associations in other jurisdictions where we operate or plan to operate.
Certain Nevada gaming laws also apply to our gaming activities and associations in jurisdictions outside the State of Nevada. We are required to comply with certain reporting requirements concerning our proposed gaming activities and associations occurring outside the State of Nevada, including Macao, Singapore and other jurisdictions. We will also be subject to disciplinary action by the Nevada Commission if:
• | we knowingly violate any laws of the foreign jurisdiction pertaining to the foreign gaming operation; |
• | we fail to conduct the foreign gaming operation in accordance with the standards of honesty and integrity required of Nevada gaming operations; |
35
• | we engage in any activity or enter into any association that is unsuitable for us because it poses an unreasonable threat to the control of gaming in Nevada, reflects or tends to reflect discredit or disrepute upon the State of Nevada or gaming in Nevada, or is contrary to the gaming policies of Nevada; |
• | we engage in any activity or enter into any association that interferes with the ability of the State of Nevada to collect gaming taxes and fees; or |
• | we employ, contract with or associate with any person in the foreign gaming operation who has been denied a license or a finding of suitability in Nevada on the ground of personal unsuitability, or who has been found guilty of cheating at gambling. |
Also, as we are required to provide any other information that the Nevada Commission may require concerning our gaming activities and associations in jurisdictions outside the State of Nevada, we could be subject to disciplinary action by the Nevada Commission if our current reporting is determined to be unsatisfactory due to Macao regulations regarding personal data protection prohibiting us from satisfying certain reporting requirements of the Nevada Commission.
In addition, if the Nevada Board determines that one of our actual or intended activities or associations in a foreign gaming operation may violate one or more of the foregoing, we can be required to file an application with the Nevada Commission for a finding of suitability of such activity or association. If the Nevada Commission finds that the activity or association in the foreign gaming operation is unsuitable or prohibited, we will either be required to terminate the activity or association, or will be prohibited from undertaking the activity or association. Consequently, should the Nevada Commission find that our gaming activities or associations in Macao or certain other jurisdictions where we operate are unsuitable, we may be prohibited from undertaking our planned gaming activities or associations in those jurisdictions.
The gaming authorities in other jurisdictions where we operate or plan to operate, including in Macao and Singapore, exercise similar powers for purposes of assessing suitability in relation to our activities in other gaming jurisdictions where we do business.
We may not be able to monetize some of our real estate assets.
Part of our business strategy in Macao and Singapore relies upon our ability to profitably operate, sell and/or grant rights of use over certain of our real estate assets once completed, including retail malls and apart-hotels. Our ability to monetize these assets will be subject to market conditions, applicable legislation, the receipt of necessary government approvals and other factors. If we are unable to profitably operate and/or monetize these real estate assets, it may have a material adverse effect on our financial condition, results of operations and cash flows.
VML may have financial and other obligations to foreign workers managed by its contractors under government labor quotas.
The Macao government has granted VML a quota to permit it to hire foreign workers. VML has effectively assigned the management of this quota to its contractors for the construction of our Cotai Strip projects. VML, however, remains ultimately liable for all employer obligations relating to these employees, including for payment of wages and taxes and compliance with labor and workers’ compensation laws. VML requires each contractor to whom it has assigned the management of part of its labor quota to indemnify VML for any costs or liabilities VML incurs as a result of such contractor’s failure to fulfill employer obligations. VML’s agreements with its contractors also contain provisions that permit it to retain some payments for up to one year after the contractors’ complete work on the projects. We cannot assure you that VML’s contractors will fulfill their obligations to employees hired under the labor quotas or to VML under the indemnification agreements, or that the amount of any indemnification payments received will be sufficient to pay for any obligations VML may owe to employees managed by contractors under VML’s quotas. Until we make final payments to our contractors, we have offset rights to collect amounts they may owe us, including amounts owed under the indemnities relating to employer obligations. After we have made the final payments, it may be more difficult for us to enforce any unpaid indemnity obligations.
36
The transportation infrastructure in Macao may not be adequate to accommodate increased future demand of visitors to Macao.
Macao is in the process of expanding its transportation infrastructure to service the increased number of visitors to Macao. If the planned expansions of transportation facilities to and from Macao are delayed or not completed, and Macao’s transportation infrastructure is insufficient to meet the demands of an increased volume of visitors to Macao, the desirability of Macao as a business and leisure tourism destination, as well as the results of operations of our Macao properties, could be negatively impacted.
Risks Associated with Our U.S. Operations
We face significant competition in Las Vegas, which could have a material adverse effect on our business, financial condition, results of operations and cash flows. In addition, any significant downturn in the trade show and convention business could have a significant and adverse effect on our mid-week occupancy rates and business.
The hotel, resort and casino businesses in Las Vegas are highly competitive. We also compete, to some extent, with other hotel/casino facilities in Nevada, as well as hotel/casinos and other resort facilities and vacation destinations elsewhere in the United States and around the world. In addition, various competitors on the Las Vegas Strip periodically expand and/or renovate their existing facilities. If demand for hotel rooms does not keep up with the increase in the number of hotel rooms, competitive pressures may cause reductions in average room rates.
We also compete with legalized gaming from casinos located on Native American tribal lands, including those located in California. While the competitive impact on our operations in Las Vegas from the continued growth of Native American gaming establishments in California remains uncertain, the proliferation of gaming in California and other areas located in the same region as our Las Vegas Operating Properties could have an adverse effect on our results of operations.
In addition, certain states have legalized, and others may legalize, casino gaming in specific areas, including metropolitan areas from which we traditionally attract customers. A number of states have permitted or are considering permitting gaming at “racinos” (combined race tracks and casinos), on Native American reservations and through expansion of state lotteries.
Certain states within the U.S. have also legalized, and others in the future may legalize, online gaming. There are a number of established, well capitalized companies producing and operating online gaming offerings that compete with us. Online gaming is a new and evolving industry and is potentially subject to significant future development, including legal and regulatory development.
The current global trend toward liberalization of gaming restrictions and resulting proliferation of gaming venues could result in a decrease in the number of visitors to our Las Vegas facilities by attracting customers close to home and away from Las Vegas, which could have a material adverse effect on our business, financial condition, results of operations and cash flows. Also, on December 23, 2011, the DOJ released an opinion on the application of the Wire Act to interstate transmission of wire communications, concluding that such communications that did not relate to a “sporting event or contest” fell outside the prohibition of the Wire Act. In concluding as such, the DOJ reversed earlier opinions that the Wire Act was not limited to such communications on sporting events or contests. Those states that permit these distribution channels may also expand the gaming offerings of their lotteries in a manner that could have an adverse effect on our business.
The Sands Expo Center provides recurring demand for mid-week room nights for business travelers who attend meetings, trade shows and conventions in Las Vegas. The Sands Expo Center presently competes with other large convention centers, including convention centers in Las Vegas and other cities. To the extent that these competitors are able to capture a substantially larger portion of the trade show and convention business, there could be a material adverse effect on our business, financial condition, results of operations and cash flows.
37
Certain beneficial owners of our voting securities may be required to file an application with, and be investigated by, the Nevada Gaming Authorities, and the Nevada Commission may restrict the ability of a beneficial owner to receive any benefit from our voting securities and may require the disposition of shares of our voting securities, if a beneficial owner is found to be unsuitable.
Any person who acquires beneficial ownership of more than 10% of our voting securities will be required to apply to the Nevada Commission for a finding of suitability within thirty days after the Chairman of the Nevada Board mails a written notice requiring the filing. Under certain circumstances, an “institutional investor” as defined under the regulations of the Nevada Commission, which acquires beneficial ownership of more than 10%, but not more than 25%, of our voting securities (subject to certain additional holdings as a result of certain debt restructurings or stock repurchase programs under the Nevada Act), may apply to the Nevada Commission for a waiver of such finding of suitability requirement if the institutional investor holds our voting securities only for investment purposes. In addition, any beneficial owner of our voting securities, regardless of the number of shares beneficially owned, may be required at the discretion of the Nevada Commission to file an application for a finding of suitability as such. In either case, a finding of suitability is comparable to licensing and the applicant must pay all costs of investigation incurred by the Nevada Gaming Authorities in conducting the investigation.
Any person who fails or refuses to apply for a finding of suitability or a license within thirty days after being ordered to do so by the Nevada Gaming Authorities may be found unsuitable. The same restrictions apply to a record owner if the record owner, after request, fails to identify the beneficial owner. Any stockholder found unsuitable who holds, directly or indirectly, any beneficial ownership of the common stock of a registered corporation beyond such period of time as may be prescribed by the Nevada Commission may be guilty of a criminal offense. We are subject to disciplinary action if, after we receive notice that a person is unsuitable to be a stockholder or to have any other relationship with us or a licensed subsidiary, we, or any of the licensed subsidiaries:
• | allow that person to exercise, directly or indirectly, any voting right conferred through securities held by that person; |
• | pay remuneration in any form to that person for services rendered or otherwise; or |
• | fail to pursue all lawful efforts to require such unsuitable person to relinquish his or her voting securities including, if necessary, purchasing them for cash at fair market value. |
For a more complete description of the Nevada gaming regulatory requirements applicable to beneficial owners of our voting securities, see “Item 1 — Business — Regulation and Licensing — State of Nevada.”
Certain beneficial owners of our voting securities may be required to file a license application with, and be investigated by, the Pennsylvania Gaming Control Board, the Pennsylvania State Police and other agencies.
Any person who acquires beneficial ownership of 5% or more of our voting securities will be required to apply to the PaGCB for licensure, obtain licensure and remain licensed. Licensure requires, among other things, that the applicant establish by clear and convincing evidence the applicant’s good character, honesty and integrity. Additionally, any trust that holds 5% or more of our voting securities is required to be licensed by the PaGCB and each individual who is a grantor, trustee or beneficiary of the trust is also required to be licensed by the PaGCB. Under certain circumstances and under the regulations of the PaGCB, an “institutional investor” as defined under the regulations of the PaGCB, which acquires beneficial ownership of 5% or more, but less than 10%, of our voting securities, may not be required to be licensed by the PaGCB provided the PaGCB grants a waiver of the licensure requirement. In addition, any beneficial owner of our voting securities, regardless of the number of shares beneficially owned, may be required at the discretion of the PaGCB to file an application for licensure.
Furthermore, a person or a group of persons acting in concert who acquire(s) more than 20% of our securities, with the exception of the ownership interest of a person at the time of original licensure when the license fee was paid, would trigger a “change in control” (as defined under applicable law). Such a change in control could require us to re-apply for licensure by the PaGCB and incur a $50.0 million license fee.
38
In the event a security holder is required to be found qualified and is not found qualified, or fails to apply for qualification, such security holder may be required by the PaGCB to divest of the interest at a price not exceeding the cost of the interest.
For a more complete description of the Pennsylvania gaming regulatory requirements applicable to beneficial owners of our voting securities, see “Item 1 — Business — Regulation and Licensing — Commonwealth of Pennsylvania.”
Labor actions and other labor problems could negatively impact our operations.
Security officers at our Bethlehem, Pennsylvania property recently voted to be represented by a labor union, the International Union, Security, Police, and Fire Professionals of America. We are currently negotiating a first collective bargaining agreement with the union and are hopeful that we will be able to reach agreement without any labor actions; however, the possibility of a disruption is always present in such circumstances. Such a labor dispute, if it occurred, could have a negative impact on our operations.
From time to time, we have experienced attempts by labor organizations to organize certain of our non-union employees. We cannot provide any assurance that we will not experience additional and successful union activity in the future. The impact of this union activity is undetermined and could have a material adverse effect on our business, financial condition, results of operations and cash flows.
If GGP (or any future owner of the Grand Canal Shoppes) breaches any of its material agreements with us or if we are unable to maintain an acceptable working relationship with GGP (or any future owner), there could be a material adverse effect on our financial condition, results of operations and cash flows.
We have entered into agreements with GGP under which, among other things, GGP has agreed to operate the Grand Canal Shoppes subject to, and in accordance with, the cooperation agreement. Our agreements with GGP could be adversely affected in ways that could have a material adverse effect on our financial condition, results of operations and cash flows if we do not maintain an acceptable working relationship with GGP or its successors. For example, the cooperation agreement that governs the relationships between the Grand Canal Shoppes and The Palazzo and The Venetian Las Vegas requires that the owners cooperate in various ways and take various joint actions, which will be more difficult to accomplish, especially in a cost-effective manner, if the parties do not have an acceptable working relationship.
There could be similar material adverse consequences to us if GGP breaches any of its agreements with us, such as its agreement under the cooperation agreement to operate the Grand Canal Shoppes consistent with the standards of first-class restaurant and retail complexes and the overall Venetian theme in the section formerly referred to as The Grand Canal Shoppes, and its various obligations as our landlord under the leases described above. Although our agreements with GGP provide us with various remedies in the event of any breaches by GGP and include various dispute resolution procedures and mechanisms, these remedies, procedures and mechanisms may be inadequate to prevent a material adverse effect on our financial condition, results of operations and cash flows if breaches by GGP occur or if we do not maintain an acceptable working relationship with GGP.
ITEM 1B. — UNRESOLVED STAFF COMMENTS
None.
ITEM 2. — PROPERTIES
We have received concessions from the Macao government to build on a six-acre land site for the Sands Macao and the sites on which The Venetian Macao, Four Seasons Macao, Sands Cotai Central and The Parisian Macao are located. We do not own these land sites in Macao; however, the land concessions grant us exclusive use of the land. Land concessions in Macao generally have an initial term of 25 years with automatic extensions of 10 years thereafter in accordance with Macao law. As specified in the land concessions, we are required to pay premiums, which are either payable in a single lump sum upon acceptance of our land concessions by the Macao government or in seven semi-annual installments, as well as annual rent for the term of the land concession, which may be revised every five years
39
by the Macao government. In October 2008, the Macao government amended our land concession to separate the retail and hotel portions of the Four Seasons Macao parcel and allowed us to subdivide the parcel into four separate components, consisting of retail, hotel/casino, Four Seasons Apartments and parking areas. In consideration for the amendment, we paid an additional land premium of approximately $17.8 million and will pay adjusted annual rent over the remaining term of the concession, which increased slightly due to the revised allocation of parcel use. See “Part II — Item 8 — Financial Statements and Supplementary Data — Notes to Consolidated Financial Statements — Note 5 — Leasehold Interests in Land, Net” for more information on our payment obligation under these land concessions.
Under our land concession for The Parisian Macao, we are required to complete the development by November 2016. The land concession for Sands Cotai Central contains a similar requirement that the development be completed by December 2016. Should we determine that we are unable to complete The Parisian Macao or Sands Cotai Central by their respective deadlines, we would then expect to apply for another extension from the Macao government. If we are unable to meet the current deadlines and the deadlines for either development are not extended, we could lose our land concessions for The Parisian Macao or Sands Cotai Central, which would prohibit us from operating any facilities developed under the respective land concessions. As a result, we could record a charge for all or some portion of the $1.65 billion or $4.87 billion in capitalized construction costs and land premiums (net of amortization) as of December 31, 2015, related to The Parisian Macao and Sands Cotai Central, respectively.
Under the Development Agreement with the STB, we paid SGD 1.2 billion (approximately $848.7 million at exchange rates in effect on December 31, 2015) in premium payments for the 60-year lease of the land on which the Marina Bay Sands is located plus an additional SGD 105.6 million (approximately $74.7 million at exchange rates in effect on December 31, 2015) for various taxes and other fees.
We own an approximately 63-acre parcel of land on which our Las Vegas Operating Properties are located and an approximately 19-acre parcel of land located to the east of the 63-acre parcel. We own these parcels of land in fee simple, subject to certain easements, encroachments and other non-monetary encumbrances. LVSLLC’s credit facility, subject to certain exceptions, is collateralized by a first priority security interest (subject to permitted liens) in substantially all of LVSLLC’s property.
The Sands Bethlehem resort is located on the site of the historic Bethlehem Steel Works in Bethlehem, Pennsylvania, which is about 70 miles from midtown Manhattan, New York. In September 2008, our joint venture partner, Bethworks Now, LLC, contributed the land on which Sands Bethlehem is located to Sands Bethworks Gaming and Sands Bethworks Retail, a portion of which was contributed through a condominium form of ownership.
In March 2004, we entered into a long-term lease with a third party for the airspace over which a portion of The Shoppes at The Palazzo was constructed (the “Leased Airspace”). In January 2008, we acquired fee title from the same third party to the airspace above the Leased Airspace (the “Acquired Airspace”) in order to build a high-rise residential condominium tower (the "Las Vegas Condo Tower") that was being constructed on the Las Vegas Strip between The Palazzo and The Venetian Las Vegas. In February 2008, in connection with the sale of The Shoppes at The Palazzo, GGP acquired control of the Leased Airspace. We continue to retain fee title to the Acquired Airspace in order to resume building when market conditions improve.
ITEM 3. — LEGAL PROCEEDINGS
In addition to the matters described at “Part II — Item 8 — Financial Statements and Supplementary Data — Notes to Consolidated Financial Statements — Note 13 — Commitments and Contingencies — Litigation,” we are party to various legal matters and claims arising in the ordinary course of business. Management has made certain estimates for potential litigation costs based upon consultation with legal counsel. Actual results could differ from these estimates; however, in the opinion of management, such litigation and claims will not have a material adverse effect on our financial condition, results of operations and cash flows.
ITEM 4. — MINE SAFETY DISCLOSURES
Not applicable.
40
PART II
ITEM 5. — MARKET FOR REGISTRANT’S COMMON EQUITY, RELATED STOCKHOLDER MATTERS AND ISSUER PURCHASES OF EQUITY SECURITIES
Market Information
The Company’s common stock trades on the NYSE under the symbol “LVS.” The following table sets forth the high and low sales prices for the common stock on the NYSE for the fiscal quarter indicated:
High | Low | ||||||
2014 | |||||||
First Quarter | $ | 88.28 | $ | 69.15 | |||
Second Quarter | $ | 84.24 | $ | 71.09 | |||
Third Quarter | $ | 78.50 | $ | 59.08 | |||
Fourth Quarter | $ | 65.83 | $ | 49.82 | |||
2015 | |||||||
First Quarter | $ | 61.59 | $ | 51.24 | |||
Second Quarter | $ | 59.90 | $ | 49.57 | |||
Third Quarter | $ | 57.77 | $ | 37.40 | |||
Fourth Quarter | $ | 52.14 | $ | 36.53 | |||
2016 | |||||||
First Quarter (through February 22, 2016) | $ | 48.28 | $ | 34.88 | |||
As of February 22, 2016, there were 794,694,494 shares of our common stock outstanding that were held by 391 stockholders of record.
Dividends
Our ability to declare and pay dividends on our common stock is subject to the requirements of Nevada law. In addition, we are a parent company with limited business operations of our own. Accordingly, our primary sources of cash are dividends and distributions with respect to our ownership interest in our subsidiaries that are derived from the earnings and cash flow generated by our operating properties.
Our subsidiaries’ long-term debt arrangements place restrictions on their ability to pay cash dividends to the Company. This may restrict our ability to pay cash dividends other than from cash on hand. See “Item 7 — Management’s Discussion and Analysis of Financial Condition and Results of Operations — Restrictions on Distributions” and “Item 8 — Financial Statements and Supplementary Data — Notes to Consolidated Financial Statements — Note 8 — Long-Term Debt.”
Common Stock Dividends
On March 31, June 30, September 30 and December 31, 2015, we paid a dividend of $0.65 per common share as part of a regular cash dividend program. During the year ended December 31, 2015, we recorded $2.07 billion as a distribution against retained earnings (of which $1.12 billion related to our Principal Stockholder and his family and the remaining $949.2 million related to all other stockholders).
On March 31, June 30, September 30 and December 29, 2014, we paid a dividend of $0.50 per common share as part of a regular cash dividend program. During the year ended December 31, 2014, we recorded $1.61 billion as a distribution against retained earnings (of which $863.3 million related to our Principal Stockholder and his family and the remaining $744.8 million related to all other stockholders).
On March 29, June 28, September 27 and December 31, 2013, we paid a dividend of $0.35 per common share as part of a regular cash dividend program. During the year ended December 31, 2013, we recorded $1.15 billion as a distribution against retained earnings (of which $604.2 million related to our Principal Stockholder and his family and the remaining $548.9 million related to all other stockholders).
41
In January 2016, our Board of Directors declared a quarterly dividend of $0.72 per common share (a total estimated to be approximately $572 million) to be paid on March 31, 2016, to shareholders of record on March 22, 2016. We expect this level of dividend to continue quarterly through the remainder of 2016. Our Board of Directors will continually assess the level and appropriateness of any cash dividends.
Recent Sales of Unregistered Securities
There have not been any sales by the Company of equity securities in the last three fiscal years that have not been registered under the Securities Act of 1933.
Purchases of Equity Securities by the Issuer
The following table provides information about share repurchases we made of our common stock during the quarter ended December 31, 2015:
Period | Total Number of Shares Purchased | Weighted Average Price Paid Per Share(1) | Total Number of Shares Purchased as Part of a Publicly Announced Program | Approximate Dollar Value of Shares that May Yet Be Purchased Under the Program (in thousands)(2) | ||||||||||
October 1, 2015 — October 31, 2015 | — | $ | — | — | $ | 1,620,027 | ||||||||
November 1, 2015 — November 30, 2015 | 674,118 | $ | 46.05 | 674,118 | $ | 1,588,983 | ||||||||
December 1, 2015 — December 31, 2015 | 673,554 | $ | 43.06 | 673,554 | $ | 1,559,983 | ||||||||
(1) | Calculated excluding commissions. |
(2) | In June 2013, our Board of Directors announced a stock repurchase program with an initial authorization of $2.0 billion, which expired on June 5, 2015, but was substantially completed during the year ended December 31, 2014. In October 2014, our Board of Directors authorized the repurchase of an additional $2.0 billion of our outstanding common stock, which expires on October 9, 2016. All repurchases under the stock repurchase program are made from time to time at our discretion in accordance with applicable federal securities laws. All share repurchases of our common stock have been recorded as treasury shares. |
42
Performance Graph
The following performance graph compares the performance of our common stock with the performance of the Standard & Poor’s 500 Index and the Dow Jones US Gambling Index, during the five years ended December 31, 2015. The graph plots the changes in value of an initial $100 investment over the indicated time period, assuming all dividends are reinvested. The stock price performance in this graph is not necessarily indicative of future stock price performance.
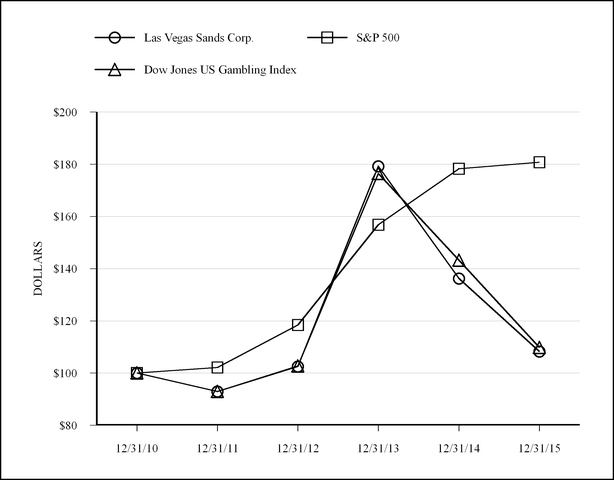
Cumulative Total Return | |||||||||||||||||||||||
12/31/2010 | 12/31/2011 | 12/31/2012 | 12/31/2013 | 12/31/2014 | 12/31/2015 | ||||||||||||||||||
Las Vegas Sands Corp. | $ | 100.00 | $ | 92.99 | $ | 102.56 | $ | 179.24 | $ | 136.20 | $ | 108.27 | |||||||||||
S&P 500 | $ | 100.00 | $ | 102.11 | $ | 118.45 | $ | 156.82 | $ | 178.29 | $ | 180.75 | |||||||||||
Dow Jones US Gambling Index | $ | 100.00 | $ | 92.95 | $ | 102.73 | $ | 176.43 | $ | 143.24 | $ | 109.82 | |||||||||||
The performance graph should not be deemed filed or incorporated by reference into any other Company filing under the Securities Act of 1933 or the Exchange Act of 1934, except to the extent the Company specifically incorporates the performance graph by reference therein.
43
ITEM 6. — SELECTED FINANCIAL DATA
The following reflects selected historical financial data that should be read in conjunction with “Item 7 — Management’s Discussion and Analysis of Financial Condition and Results of Operations” and the consolidated financial statements and notes thereto included elsewhere in this Annual Report on Form 10-K. The information as of December 31, 2013, 2012 and 2011, have been reclassified to conform to the current presentation. The historical results are not necessarily indicative of the results of operations to be expected in the future.
Year Ended December 31, | |||||||||||||||||||
2015(1) | 2014(2)(3) | 2013(4)(5)(6) | 2012(7)(8)(9) | 2011(10) | |||||||||||||||
(In thousands, except per share data) | |||||||||||||||||||
STATEMENT OF OPERATIONS DATA | |||||||||||||||||||
Gross revenues | $ | 12,414,350 | $ | 15,425,788 | $ | 14,494,436 | $ | 11,684,669 | $ | 9,862,334 | |||||||||
Less — promotional allowances | (725,889 | ) | (841,939 | ) | (724,551 | ) | (553,537 | ) | (451,589 | ) | |||||||||
Net revenues | 11,688,461 | 14,583,849 | 13,769,885 | 11,131,132 | 9,410,745 | ||||||||||||||
Operating expenses | 8,846,986 | 10,484,623 | 10,361,642 | 8,819,750 | 7,020,858 | ||||||||||||||
Operating income | 2,841,475 | 4,099,226 | 3,408,243 | 2,311,382 | 2,389,887 | ||||||||||||||
Interest, net | (250,135 | ) | (248,538 | ) | (254,874 | ) | (235,312 | ) | (268,555 | ) | |||||||||
Other income (expense) | 30,542 | 1,965 | 4,321 | 5,740 | (3,955 | ) | |||||||||||||
Loss on modification or early retirement of debt | — | (19,942 | ) | (14,178 | ) | (19,234 | ) | (22,554 | ) | ||||||||||
Income before income taxes | 2,621,882 | 3,832,711 | 3,143,512 | 2,062,576 | 2,094,823 | ||||||||||||||
Income tax expense | (236,185 | ) | (244,640 | ) | (188,836 | ) | (180,763 | ) | (211,704 | ) | |||||||||
Net income | 2,385,697 | 3,588,071 | 2,954,676 | 1,881,813 | 1,883,119 | ||||||||||||||
Net income attributable to noncontrolling interests | (419,461 | ) | (747,442 | ) | (648,679 | ) | (357,720 | ) | (322,996 | ) | |||||||||
Net income attributable to Las Vegas Sands Corp. | 1,966,236 | 2,840,629 | 2,305,997 | 1,524,093 | 1,560,123 | ||||||||||||||
Preferred stock dividends | — | — | — | — | (63,924 | ) | |||||||||||||
Accretion to redemption value of preferred stock issued to Principal Stockholder’s family | — | — | — | — | (80,975 | ) | |||||||||||||
Preferred stock inducement, repurchase and redemption premiums | — | — | — | — | (145,716 | ) | |||||||||||||
Net income attributable to common stockholders | $ | 1,966,236 | $ | 2,840,629 | $ | 2,305,997 | $ | 1,524,093 | $ | 1,269,508 | |||||||||
Per share data: | |||||||||||||||||||
Basic earnings per share | $ | 2.47 | $ | 3.52 | $ | 2.80 | $ | 1.89 | $ | 1.74 | |||||||||
Diluted earnings per share | $ | 2.47 | $ | 3.52 | $ | 2.79 | $ | 1.85 | $ | 1.56 | |||||||||
Cash dividends declared per common share | $ | 2.60 | $ | 2.00 | $ | 1.40 | $ | 3.75 | $ | — | |||||||||
OTHER DATA | |||||||||||||||||||
Capital expenditures | $ | 1,528,642 | $ | 1,178,656 | $ | 898,111 | $ | 1,449,234 | $ | 1,508,493 | |||||||||
December 31, | |||||||||||||||||||
2015(1) | 2014(2) | 2013(5) | 2012(9) | 2011(10) | |||||||||||||||
(In thousands) | |||||||||||||||||||
BALANCE SHEET DATA | |||||||||||||||||||
Total assets | $ | 20,987,421 | $ | 22,354,047 | $ | 22,710,912 | $ | 22,163,969 | $ | 22,195,856 | |||||||||
Long-term debt | $ | 9,372,645 | $ | 9,892,913 | $ | 9,382,752 | $ | 10,132,265 | $ | 9,577,131 | |||||||||
Total Las Vegas Sands Corp. stockholders’ equity | $ | 6,816,741 | $ | 7,213,586 | $ | 7,665,494 | $ | 7,061,842 | $ | 7,850,689 | |||||||||
_________________________
(1) | During the year ended December 31, 2015, we paid a quarterly dividend of $0.65 per common share as part of a regular cash dividend program. |
44
(2) | During the year ended December 31, 2014, we paid a quarterly dividend of $0.50 per common share as part of a regular cash dividend program. |
(3) | During the year ended December 31, 2014, we received a $90.1 million property tax refund related to a property tax settlement at Marina Bay Sands for the years 2010 through 2014. |
(4) | The second Sheraton tower of Sands Cotai Central opened in January 2013. |
(5) | During the year ended December 31, 2013, we paid a quarterly dividend of $0.35 per common share as part of a regular cash dividend program. |
(6) | During the year ended December 31, 2013, we recorded a legal settlement expense of $47.4 million. |
(7) | The Conrad and Holiday Inn tower and the first Sheraton tower of Sands Cotai Central opened in April and September 2012, respectively. |
(8) | During the year ended December 31, 2012, we recorded an impairment loss of $143.7 million, consisting primarily of a $100.7 million write-off of capitalized construction costs related to our former Cotai Strip development (referred to as parcels 7 and 8) in Macao and a $42.9 million impairment due to the termination of the ZAiA show at The Venetian Macao. |
(9) | During the year ended December 31, 2012, we paid a quarterly dividend of $0.25 per common share as part of a regular cash dividend program. Additionally, on December 18, 2012, we paid a special cash dividend of $2.75 per common share. |
(10) | During the year ended December 31, 2011, we repurchased, redeemed or induced holders to redeem all outstanding preferred stock, which resulted in a charge to retained earnings of $145.7 million and is also included in the calculation of net income attributable to common stockholders. |
ITEM 7. — MANAGEMENT’S DISCUSSION AND ANALYSIS OF FINANCIAL CONDITION AND RESULTS OF OPERATIONS
The following discussion should be read in conjunction with, and is qualified in its entirety by, the audited consolidated financial statements, and the notes thereto and other financial information included in this Form 10-K. Certain statements in this “Management’s Discussion and Analysis of Financial Condition and Results of Operations” are forward-looking statements. See “— Special Note Regarding Forward-Looking Statements.”
Operations
We view each of our integrated resort properties as an operating segment. Our Macao operating segments consist of The Venetian Macao, Sands Cotai Central, Four Seasons Macao, Sands Macao and other ancillary operations that support these properties. Our Singapore operating segment consists of the Marina Bay Sands. Our operating segments in the U.S. consist of The Venetian Las Vegas, The Palazzo and Sands Bethlehem. The Venetian Las Vegas and The Palazzo operating segments are managed as a single integrated resort and have been aggregated into our Las Vegas Operating Properties, considering their similar economic characteristics, types of customers, types of services and products, the regulatory business environment of the operations within each segment and the Company’s organizational and management reporting structure. For the years ended December 31, 2015 and 2014, gross revenue at our reportable segments was derived as follows:
• | At The Venetian Macao, approximately 80.8% and 84.2%, respectively, was from gaming activities, with the remainder from room, mall, food and beverage and other non-gaming sources. |
• | At Sands Cotai Central, approximately 80.3% and 83.9%, respectively, was from gaming activities, with the remainder primarily from room and food and beverage operations. |
• | At Four Seasons Macao, approximately 72.6% and 81.5%, respectively, was from gaming activities, with the remainder primarily from mall and room operations. |
• | At Sands Macao, approximately 92.8% and 94.0%, respectively, was from gaming activities, with the remainder primarily from food and beverage operations. |
• | At Marina Bay Sands, approximately 73.9% and 75.2%, respectively, was from gaming activities, with the remainder from room, food and beverage, mall and other non-gaming sources. |
• | At our Las Vegas Operating Properties, approximately 71.6% and 67.6%, respectively, was from room, food and beverage and other non-gaming sources, with the remainder from gaming activities. The percentage of |
45
non-gaming revenue reflects the integrated resort’s emphasis on the group convention and trade show business and the resulting high occupancy and room rates throughout the week, including during mid-week periods.
• | At Sands Bethlehem, approximately 88.3% and 88.2%, respectively, was from gaming activities, with the remainder primarily from food and beverage and other non-gaming sources. |
Summary Financial Results
The following table summarizes our results of operations:
Year Ended December 31, | |||||||||||||||||
2015 | Percent Change | 2014 | Percent Change | 2013 | |||||||||||||
(Dollars in thousands) | |||||||||||||||||
Net revenues | $ | 11,688,461 | (19.9 | )% | $ | 14,583,849 | 5.9 | % | $ | 13,769,885 | |||||||
Operating expenses | 8,846,986 | (15.6 | )% | 10,484,623 | 1.2 | % | 10,361,642 | ||||||||||
Operating income | 2,841,475 | (30.7 | )% | 4,099,226 | 20.3 | % | 3,408,243 | ||||||||||
Income before income taxes | 2,621,882 | (31.6 | )% | 3,832,711 | 21.9 | % | 3,143,512 | ||||||||||
Net income | 2,385,697 | (33.5 | )% | 3,588,071 | 21.4 | % | 2,954,676 | ||||||||||
Net income attributable to Las Vegas Sands Corp. | 1,966,236 | (30.8 | )% | 2,840,629 | 23.2 | % | 2,305,997 | ||||||||||
Percent of Net Revenues Year Ended December 31, | ||||||||
2015 | 2014 | 2013 | ||||||
Operating expenses | 75.7 | % | 71.9 | % | 75.2 | % | ||
Operating income | 24.3 | % | 28.1 | % | 24.8 | % | ||
Income before income taxes | 22.4 | % | 26.3 | % | 22.8 | % | ||
Net income | 20.4 | % | 24.6 | % | 21.5 | % | ||
Net income attributable to Las Vegas Sands Corp. | 16.8 | % | 19.5 | % | 16.7 | % | ||
Our historical financial results will not be indicative of our future results as we continue to develop and open new properties, including The Parisian Macao and the remainder of Sands Cotai Central.
Key Operating Revenue Measurements
Operating revenues at The Venetian Macao, Sands Cotai Central, Four Seasons Macao, Marina Bay Sands and our Las Vegas Operating Properties are dependent upon the volume of customers who stay at the hotel, which affects the price that can be charged for hotel rooms and our gaming volume. Operating revenues at Sands Macao and Sands Bethlehem are principally driven by casino customers who visit the properties on a daily basis.
The following are the key measurements we use to evaluate operating revenues:
Casino revenue measurements for Macao and Singapore: Macao and Singapore table games are segregated into two groups, consistent with the Macao and Singapore markets’ convention: Rolling Chip play (all VIP players) and Non-Rolling Chip play (mostly non-VIP players). The volume measurement for Rolling Chip play is non-negotiable gaming chips wagered and lost. The volume measurement for Non-Rolling Chip play is table games drop (“drop”), which is the sum of markers issued (credit instruments), cash deposited in the table drop box and gaming chips purchased at the cage. Rolling Chip and Non-Rolling Chip volume measurements are not comparable as the amounts wagered and lost are substantially higher than the amounts dropped. Slot handle (“handle”), also a volume measurement, is the gross amount wagered for the period cited.
We view Rolling Chip win as a percentage of Rolling Chip volume, Non-Rolling Chip win as a percentage of drop and slot hold as a percentage of slot handle. Win or hold percentage represents the percentage of Rolling Chip volume, Non-Rolling Chip drop or slot handle that is won by the casino and recorded as casino revenue. Based upon our mix of table games, our Rolling Chip win percentage (calculated before discounts and commissions) is expected
46
to be 2.7% to 3.0%. Generally, slot machine play is conducted on a cash basis. In Macao and Singapore, 23.1% and 33.1%, respectively, of our table games play was conducted on a credit basis for the year ended December 31, 2015.
Casino revenue measurements for the U.S.: The volume measurements in the U.S. are slot handle, as previously described, and table games drop which is the total amount of cash and net markers issued that are deposited in the table drop box. We view table games win as a percentage of drop and slot hold as a percentage of handle. Based upon our mix of table games, our table games are expected to produce a win percentage (calculated before discounts) of 21% to 29% for Baccarat and 16% to 20% for non-Baccarat. As in Macao and Singapore, slot machine play is generally conducted on a cash basis. Approximately 67.4% of our table games play at our Las Vegas Operating Properties, for the year ended December 31, 2015, was conducted on a credit basis, while our table games play in Pennsylvania is primarily conducted on a cash basis.
Hotel revenue measurements: Performance indicators used are occupancy rate, which is the average percentage of available hotel rooms occupied during a period, and average daily room rate, which is the average price of occupied rooms per day. The calculations of the hotel occupancy and average daily room rates include the impact of rooms provided on a complimentary basis. Complimentary room rates are determined based on an analysis of retail (or cash) room rates by customer segment and type of room product to ensure the complimentary room rates are consistent with retail rates. Revenue per available room represents a summary of hotel average daily room rates and occupancy. Because not all available rooms are occupied, average daily room rates are normally higher than revenue per available room. Reserved rooms where the guests do not show up for their stay and lose their deposit may be re-sold to walk-in guests. These rooms are considered to be occupied twice for statistical purposes due to obtaining the original deposit and the walk-in guest revenue. In cases where a significant number of rooms are resold, occupancy rates may be in excess of 100% and revenue per available room may be higher than the average daily room rate.
Mall revenue measurements: Occupancy, base rent per square foot and tenant sales per square foot are used as performance indicators. Occupancy represents gross leasable occupied area (“GLOA”) divided by gross leasable area (“GLA”) at the end of the reporting period. GLOA is the sum of: (1) tenant occupied space under lease and (2) tenants no longer occupying space, but paying rent. GLA does not include space that is currently under development or not on the market for lease. Base rent per square foot is the weighted average base, or minimum, rent charge in effect at the end of the reporting period for all tenants that would qualify to be included in occupancy. Tenant sales per square foot is the sum of reported comparable sales for the trailing 12 months divided by the comparable square footage for the same period. Only tenants that have been open for a minimum of 12 months are included in the tenant sales per square foot calculation.
Year Ended December 31, 2015 Compared to the Year Ended December 31, 2014
Operating Revenues
Our net revenues consisted of the following:
Year Ended December 31, | ||||||||||
2015 | 2014 | Percent Change | ||||||||
(Dollars in thousands) | ||||||||||
Casino | $ | 9,083,004 | $ | 12,004,361 | (24.3 | )% | ||||
Rooms | 1,469,874 | 1,540,420 | (4.6 | )% | ||||||
Food and beverage | 757,512 | 778,769 | (2.7 | )% | ||||||
Mall | 564,309 | 553,534 | 1.9 | % | ||||||
Convention, retail and other | 539,651 | 548,704 | (1.6 | )% | ||||||
12,414,350 | 15,425,788 | (19.5 | )% | |||||||
Less — promotional allowances | (725,889 | ) | (841,939 | ) | 13.8 | % | ||||
Total net revenues | $ | 11,688,461 | $ | 14,583,849 | (19.9 | )% | ||||
Consolidated net revenues were $11.69 billion for the year ended December 31, 2015, a decrease of $2.90 billion compared to $14.58 billion for the year ended December 31, 2014. The decrease in net revenues was driven by decreases of $2.72 billion at our Macao operating properties and $261.8 million at Marina Bay Sands, primarily due to decreased casino revenues.
47
Casino revenues decreased $2.92 billion compared to the year ended December 31, 2014. The decrease is primarily attributable to a decrease of $2.65 billion at our Macao operating properties, driven by a decrease in Rolling Chip volume as demand has decreased in the VIP market, and a $259.4 million decrease at Marina Bay Sands, driven by a decrease in Rolling Chip win percentage. The following table summarizes the results of our casino activity:
Year Ended December 31, | ||||||||||
2015 | 2014 | Change | ||||||||
(Dollars in thousands) | ||||||||||
Macao Operations: | ||||||||||
The Venetian Macao | ||||||||||
Total casino revenues | $ | 2,532,944 | $ | 3,554,352 | (28.7)% | |||||
Non-Rolling Chip drop | $ | 7,029,707 | $ | 8,960,823 | (21.6)% | |||||
Non-Rolling Chip win percentage | 24.5 | % | 25.2 | % | (0.7) pts | |||||
Rolling Chip volume | $ | 31,024,643 | $ | 47,871,382 | (35.2)% | |||||
Rolling Chip win percentage | 3.08 | % | 3.22 | % | (0.14) pts | |||||
Slot handle | $ | 4,092,810 | $ | 5,564,597 | (26.4)% | |||||
Slot hold percentage | 4.8 | % | 4.8 | % | — | |||||
Sands Cotai Central | ||||||||||
Total casino revenues | $ | 1,878,503 | $ | 2,801,441 | (32.9)% | |||||
Non-Rolling Chip drop | $ | 6,025,778 | $ | 7,432,536 | (18.9)% | |||||
Non-Rolling Chip win percentage | 21.5 | % | 21.8 | % | (0.3) pts | |||||
Rolling Chip volume | $ | 19,678,778 | $ | 46,860,574 | (58.0)% | |||||
Rolling Chip win percentage | 3.08 | % | 3.08 | % | — | |||||
Slot handle | $ | 6,128,318 | $ | 7,630,366 | (19.7)% | |||||
Slot hold percentage | 3.5 | % | 3.5 | % | — | |||||
Four Seasons Macao | ||||||||||
Total casino revenues | $ | 535,631 | $ | 948,110 | (43.5)% | |||||
Non-Rolling Chip drop | $ | 1,058,230 | $ | 1,335,935 | (20.8)% | |||||
Non-Rolling Chip win percentage | 22.6 | % | 24.0 | % | (1.4) pts | |||||
Rolling Chip volume | $ | 13,390,165 | $ | 27,072,914 | (50.5)% | |||||
Rolling Chip win percentage | 3.23 | % | 3.36 | % | (0.13) pts | |||||
Slot handle | $ | 475,997 | $ | 830,186 | (42.7)% | |||||
Slot hold percentage | 6.1 | % | 5.1 | % | 1.0 pts | |||||
Sands Macao | ||||||||||
Total casino revenues | $ | 853,891 | $ | 1,148,477 | (25.7)% | |||||
Non-Rolling Chip drop | $ | 3,035,159 | $ | 3,937,850 | (22.9)% | |||||
Non-Rolling Chip win percentage | 18.4 | % | 18.1 | % | 0.3 pts | |||||
Rolling Chip volume | $ | 9,608,377 | $ | 17,663,497 | (45.6)% | |||||
Rolling Chip win percentage | 3.36 | % | 2.98 | % | 0.38 pts | |||||
Slot handle | $ | 2,737,376 | $ | 3,236,093 | (15.4)% | |||||
Slot hold percentage | 3.5 | % | 3.7 | % | (0.2) pts | |||||
Singapore Operations: | ||||||||||
Marina Bay Sands | ||||||||||
Total casino revenues | $ | 2,315,388 | $ | 2,574,782 | (10.1)% | |||||
Non-Rolling Chip drop | $ | 4,204,525 | $ | 4,498,674 | (6.5)% | |||||
Non-Rolling Chip win percentage | 27.0 | % | 25.1 | % | 1.9 pts | |||||
Rolling Chip volume | $ | 41,149,059 | $ | 42,558,012 | (3.3)% | |||||
Rolling Chip win percentage | 2.79 | % | 3.30 | % | (0.51) pts | |||||
Slot handle | $ | 12,878,788 | $ | 12,368,193 | 4.1% | |||||
Slot hold percentage | 4.5 | % | 4.9 | % | (0.4) pts | |||||
U.S. Operations: | ||||||||||
Las Vegas Operating Properties | ||||||||||
Total casino revenues | $ | 455,539 | $ | 509,205 | (10.5)% | |||||
Table games drop | $ | 2,080,032 | $ | 2,139,545 | (2.8)% | |||||
Table games win percentage | 15.9 | % | 19.9 | % | (4.0) pts | |||||
Slot handle | $ | 2,408,527 | $ | 2,114,522 | 13.9% | |||||
Slot hold percentage | 8.1 | % | 8.2 | % | (0.1) pts | |||||
Sands Bethlehem | ||||||||||
Total casino revenues | $ | 511,108 | $ | 467,994 | 9.2% | |||||
Table games drop | $ | 1,133,944 | $ | 1,062,648 | 6.7% | |||||
Table games win percentage | 17.9 | % | 16.8 | % | 1.1 pts | |||||
Slot handle | $ | 4,273,801 | $ | 4,016,223 | 6.4% | |||||
Slot hold percentage | 7.0 | % | 7.0 | % | — | |||||
48
In our experience, average win percentages remain steady when measured over extended periods of time, but can vary considerably within shorter time periods as a result of the statistical variances that are associated with games of chance in which large amounts are wagered.
Room revenues decreased $70.5 million compared to the year ended December 31, 2014. The decrease is primarily due to decreases of $100.2 million at our Macao operating properties and $24.6 million at Marina Bay Sands, driven by decreased occupancy and average daily room rates, partially offset by a $52.5 million increase at our Las Vegas Operating Properties, driven by increased occupancy and average daily room rates. The suites at Sands Macao are primarily provided to casino patrons on a complimentary basis. The following table summarizes the results of our room activity:
Year Ended December 31, | ||||||||||
2015 | 2014 | Change | ||||||||
(Room revenues in thousands) | ||||||||||
Macao Operations: | ||||||||||
The Venetian Macao | ||||||||||
Total room revenues | $ | 213,660 | $ | 258,863 | (17.5)% | |||||
Occupancy rate | 84.0 | % | 91.3 | % | (7.3) pts | |||||
Average daily room rate | $ | 243 | $ | 270 | (10.0)% | |||||
Revenue per available room | $ | 204 | $ | 246 | (17.1)% | |||||
Sands Cotai Central | ||||||||||
Total room revenues | $ | 272,729 | $ | 320,875 | (15.0)% | |||||
Occupancy rate | 83.1 | % | 88.5 | % | (5.4) pts | |||||
Average daily room rate | $ | 157 | $ | 176 | (10.8)% | |||||
Revenue per available room | $ | 131 | $ | 156 | (16.0)% | |||||
Four Seasons Macao | ||||||||||
Total room revenues | $ | 42,284 | $ | 47,755 | (11.5)% | |||||
Occupancy rate | 82.0 | % | 87.0 | % | (5.0) pts | |||||
Average daily room rate | $ | 376 | $ | 400 | (6.0)% | |||||
Revenue per available room | $ | 308 | $ | 348 | (11.5)% | |||||
Sands Macao | ||||||||||
Total room revenues | $ | 22,735 | $ | 24,066 | (5.5)% | |||||
Occupancy rate | 99.3 | % | 98.6 | % | 0.7 pts | |||||
Average daily room rate | $ | 220 | $ | 238 | (7.6)% | |||||
Revenue per available room | $ | 218 | $ | 235 | (7.2)% | |||||
Singapore Operations: | ||||||||||
Marina Bay Sands | ||||||||||
Total room revenues | $ | 359,332 | $ | 383,954 | (6.4)% | |||||
Occupancy rate | 96.3 | % | 99.0 | % | (2.7) pts | |||||
Average daily room rate | $ | 404 | $ | 431 | (6.3)% | |||||
Revenue per available room | $ | 389 | $ | 427 | (8.9)% | |||||
U.S. Operations: | ||||||||||
Las Vegas Operating Properties | ||||||||||
Total room revenues | $ | 543,994 | $ | 491,493 | 10.7% | |||||
Occupancy rate | 91.8 | % | 88.0 | % | 3.8 pts | |||||
Average daily room rate | $ | 233 | $ | 222 | 5.0% | |||||
Revenue per available room | $ | 214 | $ | 196 | 9.2% | |||||
Sands Bethlehem | ||||||||||
Total room revenues | $ | 15,140 | $ | 13,414 | 12.9% | |||||
Occupancy rate | 91.5 | % | 83.4 | % | 8.1 pts | |||||
Average daily room rate | $ | 151 | $ | 146 | 3.4% | |||||
Revenue per available room | $ | 138 | $ | 122 | 13.1% | |||||
Food and beverage revenues decreased $21.3 million compared to the year ended December 31, 2014. The decrease was primarily due to a $53.5 million decrease at our Macao operating properties, driven by a decrease in
49
property visitation, partially offset by a $29.6 million increase at our Las Vegas Operating Properties, driven by an increase in banquet operations.
Mall revenues increased $10.8 million compared to the year ended December 31, 2014. The increase was primarily due to a $16.4 million increase at our Macao operating properties, driven by an increase in base rents. For further information related to the financial performance of our malls, see"— Additional Information Regarding our Retail Mall Operations." The following table summarizes the results of our mall activity:
Year Ended December 31, | ||||||||||
2015 | 2014 | Change | ||||||||
(Mall revenues in thousands) | ||||||||||
Macao Operations: | ||||||||||
Shoppes at Venetian | ||||||||||
Total mall revenues | $ | 204,624 | $ | 191,631 | 6.8% | |||||
Mall gross leasable area (in square feet) | 780,165 | 771,345 | 1.1% | |||||||
Occupancy | 97.8 | % | 93.4 | % | 4.4 pts | |||||
Base rent per square foot | $ | 223 | $ | 212 | 5.2% | |||||
Tenant sales per square foot | $ | 1,469 | $ | 1,673 | (12.2)% | |||||
Shoppes at Cotai Central(1) | ||||||||||
Total mall revenues | $ | 61,905 | $ | 56,408 | 9.7% | |||||
Mall gross leasable area (in square feet) | 331,499 | 330,258 | 0.4% | |||||||
Occupancy | 97.9 | % | 97.9 | % | — | |||||
Base rent per square foot | $ | 153 | $ | 136 | 12.5% | |||||
Tenant sales per square foot | $ | 896 | $ | 1,450 | (38.2)% | |||||
Shoppes at Four Seasons | ||||||||||
Total mall revenues | $ | 130,220 | $ | 132,326 | (1.6)% | |||||
Mall gross leasable area (in square feet) | 259,394 | 257,963 | 0.6% | |||||||
Occupancy | 99.0 | % | 99.2 | % | (0.2) pts | |||||
Base rent per square foot | $ | 454 | $ | 418 | 8.6% | |||||
Tenant sales per square foot | $ | 3,423 | $ | 5,689 | (39.8)% | |||||
Singapore Operations: | ||||||||||
The Shoppes at Marina Bay Sands | ||||||||||
Total mall revenues | $ | 163,466 | $ | 169,257 | (3.4)% | |||||
Mall gross leasable area (in square feet) | 644,719 | 648,778 | (0.6)% | |||||||
Occupancy | 95.2 | % | 96.1 | % | (0.9) pts | |||||
Base rent per square foot | $ | 214 | $ | 220 | (2.7)% | |||||
Tenant sales per square foot | $ | 1,361 | $ | 1,426 | (4.6)% | |||||
U.S. Operations: | ||||||||||
The Outlets at Sands Bethlehem | ||||||||||
Total mall revenues | $ | 4,094 | $ | 3,912 | 4.7% | |||||
Mall gross leasable area (in square feet) | 151,029 | 151,029 | — | |||||||
Occupancy | 95.1 | % | 97.0 | % | (1.9) pts | |||||
Base rent per square foot | $ | 21 | $ | 20 | 5.0% | |||||
Tenant sales per square foot | $ | 354 | $ | 365 | (3.0)% | |||||
_________________________
(1) | The third phase of the Shoppes at Cotai Central opened in June 2014. At completion, the Shoppes at Cotai Central will feature up to 600,000 square feet of gross leasable area. |
50
Operating Expenses
The breakdown of operating expenses is as follows:
Year Ended December 31, | ||||||||||
2015 | 2014 | Percent Change | ||||||||
(Dollars in thousands) | ||||||||||
Casino | $ | 5,113,870 | $ | 6,705,534 | (23.7 | )% | ||||
Rooms | 262,440 | 256,835 | 2.2 | % | ||||||
Food and beverage | 402,660 | 392,560 | 2.6 | % | ||||||
Mall | 61,299 | 69,732 | (12.1 | )% | ||||||
Convention, retail and other | 276,821 | 320,759 | (13.7 | )% | ||||||
Provision for doubtful accounts | 155,635 | 186,722 | (16.6 | )% | ||||||
General and administrative | 1,267,415 | 1,258,133 | 0.7 | % | ||||||
Corporate | 176,169 | 174,750 | 0.8 | % | ||||||
Pre-opening | 47,509 | 26,230 | 81.1 | % | ||||||
Development | 10,372 | 14,325 | (27.6 | )% | ||||||
Depreciation and amortization | 998,919 | 1,031,589 | (3.2 | )% | ||||||
Amortization of leasehold interests in land | 38,645 | 40,598 | (4.8 | )% | ||||||
Loss on disposal of assets | 35,232 | 6,856 | 413.9 | % | ||||||
Total operating expenses | $ | 8,846,986 | $ | 10,484,623 | (15.6 | )% | ||||
Operating expenses were $8.85 billion for the year ended December 31, 2015, a decrease of $1.64 billion compared to $10.48 billion for the year ended December 31, 2014. The decrease in operating expenses was primarily due to a decrease in casino expenses at our Macao operating properties.
Casino expenses decreased $1.59 billion compared to the year ended December 31, 2014. Of the decrease, $1.31 billion was due to the 39% gross win tax on decreased casino revenues at our Macao operating properties. The remaining decrease is primarily attributable to decreases in junket commissions, as well as the implementation of certain cost control measures at our Macao operating properties.
Convention, retail and other expenses decreased $43.9 million compared to the year ended December 31, 2014. The decrease was primarily due to decreases of $22.5 million and $13.2 million at our Macao operating properties and our Las Vegas Operating Properties, respectively, driven by a decrease in entertainment expenses, and an $8.5 million decrease in our passenger ferry service operations in Macao.
The provision for doubtful accounts was $155.6 million for the year ended December 31, 2015, compared to $186.7 million for the year ended December 31, 2014. The decrease was driven by the overall decrease in casino receivables at our Macao operating properties due to decreases in VIP play and junket activity. The amount of this provision can vary over short periods of time because of factors specific to the customers who owe us money from gaming activities at any given time. We believe that the amount of our provision for doubtful accounts in the future will depend upon the state of the economy, our credit standards, our risk assessments and the judgment of our employees responsible for granting credit.
Pre-opening expenses were $47.5 million for the year ended December 31, 2015, compared to $26.2 million for the year ended December 31, 2014. Pre-opening expense represents personnel and other costs incurred prior to the opening of new ventures, which are expensed as incurred. Pre-opening expenses for the years ended December 31, 2015 and 2014, were primarily related to activities at The Parisian Macao and Sands Cotai Central, respectively. Development expenses include the costs associated with the Company’s evaluation and pursuit of new business opportunities, which are also expensed as incurred.
Loss on disposal of assets was $35.2 million for the year ended December 31, 2015, compared to $6.9 million for the year ended December 31, 2014. The loss for the year ended December 31, 2015, primarily related to dispositions at our Macao operating properties.
51
Adjusted Property EBITDA
Adjusted property EBITDA, which is a non-GAAP financial measure, is used by management as the primary measure of the operating performance of our segments. Adjusted property EBITDA is net income before intersegment royalty fees, stock-based compensation expense, corporate expense, pre-opening expense, development expense, depreciation and amortization, amortization of leasehold interests in land, loss on disposal of assets, interest, other income, loss on modification or early retirement of debt and income taxes. The following table summarizes information related to our segments (see “Item 8 — Financial Statements and Supplementary Data — Notes to Consolidated Financial Statements — Note 17 — Segment Information” for discussion of our operating segments and a reconciliation of adjusted property EBITDA to net income):
Year Ended December 31, | ||||||||||
2015 | 2014 | Percent Change | ||||||||
(Dollars in thousands) | ||||||||||
Macao: | ||||||||||
The Venetian Macao | $ | 1,078,590 | $ | 1,546,323 | (30.2 | )% | ||||
Sands Cotai Central | 651,524 | 1,001,487 | (34.9 | )% | ||||||
Four Seasons Macao | 243,390 | 374,899 | (35.1 | )% | ||||||
Sands Macao | 226,094 | 338,590 | (33.2 | )% | ||||||
Other Asia | 22,833 | 3,493 | 553.7 | % | ||||||
2,222,431 | 3,264,792 | (31.9 | )% | |||||||
Marina Bay Sands | 1,506,486 | 1,723,147 | (12.6 | )% | ||||||
United States: | ||||||||||
Las Vegas Operating Properties | 305,469 | 313,913 | (2.7 | )% | ||||||
Sands Bethlehem | 135,844 | 120,491 | 12.7 | % | ||||||
441,313 | 434,404 | 1.6 | % | |||||||
Total adjusted property EBITDA | $ | 4,170,230 | $ | 5,422,343 | (23.1 | )% | ||||
Adjusted property EBITDA at our Macao operations decreased $1.04 billion compared to the year ended December 31, 2014. As previously described, the decrease was primarily due to the decrease in casino operations, driven by decreased demand in the VIP market.
Adjusted property EBITDA at Marina Bay Sands decreased $216.7 million compared to the year ended December 31, 2014. As previously described, the decrease was primarily due to the decrease in casino operations, as well as a $90.1 million tax refund received in December 2014 related to the settlement of taxes assessed and paid for the years 2010 through 2014.
Adjusted property EBITDA at our Las Vegas Operating Properties decreased $8.4 million compared to the year ended December 31, 2014. The decrease was primarily due to the decrease in casino operations, partially offset by increases in our non-gaming operations, primarily rooms and food and beverage.
Adjusted property EBITDA at Sands Bethlehem increased $15.4 million compared to the year ended December 31, 2014. The increase was primarily due to a $44.9 million increase in net revenues, driven by an increase in casino revenues, partially offset by an increase in the associated operating expenses.
52
Interest Expense
The following table summarizes information related to interest expense:
Year Ended December 31, | |||||||
2015 | 2014 | ||||||
(Dollars in thousands) | |||||||
Interest cost (which includes the amortization of deferred financing costs and original issue discounts) | $ | 277,501 | $ | 268,299 | |||
Add — imputed interest on deferred proceeds from sale of The Shoppes at The Palazzo | 15,188 | 15,190 | |||||
Less — capitalized interest | (27,469 | ) | (9,308 | ) | |||
Interest expense, net | $ | 265,220 | $ | 274,181 | |||
Cash paid for interest | $ | 239,358 | $ | 215,929 | |||
Weighted average total debt balance | $ | 9,429,221 | $ | 9,991,874 | |||
Weighted average interest rate | 2.9 | % | 2.7 | % | |||
Interest cost increased $9.2 million compared to the year ended December 31, 2014, resulting from a slight increase in our weighted average interest rate, partially offset by a decrease in our weighted average debt balance. Capitalized interest increased $18.2 million compared to the year ended December 31, 2014, primarily related to the construction of The Parisian Macao.
Other Factors Effecting Earnings
Other income was $30.5 million for the year ended December 31, 2015, compared to $2.0 million for the year ended December 31, 2014. The amounts in both periods were primarily due to foreign exchange gains.
The loss on modification or early retirement of debt was $19.9 million for the year ended December 31, 2014, and was primarily due to an $18.0 million loss related to the amendment of our 2011 VML Credit Facility in March 2014 (see “Item 8 — Financial Statements and Supplementary Data — Notes to Consolidated Financial Statements — Note 8 — Long-term Debt — 2011 VML Credit Facility”).
Our effective income tax rate was 9.0% for the year ended December 31, 2015, compared to 6.4% for the year ended December 31, 2014. The effective income tax rates reflect a 17% statutory tax rate on our Singapore operations and a zero percent tax rate on profits generated by our Macao gaming operations due to our income tax exemption in Macao, which expires at the end of 2018. We have recorded a valuation allowance related to certain deferred tax assets generated by operations in the U.S. and certain foreign jurisdictions; however, to the extent that the financial results of these operations improve and it becomes “more-likely-than-not” that these deferred tax assets or a portion thereof are realizable, we will reduce the valuation allowances in the period such determination is made.
The net income attributable to our noncontrolling interests was $419.5 million for the year ended December 31, 2015, compared to $747.4 million for the year ended December 31, 2014. These amounts are primarily related to the noncontrolling interest of SCL.
53
Year Ended December 31, 2014 Compared to the Year Ended December 31, 2013
Operating Revenues
Our net revenues consisted of the following:
Year Ended December 31, | ||||||||||
2014 | 2013 | Percent Change | ||||||||
(Dollars in thousands) | ||||||||||
Casino | $ | 12,004,361 | $ | 11,386,917 | 5.4 | % | ||||
Rooms | 1,540,420 | 1,380,681 | 11.6 | % | ||||||
Food and beverage | 778,769 | 730,259 | 6.6 | % | ||||||
Mall | 553,534 | 481,400 | 15.0 | % | ||||||
Convention, retail and other | 548,704 | 515,179 | 6.5 | % | ||||||
15,425,788 | 14,494,436 | 6.4 | % | |||||||
Less — promotional allowances | (841,939 | ) | (724,551 | ) | (16.2 | )% | ||||
Total net revenues | $ | 14,583,849 | $ | 13,769,885 | 5.9 | % | ||||
Consolidated net revenues were $14.58 billion for the year ended December 31, 2014, an increase of $814.0 million compared to $13.77 billion for the year ended December 31, 2013. The increase in net revenues was driven by increases of $605.0 million at our Macao operating properties and $245.8 million at Marina Bay Sands, primarily due to increased casino revenues.
54
Casino revenues increased $617.4 million compared to the year ended December 31, 2013, despite the challenges in the VIP market. The increase is primarily due to an increase of $474.9 million at our Macao operating properties, which were driven by increases in Non-Rolling Chip drop, partially offset by decreases in Rolling Chip volume due to decreased demand in the VIP market. The following table summarizes the results of our casino activity:
Year Ended December 31, | ||||||||||
2014 | 2013 | Change | ||||||||
(Dollars in thousands) | ||||||||||
Macao Operations: | ||||||||||
The Venetian Macao | ||||||||||
Total casino revenues | $ | 3,554,352 | $ | 3,415,327 | 4.1% | |||||
Non-Rolling Chip drop | $ | 8,960,823 | $ | 7,201,033 | 24.4% | |||||
Non-Rolling Chip win percentage | 25.2 | % | 26.8 | % | (1.6) pts | |||||
Rolling Chip volume | $ | 47,871,382 | $ | 54,420,394 | (12.0)% | |||||
Rolling Chip win percentage | 3.22 | % | 3.32 | % | (0.10) pts | |||||
Slot handle | $ | 5,564,597 | $ | 4,781,911 | 16.4% | |||||
Slot hold percentage | 4.8 | % | 5.5 | % | (0.7) pts | |||||
Sands Cotai Central | ||||||||||
Total casino revenues | $ | 2,801,441 | $ | 2,432,952 | 15.1% | |||||
Non-Rolling Chip drop | $ | 7,432,536 | $ | 5,373,622 | 38.3% | |||||
Non-Rolling Chip win percentage | 21.8 | % | 22.5 | % | (0.7) pts | |||||
Rolling Chip volume | $ | 46,860,574 | $ | 61,073,743 | (23.3)% | |||||
Rolling Chip win percentage | 3.08 | % | 2.66 | % | 0.42 pts | |||||
Slot handle | $ | 7,630,366 | $ | 5,686,446 | 34.2% | |||||
Slot hold percentage | 3.5 | % | 3.9 | % | (0.4) pts | |||||
Four Seasons Macao | ||||||||||
Total casino revenues | $ | 948,110 | $ | 922,743 | 2.7% | |||||
Non-Rolling Chip drop | $ | 1,335,935 | $ | 899,627 | 48.5% | |||||
Non-Rolling Chip win percentage | 24.0 | % | 27.5 | % | (3.5) pts | |||||
Rolling Chip volume | $ | 27,072,914 | $ | 39,280,485 | (31.1)% | |||||
Rolling Chip win percentage | 3.36 | % | 2.46 | % | 0.90 pts | |||||
Slot handle | $ | 830,186 | $ | 900,836 | (7.8)% | |||||
Slot hold percentage | 5.1 | % | 5.5 | % | (0.4) pts | |||||
Sands Macao | ||||||||||
Total casino revenues | $ | 1,148,477 | $ | 1,206,462 | (4.8)% | |||||
Non-Rolling Chip drop | $ | 3,937,850 | $ | 3,488,891 | 12.9% | |||||
Non-Rolling Chip win percentage | 18.1 | % | 19.8 | % | (1.7) pts | |||||
Rolling Chip volume | $ | 17,663,497 | $ | 23,242,588 | (24.0)% | |||||
Rolling Chip win percentage | 2.98 | % | 2.77 | % | 0.21 pts | |||||
Slot handle | $ | 3,236,093 | $ | 2,699,247 | 19.9% | |||||
Slot hold percentage | 3.7 | % | 3.9 | % | (0.2) pts | |||||
Singapore Operations: | ||||||||||
Marina Bay Sands | ||||||||||
Total casino revenues | $ | 2,574,782 | $ | 2,363,140 | 9.0% | |||||
Non-Rolling Chip drop | $ | 4,498,674 | $ | 4,650,105 | (3.3)% | |||||
Non-Rolling Chip win percentage | 25.1 | % | 23.7 | % | 1.4 pts | |||||
Rolling Chip volume | $ | 42,558,012 | $ | 60,095,322 | (29.2)% | |||||
Rolling Chip win percentage | 3.30 | % | 2.46 | % | 0.84 pts | |||||
Slot handle | $ | 12,368,193 | $ | 11,118,021 | 11.2% | |||||
Slot hold percentage | 4.9 | % | 5.1 | % | (0.2) pts | |||||
U.S. Operations: | ||||||||||
Las Vegas Operating Properties | ||||||||||
Total casino revenues | $ | 509,205 | $ | 584,372 | (12.9)% | |||||
Table games drop | $ | 2,139,545 | $ | 2,251,734 | (5.0)% | |||||
Table games win percentage | 19.9 | % | 23.3 | % | (3.4) pts | |||||
Slot handle | $ | 2,114,522 | $ | 2,024,147 | 4.5% | |||||
Slot hold percentage | 8.2 | % | 8.7 | % | (0.5) pts | |||||
Sands Bethlehem | ||||||||||
Total casino revenues | $ | 467,994 | $ | 461,921 | 1.3% | |||||
Table games drop | $ | 1,062,648 | $ | 1,024,021 | 3.8% | |||||
Table games win percentage | 16.8 | % | 16.1 | % | 0.7 pts | |||||
Slot handle | $ | 4,016,223 | $ | 4,129,171 | (2.7)% | |||||
Slot hold percentage | 7.0 | % | 7.0 | % | — | |||||
55
In our experience, average win percentages remain steady when measured over extended periods of time, but can vary considerably within shorter time periods as a result of the statistical variances that are associated with games of chance in which large amounts are wagered.
Room revenues increased $159.7 million compared to the year ended December 31, 2013. The increase is primarily due to an $84.1 million increase at Sands Cotai Central, driven by increases in occupancy and average daily room rates. There were also increases of $28.0 million, $23.7 million and $19.0 million at The Venetian Macao, Marina Bay Sands and our Las Vegas Operating Properties, respectively, which were driven by an increase in average daily room rates. The suites at Sands Macao are primarily provided to casino patrons on a complimentary basis. The following table summarizes the results of our room activity:
Year Ended December 31, | ||||||||||
2014 | 2013 | Change | ||||||||
(Room revenues in thousands) | ||||||||||
Macao Operations: | ||||||||||
The Venetian Macao | ||||||||||
Total room revenues | $ | 258,863 | $ | 230,822 | 12.1% | |||||
Occupancy rate | 91.3 | % | 91.3 | % | — | |||||
Average daily room rate | $ | 270 | $ | 243 | 11.1% | |||||
Revenue per available room | $ | 246 | $ | 222 | 10.8% | |||||
Sands Cotai Central | ||||||||||
Total room revenues | $ | 320,875 | $ | 236,819 | 35.5% | |||||
Occupancy rate | 88.5 | % | 78.5 | % | 10.0 pts | |||||
Average daily room rate | $ | 176 | $ | 155 | 13.5% | |||||
Revenue per available room | $ | 156 | $ | 121 | 28.9% | |||||
Four Seasons Macao | ||||||||||
Total room revenues | $ | 47,755 | $ | 43,626 | 9.5% | |||||
Occupancy rate | 87.0 | % | 85.3 | % | 1.7 pts | |||||
Average daily room rate | $ | 400 | $ | 373 | 7.2% | |||||
Revenue per available room | $ | 348 | $ | 318 | 9.4% | |||||
Sands Macao | ||||||||||
Total room revenues | $ | 24,066 | $ | 25,150 | (4.3)% | |||||
Occupancy rate | 98.6 | % | 96.1 | % | 2.5 pts | |||||
Average daily room rate | $ | 238 | $ | 252 | (5.6)% | |||||
Revenue per available room | $ | 235 | $ | 242 | (2.9)% | |||||
Singapore Operations: | ||||||||||
Marina Bay Sands | ||||||||||
Total room revenues | $ | 383,954 | $ | 360,264 | 6.6% | |||||
Occupancy rate | 99.0 | % | 98.6 | % | 0.4 pts | |||||
Average daily room rate | $ | 431 | $ | 396 | 8.8% | |||||
Revenue per available room | $ | 427 | $ | 390 | 9.5% | |||||
U.S. Operations: | ||||||||||
Las Vegas Operating Properties | ||||||||||
Total room revenues | $ | 491,493 | $ | 472,518 | 4.0% | |||||
Occupancy rate | 88.0 | % | 89.6 | % | (1.6) pts | |||||
Average daily room rate | $ | 222 | $ | 205 | 8.3% | |||||
Revenue per available room | $ | 196 | $ | 184 | 6.5% | |||||
Sands Bethlehem | ||||||||||
Total room revenues | $ | 13,414 | $ | 11,482 | 16.8% | |||||
Occupancy rate | 83.4 | % | 73.6 | % | 9.8 pts | |||||
Average daily room rate | $ | 146 | $ | 142 | 2.8% | |||||
Revenue per available room | $ | 122 | $ | 104 | 17.3% | |||||
56
Food and beverage revenues increased $48.5 million compared to the year ended December 31, 2013. The increase was primarily due to a $41.4 million increase at our Macao operating properties, driven by an increase in property visitation.
Mall revenues increased $72.1 million compared to the year ended December 31, 2013. The increase was primarily due to a $56.0 million increase at our Macao operating properties, driven by an increase in base rents. For further information related to the financial performance of our malls, see"— Additional Information Regarding our Retail Mall Operations." The following table summarizes the results of our mall activity:
Year Ended December 31, | ||||||||||
2014 | 2013 | Change | ||||||||
(Mall revenues in thousands) | ||||||||||
Macao Operations: | ||||||||||
Shoppes at Venetian | ||||||||||
Total mall revenues | $ | 191,631 | $ | 169,151 | 13.3% | |||||
Mall gross leasable area (in square feet) | 771,345 | 755,452 | 2.1% | |||||||
Occupancy | 93.4 | % | 95.5 | % | (2.1) pts | |||||
Base rent per square foot | $ | 212 | $ | 179 | 18.4% | |||||
Tenant sales per square foot | $ | 1,673 | $ | 1,522 | 9.9% | |||||
Shoppes at Cotai Central(1) | ||||||||||
Total mall revenues | $ | 56,408 | $ | 42,116 | 33.9% | |||||
Mall gross leasable area (in square feet) | 330,258 | 210,143 | 57.2% | |||||||
Occupancy | 97.9 | % | 100.0 | % | (2.1) pts | |||||
Base rent per square foot | $ | 136 | $ | 120 | 13.3% | |||||
Tenant sales per square foot | $ | 1,450 | $ | 1,277 | 13.5% | |||||
Shoppes at Four Seasons | ||||||||||
Total mall revenues | $ | 132,326 | $ | 113,121 | 17.0% | |||||
Mall gross leasable area (in square feet) | 257,963 | 241,895 | 6.6% | |||||||
Occupancy | 99.2 | % | 87.7 | % | 11.5 pts | |||||
Base rent per square foot | $ | 418 | $ | 348 | 20.1% | |||||
Tenant sales per square foot | $ | 5,689 | $ | 4,726 | 20.4% | |||||
Singapore Operations: | ||||||||||
The Shoppes at Marina Bay Sands | ||||||||||
Total mall revenues | $ | 169,257 | $ | 153,840 | 10.0% | |||||
Mall gross leasable area (in square feet) | 648,778 | 642,241 | 1.0% | |||||||
Occupancy | 96.1 | % | 90.7 | % | 5.4 pts | |||||
Base rent per square foot | $ | 220 | $ | 217 | 1.4% | |||||
Tenant sales per square foot | $ | 1,426 | $ | 1,528 | (6.7)% | |||||
U.S. Operations: | ||||||||||
The Outlets at Sands Bethlehem | ||||||||||
Total mall revenues | $ | 3,912 | $ | 3,172 | 23.3% | |||||
Mall gross leasable area (in square feet) | 151,029 | 134,830 | 12.0% | |||||||
Occupancy | 97.0 | % | 93.6 | % | 3.4 pts | |||||
Base rent per square foot | $ | 20 | $ | 23 | (13.0)% | |||||
Tenant sales per square foot | $ | 365 | $ | 431 | (15.3)% | |||||
_________________________
(1) | The first, second and third phases of the Shoppes at Cotai Central opened in April and September 2012 and June 2014, respectively. At completion, the Shoppes at Cotai Central will feature up to 600,000 square feet of gross leasable area. |
57
Operating Expenses
The breakdown of operating expenses is as follows:
Year Ended December 31, | ||||||||||
2014 | 2013 | Percent Change | ||||||||
(Dollars in thousands) | ||||||||||
Casino | $ | 6,705,534 | $ | 6,483,718 | 3.4 | % | ||||
Rooms | 256,835 | 271,942 | (5.6 | )% | ||||||
Food and beverage | 392,560 | 369,570 | 6.2 | % | ||||||
Mall | 69,732 | 73,358 | (4.9 | )% | ||||||
Convention, retail and other | 320,759 | 317,869 | 0.9 | % | ||||||
Provision for doubtful accounts | 186,722 | 237,786 | (21.5 | )% | ||||||
General and administrative | 1,258,133 | 1,329,740 | (5.4 | )% | ||||||
Corporate | 174,750 | 189,535 | (7.8 | )% | ||||||
Pre-opening | 26,230 | 13,339 | 96.6 | % | ||||||
Development | 14,325 | 15,809 | (9.4 | )% | ||||||
Depreciation and amortization | 1,031,589 | 1,007,468 | 2.4 | % | ||||||
Amortization of leasehold interests in land | 40,598 | 40,352 | 0.6 | % | ||||||
Loss on disposal of assets | 6,856 | 11,156 | (38.5 | )% | ||||||
Total operating expenses | $ | 10,484,623 | $ | 10,361,642 | 1.2 | % | ||||
Operating expenses were $10.48 billion for the year ended December 31, 2014, an increase of $123.0 million compared to $10.36 billion for the year ended December 31, 2013. The increase in operating expenses was primarily attributable to an increase in casino expenses at our Macao operating properties.
Casino expenses increased $221.8 million compared to the year ended December 31, 2013. The increase was primarily due to a $229.6 million increase at our Macao operating properties, of which $104.3 million was due to the 39% gross win tax on increased casino revenues and the remaining $125.3 million was driven by an increase in payroll-related expenses.
The provision for doubtful accounts was $186.7 million for the year ended December 31, 2014, compared to $237.8 million for the year ended December 31, 2013. The decrease was driven by the overall decrease in casino receivables at our Macao operating properties due to the decrease in VIP play. The amount of this provision can vary over short periods of time because of factors specific to the customers who owe us money from gaming activities at any given time. We believe that the amount of our provision for doubtful accounts in the future will depend upon the state of the economy, our credit standards, our risk assessments and the judgment of our employees responsible for granting credit.
General and administrative expenses decreased $71.6 million compared to the year ended December 31, 2013. The decrease was primarily attributable to a $78.5 million decrease at Marina Bay Sands, driven by a $90.1 million property tax refund received in December 2014 related to the settlement of taxes assessed and paid for the years 2010 through 2014. There was also a $36.5 million decrease at our Las Vegas Operating Properties, driven by a $47.4 million legal settlement charge incurred in August 2013 (see “Item 8 — Financial Statements and Supplementary Data — Notes to Consolidated Financial Statements — Note 13 — Commitments and Contingencies — Litigation”). These decreases were partially offset by a $37.0 million increase at our Macao operating properties.
Corporate expenses decreased $14.8 million compared to the year ended December 31, 2013, which was driven by a decrease in legal fees.
Pre-opening expenses were $26.2 million for the year ended December 31, 2014, compared to $13.3 million for the year ended December 31, 2013. Pre-opening expense represents personnel and other costs incurred prior to the opening of new ventures, which are expensed as incurred. Pre-opening expenses for the years ended December 31, 2014 and 2013, were primarily related to activities at The Parisian Macao and Sands Cotai Central, respectively. Development expenses include the costs associated with the Company’s evaluation and pursuit of new business opportunities, which are also expensed as incurred.
58
Adjusted Property EBITDA
The following table summarizes information related to our segments:
Year Ended December 31, | ||||||||||
2014 | 2013 | Percent Change | ||||||||
(Dollars in thousands) | ||||||||||
Macao: | ||||||||||
The Venetian Macao | $ | 1,546,323 | $ | 1,499,937 | 3.1 | % | ||||
Sands Cotai Central | 1,001,487 | 739,723 | 35.4 | % | ||||||
Four Seasons Macao | 374,899 | 305,040 | 22.9 | % | ||||||
Sands Macao | 338,590 | 362,858 | (6.7 | )% | ||||||
Other Asia | 3,493 | (3,855 | ) | N.M. | ||||||
3,264,792 | 2,903,703 | 12.4 | % | |||||||
Marina Bay Sands | 1,723,147 | 1,384,576 | 24.5 | % | ||||||
United States: | ||||||||||
Las Vegas Operating Properties | 313,913 | 351,739 | (10.8 | )% | ||||||
Sands Bethlehem | 120,491 | 123,337 | (2.3 | )% | ||||||
434,404 | 475,076 | (8.6 | )% | |||||||
Total adjusted property EBITDA | $ | 5,422,343 | $ | 4,763,355 | 13.8 | % | ||||
______________
N.M. - Not meaningful
Adjusted property EBITDA at our Macao operations increased $361.1 million compared to the year ended December 31, 2013. As previously described, the increase was primarily due to a $605.0 million increase in net revenues at our Macao operating properties, partially offset by a $229.6 million increase in casino expenses. Additionally, there was a $55.0 million increase in expenses due to a new bonus program for non-management employees in Macao initiated during the year ended December 31, 2014.
Adjusted property EBITDA at Marina Bay Sands increased $338.6 million compared to the year ended December 31, 2013. The increase was primarily due to a $245.8 million increase in net revenues driven by an increase in casino revenues, and as previously described, a $90.1 million property tax refund received in December 2014.
Adjusted property EBITDA at our Las Vegas Operating Properties decreased $37.8 million compared to the year ended December 31, 2013. The decrease was primarily due to a $44.8 million decrease in net revenues (excluding intersegment royalty revenue) driven by a decrease in casino revenues.
Adjusted property EBITDA at Sands Bethlehem decreased $2.8 million compared to the year ended December 31, 2013. Net revenues increased $7.5 million, but were offset by increases of $6.2 million and $5.8 million in general and administrative expenses and casino expenses, respectively.
59
Interest Expense
The following table summarizes information related to interest expense:
Year Ended December 31, | |||||||
2014 | 2013 | ||||||
(Dollars in thousands) | |||||||
Interest cost (which includes the amortization of deferred financing costs and original issue discounts) | $ | 268,299 | $ | 260,704 | |||
Add — imputed interest on deferred proceeds from sale of The Shoppes at The Palazzo | 15,190 | 15,168 | |||||
Less — capitalized interest | (9,308 | ) | (4,661 | ) | |||
Interest expense, net | $ | 274,181 | $ | 271,211 | |||
Cash paid for interest | $ | 215,929 | $ | 212,903 | |||
Weighted average total debt balance | $ | 9,991,874 | $ | 9,788,457 | |||
Weighted average interest rate | 2.7 | % | 2.7 | % | |||
Interest cost increased $7.6 million compared to the year ended December 31, 2013, due to an increase in our weighted average debt balance. Capitalized interest increased $4.6 million compared to the year ended December 31, 2013, primarily due to the construction of The Parisian Macao.
Other Factors Effecting Earnings
Other income was $2.0 million for the year ended December 31, 2014, compared to $4.3 million for the year ended December 31, 2013. The amounts in both periods were primarily due to foreign exchange gains.
The loss on modification or early retirement of debt was $19.9 million for the year ended December 31, 2014, and was primarily due to an $18.0 million loss related to the amendment of our 2011 VML Credit Facility in March 2014 (see “Item 8 — Financial Statements and Supplementary Data — Notes to Consolidated Financial Statements — Note 8 — Long-term Debt — 2011 VML Credit Facility”).
Our effective income tax rate was 6.4% for the year ended December 31, 2014, compared to 6.0% for the year ended December 31, 2013. The effective income tax rates reflect a 17% statutory tax rate on our Singapore operations and a zero percent tax rate on profits generated by our Macao gaming operations due to our income tax exemption in Macao, which was extended in October 2013 through the end of 2018. We have recorded a valuation allowance related to certain deferred tax assets generated by operations in the U.S. and certain foreign jurisdictions; however, to the extent that the financial results of these operations improve and it becomes “more-likely-than-not” that these deferred tax assets or a portion thereof are realizable, we will reduce the valuation allowances in the period such determination is made.
The net income attributable to our noncontrolling interests was $747.4 million for the year ended December 31, 2014, compared to $648.7 million for the year ended December 31, 2013. These amounts are primarily related to the noncontrolling interest of SCL.
60
Additional Information Regarding our Retail Mall Operations
The following tables summarize the results of our mall operations for the years ended December 31, 2015, 2014 and 2013 (in thousands):
Shoppes at Venetian | Shoppes at Four Seasons | Shoppes at Cotai Central | The Shoppes at Marina Bay Sands | The Outlets at Sands Bethlehem(1) | Total | ||||||||||||||||||
For the year ended December 31, 2015 | |||||||||||||||||||||||
Mall revenues: | |||||||||||||||||||||||
Minimum rents(2) | $ | 152,686 | $ | 109,635 | $ | 43,298 | $ | 120,486 | $ | 1,482 | $ | 427,587 | |||||||||||
Overage rents | 22,262 | 10,167 | 5,789 | 15,466 | 2,612 | 56,296 | |||||||||||||||||
CAM, levies and direct recoveries | 29,676 | 10,418 | 12,818 | 27,514 | — | 80,426 | |||||||||||||||||
Total mall revenues | 204,624 | 130,220 | 61,905 | 163,466 | 4,094 | 564,309 | |||||||||||||||||
Mall operating expenses: | |||||||||||||||||||||||
Common area maintenance | 15,121 | 5,807 | 6,451 | 18,029 | 905 | 46,313 | |||||||||||||||||
Marketing and other direct operating expenses | 5,454 | 961 | 1,555 | 6,183 | 833 | 14,986 | |||||||||||||||||
Mall operating expenses | 20,575 | 6,768 | 8,006 | 24,212 | 1,738 | 61,299 | |||||||||||||||||
Property taxes | — | — | — | 4,514 | 1,304 | 5,818 | |||||||||||||||||
Provision for (recovery of) doubtful accounts | 223 | (123 | ) | 206 | 65 | 44 | 415 | ||||||||||||||||
Mall-related expenses(3) | $ | 20,798 | $ | 6,645 | $ | 8,212 | $ | 28,791 | $ | 3,086 | $ | 67,532 | |||||||||||
For the year ended December 31, 2014 | |||||||||||||||||||||||
Mall revenues: | |||||||||||||||||||||||
Minimum rents(2) | $ | 130,555 | $ | 87,666 | $ | 31,943 | $ | 122,494 | $ | 1,486 | $ | 374,144 | |||||||||||
Overage rents | 33,860 | 36,809 | 13,589 | 16,725 | 2,426 | 103,409 | |||||||||||||||||
CAM, levies and direct recoveries | 27,216 | 7,851 | 10,876 | 30,038 | — | 75,981 | |||||||||||||||||
Total mall revenues | 191,631 | 132,326 | 56,408 | 169,257 | 3,912 | 553,534 | |||||||||||||||||
Mall operating expenses: | |||||||||||||||||||||||
Common area maintenance | 17,471 | 5,802 | 6,451 | 24,983 | 1,238 | 55,945 | |||||||||||||||||
Marketing and other direct operating expenses | 6,417 | 1,562 | 1,884 | 3,356 | 568 | 13,787 | |||||||||||||||||
Mall operating expenses | 23,888 | 7,364 | 8,335 | 28,339 | 1,806 | 69,732 | |||||||||||||||||
Property taxes(4) | (1,486 | ) | — | — | (1,961 | ) | 1,201 | (2,246 | ) | ||||||||||||||
Provision for doubtful accounts | 216 | 223 | 2 | 990 | 25 | 1,456 | |||||||||||||||||
Mall-related expenses(3) | $ | 22,618 | $ | 7,587 | $ | 8,337 | $ | 27,368 | $ | 3,032 | $ | 68,942 | |||||||||||
For the year ended December 31, 2013 | |||||||||||||||||||||||
Mall revenues: | |||||||||||||||||||||||
Minimum rents(2) | $ | 104,080 | $ | 47,913 | $ | 23,030 | $ | 106,318 | $ | 1,268 | $ | 282,609 | |||||||||||
Overage rents | 39,615 | 58,246 | 11,584 | 16,584 | 1,904 | 127,933 | |||||||||||||||||
CAM, levies and direct recoveries | 25,456 | 6,962 | 7,502 | 30,938 | — | 70,858 | |||||||||||||||||
Total mall revenues | 169,151 | 113,121 | 42,116 | 153,840 | 3,172 | 481,400 | |||||||||||||||||
Mall operating expenses: | |||||||||||||||||||||||
Common area maintenance | 16,894 | 5,466 | 5,577 | 25,370 | 1,320 | 54,627 | |||||||||||||||||
Marketing and other direct operating expenses | 6,975 | 1,607 | 1,275 | 8,083 | 791 | 18,731 | |||||||||||||||||
Mall operating expenses | 23,869 | 7,073 | 6,852 | 33,453 | 2,111 | 73,358 | |||||||||||||||||
Property taxes | 1,486 | — | — | 7,123 | 1,093 | 9,702 | |||||||||||||||||
Provision for (recovery of) doubtful accounts | (281 | ) | 226 | (245 | ) | (5 | ) | — | (305 | ) | |||||||||||||
Mall-related expenses(3) | $ | 25,074 | $ | 7,299 | $ | 6,607 | $ | 40,571 | $ | 3,204 | $ | 82,755 | |||||||||||
____________________
61
(1) | Revenues from CAM, levies and direct recoveries are included in minimum rents for The Outlets at Sands Bethlehem. |
(2) | Minimum rents include base rents and straight-line adjustments of base rents. |
(3) | Mall-related expenses consist of CAM, marketing fees and other direct operating expenses, property taxes and provision for (recovery of) doubtful accounts, but excludes depreciation and amortization and general and administrative costs. |
(4) | Commercial property that generates rental income is exempt from property tax for the first six years for newly constructed buildings in Cotai. This property tax exemption expired in August 2013 for The Venetian Macao. In May 2014, the Company received an additional six-year property tax exemption for The Venetian Macao. As a result, during the year ended December 31, 2014, the Company reversed $2.6 million of previously recognized property taxes for The Venetian Macao. Additionally, as previously described, Marina Bay Sands received a $90.1 million property tax refund in December 2014, of which $9.0 million related to the mall. |
It is common in the mall operating industry for companies to disclose mall net operating income (“NOI”) as a useful supplemental measure of a mall’s operating performance. Because NOI excludes general and administrative expenses, interest expense, impairment losses, depreciation and amortization, gains and losses from property dispositions, allocations to noncontrolling interests and provision for income taxes, it provides a performance measure that, when compared year over year, reflects the revenues and expenses directly associated with owning and operating commercial real estate properties and the impact on operations from trends in occupancy rates, rental rates and operating costs.
In the tables above, we believe that taking total mall revenues less mall-related expenses provides an operating performance measure for our malls. Other mall operating companies may use different methodologies for deriving mall-related expenses. As such, this calculation may not be comparable to the NOI of other mall operating companies.
Development Projects
Macao
We are constructing The Parisian Macao, an integrated resort that will be connected to The Venetian Macao and Four Seasons Macao. The Parisian Macao is intended to include a gaming area (to be operated under our gaming subconcession), a hotel with approximately 3,000 rooms and suites and retail, entertainment, dining and meeting facilities. We expect the cost to design, develop and construct The Parisian Macao will be approximately $2.7 billion, inclusive of payments made for the land premium. As with projects of this nature, we will continue to analyze options for both a full and phased opening of the facility, which is anticipated to open in the second half of 2016, subject to Macao government approval. We have capitalized costs of $1.65 billion, including the land premium (net of amortization), as of December 31, 2015. In addition, we will be completing the development of some open areas surrounding our Cotai Strip properties.
As of December 31, 2015, we have capitalized an aggregate of $11.14 billion in construction costs and land premiums (net of amortization) for our Cotai Strip developments, which include The Venetian Macao, Sands Cotai Central, Four Seasons Macao and The Parisian Macao, as well as our investments in transportation infrastructure, including our passenger ferry service operations.
Land concessions in Macao generally have an initial term of 25 years with automatic extensions of 10 years thereafter in accordance with Macao law. We have received land concessions from the Macao government to build on the sites on which The Venetian Macao, Sands Cotai Central, Four Seasons Macao and The Parisian Macao are located. We do not own these land sites in Macao; however, the land concessions grant us exclusive use of the land. As specified in the land concessions, we are required to pay premiums for each parcel, which are either payable in a single lump sum upon acceptance of the land concessions by the Macao government or in seven semi-annual installments, as well as annual rent for the term of the land concessions.
Under our land concession for The Parisian Macao, we are required to complete the development by November 2016. The land concession for Sands Cotai Central contains a similar requirement that the development be completed by December 2016. Should we determine that we are unable to complete The Parisian Macao or Sands Cotai Central by their respective deadlines, we would then expect to apply for another extension from the Macao government. If we
62
are unable to meet the current deadlines and the deadlines for either development are not extended, we could lose our land concessions for The Parisian Macao or Sands Cotai Central, which would prohibit us from operating any facilities developed under the respective land concessions. As a result, we could record a charge for all or some portion of the $1.65 billion or $4.87 billion in capitalized construction costs and land premiums (net of amortization), as of December 31, 2015, related to The Parisian Macao and Sands Cotai Central, respectively.
United States
We were constructing the Las Vegas Condo Tower, located on the Las Vegas Strip between The Palazzo and The Venetian Las Vegas. We suspended our construction activities for the project due to reduced demand for Las Vegas Strip condominiums and the overall decline in general economic conditions. We are evaluating the highest return opportunity for the project and intend to recommence construction when demand and conditions improve. The impact of the suspension on the estimated overall cost of the project is currently not determinable with certainty. Should demand and conditions fail to improve or management decides to abandon the project, we could record a charge for some portion of the $178.6 million in capitalized construction costs as of December 31, 2015.
Other
We continue to aggressively pursue new development opportunities globally.
Liquidity and Capital Resources
Cash Flows — Summary
Our cash flows consisted of the following:
Year Ended December 31, | |||||||||||
2015 | 2014 | 2013 | |||||||||
(In thousands) | |||||||||||
Net cash generated from operating activities | $ | 3,449,971 | $ | 4,832,844 | $ | 4,439,412 | |||||
Cash flows from investing activities: | |||||||||||
Change in restricted cash and cash equivalents | (1,328 | ) | 270 | (382 | ) | ||||||
Capital expenditures | (1,528,642 | ) | (1,178,656 | ) | (898,111 | ) | |||||
Proceeds from disposal of property and equipment | 1,504 | 1,818 | 32,155 | ||||||||
Acquisition of intangible assets | — | — | (45,871 | ) | |||||||
Net cash used in investing activities | (1,528,466 | ) | (1,176,568 | ) | (912,209 | ) | |||||
Cash flows from financing activities: | |||||||||||
Proceeds from exercise of stock options | 16,876 | 55,650 | 69,596 | ||||||||
Excess tax benefits from stock-based compensation | 8,785 | 3,585 | — | ||||||||
Repurchase of common stock | (205,084 | ) | (1,676,802 | ) | (561,150 | ) | |||||
Proceeds from exercise of warrants | — | — | 350 | ||||||||
Dividends paid | (2,692,882 | ) | (2,386,657 | ) | (1,564,049 | ) | |||||
Distributions to noncontrolling interests | (13,908 | ) | (9,773 | ) | (11,858 | ) | |||||
Proceeds from long-term debt | 2,089,277 | 2,497,725 | 3,183,107 | ||||||||
Repayments of long-term debt | (2,397,717 | ) | (2,117,466 | ) | (3,513,032 | ) | |||||
Payments of deferred financing costs | (11,745 | ) | (88,048 | ) | (35,414 | ) | |||||
Net cash used in financing activities | (3,206,398 | ) | (3,721,786 | ) | (2,432,450 | ) | |||||
Effect of exchange rate on cash | (41,936 | ) | (28,585 | ) | (7,105 | ) | |||||
Increase (decrease) in cash and cash equivalents | $ | (1,326,829 | ) | $ | (94,095 | ) | $ | 1,087,648 | |||
63
Cash Flows — Operating Activities
Table games play at our properties is conducted on a cash and credit basis. Slot machine play is primarily conducted on a cash basis. The retail hotel rooms business is generally conducted on a cash basis, the group hotel rooms business is conducted on a cash and credit basis, and banquet business is conducted primarily on a credit basis resulting in operating cash flows being generally affected by changes in operating income and accounts receivable. For the year ended December 31, 2015, net cash generated from operating activities decreased $1.38 billion compared to the year ended December 31, 2014. The decrease was primarily attributable to the decrease in operating cash flows generated from our Macao operating properties. For the year ended December 31, 2014, net cash generated from operating activities increased $393.4 million compared to the year ended December 31, 2013. The increase was primarily attributable to the increase in operating cash flows generated from our Macao operating properties and Marina Bay Sands.
Cash Flows — Investing Activities
Capital expenditures for the year ended December 31, 2015, totaled $1.53 billion, including $1.29 billion for construction and development activities in Macao, which consisted primarily of $766.7 million for The Parisian Macao and $403.1 million for Sands Cotai Central; $129.7 million in Singapore; $77.6 million at our Las Vegas Operating Properties; and $28.6 million for corporate and other activities.
Capital expenditures for the year ended December 31, 2014, totaled $1.18 billion, including $946.1 million for construction and development activities in Macao, which consisted primarily of $390.6 million for The Parisian Macao and $345.7 million for Sands Cotai Central; $108.7 million at our Las Vegas Operating Properties; $79.6 million in Singapore; and $44.3 million for corporate and other activities.
Capital expenditures for the year ended December 31, 2013, totaled $898.1 million, including $614.4 million for construction and development activities in Macao, which consisted primarily of $262.5 million for Sands Cotai Central and $212.8 million for The Parisian Macao; $142.7 million in Singapore; $93.2 million at our Las Vegas Operating Properties; and $47.8 million for corporate and other activities. Additionally, during the year ended December 31, 2013, we paid SGD 57.0 million (approximately $40.3 million at exchange rates in effect on December 31, 2015) to renew our Singapore gaming license.
Cash Flows — Financing Activities
Net cash flows used in financing activities were $3.21 billion for the year ended December 31, 2015, which was primarily attributable to $2.69 billion in dividend payments, a net repayment of $412.5 million on our 2013 U.S. Credit Facility and $205.1 million in common stock repurchases, partially offset by net proceeds of $179.1 million on our 2011 VML Credit Facility.
Net cash flows used in financing activities were $3.72 billion for the year ended December 31, 2014, which was primarily attributable to $2.39 billion in dividend payments and $1.68 billion in common stock repurchases, partially offset by net proceeds of $430.0 million from our 2013 U.S. Revolving Facility.
Net cash flows used in financing activities were $2.43 billion for the year ended December 31, 2013, which was primarily attributable to $1.56 billion in dividend payments, $561.2 million in common stock repurchases and repayments of $430.5 million on our 2012 Singapore Credit Facility.
As of December 31, 2015, we had $2.97 billion available for borrowing under our U.S., Macao and Singapore credit facilities, net of letters of credit.
Capital Financing Overview
Through December 31, 2015, we have funded our development projects primarily through borrowings from our credit facilities (see “Item 8 — Financial Statements and Supplementary Data — Notes to Consolidated Financial Statements — Note 8 — Long-term Debt”), operating cash flows, proceeds from our equity offerings and proceeds from the disposition of non-core assets.
Our U.S., Macao and Singapore credit facilities contain various financial covenants. The U.S. credit facility, requires our Las Vegas operations to comply with a financial covenant at the end of each quarter to the extent that any
64
revolving loans or certain letters of credit are outstanding. This financial covenant requires our Las Vegas operations to maintain a maximum leverage ratio of net debt, as defined, to trailing twelve-month adjusted earnings before interest, income taxes, depreciation and amortization, as defined (“Adjusted EBITDA”). The maximum leverage ratio is 5.5x for all quarterly periods through maturity. We can elect to contribute cash on hand to our Las Vegas operations on a bi-quarterly basis; such contributions having the effect of increasing Adjusted EBITDA during the applicable quarter for purposes of calculating compliance with the maximum leverage ratio. Our Macao credit facility, as amended, also requires our Macao operations to comply with similar financial covenants, including maintaining a maximum leverage ratio of debt to Adjusted EBITDA. The maximum leverage ratio is 4.0x for the quarterly periods ending December 31, 2015 through March 31, 2017, and then decreases to, and remains at, 3.5x for all quarterly periods thereafter through maturity. Our Singapore credit facility, as amended, requires our Marina Bay Sands operations to comply with similar financial covenants, including maintaining a maximum leverage ratio of debt to Adjusted EBITDA. The maximum leverage ratio is 3.5x for the quarterly periods ending December 31, 2015 through September 30, 2019, and then decreases to, and remains at, 3.0x for all quarterly periods thereafter through maturity. As of December 31, 2015, our U.S., Macao and Singapore leverage ratios were 0.9x, 1.5x and 2.3x, respectively, compared to the maximum leverage ratios allowed of 5.5x, 4.0x and 3.5x, respectively. If we are unable to maintain compliance with the financial covenants under these credit facilities, we would be in default under the respective credit facilities. A default under the U.S. credit facility would trigger a cross-default under our airplane financings. Any defaults or cross-defaults under these agreements would allow the lenders, in each case, to exercise their rights and remedies as defined under their respective agreements. If the lenders were to exercise their rights to accelerate the due dates of the indebtedness outstanding, there can be no assurance that we would be able to repay or refinance any amounts that may become due and payable under such agreements, which could force us to restructure or alter our operations or debt obligations.
We held unrestricted cash and cash equivalents of approximately $2.18 billion and restricted cash and cash equivalents of approximately $7.9 million as of December 31, 2015, of which approximately $1.70 billion of the unrestricted amount is held by non-U.S. subsidiaries. Of the $1.70 billion, approximately $1.32 billion is available to be repatriated to the U.S. with minimal taxes owed on such amounts due to the significant foreign taxes we paid, which would ultimately generate U.S. foreign tax credits if cash is repatriated. The remaining unrestricted amounts are not available for repatriation primarily due to dividend requirements to third party public shareholders in the case of funds being repatriated from SCL. We believe the cash on hand and cash flow generated from operations will be sufficient to maintain compliance with the financial covenants of our credit facilities. We may elect to arrange additional financing to fund the balance of our Cotai Strip developments. In the normal course of our activities, we will continue to evaluate our capital structure and opportunities for enhancements thereof.
In April 2015, we entered into a joinder agreement (the "Joinder Agreement") to the 2011 VML Credit Facility. Under the Joinder Agreement, certain lenders agreed to provide term loan commitments of $1.0 billion (the "2011 VML Accordion Term"), which was funded on April 30, 2015 (see “Item 8 — Financial Statements and Supplementary Data — Notes to Consolidated Financial Statements — Note 8 — Long-term Debt — 2011 VML Credit Facility”). During the year ended December 31, 2015, we made repayments of $820.2 million on our 2011 VML Revolving Facility and net repayments of $390.0 million on our 2013 U.S. Revolving Facility.
On February 27 and July 15, 2015, SCL paid a dividend of 0.99 Hong Kong dollars ("HKD") and HKD 1.00 per share, respectively, to SCL shareholders (a total of $2.07 billion, of which the Company retained $1.45 billion). On February 26, 2014, SCL paid a dividend of HKD 0.87 per share and a special dividend of HKD 0.77 per share, and, on June 30, 2014, paid a dividend of HKD 0.86 per share to SCL shareholders (a total of $2.60 billion, of which we retained $1.82 billion). On February 28 and June 21, 2013, SCL paid a dividend of HKD 0.67 and HKD 0.66 per share, respectively, to SCL shareholders (a total of $1.38 billion, of which we retained $970.2 million). In January 2016, the Board of Directors of SCL declared a dividend of HKD 0.99 per share (a total of $1.03 billion, of which we retained $723 million) to SCL shareholders of record on February 9, 2016, which was paid on February 26, 2016.
During the year ended December 31, 2015, we paid a quarterly dividend of $0.65 per common share and recorded $2.07 billion as a distribution against retained earnings. During the year ended December 31, 2014, we paid a quarterly dividend of $0.50 per common share and recorded $1.61 billion as a distribution against retained earnings. During the year ended December 31, 2013, we paid a quarterly dividend of $0.35 per common share and recorded $1.15 billion as a distribution against retained earnings. In January 2016, our Board of Directors declared a quarterly dividend of
65
$0.72 per common share (a total estimated to be approximately $572 million) to be paid on March 31, 2016, to shareholders of record on March 22, 2016. We expect this level of dividend to continue quarterly through the remainder of 2016. Our Board of Directors will continually assess the level and appropriateness of any cash dividends.
In June 2013, our Board of Directors approved a stock repurchase program with an initial authorization of $2.0 billion, which expired in June 2015, but was substantially completed during the year ended December 31, 2014. In October 2014, our Board of Directors authorized the repurchase of an additional $2.0 billion of our outstanding common stock, which expires in October 2016. Repurchases of our common stock are made at our discretion in accordance with applicable federal securities laws in the open market or otherwise. The timing and actual number of shares to be repurchased in the future will depend on a variety of factors, including our financial position, earnings, legal requirements, other investment opportunities and market conditions. During the years ended December 31, 2015, 2014 and 2013, we repurchased 4,383,793, 22,406,655 and 8,570,281 shares, respectively, of our common stock for $205.1 million, $1.66 billion and $570.5 million, respectively, (including commissions) under this program. All share repurchases of our common stock have been recorded as treasury stock.
Aggregate Indebtedness and Other Known Contractual Obligations
Our total long-term indebtedness and other known contractual obligations are summarized below as of December 31, 2015:
Payments Due by Period(11) | |||||||||||||||||||
Less than 1 Year | 1-3 Years | 3-5 Years | More than 5 Years | Total | |||||||||||||||
(In thousands) | |||||||||||||||||||
Long-Term Debt Obligations(1) | |||||||||||||||||||
2013 U.S. Credit Facility — Term B | $ | 22,500 | $ | 45,000 | $ | 2,137,500 | $ | — | $ | 2,205,000 | |||||||||
2013 U.S. Credit Facility — Revolving | — | 630,000 | — | — | 630,000 | ||||||||||||||
Airplane Financings | 3,688 | 56,295 | — | — | 59,983 | ||||||||||||||
HVAC Equipment Lease(2) | 1,402 | 2,601 | 11,152 | — | 15,155 | ||||||||||||||
U.S. Other | 118 | 22 | — | — | 140 | ||||||||||||||
2011 VML Credit Facility — Extended Term | — | 597,388 | 1,792,163 | — | 2,389,551 | ||||||||||||||
2011 VML Credit Facility — Accordion Term | — | 74,996 | 584,964 | 339,979 | 999,939 | ||||||||||||||
Macao Other | 2,594 | 1,759 | — | — | 4,353 | ||||||||||||||
2012 Singapore Credit Facility — Term | 65,065 | 276,527 | 2,830,335 | — | 3,171,927 | ||||||||||||||
Fixed Interest Payments | 1,200 | 1,903 | 409 | — | 3,512 | ||||||||||||||
Variable Interest Payments(3) | 251,984 | 485,939 | 304,753 | 1,453 | 1,044,129 | ||||||||||||||
Contractual Obligations | |||||||||||||||||||
Former Tenants(4) | 520 | 1,040 | 1,040 | 5,201 | 7,801 | ||||||||||||||
Employment Agreements(5) | 10,175 | 17,123 | 10,308 | — | 37,606 | ||||||||||||||
Macao Leasehold Interests in Land(6) | 5,003 | 10,562 | 10,562 | 65,323 | 91,450 | ||||||||||||||
Mall Leases(7) | 8,608 | 16,863 | 16,045 | 70,229 | 111,745 | ||||||||||||||
Macao Annual Premium(8) | 39,602 | 79,205 | 79,205 | 59,404 | 257,416 | ||||||||||||||
Parking Lot Lease(9) | 1,200 | 2,400 | 2,400 | 99,900 | 105,900 | ||||||||||||||
Other Operating Leases(10) | 19,337 | 16,006 | 6,370 | 8,878 | 50,591 | ||||||||||||||
Total | $ | 432,996 | $ | 2,315,629 | $ | 7,787,206 | $ | 650,367 | $ | 11,186,198 | |||||||||
_______________________
(1) | See “Item 8 — Financial Statements and Supplementary Data — Notes to Consolidated Financial Statements — Note 8 — Long-Term Debt” for further details on these financing transactions. |
(2) | In July 2009, we entered into a capital lease agreement with our current heating, ventilation and air conditioning (“HVAC”) provider (the “HVAC Equipment Lease”) to provide the operation and maintenance services for the HVAC equipment in Las Vegas. The lease has a 10-year term with a purchase option at the third, fifth, seventh |
66
and tenth anniversary dates. We are obligated under the agreement to make monthly payments of approximately $300,000 for the first year with automatic decreases of approximately $14,000 per month on every anniversary date. The HVAC Equipment Lease has been capitalized at the present value of the future minimum lease payments at lease inception.
(3) | Based on December 31, 2015, London Inter-Bank Offered Rate (“LIBOR”) of 0.6%, Hong Kong Inter-Bank Offered Rate (“HIBOR”) of 0.4% and Singapore Swap Offer Rate (“SOR”) of 1.7% plus the applicable interest rate spread in accordance with the respective debt agreements. |
(4) | We are party to a tenant lease termination and asset purchase agreement. Under the agreement for The Grand Canal Shoppes sale, we are obligated to fulfill the lease termination and asset purchase agreement. |
(5) | We are party to employment agreements with six of our executive officers, with remaining terms of approximately one to five years. |
(6) | We are party to long-term land leases of 25 years with automatic extensions at our option of 10 years thereafter in accordance with Macao law. |
(7) | We are party to certain leaseback agreements for the theater, gondola and retail space related to the sales of The Grand Canal Shoppes and The Shoppes at the Palazzo. |
(8) | In addition to the 39% gross gaming win tax in Macao (which is not included in this table as the amount we pay is variable in nature), we are required to pay an annual premium with a fixed portion and a variable portion, which is based on the number and type of gaming tables and gaming machines we operate. Based on the gaming tables and gaming machines in operation as of December 31, 2015, the annual premium payable to the Macao government is approximately $39.6 million through the termination of the gaming subconcession in June 2022. |
(9) | We are party to a 99-year lease agreement (88 years remaining) for a parking structure located adjacent to The Venetian Las Vegas. |
(10) | We are party to certain operating leases for real estate, various equipment and service arrangements. |
(11) | As of December 31, 2015, we had a $3.0 million liability related to unrecognized tax benefits; we do not expect this liability to result in a payment of cash within the next 12 months. We are unable to reasonably estimate the timing of the liability in individual years beyond 12 months due to uncertainties in the timing of the effective settlement of tax positions; therefore, such amounts are not included in the table. |
Off-Balance Sheet Arrangements
We have not entered into any transactions with special purpose entities, nor have we engaged in any derivative transactions other than interest rate caps and foreign currency contracts.
Restrictions on Distributions
We are a parent company with limited business operations. Our main asset is the stock and membership interests of our subsidiaries. The debt instruments of our U.S., Macao and Singapore subsidiaries contain certain restrictions that, among other things, limit the ability of certain subsidiaries to incur additional indebtedness, issue disqualified stock or equity interests, pay dividends or make other distributions, repurchase equity interests or certain indebtedness, create certain liens, enter into certain transactions with affiliates, enter into certain mergers or consolidations or sell our assets of our company without prior approval of the lenders or noteholders.
Inflation
We believe that inflation and changing prices have not had a material impact on our sales, revenues or income from continuing operations during the past three fiscal years.
Special Note Regarding Forward-Looking Statements
This report contains forward-looking statements that are made pursuant to the Safe Harbor Provisions of the Private Securities Litigation Reform Act of 1995. These forward-looking statements include the discussions of our business strategies and expectations concerning future operations, margins, profitability, liquidity and capital resources. In addition, in certain portions included in this report, the words: “anticipates,” “believes,” “estimates,” “seeks,” “expects,” “plans,” “intends” and similar expressions, as they relate to our company or management, are intended to identify forward-looking statements. Although we believe that these forward-looking statements are reasonable, we
67
cannot assure you that any forward-looking statements will prove to be correct. These forward-looking statements involve known and unknown risks, uncertainties and other factors, which may cause our actual results, performance or achievements to be materially different from any future results, performance or achievements expressed or implied by these forward-looking statements. These factors include, among others, the risks associated with:
• | general economic and business conditions in the U.S. and internationally, which may impact levels of disposable income, consumer spending, group meeting business, pricing of hotel rooms and retail and mall sales; |
• | the uncertainty of consumer behavior related to discretionary spending and vacationing at casino-resorts in Macao, Singapore, Las Vegas and Bethlehem, Pennsylvania; |
• | disruptions in the global financing markets and our ability to obtain sufficient funding for our current and future developments; |
• | the extensive regulations to which we are subject to and the costs of compliance or failure to comply with such regulations; |
• | our leverage, debt service and debt covenant compliance, including the pledge of our assets (other than our equity interests in our subsidiaries) as security for our indebtedness and ability to refinance our debt obligations as they come due; |
• | increased competition for labor and materials due to other planned construction projects in Macao and quota limits on the hiring of foreign workers; |
• | our ability to obtain required visas and work permits for management and employees from outside countries to work in Macao, and our ability to compete for the managers and employees with the skills required to perform the services we offer at our properties; |
• | new developments, construction projects and ventures, including our Cotai Strip developments; |
• | our ability to meet certain development deadlines; |
• | regulatory policies in mainland China or other countries in which our customers reside, or where we have operations, including visa restrictions limiting the number of visits or the length of stay for visitors from mainland China to Macao, restrictions on foreign currency exchange or importation of currency, and the judicial enforcement of gaming debts; |
• | our dependence upon properties primarily in Macao, Singapore and Las Vegas for all of our cash flow; |
• | the passage of new legislation and receipt of governmental approvals for our proposed developments in Macao and other jurisdictions where we are planning to operate; |
• | our insurance coverage, including the risk that we have not obtained sufficient coverage, may not be able to obtain sufficient coverage in the future, or will only be able to obtain additional coverage at significantly increased rates; |
• | disruptions or reductions in travel, as well as disruptions in our operations, due to natural or man-made disasters, outbreaks of infectious diseases, terrorist activity or war; |
• | our ability to collect gaming receivables from our credit players; |
• | our relationship with gaming promoters in Macao; |
• | currency exchange rates; |
• | our dependence on chance and theoretical win rates; |
• | fraud and cheating; |
• | our ability to establish and protect our IP rights; |
• | conflicts of interest that arise because certain of our directors and officers are also directors of SCL; |
• | government regulation of the casino industry (as well as new laws and regulations and changes to existing laws and regulations), including gaming license regulation, the requirement for certain beneficial owners of our |
68
securities to be found suitable by gaming authorities, the legalization of gaming in other jurisdictions and regulation of gaming on the Internet;
• | increased competition in Macao and Las Vegas, including recent and upcoming increases in hotel rooms, meeting and convention space, retail space, potential additional gaming licenses and online gaming; |
• | the popularity of Macao, Singapore and Las Vegas as convention and trade show destinations; |
• | new taxes, changes to existing tax rates or proposed changes in tax legislation; |
• | our ability to maintain our gaming licenses, certificate and subconcession in Macao, Singapore, Las Vegas and Bethlehem, Pennsylvania; |
• | the continued services of our key management and personnel; |
• | any potential conflict between the interests of our Principal Stockholder and us; |
• | the ability of our subsidiaries to make distribution payments to us; |
• | labor actions and other labor problems; |
• | our failure to maintain the integrity of our customer or company data, including against past or future cybersecurity attacks, and any litigation or disruption to our operations resulting from such loss of data integrity; |
• | the completion of infrastructure projects in Macao; |
• | our relationship with GGP or any successor owner of the Grand Canal Shoppes; and |
• | the outcome of any ongoing and future litigation. |
All future written and verbal forward-looking statements attributable to us or any person acting on our behalf are expressly qualified in their entirety by the cautionary statements contained or referred to in this section. New risks and uncertainties arise from time to time, and it is impossible for us to predict these events or how they may affect us. Readers are cautioned not to place undue reliance on these forward-looking statements. We assume no obligation to update any forward-looking statements after the date of this report as a result of new information, future events or developments, except as required by federal securities laws.
Critical Accounting Policies and Estimates
The preparation of our consolidated financial statements in conformity with accounting principles generally accepted in the United States of America requires our management to make estimates and judgments that affect the reported amounts of assets and liabilities, revenues and expenses, and related disclosures of contingent assets and liabilities. These estimates and judgments are based on historical information, information that is currently available to us and on various other assumptions that management believes to be reasonable under the circumstances. Actual results could vary from those estimates and we may change our estimates and assumptions in future evaluations. Changes in these estimates and assumptions may have a material effect on our results of operations and financial condition. We believe that the critical accounting policies discussed below affect our more significant judgments and estimates used in the preparation of our consolidated financial statements.
Allowance for Doubtful Casino Accounts
We maintain an allowance, or reserve, for doubtful casino accounts at our operating casino resorts in Macao, Singapore and the U.S., which we regularly evaluate. We specifically analyze the collectability of each account with a balance over a specified dollar amount, based upon the age of the account, the customer’s financial condition, collection history and any other known information, and we apply standard reserve percentages to aged account balances under the specified dollar amount. We also monitor regional and global economic conditions and forecasts in our evaluation of the adequacy of the recorded reserves. Credit or marker play was 23.1%, 33.1% and 67.4% of table games play at our Macao properties, Marina Bay Sands and Las Vegas Operating Properties, respectively, during the year ended December 31, 2015. Our allowance for doubtful casino accounts was 36.4% and 33.8% of gross casino receivables as of December 31, 2015 and 2014, respectively. The credit extended to our junkets can be offset by the commissions
69
payable to said junkets, which is considered in the establishment of the allowance for doubtful accounts. Our allowance for doubtful accounts from our hotel and other receivables is not material.
Litigation Accrual
We are subject to various claims and legal actions. We estimate the accruals for these claims and legal actions based on all relevant facts and circumstances currently available and include such accruals in other accrued liabilities in the consolidated balance sheets when it is determined that such contingencies are both probable and reasonably estimable.
Property and Equipment
At December 31, 2015, we had net property and equipment of $15.73 billion, representing 75.0% of our total assets. We depreciate property and equipment on a straight-line basis over their estimated useful lives. The estimated useful lives are based on the nature of the assets as well as current operating strategy and legal considerations, such as contractual life. Future events, such as property expansions, property developments, new competition, or new regulations, could result in a change in the manner in which we use certain assets requiring a change in the estimated useful lives of such assets.
For assets to be held and used (including projects under development), fixed assets are reviewed for impairment whenever indicators of impairment exist. If an indicator of impairment exists, we first group our assets with other assets and liabilities at the lowest level for which identifiable cash flows are largely independent of the cash flows of other assets and liabilities (the “asset group”). Secondly, we estimate the undiscounted future cash flows that are directly associated with and expected to arise from the completion, use and eventual disposition of such asset group. We estimate the undiscounted cash flows over the remaining useful life of the primary asset within the asset group. If the undiscounted cash flows exceed the carrying value, no impairment is indicated. If the undiscounted cash flows do not exceed the carrying value, then an impairment is measured based on fair value compared to carrying value, with fair value typically based on a discounted cash flow model. If an asset is still under development, future cash flows include remaining construction costs.
To estimate the undiscounted cash flows of our asset groups, we consider all potential cash flows scenarios, which are probability weighted based on management’s estimates given current conditions. Determining the recoverability of our asset groups is judgmental in nature and requires the use of significant estimates and assumptions, including estimated cash flows, probability weighting of potential scenarios, costs to complete construction for assets under development, growth rates and future market conditions, among others. Future changes to our estimates and assumptions based upon changes in macro-economic factors, regulatory environments, operating results or management’s intentions may result in future changes to the recoverability of our asset groups.
For assets to be held for sale, the fixed assets (the “disposal group”) are measured at the lower of their carrying amount or fair value less cost to sell. Losses are recognized for any initial or subsequent write-down to fair value less cost to sell, while gains are recognized for any subsequent increase in fair value less cost to sell, but not in excess of the cumulative loss previously recognized. Any gains or losses not previously recognized that result from the sale of the disposal group shall be recognized at the date of sale. Fixed assets are not depreciated while classified as held for sale.
Capitalized Interest
Interest costs associated with our major construction projects are capitalized and included in the cost of the projects. When no debt is incurred specifically for construction projects, we capitalize interest on amounts expended using the weighted average cost of our outstanding borrowings. Capitalization of interest ceases when the project is substantially complete or construction activity is suspended for more than a brief period.
Leasehold Interests in Land
Leasehold interests in land represent payments made for the use of land over an extended period of time. The leasehold interests in land are amortized on a straight-line basis over the expected term of the related lease agreements.
70
Indefinite Useful Life Assets
As of December 31, 2015, we had a $50.0 million asset related to our Sands Bethlehem gaming license and a $16.5 million asset related to our Sands Bethlehem table games certificate, both of which were determined to have indefinite useful lives. Assets with indefinite useful lives are assessed regularly to ensure they continue to meet the indefinite useful life criteria. These assets are not subject to amortization and are tested for impairment and recoverability annually or more frequently if events or circumstances indicate that the assets might be impaired. When performing our impairment analysis, we may first conduct a qualitative assessment to determine whether we believe it is “more-likely-than-not” that the asset is impaired. If we elect to perform a qualitative assessment and we determine it is “more-likely-than-not” that the asset is impaired after assessing the qualitative factors, we then perform an impairment test that consists of a comparison of the fair value of the asset with its carrying amount. If the fair value of the asset exceeds the carrying amount, no impairment is recognized. If the fair value of the asset does not exceed the carrying amount, an impairment will be recognized in an amount equal to the difference.
If a quantitative impairment test is to be performed to estimate the fair value of our intangible assets, our fair value analysis would be based on expected adjusted property EBITDA, combined with estimated future tax-affected cash flows and a terminal value using the Gordon Growth Model, which are discounted to present value at rates commensurate with our capital structure and the prevailing borrowing rates within the casino industry in general. Adjusted property EBITDA and discounted cash flows are common measures used to value cash-intensive businesses, such as casinos. Determining the fair value of the gaming license and table games certificate is judgmental in nature and requires the use of significant estimates and assumptions, including adjusted property EBITDA, growth rates, discount rates and future market conditions, among others.
If we determine a qualitative assessment is to be performed, we assess certain qualitative factors including, but not limited to, the results of the most recent fair value calculation, operating results and projected operating results, and macro-economic and industry conditions.
Future changes to our estimates and assumptions based upon changes in operating results, macro-economic factors or management’s intentions may result in future changes to the fair value of the gaming license and table games certificate.
Stock-Based Compensation
Accounting standards regarding share-based payments require the recognition of compensation expense in the consolidated statements of operations related to the fair value of employee stock-based compensation. Determining the fair value of stock-based awards at the grant date requires judgment, including estimating the expected term that stock options will be outstanding prior to exercise, the associated volatility and the expected dividends. Expected volatilities are based on our historical volatility. The expected option life is based on the contractual term of the option as well historical exercise and forfeiture behavior. The expected dividend yield is based on our estimate of annual dividends expected to be paid at the time of the grant. We believe that the valuation technique and the approach utilized to develop the underlying assumptions are appropriate in calculating the fair values of our stock options granted. Judgment is also required in estimating the amount of stock-based awards expected to be forfeited prior to vesting. If actual forfeitures differ significantly from these estimates, stock-based compensation expense could be materially impacted. All employee stock options were granted with an exercise price equal to the fair market value (as defined in the Company’s equity award plans).
During the years ended December 31, 2015 and 2014, we recorded stock-based compensation expense of $45.8 million and $48.1 million, respectively. As of December 31, 2015, under the LVSC 2004 Plan there was $33.4 million of unrecognized compensation cost, net of estimated forfeitures of 8.0% per year, related to unvested stock options and there was $4.7 million of unrecognized compensation cost, net of estimated forfeitures of 8.0% per year, related to unvested restricted stock and stock units. The stock option and restricted stock and stock unit costs are expected to be recognized over a weighted average period of 3.8 years and 1.1 years, respectively.
As of December 31, 2015, under the SCL Equity Plan there was $19.3 million of unrecognized compensation cost, net of estimated forfeitures of 9.5% per year, related to unvested stock options and there was $6.1 million of
71
unrecognized compensation cost related to unvested restricted stock units. The stock option and restricted stock unit costs are expected to be recognized over a weighted average period of 2.9 years and 1.8 years, respectively.
Income Taxes
We are subject to income taxes in the U.S. (including federal and state) and numerous foreign jurisdictions in which we operate. We record income taxes under the asset and liability method, whereby deferred tax assets and liabilities are recognized based on the future tax consequences attributable to temporary differences between the financial statement carrying amounts of existing assets and liabilities and their respective tax bases, and attributable to operating loss and tax credit carryforwards. Accounting standards regarding income taxes require a reduction of the carrying amounts of deferred tax assets by a valuation allowance, if based on the available evidence, it is “more-likely-than-not” that such assets will not be realized. Accordingly, the need to establish valuation allowances for deferred tax assets is assessed at each reporting period based on a “more-likely-than-not” realization threshold. This assessment considers, among other matters, the nature, frequency and severity of current and cumulative losses, forecasts of future profitability, the duration of statutory carryforward periods, our experience with operating loss and tax credit carryforwards not expiring, and implementation of tax planning strategies.
We recorded a valuation allowance on the net deferred tax assets of certain foreign jurisdictions of $195.8 million and $215.2 million, as of December 31, 2015 and 2014, respectively, and a valuation allowance on certain net deferred tax assets of our U.S. operations of $3.11 billion and $2.27 billion as of December 31, 2015 and 2014, respectively. Management will reassess the realization of deferred tax assets based on the applicable accounting standards for income taxes each reporting period and consider the scheduled reversal of deferred tax liabilities, sources of taxable income and tax planning strategies. To the extent that the financial results of these operations improve and it becomes “more-likely-than-not” that the deferred tax assets are realizable, we will be able to reduce the valuation allowance in the period such determination is made.
Significant judgment is required in evaluating our tax positions and determining our provision for income taxes. During the ordinary course of business, there are many transactions for which the tax treatment is uncertain. Accounting standards regarding uncertainty in income taxes provides a two-step approach to recognizing and measuring uncertain tax positions. The first step is to evaluate the tax position for recognition by determining if the weight of available evidence indicates it is “more-likely-than-not” that the position will be sustained on audit, including resolution of related appeals or litigation processes, if any. The second step is to measure the tax benefit as the largest amount that is more than 50% likely, based solely on the technical merits, of being sustained on examinations. We consider many factors when evaluating and estimating our tax positions and tax benefits, which may require periodic adjustments and for which actual outcomes may be different.
Our major tax jurisdictions are the U.S., Macao, and Singapore. We are subject to examination for years beginning 2010 in the U.S. and Singapore and for years beginning 2011 in Macao. The Inland Revenue Authority of Singapore is currently performing a compliance review of the Marina Bay Sands tax return for tax years 2010 through 2012.
Recent Accounting Pronouncements
See related disclosure at “Item 8 — Financial Statements and Supplementary Data — Notes to Consolidated Financial Statements — Note 2 — Summary of Significant Accounting Policies.”
ITEM 7A. — QUANTITATIVE AND QUALITATIVE DISCLOSURES ABOUT MARKET RISK
Market risk is the risk of loss arising from adverse changes in market rates and prices, such as interest rates, foreign currency exchange rates and commodity prices. Our primary exposure to market risk is interest rate risk associated with our variable rate long-term debt and foreign currency exchange rate risk associated with our operations outside the United States, which we may manage through the use of interest rate swaps, futures, options, caps, forward contracts and similar instruments. We do not hold or issue financial instruments for trading purposes and do not enter into derivative transactions that would be considered speculative positions. Our derivative financial instruments currently consist exclusively of interest rate cap agreements and foreign currency forward contracts, none of which have been designated as hedging instruments.
72
To manage exposure to counterparty credit risk in interest rate cap agreements and foreign currency forward contracts, we enter into agreements with highly rated institutions that can be expected to fully perform under the terms of such agreements. Frequently, these institutions are also members of the bank group providing our credit facilities, which management believes further minimizes the risk of nonperformance.
The table below provides information about our financial instruments that are sensitive to changes in interest rates. For debt obligations, the table presents notional amounts and weighted average interest rates by contractual maturity dates. Notional amounts are used to calculate the contractual payments to be exchanged under the contract. Weighted average variable rates are based on December 31, 2015, LIBOR, HIBOR and SOR plus the applicable interest rate spread in accordance with the respective debt agreements. The information is presented in U.S. dollar equivalents, which is the Company’s reporting currency, for the years ending December 31:
2016 | 2017 | 2018 | 2019 | 2020 | Thereafter | Total | Fair Value(1) | ||||||||||||||||||||||||
(In millions) | |||||||||||||||||||||||||||||||
LIABILITIES | |||||||||||||||||||||||||||||||
Long-term debt | |||||||||||||||||||||||||||||||
Variable rate | $ | 91.2 | $ | 323.1 | $ | 1,357.1 | $ | 2,250.8 | $ | 5,094.2 | $ | 340.0 | $ | 9,456.4 | $ | 9,224.6 | |||||||||||||||
Average interest rate(2) | 3.3 | % | 2.2 | % | 2.2 | % | 2.5 | % | 2.9 | % | 1.7 | % | 2.7 | % | |||||||||||||||||
ASSETS | |||||||||||||||||||||||||||||||
Cap Agreements(3) | $ | — | $ | — | $ | — | $ | — | $ | — | $ | — | $ | — | $ | — | |||||||||||||||
_________________________
(1) | The estimated fair values are based on level 2 inputs (quoted prices in markets that are not active). |
(2) | Based upon contractual interest rates for current LIBOR, HIBOR and SOR for variable rate indebtedness. Based on variable rate debt levels as of December 31, 2015, an assumed 100 basis point change in LIBOR, HIBOR and SOR would cause our annual interest cost to change by approximately $92.0 million. |
(3) | As of December 31, 2015, we had one interest rate cap agreement with a nominal aggregate fair value based on quoted market values from the institutions holding the agreement. |
Foreign currency transaction gains for the year ended December 31, 2015 were $19.4 million primarily due to Singapore dollar denominated intercompany debt held in the U.S., partially offset by U.S. dollar denominated debt held in Macao. We may be vulnerable to changes in the U.S. dollar/SGD and U.S. dollar/pataca exchange rates. Based on balances as of December 31, 2015, an assumed 10% change in the U.S. dollar/SGD exchange rate would cause a foreign currency transaction gain/loss of approximately $31.1 million and an assumed 1% change in the U.S. dollar/pataca exchange rate would cause a foreign currency transaction gain/loss of approximately $12.8 million. We maintain a significant amount of our operating funds in the same currencies in which we have obligations thereby reducing our exposure to currency fluctuations. Additionally, we manage our exposure to currency fluctuations with our foreign currency forward contracts. As of December 31, 2015, we had 19 foreign currency forward contracts with a total notional value of $672.7 million and a total asset fair value of $4.2 million.
See also “— Liquidity and Capital Resources,” “Item 8 — Financial Statements and Supplementary Data — Notes to Consolidated Financial Statements — Note 8 — Long-Term Debt,” and “Item 8 — Financial Statements and Supplementary Data — Notes to Consolidated Financial Statements — Note 11 — Fair Value Measurements.”
73
ITEM 8. — FINANCIAL STATEMENTS AND SUPPLEMENTARY DATA
INDEX TO FINANCIAL STATEMENTS
Financial Statements: | |
Financial Statement Schedule: | |
The financial information included in the financial statement schedule should be read in conjunction with the consolidated financial statements. All other financial statement schedules have been omitted because they are not applicable or the required information is included in the consolidated financial statements or the notes thereto.
74
REPORT OF INDEPENDENT REGISTERED PUBLIC ACCOUNTING FIRM
To the Board of Directors and Stockholders of
Las Vegas Sands Corp.
We have audited the accompanying consolidated balance sheets of Las Vegas Sands Corp. and subsidiaries (the "Company") as of December 31, 2015 and 2014, and the related consolidated statements of operations, comprehensive income, equity, and cash flows for each of the three years in the period ended December 31, 2015. Our audits also included the financial statement schedule listed in the Index at Item 15(a)(2). These financial statements and financial statement schedule are the responsibility of the Company’s management. Our responsibility is to express an opinion on the financial statements and financial statement schedule based on our audits.
We conducted our audits in accordance with the standards of the Public Company Accounting Oversight Board (United States). Those standards require that we plan and perform the audit to obtain reasonable assurance about whether the financial statements are free of material misstatement. An audit includes examining, on a test basis, evidence supporting the amounts and disclosures in the financial statements. An audit also includes assessing the accounting principles used and significant estimates made by management, as well as evaluating the overall financial statement presentation. We believe that our audits provide a reasonable basis for our opinion.
In our opinion, such consolidated financial statements present fairly, in all material respects, the financial position of Las Vegas Sands Corp. and subsidiaries at December 31, 2015 and 2014, and the results of their operations and their cash flows for each of the three years in the period ended December 31, 2015, in conformity with accounting principles generally accepted in the United States of America. Also, in our opinion, such financial statement schedule, when considered in relation to the basic consolidated financial statements taken as a whole, presents fairly, in all material respects, the information set forth therein.
We have also audited, in accordance with the standards of the Public Company Accounting Oversight Board (United States), the Company's internal control over financial reporting as of December 31, 2015, based on the criteria established in Internal Control-Integrated Framework (2013) issued by the Committee of Sponsoring Organizations of the Treadway Commission and our report dated February 26, 2016 expressed an unqualified opinion on the Company's internal control over financial reporting.
/s/ Deloitte & Touche LLP |
Las Vegas, Nevada |
February 26, 2016 |
75
REPORT OF INDEPENDENT REGISTERED PUBLIC ACCOUNTING FIRM
To the Board of Directors and Stockholders of
Las Vegas Sands Corp.
We have audited the internal control over financial reporting of Las Vegas Sands Corp. and subsidiaries (the "Company") as of December 31, 2015, based on criteria established in Internal Control - Integrated Framework (2013) issued by the Committee of Sponsoring Organizations of the Treadway Commission. The Company's management is responsible for maintaining effective internal control over financial reporting and for its assessment of the effectiveness of internal control over financial reporting, included in the accompanying Management's Annual Report on Internal Control over Financial Reporting appearing under Item 9A. Our responsibility is to express an opinion on the Company's internal control over financial reporting based on our audit.
We conducted our audit in accordance with the standards of the Public Company Accounting Oversight Board (United States). Those standards require that we plan and perform the audit to obtain reasonable assurance about whether effective internal control over financial reporting was maintained in all material respects. Our audit included obtaining an understanding of internal control over financial reporting, assessing the risk that a material weakness exists, testing and evaluating the design and operating effectiveness of internal control based on the assessed risk, and performing such other procedures as we considered necessary in the circumstances. We believe that our audit provides a reasonable basis for our opinion.
A company's internal control over financial reporting is a process designed by, or under the supervision of, the company's principal executive and principal financial officers, or persons performing similar functions, and effected by the company's board of directors, management, and other personnel to provide reasonable assurance regarding the reliability of financial reporting and the preparation of financial statements for external purposes in accordance with generally accepted accounting principles. A company's internal control over financial reporting includes those policies and procedures that (1) pertain to the maintenance of records that, in reasonable detail, accurately and fairly reflect the transactions and dispositions of the assets of the company; (2) provide reasonable assurance that transactions are recorded as necessary to permit preparation of financial statements in accordance with generally accepted accounting principles, and that receipts and expenditures of the company are being made only in accordance with authorizations of management and directors of the company; and (3) provide reasonable assurance regarding prevention or timely detection of unauthorized acquisition, use, or disposition of the company's assets that could have a material effect on the financial statements.
Because of the inherent limitations of internal control over financial reporting, including the possibility of collusion or improper management override of controls, material misstatements due to error or fraud may not be prevented or detected on a timely basis. Also, projections of any evaluation of the effectiveness of the internal control over financial reporting to future periods are subject to the risk that the controls may become inadequate because of changes in conditions, or that the degree of compliance with the policies or procedures may deteriorate.
In our opinion, the Company maintained, in all material respects, effective internal control over financial reporting as of December 31, 2015, based on the criteria established in Internal Control - Integrated Framework (2013) issued by the Committee of Sponsoring Organizations of the Treadway Commission.
We have also audited, in accordance with the standards of the Public Company Accounting Oversight Board (United States), the consolidated financial statements and financial statement schedule as of and for the year ended December 31, 2015 of the Company and our report dated February 26, 2016 expressed an unqualified opinion on those financial statements and financial statement schedules.
/s/ Deloitte & Touche LLP |
Las Vegas, Nevada |
February 26, 2016 |
76
LAS VEGAS SANDS CORP. AND SUBSIDIARIES
CONSOLIDATED BALANCE SHEETS
December 31, | |||||||
2015 | 2014 | ||||||
(In thousands, except share data) | |||||||
ASSETS | |||||||
Current assets: | |||||||
Cash and cash equivalents | $ | 2,179,490 | $ | 3,506,319 | |||
Restricted cash and cash equivalents | 7,901 | 6,566 | |||||
Accounts receivable, net | 1,267,848 | 1,510,772 | |||||
Inventories | 42,573 | 41,674 | |||||
Prepaid expenses and other | 111,438 | 125,168 | |||||
Total current assets | 3,609,250 | 5,190,499 | |||||
Property and equipment, net | 15,731,638 | 15,372,474 | |||||
Deferred financing costs, net | 169,693 | 205,596 | |||||
Deferred income taxes, net | 23,681 | 24,076 | |||||
Leasehold interests in land, net | 1,262,132 | 1,353,090 | |||||
Intangible assets, net | 71,586 | 86,260 | |||||
Other assets, net | 119,441 | 122,052 | |||||
Total assets | $ | 20,987,421 | $ | 22,354,047 | |||
LIABILITIES AND EQUITY | |||||||
Current liabilities: | |||||||
Accounts payable | $ | 110,408 | $ | 112,721 | |||
Construction payables | 364,136 | 270,929 | |||||
Accrued interest payable | 1,863 | 7,943 | |||||
Other accrued liabilities | 1,694,305 | 1,984,444 | |||||
Income taxes payable | 198,056 | 224,201 | |||||
Current maturities of long-term debt | 95,367 | 99,734 | |||||
Total current liabilities | 2,464,135 | 2,699,972 | |||||
Other long-term liabilities | 113,368 | 124,614 | |||||
Deferred income taxes | 201,734 | 193,813 | |||||
Deferred proceeds from sale of The Shoppes at The Palazzo | 268,427 | 268,710 | |||||
Deferred gain on sale of The Grand Canal Shoppes | 35,130 | 37,968 | |||||
Deferred rent from mall sale transactions | 113,995 | 115,475 | |||||
Long-term debt | 9,372,645 | 9,892,913 | |||||
Total liabilities | 12,569,434 | 13,333,465 | |||||
Commitments and contingencies (Note 13) | |||||||
Equity: | |||||||
Common stock, $0.001 par value, 1,000,000,000 shares authorized, 830,051,259 and 829,280,328 shares issued, and 794,645,310 and 798,258,172 shares outstanding | 830 | 829 | |||||
Treasury stock, at cost, 35,405,949 and 31,022,156 shares | (2,443,036 | ) | (2,237,952 | ) | |||
Capital in excess of par value | 6,484,843 | 6,428,762 | |||||
Accumulated other comprehensive income (loss) | (66,283 | ) | 76,101 | ||||
Retained earnings | 2,840,387 | 2,945,846 | |||||
Total Las Vegas Sands Corp. stockholders’ equity | 6,816,741 | 7,213,586 | |||||
Noncontrolling interests | 1,601,246 | 1,806,996 | |||||
Total equity | 8,417,987 | 9,020,582 | |||||
Total liabilities and equity | $ | 20,987,421 | $ | 22,354,047 | |||
The accompanying notes are an integral part of these consolidated financial statements.
77
LAS VEGAS SANDS CORP. AND SUBSIDIARIES
CONSOLIDATED STATEMENTS OF OPERATIONS
Year Ended December 31, | |||||||||||
2015 | 2014 | 2013 | |||||||||
(In thousands, except share and per share data) | |||||||||||
Revenues: | |||||||||||
Casino | $ | 9,083,004 | $ | 12,004,361 | $ | 11,386,917 | |||||
Rooms | 1,469,874 | 1,540,420 | 1,380,681 | ||||||||
Food and beverage | 757,512 | 778,769 | 730,259 | ||||||||
Mall | 564,309 | 553,534 | 481,400 | ||||||||
Convention, retail and other | 539,651 | 548,704 | 515,179 | ||||||||
12,414,350 | 15,425,788 | 14,494,436 | |||||||||
Less — promotional allowances | (725,889 | ) | (841,939 | ) | (724,551 | ) | |||||
Net revenues | 11,688,461 | 14,583,849 | 13,769,885 | ||||||||
Operating expenses: | |||||||||||
Casino | 5,113,870 | 6,705,534 | 6,483,718 | ||||||||
Rooms | 262,440 | 256,835 | 271,942 | ||||||||
Food and beverage | 402,660 | 392,560 | 369,570 | ||||||||
Mall | 61,299 | 69,732 | 73,358 | ||||||||
Convention, retail and other | 276,821 | 320,759 | 317,869 | ||||||||
Provision for doubtful accounts | 155,635 | 186,722 | 237,786 | ||||||||
General and administrative | 1,267,415 | 1,258,133 | 1,329,740 | ||||||||
Corporate | 176,169 | 174,750 | 189,535 | ||||||||
Pre-opening | 47,509 | 26,230 | 13,339 | ||||||||
Development | 10,372 | 14,325 | 15,809 | ||||||||
Depreciation and amortization | 998,919 | 1,031,589 | 1,007,468 | ||||||||
Amortization of leasehold interests in land | 38,645 | 40,598 | 40,352 | ||||||||
Loss on disposal of assets | 35,232 | 6,856 | 11,156 | ||||||||
8,846,986 | 10,484,623 | 10,361,642 | |||||||||
Operating income | 2,841,475 | 4,099,226 | 3,408,243 | ||||||||
Other income (expense): | |||||||||||
Interest income | 15,085 | 25,643 | 16,337 | ||||||||
Interest expense, net of amounts capitalized | (265,220 | ) | (274,181 | ) | (271,211 | ) | |||||
Other income | 30,542 | 1,965 | 4,321 | ||||||||
Loss on modification or early retirement of debt | — | (19,942 | ) | (14,178 | ) | ||||||
Income before income taxes | 2,621,882 | 3,832,711 | 3,143,512 | ||||||||
Income tax expense | (236,185 | ) | (244,640 | ) | (188,836 | ) | |||||
Net income | 2,385,697 | 3,588,071 | 2,954,676 | ||||||||
Net income attributable to noncontrolling interests | (419,461 | ) | (747,442 | ) | (648,679 | ) | |||||
Net income attributable to Las Vegas Sands Corp. | $ | 1,966,236 | $ | 2,840,629 | $ | 2,305,997 | |||||
Earnings per share: | |||||||||||
Basic | $ | 2.47 | $ | 3.52 | $ | 2.80 | |||||
Diluted | $ | 2.47 | $ | 3.52 | $ | 2.79 | |||||
Weighted average shares outstanding: | |||||||||||
Basic | 796,785,900 | 806,130,838 | 822,282,515 | ||||||||
Diluted | 797,596,082 | 808,019,219 | 826,316,108 | ||||||||
Dividends declared per common share | $ | 2.60 | $ | 2.00 | $ | 1.40 | |||||
The accompanying notes are an integral part of these consolidated financial statements.
78
LAS VEGAS SANDS CORP. AND SUBSIDIARIES
CONSOLIDATED STATEMENTS OF COMPREHENSIVE INCOME
Year Ended December 31, | |||||||||||
2015 | 2014 | 2013 | |||||||||
(In thousands) | |||||||||||
Net income | $ | 2,385,697 | $ | 3,588,071 | $ | 2,954,676 | |||||
Currency translation adjustment, net of reclassification adjustment and before and after tax | (141,012 | ) | (98,414 | ) | (89,976 | ) | |||||
Total comprehensive income | 2,244,685 | 3,489,657 | 2,864,700 | ||||||||
Comprehensive income attributable to noncontrolling interests | (420,833 | ) | (746,710 | ) | (647,998 | ) | |||||
Comprehensive income attributable to Las Vegas Sands Corp. | $ | 1,823,852 | $ | 2,742,947 | $ | 2,216,702 | |||||
The accompanying notes are an integral part of these consolidated financial statements.
79
LAS VEGAS SANDS CORP. AND SUBSIDIARIES
CONSOLIDATED STATEMENTS OF EQUITY
Las Vegas Sands Corp. Stockholders' Equity | |||||||||||||||||||||||||||
Common Stock | Treasury Stock | Capital in Excess of Par Value | Accumulated Other Comprehensive Income (Loss) | Retained Earnings | Noncontrolling Interests | Total | |||||||||||||||||||||
Balance at January 1, 2013 | $ | 824 | $ | — | $ | 6,237,488 | $ | 263,078 | $ | 560,452 | $ | 1,596,570 | $ | 8,658,412 | |||||||||||||
Net income | — | — | — | — | 2,305,997 | 648,679 | 2,954,676 | ||||||||||||||||||||
Currency translation adjustment | — | — | — | (89,295 | ) | — | (681 | ) | (89,976 | ) | |||||||||||||||||
Exercise of stock options | 3 | — | 60,065 | — | — | 9,528 | 69,596 | ||||||||||||||||||||
Stock-based compensation | — | — | 50,162 | — | — | 4,156 | 54,318 | ||||||||||||||||||||
Repurchase of common stock | — | (570,520 | ) | — | — | — | — | (570,520 | ) | ||||||||||||||||||
Exercise of warrants | — | — | 350 | — | — | — | 350 | ||||||||||||||||||||
Dividends declared | — | — | — | — | (1,153,110 | ) | (411,359 | ) | (1,564,469 | ) | |||||||||||||||||
Distributions to noncontrolling interests | — | — | — | — | — | (11,858 | ) | (11,858 | ) | ||||||||||||||||||
Balance at December 31, 2013 | 827 | (570,520 | ) | 6,348,065 | 173,783 | 1,713,339 | 1,835,035 | 9,500,529 | |||||||||||||||||||
Net income | — | — | — | — | 2,840,629 | 747,442 | 3,588,071 | ||||||||||||||||||||
Currency translation adjustment | — | — | — | (97,682 | ) | — | (732 | ) | (98,414 | ) | |||||||||||||||||
Exercise of stock options | 2 | — | 49,663 | — | — | 5,985 | 55,650 | ||||||||||||||||||||
Tax shortfall from stock-based compensation | — | — | (12,365 | ) | — | — | — | (12,365 | ) | ||||||||||||||||||
Stock-based compensation | — | — | 43,399 | — | — | 6,096 | 49,495 | ||||||||||||||||||||
Repurchase of common stock | — | (1,667,432 | ) | — | — | — | — | (1,667,432 | ) | ||||||||||||||||||
Disposition of interest in majority owned subsidiary | — | — | — | — | — | (487 | ) | (487 | ) | ||||||||||||||||||
Dividends declared | — | — | — | — | (1,608,122 | ) | (776,570 | ) | (2,384,692 | ) | |||||||||||||||||
Distributions to noncontrolling interests | — | — | — | — | — | (9,773 | ) | (9,773 | ) | ||||||||||||||||||
Balance at December 31, 2014 | 829 | (2,237,952 | ) | 6,428,762 | 76,101 | 2,945,846 | 1,806,996 | 9,020,582 | |||||||||||||||||||
Net income | — | — | — | — | 1,966,236 | 419,461 | 2,385,697 | ||||||||||||||||||||
Currency translation adjustment, net of reclassification adjustment | — | — | — | (142,384 | ) | — | 1,372 | (141,012 | ) | ||||||||||||||||||
Exercise of stock options | 1 | — | 14,772 | — | — | 2,103 | 16,876 | ||||||||||||||||||||
Tax benefit from stock-based compensation | — | — | 4,742 | — | — | — | 4,742 | ||||||||||||||||||||
Conversion of equity awards to liability awards | — | — | (4,608 | ) | — | — | (1,963 | ) | (6,571 | ) | |||||||||||||||||
Stock-based compensation | — | — | 41,175 | — | — | 6,305 | 47,480 | ||||||||||||||||||||
Repurchase of common stock | — | (205,084 | ) | — | — | — | — | (205,084 | ) | ||||||||||||||||||
Dividends declared | — | — | — | — | (2,071,695 | ) | (619,120 | ) | (2,690,815 | ) | |||||||||||||||||
Distributions to noncontrolling interests | — | — | — | — | — | (13,908 | ) | (13,908 | ) | ||||||||||||||||||
Balance at December 31, 2015 | $ | 830 | $ | (2,443,036 | ) | $ | 6,484,843 | $ | (66,283 | ) | $ | 2,840,387 | $ | 1,601,246 | $ | 8,417,987 | |||||||||||
The accompanying notes are an integral part of these consolidated financial statements.
80
LAS VEGAS SANDS CORP. AND SUBSIDIARIES
CONSOLIDATED STATEMENTS OF CASH FLOWS
Year Ended December 31, | |||||||||||
2015 | 2014 | 2013 | |||||||||
(In thousands) | |||||||||||
Cash flows from operating activities: | |||||||||||
Net income | $ | 2,385,697 | $ | 3,588,071 | $ | 2,954,676 | |||||
Adjustments to reconcile net income to net cash generated from operating activities: | |||||||||||
Depreciation and amortization | 998,919 | 1,031,589 | 1,007,468 | ||||||||
Amortization of leasehold interests in land | 38,645 | 40,598 | 40,352 | ||||||||
Amortization of deferred financing costs and original issue discount | 44,223 | 50,978 | 56,792 | ||||||||
Amortization of deferred gain on and rent from mall sale transactions | (4,318 | ) | (3,928 | ) | (4,944 | ) | |||||
Non-cash change in deferred proceeds from sale of The Shoppes at The Palazzo | 556 | 985 | 1,376 | ||||||||
Non-cash loss on modification or early retirement of debt | — | 15,345 | 3,255 | ||||||||
Loss on disposal of assets | 35,232 | 6,856 | 11,156 | ||||||||
Stock-based compensation expense | 45,804 | 48,058 | 53,377 | ||||||||
Provision for doubtful accounts | 155,635 | 186,722 | 237,786 | ||||||||
Foreign exchange gain | (21,113 | ) | (11,842 | ) | (13,029 | ) | |||||
Excess tax benefits from stock-based compensation | (8,785 | ) | (3,585 | ) | — | ||||||
Deferred income taxes | 18,663 | (3,235 | ) | (4,245 | ) | ||||||
Changes in operating assets and liabilities: | |||||||||||
Accounts receivable | 49,293 | 37,411 | (209,055 | ) | |||||||
Inventories | (1,334 | ) | (30 | ) | 1,113 | ||||||
Prepaid expenses and other | 12,116 | (26,667 | ) | (1,134 | ) | ||||||
Leasehold interests in land | (4,398 | ) | (3,428 | ) | (47,906 | ) | |||||
Accounts payable | (512 | ) | (5,215 | ) | 13,777 | ||||||
Accrued interest payable | (5,886 | ) | 1,683 | (8,608 | ) | ||||||
Income taxes payable | (4,001 | ) | 60,706 | 18,911 | |||||||
Other accrued liabilities | (284,465 | ) | (178,228 | ) | 328,294 | ||||||
Net cash generated from operating activities | 3,449,971 | 4,832,844 | 4,439,412 | ||||||||
Cash flows from investing activities: | |||||||||||
Change in restricted cash and cash equivalents | (1,328 | ) | 270 | (382 | ) | ||||||
Capital expenditures | (1,528,642 | ) | (1,178,656 | ) | (898,111 | ) | |||||
Proceeds from disposal of property and equipment | 1,504 | 1,818 | 32,155 | ||||||||
Acquisition of intangible assets | — | — | (45,871 | ) | |||||||
Net cash used in investing activities | (1,528,466 | ) | (1,176,568 | ) | (912,209 | ) | |||||
Cash flows from financing activities: | |||||||||||
Proceeds from exercise of stock options | 16,876 | 55,650 | 69,596 | ||||||||
Excess tax benefits from stock-based compensation | 8,785 | 3,585 | — | ||||||||
Repurchase of common stock | (205,084 | ) | (1,676,802 | ) | (561,150 | ) | |||||
Proceeds from exercise of warrants | — | — | 350 | ||||||||
Dividends paid | (2,692,882 | ) | (2,386,657 | ) | (1,564,049 | ) | |||||
Distributions to noncontrolling interests | (13,908 | ) | (9,773 | ) | (11,858 | ) | |||||
Proceeds from long-term debt (Note 8) | 2,089,277 | 2,497,725 | 3,183,107 | ||||||||
Repayments of long-term debt (Note 8) | (2,397,717 | ) | (2,117,466 | ) | (3,513,032 | ) | |||||
Payments of deferred financing costs | (11,745 | ) | (88,048 | ) | (35,414 | ) | |||||
Net cash used in financing activities | (3,206,398 | ) | (3,721,786 | ) | (2,432,450 | ) | |||||
Effect of exchange rate on cash | (41,936 | ) | (28,585 | ) | (7,105 | ) | |||||
Increase (decrease) in cash and cash equivalents | (1,326,829 | ) | (94,095 | ) | 1,087,648 | ||||||
Cash and cash equivalents at beginning of year | 3,506,319 | 3,600,414 | 2,512,766 | ||||||||
Cash and cash equivalents at end of year | $ | 2,179,490 | $ | 3,506,319 | $ | 3,600,414 | |||||
81
LAS VEGAS SANDS CORP. AND SUBSIDIARIES
CONSOLIDATED STATEMENTS OF CASH FLOWS (CONTINUED)
Year Ended December 31, | |||||||||||
2015 | 2014 | 2013 | |||||||||
(In thousands) | |||||||||||
Supplemental disclosure of cash flow information: | |||||||||||
Cash payments for interest, net of amounts capitalized | $ | 211,889 | $ | 206,621 | $ | 208,242 | |||||
Cash payments for taxes, net of refunds | $ | 225,504 | $ | 187,897 | $ | 173,276 | |||||
Changes in construction payables | $ | 93,207 | $ | 29,369 | $ | (101,812 | ) | ||||
Non-cash investing and financing activities: | |||||||||||
Capitalized stock-based compensation costs | $ | 335 | $ | 1,437 | $ | 941 | |||||
Change in dividends payable on unvested restricted stock and stock units included in other accrued liabilities | $ | (2,067 | ) | $ | (1,965 | ) | $ | 420 | |||
Change in common stock repurchase payable included in other accrued liabilities | $ | — | $ | (9,370 | ) | $ | 9,370 | ||||
Disposition of interest in majority owned subsidiary | $ | — | $ | 487 | $ | — | |||||
Property and equipment acquired under capital lease | $ | 871 | $ | — | $ | 2,761 | |||||
Conversion of equity awards to liability awards | $ | 6,571 | $ | — | $ | — | |||||
The accompanying notes are an integral part of these consolidated financial statements.
82
LAS VEGAS SANDS CORP. AND SUBSIDIARIES
NOTES TO CONSOLIDATED FINANCIAL STATEMENTS
Note 1 — Organization and Business of Company
Las Vegas Sands Corp. (“LVSC” or together with its subsidiaries, the “Company”) is incorporated in Nevada and its common stock is traded on the New York Stock Exchange under the symbol “LVS.”
The ordinary shares of the Company’s subsidiary, Sands China Ltd. (“SCL,” the indirect owner and operator of the majority of the Company’s operations in the Macao Special Administrative Region (“Macao”) of the People’s Republic of China) are listed on The Main Board of The Stock Exchange of Hong Kong Limited (“SEHK”). The shares were not, and will not be, registered under the Securities Act of 1933, as amended, and may not be offered or sold in the U.S. absent a registration under the Securities Act of 1933, as amended, or an applicable exception from such registration requirements.
Operations
Macao
The Company currently owns 70.1% of SCL, which includes the operations of The Venetian Macao, Sands Cotai Central, Four Seasons Macao, Sands Macao and other ancillary operations that support these properties, as further discussed below. The Company operates the gaming areas within these properties pursuant to a 20-year gaming subconcession agreement, which expires in June 2022.
The Company owns and operates The Venetian Macao Resort Hotel (“The Venetian Macao”), which anchors the Cotai Strip, the Company’s master-planned development of integrated resort properties on an area of approximately 140 acres in Macao. The Venetian Macao includes a 39-floor luxury hotel with over 2,900 suites; approximately 376,000 square feet of gaming space; a 15,000-seat arena; an 1,800-seat theater; a mall with retail and dining space of approximately 921,000 square feet; and a convention center and meeting room complex of approximately 1.2 million square feet.
The Company owns the Sands Cotai Central, an integrated resort situated across the street from The Venetian Macao and Four Seasons Macao (which is further described below). The Sands Cotai Central opened in phases, beginning in April 2012. The property features four hotel towers: the first hotel tower, consisting of approximately 650 five-star rooms and suites under the Conrad brand and approximately 1,200 four-star rooms and suites under the Holiday Inn brand; the second hotel tower, consisting of approximately 1,800 rooms and suites under the Sheraton brand; the third hotel tower, consisting of approximately 2,100 rooms and suites under the Sheraton brand; and the fourth hotel tower, consisting of approximately 400 rooms and suites under the St. Regis brand. Within Sands Cotai Central, the Company also owns and currently operates approximately 370,000 square feet of gaming space, approximately 369,000 square feet of meeting space and approximately 332,000 square feet of retail space, as well as entertainment and dining facilities. The Company is constructing the remainder of the fourth tower, an apart-hotel wing that consists of approximately 1.0 million square feet of St. Regis-serviced and -branded luxury apart-hotel units and common areas, subject to Macao government approval. The total cost to complete the remainder of the tower is expected to be approximately $220 million. Upon completion of the project, the integrated resort will feature approximately 370,000 square feet of gaming space, approximately 800,000 square feet of retail, dining and entertainment space, over 550,000 square feet of meeting facilities and a multipurpose theater. As of December 31, 2015, the Company has capitalized costs of $4.87 billion for the entire project, including the land premium (net of amortization) and $84.1 million in outstanding construction payables.
The Company owns the Four Seasons Hotel Macao, Cotai Strip (the “Four Seasons Hotel Macao”), which features 360 rooms and suites managed and operated by Four Seasons Hotels Inc. and is located adjacent and connected to The Venetian Macao. Connected to the Four Seasons Hotel Macao, the Company owns and operates the Plaza Casino (together with the Four Seasons Hotel Macao, the “Four Seasons Macao”), which features approximately 105,000 square feet of gaming space; 19 Paiza mansions; retail space of approximately 259,000 square feet, which is connected to the mall at The Venetian Macao; several food and beverage offerings; and conference, banquet and other facilities. This integrated resort will also feature the Four Seasons Apartment Hotel Macao, Cotai Strip (the “Four Seasons Apartments”), an apart-hotel tower that consists of approximately 1.0 million square feet of Four Seasons-serviced and
83
LAS VEGAS SANDS CORP. AND SUBSIDIARIES
NOTES TO CONSOLIDATED FINANCIAL STATEMENTS - (CONTINUED)
-branded luxury apart-hotel units and common areas. The Company has completed the structural work of the tower and is advancing its plans to monetize units within the Four Seasons Apartments.
The Company owns and operates the Sands Macao, the first Las Vegas-style casino in Macao. The Sands Macao offers approximately 216,000 square feet of gaming space and a 289-suite hotel tower, as well as several restaurants, VIP facilities, a theater and other high-end services and amenities.
Singapore
The Company owns and operates the Marina Bay Sands in Singapore, which features three 55-story hotel towers (totaling approximately 2,600 rooms and suites), the Sands SkyPark (which sits atop the hotel towers and features an infinity swimming pool and several dining options), approximately 160,000 square feet of gaming space, an enclosed retail, dining and entertainment complex of approximately 800,000 net leasable square feet, a convention center and meeting room complex of approximately 1.2 million square feet, theaters and a landmark iconic structure at the bay-front promenade that contains an art/science museum.
United States
Las Vegas
The Company owns and operates The Venetian Resort Hotel Casino (“The Venetian Las Vegas”), a Renaissance Venice-themed resort; The Palazzo Resort Hotel Casino (“The Palazzo”), a resort featuring modern European ambience and design; and an expo and convention center of approximately 1.2 million square feet (the “Sands Expo Center”). These Las Vegas properties, situated on or near the Las Vegas Strip, form an integrated resort with approximately 7,100 suites; approximately 225,000 square feet of gaming space; a meeting and conference facility of approximately 1.1 million square feet; and the Grand Canal Shoppes, which consist of two enclosed retail, dining and entertainment complexes that were sold to GGP Limited Partnership (“GGP,” see “— Note 12 — Mall Sales”).
Pennsylvania
The Company owns and operates the Sands Casino Resort Bethlehem (the “Sands Bethlehem”), a gaming, hotel, retail and dining complex located on the site of the historic Bethlehem Steel Works in Bethlehem, Pennsylvania. Sands Bethlehem features approximately 145,000 square feet of gaming space; a 300-room hotel tower; a 150,000-square-foot retail facility; an arts and cultural center; and a 50,000-square-foot multipurpose event center. The Company owns 86% of the economic interest in the gaming, hotel and entertainment portion of the property through its ownership interest in Sands Bethworks Gaming LLC and approximately 35% of the economic interest in the retail portion of the property through its ownership interest in Sands Bethworks Retail LLC.
Development Projects
Macao
The Company is constructing The Parisian Macao, an integrated resort that will be connected to The Venetian Macao and Four Seasons Macao. The Parisian Macao is intended to include a gaming area (to be operated under the Company’s gaming subconcession), a hotel with approximately 3,000 rooms and suites and retail, entertainment, dining and meeting facilities. The Company expects the cost to design, develop and construct The Parisian Macao will be approximately $2.7 billion, inclusive of payments made for the land premium. As with projects of this nature, the Company will continue to analyze options for both a full and phased opening of the facility, which is anticipated to open in the second half of 2016, subject to Macao government approval. The Company has capitalized costs of $1.65 billion, including the land premium (net of amortization) and $166.3 million in outstanding construction payables, as of December 31, 2015. In addition, the Company will be completing the development of some open areas surrounding its Cotai Strip properties.
84
LAS VEGAS SANDS CORP. AND SUBSIDIARIES
NOTES TO CONSOLIDATED FINANCIAL STATEMENTS - (CONTINUED)
Under the Company’s land concession for The Parisian Macao, the Company is required to complete the development by November 2016. The land concession for Sands Cotai Central contains a similar requirement that the development be completed by December 2016. Should the Company determine that it is unable to complete The Parisian Macao or Sands Cotai Central by their respective deadlines, the Company would then expect to apply for another extension from the Macao government. If the Company is unable to meet the current deadlines and the deadlines for either development are not extended, the Company could lose its land concessions for The Parisian Macao or Sands Cotai Central, which would prohibit the Company from operating any facilities developed under the respective land concessions. As a result, the Company could record a charge for all or some portion of its $1.65 billion or $4.87 billion in capitalized construction costs and land premiums (net of amortization), as of December 31, 2015, related to The Parisian Macao and Sands Cotai Central, respectively.
United States
The Company was constructing a high-rise residential condominium tower (the “Las Vegas Condo Tower”), located on the Las Vegas Strip between The Palazzo and The Venetian Las Vegas. The Company suspended construction activities for the project due to reduced demand for Las Vegas Strip condominiums and the overall decline in general economic conditions. The Company is evaluating the highest return opportunity for the project and intends to recommence construction when demand and conditions improve. The impact of the suspension on the estimated overall cost of the project is currently not determinable with certainty. Should demand and conditions fail to improve or management decides to abandon the project, the Company could record a charge for some portion of the $178.6 million in capitalized construction costs as of December 31, 2015.
Other
The Company continues to aggressively pursue new development opportunities globally.
Capital Financing Overview
Through December 31, 2015, the Company has funded its development projects primarily through borrowings under its credit facilities, operating cash flows, proceeds from its equity offerings and proceeds from the disposition of non-core assets.
The Company held unrestricted cash and cash equivalents of $2.18 billion and restricted cash and cash equivalents of $7.9 million as of December 31, 2015. The Company believes the cash on hand and cash flow generated from operations will be sufficient to maintain compliance with the financial covenants of its credit facilities. The Company may elect to arrange additional financing to fund the balance of its Cotai Strip developments. In the normal course of its activities, the Company will continue to evaluate its capital structure and opportunities for enhancements thereof. In April 2015, the Company entered into a joinder agreement to the 2011 VML Credit Facility, under which certain lenders agreed to provide term loan commitments of $1.0 billion (see “— Note 8 — Long-term Debt — Macao Related Debt — 2011 VML Credit Facility”).
Note 2 — Summary of Significant Accounting Policies
Principles of Consolidation
The consolidated financial statements include the accounts of the Company, its majority-owned subsidiaries and variable interest entities (“VIEs”) in which the Company is the primary beneficiary. All intercompany balances and transactions have been eliminated in consolidation.
Management’s determination of the appropriate accounting method with respect to the Company’s variable interests is based on accounting standards for VIEs issued by the Financial Accounting Standards Board (“FASB”). The Company consolidates any VIEs in which it is the primary beneficiary and discloses significant variable interests in VIEs of which it is not the primary beneficiary, if any.
85
LAS VEGAS SANDS CORP. AND SUBSIDIARIES
NOTES TO CONSOLIDATED FINANCIAL STATEMENTS - (CONTINUED)
The Company has entered into various joint venture agreements with independent third parties. The operations of these joint ventures have been consolidated by the Company due to the Company’s significant investment in these joint ventures, its power to direct the activities of the joint ventures that would significantly impact their economic performance and the obligation to absorb potentially significant losses or the rights to receive potentially significant benefits from these joint ventures. The Company evaluates its primary beneficiary designation on an ongoing basis and will assess the appropriateness of the VIE’s status when events have occurred that would trigger such an analysis.
As of December 31, 2015 and 2014, the Company’s joint ventures had total assets of $79.4 million and $85.0 million, respectively, and total liabilities of $148.4 million and $130.6 million, respectively.
Use of Estimates
The preparation of the consolidated financial statements in conformity with accounting principles generally accepted in the United States of America requires the Company to make estimates and judgments that affect the reported amounts of assets and liabilities, revenues and expenses, and related disclosures of contingent assets and liabilities. These estimates and judgments are based on historical information, information that is currently available to the Company and on various other assumptions that the Company believes to be reasonable under the circumstances. Actual results could vary from those estimates.
Cash and Cash Equivalents
Cash and cash equivalents consist of cash and short-term investments with original maturities of less than 90 days. Such investments are carried at cost, which is a reasonable estimate of their fair value. Cash equivalents are placed with high credit quality financial institutions and are primarily in money market funds.
Accounts Receivable and Credit Risk
Accounts receivable are comprised of casino, hotel and other receivables, which do not bear interest and are recorded at cost. The Company extends credit to approved casino customers following background checks and investigations of creditworthiness. The Company also extends credit to its junkets in Macao, which receivables can be offset against commissions payable to the respective junkets. Business or economic conditions, the legal enforceability of gaming debts, or other significant events in foreign countries could affect the collectability of receivables from customers and junkets residing in these countries.
The allowance for doubtful accounts represents the Company’s best estimate of the amount of probable credit losses in the Company’s existing accounts receivable. The Company determines the allowance based on an analysis of the collectability of each account with a balance over a specified dollar amount, based upon the age of the account, the customer’s financial condition, collection history and any other known information, and the Company applies standard reserve percentages to aged account balances under the specified dollar amount. Account balances are charged off against the allowance when the Company believes it is probable the receivable will not be recovered. Management believes that there are no concentrations of credit risk for which an allowance has not been established. Although management believes that the allowance is adequate, it is possible that the estimated amount of cash collections with respect to accounts receivable could change.
Inventories
Inventories consist primarily of food, beverage, retail products, and operating supplies, which are stated at the lower of cost or market. Cost is determined by the weighted average and specific identification methods.
86
LAS VEGAS SANDS CORP. AND SUBSIDIARIES
NOTES TO CONSOLIDATED FINANCIAL STATEMENTS - (CONTINUED)
Property and Equipment
Property and equipment are stated at the lower of cost or fair value. Depreciation and amortization are provided on a straight-line basis over the estimated useful lives of the assets, which do not exceed the lease term for leasehold improvements, as follows:
Land improvements, building and building improvements | 15 to 40 years |
Furniture, fixtures and equipment | 3 to 20 years |
Leasehold improvements | 3 to 10 years |
Transportation | 5 to 20 years |
The estimated useful lives are based on the nature of the assets as well as current operating strategy and legal considerations such as contractual life. Future events, such as property expansions, property developments, new competition or new regulations, could result in a change in the manner in which the Company uses certain assets requiring a change in the estimated useful lives of such assets.
Maintenance and repairs that neither materially add to the value of the asset nor appreciably prolong its life are charged to expense as incurred. Gains or losses on disposition of property and equipment are included in the consolidated statements of operations.
The Company evaluates its property and equipment and other long-lived assets for impairment in accordance with related accounting standards. For assets to be disposed of, the Company recognizes the asset to be sold at the lower of carrying value or fair value less costs of disposal. Fair value for assets to be disposed of is estimated based on comparable asset sales, solicited offers or a discounted cash flow model.
For assets to be held and used (including projects under development), fixed assets are reviewed for impairment whenever indicators of impairment exist. If an indicator of impairment exists, the Company first groups its assets with other assets and liabilities at the lowest level for which identifiable cash flows are largely independent of the cash flows of other assets and liabilities (the “asset group”). Secondly, the Company estimates the undiscounted future cash flows that are directly associated with and expected to arise from the completion, use and eventual disposition of such asset group. The Company estimates the undiscounted cash flows over the remaining useful life of the primary asset within the asset group. If the undiscounted cash flows exceed the carrying value, no impairment is indicated. If the undiscounted cash flows do not exceed the carrying value, then an impairment is measured based on fair value compared to carrying value, with fair value typically based on a discounted cash flow model. If an asset is still under development, future cash flows include remaining construction costs.
To estimate the undiscounted cash flows of the Company’s asset groups, the Company considers all potential cash flow scenarios, which are probability weighted based on management’s estimates given current conditions. Determining the recoverability of the Company’s asset groups is judgmental in nature and requires the use of significant estimates and assumptions, including estimated cash flows, probability weighting of potential scenarios, costs to complete construction for assets under development, growth rates and future market conditions, among others. Future changes to the Company’s estimates and assumptions based upon changes in macro-economic factors, regulatory environments, operating results or management’s intentions may result in future changes to the recoverability of these asset groups.
For assets to be held for sale, the fixed assets (the “disposal group”) are measured at the lower of their carrying amount or fair value less cost to sell. Losses are recognized for any initial or subsequent write-down to fair value less cost to sell, while gains are recognized for any subsequent increase in fair value less cost to sell, but not in excess of the cumulative loss previously recognized. Any gains or losses not previously recognized that result from the sale of the disposal group shall be recognized at the date of sale. Fixed assets are not depreciated while classified as held for sale.
During the years ended December 31, 2015, 2014 and 2013, no assets were impaired.
87
LAS VEGAS SANDS CORP. AND SUBSIDIARIES
NOTES TO CONSOLIDATED FINANCIAL STATEMENTS - (CONTINUED)
Capitalized Interest and Internal Costs
Interest costs associated with major construction projects are capitalized and included in the cost of the projects. When no debt is incurred specifically for construction projects, interest is capitalized on amounts expended using the weighted average cost of the Company’s outstanding borrowings. Capitalization of interest ceases when the project is substantially complete or construction activity is suspended for more than a brief period. During the years ended December 31, 2015, 2014 and 2013, the Company capitalized interest expense of $27.5 million, $9.3 million and $4.7 million, respectively.
During the years ended December 31, 2015, 2014 and 2013, the Company capitalized approximately $31.1 million, $32.6 million and $24.2 million, respectively, of internal costs, consisting primarily of compensation expense for individuals directly involved with the development and construction of property.
Deferred Financing Costs and Original Issue Discounts
Deferred financing costs and original issue discounts are amortized to interest expense based on the terms of the related debt instruments using the effective interest method.
Leasehold Interests in Land
Leasehold interests in land represent payments made for the use of land over an extended period of time. The leasehold interests in land are amortized on a straight-line basis over the expected term of the related lease agreements.
Indefinite Useful Life Assets
Assets with indefinite useful lives are regularly assessed to ensure they continue to meet the indefinite useful life criteria. These assets are not subject to amortization and are tested for impairment and recoverability annually or more frequently if events or circumstances indicate that the assets might be impaired. When performing the impairment analysis, the Company may first conduct a qualitative assessment to determine whether it is “more-likely-than-not” that the asset is impaired. If the Company elects to perform a qualitative assessment and it is determined that it is “more-likely-than-not” that the asset is impaired after assessing the qualitative factors, the Company then performs an impairment test that consists of a comparison of the fair value of the asset with its carrying amount. If the fair value of the asset exceeds the carrying amount, no impairment is recognized. If the fair value of the asset does not exceed the carrying amount, an impairment will be recognized in an amount equal to the difference.
As of December 31, 2015, the Company had assets of $50.0 million and $16.5 million related to its Sands Bethlehem gaming license and table games certificate, respectively, both of which were determined to have an indefinite useful life and have been recorded within intangible assets in the accompanying consolidated balance sheets. For the years ended December 31, 2015 and 2013, the annual impairment analysis included an assessment of certain qualitative factors including, but not limited to, the results of the most recent fair value calculation, current year and projected operating results, and macro-economic and industry conditions. The Company considered the qualitative factors and determined that it was not “more-likely-than-not” that the indefinite lived intangible assets were impaired. For the year ended December 31, 2014, the Company elected to perform a quantitative analysis given that the last quantitative analysis performed was during the year ended December 31, 2011. The fair value of the Company’s gaming license and table games certificate was estimated using the Company’s expected adjusted property EBITDA (as defined in “— Note 17 — Segment Information”), combined with estimated future tax-affected cash flows and a terminal value using the Gordon Growth Model, which were discounted to present value at rates commensurate with the Company’s capital structure and the prevailing borrowing rates within the casino industry in general. Adjusted property EBITDA and discounted cash flows are common measures used to value cash-intensive businesses such as casinos. Determining the fair value of the gaming license and table games certificate is judgmental in nature and requires the use of significant estimates and assumptions, including adjusted property EBITDA, growth rates, discount rates and future market conditions, among others.
88
LAS VEGAS SANDS CORP. AND SUBSIDIARIES
NOTES TO CONSOLIDATED FINANCIAL STATEMENTS - (CONTINUED)
Future changes to the Company’s estimates and assumptions based upon changes in macro-economic factors, operating results or management’s intentions may result in future changes to the fair value of the gaming license and table games certificate. No impairment charge related to these assets was recorded for the years ended December 31, 2015, 2014 and 2013.
Revenue Recognition and Promotional Allowances
Casino revenue is the aggregate of gaming wins and losses. The commissions rebated directly or indirectly through junkets to customers, cash discounts and other cash incentives to customers related to gaming play are recorded as a reduction to gross casino revenue. Hotel revenue recognition criteria are met at the time of occupancy. Food and beverage revenue recognition criteria are met at the time of service. Deposits for future hotel occupancy or food and beverage services contracts are recorded as deferred income until revenue recognition criteria are met. Cancellation fees for hotel and food and beverage services are recognized upon cancellation by the customer and are included in convention, retail and other revenues. Mall revenue is primarily generated from base rents and overage rents received through long-term leases with retail tenants. Base rent, adjusted for contractual escalations, is recognized on a straight-lined basis over the term of the related lease. Overage rent is paid by a tenant when its sales exceed an agreed upon minimum amount and is not recognized by the Company until the thresholds are met. Convention revenues are recognized when the related service is rendered or the event is held.
In accordance with industry practice, the retail value of rooms, food and beverage, and other services furnished to the Company’s guests without charge is included in gross revenue and then deducted as promotional allowances. The estimated retail value of such promotional allowances is included in operating revenues as follows (in thousands):
Year Ended December 31, | |||||||||||
2015 | 2014 | 2013 | |||||||||
Rooms | $ | 407,886 | $ | 463,920 | $ | 366,353 | |||||
Food and beverage | 215,051 | 243,605 | 222,195 | ||||||||
Convention, retail and other | 102,952 | 134,414 | 136,003 | ||||||||
$ | 725,889 | $ | 841,939 | $ | 724,551 | ||||||
The estimated departmental cost of providing such promotional allowances, which is included primarily in casino operating expenses, is as follows (in thousands):
Year Ended December 31, | |||||||||||
2015 | 2014 | 2013 | |||||||||
Rooms | $ | 90,021 | $ | 100,353 | $ | 88,379 | |||||
Food and beverage | 157,813 | 176,883 | 167,223 | ||||||||
Convention, retail and other | 80,760 | 100,618 | 88,214 | ||||||||
$ | 328,594 | $ | 377,854 | $ | 343,816 | ||||||
Gaming Taxes
The Company is subject to taxes based on gross gaming revenue in the jurisdictions in which it operates, subject to applicable jurisdictional adjustments. These gaming taxes, including the goods and services tax in Singapore, are an assessment on the Company’s gaming revenue and are recorded as a casino expense in the accompanying consolidated statements of operations. These taxes were $3.31 billion, $4.65 billion and $4.54 billion for the years ended December 31, 2015, 2014 and 2013, respectively.
89
LAS VEGAS SANDS CORP. AND SUBSIDIARIES
NOTES TO CONSOLIDATED FINANCIAL STATEMENTS - (CONTINUED)
Frequent Players Program
The Company has established promotional clubs to encourage repeat business from frequent and active slot machine customers and table games patrons. Members earn points primarily based on gaming activity and such points can be redeemed for cash, free play and other free goods and services. The Company accrues for club points expected to be redeemed for cash and free play as a reduction to gaming revenue and accrues for club points expected to be redeemed for free goods and services primarily as casino expense. The accruals are based on estimates and assumptions regarding the mix of cash, free play and other free goods and services that will be redeemed and the costs of providing those benefits. Historical data is used to assist in the determination of the estimated accruals.
Pre-Opening and Development Expenses
The Company accounts for costs incurred in the development and pre-opening phases of new ventures in accordance with accounting standards regarding start-up activities. Pre-opening expenses represent personnel and other costs incurred prior to the opening of new ventures and are expensed as incurred. Development expenses include the costs associated with the Company’s evaluation and pursuit of new business opportunities, which are also expensed as incurred.
Advertising Costs
Costs for advertising are expensed the first time the advertising takes place or as incurred. Advertising costs included in the accompanying consolidated statements of operations were $124.5 million, $140.4 million and $117.8 million for the years ended December 31, 2015, 2014 and 2013, respectively.
Corporate Expenses
Corporate expense represents payroll, travel, legal fees, professional fees and various other expenses not allocated or directly related to the Company’s integrated resort operations and related ancillary operations.
Foreign Currency
The Company accounts for currency translation in accordance with accounting standards regarding foreign currency translation. Gains or losses from foreign currency remeasurements are included in other income (expense). Balance sheet accounts are translated at the exchange rate in effect at each balance sheet date and income statement accounts are translated at the average exchange rates during the year. Translation adjustments resulting from this process are charged or credited to other comprehensive income.
Comprehensive Income and Accumulated Other Comprehensive Income (Loss)
Comprehensive income includes net income and all other non-stockholder changes in equity, or other comprehensive income. The balance of accumulated other comprehensive income (loss) consisted solely of foreign currency translation adjustments. During the year ended December 31, 2015, a $5.3 million gain related to the dissolution of a wholly owned foreign subsidiary was reclassified from accumulated other comprehensive income (loss) and comprehensive income to net income. This amount is included in other income in the accompanying consolidated statements of operations.
90
LAS VEGAS SANDS CORP. AND SUBSIDIARIES
NOTES TO CONSOLIDATED FINANCIAL STATEMENTS - (CONTINUED)
Earnings Per Share
The weighted average number of common and common equivalent shares used in the calculation of basic and diluted earnings per share consisted of the following:
Year Ended December 31, | ||||||||
2015 | 2014 | 2013 | ||||||
Weighted average common shares outstanding (used in the calculation of basic earnings per share) | 796,785,900 | 806,130,838 | 822,282,515 | |||||
Potential dilution from stock options, warrants and restricted stock and stock units | 810,182 | 1,888,381 | 4,033,593 | |||||
Weighted average common and common equivalent shares (used in the calculation of diluted earnings per share) | 797,596,082 | 808,019,219 | 826,316,108 | |||||
Antidilutive stock options excluded from the calculation of diluted earnings per share | 6,120,516 | 6,024,025 | 4,455,109 | |||||
Stock-Based Employee Compensation
The Company accounts for its stock-based employee compensation in accordance with accounting standards regarding share-based payment, which establishes accounting for equity instruments exchanged for employee services. Stock-based compensation cost is measured at the grant date, based on the calculated fair value of the award, and is recognized over the employee’s requisite service period (generally the vesting period of the equity grant). The Company’s stock-based employee compensation plans are more fully discussed in “— Note 14 — Stock-Based Employee Compensation.”
Income Taxes
The Company is subject to income taxes in the U.S. (including federal and state) and numerous foreign jurisdictions in which it operates. The Company records income taxes under the asset and liability method, whereby deferred tax assets and liabilities are recognized based on the future tax consequences attributable to temporary differences between the financial statement carrying amounts of existing assets and liabilities and their respective tax bases, and attributable to operating loss and tax credit carryforwards. Accounting standards regarding income taxes require a reduction of the carrying amounts of deferred tax assets by a valuation allowance, if based on the available evidence, it is “more-likely-than-not” that such assets will not be realized. Accordingly, the need to establish valuation allowances for deferred tax assets is assessed at each reporting period based on a “more-likely-than-not” realization threshold. This assessment considers, among other matters, the nature, frequency and severity of current and cumulative losses, forecasts of future profitability, the duration of statutory carryforward periods, the Company’s experience with operating loss and tax credit carryforwards not expiring, and tax planning strategies.
The Company recorded valuation allowances on the net deferred tax assets of certain foreign jurisdictions of $195.8 million and $215.2 million, as of December 31, 2015 and 2014, respectively, and a valuation allowance on certain deferred tax assets of its U.S. operations of $3.11 billion and $2.27 billion as of December 31, 2015 and 2014, respectively, which increased during the current year primarily due to an increase in U.S. foreign tax credits. Management will reassess the realization of deferred tax assets based on the accounting standards for income taxes each reporting period and consider the scheduled reversal of deferred tax liabilities, sources of taxable income and tax planning strategies. To the extent that the financial results of these operations improve and it becomes “more-likely-than-not” that the deferred tax assets are realizable, the Company will be able to reduce the valuation allowance in the period such determination is made.
Significant judgment is required in evaluating the Company’s tax positions and determining its provision for income taxes. During the ordinary course of business, there are many transactions for which the ultimate tax determination is uncertain. Accounting standards regarding uncertainty in income taxes provide a two-step approach to recognizing and measuring uncertain tax positions. The first step is to evaluate the tax position for recognition by
91
LAS VEGAS SANDS CORP. AND SUBSIDIARIES
NOTES TO CONSOLIDATED FINANCIAL STATEMENTS - (CONTINUED)
determining if the weight of available evidence indicates it is “more-likely-than-not” that the position will be sustained on audit, including resolution of related appeals or litigation processes, if any. The second step is to measure the tax benefit as the largest amount that is more than 50% likely, based solely on the technical merits, of being sustained on examinations. The Company considers many factors when evaluating and estimating its tax positions and tax benefits, which may require periodic adjustments and for which actual outcomes may be different.
Accounting for Derivative Instruments and Hedging Activities
Accounting standards require that an entity recognize all derivatives as either assets or liabilities in the statement of financial position and measure those instruments at fair value. If specific conditions are met, a derivative may be designated as a hedge of specific financial exposures. The accounting for changes in fair value of a derivative depends on the intended use of the derivative and, if used in hedging activities, on its effectiveness as a hedge. In order to qualify for hedge accounting, the underlying hedged item must expose the Company to risks associated with market fluctuations and the financial instrument used must be designated as a hedge and must reduce the Company’s exposure to market fluctuation throughout the hedge period.
The Company has a policy aimed at managing interest rate risk associated with its current and anticipated future borrowings and foreign currency exchange rate risk associated with operations of its foreign subsidiaries. This policy enables the Company to use any combination of interest rate swaps, futures, options, caps, forward contracts and similar instruments. The Company employs such financial instruments pursuant to this policy, none of which are currently designated as hedges. As such, all gains and losses are recognized in other income (expense). Depending on its classification and position at the end of the reporting period, each derivative is reported as prepaid expenses and other; other assets, net; other accrued liabilities; or other long-term liabilities, as applicable, in the accompanying consolidated balance sheets. See "— Note 11 — Fair Value Measurements" for additional disclosures regarding derivatives.
Recent Accounting Pronouncements
In May 2014, the FASB issued an accounting standard update on revenue recognition that will be applied to all contracts with customers. The update requires an entity to recognize revenue when it transfers promised goods or services to customers in an amount that reflects what it expects in exchange for the goods or services. It also requires more detailed disclosures to enable users of financial statements to understand the nature, amount, timing and uncertainty of revenue and cash flows arising from contracts with customers. The guidance will be required to be applied on a retrospective basis, using one of two methodologies, and will be effective for fiscal years beginning after December 15, 2017, with early application permitted only as of annual reporting periods beginning after December 15, 2016, including interim reporting periods within that reporting period. The Company is currently assessing the impact that the guidance will have on the Company's financial condition and results of operations.
In April 2015, the FASB issued an accounting standard update to simplify the presentation of debt issuance costs. The update requires that debt issuance costs be reported as a deduction of the face amount of the related debt (rather than as an asset) and that the amortization of debt issuance costs continue to be reported as interest expense. In August 2015, the FASB issued an accounting standard update to clarify that this guidance is not required to be applied to line-of-credit arrangements. The amendments do not affect the guidance on the recognition and measurement of debt issuance costs. The guidance will be required to be applied on a retrospective basis and will be effective for fiscal years beginning after December 15, 2015. Early adoption is permitted for financial statements that have not been previously issued. The adoption of this guidance will not have a material effect on the Company's financial condition, results of operations and cash flows.
In July 2015, the FASB issued an accounting standard update that requires inventory measured using any method other than last-in, first-out or the retail inventory method, to be measured at the lower of cost and net realizable value. Net realizable value is the estimated selling price in the ordinary course of business, less reasonably predictable costs of completion, disposal and transportation. If the net realizable value of inventory is lower than its cost, the difference shall be recognized as a loss during the period in which it occurs. The guidance is effective for fiscal years beginning
92
LAS VEGAS SANDS CORP. AND SUBSIDIARIES
NOTES TO CONSOLIDATED FINANCIAL STATEMENTS - (CONTINUED)
after December 15, 2016, and should be applied prospectively, with early adoption permitted. The adoption of this guidance will not have a material effect on the Company’s financial condition, results of operations and cash flows.
In November 2015, the FASB issued an accounting standard update to simplify the presentation of deferred income taxes. The update requires that all deferred tax assets and liabilities, along with any related valuation allowance, be classified as noncurrent. The guidance is effective for annual periods beginning after December 15, 2016, and interim periods within those annual periods. The amendments in this update may be applied either prospectively to all deferred tax liabilities and assets or retrospectively to all periods presented, with early adoption permitted. The Company adopted this guidance retrospectively as of December 31, 2015 (see "— Reclassification" and “— Note 10 — Income Taxes”). The adoption of this guidance did not have a material effect on the Company’s financial condition, results of operations and cash flows.
In February 2016, the FASB issued an accounting standard update on leases, which requires all lessees to recognize a lease liability and a right-of-use asset, measured at the present value of the future minimum lease payments, at the lease commencement date. Lessor accounting remains largely unchanged under the new guidance. The guidance is effective for fiscal years beginning after December 15, 2018, including interim reporting periods within that reporting period, with early adoption permitted. A modified retrospective approach must be applied for leases existing at, or entered into after, the beginning of the earliest comparative period presented in the financial statements. The Company is currently assessing the impact that the guidance will have on the Company's financial condition and results of operations.
Reclassification
To be consistent with the current year presentation, the Company retrospectively adopted the new guidance to simplify the presentation of deferred income taxes. As a result, the current deferred income tax liability of $12.5 million was reclassified to non-current and a non-current deferred income tax asset of $7.6 million was offset against the non-current deferred income tax liability in the consolidated balance sheets for the year ended December 31, 2014. The reclassification did not have an effect on the Company's financial condition, results of operations and cash flows.
Note 3 — Accounts Receivable, Net
Accounts receivable consists of the following (in thousands):
December 31, | |||||||
2015 | 2014 | ||||||
Casino | $ | 1,721,185 | $ | 1,957,799 | |||
Rooms | 78,738 | 74,983 | |||||
Mall | 67,263 | 103,093 | |||||
Other | 37,265 | 48,182 | |||||
1,904,451 | 2,184,057 | ||||||
Less — allowance for doubtful accounts | (636,603 | ) | (673,285 | ) | |||
$ | 1,267,848 | $ | 1,510,772 | ||||
93
LAS VEGAS SANDS CORP. AND SUBSIDIARIES
NOTES TO CONSOLIDATED FINANCIAL STATEMENTS - (CONTINUED)
Note 4 — Property and Equipment, Net
Property and equipment consists of the following (in thousands):
December 31, | |||||||
2015 | 2014 | ||||||
Land and improvements | $ | 556,947 | $ | 551,625 | |||
Building and improvements | 15,308,791 | 15,187,427 | |||||
Furniture, fixtures, equipment and leasehold improvements | 3,281,161 | 3,065,859 | |||||
Transportation | 456,942 | 454,278 | |||||
Construction in progress | 2,633,340 | 1,796,554 | |||||
22,237,181 | 21,055,743 | ||||||
Less — accumulated depreciation and amortization | (6,505,543 | ) | (5,683,269 | ) | |||
$ | 15,731,638 | $ | 15,372,474 | ||||
Construction in progress consists of the following (in thousands):
December 31, | |||||||
2015 | 2014 | ||||||
The Parisian Macao | $ | 1,588,474 | $ | 749,176 | |||
Four Seasons Macao (principally the Four Seasons Apartments) | 424,273 | 417,920 | |||||
Sands Cotai Central | 270,472 | 289,518 | |||||
Other | 350,121 | 339,940 | |||||
$ | 2,633,340 | $ | 1,796,554 | ||||
The $350.1 million in other construction in progress consists primarily of construction of the Las Vegas Condo Tower and various projects at The Venetian Macao.
In accordance with the April 2004 purchase and sale agreement, as amended, between Venetian Casino Resort, LLC (“VCR”) and GGP (the “Amended Agreement”), the Company sold the portion of the Grand Canal Shoppes located within The Palazzo (formerly referred to as "The Shoppes at the Palazzo," see “— Note 12 — Mall Sales — The Shoppes at The Palazzo”). Under terms of the settlement with GGP on June 24, 2011, the Company retained the $295.4 million of proceeds previously received and participates in certain potential future revenues earned by GGP. Under generally accepted accounting principles, the transaction has not been accounted for as a sale because the Company’s participation in certain potential future revenues constitutes continuing involvement in The Shoppes at The Palazzo. Therefore, $266.2 million of the proceeds allocated to the mall sale transaction has been recorded as deferred proceeds (a long-term financing obligation), which will accrue interest at an imputed rate and will be offset by (i) imputed rental income and (ii) rent payments made to GGP related to spaces leased back from GGP by the Company. The property and equipment legally sold to GGP totaling $219.7 million (net of $91.7 million of accumulated depreciation) as of December 31, 2015, will continue to be recorded on the Company’s consolidated balance sheet and will continue to be depreciated in the Company’s consolidated statement of operations.
The cost and accumulated depreciation of property and equipment that the Company is leasing to third parties, primarily as part of its mall operations, was $1.20 billion and $299.9 million, respectively, as of December 31, 2015. The cost and accumulated depreciation of property and equipment that the Company is leasing to these third parties was $1.13 billion and $251.0 million, respectively, as of December 31, 2014.
The cost and accumulated depreciation of property and equipment that the Company is leasing under capital lease arrangements was $39.2 million and $18.6 million, respectively, as of December 31, 2015. The cost and accumulated depreciation of property and equipment that the Company is leasing under capital lease arrangements was $38.4 million and $14.6 million, respectively, as of December 31, 2014.
94
LAS VEGAS SANDS CORP. AND SUBSIDIARIES
NOTES TO CONSOLIDATED FINANCIAL STATEMENTS - (CONTINUED)
During the years ended December 31, 2015, 2014 and 2013, no assets were impaired.
Note 5 — Leasehold Interests in Land, Net
Leasehold interests in land consist of the following (in thousands):
December 31, | |||||||
2015 | 2014 | ||||||
Marina Bay Sands | $ | 971,654 | $ | 1,038,636 | |||
Sands Cotai Central | 237,842 | 237,050 | |||||
The Venetian Macao | 180,118 | 178,203 | |||||
Four Seasons Macao | 88,869 | 88,232 | |||||
The Parisian Macao | 74,601 | 74,298 | |||||
Sands Macao | 29,352 | 28,022 | |||||
1,582,436 | 1,644,441 | ||||||
Less — accumulated amortization | (320,304 | ) | (291,351 | ) | |||
$ | 1,262,132 | $ | 1,353,090 | ||||
The Company amortizes the leasehold interests in land on a straight-line basis over the expected term of the lease. Amortization expense of $38.6 million, $40.6 million and $40.4 million was included in amortization of leasehold interests in land expense for the years ended December 31, 2015, 2014 and 2013, respectively. The estimated future amortization expense is approximately $38.3 million for each of the next five years and $1.31 billion thereafter at exchange rates in effect on December 31, 2015.
Land concessions in Macao generally have an initial term of 25 years with automatic extensions of 10 years thereafter in accordance with Macao law. The Company has received land concessions from the Macao government to build on the sites on which The Venetian Macao, Four Seasons Macao, Sands Cotai Central and The Parisian Macao are located. The Company does not own these land sites in Macao; however, the land concessions grant the Company exclusive use of the land. As specified in the land concessions, the Company is required to pay premiums for each parcel, as well as annual rent for the term of the land concessions.
In addition to the land premium payments for the Macao leasehold interests in land, the Company is required to make annual rent payments in the amounts and at the times specified in the land concessions. The rent amounts may be revised every five years by the Macao government. As of December 31, 2015, the Company was obligated under its land concessions to make future rental payments as follows (in thousands):
2016 | $ | 5,003 | |
2017 | 5,281 | ||
2018 | 5,281 | ||
2019 | 5,281 | ||
2020 | 5,281 | ||
Thereafter | 65,323 | ||
$ | 91,450 | ||
95
LAS VEGAS SANDS CORP. AND SUBSIDIARIES
NOTES TO CONSOLIDATED FINANCIAL STATEMENTS - (CONTINUED)
Note 6 — Intangible Assets, Net
Intangible assets consist of the following (in thousands):
December 31, | |||||||
2015 | 2014 | ||||||
Sands Bethlehem gaming license and certificate | $ | 66,500 | $ | 66,500 | |||
Marina Bay Sands gaming license | 40,312 | 43,091 | |||||
Less — accumulated amortization | (36,020 | ) | (24,139 | ) | |||
4,292 | 18,952 | ||||||
Trademarks and other | 1,099 | 1,116 | |||||
Less — accumulated amortization | (305 | ) | (308 | ) | |||
794 | 808 | ||||||
Total intangible assets, net | $ | 71,586 | $ | 86,260 | |||
In August 2007 and July 2010, the Company was issued a gaming license and certificate from the Pennsylvania Gaming Control Board for its slots and table games operations at Sands Bethlehem, respectively, which were acquired for $50.0 million and $16.5 million, respectively. The license and certificate were determined to have indefinite lives and therefore, are not subject to amortization. In April 2013, the Company paid 57.0 million Singapore dollars ("SGD," approximately $40.3 million at exchange rates in effect on December 31, 2015) to the Singapore Casino Regulatory Authority (the “CRA”) as part of the process to renew its gaming license at Marina Bay Sands. This license is being amortized over its three-year term, which expires in April 2016, and is renewable upon submitting an application, paying the applicable license fee and meeting the requirements as determined by the CRA. The Company has filed a renewal application and believes that it meets the renewal requirements as determined by the CRA; however, no assurance can be given that the license renewal will be granted or for what period of time it will be granted.
Amortization expense was $14.0 million, $15.1 million and $13.6 million for the years ended December 31, 2015, 2014 and 2013, respectively. The estimated future amortization expense is approximately $4.3 million for the year ending December 31, 2016.
Note 7 — Other Accrued Liabilities
Other accrued liabilities consist of the following (in thousands):
December 31, | |||||||
2015 | 2014 | ||||||
Customer deposits | $ | 431,019 | $ | 464,588 | |||
Outstanding gaming chips and tokens | 366,740 | 581,187 | |||||
Taxes and licenses | 319,315 | 349,455 | |||||
Payroll and related | 290,966 | 296,791 | |||||
Other accruals | 286,265 | 292,423 | |||||
$ | 1,694,305 | $ | 1,984,444 | ||||
96
LAS VEGAS SANDS CORP. AND SUBSIDIARIES
NOTES TO CONSOLIDATED FINANCIAL STATEMENTS - (CONTINUED)
Note 8 — Long-Term Debt
Long-term debt consists of the following (in thousands):
December 31, | |||||||
2015 | 2014 | ||||||
Corporate and U.S. Related: | |||||||
2013 U.S. Credit Facility — Term B (net of original issue discount of $8,036 and $9,643, respectively) | $ | 2,196,964 | $ | 2,217,857 | |||
2013 U.S. Credit Facility — Revolving | 630,000 | 1,020,000 | |||||
Airplane Financings | 59,983 | 63,671 | |||||
HVAC Equipment Lease | 15,155 | 16,619 | |||||
Other | 140 | 401 | |||||
Macao Related: | |||||||
2011 VML Credit Facility — Extended Term | 2,389,551 | 2,388,244 | |||||
2011 VML Credit Facility — Accordion Term | 999,939 | — | |||||
2011 VML Credit Facility — Extended Revolving | — | 820,024 | |||||
Other | 4,353 | 5,694 | |||||
Singapore Related: | |||||||
2012 Singapore Credit Facility — Term | 3,171,927 | 3,460,137 | |||||
9,468,012 | 9,992,647 | ||||||
Less — current maturities | (95,367 | ) | (99,734 | ) | |||
Total long-term debt | $ | 9,372,645 | $ | 9,892,913 | |||
Corporate and U.S. Related Debt
2013 U.S. Credit Facility
In December 2013, the Company entered into a $3.5 billion senior secured credit facility (the “2013 U.S. Credit Facility”), which consists of a $2.25 billion funded term B loan (the “2013 U.S. Term B Facility”) with an original issue discount of $11.3 million and a $1.25 billion revolving credit facility (the “2013 U.S. Revolving Facility”). The borrowings under the 2013 U.S. Credit Facility were used to repay the outstanding balance on the Senior Secured Credit Facility (further described below). The Company recorded a $14.2 million loss on modification or early retirement of debt during the year ended December 31, 2013. As of December 31, 2015, the Company had $617.9 million of available borrowing capacity under the 2013 U.S. Revolving Facility, net of outstanding letters of credit.
The 2013 U.S. Term B Facility matures on December 19, 2020, and is subject to quarterly amortization payments of $5.6 million, which began on March 31, 2014, followed by a balloon payment of $2.10 billion due on December 19, 2020. The 2013 U.S. Revolving Facility has no interim amortization payments and matures on December 19, 2018.
The 2013 U.S. Credit Facility is guaranteed by certain of the Company’s domestic subsidiaries (the “Guarantors”). The obligations under the 2013 U.S. Credit Facility and the guarantees of the Guarantors are collateralized by a first-priority security interest in substantially all of Las Vegas Sands, LLC (“LVSLLC”) and the Guarantors’ assets, other than capital stock and similar ownership interests, certain furniture, fixtures and equipment, and certain other excluded assets.
Borrowings under the 2013 U.S. Credit Facility bear interest, at the Company’s option, at either an adjusted Eurodollar rate or at an alternative base rate, plus a credit spread. For base rate borrowings, the initial credit spread is 0.5% per annum and 1.5% per annum for the 2013 U.S. Revolving Facility and the 2013 U.S. Term B Facility, respectively. For Eurodollar rate borrowings, the initial credit spread is 1.5% per annum and 2.5% per annum for the 2013 U.S. Revolving Facility and the 2013 U.S. Term B Facility (subject to a Eurodollar rate floor of 0.75%), respectively (the interest rates were set at 1.9% and 3.3%, respectively, as of December 31, 2015). The weighted average interest
97
LAS VEGAS SANDS CORP. AND SUBSIDIARIES
NOTES TO CONSOLIDATED FINANCIAL STATEMENTS - (CONTINUED)
rate for the 2013 U.S Credit Facility was 3.0%, 2.8% and 2.9% during the years ended December 31, 2015, 2014 and 2013, respectively.
The Company pays a commitment fee of 0.35% per annum on the undrawn amounts under the 2013 U.S. Revolving Facility, which will be reduced if certain corporate ratings are achieved, subject to certain additional conditions.
The 2013 U.S. Credit Facility contains affirmative and negative covenants customary for such financings, including, but not limited to, limitations on incurring additional liens, incurring additional indebtedness, making certain investments and acquiring and selling assets. The 2013 U.S. Credit Facility also requires the Guarantors to comply with financial covenants, including, but not limited to, a maximum ratio of net debt outstanding to adjusted earnings before interest, income taxes, depreciation and amortization, as defined (“Adjusted EBITDA”) to the extent there is an outstanding balance on the 2013 U.S. Revolving Facility or certain letters of credit are outstanding. The maximum leverage ratio is 5.5x for all applicable quarterly periods through maturity. The 2013 U.S. Credit Facility also contains conditions and events of default customary for such financings. As of December 31, 2015, approximately $3.35 billion of net assets of LVSLLC were restricted from being distributed under the terms of the 2013 U.S. Credit Facility.
Senior Secured Credit Facility
In May 2007, the Company entered into a $5.0 billion senior secured credit facility (the “Senior Secured Credit Facility”), which originally consisted of $4.0 billion in funded and delayed draw term loans and a $1.0 billion revolving credit facility (the “Revolving Facility”). As part of an amendment to the facility in August 2010, certain lenders elected to extend the maturity of $1.91 billion in aggregate principal amount of the term loans (the “Extended Term Loans”) and to extend the availability of $532.5 million of the Revolving Facility (the "Extended Revolving Facility"). As part of the extension, the Company was required to pay down $1.0 billion in aggregate principal amount of the Extended Term Loans and the commitments under the Revolving Facility were reduced from $1.0 billion to $750.0 million.
Borrowings under the Senior Secured Credit Facility, as amended, bore interest, at the Company’s option, at either an adjusted Eurodollar rate or at an alternative base rate, plus a credit spread. For base rate borrowings, the initial credit spread was 0.75% per annum for the term loans and 1.25% per annum and 1.75% per annum for the Extended Revolving Facility and the Extended Term Loans, respectively. For Eurodollar rate borrowings, the initial credit spread was 1.75% per annum for the term loans and 2.25% per annum and 2.75% per annum for the Extended Revolving Facility and Extended Term Loans, respectively. The weighted average interest rate for the Senior Secured Credit Facility was 2.3% for the year ended December 31, 2013.
Airplane Financings
In February 2007, the Company entered into promissory notes totaling $72.0 million to finance the purchase of one airplane and to finance two others that the Company already owned. The notes consist of balloon payment promissory notes and amortizing promissory notes, all of which have ten-year maturities and are collateralized by the related aircraft. The notes bear interest at three-month London Inter-Bank Offered Rate (“LIBOR”) plus 1.5% per annum (set at 1.9% as of December 31, 2015). The amortizing notes, totaling $28.8 million, are subject to quarterly amortization payments of $0.7 million, which began June 1, 2007. The balloon notes, totaling $43.2 million, mature on March 1, 2017, and have no interim amortization payments. The weighted average interest rate on the notes was 1.8% during the years ended December 31, 2015, 2014 and 2013.
In April 2007, the Company entered into promissory notes totaling $20.3 million to finance the purchase of an additional airplane. The notes have ten-year maturities and consist of a balloon payment promissory note and an amortizing promissory note. The notes bear interest at three-month LIBOR plus 1.25% per annum (set at 1.9% as of December 31, 2015). The $8.1 million amortizing note is subject to quarterly amortization payments of $0.2 million, which began June 30, 2007. The $12.2 million balloon note matures on March 31, 2017, and has no interim amortization payments. The weighted average interest rate on the notes was 1.6%, 1.5% and 1.6% during the years ended December 31, 2015, 2014 and 2013, respectively.
98
LAS VEGAS SANDS CORP. AND SUBSIDIARIES
NOTES TO CONSOLIDATED FINANCIAL STATEMENTS - (CONTINUED)
HVAC Equipment Lease
In July 2009, the Company entered into a capital lease agreement with its current heating, ventilation and air conditioning (“HVAC”) provider (the “HVAC Equipment Lease”) to provide the operation and maintenance services for the HVAC equipment in Las Vegas. The lease has a 10-year term with a purchase option at the third, fifth, seventh and tenth anniversary dates. The Company is obligated under the agreement to make monthly payments of approximately $300,000 for the first year with automatic decreases of approximately $14,000 per month on every anniversary date. The HVAC Equipment Lease was capitalized at the present value of the future minimum lease payments at lease inception.
Macao Related Debt
2011 VML Credit Facility
On September 22, 2011, two subsidiaries of the Company, VML US Finance LLC, the Borrower, and Venetian Macau Limited ("VML"), as guarantor, entered into a credit agreement (the “2011 VML Credit Facility”), which provided for up to $3.7 billion (or equivalent in Hong Kong dollars or Macao patacas) and consisted of a $3.2 billion term loan (the “2011 VML Term Facility”) that was fully drawn on November 15, 2011, and a $500.0 million revolving facility (the “2011 VML Revolving Facility”), that was available until October 15, 2016. Borrowings under the facility were used to repay outstanding indebtedness under previous credit facilities and would be used for working capital requirements and general corporate purposes, including for the development, construction and completion of certain components of Sands Cotai Central.
During March 2014, the Company amended its 2011 VML Credit Facility to, among other things, modify certain financial covenants, as discussed further below. In addition to the amendment, certain lenders extended the maturity of $2.39 billion in aggregate principal amount of the 2011 VML Term Facility to March 31, 2020 (the "Extended 2011 VML Term Facility"), and, together with new lenders, provided $2.0 billion in aggregate principal amount of revolving loan commitments (the "Extended 2011 VML Revolving Facility"). A portion of the revolving proceeds were used to pay down the $819.7 million in aggregate principal balance of the 2011 VML Term Facility loans that were not extended. The Company recorded an $18.0 million loss on modification or early retirement of debt during the year ended December 31, 2014, in connection with the pay down and extension. Borrowings under the Extended 2011 VML Revolving Facility are being used to fund the development, construction and completion of Sands Cotai Central and The Parisian Macao, and for working capital requirements and general corporate purposes. As of December 31, 2015, the Company had $2.0 billion of available borrowing capacity under the Extended 2011 VML Revolving Facility. Subsequent to year end, the Company borrowed $350.4 million under the Extended 2011 VML Revolving Facility.
In April 2015, the Company entered into a joinder agreement (the "Joinder Agreement") to the 2011 VML Credit Facility. Under the Joinder Agreement, certain lenders agreed to provide term loan commitments of $1.0 billion (the "2011 VML Accordion Term"), which was funded on April 30, 2015 (the “Joinder Funding Date”).
The indebtedness under the 2011 VML Credit Facility is guaranteed by VML, Venetian Cotai Limited, Venetian Orient Limited and certain of the Company’s other foreign subsidiaries (collectively, the “2011 VML Guarantors”). The obligations under the 2011 VML Credit Facility are collateralized by a first-priority security interest in substantially all of the Borrower’s and the 2011 VML Guarantors’ assets, other than (1) capital stock and similar ownership interests, (2) certain furniture, fixtures, fittings and equipment and (3) certain other excluded assets.
Commencing with the quarterly period ending June 30, 2017, and at the end of each subsequent quarter through March 31, 2018, the 2011 VML Credit Facility, as amended, requires the borrower to repay the outstanding Extended 2011 VML Term Facility on a pro rata basis in an amount equal to 2.5% of the aggregate principal amount outstanding as of March 31, 2014 (the “Macao Restatement Date”). Commencing with the quarterly period ending on June 30, 2018, and at the end of each subsequent quarter through March 31, 2019, the borrower is required to repay the outstanding Extended 2011 VML Term Facility on a pro rata basis in an amount equal to 5.0% of the aggregate principal amount outstanding as of the Macao Restatement Date. For the quarterly periods ending on June 30 through December 31, 2019, the borrower is required to repay the outstanding Extended 2011 VML Term Facility on a pro rata basis in an
99
LAS VEGAS SANDS CORP. AND SUBSIDIARIES
NOTES TO CONSOLIDATED FINANCIAL STATEMENTS - (CONTINUED)
amount equal to 12.0% of the aggregate principal amount outstanding as of the Macao Restatement Date. The remaining balance on the Extended 2011 VML Term Facility is due on the maturity date. The Extended 2011 VML Revolving Facility has no interim amortization payments and matures on March 31, 2020.
Commencing with the quarterly period ending June 30, 2018, and at the end of each subsequent quarter through March 31, 2019, the Joinder Agreement requires the borrower to repay the outstanding 2011 VML Accordion Term on a pro rata basis in an amount equal to 2.5% of the aggregate principal amount outstanding as of the Joinder Funding Date. Commencing with the quarterly period ending on June 30, 2019, and at the end of each subsequent quarter through March 31, 2020, the borrower is required to repay the outstanding 2011 VML Accordion Term on a pro rata basis in an amount equal to 5.0% of the aggregate principal amount outstanding as of the Joinder Funding Date. For the quarterly periods ending on June 30 through December 31, 2020, the borrower is required to repay the outstanding 2011 VML Accordion Term on a pro rata basis in an amount equal to 12.0% of the aggregate principal amount outstanding as of the Joinder Funding Date. The remaining balance on the 2011 VML Accordion Term is due on the maturity date, which is March 30, 2021.
Borrowings for all loans bear interest, as amended, at the Company's option, at either the adjusted Eurodollar rate or Hong Kong Inter-bank Offered Rate (“HIBOR”), plus a credit spread, or an alternative base rate, plus a credit spread, which credit spread in each case is determined based on the maximum leverage ratio as set forth in the respective agreements. The credit spread for all borrowings ranges from 0.25% to 1.125% per annum for loans accruing interest at the base rate and from 1.25% to 2.125% per annum for loans accruing interest at an adjusted Eurodollar or HIBOR rate (interest rates set at 1.9% and 1.7% for loans accruing interest at an adjusted Eurodollar and HIBOR rate, respectively, as of December 31, 2015). The Borrower will also pay standby fees of 0.5% per annum on the undrawn amounts under the Extended 2011 VML Revolving Facility. The weighted average interest rate on the 2011 VML Credit Facility was 1.6%, 1.5% and 1.8% for the years ended December 31, 2015, 2014 and 2013, respectively.
As of December 31, 2015 and 2014, the Company had no interest rate cap agreements in place related to the 2011 VML Credit Facility. As of December 31, 2013, the Company had interest rate cap agreements in place with a combined notional amount of $1.60 billion, an expiration date of November 2014, and strike rates of 2.0% and 2.25%. The provisions of the interest rate cap agreements entitled the Company to receive from the counterparty the amounts, if any, by which the selected market interest rates exceeded the strike rates as stated in such agreements. There was no net effect on interest expense as a result of these interest rate cap agreements for the years ended December 31, 2015, 2014 and 2013.
The 2011 VML Credit Facility, as amended, contains affirmative and negative covenants customary for such financings, including, but not limited to, limitations on liens, loans and guarantees, investments, acquisitions and asset sales, restricted payments and other distributions, affiliate transactions, and use of proceeds from the facility. The 2011 VML Credit Facility also requires the Borrower and VML to comply with financial covenants, including maximum ratios of total indebtedness to Adjusted EBITDA and minimum ratios of Adjusted EBITDA to net interest expense. The maximum leverage ratio, as amended, is 4.0x for the quarterly periods ending December 31, 2015 through March 31, 2017, and then decreases to, and remains at, 3.5x for all quarterly periods thereafter through maturity. The 2011 VML Credit Facility also contains events of default customary for such financings.
100
LAS VEGAS SANDS CORP. AND SUBSIDIARIES
NOTES TO CONSOLIDATED FINANCIAL STATEMENTS - (CONTINUED)
Singapore Related Debt
2012 Singapore Credit Facility
In June 2012, the Company’s wholly owned subsidiary, Marina Bay Sands Pte. Ltd. (“MBS”), entered into a SGD 5.1 billion (approximately $3.61 billion at exchange rates in effect on December 31, 2015) credit agreement (the "2012 Singapore Credit Facility"), providing for a fully funded SGD 4.6 billion (approximately $3.25 billion at exchange rates in effect on December 31, 2015) term loan (the “2012 Singapore Term Facility”) and a SGD 500.0 million (approximately $353.6 million at exchange rates in effect on December 31, 2015) revolving facility (the “2012 Singapore Revolving Facility”) that was available until November 25, 2017, which includes a SGD 100.0 million (approximately $70.7 million at exchange rates in effect on December 31, 2015) ancillary facility (the “2012 Singapore Ancillary Facility”). Borrowings under the 2012 Singapore Credit Facility were used to repay the outstanding balance under the previous Singapore credit facility.
In August 2014, the Company amended its 2012 Singapore Credit Facility, pursuant to which consenting lenders of borrowings under the 2012 Singapore Term Facility extended the maturity to August 28, 2020, and consenting lenders of borrowings under the 2012 Singapore Revolving Facility extended the maturity to February 28, 2020. The Company recorded a $2.0 million loss on modification or early retirement of debt during the year ended December 31, 2014, in connection with the extension. As of December 31, 2015, the Company had SGD 494.4 million (approximately $349.6 million at exchange rates in effect on December 31, 2015) of available borrowing capacity under the 2012 Singapore Revolving Facility, net of outstanding letters of credit.
The indebtedness under the 2012 Singapore Credit Facility is collateralized by a first-priority security interest in substantially all of MBS’s assets, other than capital stock and similar ownership interests, certain furniture, fixtures and equipment and certain other excluded assets.
Commencing with the quarterly period ending December 31, 2014, and at the end of each subsequent quarter through September 30, 2018, the Company is required to repay the outstanding 2012 Singapore Term Facility in the amount of 0.5% of the aggregate principal amount outstanding as of August 29, 2014 (the "Singapore Restatement Date"). Commencing with the quarterly period ending December 31, 2018, and at the end of each subsequent quarter through September 30, 2019, the Company is required to repay the outstanding 2012 Singapore Term Facility in the amount of 5.0% of the aggregate principal amount outstanding as of the Singapore Restatement Date. Commencing with the quarterly period ending December 31, 2019, and at the end of each subsequent quarter through June 30, 2020, and on the maturity date, the Company is required to repay the outstanding 2012 Singapore Term Facility in the amount of 18.0% of the aggregate principal amount outstanding as of the Singapore Restatement Date. The 2012 Singapore Revolving Facility has no interim amortization payments and matures on February 28, 2020.
Borrowings under the 2012 Singapore Credit Facility bear interest at the Singapore Swap Offered Rate ("SOR") plus a spread of 1.85% per annum. Beginning December 23, 2012, the spread for all outstanding loans is subject to reduction based on a ratio of debt to Adjusted EBITDA (interest rate set at approximately 3.1% as of December 31, 2015). MBS pays a standby commitment fee of 35% to 40% of the spread per annum on all undrawn amounts under the 2012 Singapore Revolving Facility. The weighted average interest rate for the 2012 Singapore Credit Facility was 2.5%, 1.8% and 1.9% for the years ended December 31, 2015, 2014 and 2013, respectively.
As of December 31, 2015, the Company had an interest rate cap agreement in place with a notional amount of SGD 100 million (approximately $70.7 million at exchange rates in effect on December 31, 2015), an expiration date of May 2016 and a strike rate of 3.5%. As of December 31, 2014, the Company had interest rate cap agreements in place with a combined notional amount of SGD 300 million (approximately $212.2 million at exchange rates in effect on December 31, 2015), expiration dates ranging from April 2015 to May 2016 and strike rates of 3.0% and 3.5%. As of December 31, 2013, the Company had interest rate cap agreements in place with a combined notional amount of SGD 1.45 billion (approximately $1.03 billion at exchange rates in effect on December 31, 2015), expiration dates ranging from May 2014 to May 2016 and strike rates of 3.0% and 3.5%. The provisions of the interest rate cap agreements entitle the Company to receive from the counterparties the amounts, if any, by which the selected market interest rates
101
LAS VEGAS SANDS CORP. AND SUBSIDIARIES
NOTES TO CONSOLIDATED FINANCIAL STATEMENTS - (CONTINUED)
exceed the strike rates as stated in such agreements. There was no net effect on interest expense as a result of these interest rate cap agreements for the years ended December 31, 2015, 2014 and 2013.
The 2012 Singapore Credit Facility, as amended, contains affirmative and negative covenants customary for such financings, including, but not limited to, limitations on liens, indebtedness, loans and guarantees, investments, acquisitions and asset sales, restricted payments, affiliate transactions and use of proceeds from the facilities. The 2012 Singapore Credit Facility also requires MBS to comply with financial covenants, including maximum ratios of total indebtedness to Adjusted EBITDA, minimum ratios of Adjusted EBITDA to interest expense and a positive net worth requirement. The maximum leverage ratio, as amended, is 3.5x for the quarterly periods ending December 31, 2015 through September 30, 2019, and then decreases to, and remains at, 3.0x for all quarterly periods thereafter through maturity. The 2012 Singapore Credit Facility also contains events of default customary for such financings.
Cash Flows from Financing Activities
Cash flows from financing activities related to long-term debt and capital lease obligations are as follows (in thousands):
Year Ended December 31, | |||||||||||
2015 | 2014 | 2013 | |||||||||
Proceeds from 2013 U.S. Credit Facility | $ | 1,090,000 | $ | 1,678,000 | $ | 2,828,750 | |||||
Proceeds from 2011 VML Credit Facility | 999,277 | 819,725 | — | ||||||||
Proceeds from Senior Secured Credit Facility | — | — | 250,000 | ||||||||
Proceeds from 2012 Singapore Credit Facility | — | — | 104,357 | ||||||||
$ | 2,089,277 | $ | 2,497,725 | $ | 3,183,107 | ||||||
Repayments on 2013 U.S. Credit Facility | $ | (1,502,500 | ) | $ | (1,270,500 | ) | $ | — | |||
Repayments on 2011 VML Credit Facility | (820,188 | ) | (819,680 | ) | — | ||||||
Repayments on 2012 Singapore Credit Facility | (67,403 | ) | (17,930 | ) | (430,504 | ) | |||||
Repayments on Senior Secured Credit Facility | — | — | (3,073,038 | ) | |||||||
Repayments on Airplane Financings | (3,688 | ) | (3,688 | ) | (3,688 | ) | |||||
Repayments on HVAC Equipment Lease and Other Long-Term Debt | (3,938 | ) | (5,668 | ) | (5,802 | ) | |||||
$ | (2,397,717 | ) | $ | (2,117,466 | ) | $ | (3,513,032 | ) | |||
102
LAS VEGAS SANDS CORP. AND SUBSIDIARIES
NOTES TO CONSOLIDATED FINANCIAL STATEMENTS - (CONTINUED)
Scheduled Maturities of Capital Lease Obligations and Long-Term Debt
Maturities of capital lease obligations and long-term debt outstanding as of December 31, 2015, are summarized as follows (in thousands):
Capital Lease Obligations | Long-term Debt | ||||||
2016 | $ | 5,314 | $ | 91,253 | |||
2017 | 3,754 | 323,078 | |||||
2018 | 2,531 | 1,357,128 | |||||
2019 | 11,561 | 2,250,780 | |||||
2020 | — | 5,094,182 | |||||
Thereafter | — | 339,979 | |||||
23,160 | 9,456,400 | ||||||
Less — amount representing interest | (3,512 | ) | — | ||||
Total | $ | 19,648 | $ | 9,456,400 | |||
Fair Value of Long-Term Debt
The estimated fair value of the Company’s long-term debt as of December 31, 2015 and 2014, was approximately $9.22 billion and $9.78 billion, respectively, compared to its carrying value of $9.46 billion and $9.98 billion, respectively. The estimated fair value of the Company’s long-term debt is based on level 2 inputs (quoted prices in markets that are not active).
Note 9 — Equity
Preferred Stock and Warrants
In November 2008, the Company issued 10,446,300 shares of its 10% Series A Cumulative Perpetual Preferred Stock (the “Preferred Stock”) and warrants to purchase up to an aggregate of approximately 174,105,348 shares of common stock at an exercise price of $6.00 per share and an expiration date of November 16, 2013 (the “Warrants”). Units consisting of one share of Preferred Stock and one Warrant to purchase 16.6667 shares of common stock were sold for $100 per unit. Of the 10,446,300 shares of Preferred Stock issued, the Company issued 5,196,300 shares to the public together with Warrants to purchase up to an aggregate of approximately 86,605,173 shares of its common stock. Of the 10,446,300 shares of Preferred Stock issued, the Company issued 5,250,000 shares to the Principal Stockholder and his family together with Warrants to purchase up to an aggregate of approximately 87,500,175 shares of its common stock. In November 2011, the Company redeemed all of the Preferred Stock outstanding.
During the year ended December 31, 2013, the remaining 3,500 Warrants issued to the public were exercised to purchase an aggregate of 64,562 shares of the Company’s common stock at $6.00 per share and $0.3 million in cash was received as settlement of the Warrant exercise price.
103
LAS VEGAS SANDS CORP. AND SUBSIDIARIES
NOTES TO CONSOLIDATED FINANCIAL STATEMENTS - (CONTINUED)
Common Stock
Dividends
On March 31, June 30, September 30 and December 31, 2015, the Company paid a dividend of $0.65 per common share as part of a regular cash dividend program. During the year ended December 31, 2015, the Company recorded $2.07 billion as a distribution against retained earnings (of which $1.12 billion related to the Principal Stockholder and his family and the remaining $949.2 million related to all other shareholders).
On March 31, June 30, September 30 and December 29, 2014, the Company paid a dividend of $0.50 per common share as part of a regular cash dividend program. During the year ended December 31, 2014, the Company recorded $1.61 billion as a distribution against retained earnings (of which $863.3 million related to the Principal Stockholder and his family and the remaining $744.8 million related to all other shareholders).
On March 29, June 28, September 27 and December 31, 2013, the Company paid a dividend of $0.35 per common share as part of a regular cash dividend program. During the year ended December 31, 2013, the Company recorded $1.15 billion as a distribution against retained earnings (of which $604.2 million related to the Principal Stockholder and his family and the remaining $548.9 million related to all other shareholders).
In January 2016, as part of a regular cash dividend program, the Company’s Board of Directors declared a quarterly dividend of $0.72 per common share (a total estimated to be approximately $572 million) to be paid on March 31, 2016, to shareholders of record on March 22, 2016.
Repurchase Program
In June 2013, the Company’s Board of Directors approved a stock repurchase program with an initial authorization of $2.0 billion, which expired in June 2015, but was substantially completed during the year ended December 31, 2014. In October 2014, the Company's Board of Directors authorized the repurchase of an additional $2.0 billion of its outstanding common stock, which expires in October 2016. Repurchases of the Company’s common stock are made at the Company’s discretion in accordance with applicable federal securities laws in the open market or otherwise. The timing and actual number of shares to be repurchased in the future will depend on a variety of factors, including the Company’s financial position, earnings, legal requirements, other investment opportunities and market conditions. During the years ended December 31, 2015, 2014 and 2013, the Company repurchased 4,383,793, 22,406,655 and 8,570,281 shares, respectively, of its common stock for $205.1 million, $1.66 billion and $570.5 million, respectively, (including commissions) under this program. All share repurchases of the Company’s common stock have been recorded as treasury stock.
104
LAS VEGAS SANDS CORP. AND SUBSIDIARIES
NOTES TO CONSOLIDATED FINANCIAL STATEMENTS - (CONTINUED)
Rollforward of Shares of Common Stock
A summary of the outstanding shares of common stock is as follows:
Balance as of January 1, 2013 | 824,297,756 | |
Exercise of stock options | 2,777,127 | |
Issuance of restricted stock | 146,848 | |
Forfeiture of unvested restricted stock | (13,076 | ) |
Repurchase of common stock | (8,570,281 | ) |
Exercise of warrants | 64,562 | |
Balance as of December 31, 2013 | 818,702,936 | |
Exercise of stock options | 1,955,108 | |
Issuance of restricted stock | 31,137 | |
Vesting of restricted stock units | 29,541 | |
Forfeiture of unvested restricted stock | (8,675 | ) |
Repurchase of common stock | (22,451,875 | ) |
Balance as of December 31, 2014 | 798,258,172 | |
Exercise of stock options | 688,743 | |
Issuance of restricted stock | 49,438 | |
Vesting of restricted stock units | 34,750 | |
Forfeiture of unvested restricted stock | (2,000 | ) |
Repurchase of common stock | (4,383,793 | ) |
Balance as of December 31, 2015 | 794,645,310 | |
Other Equity Transactions
In addition to the shares repurchased under the share repurchase program, during the year ended December 31, 2014, the Company repurchased 45,220 shares in satisfaction of tax withholding and exercise price obligations on vested restricted stock and a stock option exercise.
Noncontrolling Interests
SCL
On February 27 and July 15, 2015, SCL paid a dividend of 0.99 Hong Kong dollars ("HKD") and HKD 1.00 per share, respectively, to SCL shareholders (a total of $2.07 billion, of which the Company retained $1.45 billion).
On February 26, 2014, SCL paid a dividend of HKD 0.87 per share and a special dividend of HKD 0.77 per share, and, on June 30, 2014, paid a dividend of HKD 0.86 per share to SCL shareholders (a total of $2.60 billion, of which the Company retained $1.82 billion).
On February 28 and June 21, 2013, SCL paid a dividend of HKD 0.67 and HKD 0.66 per share, respectively, to SCL shareholders (a total of $1.38 billion, of which the Company retained $970.2 million).
In January 2016, the Board of Directors of SCL declared a dividend of HKD 0.99 per share (a total of $1.03 billion, of which the Company retained $723 million) to SCL shareholders of record on February 9, 2016, which was paid on February 26, 2016.
Other
During the years ended December 31, 2015, 2014 and 2013, the Company distributed $13.9 million, $9.8 million and $11.9 million, respectively, to certain of its noncontrolling interests. In April 2014, the Company disposed of its interest in one of its majority owned subsidiaries, resulting in a loss of $0.5 million, which was included in loss on disposal of assets during the year ended December 31, 2014.
105
LAS VEGAS SANDS CORP. AND SUBSIDIARIES
NOTES TO CONSOLIDATED FINANCIAL STATEMENTS - (CONTINUED)
Note 10 — Income Taxes
Consolidated income before taxes and noncontrolling interests for domestic and foreign operations is as follows (in thousands):
Year Ended December 31, | |||||||||||
2015 | 2014 | 2013 | |||||||||
Foreign | $ | 2,546,920 | $ | 3,799,941 | $ | 3,109,982 | |||||
Domestic | 74,962 | 32,770 | 33,530 | ||||||||
Total income before income taxes | $ | 2,621,882 | $ | 3,832,711 | $ | 3,143,512 | |||||
The components of the income tax expense are as follows (in thousands):
Year Ended December 31, | |||||||||||
2015 | 2014 | 2013 | |||||||||
Foreign: | |||||||||||
Current | $ | 212,743 | $ | 252,476 | $ | 195,154 | |||||
Deferred | 3,162 | (1,369 | ) | (6,318 | ) | ||||||
Federal: | |||||||||||
Current | 4,779 | (4,601 | ) | (2,073 | ) | ||||||
Deferred | 15,501 | (1,866 | ) | 2,073 | |||||||
State: | |||||||||||
Current | — | — | — | ||||||||
Deferred | — | — | — | ||||||||
Total income tax expense | $ | 236,185 | $ | 244,640 | $ | 188,836 | |||||
The reconciliation of the statutory federal income tax rate and the Company’s effective tax rate is as follows:
Year Ended December 31, | ||||||||
2015 | 2014 | 2013 | ||||||
Statutory federal income tax rate | 35.0 | % | 35.0 | % | 35.0 | % | ||
Increase (decrease) in tax rate resulting from: | ||||||||
U.S. foreign tax credits | (100.7 | )% | (80.3 | )% | (19.0 | )% | ||
Repatriation of foreign earnings | 68.0 | % | 53.6 | % | 14.6 | % | ||
Change in valuation allowance | 34.5 | % | 26.7 | % | 6.0 | % | ||
Foreign and U.S. tax rate differential | (20.0 | )% | (20.9 | )% | (21.1 | )% | ||
Tax exempt income of foreign subsidiary (Macao) | (7.8 | )% | (8.5 | )% | (9.6 | )% | ||
Other, net | — | % | 0.8 | % | 0.1 | % | ||
Effective tax rate | 9.0 | % | 6.4 | % | 6.0 | % | ||
The Company’s foreign and U.S. tax rate differential reflects the fact that income earned and reinvested in Singapore and Macao is taxed at local rates, which are lower than U.S. tax rates. The Company received a 5-year income tax exemption in Macao that exempts the Company from paying corporate income tax on profits generated by gaming operations. The Company will continue to benefit from this tax exemption through the end of 2018. Had the Company not received the income tax exemption in Macao, consolidated net income attributable to Las Vegas Sands Corp. would have been reduced by $132.0 million, $219.8 million and $207.7 million, and diluted earnings per share would have been reduced by $0.17, $0.27 and $0.25 per share for the years ended December 31, 2015, 2014 and 2013, respectively. In May 2014, the Company entered into an agreement with the Macao government, effective through the end of 2018 that provides for an annual payment of 42.4 million patacas (approximately $5.3 million at exchange rates in effect on December 31, 2015) that is a substitution for a 12% tax otherwise due from VML shareholders on dividend distributions
106
LAS VEGAS SANDS CORP. AND SUBSIDIARIES
NOTES TO CONSOLIDATED FINANCIAL STATEMENTS - (CONTINUED)
paid from VML gaming profits. In September 2013, the Company and the Internal Revenue Service ("IRS") entered into a Pre-Filing Agreement providing that the Macao special gaming tax (35% of gross gaming revenue) qualifies as a tax paid in lieu of an income tax and could be claimed as a U.S. foreign tax credit.
The primary tax affected components of the Company’s net deferred tax liabilities are as follows (in thousands):
December 31, | |||||||
2015 | 2014 | ||||||
Deferred tax assets: | |||||||
U.S. foreign tax credit carryforwards | $ | 3,094,835 | $ | 2,257,048 | |||
Net operating loss carryforwards | 243,737 | 255,623 | |||||
Stock-based compensation | 31,732 | 31,565 | |||||
Accrued expenses | 30,935 | 31,563 | |||||
Deferred gain on the sale of The Grand Canal Shoppes and The Shoppes at The Palazzo | 29,801 | 31,412 | |||||
Allowance for doubtful accounts | 29,669 | 30,861 | |||||
Pre-opening expenses | 25,215 | 32,773 | |||||
State deferred items | 11,543 | 12,361 | |||||
Other tax credit carryforwards | 3,055 | 2,059 | |||||
Other | 4,305 | 5,443 | |||||
3,504,827 | 2,690,708 | ||||||
Less — valuation allowances | (3,302,137 | ) | (2,484,653 | ) | |||
Total deferred tax assets | 202,690 | 206,055 | |||||
Deferred tax liabilities: | |||||||
Property and equipment | (310,339 | ) | (319,354 | ) | |||
Prepaid expenses | (5,402 | ) | (5,836 | ) | |||
Other | (65,002 | ) | (50,602 | ) | |||
Total deferred tax liabilities | (380,743 | ) | (375,792 | ) | |||
Deferred tax liabilities, net | $ | (178,053 | ) | $ | (169,737 | ) | |
The Company recognizes tax benefits associated with stock-based compensation directly to stockholders’ equity only when realized. Accordingly, deferred tax assets are not recognized for net operating loss carryforwards or credit carryforwards resulting from windfall tax benefits. A windfall tax benefit occurs when the actual tax benefit realized upon an employee’s disposition of a share-based award exceeds the cumulative book compensation charge associated with the award. As of December 31, 2015 and 2014, the Company has windfall tax benefits of $356.7 million and $354.6 million, respectively, which are not reflected in deferred tax assets. The Company uses a with-and-without approach to determine if the excess tax deductions associated with compensation costs have reduced income taxes payable.
During the year ended December 31, 2015, certain wholly owned foreign subsidiaries paid dividends resulting in incremental U.S. taxable income. The receipt of the dividends did not result in a cash tax liability for the Company as the incremental U.S. taxable income was fully offset by the utilization of the U.S. foreign tax credits generated as a result of the dividends. In addition, the dividends generated excess U.S. foreign tax credits that will be available to be carried forward to tax years beyond 2015. The Company’s U.S. foreign tax credit carryforwards were $3.27 billion and $2.43 billion as of December 31, 2015 and 2014, respectively, which will begin to expire in 2021. The Company’s state net operating loss carryforwards were $258.6 million and $251.2 million as of December 31, 2015 and 2014, respectively, which will begin to expire in 2024. The Company’s U.S. general business credits were $3.1 million and $2.1 million as of December 31, 2015 and 2014, respectively, which will begin to expire in 2032. There was a valuation allowance of $3.11 billion and $2.27 billion as of December 31, 2015 and 2014, respectively, provided on certain net U.S. deferred tax assets, as the Company believes these assets do not meet the “more-likely-than-not” criteria for recognition. Net operating loss carryforwards for the Company’s foreign subsidiaries were $1.97 billion and $2.07
107
LAS VEGAS SANDS CORP. AND SUBSIDIARIES
NOTES TO CONSOLIDATED FINANCIAL STATEMENTS - (CONTINUED)
billion as of December 31, 2015 and 2014, respectively, which begin to expire in 2016. There are valuation allowances of $195.8 million and $215.2 million as of December 31, 2015 and 2014, respectively, provided on the net deferred tax assets of certain foreign jurisdictions, as the Company believes these assets do not meet the “more-likely-than-not” criteria for recognition.
Undistributed earnings of subsidiaries are accounted for as a temporary difference, except that deferred tax liabilities are not recorded for undistributed earnings of foreign subsidiaries that are deemed to be indefinitely reinvested in foreign jurisdictions. The Company does not consider current year's tax earnings and profits of its foreign subsidiaries to be indefinitely reinvested. Beginning with the year ended December 31, 2015, certain of the Company’s foreign subsidiaries distributed, and may continue to distribute, earnings in excess of their current year’s tax earnings and profits in order to meet the Company’s liquidity needs. The Company has a plan for its other foreign subsidiaries that demonstrates that earnings attributable to periods before January 1, 2015, will be indefinitely reinvested in the applicable jurisdictions. As of December 31, 2015 and 2014, the amount of earnings and profits of foreign subsidiaries that the Company does not intend to repatriate was $5.24 billion and $6.07 billion, respectively. The Company has not provided deferred taxes for the remaining undistributed foreign earnings, as the Company expects there will be sufficient creditable foreign taxes to offset the U.S. and other foreign income taxes that would result, should these earnings be distributed in the form of dividends or otherwise. The Company's cumulative temporary difference is less than its earnings and profits.
A reconciliation of the beginning and ending amounts of unrecognized tax benefits, which have been reclassified to conform to the current presentation for the years ended December 31, 2014 and 2013, is as follows (in thousands):
December 31, | |||||||||||
2015 | 2014 | 2013 | |||||||||
Balance at the beginning of the year | $ | 62,765 | $ | 56,659 | $ | 59,338 | |||||
Additions to tax positions related to prior years | 1,618 | 1,101 | 4,431 | ||||||||
Reductions to tax positions related to prior years | (87 | ) | — | (11,625 | ) | ||||||
Additions to tax positions related to current year | 4,524 | 6,196 | 5,709 | ||||||||
Settlements | (1,013 | ) | — | (753 | ) | ||||||
Lapse in statutes of limitations | (1,742 | ) | (729 | ) | — | ||||||
Exchange rate fluctuations | (698 | ) | (462 | ) | (441 | ) | |||||
Balance at the end of the year | $ | 65,367 | $ | 62,765 | $ | 56,659 | |||||
As of December 31, 2015, 2014 and 2013, unrecognized tax benefits of $56.7 million, $50.6 million and $43.4 million, respectively, were recorded as reductions to the U.S. foreign tax credit deferred tax asset. As of December 31, 2015, 2014 and 2013, unrecognized tax benefits of $3.0 million, $12.2 million and $13.3 million, respectively, were recorded in other long-term liabilities. As of December 31, 2015, unrecognized tax benefits of $5.6 million were recorded in income taxes payable.
Included in the unrecognized tax benefit balance as of December 31, 2015, 2014 and 2013, are $53.2 million, $52.4 million and $47.3 million, respectively, of uncertain tax benefits that would affect the effective income tax rate if recognized.
The Company’s major tax jurisdictions are the U.S., Macao, and Singapore. The Company is subject to examination for tax years beginning 2010 in the U.S. and Singapore and tax years beginning in 2011 in Macao. The Inland Revenue Authority of Singapore is performing a compliance review of the Marina Bay Sands tax returns for tax years 2010 through 2012. The Company believes it has adequately reserved for its uncertain tax positions; however, there is no assurance that the taxing authorities will not propose adjustments that are different from the Company’s expected outcome and that will impact the provision for income taxes.
108
LAS VEGAS SANDS CORP. AND SUBSIDIARIES
NOTES TO CONSOLIDATED FINANCIAL STATEMENTS - (CONTINUED)
The Company believes that it is reasonably possible that a decrease of up to $7.2 million in the Company’s unrecognized tax benefits will occur within the next 12 months, as a result of lapses of the statute of limitations and expected settlements with taxing authorities.
The Company recognizes interest and penalties, if any, related to unrecognized tax positions in the provision for income taxes in the accompanying consolidated statement of operations. No interest or penalties were accrued as of December 31, 2015 and 2014.
Note 11 — Fair Value Measurements
Under applicable accounting guidance, fair value is defined as the exit price, or the amount that would be received to sell an asset or paid to transfer a liability in an orderly transaction between market participants as of the measurement date. Applicable accounting guidance also establishes a valuation hierarchy for inputs in measuring fair value that maximizes the use of observable inputs (inputs market participants would use based on market data obtained from sources independent of the Company) and minimizes the use of unobservable inputs (inputs that reflect the Company’s assumptions based upon the best information available in the circumstances) by requiring that the most observable inputs be used when available. Level 1 inputs are quoted prices (unadjusted) in active markets for identical assets or liabilities. Level 2 inputs are quoted prices for similar assets or liabilities in active markets, quoted prices for identical or similar assets or liabilities in markets that are not active, and inputs (other than quoted prices) that are observable for the assets or liabilities, either directly or indirectly. Level 3 inputs are unobservable inputs for the assets or liabilities. Categorization within the hierarchy is based upon the lowest level of input that is significant to the fair value measurement. See "— Note 2 — Summary of Significant Accounting Policies" for additional disclosures regarding derivatives.
The Company currently uses certain derivatives as effective economic hedges to offset interest rate risk associated with its current and anticipated future borrowings (see "— Note 8 — Long-Term Debt") and foreign currency forward contracts to manage its foreign currency exposure. Foreign currency forward contracts involve the purchase and sale of a designated currency at an agreed upon rate for settlement on a specified date. The aggregate notional value of these foreign currency contracts was $672.7 million as of December 31, 2015. As these derivatives have not been designated and/or do not qualify for hedge accounting, the changes in fair value are recognized as other income (expense) in the accompanying consolidated statements of operations.
The following table provides the assets carried at fair value (in thousands):
Fair Value Measurements Using: | |||||||||||||||
Total Carrying Value | Quoted Market Prices in Active Markets (Level 1) | Significant Other Observable Inputs (Level 2) | Significant Unobservable Inputs (Level 3) | ||||||||||||
As of December 31, 2015 | |||||||||||||||
Cash equivalents(1) | $ | 905,276 | $ | 905,276 | $ | — | $ | — | |||||||
Forward contracts(2) | $ | 4,197 | $ | — | $ | 4,197 | $ | — | |||||||
Interest rate caps(3) | $ | — | $ | — | $ | — | $ | — | |||||||
As of December 31, 2014 | |||||||||||||||
Cash equivalents(1) | $ | 2,072,177 | $ | 2,072,177 | $ | — | $ | — | |||||||
Interest rate caps(3) | $ | 3 | $ | — | $ | 3 | $ | — | |||||||
_________________________
(1) | The Company has short-term investments classified as cash equivalents as the original maturities are less than 90 days. |
(2) | As of December 31, 2015, the Company had 19 foreign currency forward contracts with fair values based on quoted market transactions from the institutions holding the agreements. |
(3) | As of December 31, 2015 and 2014, the Company had one and four interest rate cap agreements, respectively, with a nominal aggregate fair value based on quoted market values from the institutions holding the agreements. |
109
LAS VEGAS SANDS CORP. AND SUBSIDIARIES
NOTES TO CONSOLIDATED FINANCIAL STATEMENTS - (CONTINUED)
Note 12 — Mall Sales
The Grand Canal Shoppes at The Venetian Las Vegas
In April 2004, the Company entered into an agreement to sell the portion of the Grand Canal Shoppes located within The Venetian Las Vegas (formerly referred to as "The Grand Canal Shoppes') and lease certain restaurant and other retail space at the casino level of The Venetian Las Vegas (the “Master Lease”) to GGP for approximately $766.0 million (the “Mall Sale”). The Mall Sale closed in May 2004, and the Company realized a gain of $417.6 million in connection with the Mall Sale. Under the Master Lease agreement, The Venetian Las Vegas leased nineteen retail and restaurant spaces on its casino level to GGP for 89 years with annual rent of one dollar and GGP assumed the various leases. In accordance with related accounting standards, the Master Lease agreement does not qualify as a sale of the real property assets, which real property was not separately legally demised. Accordingly, $109.2 million of the transaction has been deferred as prepaid operating lease payments to The Venetian Las Vegas, which will amortize into income on a straight-line basis over the 89-year lease term. During each of the years ended December 31, 2015, 2014 and 2013, $1.2 million of this deferred item was amortized and included in convention, retail and other revenue. In addition, the Company agreed with GGP to: (i) continue to be obligated to fulfill certain lease termination and asset purchase agreements as further described in “— Note 13 — Commitments and Contingencies — Other Ventures and Commitments”; (ii) lease theater space located within The Grand Canal Shoppes from GGP for a period of 25 years with fixed minimum rent of $3.3 million per year with cost of living adjustments; (iii) operate the Gondola ride under an operating agreement for a period of 25 years for an annual fee of $3.5 million; and (iv) lease certain office space from GGP for a period of 10 years, subject to extension options for a period of up to 65 years, with annual rent of approximately $0.9 million. The lease payments under clauses (ii) through (iv) above are subject to automatic increases beginning on the sixth lease year. The net present value of the lease payments under clauses (ii) through (iv) on the closing date of the sale was $77.2 million. In accordance with related accounting standards, a portion of the transaction must be deferred in an amount equal to the present value of the minimum lease payments set forth in the lease back agreements. This deferred gain will be amortized to reduce lease expense on a straight-line basis over the lives of the leases. During the years ended December 31, 2015, 2014 and 2013, $2.8 million, $3.1 million and $3.5 million of this deferred item was amortized as an offset to convention, retail and other expense.
As of December 31, 2015, the Company was obligated under (ii), (iii), and (iv) above to make future payments as follows (in thousands):
2016 | $ | 7,718 | |
2017 | 7,718 | ||
2018 | 7,718 | ||
2019 | 7,942 | ||
2020 | 8,103 | ||
Thereafter | 70,229 | ||
$ | 109,428 | ||
The Shoppes at The Palazzo
The Company contracted to sell a portion of the Grand Canal Shoppes (formerly referred to as The Shoppes at The Palazzo) to GGP and under the terms of the settlement with GGP on June 24, 2011, the Company retained $295.4 million of proceeds received and participates in certain potential future revenues earned by GGP. Pursuant to the Amended Agreement, the Company agreed with GGP to lease certain spaces located within The Shoppes at The Palazzo for a period of 10 years with total fixed minimum rents of $0.7 million per year, subject to extension options for a period of up to 10 years and automatic increases beginning on the second lease year. As of December 31, 2015, the Company was obligated to make future payments of approximately $0.9 million for each of the two years in the period ending December 31, 2017, and approximately $0.5 million for the year ending December 31, 2018. In accordance with related accounting standards, the transaction has not been accounted for as a sale because the Company’s participation in certain potential future revenues constitutes continuing involvement in The Shoppes at The Palazzo.
110
LAS VEGAS SANDS CORP. AND SUBSIDIARIES
NOTES TO CONSOLIDATED FINANCIAL STATEMENTS - (CONTINUED)
Therefore, $268.4 million of the mall sale transaction has been recorded as deferred proceeds from the sale as of December 31, 2015, which accrues interest at an imputed interest rate offset by (i) imputed rental income and (ii) rent payments made to GGP related to those spaces leased back from GGP.
In the Amended Agreement, the Company agreed to lease certain restaurant and retail space on the casino level of The Palazzo to GGP pursuant to a master lease agreement (“The Palazzo Master Lease”). Under The Palazzo Master Lease, which was executed concurrently with, and as a part of, the closing on the sale of The Shoppes at The Palazzo to GGP on February 29, 2008, The Palazzo leased nine restaurant and retail spaces on its casino level to GGP for 89 years with annual rent of one dollar and GGP assumed the various tenant operating leases for those spaces. In accordance with related accounting standards, The Palazzo Master Lease does not qualify as a sale of the real property, which real property was not separately legally demised. Accordingly, $22.5 million of the mall sale transaction has been deferred as prepaid operating lease payments to The Palazzo, which is amortized into income on a straight-line basis over the 89-year lease term.
Note 13 — Commitments and Contingencies
Litigation
The Company is involved in other litigation in addition to those noted below, arising in the normal course of business. Management has made certain estimates for potential litigation costs based upon consultation with legal counsel. Actual results could differ from these estimates; however, in the opinion of management, such litigation and claims will not have a material effect on the Company’s financial condition, results of operations and cash flows.
On October 15, 2004, Richard Suen and Round Square Company Limited ("Roundsquare") filed an action against LVSC, Las Vegas Sands, Inc. (“LVSI”), Sheldon G. Adelson and William P. Weidner in the District Court of Clark County, Nevada (the “District Court”), asserting a breach of an alleged agreement to pay a success fee of $5.0 million and 2.0% of the net profit from the Company’s Macao resort operations to the plaintiffs as well as other related claims. In March 2005, LVSC was dismissed as a party without prejudice based on a stipulation to do so between the parties. Pursuant to an order filed March 16, 2006, plaintiffs’ fraud claims set forth in the first amended complaint were dismissed with prejudice against all defendants. The order also dismissed with prejudice the first amended complaint against defendants Sheldon G. Adelson and William P. Weidner. On May 24, 2008, the jury returned a verdict for the plaintiffs in the amount of $43.8 million. On June 30, 2008, a judgment was entered in this matter in the amount of $58.6 million (including pre-judgment interest). The Company appealed the verdict to the Nevada Supreme Court. On November 17, 2010, the Nevada Supreme Court reversed the judgment and remanded the case to the District Court for a new trial. In its decision reversing the monetary judgment against the Company, the Nevada Supreme Court also made several other rulings, including overturning the pre-trial dismissal of the plaintiffs’ breach of contract claim and deciding several evidentiary matters, some of which confirmed and some of which overturned rulings made by the District Court. On February 27, 2012, the District Court set a date of March 25, 2013, for the new trial. On June 22, 2012, the defendants filed a request to add experts and plaintiffs filed a motion seeking additional financial data as part of their discovery. The District Court granted both requests. The retrial began on March 27 and on May 14, 2013, the jury returned a verdict in favor of Roundsquare in the amount of $70.0 million. On May 28, 2013, a judgment was entered in the matter in the amount of $101.6 million (including pre-judgment interest). On June 7, 2013, the Company filed a motion with the District Court requesting that the judgment be set aside as a matter of law or in the alternative that a new trial be granted. On July 30, 2013, the District Court denied the Company’s motion. On October 17, 2013, the District Court entered an order granting plaintiff’s request for certain costs and fees associated with the litigation in the amount of approximately $1.0 million. On December 6, 2013, the Company filed a notice of appeal of the jury verdict with the Nevada Supreme Court. The Company filed its opening appellate brief with the Nevada Supreme Court on June 16, 2014. On August 19, 2014, the Nevada Supreme Court issued an order granting plaintiffs additional time until September 15, 2014, to file their answering brief. On September 15, 2014, Roundsquare filed a request to the Nevada Supreme Court to file a brief exceeding the maximum number of words, which was granted. On October 10, 2014, Roundsquare filed their answering brief. On January 12, 2015, the defendants filed their reply brief. On January 27, 2015, Roundsquare filed their reply brief. The Nevada Supreme Court set oral argument for December 17, 2015, before a panel of justices
111
LAS VEGAS SANDS CORP. AND SUBSIDIARIES
NOTES TO CONSOLIDATED FINANCIAL STATEMENTS - (CONTINUED)
only to reset it for January 26, 2016, en banc. Oral arguments were presented to the Nevada Supreme Court as scheduled but no ruling date has been set nor is one estimable. The Company believes that it has valid bases in law and fact to appeal these verdicts. As a result, the Company believes that the likelihood that the amount of the judgments will be affirmed is not probable, and, accordingly, that the amount of any loss cannot be reasonably estimated at this time. Because the Company believes that this potential loss is not probable or estimable, it has not recorded any reserves or contingencies related to this legal matter. In the event that the Company’s assumptions used to evaluate this matter as neither probable nor estimable change in future periods, it may be required to record a liability for an adverse outcome.
On October 20, 2010, Steven C. Jacobs, the former Chief Executive Officer of SCL, filed an action against LVSC and SCL in the District Court alleging breach of contract against LVSC and SCL and breach of the implied covenant of good faith and fair dealing and tortious discharge in violation of public policy against LVSC. On March 16, 2011, an amended complaint was filed, which added Sheldon G. Adelson as a defendant and alleged a claim of defamation per se against him, LVSC and SCL. On June 9, 2011, the District Court dismissed the defamation claim and certified the decision as to Sheldon G. Adelson as a final judgment. On July 1, 2011, the plaintiff filed a notice of appeal regarding the final judgment as to Sheldon G. Adelson. On August 26, 2011, the Nevada Supreme Court issued a writ of mandamus instructing the District Court to hold an evidentiary hearing on whether personal jurisdiction exists over SCL and stayed the case until after the District Court's decision. On January 17, 2012, plaintiff filed his opening brief with the Nevada Supreme Court regarding his appeal of the defamation claim against Mr. Adelson. On January 30, 2012, Mr. Adelson filed his reply to plaintiff’s opening brief. On March 8, 2012, the District Court set a hearing date for the week of June 25-29, 2012, for the evidentiary hearing on personal jurisdiction over SCL. On May 24, 2012, the District Court vacated the hearing date previously set for June 25-29 and set a status conference for June 28, 2012. At the June 28 status hearing, the District Court set out a hearing schedule to resolve a discovery dispute and did not reset a date for the jurisdictional hearing.
From September 10 to September 12, 2012, the District Court held a hearing to determine the outcome of certain discovery disputes and issued an order on September 14, 2012. In its order, the District Court fined LVSC $25,000 and, for the purposes of the jurisdictional discovery and evidentiary hearing, precluded the defendants from relying on the Macao Data Privacy Act as an objection or defense under its discovery obligations. On December 21, 2012, the District Court ordered the defendants to produce documents from a former counsel to LVSC containing attorney client privileged information. On January 23, 2013, the defendants filed a writ with the Nevada Supreme Court challenging this order (the “January Writ”). On January 29, 2013, the District Court granted defendants' motion for a stay of the order. On February 15, 2013, the Nevada Supreme Court ordered the plaintiff to answer the January Writ. On February 28, 2013, the District Court ordered a hearing on plaintiff’s request for sanctions and additional discovery (the “February 28th Order”). On April 8, 2013, the defendants filed a writ with the Nevada Supreme Court challenging the February 28th Order (the “April Writ”); and the Nevada Supreme Court ordered the plaintiff to answer the April Writ by May 20, 2013. The defendants also filed and were granted a stay of the February 28th Order by the District Court until such time as the Nevada Supreme Court decided the April Writ. On June 18, 2013, the District Court scheduled the jurisdictional hearing for July 16-22, 2013 and issued an order allowing the plaintiff access to privileged communications of counsel to the Company (the “June 18th Order”). On June 21, 2013, the Company filed another writ with the Nevada Supreme Court challenging the June 18th Order (the “June Writ”). The Nevada Supreme Court accepted the June Writ on June 28, 2013, and issued a stay of the June 18th Order. On June 28, 2013, the District Court vacated the jurisdictional hearing. On July 3, 2013, the Company filed a motion with the Nevada Supreme Court to consolidate the pending writs, each of which had been fully briefed to the Nevada Supreme Court on or before August 30, 2013. On October 9, 2013, the Nevada Supreme Court heard arguments on the January Writ and plaintiff’s appeal of the District Court's dismissal of plaintiff’s defamation claim against Mr. Adelson.
On January 29, 2014, the defendants filed Supplemental Authority and a Motion to Recall Mandate with the Nevada Supreme Court to (i) inform the Nevada Supreme Court of a recently decided U.S. Supreme Court case involving similar jurisdictional issues to this matter and (ii) given this new precedent, to review anew its August 26, 2011, writ of mandamus to the District Court, respectively. On February 27, 2014, the Nevada Supreme Court ruled in favor of the Company on the January Writ, which became effective on March 24, 2014. On March 3, 2014, the Nevada Supreme Court heard oral arguments on the April and June Writs. On May 30, 2014, the Nevada Supreme Court overturned the
112
LAS VEGAS SANDS CORP. AND SUBSIDIARIES
NOTES TO CONSOLIDATED FINANCIAL STATEMENTS - (CONTINUED)
District Court’s dismissal of Mr. Jacob’s defamation claim against Mr. Adelson and remanded the claim for further determination. On June 17, 2014, Mr. Adelson filed a petition for rehearing with the Nevada Supreme Court and, on June 20, 2014, the Nevada Supreme Court ordered Mr. Jacobs to answer the petition for rehearing, which he did on July 7, 2014.
On June 26, 2014, SCL filed a Motion for Summary Judgment with respect to jurisdiction with the District Court, which was denied on July 29, 2014. On June 30, 2014, Mr. Jacobs filed a motion for leave to file a second amended complaint. The defendants filed a notice of intent to oppose the motion for leave to file the second amended complaint. On July 1, 2014, Mr. Jacobs filed a motion to reconsider the dismissal of the defamation claim. On July 3, 2014, Mr. Adelson filed a notice of intent to oppose the motion to reconsider and requested oral argument. Also on July 3, 2014, the defendants filed a motion to continue the stay of the District Court’s March 26, 2013, order compelling the production of documents from Macao and a notice of intent to oppose plaintiff’s motion to reconsider the dismissal of his defamation claim against LVSC and SCL.
On July 22, 2014, the defendants filed a motion for leave to file a reply in support of their petition for rehearing on the defamation claim with the Nevada Supreme Court. On July 22, 2014, SCL filed its reply in support of its Motion for Summary Judgment on jurisdiction and opposition to plaintiff’s counter Motion for Summary Judgment. On July 25, 2014, the Nevada Supreme Court granted defendants’ motion for leave to file a reply. On July 29, 2014, the Nevada Supreme Court heard the Motions for Summary Judgment and denied them both. On August 7, 2014, the Nevada Supreme Court denied the writ challenging the District Court’s order on plaintiff’s March 26, 2013, Renewed Motion for Sanctions. On August 7, 2014, the Nevada Supreme Court granted in part defendants’ writ with respect to the District Court’s June 19, 2013, order requiring the production of privileged material. On August 7, 2014, the Nevada Supreme Court also denied rehearing on its reversal of the dismissal of the defamation claim by a vote of 4-3. On August 13, 2014, the District Court ruled that plaintiff could amend his complaint except for the defamation claim against Mr. Adelson until the remittitur from the Nevada Supreme Court was received. The District Court also allowed the sanctions hearing to move forward and reviewed documents in camera to determine whether they were properly withheld on privilege grounds.
On September 4, 2014, SCL filed its pre-hearing memorandum regarding the sanctions hearing regarding plaintiff’s March 26, 2013, Renewed Motion for Sanctions. On September 12, 2014, the plaintiff filed a motion for release of the privileged documents from the District Court appointed document custodian on the grounds of waiver. On September 16, 2014, the plaintiff filed a motion seeking to stop defendants from modifying their privilege log and seeking a waiver of all privilege claims as a result of alleged deficiencies in the original privilege. On September 26, 2014, after the Nevada Supreme Court issued its remittitur, plaintiff filed his motion for leave to file a third amended complaint against LVSC, SCL and Mr. Adelson. On September 26, 2014, the defendants filed their opposition to plaintiff’s motion for release of documents on the grounds of waiver. On October 3, 2014, the plaintiff filed his reply in support of his two waiver motions relating to the documents held by the District Court appointed custodian. On October 9, 2014, the District Court granted plaintiff's motion in part and denied the remainder. On October 10, 2014, Mr. Adelson filed his opposition to plaintiff's motion to file a third amended complaint, which SCL and LVSC joined on October 14, 2014. On October 17, 2014, SCL filed a motion to reconsider the District Court’s March 27, 2013, order concerning a discovery dispute. On October 30, 2014, the plaintiff filed his reply in support of his motion to file a third amended complaint. On November 5, 2014, the District Court ordered that SCL waived privilege on three confidential reports. On November 7, 2014, the District Court granted plaintiff's motion to file a third amended complaint. On November 7, 2014, defendants filed a motion for partial re-consideration of the November 5, 2014, order waiving privilege. On January 6, 2015, the District Court scheduled a sanctions hearing for February 9, 2015, and the evidentiary hearing on jurisdiction for April 20, 2015. On January 12, 2015, defendants each filed their motions to dismiss the third amended complaint. Defendants’ motions to dismiss the third amended complaint were fully briefed on February 19, 2015, and the District Court heard oral argument on February 27, 2015. In an order entered on March 30, 2015, the District Court denied Mr. Adelson’s motion to dismiss the defamation claim, but granted his motion to dismiss with respect to plaintiff’s wrongful discharge claim on the ground that Mr. Adelson was not the plaintiff’s employer. The District Court denied LVSC’s motion to dismiss and strike certain allegations in the complaint. The District Court reserved judgment on SCL’s motion to dismiss until after it ruled on jurisdiction. On April 7, 2015, LVSC filed a motion
113
LAS VEGAS SANDS CORP. AND SUBSIDIARIES
NOTES TO CONSOLIDATED FINANCIAL STATEMENTS - (CONTINUED)
for reconsideration of the order on the limited ground that the District Court had erroneously stated that LVSC was in fact plaintiff’s employer rather than stating that plaintiff had alleged that he was LVSC’s employee. Plaintiff conceded that point in his response filed on April 20, 2015. A hearing was held on the motion for reconsideration on April 21, 2015.
The sanctions hearing was held over six days, beginning on February 9 and ending on March 3, 2015. On March 6, 2015, the District Court issued a decision and order imposing sanctions on SCL for violating its September 14, 2012 Order, which the District Court construed as prohibiting SCL from redacting any documents produced in response to jurisdictional discovery requests to comply with the Macao Data Privacy Act. On March 6, 2015, the District Court ordered additional discovery to be provided by SCL. The District Court also ordered SCL to pay a total of $250,000 to five different law-related entities. Finally, the District Court imposed evidentiary sanctions on SCL, prohibiting it from offering any affirmative evidence at the hearing on jurisdiction scheduled to begin on April 20, 2015, and stating that it would adversely infer, subject to SCL’s ability to rebut the inference within the evidentiary constraints imposed on it, that any document redacted to comply with the Macao Data Privacy Act would support plaintiff’s assertion of personal jurisdiction over SCL and would contradict SCL’s denial. SCL sought a stay of the order from the District Court on March 13, 2015, and when that was denied, sought a stay from the Nevada Supreme Court on March 16, 2015. The Nevada Supreme Court granted a partial stay on March 17, 2015, staying SCL’s obligation to pay $250,000 and to run additional searches, but declining to stay the April 20, 2015 hearing on jurisdiction. SCL filed a petition for mandamus in the Nevada Supreme Court on March 20, 2015. Plaintiff filed his response on March 27, 2015, and SCL filed its reply on March 31, 2015. On April 2, 2015, the Nevada Supreme Court denied the mandamus petition with respect to everything but the $250,000 sanction and lifted the stay except with respect to that sanction. The jurisdictional hearing began on April 20, 2015, and concluded on May 7, 2015. On May 28, 2015, the District Court issued an order finding specific and general jurisdiction over SCL. On June 19, 2015, SCL filed a petition for writ of mandamus seeking review of the decision. On June 23, 2015, the Nevada Supreme Court entered an Order Directing Answer to the jurisdictional writ petition and staying the May 28, 2015 order. Also on June 23, 2015, SCL filed a writ petition challenging the District Court's order requiring the deposition of an SCL independent board member on U.S. soil. In conjunction with the June 23 writ petition, SCL also moved to stay the scheduled deposition and plaintiff filed his opposition to the motion. The Nevada Supreme Court filed its June 23, 2015 order granting the emergency stay, accepting the writ and accepting plaintiff's opposition to the motion to stay as the answer to the June 23 petition. On June 26, 2015, defendants filed a writ petition challenging the expedited trial date and discovery schedule set by the District Court, followed by a June 29, 2015 motion to stay all proceedings pending a decision on the writ petition. Plaintiff opposed the motion to stay on June 30, 2015. On July 1, 2015, the Nevada Supreme Court entered an order consolidating the three pending writ petitions, granting in part the stay sought in conjunction with the June 26 petition, ordering briefing on that petition. The Nevada Supreme Court's July 1, 2015 order vacated the expedited trial date and the pretrial motions set by the District Court. On July 22, 2015, the plaintiff filed his answer to the writ petition challenging the expedited trial date and related pretrial deadlines, and on July 23, plaintiff answered the writ petition challenging the May 28 jurisdiction order. On September 1, 2015, the Nevada Supreme Court held a consolidated oral argument on all three pending writ petitions.
On September 18, 2015, plaintiff filed, with leave of court, a Fifth Amended Complaint, adding VML as a defendant on the two breach of contract claims alleged in the complaint. The Fifth Amended Complaint alleges that LVSC entered into a term sheet with plaintiff in which it promised certain benefits in the event that plaintiff was terminated without cause. Plaintiff claims that, in connection with SCL’s initial public offering, LVSC assigned the term sheet to both SCL and VML, which (together with LVSC) allegedly assumed liability for breaches of the term sheet. In Count I of the Fifth Amended Complaint, plaintiff alleges that he was terminated without cause and that LVSC, SCL and VML breached the term sheet by not paying the severance required under those circumstances. In Count II, plaintiff claims that certain stock options in SCL purportedly awarded to him should have vested when he was terminated and seeks damages from LVSC, SCL and VML for SCL’s refusal to recognize the options. Count III is a claim for breach of an implied covenant of good faith and fair dealing against LVSC, SCL and VML. Count IV repeats plaintiff’s earlier claim for tortious discharge in violation of public policy and is alleged against LVSC alone. Count V repeats plaintiff’s claims for defamation per se and is alleged against Mr. Adelson, LVSC and SCL. Count VI repeats a tortious
114
LAS VEGAS SANDS CORP. AND SUBSIDIARIES
NOTES TO CONSOLIDATED FINANCIAL STATEMENTS - (CONTINUED)
discharge in violation of public policy claim against Mr. Adelson, which the District Court previously dismissed with prejudice. On November 13, 2015, the District Court granted Mr. Adelson's motion to strike Count VI in light of its prior dismissal of that count. Count VII alleges aiding and abetting tortious discharge in violation of public policy against SCL. Count VIII alleges a conspiracy between LVSC and SCL to tortiously discharge plaintiff in violation of public policy. LVSC, SCL and Mr. Adelson have answered the Fifth Amended Complaint and LVSC has re-filed its previously filed counterclaim against plaintiff.
On October 19, 2015, VML moved to quash service of the summons and on October 21, 2015, further moved to dismiss all claims against VML. VML also filed a peremptory challenge to the judge presiding over the case, causing it to be reassigned to another judge. On October 27, 2015, the new judge struck the peremptory challenge and the case was reassigned to the original judge. On November 3, 2015, VML filed a petition for a writ of prohibition or mandamus in the Nevada Supreme Court challenging the decision to strike its peremptory challenge; at the same time, VML filed a motion with the Nevada Supreme Court to stay all proceedings before the original judge pending the outcome of its writ petition. On November 4, 2015, the Nevada Supreme Court granted a stay with respect to proceedings against VML only and directed plaintiff to answer the writ petition within 30 days. Instead of answering, on December 18, 2015, plaintiff voluntarily dismissed VML from the action, without prejudice and then filed a notice with the Nevada Supreme Court claiming that VML’s petition was moot. On December 30, 2015, VML filed a motion with the Nevada Supreme Court asking it to grant its writ petition or, in the alternative, to permit the dismissal of VML only if it is with prejudice. The Nevada Supreme Court has not yet ruled on that motion.
On November 4, 2015, the Nevada Supreme Court issued an order granting in part and denying in part the three pending writ petitions filed by SCL that were argued on September 1, 2015. The Nevada Supreme Court held that the District Court had erred in concluding that it had general and transient jurisdiction over SCL, but held that plaintiff had met his burden of making a preliminary showing of specific jurisdiction over SCL in Nevada with respect to the particular claims plaintiff had made. The Nevada Supreme Court held that defendants’ writ petition addressing the expedited trial date was moot in light of the District Court’s order vacating that date; the Nevada Supreme Court noted, however, that defendants were correct that the previous stay of proceedings tolled the five-year time period for bringing the case to trial. The Nevada Supreme Court granted SCL’s writ petition to overturn the District Court’s order compelling one of SCL’s independent directors to appear for a deposition on U.S. soil. The Nevada Supreme Court also ruled on the previously stayed $250,000 sanction, upholding the amount but requiring the payment to be reallocated on remand. Finally, the Nevada Supreme Court denied defendants’ request that the case be reassigned to a different judge.
On November 17, 2015, plaintiff filed a petition for rehearing en banc in the Nevada Supreme Court, asking the Nevada Supreme Court to reconsider its ruling on the location of the deposition of SCL’s independent director. On November 24, 2015, SCL filed a petition for rehearing en banc in the Nevada Supreme Court, asking the Nevada Supreme Court to reconsider its conclusion that plaintiff had met his burden of making a preliminary showing of specific jurisdiction over SCL. On December 23, 2015, the Nevada Supreme Court issued an order requiring answers to both petitions for rehearing. Plaintiff filed his answer on January 8, 2016, and SCL filed its answer on January 22, 2016. On February 24, 2016, the Nevada Supreme Court granted plaintiff’s petition for rehearing concluding SCL is responsible for producing its director for a noticed deposition, the location of which may be determined by the District Court. On the same day, the Nevada Supreme Court denied SCL’s petition for rehearing regarding the finding of specific jurisdiction over SCL.
On November 19, 2015, SCL filed its answer to plaintiffs’ Fifth Amended Complaint, denying each of plaintiff’s claims and raising a number of affirmative and other defenses. Discovery is ongoing with respect to the Company and SCL. The District Court has entered a scheduling order under which discovery will close on May 5, 2016, and the case is to be tried to a jury beginning on or after June 27, 2016.
On December 18, 2015, plaintiff served a notice of the deposition of a Company executive. On December 31, 2015, counsel for the executive and defendants filed a motion for protective order. The District Court denied the motion in part and ordered the executive to appear for a deposition prior to January 12, 2016. The executive appeared for a deposition on January 11, 2016. When questions were posed during the deposition regarding the executive’s alleged
115
LAS VEGAS SANDS CORP. AND SUBSIDIARIES
NOTES TO CONSOLIDATED FINANCIAL STATEMENTS - (CONTINUED)
communications with third parties, including the media, about media coverage of the court and the Jacobs case and about the purchase of the Las Vegas Review-Journal by members of the Adelson family, counsel for the executive instructed him not to answer. At a hearing the next day, the District Court “overruled” counsel’s instruction to the executive, but devised a procedure under which the executive’s counsel could refer objections to questions about his alleged communications with third parties, including the media, concerning the Jacobs litigation to a discovery master and/or a different judge, rather than to the presiding judge. On January 13, 2016, the executive filed a motion to expand the scope of the issues that would be referred to a discovery master to include all of the questions his counsel had instructed him not to answer, on the ground that comments the court had made to the media called into question the executive’s ability to obtain a fair and impartial hearing of his objections. On the same day, the Company filed a motion to disqualify the judge based on comments the court made to the media and during hearings related to the deposition of the executive, which raised reasonable doubts about the court’s impartiality. On January 15, 2016, the judge filed an affidavit regarding her contacts with the media involving this case and denying any bias. The motion to disqualify was set for hearing on February 18, 2016, before the Chief Judge of the District Court, but on January 29, 2016, the Chief Judge denied the motion to disqualify without providing the Company the opportunity to respond to the presiding judge’s affidavit.
On February 9, 2016, the Company filed a motion requesting the Chief Judge withdraw and reconsider the order denying the Company’s motion to disqualify the presiding judge. On February 12, 2016, the presiding judge filed an additional affidavit further denying any bias toward or against defendants. On the same day, the Company filed a request for the motion for reconsideration to be heard in open court. On February 16, 2016, in support of the motion for reconsideration, the Company filed a declaration of a legal scholar confirming the presiding judge’s contacts with the media created the appearance of partiality. On February 17, 2016, from chambers, the Chief Judge denied the Company’s request for reconsideration finding the record showed no evidence of judicial bias. On February 19, 2016, plaintiff filed a reply to the Company’s counterclaim.
On February 23, 2016, defendants filed a writ petition in the Nevada Supreme Court challenging the Chief Judge’s denial of the disqualification of the presiding judge. In conjunction with the writ, the defendants also filed an emergency motion to stay the proceedings in the District Court.
On January 29, 2016, Jacobs filed a complaint against VML in the United States District Court for the District of Nevada (the "U.S. District Court") alleging a breach of contract claim similar to the one he had brought against VML in the District Court and then dismissed. The Company intends to defend the matter vigorously.
Mr. Jacobs is seeking unspecified damages. This action is in a preliminary stage and management has determined that based on proceedings to date, it is currently unable to determine the probability of the outcome of this matter or the range of reasonably possible loss, if any. The Company intends to defend this matter vigorously.
On February 9, 2011, LVSC received a subpoena from the Securities and Exchange Commission (the “SEC”) requesting that the Company produce documents relating to its compliance with the Foreign Corrupt Practices Act (the “FCPA”). The Company has also been advised by the Department of Justice (the “DOJ”) that it is conducting a similar investigation. It is the Company’s belief that the subpoena may have emanated from the lawsuit filed by Steven C. Jacobs described above.
After the Company’s receipt of the subpoena from the SEC on February 9, 2011, the Board of Directors delegated to the Audit Committee, comprised of three independent members of the Board of Directors, the authority to investigate the matters raised in the SEC subpoena and related inquiry of the DOJ.
As part of the 2012 annual audit of the Company’s financial statements, the Audit Committee advised the Company and its independent accountants that it had reached certain preliminary findings, including that there were likely violations of the books and records and internal controls provisions of the FCPA and that in recent years, the Company has improved its practices with respect to books and records and internal controls.
116
LAS VEGAS SANDS CORP. AND SUBSIDIARIES
NOTES TO CONSOLIDATED FINANCIAL STATEMENTS - (CONTINUED)
Based on the information provided to management by the Audit Committee and its counsel, the Company believes, and the Audit Committee concurs, that the preliminary findings:
• | do not have a material impact on the financial statements of the Company; |
• | do not warrant any restatement of the Company’s past financial statements; and |
• | do not represent a material weakness in the Company’s internal controls over financial reporting as of December 31, 2015. |
The investigation by the Audit Committee is complete. The Company is cooperating with all investigations. Based on proceedings to date, management is currently unable to determine the probability of the outcome of this matter, the extent of materiality, or the range of reasonably possible loss, if any.
On May 24, 2010, Frank J. Fosbre, Jr. filed a purported class action complaint in the U.S. District Court, against LVSC, Sheldon G. Adelson, and William P. Weidner. The complaint alleged that LVSC, through the individual defendants, disseminated or approved materially false information, or failed to disclose material facts, through press releases, investor conference calls and other means from August 1, 2007 through November 6, 2008. The complaint sought, among other relief, class certification, compensatory damages and attorneys’ fees and costs. On July 21, 2010, Wendell and Shirley Combs filed a purported class action complaint in the U.S. District Court, against LVSC, Sheldon G. Adelson, and William P. Weidner. The complaint alleged that LVSC, through the individual defendants, disseminated or approved materially false information, or failed to disclose material facts, through press releases, investor conference calls and other means from June 13, 2007 through November 11, 2008. The complaint, which was substantially similar to the Fosbre complaint, discussed above, sought, among other relief, class certification, compensatory damages and attorneys’ fees and costs. On August 31, 2010, the U.S. District Court entered an order consolidating the Fosbre and Combs cases, and appointed lead plaintiffs and lead counsel. As such, the Fosbre and Combs cases are reported as one consolidated matter. On November 1, 2010, a purported class action amended complaint was filed in the consolidated action against LVSC, Sheldon G. Adelson and William P. Weidner. The amended complaint alleges that LVSC, through the individual defendants, disseminated or approved materially false and misleading information, or failed to disclose material facts, through press releases, investor conference calls and other means from August 2, 2007 through November 6, 2008. The amended complaint seeks, among other relief, class certification, compensatory damages and attorneys’ fees and costs. On January 10, 2011, the defendants filed a motion to dismiss the amended complaint, which, on August 24, 2011, was granted in part, and denied in part, with the dismissal of certain allegations. On November 7, 2011, the defendants filed their answer to the allegations remaining in the amended complaint. On July 11, 2012, the U.S. District Court issued an order allowing defendants’ Motion for Partial Reconsideration of the U.S District Court’s order dated August 24, 2011, striking additional portions of the plaintiffs' complaint and reducing the class period to a period of February 4 to November 6, 2008. On August 7, 2012, the plaintiffs filed a purported class action second amended complaint (the “Second Amended Complaint”) seeking to expand their allegations back to a time period of 2007 (having previously been cut back to 2008 by the U.S. District Court) essentially alleging very similar matters that had been previously stricken by the U.S. District Court. On October 16, 2012, the defendants filed a new motion to dismiss the Second Amended Complaint. The plaintiffs responded to the motion to dismiss on November 1, 2012, and defendants filed their reply on November 12, 2012. On November 20, 2012, the U.S. District Court granted a stay of discovery under the Private Securities Litigation Reform Act pending a decision on the new motion to dismiss and therefore, the discovery process has been suspended. On April 16, 2013, the case was reassigned to a new judge. On July 30, 2013, the U.S. District Court heard the motion to dismiss and took the matter under advisement. On November 7, 2013, the judge granted in part and denied in part defendants' motions to dismiss. On December 13, 2013, the defendants filed their answer to the Second Amended Complaint. Discovery in the matter has re-started. On January 8, 2014, plaintiffs filed a motion to expand the certified class period, which was granted by the U.S. District Court on June 15, 2015. Fact discovery closed on July 31, 2015, and expert discovery closed on December 18, 2015. On January 22, 2016, the Company filed a motion for summary judgment as did co-defendant Mr. Weidner. This consolidated action is in a preliminary stage and management has determined that based on proceedings to date, it is currently unable to determine the probability of the outcome of this matter or the range of reasonably possible loss, if any. The Company intends to defend this matter vigorously.
117
LAS VEGAS SANDS CORP. AND SUBSIDIARIES
NOTES TO CONSOLIDATED FINANCIAL STATEMENTS - (CONTINUED)
On March 9, 2011, Benyamin Kohanim filed a shareholder derivative action (the “Kohanim action”) on behalf of the Company in the District Court against Sheldon G. Adelson, Jason N. Ader, Irwin Chafetz, Charles D. Forman, George P. Koo, Michael A. Leven, Jeffrey H. Schwartz and Irwin A. Siegel, the members of the Board of Directors at the time. The complaint alleges, among other things, breach of fiduciary duties in failing to properly implement, oversee and maintain internal controls to ensure compliance with the FCPA. The complaint seeks to recover for the Company unspecified damages, including restitution and disgorgement of profits, and also seeks to recover attorneys’ fees, costs and related expenses for the plaintiff. On April 18, 2011, Ira J. Gaines, Sunshine Wire and Cable Defined Benefit Pension Plan Trust dated 1/1/92 and Peachtree Mortgage Ltd. filed a shareholder derivative action (the “Gaines action”) on behalf of the Company in the District Court against Sheldon G. Adelson, Jason N. Ader, Irwin Chafetz, Charles D. Forman, George P. Koo, Michael A. Leven, Jeffrey H. Schwartz and Irwin A. Siegel, the members of the Board of Directors at the time. The complaint raises substantially similar claims as alleged in the Kohanim action. The complaint seeks to recover for the Company unspecified damages, and also seeks to recover attorneys’ fees, costs and related expenses for the plaintiffs. The Kohanim and Gaines actions have been consolidated and are reported as one consolidated matter. On July 25, 2011, the plaintiffs filed a first verified amended consolidated complaint. The plaintiffs have twice agreed to stay the proceedings. A 120-day stay was entered by the District Court in October 2011. It was extended for another 90 days in February 2012 and expired in May 2012. The parties agreed to an extension of the May 2012 deadline that expired on October 30, 2012. The defendants filed a motion to dismiss on November 1, 2012, based on the fact that the plaintiffs have suffered no damages. On January 23, 2013, the District Court denied the motion to dismiss in part, deferred the remainder of the motion to dismiss and stayed the proceedings until July 22, 2013. The District Court has granted several successive stays since that time, with the case currently stayed until April 18, 2016. This consolidated action is in a preliminary stage and management has determined that based on proceedings to date, it is currently unable to determine the probability of the outcome of this matter or the range of reasonably possible loss, if any. The Company intends to defend this matter vigorously.
On April 1, 2011, Nasser Moradi, Richard Buckman, Douglas Tomlinson and Matt Abbeduto filed a shareholder derivative action (the “Moradi action”), as amended on April 15, 2011, on behalf of the Company in the U.S. District Court, against Sheldon G. Adelson, Jason N. Ader, Irwin Chafetz, Charles D. Forman, George P. Koo, Michael A. Leven, Jeffrey H. Schwartz and Irwin A. Siegel, the members of the Board of Directors at the time. The complaint raises substantially similar claims as alleged in the Kohanim and Gaines actions. The complaint seeks to recover for the Company unspecified damages, including exemplary damages and restitution, and also seeks to recover attorneys’ fees, costs and related expenses for the plaintiffs. On April 18, 2011, the Louisiana Municipal Police Employees Retirement System filed a shareholder derivative action (the “LAMPERS action”) on behalf of the Company in the U.S. District Court, against Sheldon G. Adelson, Jason N. Ader, Irwin Chafetz, Charles D. Forman, George P. Koo, Michael A. Leven, Jeffrey H. Schwartz and Irwin A. Siegel, the members of the Board of Directors at the time, and Wing T. Chao, a former member of the Board of Directors. The complaint raises substantially similar claims as alleged in the Kohanim, Moradi and Gaines actions. The complaint seeks to recover for the Company unspecified damages, and also seeks to recover attorneys’ fees, costs and related expenses for the plaintiff. On April 22, 2011, John Zaremba filed a shareholder derivative action (the “Zaremba action”) on behalf of the Company in the U.S. District Court, against Sheldon G. Adelson, Jason N. Ader, Irwin Chafetz, Charles D. Forman, George P. Koo, Michael A. Leven, Jeffrey H. Schwartz and Irwin A. Siegel, the members of the Board of Directors at the time, and Wing T. Chao, a former member of the Board of Directors. The complaint raises substantially similar claims as alleged in the Kohanim, Moradi, Gaines and LAMPERS actions. The complaint seeks to recover for the Company unspecified damages, including restitution, disgorgement of profits and injunctive relief, and also seeks to recover attorneys’ fees, costs and related expenses for the plaintiff. On August 25, 2011, the U.S. District Court consolidated the Moradi, LAMPERS and Zaremba actions and such actions are reported as one consolidated matter. On November 17, 2011, the defendants filed a motion to dismiss or alternatively to stay the federal action due to the parallel District Court action described above. On May 25, 2012, the case was transferred to a new judge. On August 27, 2012, the U.S. District Court granted the motion to stay pending a further update of the Special Litigation Committee due on October 30, 2012. On October 30, 2012, the defendants filed the update asking the judge to determine whether to continue the stay until January 31, 2013, or to address motions to dismiss. On November 7, 2012, the U.S. District Court denied defendants request for an extension of the stay but asked the parties to brief the motion to dismiss. On November 21, 2012, defendants filed their motion
118
LAS VEGAS SANDS CORP. AND SUBSIDIARIES
NOTES TO CONSOLIDATED FINANCIAL STATEMENTS - (CONTINUED)
to dismiss. On December 21, 2012, plaintiffs filed their opposition and on January 18, 2013, defendants filed their reply. On May 31, 2013, the case was reassigned to a new judge. On April 11, 2014, the judge denied the motion to dismiss without prejudice and ordered the case stayed pending the outcome of the District Court action in Kohanim described above. Following a January 22, 2016, status report by the parties, on January 27, 2016, the judge ordered another status report on May 16, 2016. This consolidated action is in a preliminary stage and management has determined that based on proceedings to date, it is currently unable to determine the probability of the outcome of this matter or the range of reasonably possible loss, if any. The Company intends to defend this matter vigorously.
On January 23, 2014, W.A. Sokolowski filed a shareholder derivative action (the "Sokolowski action") purporting to act on behalf of the Company and in his individual capacity as a shareholder in the U.S. District Court against Sheldon G. Adelson, Michael A. Leven, Jason N. Ader, Irwin Chafetz, Charles D. Forman, George P. Koo, Charles A. Koppelman, Jeffrey H. Schwartz, Victor Chaltiel and Irwin A. Siegel, each of whom was serving on the Board of Directors (collectively, the “Directors”), as well as against Frederick Hipwell, a partner at PricewaterhouseCoopers LLP (“PwC”), the Company’s former auditor. The complaint alleges, among other things, that the Directors breached their fiduciary duties to the Company by attempting to conceal certain alleged misrepresentations and wrongdoing by the Company’s management, concealed certain facts in connection with audits performed by PwC and caused the issuance of a false or misleading proxy statement in 2013. The complaint seeks, among other things the appointment of a conservator or special master to oversee the Company’s discussions with governmental agencies as well as to recover for the Company unspecified damages, including restitution and disgorgement of profits, and also seeks to recover attorneys’ fees, costs and related expenses for the plaintiff. The Company filed a motion to dismiss the complaint on February 13, 2014. On February 28, 2014, defendant Hipwell filed his motion to dismiss the complaint. On March 12, 2014, the plaintiff filed its response to the Company’s motion to dismiss and on March 26, 2014, the Company filed its reply. On March 31, 2014, the plaintiff filed its response to Hipwell’s motion to dismiss and on April 10, 2014, Hipwell filed his reply. On April 1, 2014, the plaintiff filed a renewed motion for expedited discovery (the first motion was filed on January 24, 2014 and was denied by the judge). The Company filed its response on April 18, 2014. On May 2, 2014, the U.S. District Court denied this second motion. On May 9, 2014, Directors Ader, Chafetz, Chaltiel, Forman, Koppelman and Leven filed their motion to dismiss. On June 10, 2014, the plaintiff filed its opposition to these Directors motion to dismiss. On June 30, 2014, these Directors filed their reply. On July 30, 2014, the U.S. District Court granted the Company’s motion to dismiss the complaint, finding plaintiff had failed to allege stock ownership facts demonstrating standing to sue, with leave for plaintiff to amend his complaint to demonstrate stock ownership with more particularity. On August 29, 2014, the plaintiff filed an amended complaint and, on September 15, 2014, the served defendants filed their motions to dismiss the amended complaint. The plaintiff's opposition to the Company's motion to dismiss was filed on October 22, 2014, and to the individuals' motions to dismiss on October 29, 2014. Plaintiff also filed an opposition to Hipwell's motion on November 3, 2014, and opposed Mr. Adelson's joinder on December 9, 2014. The served defendants' reply briefs were filed on November 24, 25 and 26, 2014. On December 16, 2014, Mr. Adelson filed a reply brief. On March 3, 2015, the U.S. District Court denied, without prejudice, plaintiff's motion to substitute the estates of the late Messrs. Chaltiel and Schwartz. By order dated June 16, 2015, the U.S. District Court granted defendants’ motions to dismiss. The U.S. District Court did not dismiss the claims with prejudice, but it did not provide for further leave to amend and directed that the clerk close the case. On June 16, 2015, the U.S. District Court entered a “Judgment In A Civil Case” pursuant to the U.S District Court’s order. On June 29, 2015, plaintiff moved to re-open the dismissal order to request further leave to amend, arguing that no judgment was entered. On July 16, 2015, the Company filed an opposition to that motion. On July 27, 2015, plaintiff filed a reply in support of the motion. On July 30, 2015, the U.S. District Court denied the motion, affirming that it had entered a final judgment and had denied further leave to amend. On July16, 2015, the Company also filed a motion requesting the U.S. District Court make the findings regarding Federal Rules of Civil Procedure ("Rule 11") compliance required at the conclusion of an Exchange Act case, and to find that plaintiff's counsel violated Rule 11 by filing and defending the amended complaint. On August 27, 2015, plaintiff filed an opposition to the Company's motion. On September 21, 2015, the Company filed a reply in further support of the motion. On January 27, 2016, the judge denied the Company's request for sanctions. At this stage of the proceedings only a possible appeal by plaintiff is pending and management has determined that based on proceedings to date, it is currently unable to determine the probability of the outcome of this matter or the range of
119
LAS VEGAS SANDS CORP. AND SUBSIDIARIES
NOTES TO CONSOLIDATED FINANCIAL STATEMENTS - (CONTINUED)
reasonably possible loss, if any. The Company intends to defend this matter vigorously should plaintiff continue to pursue it.
On March 6, 2014, the Board of Directors of the Company received a shareholder demand letter from a purported shareholder named the John F. Scarpa Foundation ("Scarpa"). This letter recites substantially the same allegations as the complaint filed in the Sokolowski action and demands that the same claims be asserted by the Company, which was delivered to the Company by the same counsel representing Mr. Sokolowski. The Company responded, through its counsel, on March 26, 2014. Scarpa then sent a revised demand letter to the Board of Directors on March 31, 2014. The Company responded, through its counsel, on April 8, 2014. Scarpa then sent an additional demand letter dated August 14, 2014, to which the Company responded on August 22, 2014. This matter is in a preliminary stage and management has determined that based on proceedings to date, it is currently unable to determine the probability of the outcome of this matter, whether this matter will result in litigation or the range of reasonably possible loss, if any. The Company intends to defend this matter vigorously.
On January 19, 2012, Asian American Entertainment Corporation, Limited (“AAEC”) filed a claim (the “Macao action”) with the Macao Judicial Court (Tribunal Judicial de Base) against VML, LVS (Nevada) International Holdings, Inc. (“LVS (Nevada)”), Las Vegas Sands, LLC (“LVSLLC”) and VCR (collectively, the “Defendants”). The claim is for 3.0 billion patacas (approximately $375.8 million at exchange rates in effect on December 31, 2015) as compensation for damages resulting from the alleged breach of agreements entered into between AAEC and the Defendants for their joint presentation of a bid in response to the public tender held by the Macao government for the award of gaming concessions at the end of 2001. On July 4, 2012, the Defendants filed their defense to the Macao action with the Macao Judicial Court. AAEC then filed a reply that included several amendments to the original claim, although the amount of the claim was not amended. On January 4, 2013, the Defendants filed an amended defense to the amended claim with the Macao Judicial Court. On September 23, 2013, the three U.S. Defendants filed a motion with the Macao Second Instance Court, seeking recognition and enforcement of the U.S. Court of Appeals ruling in the Prior Action, referred to below, given on April 10, 2009, which partially dismissed AAEC’s claims against the three U.S. Defendants. On April 24, 2014, the Macao Judicial Court issued a Decision (Despacho Seneador) holding that AAEC’s claim against VML is unfounded and that VML be removed as a party to the proceedings, and that the claim should proceed exclusively against the three U.S. Defendants. On May 8, 2014, AAEC lodged an appeal against that decision. The Macao Judicial Court further held that the existence of the pending application for recognition and enforcement of the U.S. Court of Appeals ruling before the Macao Second Instance Court did not justify a stay of the proceedings against the three U.S. Defendants at the present time, although in principle an application for a stay of the proceedings against the three U.S. Defendants could be reviewed after the Macao Second Instance Court had issued its decision. On June 25, 2014, the Macao Second Instance Court delivered a decision, which gave formal recognition to and allowed enforcement in Macao of the judgment of the U.S. Court of Appeals, dismissing AAEC's claims against the U.S. Defendants. AAEC appealed against the recognition decision to the Macao Court of Final Appeal, which, on May 6, 2015, dismissed the appeal and held the U.S. judgment to be final and have preclusive effect. The Macao Court of Final Appeal's decision became final on May 21, 2015. On June 5, 2015, the three U.S. Defendants applied to the Macao Judicial Court to dismiss the claims against them as res judicata. AAEC filed its response to that application on June 30, 2015. The three U.S. Defendants filed their reply on July 23, 2015. On September 14, 2015, the Macao Judicial Court admitted two further legal opinions from Portuguese and U.S. law experts representing the U.S. Defendants and the Macao Judicial Court is now considering the res judicata issue. On March 25, 2015, application was made by the U.S. Defendants to the Macao Judicial Court to revoke the legal aid granted to AAEC, accompanied by a request for evidence taking from AAEC, relating to the fees and expenses that they incurred and paid in the U.S. subsequent action referred to below. The Macao Public Prosecutor has opposed the action on the ground of lack of evidence that AAEC's financial position has improved. No decision has been issued in respect to that application up to the present time. A complaint against AAEC's Macao lawyer arising from certain conduct in relation to recent U.S. proceedings was submitted to the Macao Lawyer's Association on October 19, 2015. On July 9, 2014, the plaintiff filed yet another action in the U.S. District Court against LVSC, LVSLLC, VCR, Sheldon G. Adelson, William P. Weidner, David Friedman and Does 1-50 for declaratory judgment, equitable accounting, misappropriation of trade secrets, breach of confidence and conversion based on a theory of copyright law. The claim is for $5.0 billion. On November 4, 2014, plaintiff finally effected notice
120
LAS VEGAS SANDS CORP. AND SUBSIDIARIES
NOTES TO CONSOLIDATED FINANCIAL STATEMENTS - (CONTINUED)
on the LVSC entities which was followed by a motion to dismiss by the U.S. Defendants on November 10, 2014. Plaintiff failed to timely respond and on December 2, 2014, the U.S. Defendants moved for immediate dismissal and sanctions against plaintiff and his counsel for bringing a frivolous lawsuit. On December 19, 2014, plaintiff filed an incomplete and untimely response, which was followed by plaintiff's December 27, 2014 notice of withdrawal of the lawsuit and the U.S. Defendants' December 29, 2014, reply in favor of sanctions and dismissal with prejudice. On August 31, 2015, the judge dismissed the U.S. action and the Defendants' sanctions motion. The Macao action is in a preliminary stage and management has determined that based on proceedings to date, it is currently unable to determine the probability of the outcome of this matter or the range of reasonably possible loss, if any. The Company intends to defend this matter vigorously.
As previously disclosed by the Company, on February 5, 2007, AAEC brought a similar claim (the “Prior Action”) in the U.S. District Court, against LVSI (now known as LVSLLC), VCR and Venetian Venture Development, LLC, which are subsidiaries of the Company, and William P. Weidner and David Friedman, who are former executives of the Company. The U.S. District Court entered an order on April 16, 2010, dismissing the Prior Action. On April 20, 2012, LVSLLC, VCR and LVS (Nevada) filed an injunctive action (the “Nevada Action”) against AAEC in the U.S. District Court seeking to enjoin AAEC from proceeding with the Macao Action based on AAEC’s filing, and the U.S. District Court’s dismissal, of the Prior Action. On June 14, 2012, the U.S. District Court issued an order that denied the motions requesting the Nevada Action, thereby effectively dismissing the Nevada Action.
The Company previously received subpoenas from the U.S. Attorney’s Office for the Central District of California (the “USAO”) requesting the production of documents relating to two prior customers of the Company’s properties. In August 2013, the USAO completed its investigation and entered into an agreement with the Company, whereby the Company agreed to voluntarily return $47.4 million to the U.S. Treasury, which represented funds received from or on behalf of one of its customers, and provide written reports to the USAO regarding certain of its casino-related activities. The amount was paid during the year ended December 31, 2013, and the matter has been closed.
On February 11, 2014, the Company disclosed that it was the victim of a sophisticated cyber-attack on its computer networks in the United States. As a result of this criminal attack, the U.S. government has commenced investigations into the source of the attack. In addition, the Company is working with internal and external forensic information technology systems experts in connection with this effort. As a result of the investigations and the Company’s efforts, which are ongoing, the Company has learned that certain customer and employee data was compromised at its Bethlehem facility and other data may have been stolen in the attack as well as that the attack may have destroyed certain other Company data. The Company is cooperating fully with the investigations. Based on the information available to date and the absence of claims asserted thus far, management is currently unable to determine the probability of the outcome of any matters relating to the cyber-attack, the extent of materiality or the range of reasonably possible loss, if any.
Macao Concession and Subconcession
On June 26, 2002, the Macao government granted a concession to operate casinos in Macao through June 26, 2022, subject to certain qualifications, to Galaxy Casino Company Limited (“Galaxy”), a consortium of Macao and Hong Kong-based investors. During December 2002, VML and Galaxy entered into a subconcession agreement that was recognized and approved by the Macao government and allows VML to develop and operate casino projects, including The Venetian Macao, Sands Cotai Central, the Plaza Casino at the Four Seasons Macao, Sands Macao and The Parisian Macao, once opened, separately from Galaxy. Beginning on December 26, 2017, the Macao government may redeem the subconcession agreement by providing the Company at least one year prior notice.
Under the subconcession, the Company is obligated to pay to the Macao government an annual premium with a fixed portion and a variable portion based on the number and type of gaming tables it employs and gaming machines it operates. The fixed portion of the premium is equal to 30.0 million patacas (approximately $3.8 million at exchange rates in effect on December 31, 2015). The variable portion is equal to 300,000 patacas per gaming table reserved exclusively for certain kinds of games or players, 150,000 patacas per gaming table not so reserved and 1,000 patacas per electrical or mechanical gaming machine, including slot machines (approximately $37,578, $18,789 and $125,
121
LAS VEGAS SANDS CORP. AND SUBSIDIARIES
NOTES TO CONSOLIDATED FINANCIAL STATEMENTS - (CONTINUED)
respectively, at exchange rates in effect on December 31, 2015), subject to a minimum of 45.0 million patacas (approximately $5.6 million at exchange rates in effect on December 31, 2015). The Company is also obligated to pay a special gaming tax of 35% of gross gaming revenues and applicable withholding taxes. The Company must also contribute 4% of its gross gaming revenue to utilities designated by the Macao government, a portion of which must be used for promotion of tourism in Macao. Based on the number and types of gaming tables employed and gaming machines in operation as of December 31, 2015, the Company was obligated under its subconcession to make minimum future payments of approximately $39.6 million in each of the next five years and approximately $59.4 million thereafter. These amounts are expected to increase when the Company opens The Parisian Macao, which is anticipated to open in the second half of 2016, subject to Macao government approval.
Currently, the gaming tax in Macao is calculated as a percentage of gross gaming revenue; however, unlike Nevada, gross gaming revenue does not include deductions for credit losses. As a result, if the Company extends credit to its customers in Macao and is unable to collect on the related receivables, the Company must pay taxes on its winnings from these customers even though it was unable to collect on the related receivables. If the laws are not changed, the Company’s business in Macao may not be able to realize the full benefits of extending credit to its customers.
Operating Leases
The Company leases real estate and various equipment under operating lease arrangements and is also party to several service agreements with terms in excess of one year. As of December 31, 2015, the Company was obligated under non-cancelable operating leases to make future minimum lease payments as follows (in thousands):
2016 | $ | 20,537 | |
2017 | 10,361 | ||
2018 | 8,045 | ||
2019 | 4,338 | ||
2020 | 4,432 | ||
Thereafter | 108,778 | ||
Total minimum payments | $ | 156,491 | |
Expenses incurred under operating lease agreements, including those that are short-term and variable-rate in nature, totaled $75.3 million, $67.4 million and $67.5 million for the years ended December 31, 2015, 2014 and 2013, respectively.
Other Ventures and Commitments
The Company has entered into employment agreements with six of its executive officers, with remaining terms of one to five years. As of December 31, 2015, the Company was obligated to make future payments of $10.2 million, $8.7 million, $8.4 million, $8.4 million and $1.9 million during the years ending December 31, 2016, 2017, 2018, 2019 and 2020, respectively.
During 2003, the Company entered into three lease termination and asset purchase agreements with The Grand Canal Shoppes tenants. In each case, the Company has obtained title to leasehold improvements and other fixed assets, which were originally purchased by The Grand Canal Shoppes tenants, and which have been recorded at estimated fair market value, which approximated the discounted present value of the Company’s obligation to the former tenants. As of December 31, 2015, the Company was obligated under the remaining agreement still in effect to make future payments of approximately $0.5 million in each of the next five years and $5.2 million thereafter.
122
LAS VEGAS SANDS CORP. AND SUBSIDIARIES
NOTES TO CONSOLIDATED FINANCIAL STATEMENTS - (CONTINUED)
Malls and Other
The Company leases space at several of its integrated resorts to various third parties. These leases are non-cancelable operating leases with lease periods that vary from 1 month to 21 years. The leases include minimum base rents with escalated contingent rent clauses. As of December 31, 2015, the future minimum rentals on these non-cancelable leases are as follows (in thousands, at exchange rates in effect on December 31, 2015):
2016 | $ | 431,797 | |
2017 | 356,856 | ||
2018 | 267,993 | ||
2019 | 198,955 | ||
2020 | 144,577 | ||
Thereafter | 240,402 | ||
Total minimum future rentals | $ | 1,640,580 | |
The total minimum future rentals do not include the escalated contingent rent clauses. Contingent rentals amounted to $56.5 million, $103.9 million and $129.1 million for the years ended December 31, 2015, 2014 and 2013, respectively.
Note 14 — Stock-Based Employee Compensation
The Company has two nonqualified stock option plans, the 2004 Plan and the SCL Equity Plan, which are described below. The plans provide for the granting of stock options pursuant to the applicable provisions of the Internal Revenue Code and regulations.
Las Vegas Sands Corp. 2004 Equity Award Plan
The Company adopted the 2004 Plan for grants of options to purchase its common stock. The purpose of the 2004 Plan is to give the Company a competitive edge in attracting, retaining and motivating employees, directors and consultants and to provide the Company with a stock plan providing incentives directly related to increases in its stockholder value. Any of the Company’s subsidiaries’ or affiliates’ employees, directors or officers and many of its consultants are eligible for awards under the 2004 Plan. The 2004 Plan provides for an aggregate of 26,344,000 shares of the Company’s common stock to be available for awards. The 2004 Plan originally had a term of ten years, but in June 2014, the Company's Board of Directors approved an amendment to the 2004 Plan, extending the term to December 2019. The compensation committee may grant awards of nonqualified stock options, incentive (qualified) stock options, stock appreciation rights, restricted stock awards, restricted stock units, stock bonus awards, performance compensation awards or any combination of the foregoing. As of December 31, 2015, there were 4,379,164 shares available for grant under the 2004 Plan.
Stock option awards are granted with an exercise price equal to the fair market value (as defined in the 2004 Plan) of the Company’s stock on the date of grant. The outstanding stock options generally vest over four years and have ten-year contractual terms. Compensation cost for all stock option grants, which all have graded vesting, is net of estimated forfeitures and is recognized on a straight-line basis over the awards’ respective requisite service periods. The Company estimates the fair value of stock options using the Black-Scholes option-pricing model. Expected volatilities are based on the Company’s historical volatility for a period equal to the expected life of the stock options. The expected option life is based on the contractual term of the option as well as historical exercise and forfeiture behavior. The risk-free interest rate for periods equal to the expected term of the stock option is based on the U.S. Treasury yield curve in effect at the time of grant. The expected dividend yield is based on the estimate of annual dividends expected to be paid at the time of the grant.
123
LAS VEGAS SANDS CORP. AND SUBSIDIARIES
NOTES TO CONSOLIDATED FINANCIAL STATEMENTS - (CONTINUED)
Sands China Ltd. Equity Award Plan
The Company’s subsidiary, SCL, adopted an equity award plan (the “SCL Equity Plan”) for grants of options to purchase ordinary shares of SCL. The purpose of the SCL Equity Plan is to give SCL a competitive edge in attracting, retaining and motivating employees, directors and consultants and to provide SCL with a stock plan providing incentives directly related to increases in its stockholder value. Subject to certain criteria as defined in the SCL Equity Plan, SCL’s subsidiaries’ or affiliates’ employees, directors or officers and many of its consultants are eligible for awards under the SCL Equity Plan. The SCL Equity Plan provides for an aggregate of 804,786,508 shares of SCL’s common stock to be available for awards. The SCL Equity Plan has a term of ten years and no further awards may be granted after the expiration of the term. SCL’s remuneration committee may grant awards of stock options, stock appreciation rights, restricted stock awards, restricted stock units, stock bonus awards, performance compensation awards or any combination of the foregoing. As of December 31, 2015, there were 756,474,620 shares available for grant under the SCL Equity Plan.
Stock option awards are granted with an exercise price not less than (i) the closing price of SCL’s stock on the date of grant or (ii) the average closing price of SCL’s stock for the five business days immediately preceding the date of grant. The outstanding stock options generally vest over four years and have ten-year contractual terms. Compensation cost for all stock option grants, which all have graded vesting, is net of estimated forfeitures and is recognized on a straight-line basis over the awards’ respective requisite service periods. SCL estimates the fair value of stock options using the Black-Scholes option-pricing model. For stock options granted subsequent to December 31, 2014, expected volatilities are based on SCL's historical volatility for a period equal to the expected life of the stock options. For stock options granted on or before December 31, 2014, expected volatilities are based on a combination of SCL’s historical volatilities and the historical volatilities from a selection of companies from SCL’s peer group due to SCL’s lack of historical information. The expected option life is based on the contractual term of the option as well as historical exercise and forfeiture behavior. The risk-free interest rate for periods equal to the expected term of the stock option is based on the Hong Kong Government Bond rate in effect at the time of the grant for stock options granted subsequent to March 31, 2015 and based on the Hong Kong Exchange Fund Note rate in effect at the time of the grant for stock options granted on or before March 31, 2015. The expected dividend yield is based on the estimate of annual dividends expected to be paid at the time of the grant.
Stock-Based Employee Compensation Activity
The fair value of each option grant was estimated on the grant date using the Black-Scholes option-pricing model with the following weighted average assumptions:
Year Ended December 31, | ||||||||
2015 | 2014 | 2013 | ||||||
LVSC 2004 Plan: | ||||||||
Weighted average volatility | 37.3 | % | 56.5 | % | 94.8 | % | ||
Expected term (in years) | 5.8 | 6.0 | 5.5 | |||||
Risk-free rate | 1.3 | % | 1.7 | % | 1.3 | % | ||
Expected dividends | 4.7 | % | 4.6 | % | 2.5 | % | ||
SCL Equity Plan: | ||||||||
Weighted average volatility | 40.4 | % | 65.1 | % | 67.7 | % | ||
Expected term (in years) | 4.0 | 6.3 | 6.3 | |||||
Risk-free rate | 0.7 | % | 1.3 | % | 0.7 | % | ||
Expected dividends | 5.6 | % | 3.0 | % | 3.1 | % | ||
124
LAS VEGAS SANDS CORP. AND SUBSIDIARIES
NOTES TO CONSOLIDATED FINANCIAL STATEMENTS - (CONTINUED)
A summary of the stock option activity for the Company’s equity award plans for the year ended December 31, 2015, is presented below:
Shares | Weighted Average Exercise Price | Weighted Average Remaining Contractual Life (Years) | Aggregate Intrinsic Value | |||||||||
LVSC 2004 Plan: | ||||||||||||
Outstanding as of January 1, 2015 | 6,964,169 | $ | 58.25 | |||||||||
Granted | 441,809 | 55.35 | ||||||||||
Exercised | (688,743 | ) | 19.33 | |||||||||
Forfeited | (267,600 | ) | 66.84 | |||||||||
Outstanding as of December 31, 2015 | 6,449,635 | $ | 61.86 | 5.34 | $ | 11,074,005 | ||||||
Exercisable as of December 31, 2015 | 3,725,000 | $ | 65.92 | 2.80 | $ | 10,995,965 | ||||||
SCL Equity Plan: | ||||||||||||
Outstanding as of January 1, 2015 | 23,249,696 | $ | 5.50 | |||||||||
Granted | 6,744,000 | 3.92 | ||||||||||
Exercised | (1,599,300 | ) | 2.21 | |||||||||
Forfeited | (2,920,600 | ) | 6.49 | |||||||||
Outstanding as of December 31, 2015 | 25,473,796 | $ | 5.17 | 7.97 | $ | 3,473,098 | ||||||
Exercisable as of December 31, 2015 | 9,062,496 | $ | 4.47 | 6.71 | $ | 3,459,473 | ||||||
125
LAS VEGAS SANDS CORP. AND SUBSIDIARIES
NOTES TO CONSOLIDATED FINANCIAL STATEMENTS - (CONTINUED)
A summary of the unvested restricted stock and stock units under the Company’s equity award plans for the year ended December 31, 2015, is presented below:
Shares | Weighted Average Grant Date Fair Value | |||||
LVSC 2004 Plan: | ||||||
Unvested Restricted Stock | ||||||
Balance as of January 1, 2015 | 508,805 | $ | 51.15 | |||
Granted | 49,438 | 59.57 | ||||
Vested | (364,657 | ) | 52.18 | |||
Forfeited | (2,000 | ) | 47.14 | |||
Balance as of December 31, 2015 | 191,586 | $ | 51.42 | |||
Unvested Restricted Stock Units | ||||||
Balance as of January 1, 2015 | 159,150 | $ | 55.98 | |||
Granted | — | — | ||||
Vested | (34,750 | ) | 46.83 | |||
Forfeited | (22,500 | ) | 51.70 | |||
Balance as of December 31, 2015 | 101,900 | $ | 60.05 | |||
SCL Equity Plan: | ||||||
Unvested Restricted Stock Units, Equity-Settled | ||||||
Balance as of January 1, 2015 | 2,971,200 | $ | 6.66 | |||
Granted | 118,800 | 4.90 | ||||
Vested | — | — | ||||
Modified to cash-settled | (1,603,849 | ) | 5.94 | |||
Forfeited | (83,820 | ) | 7.37 | |||
Balance as of December 31, 2015 | 1,402,331 | $ | 7.29 | |||
Unvested Restricted Stock Units, Cash-Settled | ||||||
Balance as of January 1, 2015 | — | $ | — | |||
Granted | — | — | ||||
Modified from equity-settled | 1,603,849 | 5.94 | ||||
Vested | (805,475 | ) | 5.99 | |||
Forfeited | — | — | ||||
Balance as of December 31, 2015 | 798,374 | $ | 5.89 | |||
As a result of SCL cash-settling and planning to cash-settle certain future unvested restricted share units on their vesting dates, 1,603,849 outstanding restricted stock units under the SCL Equity Plan were modified from equity awards to cash-settled liability awards during the year ended December 31, 2015. The modification affected four employees and resulted in no additional compensation expense. The fair value of these awards is remeasured each reporting period until the vesting dates. Upon settlement, SCL will pay the grantees an amount in cash calculated based on the higher of (i) the closing price of SCL's shares on the vesting date, and (ii) the average closing price of SCL's shares for the five trading days immediately preceding the vesting date. During the year ended December 31, 2015, SCL paid $3.3 million to settle vested restricted share units that were previously classified as equity awards. The accrued liability associated with these cash-settled restricted stock units was $1.9 million as of December 31, 2015.
As of December 31, 2015, under the 2004 Plan there was $33.4 million of unrecognized compensation cost, net of estimated forfeitures of 8.0% per year, related to unvested stock options and there was $4.7 million of unrecognized compensation cost, net of estimated forfeitures of 8.0% per year, related to unvested restricted stock and stock units. The stock option and restricted stock and stock unit costs are expected to be recognized over a weighted average period of 3.8 years and 1.1 years, respectively.
126
LAS VEGAS SANDS CORP. AND SUBSIDIARIES
NOTES TO CONSOLIDATED FINANCIAL STATEMENTS - (CONTINUED)
As of December 31, 2015, under the SCL Equity Plan there was $19.3 million of unrecognized compensation cost, net of estimated forfeitures of 9.5% per year, related to unvested stock options and there was $6.1 million of unrecognized compensation cost related to unvested restricted stock units. The stock option and restricted stock unit costs are expected to be recognized over a weighted average period of 2.9 years and 1.8 years, respectively.
The stock-based compensation activity for the 2004 Plan and SCL Equity Plan is as follows for the three years ended December 31, 2015 (in thousands, except weighted average grant date fair values):
Year Ended December 31, | |||||||||||
2015 | 2014 | 2013 | |||||||||
Compensation expense: | |||||||||||
Stock options | $ | 25,507 | $ | 24,964 | $ | 32,549 | |||||
Restricted stock and stock units | 20,297 | 23,094 | 20,828 | ||||||||
$ | 45,804 | $ | 48,058 | $ | 53,377 | ||||||
Income tax benefit recognized in the consolidated statements of operations | $ | 7,163 | $ | 6,743 | $ | — | |||||
Compensation cost capitalized as part of property and equipment | $ | 335 | $ | 1,437 | $ | 941 | |||||
LVSC 2004 Plan: | |||||||||||
Stock options granted | 442 | 2,359 | 288 | ||||||||
Weighted average grant date fair value | $ | 11.97 | $ | 20.25 | $ | 35.76 | |||||
Restricted stock granted | 49 | 31 | 47 | ||||||||
Weighted average grant date fair value | $ | 59.57 | $ | 75.46 | $ | 54.72 | |||||
Restricted stock units granted | — | 10 | 123 | ||||||||
Weighted average grant date fair value | $ | — | $ | 68.30 | $ | 58.82 | |||||
Stock options exercised: | |||||||||||
Intrinsic value | $ | 24,538 | $ | 105,386 | $ | 129,149 | |||||
Cash received | $ | 13,313 | $ | 44,973 | $ | 50,223 | |||||
Tax benefit realized for tax deductions from stock-based compensation | $ | 648 | $ | — | $ | — | |||||
SCL Equity Plan: | |||||||||||
Stock options granted | 6,744 | 11,661 | 4,537 | ||||||||
Weighted average grant date fair value | $ | 0.76 | $ | 3.40 | $ | 2.63 | |||||
Equity-settled restricted stock units granted | 119 | 363 | 2,608 | ||||||||
Weighted average grant date fair value | $ | 4.90 | $ | 6.81 | $ | 6.64 | |||||
Stock options exercised: | |||||||||||
Intrinsic value | $ | 3,253 | $ | 19,282 | $ | 25,786 | |||||
Cash received | $ | 3,563 | $ | 10,677 | $ | 19,373 | |||||
Tax benefit realized for tax deductions from stock-based compensation | $ | — | $ | — | $ | — | |||||
Note 15 — Employee Benefit Plans
The Company is self-insured for health care and workers compensation benefits for its U.S. employees. The liability for claims filed and estimates of claims incurred but not filed is included in other accrued liabilities in the accompanying consolidated balance sheets.
Participation in the VCR 401(k) employee savings plan is available for all eligible employees after a three-month probation period. The savings plan allows participants to defer, on a pre-tax basis, a portion of their salary and accumulate tax-deferred earnings as a retirement fund. The Company matches 150% of the first $390 of employee contributions and 50% of employee contributions in excess of $390 up to a maximum of 5% of participating employee’s eligible
127
LAS VEGAS SANDS CORP. AND SUBSIDIARIES
NOTES TO CONSOLIDATED FINANCIAL STATEMENTS - (CONTINUED)
gross wages. For the years ended December 31, 2015, 2014 and 2013, the Company’s matching contributions under the savings plan were $9.5 million, $8.7 million and $8.2 million, respectively.
Participation in VML’s provident retirement fund is available for all permanent employees after a three-month probation period. VML contributes 5% of each employee’s basic salary to the fund and the employee is eligible to receive, upon resignation, 30% of these contributions after working for three consecutive years, gradually increasing to 100% after working for ten years. For the years ended December 31, 2015, 2014 and 2013, VML’s contributions into the provident fund were $33.5 million, $31.4 million and $28.6 million, respectively.
Participation in MBS’s provident retirement fund is available for all permanent employees that are Singapore residents upon joining the Company. As of December 31, 2015, MBS contributes 17% of each employee’s basic salary to the fund, subject to certain caps as mandated by local regulations. The employee is eligible to receive funds upon reaching the retirement age or upon meeting requirements set up by local regulations. For the years ended December 31, 2015, 2014 and 2013, MBS’s contributions into the provident fund were $47.3 million, $44.9 million and $40.4 million, respectively.
Note 16 — Related Party Transactions
During the years ended December 31, 2015, 2014 and 2013, the Principal Stockholder and his family purchased certain services from the Company including lodging, banquet services and the use of Company personnel for approximately $2.1 million, $1.2 million and $1.7 million, respectively. During the years ended December 31, 2015, 2014 and 2013, the Company incurred and made payments of $2.3 million, $1.8 million and $1.1 million, respectively, for food and beverage services provided by restaurants that the Principal Stockholder has an ownership interest in.
During the years ended December 31, 2015, 2014 and 2013, the Company incurred and paid certain expenses totaling $3.5 million, $5.7 million and $11.4 million, respectively, to its Principal Stockholder related to the Company’s use of his personal aircraft for business purposes. In addition, during the years ended December 31, 2015, 2014 and 2013, the Company charged and received from the Principal Stockholder $19.9 million, $18.3 million and $17.6 million, respectively, related to aviation costs incurred by the Company for the Principal Stockholder’s use of Company aviation personnel and assets for personal purposes.
During the years ended December 31, 2015, 2014 and 2013, the Company charged and received from one of its executive officers approximately $7,000, $0.3 million and $0.1 million, respectively, related to aviation costs incurred by the Company for the executive’s use of Company aviation personnel and assets for personal purposes.
During the year ended December 31, 2003, the Company purchased the lease interest and assets of Carnevale Coffee Bar, LLC, in which the Principal Stockholder is a partner, for $3.1 million, payable in installments of $0.6 million during 2003, and approximately $0.3 million annually over 10 years, beginning in 2004 through September 1, 2013.
Note 17 — Segment Information
The Company’s principal operating and developmental activities occur in three geographic areas: Macao, Singapore and the U.S. The Company reviews the results of operations for each of its operating segments: The Venetian Macao; Sands Cotai Central; Four Seasons Macao; Sands Macao; Other Asia (comprised primarily of the Company’s ferry operations and various other operations that are ancillary to the Company’s properties in Macao); Marina Bay Sands; The Venetian Las Vegas, which includes the Sands Expo Center; The Palazzo; and Sands Bethlehem. The Venetian Las Vegas and The Palazzo operating segments are managed as a single integrated resort and have been aggregated as one reportable segment (the “Las Vegas Operating Properties”), considering their similar economic characteristics, types of customers, types of services and products, the regulatory business environment of the operations within each segment and the Company’s organizational and management reporting structure. The Company also reviews construction and development activities for each of its primary projects under development, in addition to its reportable segments noted above. The Company’s primary projects under development are The Parisian Macao, the remainder of
128
LAS VEGAS SANDS CORP. AND SUBSIDIARIES
NOTES TO CONSOLIDATED FINANCIAL STATEMENTS - (CONTINUED)
Sands Cotai Central and the Four Seasons Apartments in Macao, and the Las Vegas Condo Tower (which construction currently is suspended and is included in Corporate and Other) in the U.S. The corporate activities of the Company are also included in Corporate and Other. The Company’s segment information is as follows as of and for the years ended December 31, 2015, 2014 and 2013 (in thousands):
Year Ended December 31, | |||||||||||
2015 | 2014 | 2013 | |||||||||
Net Revenues | |||||||||||
Macao: | |||||||||||
The Venetian Macao | $ | 2,986,851 | $ | 4,040,681 | $ | 3,851,230 | |||||
Sands Cotai Central | 2,181,877 | 3,133,864 | 2,698,430 | ||||||||
Four Seasons Macao | 691,037 | 1,107,779 | 1,065,405 | ||||||||
Sands Macao | 879,563 | 1,174,795 | 1,237,016 | ||||||||
Other Asia | 159,798 | 151,778 | 139,572 | ||||||||
6,899,126 | 9,608,897 | 8,991,653 | |||||||||
Marina Bay Sands | 2,952,400 | 3,214,210 | 2,968,366 | ||||||||
United States: | |||||||||||
Las Vegas Operating Properties | 1,508,006 | 1,478,769 | 1,518,024 | ||||||||
Sands Bethlehem | 549,109 | 504,237 | 496,738 | ||||||||
2,057,115 | 1,983,006 | 2,014,762 | |||||||||
Intersegment eliminations | (220,180 | ) | (222,264 | ) | (204,896 | ) | |||||
Total net revenues | $ | 11,688,461 | $ | 14,583,849 | $ | 13,769,885 | |||||
Year Ended December 31, | |||||||||||
2015 | 2014 | 2013 | |||||||||
Intersegment Revenues | |||||||||||
Macao: | |||||||||||
The Venetian Macao | $ | 6,352 | $ | 5,591 | $ | 5,296 | |||||
Sands Cotai Central | 402 | 301 | 356 | ||||||||
Other Asia | 39,436 | 42,330 | 34,120 | ||||||||
46,190 | 48,222 | 39,772 | |||||||||
Marina Bay Sands | 9,739 | 12,209 | 9,548 | ||||||||
Las Vegas Operating Properties | 164,251 | 161,833 | 155,576 | ||||||||
Total intersegment revenues | $ | 220,180 | $ | 222,264 | $ | 204,896 | |||||
129
LAS VEGAS SANDS CORP. AND SUBSIDIARIES
NOTES TO CONSOLIDATED FINANCIAL STATEMENTS - (CONTINUED)
Year Ended December 31, | |||||||||||
2015 | 2014 | 2013 | |||||||||
Adjusted Property EBITDA(1) | |||||||||||
Macao: | |||||||||||
The Venetian Macao | $ | 1,078,590 | $ | 1,546,323 | $ | 1,499,937 | |||||
Sands Cotai Central | 651,524 | 1,001,487 | 739,723 | ||||||||
Four Seasons Macao | 243,390 | 374,899 | 305,040 | ||||||||
Sands Macao | 226,094 | 338,590 | 362,858 | ||||||||
Other Asia | 22,833 | 3,493 | (3,855 | ) | |||||||
2,222,431 | 3,264,792 | 2,903,703 | |||||||||
Marina Bay Sands | 1,506,486 | 1,723,147 | 1,384,576 | ||||||||
United States: | |||||||||||
Las Vegas Operating Properties | 305,469 | 313,913 | 351,739 | ||||||||
Sands Bethlehem | 135,844 | 120,491 | 123,337 | ||||||||
441,313 | 434,404 | 475,076 | |||||||||
Total adjusted property EBITDA | 4,170,230 | 5,422,343 | 4,763,355 | ||||||||
Other Operating Costs and Expenses | |||||||||||
Stock-based compensation | (21,909 | ) | (28,769 | ) | (30,053 | ) | |||||
Legal settlement | — | — | (47,400 | ) | |||||||
Corporate | (176,169 | ) | (174,750 | ) | (189,535 | ) | |||||
Pre-opening | (47,509 | ) | (26,230 | ) | (13,339 | ) | |||||
Development | (10,372 | ) | (14,325 | ) | (15,809 | ) | |||||
Depreciation and amortization | (998,919 | ) | (1,031,589 | ) | (1,007,468 | ) | |||||
Amortization of leasehold interests in land | (38,645 | ) | (40,598 | ) | (40,352 | ) | |||||
Loss on disposal of assets | (35,232 | ) | (6,856 | ) | (11,156 | ) | |||||
Operating income | 2,841,475 | 4,099,226 | 3,408,243 | ||||||||
Other Non-Operating Costs and Expenses | |||||||||||
Interest income | 15,085 | 25,643 | 16,337 | ||||||||
Interest expense, net of amounts capitalized | (265,220 | ) | (274,181 | ) | (271,211 | ) | |||||
Other income | 30,542 | 1,965 | 4,321 | ||||||||
Loss on modification or early retirement of debt | — | (19,942 | ) | (14,178 | ) | ||||||
Income tax expense | (236,185 | ) | (244,640 | ) | (188,836 | ) | |||||
Net income | $ | 2,385,697 | $ | 3,588,071 | $ | 2,954,676 | |||||
_________________________
(1) | Adjusted property EBITDA, which is a non-GAAP financial measure, is net income before intersegment royalty fees, stock-based compensation expense, legal settlement expense (see "— Note 13 — Commitments and Contingencies — Litigation"), corporate expense, pre-opening expense, development expense, depreciation and amortization, amortization of leasehold interests in land, loss on disposal of assets, interest, other income, loss on modification or early retirement of debt and income taxes. Adjusted property EBITDA is used by management as the primary measure of operating performance of the Company’s properties and to compare the operating performance of the Company’s properties with that of its competitors. |
130
LAS VEGAS SANDS CORP. AND SUBSIDIARIES
NOTES TO CONSOLIDATED FINANCIAL STATEMENTS - (CONTINUED)
Year Ended December 31, | |||||||||||
2015 | 2014 | 2013 | |||||||||
Capital Expenditures | |||||||||||
Corporate and Other | $ | 10,518 | $ | 32,030 | $ | 41,152 | |||||
Macao: | |||||||||||
The Venetian Macao | 82,402 | 125,293 | 96,172 | ||||||||
Sands Cotai Central | 403,149 | 345,748 | 262,540 | ||||||||
Four Seasons Macao | 14,937 | 41,440 | 15,003 | ||||||||
Sands Macao | 21,622 | 40,402 | 26,491 | ||||||||
Other Asia | 3,922 | 2,617 | 1,319 | ||||||||
The Parisian Macao | 766,674 | 390,582 | 212,842 | ||||||||
1,292,706 | 946,082 | 614,367 | |||||||||
Marina Bay Sands | 129,738 | 79,612 | 142,706 | ||||||||
United States: | |||||||||||
Las Vegas Operating Properties | 77,556 | 108,666 | 93,191 | ||||||||
Sands Bethlehem | 18,124 | 12,266 | 6,695 | ||||||||
95,680 | 120,932 | 99,886 | |||||||||
Total capital expenditures | $ | 1,528,642 | $ | 1,178,656 | $ | 898,111 | |||||
December 31, | |||||||||||
2015 | 2014 | 2013 | |||||||||
Total Assets | |||||||||||
Corporate and Other | $ | 463,339 | $ | 558,753 | $ | 630,673 | |||||
Macao: | |||||||||||
The Venetian Macao | 2,999,873 | 3,900,921 | 4,367,533 | ||||||||
Sands Cotai Central | 4,400,465 | 4,761,907 | 4,669,358 | ||||||||
Four Seasons Macao | 1,038,573 | 1,157,502 | 1,273,654 | ||||||||
Sands Macao | 373,113 | 414,689 | 383,444 | ||||||||
Other Asia | 288,178 | 304,826 | 328,332 | ||||||||
The Parisian Macao | 1,648,562 | 805,220 | 376,014 | ||||||||
Other Development Projects | 82 | 91 | 169 | ||||||||
10,748,846 | 11,345,156 | 11,398,504 | |||||||||
Marina Bay Sands | 5,556,299 | 6,106,397 | 6,354,231 | ||||||||
United States: | |||||||||||
Las Vegas Operating Properties | 3,525,881 | 3,630,505 | 3,653,127 | ||||||||
Sands Bethlehem | 693,056 | 713,236 | 687,729 | ||||||||
4,218,937 | 4,343,741 | 4,340,856 | |||||||||
Total assets | $ | 20,987,421 | $ | 22,354,047 | $ | 22,724,264 | |||||
131
LAS VEGAS SANDS CORP. AND SUBSIDIARIES
NOTES TO CONSOLIDATED FINANCIAL STATEMENTS - (CONTINUED)
December 31, | |||||||||||
2015 | 2014 | 2013 | |||||||||
Total Long-Lived Assets | |||||||||||
Corporate and Other | $ | 334,540 | $ | 357,071 | $ | 388,448 | |||||
Macao: | |||||||||||
The Venetian Macao | 1,795,042 | 1,893,032 | 1,925,040 | ||||||||
Sands Cotai Central | 3,943,966 | 3,814,699 | 3,772,095 | ||||||||
Four Seasons Macao | 903,649 | 932,034 | 928,396 | ||||||||
Sands Macao | 266,399 | 286,640 | 279,395 | ||||||||
Other Asia | 167,540 | 177,335 | 189,136 | ||||||||
The Parisian Macao | 1,645,881 | 804,328 | 376,014 | ||||||||
8,722,477 | 7,908,068 | 7,470,076 | |||||||||
Marina Bay Sands | 4,476,064 | 4,874,263 | 5,277,126 | ||||||||
United States: | |||||||||||
Las Vegas Operating Properties | 2,909,294 | 3,024,380 | 3,073,793 | ||||||||
Sands Bethlehem | 551,395 | 561,782 | 578,329 | ||||||||
3,460,689 | 3,586,162 | 3,652,122 | |||||||||
Total long-lived assets | $ | 16,993,770 | $ | 16,725,564 | $ | 16,787,772 | |||||
Note 18 — Condensed Consolidating Financial Information
LVSLLC, as the issuer and primary obligor of the 2013 U.S. Credit Facility, VCR, Venetian Marketing, Inc., Sands Expo & Convention Center, Inc. and Sands Pennsylvania, Inc. (collectively, the “Restricted Subsidiaries”) are all guarantors under the 2013 U.S. Credit Facility. The noncontrolling interest amounts included in the Restricted Subsidiaries’ condensed consolidating financial information are related to non-voting preferred stock of one of the subsidiaries held by third parties.
In February 2008, all of the capital stock of Phase II Mall Subsidiary, LLC (a subsidiary of VCR) was sold to GGP; however, the sale is not complete from an accounting perspective due to the Company’s continuing involvement in the transaction related to the participation in certain potential future revenues earned by GGP. Certain of the assets, liabilities and operating results related to the ownership and operation of the mall by Phase II Mall Subsidiary, LLC subsequent to the sale will continue to be accounted for by the Restricted Subsidiaries, and therefore are included in the “Restricted Subsidiaries” columns in the following condensed consolidating financial information. As a result, net liabilities of $48.7 million (consisting of $268.4 million of liabilities, comprised of deferred proceeds from the sale, partially offset by $219.7 million of property and equipment) and $40.3 million (consisting of $268.8 million of liabilities, comprised primarily of deferred proceeds from the sale, partially offset by $228.5 million of property and equipment) as of December 31, 2015 and 2014, respectively, and a net loss (consisting primarily of depreciation expense) of $9.4 million, $11.8 million and $12.9 million for the years ended December 31, 2015, 2014 and 2013, respectively, related to the mall and are being accounted for by the Restricted Subsidiaries. These balances and amounts are not collateral for the 2013 U.S. Credit Facility.
Additionally, LVSC is a holding company and, as a result, its ability to pay dividends is dependent on its subsidiaries’ ability to provide funds to it. Restrictions imposed by the Company’s U.S., Macao and Singapore credit facilities may restrict the Company’s key subsidiaries holding a majority of the consolidated group’s total assets from making dividends or distributions, subject to certain exceptions as defined in the agreements, unless certain financial and non-financial criteria have been satisfied. LVSC received cash dividends of $2.36 billion, $3.41 billion and $1.84 billion from its subsidiaries during the years ended December 31, 2015, 2014 and 2013, respectively.
132
LAS VEGAS SANDS CORP. AND SUBSIDIARIES
NOTES TO CONSOLIDATED FINANCIAL STATEMENTS - (CONTINUED)
The following condensed consolidating financial information of LVSC, a non-guarantor parent; the Restricted Subsidiaries, including LVSLLC as the issuer; and the non-restricted subsidiaries on a combined basis as of December 31, 2015 and 2014, and for each of the three years in the period ended December 31, 2015, is being presented in order to meet the reporting requirements under the 2013 U.S. Credit Facility, and is not intended to comply with SEC Regulation S-X 3-10 (in thousands):
CONDENSED CONSOLIDATING BALANCE SHEETS
December 31, 2015
LVSC (Non-Guarantor Parent) | Restricted Subsidiaries | Non-Restricted Subsidiaries | Consolidating/ Eliminating Entries | Total | |||||||||||||||
Cash and cash equivalents | $ | 64,817 | $ | 359,467 | $ | 1,755,206 | $ | — | $ | 2,179,490 | |||||||||
Restricted cash and cash equivalents | — | — | 7,901 | — | 7,901 | ||||||||||||||
Intercompany receivables | 665,285 | 264,959 | — | (930,244 | ) | — | |||||||||||||
Intercompany notes receivables | — | — | 378,612 | (378,612 | ) | — | |||||||||||||
Accounts receivable, net | 6,640 | 263,705 | 997,503 | — | 1,267,848 | ||||||||||||||
Inventories | 8,024 | 11,600 | 22,949 | — | 42,573 | ||||||||||||||
Prepaid expenses and other | 23,659 | 13,151 | 74,661 | (33 | ) | 111,438 | |||||||||||||
Total current assets | 768,425 | 912,882 | 3,236,832 | (1,308,889 | ) | 3,609,250 | |||||||||||||
Property and equipment, net | 113,817 | 2,867,664 | 12,750,157 | — | 15,731,638 | ||||||||||||||
Investments in subsidiaries | 6,464,794 | 4,804,582 | — | (11,269,376 | ) | — | |||||||||||||
Deferred financing costs, net | 65 | 19,569 | 150,059 | — | 169,693 | ||||||||||||||
Intercompany receivables | 215 | 17,476 | — | (17,691 | ) | — | |||||||||||||
Intercompany notes receivable | — | 1,446,464 | — | (1,446,464 | ) | — | |||||||||||||
Deferred income taxes, net | — | — | 80,779 | (57,098 | ) | 23,681 | |||||||||||||
Leasehold interests in land, net | — | — | 1,262,132 | — | 1,262,132 | ||||||||||||||
Intangible assets, net | 690 | — | 70,896 | — | 71,586 | ||||||||||||||
Other assets, net | 380 | 21,903 | 97,158 | — | 119,441 | ||||||||||||||
Total assets | $ | 7,348,386 | $ | 10,090,540 | $ | 17,648,013 | $ | (14,099,518 | ) | $ | 20,987,421 | ||||||||
Accounts payable | $ | 5,807 | $ | 28,268 | $ | 76,333 | $ | — | $ | 110,408 | |||||||||
Construction payables | 124 | 1,179 | 362,833 | — | 364,136 | ||||||||||||||
Intercompany payables | — | 572,128 | 358,116 | (930,244 | ) | — | |||||||||||||
Intercompany notes payable | 378,612 | — | — | (378,612 | ) | — | |||||||||||||
Accrued interest payable | 79 | 1,290 | 494 | — | 1,863 | ||||||||||||||
Other accrued liabilities | 34,458 | 220,978 | 1,438,869 | — | 1,694,305 | ||||||||||||||
Income taxes payable | 38 | — | 198,051 | (33 | ) | 198,056 | |||||||||||||
Current maturities of long-term debt | 3,688 | 24,020 | 67,659 | — | 95,367 | ||||||||||||||
Total current liabilities | 422,806 | 847,863 | 2,502,355 | (1,308,889 | ) | 2,464,135 | |||||||||||||
Other long-term liabilities | 1,610 | 9,780 | 101,978 | — | 113,368 | ||||||||||||||
Intercompany payables | — | — | 17,691 | (17,691 | ) | — | |||||||||||||
Intercompany notes payable | — | — | 1,446,464 | (1,446,464 | ) | — | |||||||||||||
Deferred income taxes | 50,934 | 26,992 | 180,906 | (57,098 | ) | 201,734 | |||||||||||||
Deferred amounts related to mall transactions | — | 417,552 | — | — | 417,552 | ||||||||||||||
Long-term debt | 56,295 | 2,818,239 | 6,498,111 | — | 9,372,645 | ||||||||||||||
Total liabilities | 531,645 | 4,120,426 | 10,747,505 | (2,830,142 | ) | 12,569,434 | |||||||||||||
Total Las Vegas Sands Corp. stockholders’ equity | 6,816,741 | 5,969,709 | 5,299,667 | (11,269,376 | ) | 6,816,741 | |||||||||||||
Noncontrolling interests | — | 405 | 1,600,841 | — | 1,601,246 | ||||||||||||||
Total equity | 6,816,741 | 5,970,114 | 6,900,508 | (11,269,376 | ) | 8,417,987 | |||||||||||||
Total liabilities and equity | $ | 7,348,386 | $ | 10,090,540 | $ | 17,648,013 | $ | (14,099,518 | ) | $ | 20,987,421 | ||||||||
133
LAS VEGAS SANDS CORP. AND SUBSIDIARIES
NOTES TO CONSOLIDATED FINANCIAL STATEMENTS - (CONTINUED)
CONDENSED CONSOLIDATING BALANCE SHEETS
December 31, 2014
LVSC (Non-Guarantor parent) | Restricted Subsidiaries | Non-Restricted Subsidiaries | Consolidating/ Eliminating Entries | Total | |||||||||||||||
Cash and cash equivalents | $ | 114,125 | $ | 345,399 | $ | 3,046,795 | $ | — | $ | 3,506,319 | |||||||||
Restricted cash and cash equivalents | — | — | 6,566 | — | 6,566 | ||||||||||||||
Intercompany receivables | 431,754 | 255,371 | — | (687,125 | ) | — | |||||||||||||
Intercompany notes receivable | — | — | 370,836 | (370,836 | ) | — | |||||||||||||
Accounts receivable, net | 15,144 | 270,838 | 1,224,790 | — | 1,510,772 | ||||||||||||||
Inventories | 5,238 | 10,745 | 25,691 | — | 41,674 | ||||||||||||||
Prepaid expenses and other | 26,210 | 11,889 | 87,530 | (461 | ) | 125,168 | |||||||||||||
Total current assets | 592,471 | 894,242 | 4,762,208 | (1,058,422 | ) | 5,190,499 | |||||||||||||
Property and equipment, net | 130,155 | 2,979,485 | 12,262,834 | — | 15,372,474 | ||||||||||||||
Investments in subsidiaries | 7,010,357 | 5,864,848 | — | (12,875,205 | ) | — | |||||||||||||
Deferred financing costs, net | 123 | 25,153 | 180,320 | — | 205,596 | ||||||||||||||
Intercompany receivables | 226 | 38,763 | — | (38,989 | ) | — | |||||||||||||
Intercompany notes receivable | — | 1,250,544 | — | (1,250,544 | ) | — | |||||||||||||
Deferred income taxes, net | — | — | 76,950 | (52,874 | ) | 24,076 | |||||||||||||
Leasehold interests in land, net | — | — | 1,353,090 | — | 1,353,090 | ||||||||||||||
Intangible assets, net | 690 | — | 85,570 | — | 86,260 | ||||||||||||||
Other assets, net | 714 | 19,736 | 101,602 | — | 122,052 | ||||||||||||||
Total assets | $ | 7,734,736 | $ | 11,072,771 | $ | 18,822,574 | $ | (15,276,034 | ) | $ | 22,354,047 | ||||||||
Accounts payable | $ | 8,065 | $ | 25,489 | $ | 79,167 | $ | — | $ | 112,721 | |||||||||
Construction payables | 156 | 4,001 | 266,772 | — | 270,929 | ||||||||||||||
Intercompany payables | — | 430,596 | 256,529 | (687,125 | ) | — | |||||||||||||
Intercompany notes payable | 370,836 | — | — | (370,836 | ) | — | |||||||||||||
Accrued interest payable | 76 | 1,030 | 6,837 | — | 7,943 | ||||||||||||||
Other accrued liabilities | 31,050 | 233,781 | 1,719,613 | — | 1,984,444 | ||||||||||||||
Income taxes payable | — | — | 224,662 | (461 | ) | 224,201 | |||||||||||||
Current maturities of long-term debt | 3,688 | 24,224 | 71,822 | — | 99,734 | ||||||||||||||
Total current liabilities | 413,871 | 719,121 | 2,625,402 | (1,058,422 | ) | 2,699,972 | |||||||||||||
Other long-term liabilities | 3,014 | 9,255 | 112,345 | — | 124,614 | ||||||||||||||
Intercompany payables | — | — | 38,989 | (38,989 | ) | — | |||||||||||||
Intercompany notes payable | — | — | 1,250,544 | (1,250,544 | ) | — | |||||||||||||
Deferred income taxes | 44,283 | 13,918 | 188,486 | (52,874 | ) | 193,813 | |||||||||||||
Deferred amounts related to mall transactions | — | 422,153 | — | — | 422,153 | ||||||||||||||
Long-term debt | 59,983 | 3,230,653 | 6,602,277 | — | 9,892,913 | ||||||||||||||
Total liabilities | 521,151 | 4,395,100 | 10,818,043 | (2,400,829 | ) | 13,333,465 | |||||||||||||
Total Las Vegas Sands Corp. stockholders’ equity | 7,213,586 | 6,677,266 | 6,197,939 | (12,875,205 | ) | 7,213,586 | |||||||||||||
Noncontrolling interests | — | 405 | 1,806,591 | — | 1,806,996 | ||||||||||||||
Total equity | 7,213,586 | 6,677,671 | 8,004,530 | (12,875,205 | ) | 9,020,582 | |||||||||||||
Total liabilities and equity | $ | 7,734,737 | $ | 11,072,771 | $ | 18,822,573 | $ | (15,276,034 | ) | $ | 22,354,047 | ||||||||
134
LAS VEGAS SANDS CORP. AND SUBSIDIARIES
NOTES TO CONSOLIDATED FINANCIAL STATEMENTS - (CONTINUED)
CONDENSED CONSOLIDATING STATEMENTS OF OPERATIONS
For the Year Ended December 31, 2015
LVSC (Non-Guarantor parent) | Restricted Subsidiaries | Non-Restricted Subsidiaries | Consolidating/ Eliminating Entries | Total | |||||||||||||||
Revenues: | |||||||||||||||||||
Casino | $ | — | $ | 455,539 | $ | 8,627,465 | $ | — | $ | 9,083,004 | |||||||||
Rooms | — | 543,994 | 925,880 | — | 1,469,874 | ||||||||||||||
Food and beverage | — | 218,824 | 538,688 | — | 757,512 | ||||||||||||||
Mall | — | — | 564,309 | — | 564,309 | ||||||||||||||
Convention, retail and other | — | 324,554 | 399,220 | (184,123 | ) | 539,651 | |||||||||||||
— | 1,542,911 | 11,055,562 | (184,123 | ) | 12,414,350 | ||||||||||||||
Less — promotional allowances | (763 | ) | (92,293 | ) | (630,185 | ) | (2,648 | ) | (725,889 | ) | |||||||||
Net revenues | (763 | ) | 1,450,618 | 10,425,377 | (186,771 | ) | 11,688,461 | ||||||||||||
Operating expenses: | |||||||||||||||||||
Casino | — | 300,954 | 4,816,106 | (3,190 | ) | 5,113,870 | |||||||||||||
Rooms | — | 151,297 | 111,143 | — | 262,440 | ||||||||||||||
Food and beverage | — | 110,131 | 296,595 | (4,066 | ) | 402,660 | |||||||||||||
Mall | — | — | 61,299 | — | 61,299 | ||||||||||||||
Convention, retail and other | — | 86,681 | 218,356 | (28,216 | ) | 276,821 | |||||||||||||
Provision for doubtful accounts | — | 35,912 | 119,723 | — | 155,635 | ||||||||||||||
General and administrative | — | 319,763 | 948,845 | (1,193 | ) | 1,267,415 | |||||||||||||
Corporate | 135,822 | 294 | 190,098 | (150,045 | ) | 176,169 | |||||||||||||
Pre-opening | — | — | 47,514 | (5 | ) | 47,509 | |||||||||||||
Development | 10,414 | — | 14 | (56 | ) | 10,372 | |||||||||||||
Depreciation and amortization | 26,815 | 170,691 | 801,413 | — | 998,919 | ||||||||||||||
Amortization of leasehold interests in land | — | — | 38,645 | — | 38,645 | ||||||||||||||
Loss on disposal of assets | — | 13,016 | 22,216 | — | 35,232 | ||||||||||||||
173,051 | 1,188,739 | 7,671,967 | (186,771 | ) | 8,846,986 | ||||||||||||||
Operating income (loss) | (173,814 | ) | 261,879 | 2,753,410 | — | 2,841,475 | |||||||||||||
Other income (expense): | |||||||||||||||||||
Interest income | 111 | 206,609 | 22,530 | (214,165 | ) | 15,085 | |||||||||||||
Interest expense, net of amounts capitalized | (9,000 | ) | (108,818 | ) | (361,567 | ) | 214,165 | (265,220 | ) | ||||||||||
Other income (expense) | — | (1,805 | ) | 32,347 | — | 30,542 | |||||||||||||
Income from equity investments in subsidiaries | 1,941,839 | 1,567,804 | — | (3,509,643 | ) | — | |||||||||||||
Income before income taxes | 1,759,136 | 1,925,669 | 2,446,720 | (3,509,643 | ) | 2,621,882 | |||||||||||||
Income tax benefit (expense) | 207,100 | (149,376 | ) | (293,909 | ) | — | (236,185 | ) | |||||||||||
Net income | 1,966,236 | 1,776,293 | 2,152,811 | (3,509,643 | ) | 2,385,697 | |||||||||||||
Net income attributable to noncontrolling interests | — | (3,240 | ) | (416,221 | ) | — | (419,461 | ) | |||||||||||
Net income attributable to Las Vegas Sands Corp. | $ | 1,966,236 | $ | 1,773,053 | $ | 1,736,590 | $ | (3,509,643 | ) | $ | 1,966,236 | ||||||||
135
LAS VEGAS SANDS CORP. AND SUBSIDIARIES
NOTES TO CONSOLIDATED FINANCIAL STATEMENTS - (CONTINUED)
CONDENSED CONSOLIDATING STATEMENTS OF OPERATIONS
For the Year Ended December 31, 2014
LVSC (Non-Guarantor parent) | Restricted Subsidiaries | Non-Restricted Subsidiaries | Consolidating/ Eliminating Entries | Total | |||||||||||||||
Revenues: | |||||||||||||||||||
Casino | $ | — | $ | 509,206 | $ | 11,495,155 | $ | — | $ | 12,004,361 | |||||||||
Rooms | — | 491,493 | 1,048,927 | — | 1,540,420 | ||||||||||||||
Food and beverage | — | 201,892 | 576,877 | — | 778,769 | ||||||||||||||
Mall | — | — | 553,534 | — | 553,534 | ||||||||||||||
Convention, retail and other | — | 320,409 | 410,967 | (182,672 | ) | 548,704 | |||||||||||||
— | 1,523,000 | 14,085,460 | (182,672 | ) | 15,425,788 | ||||||||||||||
Less — promotional allowances | (1,279 | ) | (88,929 | ) | (749,504 | ) | (2,227 | ) | (841,939 | ) | |||||||||
Net revenues | (1,279 | ) | 1,434,071 | 13,335,956 | (184,899 | ) | 14,583,849 | ||||||||||||
Operating expenses: | |||||||||||||||||||
Casino | — | 298,641 | 6,410,119 | (3,226 | ) | 6,705,534 | |||||||||||||
Rooms | — | 139,837 | 116,998 | — | 256,835 | ||||||||||||||
Food and beverage | — | 99,427 | 297,212 | (4,079 | ) | 392,560 | |||||||||||||
Mall | — | — | 69,732 | — | 69,732 | ||||||||||||||
Convention, retail and other | — | 101,983 | 249,968 | (31,192 | ) | 320,759 | |||||||||||||
Provision for doubtful accounts | — | 37,059 | 149,663 | — | 186,722 | ||||||||||||||
General and administrative | — | 305,279 | 953,831 | (977 | ) | 1,258,133 | |||||||||||||
Corporate | 156,775 | 1,807 | 161,570 | (145,402 | ) | 174,750 | |||||||||||||
Pre-opening | — | 98 | 26,133 | (1 | ) | 26,230 | |||||||||||||
Development | 14,210 | — | 137 | (22 | ) | 14,325 | |||||||||||||
Depreciation and amortization | 26,020 | 183,566 | 822,003 | — | 1,031,589 | ||||||||||||||
Amortization of leasehold interests in land | — | — | 40,598 | — | 40,598 | ||||||||||||||
(Gain) loss on disposal of assets | (42 | ) | 7,233 | (335 | ) | — | 6,856 | ||||||||||||
196,963 | 1,174,930 | 9,297,629 | (184,899 | ) | 10,484,623 | ||||||||||||||
Operating income (loss) | (198,242 | ) | 259,141 | 4,038,327 | — | 4,099,226 | |||||||||||||
Other income (expense): | |||||||||||||||||||
Interest income | 180 | 178,136 | 30,406 | (183,079 | ) | 25,643 | |||||||||||||
Interest expense, net of amounts capitalized | (6,442 | ) | (113,546 | ) | (337,272 | ) | 183,079 | (274,181 | ) | ||||||||||
Other income (expense) | (791 | ) | (4,732 | ) | 7,488 | — | 1,965 | ||||||||||||
Loss on modification or early retirement of debt | — | — | (19,942 | ) | — | (19,942 | ) | ||||||||||||
Income from equity investments in subsidiaries | 2,919,958 | 2,598,506 | — | (5,518,464 | ) | — | |||||||||||||
Income before income taxes | 2,714,663 | 2,917,505 | 3,719,007 | (5,518,464 | ) | 3,832,711 | |||||||||||||
Income tax benefit (expense) | 125,966 | (141,089 | ) | (229,517 | ) | — | (244,640 | ) | |||||||||||
Net income | 2,840,629 | 2,776,416 | 3,489,490 | (5,518,464 | ) | 3,588,071 | |||||||||||||
Net income attributable to noncontrolling interests | — | (2,274 | ) | (745,168 | ) | — | (747,442 | ) | |||||||||||
Net income attributable to Las Vegas Sands Corp. | $ | 2,840,629 | $ | 2,774,142 | $ | 2,744,322 | $ | (5,518,464 | ) | $ | 2,840,629 | ||||||||
136
LAS VEGAS SANDS CORP. AND SUBSIDIARIES
NOTES TO CONSOLIDATED FINANCIAL STATEMENTS - (CONTINUED)
CONDENSED CONSOLIDATING STATEMENTS OF OPERATIONS
For the Year Ended December 31, 2013
LVSC (Non-Guarantor parent) | Restricted Subsidiaries | Non-Restricted Subsidiaries | Consolidating/ Eliminating Entries | Total | |||||||||||||||
Revenues: | |||||||||||||||||||
Casino | $ | — | $ | 584,372 | $ | 10,802,545 | $ | — | $ | 11,386,917 | |||||||||
Rooms | — | 472,518 | 908,163 | — | 1,380,681 | ||||||||||||||
Food and beverage | — | 197,371 | 532,888 | — | 730,259 | ||||||||||||||
Mall | — | — | 481,400 | — | 481,400 | ||||||||||||||
Convention, retail and other | — | 310,276 | 377,791 | (172,888 | ) | 515,179 | |||||||||||||
— | 1,564,537 | 13,102,787 | (172,888 | ) | 14,494,436 | ||||||||||||||
Less — promotional allowances | (1,455 | ) | (91,217 | ) | (629,994 | ) | (1,885 | ) | (724,551 | ) | |||||||||
Net revenues | (1,455 | ) | 1,473,320 | 12,472,793 | (174,773 | ) | 13,769,885 | ||||||||||||
Operating expenses: | |||||||||||||||||||
Casino | — | 314,966 | 6,171,744 | (2,992 | ) | 6,483,718 | |||||||||||||
Rooms | — | 157,497 | 114,449 | (4 | ) | 271,942 | |||||||||||||
Food and beverage | — | 90,507 | 283,366 | (4,303 | ) | 369,570 | |||||||||||||
Mall | — | — | 73,358 | — | 73,358 | ||||||||||||||
Convention, retail and other | — | 106,242 | 238,296 | (26,669 | ) | 317,869 | |||||||||||||
Provision for doubtful accounts | — | 29,977 | 207,809 | — | 237,786 | ||||||||||||||
General and administrative | — | 341,659 | 988,927 | (846 | ) | 1,329,740 | |||||||||||||
Corporate | 164,926 | 1,264 | 163,287 | (139,942 | ) | 189,535 | |||||||||||||
Pre-opening | — | 911 | 12,428 | — | 13,339 | ||||||||||||||
Development | 15,207 | — | 619 | (17 | ) | 15,809 | |||||||||||||
Depreciation and amortization | 26,165 | 186,871 | 794,432 | — | 1,007,468 | ||||||||||||||
Amortization of leasehold interests in land | — | — | 40,352 | — | 40,352 | ||||||||||||||
(Gain) loss on disposal of assets | (12,641 | ) | 1,823 | 21,974 | — | 11,156 | |||||||||||||
193,657 | 1,231,717 | 9,111,041 | (174,773 | ) | 10,361,642 | ||||||||||||||
Operating income (loss) | (195,112 | ) | 241,603 | 3,361,752 | — | 3,408,243 | |||||||||||||
Other income (expense): | |||||||||||||||||||
Interest income | 1,155 | 173,203 | 18,189 | (176,210 | ) | 16,337 | |||||||||||||
Interest expense, net of amounts capitalized | (4,269 | ) | (88,972 | ) | (354,180 | ) | 176,210 | (271,211 | ) | ||||||||||
Other income (expense) | (5,282 | ) | (2,322 | ) | 11,925 | — | 4,321 | ||||||||||||
Loss on modification or early retirement of debt | — | (14,178 | ) | — | — | (14,178 | ) | ||||||||||||
Income from equity investments in subsidiaries | 2,416,604 | 2,119,936 | — | (4,536,540 | ) | — | |||||||||||||
Income before income taxes | 2,213,096 | 2,429,270 | 3,037,686 | (4,536,540 | ) | 3,143,512 | |||||||||||||
Income tax benefit (expense) | 92,901 | (133,519 | ) | (148,218 | ) | — | (188,836 | ) | |||||||||||
Net income | 2,305,997 | 2,295,751 | 2,889,468 | (4,536,540 | ) | 2,954,676 | |||||||||||||
Net income attributable to noncontrolling interests | — | (2,894 | ) | (645,785 | ) | — | (648,679 | ) | |||||||||||
Net income attributable to Las Vegas Sands Corp. | $ | 2,305,997 | $ | 2,292,857 | $ | 2,243,683 | $ | (4,536,540 | ) | $ | 2,305,997 | ||||||||
137
LAS VEGAS SANDS CORP. AND SUBSIDIARIES
NOTES TO CONSOLIDATED FINANCIAL STATEMENTS - (CONTINUED)
CONDENSED CONSOLIDATING STATEMENTS OF COMPREHENSIVE INCOME
For the Year Ended December 31, 2015
LVSC (Non-Guarantor parent) | Restricted Subsidiaries | Non-Restricted Subsidiaries | Consolidating/ Eliminating Entries | Total | |||||||||||||||
Net income | $ | 1,966,236 | $ | 1,776,293 | $ | 2,152,811 | $ | (3,509,643 | ) | $ | 2,385,697 | ||||||||
Currency translation adjustment, net of reclassification adjustment and before and after tax | (142,384 | ) | (120,949 | ) | (141,012 | ) | 263,333 | (141,012 | ) | ||||||||||
Total comprehensive income | 1,823,852 | 1,655,344 | 2,011,799 | (3,246,310 | ) | 2,244,685 | |||||||||||||
Comprehensive income attributable to noncontrolling interests | — | (3,240 | ) | (417,593 | ) | — | (420,833 | ) | |||||||||||
Comprehensive income attributable to Las Vegas Sands Corp. | $ | 1,823,852 | $ | 1,652,104 | $ | 1,594,206 | $ | (3,246,310 | ) | $ | 1,823,852 | ||||||||
138
LAS VEGAS SANDS CORP. AND SUBSIDIARIES
NOTES TO CONSOLIDATED FINANCIAL STATEMENTS - (CONTINUED)
CONDENSED CONSOLIDATING STATEMENTS OF COMPREHENSIVE INCOME
For the Year Ended December 31, 2014
LVSC (Non-Guarantor parent) | Restricted Subsidiaries | Non-Restricted Subsidiaries | Consolidating/ Eliminating Entries | Total | |||||||||||||||
Net income | $ | 2,840,629 | $ | 2,776,416 | $ | 3,489,490 | $ | (5,518,464 | ) | $ | 3,588,071 | ||||||||
Currency translation adjustment, before and after tax | (97,682 | ) | (83,039 | ) | (98,414 | ) | 180,721 | (98,414 | ) | ||||||||||
Total comprehensive income | 2,742,947 | 2,693,377 | 3,391,076 | (5,337,743 | ) | 3,489,657 | |||||||||||||
Comprehensive income attributable to noncontrolling interests | — | (2,274 | ) | (744,436 | ) | — | (746,710 | ) | |||||||||||
Comprehensive income attributable to Las Vegas Sands Corp. | $ | 2,742,947 | $ | 2,691,103 | $ | 2,646,640 | $ | (5,337,743 | ) | $ | 2,742,947 | ||||||||
139
LAS VEGAS SANDS CORP. AND SUBSIDIARIES
NOTES TO CONSOLIDATED FINANCIAL STATEMENTS - (CONTINUED)
CONDENSED CONSOLIDATING STATEMENTS OF COMPREHENSIVE INCOME
For the Year Ended December 31, 2013
LVSC (Non-Guarantor parent) | Restricted Subsidiaries | Non-Restricted Subsidiaries | Consolidating/ Eliminating Entries | Total | |||||||||||||||
Net income | $ | 2,305,997 | $ | 2,295,751 | $ | 2,889,468 | $ | (4,536,540 | ) | $ | 2,954,676 | ||||||||
Currency translation adjustment, before and after tax | (89,295 | ) | (75,797 | ) | (89,976 | ) | 165,092 | (89,976 | ) | ||||||||||
Total comprehensive income | 2,216,702 | 2,219,954 | 2,799,492 | (4,371,448 | ) | 2,864,700 | |||||||||||||
Comprehensive income attributable to noncontrolling interests | — | (2,894 | ) | (645,104 | ) | — | (647,998 | ) | |||||||||||
Comprehensive income attributable to Las Vegas Sands Corp. | $ | 2,216,702 | $ | 2,217,060 | $ | 2,154,388 | $ | (4,371,448 | ) | $ | 2,216,702 | ||||||||
140
LAS VEGAS SANDS CORP. AND SUBSIDIARIES
NOTES TO CONSOLIDATED FINANCIAL STATEMENTS - (CONTINUED)
CONDENSED CONSOLIDATING STATEMENTS OF CASH FLOWS
For the Year Ended December 31, 2015
LVSC (Non-Guarantor parent) | Restricted Subsidiaries | Non-Restricted Subsidiaries | Consolidating/ Eliminating Entries | Total | |||||||||||||||
Net cash generated from operating activities | $ | 2,221,658 | $ | 2,601,691 | $ | 3,229,278 | $ | (4,602,656 | ) | $ | 3,449,971 | ||||||||
Cash flows from investing activities: | |||||||||||||||||||
Change in restricted cash and cash equivalents | — | — | (1,328 | ) | — | (1,328 | ) | ||||||||||||
Capital expenditures | (10,518 | ) | (74,789 | ) | (1,443,335 | ) | — | (1,528,642 | ) | ||||||||||
Proceeds from disposal of property and equipment | 10 | 81 | 1,413 | — | 1,504 | ||||||||||||||
Repayments of receivable from non-restricted subsidiaries | — | 2,285 | — | (2,285 | ) | — | |||||||||||||
Dividends received from non-restricted subsidiaries | — | 1,506,308 | — | (1,506,308 | ) | — | |||||||||||||
Capital contributions to subsidiaries | (22 | ) | (1,383,708 | ) | — | 1,383,730 | — | ||||||||||||
Net cash generated from (used in) investing activities | (10,530 | ) | 50,177 | (1,443,250 | ) | (124,863 | ) | (1,528,466 | ) | ||||||||||
Cash flows from financing activities: | |||||||||||||||||||
Proceeds from exercise of stock options | 13,313 | — | 3,563 | — | 16,876 | ||||||||||||||
Excess tax benefit from stock option exercises | 8,785 | — | — | — | 8,785 | ||||||||||||||
Repurchase of common stock | (205,084 | ) | — | — | — | (205,084 | ) | ||||||||||||
Dividends paid | (2,073,762 | ) | — | (619,120 | ) | — | (2,692,882 | ) | |||||||||||
Distributions to noncontrolling interests | — | (3,240 | ) | (10,668 | ) | — | (13,908 | ) | |||||||||||
Dividends paid to Las Vegas Sands Corp. | — | (2,220,335 | ) | (142,205 | ) | 2,362,540 | — | ||||||||||||
Dividends paid to Restricted Subsidiaries | — | — | (3,746,424 | ) | 3,746,424 | — | |||||||||||||
Capital contributions received | — | — | 1,383,730 | (1,383,730 | ) | — | |||||||||||||
Repayments on borrowings from Restricted Subsidiaries | — | — | (2,285 | ) | 2,285 | — | |||||||||||||
Proceeds from 2013 U.S. credit facility | — | 1,090,000 | — | — | 1,090,000 | ||||||||||||||
Proceeds from 2011 VML credit facility | — | — | 999,277 | — | 999,277 | ||||||||||||||
Repayments on 2013 U.S. credit facility | — | (1,502,500 | ) | — | — | (1,502,500 | ) | ||||||||||||
Repayments on 2011 VML credit facility | — | — | (820,188 | ) | — | (820,188 | ) | ||||||||||||
Repayments on 2012 Singapore credit facility | — | — | (67,403 | ) | — | (67,403 | ) | ||||||||||||
Repayments on airplane financings | (3,688 | ) | — | — | — | (3,688 | ) | ||||||||||||
Repayments on HVAC equipment lease and other long-term debt | — | (1,725 | ) | (2,213 | ) | — | (3,938 | ) | |||||||||||
Payments of deferred financing costs | — | — | (11,745 | ) | — | (11,745 | ) | ||||||||||||
Net cash used in financing activities | (2,260,436 | ) | (2,637,800 | ) | (3,035,681 | ) | 4,727,519 | (3,206,398 | ) | ||||||||||
Effect of exchange rate on cash | — | — | (41,936 | ) | — | (41,936 | ) | ||||||||||||
Increase (decrease) in cash and cash equivalents | (49,308 | ) | 14,068 | (1,291,589 | ) | — | (1,326,829 | ) | |||||||||||
Cash and cash equivalents at beginning of year | 114,125 | 345,399 | 3,046,795 | — | 3,506,319 | ||||||||||||||
Cash and cash equivalents at end of year | $ | 64,817 | $ | 359,467 | $ | 1,755,206 | $ | — | $ | 2,179,490 | |||||||||
141
LAS VEGAS SANDS CORP. AND SUBSIDIARIES
NOTES TO CONSOLIDATED FINANCIAL STATEMENTS - (CONTINUED)
CONDENSED CONSOLIDATING STATEMENTS OF CASH FLOWS
For the Year Ended December 31, 2014
LVSC (Non-Guarantor parent) | Restricted Subsidiaries | Non-Restricted Subsidiaries | Consolidating/ Eliminating Entries | Total | |||||||||||||||
Net cash generated from operating activities | $ | 3,223,393 | $ | 2,915,949 | $ | 4,643,445 | $ | (5,949,943 | ) | $ | 4,832,844 | ||||||||
Cash flows from investing activities: | |||||||||||||||||||
Change in restricted cash and cash equivalents | — | — | 270 | — | 270 | ||||||||||||||
Capital expenditures | (31,626 | ) | (102,502 | ) | (1,044,528 | ) | — | (1,178,656 | ) | ||||||||||
Proceeds from disposal of property and equipment | 42 | 671 | 1,105 | — | 1,818 | ||||||||||||||
Repayments of receivable from non-restricted subsidiaries | — | 1,889 | — | (1,889 | ) | — | |||||||||||||
Notes receivable to Las Vegas Sands Corp. | — | — | (114,155 | ) | 114,155 | — | |||||||||||||
Dividends received from non-restricted subsidiaries | — | 1,418,221 | — | (1,418,221 | ) | — | |||||||||||||
Capital contributions to subsidiaries | — | (1,327,991 | ) | — | 1,327,991 | — | |||||||||||||
Net cash used in investing activities | (31,584 | ) | (9,712 | ) | (1,157,308 | ) | 22,036 | (1,176,568 | ) | ||||||||||
Cash flows from financing activities: | |||||||||||||||||||
Proceeds from exercise of stock options | 44,973 | — | 10,677 | — | 55,650 | ||||||||||||||
Excess tax benefit from stock option exercises | 3,585 | — | — | — | 3,585 | ||||||||||||||
Repurchase of common stock | (1,676,802 | ) | — | — | — | (1,676,802 | ) | ||||||||||||
Dividends paid | (1,610,087 | ) | — | (776,570 | ) | — | (2,386,657 | ) | |||||||||||
Distributions to noncontrolling interests | — | (2,274 | ) | (7,499 | ) | — | (9,773 | ) | |||||||||||
Dividends paid to Las Vegas Sands Corp. | — | (3,279,161 | ) | (129,416 | ) | 3,408,577 | — | ||||||||||||
Dividends paid to Restricted Subsidiaries | — | — | (3,959,587 | ) | 3,959,587 | — | |||||||||||||
Capital contributions received | — | — | 1,327,991 | (1,327,991 | ) | — | |||||||||||||
Borrowings from non-restricted subsidiaries | 114,155 | — | — | (114,155 | ) | — | |||||||||||||
Repayments on borrowings from Restricted Subsidiaries | — | — | (1,889 | ) | 1,889 | — | |||||||||||||
Proceeds from 2013 U.S. credit facility | — | 1,678,000 | — | — | 1,678,000 | ||||||||||||||
Proceeds from 2011 VML credit facility | — | — | 819,725 | — | 819,725 | ||||||||||||||
Repayments on 2013 U.S. credit facility | — | (1,270,500 | ) | — | — | (1,270,500 | ) | ||||||||||||
Repayments on 2011 VML credit facility | — | — | (819,680 | ) | — | (819,680 | ) | ||||||||||||
Repayments on 2012 Singapore credit facility | — | — | (17,930 | ) | — | (17,930 | ) | ||||||||||||
Repayments on airplane financings | (3,688 | ) | — | — | — | (3,688 | ) | ||||||||||||
Repayments on HVAC equipment lease and other long-term debt | — | (2,392 | ) | (3,276 | ) | — | (5,668 | ) | |||||||||||
Payments of deferred financing costs | — | — | (88,048 | ) | — | (88,048 | ) | ||||||||||||
Net cash used in financing activities | (3,127,864 | ) | (2,876,327 | ) | (3,645,502 | ) | 5,927,907 | (3,721,786 | ) | ||||||||||
Effect of exchange rate on cash | — | — | (28,585 | ) | — | (28,585 | ) | ||||||||||||
Increase (decrease) in cash and cash equivalents | 63,945 | 29,910 | (187,950 | ) | — | (94,095 | ) | ||||||||||||
Cash and cash equivalents at beginning of year | 50,180 | 315,489 | 3,234,745 | — | 3,600,414 | ||||||||||||||
Cash and cash equivalents at end of year | $ | 114,125 | $ | 345,399 | $ | 3,046,795 | $ | — | $ | 3,506,319 | |||||||||
142
LAS VEGAS SANDS CORP. AND SUBSIDIARIES
NOTES TO CONSOLIDATED FINANCIAL STATEMENTS - (CONTINUED)
CONDENSED CONSOLIDATING STATEMENTS OF CASH FLOWS
For the Year Ended December 31, 2013
LVSC (Non-Guarantor parent) | Restricted Subsidiaries | Non-Restricted Subsidiaries | Consolidating/ Eliminating Entries | Total | |||||||||||||||
Net cash generated from operating activities | $ | 1,693,766 | $ | 1,892,021 | $ | 4,255,589 | $ | (3,401,964 | ) | $ | 4,439,412 | ||||||||
Cash flows from investing activities: | |||||||||||||||||||
Change in restricted cash and cash equivalents | — | 1 | (383 | ) | — | (382 | ) | ||||||||||||
Capital expenditures | (29,901 | ) | (91,900 | ) | (776,310 | ) | — | (898,111 | ) | ||||||||||
Proceeds from disposal of property and equipment | 31,000 | 121 | 1,034 | — | 32,155 | ||||||||||||||
Acquisition of intangible assets | — | — | (45,871 | ) | — | (45,871 | ) | ||||||||||||
Repayments of receivable from non-restricted subsidiaries | — | 1,357 | — | (1,357 | ) | — | |||||||||||||
Notes receivable to Las Vegas Sands Corp. | — | — | (251,537 | ) | 251,537 | — | |||||||||||||
Repayments of receivable from Las Vegas Sands Corp. | — | — | 237,161 | (237,161 | ) | ||||||||||||||
Dividends received from non-restricted subsidiaries | — | 1,383,116 | — | (1,383,116 | ) | — | |||||||||||||
Capital contributions to subsidiaries | (68 | ) | (1,292,416 | ) | — | 1,292,484 | — | ||||||||||||
Net cash generated from (used in) investing activities | 1,031 | 279 | (835,906 | ) | (77,613 | ) | (912,209 | ) | |||||||||||
Cash flows from financing activities: | |||||||||||||||||||
Proceeds from exercise of stock options | 50,223 | — | 19,373 | — | 69,596 | ||||||||||||||
Repurchase of common stock | (561,150 | ) | — | — | — | (561,150 | ) | ||||||||||||
Proceeds from exercise of warrants | 350 | — | — | — | 350 | ||||||||||||||
Dividends paid | (1,152,690 | ) | — | (411,359 | ) | — | (1,564,049 | ) | |||||||||||
Distributions to noncontrolling interests | — | (2,894 | ) | (8,964 | ) | — | (11,858 | ) | |||||||||||
Dividends paid to Las Vegas Sands Corp. | — | (1,732,152 | ) | (108,570 | ) | 1,840,722 | — | ||||||||||||
Dividends paid to Restricted Subsidiaries | — | — | (2,944,358 | ) | 2,944,358 | — | |||||||||||||
Capital contributions received | — | — | 1,292,484 | (1,292,484 | ) | — | |||||||||||||
Borrowings from non-restricted subsidiaries | 251,537 | — | — | (251,537 | ) | — | |||||||||||||
Repayments on borrowings from Restricted Subsidiaries | — | — | (1,357 | ) | 1,357 | — | |||||||||||||
Repayments on borrowings from non-restricted subsidiaries | (237,161 | ) | — | — | 237,161 | — | |||||||||||||
Proceeds from 2013 U.S. credit facility | — | 2,828,750 | — | — | 2,828,750 | ||||||||||||||
Proceeds from senior secured credit facility | — | 250,000 | — | — | 250,000 | ||||||||||||||
Proceeds from 2012 Singapore credit facility | — | — | 104,357 | — | 104,357 | ||||||||||||||
Repayments on senior secured credit facility | — | (3,073,038 | ) | — | — | (3,073,038 | ) | ||||||||||||
Repayments on 2012 Singapore credit facility | — | — | (430,504 | ) | — | (430,504 | ) | ||||||||||||
Repayments on airplane financings | (3,688 | ) | — | — | — | (3,688 | ) | ||||||||||||
Repayments on HVAC equipment lease and other long-term debt | — | (2,350 | ) | (3,452 | ) | — | (5,802 | ) | |||||||||||
Payments of deferred financing costs | — | (27,529 | ) | (7,885 | ) | — | (35,414 | ) | |||||||||||
Net cash used in financing activities | (1,652,579 | ) | (1,759,213 | ) | (2,500,235 | ) | 3,479,577 | (2,432,450 | ) | ||||||||||
Effect of exchange rate on cash | — | — | (7,105 | ) | — | (7,105 | ) | ||||||||||||
Increase in cash and cash equivalents | 42,218 | 133,087 | 912,343 | — | 1,087,648 | ||||||||||||||
Cash and cash equivalents at beginning of year | 7,962 | 182,402 | 2,322,402 | — | 2,512,766 | ||||||||||||||
Cash and cash equivalents at end of year | $ | 50,180 | $ | 315,489 | $ | 3,234,745 | $ | — | $ | 3,600,414 | |||||||||
143
LAS VEGAS SANDS CORP. AND SUBSIDIARIES
NOTES TO CONSOLIDATED FINANCIAL STATEMENTS - (CONTINUED)
Note 19 — Selected Quarterly Financial Results (Unaudited)
Quarter | |||||||||||||||||||
First | Second | Third | Fourth(1) | Total | |||||||||||||||
(In thousands, except per share data) | |||||||||||||||||||
2015 | |||||||||||||||||||
Net revenues | $ | 3,011,622 | $ | 2,921,421 | $ | 2,893,683 | $ | 2,861,735 | $ | 11,688,461 | |||||||||
Operating income | 711,115 | 689,310 | 739,069 | 701,981 | 2,841,475 | ||||||||||||||
Net income | 611,038 | 581,491 | 618,193 | 574,975 | 2,385,697 | ||||||||||||||
Net income attributable to Las Vegas Sands Corp. | 511,923 | 469,173 | 519,358 | 465,782 | 1,966,236 | ||||||||||||||
Basic earnings per share | 0.64 | 0.59 | 0.65 | 0.59 | 2.47 | ||||||||||||||
Diluted earnings per share | 0.64 | 0.59 | 0.65 | 0.59 | 2.47 | ||||||||||||||
2014 | |||||||||||||||||||
Net revenues | $ | 4,010,384 | $ | 3,624,350 | $ | 3,533,122 | $ | 3,415,993 | $ | 14,583,849 | |||||||||
Operating income | 1,143,825 | 961,460 | 971,421 | 1,022,520 | 4,099,226 | ||||||||||||||
Net income | 996,728 | 852,844 | 860,499 | 878,000 | 3,588,071 | ||||||||||||||
Net income attributable to Las Vegas Sands Corp. | 776,185 | 671,434 | 671,705 | 721,305 | 2,840,629 | ||||||||||||||
Basic earnings per share | 0.95 | 0.83 | 0.84 | 0.90 | 3.52 | ||||||||||||||
Diluted earnings per share | 0.95 | 0.83 | 0.83 | 0.90 | 3.52 | ||||||||||||||
________________________
(1) | The Company received a $90.1 million refund during December 2014 related to property taxes assessed and paid at Marina Bay Sands for the years 2010 through 2014. |
Because earnings per share amounts are calculated using the weighted average number of common and dilutive common equivalent shares outstanding during each quarter, the sum of the per share amounts for the four quarters may not equal the total earnings per share amounts for the respective year.
144
SCHEDULE II — VALUATION AND QUALIFYING ACCOUNTS
LAS VEGAS SANDS CORP. AND SUBSIDIARIES
For the Years Ended December 31, 2015, 2014 and 2013
Description | Balance at Beginning of Year | Provision for Doubtful Accounts | Write-offs, Net of Recoveries | Balance at End of Year | ||||||||||
(In thousands) | ||||||||||||||
Allowance for doubtful accounts: | ||||||||||||||
2013 | $ | 491,682 | 237,786 | (99,741 | ) | $ | 629,727 | |||||||
2014 | $ | 629,727 | 186,722 | (143,164 | ) | $ | 673,285 | |||||||
2015 | $ | 673,285 | 155,635 | (192,317 | ) | $ | 636,603 | |||||||
Description | Balance at Beginning of Year | Additions | Deductions | Balance at End of Year | ||||||||||
(In thousands) | ||||||||||||||
Deferred income tax asset valuation allowance: | ||||||||||||||
2013 | $ | 1,390,900 | 149,893 | (21,525 | ) | $ | 1,519,268 | |||||||
2014 | $ | 1,519,268 | 1,012,126 | (46,741 | ) | $ | 2,484,653 | |||||||
2015 | $ | 2,484,653 | 840,157 | (22,673 | ) | $ | 3,302,137 | |||||||
145
ITEM 9. — CHANGES IN AND DISAGREEMENTS WITH ACCOUNTANTS ON ACCOUNTING AND FINANCIAL DISCLOSURE
Not applicable.
ITEM 9A. — CONTROLS AND PROCEDURES
Evaluation of Disclosure Controls and Procedures
Disclosure controls and procedures are designed to ensure that information required to be disclosed in the reports that the Company files or submits under the Securities Exchange Act of 1934 is recorded, processed, summarized and reported within the time periods specified in the SEC’s rules and forms and that such information is accumulated and communicated to the Company’s management, including its principal executive officer and principal financial officer, as appropriate, to allow for timely decisions regarding required disclosure. The Company’s Chief Executive Officer and its Principal Financial Officer have evaluated the disclosure controls and procedures (as defined in the Securities Exchange Act of 1934 Rules 13a-15(e) and 15d-15(e)) of the Company as of December 31, 2015, and have concluded that they are effective at the reasonable assurance level.
It should be noted that any system of controls, however well designed and operated, can provide only reasonable, and not absolute, assurance that the objectives of the system are met. In addition, the design of any control system is based in part upon certain assumptions about the likelihood of future events. Because of these and other inherent limitations of control systems, there can be no assurance that any design will succeed in achieving its stated goals under all potential future conditions, regardless of how remote.
Changes in Internal Control over Financial Reporting
There were no changes in the Company’s internal control over financial reporting that occurred during the fourth quarter covered by this Annual Report on Form 10-K that had a material effect, or was reasonably likely to have a material effect, on the Company’s internal control over financial reporting.
Management’s Annual Report on Internal Control Over Financial Reporting
The Company’s management is responsible for establishing and maintaining adequate internal control over financial reporting, as defined in Rules 13a-15(f) and 15d-15(f) of the Securities Exchange Act of 1934. The Company’s internal control over financial reporting is designed to provide reasonable assurance regarding the reliability of financial reporting and the preparation of financial statements for external purposes in accordance with generally accepted accounting principles. The Company’s internal control over financial reporting includes those policies and procedures that:
(1) pertain to the maintenance of records that, in reasonable detail, accurately and fairly reflect the transactions and dispositions of the Company’s assets;
(2) provide reasonable assurance that transactions are recorded as necessary to permit preparation of financial statements in accordance with generally accepted accounting principles and that the Company’s receipts and expenditures are being made only in accordance with authorizations of its management and directors; and
(3) provide reasonable assurance regarding prevention or timely detection of unauthorized acquisition, use or disposition of the Company’s assets that could have a material effect on the financial statements.
Because of its inherent limitations, internal control over financial reporting may not prevent or detect misstatements. Also, projections of any evaluation of effectiveness to future periods are subject to the risk that controls may become inadequate because of changes in conditions, or that the degree of compliance with the policies or procedures may deteriorate.
The Company’s management assessed the effectiveness of the Company’s internal control over financial reporting as of December 31, 2015. In making this assessment, the Company’s management used the framework set forth by the Committee of Sponsoring Organizations of the Treadway Commission in “Internal Control — Integrated Framework (2013).”
146
Based on this assessment, management concluded that, as of December 31, 2015, the Company’s internal control over financial reporting is effective based on this framework.
The effectiveness of the Company’s internal control over financial reporting as of December 31, 2015, has been audited by Deloitte & Touche LLP, an independent registered public accounting firm, as stated in their report, which appears herein.
ITEM 9B. — OTHER INFORMATION
On February 23, 2016, the Company’s Board of Directors appointed Patrick Dumont to serve as the Company’s principal financial officer and Stephanie Marz to serve as the Company’s principal accounting officer.
Mr. Dumont, 41, also serves as the Company’s Senior Vice President, Finance and Strategy, a position he has held since September 2013. From June 2010 until August 2013, Mr. Dumont served as the Company’s Vice President, Corporate Strategy.
Mr. Dumont is the son-in-law of Sheldon G. Adelson, the Company’s Chairman of the Board, Chief Executive Officer and Treasurer.
Ms. Marz, 40, also serves as the Company’s Vice President, Corporate Accounting, a position she has held since June 2015. She has held progressively senior positions in the Company’s finance organization since 2006.
Ms. Marz’s husband was formerly Vice President of Corporate Accounts at Scientific Games Corporation, one of the Company’s vendors, and was involved in transactions with the Company since January 1, 2015, with an approximate value of $1.0 million.
PART III
ITEM 10. — DIRECTORS, EXECUTIVE OFFICERS AND CORPORATE GOVERNANCE
We incorporate by reference the information responsive to this Item appearing in our definitive Proxy Statement for our 2016 Annual Meeting of Stockholders, which we expect to file with the Securities and Exchange Commission on or about April 22, 2016 (the “Proxy Statement”), including under the captions “Board of Directors,” “Executive Officers,” “Section 16(a) Beneficial Ownership Reporting Compliance” and “Information Regarding the Board of Directors and Its Committees.”
We have adopted a Code of Business Conduct and Ethics, which is posted on our website at www.sands.com, along with any amendments or waivers to the Code. Copies of the Code of Business Conduct and Ethics are available without charge by sending a written request to Investor Relations at the following address: Las Vegas Sands Corp., 3355 Las Vegas Boulevard South, Las Vegas, Nevada 89109.
ITEM 11. — EXECUTIVE COMPENSATION
We incorporate by reference the information responsive to this Item appearing in the Proxy Statement, including under the captions “Executive Compensation and Other Information,” “Director Compensation,” “Information Regarding the Board of Directors and Its Committees” and “Compensation Committee Report” (which report is deemed to be furnished and is not deemed to be filed in any Company filing under the Securities Act of 1933 or the Securities Exchange Act of 1934).
ITEM 12. — SECURITY OWNERSHIP OF CERTAIN BENEFICIAL OWNERS AND MANAGEMENT AND RELATED STOCKHOLDER MATTERS
We incorporate by reference the information responsive to this Item appearing in the Proxy Statement, including under the captions “Equity Compensation Plan Information” and “Principal Stockholders.”
147
ITEM 13. — CERTAIN RELATIONSHIPS AND RELATED TRANSACTIONS, AND DIRECTOR INDEPENDENCE
We incorporate by reference the information responsive to this Item appearing in the Proxy Statement, including under the captions “Board of Directors,” “Information Regarding the Board of Directors and its Committees” and “Certain Transactions.”
ITEM 14. — PRINCIPAL ACCOUNTANT FEES AND SERVICES
We incorporate by reference the information responsive to this Item appearing in the Proxy Statement, under the caption “Fees Paid to Independent Registered Public Accounting Firm.”
148
PART IV
ITEM 15. — EXHIBITS AND FINANCIAL STATEMENT SCHEDULES
(a) Documents filed as part of the Annual Report on Form 10-K.
(1) List of Financial Statements
Reports of Independent Registered Public Accounting Firm
Consolidated Balance Sheets
Consolidated Statements of Operations
Consolidated Statements of Comprehensive Income
Consolidated Statements of Equity
Consolidated Statements of Cash Flows
Notes to Consolidated Financial Statements
(2) List of Financial Statement Schedule
Schedule II — Valuation and Qualifying Accounts
(3) List of Exhibits
Exhibit No. | Description of Document | |
3.1 | Certificate of Amended and Restated Articles of Incorporation of Las Vegas Sands Corp. (incorporated by reference from Exhibit 3.1 to the Company’s Amendment No. 2 to Registration Statement on Form S-1 (File No. 333-118827) filed on November 22, 2004). | |
3.2 | Amended and Restated By-laws of Las Vegas Sands Corp. (incorporate by reference to Exhibit 3.2 to the Company's Annual Report on Form 10-K (File No. 001-32373) for the year ended December 31, 2013 and filed on February 28, 2014). | |
4.1 | Form of Specimen Common Stock Certificate of Las Vegas Sands Corp. (incorporated by reference from Exhibit 4.1 to the Company’s Amendment No. 2 to Registration Statement on Form S-1 (File No. 333-118827) filed on November 22, 2004). | |
10.1 | Amendment and Restatement Agreement dated as of December 19, 2013, to the Amended and Restated Credit and Guaranty Agreement dated as of August 18, 2010 among Las Vegas Sands, LLC, the Guarantors party thereto, the Lenders party thereto and The Bank of Nova Scotia (including as Exhibit A thereto the Second Amended and Restated Credit and Guaranty Agreement dated as of December 19, 2013 among Las Vegas Sands, LLC, the Guarantors party thereto, the lenders party thereto, The Bank of Nova Scotia, Barclays Bank PLC, Citigroup Global Markets Inc., Merrill Lynch, Pierce, Fenner & Smith Incorporated, BNP Paribas Securities Corp., Goldman Sachs Bank USA, Credit Agricole Corporate & Investment Bank, Morgan Stanley Senior Funding, Inc., The Royal Bank of Scotland plc and Sumitomo Mitsui Banking Corporation)(incorporated by reference from Exhibit 10.2 to the Company’s Annual Report on Form 10-K (File No. 001-32373) for the year ended December 31, 2013 and filed on February 28, 2014). | |
10.2 | Second Amended and Restated Security Agreement, dated as of December 19, 2013, between each of the parties named as a grantor therein and The Bank of Nova Scotia, as collateral agent for the secured parties, as defined therein (incorporated by reference from Exhibit 10.3 to the Company’s Annual Report on Form 10-K (File No. 001-32373) for the year ended December 31, 2013 and filed on February 28, 2014). | |
149
Exhibit No. | Description of Document | |
10.3 | Amendment and Restatement Agreement dated as of March 25, 2014, among VML US Finance LLC, as Borrower, Guarantors Party Hereto, Lender Party Hereto and Bank of China Limited, Macau Branch, as Administrative Agent and Collateral Agent (incorporated by reference from Exhibit 10.1 to the Company's Quarterly Report on Form 10-Q (File No. 001-32373) for the quarter ended March 31, 2014) and filed on May 7, 2014. | |
10.4 | Joinder Agreement, dated as of April 10, 2015, to the Amended and Restated Credit Agreement dated March 31, 2014 among VML US Finance LLC, as Borrower, Lender Party Hereto and Bank of China Limited, Macau Branch, as Administrative Agent (incorporated by reference from Exhibit 10.1 to the Company's Quarterly Report on Form 10-Q (File No. 001-32373) for the quarter ended March 31, 2015) and filed on May 7, 2015. | |
10.5 | Credit Agreement, dated as of September 21, 2011, entered into by and among VML US Finance LLC, Venetian Macau Limited, the financial institutions listed on the signature pages thereto as Lenders, Bank of China Limited, Macau Branch (“BOC”), as administrative agent for the Lenders, Goldman Sachs (Asia) L.L.C., Goldman Sachs Lending Partners LLC, Bank of America, N.A., BOC, Barclays Capital, BNP Paribas Hong Kong Branch, Citigroup Global Markets Asia Limited, Citibank, N.A. Hong Kong Branch, Commerzbank AG, Credit Agricole Corporate and Investment Bank, Credit Suisse Securities (USA) LLC, Credit Suisse AG, Singapore Branch, Industrial and Commercial Bank of China (Macau) Limited, ING Capital L.L.C. and ING Bank NV, Singapore Bank, Sumitomo Mitsui Banking Corporation, UBS Securities LLC and United Overseas Bank Limited, as global coordinators and bookrunners for the Term Loan Facility and Revolving Credit Facility and as co-syndication agents for the Term Loan Lenders and Revolving Loan Lenders and Banco Nacional Ultramarino, S.A., DBS Bank Ltd., Oversea-Chinese Banking Corporation Limited, The Bank of Nova Scotia and Wing Lung Bank Ltd., Macau Branch, as lead arrangers for the Term Loan Facility and Revolving Credit Facility (incorporated by reference from Exhibit 10.1 to the Company’s Quarterly Report on Form 10-Q (File No. 001-32373) for the quarter ended September 30, 2011 and filed on November 9, 2011). | |
10.6 | Credit Agreement, dated as of May 17, 2010, by and among Venetian Orient Limited, the financial institutions listed as Lenders on the signature pages thereto, The Bank of Nova Scotia, as Administrative Agent, Goldman Sachs Lending Partners LLC, BNP Paribas, Hong Kong Branch, Citibank, N.A., Citigroup Financial Services Limited and Citibank, N.A., Hong Kong Branch, UBS AG Hong Kong Branch, Barclays Capital, The Investment Banking Division of Barclays PLC, Bank of China Limited, Macau Branch (“BOC”), and Industrial and Commercial Bank of China (Macau) Limited (“ICBC”), as Global Coordinators and Bookrunners, and, with the exception of BOC and ICBC, as co-syndication agents for the enders, and Banco Nacional Ultramarino, S.A., DBS Bank Ltd. and Oversea-Chinese Banking Corporation Limited, as Mandated Lead Arrangers and Bookrunners (incorporated by reference from Exhibit 10.1 to the Company’s Quarterly Report on Form 10-Q (File No. 001-32373) for the quarter ended June 30, 2010 and filed on August 9, 2010). | |
10.7 | Sponsor Agreement, dated as of May 17, 2010, by and between Sands China Ltd., The Bank of Nova Scotia, as administrative agent, and Bank of China Limited, Macau Branch, as the collateral agent (incorporated by reference from Exhibit 10.2 to the Company’s Quarterly Report on Form 10-Q (File No. 001-32373) for the quarter ended June 30, 2010 and filed on August 9, 2010). | |
10.8 | Guaranty, dated as of May 17, 2010, is made by Sands China Ltd., and each Subsidiary of Sands China Ltd. Required from time to time to become party hereto pursuant to the Credit Agreement, in favor of and for the benefit of The Bank of Nova Scotia, as administrative agent (incorporated by reference from Exhibit 10.3 to the Company’s Quarterly Report on Form 10-Q (File No. 001-32373) for the quarter ended June 30, 2010 and filed on August 9, 2010). | |
150
Exhibit No. | Description of Document | |
10.9 | Amendment and Restatement Agreement dated as of August 29, 2014, to the Facility Agreement, dated as of June 25, 2012 (as amended by an amendment agreement dated November 20, 2013), among Marina Bay Sands Pte, Ltd., as borrower, various lenders party thereto, DBS Bank Ltd. (“DBS”), Oversea-Chinese Banking Corporation Limited, United Overseas Bank Limited and Malayan Banking Berhad, Singapore Branch, as global coordinators, DBS, as agent and security trustee, and DBS, Oversea-Chinese Banking Corporation Limited, United Overseas Bank Limited, Malayan Banking Berhad, Singapore Branch, Standard Chartered Bank, Sumitomo Mitsui Banking Corporation and CIMB Bank Berhad, Singapore Branch, as mandated lead arrangers (including as Schedule 3 thereto, the Form of Amended and Restated Facility Agreement) (incorporated by reference from Exhibit 10.1 to the Company's Quarterly Report on Form 10-Q (File No. 001-32373) for the quarter ended September 30, 2014) and filed on November 5, 2014. | |
10.10 | Facility Agreement, dated as of June 25, 2012, among Marina Bay Sands Pte. Ltd., as borrower, DBS Bank Ltd., Oversea-Chinese Banking Corporation Limited, United Overseas Bank Limited and Malayan Banking Berhad, Singapore Branch, as global coordinators, DBS Bank Ltd., as agent for the finance parties and security trustee for the secured parties and certain other lenders party thereto (incorporated by reference from Exhibit 10.2 to the Company’s Quarterly Report on Form 10-Q (File No. 001-32373) for the quarter ended June 30, 2012 and filed on August 9, 2012). | |
10.11 | Construction Agency Agreement, dated as of May 1, 1997, by and between Venetian Casino Resort, LLC and Atlantic Pacific Las Vegas, LLC (incorporated by reference from Exhibit 10.21 to Amendment No. 2 to Las Vegas Sands, Inc.’s Registration Statement on Form S-4 (File No. 333-42147) dated March 27, 1998). | |
10.12 | Sands Resort Hotel and Casino Agreement, dated as of February 18, 1997, by and between Clark County and Las Vegas Sands, Inc. (incorporated by reference from Exhibit 10.27 to Amendment No. 1 to Las Vegas Sands, Inc.’s Registration Statement on Form S-4 (File No. 333-42147) dated February 12, 1998). | |
10.13 | Addendum to Sands Resort Hotel and Casino Agreement, dated as of September 16, 1997, by and between Clark County and Las Vegas Sands, Inc. (incorporated by reference from Exhibit 10.20 to the Company’s Amendment No. 1 to Registration Statement on Form S-1 (File No. 333-118827) dated October 25, 2004). | |
10.14 | Improvement Phasing Agreement by and between Clark County and Lido Casino Resort, LLC (incorporated by reference from Exhibit 10.21 to the Company’s Amendment No. 1 to Registration Statement on Form S-1 (File No. 333-118827) dated October 22, 2004). | |
10.15 | Concession Contract for Operating Casino Games of Chance or Games of Other Forms in the Macao Special Administrative Region, June 26, 2002, by and among the Macao Special Administrative Region and Galaxy Casino Company Limited (incorporated by reference from Exhibit 10.40 to Las Vegas Sands, Inc.’s Form 10-K (File No. 333-42147) for the year ended December 31, 2002 and filed on March 31, 2003). | |
10.16† | Subconcession Contract for Operating Casino Games of Chance or Games of Other Forms in the Macao Special Administrative Region, dated December 19, 2002, between Galaxy Casino Company Limited, as concessionaire, and Venetian Macau S.A., as subconcessionaire (incorporated by reference from Exhibit 10.65 to the Company’s Amendment No. 5 to Registration Statement on Form S-1 (File No. 333-118827) dated December 10, 2004). | |
10.17 | Land Concession Agreement, dated as of December 10, 2003, relating to the Sands Macao between the Macao Special Administrative Region and Venetian Macau Limited (incorporated by reference from Exhibit 10.39 to the Company’s Amendment No. 1 to Registration Statement on Form S-1 (File No. 333-118827) dated October 25, 2004). | |
10.18 | Amendment, published on April 22, 2008, to Land Concession Agreement, dated as of December 10, 2003, relating to the Sands Macao between the Macau Special Administrative Region and Venetian Macau Limited (incorporated by reference from Exhibit 10.3 to the Company’s Quarterly Report on Form 10-Q (File No. 001-32373) for the quarter ended March 31, 2008 and filed on May 9, 2008). | |
151
Exhibit No. | Description of Document | |
10.19 | Land Concession Agreement, dated as of February 23, 2007, relating to the Venetian Macao, Four Seasons Macao and Site 3 among the Macau Special Administrative Region, Venetian Cotai Limited and Venetian Macau Limited (incorporated by reference from Exhibit 10.3 to the Company’s Quarterly Report on Form 10-Q (File No. 001-32373) for the quarter ended March 31, 2007 and filed on May 10, 2007). | |
10.20 | Amendment published on October 28, 2008, to Land Concession Agreement between Macau Special Administrative Region and Venetian Cotai Limited (incorporated by reference from Exhibit 10.5 to the Company’s Quarterly Report on Form 10-Q (File No. 001-32373) for the quarter ended September 30, 2008 and filed on November 10, 2008). | |
10.21 | Development Agreement, dated August 23, 2006, between the Singapore Tourism Board and Marina Bay Sands Pte. Ltd. (incorporated by reference from Exhibit 10.3 to the Company’s Quarterly Report on Form 10-Q (File No. 001-32373) for the quarter ended September 30, 2006 and filed on November 9, 2006). | |
10.22 | Supplement to Development Agreement, dated December 11, 2009, by and between Singapore Tourism Board and Marina Bay Sands PTE. LTD (incorporated by reference from Exhibit 10.76 to the Company’s Annual Report on Form 10-K (File No. 001-32373) for the year ended December 31, 2009 and filed on March 1, 2010). | |
10.23 | Energy Services Agreement, dated as of May 1, 1997, by and between Atlantic Pacific Las Vegas, LLC and Venetian Casino Resort, LLC (incorporated by reference from Exhibit 10.3 to Amendment No. 2 to Las Vegas Sands, Inc.’s Registration Statement on Form S-4 (File No. 333-42147) dated March 27, 1998). | |
10.24 | Energy Services Agreement Amendment No. 1, dated as of July 1, 1999, by and between Atlantic Pacific Las Vegas, LLC and Venetian Casino Resort, LLC (incorporated by reference from Exhibit 10.8 to Las Vegas Sands, Inc.’s Annual Report on Form 10-K (File No. 333-42147) for the year ended December 31, 1999 and filed on March 30, 2000). | |
10.25 | Energy Services Agreement Amendment No. 2, dated as of July 1, 2006, by and between Atlantic Pacific Las Vegas, LLC and Venetian Casino Resort, LLC (incorporated by reference from Exhibit 10.77 to the Company’s Annual Report on Form 10-K (File No. 001-32373) for the year ended December 31, 2006 and filed on February 28, 2007). | |
10.26 | Energy Services Agreement Amendment No. 3 dated as of February 10, 2009, by and between Trigen-Las Vegas Energy Company, LLC f/k/a Atlantic Pacific Las Vegas, LLC, Venetian Casino Resort, LLC Grand Canal Shops II, LLC and Interface Group-Nevada, Inc. (incorporated by reference from Exhibit 10.34 to the Company’s Annual Report on Form 10-K (File No. 001-32373) for year ended December 31, 2010 and filed on March 1, 2011). | |
10.27 | Energy Services Agreement, dated as of November 14, 1997, by and between Atlantic-Pacific Las Vegas, LLC and Interface Group-Nevada, Inc. (incorporated by reference from Exhibit 10.8 to Amendment No. 1 of the Company’s Registration Statement on Form S-1 (File No. 333-118827) dated October 25, 2004). | |
10.28 | Energy Services Agreement Amendment No. 1, dated as of July 1, 1999, by and between Atlantic-Pacific Las Vegas, LLC and Interface Group-Nevada, Inc. (incorporated by reference from Exhibit 10.9 to the Company’s Amendment No. 1 to Registration Statement on Form S-1 (File No. 333-118827) dated October 25, 2004). | |
10.29 | Amended and Restated Services Agreement, dated as of November 14, 1997, by and among Las Vegas Sands, Inc., Venetian Casino Resort, LLC, Interface Group Holding Company, Inc., Interface Group-Nevada, Inc., Lido Casino Resort MM, Inc., Grand Canal Shops Mall MM Subsidiary, Inc. and certain subsidiaries of Venetian Casino Resort, LLC named therein (incorporated by reference from Exhibit 10.15 to Amendment No. 1 to Las Vegas Sands, Inc.’s Registration Statement on Form S-4 (File No. 333-42147) dated February 12, 1998). | |
10.30 | Assignment and Assumption Agreement, dated as of November 8, 2004, by and among Las Vegas Sands, Inc., Venetian Casino Resort, LLC, Interface Group Holding Company, Inc., Interface Group-Nevada, Inc., Interface Operations LLC, Lido Casino Resort MM, Inc., Grand Canal Shops Mall MM Subsidiary, Inc. and certain subsidiaries of Venetian Casino Resort, LLC named therein (incorporated by reference from Exhibit 10.52 to the Company’s Amendment No. 2 to Registration Statement on Form S-1 (File No. 333-118827) dated November 22, 2004). | |
152
Exhibit No. | Description of Document | |
10.31 | Fourth Amended and Restated Reciprocal Easement, Use and Operating Agreement, dated as of February 29, 2008, by and among Interface Group — Nevada, Inc., Grand Canal Shops II, LLC, Phase II Mall Subsidiary, LLC, Venetian Casino Resort, LLC, and Palazzo Condo Tower, LLC (incorporated by reference from Exhibit 10.1 to the Company’s Quarterly Report on Form 10-Q (File No. 001-32373) for the quarter ended March 31, 2008 and filed on May 9, 2008). | |
10.32+ | Las Vegas Sands Corp. 2004 Equity Award Plan (Amended and Restated) (incorporated by reference from Exhibit 10.1 to the Company’s Quarterly Report on Form 10-Q (File No. 001-32373) for the quarter ended June 30, 2014 and filed on August 7, 2014). | |
10.33+ | Form of Director Restricted Stock Award Agreement under the 2004 Equity Award Plan (incorporated by reference from Exhibit 10.2 to the Company’s Quarterly Report on Form 10-Q (File No. 001-32373) for the quarter ended June 30, 2014 and filed on August 7, 2014). | |
10.34+ | Form of Restricted Stock Award Agreement under the 2004 Equity Award Plan (incorporated by reference from Exhibit 10.3 to the Company's Quarterly Report on Form 10-Q (File No. 001-32373) for the quarter ended June 30, 2014) and filed on August 7, 2014. | |
10.35+ | Form of Restricted Stock Award Agreements under the 2004 Equity Award Plan (incorporated by reference from Exhibit 10.70 to the Company’s Amendment No. 4 to Registration Statement on Form S-1 (File No. 333-118827) dated December 8, 2004). | |
10.36+ | Form of Restricted Stock Award Agreement under the 2004 Equity Award Plan (incorporated by reference from Exhibit 10.48 to the Company’s Annual Report on Form 10-K (File No. 001-32373) for year ended December 31, 2010 and filed on March 1, 2011). | |
10.37+ | Form of Nonqualified Stock Option Agreements under the 2004 Equity Award Plan (incorporated by reference from Exhibit 10.71 to the Company’s Amendment No. 4 to Registration Statement on Form S-1 (File No. 333-118827) dated December 8, 2004). | |
10.38+ | Form of Nonqualified Stock Option Agreement under the Company’s 2004 Equity Award Plan (incorporated by reference from Exhibit 10.2 to the Company’s Quarterly Report on Form 10-Q (File No. 001-32373) for the quarter ended June 30, 2009 and filed August 7, 2009). | |
10.39+ | Form of Nonqualified Stock Option Agreement under the 2004 Equity Award Plan (incorporated by reference from Exhibit 10.51 to the Company’s Annual Report on Form 10-K (File No. 001-32373) for the year ended December 31, 2010 and filed on March 1, 2011). | |
10.40+ | Las Vegas Sands Corp. Amended and Restated Executive Cash Incentive Plan (incorporated by reference from Exhibit 10.1 to the Company’s Quarterly Report on Form 10-Q (File No. 001-32373) for the quarter ended March 31, 2013 and filed on May 10, 2013). | |
10.41+ | Form of Director Restricted Stock Units Award Agreement under the Company's 2004 Equity Award Plan (incorporated by reference from Exhibit 10.4 to the Company's Quarterly Report on Form 10-Q (File No. 001-32373) for the quarter ended June 30, 2014) and filed on August 7, 2014. | |
10.42+ | Form of Restricted Stock Award Agreement (incorporated by reference from Exhibit 10.1 to the Company’s Current Report on Form 8-K (File No. 001-32373) filed on February 9, 2007). | |
10.43+ | Employment Agreement, dated as of November 18, 2004, by and among Las Vegas Sands Corp., Las Vegas Sands, Inc. and Sheldon G. Adelson (incorporated by reference from Exhibit 10.36 to the Company’s Amendment No. 2 to Registration Statement on Form S-1 (File No. 333-118827) dated November 22, 2004). | |
10.44+ | Amendment No. 1 to Employment Agreement, dated as of December 31, 2008, by and among Las Vegas Sands Corp., Las Vegas Sands, LLC (f/k/a Las Vegas Sands, Inc.) and Sheldon G. Adelson (incorporated by reference from Exhibit 10.35 to the Company’s Annual Report on Form 10-K (File No. 001-32373) for the year ended December 31, 2008 and filed on March 2, 2009). | |
10.45+ | Employment Agreement, dated as of November 13, 2010, among Las Vegas Sands Corp., Las Vegas Sands, LLC and Michael A. Leven (incorporated by reference from Exhibit 10.57 to the Company’s Annual Report on Form 10-K (File No. 001-32373) for year ended December 31, 2010 and filed on March 1, 2011). | |
10.46+ | Terms of Continued Employment, dated June 7, 2012, among Las Vegas Sands Corp., Las Vegas Sands, LLC and Michael A. Leven (incorporated by reference from Exhibit 10.1 to the Company’s Quarterly Report on Form 10-Q (File No. 001-32373) for the quarter ended June 30, 2012 and filed on August 9, 2012). | |
153
Exhibit No. | Description of Document | |
10.47+ | Amended Terms of Continued Employment, dated April 24, 2013, among Las Vegas Sands Corp., Las Vegas Sands, LLC and Michael A. Leven (incorporated by reference from Exhibit 10.2 to the Company’s Quarterly Report on Form 10-Q (File No. 001-32373) for the quarter ended March 31, 2013 and filed on May 10, 2013). | |
10.48+ | Employment Agreement, dated as of December 1, 2008 between Las Vegas Sands Corp. and Kenneth J. Kay (incorporated by reference from Exhibit 10.36 to the Company’s Annual Report on Form 10-K (File No. 001-32373) for the year ended December 31, 2008 and filed on March 2, 2009). | |
10.49+ | Letter Agreement, dated January 18, 2010, between Las Vegas Sands Corp. and Kenneth J. Kay (incorporated by reference from Exhibit 10.33 to the Company’s Annual Report on Form 10-K (File No. 001-32373) for the year ended December 31, 2009 and filed on March 1, 2010). | |
10.50+ | Amendment to Employment Agreement, effective December 31, 2012, between Las Vegas Sands Corp. and Kenneth J. Kay (incorporated by reference from Exhibit 10.3 to the Company’s Quarterly Report on Form 10-Q (File No. 001-32373) for the quarter ended March 31, 2013 and filed on May 10, 2013). | |
10.51+ | Separation Agreement and General Release, dated as of July 10, 2013, between Kenneth J. Kay and Las Vegas Sands Corp. (including as Attachment A thereto, the Consultancy Agreement, entered into as of July 10, 2013, between Las Vegas Sands Corp. and Kenneth J. Kay) (incorporated by reference from Exhibit 10.1 to the Company’s Quarterly Report on Form 10-Q (File No. 001-32373) for the quarter ended June 30, 2013 and filed on August 9, 2013). | |
10.52+ | Employment Agreement, dated as of January 11, 2011, among Las Vegas Sands Corp., Las Vegas Sands, LLC and Robert G. Goldstein (incorporated by reference from Exhibit 10.60 to the Company’s Annual Report on Form 10-K (File No. 001-32373) for year ended December 31, 2010 and filed on March 1, 2011). | |
10.53+ | Terms of Continued Employment, dated as of March 7, 2012, among Las Vegas Sands Corp., Las Vegas Sands, LLC and Robert G. Goldstein (incorporated by reference from Exhibit 10.1 to the Company’s Quarterly Report on Form 10-Q (File No. 001-32373) for the quarter ended March 31, 2012 and filed on May 10, 2012). | |
10.54+ | Employment Agreement, dated as of April 1 2012, between Las Vegas Sands Corp. and Chris J. Cahill (incorporated by reference from Exhibit 10.4 to the Company’s Quarterly Report on Form 10-Q (File No. 001-32373) for the quarter ended March 31, 2013 and filed on May 10, 2013). | |
10.55+ | Amendment to Employment Agreement, effective December 31, 2012, between Las Vegas Sands Corp. and Chris J. Cahill (incorporated by reference from Exhibit 10.5 to the Company’s Quarterly Report on Form 10-Q (File No. 001-32373) for the quarter ended March 31, 2013 and filed on May 10, 2013). | |
10.56+ | Amendment to Employment Agreement, dated as of March 27, 2013, between Las Vegas Sands Corp. and Chris J. Cahill (incorporated by reference from Exhibit 10.6 to the Company’s Quarterly Report on Form 10-Q (File No. 001-32373) for the quarter ended March 31, 2013 and filed on May 10, 2013). | |
10.57+ | Employment Letter, dated April 15, 2011, from Las Vegas Sands Corp. to John Caparella (incorporated by reference from Exhibit 10.7 to the Company’s Quarterly Report on Form 10-Q (File No. 001-32373) for the quarter ended March 31, 2013 and filed on May 10, 2013). | |
10.58+ | Amendment to Employment Letter, effective December 31, 2012, between Las Vegas Sands Corp. and John Caparella (incorporated by reference from Exhibit 10.8 to the Company’s Quarterly Report on Form 10-Q (File No. 001-32373) for the quarter ended March 31, 2013 and filed on May 10, 2013). | |
10.59 | Settlement Agreement, date as of June 24, 2011, by and among Venetian Casino Resort, LLC, Phase II Mall Holding, LLC, GGP Limited Partnership, The Shoppes at the Palazzo, LLC (f/k/a Phase II Mall Subsidiary, LLC) and Grand Canal Shops II, LLC (incorporated by reference from Exhibit 10.63 to the Company’s Annual Report on Form 10-K (File No. 001-32373) for the year ended December 31, 2011 and filed on February 28, 2012). | |
10.60 | Purchase and Sale Agreement, dated April 12, 2004, by and among Grand Canal Shops Mall Subsidiary, LLC, Grand Canal Shops Mall MM Subsidiary, Inc. and GGP Limited Partnership (incorporated by reference from Exhibit 10.1 to Las Vegas Sands, Inc.’s Current Report on Form 8-K (File No. 333-42147) filed on April 16, 2004). | |
154
Exhibit No. | Description of Document | |
10.61 | Agreement, made as of April 12, 2004, by and between Lido Casino Resort, LLC and GGP Limited Partnership (incorporated by reference from Exhibit 10.2 to Las Vegas Sands, Inc.’s Current Report on Form 8-K (File No. 333-42147) filed on April 16, 2004). | |
10.62 | Assignment and Assumption of Agreement and First Amendment to Agreement, dated September 30, 2004, made by Lido Casino Resort, LLC, as assignor, to Phase II Mall Holding, LLC, as assignee, and to GGP Limited Partnership, as buyer (incorporated by reference from Exhibit 10.60 to the Company’s Amendment No. 1 to Registration Statement on Form S- 1 (File No. 333-118827) dated October 25, 2004). | |
10.63 | Second Amendment, dated as of January 31, 2008, to Agreement dated as of April 12, 2004 and amended as of September 30, 2004, by and among Venetian Casino Resort, LLC, as successor-by-merger to Lido Casino Resort, LLC, Phase II Mall Holding, LLC, as successor-in-interest to Lido Casino Resort, LLC, and GGP Limited Partnership (incorporated by reference from Exhibit 10.2 to the Company’s Quarterly Report on Form 10-Q (File No. 001-32373) for the quarter ended March 31, 2008 and filed on May 9, 2008). | |
10.64 | Second Amended and Restated Registration Rights Agreement, dated as of November 14, 2008, by and among Las Vegas Sands Corp., Dr. Miriam Adelson and the other Adelson Holders (as defined therein) that are party to the agreement from time to time (incorporated by reference from Exhibit 10.2 to the Company’s Current Report on Form 8-K (File No. 001-32373) filed on November 14, 2008). | |
10.65 | Investor Rights Agreement, dated as of September 30, 2008, by and between Las Vegas Sands Corp. and the Investor named therein (incorporated by reference from Exhibit 10.3 to the Company’s Quarterly Report on Form 10-Q (File No. 001-32373) for the quarter ended September 30, 2008 and filed on November 10, 2008). | |
10.66 | Agreement, dated as of July 8, 2004, by and between Sheldon G. Adelson and Las Vegas Sands, Inc. (incorporated by reference from Exhibit 10.47 to the Company’s Registration Statement on Form S-1 (File No. 333-118827) dated September 3, 2004). | |
10.67 | Venetian Hotel Service Agreement, dated as of June 28, 2001, by and between Venetian Casino Resort, LLC and Interface Group-Nevada, Inc. d/b/a Sands Expo and Convention Center (incorporated by reference from Exhibit 10.49 to the Company’s Amendment No. 2 to Registration Statement on Form S-1 (File No. 333-118827) dated November 22, 2004). | |
10.68 | First Amendment to Venetian Hotel Service Agreement, dated as of June 28, 2004, by and between Venetian Casino Resort, LLC and Interface Group-Nevada, Inc. d/b/a Sands Expo and Convention Center (incorporated by reference from Exhibit 10.50 to the Company’s Registration Statement on Form S-1 (File No. 333-118827) dated September 3, 2004). | |
10.69 | Tax Indemnification Agreement, dated as of December 17, 2004, by and among Las Vegas Sands Corp., Las Vegas Sands, Inc. and the stockholders named therein (incorporated by reference from Exhibit 10.56 to the Company’s Current Report on Form 8-K (File No. 001-32373) filed on April 4, 2005). | |
10.70 | Aircraft Time Sharing Agreement, dated as of November 6, 2009 and effective as of January 1, 2009, between Las Vegas Sands Corp. and Interface Operations, LLC (incorporated by reference from Exhibit 10.2 to the Company’s Quarterly Report on Form 10-Q for the quarter ended September 30, 2009 and filed on November 9, 2009). | |
10.71 | Aircraft Time Sharing Agreement, dated as of November 6, 2009 and effective as of January 1, 2009, between Interface Operations, LLC and Las Vegas Sands Corp. (incorporated by reference from Exhibit 10.3 to the Company’s Quarterly Report on Form 10-Q (File No. 001-32373) for the quarter ended September 30, 2009 and filed on November 9, 2009). | |
10.72 | Aircraft Time Sharing Agreement, dated as of November 6, 2009 and effective as of January 1, 2009, between Las Vegas Sands Corp. and Interface Operations, LLC (incorporated by reference from Exhibit 10.4 to the Company’s Quarterly Report on Form 10-Q (File No. 001-32373) for the quarter ended September 30, 2009 and filed on November 9, 2009). | |
10.73 | Aircraft Time Sharing Agreement, dated as of November 6, 2009 and effective as of January 1, 2009, between Interface Operations, LLC and Las Vegas Sands Corp. (incorporated by reference from Exhibit 10.5 to the Company’s Quarterly Report on Form 10-Q (File No. 001-32373) for the quarter ended September 30, 2009 and filed on November 9, 2009). | |
155
Exhibit No. | Description of Document | |
10.74 | Aircraft Time Sharing Agreement, dated as of November 6, 2009 and effective as of January 1, 2009, between Interface Operations Bermuda, LTD and Las Vegas Sands Corp. (incorporated by reference from Exhibit 10.6 to the Company’s Quarterly Report on Form 10-Q (File No. 001-32373) for the quarter ended September 30, 2009 and filed on November 9, 2009). | |
10.75 | Aircraft Time Share Agreement, dated as of May 23, 2007, by and between Interface Operations LLC and Las Vegas Sands Corp. (incorporated by reference from Exhibit 10.2 to the Company’s Quarterly Report on Form 10-Q (File No. 001-32373) for the quarter ended June 30, 2007 and filed on August 9, 2007). | |
10.76 | Aircraft Time Sharing Agreement, dated as of January 1, 2005, by and between Interface Operations LLC and Las Vegas Sands Corp. (incorporated by reference from Exhibit 10.3 to the Company’s Quarterly Report on Form 10-Q (File No. 001-32373) for the quarter ended September 30, 2005 and filed November 14, 2005). | |
10.77 | Aircraft Time Sharing Agreement, dated as of June 18, 2004, by and between Interface Operations LLC and Las Vegas Sands, Inc. (incorporated by reference from Exhibit 10.48 to the Company’s Amendment No. 1 to Registration Statement on Form S-1 (File No. 333-118827) dated October 25, 2004). | |
10.78 | Aircraft Time Sharing Agreement dated as of April 14, 2011, between Las Vegas Sands Corp. and Interface Operations, LLC (incorporated by reference from Exhibit 10.1 to the Company’s Quarterly Report on Form 10-Q (File No. 001-32373) for the quarter ended June 30, 2011). | |
10.79+ | Form of Restricted Stock Award Agreement under the 2004 Equity Award Plan (incorporated by reference from Exhibit 10.82 to the Company’s Annual Report on Form 10-K (File No. 001-32373) for year ended December 31, 2010 and filed on March 1, 2011). | |
10.80+ | Form of Restricted Stock Award agreement under the 2004 Equity Award Plan (incorporated by reference from Exhibit 10.86 to the Company’s Annual Report on Form 10-K (File No. 001-32373) for the year ended December 31, 2011 and filed on February 28, 2012). | |
10.81+ | Form of Restricted Stock Units Award agreement under the 2004 Equity Award Plan (incorporated by reference from Exhibit 10.87 to the Company’s Annual Report on Form 10-K (File No. 001-32373) for the year ended December 31, 2011 and filed on February 28, 2012). | |
10.82+ | Terms of Continued Employment, dated December 9, 2014, among Las Vegas Sands Corp., Las Vegas Sands, LLC and Robert G. Goldstein (incorporated by reference from Exhibit 10.81 to the Company’s Annual Report on Form 10-K (File No. 001-32373) for the year ended December 31, 2014 and filed on February 27, 2015). | |
10.83+ | Las Vegas Sands Corp. Non-Employee Director Deferred Compensation Plan (incorporated by reference from Exhibit 10.88 to the Company’s Annual Report on Form 10-K (File No. 001-32373) for the year ended December 31, 2011 and filed on February 28, 2012). | |
10.84+ | Letter of Appointment for Executive, dated August 4, 2010, between Venetian Macau Limited and Edward M. Tracy (incorporated by reference from Exhibit 10.2 to the Company's Quarterly Report on Form 10-Q (File No. 001-32373) for the quarter ended March 31, 2014 and filed on May 7, 2014). | |
10.85+ | Contract Renewal, dated May 10, 2012, between Venetian Macau Limited and Edward Matthew Tracy (incorporated by reference from Exhibit 10.2.1 to the Company's Quarterly Report on Form 10-Q (File No. 001-32373) for the quarter ended March 31, 2014 and filed on May 7, 2014). | |
10.86+ | Contract Renewal, dated May 1, 2013, between Venetian Macau Limited and Edward Matthew Tracy (incorporated by reference from Exhibit 10.2.2 to the Company's Quarterly Report on Form 10-Q (File No. 001-32373) for the quarter ended March 31, 2014 and filed on May 7, 2014). | |
10.87+ | Form of Director Restricted Stock Units Award Agreement (with deferred settlement) under the 2004 Equity Award Plan (incorporated by reference from Exhibit 10.5 to the Company's Quarterly Report on Form 10-Q (File No. 001-32373) for the quarter ended June 30, 2014 and filed on August 7, 2014). | |
10.88+ | Form of Restricted Stock Units Award Agreement under the 2004 Equity Award Plan (incorporated by reference from Exhibit 10.6 to the Company's Quarterly Report on Form 10-Q (File No. 001-32373) for the quarter ended June 30, 2014 and filed on August 7, 2014). | |
156
Exhibit No. | Description of Document | |
10.89+ | Employment Agreement, dated as of March 17, 2015, between Venetian Casino Resort, LLC and George M. Markantonis (incorporated by reference from Exhibit 10.2 to the Company's Quarterly Report on Form 10-Q (File No. 001-32373) for the quarter ended March 31, 2015 and filed on May 7, 2015). | |
10.90+ | Separation and General Release, dated as of January 15, 2015, between Edward M. Tracy and Venetian Macau Limited, its subsidiaries, affiliates and related entities incorporated by reference from Exhibit 10.3 to the Company's Quarterly Report on Form 10-Q (File No. 001-32373) for the quarter ended March 31, 2015 and filed on May 7, 2015). | |
10.91+ | Separation Agreement and General Release, dated as of November 4, 2015, between Michael Quartieri and Las Vegas Sands Corp.(incorporated by reference from Exhibit 10.1 to the Company's Quarterly Report on Form 10-Q (File No. 001-32373) for the quarter ended September 30, 2015 and filed on November 5, 2015). | |
21.1* | Subsidiaries of Las Vegas Sands Corp. | |
23.1* | Consent of Deloitte & Touche LLP. | |
31.1* | Certification of the Chief Executive Officer pursuant to Section 302 of the Sarbanes-Oxley Act of 2002. | |
31.2* | Certification of the Principal Financial Officer pursuant to Section 302 of the Sarbanes-Oxley Act of 2002. | |
32.1++ | Certification of Chief Executive Officer of Las Vegas Sands Corp. pursuant to 18 U.S.C. Section 1350, as adopted pursuant to Section 906 of the Sarbanes-Oxley Act of 2002. | |
32.2++ | Certification of Principal Financial Officer of Las Vegas Sands Corp. pursuant to 18 U.S.C. Section 1350, as adopted pursuant to Section 906 of the Sarbanes-Oxley Act of 2002. | |
101.INS | XBRL Instance Document | |
101.SCH | XBRL Taxonomy Extension Schema Document | |
101.CAL | XBRL Taxonomy Extension Calculation Linkbase Document | |
101.DEF | XBRL Taxonomy Extension Definition Linkbase Document | |
101.LAB | XBRL Taxonomy Extension Label Linkbase Document | |
101.PRE | XBRL Taxonomy Extension Presentation Linkbase Document | |
_________________________
* | Filed herewith. |
† | Confidential treatment has been requested and granted with respect to portions of this exhibit, and such confidential portions have been deleted and replaced with “**” and filed separately with the Securities and Exchange Commission pursuant to Rule 406 under the Securities Act of 1933. |
+ | Denotes a management contract or compensatory plan or arrangement. |
++ | This exhibit will not be deemed "filed" for purposes of Section 18 of the Securities Exchange Act of 1934, as amended, or otherwise subject to the liability of that section. Such exhibit shall not be deemed incorporated into any filing under the Securities Act of 1933, as amended, or the Securities Exchange Exchange Act of 1934, as amended. |
157
SIGNATURES
Pursuant to the requirements of Section 13 or 15(d) of the Securities Exchange Act of 1934, the registrant has duly caused this Annual Report on Form 10-K to be signed on its behalf by the undersigned thereunto duly authorized.
LAS VEGAS SANDS CORP. | |||
February 26, 2016 | /S/ SHELDON G. ADELSON | ||
Sheldon G. Adelson, Chairman of the Board and Chief Executive Officer | |||
Pursuant to the requirements of the Securities Exchange Act of 1934, this Annual Report on Form 10-K has been signed below by the following persons on behalf of the registrant and in the capacities and on the dates indicated.
Signature | Title | Date | ||
/S/ SHELDON G. ADELSON | Chairman of the Board, Chief | February 26, 2016 | ||
Sheldon G. Adelson | Executive Officer and Director | |||
/S/ ROBERT G. GOLDSTEIN | President, Chief Operating Officer | February 26, 2016 | ||
Robert G. Goldstein | and Director | |||
/S/ JASON N. ADER | Director | February 26, 2016 | ||
Jason N. Ader | ||||
/S/ IRWIN CHAFETZ | Director | February 26, 2016 | ||
Irwin Chafetz | ||||
/S/ MICHELINE CHAU | Director | February 26, 2016 | ||
Micheline Chau | ||||
/S/ CHARLES D. FORMAN | Director | February 26, 2016 | ||
Charles D. Forman | ||||
/S/ STEVEN L. GERARD | Director | February 26, 2016 | ||
Steven L. Gerard | ||||
/S/ GEORGE JAMIESON | Director | February 26, 2016 | ||
George Jamieson | ||||
/S/ CHARLES A. KOPPELMAN | Director | February 26, 2016 | ||
Charles A. Koppelman | ||||
/S/ MICHAEL A. LEVEN | Director | February 26, 2016 | ||
Michael A. Leven | ||||
/S/ DAVID F. LEVI | Director | February 26, 2016 | ||
David. F. Levi | ||||
Senior Vice President, Corporate Finance and Strategy | ||||
/S/ PATRICK DUMONT | February 26, 2016 | |||
Patrick Dumont | (Principal Financial Officer) | |||
/S/ STEPHANIE MARZ | Vice President, Corporate Accounting | February 26, 2016 | ||
Stephanie Marz | (Principal Accounting Officer) | |||
158