EX-99.2
Exhibit 99.2


Supplemental Operating and Financial Data
THIRD QUARTER: SEPTEMBER 30, 2013
This Supplemental Operating and Financial Data package is not an offer to sell or solicitation to buy securities of Digital Realty Trust, Inc.
Any offers to sell or solicitations to buy securities of Digital Realty Trust, Inc. shall be made only by means of a prospectus approved for that purpose.
DIGITAL REALTY TRUST, INC.
Third Quarter 2013
Page 2
DIGITAL REALTY TRUST, INC.
Third Quarter 2013
Statement Regarding Forward-Looking Statements
This supplemental package contains forward-looking statements within the meaning of the federal securities laws, including information related to trends,
leasing expectations, weighted average lease terms, the exercise of lease extensions, lease expirations, debt maturities, annualized rent at expiration of leases, the effect new leases and increases in rental rates will have on our rental revenue,
our credit ratings, construction and development activity, projected construction costs and other forward-looking financial data. Such statements are based on management’s beliefs and assumptions made based on information currently available to
management. Such statements are subject to risks, uncertainties and assumptions and are not guarantees of future performance and may be affected by known and unknown risks, trends, uncertainties and factors that are beyond our control. Should one or
more of these risks or uncertainties materialize, or should underlying assumptions prove incorrect, actual results may vary materially from those anticipated, estimated or projected. Some of the risks and uncertainties that may cause our actual
results, performance or achievements to differ materially from those expressed or implied by forward-looking statements include, among others, the following:
| |
• |
|
the impact of the recent deterioration in global economic, credit and market conditions, including the downgrade of the U.S. government’s credit rating; |
| |
• |
|
current local economic conditions in our geographic markets; |
| |
• |
|
decreases in information technology spending, including as a result of economic slowdowns or recession; |
| |
• |
|
adverse economic or real estate developments in our industry or the industry sectors that we sell to (including risks relating to decreasing real estate valuations and impairment charges); |
| |
• |
|
our dependence upon significant tenants; |
| |
• |
|
bankruptcy or insolvency of a major tenant or a significant number of smaller tenants; |
| |
• |
|
defaults on or non-renewal of leases by tenants; |
| |
• |
|
our failure to obtain necessary debt and equity financing; |
| |
• |
|
increased interest rates and operating costs; |
| |
• |
|
risks associated with using debt to fund our business activities, including re-financing and interest rate risks, our failure to repay debt when due, adverse changes in our credit ratings or our breach of covenants or
other terms contained in our loan facilities and agreements; |
| |
• |
|
financial market fluctuations; |
| |
• |
|
changes in foreign currency exchange rates; |
| |
• |
|
our inability to manage our growth effectively; |
| |
• |
|
difficulty acquiring or operating properties in foreign jurisdictions; |
| |
• |
|
our failure to successfully integrate and operate acquired or developed properties or businesses; |
| |
• |
|
the suitability of our properties and data center infrastructure, delays or disruptions in connectivity, failure of our physical infrastructure or services or availability of power; |
| |
• |
|
risks related to joint venture investments, including as a result of our lack of control of such investments; |
| |
• |
|
delays or unexpected costs in development of properties; |
| |
• |
|
decreased rental rates or increased vacancy rates; |
| |
• |
|
increased competition or available supply of data center space; |
| |
• |
|
our inability to successfully develop and lease new properties and space held for development; |
| |
• |
|
difficulties in identifying properties to acquire and completing acquisitions; |
| |
• |
|
our inability to acquire off-market properties; |
| |
• |
|
our inability to comply with the rules and regulations applicable to reporting companies; |
| |
• |
|
our failure to maintain our status as a REIT; |
| |
• |
|
possible adverse changes to tax laws; |
| |
• |
|
restrictions on our ability to engage in certain business activities; |
| |
• |
|
environmental uncertainties and risks related to natural disasters; |
| |
• |
|
losses in excess of our insurance coverage; |
| |
• |
|
changes in foreign laws and regulations, including those related to taxation and real estate ownership and operation; and |
| |
• |
|
changes in local, state and federal regulatory requirements, including changes in real estate and zoning laws and increases in real property tax rates. |
The risks included here are not exhaustive, and additional factors could adversely affect our business and financial performance. We discussed a number of
additional material risks in our annual report on Form 10-K for the year ended December 31, 2012, and other filings with the Securities and Exchange Commission. Those risks continue to be relevant to our performance and financial condition.
Moreover, we operate in a very competitive and rapidly changing environment. New risk factors emerge from time to time and it is not possible for management to predict all such risk factors, nor can it assess the impact of all such risk factors on
the business or the extent to which any factor, or combination of factors, may cause actual results to differ materially from those contained in any forward-looking statements. We expressly disclaim any responsibility to update forward-looking
statements, whether as a result of new information, future events or otherwise.
Page 3
DIGITAL REALTY TRUST, INC.
Third Quarter 2013
Corporate Information
Corporate Profile
Digital Realty Trust, Inc. owns,
acquires, develops and manages technology-related real estate. The Company is focused on providing datacenter solutions for domestic and international tenants across a variety of industry verticals ranging from financial services, cloud and
information technology services, to manufacturing, energy, healthcare, and consumer products. As of September 30, 2013, the Company’s 130 properties, including ten properties held as investments in unconsolidated managed joint ventures and
two properties held as investments in unconsolidated non-managed joint ventures, contain applications and operations critical to the day-to-day operations of technology industry tenants and corporate enterprise datacenter tenants. Comprising
approximately 21.0 million net rentable square feet, excluding approximately 2.8 million square feet of space held for development, Digital Realty’s portfolio is located throughout North America, Europe, Asia and Australia. For
additional information, please visit the Company’s website at www.digitalrealty.com.
Corporate Headquarters
Four Embarcadero Center, Suite 3200
San Francisco, California
94111
Telephone: (415) 738-6500
Facsimile:
(415) 738-6501
Web site: www.digitalrealty.com
Senior Management
Michael F. Foust: Chief Executive
Officer
A. William Stein: Chief Financial Officer and Chief Investment Officer
Scott E. Peterson: Chief Acquisitions Officer
David J. Caron:
Senior Vice President, Portfolio Management
Matthew Miszewski: Senior Vice President, Sales
Investor Relations
To request an Investor Relations
package or be added to our e-mail distribution list, please visit our website:
www.digitalrealty.com (Proceed to Information Request in the Investor Relations section)
Analyst Coverage
|
|
|
|
|
|
|
|
|
|
|
|
|
| Baird |
|
Bank of America
Merrill Lynch |
|
Barclays Capital |
|
Canaccord Genuity |
|
Cantor Fitzgerald |
|
Citigroup |
|
Deutsche Bank |
| Dave Rodgers |
|
James Feldman |
|
Ross Smotrich |
|
Greg Miller |
|
David Toti |
|
Michael Bilerman |
|
Vincent Chao |
| (216) 737-7341 |
|
(646) 855-5808 |
|
(212) 526-2306 |
|
(212) 389-8128 |
|
(212) 915-1219 |
|
(212) 816-1685 |
|
(212) 250-6799 |
|
|
|
|
|
|
|
|
|
Stephen Douglas |
|
|
|
Eric Z. Chu |
|
Evan Smith |
|
Emmanuel Korchman |
|
|
|
|
(646) 855-2615 |
|
|
|
(212) 389-8129 |
|
(212) 915-1220 |
|
(212) 816-1382 |
|
|
|
|
|
|
|
|
|
| Evercore |
|
Green Street |
|
ISI |
|
Jefferies |
|
JMP Securities |
|
KeyBanc Capital Markets |
|
Macquarie |
| Johnathan Schildkraut |
|
John Bejjani |
|
Steve Sakwa |
|
Omotayo Okusanya |
|
William C. Marks |
|
Jordan Sadler |
|
Rob Stevenson |
| (212) 497-0864 |
|
(949) 640-8780 |
|
(212) 446-9462 |
|
(212) 336-7076 |
|
(415) 835-8944 |
|
(917) 368-2280 |
|
(212) 231-8068 |
|
|
|
|
|
|
|
| Robert Gutman |
|
Michael Knott |
|
George Auerbach |
|
|
|
Mitch Germain |
|
Craig Mailman |
|
|
| (212) 497-0877 |
|
(949) 640-8780 |
|
(212) 446-9459 |
|
|
|
(212) 906-3546 |
|
(917) 368-2316 |
|
|
|
|
|
|
|
|
|
| MLV & Co. |
|
Morgan Stanley |
|
Raymond James |
|
RBC Capital Markets |
|
Stifel Nicolaus |
|
UBS |
|
|
| Jonathan M. Petersen |
|
Paul Morgan |
|
Paul D. Puryear |
|
Jonathan Atkin |
|
Todd Weller |
|
Ross Nussbaum |
|
|
| (646) 556-9185 |
|
(415) 576-2627 |
|
(727) 567-2253 |
|
(415) 633-8589 |
|
(443) 224-1305 |
|
(212) 713-2484 |
|
|
|
|
|
|
|
|
|
|
|
Vance Edelson |
|
William A. Crow |
|
|
|
Ben Lowe |
|
Gabriel Hilmoe |
|
|
|
|
(212) 761-0078 |
|
(727) 567-2594 |
|
|
|
(443) 224-1264 |
|
(212) 713-3876 |
|
|
This Supplemental Operating and Financial Data package supplements the information provided in our quarterly and annual
reports filed with the Securities and Exchange Commission. Additional information about us and our properties is also available at our website www.digitalrealty.com.
Page 4
DIGITAL REALTY TRUST, INC.
Third Quarter 2013
Corporate Information
Stock Listing Information
The stock of Digital Realty
Trust, Inc. is traded primarily on the New York Stock Exchange under the following symbols:
|
|
|
|
|
|
|
|
|
| Common Stock: |
|
|
|
|
|
|
|
DLR |
| Series E Preferred Stock: |
|
|
|
|
|
|
|
DLRPRE |
| Series F Preferred Stock: |
|
|
|
|
|
|
|
DLRPRF |
| Series G Preferred Stock: |
|
|
|
|
|
|
|
DLRPRG |
|
|
| Note that symbols may vary by stock quote provider. |
|
|
|
|
|
|
|
| Credit Ratings |
|
|
|
|
|
|
|
|
|
|
|
|
|
| Standard & Poors |
|
|
|
|
|
|
|
|
| Corporate Credit Rating |
|
|
|
BBB |
|
|
|
(Stable Outlook) |
| Preferred Stock |
|
|
|
BB+ |
|
|
|
|
|
|
|
|
|
| Moody’s |
|
|
|
|
|
|
|
|
| Issuer Rating |
|
|
|
Baa2 |
|
|
|
(Stable Outlook) |
| Preferred Stock |
|
|
|
Baa3 |
|
|
|
|
|
|
|
|
|
| Fitch |
|
|
|
|
|
|
|
|
| Issuer Default Rating |
|
|
|
BBB |
|
|
|
(Stable Outlook) |
| Preferred Stock |
|
|
|
BB+ |
|
|
|
|
These credit ratings may not reflect the potential impact of risks relating to the structure or trading of the Company’s
securities and are provided solely for informational purposes. Credit ratings are not recommendations to buy, sell or hold any security, and may be revised or withdrawn at any time by the issuing organization in its sole discretion. The Company does
not undertake any obligation to maintain the ratings or to advise of any change in ratings. Each agency’s rating should be evaluated independently of any other agency’s rating. An explanation of the significance of the ratings may be
obtained from each of the rating agencies.
Common Stock Price Performance
The following summarizes recent activity of Digital Realty’s common stock (DLR):
|
|
|
|
|
|
|
|
|
|
|
|
|
|
|
|
|
|
|
|
|
|
|
|
|
|
|
|
|
| |
|
3rd Quarter
2013 |
|
|
2nd Quarter
2013 |
|
|
1st Quarter
2013 |
|
|
4th Quarter
2012 |
|
|
3rd Quarter
2012 |
|
|
2nd Quarter
2012 |
|
|
1st Quarter
2012 |
|
| High Price * |
|
$ |
65.43 |
|
|
$ |
74.00 |
|
|
$ |
72.92 |
|
|
$ |
70.16 |
|
|
$ |
80.59 |
|
|
$ |
76.04 |
|
|
$ |
74.04 |
|
| Low Price * |
|
$ |
50.98 |
|
|
$ |
56.02 |
|
|
$ |
62.75 |
|
|
$ |
59.25 |
|
|
$ |
66.70 |
|
|
$ |
67.84 |
|
|
$ |
65.00 |
|
| Closing Price, end of quarter * |
|
$ |
53.10 |
|
|
$ |
61.00 |
|
|
$ |
66.91 |
|
|
$ |
67.89 |
|
|
$ |
69.85 |
|
|
$ |
75.07 |
|
|
$ |
73.97 |
|
| Average daily trading volume * |
|
|
1,571,339 |
|
|
|
1,680,636 |
|
|
|
1,420,527 |
|
|
|
1,389,261 |
|
|
|
1,215,760 |
|
|
|
1,073,521 |
|
|
|
1,026,947 |
|
| Indicated dividend per common share ** |
|
$ |
3.12 |
|
|
$ |
3.12 |
|
|
$ |
3.12 |
|
|
$ |
2.92 |
|
|
$ |
2.92 |
|
|
$ |
2.92 |
|
|
$ |
2.92 |
|
| Closing annual dividend yield, end of quarter |
|
|
5.9 |
% |
|
|
5.1 |
% |
|
|
4.7 |
% |
|
|
4.3 |
% |
|
|
4.2 |
% |
|
|
3.9 |
% |
|
|
3.9 |
% |
| Closing shares and units outstanding, end of quarter *** |
|
|
131,421,001 |
|
|
|
131,418,758 |
|
|
|
131,410,505 |
|
|
|
127,992,183 |
|
|
|
127,887,458 |
|
|
|
115,050,528 |
|
|
|
112,215,683 |
|
| Closing market value of shares and units outstanding (thousands), end of quarter |
|
$ |
6,978,455 |
|
|
$ |
8,016,544 |
|
|
$ |
8,792,677 |
|
|
$ |
8,689,389 |
|
|
$ |
8,932,939 |
|
|
$ |
8,636,843 |
|
|
$ |
8,300,594 |
|
| * |
New York Stock Exchange trades only. |
| ** |
On an annualized basis. |
| *** |
As of September 30, 2013, the total number of shares and units includes 128,438,970 common stock, 1,500,814 common units held by third parties and 1,481,217 common units, vested and unvested long-term incentive
units and vested class C units held by officers and directors, and excludes all unexercised common stock options and all shares potentially issuable upon exchange of our 5.50% exchangeable senior debentures due 2029 or upon conversion of our series
E, series F and series G cumulative redeemable preferred stock upon certain change of control transactions. |
This Supplemental
Operating and Financial Data package supplements the information provided in our quarterly and annual reports filed with the Securities and Exchange Commission. Additional information about us and our properties is also available at our website
www.digitalrealty.com.
Page 5
DIGITAL REALTY TRUST, INC.
Third Quarter 2013
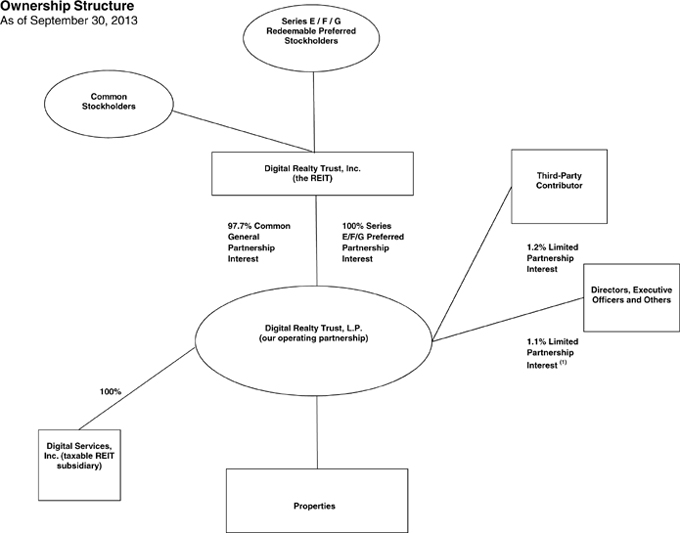
|
|
|
|
|
|
|
|
|
| Partner |
|
# of Units (2) |
|
|
% Ownership |
|
| Digital Realty Trust, Inc. |
|
|
128,438,970 |
|
|
|
97.7 |
% |
| Cambay Tele.com, LLC (3) |
|
|
1,500,814 |
|
|
|
1.2 |
% |
| Directors, Executive Officers and Others |
|
|
1,481,217 |
|
|
|
1.1 |
% |
|
|
|
|
|
|
|
|
|
| Total |
|
|
131,421,001 |
|
|
|
100.0 |
% |
|
|
|
|
|
|
|
|
|
| (1) |
Reflects limited partnership interests held by our officers and directors in the form of common units, vested and unvested long-term incentive units and vested class C units and excludes all unexercised common stock
options. |
| (2) |
The total number of units includes 128,438,970 common units, 1,500,814 common units held by third parties and 1,481,217 common units, vested and unvested long-term incentive units and vested class C units held by
officers and directors, and excludes all unexercised common stock options and all shares potentially issuable upon exchange of our 5.50% exchangeable senior debentures due 2029 or upon conversion of our series E, series F and series G cumulative
redeemable preferred stock upon certain change of control transactions. |
| (3) |
This third-party contributor received the common units (along with cash and our operating partnership’s assumption of debt) in exchange for their interests in 200 Paul Avenue 1-4, 1100 Space Park Drive, the
eXchange colocation business and other specified assets and liabilities. Includes 403,913 common units held by the members of Cambay Tele.com, LLC. |
Page 6
DIGITAL REALTY TRUST, INC.
Third Quarter 2013
Key Quarterly Financial Data
(Unaudited and dollars in thousands, except per share data)
|
|
|
|
|
|
|
|
|
|
|
|
|
|
|
|
|
|
|
|
|
|
|
|
|
|
|
|
|
| |
|
30-Sep-13 |
|
|
30-Jun-13 |
|
|
31-Mar-13 |
|
|
31-Dec-12 |
|
|
30-Sep-12 |
|
|
30-Jun-12 |
|
|
31-Mar-12 |
|
| Shares and Units at End of Quarter |
|
|
|
|
|
|
|
|
|
|
|
|
|
|
|
|
|
|
|
|
|
|
|
|
| Common shares outstanding |
|
|
128,438,970 |
|
|
|
128,421,888 |
|
|
|
128,413,791 |
|
|
|
125,140,783 |
|
|
|
123,261,390 |
|
|
|
110,268,388 |
|
|
|
107,342,049 |
|
| Common units outstanding |
|
|
2,982,031 |
|
|
|
2,996,870 |
|
|
|
2,996,714 |
|
|
|
2,851,400 |
|
|
|
4,626,068 |
|
|
|
4,782,140 |
|
|
|
4,873,634 |
|
|
|
|
|
|
|
|
|
|
|
|
|
|
|
|
|
|
|
|
|
|
|
|
|
|
|
|
|
|
| Total shares and operating partnership units |
|
|
131,421,001 |
|
|
|
131,418,758 |
|
|
|
131,410,505 |
|
|
|
127,992,183 |
|
|
|
127,887,458 |
|
|
|
115,050,528 |
|
|
|
112,215,683 |
|
|
|
|
|
|
|
|
|
|
|
|
|
|
|
|
|
|
|
|
|
|
|
|
|
|
|
|
|
|
| Enterprise Value |
|
|
|
|
|
|
|
|
|
|
|
|
|
|
|
|
|
|
|
|
|
|
|
|
| Market value of common equity (1) |
|
$ |
6,978,455 |
|
|
$ |
8,016,544 |
|
|
$ |
8,792,677 |
|
|
$ |
8,689,389 |
|
|
$ |
8,932,939 |
|
|
$ |
8,636,843 |
|
|
$ |
8,300,594 |
|
| Liquidation value of preferred equity |
|
|
720,000 |
|
|
|
720,000 |
|
|
|
470,000 |
|
|
|
593,413 |
|
|
|
597,447 |
|
|
|
644,096 |
|
|
|
590,081 |
|
| Total debt at balance sheet carrying value |
|
|
4,780,397 |
|
|
|
4,698,248 |
|
|
|
4,682,124 |
|
|
|
4,278,565 |
|
|
|
4,080,073 |
|
|
|
3,400,212 |
|
|
|
3,271,848 |
|
|
|
|
|
|
|
|
|
|
|
|
|
|
|
|
|
|
|
|
|
|
|
|
|
|
|
|
|
|
| Total enterprise value |
|
$ |
12,478,852 |
|
|
$ |
13,434,792 |
|
|
$ |
13,944,801 |
|
|
$ |
13,561,367 |
|
|
$ |
13,610,459 |
|
|
$ |
12,681,151 |
|
|
$ |
12,162,523 |
|
|
|
|
|
|
|
|
|
|
|
|
|
|
|
|
|
|
|
|
|
|
|
|
|
|
|
|
|
|
| Total debt/Total enterprise value |
|
|
38.3 |
% |
|
|
35.0 |
% |
|
|
33.6 |
% |
|
|
31.5 |
% |
|
|
30.0 |
% |
|
|
26.8 |
% |
|
|
26.9 |
% |
| Selected Balance Sheet Data |
|
|
|
|
|
|
|
|
|
|
|
|
|
|
|
|
|
|
|
|
|
|
|
|
| Investments in real estate (before depreciation) |
|
$ |
9,576,467 |
|
|
$ |
9,335,886 |
|
|
$ |
9,011,433 |
|
|
$ |
8,809,153 |
|
|
$ |
8,430,710 |
|
|
$ |
6,828,926 |
|
|
$ |
6,511,710 |
|
| Total assets |
|
|
9,426,041 |
|
|
|
9,184,859 |
|
|
|
8,971,492 |
|
|
|
8,819,214 |
|
|
|
8,512,598 |
|
|
|
6,717,113 |
|
|
|
6,418,061 |
|
| Total liabilities |
|
|
5,745,472 |
|
|
|
5,601,589 |
|
|
|
5,589,544 |
|
|
|
5,320,830 |
|
|
|
4,985,042 |
|
|
|
3,978,929 |
|
|
|
3,785,077 |
|
| Selected Operating Data |
|
|
|
|
|
|
|
|
|
|
|
|
|
|
|
|
|
|
|
|
|
|
|
|
| Total operating revenues |
|
$ |
379,456 |
|
|
$ |
363,502 |
|
|
$ |
358,370 |
|
|
$ |
349,736 |
|
|
$ |
342,479 |
|
|
$ |
303,704 |
|
|
$ |
283,148 |
|
| Total operating expenses |
|
|
294,279 |
|
|
|
263,508 |
|
|
|
259,784 |
|
|
|
255,098 |
|
|
|
245,404 |
|
|
|
215,255 |
|
|
|
197,232 |
|
| Interest expense |
|
|
47,742 |
|
|
|
47,583 |
|
|
|
48,078 |
|
|
|
40,350 |
|
|
|
41,047 |
|
|
|
37,681 |
|
|
|
38,030 |
|
| Net income |
|
|
153,480 |
|
|
|
59,621 |
|
|
|
51,681 |
|
|
|
55,895 |
|
|
|
56,921 |
|
|
|
53,968 |
|
|
|
49,263 |
|
| Net income available to common stockholders |
|
|
138,872 |
|
|
|
47,077 |
|
|
|
42,657 |
|
|
|
44,815 |
|
|
|
45,615 |
|
|
|
42,021 |
|
|
|
39,211 |
|
| Financial Ratios |
|
|
|
|
|
|
|
|
|
|
|
|
|
|
|
|
|
|
|
|
|
|
|
|
| EBITDA (2) |
|
$ |
308,868 |
|
|
$ |
211,238 |
|
|
$ |
203,561 |
|
|
$ |
192,893 |
|
|
$ |
189,212 |
|
|
$ |
170,211 |
|
|
$ |
161,957 |
|
| Adjusted EBITDA (3) |
|
$ |
217,577 |
|
|
$ |
223,782 |
|
|
$ |
212,585 |
|
|
$ |
203,973 |
|
|
$ |
200,518 |
|
|
$ |
182,158 |
|
|
$ |
172,009 |
|
| Cash interest expense (4) |
|
$ |
68,020 |
|
|
$ |
35,563 |
|
|
$ |
56,163 |
|
|
$ |
30,311 |
|
|
$ |
54,517 |
|
|
$ |
27,447 |
|
|
$ |
53,876 |
|
| Fixed charges (5) |
|
$ |
82,894 |
|
|
$ |
50,735 |
|
|
$ |
68,113 |
|
|
$ |
43,829 |
|
|
$ |
67,919 |
|
|
$ |
42,646 |
|
|
$ |
66,477 |
|
| Debt service coverage ratio (6) |
|
|
3.2 |
x |
|
|
6.3 |
x |
|
|
3.8 |
x |
|
|
6.7 |
x |
|
|
3.7 |
x |
|
|
6.6 |
x |
|
|
3.2 |
x |
| Fixed charge coverage ratio (7) |
|
|
2.6 |
x |
|
|
4.4 |
x |
|
|
3.1 |
x |
|
|
4.7 |
x |
|
|
3.0 |
x |
|
|
4.3 |
x |
|
|
2.6 |
x |
| Profitability Measures |
|
|
|
|
|
|
|
|
|
|
|
|
|
|
|
|
|
|
|
|
|
|
|
|
| Net income per common share—basic |
|
$ |
1.08 |
|
|
$ |
0.37 |
|
|
$ |
0.34 |
|
|
$ |
0.36 |
|
|
$ |
0.37 |
|
|
$ |
0.38 |
|
|
$ |
0.37 |
|
| Net income per common share—diluted |
|
$ |
1.06 |
|
|
$ |
0.37 |
|
|
$ |
0.34 |
|
|
$ |
0.36 |
|
|
$ |
0.37 |
|
|
$ |
0.38 |
|
|
$ |
0.36 |
|
| Funds From Operations (FFO) per diluted share and unit (8) |
|
$ |
1.10 |
|
|
$ |
1.22 |
|
|
$ |
1.16 |
|
|
$ |
1.16 |
|
|
$ |
1.13 |
|
|
$ |
1.09 |
|
|
$ |
1.06 |
|
| Adjusted Funds From Operations (AFFO) per diluted share and unit (9) |
|
$ |
0.92 |
|
|
$ |
0.95 |
|
|
$ |
0.92 |
|
|
$ |
0.88 |
|
|
$ |
0.88 |
|
|
$ |
0.86 |
|
|
$ |
0.86 |
|
| Dividends per share and common unit |
|
$ |
0.78 |
|
|
$ |
0.78 |
|
|
$ |
0.78 |
|
|
$ |
0.73 |
|
|
$ |
0.73 |
|
|
$ |
0.73 |
|
|
$ |
0.73 |
|
| Diluted FFO payout ratio (10) |
|
|
71.0 |
% |
|
|
64.1 |
% |
|
|
67.5 |
% |
|
|
63.0 |
% |
|
|
64.8 |
% |
|
|
67.1 |
% |
|
|
69.1 |
% |
| Diluted AFFO payout ratio (9) (11) |
|
|
84.7 |
% |
|
|
82.1 |
% |
|
|
85.2 |
% |
|
|
82.6 |
% |
|
|
82.6 |
% |
|
|
85.4 |
% |
|
|
84.6 |
% |
| Portfolio Statistics |
|
|
|
|
|
|
|
|
|
|
|
|
|
|
|
|
|
|
|
|
|
|
|
|
| Buildings (12) |
|
|
188 |
|
|
|
187 |
|
|
|
178 |
|
|
|
171 |
|
|
|
164 |
|
|
|
158 |
|
|
|
152 |
|
| Properties (12) |
|
|
130 |
|
|
|
129 |
|
|
|
127 |
|
|
|
122 |
|
|
|
115 |
|
|
|
110 |
|
|
|
107 |
|
| Net rentable square feet, excluding development space (12) |
|
|
21,033,398 |
|
|
|
20,948,042 |
|
|
|
20,606,509 |
|
|
|
19,889,396 |
|
|
|
19,322,704 |
|
|
|
18,282,226 |
|
|
|
17,629,567 |
|
| Square feet held for development (13) |
|
|
2,817,984 |
|
|
|
2,798,241 |
|
|
|
2,588,034 |
|
|
|
2,427,257 |
|
|
|
2,242,204 |
|
|
|
2,177,144 |
|
|
|
2,189,203 |
|
| Occupancy at end of quarter (14) |
|
|
93.0 |
% |
|
|
93.1 |
% |
|
|
94.0 |
% |
|
|
94.4 |
% |
|
|
94.2 |
% |
|
|
93.5 |
% |
|
|
94.8 |
% |
| Weighted average remaining lease term (years) (15) |
|
|
6.9 |
|
|
|
7.1 |
|
|
|
6.9 |
|
|
|
6.9 |
|
|
|
7.0 |
|
|
|
7.0 |
|
|
|
7.0 |
|
| Same store occupancy at end of quarter (14) (16) |
|
|
91.8 |
% |
|
|
92.3 |
% |
|
|
93.1 |
% |
|
|
93.7 |
% |
|
|
94.2 |
% |
|
|
93.2 |
% |
|
|
94.6 |
% |
| (1) |
The market value of common equity is based on the closing stock price at the end of the quarter and assumes 100% redemption of the limited partnership units in our operating partnership, including common units and
vested and unvested long-term incentive units (including vested class C units), for shares of our common stock. Excludes shares issuable with respect to stock options that have been granted but have not yet been exercised, and also excludes all
shares potentially issuable upon exchange of our 5.50% exchangeable senior debentures due 2029 or upon conversion of our series E, series F and series G cumulative redeemable preferred stock upon certain change of control transactions.
|
| (2) |
EBITDA is calculated as earnings before interest, taxes, depreciation and amortization. For a discussion of EBITDA, see page 35. For a reconciliation of net income available to common stockholders to EBITDA, see page
12. |
| (3) |
Adjusted EBITDA is EBITDA adjusted for straight-line rent expense adjustment attributable to prior periods, gain on contribution of properties to unconsolidated joint venture, preferred dividends and non-controlling
interests. For a discussion of Adjusted EBITDA, see page 35. For a reconciliation of net income available to common stockholders to Adjusted EBITDA, see page 12. |
| (4) |
Cash interest expense is interest expense per our statement of operations less amortization of debt discount and deferred financing fees and includes interest that we capitalized. For a reconciliation of GAAP interest
expense to cash interest expense, see page 12. |
| (5) |
Fixed charges consist of cash interest expense, scheduled debt principal payments and preferred dividends. |
| (6) |
Debt service coverage ratio is Adjusted EBITDA divided by cash interest expense. |
| (7) |
Fixed charge coverage ratio is Adjusted EBITDA divided by fixed charges. |
| (8) |
For a definition and discussion of FFO, see page 35. For a reconciliation of net income available to common stockholders to FFO, see page 10. |
| (9) |
All periods presented include internal leasing commissions, the amounts of which have historically been included in capitalized leasing commissions and were previously excluded from recurring capital expenditures. For a
definition and discussion of AFFO, see page 35. For a reconciliation of FFO to AFFO, see page 11. |
| (10) |
Diluted FFO payout ratio is dividends declared per common share and unit divided by diluted FFO per share and unit. |
| (11) |
Diluted AFFO payout ratio is dividends declared per common share and unit divided by diluted AFFO per share and unit. |
| (12) |
Includes properties held as investments in unconsolidated joint ventures. |
| (13) |
Development space requires significant capital investment in order to develop data center facilities that are ready for use. Most often this is shell space. However, in certain circumstances this may include
partially built datacenter space that was not completed by previous ownership and requires a large capital investment in order to build out the space. |
| (14) |
Occupancy and same store occupancy exclude space held for development and non-managed properties held as investments in unconsolidated joint ventures. For some of our properties, we calculate occupancy based on factors
in addition to contractually leased square feet, including available power, required support space and common area. |
| (15) |
Weighted average remaining lease term excludes renewal options and is weighted by net rentable square feet. |
| (16) |
Same store properties were acquired before December 31, 2011. |
Page 7
DIGITAL REALTY TRUST, INC.
Third Quarter 2013
Consolidated Balance Sheets
(Dollars in thousands, except per share data)
|
|
|
|
|
|
|
|
|
| |
|
September 30, 2013 |
|
|
December 31, 2012 |
|
| ASSETS |
|
|
(unaudited |
) |
|
|
|
|
| Investments in real estate |
|
|
|
|
|
|
|
|
| Land |
|
$ |
684,644 |
|
|
$ |
661,058 |
|
| Acquired ground leases |
|
|
14,355 |
|
|
|
13,658 |
|
| Buildings and improvements |
|
|
8,357,786 |
|
|
|
7,662,973 |
|
| Tenant improvements |
|
|
466,616 |
|
|
|
404,830 |
|
|
|
|
|
|
|
|
|
|
| Investments in real estate |
|
|
9,523,401 |
|
|
|
8,742,519 |
|
| Accumulated depreciation and amortization |
|
|
(1,459,055 |
) |
|
|
(1,206,017 |
) |
|
|
|
|
|
|
|
|
|
| Net investments in properties |
|
|
8,064,346 |
|
|
|
7,536,502 |
|
| Land held for sale |
|
|
11,015 |
|
|
|
— |
|
| Investment in unconsolidated joint ventures |
|
|
53,066 |
|
|
|
66,634 |
|
|
|
|
|
|
|
|
|
|
| Net investments in real estate |
|
|
8,128,427 |
|
|
|
7,603,136 |
|
| Cash and cash equivalents |
|
|
55,118 |
|
|
|
56,281 |
|
| Accounts and other receivables, net of allowance for doubtful accounts of $5,269 and $3,609 as of September 30, 2013 and
December 31, 2012, respectively |
|
|
191,715 |
|
|
|
168,286 |
|
| Deferred rent |
|
|
369,979 |
|
|
|
321,715 |
|
| Acquired above market leases, net |
|
|
54,446 |
|
|
|
65,055 |
|
| Acquired in place lease value and deferred leasing costs, net |
|
|
484,445 |
|
|
|
495,205 |
|
| Deferred financing costs, net |
|
|
39,132 |
|
|
|
30,621 |
|
| Restricted cash |
|
|
42,457 |
|
|
|
44,050 |
|
| Other assets |
|
|
60,322 |
|
|
|
34,865 |
|
|
|
|
|
|
|
|
|
|
| Total Assets |
|
$ |
9,426,041 |
|
|
$ |
8,819,214 |
|
|
|
|
|
|
|
|
|
|
| LIABILITIES AND EQUITY |
|
|
|
|
|
|
|
|
| Global revolving credit facility |
|
$ |
498,082 |
|
|
$ |
723,729 |
|
| Unsecured term loan |
|
|
950,205 |
|
|
|
757,839 |
|
| Unsecured senior notes, net of discount |
|
|
2,382,059 |
|
|
|
1,738,221 |
|
| Exchangeable senior debentures |
|
|
266,400 |
|
|
|
266,400 |
|
| Mortgage loans, net of premiums |
|
|
683,651 |
|
|
|
792,376 |
|
| Accounts payable and other accrued liabilities |
|
|
652,720 |
|
|
|
646,427 |
|
| Accrued dividends and distributions |
|
|
— |
|
|
|
93,434 |
|
| Acquired below market leases, net |
|
|
133,625 |
|
|
|
148,233 |
|
| Security deposits and prepaid rents |
|
|
178,730 |
|
|
|
154,171 |
|
|
|
|
|
|
|
|
|
|
| Total Liabilities |
|
|
5,745,472 |
|
|
|
5,320,830 |
|
|
|
|
|
|
|
|
|
|
| Commitments and contingencies |
|
|
— |
|
|
|
— |
|
| EQUITY: |
|
|
|
|
|
|
|
|
| Stockholders’ equity: |
|
|
|
|
|
|
|
|
| Preferred Stock: $0.01 par value per share, 70,000,000 shares authorized: |
|
|
|
|
|
|
|
|
| Series D Cumulative Convertible Preferred Stock, 5.500%, $0 and $123,413 liquidation preference, respectively ($25.00 per share), 0 and
4,936,505 shares issued and outstanding as of September 30, 2013 and December 31, 2012, respectively |
|
|
— |
|
|
|
119,348 |
|
| Series E Cumulative Redeemable Preferred Stock, 7.000%, $287,500 and $287,500 liquidation preference, respectively ($25.00 per share),
11,500,000 and 11,500,000 shares issued and outstanding as of September 30, 2013 and December 31, 2012, respectively |
|
|
277,172 |
|
|
|
277,172 |
|
| Series F Cumulative Redeemable Preferred Stock, 6.625%, $182,500 and $182,500 liquidation preference, respectively ($25.00 per share),
7,300,000 and 7,300,000 shares issued and outstanding as of September 30, 2013 and December 31, 2012, respectively |
|
|
176,191 |
|
|
|
176,191 |
|
| Series G Cumulative Redeemable Preferred Stock, 5.875%, $250,000 and $0 liquidation preference, respectively ($25.00 per share),
10,000,000 and 0 shares issued and outstanding as of September 30, 2013 and December 31, 2012, respectively |
|
|
241,511 |
|
|
|
— |
|
| Common Stock: $0.01 par value per share, 215,000,000 shares authorized, 128,438,970 and 125,140,783 shares issued and outstanding as of
September 30, 2013 and December 31, 2012, respectively |
|
|
1,279 |
|
|
|
1,247 |
|
| Additional paid-in capital |
|
|
3,685,668 |
|
|
|
3,562,642 |
|
| Dividends in excess of earnings |
|
|
(728,012 |
) |
|
|
(656,104 |
) |
| Accumulated other comprehensive income, net |
|
|
(10,327 |
) |
|
|
(12,191 |
) |
|
|
|
|
|
|
|
|
|
| Total stockholders’ equity |
|
|
3,643,482 |
|
|
|
3,468,305 |
|
|
|
|
|
|
|
|
|
|
| Noncontrolling interests: |
|
|
|
|
|
|
|
|
| Noncontrolling interest in operating partnership |
|
|
30,264 |
|
|
|
24,135 |
|
| Noncontrolling interest in consolidated joint ventures |
|
|
6,823 |
|
|
|
5,944 |
|
|
|
|
|
|
|
|
|
|
| Total noncontrolling interests |
|
|
37,087 |
|
|
|
30,079 |
|
|
|
|
|
|
|
|
|
|
| Total Equity |
|
|
3,680,569 |
|
|
|
3,498,384 |
|
|
|
|
|
|
|
|
|
|
| Total Liabilities and Equity |
|
$ |
9,426,041 |
|
|
$ |
8,819,214 |
|
|
|
|
|
|
|
|
|
|
Page 8
DIGITAL REALTY TRUST, INC.
Third Quarter 2013
Consolidated Quarterly Statements of Operations
(unaudited and in thousands, except share and per share data)
|
|
|
|
|
|
|
|
|
|
|
|
|
|
|
|
|
|
|
|
|
|
|
|
|
|
|
|
|
| |
|
Three Months Ended |
|
| |
|
30-Sep-13 |
|
|
30-Jun-13 |
|
|
31-Mar-13 |
|
|
31-Dec-12 |
|
|
30-Sep-12 |
|
|
30-Jun-12 |
|
|
31-Mar-12 |
|
| Rental |
|
$ |
290,712 |
|
|
$ |
285,953 |
|
|
$ |
281,399 |
|
|
$ |
272,906 |
|
|
$ |
260,052 |
|
|
$ |
234,923 |
|
|
$ |
222,834 |
|
| Tenant reimbursements—Utilities |
|
|
59,936 |
|
|
|
54,397 |
|
|
|
51,245 |
|
|
|
50,085 |
|
|
|
56,126 |
|
|
|
41,931 |
|
|
|
37,378 |
|
| Tenant reimbursements—Other |
|
|
28,123 |
|
|
|
22,284 |
|
|
|
24,672 |
|
|
|
25,062 |
|
|
|
22,752 |
|
|
|
18,491 |
|
|
|
20,484 |
|
| Construction management |
|
|
671 |
|
|
|
728 |
|
|
|
806 |
|
|
|
1,525 |
|
|
|
2,497 |
|
|
|
1,954 |
|
|
|
2,452 |
|
| Other |
|
|
14 |
|
|
|
140 |
|
|
|
248 |
|
|
|
158 |
|
|
|
1,052 |
|
|
|
6,405 |
|
|
|
— |
|
|
|
|
|
|
|
|
|
|
|
|
|
|
|
|
|
|
|
|
|
|
|
|
|
|
|
|
|
|
| Total operating revenues |
|
|
379,456 |
|
|
|
363,502 |
|
|
|
358,370 |
|
|
|
349,736 |
|
|
|
342,479 |
|
|
|
303,704 |
|
|
|
283,148 |
|
|
|
|
|
|
|
|
|
|
|
|
|
|
|
|
|
|
|
|
|
|
|
|
|
|
|
|
|
|
| Utilities |
|
|
65,055 |
|
|
|
57,142 |
|
|
|
53,972 |
|
|
|
53,040 |
|
|
|
58,866 |
|
|
|
43,622 |
|
|
|
39,352 |
|
| Rental property operating |
|
|
28,460 |
|
|
|
26,911 |
|
|
|
29,180 |
|
|
|
25,044 |
|
|
|
25,914 |
|
|
|
24,065 |
|
|
|
19,768 |
|
| Repairs and maintenance |
|
|
24,788 |
|
|
|
22,283 |
|
|
|
23,628 |
|
|
|
28,011 |
|
|
|
21,880 |
|
|
|
19,889 |
|
|
|
20,725 |
|
| Non-cash straight-line rent expense adjustment |
|
|
9,988 |
|
|
|
— |
|
|
|
— |
|
|
|
— |
|
|
|
— |
|
|
|
— |
|
|
|
— |
|
| Property taxes |
|
|
26,074 |
|
|
|
19,374 |
|
|
|
21,042 |
|
|
|
19,682 |
|
|
|
17,982 |
|
|
|
15,769 |
|
|
|
16,042 |
|
| Insurance |
|
|
2,144 |
|
|
|
2,238 |
|
|
|
2,205 |
|
|
|
2,647 |
|
|
|
2,463 |
|
|
|
2,260 |
|
|
|
2,230 |
|
| Construction management |
|
|
51 |
|
|
|
294 |
|
|
|
384 |
|
|
|
184 |
|
|
|
623 |
|
|
|
596 |
|
|
|
193 |
|
| Depreciation and amortization |
|
|
121,198 |
|
|
|
115,867 |
|
|
|
111,623 |
|
|
|
107,718 |
|
|
|
101,840 |
|
|
|
89,000 |
|
|
|
83,995 |
|
| General and administrative |
|
|
16,275 |
|
|
|
17,891 |
|
|
|
15,951 |
|
|
|
13,441 |
|
|
|
14,409 |
|
|
|
15,109 |
|
|
|
14,250 |
|
| Transactions |
|
|
243 |
|
|
|
1,491 |
|
|
|
1,763 |
|
|
|
5,331 |
|
|
|
504 |
|
|
|
4,608 |
|
|
|
677 |
|
| Other |
|
|
3 |
|
|
|
17 |
|
|
|
36 |
|
|
|
— |
|
|
|
923 |
|
|
|
337 |
|
|
|
— |
|
|
|
|
|
|
|
|
|
|
|
|
|
|
|
|
|
|
|
|
|
|
|
|
|
|
|
|
|
|
| Total operating expenses |
|
|
294,279 |
|
|
|
263,508 |
|
|
|
259,784 |
|
|
|
255,098 |
|
|
|
245,404 |
|
|
|
215,255 |
|
|
|
197,232 |
|
|
|
|
|
|
|
|
|
|
|
|
|
|
|
|
|
|
|
|
|
|
|
|
|
|
|
|
|
|
| Operating income |
|
|
85,177 |
|
|
|
99,994 |
|
|
|
98,586 |
|
|
|
94,638 |
|
|
|
97,075 |
|
|
|
88,449 |
|
|
|
85,916 |
|
| Equity in earnings of unconsolidated joint ventures |
|
|
2,174 |
|
|
|
2,330 |
|
|
|
2,335 |
|
|
|
1,733 |
|
|
|
1,520 |
|
|
|
3,493 |
|
|
|
1,389 |
|
| Gain on insurance settlement |
|
|
— |
|
|
|
5,597 |
|
|
|
— |
|
|
|
— |
|
|
|
— |
|
|
|
— |
|
|
|
— |
|
| Gain on contribution of properties to unconsolidated joint venture |
|
|
115,054 |
|
|
|
— |
|
|
|
— |
|
|
|
— |
|
|
|
— |
|
|
|
— |
|
|
|
— |
|
| Interest and other income |
|
|
(127 |
) |
|
|
(6 |
) |
|
|
41 |
|
|
|
(116 |
) |
|
|
83 |
|
|
|
1,216 |
|
|
|
709 |
|
| Interest expense |
|
|
(47,742 |
) |
|
|
(47,583 |
) |
|
|
(48,078 |
) |
|
|
(40,350 |
) |
|
|
(41,047 |
) |
|
|
(37,681 |
) |
|
|
(38,030 |
) |
| Tax expense |
|
|
(352 |
) |
|
|
(210 |
) |
|
|
(1,203 |
) |
|
|
(10 |
) |
|
|
(710 |
) |
|
|
(1,206 |
) |
|
|
(721 |
) |
| Loss from early extinguishment of debt |
|
|
(704 |
) |
|
|
(501 |
) |
|
|
— |
|
|
|
— |
|
|
|
— |
|
|
|
(303 |
) |
|
|
— |
|
|
|
|
|
|
|
|
|
|
|
|
|
|
|
|
|
|
|
|
|
|
|
|
|
|
|
|
|
|
| Net income |
|
|
153,480 |
|
|
|
59,621 |
|
|
|
51,681 |
|
|
|
55,895 |
|
|
|
56,921 |
|
|
|
53,968 |
|
|
|
49,263 |
|
| Net income attributable to noncontrolling interests |
|
|
(2,882 |
) |
|
|
(1,145 |
) |
|
|
(970 |
) |
|
|
(1,329 |
) |
|
|
(1,529 |
) |
|
|
(1,634 |
) |
|
|
(1,221 |
) |
|
|
|
|
|
|
|
|
|
|
|
|
|
|
|
|
|
|
|
|
|
|
|
|
|
|
|
|
|
| Net income attributable to Digital Realty Trust, Inc. |
|
|
150,598 |
|
|
|
58,476 |
|
|
|
50,711 |
|
|
|
54,566 |
|
|
|
55,392 |
|
|
|
52,334 |
|
|
|
48,042 |
|
| Preferred stock dividends |
|
|
(11,726 |
) |
|
|
(11,399 |
) |
|
|
(8,054 |
) |
|
|
(9,751 |
) |
|
|
(9,777 |
) |
|
|
(10,313 |
) |
|
|
(8,831 |
) |
|
|
|
|
|
|
|
|
|
|
|
|
|
|
|
|
|
|
|
|
|
|
|
|
|
|
|
|
|
| Net income available to common stockholders |
|
$ |
138,872 |
|
|
$ |
47,077 |
|
|
$ |
42,657 |
|
|
$ |
44,815 |
|
|
$ |
45,615 |
|
|
$ |
42,021 |
|
|
$ |
39,211 |
|
|
|
|
|
|
|
|
|
|
|
|
|
|
|
|
|
|
|
|
|
|
|
|
|
|
|
|
|
|
| Net income per share available to common stockholders—basic |
|
$ |
1.08 |
|
|
$ |
0.37 |
|
|
$ |
0.34 |
|
|
$ |
0.36 |
|
|
$ |
0.37 |
|
|
$ |
0.38 |
|
|
$ |
0.37 |
|
| Net income per share available to common stockholders—diluted |
|
$ |
1.06 |
|
|
$ |
0.37 |
|
|
$ |
0.34 |
|
|
$ |
0.36 |
|
|
$ |
0.37 |
|
|
$ |
0.38 |
|
|
$ |
0.36 |
|
| Weighted-average shares outstanding—basic |
|
|
128,427,444 |
|
|
|
128,419,745 |
|
|
|
126,445,285 |
|
|
|
123,824,957 |
|
|
|
122,026,421 |
|
|
|
109,761,017 |
|
|
|
107,099,856 |
|
| Weighted-average shares outstanding—diluted |
|
|
135,301,765 |
|
|
|
128,623,076 |
|
|
|
126,738,339 |
|
|
|
124,145,590 |
|
|
|
122,353,511 |
|
|
|
110,166,082 |
|
|
|
107,584,856 |
|
| Weighted-average fully diluted shares and units |
|
|
137,851,514 |
|
|
|
131,177,283 |
|
|
|
129,181,095 |
|
|
|
127,835,847 |
|
|
|
126,569,841 |
|
|
|
114,505,563 |
|
|
|
111,917,822 |
|
Page 9
DIGITAL REALTY TRUST, INC.
Third Quarter 2013
Funds From Operations (FFO)
(unaudited and in thousands, except per share data)
|
|
|
|
|
|
|
|
|
|
|
|
|
|
|
|
|
|
|
|
|
|
|
|
|
|
|
|
|
| |
|
Three Months Ended |
|
| |
|
30-Sep-13 |
|
|
30-Jun-13 |
|
|
31-Mar-13 |
|
|
31-Dec-12 |
|
|
30-Sep-12 |
|
|
30-Jun-12 |
|
|
31-Mar-12 |
|
| Reconciliation of net income available to common stockholders to FFO (Note): |
|
|
|
|
|
|
|
|
|
|
|
|
|
|
|
|
| Net income available to common stockholders |
|
$ |
138,872 |
|
|
$ |
47,077 |
|
|
$ |
42,657 |
|
|
$ |
44,815 |
|
|
$ |
45,615 |
|
|
$ |
42,021 |
|
|
$ |
39,211 |
|
| Adjustments: |
|
|
|
|
|
|
|
|
|
|
|
|
|
|
|
|
| Noncontrolling interests in operating partnership |
|
|
2,757 |
|
|
|
936 |
|
|
|
824 |
|
|
|
1,336 |
|
|
|
1,574 |
|
|
|
1,661 |
|
|
|
1,586 |
|
| Real estate related depreciation and amortization (1) |
|
|
120,006 |
|
|
|
114,913 |
|
|
|
110,690 |
|
|
|
106,797 |
|
|
|
100,994 |
|
|
|
88,186 |
|
|
|
82,993 |
|
| Real estate related depreciation and amortization related to investment in unconsolidated joint ventures |
|
|
788 |
|
|
|
797 |
|
|
|
833 |
|
|
|
727 |
|
|
|
710 |
|
|
|
866 |
|
|
|
905 |
|
| Gain on contribution of properties to unconsolidated joint venture |
|
|
(115,054 |
) |
|
|
— |
|
|
|
— |
|
|
|
— |
|
|
|
— |
|
|
|
— |
|
|
|
— |
|
| Gain on sale of assets held in unconsolidated joint venture |
|
|
— |
|
|
|
— |
|
|
|
— |
|
|
|
— |
|
|
|
— |
|
|
|
(2,325 |
) |
|
|
— |
|
|
|
|
|
|
|
|
|
|
|
|
|
|
|
|
|
|
|
|
|
|
|
|
|
|
|
|
|
|
| FFO available to common stockholders and unitholders |
|
$ |
147,369 |
|
|
$ |
163,723 |
|
|
$ |
155,004 |
|
|
$ |
153,675 |
|
|
$ |
148,893 |
|
|
$ |
130,409 |
|
|
$ |
124,695 |
|
|
|
|
|
|
|
|
|
|
|
|
|
|
|
|
|
|
|
|
|
|
|
|
|
|
|
|
|
|
| FFO per share and unit: |
|
|
|
|
|
|
|
|
|
|
|
|
|
|
|
|
| Basic |
|
$ |
1.13 |
|
|
$ |
1.25 |
|
|
$ |
1.20 |
|
|
$ |
1.21 |
|
|
$ |
1.18 |
|
|
$ |
1.14 |
|
|
$ |
1.12 |
|
| Diluted (2) |
|
$ |
1.10 |
|
|
$ |
1.22 |
|
|
$ |
1.16 |
|
|
$ |
1.16 |
|
|
$ |
1.13 |
|
|
$ |
1.09 |
|
|
$ |
1.06 |
|
|
|
|
|
|
|
|
|
|
|
|
|
|
|
|
|
|
|
|
|
|
|
|
|
|
|
|
|
|
| Weighted-average shares and units outstanding—basic |
|
|
130,977 |
|
|
|
130,974 |
|
|
|
128,888 |
|
|
|
127,515 |
|
|
|
126,243 |
|
|
|
114,100 |
|
|
|
111,433 |
|
| Weighted-average shares and units outstanding—diluted (2) |
|
|
137,851 |
|
|
|
137,787 |
|
|
|
137,680 |
|
|
|
137,510 |
|
|
|
137,304 |
|
|
|
125,824 |
|
|
|
125,482 |
|
| (1) Real estate related depreciation and amortization was computed as follows: |
|
|
|
|
|
|
|
|
|
|
|
|
|
|
|
|
|
|
|
|
| Depreciation and amortization per income statement |
|
$ |
121,198 |
|
|
$ |
115,867 |
|
|
$ |
111,623 |
|
|
$ |
107,718 |
|
|
$ |
101,840 |
|
|
$ |
89,000 |
|
|
$ |
83,995 |
|
| Non-real estate depreciation |
|
|
(1,192 |
) |
|
|
(954 |
) |
|
|
(933 |
) |
|
|
(921 |
) |
|
|
(846 |
) |
|
|
(814 |
) |
|
|
(1,002 |
) |
|
|
|
|
|
|
|
|
|
|
|
|
|
|
|
|
|
|
|
|
|
|
|
|
|
|
|
|
|
|
|
$ |
120,006 |
|
|
$ |
114,913 |
|
|
$ |
110,690 |
|
|
$ |
106,797 |
|
|
$ |
100,994 |
|
|
$ |
88,186 |
|
|
$ |
82,993 |
|
|
|
|
|
|
|
|
|
|
|
|
|
|
|
|
|
|
|
|
|
|
|
|
|
|
|
|
|
|
|
| (2) For the three months ended September 30, 2013, we have excluded the effect of dilutive
series E, series F and series G preferred stock, as applicable, that may be converted upon the occurrence of specified change in control transactions as described in the articles supplementary governing the series E, series F and series G preferred
stock, as applicable, which we consider highly improbable; if included, the dilutive effect for the three months ended September 30, 2013 would be 12,734. In addition, we had a balance of $266,400 of 5.50% exchangeable senior debentures due
2029 that were exchangeable for 6,684 common shares on a weighted average basis for the three months ended September 30, 2013. See below for calculations of diluted FFO available to common stockholders and unitholders and weighted average
common stock and units outstanding. |
|
|
|
|
|
|
|
|
|
| FFO available to common stockholders and unitholders |
|
$ |
147,369 |
|
|
$ |
163,723 |
|
|
$ |
155,004 |
|
|
$ |
153,675 |
|
|
$ |
148,893 |
|
|
$ |
130,409 |
|
|
$ |
124,695 |
|
| Add: Series C convertible preferred dividends |
|
|
— |
|
|
|
— |
|
|
|
— |
|
|
|
— |
|
|
|
— |
|
|
|
— |
|
|
|
1,402 |
|
| Add: Series D convertible preferred dividends |
|
|
— |
|
|
|
— |
|
|
|
— |
|
|
|
1,697 |
|
|
|
1,723 |
|
|
|
2,394 |
|
|
|
2,398 |
|
| Add: 5.50% exchangeable senior debentures interest expense |
|
|
4,050 |
|
|
|
4,050 |
|
|
|
4,050 |
|
|
|
4,050 |
|
|
|
4,050 |
|
|
|
4,050 |
|
|
|
4,050 |
|
|
|
|
|
|
|
|
|
|
|
|
|
|
|
|
|
|
|
|
|
|
|
|
|
|
|
|
|
|
| FFO available to common stockholders and unitholders — diluted |
|
$ |
151,419 |
|
|
$ |
167,773 |
|
|
$ |
159,054 |
|
|
$ |
159,422 |
|
|
$ |
154,666 |
|
|
$ |
136,853 |
|
|
$ |
132,545 |
|
|
|
|
|
|
|
|
|
|
|
|
|
|
|
|
|
|
|
|
|
|
|
|
|
|
|
|
|
|
| Weighted average common stock and units outstanding |
|
|
130,977 |
|
|
|
130,974 |
|
|
|
128,888 |
|
|
|
127,515 |
|
|
|
126,243 |
|
|
|
114,100 |
|
|
|
111,433 |
|
| Add: Effect of dilutive securities (excl. series C & D convert. preferred stock & 5.50% debentures) |
|
|
190 |
|
|
|
203 |
|
|
|
293 |
|
|
|
321 |
|
|
|
327 |
|
|
|
405 |
|
|
|
485 |
|
| Add: Effect of dilutive series C convertible preferred stock |
|
|
— |
|
|
|
— |
|
|
|
— |
|
|
|
— |
|
|
|
— |
|
|
|
489 |
|
|
|
2,785 |
|
| Add: Effect of dilutive series D convertible preferred stock |
|
|
— |
|
|
|
— |
|
|
|
1,909 |
|
|
|
3,143 |
|
|
|
4,219 |
|
|
|
4,374 |
|
|
|
4,337 |
|
| Add: Effect of dilutive 5.50% exchangeable senior debentures |
|
|
6,684 |
|
|
|
6,610 |
|
|
|
6,590 |
|
|
|
6,531 |
|
|
|
6,515 |
|
|
|
6,456 |
|
|
|
6,442 |
|
|
|
|
|
|
|
|
|
|
|
|
|
|
|
|
|
|
|
|
|
|
|
|
|
|
|
|
|
|
| Weighted average common stock and units outstanding — diluted |
|
|
137,851 |
|
|
|
137,787 |
|
|
|
137,680 |
|
|
|
137,510 |
|
|
|
137,304 |
|
|
|
125,824 |
|
|
|
125,482 |
|
|
|
|
|
|
|
|
|
|
|
|
|
|
|
|
|
|
|
|
|
|
|
|
|
|
|
|
|
|
Note: For a definition and discussion of FFO, see page 35.
Page 10
DIGITAL REALTY TRUST, INC.
Third Quarter 2013
Adjusted Funds From Operations (AFFO)
(Unaudited and in thousands)
|
|
|
|
|
|
|
|
|
|
|
|
|
|
|
|
|
|
|
|
|
|
|
|
|
|
|
|
|
| |
|
Three Months Ended |
|
| |
|
30-Sep-13 |
|
|
30-Jun-13 |
|
|
31-Mar-13 |
|
|
31-Dec-12 |
|
|
30-Sep-12 |
|
|
30-Jun-12 |
|
|
31-Mar-12 |
|
| Reconcillation of FFO to AFFO (Note): |
|
|
|
|
|
|
|
|
|
|
|
|
|
|
|
|
|
|
|
|
|
|
|
|
|
|
|
|
| FFO available to common stockholders and unitholders |
|
$ |
147,369 |
|
|
$ |
163,723 |
|
|
$ |
155,004 |
|
|
$ |
153,675 |
|
|
$ |
148,893 |
|
|
$ |
130,409 |
|
|
$ |
124,695 |
|
| Adjustments: |
|
|
|
|
|
|
|
|
|
|
|
|
|
|
|
|
|
|
|
|
|
|
|
|
|
|
|
|
| Non-real estate depreciation |
|
|
1,192 |
|
|
|
954 |
|
|
|
933 |
|
|
|
921 |
|
|
|
846 |
|
|
|
814 |
|
|
|
1,002 |
|
| Amortization of deferred financing costs |
|
|
2,831 |
|
|
|
2,471 |
|
|
|
2,431 |
|
|
|
2,359 |
|
|
|
2,328 |
|
|
|
1,799 |
|
|
|
2,214 |
|
| Amortization of debt discount |
|
|
418 |
|
|
|
418 |
|
|
|
605 |
|
|
|
340 |
|
|
|
260 |
|
|
|
250 |
|
|
|
247 |
|
| Non-cash compensation |
|
|
3,647 |
|
|
|
3,580 |
|
|
|
2,888 |
|
|
|
2,709 |
|
|
|
2,741 |
|
|
|
3,775 |
|
|
|
3,407 |
|
| Loss from early extinguishment of debt |
|
|
704 |
|
|
|
501 |
|
|
|
— |
|
|
|
— |
|
|
|
— |
|
|
|
303 |
|
|
|
— |
|
| Straight-line rents |
|
|
(19,661 |
) |
|
|
(19,892 |
) |
|
|
(21,169 |
) |
|
|
(20,004 |
) |
|
|
(20,221 |
) |
|
|
(19,649 |
) |
|
|
(15,902 |
) |
| Non-cash straight-line rent expense adjustment |
|
|
9,988 |
|
|
|
— |
|
|
|
— |
|
|
|
— |
|
|
|
— |
|
|
|
— |
|
|
|
— |
|
| Above and below market rent amortization |
|
|
(2,746 |
) |
|
|
(3,041 |
) |
|
|
(3,045 |
) |
|
|
(2,819 |
) |
|
|
(2,333 |
) |
|
|
(2,871 |
) |
|
|
(2,239 |
) |
| Change in fair value of contingent consideration (3) |
|
|
(943 |
) |
|
|
(370 |
) |
|
|
1,300 |
|
|
|
(1,051 |
) |
|
|
— |
|
|
|
— |
|
|
|
— |
|
| Capitalized leasing compensation |
|
|
(4,924 |
) |
|
|
(4,786 |
) |
|
|
(5,053 |
)(5) |
|
|
(4,008 |
) |
|
|
(3,847 |
) |
|
|
(3,334 |
) |
|
|
(3,913 |
) |
| Recurring capital expenditures (4) |
|
|
(12,895 |
) |
|
|
(13,429 |
) |
|
|
(9,860 |
) |
|
|
(14,432 |
) |
|
|
(11,015 |
) |
|
|
(9,229 |
) |
|
|
(6,754 |
) |
| Capitalized internal leasing commissions |
|
|
(2,077 |
) |
|
|
(3,331 |
) |
|
|
(2,025 |
) |
|
|
(1,877 |
) |
|
|
(2,040 |
) |
|
|
(1,100 |
) |
|
|
(2,284 |
) |
|
|
|
|
|
|
|
|
|
|
|
|
|
|
|
|
|
|
|
|
|
|
|
|
|
|
|
|
|
| AFFO available to common stockholders and unitholders |
|
$ |
122,903 |
|
|
$ |
126,798 |
|
|
$ |
122,009 |
|
|
$ |
115,813 |
|
|
$ |
115,612 |
|
|
$ |
101,167 |
|
|
$ |
100,473 |
|
|
|
|
|
|
|
|
|
|
|
|
|
|
|
|
|
|
|
|
|
|
|
|
|
|
|
|
|
|
| (3) |
Relates to earn-out contingency in connection with Sentrum Portfolio acquisition. |
| (4) |
For a definition, see page 31. |
| (5) |
Corrects understated amount in previously reported capitalized leasing compensation. |
Note: For a definition
and discussion of AFFO, see page 35. For a reconciliation of net income available to common stockholders to FFO, see above table.
Page 11
DIGITAL REALTY TRUST, INC.
Third Quarter 2013
Reconciliation of Earnings Before Interest, Taxes, Depreciation and
Amortization (EBITDA) (1)
(unaudited and in thousands)
|
|
|
|
|
|
|
|
|
|
|
|
|
|
|
|
|
|
|
|
|
|
|
|
|
|
|
|
|
| |
|
Three Months Ended |
|
| |
|
30-Sep-13 |
|
|
30-Jun-13 |
|
|
31-Mar-13 |
|
|
31-Dec-12 |
|
|
30-Sep-12 |
|
|
30-Jun-12 |
|
|
31-Mar-12 |
|
| Net income available to common stockholders |
|
$ |
138,872 |
|
|
$ |
47,077 |
|
|
$ |
42,657 |
|
|
$ |
44,815 |
|
|
$ |
45,615 |
|
|
$ |
42,021 |
|
|
$ |
39,211 |
|
| Interest |
|
|
47,742 |
|
|
|
47,583 |
|
|
|
48,078 |
|
|
|
40,350 |
|
|
|
41,047 |
|
|
|
37,681 |
|
|
|
38,030 |
|
| Loss from early extinguishment of debt |
|
|
704 |
|
|
|
501 |
|
|
|
— |
|
|
|
— |
|
|
|
— |
|
|
|
303 |
|
|
|
— |
|
| Taxes |
|
|
352 |
|
|
|
210 |
|
|
|
1,203 |
|
|
|
10 |
|
|
|
710 |
|
|
|
1,206 |
|
|
|
721 |
|
| Depreciation and amortization |
|
|
121,198 |
|
|
|
115,867 |
|
|
|
111,623 |
|
|
|
107,718 |
|
|
|
101,840 |
|
|
|
89,000 |
|
|
|
83,995 |
|
|
|
|
|
|
|
|
|
|
|
|
|
|
|
|
|
|
|
|
|
|
|
|
|
|
|
|
|
|
| EBITDA |
|
|
308,868 |
|
|
|
211,238 |
|
|
|
203,561 |
|
|
|
192,893 |
|
|
|
189,212 |
|
|
|
170,211 |
|
|
|
161,957 |
|
| Straight-line rent expense adjustment attributable to prior periods |
|
|
9,155 |
|
|
|
— |
|
|
|
— |
|
|
|
— |
|
|
|
— |
|
|
|
— |
|
|
|
— |
|
| Gain on contribution of properties to unconsolidated joint venture |
|
|
(115,054 |
) |
|
|
— |
|
|
|
— |
|
|
|
— |
|
|
|
— |
|
|
|
— |
|
|
|
— |
|
| Noncontrolling interests |
|
|
2,882 |
|
|
|
1,145 |
|
|
|
970 |
|
|
|
1,329 |
|
|
|
1,529 |
|
|
|
1,634 |
|
|
|
1,221 |
|
| Preferred stock dividends |
|
|
11,726 |
|
|
|
11,399 |
|
|
|
8,054 |
|
|
|
9,751 |
|
|
|
9,777 |
|
|
|
10,313 |
|
|
|
8,831 |
|
|
|
|
|
|
|
|
|
|
|
|
|
|
|
|
|
|
|
|
|
|
|
|
|
|
|
|
|
|
| Adjusted EBITDA |
|
$ |
217,577 |
|
|
$ |
223,782 |
|
|
$ |
212,585 |
|
|
$ |
203,973 |
|
|
$ |
200,518 |
|
|
$ |
182,158 |
|
|
$ |
172,009 |
|
|
|
|
|
|
|
|
|
|
|
|
|
|
|
|
|
|
|
|
|
|
|
|
|
|
|
|
|
|
| (1) |
For the definition and discussion of EBITDA and Adjusted EBITDA, see page 35. EBITDA and Adjusted EBITDA for the three months ended June 30, 2012 include a gain on sale of 700 / 750 Central Expressway, held through
an unconsolidated joint venture, of approximately $2.3 million. Excluding this gain, EBITDA and Adjusted EBITDA would have been $167.9 million and $179.9 million, respectively, for three months ended June 30, 2012. |
Financial Ratios
(unaudited and in thousands)
|
|
|
|
|
|
|
|
|
|
|
|
|
|
|
|
|
|
|
|
|
|
|
|
|
|
|
|
|
| |
|
30-Sep-13 |
|
|
30-Jun-13 |
|
|
31-Mar-13 |
|
|
31-Dec-12 |
|
|
30-Sep-12 |
|
|
30-Jun-12 |
|
|
31-Mar-12 |
|
| Total GAAP interest expense |
|
$ |
47,742 |
|
|
$ |
47,583 |
|
|
$ |
48,078 |
|
|
$ |
40,350 |
|
|
$ |
41,047 |
|
|
$ |
37,681 |
|
|
$ |
38,030 |
|
| Capitalized interest |
|
|
6,882 |
|
|
|
6,617 |
|
|
|
5,343 |
|
|
|
7,833 |
|
|
|
4,496 |
|
|
|
4,602 |
|
|
|
4,526 |
|
| Change in accrued interest and other non-cash amounts |
|
|
13,396 |
|
|
|
(18,637 |
) |
|
|
2,742 |
|
|
|
(17,872 |
) |
|
|
8,974 |
|
|
|
(14,836 |
) |
|
|
11,320 |
|
|
|
|
|
|
|
|
|
|
|
|
|
|
|
|
|
|
|
|
|
|
|
|
|
|
|
|
|
|
| Cash interest expense (a) |
|
|
68,020 |
|
|
|
35,563 |
|
|
|
56,163 |
|
|
|
30,311 |
|
|
|
54,517 |
|
|
|
27,447 |
|
|
|
53,876 |
|
| Scheduled debt principal payments and preferred dividends |
|
|
14,874 |
|
|
|
15,172 |
|
|
|
11,950 |
|
|
|
13,518 |
|
|
|
13,402 |
|
|
|
15,199 |
|
|
|
12,601 |
|
|
|
|
|
|
|
|
|
|
|
|
|
|
|
|
|
|
|
|
|
|
|
|
|
|
|
|
|
|
| Total fixed charges (b) |
|
$ |
82,894 |
|
|
$ |
50,735 |
|
|
$ |
68,113 |
|
|
$ |
43,829 |
|
|
$ |
67,919 |
|
|
$ |
42,646 |
|
|
$ |
66,477 |
|
|
|
|
|
|
|
|
|
|
|
|
|
|
|
|
|
|
|
|
|
|
|
|
|
|
|
|
|
|
| Debt service coverage ratio based on GAAP interest expense (c) |
|
|
4.6 |
x |
|
|
4.7 |
x |
|
|
4.4 |
x |
|
|
5.1 |
x |
|
|
4.9 |
x |
|
|
4.8 |
x |
|
|
4.5 |
x |
| Debt service coverage ratio based on cash interest expense (d) |
|
|
3.2 |
x |
|
|
6.3 |
x |
|
|
3.8 |
x |
|
|
6.7 |
x |
|
|
3.7 |
x |
|
|
6.6 |
x |
|
|
3.2 |
x |
| Fixed charge coverage ratio based on GAAP interest expense (e) |
|
|
3.5 |
x |
|
|
3.6 |
x |
|
|
3.5 |
x |
|
|
3.8 |
x |
|
|
3.7 |
x |
|
|
3.4 |
x |
|
|
3.4 |
x |
| Fixed charge coverage ratio based on cash interest expense (f) |
|
|
2.6 |
x |
|
|
4.4 |
x |
|
|
3.1 |
x |
|
|
4.7 |
x |
|
|
3.0 |
x |
|
|
4.3 |
x |
|
|
2.6 |
x |
| Debt to total enterprise value including debt and preferred equity (g) |
|
|
38.3 |
% |
|
|
35.0 |
% |
|
|
33.6 |
% |
|
|
31.5 |
% |
|
|
30.0 |
% |
|
|
26.8 |
% |
|
|
26.9 |
% |
| Debt plus preferred stock to total enterprise value including debt and preferred equity (h) |
|
|
44.1 |
% |
|
|
40.3 |
% |
|
|
36.9 |
% |
|
|
35.9 |
% |
|
|
34.4 |
% |
|
|
31.9 |
% |
|
|
31.8 |
% |
| Pre-tax income to interest expense (i) |
|
|
4.2 |
x |
|
|
2.3 |
x |
|
|
2.1 |
x |
|
|
2.4 |
x |
|
|
2.4 |
x |
|
|
2.4 |
x |
|
|
2.3 |
x |
| Net Debt to Adjusted EBITDA (j) |
|
|
5.4 |
x |
|
|
5.2 |
x |
|
|
5.5 |
x |
|
|
5.2 |
x |
|
|
5.0 |
x |
|
|
4.6 |
x |
|
|
4.7 |
x |
| (a) |
Cash interest expense is interest expense less amortization of debt discount and deferred financing fees and includes interest that we capitalized. We consider cash interest expense to be a useful measure of
interest as it excludes non-cash based interest expense. |
| (b) |
Fixed charges consist of cash interest expense, scheduled debt principal payments and preferred dividends. |
| (c) |
Adjusted EBITDA divided by GAAP interest expense. |
| (d) |
Adjusted EBITDA divided by cash interest expense. |
| (e) |
Adjusted EBITDA divided by the sum of GAAP interest expense, scheduled debt principal payments and preferred dividends. |
| (f) |
Adjusted EBITDA divided by fixed charges. |
| (g) |
Mortgage debt and other loans divided by mortgage debt and other loans plus the liquidation value of preferred stock and the market value of outstanding common stock and operating partnership units, assuming the
redemption of operating partnership units for shares of our common stock. |
| (h) |
Same as (g), except numerator includes preferred stock. |
| (i) |
Calculated as net income, adding back interest expense and divided by GAAP interest expense. |
| (j) |
Calculated as total debt at balance sheet carrying value (see page 7) less unrestricted cash and cash equivalents divided by the product of Adjusted EBITDA multiplied by four. |
Page 12
DIGITAL REALTY TRUST, INC.
Third Quarter 2013
Same Store and New Properties Consolidated Quarterly Statements of Operations
(unaudited and in thousands)
|
|
|
|
|
|
|
|
|
|
|
|
|
|
|
|
|
|
|
|
|
|
|
|
|
|
|
|
|
| |
|
Three Months Ended |
|
| Same store (1) |
|
30-Sep-13 |
|
|
30-Jun-13 |
|
|
31-Mar-13 |
|
|
31-Dec-12 |
|
|
30-Sep-12 |
|
|
30-Jun-12 |
|
|
31-Mar-12 |
|
| Operating Revenues: |
|
|
|
|
|
|
|
|
|
|
|
|
|
|
|
|
|
|
|
|
|
|
|
|
|
|
|
|
| Rental |
|
$ |
244,617 |
|
|
$ |
241,528 |
|
|
$ |
238,957 |
|
|
$ |
231,214 |
|
|
$ |
226,583 |
|
|
$ |
223,059 |
|
|
$ |
215,125 |
|
| Tenant reimbursements—Utilities |
|
|
51,075 |
|
|
|
44,600 |
|
|
|
42,525 |
|
|
|
41,736 |
|
|
|
47,127 |
|
|
|
40,726 |
|
|
|
36,879 |
|
| Tenant reimbursements—Other |
|
|
20,022 |
|
|
|
17,014 |
|
|
|
18,955 |
|
|
|
18,718 |
|
|
|
18,326 |
|
|
|
17,415 |
|
|
|
19,015 |
|
| Construction management (2) |
|
|
— |
|
|
|
— |
|
|
|
— |
|
|
|
— |
|
|
|
— |
|
|
|
— |
|
|
|
— |
|
| Other |
|
|
14 |
|
|
|
— |
|
|
|
248 |
|
|
|
158 |
|
|
|
1,052 |
|
|
|
6,405 |
|
|
|
— |
|
|
|
|
|
|
|
|
|
|
|
|
|
|
|
|
|
|
|
|
|
|
|
|
|
|
|
|
|
|
| Total operating revenues |
|
|
315,728 |
|
|
|
303,142 |
|
|
|
300,685 |
|
|
|
291,826 |
|
|
|
293,088 |
|
|
|
287,605 |
|
|
|
271,019 |
|
|
|
|
|
|
|
|
|
|
|
|
|
|
|
|
|
|
|
|
|
|
|
|
|
|
|
|
|
|
| Operating Expenses: |
|
|
|
|
|
|
|
|
|
|
|
|
|
|
|
|
|
|
|
|
|
|
|
|
|
|
|
|
| Utilities |
|
|
55,620 |
|
|
|
47,186 |
|
|
|
45,032 |
|
|
|
44,633 |
|
|
|
50,080 |
|
|
|
42,468 |
|
|
|
38,854 |
|
| Rental property operating |
|
|
25,795 |
|
|
|
24,318 |
|
|
|
25,234 |
|
|
|
23,216 |
|
|
|
23,686 |
|
|
|
23,307 |
|
|
|
19,297 |
|
| Repairs and maintenance |
|
|
22,351 |
|
|
|
20,143 |
|
|
|
21,457 |
|
|
|
25,664 |
|
|
|
20,558 |
|
|
|
19,615 |
|
|
|
20,654 |
|
| Non-cash straight-line rent expense adjustment |
|
|
9,988 |
|
|
|
— |
|
|
|
— |
|
|
|
— |
|
|
|
— |
|
|
|
— |
|
|
|
— |
|
| Property taxes |
|
|
21,397 |
|
|
|
16,045 |
|
|
|
17,787 |
|
|
|
16,455 |
|
|
|
15,781 |
|
|
|
14,622 |
|
|
|
15,231 |
|
| Insurance |
|
|
1,778 |
|
|
|
1,869 |
|
|
|
1,952 |
|
|
|
2,142 |
|
|
|
1,994 |
|
|
|
2,061 |
|
|
|
2,037 |
|
| Construction management (2) |
|
|
— |
|
|
|
— |
|
|
|
— |
|
|
|
— |
|
|
|
— |
|
|
|
— |
|
|
|
— |
|
| Depreciation and amortization |
|
|
99,499 |
|
|
|
96,857 |
|
|
|
94,075 |
|
|
|
89,881 |
|
|
|
87,186 |
|
|
|
84,841 |
|
|
|
81,246 |
|
| General and administrative (3) |
|
|
16,275 |
|
|
|
17,891 |
|
|
|
15,951 |
|
|
|
13,441 |
|
|
|
14,409 |
|
|
|
15,109 |
|
|
|
14,250 |
|
| Transactions (4) |
|
|
— |
|
|
|
— |
|
|
|
— |
|
|
|
— |
|
|
|
— |
|
|
|
— |
|
|
|
— |
|
| Other |
|
|
3 |
|
|
|
17 |
|
|
|
36 |
|
|
|
— |
|
|
|
923 |
|
|
|
337 |
|
|
|
— |
|
|
|
|
|
|
|
|
|
|
|
|
|
|
|
|
|
|
|
|
|
|
|
|
|
|
|
|
|
|
| Total operating expenses |
|
|
252,706 |
|
|
|
224,326 |
|
|
|
221,524 |
|
|
|
215,432 |
|
|
|
214,617 |
|
|
|
202,360 |
|
|
|
191,569 |
|
|
|
|
|
|
|
|
|
|
|
|
|
|
|
|
|
|
|
|
|
|
|
|
|
|
|
|
|
|
| Operating income |
|
|
63,022 |
|
|
|
78,816 |
|
|
|
79,161 |
|
|
|
76,394 |
|
|
|
78,471 |
|
|
|
85,245 |
|
|
|
79,450 |
|
| Other Income (Expenses): |
|
|
|
|
|
|
|
|
|
|
|
|
|
|
|
|
|
|
|
|
|
|
|
|
|
|
|
|
| Equity in earnings of unconsolidated joint ventures |
|
|
2,321 |
|
|
|
2,346 |
|
|
|
2,346 |
|
|
|
1,743 |
|
|
|
1,531 |
|
|
|
3,493 |
|
|
|
1,389 |
|
| Gain on insurance settlement |
|
|
— |
|
|
|
5,597 |
|
|
|
— |
|
|
|
— |
|
|
|
— |
|
|
|
— |
|
|
|
— |
|
| Gain on contribution of properties to unconsolidated joint venture |
|
|
— |
|
|
|
— |
|
|
|
— |
|
|
|
— |
|
|
|
— |
|
|
|
— |
|
|
|
— |
|
| Interest and other income |
|
|
(120 |
) |
|
|
(21 |
) |
|
|
39 |
|
|
|
(118 |
) |
|
|
(53 |
) |
|
|
1,263 |
|
|
|
774 |
|
| Interest expense |
|
|
(40,425 |
) |
|
|
(40,486 |
) |
|
|
(42,007 |
) |
|
|
(38,383 |
) |
|
|
(39,208 |
) |
|
|
(37,643 |
) |
|
|
(38,030 |
) |
| Tax expense |
|
|
99 |
|
|
|
162 |
|
|
|
(827 |
) |
|
|
320 |
|
|
|
(583 |
) |
|
|
(1,079 |
) |
|
|
(594 |
) |
| Loss from early extinguishment of debt |
|
|
(704 |
) |
|
|
(501 |
) |
|
|
— |
|
|
|
— |
|
|
|
— |
|
|
|
(303 |
) |
|
|
— |
|
|
|
|
|
|
|
|
|
|
|
|
|
|
|
|
|
|
|
|
|
|
|
|
|
|
|
|
|
|
| Net income |
|
$ |
24,193 |
|
|
$ |
45,913 |
|
|
$ |
38,712 |
|
|
$ |
39,956 |
|
|
$ |
40,158 |
|
|
$ |
50,976 |
|
|
$ |
42,989 |
|
|
|
|
|
|
|
|
|
|
|
|
|
|
|
|
|
|
|
|
|
|
|
|
|
|
|
|
|
|
| New properties/Managed Joint Venture (1) |
|
|
|
|
|
|
|
|
|
|
|
|
|
|
|
|
|
|
|
|
|
|
|
|
|
|
|
|
| Operating Revenues: |
|
|
|
|
|
|
|
|
|
|
|
|
|
|
|
|
|
|
|
|
|
|
|
|
|
|
|
|
| Rental |
|
$ |
46,095 |
|
|
$ |
44,425 |
|
|
$ |
42,442 |
|
|
$ |
41,692 |
|
|
$ |
33,469 |
|
|
$ |
11,864 |
|
|
$ |
7,709 |
|
| Tenant reimbursements—Utilities |
|
|
8,861 |
|
|
|
9,797 |
|
|
|
8,720 |
|
|
|
8,349 |
|
|
|
8,999 |
|
|
|
1,205 |
|
|
|
499 |
|
| Tenant reimbursements—Other |
|
|
8,101 |
|
|
|
5,270 |
|
|
|
5,717 |
|
|
|
6,344 |
|
|
|
4,426 |
|
|
|
1,076 |
|
|
|
1,469 |
|
| Construction management (2) |
|
|
671 |
|
|
|
728 |
|
|
|
806 |
|
|
|
1,525 |
|
|
|
2,497 |
|
|
|
1,954 |
|
|
|
2,452 |
|
| Other |
|
|
— |
|
|
|
140 |
|
|
|
— |
|
|
|
— |
|
|
|
— |
|
|
|
— |
|
|
|
— |
|
|
|
|
|
|
|
|
|
|
|
|
|
|
|
|
|
|
|
|
|
|
|
|
|
|
|
|
|
|
| Total operating revenues |
|
|
63,728 |
|
|
|
60,360 |
|
|
|
57,685 |
|
|
|
57,910 |
|
|
|
49,391 |
|
|
|
16,099 |
|
|
|
12,129 |
|
|
|
|
|
|
|
|
|
|
|
|
|
|
|
|
|
|
|
|
|
|
|
|
|
|
|
|
|
|
| Operating Expenses: |
|
|
|
|
|
|
|
|
|
|
|
|
|
|
|
|
|
|
|
|
|
|
|
|
|
|
|
|
| Utilities |
|
|
9,435 |
|
|
|
9,956 |
|
|
|
8,940 |
|
|
|
8,407 |
|
|
|
8,786 |
|
|
|
1,154 |
|
|
|
498 |
|
| Rental property operating |
|
|
2,665 |
|
|
|
2,593 |
|
|
|
3,946 |
|
|
|
1,828 |
|
|
|
2,228 |
|
|
|
758 |
|
|
|
471 |
|
| Repairs and maintenance |
|
|
2,437 |
|
|
|
2,140 |
|
|
|
2,171 |
|
|
|
2,347 |
|
|
|
1,322 |
|
|
|
274 |
|
|
|
71 |
|
| Non-cash straight-line rent expense adjustment |
|
|
— |
|
|
|
— |
|
|
|
— |
|
|
|
— |
|
|
|
— |
|
|
|
— |
|
|
|
— |
|
| Property taxes |
|
|
4,677 |
|
|
|
3,329 |
|
|
|
3,255 |
|
|
|
3,227 |
|
|
|
2,201 |
|
|
|
1,147 |
|
|
|
811 |
|
| Insurance |
|
|
366 |
|
|
|
369 |
|
|
|
253 |
|
|
|
505 |
|
|
|
469 |
|
|
|
199 |
|
|
|
193 |
|
| Construction management (2) |
|
|
51 |
|
|
|
294 |
|
|
|
384 |
|
|
|
184 |
|
|
|
623 |
|
|
|
596 |
|
|
|
193 |
|
| Depreciation and amortization |
|
|
21,699 |
|
|
|
19,010 |
|
|
|
17,548 |
|
|
|
17,837 |
|
|
|
14,654 |
|
|
|
4,159 |
|
|
|
2,749 |
|
| General and administrative (3) |
|
|
— |
|
|
|
— |
|
|
|
— |
|
|
|
— |
|
|
|
— |
|
|
|
— |
|
|
|
— |
|
| Transactions (4) |
|
|
243 |
|
|
|
1,491 |
|
|
|
1,763 |
|
|
|
5,331 |
|
|
|
504 |
|
|
|
4,608 |
|
|
|
677 |
|
| Other |
|
|
— |
|
|
|
— |
|
|
|
— |
|
|
|
— |
|
|
|
— |
|
|
|
— |
|
|
|
— |
|
|
|
|
|
|
|
|
|
|
|
|
|
|
|
|
|
|
|
|
|
|
|
|
|
|
|
|
|
|
| Total operating expenses |
|
|
41,573 |
|
|
|
39,182 |
|
|
|
38,260 |
|
|
|
39,666 |
|
|
|
30,787 |
|
|
|
12,895 |
|
|
|
5,663 |
|
|
|
|
|
|
|
|
|
|
|
|
|
|
|
|
|
|
|
|
|
|
|
|
|
|
|
|
|
|
| Operating income |
|
|
22,155 |
|
|
|
21,178 |
|
|
|
19,425 |
|
|
|
18,244 |
|
|
|
18,604 |
|
|
|
3,204 |
|
|
|
6,466 |
|
| Other Income (Expenses): |
|
|
|
|
|
|
|
|
|
|
|
|
|
|
|
|
|
|
|
|
|
|
|
|
|
|
|
|
| Equity in earnings of unconsolidated joint ventures |
|
|
(147 |
) |
|
|
(16 |
) |
|
|
(11 |
) |
|
|
(10 |
) |
|
|
(11 |
) |
|
|
— |
|
|
|
— |
|
| Gain on insurance settlement |
|
|
— |
|
|
|
— |
|
|
|
— |
|
|
|
— |
|
|
|
— |
|
|
|
— |
|
|
|
— |
|
| Gain on contribution of properties to unconsolidated joint venture |
|
|
115,054 |
|
|
|
— |
|
|
|
— |
|
|
|
— |
|
|
|
— |
|
|
|
— |
|
|
|
— |
|
| Interest and other income |
|
|
(7 |
) |
|
|
15 |
|
|
|
2 |
|
|
|
2 |
|
|
|
136 |
|
|
|
(47 |
) |
|
|
(65 |
) |
| Interest expense |
|
|
(7,317 |
) |
|
|
(7,097 |
) |
|
|
(6,071 |
) |
|
|
(1,967 |
) |
|
|
(1,839 |
) |
|
|
(38 |
) |
|
|
— |
|
| Tax expense |
|
|
(451 |
) |
|
|
(372 |
) |
|
|
(376 |
) |
|
|
(330 |
) |
|
|
(127 |
) |
|
|
(127 |
) |
|
|
(127 |
) |
|
|
|
|
|
|
|
|
|
|
|
|
|
|
|
|
|
|
|
|
|
|
|
|
|
|
|
|
|
| Loss from early extinguishment of debt |
|
|
— |
|
|
|
— |
|
|
|
— |
|
|
|
— |
|
|
|
— |
|
|
|
— |
|
|
|
— |
|
| Net Income |
|
$ |
129,287 |
|
|
$ |
13,708 |
|
|
$ |
12,969 |
|
|
$ |
15,939 |
|
|
$ |
16,763 |
|
|
$ |
2,992 |
|
|
$ |
6,274 |
|
| (1) |
Same store properties are properties that were acquired on or before December 31, 2011 and new properties are properties acquired after December 31, 2011. |
| (2) |
Construction management revenues and expenses are included entirely in new properties as they are not allocable to specific properties. |
| (3) |
General and administrative expenses are included entirely in same store properties as they are not allocable to specific properties. |
| (4) |
Transaction expenses are included entirely in new properties as they are not allocable to specific properties. |
Note: Managed unconsolidated joint ventures excluded from same store in all periods.
Page 13
DIGITAL REALTY TRUST, INC.
Third Quarter 2013
Same Store Operating Trend Summary
(unaudited and in thousands)
|
|
|
|
|
|
|
|
|
|
|
|
|
|
|
|
|
|
|
|
|
| |
|
Three Months Ended |
|
| Same store (1) |
|
30-Sep-13 |
|
|
30-Jun-13 |
|
|
Percentage
Change |
|
|
30-Sep-12 |
|
|
Percentage
Change |
|
| Rental |
|
$ |
244,617 |
|
|
$ |
241,528 |
|
|
|
1.3 |
% |
|
$ |
226,583 |
|
|
|
8.0 |
% |
| Tenant reimbursements—Utilities |
|
|
51,075 |
|
|
|
44,600 |
|
|
|
14.5 |
% |
|
|
47,127 |
|
|
|
8.4 |
% |
| Tenant reimbursements—Other |
|
|
20,022 |
|
|
|
17,014 |
|
|
|
17.7 |
% |
|
|
18,326 |
|
|
|
9.3 |
% |
|
|
|
|
|
|
|
|
|
|
|
|
|
|
|
|
|
|
|
|
|
|
|
|
315,714 |
|
|
|
303,142 |
|
|
|
4.1 |
% |
|
|
292,036 |
|
|
|
8.1 |
% |
| Utilities |
|
|
55,620 |
|
|
|
47,186 |
|
|
|
17.9 |
% |
|
|
50,080 |
|
|
|
11.1 |
% |
| Rental property operating |
|
|
25,795 |
|
|
|
24,318 |
|
|
|
6.1 |
% |
|
|
23,686 |
|
|
|
8.9 |
% |
| Repairs and maintenance |
|
|
22,351 |
|
|
|
20,143 |
|
|
|
11.0 |
% |
|
|
20,558 |
|
|
|
8.7 |
% |
| Non-cash straight-line rent expense adjustment |
|
|
9,988 |
|
|
|
— |
|
|
|
0.0 |
% |
|
|
— |
|
|
|
0.0 |
% |
| Property taxes |
|
|
21,397 |
|
|
|
16,045 |
|
|
|
33.4 |
% |
|
|
15,781 |
|
|
|
35.6 |
% |
| Insurance |
|
|
1,778 |
|
|
|
1,869 |
|
|
|
(4.9 |
%) |
|
|
1,994 |
|
|
|
(10.8 |
%) |
|
|
|
|
|
|
|
|
|
|
|
|
|
|
|
|
|
|
|
|
|
|
|
|
136,929 |
|
|
|
109,561 |
|
|
|
25.0 |
% |
|
|
112,099 |
|
|
|
22.2 |
% |
|
|
|
|
|
|
|
|
|
|
|
|
|
|
|
|
|
|
|
|
|
| Net Operating Income (2) |
|
$ |
178,785 |
|
|
$ |
193,581 |
|
|
|
(7.6 |
%) |
|
$ |
179,937 |
|
|
|
(0.6 |
%) |
|
|
|
|
|
|
|
|
|
|
|
|
|
|
|
|
|
|
|
|
|
| Same store straight-line rent |
|
|
15,931 |
|
|
|
17,061 |
|
|
|
(6.6 |
%) |
|
|
18,357 |
|
|
|
(13.2 |
%) |
| Non-cash straight-line rent expense adjustment |
|
|
(9,988 |
) |
|
|
— |
|
|
|
0.0 |
% |
|
|
— |
|
|
|
0.0 |
% |
| Above and below market rent |
|
|
1,816 |
|
|
|
2,114 |
|
|
|
(14.1 |
%) |
|
|
1,902 |
|
|
|
(4.5 |
%) |
|
|
|
|
|
|
|
|
|
|
|
|
|
|
|
|
|
|
|
|
|
| Cash Net Operating Income (3) |
|
$ |
171,026 |
|
|
$ |
174,406 |
|
|
|
(1.9 |
%) |
|
$ |
159,678 |
|
|
|
7.1 |
% |
|
|
|
|
|
|
|
|
|
|
|
|
|
|
|
|
|
|
|
|
|
| Same store occupancy at end of quarter (4) |
|
|
91.8 |
% |
|
|
92.3 |
% |
|
|
(0.5 |
%) |
|
|
94.2 |
% |
|
|
(2.5 |
%) |
|
|
|
|
|
|
|
|
|
|
|
|
|
|
|
|
|
|
|
|
|
| (1) |
Same store properties were acquired on or before December 31, 2011. |
| (2) |
For a definition and discussion of Net Operating Income, see page 35. |
| (3) |
For a definition and discussion of Cash Net Operating Income, see page 35. |
| (4) |
Occupancy excludes space held for development. For some of our properties, we calculate occupancy based on factors in addition to contractually leased square feet, including available power, required support space and
common area. |
Note: Managed joint ventures excluded from same store in all periods.
Page 14
DIGITAL REALTY TRUST, INC.
Third Quarter 2013
Consolidated Debt Analysis
(unaudited, in thousands)
|
|
|
|
|
|
|
|
|
|
|
|
|
|
|
|
|
|
|
| |
|
Maturity Date |
|
Principal Balance as of
September 30, 2013 |
|
|
% of Debt |
|
|
Interest Rate as of
September 30,
2013 |
|
|
Interest Rate as of
September 30, 2013
including swaps |
|
| Global Revolving Credit Facility: |
|
|
|
|
|
|
|
|
|
|
|
|
|
|
|
|
|
|
| Global revolving credit facility |
|
November 2, 2018 (1) |
|
|
498,082 |
|
|
|
10.4 |
% |
|
|
1.66 |
% |
|
|
|
|
|
|
|
|
|
|
|
|
|
|
|
|
|
|
|
|
|
|
|
|
|
|
|
$ |
498,082 |
|
|
|
10.4 |
% |
|
|
|
|
|
|
|
|
| Unsecured term loan: |
|
|
|
|
|
|
|
|
|
|
|
|
|
|
|
|
|
|
| Unsecured term loan |
|
April 16, 2018 (1) |
|
|
950,205 |
|
|
|
19.9 |
% |
|
|
1.68 |
% |
|
|
2.02 |
% |
|
|
|
|
|
|
|
|
|
|
|
|
|
|
|
|
|
|
|
|
|
|
|
$ |
950,205 |
|
|
|
19.9 |
% |
|
|
|
|
|
|
|
|
| Unsecured senior notes: |
|
|
|
|
|
|
|
|
|
|
|
|
|
|
|
|
|
|
| Prudential Shelf Facility: |
|
|
|
|
|
|
|
|
|
|
|
|
|
|
|
|
|
|
| Series B |
|
November 5, 2013 |
|
|
33,000 |
|
|
|
0.7 |
% |
|
|
9.32 |
% |
|
|
|
|
| Series C |
|
January 6, 2016 |
|
|
25,000 |
|
|
|
0.5 |
% |
|
|
9.68 |
% |
|
|
|
|
| Series D |
|
January 20, 2015 |
|
|
50,000 |
|
|
|
1.0 |
% |
|
|
4.57 |
% |
|
|
|
|
| Series E |
|
January 20, 2017 |
|
|
50,000 |
|
|
|
1.0 |
% |
|
|
5.73 |
% |
|
|
|
|
| Series F |
|
February 3, 2015 |
|
|
17,000 |
|
|
|
0.4 |
% |
|
|
4.50 |
% |
|
|
|
|
|
|
|
|
|
|
|
|
|
|
|
|
|
|
|
|
|
|
|
| Total Prudential Shelf Facility |
|
|
|
$ |
175,000 |
|
|
|
3.6 |
% |
|
|
|
|
|
|
|
|
| Senior Notes: |
|
|
|
|
|
|
|
|
|
|
|
|
|
|
|
|
|
|
| 4.50% notes due 2015 |
|
July 15, 2015 |
|
|
375,000 |
|
|
|
7.8 |
% |
|
|
4.50 |
% |
|
|
|
|
| 5.875% notes due 2020 |
|
February 1, 2020 |
|
|
500,000 |
|
|
|
10.5 |
% |
|
|
5.88 |
% |
|
|
|
|
| 5.25% notes due 2021 |
|
March 15, 2021 |
|
|
400,000 |
|
|
|
8.4 |
% |
|
|
5.25 |
% |
|
|
|
|
| 3.625% notes due 2022 |
|
October 1, 2022 |
|
|
300,000 |
|
|
|
6.3 |
% |
|
|
3.63 |
% |
|
|
|
|
| 4.25% notes due 2025 |
|
January 17, 2025 |
|
|
647,440 |
|
|
|
13.5 |
% |
|
|
4.25 |
% |
|
|
|
|
| Unamortized discounts |
|
|
|
|
(15,381 |
) |
|
|
-0.3 |
% |
|
|
|
|
|
|
|
|
|
|
|
|
|
|
|
|
|
|
|
|
|
|
|
|
|
|
|
| Total senior notes |
|
|
|
$ |
2,207,059 |
|
|
|
46.2 |
% |
|
|
|
|
|
|
|
|
|
|
|
|
|
|
|
|
|
|
|
|
|
|
|
|
|
|
|
| Total unsecured senior notes |
|
|
|
$ |
2,382,059 |
|
|
|
49.8 |
% |
|
|
|
|
|
|
|
|
| Exchangeable senior debentures: |
|
|
|
|
|
|
|
|
|
|
|
|
|
|
|
|
|
|
| 5.50% exchangeable senior debentures due 2029 |
|
April 15, 2029 |
|
|
266,400 |
|
|
|
5.6 |
% |
|
|
5.50 |
% |
|
|
|
|
|
|
|
|
|
|
|
|
|
|
|
|
|
|
|
|
|
|
|
| Total exchangeable senior debentures |
|
|
|
$ |
266,400 |
|
|
|
5.6 |
% |
|
|
|
|
|
|
|
|
| Mortgage loans: |
|
|
|
|
|
|
|
|
|
|
|
|
|
|
|
|
|
|
| Gyroscoopweg 2E-2F |
|
October 18, 2013(2) |
|
|
8,598 |
|
|
|
0.2 |
% |
|
|
1.68 |
% |
|
|
5.49 |
% |
| 360 Spear Street |
|
November 8, 2013 |
|
|
45,850 |
|
|
|
1.0 |
% |
|
|
6.32 |
% |
|
|
|
|
| Mundells Roundabout |
|
November 30, 2013 |
|
|
69,317 |
|
|
|
1.5 |
% |
|
|
1.71 |
% |
|
|
4.18 |
% |
| Cressex 1 |
|
October 16, 2014 |
|
|
28,066 |
|
|
|
0.6 |
% |
|
|
5.68 |
% |
|
|
|
|
| Manchester Technopark |
|
October 16, 2014 |
|
|
8,538 |
|
|
|
0.2 |
% |
|
|
5.68 |
% |
|
|
|
|
| Secured Term Debt |
|
November 11, 2014 |
|
|
133,744 |
|
|
|
2.8 |
% |
|
|
5.65 |
% |
|
|
|
|
| 200 Paul Avenue 1-4 |
|
October 8, 2015 |
|
|
71,210 |
|
|
|
1.5 |
% |
|
|
5.74 |
% |
|
|
|
|
| 8025 North Interstate 35 |
|
March 6, 2016 |
|
|
6,377 |
|
|
|
0.1 |
% |
|
|
4.09 |
% |
|
|
|
|
| 600 West Seventh Street |
|
March 15, 2016 |
|
|
49,964 |
|
|
|
1.0 |
% |
|
|
5.80 |
% |
|
|
|
|
| 34551 Ardenwood Boulevard 1-4 |
|
November 11, 2016 |
|
|
52,349 |
|
|
|
1.1 |
% |
|
|
5.95 |
% |
|
|
|
|
| 2334 Lundy Place |
|
November 11, 2016 |
|
|
38,074 |
|
|
|
0.8 |
% |
|
|
5.96 |
% |
|
|
|
|
| 1100 Space Park Drive |
|
December 11, 2016 |
|
|
52,315 |
|
|
|
1.1 |
% |
|
|
5.89 |
% |
|
|
|
|
| 2045 & 2055 LaFayette Street |
|
February 6, 2017 |
|
|
63,880 |
|
|
|
1.3 |
% |
|
|
5.93 |
% |
|
|
|
|
| 150 South First Street |
|
February 6, 2017 |
|
|
50,287 |
|
|
|
1.0 |
% |
|
|
6.30 |
% |
|
|
|
|
| 731 East Trade Street |
|
July 1, 2020 |
|
|
4,269 |
|
|
|
0.1 |
% |
|
|
8.22 |
% |
|
|
|
|
| Unamortized net premiums |
|
|
|
|
813 |
|
|
|
0.0 |
% |
|
|
|
|
|
|
|
|
|
|
|
|
|
|
|
|
|
|
|
|
|
|
|
|
|
|
|
| Total mortgage loans |
|
|
|
$ |
683,651 |
|
|
|
14.3 |
% |
|
|
|
|
|
|
|
|
|
|
|
|
|
|
|
|
|
|
|
|
|
|
|
|
|
|
|
| Total Consolidated Debt |
|
|
|
$ |
4,780,397 |
|
|
|
100.0 |
% |
|
|
|
|
|
|
|
|
|
|
|
|
|
|
|
|
|
|
|
|
|
|
|
|
|
|
|
| Weighted average cost of debt (including interest rate swaps) |
|
|
|
|
|
|
|
|
|
|
|
|
|
|
|
|
4.13 |
% |
|
|
|
|
|
|
|
|
|
|
|
|
|
|
|
|
|
|
|
| (1) |
Assumes all extensions will be exercised. |
| (2) |
Mortgage loan paid in full in October 2013. |
Global Revolving Credit Facility
(in thousands)
|
|
|
|
|
|
|
|
|
|
|
|
|
| |
|
Maximum Available as of
September 30, 2013 |
|
|
Available as of
September 30, 2013 (3) |
|
|
Drawn as of
September 30, 2013 |
|
| Global Revolving Credit Facility |
|
$ |
2,000,000 |
|
|
$ |
1,481,624 |
|
|
$ |
498,082 |
|
| (3) Net of letters of credit issued |
|
|
|
|
|
|
|
|
|
|
|
|
Page 15
DIGITAL REALTY TRUST, INC.
Third Quarter 2013
Debt Maturities
(unaudited, in thousands)
|
|
|
|
|
|
|
|
|
|
|
|
|
|
|
|
|
|
|
|
|
|
|
|
|
|
|
|
|
|
|
|
|
|
|
|
|
| |
|
|
|
|
Interest Rate
as of
September 30,
2013 |
|
|
2013 |
|
|
2014 |
|
|
2015 |
|
|
2016 |
|
|
2017 |
|
|
Thereafter |
|
|
Total |
|
| Unsecured term loan: |
|
|
|
|
|
|
|
|
|
|
|
|
|
|
|
|
|
|
|
|
|
|
|
|
|
|
|
|
|
|
|
|
|
|
|
|
| Unsecured term loan |
|
|
(1 |
) |
|
|
1.68 |
% |
|
$ |
— |
|
|
$ |
— |
|
|
$ |
— |
|
|
$ |
— |
|
|
$ |
— |
|
|
$ |
950,205 |
|
|
$ |
950,205 |
|
| Global revolving credit facility: |
|
|
|
|
|
|
|
|
|
|
|
|
|
|
|
|
|
|
|
|
|
|
|
|
|
|
|
|
|
|
|
|
|
|
|
|
| Global revolving credit facility |
|
|
(1 |
) |
|
|
1.66 |
% |
|
|
— |
|
|
|
— |
|
|
|
— |
|
|
|
— |
|
|
|
— |
|
|
|
498,082 |
|
|
|
498,082 |
|
| Series Notes: |
|
|
|
|
|
|
|
|
|
|
|
|
|
|
|
|
|
|
|
|
|
|
|
|
|
|
|
|
|
|
|
|
|
|
|
|
| 4.25% notes due 2025 |
|
|
|
|
|
|
4.25 |
% |
|
|
— |
|
|
|
— |
|
|
|
— |
|
|
|
— |
|
|
|
— |
|
|
|
647,440 |
|
|
|
647,440 |
|
| 5.875% notes due 2020 |
|
|
|
|
|
|
5.88 |
% |
|
|
— |
|
|
|
— |
|
|
|
— |
|
|
|
— |
|
|
|
— |
|
|
|
500,000 |
|
|
|
500,000 |
|
| 5.25% notes due 2021 |
|
|
|
|
|
|
5.25 |
% |
|
|
— |
|
|
|
— |
|
|
|
— |
|
|
|
— |
|
|
|
— |
|
|
|
400,000 |
|
|
|
400,000 |
|
| 4.50% notes due 2015 |
|
|
|
|
|
|
4.50 |
% |
|
|
— |
|
|
|
— |
|
|
|
375,000 |
|
|
|
— |
|
|
|
— |
|
|
|
— |
|
|
|
375,000 |
|
| 3.625% notes due 2022 |
|
|
|
|
|
|
3.63 |
% |
|
|
— |
|
|
|
— |
|
|
|
— |
|
|
|
— |
|
|
|
— |
|
|
|
300,000 |
|
|
|
300,000 |
|
|
|
|
|
|
|
|
|
|
|
|
|
|
|
|
|
|
|
|
|
|
|
|
|
|
|
|
|
|
|
|
|
|
|
|
|
|
| Total senior notes: |
|
|
|
|
|
|
|
|
|
|
— |
|
|
|
— |
|
|
|
375,000 |
|
|
|
— |
|
|
|
— |
|
|
|
1,847,440 |
|
|
|
2,222,440 |
|
| Exchangeable senior debenture: |
|
|
|
|
|
|
|
|
|
|
|
|
|
|
|
|
|
|
|
|
|
|
|
|
|
|
|
|
|
|
|
|
|
|
|
|
| 5.50% exchangeable senior debentures due 2029 |
|
|
(2 |
) |
|
|
5.50 |
% |
|
|
— |
|
|
|
266,400 |
|
|
|
— |
|
|
|
— |
|
|
|
— |
|
|
|
— |
|
|
|
266,400 |
|
| Prudential shelf facility senior notes: |
|
|
|
|
|
|
|
|
|
|
|
|
|
|
|
|
|
|
|
|
|
|
|
|
|
|
|
|
|
|
|
|
|
|
|
|
| Series D |
|
|
|
|
|
|
4.57 |
% |
|
|
— |
|
|
|
— |
|
|
|
50,000 |
|
|
|
— |
|
|
|
— |
|
|
|
— |
|
|
|
50,000 |
|
| Series E |
|
|
|
|
|
|
5.73 |
% |
|
|
— |
|
|
|
— |
|
|
|
— |
|
|
|
— |
|
|
|
50,000 |
|
|
|
— |
|
|
|
50,000 |
|
| Series B |
|
|
|
|
|
|
9.32 |
% |
|
|
33,000 |
|
|
|
— |
|
|
|
— |
|
|
|
— |
|
|
|
— |
|
|
|
— |
|
|
|
33,000 |
|
| Series C |
|
|
|
|
|
|
9.68 |
% |
|
|
— |
|
|
|
— |
|
|
|
— |
|
|
|
25,000 |
|
|
|
— |
|
|
|
— |
|
|
|
25,000 |
|
| Series F |
|
|
|
|
|
|
4.50 |
% |
|
|
— |
|
|
|
— |
|
|
|
17,000 |
|
|
|
— |
|
|
|
— |
|
|
|
— |
|
|
|
17,000 |
|
|
|
|
|
|
|
|
|
|
|
|
|
|
|
|
|
|
|
|
|
|
|
|
|
|
|
|
|
|
|
|
|
|
|
|
|
|
| Total prudential shelf facility senior notes: |
|
|
|
|
|
|
|
|
|
|
33,000 |
|
|
|
— |
|
|
|
67,000 |
|
|
|
25,000 |
|
|
|
50,000 |
|
|
|
— |
|
|
|
175,000 |
|
| Mortgage loans: |
|
|
|
|
|
|
|
|
|
|
|
|
|
|
|
|
|
|
|
|
|
|
|
|
|
|
|
|
|
|
|
|
|
|
|
|
| Secured Term Debt |
|
|
(3 |
) |
|
|
5.65 |
% |
|
|
778 |
|
|
|
132,966 |
|
|
|
— |
|
|
|
— |
|
|
|
— |
|
|
|
— |
|
|
|
133,744 |
|
| 200 Paul Avenue 1-4 |
|
|
|
|
|
|
5.74 |
% |
|
|
496 |
|
|
|
2,048 |
|
|
|
68,666 |
|
|
|
— |
|
|
|
— |
|
|
|
— |
|
|
|
71,210 |
|
| Mundells Roundabout |
|
|
|
|
|
|
1.71 |
% |
|
|
69,317 |
|
|
|
— |
|
|
|
— |
|
|
|
— |
|
|
|
— |
|
|
|
— |
|
|
|
69,317 |
|
| 2045 & 2055 LaFayette Street |
|
|
|
|
|
|
5.93 |
% |
|
|
257 |
|
|
|
1,060 |
|
|
|
1,125 |
|
|
|
1,195 |
|
|
|
60,243 |
|
|
|
— |
|
|
|
63,880 |
|
| 34551 Ardenwood Boulevard 1-4 |
|
|
|
|
|
|
5.95 |
% |
|
|
198 |
|
|
|
812 |
|
|
|
862 |
|
|
|
50,477 |
|
|
|
— |
|
|
|
— |
|
|
|
52,349 |
|
| 1100 Space Park Drive |
|
|
|
|
|
|
5.89 |
% |
|
|
200 |
|
|
|
821 |
|
|
|
871 |
|
|
|
50,423 |
|
|
|
— |
|
|
|
— |
|
|
|
52,315 |
|
| 150 South First Street |
|
|
|
|
|
|
6.30 |
% |
|
|
190 |
|
|
|
781 |
|
|
|
832 |
|
|
|
878 |
|
|
|
47,606 |
|
|
|
— |
|
|
|
50,287 |
|
| 600 West Seventh Street |
|
|
|
|
|
|
5.80 |
% |
|
|
416 |
|
|
|
1,723 |
|
|
|
1,825 |
|
|
|
46,000 |
|
|
|
— |
|
|
|
— |
|
|
|
49,964 |
|
| 360 Spear Street |
|
|
|
|
|
|
6.32 |
% |
|
|
45,850 |
|
|
|
— |
|
|
|
— |
|
|
|
— |
|
|
|
— |
|
|
|
— |
|
|
|
45,850 |
|
| 2334 Lundy Place |
|
|
|
|
|
|
5.96 |
% |
|
|
144 |
|
|
|
590 |
|
|
|
626 |
|
|
|
36,714 |
|
|
|
— |
|
|
|
— |
|
|
|
38,074 |
|
| Cressex 1 |
|
|
|
|
|
|
5.68 |
% |
|
|
124 |
|
|
|
27,942 |
|
|
|
— |
|
|
|
— |
|
|
|
— |
|
|
|
— |
|
|
|
28,066 |
|
| Gyroscoopweg 2E-2F |
|
|
(4 |
) |
|
|
1.68 |
% |
|
|
8,598 |
|
|
|
— |
|
|
|
— |
|
|
|
— |
|
|
|
— |
|
|
|
— |
|
|
|
8,598 |
|
| Manchester Technopark |
|
|
|
|
|
|
5.68 |
% |
|
|
38 |
|
|
|
8,500 |
|
|
|
— |
|
|
|
— |
|
|
|
— |
|
|
|
— |
|
|
|
8,538 |
|
| 8025 North Interstate 35 |
|
|
|
|
|
|
4.09 |
% |
|
|
63 |
|
|
|
257 |
|
|
|
268 |
|
|
|
5,789 |
|
|
|
— |
|
|
|
— |
|
|
|
6,377 |
|
| 731 East Trade Street |
|
|
|
|
|
|
8.22 |
% |
|
|
82 |
|
|
|
350 |
|
|
|
418 |
|
|
|
503 |
|
|
|
546 |
|
|
|
2,370 |
|
|
|
4,269 |
|
|
|
|
|
|
|
|
|
|
|
|
|
|
|
|
|
|
|
|
|
|
|
|
|
|
|
|
|
|
|
|
|
|
|
|
|
|
| Total mortgage loans: |
|
|
|
|
|
|
|
|
|
|
126,751 |
|
|
|
177,850 |
|
|
|
75,493 |
|
|
|
191,979 |
|
|
|
108,395 |
|
|
|
2,370 |
|
|
|
682,838 |
|
|
|
|
|
|
|
|
|
|
|
|
|
|
|
|
|
|
|
|
|
|
|
|
|
|
|
|
|
|
|
|
|
|
|
|
|
|
| Total Debt: |
|
|
|
|
|
|
|
|
|
$ |
159,751 |
|
|
$ |
444,250 |
|
|
$ |
517,493 |
|
|
$ |
216,979 |
|
|
$ |
158,395 |
|
|
$ |
3,298,097 |
|
|
$ |
4,794,965 |
|
|
|
|
|
|
|
|
|
|
|
|
|
|
|
|
|
|
|
|
|
|
|
|
|
|
|
|
|
|
|
|
|
|
|
|
|
|
| Weighted Average Term to Initial Maturity |
|
|
(2 |
) |
|
|
|
|
|
|
|
|
|
|
5.0 Years |
|
|
|
|
|
|
|
|
|
|
|
|
|
|
|
|
|
|
|
|
|
| Weighted Average Term to Initial Maturity (assuming exercise of extension options) |
|
|
(2 |
) |
|
|
|
|
|
|
|
|
|
|
5.3 Years |
|
|
|
|
|
|
|
|
|
|
|
|
|
|
|
|
|
|
|
|
|
| (1) |
Assumes all extensions will be exercised. |
| (2) |
Assumes maturity of 5.50% exchangeable senior debentures due 2029 at first redemption date in April 2014. |
| (3) |
This amount represents six mortgage loans secured by our interests in 36 NE 2nd Street, 3300 East Birch Street, 100 & 200 Quannapowitt Parkway, 300 Boulevard East, 4849 Alpha Road, and 11830 Webb Chapel Road.
Each of these loans is cross-collateralized by the six properties. |
| (4) |
Mortgage loan paid in full in October 2013. |
Note: Total excludes $813 of loan premiums, net and
($4,646), ($5,974), ($436), ($713), and ($3,612) of debt discount on 4.25% unsecured senior notes due 2025, 5.875% unsecured senior notes due 2020, 4.50% unsecured senior notes due 2015, 5.25% unsecured senior notes due 2021, and 3.625% unsecured
senior notes due 2022, respectively.
Page 16
DIGITAL REALTY TRUST, INC.
Third Quarter 2013
Debt Analysis & Covenant Compliance
(unaudited)
|
|
|
|
|
|
|
|
|
|
|
| Debt Covenant Ratios (1): |
|
As of September 30, 2013 |
| |
|
4.50% Notes due 2015,
5.875% Notes due 2020 &
5.25% Notes due 2021 |
|
3.625% Notes
due 2022 &
4.250% Notes
due 2025 |
|
Global Revolving Credit Facility |
| |
|
Required |
|
Actual |
|
Actual |
|
Required |
|
Actual |
| Total Outstanding Debt / Total Assets (2) |
|
Less than 60% |
|
45% |
|
39% |
|
Less than 60%(3) |
|
38% |
| Secured Debt / Total Assets (4) |
|
Less than 40% |
|
6% |
|
6% |
|
Less than 40% |
|
6% |
| Total Unencumbered Assets / Unsecured Debt |
|
Greater than 150% |
|
226% |
|
260% |
|
|
|
N/A |
| Consolidated EBITDA / Interest Expense (5) |
|
Greater than 1.50x |
|
3.7 x |
|
3.7 x |
|
|
|
N/A |
| Fixed Charge Coverage |
|
|
|
N/A |
|
N/A |
|
Greater than 1.50x |
|
3.7 x |
| Unsecured Debt / Total Unencumbered Asset Value (6) |
|
|
|
N/A |
|
N/A |
|
Less than 60% |
|
43% |
| Unencumbered Assets Debt Service Coverage Ratio |
|
|
|
N/A |
|
N/A |
|
Greater than 1.50x |
|
4.6 x |
| (1) |
For a definition of the capitalized terms used in the table above and related footnotes, please refer to: the Indenture dated January 28, 2010, which governs the 5.875% Notes due 2020; the Indenture dated
July 8, 2010, which governs the 4.50% Notes due 2015; the Indenture and Supplemental Indenture No. 1 dated March 8, 2011, which governs the 5.25% Notes due 2021; the Indenture and Supplemental Indenture No. 1 dated
September 24, 2012, which governs the 3.625% Notes due 2022; the Indenture dated January 18, 2013, which governs the 4.250% Notes due 2025; and the Global Senior Credit Agreement dated as of August 15, 2013, which are or will be filed
as exhibits to our reports filed with the Securities and Exchange Commission. |
| (2) |
This ratio is referred to as the Leverage Ratio, defined as Consolidated Debt / Total Asset Value, under the Global Revolving Credit Facility. Under the 4.50% Notes due 2015, 5.875% Notes due 2020, and 5.25% Notes due
2021, Total Assets is calculated using Consolidated EBITDA capped at 9.0%. Under the 3.625% Notes due 2022 and 4.250% Notes due 2025, Total Assets is calculated using Consolidated EBITDA capped at 8.25%. Under the Global Revolving Credit Facility,
Total Asset Value is calculated using Adjusted Net Operating Income capped at 8.00% for Data Center Assets and 7.50% for Other Assets. |
| (3) |
The Company has the right to maintain a Leverage Ratio of greater than 60.0% but less than or equal to 65.0% for up to four consecutive fiscal quarters during the term of the Facility following an acquisition of one or
more Assets for a purchase price and other consideration in an amount not less than 5% of Total Asset Value. |
| (4) |
This ratio is referred to as the Secured Debt Leverage Ratio, defined as Secured Debt / Total Asset Value, under the Global Revolving Credit Facility. |
| (5) |
Calculated as current quarter annualized Consolidated EBITDA to current quarter annualized Interest Expense (including capitalized interest and debt discounts). |
| (6) |
Assets must satisfy certain conditions to qualify for inclusion as an Unencumbered Asset under the Global Revolving Credit Facility. |
Page 17
DIGITAL REALTY TRUST, INC.
Third Quarter 2013
Portfolio Summary (1)
As of September 30, 2013
|
|
|
|
|
|
|
|
|
| |
|
9/30/2013 |
|
|
6/30/2013 |
|
| Number of Properties: |
|
|
|
|
|
|
|
|
| Domestic |
|
|
90 |
|
|
|
98 |
(2) |
| International |
|
|
28 |
|
|
|
28 |
|
| Unconsolidated Joint Ventures: Managed |
|
|
10 |
|
|
|
1 |
|
| Unconsolidated Joint Ventures: Non-Managed |
|
|
2 |
|
|
|
2 |
|
|
|
|
|
|
|
|
|
|
|
|
|
130 |
|
|
|
129 |
|
| Number of Buildings: |
|
|
|
|
|
|
|
|
| Domestic |
|
|
142 |
|
|
|
152 |
|
| International |
|
|
32 |
|
|
|
32 |
|
| Unconsolidated Joint Ventures: Managed |
|
|
12 |
|
|
|
1 |
|
| Unconsolidated Joint Ventures: Non-Managed |
|
|
2 |
|
|
|
2 |
|
|
|
|
|
|
|
|
|
|
|
|
|
188 |
|
|
|
187 |
|
| Number of Markets: |
|
|
|
|
|
|
|
|
| Domestic |
|
|
20 |
|
|
|
20 |
|
| International |
|
|
11 |
|
|
|
10 |
|
| Unconsolidated Joint Ventures: Managed |
|
|
1 |
|
|
|
1 |
|
| Unconsolidated Joint Ventures: Non-Managed |
|
|
1 |
|
|
|
1 |
|
|
|
|
|
|
|
|
|
|
|
|
|
33 |
|
|
|
32 |
|
| Net Rentable Square Feet: (3) |
|
|
|
|
|
|
|
|
| Domestic |
|
|
16,705,106 |
|
|
|
17,685,861 |
|
| International |
|
|
2,816,450 |
|
|
|
2,814,782 |
|
| Unconsolidated Joint Ventures: Managed |
|
|
1,060,473 |
|
|
|
0 |
|
| Unconsolidated Joint Ventures: Non-Managed |
|
|
451,369 |
|
|
|
447,399 |
|
|
|
|
|
|
|
|
|
|
|
|
|
21,033,398 |
|
|
|
20,948,042 |
|
| Space Held for Development Square Feet: |
|
|
|
|
|
|
|
|
| Domestic |
|
|
2,425,699 |
|
|
|
2,404,288 |
|
| International |
|
|
392,285 |
|
|
|
393,953 |
|
| Unconsolidated Joint Ventures: Managed |
|
|
0 |
|
|
|
0 |
|
| Unconsolidated Joint Ventures: Non-Managed |
|
|
0 |
|
|
|
0 |
|
|
|
|
|
|
|
|
|
|
|
|
|
2,817,984 |
|
|
|
2,798,241 |
|
| Portfolio Occupancy (4) |
|
|
93.0 |
% |
|
|
93.1 |
% |
| DLR Share Occupancy (4)(5) |
|
|
92.7 |
% |
|
|
93.1 |
% |
| Same Store Pool Occupancy (4) |
|
|
91.8 |
% |
|
|
92.3 |
% |
| (1) |
Includes ten properties held in our managed portfolio of unconsolidated joint ventures consisting of 4650 Old Ironsides Drive, Santa Clara, CA, 2950 Zanker Road, San Jose, CA, 4700 Old Ironsides Drive, Santa Clara, CA,
444 Toyama Drive, Sunnyvale, CA, 43790 Devin Shafron Drive—E, Ashburn, VA, 21551 Beaumeade Circle, Ashburn, VA, 7505 Mason King Court, Manassas, VA, 14901 FAA Boulevard, Fort Worth, TX, 900 Dorothy Drive, Richardson, TX and 33 Chun Choi Street,
Hong Kong; and two unconsolidated non-managed joint ventures: 2001 Sixth Avenue, Seattle and 2020 Fifth Avenue, Seattle. |
| (2) |
43790 Devin Shafron Drive—E & 21551 Beaumeade Circle are included in the property count because they were separately contributed to our managed unconsolidated joint venture. Not included in prior quarter.
|
| (3) |
We estimate the total net rentable square feet available for lease based on a number of factors in addition to contractually leased square feet, including available power, required support space and common area.
|
| (4) |
Occupancy excludes space held for development and our two unconsolidated joint ventures that we do not manage. For some of our properties, we calculate occupancy based on factors in addition to contractually leased
square feet, including available power, required support space and common area. |
| (5) |
Represents consolidated portfolio plus our managed portfolio of unconsolidated joint ventures based on our ownership percentage. |
Page 18
DIGITAL REALTY TRUST, INC.
Third Quarter 2013
Properties Acquired
For the three months ended September 30, 2013
|
|
|
|
|
|
|
|
|
|
|
|
|
|
|
|
|
|
|
|
|
|
|
| Property |
|
|
|
Metropolitan Area |
|
Date Acquired |
|
Purchase Price
(in millions) |
|
|
Net Rentable
Square Feet (1) |
|
|
Space Held For
Development |
|
|
Percentage of Total
Net Rentable Square
Feet Occupied (2) |
|
| Saito Industrial Park (Land) |
|
(3) |
|
Osaka, Japan |
|
Aug-13 |
|
$ |
9.6 |
(4) |
|
|
— |
|
|
|
— |
|
|
|
0.0 |
% |
| Principal Park (Land) |
|
(5) |
|
London, England |
|
Sep-13 |
|
$ |
19.2 |
(4) |
|
|
— |
|
|
|
— |
|
|
|
0.0 |
% |
| De President Business Park (Land) |
|
(6) |
|
Amsterdam, Netherlands |
|
Sep-13 |
|
$ |
6.7 |
(4) |
|
|
— |
|
|
|
— |
|
|
|
0.0 |
% |
|
|
|
|
|
|
|
|
|
|
|
|
|
|
|
|
|
|
|
|
|
|
|
|
|
|
|
|
|
|
|
$ |
35.5 |
|
|
|
— |
|
|
|
— |
|
|
|
0.0 |
% |
|
|
|
|
|
|
|
|
|
|
|
|
|
|
|
|
|
|
|
|
|
|
|
| (1) |
We estimate the total net rentable square feet available for lease based on a number of factors in addition to contractually leased square feet, including available power, required support space and common area.
|
| (2) |
Occupancy percentages are calculated net of square footage of space held for development. |
| (4) |
Purchase price in USD is based on the exchange rate on the date of acquisition. |
Page 19
DIGITAL REALTY TRUST, INC.
Third Quarter 2013
Occupancy Analysis
As of September 30, 2013
(Dollar amounts in
thousands)
|
|
|
|
|
|
|
|
|
|
|
|
|
|
|
|
|
|
|
|
|
|
|
|
|
|
|
|
|
|
|
|
|
|
|
|
|
|
|
| |
|
|
|
|
|
|
|
|
|
|
|
|
|
|
|
|
|
|
Occupancy (3) |
|
|
Net Rentable
Square Feet as a
% of |
|
|
Annualized Rent
as a % of |
|
| Property |
|
|
|
|
Acquisition
Date |
|
|
Property Type |
|
Net Rentable
Square Feet (1) |
|
|
Space Held for
Development |
|
|
Annualized Rent
($000) (2) |
|
|
As of
9/30/13 |
|
|
As of
6/30/13 |
|
|
Total
Portfolio |
|
|
Total Portfolio |
|
| NORTH AMERICA |
|
|
|
|
|
|
|
|
|
|
|
|
|
|
|
|
|
|
|
|
|
|
|
|
|
|
|
|
|
|
|
|
|
|
|
|
|
|
| Northern Virginia |
|
|
|
|
|
|
|
|
|
|
|
|
|
|
|
|
|
|
|
|
|
|
|
|
|
|
|
|
|
|
|
|
|
|
|
|
|
|
| 43881 Devin Shafron Drive |
|
|
|
|
|
|
Mar-07 |
|
|
Data Center |
|
|
180,000 |
|
|
|
— |
|
|
|
19,097 |
|
|
|
100.0 |
% |
|
|
100.0 |
% |
|
|
0.9 |
% |
|
|
1.7 |
% |
| 43915 Devin Shafron Drive—A |
|
|
|
|
|
|
May-09 |
|
|
Data Center |
|
|
129,033 |
|
|
|
3,247 |
|
|
|
16,365 |
|
|
|
100.0 |
% |
|
|
100.0 |
% |
|
|
0.6 |
|
|
|
1.5 |
|
| 43940 Digital Loudoun Plaza—G |
|
|
|
|
|
|
Apr-11 |
|
|
Data Center |
|
|
133,816 |
|
|
|
— |
|
|
|
13,189 |
|
|
|
100.0 |
% |
|
|
100.0 |
% |
|
|
0.6 |
|
|
|
1.2 |
|
| 43830 Devin Shafron Drive—F |
|
|
|
|
|
|
May-09 |
|
|
Data Center |
|
|
101,300 |
|
|
|
11,950 |
|
|
|
11,662 |
|
|
|
93.9 |
% |
|
|
67.8 |
% |
|
|
0.5 |
|
|
|
1.1 |
|
| 43791 Devin Shafron Drive—D |
|
|
|
|
|
|
Mar-07 |
|
|
Data Center |
|
|
134,741 |
|
|
|
259 |
|
|
|
10,449 |
|
|
|
100.0 |
% |
|
|
76.0 |
% |
|
|
0.6 |
|
|
|
0.9 |
|
| 4050 Lafayette Center Drive |
|
|
|
|
|
|
Jul-10 |
|
|
Data Center |
|
|
42,374 |
|
|
|
— |
|
|
|
6,855 |
|
|
|
99.0 |
% |
|
|
99.0 |
% |
|
|
0.2 |
|
|
|
0.6 |
|
| 4030 Lafayette Center Drive |
|
|
|
|
|
|
Jul-10 |
|
|
Data Center |
|
|
72,696 |
|
|
|
— |
|
|
|
5,887 |
|
|
|
100.0 |
% |
|
|
100.0 |
% |
|
|
0.3 |
|
|
|
0.5 |
|
| 45901 & 45845 Nokes Blvd |
|
|
|
|
|
|
Dec-09 |
|
|
Data Center |
|
|
167,160 |
|
|
|
— |
|
|
|
4,751 |
|
|
|
100.0 |
% |
|
|
100.0 |
% |
|
|
0.8 |
|
|
|
0.4 |
|
| 44470 Chilum Place |
|
|
|
|
|
|
Feb-07 |
|
|
Data Center |
|
|
95,440 |
|
|
|
— |
|
|
|
4,419 |
|
|
|
100.0 |
% |
|
|
100.0 |
% |
|
|
0.5 |
|
|
|
0.4 |
|
| 21110 Ridgetop Circle |
|
|
|
|
|
|
Jan-07 |
|
|
Data Center |
|
|
135,513 |
|
|
|
— |
|
|
|
2,993 |
|
|
|
100.0 |
% |
|
|
100.0 |
% |
|
|
0.6 |
|
|
|
0.3 |
|
| 21561 & 21571 Beaumeade Circle |
|
|
|
|
|
|
Dec-09 |
|
|
Data Center |
|
|
164,453 |
|
|
|
— |
|
|
|
2,931 |
|
|
|
100.0 |
% |
|
|
100.0 |
% |
|
|
0.8 |
|
|
|
0.3 |
|
| 1506 Moran Road |
|
|
|
|
|
|
Dec-11 |
|
|
Data Center |
|
|
78,295 |
|
|
|
— |
|
|
|
2,371 |
|
|
|
100.0 |
% |
|
|
100.0 |
% |
|
|
0.4 |
|
|
|
0.2 |
|
| 1807 Michael Faraday Court |
|
|
|
|
|
|
Oct-06 |
|
|
Data Center |
|
|
19,237 |
|
|
|
— |
|
|
|
1,892 |
|
|
|
100.0 |
% |
|
|
100.0 |
% |
|
|
0.1 |
|
|
|
0.2 |
|
| 251 Exchange Place |
|
|
|
|
|
|
Nov-05 |
|
|
Data Center |
|
|
70,982 |
|
|
|
— |
|
|
|
1,689 |
|
|
|
100.0 |
% |
|
|
100.0 |
% |
|
|
0.3 |
|
|
|
0.2 |
|
| 43831 Devin Shafron Drive—C |
|
|
|
|
|
|
Mar-07 |
|
|
Data Center |
|
|
117,071 |
|
|
|
— |
|
|
|
1,573 |
|
|
|
100.0 |
% |
|
|
100.0 |
% |
|
|
0.6 |
|
|
|
0.2 |
|
| 8100 Boone Boulevard |
|
|
|
|
|
|
Oct-06 |
|
|
Data Center |
|
|
17,015 |
|
|
|
— |
|
|
|
529 |
|
|
|
14.9 |
% |
|
|
14.9 |
% |
|
|
0.1 |
|
|
|
0.0 |
|
| 4040 Lafayette Center Drive |
|
|
|
|
|
|
Jul-10 |
|
|
Data Center |
|
|
— |
|
|
|
30,333 |
|
|
|
— |
|
|
|
N/A |
|
|
|
N/A |
|
|
|
0.0 |
|
|
|
0.0 |
|
|
|
|
|
|
|
|
|
|
|
|
|
|
|
|
|
|
|
|
|
|
|
|
|
|
|
|
|
|
|
|
|
|
|
|
|
|
|
|
|
|
|
|
|
|
|
|
|
|
|
|
|
1,659,126 |
|
|
|
45,789 |
|
|
|
106,652 |
|
|
|
98.7 |
% |
|
|
95.1 |
% |
|
|
7.9 |
% |
|
|
9.7 |
% |
| Dallas |
|
|
|
|
|
|
|
|
|
|
|
|
|
|
|
|
|
|
|
|
|
|
|
|
|
|
|
|
|
|
|
|
|
|
|
|
|
|
| 2323 Bryan Street |
|
|
|
|
|
|
Jan-02 |
|
|
Internet Gateway |
|
|
453,539 |
|
|
|
23,568 |
|
|
|
15,582 |
|
|
|
77.7 |
% |
|
|
77.4 |
% |
|
|
2.2 |
% |
|
|
1.5 |
% |
| 2501 S. State Hwy. 121 |
|
|
|
|
|
|
Feb-12 |
|
|
Data Center |
|
|
829,372 |
|
|
|
— |
|
|
|
13,325 |
|
|
|
98.5 |
% |
|
|
98.5 |
% |
|
|
3.9 |
|
|
|
1.2 |
|
| 2440 Marsh Lane |
|
|
|
|
|
|
Jan-03 |
|
|
Data Center |
|
|
135,250 |
|
|
|
— |
|
|
|
12,616 |
|
|
|
94.7 |
% |
|
|
94.7 |
% |
|
|
0.6 |
|
|
|
1.1 |
|
| 1232 Alma Rd RS 100 |
|
|
|
|
|
|
Sep-09 |
|
|
Data Center |
|
|
105,726 |
|
|
|
— |
|
|
|
12,518 |
|
|
|
92.8 |
% |
|
|
89.0 |
% |
|
|
0.5 |
|
|
|
1.1 |
|
| 4849 Alpha Road |
|
|
|
|
|
|
Apr-04 |
|
|
Data Center |
|
|
125,538 |
|
|
|
— |
|
|
|
11,276 |
|
|
|
99.8 |
% |
|
|
100.0 |
% |
|
|
0.6 |
|
|
|
1.0 |
|
| 4025 Midway Road |
|
|
|
|
|
|
Jan-06 |
|
|
Data Center |
|
|
100,590 |
|
|
|
— |
|
|
|
10,204 |
|
|
|
98.4 |
% |
|
|
98.4 |
% |
|
|
0.5 |
|
|
|
1.0 |
|
| 400 S. Akard |
|
|
|
|
|
|
Jun-12 |
|
|
Internet Gateway |
|
|
269,563 |
|
|
|
— |
|
|
|
7,921 |
|
|
|
94.7 |
% |
|
|
94.7 |
% |
|
|
1.3 |
|
|
|
0.7 |
|
| 11830 Webb Chapel Road |
|
|
|
|
|
|
Aug-04 |
|
|
Data Center |
|
|
365,647 |
|
|
|
— |
|
|
|
7,877 |
|
|
|
98.0 |
% |
|
|
98.0 |
% |
|
|
1.7 |
|
|
|
0.7 |
|
| 900 Quality Way |
|
|
|
|
|
|
Sep-09 |
|
|
Data Center |
|
|
42,318 |
|
|
|
72,604 |
|
|
|
6,466 |
|
|
|
96.2 |
% |
|
|
96.2 |
% |
|
|
0.2 |
|
|
|
0.6 |
|
| 1215 Integrity Drive |
|
|
(4 |
) |
|
|
Sep-09 |
|
|
Data Center |
|
|
61,750 |
|
|
|
— |
|
|
|
1,310 |
|
|
|
94.6 |
% |
|
|
94.6 |
% |
|
|
0.3 |
|
|
|
0.1 |
|
| 904 Quality Way |
|
|
|
|
|
|
Sep-09 |
|
|
Data Center |
|
|
46,750 |
|
|
|
— |
|
|
|
978 |
|
|
|
100.0 |
% |
|
|
100.0 |
% |
|
|
0.2 |
|
|
|
0.1 |
|
| 17201 Waterview Parkway |
|
|
|
|
|
|
Jan-13 |
|
|
Data Center |
|
|
61,750 |
|
|
|
— |
|
|
|
704 |
|
|
|
100.0 |
% |
|
|
100.0 |
% |
|
|
0.3 |
|
|
|
0.1 |
|
| 850 East Collins |
|
|
|
|
|
|
Sep-08 |
|
|
Data Center |
|
|
46,723 |
|
|
|
— |
|
|
|
319 |
|
|
|
6.1 |
% |
|
|
0.0 |
% |
|
|
0.2 |
|
|
|
0.0 |
|
| 905 Security Row |
|
|
|
|
|
|
Sep-09 |
|
|
Data Center |
|
|
— |
|
|
|
249,657 |
|
|
|
— |
|
|
|
0.0 |
% |
|
|
0.0 |
% |
|
|
0.0 |
|
|
|
0.0 |
|
| 1210 Integrity Drive |
|
|
|
|
|
|
Sep-09 |
|
|
Data Center |
|
|
— |
|
|
|
246,940 |
|
|
|
— |
|
|
|
0.0 |
% |
|
|
0.0 |
% |
|
|
0.0 |
|
|
|
0.0 |
|
| 1301 International Parkway |
|
|
|
|
|
|
Sep-09 |
|
|
Data Center |
|
|
— |
|
|
|
20,500 |
|
|
|
— |
|
|
|
0.0 |
% |
|
|
0.0 |
% |
|
|
0.0 |
|
|
|
0.0 |
|
|
|
|
|
|
|
|
|
|
|
|
|
|
|
|
|
|
|
|
|
|
|
|
|
|
|
|
|
|
|
|
|
|
|
|
|
|
|
|
|
|
|
|
|
|
|
|
|
|
|
|
|
2,644,516 |
|
|
|
613,269 |
|
|
|
101,096 |
|
|
|
92.4 |
% |
|
|
92.1 |
% |
|
|
12.5 |
% |
|
|
9.2 |
% |
| New York |
|
|
|
|
|
|
|
|
|
|
|
|
|
|
|
|
|
|
|
|
|
|
|
|
|
|
|
|
|
|
|
|
|
|
|
|
|
|
| 365 S Randolphville Road |
|
|
|
|
|
|
Feb-08 |
|
|
Data Center |
|
|
209,815 |
|
|
|
54,977 |
|
|
|
22,504 |
|
|
|
98.8 |
% |
|
|
98.7 |
% |
|
|
1.0 |
% |
|
|
2.0 |
% |
| 111 Eighth Avenue |
|
|
(5 |
) |
|
|
Oct-06 |
|
|
Internet Gateway |
|
|
116,843 |
|
|
|
— |
|
|
|
21,175 |
|
|
|
100.0 |
% |
|
|
100.0 |
% |
|
|
0.6 |
|
|
|
1.9 |
|
| 3 Corporate Place |
|
|
|
|
|
|
Dec-05 |
|
|
Data Center |
|
|
276,931 |
|
|
|
— |
|
|
|
19,318 |
|
|
|
100.0 |
% |
|
|
100.0 |
% |
|
|
1.3 |
|
|
|
1.7 |
|
| 300 Boulevard East |
|
|
|
|
|
|
Nov-02 |
|
|
Data Center |
|
|
346,819 |
|
|
|
22,962 |
|
|
|
16,057 |
|
|
|
92.7 |
% |
|
|
92.7 |
% |
|
|
1.6 |
|
|
|
1.4 |
|
| 60 & 80 Merritt Boulevard |
|
|
|
|
|
|
Jan-10 |
|
|
Data Center |
|
|
192,933 |
|
|
|
— |
|
|
|
15,288 |
|
|
|
100.0 |
% |
|
|
100.0 |
% |
|
|
0.9 |
|
|
|
1.4 |
|
| 410 Commerce Boulevard |
|
|
(6 |
) |
|
|
Aug-12 |
|
|
Data Center |
|
|
27,943 |
|
|
|
— |
|
|
|
4,847 |
|
|
|
100.0 |
% |
|
|
0.0 |
% |
|
|
0.1 |
|
|
|
0.4 |
|
| 650 Randolph Road |
|
|
|
|
|
|
Jun-08 |
|
|
Data Center |
|
|
— |
|
|
|
127,790 |
|
|
|
— |
|
|
|
0.0 |
% |
|
|
0.0 |
% |
|
|
0.0 |
|
|
|
0.0 |
|
| 701 Union Boulevard |
|
|
|
|
|
|
Nov-12 |
|
|
Data Center |
|
|
— |
|
|
|
271,000 |
|
|
|
— |
|
|
|
N/A |
|
|
|
N/A |
|
|
|
0.0 |
|
|
|
0.0 |
|
|
|
|
|
|
|
|
|
|
|
|
|
|
|
|
|
|
|
|
|
|
|
|
|
|
|
|
|
|
|
|
|
|
|
|
|
|
|
|
|
|
|
|
|
|
|
|
|
|
|
|
|
1,171,284 |
|
|
|
476,729 |
|
|
|
99,189 |
|
|
|
97.6 |
% |
|
|
97.5 |
% |
|
|
5.5 |
% |
|
|
8.8 |
% |
| Silicon Valley |
|
|
|
|
|
|
|
|
|
|
|
|
|
|
|
|
|
|
|
|
|
|
|
|
|
|
|
|
|
|
|
|
|
|
|
|
|
|
| 3011 Lafayette Street |
|
|
|
|
|
|
Jan-07 |
|
|
Data Center |
|
|
90,780 |
|
|
|
— |
|
|
|
10,553 |
|
|
|
100.0 |
% |
|
|
100.0 |
% |
|
|
0.4 |
% |
|
|
1.0 |
% |
| 1350 Duane & 3080 Raymond |
|
|
|
|
|
|
Oct-09 |
|
|
Data Center |
|
|
185,000 |
|
|
|
— |
|
|
|
10,552 |
|
|
|
100.0 |
% |
|
|
100.0 |
% |
|
|
0.9 |
|
|
|
1.0 |
|
| 1500 Space Park Drive |
|
|
|
|
|
|
Sep-07 |
|
|
Data Center |
|
|
51,615 |
|
|
|
— |
|
|
|
9,605 |
|
|
|
100.0 |
% |
|
|
100.0 |
% |
|
|
0.2 |
|
|
|
0.9 |
|
| 1525 Comstock Street |
|
|
|
|
|
|
Sep-07 |
|
|
Data Center |
|
|
42,385 |
|
|
|
— |
|
|
|
8,786 |
|
|
|
100.0 |
% |
|
|
100.0 |
% |
|
|
0.2 |
|
|
|
0.8 |
|
| 3105 and 3205 Alfred Street |
|
|
|
|
|
|
May-10 |
|
|
Data Center |
|
|
49,858 |
|
|
|
— |
|
|
|
8,621 |
|
|
|
87.9 |
% |
|
|
87.9 |
% |
|
|
0.2 |
|
|
|
0.8 |
|
| 1100 Space Park Drive |
|
|
|
|
|
|
Nov-04 |
|
|
Internet Gateway |
|
|
165,297 |
|
|
|
— |
|
|
|
7,744 |
|
|
|
92.7 |
% |
|
|
92.7 |
% |
|
|
0.8 |
|
|
|
0.7 |
|
| 2045 & 2055 LaFayette Street |
|
|
|
|
|
|
May-04 |
|
|
Data Center |
|
|
300,000 |
|
|
|
— |
|
|
|
7,200 |
|
|
|
100.0 |
% |
|
|
100.0 |
% |
|
|
1.4 |
|
|
|
0.6 |
|
Page 20
DIGITAL REALTY TRUST, INC.
Third Quarter 2013
Occupancy Analysis
As of September 30, 2013
(Dollar amounts in
thousands)
|
|
|
|
|
|
|
|
|
|
|
|
|
|
|
|
|
|
|
|
|
|
|
|
|
|
|
|
|
|
|
|
|
|
|
|
|
|
|
| |
|
|
|
|
|
|
|
|
|
|
|
|
|
|
|
|
|
|
Occupancy (3) |
|
|
Net Rentable
Square Feet as a
% of |
|
|
Annualized Rent
as a % of |
|
| Property |
|
|
|
|
Acquisition
Date |
|
|
Property Type |
|
Net Rentable
Square Feet (1) |
|
|
Space Held for
Development |
|
|
Annualized Rent
($000) (2) |
|
|
As of
9/30/13 |
|
|
As of
6/30/13 |
|
|
Total
Portfolio |
|
|
Total Portfolio |
|
| 1725 Comstock Street |
|
|
|
|
|
|
Apr-10 |
|
|
Data Center |
|
|
39,643 |
|
|
|
— |
|
|
|
6,870 |
|
|
|
100.0 |
% |
|
|
100.0 |
% |
|
|
0.2 |
|
|
|
0.6 |
|
| 150 South First Street |
|
|
|
|
|
|
Sep-04 |
|
|
Data Center |
|
|
179,761 |
|
|
|
— |
|
|
|
6,551 |
|
|
|
94.6 |
% |
|
|
93.7 |
% |
|
|
0.9 |
|
|
|
0.6 |
|
| 1201 Comstock Street |
|
|
|
|
|
|
Jun-08 |
|
|
Data Center |
|
|
24,000 |
|
|
|
— |
|
|
|
4,736 |
|
|
|
100.0 |
% |
|
|
100.0 |
% |
|
|
0.1 |
|
|
|
0.4 |
|
| 2334 Lundy Place |
|
|
|
|
|
|
Dec-02 |
|
|
Data Center |
|
|
130,752 |
|
|
|
— |
|
|
|
4,525 |
|
|
|
100.0 |
% |
|
|
100.0 |
% |
|
|
0.6 |
|
|
|
0.4 |
|
| 2401 Walsh Street |
|
|
|
|
|
|
Jun-05 |
|
|
Data Center |
|
|
167,932 |
|
|
|
— |
|
|
|
3,834 |
|
|
|
100.0 |
% |
|
|
100.0 |
% |
|
|
0.8 |
|
|
|
0.3 |
|
| 2403 Walsh Street |
|
|
|
|
|
|
Jun-05 |
|
|
Data Center |
|
|
103,940 |
|
|
|
— |
|
|
|
2,373 |
|
|
|
100.0 |
% |
|
|
100.0 |
% |
|
|
0.5 |
|
|
|
0.2 |
|
| 2805 Lafayette Street |
|
|
(7 |
) |
|
|
Aug-10 |
|
|
Data Center |
|
|
38,693 |
|
|
|
111,647 |
|
|
|
334 |
|
|
|
34.4 |
% |
|
|
1.2 |
% |
|
|
0.2 |
|
|
|
0.0 |
|
|
|
|
|
|
|
|
|
|
|
|
|
|
|
|
|
|
|
|
|
|
|
|
|
|
|
|
|
|
|
|
|
|
|
|
|
|
|
|
|
|
|
|
|
|
|
|
|
|
|
|
|
1,569,656 |
|
|
|
111,647 |
|
|
|
92,284 |
|
|
|
96.6 |
% |
|
|
95.7 |
% |
|
|
7.4 |
% |
|
|
8.3 |
% |
| Chicago |
|
|
|
|
|
|
|
|
|
|
|
|
|
|
|
|
|
|
|
|
|
|
|
|
|
|
|
|
|
|
|
|
|
|
|
|
|
|
| 350 E Cermak Road |
|
|
|
|
|
|
May-05 |
|
|
Internet Gateway |
|
|
1,120,226 |
|
|
|
13,513 |
|
|
|
69,246 |
|
|
|
98.7 |
% |
|
|
99.3 |
% |
|
|
5.3 |
% |
|
|
6.1 |
% |
| 600-780 S. Federal |
|
|
|
|
|
|
Sep-05 |
|
|
Internet Gateway |
|
|
131,930 |
|
|
|
29,617 |
|
|
|
7,185 |
|
|
|
84.9 |
% |
|
|
92.7 |
% |
|
|
0.6 |
|
|
|
0.6 |
|
| 9333, 9355, 9377 Grand Avenue |
|
|
|
|
|
|
May-12 |
|
|
Data Center |
|
|
108,838 |
|
|
|
466,106 |
|
|
|
2,788 |
|
|
|
66.8 |
% |
|
|
84.8 |
% |
|
|
0.5 |
|
|
|
0.3 |
|
|
|
|
|
|
|
|
|
|
|
|
|
|
|
|
|
|
|
|
|
|
|
|
|
|
|
|
|
|
|
|
|
|
|
|
|
|
|
|
|
|
|
|
|
|
|
|
|
|
|
|
|
1,360,994 |
|
|
|
509,236 |
|
|
|
79,219 |
|
|
|
94.9 |
% |
|
|
96.6 |
% |
|
|
6.4 |
% |
|
|
7.0 |
% |
| San Francisco |
|
|
|
|
|
|
|
|
|
|
|
|
|
|
|
|
|
|
|
|
|
|
|
|
|
|
|
|
|
|
|
|
|
|
|
|
|
|
| 200 Paul Avenue 1-4 |
|
|
|
|
|
|
Nov-04 |
|
|
Internet Gateway |
|
|
479,082 |
|
|
|
33,560 |
|
|
|
28,112 |
|
|
|
95.0 |
% |
|
|
99.3 |
% |
|
|
2.3 |
% |
|
|
2.5 |
% |
| 365 Main Street |
|
|
|
|
|
|
Jul-10 |
|
|
Internet Gateway |
|
|
226,981 |
|
|
|
— |
|
|
|
26,921 |
|
|
|
77.7 |
% |
|
|
79.3 |
% |
|
|
1.1 |
|
|
|
2.4 |
|
| 720 2nd Street |
|
|
|
|
|
|
Jul-10 |
|
|
Data Center |
|
|
121,220 |
|
|
|
— |
|
|
|
15,667 |
|
|
|
90.6 |
% |
|
|
87.2 |
% |
|
|
0.6 |
|
|
|
1.4 |
|
| 360 Spear Street |
|
|
|
|
|
|
Dec-11 |
|
|
Data Center |
|
|
154,950 |
|
|
|
— |
|
|
|
8,269 |
|
|
|
100.0 |
% |
|
|
100.0 |
% |
|
|
0.7 |
|
|
|
0.7 |
|
|
|
|
|
|
|
|
|
|
|
|
|
|
|
|
|
|
|
|
|
|
|
|
|
|
|
|
|
|
|
|
|
|
|
|
|
|
|
|
|
|
|
|
|
|
|
|
|
|
|
|
|
982,233 |
|
|
|
33,560 |
|
|
|
78,969 |
|
|
|
91.2 |
% |
|
|
93.4 |
% |
|
|
4.7 |
% |
|
|
7.0 |
% |
| Phoenix |
|
|
|
|
|
|
|
|
|
|
|
|
|
|
|
|
|
|
|
|
|
|
|
|
|
|
|
|
|
|
|
|
|
|
|
|
|
|
| 2121 South Price Road |
|
|
|
|
|
|
Jul-10 |
|
|
Data Center |
|
|
380,235 |
|
|
|
139,244 |
|
|
|
39,432 |
|
|
|
79.9 |
% |
|
|
81.6 |
% |
|
|
1.8 |
% |
|
|
3.6 |
% |
| 120 E Van Buren |
|
|
|
|
|
|
Jul-06 |
|
|
Internet Gateway |
|
|
273,569 |
|
|
|
13,945 |
|
|
|
20,922 |
|
|
|
92.1 |
% |
|
|
92.3 |
% |
|
|
1.3 |
|
|
|
1.9 |
|
| 2055 East Technology Circle |
|
|
|
|
|
|
Oct-06 |
|
|
Data Center |
|
|
76,350 |
|
|
|
— |
|
|
|
8,478 |
|
|
|
100.0 |
% |
|
|
100.0 |
% |
|
|
0.4 |
|
|
|
0.8 |
|
| 1900 S. Price Road |
|
|
|
|
|
|
Jan-13 |
|
|
Data Center |
|
|
118,348 |
|
|
|
108,926 |
|
|
|
1,450 |
|
|
|
100.0 |
% |
|
|
100.0 |
% |
|
|
0.6 |
|
|
|
0.1 |
|
|
|
|
|
|
|
|
|
|
|
|
|
|
|
|
|
|
|
|
|
|
|
|
|
|
|
|
|
|
|
|
|
|
|
|
|
|
|
|
|
|
|
|
|
|
|
|
|
|
|
|
|
848,502 |
|
|
|
262,115 |
|
|
|
70,282 |
|
|
|
88.5 |
% |
|
|
89.4 |
% |
|
|
4.1 |
% |
|
|
6.4 |
% |
| Boston |
|
|
|
|
|
|
|
|
|
|
|
|
|
|
|
|
|
|
|
|
|
|
|
|
|
|
|
|
|
|
|
|
|
|
|
|
|
|
| 128 First Avenue |
|
|
|
|
|
|
Jan-10 |
|
|
Data Center |
|
|
274,750 |
|
|
|
— |
|
|
|
23,058 |
|
|
|
97.5 |
% |
|
|
97.5 |
% |
|
|
1.3 |
% |
|
|
2.1 |
% |
| Digital 55 Middlesex LLC |
|
|
|
|
|
|
Jan-10 |
|
|
Data Center |
|
|
106,000 |
|
|
|
— |
|
|
|
12,074 |
|
|
|
95.3 |
% |
|
|
95.3 |
% |
|
|
0.5 |
|
|
|
1.1 |
|
| 100 Quannapowitt Parkway |
|
|
|
|
|
|
Jun-04 |
|
|
Data Center |
|
|
302,512 |
|
|
|
84,444 |
|
|
|
7,288 |
|
|
|
86.5 |
% |
|
|
86.5 |
% |
|
|
1.4 |
|
|
|
0.7 |
|
| 115 Second Avenue |
|
|
|
|
|
|
Oct-05 |
|
|
Data Center |
|
|
66,730 |
|
|
|
— |
|
|
|
3,869 |
|
|
|
100.0 |
% |
|
|
100.0 |
% |
|
|
0.3 |
|
|
|
0.3 |
|
| 105 Cabot Street |
|
|
|
|
|
|
Jan-10 |
|
|
Data Center |
|
|
34,526 |
|
|
|
— |
|
|
|
1,558 |
|
|
|
39.4 |
% |
|
|
19.4 |
% |
|
|
0.2 |
|
|
|
0.1 |
|
| 600 Winter Street |
|
|
|
|
|
|
Sep-06 |
|
|
Data Center |
|
|
30,400 |
|
|
|
— |
|
|
|
760 |
|
|
|
100.0 |
% |
|
|
100.0 |
% |
|
|
0.2 |
|
|
|
0.1 |
|
|
|
|
|
|
|
|
|
|
|
|
|
|
|
|
|
|
|
|
|
|
|
|
|
|
|
|
|
|
|
|
|
|
|
|
|
|
|
|
|
|
|
|
|
|
|
|
|
|
|
|
|
814,918 |
|
|
|
84,444 |
|
|
|
48,607 |
|
|
|
91.0 |
% |
|
|
90.1 |
% |
|
|
3.9 |
% |
|
|
4.4 |
% |
| Los Angeles |
|
|
|
|
|
|
|
|
|
|
|
|
|
|
|
|
|
|
|
|
|
|
|
|
|
|
|
|
|
|
|
|
|
|
|
|
|
|
| 600 West Seventh Street |
|
|
|
|
|
|
May-04 |
|
|
Internet Gateway |
|
|
489,722 |
|
|
|
— |
|
|
|
23,496 |
|
|
|
97.8 |
% |
|
|
97.8 |
% |
|
|
2.3 |
% |
|
|
2.1 |
% |
| 2260 East El Segundo Boulevard |
|
|
|
|
|
|
Jul-10 |
|
|
Data Center |
|
|
132,240 |
|
|
|
— |
|
|
|
11,762 |
|
|
|
90.2 |
% |
|
|
90.1 |
% |
|
|
0.6 |
|
|
|
1.1 |
|
| 200 North Nash Street |
|
|
|
|
|
|
Jun-05 |
|
|
Data Center |
|
|
113,606 |
|
|
|
— |
|
|
|
2,594 |
|
|
|
100.0 |
% |
|
|
100.0 |
% |
|
|
0.5 |
|
|
|
0.2 |
|
| 3015 Winona Avenue |
|
|
|
|
|
|
Dec-04 |
|
|
Data Center |
|
|
82,911 |
|
|
|
— |
|
|
|
1,706 |
|
|
|
100.0 |
% |
|
|
100.0 |
% |
|
|
0.4 |
|
|
|
0.2 |
|
| 3300 East Birch Street |
|
|
|
|
|
|
Aug-03 |
|
|
Data Center |
|
|
68,807 |
|
|
|
— |
|
|
|
1,593 |
|
|
|
100.0 |
% |
|
|
100.0 |
% |
|
|
0.3 |
|
|
|
0.1 |
|
|
|
|
|
|
|
|
|
|
|
|
|
|
|
|
|
|
|
|
|
|
|
|
|
|
|
|
|
|
|
|
|
|
|
|
|
|
|
|
|
|
|
|
|
|
|
|
|
|
|
|
|
887,286 |
|
|
|
— |
|
|
|
41,151 |
|
|
|
97.3 |
% |
|
|
97.3 |
% |
|
|
4.1 |
% |
|
|
3.7 |
% |
| Atlanta |
|
|
|
|
|
|
|
|
|
|
|
|
|
|
|
|
|
|
|
|
|
|
|
|
|
|
|
|
|
|
|
|
|
|
|
|
|
|
| 375 Riverside Parkway |
|
|
|
|
|
|
Jun-03 |
|
|
Data Center |
|
|
250,191 |
|
|
|
— |
|
|
|
8,609 |
|
|
|
100.0 |
% |
|
|
100.0 |
% |
|
|
1.2 |
% |
|
|
0.8 |
% |
| 760 Doug Davis Drive |
|
|
|
|
|
|
Dec-11 |
|
|
Data Center |
|
|
334,306 |
|
|
|
— |
|
|
|
6,473 |
|
|
|
100.0 |
% |
|
|
100.0 |
% |
|
|
1.6 |
|
|
|
0.6 |
|
| 101 Aquila Way |
|
|
|
|
|
|
Apr-06 |
|
|
Data Center |
|
|
313,581 |
|
|
|
— |
|
|
|
1,437 |
|
|
|
100.0 |
% |
|
|
100.0 |
% |
|
|
1.5 |
|
|
|
0.1 |
|
|
|
|
|
|
|
|
|
|
|
|
|
|
|
|
|
|
|
|
|
|
|
|
|
|
|
|
|
|
|
|
|
|
|
|
|
|
|
|
|
|
|
|
|
|
|
|
|
|
|
|
|
898,078 |
|
|
|
— |
|
|
|
16,519 |
|
|
|
100.0 |
% |
|
|
100.0 |
% |
|
|
4.3 |
% |
|
|
1.5 |
% |
| Philadelphia |
|
|
|
|
|
|
|
|
|
|
|
|
|
|
|
|
|
|
|
|
|
|
|
|
|
|
|
|
|
|
|
|
|
|
|
|
|
|
| 833 Chestnut Street |
|
|
|
|
|
|
Mar-05 |
|
|
Data Center |
|
|
594,747 |
|
|
|
60,011 |
|
|
|
13,375 |
|
|
|
91.7 |
% |
|
|
91.6 |
% |
|
|
2.8 |
% |
|
|
1.2 |
% |
|
|
|
|
|
|
|
|
|
|
|
|
|
|
|
|
|
|
|
|
|
|
|
|
|
|
|
|
|
|
|
|
|
|
|
|
|
|
|
|
|
|
|
|
|
|
|
|
|
|
|
|
594,747 |
|
|
|
60,011 |
|
|
|
13,375 |
|
|
|
91.7 |
% |
|
|
91.6 |
% |
|
|
2.8 |
% |
|
|
1.2 |
% |
| Houston |
|
|
|
|
|
|
|
|
|
|
|
|
|
|
|
|
|
|
|
|
|
|
|
|
|
|
|
|
|
|
|
|
|
|
|
|
|
|
| Digital Houston |
|
|
|
|
|
|
Apr-06 |
|
|
Data Center |
|
|
408,735 |
|
|
|
18,222 |
|
|
|
12,283 |
|
|
|
84.5 |
% |
|
|
89.4 |
% |
|
|
1.9 |
% |
|
|
1.1 |
% |
|
|
|
|
|
|
|
|
|
|
|
|
|
|
|
|
|
|
|
|
|
|
|
|
|
|
|
|
|
|
|
|
|
|
|
|
|
|
|
|
|
|
|
|
|
|
|
|
|
|
|
|
408,735 |
|
|
|
18,222 |
|
|
|
12,283 |
|
|
|
84.5 |
% |
|
|
89.4 |
% |
|
|
1.9 |
% |
|
|
1.1 |
% |
Page 21
DIGITAL REALTY TRUST, INC.
Third Quarter 2013
Occupancy Analysis
As of September 30, 2013
(Dollar amounts in
thousands)
|
|
|
|
|
|
|
|
|
|
|
|
|
|
|
|
|
|
|
|
|
|
|
|
|
|
|
|
|
|
|
|
|
|
|
| |
|
|
|
|
|
|
|
|
|
|
|
|
|
|
|
|
Occupancy (3) |
|
|
Net Rentable
Square Feet as a
% of |
|
|
Annualized Rent
as a % of |
|
| Property |
|
|
|
Acquisition
Date |
|
Property Type |
|
Net Rentable
Square Feet (1) |
|
|
Space Held for
Development |
|
|
Annualized Rent
($000) (2) |
|
|
As of
9/30/13 |
|
|
As of
6/30/13 |
|
|
Total
Portfolio |
|
|
Total
Portfolio |
|
| Denver |
|
|
|
|
|
|
|
|
|
|
|
|
|
|
|
|
|
|
|
|
|
|
|
|
|
|
|
|
|
|
|
|
|
|
| 11900 East Cornell Avenue |
|
|
|
Sep-12 |
|
Data Center |
|
|
285,840 |
|
|
|
— |
|
|
|
6,421 |
|
|
|
94.3 |
% |
|
|
94.3 |
% |
|
|
1.4 |
% |
|
|
0.6 |
% |
| 8534 Concord Center Drive |
|
|
|
Jun-05 |
|
Data Center |
|
|
85,660 |
|
|
|
— |
|
|
|
3,784 |
|
|
|
100.0 |
% |
|
|
100.0 |
% |
|
|
0.4 |
|
|
|
0.3 |
|
|
|
|
|
|
|
|
|
|
|
|
|
|
|
|
|
|
|
|
|
|
|
|
|
|
|
|
|
|
|
|
|
|
|
|
|
|
|
|
|
|
|
|
|
371,500 |
|
|
|
— |
|
|
|
10,205 |
|
|
|
95.6 |
% |
|
|
95.6 |
% |
|
|
1.8 |
% |
|
|
0.9 |
% |
| St. Louis |
|
|
|
|
|
|
|
|
|
|
|
|
|
|
|
|
|
|
|
|
|
|
|
|
|
|
|
|
|
|
|
|
|
|
| 210 N Tucker Boulevard |
|
|
|
Aug-07 |
|
Data Center |
|
|
201,588 |
|
|
|
135,828 |
|
|
|
4,650 |
|
|
|
75.2 |
% |
|
|
81.4 |
% |
|
|
1.0 |
% |
|
|
0.4 |
% |
| 900 Walnut Street |
|
|
|
Aug-07 |
|
Internet Gateway |
|
|
105,776 |
|
|
|
6,490 |
|
|
|
4,491 |
|
|
|
95.8 |
% |
|
|
95.8 |
% |
|
|
0.5 |
|
|
|
0.4 |
|
|
|
|
|
|
|
|
|
|
|
|
|
|
|
|
|
|
|
|
|
|
|
|
|
|
|
|
|
|
|
|
|
|
|
|
|
|
|
|
|
|
|
|
|
307,364 |
|
|
|
142,318 |
|
|
|
9,141 |
|
|
|
82.3 |
% |
|
|
86.6 |
% |
|
|
1.5 |
% |
|
|
0.8 |
% |
| Portland |
|
|
|
|
|
|
|
|
|
|
|
|
|
|
|
|
|
|
|
|
|
|
|
|
|
|
|
|
|
|
|
|
|
|
| 3825 NW Aloclek Place |
|
|
|
Aug-11 |
|
Data Center |
|
|
48,574 |
|
|
|
— |
|
|
|
7,993 |
|
|
|
100.0 |
% |
|
|
100.0 |
% |
|
|
0.2 |
% |
|
|
0.7 |
% |
|
|
|
|
|
|
|
|
|
|
|
|
|
|
|
|
|
|
|
|
|
|
|
|
|
|
|
|
|
|
|
|
|
|
|
|
|
|
|
|
|
|
|
|
48,574 |
|
|
|
— |
|
|
|
7,993 |
|
|
|
100.0 |
% |
|
|
100.0 |
% |
|
|
0.2 |
% |
|
|
0.7 |
% |
| Minneapolis/St. Paul |
|
|
|
|
|
|
|
|
|
|
|
|
|
|
|
|
|
|
|
|
|
|
|
|
|
|
|
|
|
|
|
|
|
|
| 1500 Towerview Road |
|
|
|
Mar-13 |
|
Data Center |
|
|
328,765 |
|
|
|
— |
|
|
|
4,438 |
|
|
|
100.0 |
% |
|
|
100.0 |
% |
|
|
1.6 |
% |
|
|
0.5 |
% |
| 1125 Energy Park Drive |
|
|
|
Mar-05 |
|
Data Center |
|
|
112,827 |
|
|
|
— |
|
|
|
1,437 |
|
|
|
100.0 |
% |
|
|
100.0 |
% |
|
|
0.5 |
|
|
|
0.2 |
|
|
|
|
|
|
|
|
|
|
|
|
|
|
|
|
|
|
|
|
|
|
|
|
|
|
|
|
|
|
|
|
|
|
|
|
|
|
|
|
|
|
|
|
|
441,592 |
|
|
|
— |
|
|
|
5,875 |
|
|
|
100.0 |
% |
|
|
100.0 |
% |
|
|
2.1 |
% |
|
|
0.7 |
% |
| Miami |
|
|
|
|
|
|
|
|
|
|
|
|
|
|
|
|
|
|
|
|
|
|
|
|
|
|
|
|
|
|
|
|
|
|
| 36 NE 2nd Street |
|
|
|
Jan-02 |
|
Internet Gateway |
|
|
162,140 |
|
|
|
— |
|
|
|
5,149 |
|
|
|
99.1 |
% |
|
|
99.1 |
% |
|
|
0.8 |
% |
|
|
0.5 |
% |
| 2300 NW 89th Place |
|
|
|
Sep-06 |
|
Data Center |
|
|
64,174 |
|
|
|
— |
|
|
|
694 |
|
|
|
100.0 |
% |
|
|
100.0 |
% |
|
|
0.3 |
|
|
|
0.1 |
|
|
|
|
|
|
|
|
|
|
|
|
|
|
|
|
|
|
|
|
|
|
|
|
|
|
|
|
|
|
|
|
|
|
|
|
|
|
|
|
|
|
|
|
|
226,314 |
|
|
|
— |
|
|
|
5,843 |
|
|
|
99.3 |
% |
|
|
99.3 |
% |
|
|
1.1 |
% |
|
|
0.6 |
% |
| Sacramento |
|
|
|
|
|
|
|
|
|
|
|
|
|
|
|
|
|
|
|
|
|
|
|
|
|
|
|
|
|
|
|
|
|
|
| 11085 Sun Center Drive |
|
|
|
Sep-11 |
|
Data Center |
|
|
69,048 |
|
|
|
— |
|
|
|
2,878 |
|
|
|
100.0 |
% |
|
|
100.0 |
% |
|
|
0.3 |
% |
|
|
0.3 |
% |
| 3065 Gold Camp Drive |
|
|
|
Oct-04 |
|
Data Center |
|
|
40,394 |
|
|
|
23,397 |
|
|
|
1,914 |
|
|
|
100.0 |
% |
|
|
100.0 |
% |
|
|
0.2 |
|
|
|
0.2 |
|
|
|
|
|
|
|
|
|
|
|
|
|
|
|
|
|
|
|
|
|
|
|
|
|
|
|
|
|
|
|
|
|
|
|
|
|
|
|
|
|
|
|
|
|
109,442 |
|
|
|
23,397 |
|
|
|
4,792 |
|
|
|
100.0 |
% |
|
|
100.0 |
% |
|
|
0.5 |
% |
|
|
0.5 |
% |
| Charlotte |
|
|
|
|
|
|
|
|
|
|
|
|
|
|
|
|
|
|
|
|
|
|
|
|
|
|
|
|
|
|
|
|
|
|
| 125 North Myers |
|
|
|
Aug-05 |
|
Internet Gateway |
|
|
25,402 |
|
|
|
— |
|
|
|
1,400 |
|
|
|
100.0 |
% |
|
|
100.0 |
% |
|
|
0.1 |
% |
|
|
0.1 |
% |
| 731 East Trade Street |
|
|
|
Aug-05 |
|
Internet Gateway |
|
|
40,879 |
|
|
|
— |
|
|
|
1,351 |
|
|
|
100.0 |
% |
|
|
100.0 |
% |
|
|
0.2 |
|
|
|
0.1 |
|
| 113 North Myers |
|
|
|
Aug-05 |
|
Internet Gateway |
|
|
29,218 |
|
|
|
— |
|
|
|
948 |
|
|
|
100.0 |
% |
|
|
100.0 |
% |
|
|
0.1 |
|
|
|
0.1 |
|
|
|
|
|
|
|
|
|
|
|
|
|
|
|
|
|
|
|
|
|
|
|
|
|
|
|
|
|
|
|
|
|
|
|
|
|
|
|
|
|
|
|
|
|
95,499 |
|
|
|
— |
|
|
|
3,699 |
|
|
|
100.0 |
% |
|
|
100.0 |
% |
|
|
0.4 |
% |
|
|
0.3 |
% |
| Austin |
|
|
|
|
|
|
|
|
|
|
|
|
|
|
|
|
|
|
|
|
|
|
|
|
|
|
|
|
|
|
|
|
|
|
| 7401 E. Ben White Boulevard Building 7 |
|
|
|
May-13 |
|
Data Center |
|
|
203,235 |
|
|
|
— |
|
|
|
1,848 |
|
|
|
100.0 |
% |
|
|
100.0 |
% |
|
|
1.0 |
% |
|
|
0.2 |
% |
| 8025 North Interstate 35 |
|
|
|
May-12 |
|
Data Center |
|
|
62,237 |
|
|
|
— |
|
|
|
934 |
|
|
|
100.0 |
% |
|
|
100.0 |
% |
|
|
0.3 |
|
|
|
0.1 |
|
| 7620 Metro Center Drive |
|
|
|
Dec-05 |
|
Data Center |
|
|
45,000 |
|
|
|
— |
|
|
|
335 |
|
|
|
69.6 |
% |
|
|
69.6 |
% |
|
|
0.2 |
|
|
|
0.0 |
|
| 7500 Metro Center Drive |
|
|
|
Dec-05 |
|
Data Center |
|
|
30,000 |
|
|
|
44,962 |
|
|
|
— |
|
|
|
0.0 |
% |
|
|
0.0 |
% |
|
|
0.1 |
|
|
|
0.0 |
|
|
|
|
|
|
|
|
|
|
|
|
|
|
|
|
|
|
|
|
|
|
|
|
|
|
|
|
|
|
|
|
|
|
|
|
|
|
|
|
|
|
|
|
|
340,472 |
|
|
|
44,962 |
|
|
|
3,117 |
|
|
|
87.2 |
% |
|
|
95.6 |
% |
|
|
1.6 |
% |
|
|
0.3 |
% |
| Toronto, Canada |
|
|
|
|
|
|
|
|
|
|
|
|
|
|
|
|
|
|
|
|
|
|
|
|
|
|
|
|
|
|
|
|
|
|
| 6800 Millcreek Drive |
|
|
|
Apr-06 |
|
Data Center |
|
|
83,758 |
|
|
|
— |
|
|
|
2,084 |
|
|
|
100.0 |
% |
|
|
100.0 |
% |
|
|
0.4 |
% |
|
|
0.2 |
% |
| 371 Gough Road |
|
|
|
Mar-13 |
|
Data Center |
|
|
64,546 |
|
|
|
55,495 |
|
|
|
348 |
|
|
|
100.0 |
% |
|
|
100.0 |
% |
|
|
0.3 |
|
|
|
0.0 |
|
|
|
|
|
|
|
|
|
|
|
|
|
|
|
|
|
|
|
|
|
|
|
|
|
|
|
|
|
|
|
|
|
|
|
|
|
|
|
|
|
|
|
|
|
148,304 |
|
|
|
55,495 |
|
|
|
2,432 |
|
|
|
100.0 |
% |
|
|
100.0 |
% |
|
|
0.7 |
% |
|
|
0.2 |
% |
| EUROPE |
|
|
|
|
|
|
|
|
|
|
|
|
|
|
|
|
|
|
|
|
|
|
|
|
|
|
|
|
|
|
|
|
|
|
| London, England |
|
|
|
|
|
|
|
|
|
|
|
|
|
|
|
|
|
|
|
|
|
|
|
|
|
|
|
|
|
|
|
|
|
|
| Unit 21 Goldsworth Park Trading Estate |
|
|
|
Jul-12 |
|
Data Center |
|
|
369,717 |
|
|
|
110,283 |
|
|
|
55,377 |
|
|
|
96.6 |
% |
|
|
99.2 |
% |
|
|
1.8 |
% |
|
|
5.0 |
% |
| Watford |
|
(8) |
|
Jul-12 |
|
Data Center |
|
|
133,000 |
|
|
|
— |
|
|
|
19,426 |
|
|
|
97.3 |
% |
|
|
97.3 |
% |
|
|
0.6 |
|
|
|
1.7 |
|
| Croydon |
|
(9) |
|
Jul-12 |
|
Data Center |
|
|
120,000 |
|
|
|
— |
|
|
|
16,436 |
|
|
|
100.0 |
% |
|
|
100.0 |
% |
|
|
0.6 |
|
|
|
1.5 |
|
| 3 St. Anne’s Boulevard |
|
|
|
Dec-07 |
|
Data Center |
|
|
96,147 |
|
|
|
— |
|
|
|
13,762 |
|
|
|
84.2 |
% |
|
|
72.0 |
% |
|
|
0.5 |
|
|
|
1.2 |
|
| Mundells Roundabout |
|
|
|
Apr-07 |
|
Data Center |
|
|
113,464 |
|
|
|
— |
|
|
|
8,253 |
|
|
|
100.0 |
% |
|
|
100.0 |
% |
|
|
0.5 |
|
|
|
0.7 |
|
| Cressex 1 |
|
|
|
Dec-07 |
|
Data Center |
|
|
50,847 |
|
|
|
— |
|
|
|
7,629 |
|
|
|
100.0 |
% |
|
|
100.0 |
% |
|
|
0.2 |
|
|
|
0.7 |
|
| 6 Braham Street |
|
|
|
Jul-02 |
|
Internet Gateway |
|
|
63,233 |
|
|
|
— |
|
|
|
5,041 |
|
|
|
100.0 |
% |
|
|
100.0 |
% |
|
|
0.3 |
|
|
|
0.5 |
|
| 2 St. Anne’s Boulevard |
|
|
|
Dec-07 |
|
Data Center |
|
|
30,612 |
|
|
|
— |
|
|
|
3,547 |
|
|
|
100.0 |
% |
|
|
100.0 |
% |
|
|
0.1 |
|
|
|
0.3 |
|
| Fountain Court |
|
|
|
Jul-11 |
|
Data Center |
|
|
41,957 |
|
|
|
89,814 |
|
|
|
965 |
|
|
|
27.2 |
% |
|
|
27.2 |
% |
|
|
0.2 |
|
|
|
0.1 |
|
Page 22
DIGITAL REALTY TRUST, INC.
Third Quarter 2013
Occupancy Analysis
As of September 30, 2013
(Dollar amounts in
thousands)
|
|
|
|
|
|
|
|
|
|
|
|
|
|
|
|
|
|
|
|
|
|
|
|
|
|
|
|
|
|
|
|
|
| |
|
|
|
|
|
|
|
|
|
|
|
|
|
|
Occupancy (3) |
|
|
Net Rentable
Square Feet as a
% of |
|
|
Annualized Rent
as a % of |
|
| Property |
|
Acquisition
Date |
|
Property Type |
|
Net Rentable
Square Feet (1) |
|
|
Space Held for
Development |
|
|
Annualized Rent
($000) (2) |
|
|
As of
9/30/13 |
|
|
As of
6/30/13 |
|
|
Total
Portfolio |
|
|
Total
Portfolio |
|
| 1 St. Anne’s Boulevard |
|
Dec-07 |
|
Data Center |
|
|
20,219 |
|
|
|
— |
|
|
|
293 |
|
|
|
100.0 |
% |
|
|
100.0 |
% |
|
|
0.1 |
|
|
|
0.0 |
|
|
|
|
|
|
|
|
|
|
|
|
|
|
|
|
|
|
|
|
|
|
|
|
|
|
|
|
|
|
|
|
|
|
|
|
|
|
|
|
|
1,039,196 |
|
|
|
200,097 |
|
|
|
130,729 |
|
|
|
94.0 |
% |
|
|
93.8 |
% |
|
|
4.9 |
% |
|
|
11.7 |
% |
| Paris, France |
|
|
|
|
|
|
|
|
|
|
|
|
|
|
|
|
|
|
|
|
|
|
|
|
|
|
|
|
|
|
|
|
| 114 Rue Ambroise Croizat |
|
Dec-06 |
|
Internet Gateway |
|
|
324,796 |
|
|
|
27,350 |
|
|
|
21,407 |
|
|
|
96.9 |
% |
|
|
93.5 |
% |
|
|
1.5 |
% |
|
|
1.9 |
% |
| 1 Rue Jean-Pierre |
|
Dec-12 |
|
Data Center |
|
|
104,666 |
|
|
|
— |
|
|
|
4,734 |
|
|
|
100.0 |
% |
|
|
100.0 |
% |
|
|
0.5 |
|
|
|
0.4 |
|
| 127 Rue de Paris |
|
Dec-12 |
|
Data Center |
|
|
59,991 |
|
|
|
— |
|
|
|
2,029 |
|
|
|
100.0 |
% |
|
|
100.0 |
% |
|
|
0.3 |
|
|
|
0.2 |
|
| Liet-dit ie Christ de Saclay |
|
Dec-12 |
|
Data Center |
|
|
21,337 |
|
|
|
— |
|
|
|
676 |
|
|
|
100.0 |
% |
|
|
100.0 |
% |
|
|
0.1 |
|
|
|
0.1 |
|
|
|
|
|
|
|
|
|
|
|
|
|
|
|
|
|
|
|
|
|
|
|
|
|
|
|
|
|
|
|
|
|
|
|
|
|
|
|
|
|
510,790 |
|
|
|
27,350 |
|
|
|
28,846 |
|
|
|
98.0 |
% |
|
|
95.8 |
% |
|
|
2.4 |
% |
|
|
2.6 |
% |
| Dublin, Ireland |
|
|
|
|
|
|
|
|
|
|
|
|
|
|
|
|
|
|
|
|
|
|
|
|
|
|
|
|
|
|
|
|
| Unit 9 Blanchardstown Corporate Center |
|
Dec-06 |
|
Data Center |
|
|
120,000 |
|
|
|
— |
|
|
|
10,678 |
|
|
|
97.1 |
% |
|
|
97.1 |
% |
|
|
0.6 |
% |
|
|
1.0 |
% |
| Clonshaugh Industrial Estate (Eircom) |
|
Aug-05 |
|
Data Center |
|
|
124,500 |
|
|
|
— |
|
|
|
9,088 |
|
|
|
100.0 |
% |
|
|
100.0 |
% |
|
|
0.6 |
|
|
|
0.8 |
|
| Clonshaugh Industrial Estate IE |
|
Feb-06 |
|
Data Center |
|
|
20,000 |
|
|
|
— |
|
|
|
1,597 |
|
|
|
100.0 |
% |
|
|
100.0 |
% |
|
|
0.1 |
|
|
|
0.1 |
|
|
|
|
|
|
|
|
|
|
|
|
|
|
|
|
|
|
|
|
|
|
|
|
|
|
|
|
|
|
|
|
|
|
|
|
|
|
|
|
|
264,500 |
|
|
|
— |
|
|
|
21,363 |
|
|
|
98.7 |
% |
|
|
98.7 |
% |
|
|
1.3 |
% |
|
|
1.9 |
% |
| Amsterdam, Netherlands |
|
|
|
|
|
|
|
|
|
|
|
|
|
|
|
|
|
|
|
|
|
|
|
|
|
|
|
|
|
|
|
|
| Paul van Vlissingenstraat 16 |
|
Aug-05 |
|
Data Center |
|
|
112,472 |
|
|
|
— |
|
|
|
7,586 |
|
|
|
100.0 |
% |
|
|
100.0 |
% |
|
|
0.5 |
% |
|
|
0.7 |
% |
| Cateringweg 5 |
|
Jun-10 |
|
Data Center |
|
|
55,972 |
|
|
|
— |
|
|
|
5,662 |
|
|
|
100.0 |
% |
|
|
100.0 |
% |
|
|
0.3 |
|
|
|
0.5 |
|
| Naritaweg 52 |
|
Dec-07 |
|
Data Center |
|
|
63,260 |
|
|
|
— |
|
|
|
2,719 |
|
|
|
100.0 |
% |
|
|
100.0 |
% |
|
|
0.3 |
|
|
|
0.2 |
|
| Gyroscoopweg 2E-2F |
|
Jul-06 |
|
Data Center |
|
|
55,585 |
|
|
|
— |
|
|
|
1,282 |
|
|
|
100.0 |
% |
|
|
100.0 |
% |
|
|
0.3 |
|
|
|
0.1 |
|
| Liverpoolweg 10—The Netherlands |
|
Jun-13 |
|
Data Center |
|
|
16,813 |
|
|
|
— |
|
|
|
840 |
|
|
|
100.0 |
% |
|
|
100.0 |
% |
|
|
0.1 |
|
|
|
0.1 |
|
|
|
|
|
|
|
|
|
|
|
|
|
|
|
|
|
|
|
|
|
|
|
|
|
|
|
|
|
|
|
|
|
|
|
|
|
|
|
|
|
304,102 |
|
|
|
— |
|
|
|
18,089 |
|
|
|
100.0 |
% |
|
|
100.0 |
% |
|
|
1.5 |
% |
|
|
1.6 |
% |
| Manchester, England |
|
|
|
|
|
|
|
|
|
|
|
|
|
|
|
|
|
|
|
|
|
|
|
|
|
|
|
|
|
|
|
|
| Manchester Technopark |
|
Jun-08 |
|
Data Center |
|
|
38,016 |
|
|
|
— |
|
|
|
1,943 |
|
|
|
100.0 |
% |
|
|
100.0 |
% |
|
|
0.2 |
% |
|
|
0.2 |
% |
|
|
|
|
|
|
|
|
|
|
|
|
|
|
|
|
|
|
|
|
|
|
|
|
|
|
|
|
|
|
|
|
|
|
|
|
|
|
|
|
38,016 |
|
|
|
— |
|
|
|
1,943 |
|
|
|
100.0 |
% |
|
|
100.0 |
% |
|
|
0.2 |
% |
|
|
0.2 |
% |
| Geneva, Switzerland |
|
|
|
|
|
|
|
|
|
|
|
|
|
|
|
|
|
|
|
|
|
|
|
|
|
|
|
|
|
|
|
|
| Chemin de l Epinglier 2 |
|
Nov-05 |
|
Data Center |
|
|
59,190 |
|
|
|
— |
|
|
|
1,765 |
|
|
|
100.0 |
% |
|
|
100.0 |
% |
|
|
0.3 |
% |
|
|
0.2 |
% |
|
|
|
|
|
|
|
|
|
|
|
|
|
|
|
|
|
|
|
|
|
|
|
|
|
|
|
|
|
|
|
|
|
|
|
|
|
|
|
|
59,190 |
|
|
|
— |
|
|
|
1,765 |
|
|
|
100.0 |
% |
|
|
100.0 |
% |
|
|
0.3 |
% |
|
|
0.2 |
% |
| ASIA PACIFIC |
|
|
|
|
|
|
|
|
|
|
|
|
|
|
|
|
|
|
|
|
|
|
|
|
|
|
|
|
|
|
|
|
| Singapore |
|
|
|
|
|
|
|
|
|
|
|
|
|
|
|
|
|
|
|
|
|
|
|
|
|
|
|
|
|
|
|
|
| 29A International Business Park |
|
Nov-10 |
|
Data Center |
|
|
306,172 |
|
|
|
64,328 |
|
|
|
11,880 |
|
|
|
82.7 |
% |
|
|
84.7 |
% |
|
|
1.5 |
% |
|
|
1.1 |
% |
|
|
|
|
|
|
|
|
|
|
|
|
|
|
|
|
|
|
|
|
|
|
|
|
|
|
|
|
|
|
|
|
|
|
|
|
|
|
|
|
306,172 |
|
|
|
64,328 |
|
|
|
11,880 |
|
|
|
82.7 |
% |
|
|
84.7 |
% |
|
|
1.5 |
% |
|
|
1.1 |
% |
| Melbourne |
|
|
|
|
|
|
|
|
|
|
|
|
|
|
|
|
|
|
|
|
|
|
|
|
|
|
|
|
|
|
|
|
| 98 Radnor Drive |
|
Jun-11 |
|
Data Center |
|
|
52,988 |
|
|
|
— |
|
|
|
7,133 |
|
|
|
100.0 |
% |
|
|
100.0 |
% |
|
|
0.3 |
% |
|
|
0.6 |
% |
|
|
|
|
|
|
|
|
|
|
|
|
|
|
|
|
|
|
|
|
|
|
|
|
|
|
|
|
|
|
|
|
|
|
|
|
|
|
|
|
52,988 |
|
|
|
— |
|
|
|
7,133 |
|
|
|
100.0 |
% |
|
|
100.0 |
% |
|
|
0.3 |
% |
|
|
0.6 |
% |
| Sydney |
|
|
|
|
|
|
|
|
|
|
|
|
|
|
|
|
|
|
|
|
|
|
|
|
|
|
|
|
|
|
|
|
| 1-23 Templar Road |
|
Feb-11 |
|
Data Center |
|
|
41,202 |
|
|
|
45,015 |
|
|
|
3,668 |
|
|
|
43.0 |
% |
|
|
43.0 |
% |
|
|
0.2 |
% |
|
|
0.2 |
% |
| 23 Waterloo Road |
|
Nov-12 |
|
Data Center |
|
|
51,990 |
|
|
|
— |
|
|
|
1,289 |
|
|
|
100.0 |
% |
|
|
100.0 |
% |
|
|
0.2 |
|
|
|
0.1 |
|
|
|
|
|
|
|
|
|
|
|
|
|
|
|
|
|
|
|
|
|
|
|
|
|
|
|
|
|
|
|
|
|
|
|
|
|
|
|
|
|
93,192 |
|
|
|
45,015 |
|
|
|
4,957 |
|
|
|
74.8 |
% |
|
|
74.8 |
% |
|
|
0.4 |
% |
|
|
0.3 |
% |
| NON-DATACENTER PROPERTIES |
|
|
|
|
|
|
|
|
|
|
|
|
|
|
|
|
|
|
|
|
|
|
|
|
|
|
|
|
|
|
|
|
| 34551 Ardenwood Boulevard |
|
Jan-03 |
|
Technology Manufacturing |
|
|
307,657 |
|
|
|
— |
|
|
|
4,087 |
|
|
|
41.6 |
% |
|
|
41.6 |
% |
|
|
1.5 |
% |
|
|
0.4 |
% |
| 2010 East Centennial Circle |
|
May-03 |
|
Technology Manufacturing |
|
|
113,405 |
|
|
|
— |
|
|
|
3,194 |
|
|
|
100.0 |
% |
|
|
100.0 |
% |
|
|
0.5 |
|
|
|
0.3 |
|
| 1 Savvis Parkway |
|
Aug-07 |
|
Technology Office |
|
|
156,000 |
|
|
|
— |
|
|
|
3,042 |
|
|
|
100.0 |
% |
|
|
100.0 |
% |
|
|
0.7 |
|
|
|
0.3 |
|
| 8201 E. Riverside Drive Building 4 |
|
May-13 |
|
Technology Manufacturing |
|
|
133,460 |
|
|
|
— |
|
|
|
956 |
|
|
|
74.4 |
% |
|
|
74.4 |
% |
|
|
0.6 |
|
|
|
0.1 |
|
| 908 Quality Way |
|
Sep-09 |
|
Technology Office |
|
|
14,400 |
|
|
|
— |
|
|
|
— |
|
|
|
86.1 |
% |
|
|
100.0 |
% |
|
|
0.1 |
|
|
|
0.0 |
|
| 47700 Kato Road & 1055 Page Avenue |
|
Sep-03 |
|
Technology Manufacturing |
|
|
199,352 |
|
|
|
— |
|
|
|
— |
|
|
|
0.0 |
% |
|
|
0.0 |
% |
|
|
0.9 |
|
|
|
0.0 |
|
|
|
|
|
|
|
|
|
|
|
|
|
|
|
|
|
|
|
|
|
|
|
|
|
|
|
|
|
|
|
|
|
|
|
|
|
|
|
|
|
924,274 |
|
|
|
— |
|
|
|
11,279 |
|
|
|
55.1 |
% |
|
|
55.3 |
% |
|
|
4.3 |
% |
|
|
1.1 |
% |
|
|
|
|
|
|
|
|
|
|
|
|
|
|
|
|
|
|
|
|
|
|
|
|
|
|
|
|
|
|
|
|
|
| Consolidated Portfolio Total/Weighted Average |
|
|
|
|
|
|
19,521,556 |
|
|
|
2,817,984 |
|
|
|
1,050,707 |
|
|
|
92.6 |
% |
|
|
92.7 |
% |
|
|
|
|
|
|
|
|
|
|
|
|
|
|
|
|
|
|
|
|
|
|
|
|
|
|
|
|
|
|
|
|
|
|
|
|
|
|
|
|
|
Page 23
DIGITAL REALTY TRUST, INC.
Third Quarter 2013
Occupancy Analysis
As of September 30, 2013
(Dollar amounts in
thousands)
|
|
|
|
|
|
|
|
|
|
|
|
|
|
|
|
|
|
|
|
|
|
|
|
|
|
|
|
|
|
|
|
|
|
|
|
|
|
|
| |
|
|
|
|
|
|
|
|
|
|
|
|
|
|
|
|
|
|
Occupancy (3) |
|
|
Net Rentable
Square Feet as a
% of |
|
|
Annualized Rent
as a % of |
|
| Property |
|
|
|
Acquisition
Date |
|
|
Property Type |
|
|
Net Rentable
Square Feet (1) |
|
|
Space Held for
Development |
|
|
Annualized Rent
($000) (2) |
|
|
As of
9/30/13 |
|
|
As of
6/30/13 |
|
|
Total
Portfolio |
|
|
Total
Portfolio |
|
| UNCONSOLIDATED JOINT VENTURES: MANAGED |
|
|
|
|
|
|
|
|
|
|
|
|
|
|
|
|
|
|
|
|
|
|
|
|
|
|
|
|
|
|
|
|
|
|
|
|
|
|
| Silicon Valley |
|
|
|
|
|
|
|
|
|
|
|
|
|
|
|
|
|
|
|
|
|
|
|
|
|
|
|
|
|
|
|
|
|
|
|
|
|
|
| 4650 Old Ironsides Drive |
|
|
|
|
Jun-05 |
|
|
|
Data Center |
|
|
|
124,383 |
|
|
|
— |
|
|
|
4,062 |
|
|
|
100.0 |
% |
|
|
100.0 |
% |
|
|
0.6 |
% |
|
|
0.4 |
% |
| 2950 Zanker Road |
|
|
|
|
Aug-10 |
|
|
|
Data Center |
|
|
|
69,700 |
|
|
|
— |
|
|
|
3,059 |
|
|
|
100.0 |
% |
|
|
100.0 |
% |
|
|
0.3 |
|
|
|
0.3 |
|
| 4700 Old Ironsides Drive |
|
|
|
|
Jun-05 |
|
|
|
Data Center |
|
|
|
90,139 |
|
|
|
— |
|
|
|
2,058 |
|
|
|
100.0 |
% |
|
|
100.0 |
% |
|
|
0.4 |
|
|
|
0.2 |
|
| 444 Toyama Drive |
|
|
|
|
Sep-09 |
|
|
|
Data Center |
|
|
|
42,083 |
|
|
|
— |
|
|
|
1,942 |
|
|
|
100.0 |
% |
|
|
100.0 |
% |
|
|
0.2 |
|
|
|
0.2 |
|
|
|
|
|
|
|
|
|
|
|
|
|
|
|
|
|
|
|
|
|
|
|
|
|
|
|
|
|
|
|
|
|
|
|
|
|
|
|
|
|
|
|
|
|
|
|
|
|
|
|
|
|
326,305 |
|
|
|
— |
|
|
|
11,121 |
|
|
|
100.0 |
% |
|
|
100.0 |
% |
|
|
1.5 |
% |
|
|
1.1 |
% |
| Northern Virginia |
|
|
|
|
|
|
|
|
|
|
|
|
|
|
|
|
|
|
|
|
|
|
|
|
|
|
|
|
|
|
|
|
|
|
|
|
|
|
| 43790 Devin Shafron Drive—E |
|
|
|
|
May-09 |
|
|
|
Data Center |
|
|
|
152,138 |
|
|
|
— |
|
|
|
3,228 |
|
|
|
100.0 |
% |
|
|
100.0 |
% |
|
|
0.7 |
% |
|
|
0.3 |
% |
| 21551 Beaumeade Circle |
|
|
|
|
Dec-09 |
|
|
|
Data Center |
|
|
|
152,504 |
|
|
|
— |
|
|
|
2,088 |
|
|
|
100.0 |
% |
|
|
100.0 |
% |
|
|
0.7 |
|
|
|
0.2 |
|
| 7505 Mason King Court |
|
|
|
|
Nov-08 |
|
|
|
Data Center |
|
|
|
109,650 |
|
|
|
— |
|
|
|
1,865 |
|
|
|
100.0 |
% |
|
|
100.0 |
% |
|
|
0.5 |
|
|
|
0.2 |
|
|
|
|
|
|
|
|
|
|
|
|
|
|
|
|
|
|
|
|
|
|
|
|
|
|
|
|
|
|
|
|
|
|
|
|
|
|
|
|
|
|
|
|
|
|
|
|
|
|
|
|
|
414,292 |
|
|
|
— |
|
|
|
7,181 |
|
|
|
100.0 |
% |
|
|
100.0 |
% |
|
|
1.9 |
% |
|
|
0.7 |
% |
| Dallas |
|
|
|
|
|
|
|
|
|
|
|
|
|
|
|
|
|
|
|
|
|
|
|
|
|
|
|
|
|
|
|
|
|
|
|
|
|
|
| 14901 FAA Boulevard |
|
|
|
|
Jun-06 |
|
|
|
Data Center |
|
|
|
263,700 |
|
|
|
— |
|
|
|
5,188 |
|
|
|
100.0 |
% |
|
|
100.0 |
% |
|
|
1.3 |
% |
|
|
0.5 |
% |
| 900 Dorothy Drive |
|
|
|
|
Aug-10 |
|
|
|
Data Center |
|
|
|
56,176 |
|
|
|
— |
|
|
|
1,612 |
|
|
|
100.0 |
% |
|
|
100.0 |
% |
|
|
0.3 |
|
|
|
0.1 |
|
|
|
|
|
|
|
|
|
|
|
|
|
|
|
|
|
|
|
|
|
|
|
|
|
|
|
|
|
|
|
|
|
|
|
|
|
|
|
|
|
|
|
|
|
|
|
|
|
|
|
|
|
319,876 |
|
|
|
— |
|
|
|
6,800 |
|
|
|
100.0 |
% |
|
|
100.0 |
% |
|
|
1.6 |
% |
|
|
0.6 |
% |
| Hong Kong |
|
|
|
|
|
|
|
|
|
|
|
|
|
|
|
|
|
|
|
|
|
|
|
|
|
|
|
|
|
|
|
|
|
|
|
|
|
|
| 33 Chun Choi Street |
|
|
|
|
Oct-12 |
|
|
|
Data Center |
|
|
|
— |
|
|
|
— |
|
|
|
— |
|
|
|
N/A |
|
|
|
N/A |
|
|
|
|
|
|
|
|
|
|
|
|
|
|
|
|
|
|
|
|
|
|
|
|
|
|
|
|
|
|
|
|
|
|
|
|
|
|
|
|
|
|
|
|
|
|
|
|
|
|
|
|
|
|
|
|
|
|
|
|
|
— |
|
|
|
— |
|
|
|
— |
|
|
|
N/A |
|
|
|
N/A |
|
|
|
|
|
|
|
|
|
| Unconsolidated Managed Portfolio Total/Weighted Average |
|
|
|
|
|
|
|
|
|
|
|
|
1,060,473 |
|
|
|
— |
|
|
|
25,102 |
|
|
|
100.0 |
% |
|
|
100.0 |
% |
|
|
|
|
|
|
|
|
|
|
|
|
|
|
|
|
|
|
|
|
|
|
|
|
|
|
|
|
|
|
|
|
|
|
|
|
|
|
|
|
|
|
|
|
|
|
|
| Managed Portfolio Total/Weighted Average |
|
|
|
|
|
|
|
|
|
|
|
|
20,582,029 |
|
|
|
2,817,984 |
|
|
|
1,075,809 |
|
|
|
93.0 |
% |
|
|
93.1 |
% |
|
|
|
|
|
|
|
|
|
|
|
|
|
|
|
|
|
|
|
|
|
|
|
|
|
|
|
|
|
|
|
|
|
|
|
|
|
|
|
|
|
|
|
|
|
|
|
| Digital Realty Share Total/Weighted Average |
|
(10) |
|
|
|
|
|
|
|
|
|
|
19,733,651 |
|
|
|
2,817,984 |
|
|
|
1,055,728 |
|
|
|
92.7 |
% |
|
|
93.1 |
% |
|
|
|
|
|
|
|
|
|
|
|
|
|
|
|
|
|
|
|
|
|
|
|
|
|
|
|
|
|
|
|
|
|
|
|
|
|
|
|
|
|
|
|
|
|
|
|
| UNCONSOLIDATED JOINT VENTURES: NON-MANAGED |
|
|
|
|
|
|
|
|
|
|
|
|
|
|
|
|
|
|
|
|
|
|
|
|
|
|
|
|
|
|
|
|
|
|
|
|
|
|
| Seattle |
|
|
|
|
|
|
|
|
|
|
|
|
|
|
|
|
|
|
|
|
|
|
|
|
|
|
|
|
|
|
|
|
|
|
|
|
|
|
| 2001 Sixth Avenue |
|
|
|
|
Nov-06 |
|
|
|
Data Center |
|
|
|
400,369 |
|
|
|
— |
|
|
|
31,367 |
|
|
|
95.0 |
% |
|
|
91.3 |
% |
|
|
|
|
|
|
|
|
| 2020 Fifth Avenue |
|
|
|
|
Oct-11 |
|
|
|
Data Center |
|
|
|
51,000 |
|
|
|
— |
|
|
|
3,120 |
|
|
|
100.0 |
% |
|
|
100.0 |
% |
|
|
|
|
|
|
|
|
|
|
|
|
|
|
|
|
|
|
|
|
|
|
|
|
|
|
|
|
|
|
|
|
|
|
|
|
|
|
|
|
|
|
|
|
|
|
|
|
|
|
|
|
|
|
|
|
|
|
|
|
451,369 |
|
|
|
— |
|
|
|
34,487 |
|
|
|
95.6 |
% |
|
|
92.3 |
% |
|
|
|
|
|
|
|
|
| Unconsolidated Non-Managed Portfolio Total/Weighted Average |
|
|
|
|
|
|
|
|
|
|
|
|
451,369 |
|
|
|
— |
|
|
|
34,487 |
|
|
|
|
|
|
|
|
|
|
|
|
|
|
|
|
|
|
|
|
|
|
|
|
|
|
|
|
|
|
|
|
|
|
|
|
|
|
|
|
|
|
|
|
|
|
|
|
|
|
|
|
|
|
|
|
| Portfolio Total/Weighted Average |
|
|
|
|
|
|
|
|
|
|
|
|
21,033,398 |
|
|
|
2,817,984 |
|
|
|
1,110,296 |
|
|
|
93.0 |
% |
|
|
93.1 |
% |
|
|
|
|
|
|
|
|
|
|
|
|
|
|
|
|
|
|
|
|
|
|
|
|
|
|
|
|
|
|
|
|
|
|
|
|
|
|
|
|
|
|
|
|
|
|
|
| (1) |
We estimate the total net rentable square feet available for lease based on a number of factors in addition to contractually leased square feet, including available power, required support space and common area.
|
| (2) |
Annualized base rent represents the monthly contractual base rent (defined as cash base rent before abatements) under existing leases as of September 30, 2013 multiplied by 12. |
| (3) |
Occupancy excludes space held for development. For some of our properties, we calculate occupancy based on factors in addition to contractually leased square feet, including available power, required support space and
common area. |
| (4) |
Building formerly referred to as 1215 Datacenter Park. |
| (5) |
Includes approximately 33,700 rentable square feet from a leasehold interest acquisition. |
| (6) |
Includes approximately 27,943 rentable square feet from a leasehold interest acquisition. |
| (7) |
Building formerly referred to as 800 Central Expressway. |
| (8) |
Building formerly referred to as The Chess Building. |
| (9) |
Building formerly referred to as Unit B Prologis Park. |
| (10) |
Represents consolidated portfolio plus our managed portfolio of unconsolidated joint ventures based on our ownership percentage. |
Page 24
DIGITAL REALTY TRUST, INC.
Third Quarter 2013
Top 20 Tenants by Annualized Rent
As of September 30, 2013
(Dollar amounts in
thousands)
|
|
|
|
|
|
|
|
|
|
|
|
|
|
|
|
|
|
|
|
|
|
|
|
|
|
|
| Tenant |
|
|
|
Number of
Locations |
|
|
Total Occupied
Square Feet (1)(5) |
|
|
Percentage of
Net Rentable
Square Feet |
|
|
Annualized
Rent (2)(5) |
|
|
Percentage of
Annualized Rent |
|
|
Weighted
Average
Remaining
Lease Term
in Months |
|
| 1 CenturyLink, Inc. |
|
(3) |
|
|
37 |
|
|
|
2,412,287 |
|
|
|
11.8 |
% |
|
$ |
83,954 |
|
|
|
8.1 |
% |
|
|
78 |
|
| 2 IBM |
|
(4) |
|
|
11 |
|
|
|
449,931 |
|
|
|
2.2 |
% |
|
$ |
51,035 |
|
|
|
4.9 |
% |
|
|
100 |
|
| 3 TelX Group, Inc. |
|
|
|
|
12 |
|
|
|
331,002 |
|
|
|
1.6 |
% |
|
$ |
45,573 |
|
|
|
4.4 |
% |
|
|
172 |
|
| 4 Equinix Operating Company, Inc. |
|
|
|
|
10 |
|
|
|
731,682 |
|
|
|
3.6 |
% |
|
$ |
33,799 |
|
|
|
3.2 |
% |
|
|
148 |
|
| 5 Morgan Stanley |
|
|
|
|
5 |
|
|
|
182,242 |
|
|
|
0.9 |
% |
|
$ |
28,224 |
|
|
|
2.7 |
% |
|
|
35 |
|
| 6 Facebook, Inc. |
|
|
|
|
3 |
|
|
|
206,283 |
|
|
|
1.0 |
% |
|
$ |
27,626 |
|
|
|
2.6 |
% |
|
|
67 |
|
| 7 AT & T |
|
|
|
|
17 |
|
|
|
615,501 |
|
|
|
3.0 |
% |
|
$ |
25,644 |
|
|
|
2.5 |
% |
|
|
64 |
|
| 8 Deutsche Bank AG |
|
|
|
|
3 |
|
|
|
113,461 |
|
|
|
0.6 |
% |
|
$ |
22,383 |
|
|
|
2.1 |
% |
|
|
58 |
|
| 9 Verizon Communications, Inc. |
|
|
|
|
31 |
|
|
|
320,703 |
|
|
|
1.6 |
% |
|
$ |
20,197 |
|
|
|
1.9 |
% |
|
|
58 |
|
| 10 NTT Communications Company |
|
|
|
|
6 |
|
|
|
321,061 |
|
|
|
1.6 |
% |
|
$ |
19,470 |
|
|
|
1.9 |
% |
|
|
70 |
|
| 11 SunGard Availability Services LP |
|
|
|
|
7 |
|
|
|
343,370 |
|
|
|
1.7 |
% |
|
$ |
19,110 |
|
|
|
1.8 |
% |
|
|
75 |
|
| 12 JPMorgan Chase & Co. |
|
|
|
|
6 |
|
|
|
195,890 |
|
|
|
1.0 |
% |
|
$ |
16,707 |
|
|
|
1.6 |
% |
|
|
83 |
|
| 13 Level 3 Communications, LLC |
|
|
|
|
40 |
|
|
|
375,887 |
|
|
|
1.8 |
% |
|
$ |
15,729 |
|
|
|
1.5 |
% |
|
|
86 |
|
| 14 Nomura International PLC |
|
|
|
|
2 |
|
|
|
63,137 |
|
|
|
0.3 |
% |
|
$ |
12,645 |
|
|
|
1.2 |
% |
|
|
76 |
|
| 15 TATA Communications (UK) |
|
|
|
|
3 |
|
|
|
116,773 |
|
|
|
0.6 |
% |
|
$ |
12,015 |
|
|
|
1.2 |
% |
|
|
51 |
|
| 16 Pfizer, Inc. |
|
|
|
|
1 |
|
|
|
97,069 |
|
|
|
0.5 |
% |
|
$ |
11,214 |
|
|
|
1.1 |
% |
|
|
51 |
|
| 17 Amazon |
|
|
|
|
8 |
|
|
|
281,118 |
|
|
|
1.4 |
% |
|
$ |
11,013 |
|
|
|
1.1 |
% |
|
|
56 |
|
| 18 Yahoo! Inc. |
|
|
|
|
2 |
|
|
|
110,847 |
|
|
|
0.5 |
% |
|
$ |
10,988 |
|
|
|
1.1 |
% |
|
|
49 |
|
| 19 BT Americas, Inc. |
|
|
|
|
3 |
|
|
|
67,685 |
|
|
|
0.3 |
% |
|
$ |
10,028 |
|
|
|
1.0 |
% |
|
|
45 |
|
| 20 Sprint Communications Co., LP |
|
|
|
|
6 |
|
|
|
173,319 |
|
|
|
0.8 |
% |
|
$ |
9,995 |
|
|
|
1.0 |
% |
|
|
12 |
|
|
|
|
|
|
|
|
|
|
|
|
|
|
|
|
|
|
|
|
|
|
|
|
|
|
|
|
| Total/Weighted Average |
|
|
|
|
|
|
|
|
7,509,248 |
|
|
|
36.8 |
% |
|
$ |
487,349 |
|
|
|
46.9 |
% |
|
|
83 |
|
|
|
|
|
|
|
|
|
|
|
|
|
|
|
|
|
|
|
|
|
|
|
|
|
|
|
|
| (1) |
Occupied square footage is defined as leases that commenced on or before September 30, 2013. For some of our properties, we calculate occupancy based on factors in addition to contractually leased square feet,
including available power, required support space and common area. |
| (2) |
Annualized base rent represents the monthly contractual base rent (defined as cash base rent before abatements) under existing leases as of September 30, 2013 multiplied by 12. |
| (3) |
Represents leases with Savvis Communications Corporation and Qwest Communications International Inc. (or affiliates thereof), which are our direct tenants. CenturyLink, Inc. acquired Qwest in Q2 2011 and Savvis in Q3
2011, and Qwest and Savvis are now wholly owned subsidiaries of CenturyLink. |
| (4) |
Represents leases with IBM and leases with Softlayer. IBM acquired Softlayer in July 2013. |
| (5) |
Represents consolidated portfolio plus our managed portfolio of unconsolidated joint ventures based on our ownership percentage. |
Page 25
DIGITAL REALTY TRUST, INC.
Third Quarter 2013
Lease Expirations and Lease Distribution
Lease Expirations
As of September 30, 2013
(Dollar amounts in thousands, except per square foot amounts)
|
|
|
|
|
|
|
|
|
|
|
|
|
|
|
|
|
|
|
|
|
|
|
|
|
|
|
|
|
|
|
|
|
| Year |
|
Number of
Leases
Expiring (1)(5) |
|
|
Square
Footage of
Expiring
Leases (2)(5) |
|
|
Percentage of
Net Rentable
Square Feet |
|
|
Annualized
Rent (3)(5) |
|
|
Percentage
of
Annualized
Rent |
|
|
Annualized
Rent Per
Occupied
Square
Foot |
|
|
Annualized
Rent Per
Occupied
Square
Foot at
Expiration |
|
|
Annualized
Rent at
Expiration |
|
| Available |
|
|
|
|
|
|
1,450,197 |
|
|
|
7.3 |
% |
|
|
|
|
|
|
0.0 |
% |
|
|
|
|
|
|
|
|
|
|
|
|
| Month to Month (4) |
|
|
101 |
|
|
|
51,537 |
|
|
|
0.3 |
% |
|
$ |
4,787 |
|
|
|
0.4 |
% |
|
$ |
92.89 |
|
|
$ |
103.08 |
|
|
$ |
5,312 |
|
| 2013 |
|
|
87 |
|
|
|
304,305 |
|
|
|
1.6 |
% |
|
|
14,687 |
|
|
|
1.4 |
% |
|
|
48.26 |
|
|
|
48.29 |
|
|
|
14,696 |
|
| 2014 |
|
|
328 |
|
|
|
1,359,010 |
|
|
|
6.9 |
% |
|
|
98,811 |
|
|
|
9.4 |
% |
|
|
72.71 |
|
|
|
74.19 |
|
|
|
100,822 |
|
| 2015 |
|
|
252 |
|
|
|
1,798,622 |
|
|
|
9.1 |
% |
|
|
84,660 |
|
|
|
8.0 |
% |
|
|
47.07 |
|
|
|
48.74 |
|
|
|
87,661 |
|
| 2016 |
|
|
271 |
|
|
|
1,994,235 |
|
|
|
10.1 |
% |
|
|
101,465 |
|
|
|
9.6 |
% |
|
|
50.88 |
|
|
|
53.97 |
|
|
|
107,625 |
|
| 2017 |
|
|
173 |
|
|
|
1,442,093 |
|
|
|
7.3 |
% |
|
|
73,565 |
|
|
|
7.0 |
% |
|
|
51.01 |
|
|
|
55.12 |
|
|
|
79,494 |
|
| 2018 |
|
|
177 |
|
|
|
1,279,081 |
|
|
|
6.5 |
% |
|
|
84,180 |
|
|
|
8.0 |
% |
|
|
65.81 |
|
|
|
75.67 |
|
|
|
96,788 |
|
| 2019 |
|
|
116 |
|
|
|
1,655,798 |
|
|
|
8.4 |
% |
|
|
128,464 |
|
|
|
12.2 |
% |
|
|
77.58 |
|
|
|
87.07 |
|
|
|
144,173 |
|
| 2020 |
|
|
116 |
|
|
|
1,146,146 |
|
|
|
5.8 |
% |
|
|
80,851 |
|
|
|
7.6 |
% |
|
|
70.54 |
|
|
|
87.63 |
|
|
|
100,442 |
|
| 2021 |
|
|
78 |
|
|
|
1,407,226 |
|
|
|
7.1 |
% |
|
|
74,356 |
|
|
|
7.0 |
% |
|
|
52.84 |
|
|
|
65.65 |
|
|
|
92,382 |
|
| 2022 |
|
|
87 |
|
|
|
1,210,389 |
|
|
|
6.1 |
% |
|
|
62,898 |
|
|
|
6.0 |
% |
|
|
51.97 |
|
|
|
62.62 |
|
|
|
75,795 |
|
| Thereafter |
|
|
317 |
|
|
|
4,635,011 |
|
|
|
23.5 |
% |
|
|
247,003 |
|
|
|
23.4 |
% |
|
|
53.29 |
|
|
|
74.05 |
|
|
|
343,238 |
|
|
|
|
|
|
|
|
|
|
|
|
|
|
|
|
|
|
|
|
|
|
|
|
|
|
|
|
|
|
|
|
|
|
| Portfolio Total / Weighted Average |
|
|
2,103 |
|
|
|
19,733,650 |
|
|
|
100.0 |
% |
|
$ |
1,055,728 |
|
|
|
100.0 |
% |
|
$ |
57.74 |
|
|
$ |
68.28 |
|
|
$ |
1,248,428 |
|
|
|
|
|
|
|
|
|
|
|
|
|
|
|
|
|
|
|
|
|
|
|
|
|
|
|
|
|
|
|
|
|
|
Lease Distribution
As of
September 30, 2013
(Dollar amounts in thousands)
|
|
|
|
|
|
|
|
|
|
|
|
|
|
|
|
|
|
|
|
|
|
|
|
|
| Square Feet Under Lease |
|
Number of
Leases (1)(5) |
|
|
Percentage
of All
Leases |
|
|
Total Net
Rentable
Square Feet (2)(5) |
|
|
Percentage
of Net
Rentable
Square
Feet (2) |
|
|
Annualized
Rent (3)(5) |
|
|
Percentage of
Annualized
Rent |
|
| Available |
|
|
|
|
|
|
|
|
|
|
1,450,197 |
|
|
|
7.3 |
% |
|
|
|
|
|
|
0.0 |
% |
| 2,500 or less |
|
|
1,319 |
|
|
|
62.7 |
% |
|
|
631,858 |
|
|
|
3.2 |
% |
|
$ |
60,563 |
|
|
|
5.7 |
% |
| 2,501 - 10,000 |
|
|
352 |
|
|
|
16.7 |
% |
|
|
2,098,738 |
|
|
|
10.6 |
% |
|
|
185,381 |
|
|
|
17.6 |
% |
| 10,001 - 20,000 |
|
|
208 |
|
|
|
9.9 |
% |
|
|
3,108,921 |
|
|
|
15.8 |
% |
|
|
272,618 |
|
|
|
25.8 |
% |
| 20,001 - 40,000 |
|
|
116 |
|
|
|
5.5 |
% |
|
|
3,411,751 |
|
|
|
17.3 |
% |
|
|
235,656 |
|
|
|
22.3 |
% |
| 40,001 - 100,000 |
|
|
75 |
|
|
|
3.6 |
% |
|
|
4,665,259 |
|
|
|
23.6 |
% |
|
|
188,375 |
|
|
|
17.9 |
% |
| Greater than 100,000 |
|
|
33 |
|
|
|
1.6 |
% |
|
|
4,366,926 |
|
|
|
22.2 |
% |
|
|
113,135 |
|
|
|
10.7 |
% |
|
|
|
|
|
|
|
|
|
|
|
|
|
|
|
|
|
|
|
|
|
|
|
|
|
| Portfolio Total |
|
|
2,103 |
|
|
|
100.0 |
% |
|
|
19,733,650 |
|
|
|
100.0 |
% |
|
$ |
1,055,728 |
|
|
|
100.0 |
% |
|
|
|
|
|
|
|
|
|
|
|
|
|
|
|
|
|
|
|
|
|
|
|
|
|
| (1) |
Number of leases represents the leased-unit count; a lease could include multiple units. |
| (2) |
For some of our properties, we calculate square footage based on factors in addition to contractually leased square feet, including available power, required support space and common area. We estimate the total net
rentable square feet available for lease based on a number of factors in addition to contractually leased square feet, including available power, required support space and common area. |
| (3) |
Annualized rent represents the monthly contractual base rent (defined as cash base rent before abatements) under existing leases as of September 30, 2013 multiplied by 12. |
| (4) |
Includes leases, licenses and similar agreements that upon expiration have been automatically renewed on a month-to-month basis. |
| (5) |
Represents consolidated portfolio plus our managed portfolio of unconsolidated joint ventures based on our ownership percentage. |
Page 26
DIGITAL REALTY TRUST, INC.
Third Quarter 2013
Lease Expirations—By Product Type
As of September 30, 2013
(Dollar amounts in
thousands, except per square foot amounts)
TURN-KEY FLEX
|
|
|
|
|
|
|
|
|
|
|
|
|
|
|
|
|
|
|
|
|
|
|
|
|
|
|
|
|
|
|
|
|
| Year |
|
Number of
Leases Expiring (1)(5) |
|
|
Square
Footage of
Expiring
Leases (2)(5) |
|
|
Percentage
of Net
Rentable
Square
Feet |
|
|
Annualized
Rent (3)(5) |
|
|
Percentage of
Annualized
Rent |
|
|
Annualized
Rent Per
Occupied
Square
Foot |
|
|
Annualized
Rent Per
Occupied
Square
Foot at
Expiration |
|
|
Annualized
Rent at
Expiration |
|
| Available |
|
|
|
|
|
|
421,251 |
|
|
|
2.1 |
% |
|
|
|
|
|
|
0.0 |
% |
|
|
|
|
|
|
|
|
|
|
|
|
| Month to Month (4) |
|
|
42 |
|
|
|
5,894 |
|
|
|
0.0 |
% |
|
$ |
1,819 |
|
|
|
0.2 |
% |
|
$ |
308.62 |
|
|
$ |
308.62 |
|
|
$ |
1,819 |
|
| 2013 |
|
|
26 |
|
|
|
41,929 |
|
|
|
0.2 |
% |
|
|
5,155 |
|
|
|
0.5 |
% |
|
|
122.95 |
|
|
|
122.95 |
|
|
|
5,155 |
|
| 2014 |
|
|
126 |
|
|
|
340,207 |
|
|
|
1.7 |
% |
|
|
55,310 |
|
|
|
5.2 |
% |
|
|
162.58 |
|
|
|
166.34 |
|
|
|
56,590 |
|
| 2015 |
|
|
83 |
|
|
|
218,248 |
|
|
|
1.1 |
% |
|
|
24,768 |
|
|
|
2.3 |
% |
|
|
113.49 |
|
|
|
115.77 |
|
|
|
25,266 |
|
| 2016 |
|
|
123 |
|
|
|
385,062 |
|
|
|
1.9 |
% |
|
|
58,763 |
|
|
|
5.6 |
% |
|
|
152.61 |
|
|
|
160.44 |
|
|
|
61,781 |
|
| 2017 |
|
|
77 |
|
|
|
405,143 |
|
|
|
2.0 |
% |
|
|
47,628 |
|
|
|
4.5 |
% |
|
|
117.56 |
|
|
|
128.60 |
|
|
|
52,101 |
|
| 2018 |
|
|
86 |
|
|
|
462,795 |
|
|
|
2.3 |
% |
|
|
57,503 |
|
|
|
5.4 |
% |
|
|
124.25 |
|
|
|
144.95 |
|
|
|
67,084 |
|
| 2019 |
|
|
44 |
|
|
|
534,822 |
|
|
|
2.7 |
% |
|
|
89,393 |
|
|
|
8.5 |
% |
|
|
167.15 |
|
|
|
186.43 |
|
|
|
99,708 |
|
| 2020 |
|
|
53 |
|
|
|
465,434 |
|
|
|
2.4 |
% |
|
|
58,916 |
|
|
|
5.6 |
% |
|
|
126.58 |
|
|
|
161.33 |
|
|
|
75,087 |
|
| 2021 |
|
|
41 |
|
|
|
328,740 |
|
|
|
1.7 |
% |
|
|
53,495 |
|
|
|
5.1 |
% |
|
|
162.73 |
|
|
|
205.25 |
|
|
|
67,473 |
|
| 2022 |
|
|
43 |
|
|
|
287,824 |
|
|
|
1.5 |
% |
|
|
38,795 |
|
|
|
3.7 |
% |
|
|
134.79 |
|
|
|
162.65 |
|
|
|
46,814 |
|
| Thereafter |
|
|
119 |
|
|
|
1,179,920 |
|
|
|
6.0 |
% |
|
|
128,676 |
|
|
|
12.1 |
% |
|
|
109.05 |
|
|
|
152.39 |
|
|
|
179,807 |
|
|
|
|
|
|
|
|
|
|
|
|
|
|
|
|
|
|
|
|
|
|
|
|
|
|
|
|
|
|
|
|
|
|
| Portfolio Total / Weighted Average |
|
|
863 |
|
|
|
5,077,269 |
|
|
|
25.6 |
% |
|
$ |
620,221 |
|
|
|
58.7 |
% |
|
$ |
133.21 |
|
|
$ |
158.65 |
|
|
$ |
738,685 |
|
|
|
|
|
|
|
|
|
|
|
|
|
|
|
|
|
|
|
|
|
|
|
|
|
|
|
|
|
|
|
|
|
|
POWERED BASE BUILDING
|
|
|
|
|
|
|
|
|
|
|
|
|
|
|
|
|
|
|
|
|
|
|
|
|
|
|
|
|
|
|
|
|
| Year |
|
Number of
Leases Expiring (1)(5) |
|
|
Square
Footage of
Expiring
Leases (2)(5) |
|
|
Percentage
of Net
Rentable
Square
Feet |
|
|
Annualized
Rent (3)(5) |
|
|
Percentage
of
Annualized
Rent |
|
|
Annualized
Rent Per
Occupied
Square
Foot |
|
|
Annualized
Rent Per
Occupied
Square
Foot at
Expiration |
|
|
Annualized
Rent at
Expiration |
|
| Available |
|
|
|
|
|
|
161,082 |
|
|
|
0.8 |
% |
|
|
|
|
|
|
0.0 |
% |
|
|
|
|
|
|
|
|
|
|
|
|
| Month to Month (4) |
|
|
10 |
|
|
|
6,379 |
|
|
|
0.0 |
% |
|
$ |
258 |
|
|
|
0.0 |
% |
|
$ |
40.45 |
|
|
$ |
40.45 |
|
|
$ |
258 |
|
| 2013 |
|
|
12 |
|
|
|
204,901 |
|
|
|
1.0 |
% |
|
|
5,202 |
|
|
|
0.5 |
% |
|
|
25.39 |
|
|
|
25.39 |
|
|
|
5,202 |
|
| 2014 |
|
|
32 |
|
|
|
668,136 |
|
|
|
3.4 |
% |
|
|
25,454 |
|
|
|
2.4 |
% |
|
|
38.10 |
|
|
|
38.69 |
|
|
|
25,851 |
|
| 2015 |
|
|
49 |
|
|
|
1,214,901 |
|
|
|
6.2 |
% |
|
|
43,429 |
|
|
|
4.1 |
% |
|
|
35.75 |
|
|
|
37.17 |
|
|
|
45,159 |
|
| 2016 |
|
|
39 |
|
|
|
1,370,964 |
|
|
|
6.8 |
% |
|
|
32,264 |
|
|
|
3.1 |
% |
|
|
23.53 |
|
|
|
24.80 |
|
|
|
34,001 |
|
| 2017 |
|
|
18 |
|
|
|
244,914 |
|
|
|
1.2 |
% |
|
|
7,172 |
|
|
|
0.7 |
% |
|
|
29.28 |
|
|
|
31.79 |
|
|
|
7,786 |
|
| 2018 |
|
|
17 |
|
|
|
547,740 |
|
|
|
2.8 |
% |
|
|
18,101 |
|
|
|
1.7 |
% |
|
|
33.05 |
|
|
|
35.93 |
|
|
|
19,683 |
|
| 2019 |
|
|
20 |
|
|
|
957,984 |
|
|
|
4.8 |
% |
|
|
34,676 |
|
|
|
3.3 |
% |
|
|
36.20 |
|
|
|
41.22 |
|
|
|
39,485 |
|
| 2020 |
|
|
17 |
|
|
|
408,583 |
|
|
|
2.1 |
% |
|
|
14,486 |
|
|
|
1.4 |
% |
|
|
35.45 |
|
|
|
43.17 |
|
|
|
17,637 |
|
| 2021 |
|
|
9 |
|
|
|
646,621 |
|
|
|
3.3 |
% |
|
|
15,226 |
|
|
|
1.4 |
% |
|
|
23.55 |
|
|
|
28.47 |
|
|
|
18,407 |
|
| 2022 |
|
|
13 |
|
|
|
642,074 |
|
|
|
3.2 |
% |
|
|
19,014 |
|
|
|
1.8 |
% |
|
|
29.61 |
|
|
|
35.83 |
|
|
|
23,004 |
|
| Thereafter |
|
|
98 |
|
|
|
2,736,352 |
|
|
|
13.9 |
% |
|
|
105,927 |
|
|
|
10.0 |
% |
|
|
38.71 |
|
|
|
54.06 |
|
|
|
147,936 |
|
|
|
|
|
|
|
|
|
|
|
|
|
|
|
|
|
|
|
|
|
|
|
|
|
|
|
|
|
|
|
|
|
|
| Portfolio Total / Weighted Average |
|
|
334 |
|
|
|
9,810,631 |
|
|
|
49.5 |
% |
|
$ |
321,209 |
|
|
|
30.4 |
% |
|
$ |
33.29 |
|
|
$ |
39.84 |
|
|
$ |
384,409 |
|
|
|
|
|
|
|
|
|
|
|
|
|
|
|
|
|
|
|
|
|
|
|
|
|
|
|
|
|
|
|
|
|
|
COLOCATION
|
|
|
|
|
|
|
|
|
|
|
|
|
|
|
|
|
|
|
|
|
|
|
|
|
|
|
|
|
|
|
|
|
| Year |
|
Number of
Leases
Expiring (1)(5) |
|
|
Square
Footage
of
Expiring
Leases
(2)(5) |
|
|
Percentage
of Net
Rentable
Square
Feet |
|
|
Annualized
Rent (3)(5) |
|
|
Percentage of
Annualized
Rent |
|
|
Annualized
Rent Per
Occupied
Square
Foot |
|
|
Annualized
Rent Per
Occupied
Square
Foot at
Expiration |
|
|
Annualized
Rent at
Expiration |
|
| Available |
|
|
|
|
|
|
150,232 |
|
|
|
0.8 |
% |
|
|
|
|
|
|
0.0 |
% |
|
|
|
|
|
|
|
|
|
|
|
|
| Month to Month (4) |
|
|
19 |
|
|
|
10,139 |
|
|
|
0.1 |
% |
|
$ |
1,910 |
|
|
|
0.2 |
% |
|
$ |
188.38 |
|
|
$ |
240.16 |
|
|
$ |
2,435 |
|
| 2013 |
|
|
27 |
|
|
|
15,642 |
|
|
|
0.1 |
% |
|
|
3,541 |
|
|
|
0.3 |
% |
|
|
226.38 |
|
|
|
226.83 |
|
|
|
3,548 |
|
| 2014 |
|
|
96 |
|
|
|
59,101 |
|
|
|
0.3 |
% |
|
|
12,585 |
|
|
|
1.2 |
% |
|
|
212.94 |
|
|
|
217.92 |
|
|
|
12,879 |
|
| 2015 |
|
|
50 |
|
|
|
51,047 |
|
|
|
0.3 |
% |
|
|
10,565 |
|
|
|
1.0 |
% |
|
|
206.97 |
|
|
|
219.74 |
|
|
|
11,217 |
|
| 2016 |
|
|
44 |
|
|
|
33,243 |
|
|
|
0.2 |
% |
|
|
6,217 |
|
|
|
0.6 |
% |
|
|
187.02 |
|
|
|
221.88 |
|
|
|
7,376 |
|
| 2017 |
|
|
13 |
|
|
|
12,222 |
|
|
|
0.1 |
% |
|
|
1,963 |
|
|
|
0.2 |
% |
|
|
160.61 |
|
|
|
175.01 |
|
|
|
2,139 |
|
| 2018 |
|
|
19 |
|
|
|
15,197 |
|
|
|
0.1 |
% |
|
|
2,682 |
|
|
|
0.3 |
% |
|
|
176.48 |
|
|
|
225.51 |
|
|
|
3,427 |
|
| 2019 |
|
|
7 |
|
|
|
9,729 |
|
|
|
0.1 |
% |
|
|
994 |
|
|
|
0.1 |
% |
|
|
102.17 |
|
|
|
120.57 |
|
|
|
1,173 |
|
| 2020 |
|
|
2 |
|
|
|
1,105 |
|
|
|
0.0 |
% |
|
|
304 |
|
|
|
0.0 |
% |
|
|
275.11 |
|
|
|
329.41 |
|
|
|
364 |
|
| 2021 |
|
|
1 |
|
|
|
3,194 |
|
|
|
0.0 |
% |
|
|
300 |
|
|
|
0.0 |
% |
|
|
93.93 |
|
|
|
113.34 |
|
|
|
362 |
|
| 2022 |
|
|
— |
|
|
|
— |
|
|
|
0.0 |
% |
|
|
— |
|
|
|
0.0 |
% |
|
|
— |
|
|
|
— |
|
|
|
— |
|
| Thereafter |
|
|
4 |
|
|
|
10,802 |
|
|
|
0.1 |
% |
|
|
1,403 |
|
|
|
0.1 |
% |
|
|
129.88 |
|
|
|
228.57 |
|
|
|
2,469 |
|
|
|
|
|
|
|
|
|
|
|
|
|
|
|
|
|
|
|
|
|
|
|
|
|
|
|
|
|
|
|
|
|
|
| Portfolio Total / Weighted Average |
|
|
282 |
|
|
|
371,653 |
|
|
|
2.2 |
% |
|
$ |
42,464 |
|
|
|
4.0 |
% |
|
$ |
191.78 |
|
|
$ |
214.02 |
|
|
$ |
47,389 |
|
|
|
|
|
|
|
|
|
|
|
|
|
|
|
|
|
|
|
|
|
|
|
|
|
|
|
|
|
|
|
|
|
|
NON-TECHNICAL
|
|
|
|
|
|
|
|
|
|
|
|
|
|
|
|
|
|
|
|
|
|
|
|
|
|
|
|
|
|
|
|
|
| Year |
|
Number of
Leases Expiring (1)(5) |
|
|
Square
Footage of
Expiring
Leases (2)(5) |
|
|
Percentage
of Net
Rentable
Square
Feet |
|
|
Annualized
Rent (3)(5) |
|
|
Percentage of
Annualized
Rent |
|
|
Annualized
Rent Per
Occupied
Square
Foot |
|
|
Annualized
Rent Per
Occupied
Square
Foot at
Expiration |
|
|
Annualized
Rent at
Expiration |
|
| Available |
|
|
|
|
|
|
717,632 |
|
|
|
3.6 |
% |
|
|
|
|
|
|
0.0 |
% |
|
|
|
|
|
|
|
|
|
|
|
|
| Month to Month (4) |
|
|
30 |
|
|
|
29,125 |
|
|
|
0.1 |
% |
|
$ |
800 |
|
|
|
0.1 |
% |
|
$ |
27.47 |
|
|
$ |
27.47 |
|
|
$ |
800 |
|
| 2013 |
|
|
22 |
|
|
|
41,833 |
|
|
|
0.2 |
% |
|
|
788 |
|
|
|
0.1 |
% |
|
|
18.84 |
|
|
|
18.91 |
|
|
|
791 |
|
| 2014 |
|
|
74 |
|
|
|
291,566 |
|
|
|
1.5 |
% |
|
|
5,461 |
|
|
|
0.5 |
% |
|
|
18.73 |
|
|
|
18.87 |
|
|
|
5,502 |
|
| 2015 |
|
|
70 |
|
|
|
314,426 |
|
|
|
1.6 |
% |
|
|
5,899 |
|
|
|
0.6 |
% |
|
|
18.76 |
|
|
|
19.15 |
|
|
|
6,020 |
|
| 2016 |
|
|
65 |
|
|
|
204,966 |
|
|
|
1.0 |
% |
|
|
4,220 |
|
|
|
0.4 |
% |
|
|
20.59 |
|
|
|
21.79 |
|
|
|
4,466 |
|
| 2017 |
|
|
65 |
|
|
|
779,814 |
|
|
|
4.0 |
% |
|
|
16,803 |
|
|
|
1.6 |
% |
|
|
21.55 |
|
|
|
22.40 |
|
|
|
17,469 |
|
| 2018 |
|
|
55 |
|
|
|
253,349 |
|
|
|
1.3 |
% |
|
|
5,894 |
|
|
|
0.6 |
% |
|
|
23.26 |
|
|
|
26.03 |
|
|
|
6,594 |
|
| 2019 |
|
|
45 |
|
|
|
153,263 |
|
|
|
0.8 |
% |
|
|
3,400 |
|
|
|
0.3 |
% |
|
|
22.18 |
|
|
|
24.85 |
|
|
|
3,808 |
|
| 2020 |
|
|
44 |
|
|
|
271,024 |
|
|
|
1.4 |
% |
|
|
7,145 |
|
|
|
0.7 |
% |
|
|
26.36 |
|
|
|
27.13 |
|
|
|
7,354 |
|
| 2021 |
|
|
27 |
|
|
|
428,671 |
|
|
|
2.2 |
% |
|
|
5,335 |
|
|
|
0.5 |
% |
|
|
12.45 |
|
|
|
14.32 |
|
|
|
6,139 |
|
| 2022 |
|
|
31 |
|
|
|
280,491 |
|
|
|
1.4 |
% |
|
|
5,090 |
|
|
|
0.5 |
% |
|
|
18.15 |
|
|
|
21.31 |
|
|
|
5,977 |
|
| Thereafter |
|
|
96 |
|
|
|
707,938 |
|
|
|
3.6 |
% |
|
|
10,999 |
|
|
|
1.0 |
% |
|
|
15.54 |
|
|
|
18.40 |
|
|
|
13,025 |
|
|
|
|
|
|
|
|
|
|
|
|
|
|
|
|
|
|
|
|
|
|
|
|
|
|
|
|
|
|
|
|
|
|
| Portfolio Total / Weighted Average |
|
|
624 |
|
|
|
4,474,098 |
|
|
|
22.7 |
% |
|
$ |
71,834 |
|
|
|
6.9 |
% |
|
$ |
19.12 |
|
|
$ |
20.75 |
|
|
$ |
77,945 |
|
|
|
|
|
|
|
|
|
|
|
|
|
|
|
|
|
|
|
|
|
|
|
|
|
|
|
|
|
|
|
|
|
|
| (1) |
Number of leases represents the leased-unit count; a lease could include multiple units. |
| (2) |
For some of our properties, we calculate square footage based on factors in addition to contractually leased square feet, including available power, required support space and common area. We estimate the total net
rentable square feet available for lease based on a number of factors in addition to contractually leased square feet, including available power, required support space and common area. |
| (3) |
Annualized rent represents the monthly contractual base rent (defined as cash base rent before abatements) under existing leases as of September 30, 2013 multiplied by 12. |
| (4) |
Includes leases, licenses and similar agreements that upon expiration have been automatically renewed on a month-to-month basis. |
| (5) |
Represents consolidated portfolio plus our managed portfolio of unconsolidated joint ventures based on our ownership percentage. |
Page 27
DIGITAL REALTY TRUST, INC.
Third Quarter 2013
Portfolio Overview by Product Type
As of September 30, 2013
(Dollar amounts in thousands)
|
|
|
|
|
|
|
|
|
|
|
|
|
|
|
| Property Type |
|
Product Type |
|
Annualized
Rent (1)(2) |
|
|
Percentage of
Annualized
Rent |
|
|
Percentage of
Property
Type Total |
|
| Corporate Data Center |
|
Turn-Key Flex |
|
$ |
507,962 |
|
|
|
48.1 |
% |
|
|
65.4 |
% |
|
|
Powered Base Building |
|
|
204,817 |
|
|
|
19.4 |
% |
|
|
26.4 |
% |
|
|
Colocation |
|
|
13,347 |
|
|
|
1.3 |
% |
|
|
1.7 |
% |
|
|
Non-Technical |
|
|
50,232 |
|
|
|
4.7 |
% |
|
|
6.5 |
% |
|
|
|
|
|
|
|
|
|
|
|
|
|
|
|
|
|
Data Center Total |
|
|
776,359 |
|
|
|
73.5 |
% |
|
|
100.0 |
% |
|
|
|
|
|
|
|
|
|
|
|
|
|
|
|
| Internet Gateway Data Center |
|
Turn-Key Flex |
|
|
112,259 |
|
|
|
10.6 |
% |
|
|
41.9 |
% |
|
|
Powered Base Building |
|
|
116,393 |
|
|
|
11.0 |
% |
|
|
43.4 |
% |
|
|
Colocation |
|
|
29,117 |
|
|
|
2.8 |
% |
|
|
10.9 |
% |
|
|
Non-Technical |
|
|
10,322 |
|
|
|
1.0 |
% |
|
|
3.8 |
% |
|
|
|
|
|
|
|
|
|
|
|
|
|
|
|
|
|
Internet Gateway Data Center Total |
|
|
268,091 |
|
|
|
25.4 |
% |
|
|
100.0 |
% |
|
|
|
|
|
|
|
|
|
|
|
|
|
|
|
| Non-Data Center |
|
Non-Technical |
|
|
11,278 |
|
|
|
1.1 |
% |
|
|
100.0 |
% |
|
|
|
|
|
|
|
|
|
|
|
|
|
|
|
|
|
Non-Data Center Total |
|
|
11,278 |
|
|
|
1.1 |
% |
|
|
100.0 |
% |
|
|
|
|
|
|
|
|
|
|
|
|
|
|
|
|
|
Total |
|
$ |
1,055,728 |
|
|
|
100.0 |
% |
|
|
|
|
|
|
|
|
|
|
|
|
|
|
|
|
|
|
|
| (1) |
Annualized rent represents the monthly contractual base rent (defined as cash base rent before abatements) under existing leases as of September 30, 2013 multiplied by 12. |
| (2) |
Represents consolidated portfolio plus our managed portfolio of unconsolidated joint ventures based on our ownership percentage. |
Page 28
DIGITAL REALTY TRUST, INC.
Third Quarter 2013
Summary of Leasing Activity
Leases Signed in the Quarter Ended September 30, 2013
|
|
|
|
|
|
|
|
|
|
|
|
|
|
|
|
|
|
|
|
|
|
|
|
|
|
|
|
|
|
|
|
|
|
|
|
|
|
|
|
|
|
|
|
|
|
|
|
|
| |
|
Turn-Key Flex |
|
|
Powered Base
Building |
|
|
Colocation |
|
|
Build to Suit |
|
|
Non-Tech |
|
|
Total |
|
| |
|
QTR |
|
|
R12 |
|
|
QTR |
|
|
R12 |
|
|
QTR |
|
|
R12 |
|
|
QTR |
|
|
R12 |
|
|
QTR |
|
|
R12 |
|
|
QTR |
|
|
R12 |
|
| Leasing Activity—New (1) |
|
|
|
|
|
|
|
|
|
|
|
|
|
|
|
|
|
|
|
|
|
|
|
|
|
|
|
|
|
|
|
|
|
|
|
|
|
|
|
|
|
|
|
|
|
|
|
|
| Number of Leases (2) |
|
|
20 |
|
|
|
52 |
|
|
|
|
|
|
|
3 |
|
|
|
35 |
|
|
|
107 |
|
|
|
2 |
|
|
|
16 |
|
|
|
23 |
|
|
|
57 |
|
|
|
80 |
|
|
|
235 |
|
| Rentable Square Feet Leased (3) |
|
|
265,327 |
|
|
|
493,947 |
|
|
|
|
|
|
|
54,805 |
|
|
|
20,895 |
|
|
|
50,725 |
|
|
|
23,322 |
|
|
|
296,075 |
|
|
|
31,015 |
|
|
|
210,599 |
|
|
|
340,559 |
|
|
|
1,106,151 |
|
| Initial Stabilized Cash Rent per Square Foot (PSF) |
|
$ |
134 |
|
|
$ |
151 |
|
|
|
|
|
|
$ |
27 |
|
|
$ |
159 |
|
|
$ |
220 |
|
|
$ |
167 |
|
|
$ |
114 |
|
|
$ |
24 |
|
|
$ |
22 |
|
|
$ |
128 |
|
|
$ |
114 |
|
| GAAP Rent PSF (4) |
|
$ |
147 |
|
|
$ |
165 |
|
|
|
|
|
|
$ |
31 |
|
|
$ |
165 |
|
|
$ |
221 |
|
|
$ |
173 |
|
|
$ |
123 |
|
|
$ |
23 |
|
|
$ |
23 |
|
|
$ |
139 |
|
|
$ |
123 |
|
| Leasing Cost PSF |
|
$ |
46 |
|
|
$ |
60 |
|
|
|
|
|
|
$ |
10 |
|
|
$ |
27 |
|
|
$ |
41 |
|
|
$ |
78 |
|
|
$ |
21 |
|
|
$ |
10 |
|
|
$ |
28 |
|
|
$ |
44 |
|
|
$ |
40 |
|
| Weighted Average Lease Term (years) |
|
|
8.0 |
|
|
|
9.4 |
|
|
|
|
|
|
|
9.3 |
|
|
|
4.9 |
|
|
|
3.8 |
|
|
|
7.7 |
|
|
|
12.9 |
|
|
|
5.6 |
|
|
|
9.7 |
|
|
|
7.6 |
|
|
|
10.1 |
|
| Leasing Activity—Renewals (1) |
|
|
|
|
|
|
|
|
|
|
|
|
|
|
|
|
|
|
|
|
|
|
|
|
|
|
|
|
|
|
|
|
|
|
|
|
|
|
|
|
|
|
|
|
|
|
|
|
| Number of Leases (2) |
|
|
7 |
|
|
|
23 |
|
|
|
15 |
|
|
|
22 |
|
|
|
14 |
|
|
|
62 |
|
|
|
|
|
|
|
|
|
|
|
10 |
|
|
|
29 |
|
|
|
46 |
|
|
|
136 |
|
| Leases Renewed (square feet) (3) |
|
|
148,046 |
|
|
|
331,754 |
|
|
|
479,815 |
|
|
|
727,014 |
|
|
|
10,126 |
|
|
|
63,268 |
|
|
|
|
|
|
|
|
|
|
|
65,227 |
|
|
|
122,214 |
|
|
|
703,214 |
|
|
|
1,244,250 |
|
| Expiring Cash Rent PSF |
|
$ |
120 |
|
|
$ |
160 |
|
|
$ |
41 |
|
|
$ |
40 |
|
|
$ |
156 |
|
|
$ |
167 |
|
|
|
|
|
|
|
|
|
|
$ |
25 |
|
|
$ |
26 |
|
|
$ |
58 |
|
|
$ |
77 |
|
| Renewed Cash Rent PSF |
|
$ |
114 |
|
|
$ |
150 |
|
|
$ |
44 |
|
|
$ |
43 |
|
|
$ |
168 |
|
|
$ |
180 |
|
|
|
|
|
|
|
|
|
|
$ |
25 |
|
|
$ |
26 |
|
|
$ |
59 |
|
|
$ |
77 |
|
| Cash Rental Rate Change |
|
|
-4.7 |
% |
|
|
-6.4 |
% |
|
|
8.3 |
% |
|
|
5.5 |
% |
|
|
8.0 |
% |
|
|
7.7 |
% |
|
|
|
|
|
|
|
|
|
|
-0.7 |
% |
|
|
1.5 |
% |
|
|
2.2 |
% |
|
|
-1.0 |
% |
| Expring GAAP Rent PSF (4) |
|
$ |
112 |
|
|
$ |
117 |
|
|
$ |
35 |
|
|
$ |
35 |
|
|
$ |
152 |
|
|
$ |
162 |
|
|
|
|
|
|
|
|
|
|
$ |
23 |
|
|
$ |
24 |
|
|
$ |
52 |
|
|
$ |
62 |
|
| Renewed GAAP Rent PSF (4) |
|
$ |
117 |
|
|
$ |
121 |
|
|
$ |
51 |
|
|
$ |
48 |
|
|
$ |
186 |
|
|
$ |
191 |
|
|
|
|
|
|
|
|
|
|
$ |
26 |
|
|
$ |
27 |
|
|
$ |
64 |
|
|
$ |
73 |
|
| GAAP Rental Rate Change |
|
|
4.6 |
% |
|
|
3.2 |
% |
|
|
44.9 |
% |
|
|
37.5 |
% |
|
|
22.5 |
% |
|
|
17.8 |
% |
|
|
|
|
|
|
|
|
|
|
11.9 |
% |
|
|
11.4 |
% |
|
|
24.2 |
% |
|
|
16.7 |
% |
| Leasing Cost PSF |
|
$ |
8 |
|
|
$ |
20 |
|
|
$ |
2 |
|
|
$ |
9 |
|
|
$ |
58 |
|
|
$ |
11 |
|
|
|
|
|
|
|
|
|
|
$ |
3 |
|
|
$ |
3 |
|
|
$ |
4 |
|
|
$ |
12 |
|
| Weighted Average Lease Term (years) |
|
|
2.9 |
|
|
|
5.3 |
|
|
|
16.6 |
|
|
|
16.2 |
|
|
|
7.4 |
|
|
|
3.4 |
|
|
|
|
|
|
|
|
|
|
|
11.5 |
|
|
|
9.6 |
|
|
|
13.1 |
|
|
|
11.8 |
|
| Retention Ratio (5) |
|
|
97 |
% |
|
|
82 |
% |
|
|
98 |
% |
|
|
98 |
% |
|
|
60 |
% |
|
|
60 |
% |
|
|
|
|
|
|
|
|
|
|
62 |
% |
|
|
34 |
% |
|
|
92 |
% |
|
|
77 |
% |
| (1) |
Excludes short term, roof and garage leases. |
| (2) |
The number of leases represents the leased-unit count; a lease could include multiple units. |
| (3) |
For some of our properties, we calculate square footage based on factors in addition to contractually leased square feet, including power, required support space and common area. |
| (4) |
Rental rates represent annual estimated cash rent per rentable square foot adjusted for straight-line rents in accordance with GAAP rent. |
| (5) |
Based on square feet. |
Note: R12 represents rolling 12 months including current quarter.
Page 29
DIGITAL REALTY TRUST, INC.
Third Quarter 2013
Summary of Leasing Activity
Leases Commenced in the Quarter Ended September 30, 2013
|
|
|
|
|
|
|
|
|
|
|
|
|
|
|
|
|
|
|
|
|
|
|
|
|
|
|
|
|
|
|
|
|
|
|
|
|
|
|
|
|
|
|
|
|
|
|
|
|
| |
|
Turn-Key Flex |
|
|
Powered Base
Building |
|
|
Colocation |
|
|
Build to Suit |
|
|
Non-Tech |
|
|
Total |
|
| |
|
QTR |
|
|
R12 |
|
|
QTR |
|
|
R12 |
|
|
QTR |
|
|
R12 |
|
|
QTR |
|
|
R12 |
|
|
QTR |
|
|
R12 |
|
|
QTR |
|
|
R12 |
|
| Leasing Activity—New (1) |
|
|
|
|
|
|
|
|
|
|
|
|
|
|
|
|
|
|
|
|
|
|
|
|
|
|
|
|
|
|
|
|
|
|
|
|
|
|
|
|
|
|
|
|
|
|
|
|
| Number of Leases (2) |
|
|
9 |
|
|
|
59 |
|
|
|
1 |
|
|
|
6 |
|
|
|
29 |
|
|
|
102 |
|
|
|
4 |
|
|
|
10 |
|
|
|
17 |
|
|
|
49 |
|
|
|
60 |
|
|
|
226 |
|
| Rentable Square Feet Leased (3) |
|
|
111,451 |
|
|
|
543,760 |
|
|
|
32,285 |
|
|
|
86,958 |
|
|
|
14,770 |
|
|
|
43,046 |
|
|
|
91,355 |
|
|
|
291,501 |
|
|
|
16,117 |
|
|
|
127,686 |
|
|
|
265,978 |
|
|
|
1,092,951 |
|
| Initial Stabilized Cash Rent per Square Foot (PSF) |
|
$ |
161 |
|
|
$ |
163 |
|
|
$ |
21 |
|
|
$ |
58 |
|
|
$ |
187 |
|
|
$ |
243 |
|
|
$ |
103 |
|
|
$ |
76 |
|
|
$ |
21 |
|
|
$ |
21 |
|
|
$ |
117 |
|
|
$ |
118 |
|
| GAAP Rent PSF (4) |
|
$ |
168 |
|
|
$ |
175 |
|
|
$ |
23 |
|
|
$ |
65 |
|
|
$ |
187 |
|
|
$ |
240 |
|
|
$ |
105 |
|
|
$ |
79 |
|
|
$ |
22 |
|
|
$ |
22 |
|
|
$ |
121 |
|
|
$ |
125 |
|
| Leasing Cost PSF |
|
$ |
52 |
|
|
$ |
48 |
|
|
$ |
8 |
|
|
$ |
8 |
|
|
$ |
45 |
|
|
$ |
46 |
|
|
$ |
24 |
|
|
$ |
17 |
|
|
$ |
6 |
|
|
$ |
14 |
|
|
$ |
34 |
|
|
$ |
32 |
|
| Weighted Average Lease Term (years) |
|
|
8.0 |
|
|
|
10.7 |
|
|
|
7.8 |
|
|
|
11.2 |
|
|
|
4.5 |
|
|
|
3.8 |
|
|
|
10.0 |
|
|
|
9.7 |
|
|
|
7.5 |
|
|
|
7.6 |
|
|
|
8.4 |
|
|
|
9.8 |
|
| Leasing Activity—Renewals (1) |
|
|
|
|
|
|
|
|
|
|
|
|
|
|
|
|
|
|
|
|
|
|
|
|
|
|
|
|
|
|
|
|
|
|
|
|
|
|
|
|
|
|
|
|
|
|
|
|
| Number of Leases (2) |
|
|
8 |
|
|
|
24 |
|
|
|
15 |
|
|
|
22 |
|
|
|
10 |
|
|
|
63 |
|
|
|
|
|
|
|
|
|
|
|
9 |
|
|
|
29 |
|
|
|
42 |
|
|
|
138 |
|
| Leases Renewed SF (3) |
|
|
176,853 |
|
|
|
367,127 |
|
|
|
479,815 |
|
|
|
727,014 |
|
|
|
4,199 |
|
|
|
59,569 |
|
|
|
|
|
|
|
|
|
|
|
27,717 |
|
|
|
89,780 |
|
|
|
688,584 |
|
|
|
1,243,490 |
|
| Expiring Cash Rent PSF |
|
$ |
135 |
|
|
$ |
127 |
|
|
$ |
41 |
|
|
$ |
40 |
|
|
$ |
233 |
|
|
$ |
167 |
|
|
|
|
|
|
|
|
|
|
$ |
21 |
|
|
$ |
35 |
|
|
$ |
66 |
|
|
$ |
72 |
|
| Renewed Cash Rent PSF |
|
$ |
132 |
|
|
$ |
118 |
|
|
$ |
44 |
|
|
$ |
43 |
|
|
$ |
229 |
|
|
$ |
179 |
|
|
|
|
|
|
|
|
|
|
$ |
21 |
|
|
$ |
36 |
|
|
$ |
67 |
|
|
$ |
71 |
|
| Cash Rental Rate Change |
|
|
-2.7 |
% |
|
|
-7.0 |
% |
|
|
8.3 |
% |
|
|
5.5 |
% |
|
|
-1.4 |
% |
|
|
7.5 |
% |
|
|
|
|
|
|
|
|
|
|
1.0 |
% |
|
|
1.5 |
% |
|
|
2.2 |
% |
|
|
-0.9 |
% |
| Expring GAAP Rent PSF (4) |
|
$ |
128 |
|
|
$ |
121 |
|
|
$ |
35 |
|
|
$ |
35 |
|
|
$ |
229 |
|
|
$ |
161 |
|
|
|
|
|
|
|
|
|
|
$ |
19 |
|
|
$ |
23 |
|
|
$ |
59 |
|
|
$ |
65 |
|
| Renewed GAAP Rent PSF (4) |
|
$ |
134 |
|
|
$ |
125 |
|
|
$ |
51 |
|
|
$ |
48 |
|
|
$ |
234 |
|
|
$ |
189 |
|
|
|
|
|
|
|
|
|
|
$ |
21 |
|
|
$ |
26 |
|
|
$ |
72 |
|
|
$ |
76 |
|
| GAAP Rental Rate Change |
|
|
4.9 |
% |
|
|
3.6 |
% |
|
|
44.9 |
% |
|
|
37.5 |
% |
|
|
2.0 |
% |
|
|
17.3 |
% |
|
|
|
|
|
|
|
|
|
|
11.0 |
% |
|
|
10.9 |
% |
|
|
21.3 |
% |
|
|
16.0 |
% |
| Leasing Cost PSF |
|
$ |
6 |
|
|
$ |
18 |
|
|
$ |
2 |
|
|
$ |
9 |
|
|
$ |
2 |
|
|
$ |
2 |
|
|
|
|
|
|
|
|
|
|
$ |
7 |
|
|
$ |
6 |
|
|
$ |
3 |
|
|
$ |
11 |
|
| Weighted Average Lease Term (years) |
|
|
2.5 |
|
|
|
4.5 |
|
|
|
16.6 |
|
|
|
16.2 |
|
|
|
2.6 |
|
|
|
2.6 |
|
|
|
|
|
|
|
|
|
|
|
6.6 |
|
|
|
7.4 |
|
|
|
12.5 |
|
|
|
11.4 |
|
| (1) |
Excludes short term, roof and garage leases. |
| (2) |
The number of leases represents the leased-unit count; a lease could include multiple units. |
| (3) |
For some of our properties, we calculate square footage based on factors in addition to contractually leased square feet, including power, required support space and common area. |
| (4) |
Rental rates represent annual estimated cash rent per rentable square foot adjusted for straight-line rents in accordance with GAAP rent. |
Note: R12 represents rolling 12 months including current quarter.
Page 30
DIGITAL REALTY TRUST, INC.
Third Quarter 2013
Historical Capital Expenditures
|
|
|
|
|
|
|
|
|
|
|
|
|
|
|
|
|
|
|
|
|
|
|
|
|
|
|
|
|
| |
|
Three Months Ended |
|
| |
|
9/30/2013 |
|
|
6/30/2013 |
|
|
3/31/2013 |
|
|
12/31/2012 |
|
|
9/30/2012 |
|
|
6/30/2012 |
|
|
3/31/2012 |
|
| Recurring capital expenditures (1) |
|
$ |
12,895,000 |
|
|
$ |
13,429,000 |
|
|
$ |
9,860,000 |
|
|
$ |
14,432,000 |
|
|
$ |
11,015,000 |
|
|
$ |
9,229,000 |
|
|
$ |
6,754,000 |
|
| Non-recurring capital expenditures (2) |
|
$ |
277,697,000 |
|
|
$ |
289,977,000 |
|
|
$ |
232,774,000 |
|
|
$ |
216,712,000 |
|
|
$ |
176,141,000 |
|
|
$ |
187,055,000 |
|
|
$ |
167,360,000 |
|
| Total net rentable square feet at period end excluding development space
(3) |
|
|
19,521,556 |
|
|
|
20,500,643 |
|
|
|
20,158,840 |
|
|
|
19,488,757 |
|
|
|
18,922,065 |
|
|
|
17,881,857 |
|
|
|
16,923,054 |
|
| (1) |
Recurring capital expenditures represent non-incremental building improvements required to maintain current revenues and external leasing commissions. Recurring capital expenditures do not include acquisition capital
that was taken into consideration when underwriting the purchase of a building, costs which are incurred to bring a building up to Digital Realty’s “operating standards”, or internal leasing commissions. |
| (2) |
Non-recurring capital expenditures are primarily for development of space and land not including acquisition costs. In addition, these expenditures include certain infrequent expenditures for capitalized replacements,
upgrades, or other projects which enhance the existing operating portfolio (e.g., electrical, mechanical and building upgrades). |
| (3) |
For some of our properties, we calculate square footage based on factors in addition to contractually leased square feet, including available power, required support space and common area. |
Page 31
DIGITAL REALTY TRUST, INC.
Third Quarter 2013
Developable Land (1)
As of September 30, 2013
(Dollar amounts in
thousands)
|
|
|
|
|
|
|
|
|
|
|
|
|
|
|
|
|
| Property Name |
|
Region |
|
|
Acquisition Date |
|
|
Acres |
|
|
$
Cost Basis (2) |
|
| 701 Union Boulevard |
|
|
New York |
|
|
|
Oct-12 |
|
|
|
34.3 |
|
|
|
10,045 |
|
| Saito Industrial Park |
|
|
Osaka, Japan |
|
|
|
Aug-13 |
|
|
|
3.7 |
|
|
|
9,864 |
|
| Loudoun Parkway North - H&J |
|
|
Northern Virginia |
|
|
|
Apr-11 |
|
|
|
15.6 |
|
|
|
7,371 |
|
| De President Business Park |
|
|
Amsterdam, Netherlands |
|
|
|
Sep-13 |
|
|
|
5.4 |
|
|
|
7,129 |
|
| Convergence Park |
|
|
Dallas |
|
|
|
Feb-12 |
|
|
|
50.2 |
|
|
|
6,896 |
|
| Profile Park |
|
|
Dublin, Ireland |
|
|
|
Oct-11 |
|
|
|
10.0 |
|
|
|
6,595 |
|
| 1-23 Templar Rd (Building 2) |
|
|
Sydney, Australia |
|
|
|
Jul-11 |
|
|
|
8.6 |
|
|
|
4,426 |
|
| Loudoun Parkway North - K |
|
|
Northern Virginia |
|
|
|
Apr-11 |
|
|
|
9.2 |
|
|
|
3,700 |
|
| 3205 Alfred Road |
|
|
Silicon Valley |
|
|
|
May-10 |
|
|
|
2.3 |
|
|
|
3,086 |
|
| 1550 Space Park Drive |
|
|
Silicon Valley |
|
|
|
Sep-07 |
|
|
|
7.2 |
|
|
|
1,939 |
|
| 8025 North Interstate 35 |
|
|
Austin |
|
|
|
Jun-12 |
|
|
|
11.3 |
|
|
|
1,721 |
|
|
|
|
|
|
|
|
|
|
|
|
|
|
|
|
|
|
|
|
|
|
|
|
|
|
|
|
|
157.8 |
|
|
$ |
62,772 |
|
|
|
|
|
|
|
|
|
|
|
|
|
|
|
|
|
|
| (1) |
Represents properties acquired to support ground up development. |
| (2) |
Cost basis calculated using the spot rate as of September 30, 2013. |
Page 32
DIGITAL REALTY TRUST, INC.
Third Quarter 2013
Construction Activity Report
As of September 30, 2013
(in square feet unless otherwise
noted)
Construction in Progress by Market
|
|
|
|
|
|
|
|
|
|
|
|
|
|
|
|
|
|
|
|
|
|
|
|
|
| |
|
Construction in Progress (“CIP”) |
|
|
|
|
|
|
|
|
|
|
| Market |
|
Space Under
Development |
|
|
Land Under
Development |
|
|
Total Construction
In Progress |
|
|
Space Held for
Development |
|
|
Total |
|
|
Percentage
Leased of CIP |
|
| Austin |
|
|
23,322 |
|
|
|
— |
|
|
|
23,322 |
|
|
|
21,640 |
|
|
|
44,962 |
|
|
|
100.0 |
% |
| Boston |
|
|
— |
|
|
|
71,205 |
|
|
|
71,205 |
|
|
|
84,444 |
|
|
|
155,649 |
|
|
|
0.0 |
% |
| Chicago |
|
|
348,827 |
|
|
|
— |
|
|
|
348,827 |
|
|
|
160,409 |
|
|
|
509,236 |
|
|
|
11.2 |
% |
| Dallas |
|
|
— |
|
|
|
248,164 |
|
|
|
248,164 |
|
|
|
613,269 |
|
|
|
861,433 |
|
|
|
23.8 |
% |
| Houston |
|
|
— |
|
|
|
4,500 |
|
|
|
4,500 |
|
|
|
18,222 |
|
|
|
22,722 |
|
|
|
0.0 |
% |
| New York Metro |
|
|
35,224 |
|
|
|
54,065 |
|
|
|
89,289 |
|
|
|
441,505 |
|
|
|
530,794 |
|
|
|
20.6 |
% |
| Northern Virginia |
|
|
30,333 |
|
|
|
264,027 |
|
|
|
294,360 |
|
|
|
15,456 |
|
|
|
309,816 |
|
|
|
15.8 |
% |
| Philadelphia |
|
|
— |
|
|
|
— |
|
|
|
— |
|
|
|
60,011 |
|
|
|
60,011 |
|
|
|
0.0 |
% |
| Phoenix |
|
|
92,420 |
|
|
|
— |
|
|
|
92,420 |
|
|
|
169,695 |
|
|
|
262,115 |
|
|
|
0.0 |
% |
| Sacramento |
|
|
— |
|
|
|
— |
|
|
|
— |
|
|
|
23,397 |
|
|
|
23,397 |
|
|
|
0.0 |
% |
| San Francisco |
|
|
— |
|
|
|
— |
|
|
|
— |
|
|
|
33,560 |
|
|
|
33,560 |
|
|
|
0.0 |
% |
| Silicon Valley |
|
|
15,193 |
|
|
|
— |
|
|
|
15,193 |
|
|
|
96,454 |
|
|
|
111,647 |
|
|
|
100.0 |
% |
| St. Louis |
|
|
67,914 |
|
|
|
— |
|
|
|
67,914 |
|
|
|
74,404 |
|
|
|
142,318 |
|
|
|
0.0 |
% |
| Toronto, Canada |
|
|
34,306 |
|
|
|
— |
|
|
|
34,306 |
|
|
|
21,189 |
|
|
|
55,495 |
|
|
|
100.0 |
% |
| London, England |
|
|
16,070 |
|
|
|
106,400 |
|
|
|
122,470 |
|
|
|
184,027 |
|
|
|
306,497 |
|
|
|
100.0 |
% |
| Melbourne, Australia |
|
|
— |
|
|
|
93,582 |
|
|
|
93,582 |
|
|
|
— |
|
|
|
93,582 |
|
|
|
0.0 |
% |
| Paris, France |
|
|
27,350 |
|
|
|
— |
|
|
|
27,350 |
|
|
|
— |
|
|
|
27,350 |
|
|
|
100.0 |
% |
| Singapore |
|
|
— |
|
|
|
— |
|
|
|
— |
|
|
|
64,328 |
|
|
|
64,328 |
|
|
|
0.0 |
% |
| Sydney, Australia |
|
|
|
|
|
|
|
|
|
|
— |
|
|
|
45,015 |
|
|
|
45,015 |
|
|
|
0.0 |
% |
|
|
|
|
|
|
|
|
|
|
|
|
|
|
|
|
|
|
|
|
|
|
|
|
|
| Grand Total |
|
|
690,959 |
|
|
|
841,943 |
|
|
|
1,532,902 |
|
|
|
2,127,025 |
|
|
|
3,659,927 |
|
|
|
|
|
|
|
|
|
|
|
|
|
|
|
|
|
|
|
|
|
|
|
|
|
|
|
|
|
|
| Total US Markets |
|
|
613,233 |
|
|
|
641,961 |
|
|
|
1,255,194 |
|
|
|
1,812,466 |
|
|
|
3,067,660 |
|
|
|
|
|
| Total Intl Markets |
|
|
77,726 |
|
|
|
199,982 |
|
|
|
277,708 |
|
|
|
314,559 |
|
|
|
592,267 |
|
|
|
|
|
|
|
|
|
|
|
|
|
|
|
|
|
|
|
|
|
|
|
|
|
|
|
|
|
|
| Percentage Leased (1) |
|
|
29.5 |
% |
|
|
21.6 |
% |
|
|
25.1 |
% |
|
|
|
|
|
|
|
|
|
|
|
|
|
|
|
|
|
|
|
|
|
|
|
|
|
|
|
|
|
|
|
|
|
|
|
|
|
Construction in Progress by Product Type (2)
|
|
|
|
|
|
|
|
|
|
|
|
|
|
|
|
|
|
|
|
|
| |
|
US |
|
|
Europe |
|
|
Asia/Pacific |
|
|
Total |
|
|
% Leased (1) |
|
| Turn-Key FlexSM |
|
|
511,678 |
|
|
|
— |
|
|
|
40,000 |
|
|
|
551,678 |
|
|
|
29.6 |
% |
| Powered Base Building® |
|
|
705,481 |
|
|
|
27,350 |
|
|
|
53,582 |
|
|
|
786,413 |
|
|
|
3.5 |
% |
| Custom Solutions |
|
|
72,341 |
|
|
|
122,470 |
|
|
|
— |
|
|
|
194,811 |
|
|
|
100.0 |
% |
|
|
|
|
|
|
|
|
|
|
|
|
|
|
|
|
|
|
|
|
|
| Total Construction in Progress by Product Type |
|
|
1,289,500 |
|
|
|
149,820 |
|
|
|
93,582 |
|
|
|
1,532,902 |
|
|
|
25.1 |
% |
|
|
|
|
|
|
|
|
|
|
|
|
|
|
|
|
|
|
|
|
|
Total Development Activity (3)
|
|
|
|
|
|
|
|
|
|
|
|
|
|
|
|
|
|
|
|
|
| |
|
US |
|
|
Europe |
|
|
Asia/Pacific |
|
|
Total |
|
|
% Leased (1) |
|
| Total Development and Space Held as of June 30, 2013 |
|
|
3,021,030 |
|
|
|
335,515 |
|
|
|
202,925 |
|
|
|
3,559,470 |
|
|
|
|
|
| New Inventory Held for Development |
|
|
379,641 |
|
|
|
— |
|
|
|
— |
|
|
|
379,641 |
|
|
|
|
|
| Space Delivered During the Quarter: |
|
|
|
|
|
|
|
|
|
|
|
|
|
|
— |
|
|
|
|
|
| Turn-Key FlexSM |
|
|
(161,175 |
) |
|
|
— |
|
|
|
— |
|
|
|
(161,175 |
) |
|
|
36.1 |
% |
| Powered Base Building® |
|
|
(26,325 |
) |
|
|
— |
|
|
|
— |
|
|
|
(26,325 |
) |
|
|
100.0 |
% |
| Custom Solutions |
|
|
(92,345 |
) |
|
|
— |
|
|
|
— |
|
|
|
(92,345 |
) |
|
|
100.0 |
% |
| Remeasurement Adjustments |
|
|
2,329 |
|
|
|
(1,668 |
) |
|
|
— |
|
|
|
661 |
|
|
|
|
|
|
|
|
|
|
|
|
|
|
|
|
|
|
|
|
|
|
|
|
|
|
| Total Development and Space Held as of September 30, 2013 |
|
|
3,123,155 |
|
|
|
333,847 |
|
|
|
202,925 |
|
|
|
3,659,927 |
|
|
|
|
|
|
|
|
|
|
|
|
|
|
|
|
|
|
|
|
|
|
|
|
|
|
| (1) |
Represents leases signed. |
| (2) |
Based on current estimates. |
| (3) |
Includes space and land under development and space held for development. |
Page 33
DIGITAL REALTY TRUST, INC.
Third Quarter 2013
Construction Projects in Progress and Total Estimated Direct Cost (1)
For the quarter ended September 30, 2013
(Dollar amounts in thousands, except for cost per square foot)
|
|
|
|
|
|
|
|
|
|
|
|
|
|
|
|
|
|
|
|
|
|
|
|
|
| Construction Projects in Progress and
Total Estimated Direct Cost |
|
Base Building
Improvement to
Net Rentable
Square Feet |
|
|
Net Rentable
Square Feet |
|
|
Direct Project
Cost—Spent
to Date |
|
|
Direct Project
Cost—to Be
Spent |
|
|
Direct
Project
Total
Estimated
Cost |
|
|
Direct
Project Cost
Per Net
Rentable
Square Foot |
|
| Turn-Key Flex Under Construction as of September 30, 2013 (2) |
|
|
— |
|
|
|
551,678 |
|
|
$ |
154,344 |
|
|
$ |
142,248 |
|
|
$ |
296,592 |
|
|
$ |
538 |
|
| Custom Solutions Under Construction as of September 30, 2013 (2) |
|
|
— |
|
|
|
194,811 |
|
|
|
23,108 |
|
|
|
180,166 |
|
|
|
203,274 |
|
|
$ |
1,043 |
|
| Powered Base Building Under Construction as of
September 30, 2013 (2) |
|
|
— |
|
|
|
786,413 |
|
|
|
89,248 |
|
|
|
47,743 |
|
|
|
136,991 |
|
|
$ |
174 |
|
| Base Building Improvements to Current in Progress Space Under Construction |
|
|
— |
|
|
|
— |
|
|
|
158,095 |
|
|
|
24,799 |
|
|
|
182,894 |
|
|
|
|
|
| Base Building Improvements to Support Future Development (3) |
|
|
1,809,458 |
|
|
|
— |
|
|
|
66,601 |
|
|
|
148,109 |
|
|
|
214,710 |
|
|
|
|
|
| Base Building Improvements to Support Operating Portfolio (3) |
|
|
2,655,099 |
|
|
|
— |
|
|
|
77,116 |
|
|
|
18,056 |
|
|
|
95,172 |
|
|
|
|
|
|
|
|
|
|
|
|
|
|
|
|
|
|
|
|
|
|
|
|
|
|
|
|
|
|
| TOTAL |
|
|
4,464,557 |
|
|
|
1,532,902 |
|
|
$ |
568,512 |
|
|
$ |
561,121 |
|
|
$ |
1,129,633 |
|
|
|
|
|
|
|
|
|
|
|
|
|
|
|
|
|
|
|
|
|
|
|
|
|
|
|
|
|
|
| (1) |
Includes direct project cash disbursements and project accruals; does not include capitalized costs (i.e., interest and general & administrative) or pro-rata acquisition cost. |
| (2) |
Represents suite-specific projects based on current estimates. |
| (3) |
Cost incurred to develop base buildings for future development and overall condition of portfolio. |
Page 34
DIGITAL REALTY TRUST, INC.
Third Quarter 2013
Management Statements on Non-GAAP Supplemental Measures
Funds from Operations (FFO):
We calculate funds from
operations, or FFO, in accordance with the standards established by the National Association of Real Estate Investment Trusts, or NAREIT. FFO represents net income (loss) (computed in accordance with GAAP), excluding gains (or losses) from sales of
property, impairment charges, real estate related depreciation and amortization (excluding amortization of deferred financing costs) and after adjustments for unconsolidated partnerships and joint ventures. Management uses FFO as a supplemental
performance measure because, in excluding real estate related depreciation and amortization and gains and losses from property dispositions and after adjustments for unconsolidated partnerships and joint ventures, it provides a performance measure
that, when compared year over year, captures trends in occupancy rates, rental rates and operating costs. We also believe that, as a widely recognized measure of the performance of REITs, FFO will be used by investors as a basis to compare our
operating performance with that of other REITs. However, because FFO excludes depreciation and amortization and captures neither the changes in the value of our properties that result from use or market conditions, nor the level of capital
expenditures and capitalized leasing commissions necessary to maintain the operating performance of our properties, all of which have real economic effect and could materially impact our financial condition and results from operations, the utility
of FFO as a measure of our performance is limited. Other REITs may not calculate FFO in accordance with the NAREIT definition and, accordingly, our FFO may not be comparable to such other REITs’ FFO. Accordingly, FFO should be considered only
as a supplement to net income computed in accordance with GAAP as a measure of our performance.
Adjusted Funds from Operations (AFFO):
We present adjusted funds from operations, or AFFO, as a supplemental operating measure because, when compared year over year, it assesses our ability to fund
dividend and distribution requirements from our operating activities. We also believe that, as a widely recognized measure of the operations of REITs, AFFO will be used by investors as a basis to assess our ability to fund dividend payments in
comparison to other REITs, including on a per share and unit basis. We calculate AFFO by adding to or subtracting from FFO (i) non-real estate depreciation, (ii) amortization of deferred financing costs, (iii) amortization of debt
discount, (iv) non-cash compensation, (v) loss from early extinguishment of debt, (vi) straight line rents, (vii) fair value of lease revenue amortization, (viii) change in fair value of contingent consideration,
(ix) capitalized leasing payroll, (x) recurring tenant improvements, (xi) capitalized leasing commissions and (xii) costs of redeeming our preferred stock. Other REITs may not calculate AFFO in a consistent manner. Accordingly,
our AFFO may not be comparable to other REITs’ AFFO. AFFO should be considered only as a supplement to net income computed in accordance with GAAP as a measure of our performance.
EBITDA and Adjusted EBITDA:
We believe that earnings
before interest expense, income taxes, depreciation and amortization, or EBITDA, and Adjusted EBITDA (as defined below), are useful supplemental performance measures because they allow investors to view our performance without the impact of non-cash
depreciation and amortization or the cost of debt and, with respect to Adjusted EBITDA, straight-line rent expense adjustment attributable to prior periods, gain from change in control of investment properties, noncontrolling interests, and
preferred stock dividends. Adjusted EBITDA is EBITDA excluding straight-line rent expense adjustment attributable to prior periods, gain on contribution of properties to unconsolidated joint venture, noncontrolling interests, and preferred stock
dividends. In addition, we believe EBITDA and Adjusted EBITDA are frequently used by securities analysts, investors and other interested parties in the evaluation of REITs. Because EBITDA and Adjusted EBITDA are calculated before recurring cash
charges including interest expense and income taxes, exclude capitalized costs, such as leasing commissions, and are not adjusted for capital expenditures or other recurring cash requirements of our business, their utility as a measure of our
performance is limited. Other REITs may calculate EBITDA and Adjusted EBITDA differently than we do; accordingly, our EBITDA and Adjusted EBITDA may not be comparable to such other REITs’ EBITDA and Adjusted EBITDA. Accordingly, EBITDA and
Adjusted EBITDA should be considered only as supplements to net income computed in accordance with GAAP as a measure of our financial performance.
Net
Operating Income (NOI) and Cash NOI:
Net operating income, or NOI, represents rental revenue and tenant reimbursement revenue less rental property
operating and maintenance expenses, property taxes and insurance expenses (as reflected in the statement of operations). NOI is commonly used by stockholders, company management and industry analysts as a measurement of operating performance of the
company’s rental portfolio. Cash NOI is NOI less straight-line rents and above and below market rent amortization. Cash NOI is commonly used by stockholders, company management and industry analysts as a measure of property operating
performance on a cash basis. However, because NOI and cash NOI exclude depreciation and amortization and capture neither the changes in the value of our properties that result from use or market conditions, nor the level of capital expenditures and
capitalized leasing commissions necessary to maintain the operating performance of our properties, all of which have real economic effect and could materially impact our results from operations, the utility of NOI and cash NOI as measures of our
performance is limited. Other REITs may not calculate NOI and cash NOI in the same manner we do and, accordingly, our NOI and cash NOI may not be comparable to such other REITs’ NOI and cash NOI. Accordingly, NOI and cash NOI should be
considered only as supplements to net income computed in accordance with GAAP as measures of our performance.
Page 35