UNITED STATES
SECURITIES AND EXCHANGE COMMISSION
Washington, D.C. 20549
Form
Current Report
Pursuant to Section 13 or 15(d) of the Securities Exchange Act of 1934
Date of Report (Date of earliest event
reported):
(Exact name of registrant as specified in its charter)
Commission File Number:
(State or other jurisdiction of | (IRS Employer | |
incorporation) | Identification No.) |
(Address of principal executive offices, including zip code)
(Registrant’s telephone number, including area code)
(Former name or former address, if changed since last report)
Check the appropriate box below if the Form 8-K filing is intended to simultaneously satisfy the filing obligation of the registrant under any of the following provisions:
Securities registered pursuant to Section 12(b) of the Act:
Title of each class |
Trading Symbol(s) |
Name of each exchange on which registered | ||
Indicate by check mark whether the registrant is an emerging growth company as defined in Rule 405 of the Securities Act of 1933 (§230.405) or Rule 12b-2 of the Securities Exchange Act of 1934 (§240.12b-2).
If an emerging growth company, indicate by check mark if the registrant has elected not to use the extended transition period for complying with any new or revised financial accounting standards provided pursuant to Section 13(a) of the Exchange Act. [ ]
Item 2.02. | Results of Operations and Financial Condition |
On January 26, 2023, The Bancorp, Inc. (the "Company") issued a press release regarding its earnings for the three and twelve months ended December 31, 2022. A copy of this press release is furnished with this report as Exhibit 99.1.
Item 7.01. | Regulation FD Disclosure. |
The Company hereby furnishes the information set forth in the presentation attached hereto as Exhibit 99.2, which is incorporated herein by reference.
The information being furnished pursuant to Item 2.02 and Item 7.01 in this Current Report, including the exhibits hereto, is to be considered “furnished” pursuant to Form 8-K and shall not be deemed “filed” for purposes of Section 18 of the Securities Exchange Act of 1934, as amended, or otherwise subject to the liabilities of that section. The information in this Current Report shall not be incorporated by reference into any registration statement or other document pursuant to the Securities Act of 1933, as amended.
Item 9.01. | Financial Statements and Exhibits |
(d) Exhibits | ||
99.1 | Press Release | |
99.2 | Investor Presentation | |
104 | Cover Page Interactive Data File (embedded within the Inline XBRL document) | |
SIGNATURES
Pursuant to the requirements of the Securities Exchange Act of 1934, the registrant has duly caused this report to be signed on its behalf by the undersigned hereunto duly authorized.
Date: January 26, 2023 | The Bancorp, Inc. | |
By: | /s/ Paul Frenkiel | |
Name: | Paul Frenkiel | |
Title: | Chief Financial Officer and | |
Secretary |
Exhibit 99.1
The Bancorp, Inc. Reports Fourth Quarter and Full Year 2022 Financial Results and Updates 2023 Guidance
Wilmington, DE – January 26, 2023 – The Bancorp, Inc. ("The Bancorp" or “we”) (NASDAQ: TBBK), a financial holding company, today reported financial results for the fourth quarter of 2022.
Highlights
· | The Bancorp reported net income of $40.2 million, or $0.71 per diluted share, for the quarter ended December 31, 2022, compared to net income of $27.0 million, or $0.46 per diluted share, for the quarter ended December 31, 2021, or a 54% increase in income per diluted share. |
· | Return on assets and equity for the quarter ended December 31, 2022 amounted to 2.1% and 24%, respectively, compared to 1.7% and 17%, respectively, for the quarter ended December 31, 2021 (all percentages “annualized”). |
· | Net interest income increased 47% to $76.8 million for the quarter ended December 31, 2022, compared to $52.2 million for the quarter ended December 31, 2021. |
· | Net interest margin amounted to 4.21% for the quarter ended December 31, 2022, compared to 3.51% for the quarter ended December 31, 2021, and 3.69% for the quarter ended September 30, 2022. |
· | Excluding commercial loans, at fair value, which were originally generated for sale, total loans increased to $5.49 billion at December 31, 2022, compared to $5.27 billion at September 30, 2022 and $3.75 billion at December 31, 2021. Those increases reflected growth of 4% quarter over quarter and 45% year over year. Those percentage increases exclude the impact of $50.4 million of December 31, 2022 balances previously included in discontinued assets which were reclassified to loans held for investment in the first quarter of 2022. |
· | Gross dollar volume (“GDV”), representing the total amounts spent on prepaid and debit cards, increased $3.25 billion, or 13%, to $28.07 billion for the quarter ended December 31, 2022 compared to the quarter ended December 31, 2021. Total prepaid, debit card, ACH and other payment fees increased 10% to $21.8 million for fourth quarter 2022 compared to the fourth quarter of 2021. |
· | SBLOC (securities backed lines of credit), IBLOC (insurance backed lines of credit) and investment advisor financing loans collectively increased 22% year over year and decreased 1% quarter over quarter to $2.50 billion at December 31, 2022. |
· | Small Business Loans, including those held at fair value, grew 10% year over year to $763.8 million at December 31, 2022, and 4% quarter over quarter. That growth is exclusive of PPP loan balances which amounted to $4.5 million and $44.8 million, respectively, at December 31, 2022 and December 31, 2021. |
· | Direct lease financing balances increased 19% year over year to $632.2 million at December 31, 2022, and 5% quarter over quarter. |
· | We resumed non-SBA commercial real estate bridge lending in the third quarter of 2021. At December 31, 2022, the balance of such real estate bridge loans, consisting of apartment buildings, was $1.67 billion compared to $1.49 billion at September 30, 2022, reflecting quarter over quarter growth of 12%. At December 31, 2021, these loans totaled $621.7 million. |
· | The average interest rate on $6.80 billion of average deposits and interest-bearing liabilities during the fourth quarter of 2022 was 1.77%. Average deposits of $6.62 billion for the fourth quarter of 2022, reflected an increase of 25% from the $5.31 billion of average deposits for the quarter ended December 31, 2021. |
· | As of December 31, 2022, tier one capital to assets (leverage), tier one capital to risk-weighted assets, total capital to risk-weighted assets and common equity-tier 1 to risk-weighted assets ratios were 9.63%, 13.40%, 13.87% and 13.40%, respectively, compared to well-capitalized minimums of 5%, 8%, 10% and 6.5%, respectively. The Bancorp and its wholly owned subsidiary, The Bancorp Bank, National Association, each remain well capitalized under banking regulations. |
· | Book value per common share at December 31, 2022 was $12.46 per share compared to $11.37 per share at December 31, 2021, an increase of 10%. Increases resulting from retained earnings were partially offset by reductions in the market value of securities available for sale, which are recognized through equity. |
1 |
· | The Bancorp repurchased 553,003 shares of its common stock at an average cost of $27.12 per share during the quarter ended December 31, 2022. |
“We finished 2022 with significant improvements in profitability, NIM and GDV growth" said CEO and President Damian Kozlowski. "Our team continues to be focused on further improving our arguably best fintech ecosystem in banking, maintaining a lower risk balance sheet than peers, continuing our rigorous risk management and increasing profitability. We believe 2023 will be another substantial move forward on all fronts and we confirm our guidance of $3.20 a share, an improvement of approximately 40% over 2022 EPS. We expect to increase our share repurchases to $25 million per quarter, or $100 million in 2023, from $15 million a quarter, or $60 million, in 2022.”
Conference Call Webcast
You may access the LIVE webcast of The Bancorp's Quarterly Earnings Conference Call at 8:00 AM ET Friday, January 27, 2023 by clicking on the webcast link on The Bancorp's homepage at www.thebancorp.com. Or you may dial 1.888.396.8049, access code 92735961. You may listen to the replay of the webcast following the live call on The Bancorp's investor relations website or telephonically until Friday, February 3, 2023 by dialing 1.877.674.7070, access code 735961#.
About The Bancorp
The Bancorp, Inc. (NASDAQ: TBBK), headquartered in Wilmington, Delaware, through its subsidiary, The Bancorp Bank, National Association, (or “The Bancorp Bank, N. A.”) provides non-bank financial companies with the people, processes, and technology to meet their unique banking needs. Through its Fintech Solutions, Institutional Banking, Commercial Lending, and Real Estate Bridge Lending businesses, The Bancorp provides partner-focused solutions paired with cutting-edge technology for companies that range from entrepreneurial startups to Fortune 500 companies. With over 20 years of experience, The Bancorp has become a leader in the financial services industry, earning recognition as the #1 issuer of prepaid cards in the U.S., a nationwide provider of bridge financing for real estate capital improvement plans, an SBA National Preferred Lender, a leading provider of securities-backed lines of credit, with one of the few bank-owned commercial vehicle leasing groups. By its company-wide commitment to excellence, The Bancorp has also been ranked as one of the 100 Fastest-Growing Companies by Fortune, a Top 50 Employer by Equal Opportunity Magazine and was selected to be included in the S&P Small Cap 600. For more about The Bancorp, visit https://thebancorp.com/.
Forward-Looking Statements
Statements in this earnings release regarding The Bancorp’s business which are not historical facts are "forward-looking statements." These statements may be identified by the use of forward-looking terminology, including but not limited to the words “intend,” “may,” “believe,” “will,” “expect,” “look,” “anticipate,” “plan,” “estimate,” “continue,” or similar words , and are based on current expectations about important economic, political, and technological factors, among others, and are subject to risks and uncertainties, which could cause the actual results, events or achievements to differ materially from those set forth in or implied by the forward-looking statements and related assumptions. For further discussion of the risks and uncertainties to which these forward-looking statements may be subject, see The Bancorp’s filings with the Securities and Exchange Commission, including the “Risk Factors” and “Management’s Discussion and Analysis of Financial Condition and Results of Operations” sections of those filings. The forward-looking statements speak only as of the date of this press release. The Bancorp does not undertake to publicly revise or update forward-looking statements in this press release to reflect events or circumstances that arise after the date of this press release, except as may be required under applicable law.
The Bancorp, Inc. Contact
Andres Viroslav
Director, Investor Relations
215-861-7990
andres.viroslav@thebancorp.com
Source: The Bancorp, Inc.
2 |
The Bancorp, Inc.
Financial highlights
(unaudited)
Three months ended | Year ended | |||||||||||||||
December 31, | December 31, | |||||||||||||||
Consolidated condensed income statements | 2022 | 2021 | 2022 | 2021 | ||||||||||||
(Dollars in thousands, except per share and share data) | ||||||||||||||||
Net interest income | $ | 76,760 | $ | 52,157 | $ | 248,841 | $ | 210,876 | ||||||||
Provision for credit losses | 2,777 | 1,626 | 7,108 | 3,110 | ||||||||||||
Non-interest income | ||||||||||||||||
ACH, card and other payment processing fees | 2,383 | 1,921 | 8,935 | 7,526 | ||||||||||||
Prepaid, debit card and related fees | 19,371 | 17,776 | 77,236 | 74,654 | ||||||||||||
Net realized and unrealized gains on commercial loans, at fair value | 2,269 | 6,004 | 13,531 | 14,885 | ||||||||||||
Leasing related income | 1,256 | 1,757 | 4,822 | 6,457 | ||||||||||||
Other non-interest income | 461 | 768 | 1,159 | 1,227 | ||||||||||||
Total non-interest income | 25,740 | 28,226 | 105,683 | 104,749 | ||||||||||||
Non-interest expense | ||||||||||||||||
Salaries and employee benefits | 27,520 | 28,159 | 105,368 | 105,998 | ||||||||||||
Data processing expense | 1,245 | 1,183 | 4,972 | 4,664 | ||||||||||||
Legal expense | 703 | 1,499 | 3,878 | 6,848 | ||||||||||||
Legal settlement | — | — | 1,152 | — | ||||||||||||
Civil money penalty | — | — | 1,750 | — | ||||||||||||
FDIC insurance | 944 | 351 | 3,270 | 5,586 | ||||||||||||
Software | 4,181 | 4,224 | 16,211 | 15,659 | ||||||||||||
Other non-interest expense | 8,882 | 7,784 | 32,901 | 29,595 | ||||||||||||
Total non-interest expense | 43,475 | 43,200 | 169,502 | 168,350 | ||||||||||||
Income from continuing operations before income taxes | 56,248 | 35,557 | 177,914 | 144,165 | ||||||||||||
Income tax expense | 16,007 | 8,529 | 47,701 | 33,724 | ||||||||||||
Net income from continuing operations | 40,241 | 27,028 | 130,213 | 110,441 | ||||||||||||
Discontinued operations | ||||||||||||||||
(Loss) income from discontinued operations before income taxes | — | (36 | ) | — | 288 | |||||||||||
Income tax expense | — | — | — | 76 | ||||||||||||
Net (loss) income from discontinued operations, net of tax | — | (36 | ) | — | 212 | |||||||||||
Net income | $ | 40,241 | $ | 26,992 | $ | 130,213 | $ | 110,653 | ||||||||
Net income per share from continuing operations - basic | $ | 0.72 | $ | 0.47 | $ | 2.30 | $ | 1.93 | ||||||||
Net income per share from discontinued operations - basic | $ | — | $ | — | $ | — | $ | — | ||||||||
Net income per share - basic | $ | 0.72 | $ | 0.47 | $ | 2.30 | $ | 1.93 | ||||||||
Net income per share from continuing operations - diluted | $ | 0.71 | $ | 0.46 | $ | 2.27 | $ | 1.88 | ||||||||
Net income per share from discontinued operations - diluted | $ | — | $ | — | $ | — | $ | — | ||||||||
Net income per share - diluted | $ | 0.71 | $ | 0.46 | $ | 2.27 | $ | 1.88 | ||||||||
Weighted average shares - basic | 55,885,015 | 56,966,661 | 56,556,303 | 57,190,311 | ||||||||||||
Weighted average shares - diluted | 56,588,011 | 58,369,204 | 57,268,946 | 58,830,437 |
3 |
Condensed consolidated balance sheets | December 31, | September 30, | June 30, | December 31, | ||||||||||||
2022 (unaudited) | 2022 (unaudited) | 2022 (unaudited) | 2021 | |||||||||||||
(Dollars in thousands, except per share and share data) | ||||||||||||||||
Assets: | ||||||||||||||||
Cash and cash equivalents | ||||||||||||||||
Cash and due from banks | $ | 24,063 | $ | 22,537 | $ | 12,873 | $ | 5,382 | ||||||||
Interest earning deposits at Federal Reserve Bank | 864,126 | 700,175 | 329,992 | 596,402 | ||||||||||||
Total cash and cash equivalents | 888,189 | 722,712 | 342,865 | 601,784 | ||||||||||||
Investment securities, available-for-sale, at fair value | 766,016 | 790,594 | 826,616 | 953,709 | ||||||||||||
Commercial loans, at fair value | 589,143 | 818,040 | 995,493 | 1,388,416 | ||||||||||||
Loans, net of deferred fees and costs | 5,486,853 | 5,267,375 | 4,754,697 | 3,747,224 | ||||||||||||
Allowance for credit losses | (22,374 | ) | (19,689 | ) | (19,087 | ) | (17,806 | ) | ||||||||
Loans, net | 5,464,479 | 5,247,686 | 4,735,610 | 3,729,418 | ||||||||||||
Federal Home Loan Bank, Atlantic Central Bankers Bank, and Federal Reserve Bank stock | 12,629 | 12,629 | 1,643 | 1,663 | ||||||||||||
Premises and equipment, net | 18,401 | 18,443 | 16,693 | 16,156 | ||||||||||||
Accrued interest receivable | 32,005 | 25,506 | 19,264 | 17,871 | ||||||||||||
Intangible assets, net | 2,049 | 2,149 | 2,248 | 2,447 | ||||||||||||
Other real estate owned | 21,210 | 18,873 | 18,873 | 18,873 | ||||||||||||
Deferred tax asset, net | 19,703 | 27,241 | 23,344 | 12,667 | ||||||||||||
Assets held-for-sale from discontinued operations | — | — | — | 3,268 | ||||||||||||
Other assets | 89,176 | 93,201 | 137,086 | 96,967 | ||||||||||||
Total assets | $ | 7,903,000 | $ | 7,777,074 | $ | 7,119,735 | $ | 6,843,239 | ||||||||
Liabilities: | ||||||||||||||||
Deposits | ||||||||||||||||
Demand and interest checking | $ | 6,559,617 | $ | 5,934,591 | $ | 5,394,562 | $ | 5,561,365 | ||||||||
Savings and money market | 140,496 | 575,381 | 486,189 | 415,546 | ||||||||||||
Time deposits, $100,000 and over | 330,000 | 401,331 | — | — | ||||||||||||
Total deposits | 7,030,113 | 6,911,303 | 5,880,751 | 5,976,911 | ||||||||||||
Securities sold under agreements to repurchase | 42 | 42 | 42 | 42 | ||||||||||||
Short-term borrowings | — | — | 385,000 | — | ||||||||||||
Senior debt | 99,050 | 98,958 | 98,866 | 98,682 | ||||||||||||
Subordinated debenture | 13,401 | 13,401 | 13,401 | 13,401 | ||||||||||||
Other long-term borrowings | 10,028 | 38,928 | 39,125 | 39,521 | ||||||||||||
Other liabilities | 56,335 | 50,704 | 46,014 | 62,228 | ||||||||||||
Total liabilities | $ | 7,208,969 | $ | 7,113,336 | $ | 6,463,199 | $ | 6,190,785 | ||||||||
Shareholders' equity: | ||||||||||||||||
Common stock - authorized, 75,000,000 shares of $1.00 par value; 55,689,627 and 57,370,563 shares issued and outstanding at December 31, 2022 and 2021, respectively | 55,690 | 56,202 | 56,865 | 57,371 | ||||||||||||
Additional paid-in capital | 299,279 | 311,569 | 323,774 | 349,686 | ||||||||||||
Retained earnings | 369,319 | 329,078 | 298,474 | 239,106 | ||||||||||||
Accumulated other comprehensive (loss) income | (30,257 | ) | (33,111 | ) | (22,577 | ) | 6,291 | |||||||||
Total shareholders' equity | 694,031 | 663,738 | 656,536 | 652,454 | ||||||||||||
Total liabilities and shareholders' equity | $ | 7,903,000 | $ | 7,777,074 | $ | 7,119,735 | $ | 6,843,239 |
4 |
Average balance sheet and net interest income | Three months ended December 31, 2022 | Three months ended December 31, 2021 | ||||||||||||||||||||||
(Dollars in thousands; unaudited) | ||||||||||||||||||||||||
Average | Average | Average | Average | |||||||||||||||||||||
Assets: | Balance | Interest | Rate | Balance | Interest | Rate | ||||||||||||||||||
Interest earning assets: | ||||||||||||||||||||||||
Loans, net of deferred fees and costs* | $ | 6,083,587 | $ | 94,477 | 6.21 | % | $ | 4,766,271 | $ | 48,792 | 4.09 | % | ||||||||||||
Leases-bank qualified** | 2,952 | 50 | 6.78 | % | 4,465 | 76 | 6.81 | % | ||||||||||||||||
Investment securities-taxable | 782,046 | 8,483 | 4.34 | % | 954,172 | 5,770 | 2.42 | % | ||||||||||||||||
Investment securities-nontaxable** | 3,559 | 32 | 3.60 | % | 3,558 | 31 | 3.49 | % | ||||||||||||||||
Interest earning deposits at Federal Reserve Bank | 424,255 | 3,886 | 3.66 | % | 208,120 | 65 | 0.12 | % | ||||||||||||||||
Net interest earning assets | 7,296,399 | 106,928 | 5.86 | % | 5,936,586 | 54,734 | 3.69 | % | ||||||||||||||||
Allowance for credit losses | (20,227 | ) | (17,108 | ) | ||||||||||||||||||||
Assets held-for-sale from discontinued operations | — | — | — | 83,821 | 708 | 3.38 | % | |||||||||||||||||
Other assets | 223,692 | 189,760 | ||||||||||||||||||||||
$ | 7,499,864 | $ | 6,193,059 | |||||||||||||||||||||
Liabilities and Shareholders' Equity: | ||||||||||||||||||||||||
Deposits: | ||||||||||||||||||||||||
Demand and interest checking | $ | 5,891,947 | $ | 21,350 | 1.45 | % | $ | 4,931,891 | $ | 1,015 | 0.08 | % | ||||||||||||
Savings and money market | 474,302 | 4,332 | 3.65 | % | 373,381 | 114 | 0.12 | % | ||||||||||||||||
Time deposits | 257,231 | 2,193 | 3.41 | % | — | — | — | |||||||||||||||||
Total deposits | 6,623,480 | 27,875 | 1.68 | % | 5,305,272 | 1,129 | 0.09 | % | ||||||||||||||||
Short-term borrowings | 26,847 | 271 | 4.04 | % | 53,315 | 34 | 0.26 | % | ||||||||||||||||
Repurchase agreements | 42 | — | — | 41 | — | — | ||||||||||||||||||
Long-term borrowings | 38,951 | 498 | 5.11 | % | — | — | — | |||||||||||||||||
Subordinated debentures | 13,401 | 226 | 6.75 | % | 13,401 | 112 | 3.34 | % | ||||||||||||||||
Senior debt | 99,005 | 1,280 | 5.17 | % | 100,419 | 1,280 | 5.10 | % | ||||||||||||||||
Total deposits and liabilities | 6,801,726 | 30,150 | 1.77 | % | 5,472,448 | 2,555 | 0.19 | % | ||||||||||||||||
Other liabilities | 19,254 | 75,395 | ||||||||||||||||||||||
Total liabilities | 6,820,980 | 5,547,843 | ||||||||||||||||||||||
Shareholders' equity | 678,884 | 645,216 | ||||||||||||||||||||||
$ | 7,499,864 | $ | 6,193,059 | |||||||||||||||||||||
Net interest income on tax equivalent basis** | $ | 76,778 | $ | 52,887 | ||||||||||||||||||||
Tax equivalent adjustment | 18 | 22 | ||||||||||||||||||||||
Net interest income | $ | 76,760 | $ | 52,865 | ||||||||||||||||||||
Net interest margin ** | 4.21 | % | 3.51 | % |
* Includes commercial loans, at fair value. All periods include non-accrual loans.
** Full taxable equivalent basis, using a statutory Federal tax rate of 21% for 2022 and 2021.
NOTE: In the table above, interest on loans for 2022 and 2021 includes $12,000 and $991,000, respectively, of interest and fees on PPP loans.
5 |
Average balance sheet and net interest income | Year ended December 31, 2022 | Year ended December 31, 2021 | ||||||||||||||||||||||
(Dollars in thousands; unaudited) | ||||||||||||||||||||||||
Average | Average | Average | Average | |||||||||||||||||||||
Assets: | Balance | Interest | Rate | Balance | Interest | Rate | ||||||||||||||||||
Interest earning assets: | ||||||||||||||||||||||||
Loans, net of deferred fees and costs* | $ | 5,670,957 | $ | 275,651 | 4.86 | % | $ | 4,597,977 | $ | 192,338 | 4.18 | % | ||||||||||||
Leases-bank qualified** | 3,479 | 235 | 6.75 | % | 5,557 | 377 | 6.78 | % | ||||||||||||||||
Investment securities-taxable | 855,629 | 25,598 | 2.99 | % | 1,059,229 | 28,661 | 2.71 | % | ||||||||||||||||
Investment securities-nontaxable** | 3,559 | 125 | 3.51 | % | 3,757 | 130 | 3.46 | % | ||||||||||||||||
Interest earning deposits at Federal Reserve Bank | 479,791 | 6,762 | 1.41 | % | 637,056 | 715 | 0.11 | % | ||||||||||||||||
Net interest earning assets | 7,013,415 | 308,371 | 4.40 | % | 6,303,576 | 222,221 | 3.53 | % | ||||||||||||||||
Allowance for credit losses | (19,374 | ) | (16,469 | ) | ||||||||||||||||||||
Assets held for sale from discontinued operations | — | — | — | 95,527 | 3,096 | 3.24 | % | |||||||||||||||||
Other assets | 213,491 | 217,476 | ||||||||||||||||||||||
$ | 7,207,532 | $ | 6,600,110 | |||||||||||||||||||||
Liabilities and Shareholders' Equity: | ||||||||||||||||||||||||
Deposits: | ||||||||||||||||||||||||
Demand and interest checking | $ | 5,670,818 | $ | 39,872 | 0.70 | % | $ | 5,321,283 | $ | 5,022 | 0.09 | % | ||||||||||||
Savings and money market | 510,370 | 8,524 | 1.67 | % | 427,708 | 601 | 0.14 | % | ||||||||||||||||
Time deposits | 86,907 | 2,740 | 3.15 | % | — | — | — | |||||||||||||||||
Total deposits | 6,268,095 | 51,136 | 0.82 | % | 5,748,991 | 5,623 | 0.10 | % | ||||||||||||||||
Short-term borrowings | 60,312 | 1,538 | 2.55 | % | 19,958 | 49 | 0.25 | % | ||||||||||||||||
Repurchase agreements | 41 | — | — | 41 | — | — | ||||||||||||||||||
Long-term borrowings | 39,202 | 1,004 | 2.56 | % | — | — | — | |||||||||||||||||
Subordinated debentures | 13,401 | 658 | 4.91 | % | 13,401 | 449 | 3.35 | % | ||||||||||||||||
Senior debt | 98,865 | 5,118 | 5.18 | % | 100,283 | 5,118 | 5.10 | % | ||||||||||||||||
Total deposits and liabilities | 6,479,916 | 59,454 | 0.92 | % | 5,882,674 | 11,239 | 0.19 | % | ||||||||||||||||
Other liabilities | 54,374 | 100,627 | ||||||||||||||||||||||
Total liabilities | 6,534,290 | 5,983,301 | ||||||||||||||||||||||
Shareholders' equity | 673,242 | 616,809 | ||||||||||||||||||||||
$ | 7,207,532 | $ | 6,600,110 | |||||||||||||||||||||
Net interest income on tax equivalent basis** | $ | 248,917 | $ | 214,078 | ||||||||||||||||||||
Tax equivalent adjustment | 76 | 106 | ||||||||||||||||||||||
Net interest income | $ | 248,841 | $ | 213,972 | ||||||||||||||||||||
Net interest margin ** | 3.55 | % | 3.35 | % |
* Includes commercial loans, at fair value. All periods include non-accrual loans.
** Full taxable equivalent basis, using a statutory Federal tax rate of 21% for 2022 and 2021.
NOTE: In the table above, the 2021 interest on loans reflects $4.6 million of interest and fees which were earned on a short-term line of credit to another institution to initially fund PPP loans, which did not materially increase average loans or assets and which are not expected to recur. Interest on loans for 2022 and 2021 includes $514,000 and $5.8 million, respectively, of interest and fees on PPP loans.
6 |
Allowance for credit losses | Year ended | |||||||
December 31, | December 31, | |||||||
2022 (unaudited) | 2021 | |||||||
(Dollars in thousands) | ||||||||
Balance in the allowance for credit losses at beginning of period (1) | $ | 17,806 | $ | 16,082 | ||||
Loans charged-off: | ||||||||
SBA non-real estate | 885 | 1,138 | ||||||
SBA commercial mortgage | — | 417 | ||||||
Direct lease financing | 576 | 412 | ||||||
SBLOC | — | 15 | ||||||
Consumer - home equity | — | 10 | ||||||
Consumer - other | — | 14 | ||||||
Total | 1,461 | 2,006 | ||||||
Recoveries: | ||||||||
SBA non-real estate | 140 | 51 | ||||||
SBA commercial mortgage | — | 9 | ||||||
Direct lease financing | 124 | 58 | ||||||
Consumer - home equity | — | 1,099 | ||||||
Other loans | 24 | — | ||||||
Total | 288 | 1,217 | ||||||
Net charge-offs | 1,173 | 789 | ||||||
Provision for credit losses, excluding commitment provision | 5,741 | 2,513 | ||||||
Balance in allowance for credit losses at end of period | $ | 22,374 | $ | 17,806 | ||||
Net charge-offs/average loans | 0.03 | % | 0.03 | % | ||||
Net charge-offs/average assets | 0.02 | % | 0.01 | % |
(1) Excludes activity from discontinued operations.
7 |
Loan portfolio | December 31, | September 30, | June 30, | December 31, | ||||||||||||
2022 (unaudited) | 2022 (unaudited) | 2022 (unaudited) | 2021 | |||||||||||||
(Dollars in thousands) | ||||||||||||||||
SBL non-real estate | $ | 108,954 | $ | 116,080 | $ | 112,854 | $ | 147,722 | ||||||||
SBL commercial mortgage | 474,496 | 429,865 | 425,219 | 361,171 | ||||||||||||
SBL construction | 30,864 | 26,841 | 27,042 | 27,199 | ||||||||||||
Small business loans | 614,314 | 572,786 | 565,115 | 536,092 | ||||||||||||
Direct lease financing | 632,160 | 599,796 | 583,086 | 531,012 | ||||||||||||
SBLOC / IBLOC * | 2,332,469 | 2,369,106 | 2,274,256 | 1,929,581 | ||||||||||||
Advisor financing ** | 172,468 | 168,559 | 155,235 | 115,770 | ||||||||||||
Real estate bridge loans | 1,669,031 | 1,488,119 | 1,106,875 | 621,702 | ||||||||||||
Other loans *** | 61,679 | 64,980 | 63,514 | 5,014 | ||||||||||||
5,482,121 | 5,263,346 | 4,748,081 | 3,739,171 | |||||||||||||
Unamortized loan fees and costs | 4,732 | 4,029 | 6,616 | 8,053 | ||||||||||||
Total loans, including unamortized fees and costs | $ | 5,486,853 | $ | 5,267,375 | $ | 4,754,697 | $ | 3,747,224 |
Small business portfolio | December 31, | September 30, | June 30, | December 31, | ||||||||||||
2022 (unaudited) | 2022 (unaudited) | 2022 (unaudited) | 2021 | |||||||||||||
(Dollars in thousands) | ||||||||||||||||
SBL, including unamortized fees and costs | $ | 621,641 | $ | 579,156 | $ | 571,559 | $ | 541,437 | ||||||||
SBL, included in loans, at fair value | 146,717 | 159,914 | 168,579 | 199,585 | ||||||||||||
Total small business loans **** | $ | 768,358 | $ | 739,070 | $ | 740,138 | $ | 741,022 |
* Securities Backed Lines of Credit, or SBLOC, are collateralized by marketable securities, while Insurance Backed Lines of Credit, or IBLOC, are collateralized by the cash surrender value of eligible life insurance policies.
** In 2020, we began originating loans to investment advisors for purposes of debt refinance, acquisition of another firm or internal succession. Maximum loan amounts are subject to 70% of the estimated business enterprise value, based on a third-party valuation, but may be increased depending upon the debt service coverage ratio. Personal guarantees and blanket business liens are obtained as appropriate.
*** Includes demand deposit overdrafts reclassified as loan balances totaling $2.6 million and $322,000 at December 31, 2022 and December 31, 2021, respectively. Estimated overdraft charge-offs and recoveries are reflected in the allowance for credit losses and have been immaterial.
****The small business loans held at fair value are comprised of the government guaranteed portion of certain SBA loans at the dates indicated.
Small business loans as of December 31, 2022
Loan principal | ||||
(Dollars in millions) | ||||
U.S. government guaranteed portion of SBA loans (a) | $ | 375 | ||
Paycheck Protection Program loans (PPP) (a) | 5 | |||
Commercial mortgage SBA (b) | 248 | |||
Construction SBA (c) | 10 | |||
Non-guaranteed portion of U.S. government guaranteed loans (d) | 100 | |||
Non-SBA small business loans | 23 | |||
Total principal | $ | 761 | ||
Unamortized fees and costs | 7 | |||
Total small business loans | $ | 768 |
(a) This is the portion of SBA 7a loans (7a) and PPP loans that have been guaranteed by the U.S. government, and therefore are assumed to have no credit risk.
(b) Substantially all these loans are made under the SBA 504 Fixed Asset Financing program (504) which dictates origination date loan to value percentages (LTV), generally 50-60%, to which the Bank adheres.
(c) Of the $10 million in Construction SBA loans, $9 million are 504 first mortgages with an origination date LTV of 50-60% and $1 million are SBA interim loans with an approved SBA post-construction full takeout/payoff.
(d) The $100 million represents the unguaranteed portion of 7a loans which are generally 70% or more guaranteed by the U.S. government. 7a loans are not made on the basis of real estate LTV; however, they are subject to SBA's "All Available Collateral" rule which mandates that to the extent a borrower or its 20% or greater principals have available collateral (including personal residences), the collateral must be pledged to fully collateralize the loan, after applying SBA-determined liquidation rates. In addition, all 7a and 504 loans require the personal guaranty of all 20% or greater owners.
8 |
Small business loans by type as of December 31, 2022
(Excludes government guaranteed portion of SBA 7a loans and PPP loans)
SBL commercial mortgage* | SBL construction* | SBL non-real estate | Total | % Total | ||||||||||||||||
(Dollars in millions) | ||||||||||||||||||||
Hotels and motels | $ | 79 | $ | — | $ | — | $ | 79 | 21 | % | ||||||||||
Car washes | 18 | 1 | — | 19 | 5 | % | ||||||||||||||
Full-service restaurants | 12 | 3 | 2 | 17 | 4 | % | ||||||||||||||
Lessors of nonresidential buildings | 16 | — | — | 16 | 4 | % | ||||||||||||||
Child day care services | 14 | — | 1 | 15 | 4 | % | ||||||||||||||
Outpatient mental health and substance abuse centers | 15 | — | — | 15 | 4 | % | ||||||||||||||
Funeral homes and funeral services | 10 | — | — | 10 | 3 | % | ||||||||||||||
Assisted living facilities for the elderly | 10 | — | — | 10 | 3 | % | ||||||||||||||
Offices of lawyers | 9 | — | — | 9 | 2 | % | ||||||||||||||
Packaged frozen food merchant wholesalers | 9 | — | — | 9 | 2 | % | ||||||||||||||
Gasoline stations with convenience stores | 8 | — | — | 8 | 2 | % | ||||||||||||||
Lessors of other real estate property | 8 | — | — | 8 | 2 | % | ||||||||||||||
Fitness and recreational sports centers | 6 | — | 2 | 8 | 2 | % | ||||||||||||||
General warehousing and storage | 7 | — | — | 7 | 2 | % | ||||||||||||||
Plumbing, heating, and air-conditioning contractors | 6 | — | 1 | 7 | 2 | % | ||||||||||||||
Limited-service restaurants | 1 | 2 | 2 | 5 | 1 | % | ||||||||||||||
Other miscellaneous durable goods merchant wholesalers | 5 | — | — | 5 | 1 | % | ||||||||||||||
Lessors of residential buildings and dwellings | 5 | — | — | 5 | 1 | % | ||||||||||||||
Other spectator sports | 5 | — | — | 5 | 1 | % | ||||||||||||||
All other amusement and recreation industries | 4 | — | — | 4 | 1 | % | ||||||||||||||
Gas stations | 4 | — | — | 4 | 1 | % | ||||||||||||||
Offices of dentists | 3 | 1 | — | 4 | 1 | % | ||||||||||||||
Other warehousing and storage | 3 | — | — | 3 | 1 | % | ||||||||||||||
Vocational rehabilitation services | 3 | — | — | 3 | 1 | % | ||||||||||||||
Other** | 74 | 3 | 29 | 106 | 29 | % | ||||||||||||||
Total | $ | 334 | $ | 10 | $ | 37 | $ | 381 | 100 | % |
* Of the SBL commercial mortgage and SBL construction loans, $85 million represents the total of the non-guaranteed portion of SBA 7a loans and non-SBA loans. The balance of those categories represents SBA 504 loans with 50%-60% origination date loan-to-values.
**Loan types less than $3 million are spread over a hundred different classifications such as Commercial Printing, Pet and Pet Supplies Stores, Securities Brokerage, etc.
9 |
State diversification as of December 31, 2022
(Excludes government guaranteed portion of SBA 7a loans and PPP loans)
SBL commercial mortgage* | SBL construction* | SBL non-real estate | Total | % Total | |||||||||||
(Dollars in millions) | |||||||||||||||
Florida | $ | 65 | $ | — | $ | 4 | $ | 69 | 18% | ||||||
California | 61 | 3 | 3 | 67 | 18% | ||||||||||
North Carolina | 40 | 7 | 2 | 49 | 13% | ||||||||||
New York | 25 | — | 5 | 30 | 8% | ||||||||||
Pennsylvania | 18 | — | 1 | 19 | 5% | ||||||||||
Georgia | 15 | — | 2 | 17 | 4% | ||||||||||
Illinois | 15 | — | 1 | 16 | 4% | ||||||||||
New Jersey | 12 | — | 3 | 15 | 4% | ||||||||||
Texas | 12 | — | 3 | 15 | 4% | ||||||||||
Tennessee | 14 | — | — | 14 | 4% | ||||||||||
Colorado | 12 | — | 1 | 13 | 3% | ||||||||||
Ohio | 11 | — | 1 | 12 | 3% | ||||||||||
Connecticut | 10 | — | 1 | 11 | 3% | ||||||||||
Virginia | 8 | — | 1 | 9 | 2% | ||||||||||
Michigan | 4 | — | 1 | 5 | 1% | ||||||||||
Other States | 12 | — | 8 | 20 | 6% | ||||||||||
Total | $ | 334 | $ | 10 | $ | 37 | $ | 381 | 100% | ||||||
* Of the SBL commercial mortgage and SBL construction loans, $85 million represents the total of the non-guaranteed portion of SBA 7a loans and non-SBA loans. The balance of those categories represents SBA 504 loans with 50%-60% origination date loan-to-values.
Top 10 loans as of December 31, 2022
Type | State | SBL commercial mortgage | |||||
(Dollars in millions) | |||||||
Mental health and substance abuse center | FL | $ | 10 | ||||
Hotel | FL | 9 | |||||
Lawyer's office | CA | 8 | |||||
General warehousing and storage | PA | 7 | |||||
Hotel | NC | 7 | |||||
Hotel | FL | 6 | |||||
Hotel | NY | 6 | |||||
Hotel | NC | 5 | |||||
Mental health and substance abuse center | CT | 5 | |||||
Assisted living facility | FL | 5 | |||||
Total | $ | 68 | |||||
10 |
Commercial real estate loans, excluding SBA loans, are as follows including LTV at origination:
Type as of December 31, 2022
Type | # Loans | Balance | Weighted average origination date LTV | Weighted average interest rate | ||||||
(Dollars in millions) | ||||||||||
Real estate bridge loans (multi-family apartment loans recorded at amortized cost)* | 130 | $ | 1,669 | 72% | 7.69% | |||||
Non-SBA commercial real estate loans, at fair value: | ||||||||||
Multi-family (apartment bridge loans)* | 22 | $ | 354 | 76% | 7.52% | |||||
Hospitality (hotels and lodging) | 4 | 36 | 65% | 8.00% | ||||||
Retail | 3 | 42 | 72% | 7.30% | ||||||
Other | 3 | 11 | 73% | 5.20% | ||||||
32 | 443 | 74% | 7.48% | |||||||
Fair value adjustment | (1) | |||||||||
Total non-SBA commercial real estate loans, at fair value | 442 | |||||||||
Total commercial real estate loans | $ | 2,111 | 73% | 7.65% |
*In the third quarter of 2021, we resumed the origination of multi-family apartment loans. These are similar to the multi-family apartment loans carried at fair value, but at origination are intended to be held on the balance sheet, so are not accounted for at fair value.
State diversification as of December 31, 2022 | 15 largest loans as of December 31, 2022 | ||||||||||||||
State | Balance | Origination date LTV | State | Balance | Origination date LTV | ||||||||||
(Dollars in millions) | (Dollars in millions) | ||||||||||||||
Texas | $ | 760 | 74% | Texas | $ | 42 | 75% | ||||||||
Georgia | 232 | 71% | Texas | 39 | 75% | ||||||||||
Florida | 217 | 71% | Texas | 39 | 79% | ||||||||||
Ohio | 95 | 69% | Texas | 39 | 72% | ||||||||||
Tennessee | 98 | 72% | Tennessee | 37 | 72% | ||||||||||
Alabama | 62 | 72% | Texas | 37 | 80% | ||||||||||
Michigan | 72 | 70% | Michigan | 36 | 62% | ||||||||||
Other States each <$55 million | 575 | 74% | Florida | 32 | 72% | ||||||||||
Total | $ | 2,111 | 74% | Texas | 32 | 67% | |||||||||
Michigan | 31 | 79% | |||||||||||||
Tennessee | 30 | 71% | |||||||||||||
Missouri | 30 | 72% | |||||||||||||
Texas | 30 | 62% | |||||||||||||
Ohio | 29 | 74% | |||||||||||||
Texas | 29 | 77% | |||||||||||||
15 Largest loans | $ | 512 | 73% |
11 |
Institutional banking loans outstanding at December 31, 2022
Type | Principal | % of total | ||||
(Dollars in millions) | ||||||
Securities backed lines of credit (SBLOC) | $ | 1,209 | 48 | % | ||
Insurance backed lines of credit (IBLOC) | 1,124 | 45 | % | |||
Advisor financing | 172 | 7 | % | |||
Total | $ | 2,505 | 100 | % |
For SBLOC, we generally lend up to 50% of the value of equities and 80% for investment grade securities. While equities have fallen in excess of 30% in recent years, the reduction in collateral value of brokerage accounts collateralizing SBLOCs generally has been less, for two reasons. First, many collateral accounts are “balanced” and accordingly have a component of debt securities, which have either not decreased in value as much as equities, or in some cases may have increased in value. Secondly, many of these accounts have the benefit of professional investment advisors who provided some protection against market downturns, through diversification and other means. Additionally, borrowers often utilize only a portion of collateral value, which lowers the percentage of principal to collateral.
Top 10 SBLOC loans at December 31, 2022
Principal amount | % Principal to collateral | |||
(Dollars in millions) | ||||
$ | 20 | 55% | ||
18 | 41% | |||
13 | 32% | |||
9 | 34% | |||
9 | 66% | |||
9 | 45% | |||
9 | 62% | |||
8 | 73% | |||
7 | 38% | |||
6 | 39% | |||
Total and weighted average | $ | 108 | 48% |
Insurance backed lines of credit (IBLOC)
IBLOC loans are backed by the cash value of eligible life insurance policies which have been assigned to us. We generally lend up to 95% of such cash value. Our underwriting standards require approval of the insurance companies which carry the policies backing these loans. Currently, nine insurance companies have been approved and, as of December 31, 2022, all were rated A- or better by AM BEST.
12 |
Direct lease financing* by type as of December 31, 2022
Principal balance | % Total | ||||||
(Dollars in millions) | |||||||
Construction | $ | 115 | 18 | % | |||
Government agencies and public institutions** | 99 | 16 | % | ||||
Waste management and remediation services | 69 | 11 | % | ||||
Real estate and rental and leasing | 59 | 9 | % | ||||
Retail trade | 49 | 8 | % | ||||
Transportation and warehousing | 33 | 5 | % | ||||
Health care and social assistance | 32 | 5 | % | ||||
Finance and insurance | 31 | 5 | % | ||||
Professional, scientific, and technical services | 19 | 3 | % | ||||
Manufacturing | 18 | 3 | % | ||||
Wholesale trade | 18 | 3 | % | ||||
Educational services | 8 | 1 | % | ||||
Mining, quarrying, and gas extraction | 4 | 1 | % | ||||
Other | 78 | 12 | % | ||||
Total | $ | 632 | 100 | % |
* Of the total $632 million of direct lease financing, $555 million consisted of vehicle leases with the remaining balance consisting of equipment leases..
** Includes public universities and school districts.
Direct lease financing by state as of December 31, 2022
State | Principal balance | % Total | ||||
(Dollars in millions) | ||||||
Florida | $ | 88 | 14 | % | ||
California | 68 | 11 | % | |||
Utah | 65 | 10 | % | |||
New Jersey | 42 | 7 | % | |||
Pennsylvania | 41 | 6 | % | |||
New York | 29 | 5 | % | |||
North Carolina | 29 | 5 | % | |||
Texas | 28 | 4 | % | |||
Maryland | 27 | 4 | % | |||
Connecticut | 23 | 4 | % | |||
Washington | 16 | 3 | % | |||
Idaho | 15 | 2 | % | |||
Georgia | 14 | 2 | % | |||
Illinois | 12 | 2 | % | |||
Ohio | 11 | 2 | % | |||
Other States | 124 | 19 | % | |||
Total | $ | 632 | 100 | % |
13 |
Capital ratios | Tier 1 capital | Tier 1 capital | Total capital | Common equity | ||||||||||||
to average | to risk-weighted | to risk-weighted | tier 1 to risk | |||||||||||||
assets ratio | assets ratio | assets ratio | weighted assets | |||||||||||||
As of December 31, 2022 | ||||||||||||||||
The Bancorp, Inc. | 9.63 | % | 13.40 | % | 13.87 | % | 13.40 | % | ||||||||
The Bancorp Bank, National Association | 10.73 | % | 14.95 | % | 15.42 | % | 14.95 | % | ||||||||
"Well capitalized" institution (under federal regulations-Basel III) | 5.00 | % | 8.00 | % | 10.00 | % | 6.50 | % | ||||||||
As of December 31, 2021 | ||||||||||||||||
The Bancorp, Inc. | 10.40 | % | 14.72 | % | 15.13 | % | 14.72 | % | ||||||||
The Bancorp Bank, National Association | 10.98 | % | 15.48 | % | 15.88 | % | 15.48 | % | ||||||||
"Well capitalized" institution (under federal regulations-Basel III) | 5.00 | % | 8.00 | % | 10.00 | % | 6.50 | % |
Three months ended | Year ended | |||||||||||||||
December 31, | December 31, | |||||||||||||||
2022 | 2021 | 2022 | 2021 | |||||||||||||
Selected operating ratios | ||||||||||||||||
Return on average assets (1) | 2.13 | % | 1.73 | % | 1.81 | % | 1.68 | % | ||||||||
Return on average equity (1) | 23.52 | % | 16.60 | % | 19.34 | % | 17.94 | % | ||||||||
Net interest margin | 4.21 | % | 3.51 | % | 3.55 | % | 3.35 | % |
(1) Annualized
Book value per share table | December 31, | September 30, | June 30, | December 31, | |||||||
2022 | 2022 | 2022 | 2021 | ||||||||
Book value per share | $ | 12.46 | $ | 11.81 | $ | 11.55 | $ | 11.37 |
Loan quality table | December 31, | September 30, | June 30, | December 31, | ||||||||||||
2022 | 2022 | 2022 | 2021 | |||||||||||||
(Dollars in thousands) | ||||||||||||||||
Nonperforming loans to total loans | 0.33 | % | 0.16 | % | 0.18 | % | 0.10 | % | ||||||||
Nonperforming assets to total assets | 0.50 | % | 0.35 | % | 0.39 | % | 0.33 | % | ||||||||
Allowance for credit losses to total loans | 0.41 | % | 0.37 | % | 0.40 | % | 0.48 | % | ||||||||
Nonaccrual loans (1) | $ | 10,356 | $ | 3,860 | $ | 3,698 | $ | 3,161 | ||||||||
Loans 90 days past due still accruing interest (2) | 7,775 | 4,415 | 4,848 | 461 | ||||||||||||
Other real estate owned | 21,210 | 18,873 | 18,873 | 18,873 | ||||||||||||
Total nonperforming assets | $ | 39,341 | $ | 27,148 | $ | 27,419 | $ | 22,495 |
(1) | Of the $10.4 million of nonaccrual loans at December 31, 2022, $3.1 million were guaranteed under various SBA loan programs, with the majority of such loans classified as nonaccrual in the fourth quarter of 2022. The majority of the balance of the increase in that quarter resulted from $3.1 million representing 78 vehicles from one leasing relationship which were marked to their estimated market value. |
(2) | The majority of the fourth quarter increase resulted from $2.0 million for an IBLOC loan which is in process of pay-off from the cash value of life insurance, and $878,000 from an SBLOC loan which was brought current in January 2023. To the extent that IBLOC loans become non-performing or are not repaid by borrowers, the Bank can utilize the related cash value of life insurance collateral for loan repayment. Similarly, marketable securities collateralizing SBLOC loans may be sold to repay those loans. |
Gross dollar volume (GDV) (1) | Three months ended | ||||||||||
December 31, | September 30, | June 30, | December 31, | ||||||||
2022 | 2022 | 2022 | 2021 | ||||||||
(Dollars in thousands) | |||||||||||
Prepaid and debit card GDV | $ | 28,066,895 | $ | 28,119,428 | $ | 28,394,897 | $ | 24,821,576 |
(1) Gross dollar volume represents the total dollar amount spent on prepaid and debit cards issued by The Bancorp Bank, N.A.
14 |
Business line quarterly summary |
Quarter ended December 31, 2022 |
(Dollars in millions) |
Balances | |||||||||||||||
% Growth | |||||||||||||||
Major business lines | Average approximate rates * | Balances ** | Year over year | Linked quarter annualized | |||||||||||
Loans | |||||||||||||||
Institutional banking *** | 5.3% | $ | 2,505 | 22% | (5)% | ||||||||||
Small business lending**** | 6.1% | 768 | 10% | 17% | |||||||||||
Leasing | 6.3% | 632 | 19% | 22% | |||||||||||
Commercial real estate (non-SBA loans, at fair value) | 7.3% | 443 | nm | nm | |||||||||||
Real estate bridge loans (recorded at book value) | 7.4% | 1,669 | nm | nm | |||||||||||
Weighted average yield | 6.2% | $ | 6,017 | Non-interest income | |||||||||||
% Growth | |||||||||||||||
Deposits: Fintech solutions group | Current quarter | Year over year | |||||||||||||
Prepaid and debit card issuance, and other payments | 1.8% | $ | 5,685 | 15% | nm | $ | 21.8 | 10 | % | ||||||
* Average rates are for the quarter ended December 31, 2022.
** Loan and deposit categories are respectively based on period-end and average quarterly balances.
*** Institutional Banking loans are comprised of security backed lines of credit (SBLOC), collateralized by marketable securities, insurance backed lines of credit (IBLOC), collateralized by the cash surrender value of eligible life insurance policies, and investment advisor financing.
**** Small Business Lending is substantially comprised of SBA loans. Loan growth percentages exclude short-term PPP loans.
15 |
Exhibit 99.2
JANUARY 2023 THE BANCORP INVESTOR PRESENTATION
2 FORWARD LOOKING STATEMENTS & OTHER DISCLOSURES DISCLOSURES Statements in this presentation regarding The Bancorp, Inc.’s (“The Bancorp”) business that are not historical facts or concern our earnings guidance or 2030 plan are “forward - looking statements”. These statements may be identified by the use of forward - looking terminology, including the words “may,” “believe,” “will,” “expect,” “anticipate,” “estimate,” “intend,” “plan," or similar words, and are based on current expectations about important economic, political, and technological factors, among others, and are subject to risks and uncertainties, which could cause the actual results, events or achievements to differ materially from those set forth in or implied by the forward - looking statements and related assumptions. These risks and uncertainties include those relating to the on - going COVID - 19 pandemic, the impact it will have on the company’s business and the industry as a whole, and the resulting governmental and societal responses. 2023 guidance and long - term financial targets in this presentation assume achievement of management’s credit roadmap growth goals as described herein and other growth goals. If such assumptions are not met, guidance and long - term financial targets might not be reached. For further discussion of these risks and uncertainties, see the “risk factors” sections contained, in The Bancorp’s Annual Report on Form 10 - K for the year ended December 31, 2021 and in its other public filings with the SEC. In addition, these forward - looking statements are based upon assumptions with respect to future strategies and decisions that are subject to change. Actual results may differ materially from the anticipated results discussed in these forward - looking statements. The forward - looking statements speak only as of the date of this presentation. The Bancorp does not undertake to publicly revise or update forward - looking statements in this presentation to reflect events or circumstances that arise after the date of this presentation, except as may be required under applicable law. This presentation contains information regarding financial results that is calculated and presented on the basis of methodologies other than in accordance with accounting principles generally accepted in the United States (“GAAP”), such as those identified in the Appendix. As a result, such information may not conform to SEC Regulation S - X and may be adjusted and presented differently in filings with the SEC. Any non - GAAP financial measures used in this presentation are in addition to, and should not be considered superior to, or a substitute for, financial statements prepared in accordance with GAAP. Non - GAAP financial measures are subject to significant inherent limitations. The non - GAAP measures presented herein may not be comparable to similar non - GAAP measures presented by other companies. This information may be presented differently in future filings by The Bancorp with the SEC. This presentation may contain statistics and other data that in some cases has been obtained from or compiled from information made available by third - party service providers. The Bancorp makes no representation or warranty, express or implied, with respect to the accuracy, reasonableness or completeness of such information. Past performance is not indicative nor a guarantee of future results. Copies of the documents filed by The Bancorp with the SEC are available free of charge from the website of the SEC at www.sec.gov as well as on The Bancorp’s website at www.thebancorp.com . This presentation is for information purposes only and shall not constitute an offer to sell or the solicitation of an offer to buy any securities. Neither the SEC nor any other regulatory body has approved or disapproved of the securities of The Bancorp or passed upon the accuracy or adequacy of this presentation. Any representation to the contrary is a criminal offense.
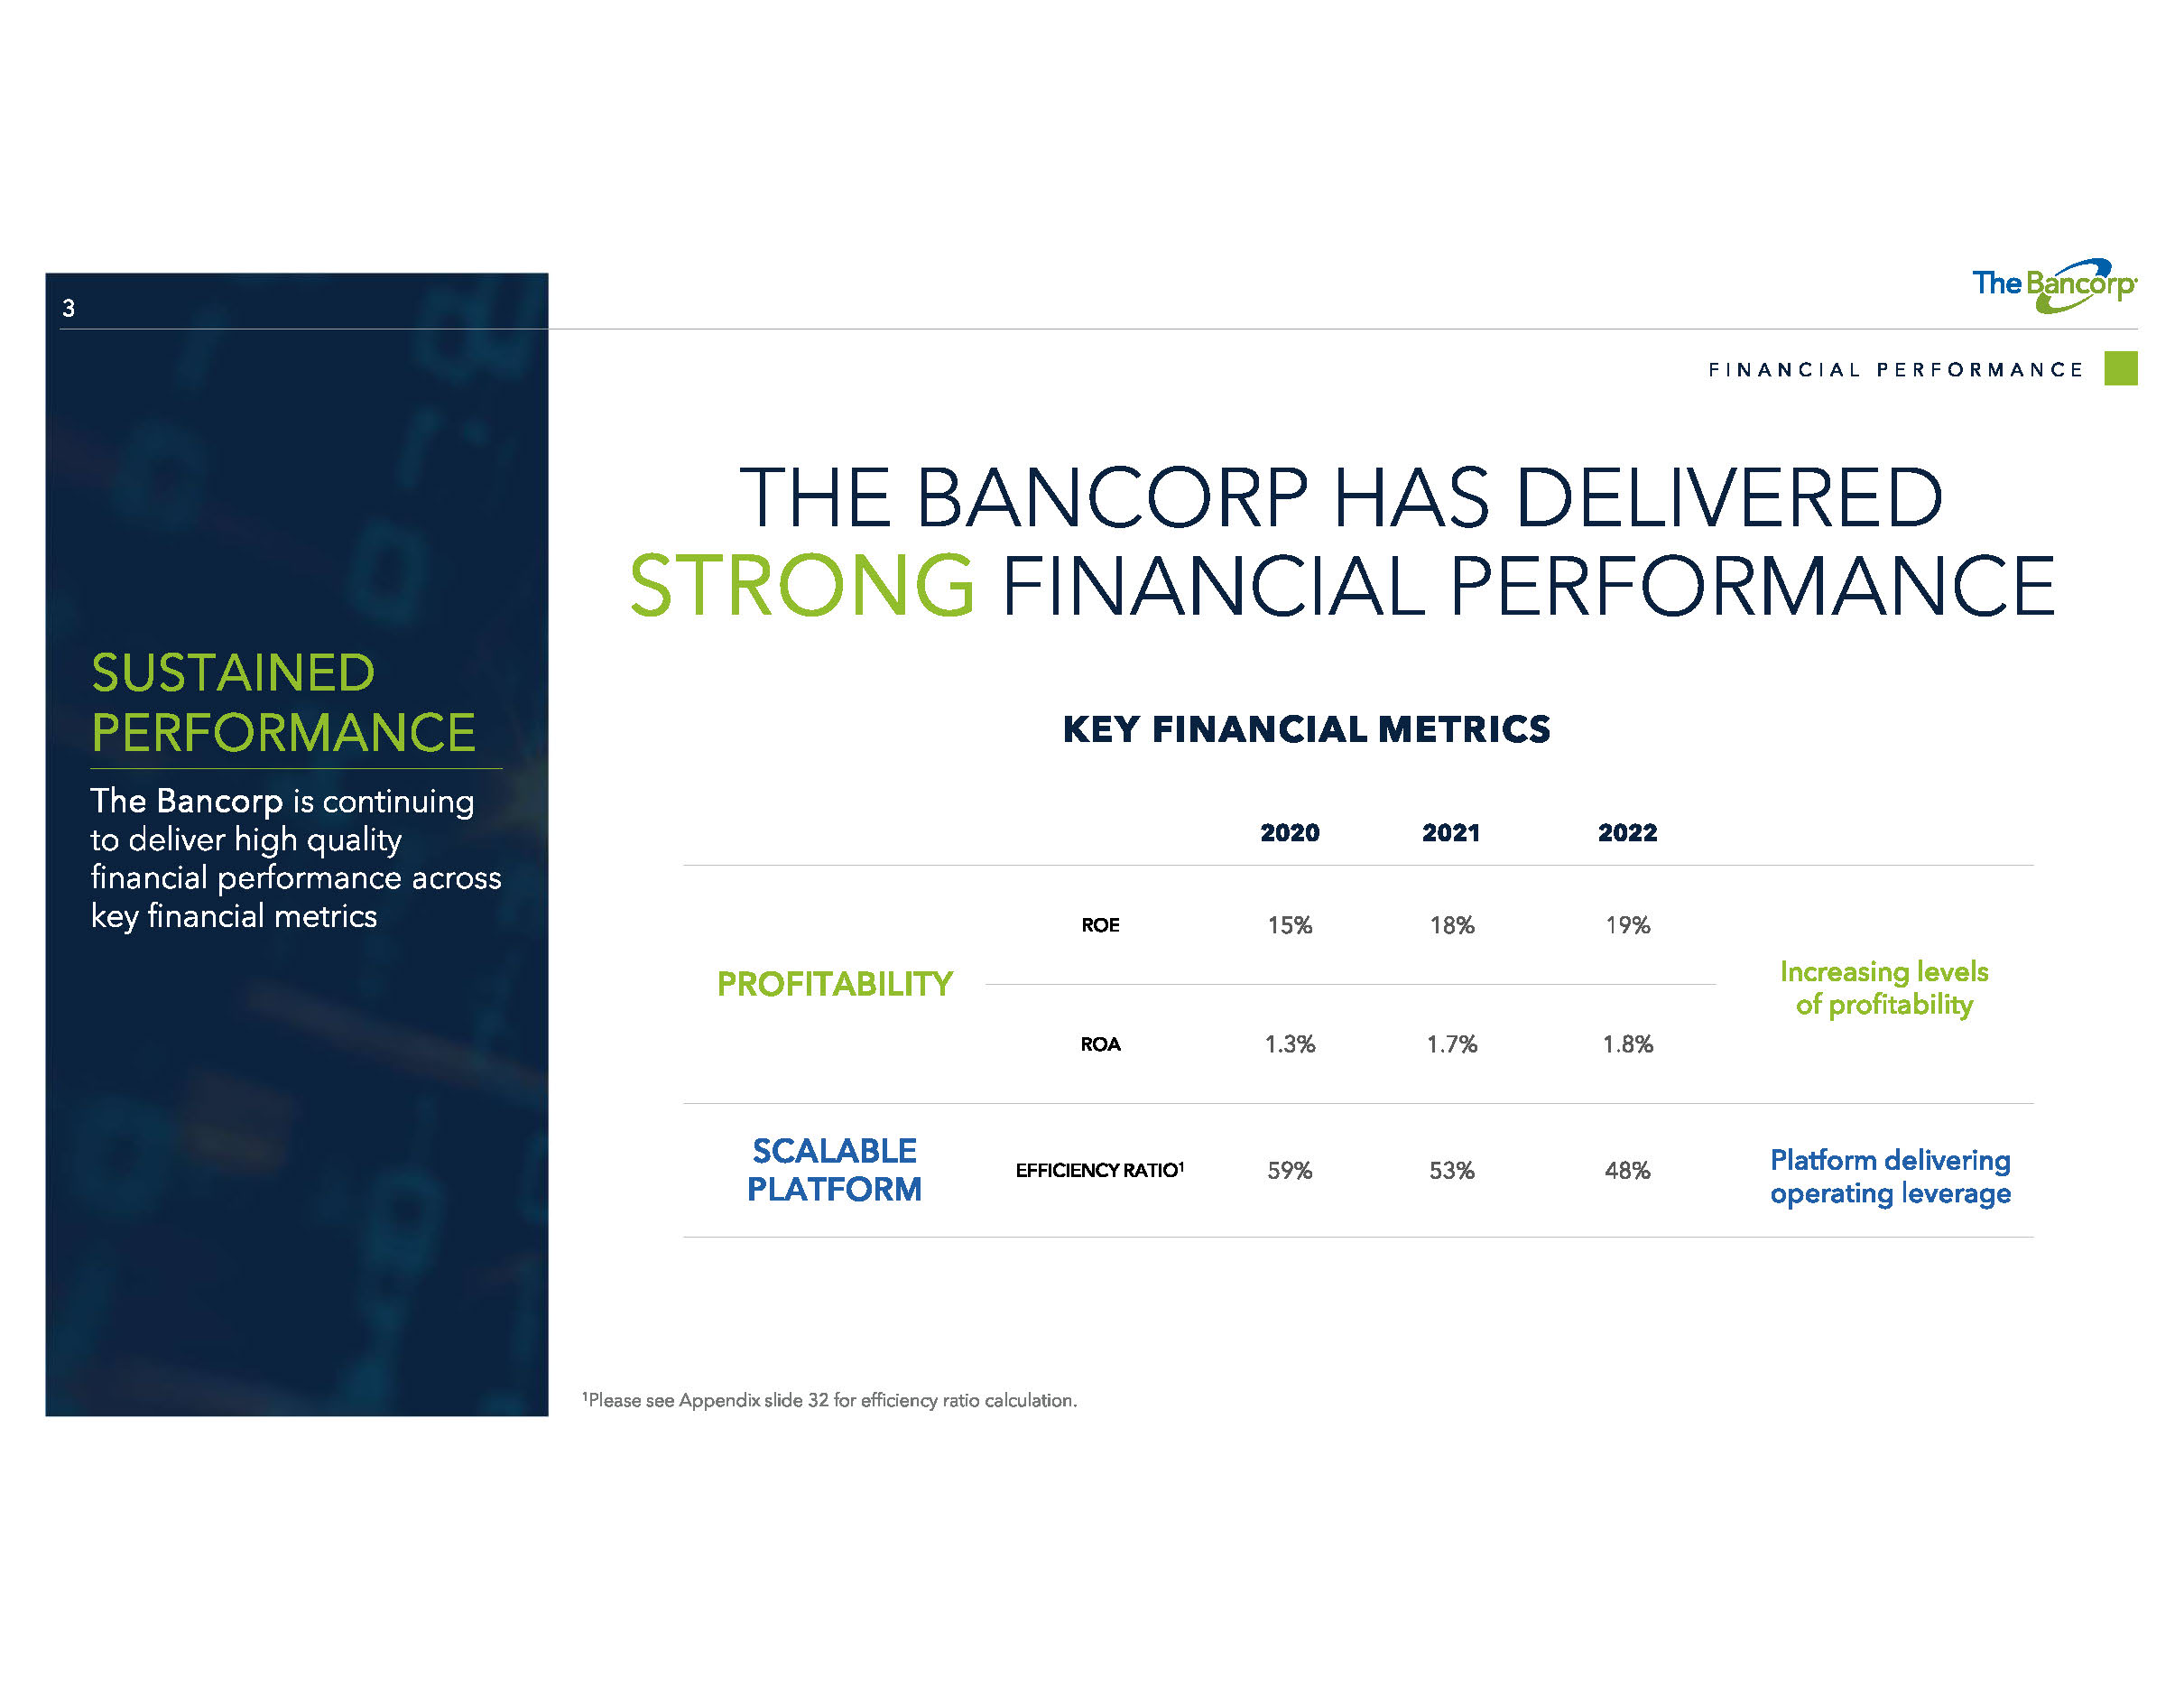
3 THE BANCORP HAS DELIVERED STRONG FINANCIAL PERFORMANCE 2020 2021 2022 PROFITABILITY ROE 15% 18% 19% ROA 1.3% 1.7% 1.8% SCALABLE PLATFORM EFFICIENCY RATIO 1 59% 53% 48% KEY FINANCIAL METRICS Increasing levels of profitability Platform delivering operating leverage FINANCIAL PERFORMANCE SUSTAINED PERFORMANCE The Bancorp is continuing to deliver high quality financial performance across key financial metrics 1 Please see Appendix slide 32 for efficiency ratio calculation.
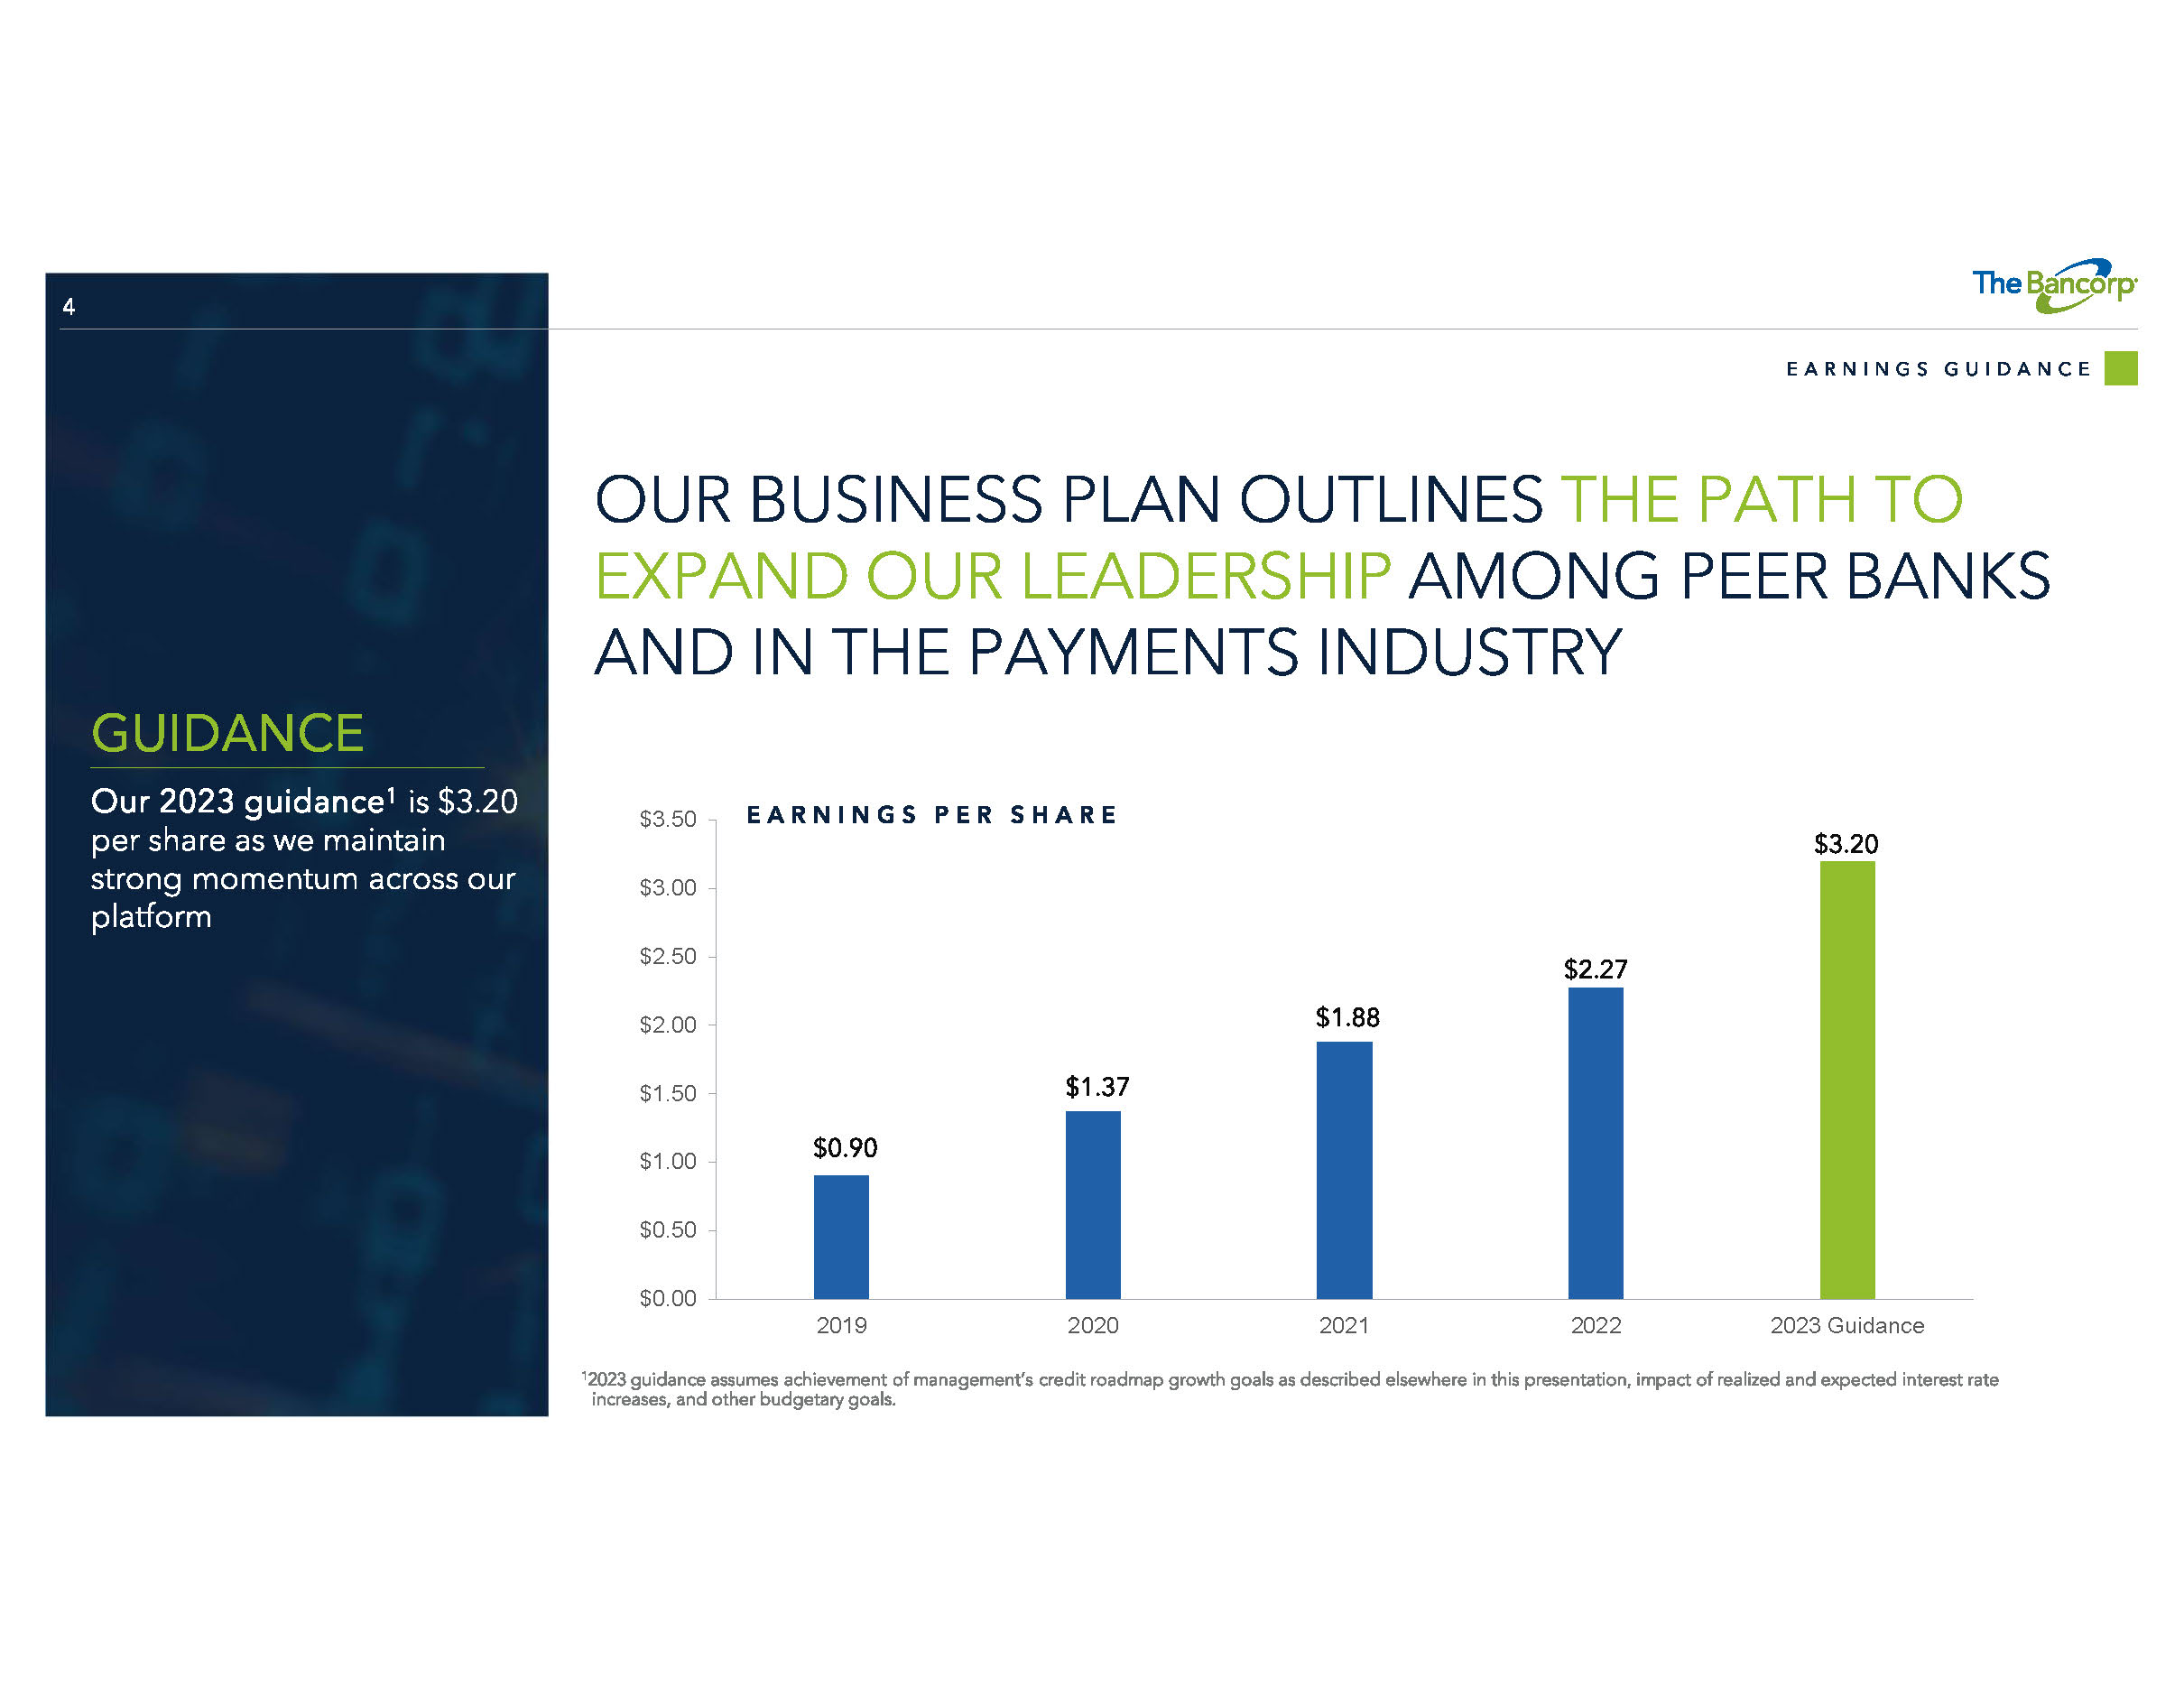
4 OUR BUSINESS PLAN OUTLINES THE PATH TO EXPAND OUR LEADERSHIP AMONG PEER BANKS AND IN THE PAYMENTS INDUSTRY $0.00 $0.50 $1.00 $1.50 $2.00 $2.50 $3.00 $3.50 2019 2020 2021 2022 2023 Guidance EARNINGS PER SHARE EARNINGS GUIDANCE GUIDANCE Our 2023 guidance 1 is $3.20 per share as we maintain strong momentum across our platform 1 2023 guidance assumes achievement of management’s credit roadmap growth goals as described elsewhere in this presentation, im pac t of realized and expected interest rate increases, and other budgetary goals. $0.90 $1.37 $1.88 $2.27 $3.20
5 FINANCIAL INDUSTRY LEADER FORTUNE 100 FASTEST GROWING COMPANY RANKED #28 OCT. 2020 FORUM OF EXECUTIVE WOMEN Champion of Board Diversity Honoree OCT. 2022 IPA CONSUMER CHAMPION APR. 2021 NILSON REPORT RANKED #1 PREPAID CARD ISSUER JUNE 2021 EQUAL OPPORTUNITY PUBLICATION TOP EMPLOYER READERS CHOICE MAR. 2021 – RANKED #29 MAR. 2020 – RANKED #46 S&P SMALL CAP 600 ADDED TO RATING MAY 2021 INDUSTRY LEADERSHIP NILSON REPORT RANKED #8 DEBIT ISSUING BANK APRIL 2021 RECOGNIZED PERFORMANCE At The Bancorp, we strive for excellence and have been recognized in the market as a leader across a variety of industry rankings BANK DIRECTOR RANKING BANKING RANKED #1 >$5B Assets 1 1 Ranked #3 for full Bank Director Ranking Banking universe.
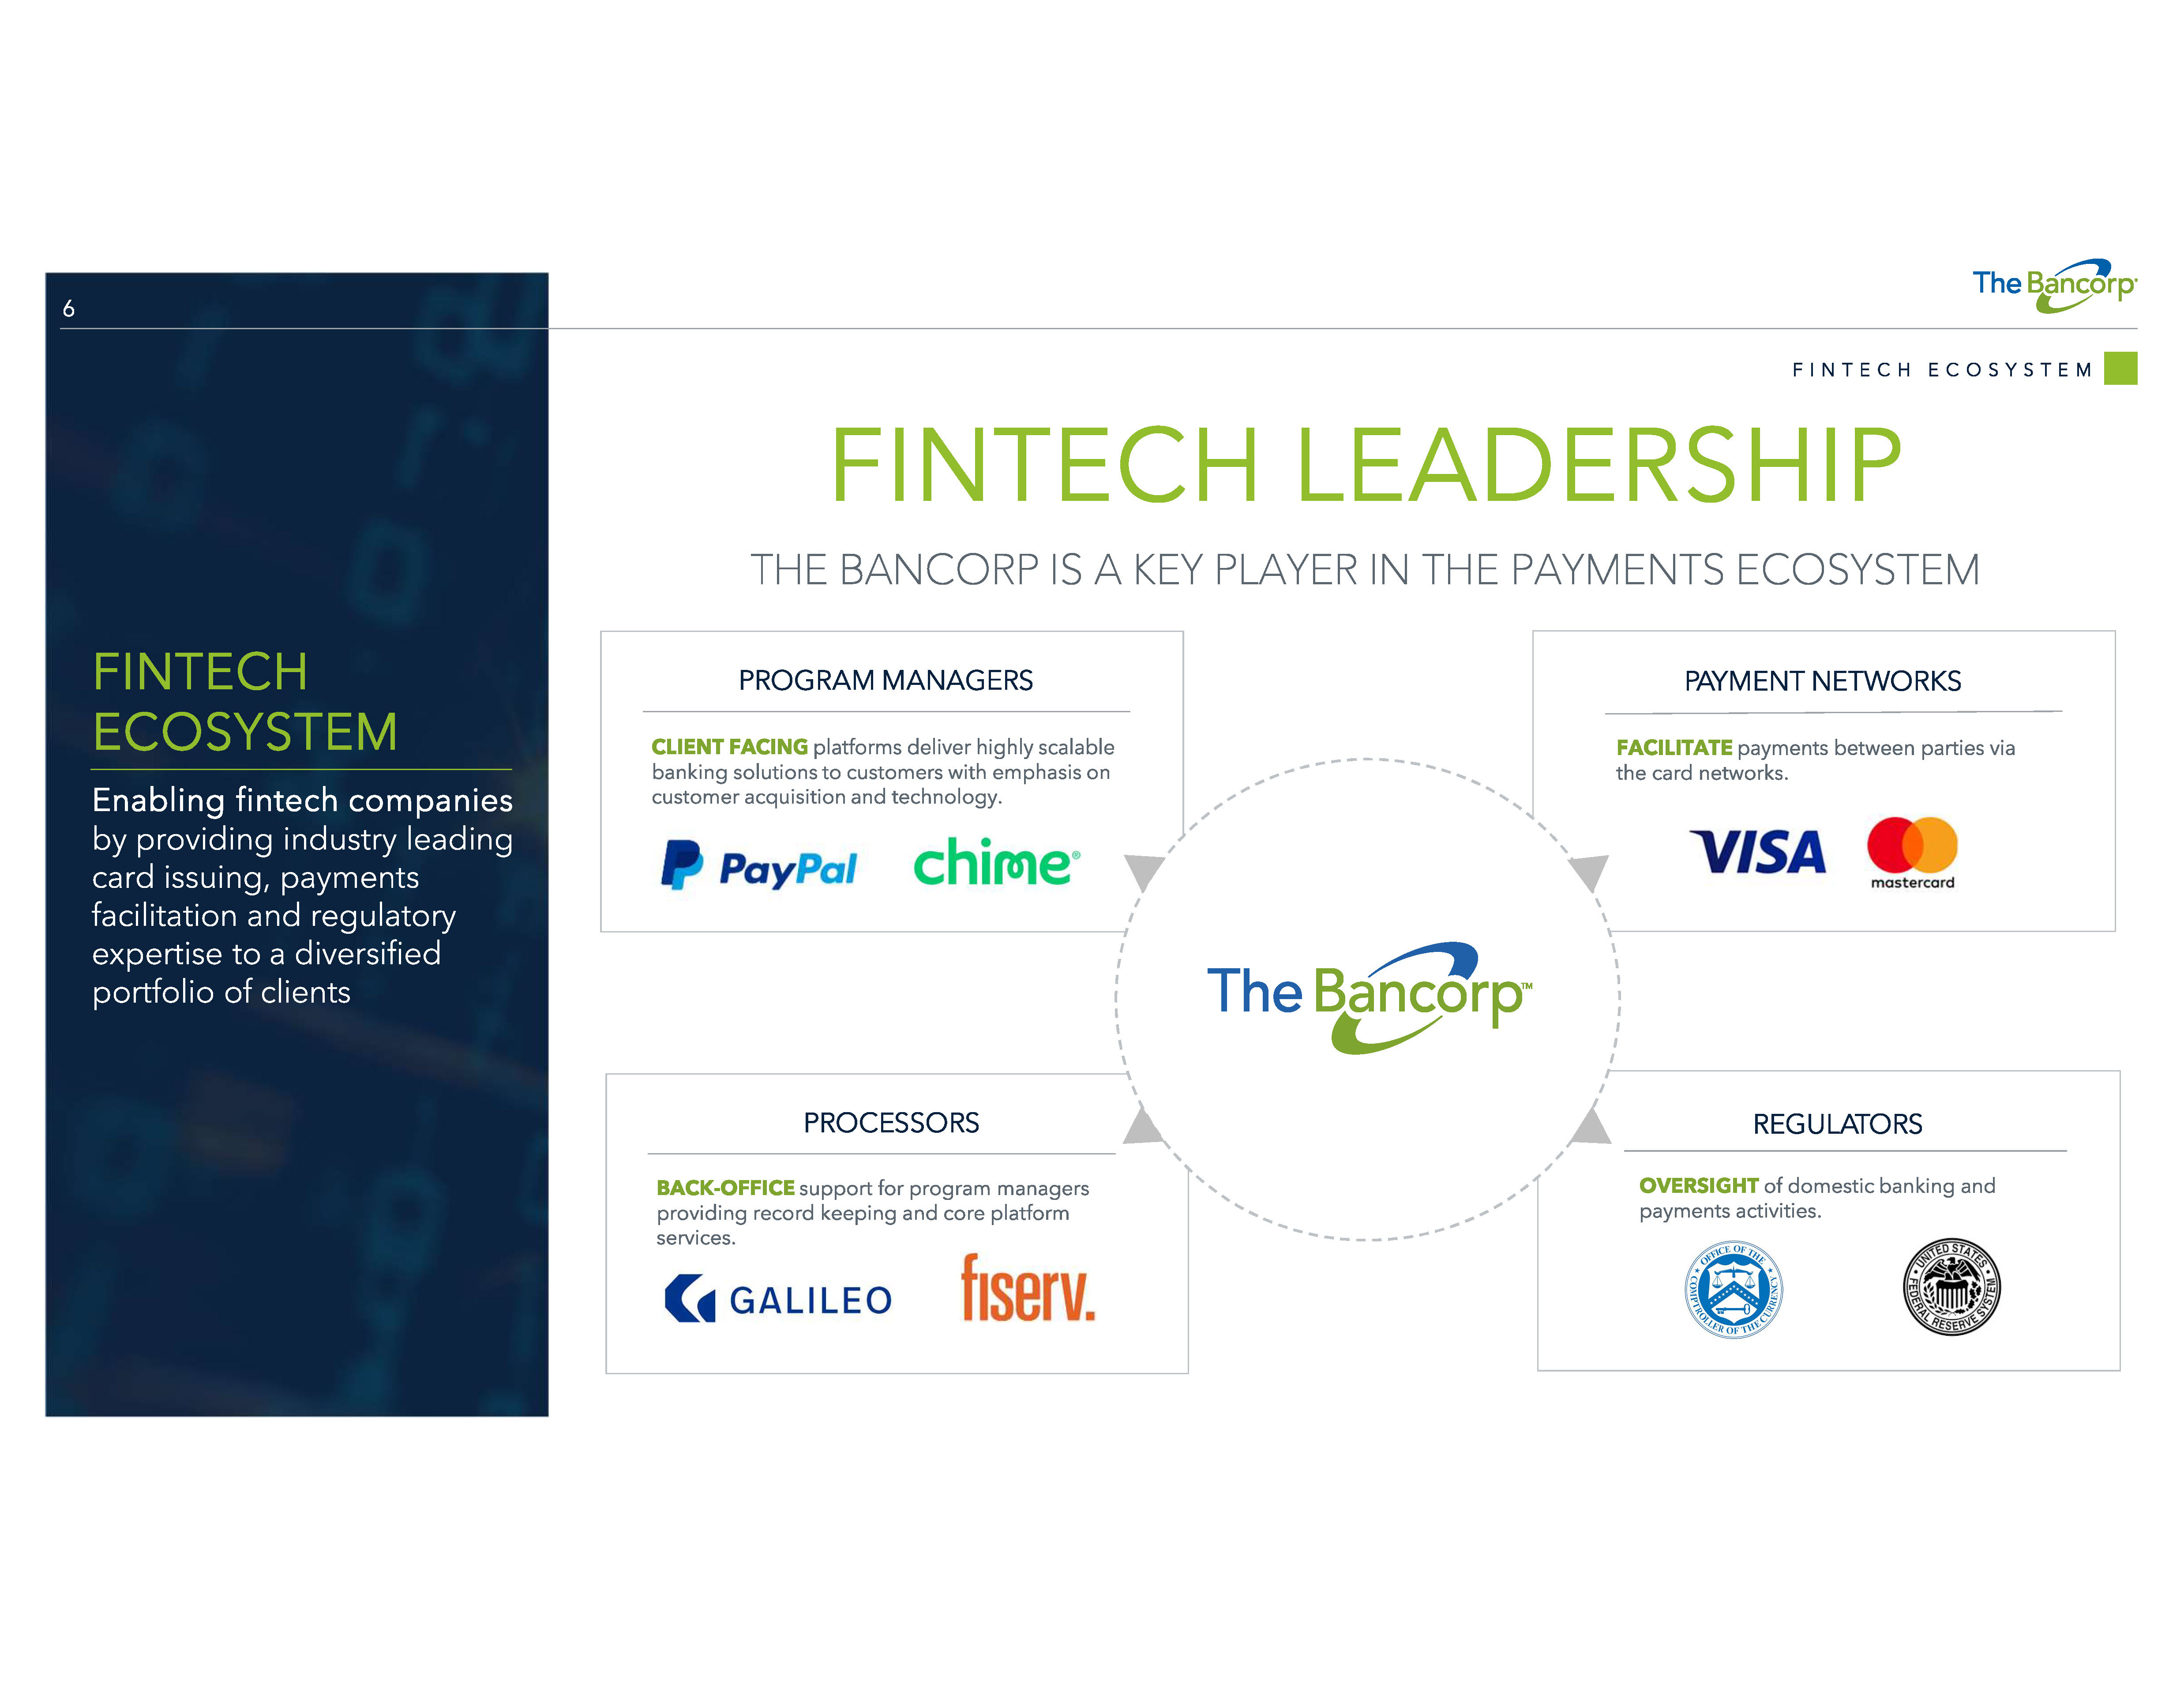
6 FINTECH LEADERSHIP THE BANCORP IS A KEY PLAYER IN THE PAYMENTS ECOSYSTEM FINTECH ECOSYSTEM Enabling fintech companies by providing industry leading card issuing, payments facilitation and regulatory expertise to a diversified portfolio of clients PAYMENT NETWORKS FACILITATE payments between parties via the card networks. PROGRAM MANAGERS CLIENT FACING platforms deliver highly scalable banking solutions to customers with emphasis on customer acquisition and technology. REGULATORS OVERSIGHT of domestic banking and payments activities. PROCESSORS BACK - OFFICE support for program managers providing record keeping and core platform services. FINTECH ECOSYSTEM
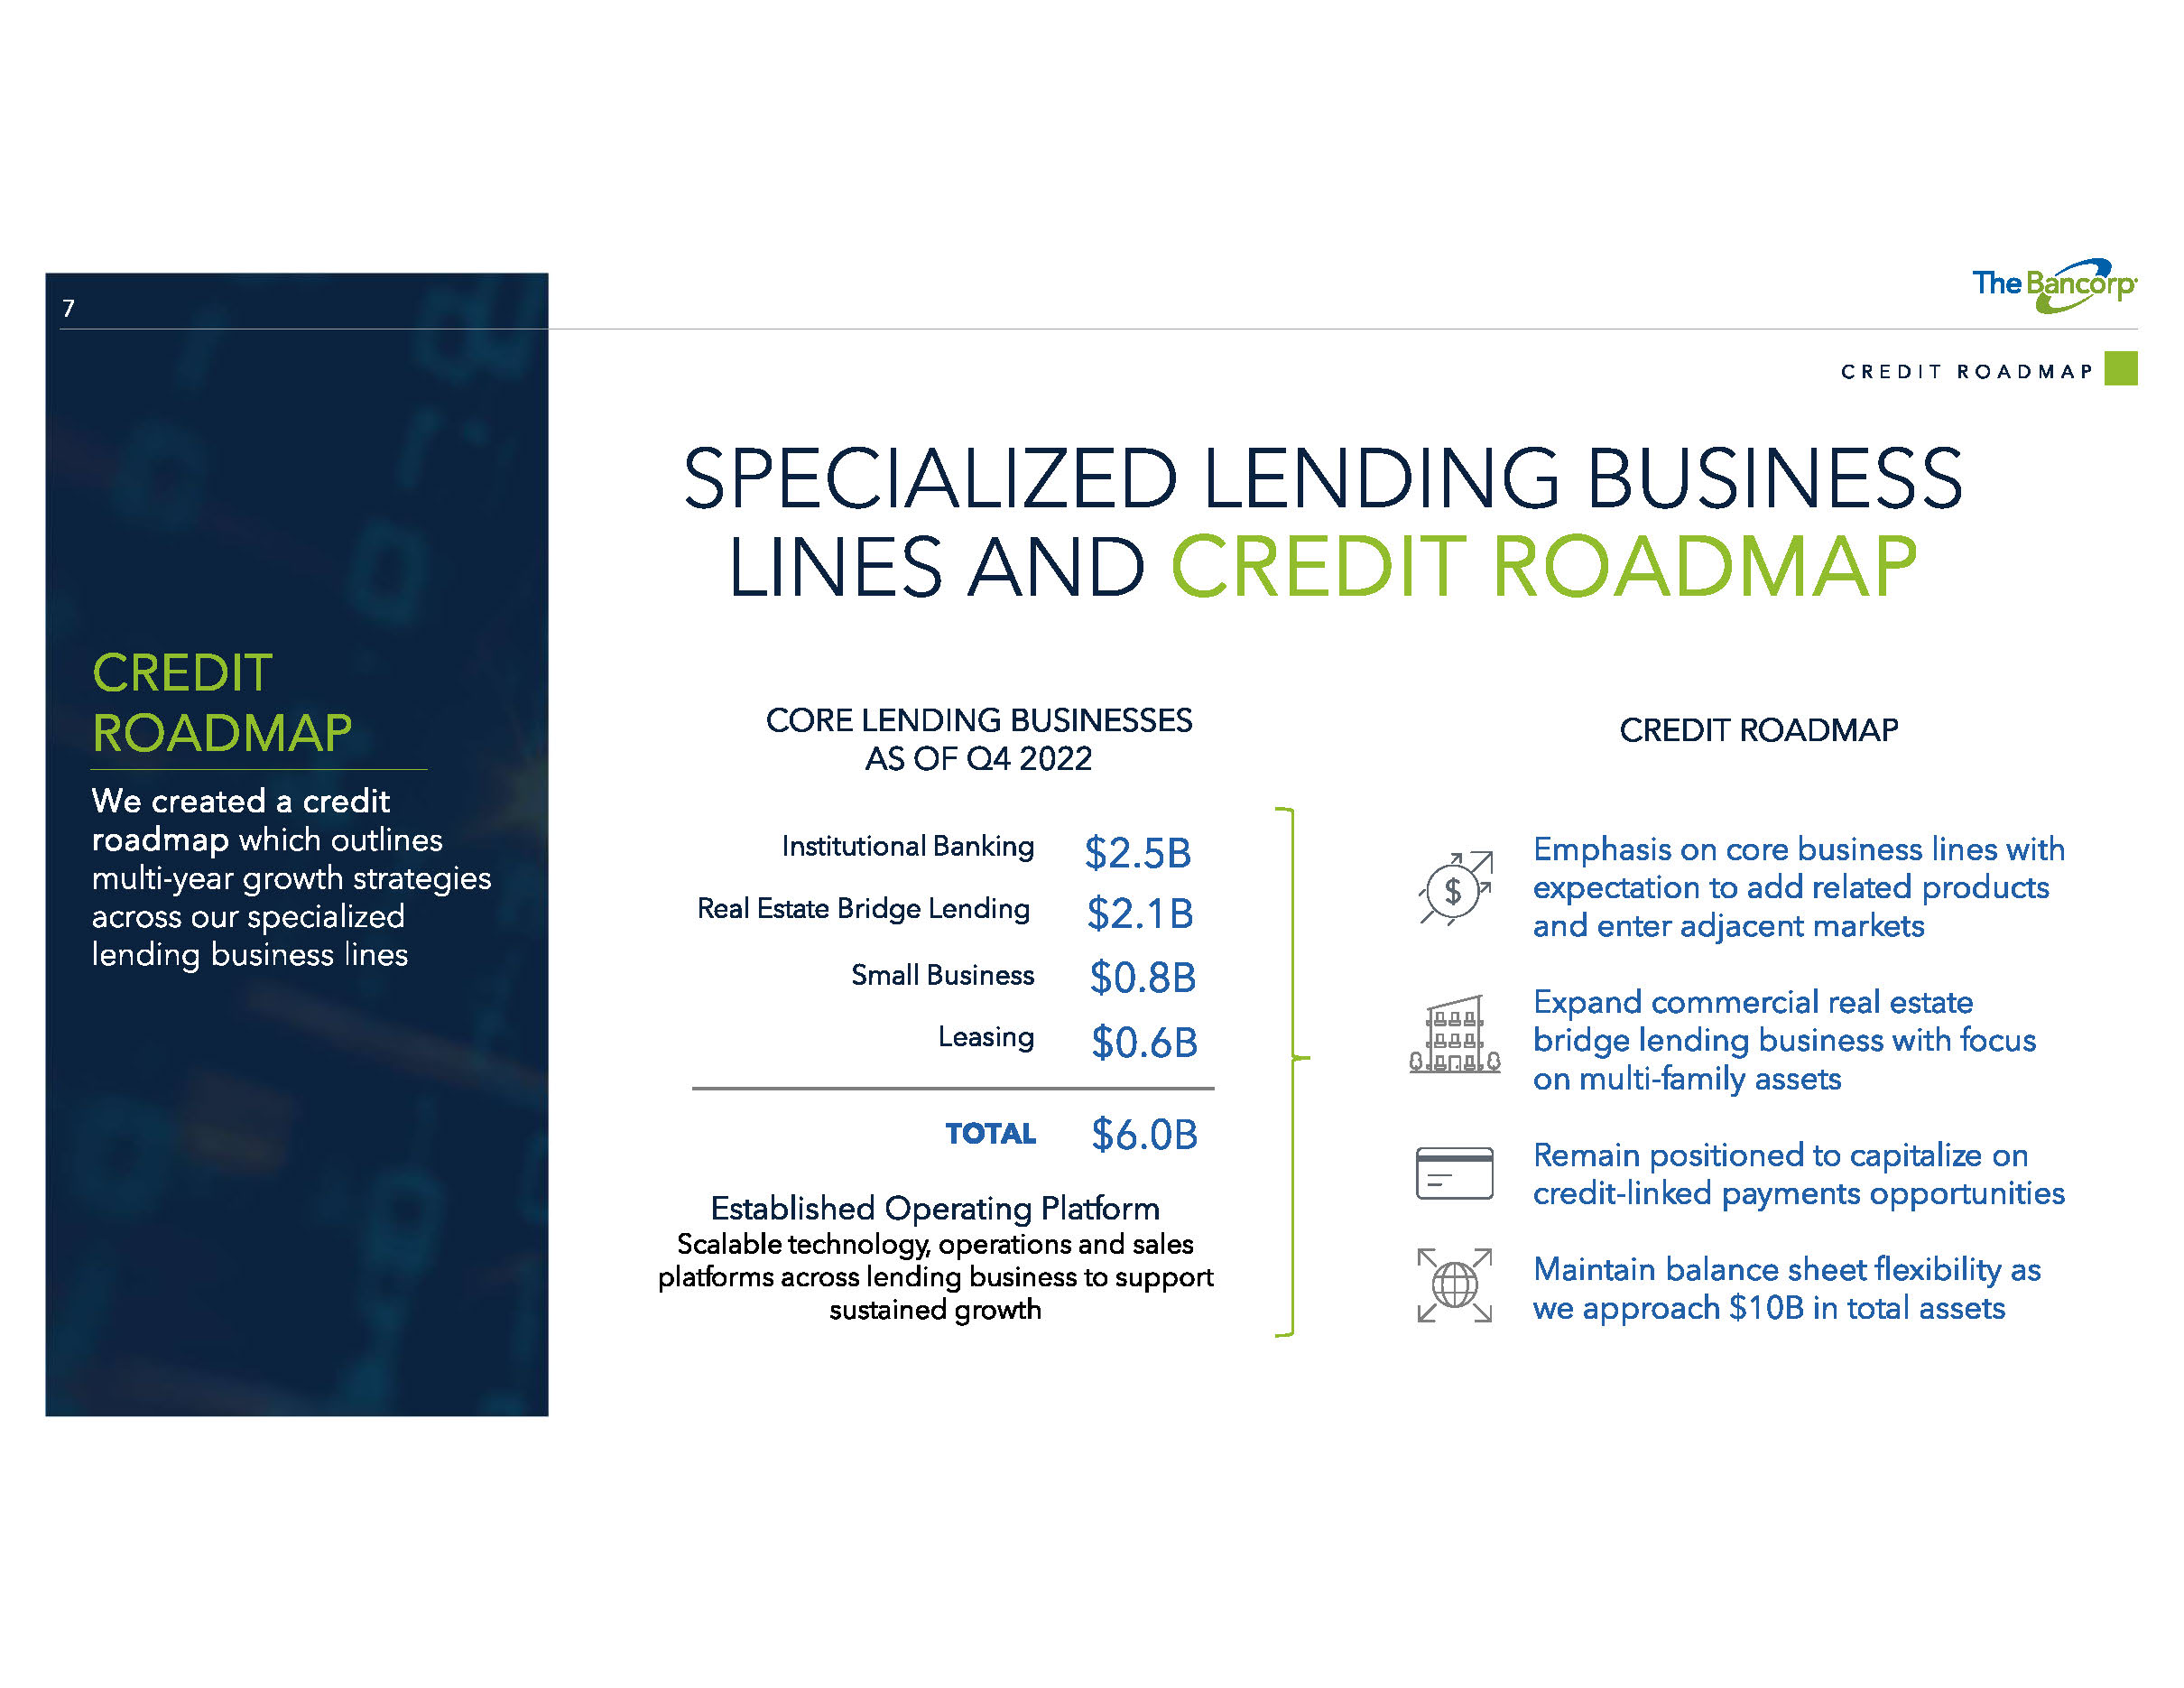
7 SPECIALIZED LENDING BUSINESS LINES AND CREDIT ROADMAP Real Estate Bridge Lending $2.1B Emphasis on core business lines with expectation to add related products and enter adjacent markets Expand commercial real estate bridge lending business with focus on multi - family assets Remain positioned to capitalize on credit - linked payments opportunities Maintain balance sheet flexibility as we approach $10B in total assets Institutional Banking $2.5B Small Business $0.8B Leasing $ 0.6B CORE LENDING BUSINESSES AS OF Q4 2022 TOTAL $ 6.0 B Established Operating Platform Scalable technology, operations and sales platforms across lending business to support sustained growth CREDIT ROADMAP CREDIT ROADMAP CREDIT ROADMAP We created a credit roadmap which outlines multi - year growth strategies across our specialized lending business lines
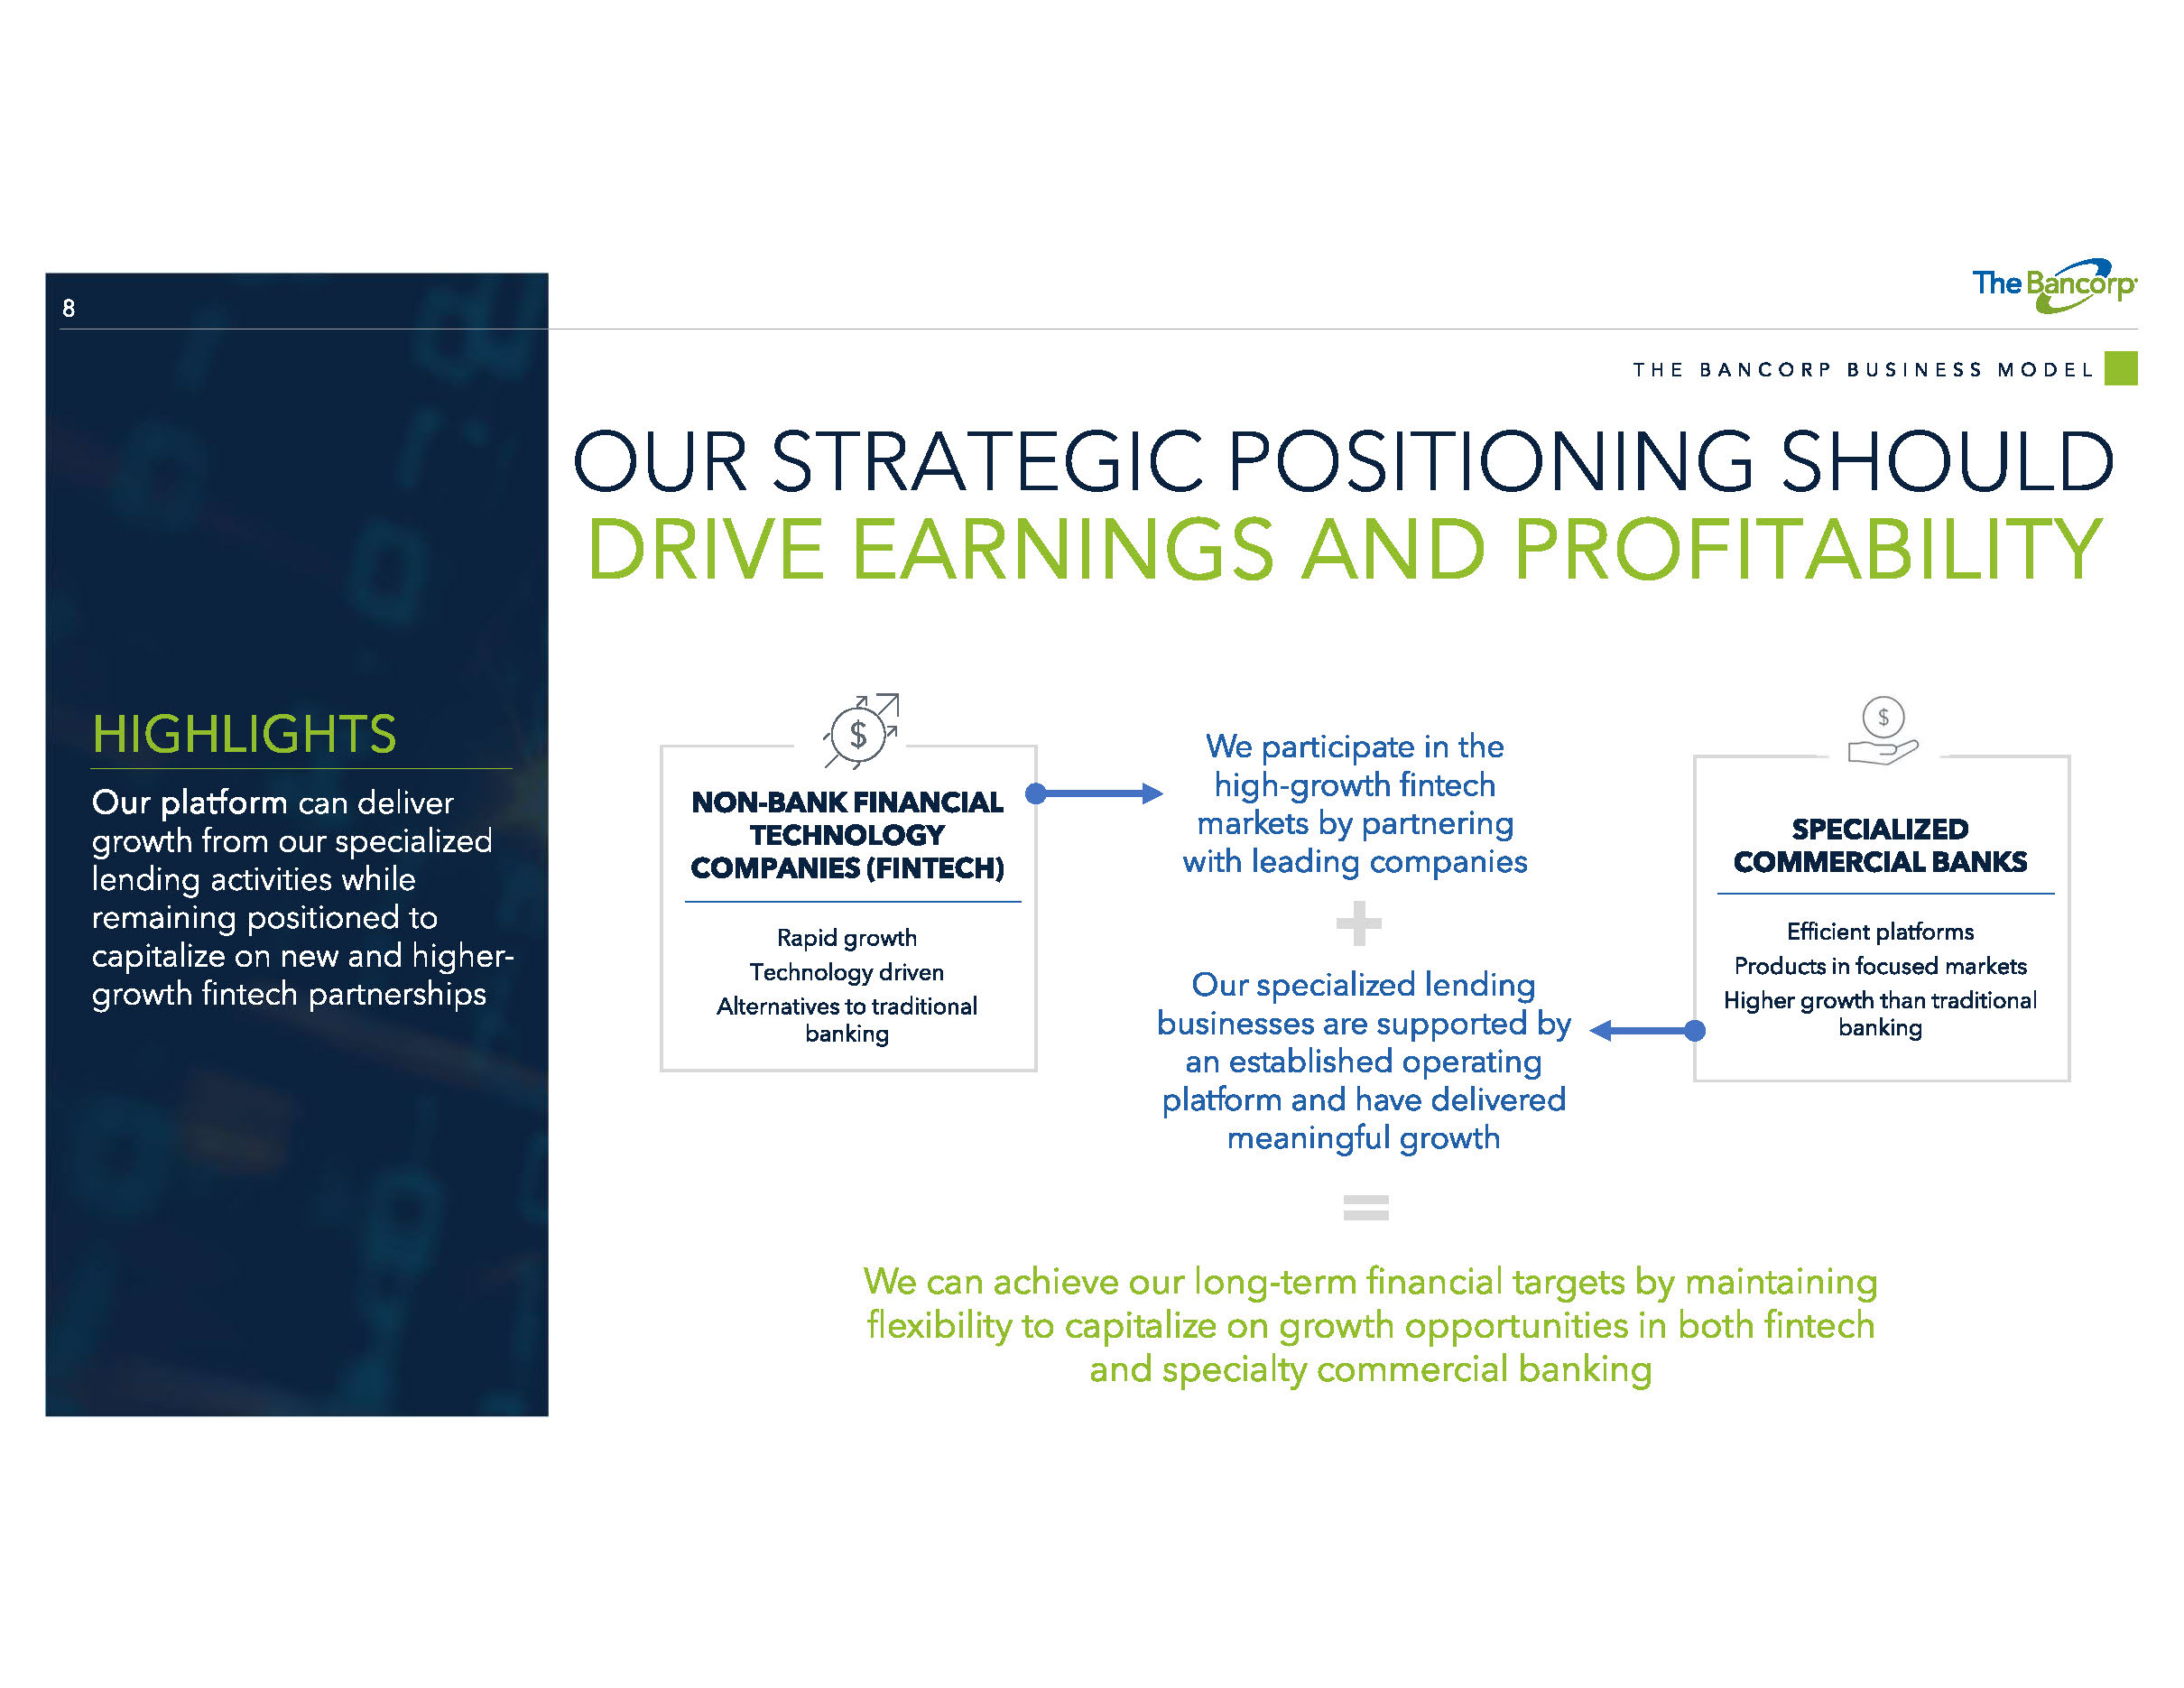
8 OUR STRATEGIC POSITIONING SHOULD DRIVE EARNINGS AND PROFITABILITY HIGHLIGHTS Our platform can deliver growth from our specialized lending activities while remaining positioned to capitalize on new and higher - growth fintech partnerships SPECIALIZED COMMERCIAL BANKS Efficient platforms Products in focused markets Higher growth than traditional banking We can achieve our long - term financial targets by maintaining flexibility to capitalize on growth opportunities in both fintech and specialty commercial banking THE BANCORP BUSINESS MODEL We participate in the high - growth fintech markets by partnering with leading companies Our specialized lending businesses are supported by an established operating platform and have delivered meaningful growth NON - BANK FINANCIAL TECHNOLOGY COMPANIES (FINTECH) Rapid growth Technology driven Alternatives to traditional banking
9 FINANCIAL TARGETS We have amended our vision 500 to include enhanced 2030 financial targets that can be achieved by unlocking the full potential of The Bancorp’s payments and lending businesses CAPITAL RETURN VISION 500 700 Established the plan to optimize our balance sheet PAYMENTS ECOSYSTEM Enhance plan to maximize capital return to shareholders Activate Payments Ecosystem 2.0 TOTAL REVENUE >$700 Million CREDIT ROADMAP ROE >30% ROA >2.5% LEVERAGE > 9% LONG TERM FINANCIAL TARGETS 1 FINANCIAL TARGETS 1 Long term guidance assumes achievement of management’s credit roadmap growth goals as described elsewhere in this presentatio n, impact of realized and expected interest rate increases, and other budgetary goals.
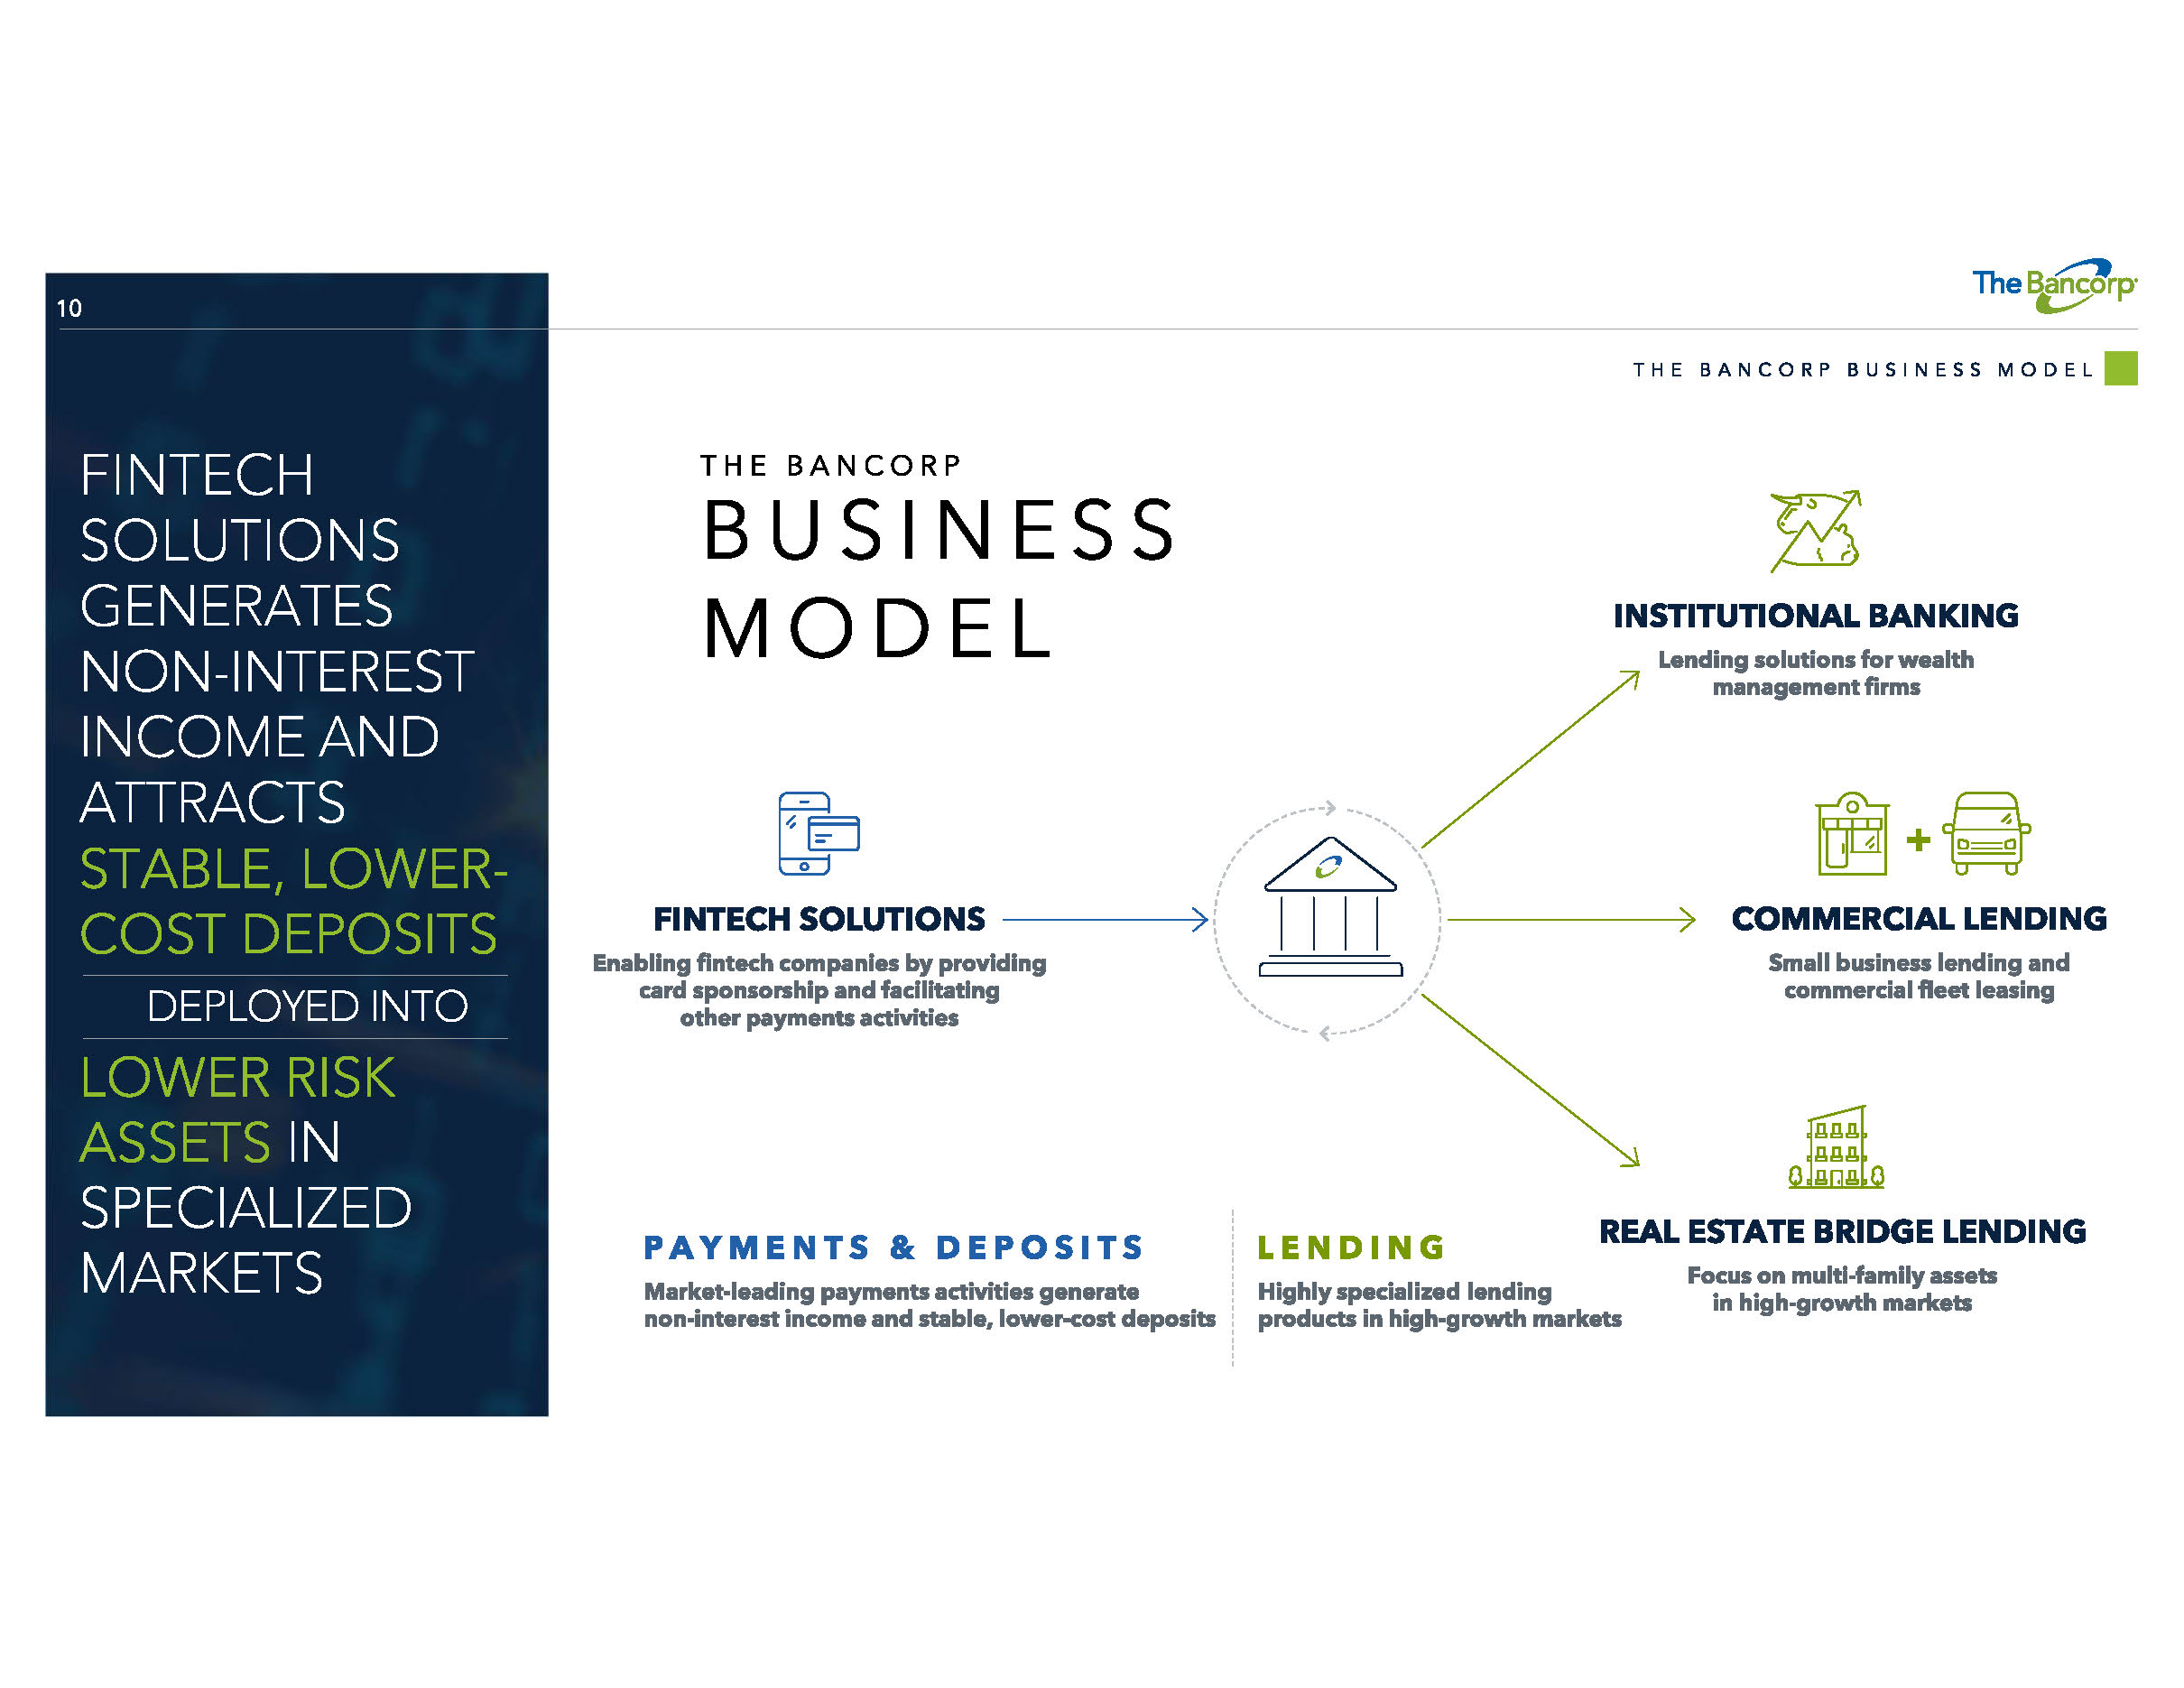
10 FINTECH SOLUTIONS GENERATES NON - INTEREST INCOME AND ATTRACTS STABLE, LOWER - COST DEPOSITS DEPLOYED INTO LOWER RISK ASSETS IN SPECIALIZED MARKETS FINTECH SOLUTIONS Enabling fintech companies by providing card sponsorship and facilitating other payments activities INSTITUTIONAL BANKING Lending solutions for wealth management firms COMMERCIAL LENDING Small business lending and commercial fleet leasing + THE BANCORP BUSINESS MODEL PAYMENTS & DEPOSITS Market - leading payments activities generate non - interest income and stable, lower - cost deposits LENDING Highly specialized lending products in high - growth markets THE BANCORP BUSINESS MODEL REAL ESTATE BRIDGE LENDING Focus on multi - family assets in high - growth markets
DEPOSITS & FEES: FINTECH SOLUTIONS GENERATES NON - INTEREST INCOME AND STABLE, LOWER - COST DEPOSITS
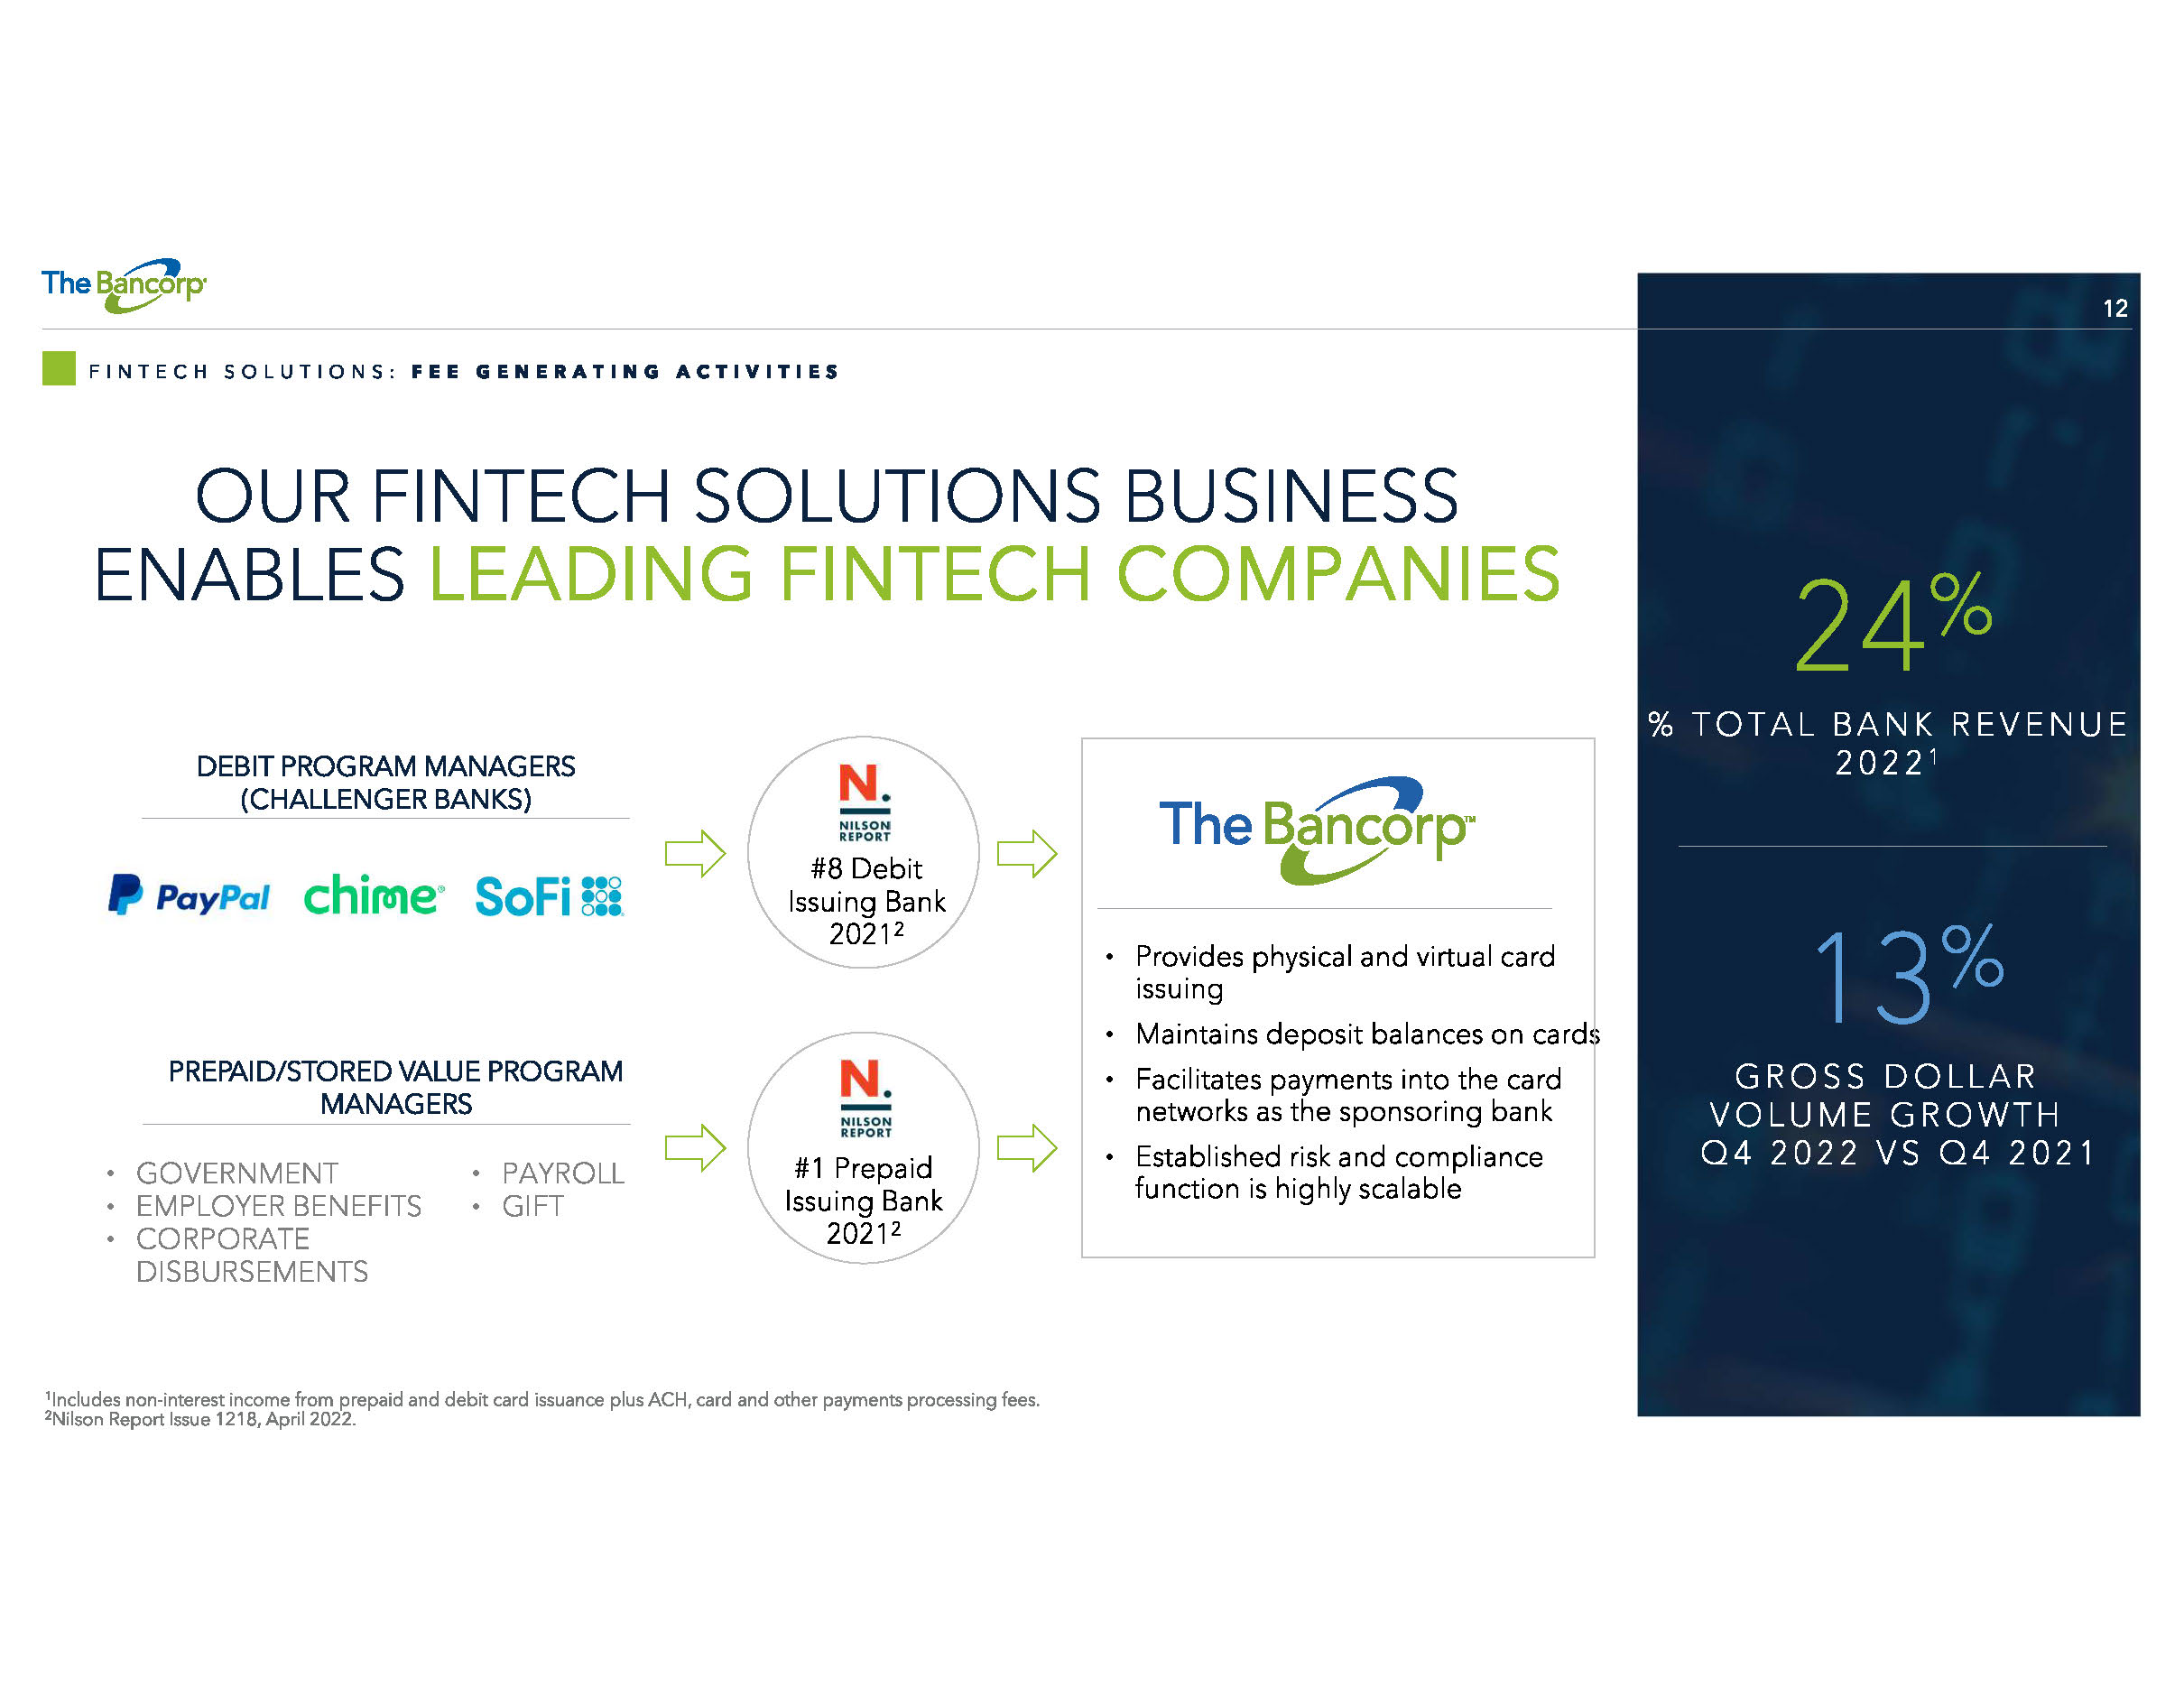
12 FINTECH SOLUTIONS: FEE GENERATING ACTIVITIES % TOTAL BANK REVENUE 2022 1 OUR FINTECH SOLUTIONS BUSINESS ENABLES LEADING FINTECH COMPANIES DEBIT PROGRAM MANAGERS (CHALLENGER BANKS) PREPAID/STORED VALUE PROGRAM MANAGERS • Provides physical and virtual card issuing • Maintains deposit balances on cards • Facilitates payments into the card networks as the sponsoring bank • Established risk and compliance function is highly scalable #8 Debit Issuing Bank 2021 2 #1 Prepaid Issuing Bank 2021 2 24 % GROSS DOLLAR VOLUME GROWTH Q4 2022 VS Q4 2021 13 % • GOVERNMENT • EMPLOYER BENEFITS • CORPORATE DISBURSEMENTS • PAYROLL • GIFT 1 Includes non - interest income from prepaid and debit card issuance plus ACH, card and other payments processing fees. 2 Nilson Report Issue 1218, April 2022.
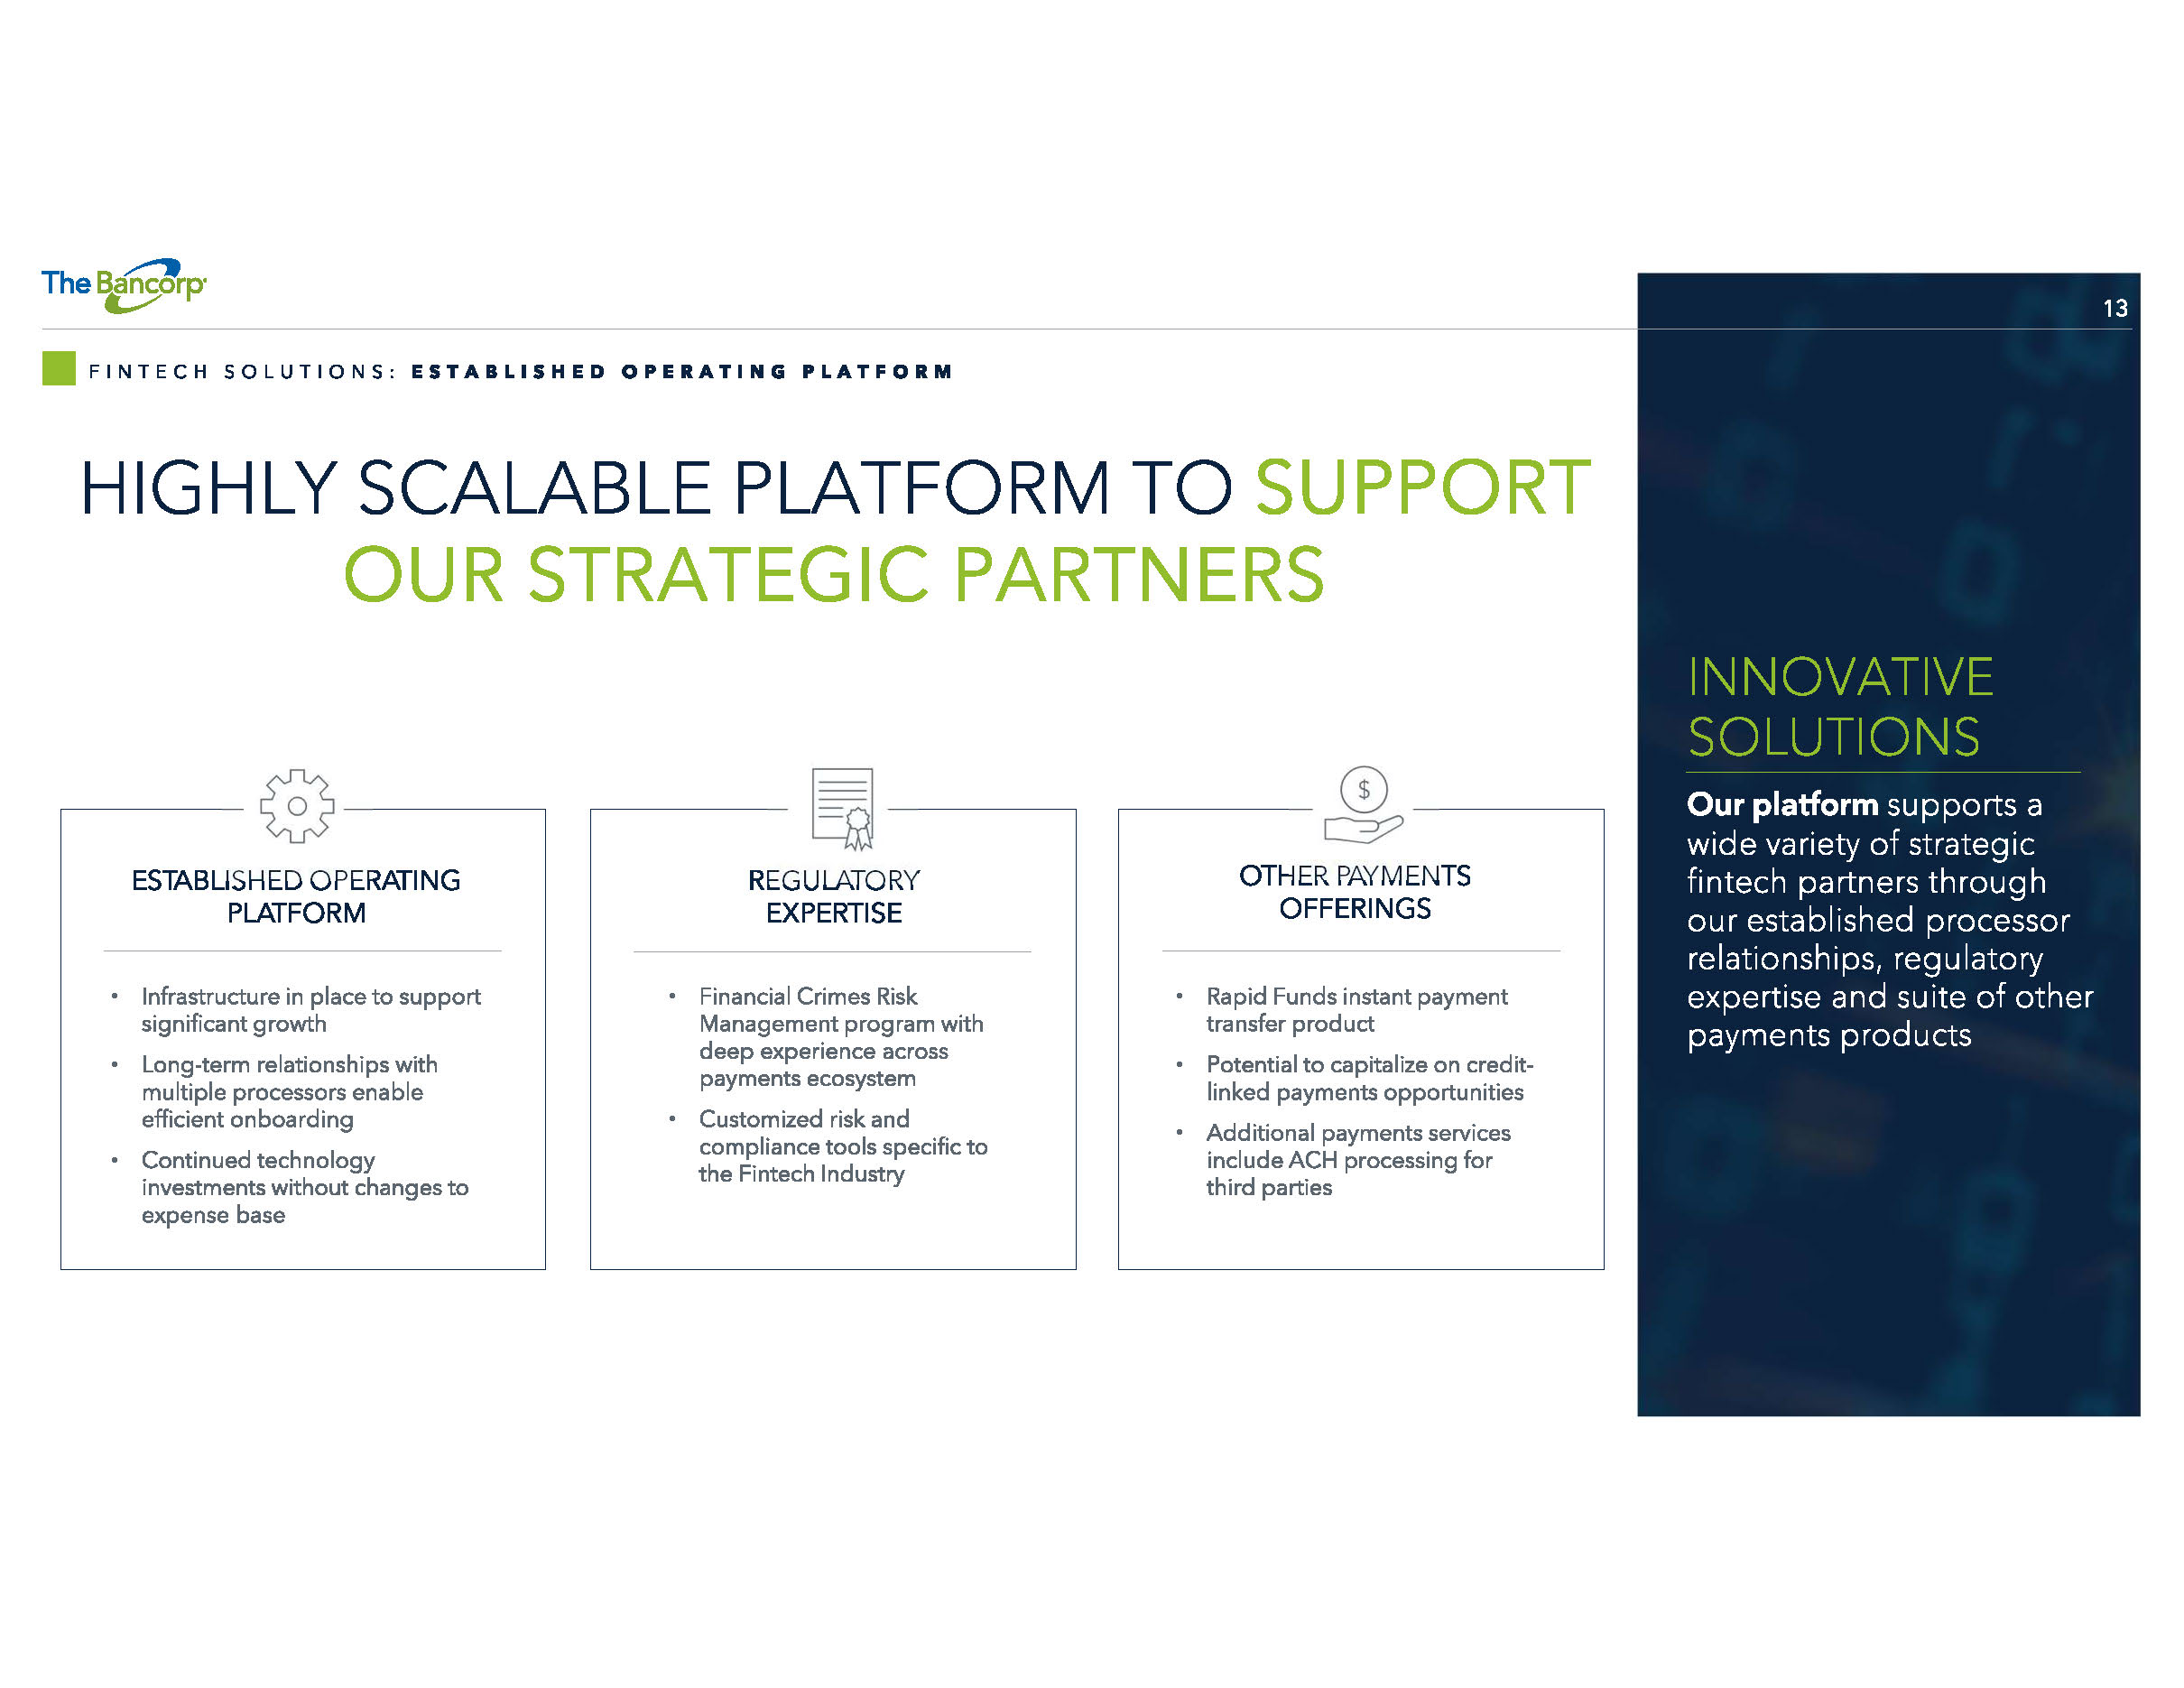
13 FINTECH SOLUTIONS: ESTABLISHED OPERATING PLATFORM HIGHLY SCALABLE PLATFORM TO SUPPORT OUR STRATEGIC PARTNERS ESTABLISHED OPERATING PLATFORM • Infrastructure in place to support significant growth • Long - term relationships with multiple processors enable efficient onboarding • Continued technology investments without changes to expense base REGULATORY EXPERTISE • Financial Crimes Risk Management program with deep experience across payments ecosystem • Customized risk and compliance tools specific to the Fintech Industry OTHER PAYMENTS OFFERINGS • Rapid Funds instant payment transfer product • Potential to capitalize on credit - linked payments opportunities • Additional payments services include ACH processing for third parties INNOVATIVE SOLUTIONS Our platform supports a wide variety of strategic fintech partners through our established processor relationships, regulatory expertise and suite of other payments products
14 DEPOSIT GROWTH FROM PAYMENTS BUSINESS FINTECH SOLUTIONS: STABLE, LOWER - COST DEPOSIT GENERATOR $0.0 $1.0 $2.0 $3.0 $4.0 $5.0 $6.0 $7.0 2018 2019 2020 2021 2022 AVERAGE DEPOSITS BY PERIOD ($ BILLIONS) Fintech Solutions Group (Prepaid and Debit Card Issuance and other payments) Institutional Banking (checking and money market for higher net worth individuals) Other (Includes time deposits and other legacy deposit programs) HIGHLIGHTS • Stable, lower - cost deposit base anchored by multi - year, contractual relationships in our Fintech Solutions business • Fintech Solutions growth driven by increased transactional volume due to electronic banking migration, addition of new partners and overall savings increases among consumers DEPOSIT TYPE (2022 AVG.) BALANCE % TOTAL Demand & Int. checking $5.7B 90% Savings & money market $0.5B 8% Time deposits $0.1B 2% Total $6.3B 100% COST OF DEPOSITS 0.67% 0.85% 0.25% 0.10% 0.82% $3.9 $4.0 $5.2 $5.7 $6.3
LOANS & LEASES: HIGHLY SPECIALIZED LENDING WITH LOW LOSS HISTORIES
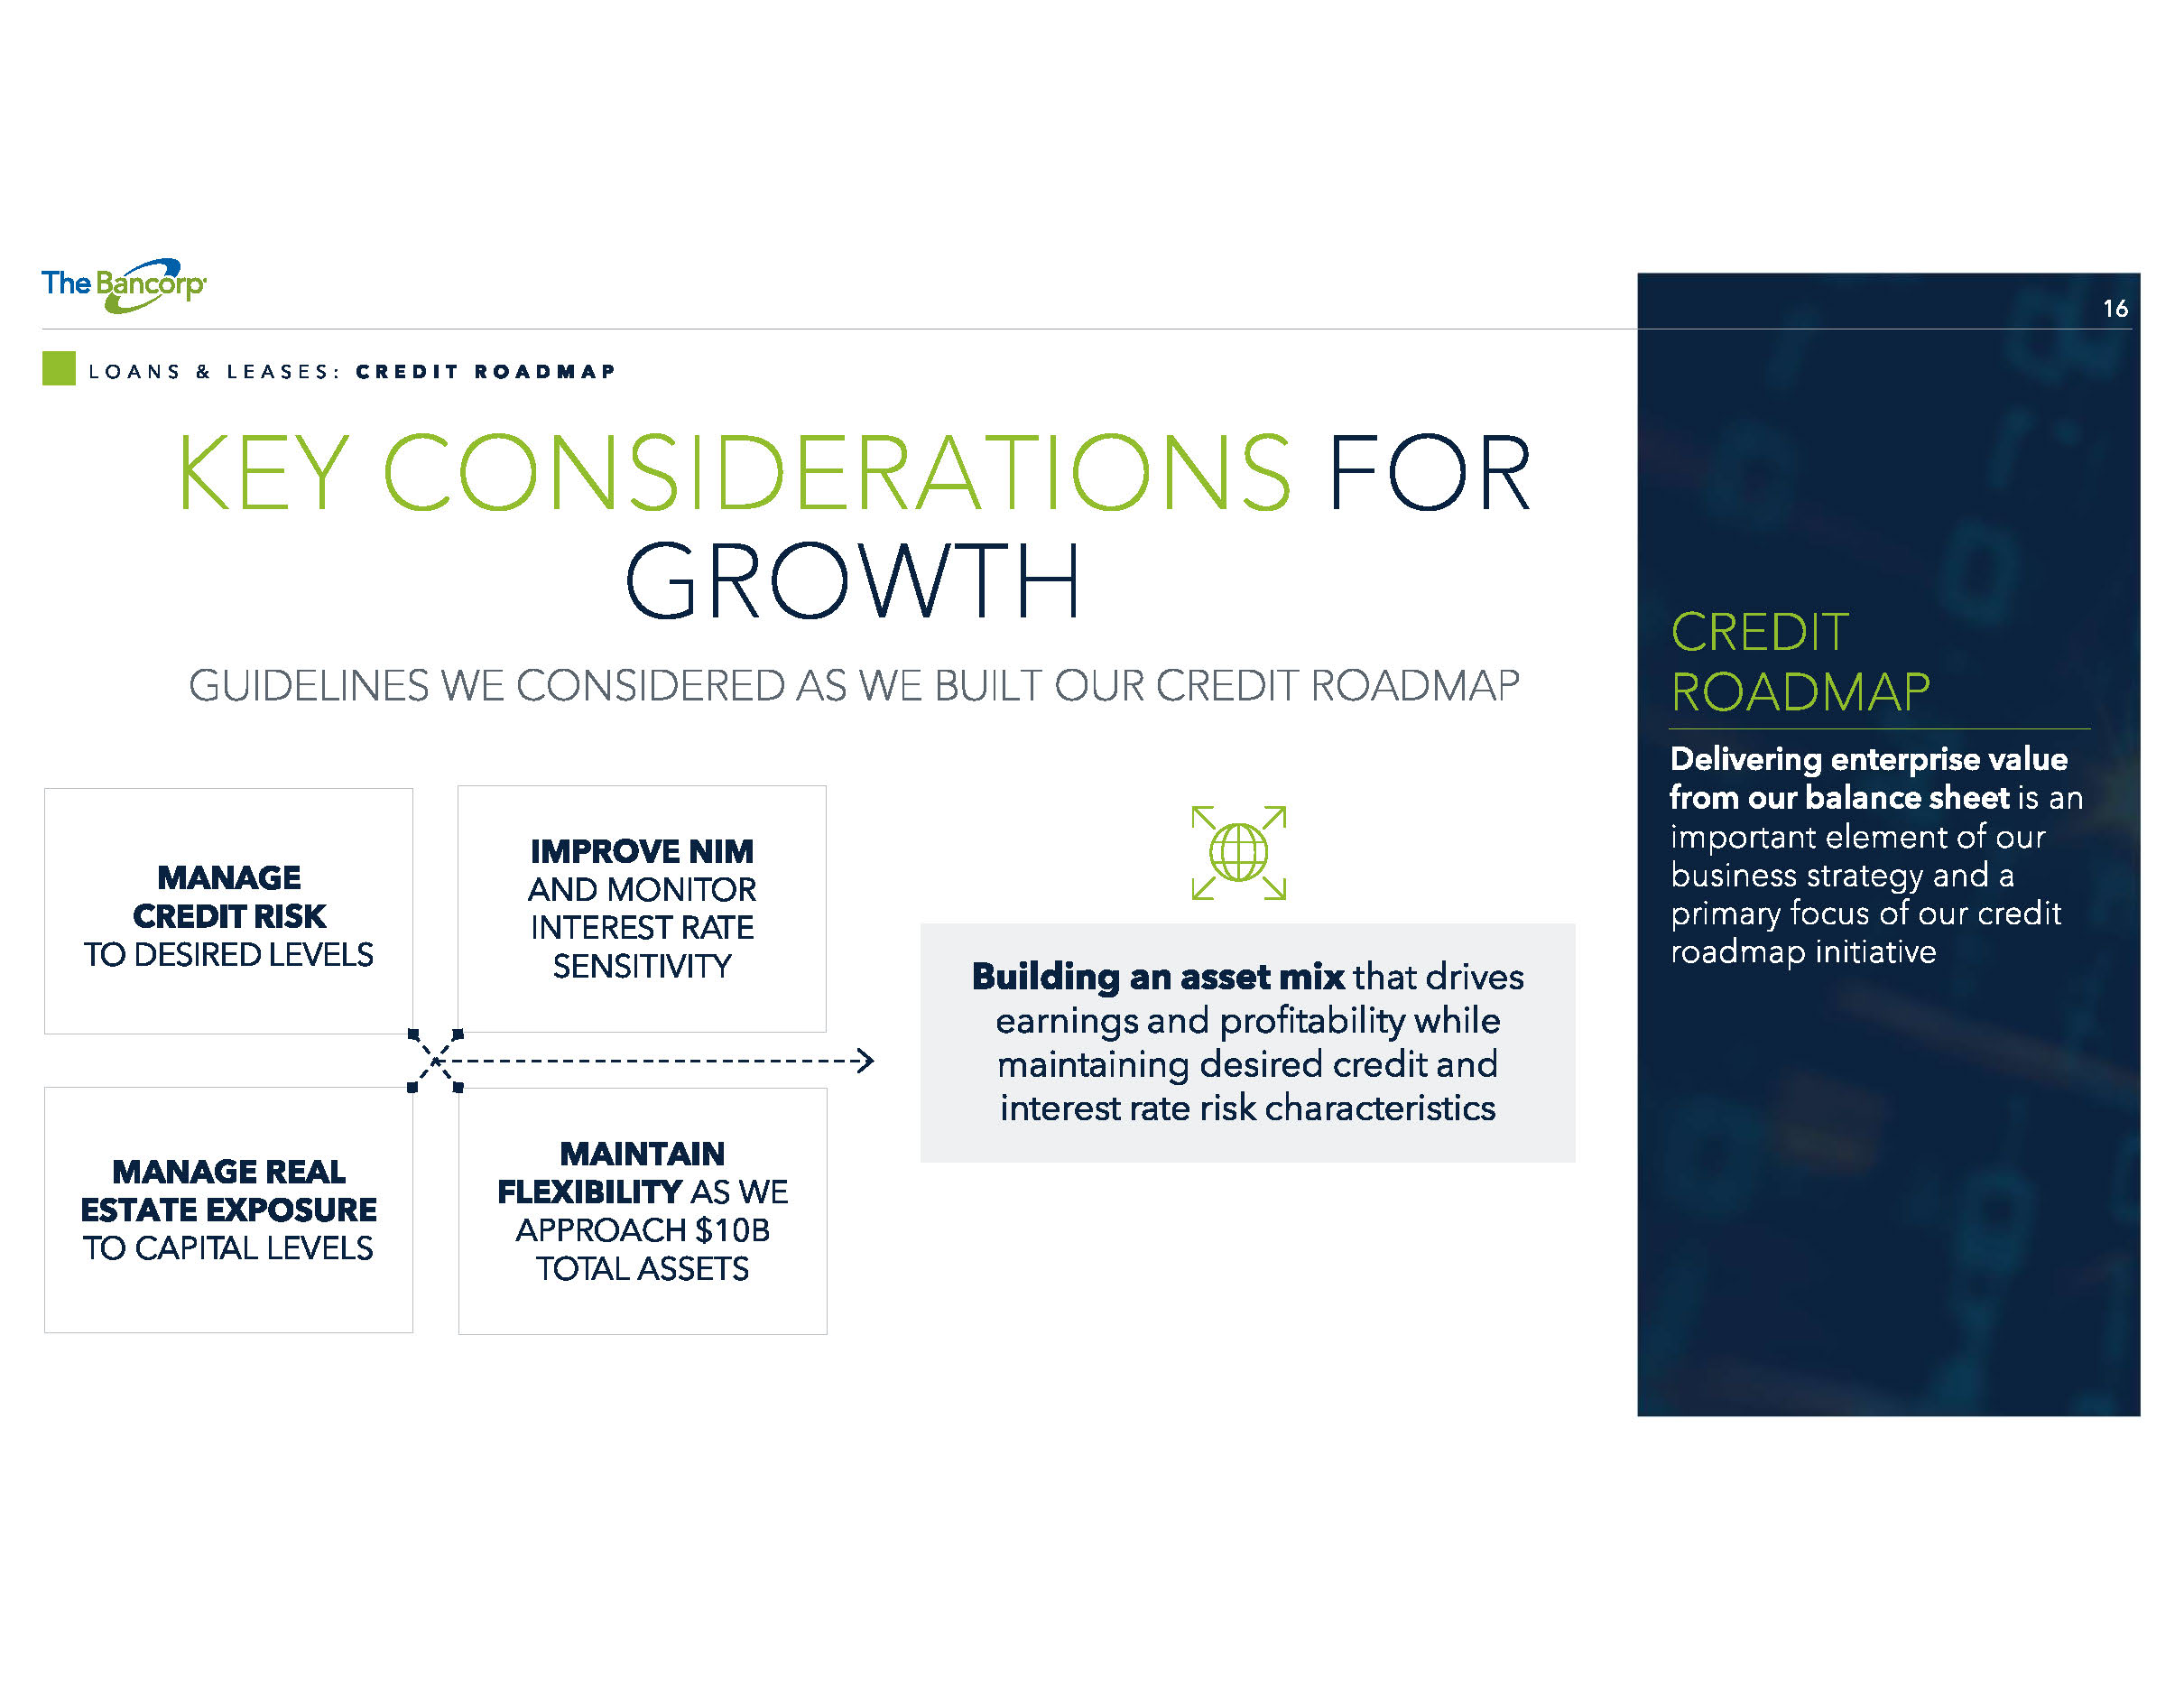
16 LOANS & LEASES: CREDIT ROADMAP CREDIT ROADMAP Delivering enterprise value from our balance sheet is an important element of our business strategy and a primary focus of our credit roadmap initiative MANAGE CREDIT RISK TO DESIRED LEVELS IMPROVE NIM AND MONITOR INTEREST RATE SENSITIVITY MANAGE REAL ESTATE EXPOSURE TO CAPITAL LEVELS MAINTAIN FLEXIBILITY AS WE APPROACH $10B TOTAL ASSETS Building an asset mix that drives earnings and profitability while maintaining desired credit and interest rate risk characteristics KEY CONSIDERATIONS FOR GROWTH GUIDELINES WE CONSIDERED AS WE BUILT OUR CREDIT ROADMAP
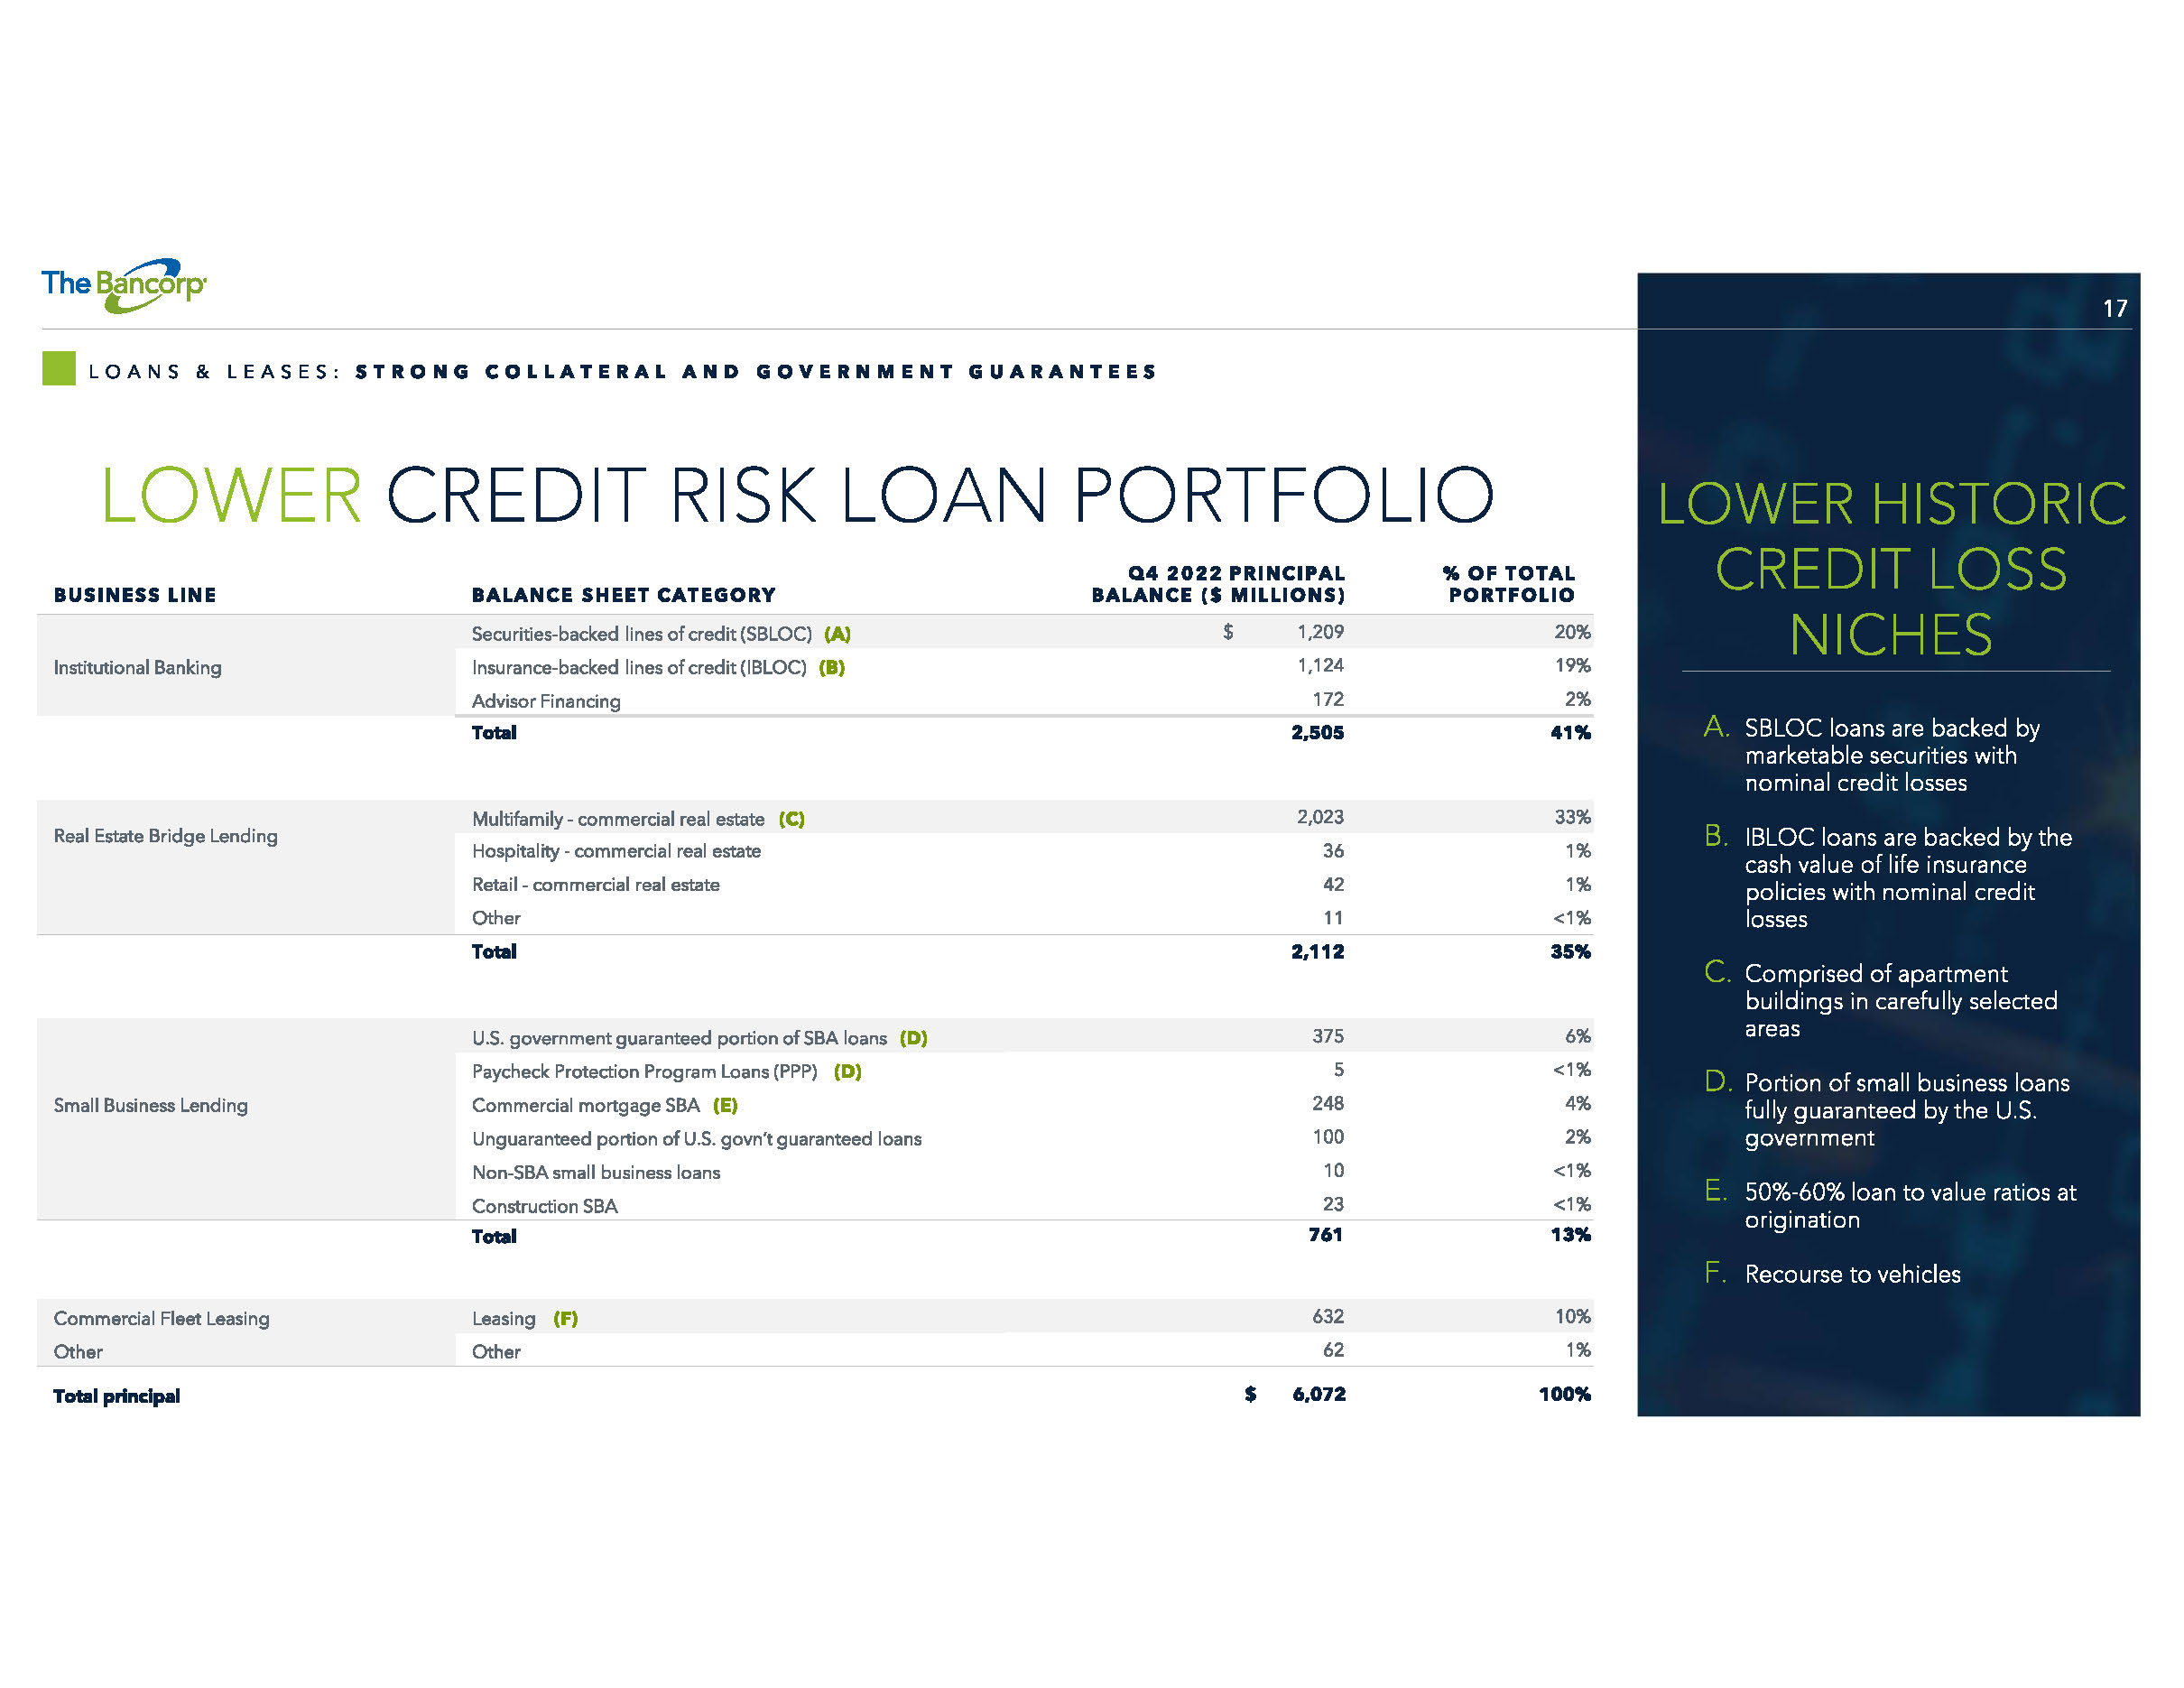
17 LOWER CREDIT RISK LOAN PORTFOLIO LOANS & LEASES: STRONG COLLATERAL AND GOVERNMENT GUARANTEES BUSINESS LINE BALANCE SHEET CATEGORY Q4 2022 PRINCIPAL BALANCE ($ MILLIONS) % OF TOTAL PORTFOLIO Institutional Banking Securities - backed lines of credit (SBLOC) ( A) $ 1,209 20% Insurance - backed lines of credit (IBLOC) (B) 1,124 19% Advisor Financing 172 2% Total 2,505 41% Real Estate Bridge Lending Multifamily - commercial real estate (C) 2,023 33% Hospitality - commercial real estate 36 1% Retail - commercial real estate 42 1% Other 11 <1% Total 2,112 35% Small Business Lending U.S. government guaranteed portion of SBA loans ( D) 375 6% Pay check Protection Program Loans (PPP) ( D) 5 <1% Commercial mortgage SBA ( E) 248 4% Unguaranteed portion of U.S. govn’t guaranteed loans 100 2% Non - SBA small business loans 10 <1% Construction SBA 23 <1% Total 761 13% Commercial Fleet Leasing Leasing ( F) 632 10% Other Other 62 1% Total principal $ 6,072 100% LOWER HISTORIC CREDIT LOSS NICHES A. SBLOC loans are backed by marketable securities with nominal credit losses B. IBLOC loans are backed by the cash value of life insurance policies with nominal credit losses C. Comprised of apartment buildings in carefully selected areas D. Portion of small business loans fully guaranteed by the U.S. government E. 50% - 60% loan to value ratios at origination F. Recourse to vehicles
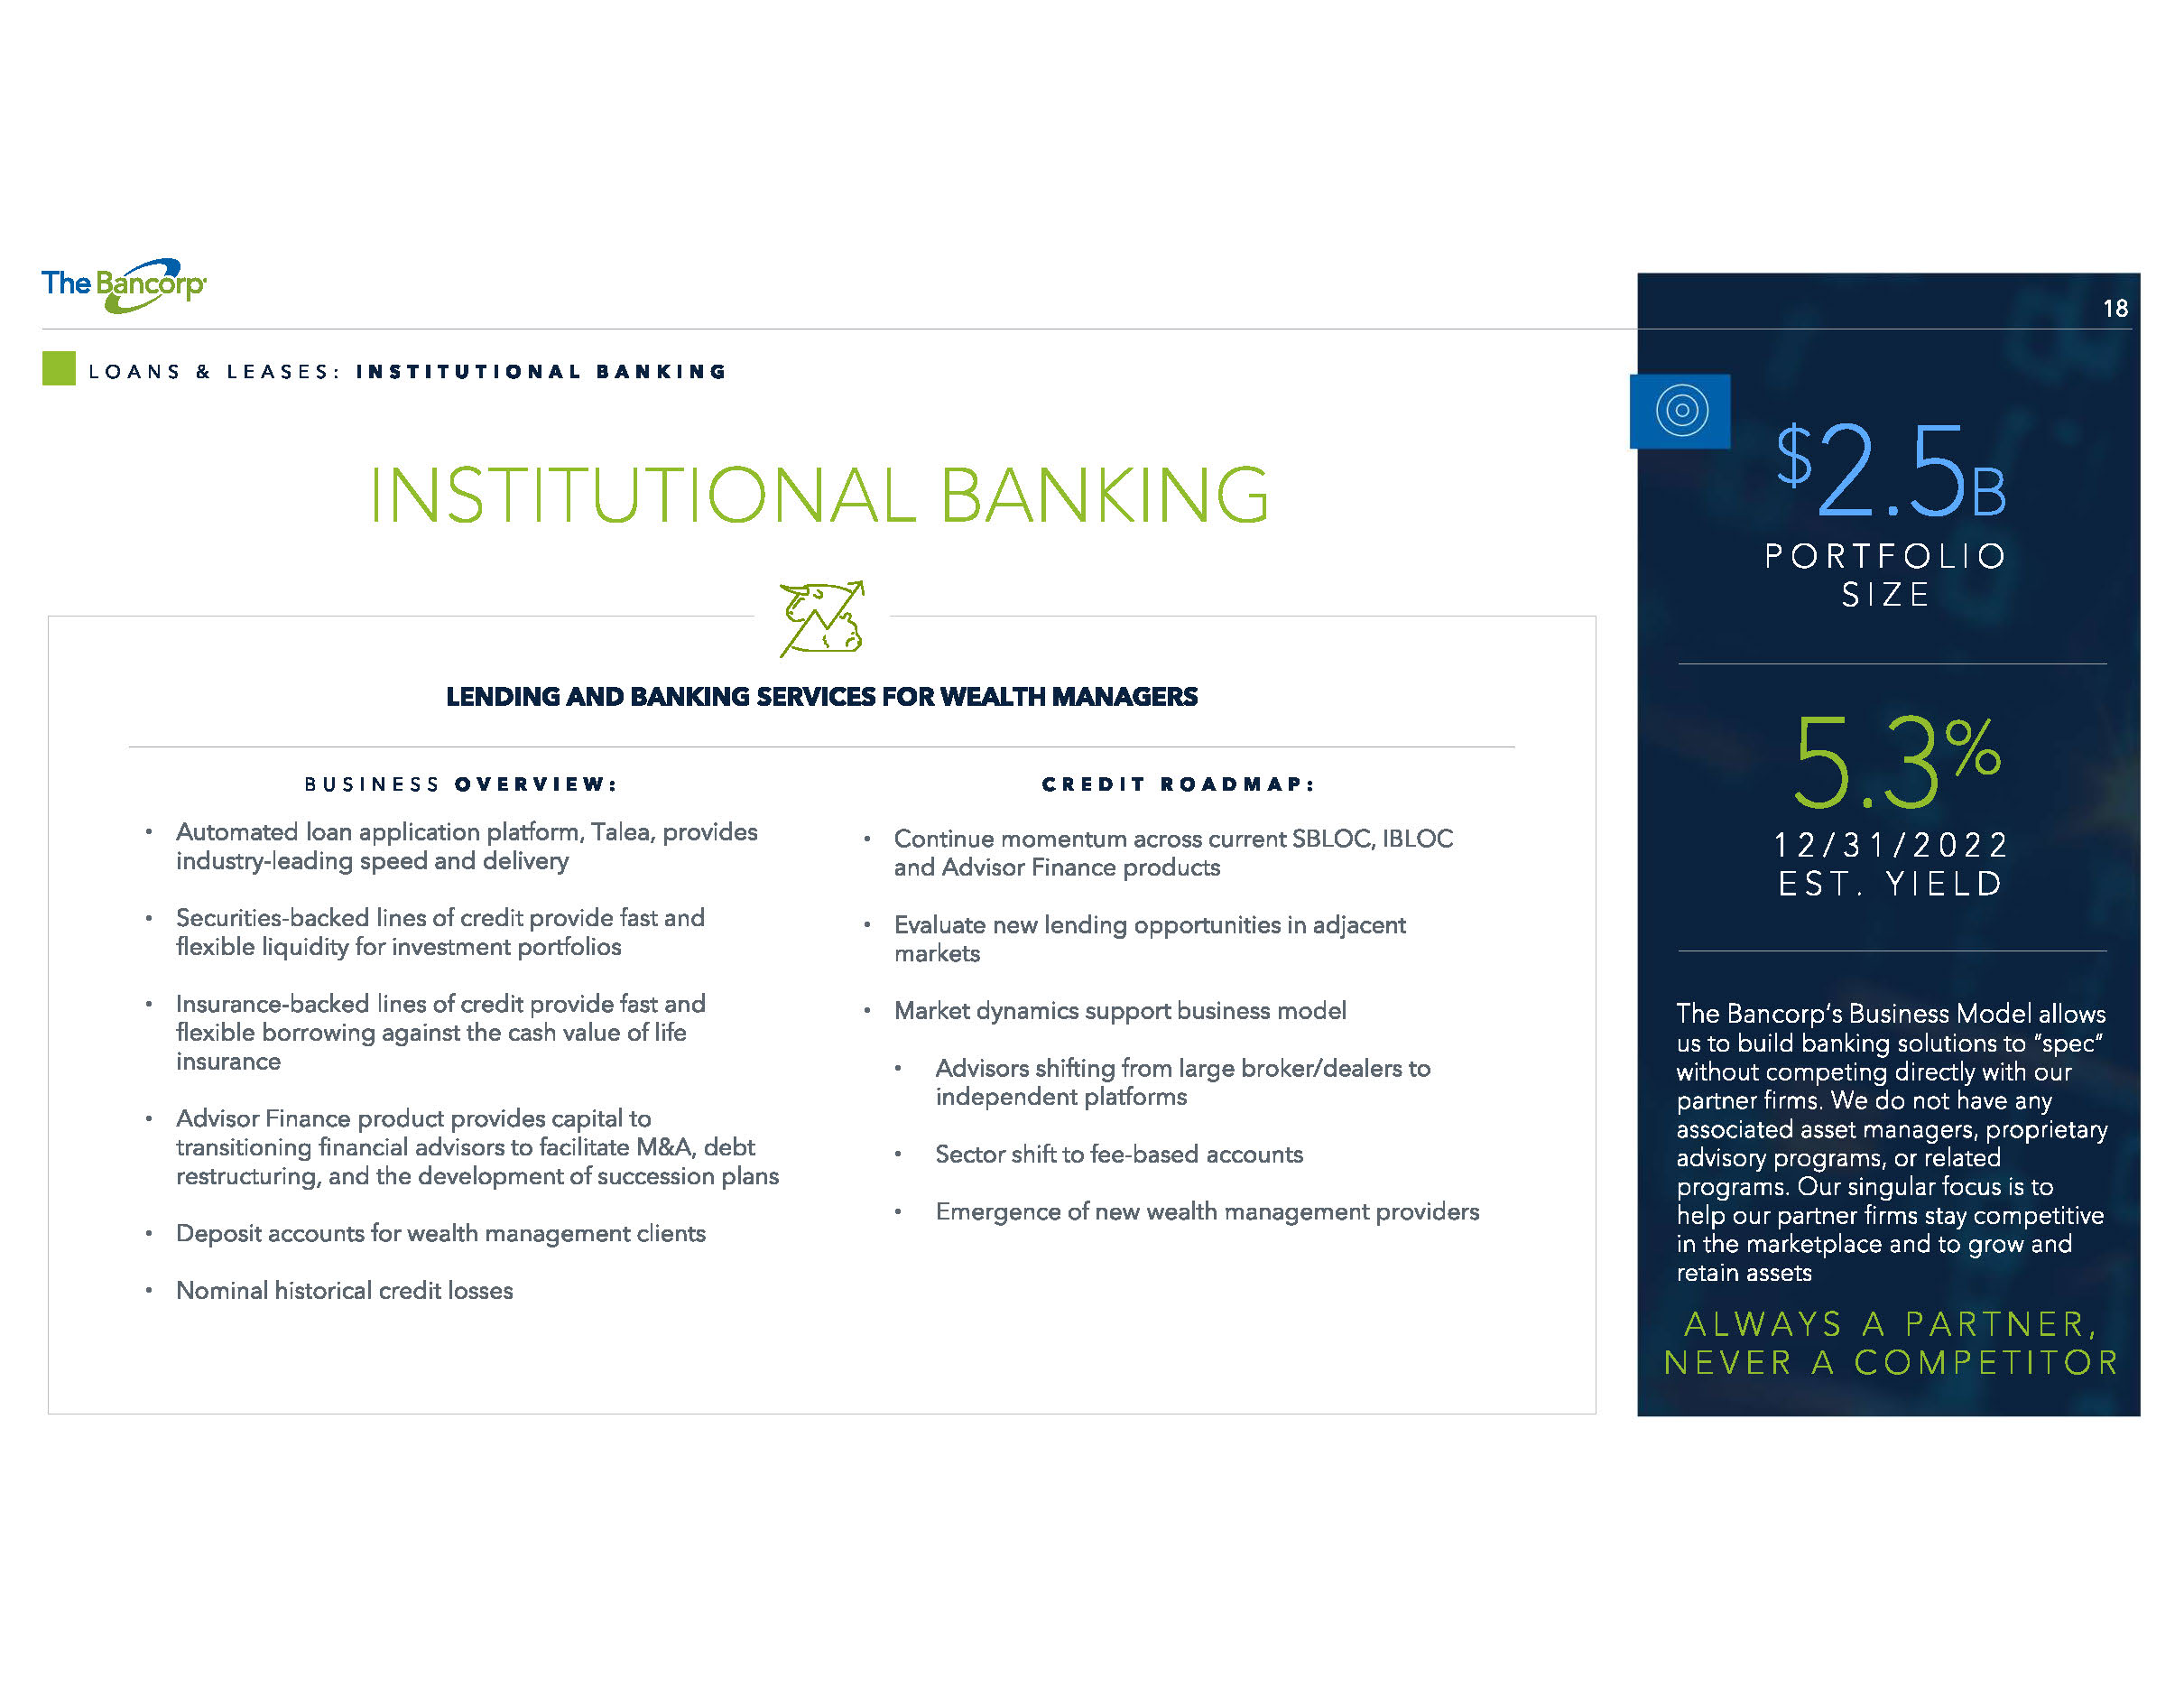
18 INSTITUTIONAL BANKING LOANS & LEASES: INSTITUTIONAL BANKING BUSINESS OVERVIEW: • Automated loan application platform, Talea, provides industry - leading speed and delivery • Securities - backed lines of credit provide fast and flexible liquidity for investment portfolios • Insurance - backed lines of credit provide fast and flexible borrowing against the cash value of life insurance • Advisor Finance product provides capital to transitioning financial advisors to facilitate M&A, debt restructuring, and the development of succession plans • Deposit accounts for wealth management clients • Nominal historical credit losses CREDIT ROADMAP: • Continue momentum across current SBLOC, IBLOC and Advisor Finance products • Evaluate new lending opportunities in adjacent markets • Market dynamics support business model • Advisors shifting from large broker/dealers to independent platforms • Sector shift to fee - based accounts • Emergence of new wealth management providers LENDING AND BANKING SERVICES FOR WEALTH MANAGERS The Bancorp’s Business Model allows us to build banking solutions to “spec” without competing directly with our partner firms. We do not have any associated asset managers, proprietary advisory programs, or related programs. Our singular focus is to help our partner firms stay competitive in the marketplace and to grow and retain assets ALWAYS A PARTNER, NEVER A COMPETITOR $ 2.5 B PORTFOLIO SIZE 5.3 % 12/31/2022 EST. YIELD
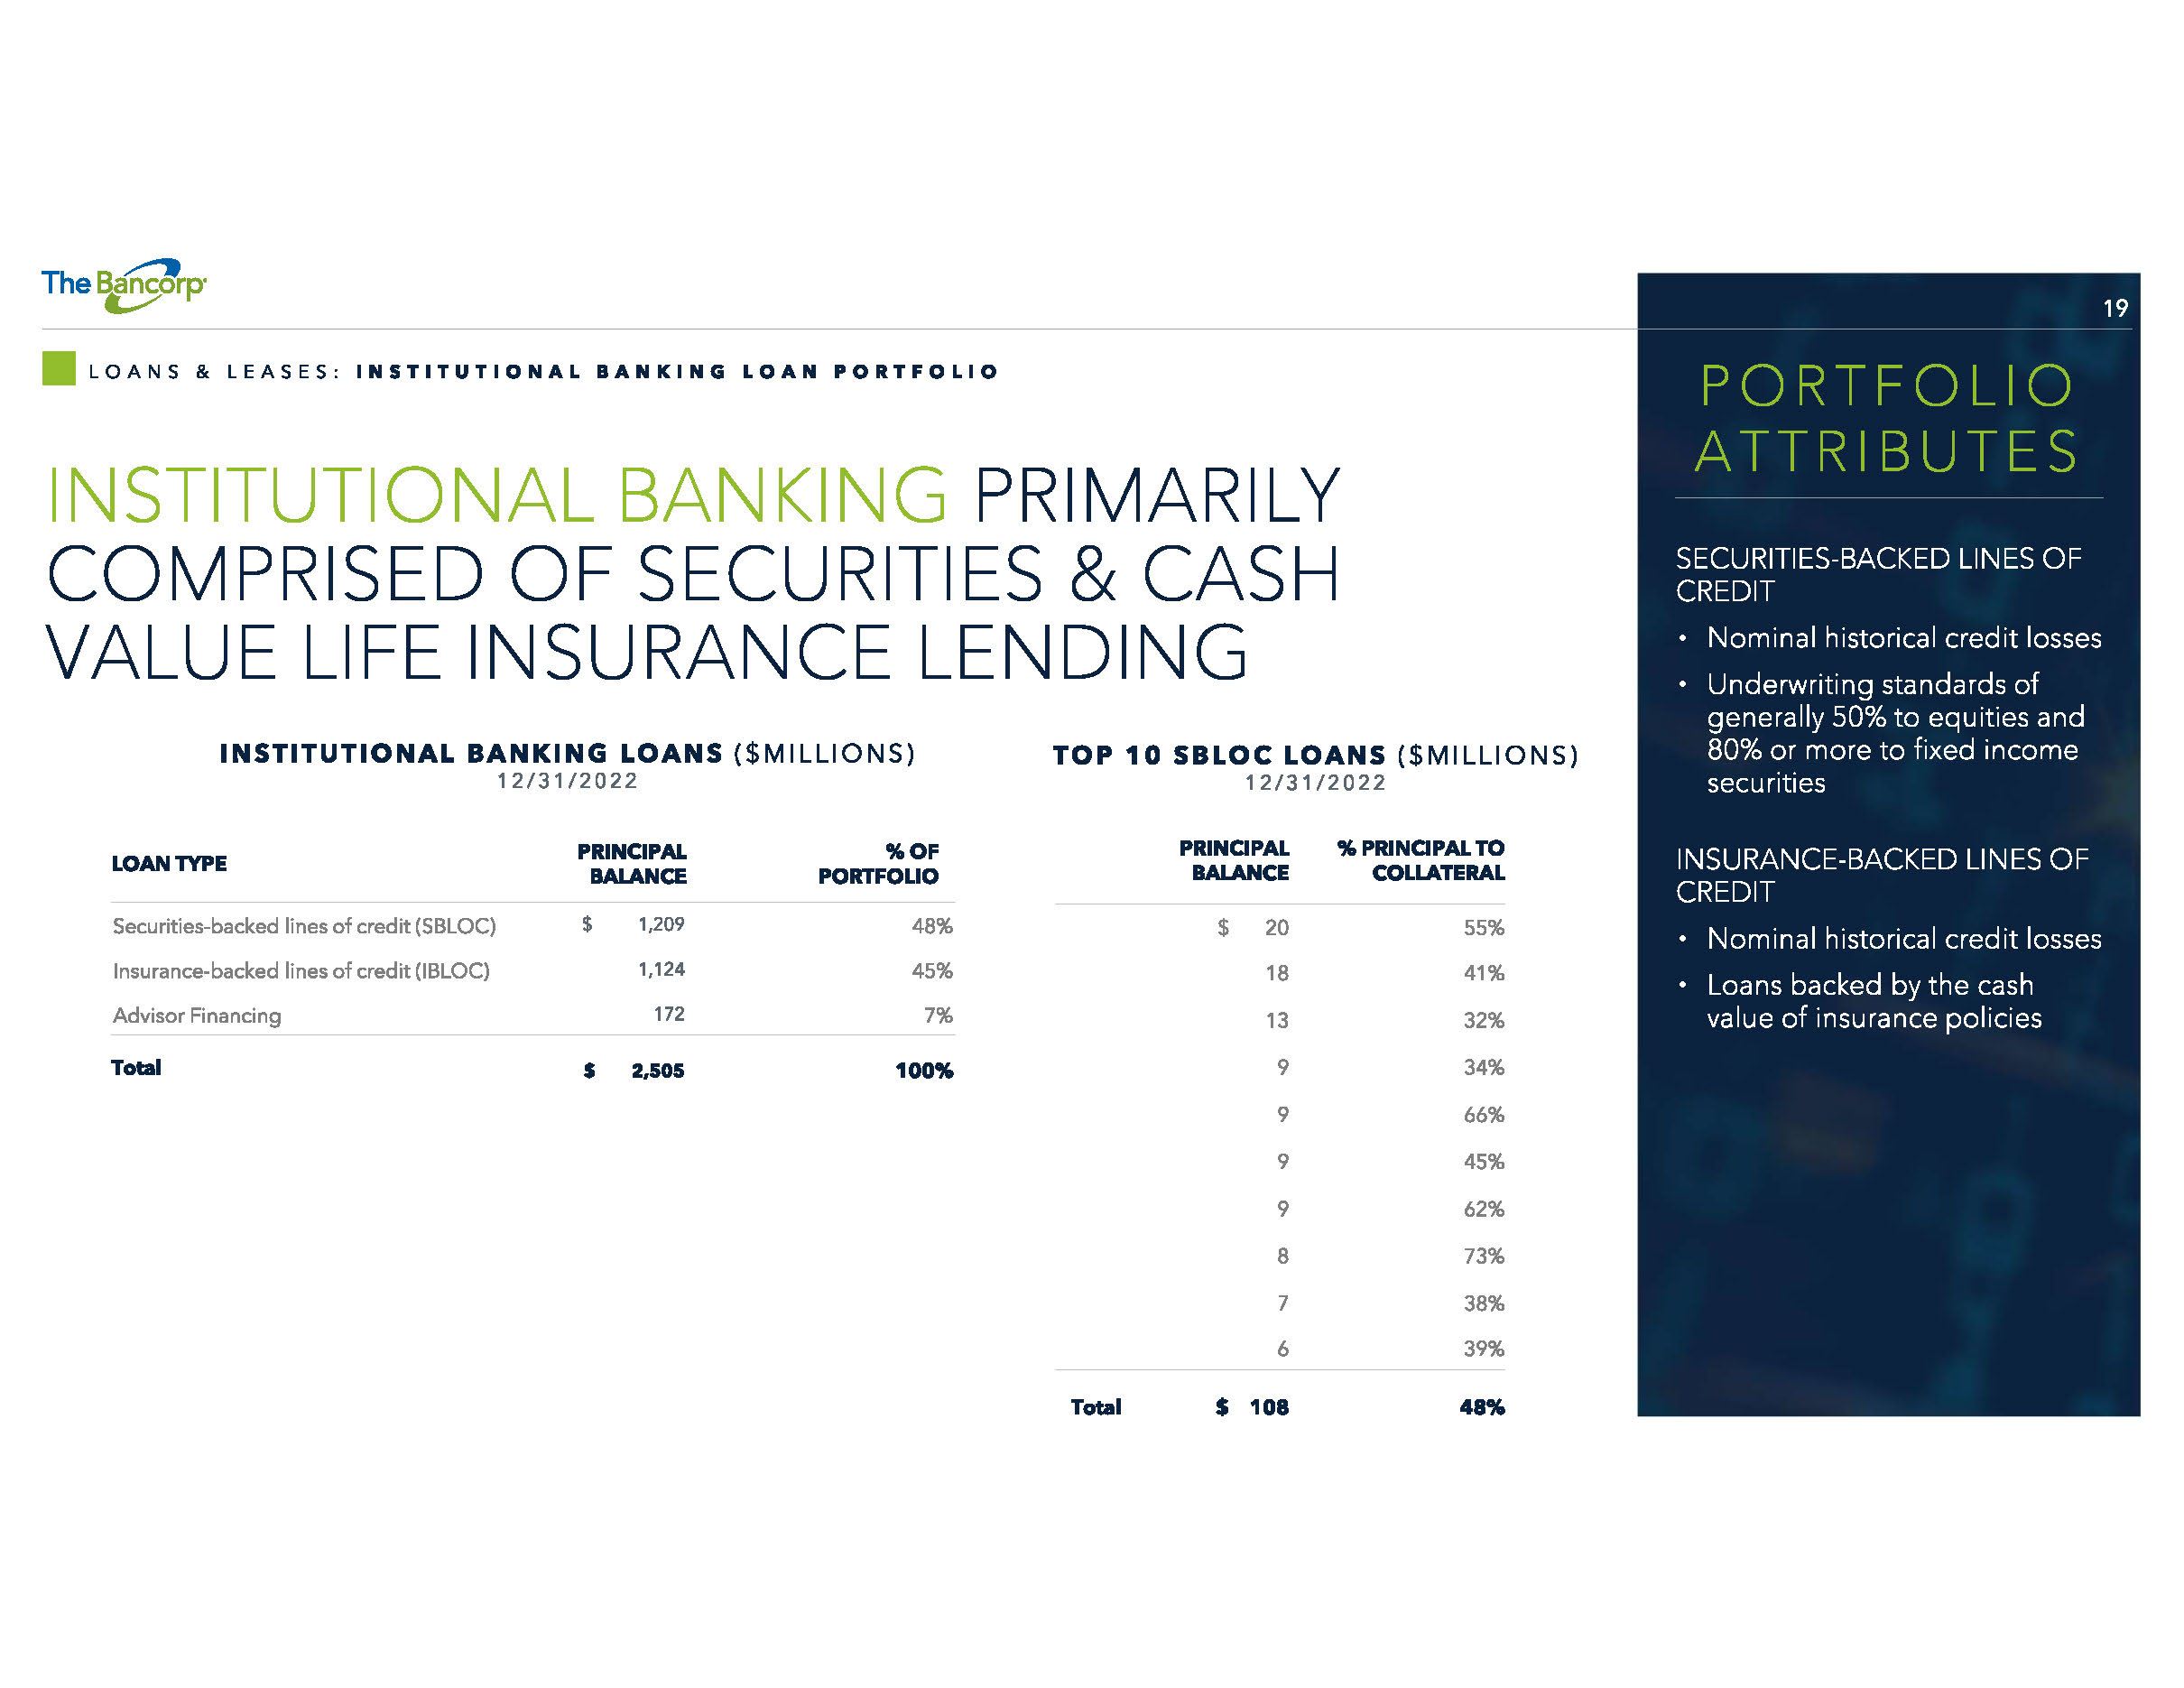
19 INSTITUTIONAL BANKING PRIMARILY COMPRISED OF SECURITIES & CASH VALUE LIFE INSURANCE LENDING LOANS & LEASES: INSTITUTIONAL BANKING LOAN PORTFOLIO LOAN TYPE PRINCIPAL BALANCE % OF PORTFOLIO Securities - backed lines of credit (SBLOC) $ 1,209 48% Insurance - backed lines of credit (IBLOC) 1,124 45% Advisor Financing 172 7% Total $ 2,505 100% INSTITUTIONAL BANKING LOANS ($MILLIONS) 12/31/2022 SECURITIES - BACKED LINES OF CREDIT • Nominal historical credit losses • Underwriting standards of generally 50% to equities and 80% or more to fixed income securities PORTFOLIO ATTRIBUTES PRINCIPAL BALANCE % PRINCIPAL TO COLLATERAL $ 20 55% 18 41% 13 32% 9 34% 9 66% 9 45% 9 62% 8 73% 7 38% 6 39% Total $ 108 48% TOP 10 SBLOC LOANS ($MILLIONS) 12/31/2022 INSURANCE - BACKED LINES OF CREDIT • Nominal historical credit losses • Loans backed by the cash value of insurance policies
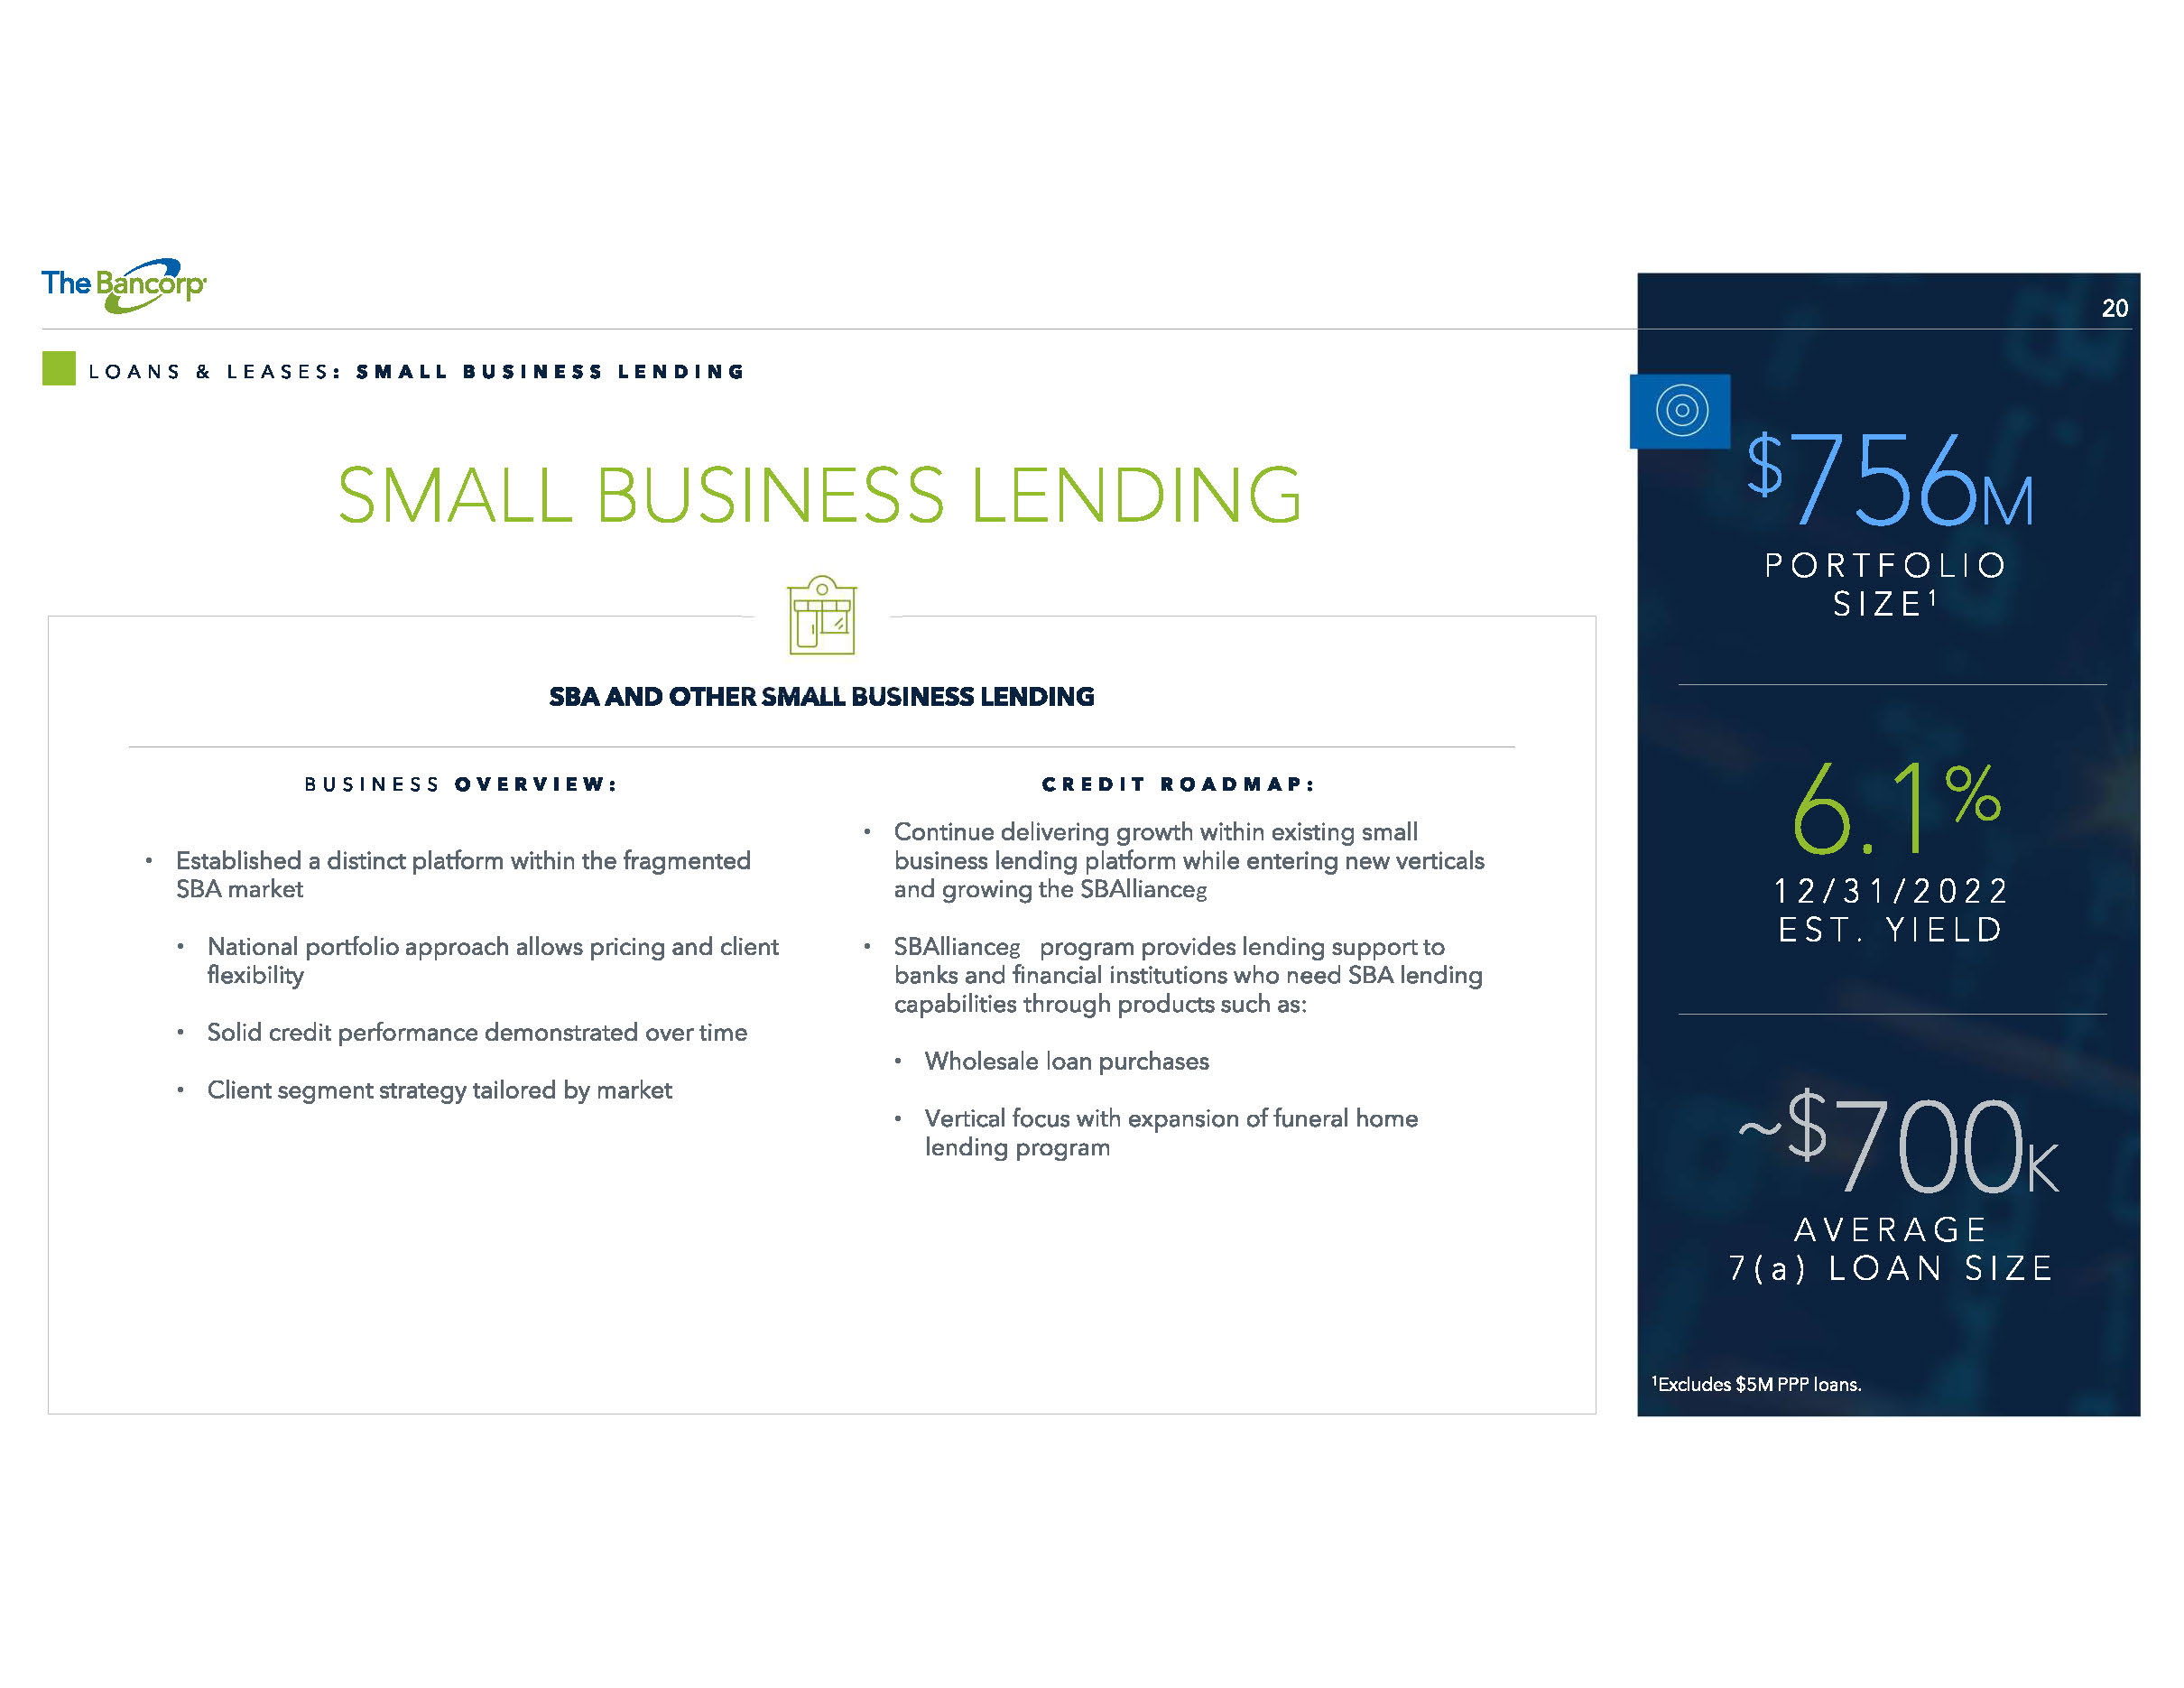
20 SMALL BUSINESS LENDING LOANS & LEASES : SMALL BUSINESS LENDING BUSINESS OVERVIEW: • Established a distinct platform within the fragmented SBA market • National portfolio approach allows pricing and client flexibility • Solid credit performance demonstrated over time • Client segment strategy tailored by market CREDIT ROADMAP: • Continue delivering growth within existing small business lending platform while entering new verticals and growing the SBAlliance Ρ • SBAlliance Ρ program provides lending support to banks and financial institutions who need SBA lending capabilities through products such as: • Wholesale loan purchases • Vertical focus with expansion of funeral home lending program SBA AND OTHER SMALL BUSINESS LENDING $ 756 M PORTFOLIO SIZE 1 6.1 % 12/31/2022 EST. YIELD ~$ 700 K AVERAGE 7(a) LOAN SIZE 1 Excludes $5M PPP loans.
21 LOANS & LEASES: STRONG COLLATERAL & GOVERNMENT GUARANTEES SMALL BUSINESS LOANS BY TYPE 1 ($MILLIONS) 12/31/2022 1 Excludes the government guaranteed portion of SBA 7a loans and PPP loans. TYPE DISTRIBUTION • Diverse product mix • Commercial mortgage and construction are generally originated with 50% - 60% LTV’s GEOGRAPHIC DISTRIBUTION • Diverse geographic mix • Largest concentration in Florida representing 19% of total PORTFOLIO ATTRIBUTES SMALL BUSINESS LOANS BY STATE 1 ($MILLIONS) 12/31/2022 STATE SBL COMMERCIAL MORTGAGE SBL CONSTRUCTION SBL NON - REAL ESTATE TOTAL Florida $ 65 $ - $ 4 $ 69 California 61 3 3 67 North Carolina 40 7 2 49 New York 25 - 5 30 Pennsylvania 18 - 1 19 Georgia 16 - 2 17 Illinois 15 - 1 16 New Jersey 12 - 3 15 Texas 12 - 3 15 Tennessee 14 - - 14 Colorado 12 - 1 13 Ohio 11 - - 11 Connecticut 10 - - 10 Virginia 8 - 1 9 Michigan 4 - - 4 Other states 19 - 8 27 Total $ 334 $ 10 $ 37 $ 381 SMALL BUSINESS LENDING TYPE SBL COMMERCIAL MORTGAGE SBL CONSTRUCTION SBL NON - REAL ESTATE TOTAL Hotels and motels $ 79 $ — $ - $ 79 Car washes 18 1 - 19 Full - service restaurants 12 3 2 17 Lessors of nonresidential buildings 16 — - 16 Child day care services 14 — 1 15 Outpatient mental health and substance abuse centers 15 — - 15 Funeral homes and funeral services 10 — - 10 Assisted living facilities for the elderly 10 — - 10 Offices of lawyers 9 — - 9 Packaged frozen food merchant wholesalers 9 — - 9 Gasoline stations with convenience stores 8 — - 8 Lessors of other real estate property 8 — - 8 Fitness and recreational sports centers 6 — 2 8 General Warehousing and Storage 7 — - 7 Other 113 6 32 151 Total $ 334 $ 10 $ 37 $ 381
22 COMMERCIAL FLEET LEASING LOANS & LEASES : COMMERCIAL FLEET LEASING BUSINESS OVERVIEW: • Niche provider of vehicle leasing solutions • Focus on smaller fleets (less than 150 vehicles) • Direct lessor (The Bancorp Bank sources opportunities directly and provides value - add services such as outfitting police cars) • Historical acquisitions of small leasing companies have contributed to growth • Mix of commercial (~85%), government agencies and educational institutions (~15%) CREDIT ROADMAP: • Continue enhancing platform and growing balances • Enhanced sales process and support functions • Pursuing technology enhancements to scale business with efficiency • Constantly evaluating organic and inorganic growth opportunities in the vehicle space NICHE - VEHICLE FLEET LEASING SOLUTIONS $ 632 M PORTFOLIO SIZE 6.3 % 12/31/2022 EST. YIELD
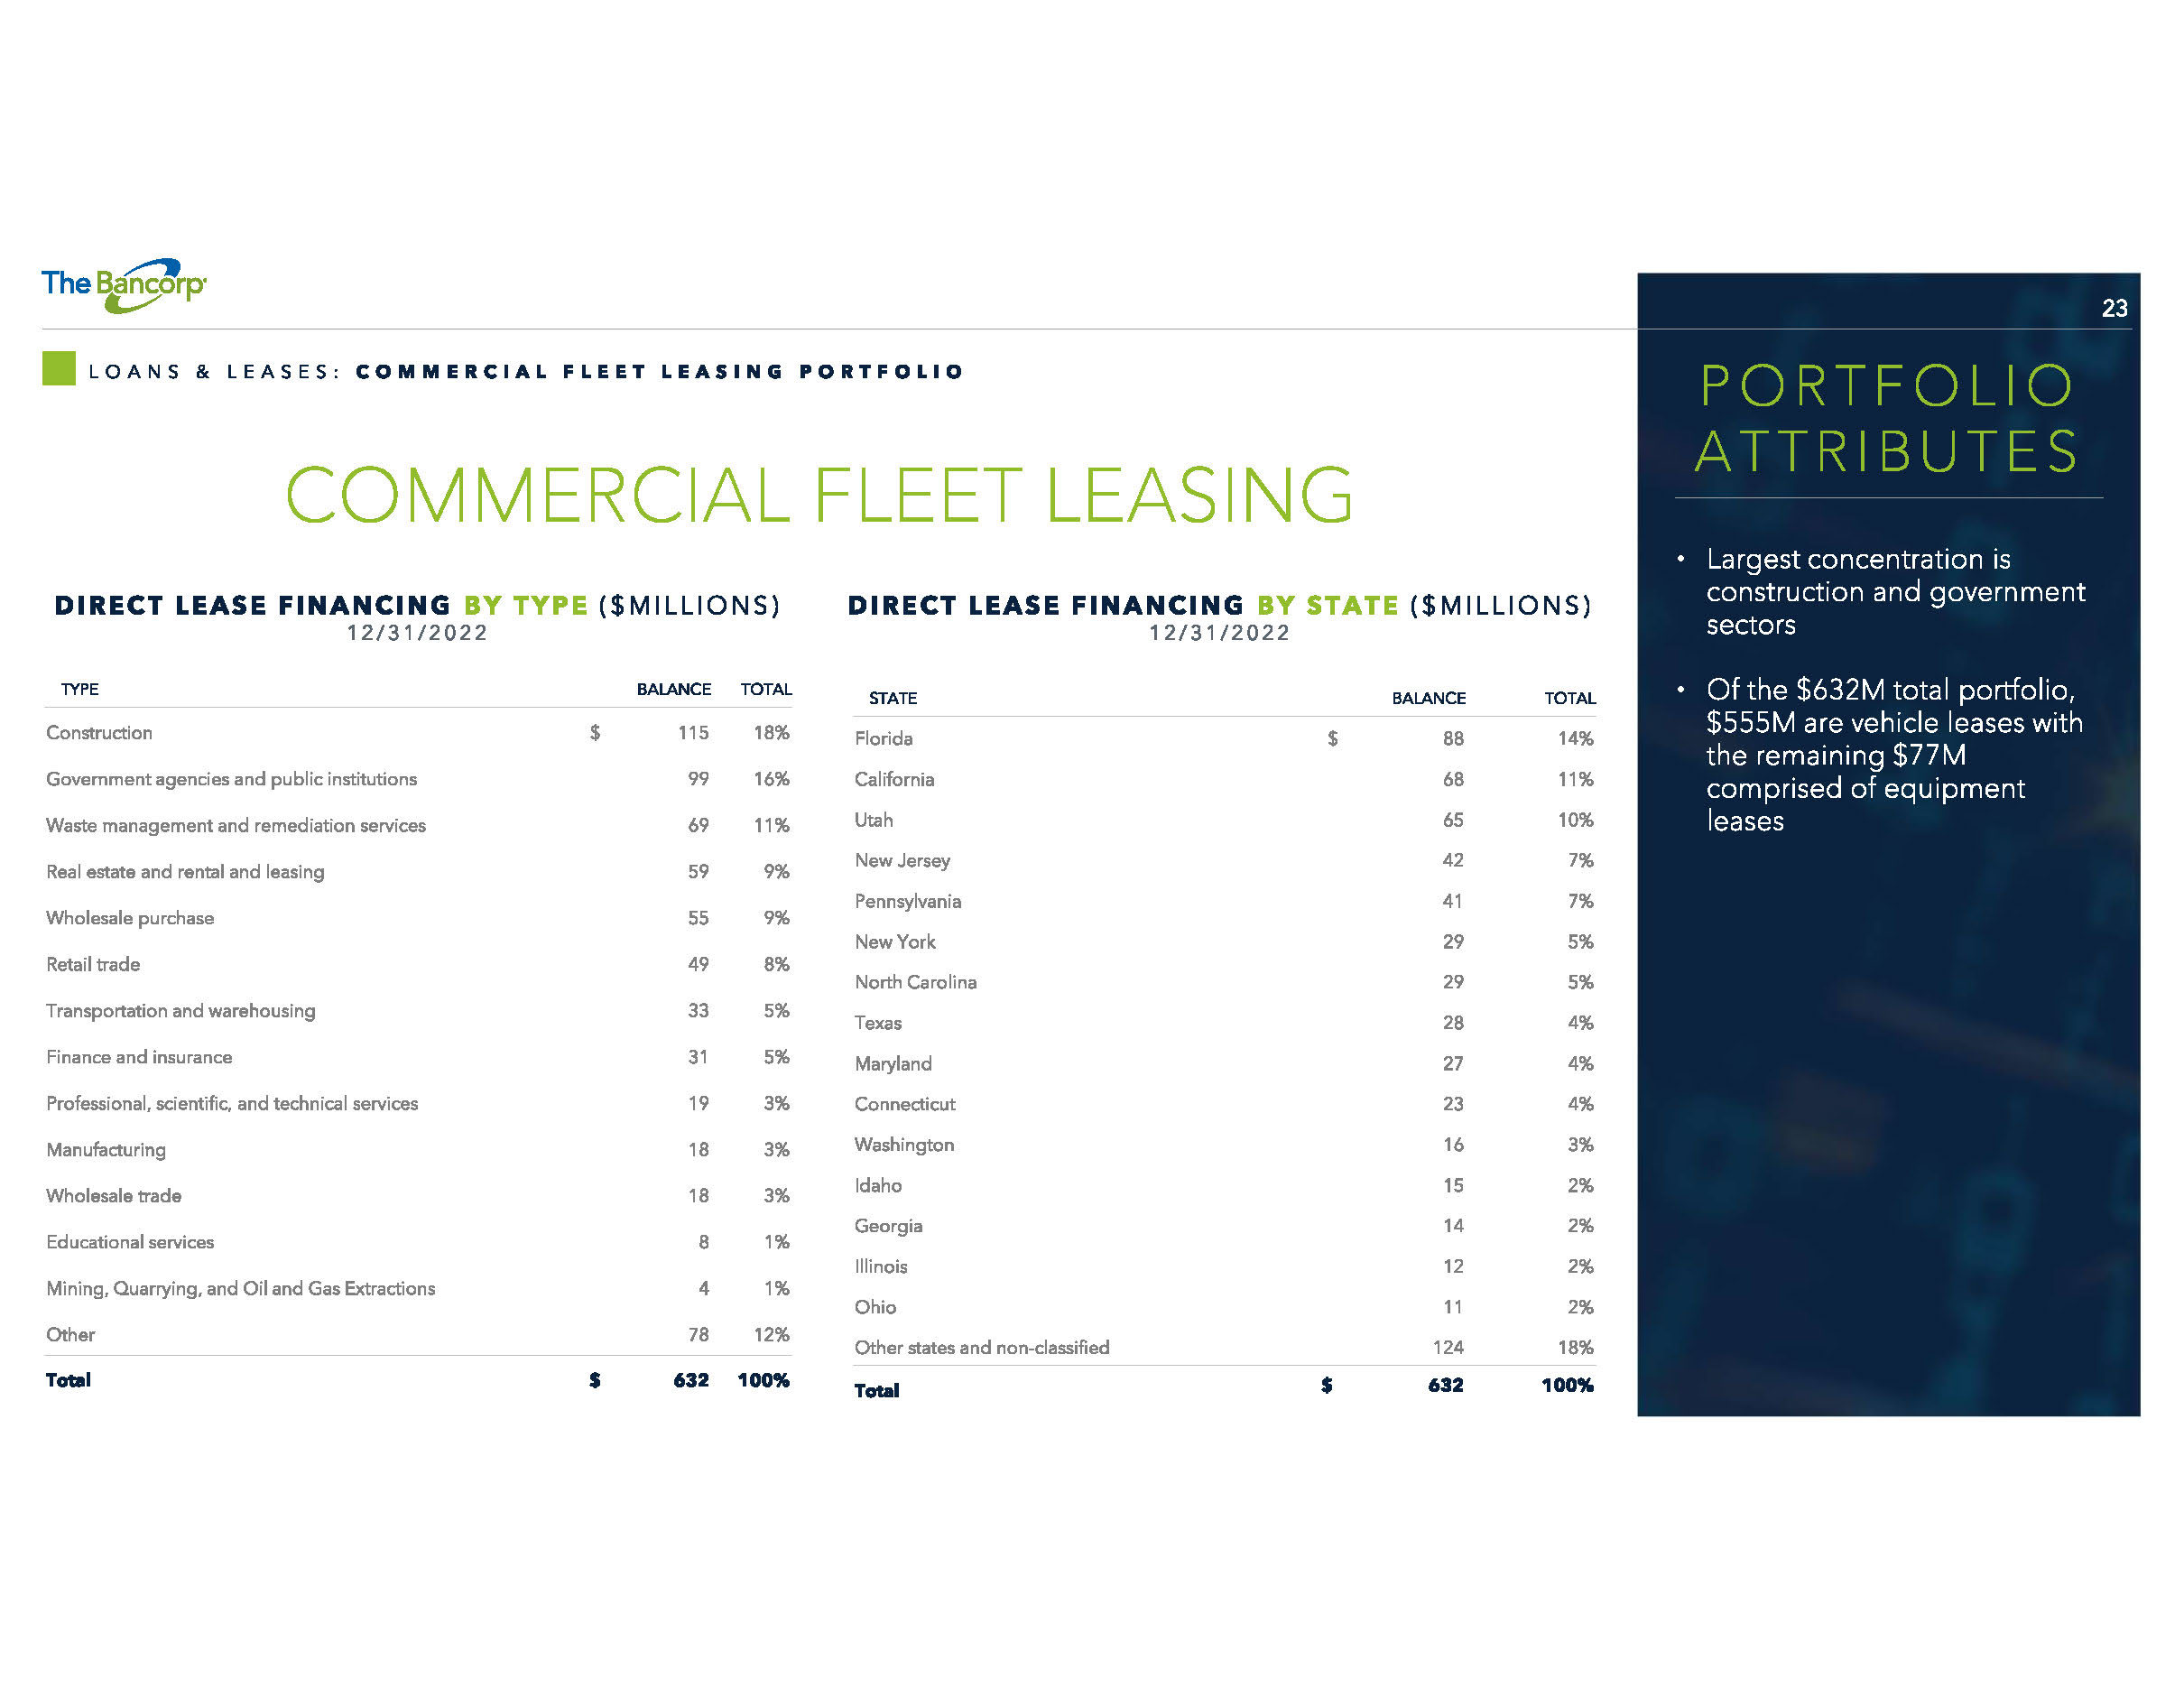
23 LOANS & LEASES: COMMERCIAL FLEET LEASING PORTFOLIO • Largest concentration is construction and government sectors • Of the $632M total portfolio, $555M are vehicle leases with the remaining $77M comprised of equipment leases PORTFOLIO ATTRIBUTES TYPE BALANCE TOTAL Construction $ 115 18% Government agencies and public institutions 99 16% Waste management and remediation services 69 11% Real estate and rental and leasing 59 9% Wholesale purchase 55 9% Retail trade 49 8% Transportation and warehousing 33 5% Finance and insurance 31 5% Professional, scientific, and technical services 19 3% Manufacturing 18 3% Wholesale trade 18 3% Educational services 8 1% Mining, Quarrying, and Oil and Gas Extractions 4 1% Other 78 12% Total $ 632 100% DIRECT LEASE FINANCING BY STATE ($MILLIONS) 12/31/2022 COMMERCIAL FLEET LEASING STATE BALANCE TOTAL Florida $ 88 14% California 68 11% Utah 65 10% New Jersey 42 7% Pennsylvania 41 7% New York 29 5% North Carolina 29 5% Texas 28 4% Maryland 27 4% Connecticut 23 4% Washington 16 3% Idaho 15 2% Georgia 14 2% Illinois 12 2% Ohio 11 2% Other states and non - classified 124 18% Total $ 632 100% DIRECT LEASE FINANCING BY TYPE ($MILLIONS) 12/31/2022
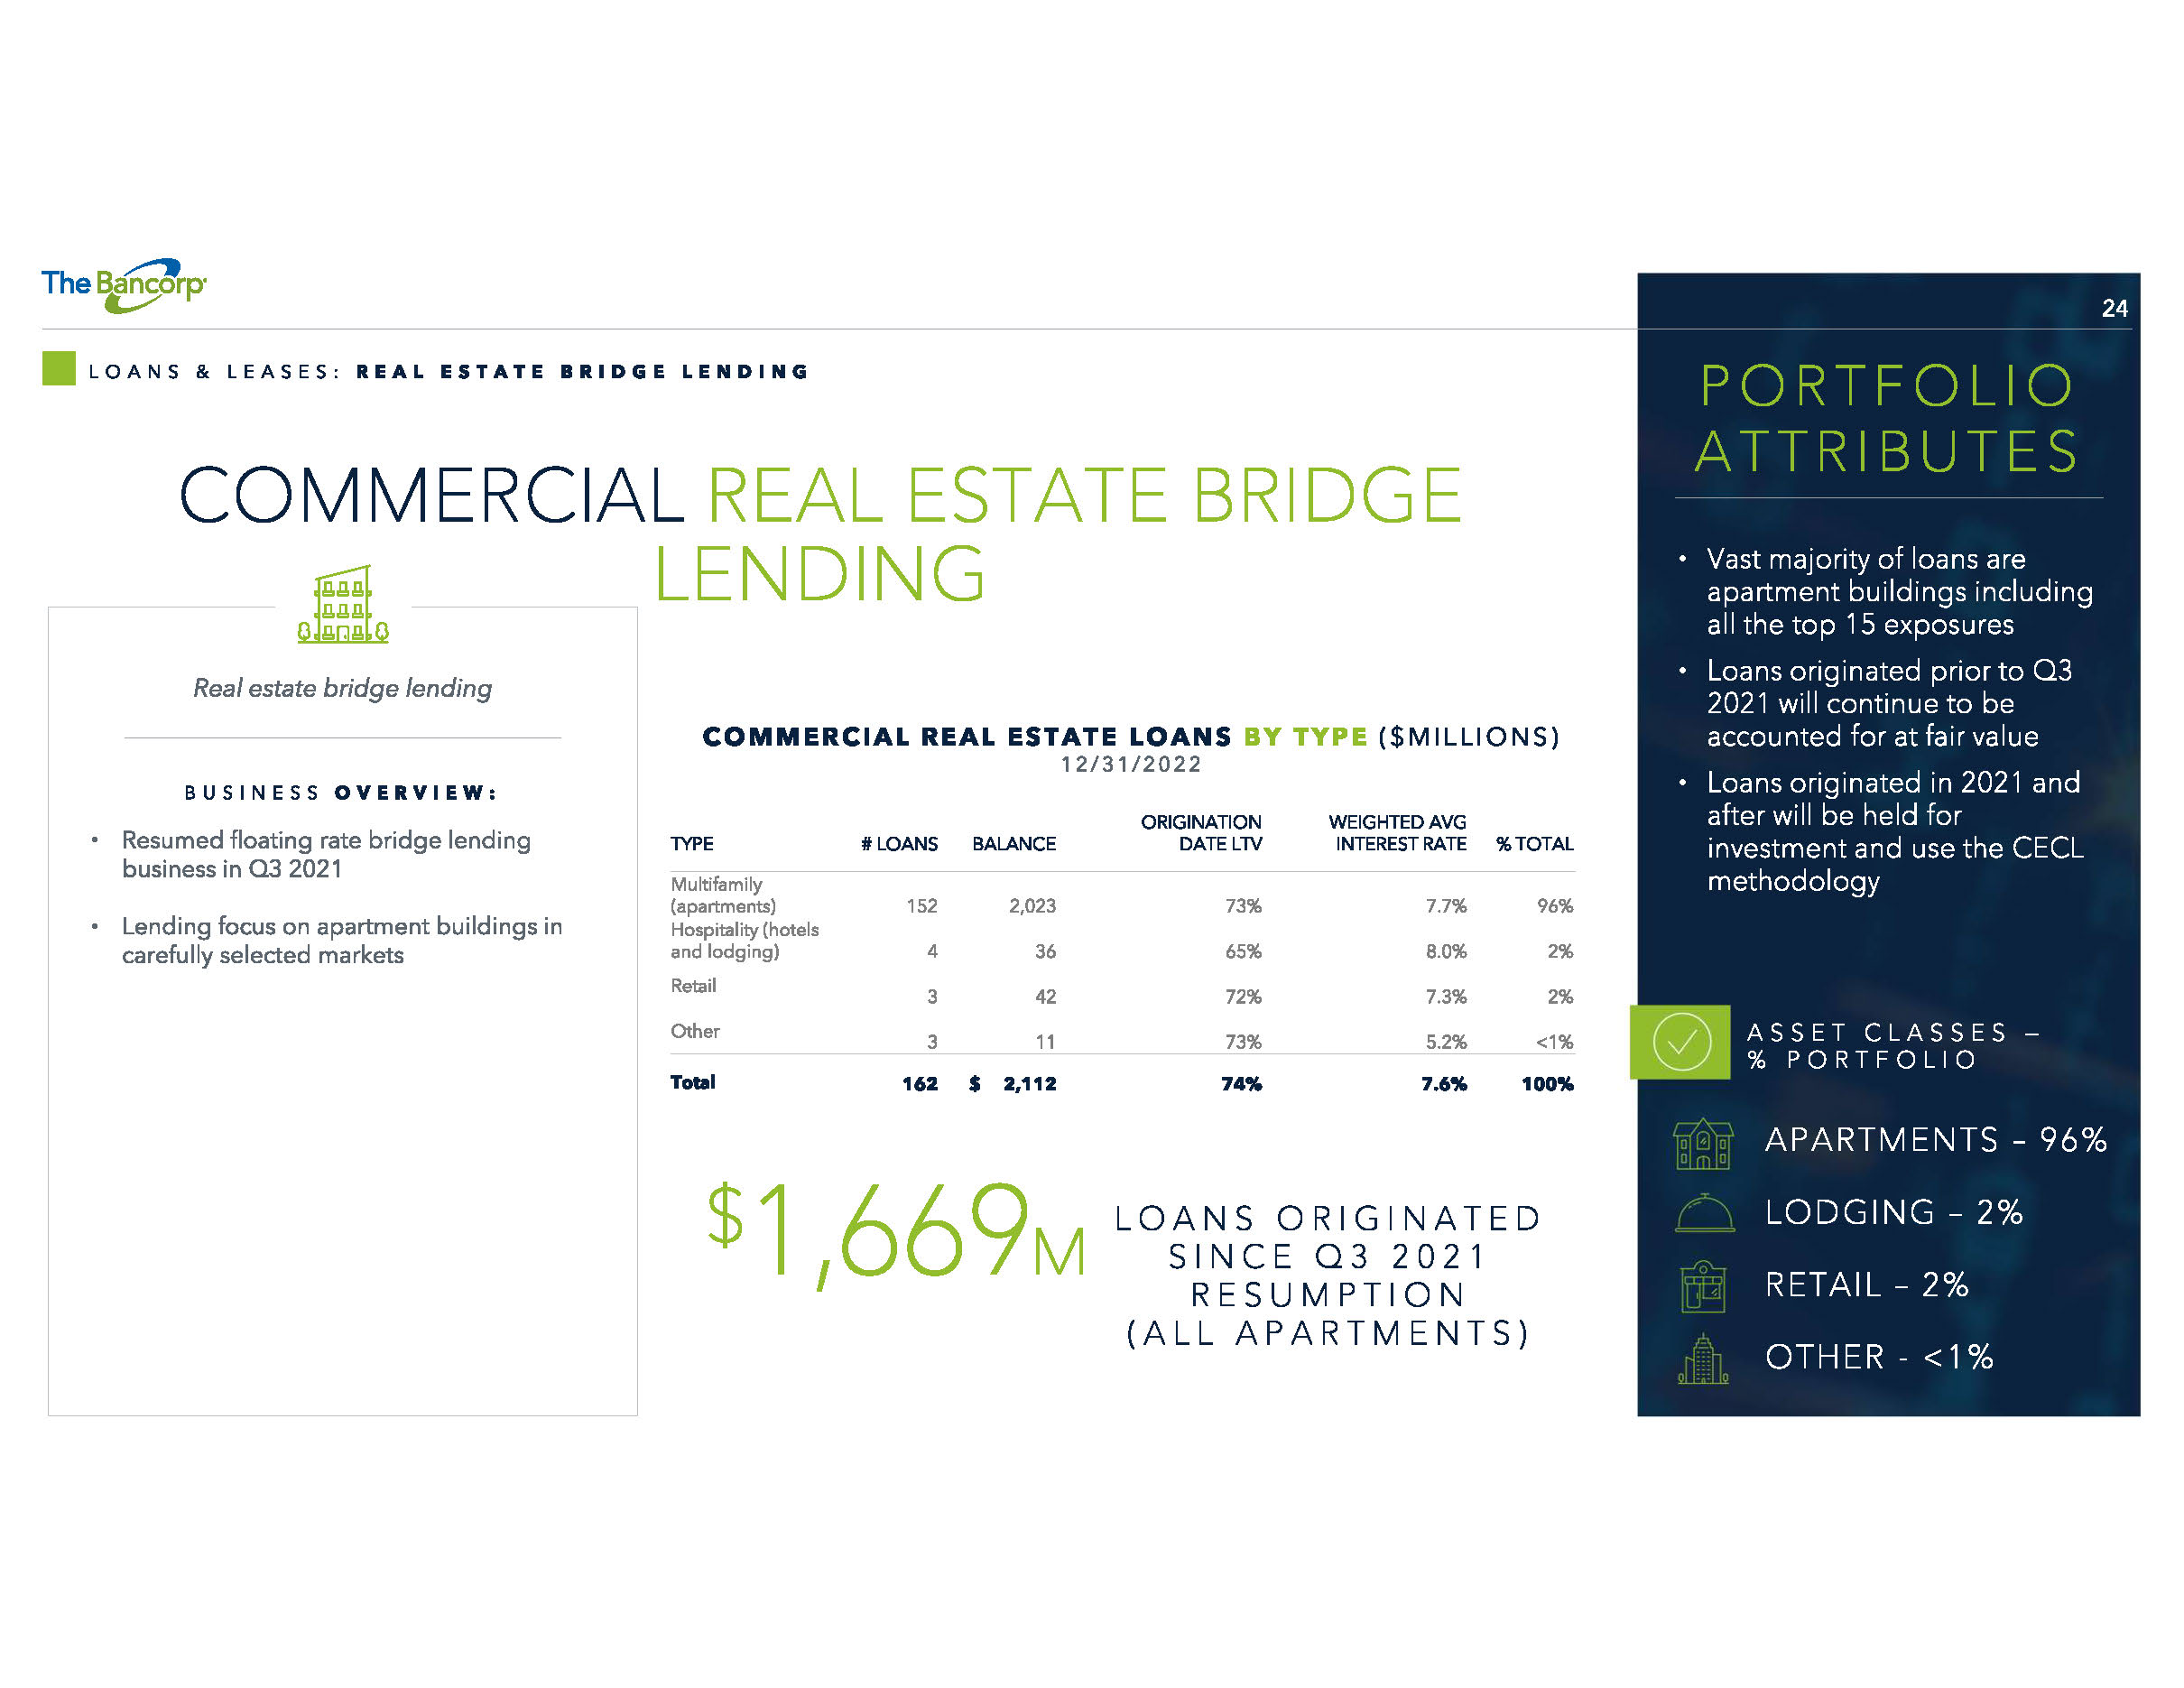
24 COMMERCIAL REAL ESTATE BRIDGE LENDING LOANS & LEASES: REAL ESTATE BRIDGE LENDING TYPE # LOANS BALANCE ORIGINATION DATE LTV WEIGHTED AVG INTEREST RATE % TOTAL Multifamily (apartments) 152 2,023 73% 7.7% 96% Hospitality (hotels and lodging) 4 36 65% 8.0% 2% Retail 3 42 72% 7.3% 2% Other 3 11 73% 5.2% <1% Total 162 $ 2,112 74% 7.6% 100% COMMERCIAL REAL ESTATE LOANS BY TYPE ($MILLIONS) 12/31/2022 BUSINESS OVERVIEW: • Resumed floating rate bridge lending business in Q3 2021 • Lending focus on apartment buildings in carefully selected markets Real estate bridge lending APARTMENTS – 96% LODGING – 2% RETAIL – 2% OTHER - <1% ASSET CLASSES — % PORTFOLIO • Vast majority of loans are apartment buildings including all the top 15 exposures • Loans originated prior to Q3 2021 will continue to be accounted for at fair value • Loans originated in 2021 and after will be held for investment and use the CECL methodology PORTFOLIO ATTRIBUTES $ 1,669 M PORTFOLIO LOANS ORIGINATED SINCE Q3 2021 RESUMPTION (ALL APARTMENTS)
FINANCIAL REVIEW
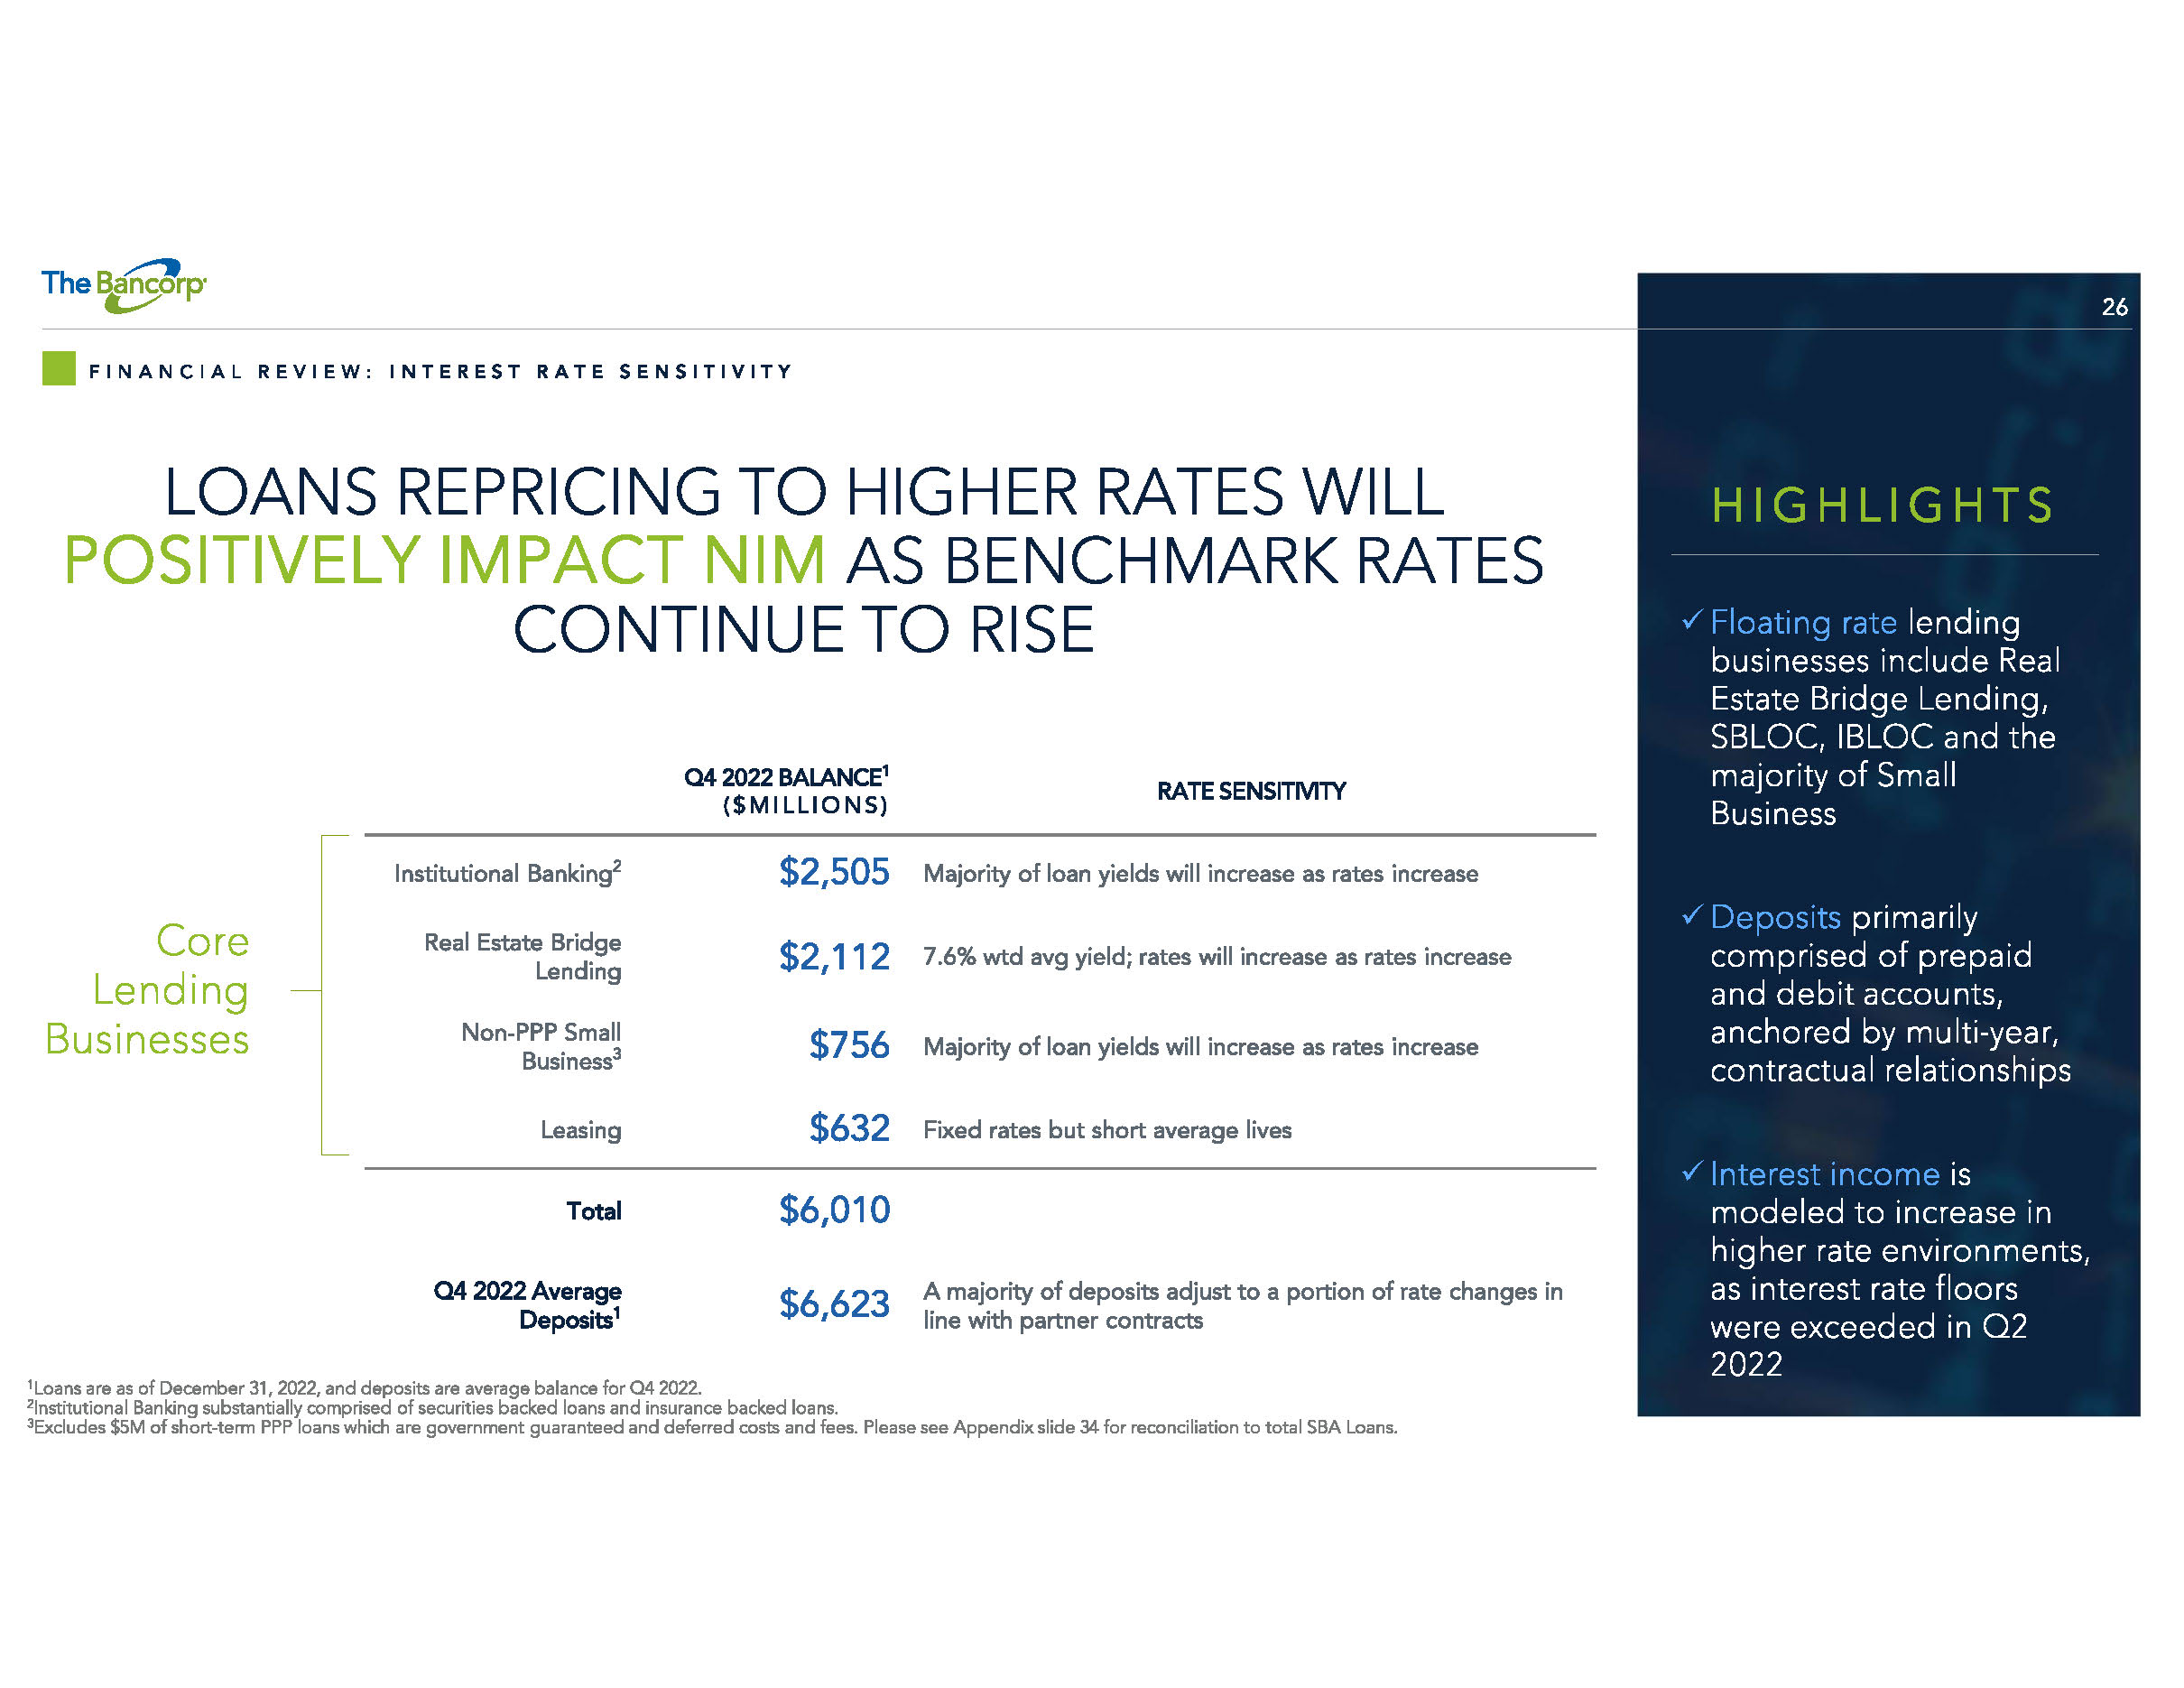
26 LOANS REPRICING TO HIGHER RATES WILL POSITIVELY IMPACT NIM AS BENCHMARK RATES CONTINUE TO RISE FINANCIAL REVIEW: INTEREST RATE SENSITIVITY 1 Loans are as of December 31, 2022, and deposits are average balance for Q4 2022. 2 Institutional Banking substantially comprised of securities backed loans and insurance backed loans. 3 Excludes $5M of short - term PPP loans which are government guaranteed and deferred costs and fees. Please see Appendix slide 34 f or reconciliation to total SBA Loans. Q4 2022 BALANCE 1 ($MILLIONS) RATE SENSITIVITY Institutional Banking 2 $2,505 Majority of loan yields will increase as rates increase Real Estate Bridge Lending $2,112 7.6% wtd avg yield; rates will increase as rates increase Non - PPP Small Business 3 $756 Majority of loan yields will increase as rates increase Leasing $632 Fixed rates but short average lives Total $6,010 Q4 2022 Average Deposits 1 $6,623 A majority of deposits adjust to a portion of rate changes in line with partner contracts Core Lending Businesses HIGHLIGHTS x Floating rate lending businesses include Real Estate Bridge Lending, SBLOC, IBLOC and the majority of Small Business x Deposits primarily comprised of prepaid and debit accounts, anchored by multi - year, contractual relationships x Interest income is modeled to increase in higher rate environments, as interest rate floors were exceeded in Q2 2022
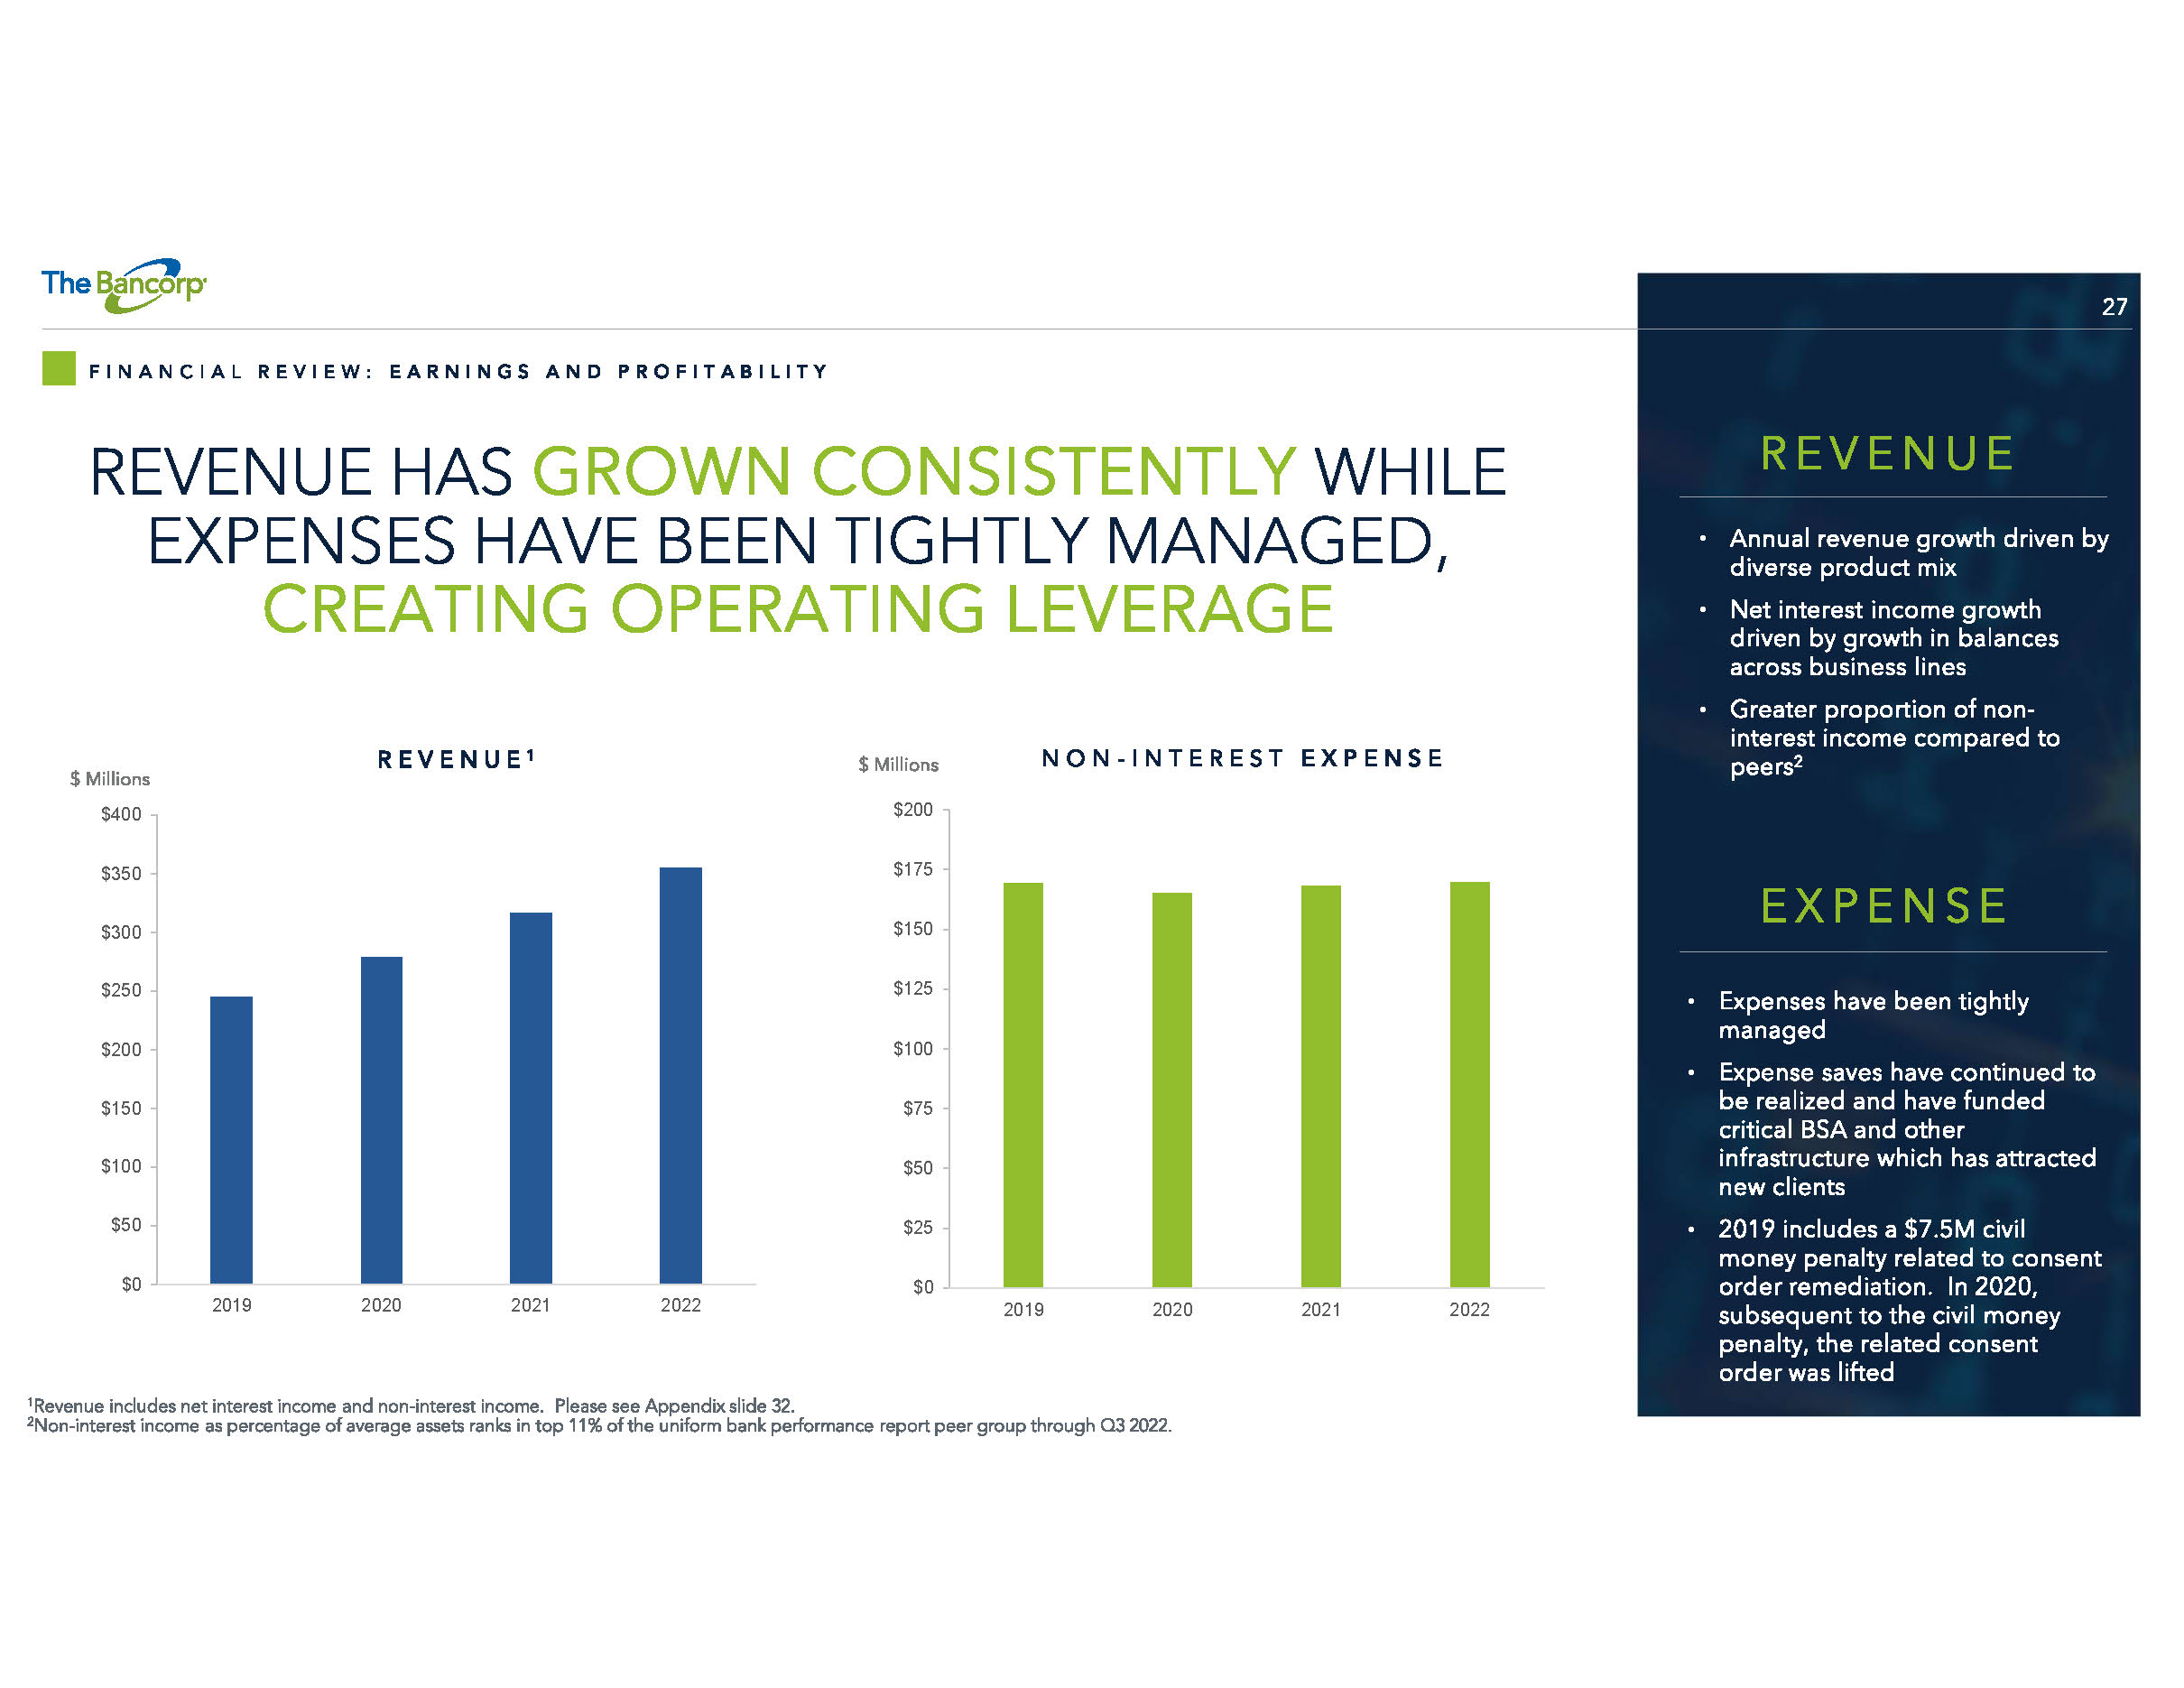
27 REVENUE HAS GROWN CONSISTENTLY WHILE EXPENSES HAVE BEEN TIGHTLY MANAGED, CREATING OPERATING LEVERAGE FINANCIAL REVIEW: EARNINGS AND PROFITABILITY 1 Revenue includes net interest income and non - interest income. Please see Appendix slide 32. 2 Non - interest income as percentage of average assets ranks in top 11% of the uniform bank performance report peer group through Q 3 2022. $0 $25 $50 $75 $100 $125 $150 $175 $200 2019 2020 2021 2022 NON - INTEREST EXPENSE $ Millions REVENUE • Annual revenue growth driven by diverse product mix • Net interest income growth driven by growth in balances across business lines • Greater proportion of non - interest income compared to peers 2 EXPENSE • Expenses have been tightly managed • Expense saves have continued to be realized and have funded critical BSA and other infrastructure which has attracted new clients • 2019 includes a $7.5M civil money penalty related to consent order remediation. In 2020, subsequent to the civil money penalty, the related consent order was lifted $0 $50 $100 $150 $200 $250 $300 $350 $400 2019 2020 2021 2022 REVENUE 1 $ Millions
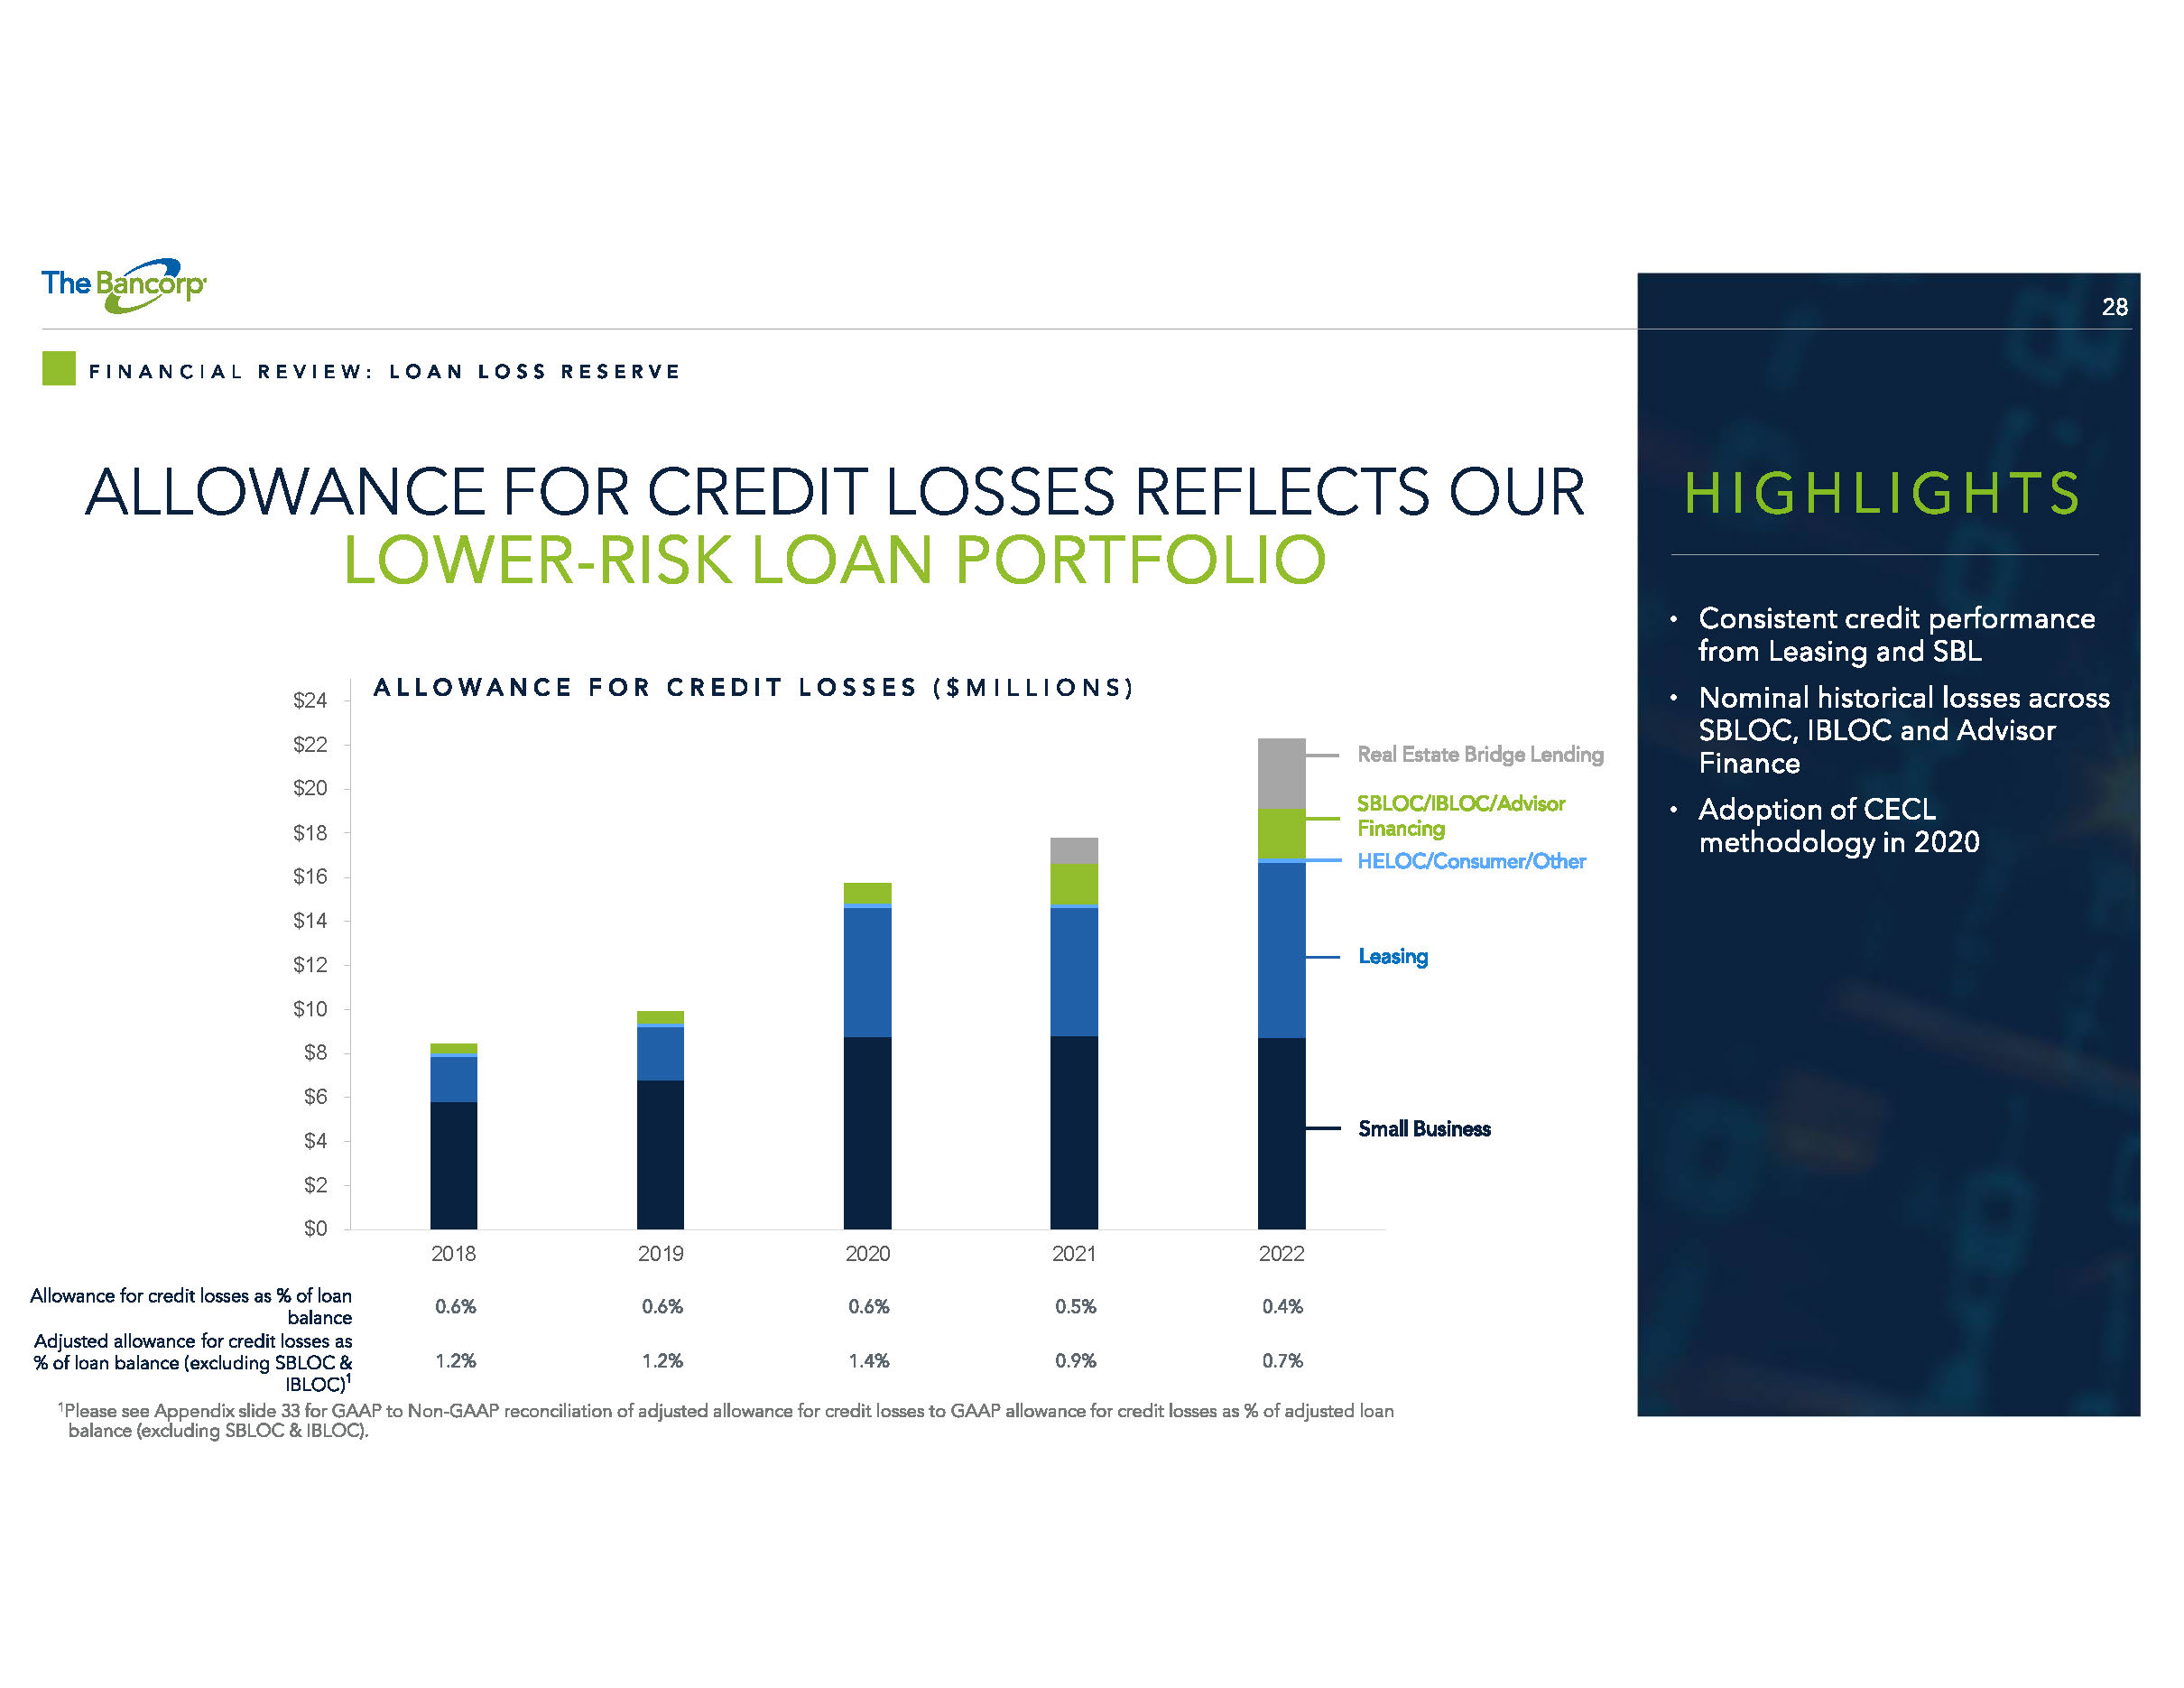
28 $0 $2 $4 $6 $8 $10 $12 $14 $16 $18 $20 $22 $24 2018 2019 2020 2021 2022 ALLOWANCE FOR CREDIT LOSSES REFLECTS OUR LOWER - RISK LOAN PORTFOLIO FINANCIAL REVIEW: LOAN LOSS RESERVE ALLOWANCE FOR CREDIT LOSSES ($MILLIONS) Small Business HELOC/Consumer/Other SBLOC/IBLOC/Advisor Financing Allowance for credit losses as % of loan balance 0.6% 0.6% 0.6% 0.5% 0.4% Adjusted allowance for credit losses as % of loan balance (excluding SBLOC & IBLOC) 1 1.2% 1.2% 1.4% 0.9% 0.7% HIGHLIGHTS • Consistent credit performance from Leasing and SBL • Nominal historical losses across SBLOC, IBLOC and Advisor Finance • Adoption of CECL methodology in 2020 Leasing Real Estate Bridge Lending 1 Please see Appendix slide 33 for GAAP to Non - GAAP reconciliation of adjusted allowance for credit losses to GAAP allowance for c redit losses as % of adjusted loan balance (excluding SBLOC & IBLOC).
29 CAPITAL POSITION FINANCIAL REVIEW: HISTORICAL CAPITAL POSITION HIGHLIGHTS • Executed common stock buyback program of $15M per quarter throughout 2022 • We expect to increase the stock buyback program to $25M per quarter in 2023 2 • Corporate governance requires periodic assessment of capital minimums • Capital planning includes stress testing for unexpected conditions and events 0% 5% 10% 15% 20% 25% 2019 2020 2021 2022 Tier 1 Leverage Ratio 9.5% 9.1% 10.9% 10.7% 5.0% Tier 1 Risk - based Capital Ratio (RBC) 1 19% 14% 15% 15% 8% Total Risk - based Capital Ratio 19% 15% 16% 15% 10% Tier 1 Capital Ratio Total RBC Ratio Tier 1 Leverage Ratio THE BANCORP BANK, N.A. CAPITAL RATIOS 1 Common Equity Tier 1 to risk weighted assets is identical to Tier 1 risk - based ratio and has a 6.5% well capitalized minimum. 2 Buyback may be modified without notice at any time. Well - capitalized minimum
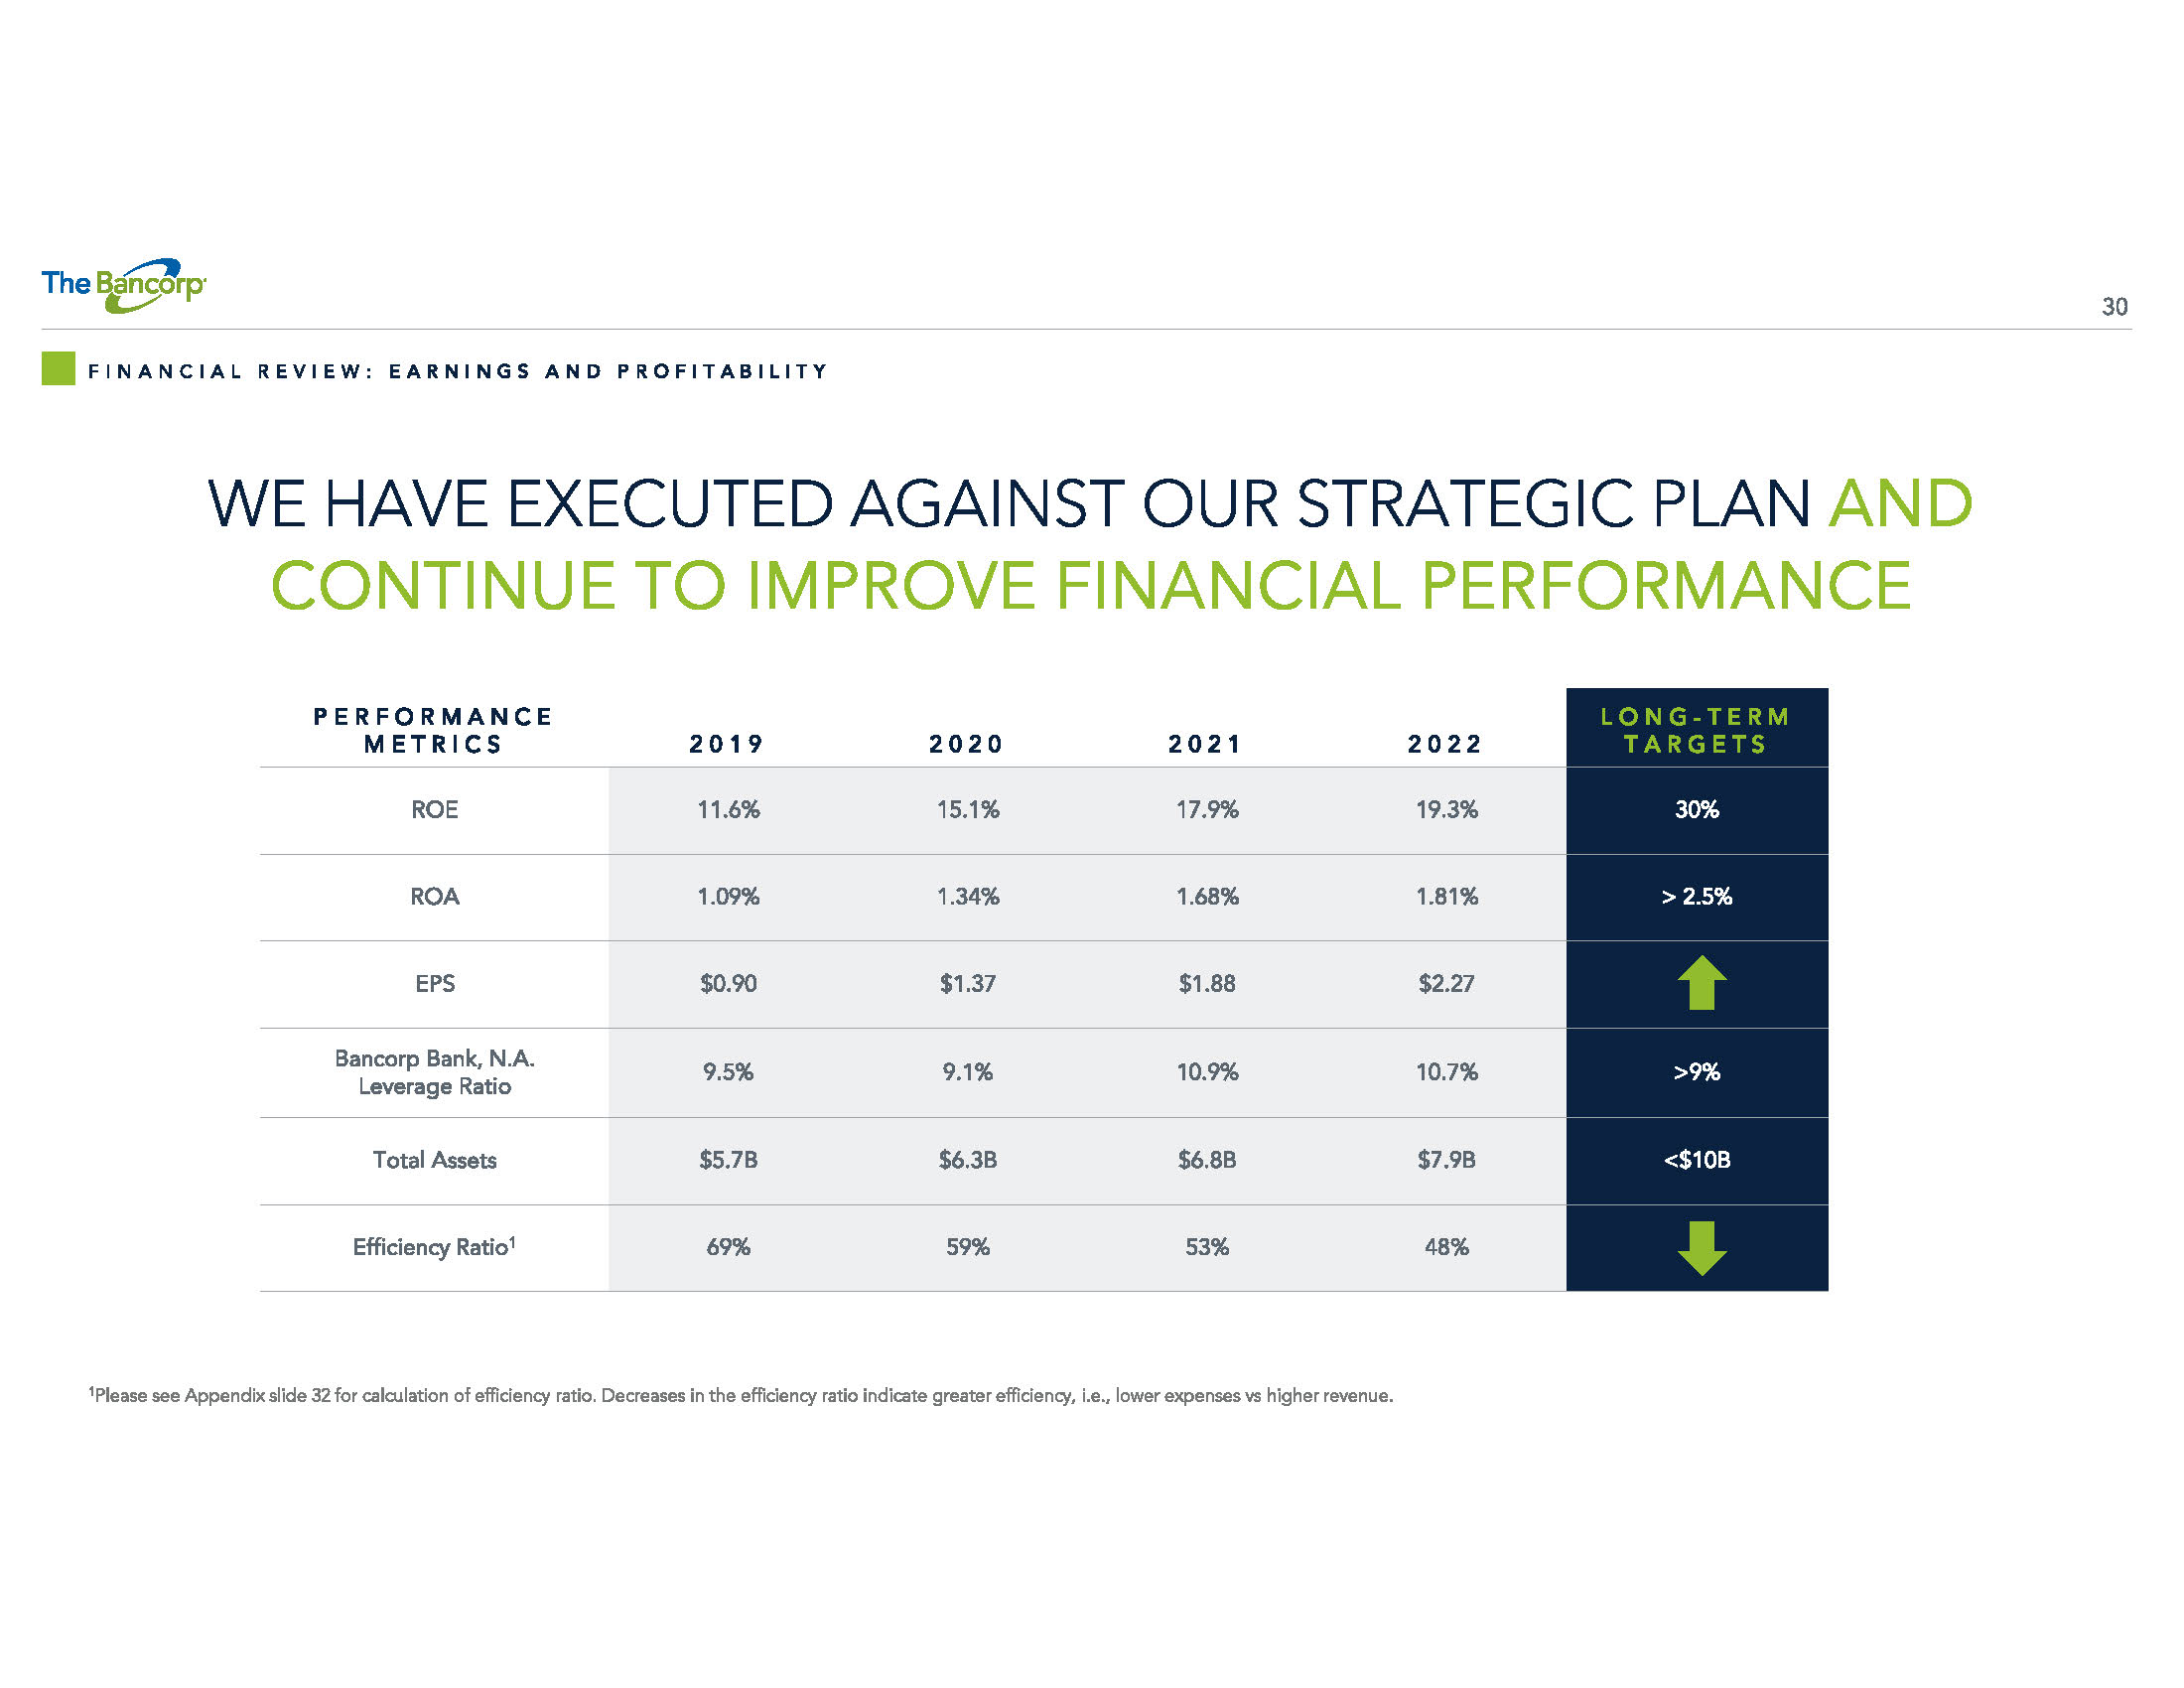
30 WE HAVE EXECUTED AGAINST OUR STRATEGIC PLAN AND CONTINUE TO IMPROVE FINANCIAL PERFORMANCE FINANCIAL REVIEW: EARNINGS AND PROFITABILITY PERFORMANCE METRICS 2019 2020 2021 2022 LONG - TERM TARGETS ROE 11.6% 15.1% 17.9% 19.3% 30% ROA 1.09% 1.34% 1.68% 1.81% > 2.5% EPS $0.90 $1.37 $1.88 $2.27 Bancorp Bank, N.A. Leverage Ratio 9.5% 9.1% 10.9% 10.7% >9% Total Assets $5.7B $6.3B $6.8B $7.9B <$10B Efficiency Ratio 1 69% 59% 53% 48% 1 Please see Appendix slide 32 for calculation of efficiency ratio. Decreases in the efficiency ratio indicate greater efficien cy, i.e., lower expenses vs higher revenue.
APPENDIX
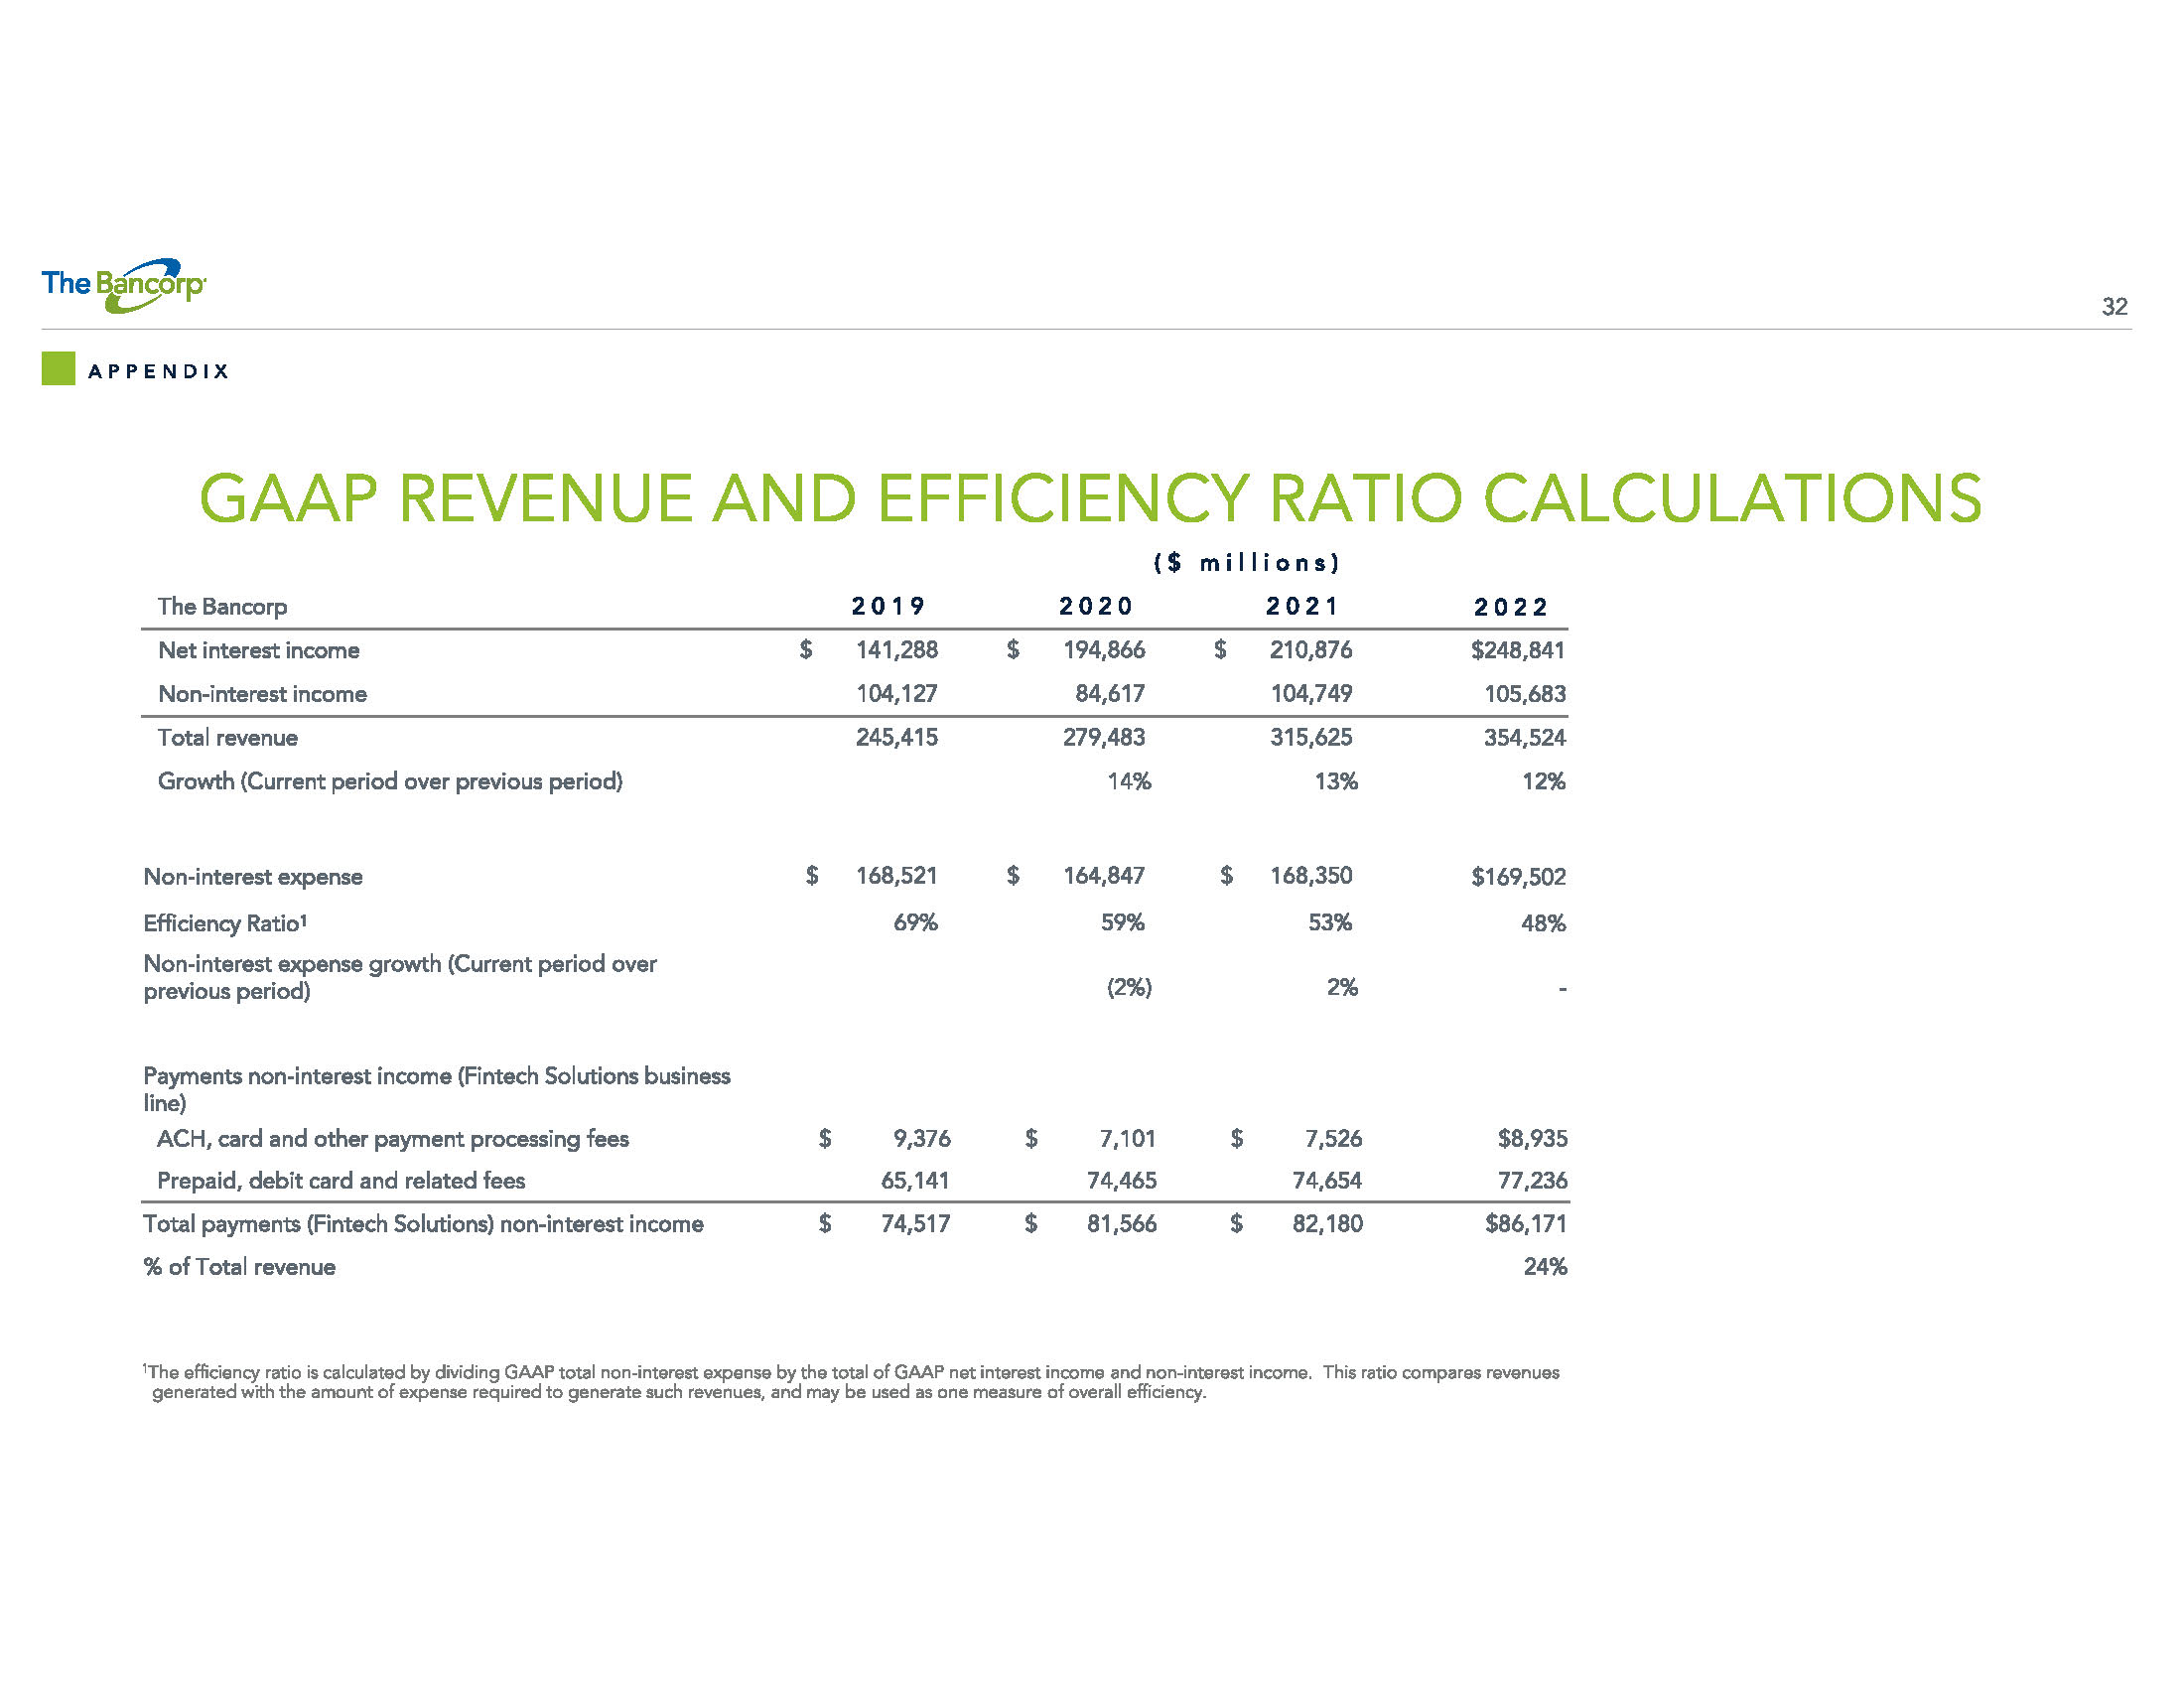
32 GAAP REVENUE AND EFFICIENCY RATIO CALCULATIONS APPENDIX ($ millions) The Bancorp 2019 2020 2021 2022 Net interest income $ 141,288 $ 194,866 $ 210,876 $248,841 Non - interest income 104,127 84,617 104,749 105,683 Total revenue 245,415 279,483 315,625 354,524 Growth (Current period over previous period) 14% 13% 12% Non - interest expense $ 168,521 $ 164,847 $ 168,350 $169,502 Efficiency Ratio 1 69% 59% 53% 48% Non - interest expense growth (Current period over previous period) (2%) 2% - Payments non - interest income (Fintech Solutions business line) ACH, card and other payment processing fees $ 9,376 $ 7,101 $ 7,526 $8,935 Prepaid, debit card and related fees 65,141 74,465 74,654 77,236 Total payments (Fintech Solutions) non - interest income $ 74,517 $ 81,566 $ 82,180 $86,171 % of Total revenue 24% 1 The efficiency ratio is calculated by dividing GAAP total non - interest expense by the total of GAAP net interest income and non - interest income. This ratio compares revenues generated with the amount of expense required to generate such revenues, and may be used as one measure of overall efficiency .
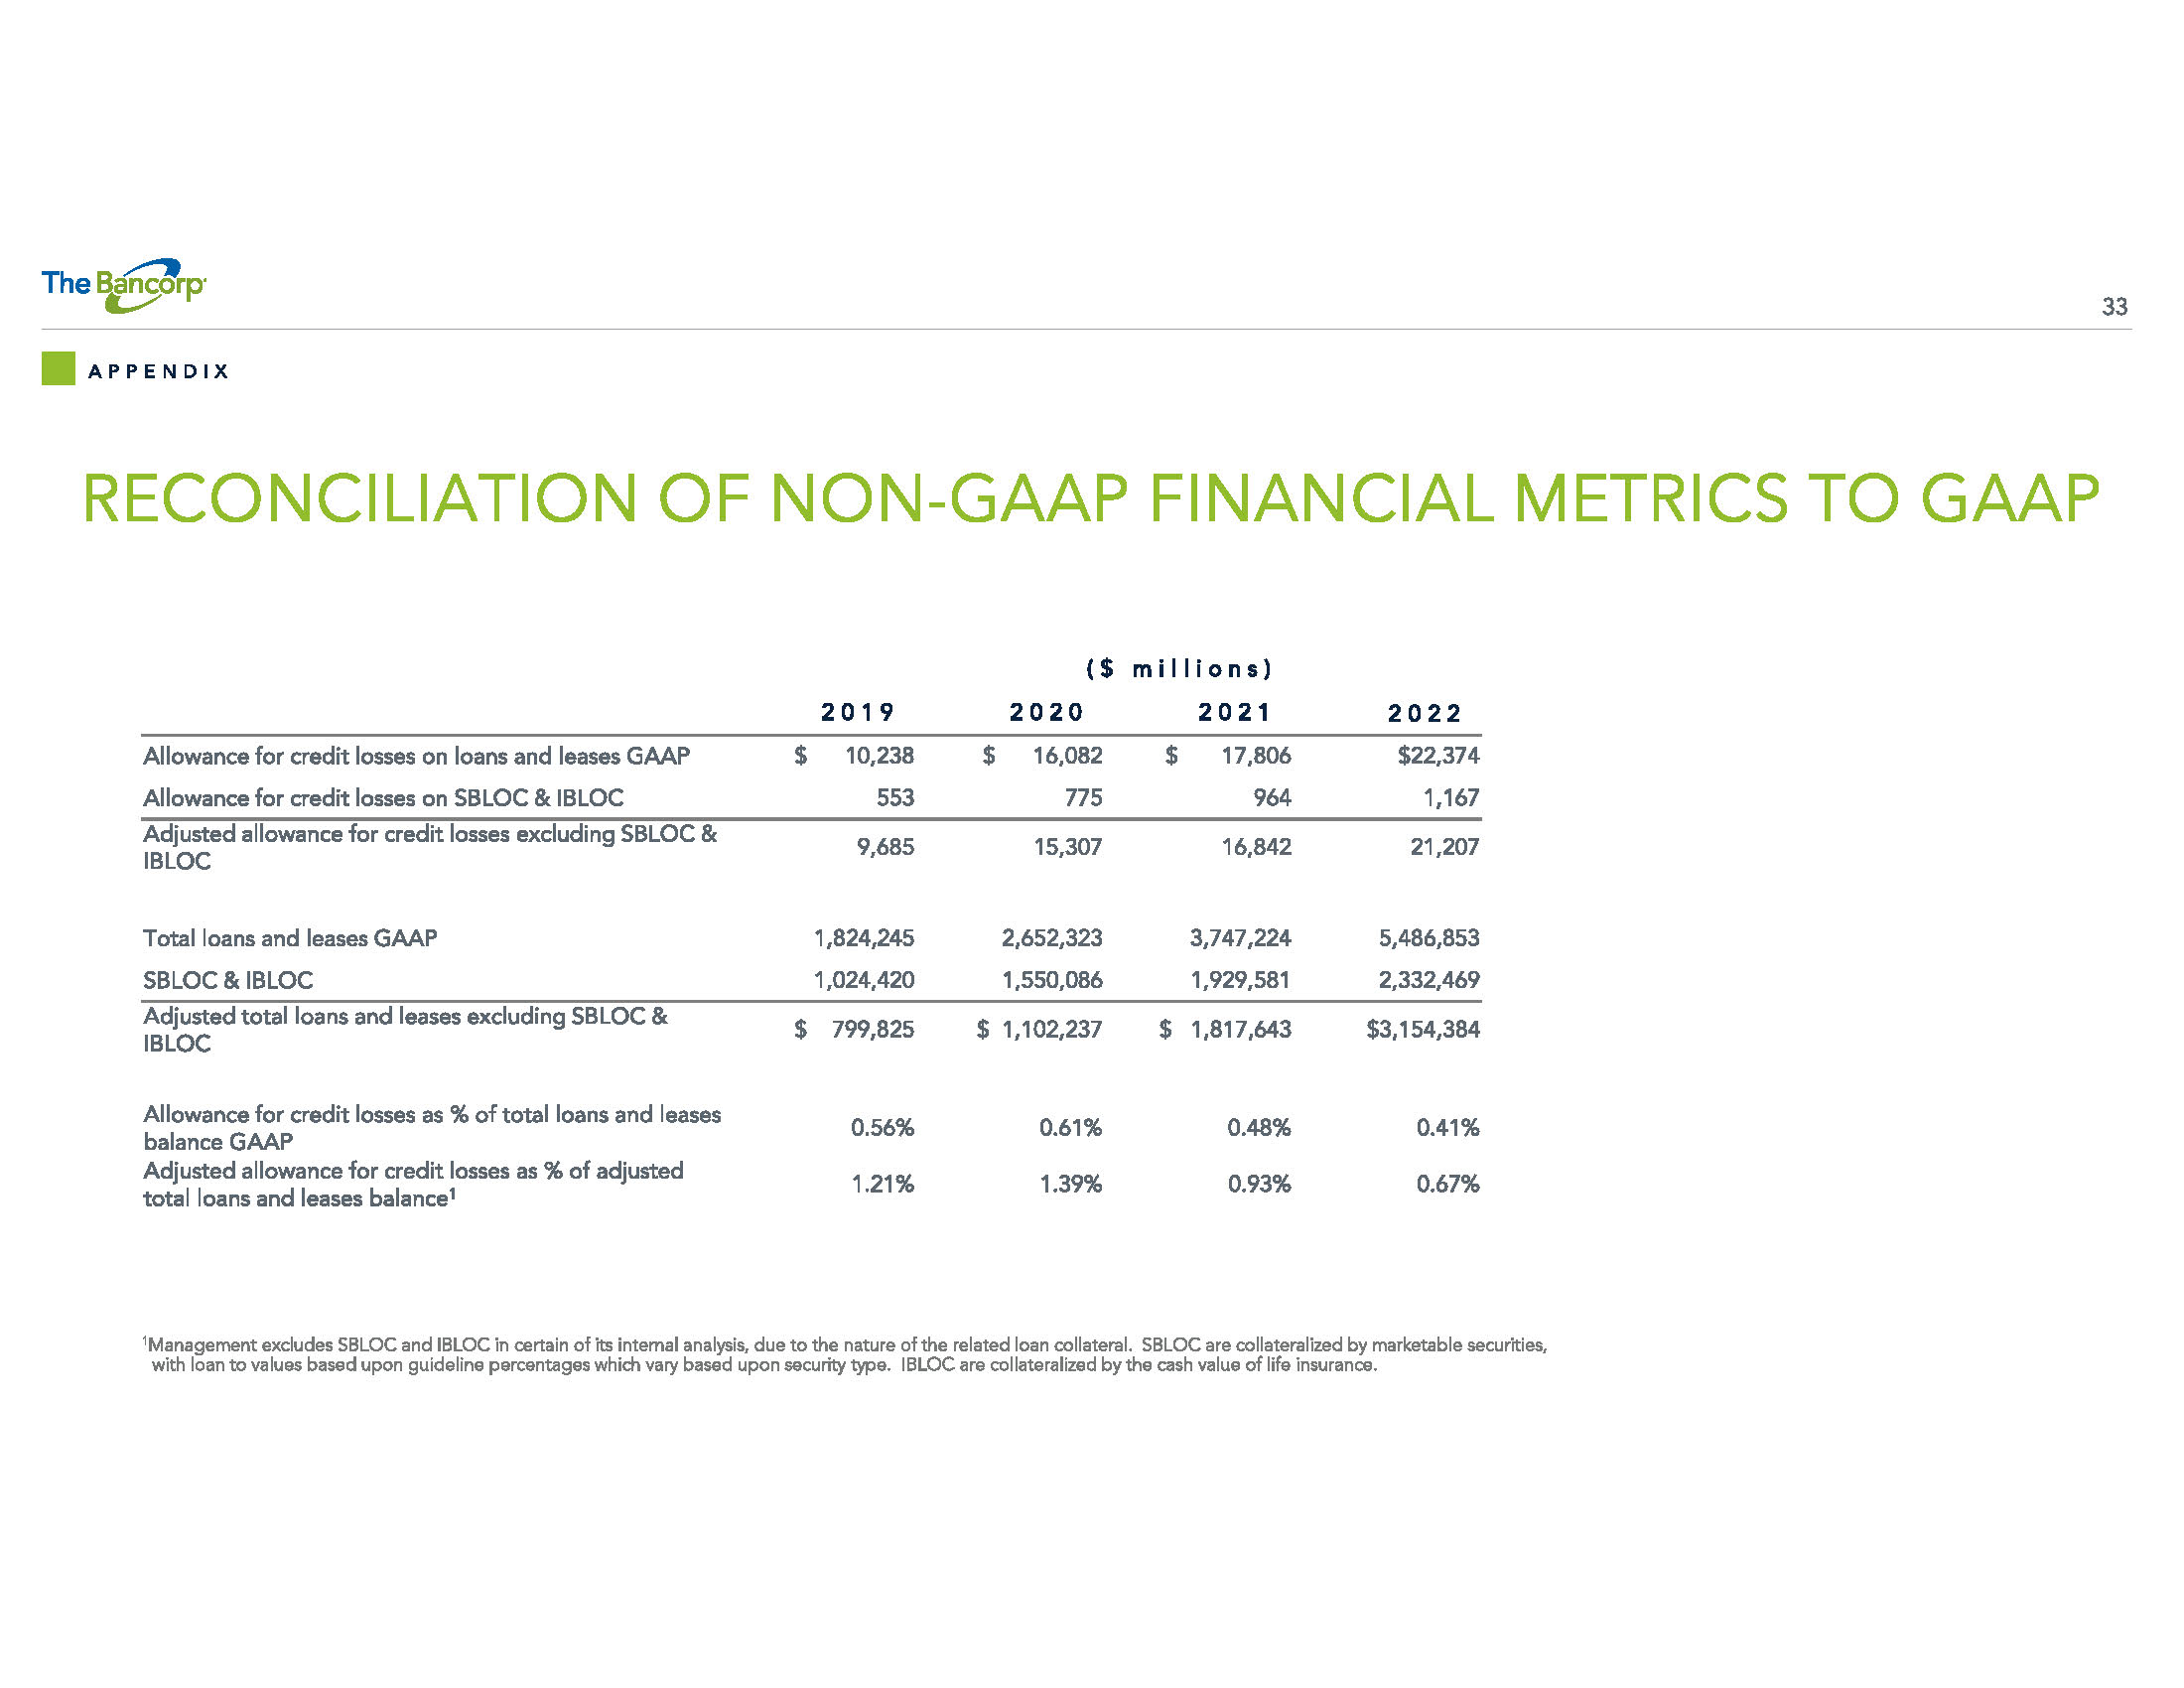
33 RECONCILIATION OF NON - GAAP FINANCIAL METRICS TO GAAP APPENDIX ($ millions) 2019 2020 2021 2022 Allowance for credit losses on loans and leases GAAP $ 10,238 $ 16,082 $ 17,806 $22,374 Allowance for credit losses on SBLOC & IBLOC 553 775 964 1,167 Adjusted allowance for credit losses excluding SBLOC & IBLOC 9,685 15,307 16,842 21,207 Total loans and leases GAAP 1,824,245 2,652,323 3,747,224 5,486,853 SBLOC & IBLOC 1,024,420 1,550,086 1,929,581 2,332,469 Adjusted total loans and leases excluding SBLOC & IBLOC $ 799,825 $ 1,102,237 $ 1,817,643 $3,154,384 Allowance for credit losses as % of total loans and leases balance GAAP 0.56% 0.61% 0.48% 0.41% Adjusted allowance for credit losses as % of adjusted total loans and leases balance 1 1.21% 1.39% 0.93% 0.67% 1 Management excludes SBLOC and IBLOC in certain of its internal analysis, due to the nature of the related loan collateral. S BLO C are collateralized by marketable securities, with loan to values based upon guideline percentages which vary based upon security type. IBLOC are collateralized by the ca sh value of life insurance.
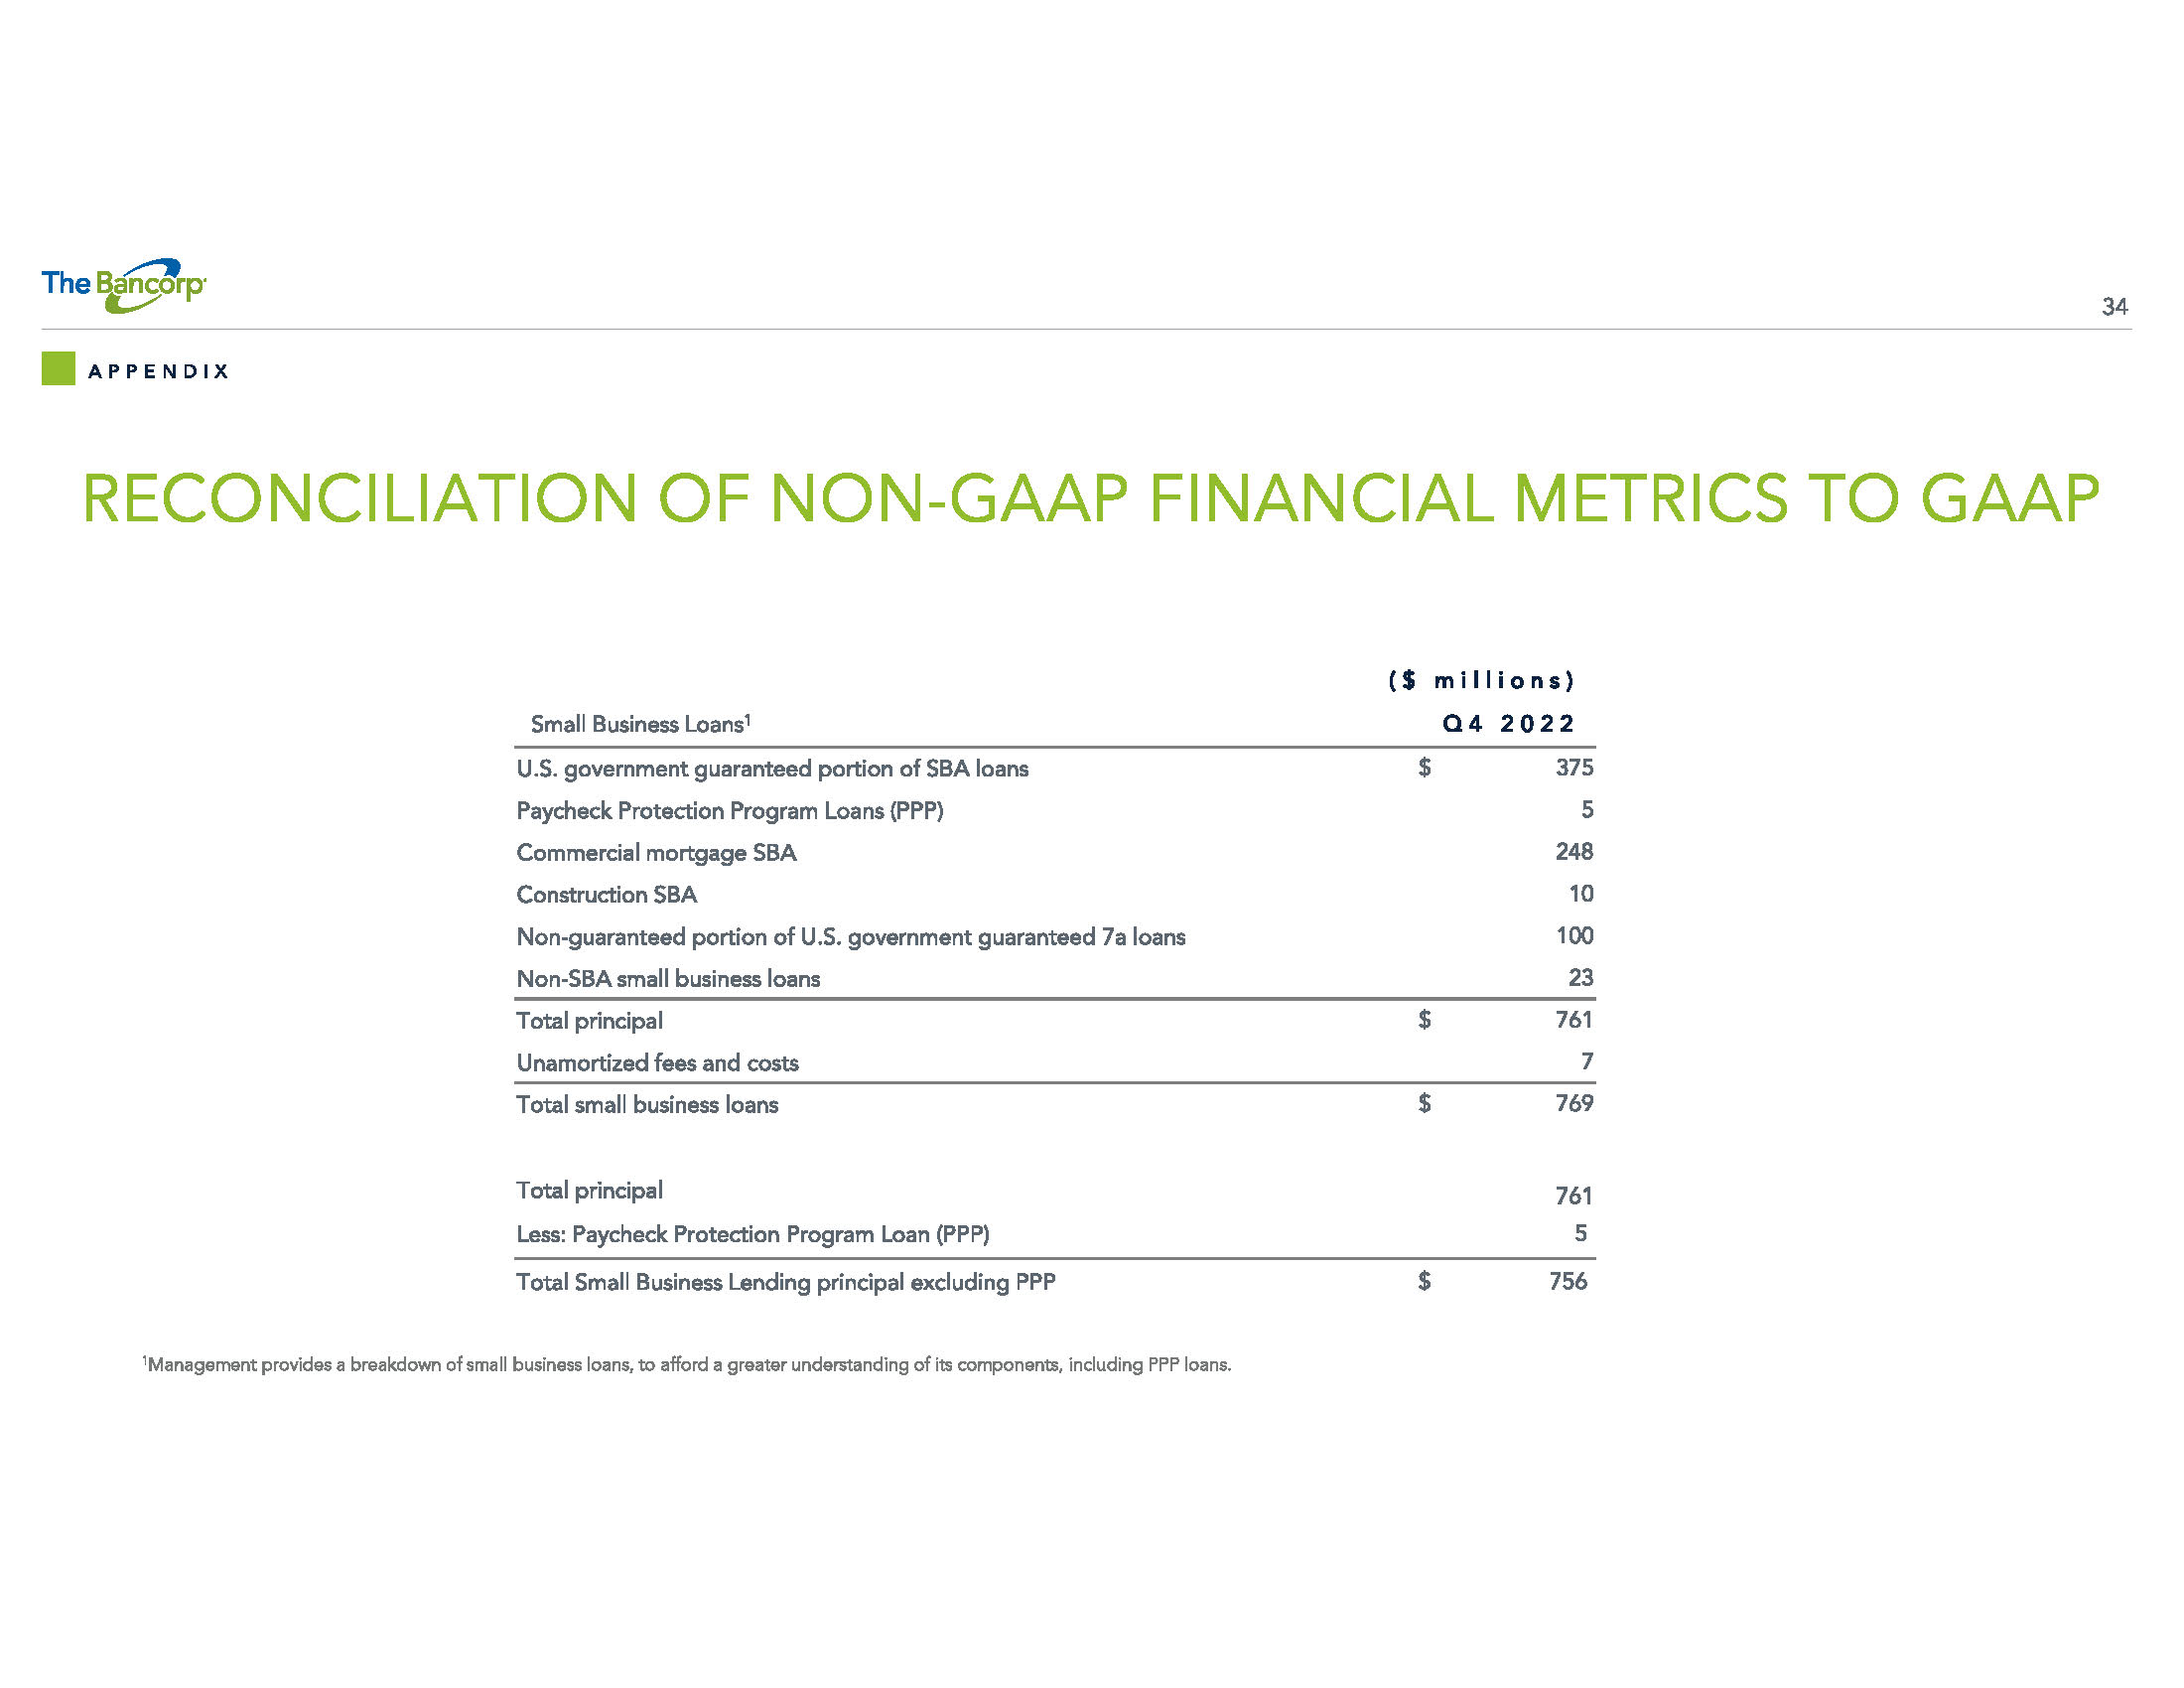
34 RECONCILIATION OF NON - GAAP FINANCIAL METRICS TO GAAP APPENDIX ($ millions) Small Business Loans 1 Q4 2022 U.S. government guaranteed portion of SBA loans $ 375 Paycheck Protection Program Loans (PPP) 5 Commercial mortgage SBA 248 Construction SBA 10 Non - guaranteed portion of U.S. government guaranteed 7a loans 100 Non - SBA small business loans 23 Total principal $ 761 Unamortized fees and costs 7 Total small business loans $ 769 Total principal 761 Less: Paycheck Protection Program Loan (PPP) 5 Total Small Business Lending principal excluding PPP $ 756 1 Management provides a breakdown of small business loans, to afford a greater understanding of its components, including PPP l oan s.
D!
M\@'Z @,"# (4 AT")@(O C@"00)+ E0"70)G G$">@*$ HX"F *B JP"M@+!
M LL"U0+@ NL"]0, PL#%@,A RT#. -# T\#6@-F W(#?@.* Y8#H@.N [H#
MQP/3 ^ #[ /Y! 8$$P0@!"T$.P1(!%4$8P1Q!'X$C 2:!*@$M@3$!-,$X03P
M!/X%#044%]@8&!A8&)P8W!D@&
M609J!GL&C :=!J\&P ;1!N,&]0<'!QD'*P<]!T\'80=T!X8'F0>L![\'T@?E
M!_@("P@?"#((1@A:"&X(@@B6"*H(O@C2".<(^PD0"24).@E/"60)>0F/":0)
MN@G/">4)^PH1"B<*/0I4"FH*@0J8"JX*Q0K<"O,+"PLB"SD+40MI"X +F NP
M"\@+X0OY#!(,*@Q##%P,=0R.#*<,P S9#/,-#0TF#4 -6@UT#8X-J0W##=X-
M^ X3#BX.20YD#G\.FPZV#M(.[@\)#R4/00]>#WH/E@^S#\\/[! )$"800Q!A
M$'X0FQ"Y$-<0]1$3$3$13Q%M$8P1JA')$>@2!Q(F$D429!*$$J,2PQ+C$P,3
M(Q-#$V,3@Q.D$\43Y10&%"<4211J%(L4K13.%/ 5$A4T%585>!6;%;T5X!8#
M%B86219L%H\6LA;6%OH7'1=!%V47B1>N%](7]Q@;&$ 891B*&*\8U1CZ&2 9
M11EK&9$9MQG=&@0:*AI1&G<:GAK%&NP;%!L[&V,;BANR&]H< APJ'%(<>QRC
M',P<]1T>'4<=:AZ4'KX>Z1\3'SX?:1^4'[\?ZB 5($$@
M;""8(,0@\"$<(4@A=2&A( &YXS'DJ>8EYYWI&
M>J5[!'MC>\)\(7R!?.%]07VA?@%^8G["?R-_A'_E@$> J($*@6N!S8(P@I*"
M](-7@[J$'82 A..%1X6KA@Z& &C?\_D7YG_ HY&','_"\-&_Y_(OS/
M^%'(PY@_X7AHW_/Y%^9_PHY&','_ O#1O\ G\B_,_X4 &C?\_D7YG_ HY&','_"\-&_Y_(OS/^%'(PY@_X7AHW_/Y
M%^9_PHY&','_ O#1O\ G\B_,_X4 &C
M?\_D7YG_ HY&','_"\-&_Y_(OS/^%'(PY@_X7AHW_/Y%^9_PHY&','_ O#
M1O\ G\B_,_X4 &C?\_D7YG_ HY&','
M_"\-&_Y_(OS/^%'(PY@_X7AHW_/Y%^9_PHY&','_ O#1O\ G\B_,_X4 &C?\_D7YG_ HY&','_"\-&_Y_(OS/^%'(
MPY@_X7AHW_/Y%^9_PHY&','_ O#1O\ G\B_,_X4 _
MPHY6%P_X79H__/W'_P"/?X4 &C?\ /Y%^9_PHY&',
M'_"\-&_Y_(OS/^%'(PY@_P"%X:-_S^1?F?\ "CD8 &C?\_D7YG_"CD8 &C?\ /Y%^9_PHY&','_"\-&_Y_(OS/^%'
M(PY@_P"%X:-_S^1?F?\ "CD8 &C?\_D7YG_"
MCD8 &C?\_D7YG_"CD8 &C?\
M/Y%^9_PHY&','_"\-&_Y_(OS/^%'(PY@_P"%X:-_S^1?F?\ "CD8 &C?\_D7YG_"CD8 &C?\ /Y%^9_PHY&','_"\
M-&_Y_(OS/^%'(PY@_P"%X:-_S^1?F?\ "CD8 &C?\_D7YG_"CD8 &C?\ /Y%^9_PHY&','_"\-&_Y_(OS/^%'(PY@
M_P"%X:-_S^1?F?\ "CD8 &C?\_D7YG_"CD8<
MP?\ "\-&_P"?R+\S_A1R,.8/^%X:-_S^1?F?\*.1AS!_PO#1O^?R+\S_ (4<
MC#F#_A>&C?\ /Y%^9_PHY&','_"\-&_Y_(OS/^%'(PY@_P"%X:-_S^1?F?\
M"CD8 &C?\_D7YG_"CD8 &C?\ /Y%^9_PI
M &C?\_D7YG_ HY&','_"\-&_Y_(OS/
M^%'(PY@_X7AHW_/Y%^9_PHY&','_ O#1O\ G\B_,_X4 &C?\_D7YG_ HY&','_"\-&_Y_(OS/^%'(Q /\ "BP7#'^>
M/\*+!<3'^>/\*+#N'^>W^%%AW#'^>/\ "CE"X8_SQ_A1RA<,?YX_PHL%P_SV
M_P *+!\]O\*+!\]O\*+!\ /;_"BP7#_/;_ HL%P_SV_PHL%P_SV_P
MHL%P_P ]O\*+!\]O\ "BP7#_/;_"BP7#_/;_"BP /\ "CE"XX?YZ?X46"X_
M'T_*JL3<7;_G%+E"XT_A^5+E"XW'T_*BP[B_Y[?X46+YA#_GI_A18.8;C_/'
M^%'*%Q/\]O\ "BP7#'^>/\*.4+B@?YX_PHL%QV[_ #Q_A56,[@!]/RHL%QV/
MI^5%B>8=M^GY4:+@,847+"BX!1<=@HN%@Q1<5@Q1M B1>*H@1J (VJ303- "T % !0 4 % "[: #;0 M "K0#)5
M%!F.Q0"&,,4&@S-2 HH =02% #=M2:#U% $N,U)0PC% ""FP)!4 ** $/% #
M:T$T(!09M#@M4(:"[";: L*%H =B@!*
M $- #:"0I@%,!-U "4 H >*"1U "4 (10 W;04(: &T % !0 4 % * '4$
M@* ) ,U1(N* '4 % !02% !0 AH ;04)B@!#4E#: %Q0 Z@ H 4"@!<4 .H
M7% "T % : /I3]C_I??[T'\I:XZIU4SZ,KG.@* "@ H * "@ H * "@ H *
M $:@3V/S;NOO-_O&O3B<+(:ID!2*"@ H * "@ H * "@ H * "@ H * "@ H
M * "@ H * "@ H * "@ H * "@ H * "@ H * "@ H * "@ H * "@ H * "
M@ H * "@ H * "@ H * "@ H * "@ H * "@ H * "@ H * "@ H * "@ H
M* "@ H * "@ H * "@ H * "@ H * "@ H * "@ H * "@! E %B)2:BYHHDJ1C\:1H601%UH2,
M6R&9VZCI6B1SMC&D\[CO38XH8<1_6H9O