FALSE2022FY0001289490P5YP3YP3YP6YP1YP6Mhttp://fasb.org/us-gaap/2022#RealEstateInvestmentPropertyNethttp://fasb.org/us-gaap/2022#RealEstateInvestmentPropertyNethttp://fasb.org/us-gaap/2022#OtherLiabilitieshttp://fasb.org/us-gaap/2022#OtherLiabilitiesP5Y4MP2YP3Y00012894902022-01-012022-12-3100012894902022-06-30iso4217:USD00012894902023-02-22xbrli:shares00012894902022-12-3100012894902021-12-31iso4217:USDxbrli:shares00012894902021-01-012021-12-3100012894902020-01-012020-12-310001289490exr:PreferredOperatingPartnershipMember2019-12-310001289490exr:CommonOperatingPartnershipMember2019-12-310001289490exr:NonControllingInterestOtherMember2019-12-310001289490us-gaap:CommonStockMember2019-12-310001289490us-gaap:AdditionalPaidInCapitalMember2019-12-310001289490us-gaap:AccumulatedOtherComprehensiveIncomeMember2019-12-310001289490us-gaap:RetainedEarningsMember2019-12-3100012894902019-12-310001289490us-gaap:CommonStockMember2020-01-012020-12-310001289490us-gaap:AdditionalPaidInCapitalMember2020-01-012020-12-310001289490us-gaap:RetainedEarningsMember2020-01-012020-12-310001289490exr:CommonOperatingPartnershipMemberexr:RedemptionOfUnitsForCommonStockMember2020-01-012020-12-310001289490us-gaap:CommonStockMemberexr:RedemptionOfUnitsForCommonStockMember2020-01-012020-12-310001289490us-gaap:AdditionalPaidInCapitalMemberexr:RedemptionOfUnitsForCommonStockMember2020-01-012020-12-310001289490exr:CommonOperatingPartnershipMember2020-01-012020-12-310001289490exr:SeriesBUnitsMemberexr:PreferredOperatingPartnershipMemberexr:RedemptionOfUnitsForCashMember2020-01-012020-12-310001289490exr:SeriesBUnitsMemberexr:RedemptionOfUnitsForCashMember2020-01-012020-12-310001289490exr:SeriesDUnitsMemberexr:PreferredOperatingPartnershipMemberexr:RedemptionOfUnitsForCommonStockMember2020-01-012020-12-310001289490exr:SeriesDUnitsMemberus-gaap:CommonStockMemberexr:RedemptionOfUnitsForCommonStockMember2020-01-012020-12-310001289490exr:SeriesDUnitsMemberus-gaap:AdditionalPaidInCapitalMemberexr:RedemptionOfUnitsForCommonStockMember2020-01-012020-12-310001289490exr:SeriesDUnitsMemberexr:RedemptionOfUnitsForCommonStockMember2020-01-012020-12-310001289490exr:NonControllingInterestOtherMember2020-01-012020-12-310001289490exr:PreferredOperatingPartnershipMember2020-01-012020-12-310001289490us-gaap:AccumulatedOtherComprehensiveIncomeMember2020-01-012020-12-310001289490exr:PreferredOperatingPartnershipMember2020-12-310001289490exr:CommonOperatingPartnershipMember2020-12-310001289490exr:NonControllingInterestOtherMember2020-12-310001289490us-gaap:CommonStockMember2020-12-310001289490us-gaap:AdditionalPaidInCapitalMember2020-12-310001289490us-gaap:AccumulatedOtherComprehensiveIncomeMember2020-12-310001289490us-gaap:RetainedEarningsMember2020-12-3100012894902020-12-310001289490us-gaap:CommonStockMember2021-01-012021-12-310001289490us-gaap:AdditionalPaidInCapitalMember2021-01-012021-12-310001289490exr:CommonOperatingPartnershipMemberexr:RedemptionOfUnitsForCommonStockMember2021-01-012021-12-310001289490us-gaap:CommonStockMemberexr:RedemptionOfUnitsForCommonStockMember2021-01-012021-12-310001289490us-gaap:AdditionalPaidInCapitalMemberexr:RedemptionOfUnitsForCommonStockMember2021-01-012021-12-310001289490exr:RedemptionOfUnitsForCommonStockMember2021-01-012021-12-310001289490exr:SeriesBUnitsMemberexr:PreferredOperatingPartnershipMemberexr:RedemptionOfUnitsForCommonStockMember2021-01-012021-12-310001289490exr:SeriesBUnitsMemberus-gaap:CommonStockMemberexr:RedemptionOfUnitsForCommonStockMember2021-01-012021-12-310001289490us-gaap:AdditionalPaidInCapitalMemberexr:SeriesBUnitsMemberexr:RedemptionOfUnitsForCommonStockMember2021-01-012021-12-310001289490exr:SeriesBUnitsMemberexr:RedemptionOfUnitsForCommonStockMember2021-01-012021-12-310001289490exr:CommonOperatingPartnershipMemberexr:RedemptionOfUnitsForCashMember2021-01-012021-12-310001289490us-gaap:AdditionalPaidInCapitalMemberexr:RedemptionOfUnitsForCashMember2021-01-012021-12-310001289490exr:RedemptionOfUnitsForCashMember2021-01-012021-12-310001289490exr:CommonOperatingPartnershipMember2021-01-012021-12-310001289490exr:SeriesDUnitsMemberexr:PreferredOperatingPartnershipMember2021-01-012021-12-310001289490exr:SeriesDUnitsMember2021-01-012021-12-310001289490exr:NonControllingInterestOtherMember2021-01-012021-12-310001289490exr:PreferredOperatingPartnershipMember2021-01-012021-12-310001289490us-gaap:RetainedEarningsMember2021-01-012021-12-310001289490us-gaap:AccumulatedOtherComprehensiveIncomeMember2021-01-012021-12-310001289490exr:PreferredOperatingPartnershipMember2021-12-310001289490exr:CommonOperatingPartnershipMember2021-12-310001289490exr:NonControllingInterestOtherMember2021-12-310001289490us-gaap:CommonStockMember2021-12-310001289490us-gaap:AdditionalPaidInCapitalMember2021-12-310001289490us-gaap:AccumulatedOtherComprehensiveIncomeMember2021-12-310001289490us-gaap:RetainedEarningsMember2021-12-310001289490us-gaap:CommonStockMember2022-01-012022-12-310001289490us-gaap:AdditionalPaidInCapitalMember2022-01-012022-12-310001289490exr:CommonOperatingPartnershipMemberexr:RedemptionOfUnitsForCashMember2022-01-012022-12-310001289490us-gaap:AdditionalPaidInCapitalMemberexr:RedemptionOfUnitsForCashMember2022-01-012022-12-310001289490exr:RedemptionOfUnitsForCashMember2022-01-012022-12-310001289490exr:SeriesBUnitsMemberexr:PreferredOperatingPartnershipMemberexr:RedemptionOfUnitsForCashMember2022-01-012022-12-310001289490exr:SeriesBUnitsMemberexr:RedemptionOfUnitsForCashMember2022-01-012022-12-310001289490exr:CommonOperatingPartnershipMember2022-01-012022-12-310001289490exr:SeriesDUnitsMemberexr:PreferredOperatingPartnershipMember2022-01-012022-12-310001289490exr:SeriesDUnitsMember2022-01-012022-12-310001289490us-gaap:RetainedEarningsMember2022-01-012022-12-310001289490exr:NonControllingInterestOtherMember2022-01-012022-12-310001289490exr:PreferredOperatingPartnershipMember2022-01-012022-12-310001289490us-gaap:AccumulatedOtherComprehensiveIncomeMember2022-01-012022-12-310001289490exr:PreferredOperatingPartnershipMember2022-12-310001289490exr:CommonOperatingPartnershipMember2022-12-310001289490exr:NonControllingInterestOtherMember2022-12-310001289490us-gaap:CommonStockMember2022-12-310001289490us-gaap:AdditionalPaidInCapitalMember2022-12-310001289490us-gaap:AccumulatedOtherComprehensiveIncomeMember2022-12-310001289490us-gaap:RetainedEarningsMember2022-12-310001289490exr:PreferredOPUnitsMember2022-01-012022-12-310001289490exr:PreferredOPUnitsMember2021-01-012021-12-310001289490exr:PreferredOPUnitsMember2020-01-012020-12-310001289490exr:CommonOPUnitsMember2022-01-012022-12-310001289490exr:CommonOPUnitsMember2021-01-012021-12-310001289490exr:CommonOPUnitsMember2020-01-012020-12-31exr:storeexr:stateexr:variable_interest_entity0001289490us-gaap:FairValueMeasurementsRecurringMember2022-12-310001289490us-gaap:FairValueMeasurementsRecurringMemberus-gaap:FairValueInputsLevel1Member2022-12-310001289490us-gaap:FairValueMeasurementsRecurringMemberus-gaap:FairValueInputsLevel2Member2022-12-310001289490us-gaap:FairValueInputsLevel3Memberus-gaap:FairValueMeasurementsRecurringMember2022-12-310001289490us-gaap:EstimateOfFairValueFairValueDisclosureMember2022-12-310001289490us-gaap:CarryingReportedAmountFairValueDisclosureMember2022-12-310001289490us-gaap:EstimateOfFairValueFairValueDisclosureMember2021-12-310001289490us-gaap:CarryingReportedAmountFairValueDisclosureMember2021-12-310001289490us-gaap:BuildingAndBuildingImprovementsMembersrt:MinimumMember2022-01-012022-12-310001289490srt:MaximumMemberus-gaap:BuildingAndBuildingImprovementsMember2022-01-012022-12-310001289490exr:EquipmentAndFixturesMembersrt:MinimumMember2022-01-012022-12-310001289490srt:MaximumMemberexr:EquipmentAndFixturesMember2022-01-012022-12-310001289490us-gaap:SoftwareDevelopmentMember2022-12-310001289490us-gaap:SoftwareDevelopmentMember2021-12-310001289490us-gaap:SoftwareDevelopmentMember2022-01-012022-12-310001289490us-gaap:SoftwareDevelopmentMember2021-01-012021-12-31exr:item0001289490exr:ManagementServicesAgreementsMSAMembersrt:MinimumMember2022-01-012022-12-310001289490srt:MaximumMemberexr:ManagementServicesAgreementsMSAMember2022-01-012022-12-31exr:claimxbrli:pure0001289490exr:CommonOPUnitsMember2022-01-012022-12-310001289490exr:CommonOPUnitsMember2021-01-012021-12-310001289490exr:CommonOPUnitsMember2020-01-012020-12-310001289490exr:SeriesAUnitsMember2022-01-012022-12-310001289490exr:SeriesAUnitsMember2021-01-012021-12-310001289490exr:SeriesAUnitsMember2020-01-012020-12-310001289490exr:SeriesBUnitsMember2022-01-012022-12-310001289490exr:SeriesBUnitsMember2021-01-012021-12-310001289490exr:SeriesBUnitsMember2020-01-012020-12-310001289490exr:SeriesDUnitsMember2022-01-012022-12-310001289490exr:SeriesDUnitsMember2021-01-012021-12-310001289490exr:SeriesDUnitsMember2020-01-012020-12-310001289490exr:SeriesAUnitsMember2022-12-310001289490srt:MinimumMember2022-01-012022-12-310001289490srt:MaximumMember2022-01-012022-12-3100012894902022-09-152022-09-150001289490exr:CommonOperatingPartnershipMember2022-09-150001289490exr:CommonOperatingPartnershipMember2022-09-152022-09-1500012894902022-09-15exr:land_parcel0001289490exr:BargoldMember2022-06-012022-06-010001289490exr:BargoldMember2022-06-01exr:storage_unit0001289490exr:BargoldMember2022-06-010001289490exr:SeriesDUnitsMemberexr:BargoldMember2022-06-012022-06-010001289490exr:CommonOPUnitsMemberexr:BargoldMember2022-06-012022-06-010001289490exr:BargoldMemberus-gaap:DevelopedTechnologyRightsMember2022-06-010001289490exr:BargoldMemberus-gaap:TrademarksMember2022-06-010001289490us-gaap:CustomerRelationshipsMemberexr:BargoldMember2022-06-010001289490exr:BargoldMember2022-01-012022-12-3100012894902022-01-012022-03-310001289490us-gaap:DisposalGroupDisposedOfBySaleNotDiscontinuedOperationsMember2021-12-162021-12-160001289490us-gaap:DisposalGroupDisposedOfBySaleNotDiscontinuedOperationsMember2021-03-012021-03-010001289490exr:UnconsolidatedJointVentureMember2021-03-0100012894902021-03-010001289490exr:PRISASelfStorageLLCMember2022-12-31exr:property0001289490exr:PRISASelfStorageLLCMember2021-12-310001289490exr:StoragePortfolioIIJVLLCMember2022-12-310001289490exr:StoragePortfolioIIJVLLCMember2021-12-310001289490exr:StoragePortfolioIVJVLLCMember2022-12-310001289490exr:StoragePortfolioIVJVLLCMember2021-12-310001289490exr:StoragePortfolioILLCMember2022-12-310001289490exr:StoragePortfolioILLCMember2021-12-310001289490exr:PRIIEXRJVLLCMember2022-12-310001289490exr:PRIIEXRJVLLCMember2021-12-310001289490exr:ESSCATIVSJVLPMember2022-12-310001289490exr:ESSCATIVSJVLPMember2021-12-310001289490exr:VRSSelfStorageLLCMember2022-12-310001289490exr:VRSSelfStorageLLCMember2021-12-310001289490exr:ARAEXRJVLLCMember2022-12-310001289490exr:ARAEXRJVLLCMember2021-12-310001289490exr:ESSNYFLJVLPMember2022-12-310001289490exr:ESSNYFLJVLPMember2021-12-310001289490exr:ExtraSpaceNorthernPropertiesSixLLCMember2022-12-310001289490exr:ExtraSpaceNorthernPropertiesSixLLCMember2021-12-310001289490exr:AlanJathooJVLLCMember2022-12-310001289490exr:AlanJathooJVLLCMember2021-12-310001289490exr:BristolInvestmentsLLCMember2022-12-310001289490exr:BristolInvestmentsLLCMember2021-12-310001289490exr:ESSBGOAtlantaGAJVLLCMember2022-12-310001289490exr:ESSBGOAtlantaGAJVLLCMember2021-12-310001289490exr:StoragePortfolioVJVLLCMember2022-12-310001289490exr:StoragePortfolioVJVLLCMember2021-12-310001289490exr:PREXRSelfStorageLLCMember2022-12-310001289490exr:PREXRSelfStorageLLCMember2021-12-310001289490exr:StoragePortfolioIIIJVLLCMember2022-12-310001289490exr:StoragePortfolioIIIJVLLCMember2021-12-310001289490exr:OtherMinorityOwnedPropertiesMember2022-12-310001289490exr:OtherMinorityOwnedPropertiesMembersrt:MinimumMember2022-12-310001289490exr:OtherMinorityOwnedPropertiesMembersrt:MaximumMember2022-12-310001289490exr:OtherMinorityOwnedPropertiesMember2021-12-310001289490exr:SmartStopSelfStorageREITIncSeriesAConvertiblePreferredStockMember2022-12-310001289490exr:SmartStopSelfStorageREITIncSeriesAConvertiblePreferredStockMember2021-12-310001289490exr:SmartStopSelfStorageREITIncSeriesAConvertiblePreferredStockMember2019-10-012019-10-310001289490exr:SmartStopSelfStorageREITIncSeriesAConvertiblePreferredStockMember2022-01-012022-12-3100012894902021-06-012021-06-30exr:joint_venture0001289490exr:WICNNJVLLCAndGFNJVLLCMember2021-06-012021-06-300001289490exr:SmartStopSelfStorageREITIncSeriesAConvertiblePreferredStockMember2021-01-012021-12-310001289490exr:SmartStopSelfStorageREITIncSeriesAConvertiblePreferredStockMember2020-01-012020-12-310001289490exr:PRISASelfStorageLLCMember2022-01-012022-12-310001289490exr:PRISASelfStorageLLCMember2021-01-012021-12-310001289490exr:PRISASelfStorageLLCMember2020-01-012020-12-310001289490exr:StoragePortfolioIIJVLLCMember2022-01-012022-12-310001289490exr:StoragePortfolioIIJVLLCMember2021-01-012021-12-310001289490exr:StoragePortfolioIIJVLLCMember2020-01-012020-12-310001289490exr:StoragePortfolioIVJVLLCMember2022-01-012022-12-310001289490exr:StoragePortfolioIVJVLLCMember2021-01-012021-12-310001289490exr:StoragePortfolioIVJVLLCMember2020-01-012020-12-310001289490exr:StoragePortfolioILLCMember2022-01-012022-12-310001289490exr:StoragePortfolioILLCMember2021-01-012021-12-310001289490exr:StoragePortfolioILLCMember2020-01-012020-12-310001289490exr:PRIIEXRJVLLCMember2022-01-012022-12-310001289490exr:PRIIEXRJVLLCMember2021-01-012021-12-310001289490exr:PRIIEXRJVLLCMember2020-01-012020-12-310001289490exr:ESSCATIVSJVLPMember2022-01-012022-12-310001289490exr:ESSCATIVSJVLPMember2021-01-012021-12-310001289490exr:ESSCATIVSJVLPMember2020-01-012020-12-310001289490exr:VRSSelfStorageLLCMember2022-01-012022-12-310001289490exr:VRSSelfStorageLLCMember2021-01-012021-12-310001289490exr:VRSSelfStorageLLCMember2020-01-012020-12-310001289490exr:ARAEXRJVLLCMember2022-01-012022-12-310001289490exr:ARAEXRJVLLCMember2021-01-012021-12-310001289490exr:ARAEXRJVLLCMember2020-01-012020-12-310001289490exr:ESSNYFLJVLLCMember2022-01-012022-12-310001289490exr:ESSNYFLJVLLCMember2021-01-012021-12-310001289490exr:ESSNYFLJVLLCMember2020-01-012020-12-310001289490exr:ExtraSpaceNorthernPropertiesSixLLCMember2022-01-012022-12-310001289490exr:ExtraSpaceNorthernPropertiesSixLLCMember2021-01-012021-12-310001289490exr:ExtraSpaceNorthernPropertiesSixLLCMember2020-01-012020-12-310001289490exr:ESSBGOAtlantaGAJVLLCMember2022-01-012022-12-310001289490exr:ESSBGOAtlantaGAJVLLCMember2021-01-012021-12-310001289490exr:ESSBGOAtlantaGAJVLLCMember2020-01-012020-12-310001289490exr:AlanJathooJVLLCMember2022-01-012022-12-310001289490exr:AlanJathooJVLLCMember2021-01-012021-12-310001289490exr:AlanJathooJVLLCMember2020-01-012020-12-310001289490exr:BristolInvestmentsLLCMember2022-01-012022-12-310001289490exr:BristolInvestmentsLLCMember2021-01-012021-12-310001289490exr:BristolInvestmentsLLCMember2020-01-012020-12-310001289490exr:StoragePortfolioVJVLLCMember2022-01-012022-12-310001289490exr:StoragePortfolioVJVLLCMember2021-01-012021-12-310001289490exr:StoragePortfolioVJVLLCMember2020-01-012020-12-310001289490exr:PREXRSelfStorageLLCMember2022-01-012022-12-310001289490exr:PREXRSelfStorageLLCMember2021-01-012021-12-310001289490exr:PREXRSelfStorageLLCMember2020-01-012020-12-310001289490exr:WICNNJVLLCMember2022-01-012022-12-310001289490exr:WICNNJVLLCMember2021-01-012021-12-310001289490exr:WICNNJVLLCMember2020-01-012020-12-310001289490exr:GFNJVLLCMember2022-01-012022-12-310001289490exr:GFNJVLLCMember2021-01-012021-12-310001289490exr:GFNJVLLCMember2020-01-012020-12-310001289490exr:OtherMinorityOwnedPropertiesMember2022-01-012022-12-310001289490exr:OtherMinorityOwnedPropertiesMember2021-01-012021-12-310001289490exr:OtherMinorityOwnedPropertiesMember2020-01-012020-12-310001289490exr:NexPointPreferredStockMember2022-12-310001289490exr:NexPointPreferredStockMember2021-12-310001289490us-gaap:BridgeLoanMember2022-12-310001289490us-gaap:BridgeLoanMember2021-12-310001289490us-gaap:NotesReceivableMember2022-12-310001289490us-gaap:NotesReceivableMember2021-12-3100012894902020-11-012020-11-300001289490exr:JCAPSeriesAPreferredStockMember2020-11-300001289490exr:JCAPSeriesAPreferredStockMember2020-11-012020-11-300001289490exr:JCAPSeriesBPreferredStockMember2020-11-300001289490exr:JCAPSeriesBPreferredStockMember2020-11-012020-11-300001289490exr:JCAPSeriesDPreferredStockMember2022-12-310001289490exr:JCAPSeriesDPreferredStockMember2022-12-012022-12-31exr:extension_option0001289490exr:JCAPSeriesDPreferredStockMember2022-01-012022-12-3100012894902022-12-012022-12-310001289490us-gaap:NotesReceivableMember2020-07-012020-07-310001289490us-gaap:NotesReceivableMember2020-07-3100012894902020-07-012020-07-310001289490us-gaap:NotesReceivableMember2022-02-012022-02-280001289490us-gaap:BridgeLoanMember2022-01-012022-12-310001289490us-gaap:SeniorNotesMemberexr:SeniorNotesDue2029Member2022-03-310001289490us-gaap:SeniorNotesMemberexr:SeniorNotesDue2032Member2021-09-300001289490us-gaap:SeniorNotesMemberexr:SeniorNotesDue2031Member2021-05-310001289490us-gaap:SeniorNotesMember2022-01-012022-12-310001289490exr:SecuredLoanWithBankMemberus-gaap:NotesPayableToBanksMember2022-12-310001289490exr:SecuredLoanWithBankMemberus-gaap:NotesPayableToBanksMember2021-12-310001289490exr:SecuredLoanWithBankMemberus-gaap:NotesPayableToBanksMembersrt:MinimumMember2022-12-310001289490exr:SecuredLoanWithBankMembersrt:MaximumMemberus-gaap:NotesPayableToBanksMember2022-12-310001289490exr:UnsecuredLoanWithBankMemberus-gaap:NotesPayableToBanksMember2022-12-310001289490exr:UnsecuredLoanWithBankMemberus-gaap:NotesPayableToBanksMember2021-12-310001289490exr:UnsecuredLoanWithBankMemberus-gaap:NotesPayableToBanksMembersrt:MinimumMember2022-12-310001289490srt:MaximumMemberexr:UnsecuredLoanWithBankMemberus-gaap:NotesPayableToBanksMember2022-12-310001289490us-gaap:NotesPayableToBanksMember2022-12-310001289490us-gaap:NotesPayableToBanksMember2021-12-310001289490us-gaap:RevolvingCreditFacilityMemberus-gaap:LineOfCreditMember2022-12-310001289490us-gaap:LineOfCreditMemberexr:Tranche1TermLoanFacilityMember2022-12-310001289490exr:Tranche2TermLoanFacilityMemberus-gaap:LineOfCreditMember2022-12-310001289490us-gaap:LineOfCreditMemberexr:Tranche3TermLoanFacilityMember2022-12-310001289490exr:Tranche4TermLoanFacilityMemberus-gaap:LineOfCreditMember2022-12-310001289490exr:Tranche5TermLoanFacilityMemberus-gaap:LineOfCreditMember2022-12-310001289490us-gaap:LineOfCreditMemberexr:Tranche6TermLoanFacilityMember2022-12-310001289490us-gaap:LineOfCreditMemberexr:Tranche7TermLoanFacilityMember2022-12-310001289490us-gaap:LineOfCreditMember2022-12-310001289490us-gaap:LineOfCreditMember2022-01-012022-12-310001289490us-gaap:BaseRateMemberus-gaap:LineOfCreditMember2022-01-012022-12-310001289490us-gaap:LineOfCreditMemberus-gaap:FederalFundsEffectiveSwapRateMember2022-01-012022-12-310001289490exr:SecuredOvernightFinancingRateSOFRMemberus-gaap:LineOfCreditMember2022-01-012022-12-310001289490exr:SecuredOvernightFinancingRateSOFRMemberus-gaap:LineOfCreditMembersrt:MinimumMember2022-01-012022-12-310001289490srt:MaximumMemberexr:SecuredOvernightFinancingRateSOFRMemberus-gaap:LineOfCreditMember2022-01-012022-12-310001289490us-gaap:BaseRateMemberus-gaap:LineOfCreditMembersrt:MinimumMember2022-01-012022-12-310001289490us-gaap:BaseRateMembersrt:MaximumMemberus-gaap:LineOfCreditMember2022-01-012022-12-310001289490us-gaap:LineOfCreditMemberexr:UnsecuredDebtTrancheOneMember2022-07-310001289490us-gaap:LineOfCreditMemberexr:UnsecuredDebtTrancheTwoMember2022-07-310001289490exr:AdjustedSecuredOvernightFinancingRateMemberus-gaap:LineOfCreditMemberexr:UnsecuredDebtTrancheOneMember2022-07-012022-07-310001289490exr:AdjustedSecuredOvernightFinancingRateMemberus-gaap:LineOfCreditMemberexr:UnsecuredDebtTrancheTwoMember2022-07-012022-07-310001289490exr:FirstCreditLineMember2022-12-310001289490exr:FirstCreditLineMemberexr:SecuredOvernightFinancingRateSOFRMember2022-01-012022-12-310001289490exr:SecondCreditLineMember2022-12-310001289490exr:SecuredOvernightFinancingRateSOFRMemberexr:SecondCreditLineMember2022-01-012022-12-310001289490exr:LinesOfCreditMember2022-12-310001289490exr:FirstCreditLineMemberus-gaap:SubsequentEventMember2023-01-130001289490exr:FirstCreditLineMemberus-gaap:SubsequentEventMember2023-01-132023-01-130001289490exr:SecondCreditLineMember2022-01-012022-12-31exr:derivative0001289490us-gaap:CashFlowHedgingMemberus-gaap:InterestRateSwapMembersrt:MinimumMember2022-12-310001289490srt:MaximumMemberus-gaap:CashFlowHedgingMemberus-gaap:InterestRateSwapMember2022-12-310001289490us-gaap:OtherAssetsMember2022-12-310001289490us-gaap:OtherAssetsMember2021-12-310001289490us-gaap:OtherLiabilitiesMember2022-12-310001289490us-gaap:OtherLiabilitiesMember2021-12-310001289490us-gaap:InterestRateSwapMember2022-01-012022-12-310001289490us-gaap:InterestRateSwapMember2021-01-012021-12-310001289490us-gaap:InterestRateSwapMember2020-01-012020-12-310001289490exr:ExchangeableSeniorNotesThreePointOneTwoFivePercentDueTwoThousandAndThirtyFiveMember2015-09-300001289490exr:ExchangeableSeniorNotesThreePointOneTwoFivePercentDueTwoThousandAndThirtyFiveMember2015-09-012015-09-300001289490exr:ExchangeableSeniorNotesThreePointOneTwoFivePercentDueTwoThousandAndThirtyFiveMembersrt:MinimumMember2015-09-012015-09-300001289490srt:MaximumMemberexr:ExchangeableSeniorNotesThreePointOneTwoFivePercentDueTwoThousandAndThirtyFiveMember2015-09-012015-09-30exr:day0001289490exr:ExchangeableSeniorNotesThreePointOneTwoFivePercentDueTwoThousandAndThirtyFiveMember2022-12-310001289490exr:ExchangeableSeniorNotesThreePointOneTwoFivePercentDueTwoThousandAndThirtyFiveMemberus-gaap:DebtInstrumentRedemptionPeriodOneMember2020-10-012020-10-010001289490us-gaap:DebtInstrumentRedemptionPeriodTwoMemberexr:ExchangeableSeniorNotesThreePointOneTwoFivePercentDueTwoThousandAndThirtyFiveMember2020-11-022020-11-020001289490us-gaap:DebtInstrumentRedemptionPeriodThreeMemberexr:ExchangeableSeniorNotesThreePointOneTwoFivePercentDueTwoThousandAndThirtyFiveMember2020-11-022020-11-020001289490exr:ExchangeableSeniorNotesMember2022-12-310001289490exr:ExchangeableSeniorNotesMember2021-12-310001289490exr:ExchangeableSeniorNotesMember2020-12-310001289490exr:ExchangeableSeniorNotesMember2022-01-012022-12-310001289490exr:ExchangeableSeniorNotesMember2021-01-012021-12-310001289490exr:ExchangeableSeniorNotesMember2020-01-012020-12-310001289490exr:AtTheMarketEquityDistributionAgreementMember2021-08-092021-08-090001289490exr:AtTheMarketEquityDistributionAgreementMember2021-01-012021-08-080001289490exr:AtTheMarketEquityDistributionAgreementMember2021-08-0800012894902021-03-232021-03-2300012894902021-03-2300012894902020-10-150001289490exr:SeriesAUnitsMember2022-12-310001289490exr:SeriesAUnitsMember2021-12-310001289490exr:SeriesBUnitsMember2022-12-310001289490exr:SeriesBUnitsMember2021-12-310001289490exr:SeriesDUnitsMember2022-12-310001289490exr:SeriesDUnitsMember2021-12-310001289490exr:SeriesAUnitsMember2007-06-300001289490exr:HoldersOfSeriesAPreferredOperatingPartnershipUnitsMemberexr:SeriesAUnitsMember2014-10-012014-10-310001289490exr:SeriesAUnitsMember2014-10-310001289490exr:HoldersOfSeriesAPreferredOperatingPartnershipUnitsMemberexr:SeriesAUnitsMember2007-06-250001289490exr:HoldersOfSeriesAPreferredOperatingPartnershipUnitsMemberexr:SeriesAUnitsMember2017-04-182017-04-180001289490exr:HoldersOfSeriesAPreferredOperatingPartnershipUnitsMemberexr:SeriesAUnitsMember2007-06-252007-06-250001289490us-gaap:SubsequentEventMemberexr:SeriesAUnitsMember2023-01-252023-01-250001289490us-gaap:SubsequentEventMemberexr:HoldersOfSeriesAPreferredOperatingPartnershipUnitsMemberexr:SeriesAUnitsMember2023-01-252023-01-250001289490exr:SeriesBUnitsMember2022-12-310001289490exr:SeriesBUnitsMember2013-01-012014-12-310001289490exr:SeriesBUnitsMember2022-05-102022-05-1000012894902021-08-312021-08-310001289490exr:SeriesCUnitsMember2014-12-012014-12-310001289490exr:SeriesDUnitsMember2022-12-310001289490exr:SeriesDUnitsMembersrt:MinimumMember2020-01-012020-12-310001289490exr:SeriesDUnitsMembersrt:MaximumMember2020-01-012020-12-310001289490exr:SeriesDUnitsMemberus-gaap:SubsequentEventMember2023-01-032023-01-030001289490exr:CommonOperatingPartnershipMember2022-12-310001289490exr:NonControllingInterestOtherMemberstpr:FL2022-12-310001289490exr:StoreLeaseMember2022-12-31exr:lease0001289490exr:StoreLeaseMembersrt:MinimumMember2022-01-012022-12-310001289490srt:MaximumMemberexr:StoreLeaseMember2022-01-012022-12-310001289490exr:CorporateOfficeAndCallCenterLeaseMembersrt:MinimumMember2022-12-310001289490exr:CorporateOfficeAndCallCenterLeaseMembersrt:MaximumMember2022-12-310001289490exr:RegionalOfficeLeaseMember2022-12-310001289490srt:MinimumMemberexr:RegionalOfficeLeaseMember2022-12-310001289490srt:MaximumMemberexr:RegionalOfficeLeaseMember2022-12-310001289490exr:DistrictOfficeLeaseMember2022-12-310001289490us-gaap:EmployeeStockOptionMember2022-01-012022-12-310001289490srt:MinimumMemberus-gaap:RestrictedStockMember2022-01-012022-12-310001289490srt:MaximumMemberus-gaap:RestrictedStockMember2022-01-012022-12-310001289490exr:ExercisePriceRangeOneMember2022-01-012022-12-310001289490exr:ExercisePriceRangeOneMember2022-12-310001289490exr:ExercisePriceRangeTwoMember2022-01-012022-12-310001289490exr:ExercisePriceRangeTwoMember2022-12-310001289490us-gaap:EmployeeStockOptionMember2021-01-012021-12-310001289490us-gaap:EmployeeStockOptionMember2020-01-012020-12-310001289490us-gaap:EmployeeStockOptionMember2022-12-310001289490us-gaap:RestrictedStockMember2022-01-012022-12-310001289490us-gaap:RestrictedStockMember2021-01-012021-12-310001289490us-gaap:RestrictedStockMember2020-01-012020-12-310001289490us-gaap:RestrictedStockMember2022-12-310001289490us-gaap:RestrictedStockMember2019-12-310001289490us-gaap:RestrictedStockMember2020-12-310001289490us-gaap:RestrictedStockMember2021-12-310001289490us-gaap:PerformanceSharesMember2022-01-012022-12-310001289490us-gaap:PerformanceSharesMember2019-12-310001289490us-gaap:PerformanceSharesMember2020-01-012020-12-310001289490us-gaap:PerformanceSharesMember2020-12-310001289490us-gaap:PerformanceSharesMember2021-01-012021-12-310001289490us-gaap:PerformanceSharesMember2021-12-310001289490us-gaap:PerformanceSharesMember2022-12-31exr:segment0001289490us-gaap:OperatingSegmentsMemberexr:SelfStorageOperationsMember2022-01-012022-12-310001289490us-gaap:OperatingSegmentsMemberexr:SelfStorageOperationsMember2021-01-012021-12-310001289490us-gaap:OperatingSegmentsMemberexr:SelfStorageOperationsMember2020-01-012020-12-310001289490exr:TenantReinsuranceMemberus-gaap:OperatingSegmentsMember2022-01-012022-12-310001289490exr:TenantReinsuranceMemberus-gaap:OperatingSegmentsMember2021-01-012021-12-310001289490exr:TenantReinsuranceMemberus-gaap:OperatingSegmentsMember2020-01-012020-12-310001289490us-gaap:OperatingSegmentsMember2022-01-012022-12-310001289490us-gaap:OperatingSegmentsMember2021-01-012021-12-310001289490us-gaap:OperatingSegmentsMember2020-01-012020-12-310001289490exr:CommitmentToAcquireStoresMember2022-12-310001289490exr:CommitmentToAcquireRetailSpaceExpectedToCloseNextFiscalYearMember2022-12-310001289490exr:CommitmentToAcquireRetailSpaceExpectedToCloseIn2024Member2022-12-310001289490exr:CommitmentToAcquireRetailSpaceWithJointVenturePartnersMember2022-12-310001289490exr:SelfStorageFacilityMemberstpr:AL2022-01-012022-12-310001289490exr:SelfStorageFacilityMemberstpr:AL2022-12-310001289490exr:SelfStorageFacilityMemberstpr:AZ2022-01-012022-12-310001289490exr:SelfStorageFacilityMemberstpr:AZ2022-12-310001289490exr:SelfStorageFacilityMemberstpr:CA2022-01-012022-12-310001289490exr:SelfStorageFacilityMemberstpr:CA2022-12-310001289490exr:SelfStorageFacilityMemberstpr:CO2022-01-012022-12-310001289490exr:SelfStorageFacilityMemberstpr:CO2022-12-310001289490exr:SelfStorageFacilityMemberstpr:CT2022-01-012022-12-310001289490exr:SelfStorageFacilityMemberstpr:CT2022-12-310001289490exr:SelfStorageFacilityMemberstpr:FL2022-01-012022-12-310001289490exr:SelfStorageFacilityMemberstpr:FL2022-12-310001289490exr:SelfStorageFacilityMemberstpr:GA2022-01-012022-12-310001289490exr:SelfStorageFacilityMemberstpr:GA2022-12-310001289490exr:SelfStorageFacilityMemberstpr:HI2022-01-012022-12-310001289490exr:SelfStorageFacilityMemberstpr:HI2022-12-310001289490exr:SelfStorageFacilityMemberstpr:ID2022-01-012022-12-310001289490exr:SelfStorageFacilityMemberstpr:ID2022-12-310001289490exr:SelfStorageFacilityMemberstpr:IL2022-01-012022-12-310001289490exr:SelfStorageFacilityMemberstpr:IL2022-12-310001289490exr:SelfStorageFacilityMemberstpr:IN2022-01-012022-12-310001289490exr:SelfStorageFacilityMemberstpr:IN2022-12-310001289490exr:SelfStorageFacilityMemberstpr:KS2022-01-012022-12-310001289490exr:SelfStorageFacilityMemberstpr:KS2022-12-310001289490exr:SelfStorageFacilityMemberstpr:KY2022-01-012022-12-310001289490exr:SelfStorageFacilityMemberstpr:KY2022-12-310001289490stpr:LAexr:SelfStorageFacilityMember2022-01-012022-12-310001289490stpr:LAexr:SelfStorageFacilityMember2022-12-310001289490stpr:MAexr:SelfStorageFacilityMember2022-01-012022-12-310001289490stpr:MAexr:SelfStorageFacilityMember2022-12-310001289490stpr:MDexr:SelfStorageFacilityMember2022-01-012022-12-310001289490stpr:MDexr:SelfStorageFacilityMember2022-12-310001289490exr:SelfStorageFacilityMemberstpr:MI2022-01-012022-12-310001289490exr:SelfStorageFacilityMemberstpr:MI2022-12-310001289490exr:SelfStorageFacilityMemberstpr:MN2022-01-012022-12-310001289490exr:SelfStorageFacilityMemberstpr:MN2022-12-310001289490exr:SelfStorageFacilityMemberstpr:MO2022-01-012022-12-310001289490exr:SelfStorageFacilityMemberstpr:MO2022-12-310001289490exr:SelfStorageFacilityMemberstpr:MS2022-01-012022-12-310001289490exr:SelfStorageFacilityMemberstpr:MS2022-12-310001289490exr:SelfStorageFacilityMemberstpr:NC2022-01-012022-12-310001289490exr:SelfStorageFacilityMemberstpr:NC2022-12-310001289490exr:SelfStorageFacilityMemberstpr:NH2022-01-012022-12-310001289490exr:SelfStorageFacilityMemberstpr:NH2022-12-310001289490exr:SelfStorageFacilityMemberstpr:NJ2022-01-012022-12-310001289490exr:SelfStorageFacilityMemberstpr:NJ2022-12-310001289490exr:SelfStorageFacilityMemberstpr:NM2022-01-012022-12-310001289490exr:SelfStorageFacilityMemberstpr:NM2022-12-310001289490exr:SelfStorageFacilityMemberstpr:NV2022-01-012022-12-310001289490exr:SelfStorageFacilityMemberstpr:NV2022-12-310001289490exr:SelfStorageFacilityMemberstpr:NY2022-01-012022-12-310001289490exr:SelfStorageFacilityMemberstpr:NY2022-12-310001289490stpr:OHexr:SelfStorageFacilityMember2022-01-012022-12-310001289490stpr:OHexr:SelfStorageFacilityMember2022-12-310001289490exr:SelfStorageFacilityMemberstpr:OK2022-01-012022-12-310001289490exr:SelfStorageFacilityMemberstpr:OK2022-12-310001289490stpr:ORexr:SelfStorageFacilityMember2022-01-012022-12-310001289490stpr:ORexr:SelfStorageFacilityMember2022-12-310001289490exr:SelfStorageFacilityMemberstpr:PA2022-01-012022-12-310001289490exr:SelfStorageFacilityMemberstpr:PA2022-12-310001289490exr:SelfStorageFacilityMemberstpr:RI2022-01-012022-12-310001289490exr:SelfStorageFacilityMemberstpr:RI2022-12-310001289490stpr:SCexr:SelfStorageFacilityMember2022-01-012022-12-310001289490stpr:SCexr:SelfStorageFacilityMember2022-12-310001289490exr:SelfStorageFacilityMemberstpr:TN2022-01-012022-12-310001289490exr:SelfStorageFacilityMemberstpr:TN2022-12-310001289490stpr:TXexr:SelfStorageFacilityMember2022-01-012022-12-310001289490stpr:TXexr:SelfStorageFacilityMember2022-12-310001289490stpr:UTexr:SelfStorageFacilityMember2022-01-012022-12-310001289490stpr:UTexr:SelfStorageFacilityMember2022-12-310001289490stpr:VAexr:SelfStorageFacilityMember2022-01-012022-12-310001289490stpr:VAexr:SelfStorageFacilityMember2022-12-310001289490exr:SelfStorageFacilityMemberstpr:WA2022-01-012022-12-310001289490exr:SelfStorageFacilityMemberstpr:WA2022-12-310001289490exr:SelfStorageFacilityMemberstpr:DC2022-01-012022-12-310001289490exr:SelfStorageFacilityMemberstpr:DC2022-12-310001289490exr:OtherCorporateAssetsMember2022-12-310001289490exr:IntangibleTenantRelationshipsAndLeaseRightsMember2022-12-310001289490exr:ConstructionInProgressAndUndevelopedLandMember2022-12-310001289490exr:FinanceLeaseMember2022-12-310001289490exr:OperatingFacilitiesMember2021-12-310001289490exr:OperatingFacilitiesMember2020-12-310001289490exr:OperatingFacilitiesMember2019-12-310001289490exr:OperatingFacilitiesMember2022-01-012022-12-310001289490exr:OperatingFacilitiesMember2021-01-012021-12-310001289490exr:OperatingFacilitiesMember2020-01-012020-12-310001289490exr:OperatingFacilitiesMember2022-12-310001289490exr:RealEstateUnderDevelopmentMember2021-12-310001289490exr:RealEstateUnderDevelopmentMember2020-12-310001289490exr:RealEstateUnderDevelopmentMember2019-12-310001289490exr:RealEstateUnderDevelopmentMember2022-01-012022-12-310001289490exr:RealEstateUnderDevelopmentMember2021-01-012021-12-310001289490exr:RealEstateUnderDevelopmentMember2020-01-012020-12-310001289490exr:RealEstateUnderDevelopmentMember2022-12-31
UNITED STATES
SECURITIES AND EXCHANGE COMMISSION
WASHINGTON, D.C. 20549
FORM 10-K
(Mark One) | | | | | |
| ☒ | ANNUAL REPORT PURSUANT TO SECTION 13 OR 15(d) OF THE SECURITIES EXCHANGE ACT OF 1934 |
For the fiscal year ended December 31, 2022
OR | | | | | |
| ☐ | TRANSITION REPORT PURSUANT TO SECTION 13 OR 15(d) OF THE SECURITIES EXCHANGE ACT OF 1934 |
For the transition period from to .
Commission File Number: 001-32269
EXTRA SPACE STORAGE INC.
(Exact name of registrant as specified in its charter)
| | | | | | | | |
| Maryland | | 20-1076777 |
(State or other jurisdiction of
incorporation or organization) | | (I.R.S. Employer
Identification No.) |
2795 East Cottonwood Parkway, Suite 300
Salt Lake City, Utah 84121
(Address of principal executive offices and zip code)
Registrant’s telephone number, including area code: (801) 365-4600
Securities Registered Pursuant to Section 12(b) of the Act: | | | | | | | | |
| Title of each class | Trading symbol | Name of each exchange on which registered |
| Common Stock, $0.01 par value | EXR | New York Stock Exchange |
Securities registered pursuant to Section 12(g) of the Act: None
Indicate by check mark if the registrant is a well-known seasoned issuer, as defined in Rule 405 of the Securities Act. Yes x No ¨
Indicate by check mark if the registrant is not required to file reports pursuant to Section 13 or 15(d) of the Act. Yes ¨ No x
Indicate by check mark whether the registrant (1) has filed all reports required to be filed by Section 13 or 15(d) of the Securities Exchange Act of 1934 during the preceding 12 months (or for such shorter period that the registrant was required to file such reports), and (2) has been subject to such filing requirements for the past 90 days. Yes x No ¨
Indicate by check mark whether the registrant has submitted electronically every Interactive Data File required to be submitted pursuant to Rule 405 of Regulation S-T (§ 232.405 of this chapter) during the preceding 12 months (or for such shorter period that the registrant was required to submit such files). Yes x No ¨
Indicate by check mark whether the registrant is a large accelerated filer, an accelerated filer, a non-accelerated filer, a smaller reporting company, or an emerging growth company. See the definitions of “large accelerated filer,” “accelerated filer,” “smaller reporting company” and "emerging growth company" in Rule 12b-2 of the Exchange Act. | | | | | | | | | | | | | | | | | | | | |
| Large accelerated filer | | ☒ | | Accelerated filer | | ☐ |
| Non-accelerated filer | | ☐ | | Smaller reporting company | | ☐ |
| | | | Emerging growth company | | ☐ |
If an emerging growth company, indicate by check mark if the registrant has elected not to use the extended transition period for complying with any new or revised financial accounting standards provided pursuant to Section 13(a) of the Exchange Act. ¨
Indicate by check mark whether the registrant has filed a report on and attestation to its management’s assessment of the effectiveness of its internal control over financial reporting under Section 404(b) of the Sarbanes-Oxley Act (15 U.S.C. 7262(b)) by the registered public accounting firm that prepared or issued its audit report. x
If securities are registered pursuant to Section 12(b) of the Act, indicate by check mark whether the financial statements of the registrant included in the filing reflect the correction of an error to previously issued financial statements. ☐
Indicate by check mark whether any of those error corrections are restatements that required a recovery analysis of incentive-based compensation received by any of the registrant’s executive officers during the relevant recovery period pursuant to § 240.10D-1(b). ☐
Indicate by check mark whether the registrant is a shell company (as defined in Rule 12b-2 of the Exchange Act). Yes ☐ No ☒
The aggregate market value of the common stock held by non-affiliates of the registrant was $22,430,933,071 based upon the closing price on the New York Stock Exchange on June 30, 2022, the last business day of the registrant’s most recently completed second fiscal quarter. This calculation does not reflect a determination that persons whose shares are excluded from the computation are affiliates for any other purpose.
The number of shares outstanding of the registrant’s common stock, $0.01 par value per share, as of February 22, 2023 was 134,985,035.
Documents Incorporated by Reference
Portions of the registrant’s definitive proxy statement to be issued in connection with the registrant’s annual stockholders’ meeting to be held in 2023 are incorporated by reference into Part III of this Annual Report on Form 10-K.
Extra Space Storage Inc.
Annual Report on Form 10-K
For the Year Ended December 31, 2022
Table of Contents
| | | | | | | | |
| |
| Item 1. | | |
| Item 1A. | | |
| Item 1B. | | |
| Item 2. | | |
| Item 3. | | |
| Item 4. | | |
| |
| Item 5. | | |
| Item 6. | | |
| Item 7. | | |
| Item 7A. | | |
| Item 8. | | |
| Item 9. | | |
| Item 9A. | | |
| Item 9B. | | |
| Item 9C. | | |
| |
| Item 10. | | |
| Item 11. | | |
| Item 12. | | |
| Item 13. | | |
| Item 14. | | |
| |
| Item 15. | | |
| Item 16. | | |
| |
Statements Regarding Forward-Looking Information
Certain information set forth in this report contains “forward-looking statements” within the meaning of the federal securities laws. Forward-looking statements include statements concerning our plans, objectives, goals, strategies, future events, future revenues or performance, capital expenditures, financing needs, plans or intentions relating to acquisitions and other information that is not historical information. In some cases, forward-looking statements can be identified by terminology such as “believes,” “expects,” “estimates,” “may,” “will,” “should,” “anticipates,” or “intends” or the negative of such terms or other comparable terminology, or by discussions of strategy. We may also make additional forward-looking statements from time to time. All such subsequent forward-looking statements, whether written or oral, by us or on our behalf, are also expressly qualified by these cautionary statements.
All forward-looking statements, including without limitation, management’s examination of historical operating trends and estimates of future earnings, are based upon our current expectations and various assumptions. Our expectations, beliefs and projections are expressed in good faith and we believe there is a reasonable basis for them, but there can be no assurance that management’s expectations, beliefs and projections will result or be achieved. All forward-looking statements apply only as of the date made. We undertake no obligation to publicly update or revise forward-looking statements which may be made to reflect events or circumstances after the date made or to reflect the occurrence of unanticipated events.
There are a number of risks and uncertainties that could cause our actual results to differ materially from the forward-looking statements contained in or contemplated by this report. Any forward-looking statements should be considered in light of the risks referenced in “Part I. Item 1A. Risk Factors” below. Such factors include, but are not limited to:
•adverse changes in general economic conditions, the real estate industry and in the markets in which we operate;
•failure to close pending acquisitions and developments on expected terms, or at all;
•the effect of competition from new and existing stores or other storage alternatives, which could cause rents and occupancy rates to decline;
•potential liability for uninsured losses and environmental contamination;
•the impact of the regulatory environment as well as national, state, and local laws and regulations including, without limitation, those governing real estate investment trusts (“REITs”), tenant reinsurance and other aspects of our business, which could adversely affect our results;
•disruptions in credit and financial markets and resulting difficulties in raising capital or obtaining credit at reasonable rates or at all, which could impede our ability to grow;
•increased interest rates;
•reductions in asset valuations and related impairment charges;
•our lack of sole decision-making authority with respect to our joint venture investments;
•the effect of recent or future changes to U.S. tax laws;
•the failure to maintain our REIT status for U.S. federal income tax purposes;
•impacts from any outbreak of highly infectious or contagious diseases such as COVID-19, including reduced demand for self-storage space and ancillary products, and potential decreases in occupancy and rental rates and staffing levels, which could adversely affect our results; and
•economic uncertainty due to the impact of natural disasters, war or terrorism, which could adversely affect our business plan.
The forward-looking statements are based on our beliefs, assumptions and expectations of our future performance, taking into account all information currently available to us. These beliefs, assumptions and expectations are subject to risks and uncertainties and can change as a result of many possible events or factors, not all of which are known to us. If a change occurs, our business, financial condition, liquidity and results of operations may vary materially from those expressed in our forward-looking statements. You should carefully consider these risks before you make an investment decision with respect to our securities.
We disclaim any duty or obligation to update or revise any forward-looking statements set forth in this Annual Report on Form 10-K to reflect new information, future events or otherwise.
PART I
Item 1. Business
General
Extra Space Storage Inc. (“we,” “our,” “us” or the “Company”) is a fully integrated, self-administered and self-managed real estate investment trust (“REIT”) formed as a Maryland corporation on April 30, 2004. We closed our initial public offering (“IPO”) on August 17, 2004. Our common stock is traded on the New York Stock Exchange under the symbol “EXR.”
We were formed to continue the business of Extra Space Storage LLC and its subsidiaries, which had engaged in the self-storage business since 1977. These companies were reorganized after the consummation of our IPO and various formation transactions. Our executive management team and board of directors have extensive experience and ownership positions in the Company.
Substantially all of our business is conducted through Extra Space Storage LP (the “Operating Partnership”). Our primary assets are general partner and limited partner interests in the Operating Partnership. This structure is commonly referred to as an umbrella partnership REIT, or UPREIT. We have elected to be taxed as a REIT under the Internal Revenue Code of 1986, as amended (the “Internal Revenue Code”). To the extent we continue to qualify as a REIT we will not be subject to U.S. federal tax, with certain exceptions, on our REIT taxable income that is distributed to our stockholders.
Our principal offices are located at 2795 East Cottonwood Parkway, Suite 300, Salt Lake City, Utah 84121, telephone number (801) 365-4600.
Our internet address is www.extraspace.com. We file our annual report on Form 10-K, quarterly reports on Form 10-Q, current reports on Form 8-K, and all amendments to those reports with the Securities and Exchange Commission (the “SEC”). You may obtain copies of these documents by visiting the SEC’s website at www.sec.gov. In addition, as soon as reasonably practicable after such materials are furnished to the SEC, we make copies of these documents available to the public free of charge through the Investor Relations section of our website.
Self-Storage Operations
We own, operate, manage, provide lending to, acquire, develop and redevelop self-storage properties (“stores”). We operate and manage our business by evaluating the operating performance of the properties for our entire portfolio which includes wholly-owned stores, stores in which we have a partial ownership interest and managed stores. Stores offer month-to-month rental of storage space for personal or business use.
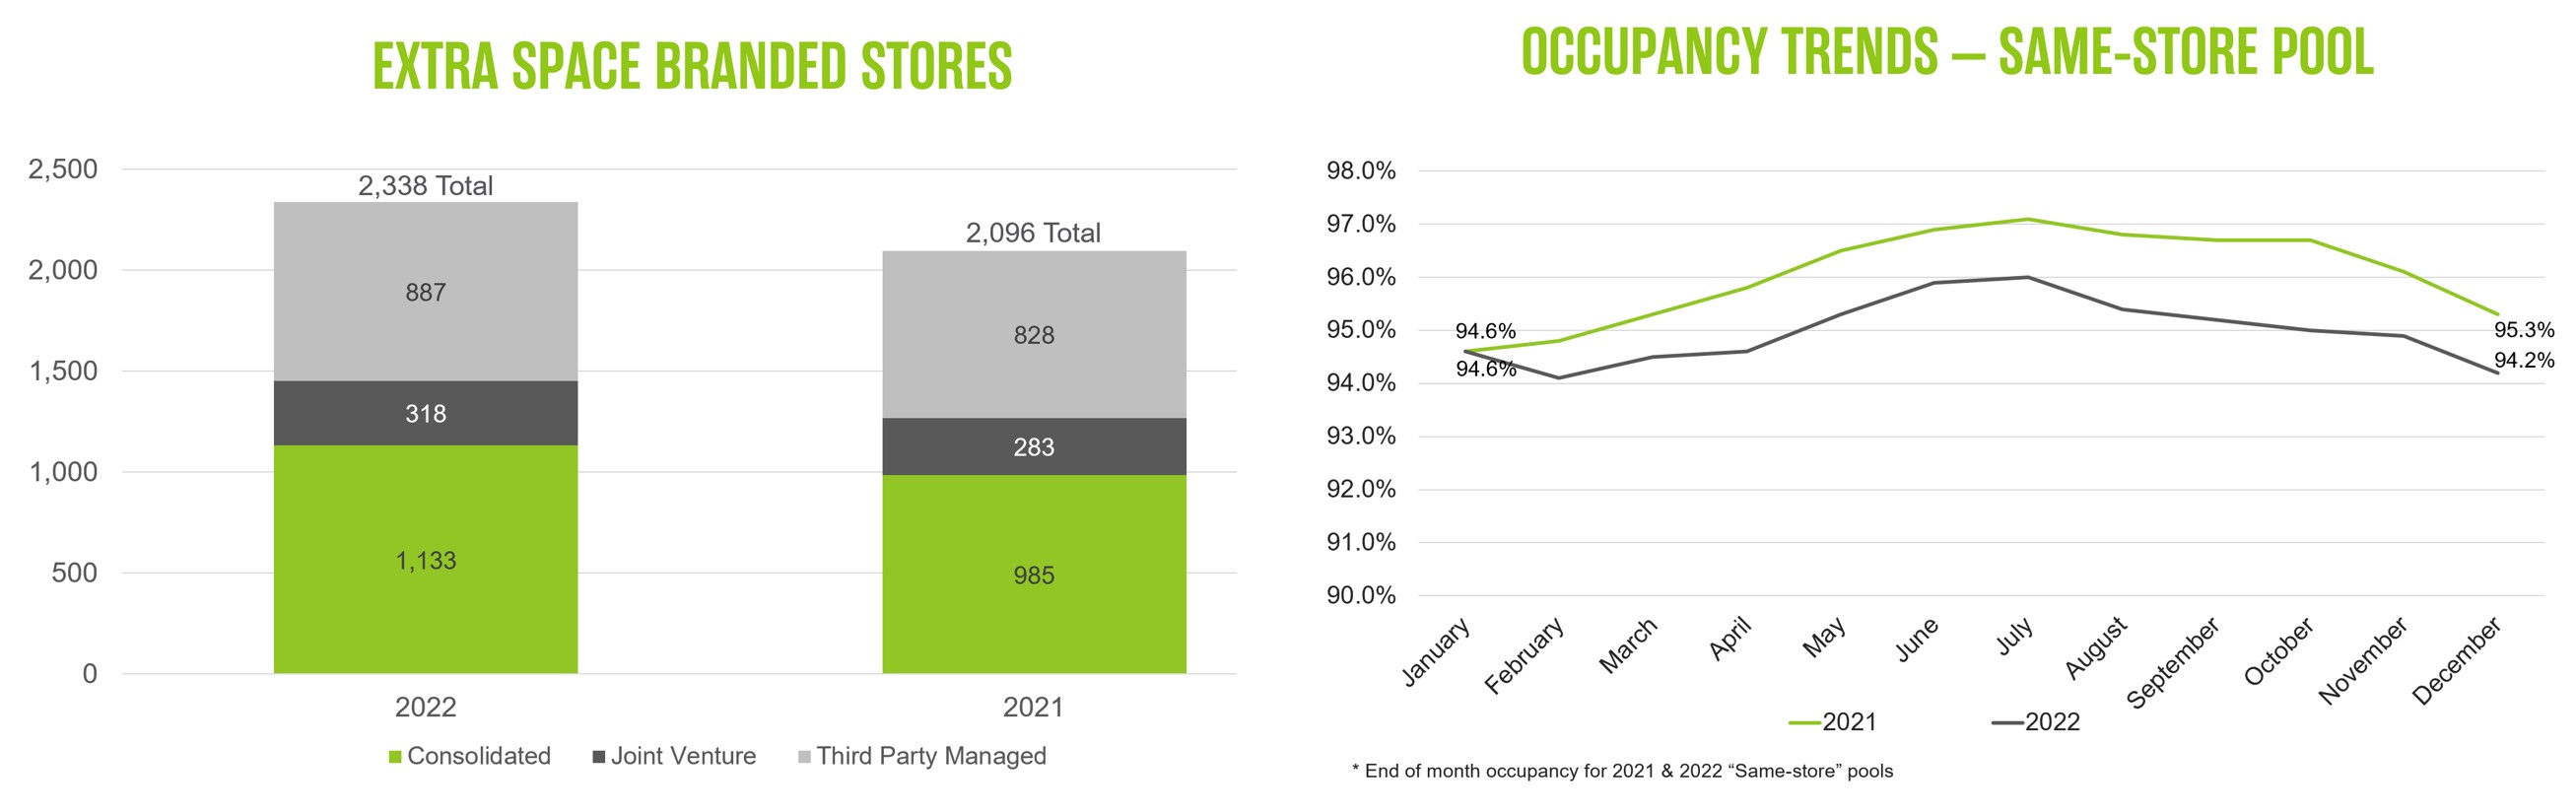
As of December 31, 2022, we owned and/or operated 2,338 stores in 41 states, and Washington, D.C., comprising approximately 176.1 million square feet of net rentable space in approximately 1.6 million units.
Other Operations
Our tenant reinsurance activities include the reinsurance of risks relating to the loss of goods stored by tenants in our stores. Our customers have the option of purchasing insurance from a non-affiliated insurance company to cover certain losses to their goods stored at our facilities, as well as those we manage for third parties. A wholly-owned, consolidated subsidiary fully reinsures such policies and thereby assumes all risk of losses under these policies and receives reinsurance premiums substantially equal to the premiums collected from our tenants, from the non-affiliated insurance company.
As of December 31, 2022, we managed 887 stores for third party owners. Our management business enables us to generate increased revenues through management fees as well as expand our geographic footprint, data sophistication and scale with little capital investment. We believe this expanded footprint enables us to reduce our operating costs through economies of scale. In addition, we see our management business as a potential future acquisition pipeline.
We have a bridge lending program, under which we provide financing to third party self storage owners for operating properties that we manage. This program helps us increase our management business, create additional potential future acquisition opportunities, and strengthen our relationships with partners, all while generating interest and fee income. We generally originate mortgage loans and mezzanine loans, with the intent to sell many of the mortgage loans to third parties, while retaining our interests in the mezzanine loans. As of December 31, 2022, the total principal balance of bridge loans receivable was $491.9 million.
We have made investments in preferred stock of other self-storage companies. These investments benefit us by providing dividend income, increasing our management business, and creating additional potential future acquisition opportunities through relationships with the companies in which we invest.
Operating Segments
We operate in two distinct segments: (1) self-storage operations; and (2) tenant reinsurance. Our self-storage operations activities include rental operations of wholly-owned stores. Tenant reinsurance activities include the reinsurance of risks relating to the loss of goods stored by tenants in our stores. For more information and comparative financial and other information on our reportable business segments, refer to the segment information footnote in the notes to the consolidated financial statements in Item 8 of this Form 10-K.
Long-Term Growth and Investment Strategies
Our primary business objectives are to maximize cash flow available for distribution to our stockholders and to achieve sustainable long-term growth in cash flow per share in order to maximize long-term stockholder value both at acceptable levels of risk. We continue to evaluate a range of growth initiatives and opportunities. Our primary strategies include the following:
Maximize the performance of our stores through strategic, efficient and proactive management
We pursue revenue-generating and expense-minimizing opportunities in our operations. We seek to maximize revenue by responding to changing market conditions through our advanced technology systems' ability to provide real-time, interactive rental rate and discount management. Our size allows us greater ability than the majority of our competitors to implement more dynamic online marketing programs, which we believe will attract more customers to our stores at a lower net cost.
We continually analyze our portfolio to look for long-term value-enhancing opportunities. We proactively redevelop properties to add units or modify existing unit mix to better meet the demand in a given market and to maximize revenue. We also redevelop properties to reduce their effective useful age, increase visual appeal, enhance security and to improve brand consistency across the portfolio.
Acquire self-storage stores
Our acquisitions team continues to pursue the acquisition of multi-store portfolios and single stores which can range from fully occupied to various stages of lease-up that we believe can provide stockholder value. We have established a reputation as a reliable, ethical buyer, which we believe enhances our ability to negotiate and close acquisitions. In addition, we believe our status as an UPREIT enables flexibility when structuring deals. We remain a disciplined buyer and only execute acquisitions that we believe will strengthen our portfolio and increase stockholder value.
In addition to the pursuit of operating stores, from time to time we develop stores from the ground up and provide the construction capital. We also purchase stores at the completion of construction from third party developers, who build to our specifications. These stores purchased at completion of construction (a "Certificate of Occupancy store"), create additional long-term value for our stockholders. We are typically able to acquire these assets at a lower price than a stabilized store, and expect greater long term returns on these stores on average. However, in the short term, these acquisitions cause dilution to our earnings during the two-to-four year period required to lease up the Certificate of Occupancy stores. We expect that this trend will continue as we continue to acquire Certificate of Occupancy stores.
Financing of Our Long-Term Growth Strategies
As a REIT, we are required to distribute at least 90%of our REIT taxable income to our stockholders. Consequently, we require access to additional sources of capital to fund our growth. We expect to maintain a flexible approach to financing growth. We plan to finance future acquisitions, store development and our bridge loan program through a diverse capital optimization strategy which includes but is not limited to: cash generated from operations, borrowings under our revolving lines of credit (the "Credit Lines"), secured and unsecured financing, equity offerings, joint ventures and the sale of stores.
Credit Lines - We have two credit lines which we primarily use as short-term bridge financing until we obtain longer-term financing through either debt or equity. As of December 31, 2022, our Credit Lines had available capacity of $1.4 billion, of which $445.0 million was undrawn.
Secured and Unsecured Debt - We primarily use public bonds, unsecured private placement bonds and unsecured bank term loans to finance store acquisitions and development efforts. We will continue to utilize a combination of secured and unsecured financing for future store acquisitions and development. As of December 31, 2022, we had $1.3 billion of secured notes payable and $5.1 billion of unsecured notes payable outstanding.
Equity - We have an active "at the market" ("ATM") program for selling stock. We sell stock under the ATM program from time to time to raise capital when we believe conditions are advantageous. During the year ended December 31, 2022, we didn't issue or sell any shares of common stock.
We view equity interests in our Operating Partnership as another source of capital that can provide an attractive tax planning opportunity to sellers of real estate. We issue common and preferred Operating Partnership units to sellers in certain acquisitions. Common Operating Partnership units receive distributions equal to the dividends on common stock, while Preferred Operating Partnership units receive distributions at various negotiated rates. We may issue additional units in the future when circumstances are favorable.
Joint Ventures - As of December 31, 2022, we owned 319 of our stores through joint ventures with third parties. Our joint venture partners typically provide most of the equity capital required for the acquisition of stores owned in these joint ventures. Most joint venture agreements include buy-sell rights, as well as rights of first offer in connection with the sale of stores by the joint venture. We manage the day-to-day operations of the stores owned in these joint ventures and have the right to participate in major decisions relating to sales of stores or financings by the applicable joint venture, but do not control the joint ventures.
Sale of Properties - We have not historically sold a high volume of stores, as we generally believe we are able to optimize the cash flow from stores through continued operations. However, we may sell more stores or interests in stores in the future in response to changing economic, financial or investment conditions. For the year ended December 31, 2022, we sold two stores for $38.7 million.
Industry & Competition
We are the second largest self-storage operator in the United States. Our four primary competitors who are public self-storage REITs are CubeSmart, Life Storage, National Storage Affiliates and Public Storage.
Stores offer month-to-month rental of storage space for personal or business use. Tenants typically rent fully enclosed spaces that vary in size and typically range from 5 feet by 5 feet to 20 feet by 20 feet, with an interior height of 8 feet to 12 feet. Tenants have responsibility for moving their items into and out of their units. Stores generally have on-site managers who supervise and run the day-to-day operations, providing tenants with assistance as needed.
Self-storage provides a convenient way for individuals and businesses to store their possessions due to life changes, or simply because of a need for storage space. The mix of residential tenants using a store is determined by a store’s local demographics and often includes people who are experiencing life changes such as downsizing their living space or others who are not yet settled into a permanent residence. Items that tenants place in self-storage are typically furniture, household items and appliances. Commercial tenants tend to include small business owners who require easy and frequent access to their goods, records, inventory or storage for seasonal goods.
Our research has shown that tenants choose a store based primarily on the convenience of the site to their home or business, making high-density, high-traffic population centers ideal locations for stores. A store’s visibility on the internet, price, perceived security, cleanliness, and the general professionalism of the store managers and staff are also contributing factors to a store’s ability to successfully secure rentals. Although most stores are leased to tenants on a month-to-month basis, tenants tend to continue their leases for extended periods of time.
The self-storage business is subject to seasonal fluctuations. A greater portion of revenues and profits are typically realized from May through September. Historically, our highest level of occupancy has been at the end of July, while our lowest level of occupancy has been in late February and early March.
The self-storage industry is a mature industry that has seen the average occupancy continue to increase. According to the Self-Storage Almanac (the “Almanac”), the national average physical occupancy rate was 90.2% of net rentable square feet in 2015, compared to an average physical occupancy rate of 93.4% in 2022. Our average occupancy for wholly-owned stores for 2022 was 93.3%.
The industry is also characterized by fragmented ownership. According to the Almanac, as of the end of 2022, the top ten self-storage companies in the United States operated approximately 24.2% of the total U.S. stores, and the top 50 self-storage
companies operated approximately 31.9% of the total U.S. stores. We believe this fragmentation will contribute to continued consolidation at some level in the future.
We believe that we are well positioned to compete for acquisitions. We have encountered competition when we have sought to acquire existing operating stores, especially for brokered portfolios. Competitive bidding practices have been commonplace between both public and private entities, and this will likely continue.
Regulation
Generally, stores are subject to various laws, ordinances and regulations, including regulations relating to lien sale rights and procedures and the Americans with Disabilities Act of 1990. Changes in any of these laws or regulations, as well as changes in laws, such as the Comprehensive Environmental Response and Compensation Liability Act, which increase the potential liability for environmental conditions or circumstances existing or created by tenants or others on stores, or laws affecting development, construction, operation, limitations on rent increases due to state of emergency or similar orders, upkeep, safety and taxation may result in significant unanticipated expenditures, loss of stores or other impairments to operations, which would adversely affect our financial position, results of operations or cash flows. In addition, noncompliance with any of these laws, ordinances or regulations could result in the imposition of fines or an award of damages to private litigants and also could require substantial capital expenditures to ensure compliance.
Insurance activities are subject to state insurance laws and regulations as determined by the particular insurance commissioner for each state in accordance with the McCarran-Ferguson Act, and are subject to the Gramm-Leach-Bliley Act and the privacy regulations promulgated by the Federal Trade Commission pursuant thereto. Store management activities may be subject to state real estate brokerage laws and regulations as determined by the particular real estate commission for each state. Our collection and processing of personal information may be subject to various data privacy and security laws, which govern the collection, use, disclosure of personal information and are constantly evolving, may conflict with each other to complicate compliance efforts and can results in investigations, proceedings, or actions that lead to significant civil and/or criminal penalties and restrictions on data processing. Changes in any of the laws governing our conduct could have an adverse impact on our ability to conduct our business or could materially affect our financial position, results of operations or cash flows.
Human Capital
At Extra Space, our culture is driven by our belief that our people are a key driver in our success. We believe that if we focus on attracting, developing, and retaining diverse top talent at all levels of the organization, our employees will take care of our customers and drive growth for our shareholders.
As of December 31, 2022, we had 4,781 employees and believe our relationship with our employees is good. Our employees are not represented by a collective bargaining agreement. In 2022, we invited our employees to participate in an employee satisfaction survey. We achieved an overall satisfaction score of 79% with over 91% of our employees participating in our survey.
Compensation, Health and Well Being
We offer competitive health benefits and encourage our employees to participate in employee health and wellness programs. Over 58% of our employees who are enrolled in our health plan participate in these programs. We offer individualized counseling to our employees to assist them with their journey towards better health. We also offer other health-oriented benefits such as smoking cessation programs and a fitness program that allows for reimbursements to employees for expenses incurred relating to fit-friendly activities, sports or exercise equipment.
Training and Development
In order to attract and retain diverse top talent, we offer training and development opportunities for our employees. In 2022, we invested in training and development for our employees, which included leadership training, communication training, individual learning plans, site manager training and mentorship programs. Our field employees received an average of eight hours of training and each new hire received an average of 82 hours of training in 2022. Additionally, we provide our employees with an education assistance program through Western Governors University that allows our employees a path to an undergraduate degree in business or information technology through scholarships and other assistance.
Diversity, Equity and Inclusion
We value diversity, equity and inclusion and undertake a wide spectrum of initiatives to attract and retain a diverse workforce. During 2022, we expanded participation in our employee resource groups that provide our employees a space to build community by celebrating their culture, providing mentoring opportunities and developing educational content for Extra Space. We will continue to implement and pursue diversity, equity and inclusion initiatives and tracking that allow us to attract and retain diverse top talent, improve employee engagement, increase innovation and customer insight and enhance the quality of our decision making. We also launched a formal internship program with Project Destined to support a more diverse talent pipeline into real estate professions. Utah Business Magazine recently recognized us as one of the top 100 Companies Championing Women.
Our employee population is approximately 47% female and approximately 44% have self-identified as people of color: Black or African American (16%), Hispanic or Latino (20%), Asian (2.4%), of two or more races (4.2%), Native American (0.6%), and Pacific Islander (0.5%).
We believe that our emphasis on training and development, employee safety, employee health and well-being, and a commitment to diversity, equity and inclusion leads to an increase in employee productivity and positions us to attract and retain top diverse talent.
Item 1A. Risk Factors
An investment in our securities involves various risks. All investors should carefully consider the following risk factors in conjunction with the other information contained in this Annual Report before trading in our securities. If any of the events set forth in the following risks actually occur, our business, operating results, prospects and financial condition could be harmed.
Our performance is subject to risks associated with real estate investments. We are a real estate company that derives our income from the operation of our stores. There are a number of factors that may adversely affect the income that our stores generate, including the following:
Risks Related to Our Stores and Operations
Adverse economic or other conditions in the markets in which we do business could negatively affect our occupancy levels and rental rates and therefore our operating results.
Our revenues and net operating income can be negatively impacted by general economic factors and other conditions that lead to a reduction in demand for rental space in the markets in which we operate. Our operations, revenues and operating income may be adversely impacted by, for example, increases in unemployment rates, rising interest rates, changing demographics, recessions, perceptions about the safety of our stores, changes in local zoning laws, consequences from climate change, public health emergencies, as well as earthquakes, hurricanes and other natural disasters, terrorist acts, civil disturbances or acts of war.
If we are unable to promptly re-let our units or if the rates upon such re-letting are significantly lower than expected, our business and results of operations would be adversely affected.
Virtually all of our leases are on a month-to-month basis. Any delay in re-letting units as vacancies arise would reduce our revenues and harm our operating results. In addition, lower than expected rental rates upon re-letting could adversely affect our revenues and impede our growth.
Uninsured losses or losses in excess of our insurance coverage could adversely affect our financial condition and our cash flow.
We maintain comprehensive property and casualty insurance policies, including liability, fire, flood, earthquake, wind (as we deem necessary or as required by our lenders), umbrella coverage and rental loss insurance with respect to our stores. Certain types of losses, however, may be either uninsurable, not economically insurable, or coverage may be excluded on certain policies, such as losses due to earthquakes, hurricanes, tornadoes, riots, acts of war, terrorism, or social engineering. Should an uninsured loss occur, we could lose both our investment in and anticipated profits and cash flow from a store. In addition, if any such loss is insured, we may be required to pay significant amounts on any claim for recovery of such a loss prior to our insurer being obligated to reimburse us for the loss, or the amount of the loss may exceed our coverage for the loss. As a result, our operating results may be adversely affected.
Legal disputes, settlement and defense costs could have an adverse effect on our operating results.
From time to time we have to make monetary settlements or defend actions or arbitration (including class actions) to resolve tenant, employment-related or other claims and disputes. Settling any such liabilities could negatively impact our operating results and cash available for distribution to stockholders, and could also adversely affect our ability to sell, lease, operate or encumber affected properties.
Our tenant reinsurance business is subject to significant governmental regulation, which may adversely affect our results.
Our tenant reinsurance business is subject to significant governmental regulation. The regulatory authorities generally have broad discretion to grant, renew and revoke licenses and approvals, to promulgate, interpret and implement regulations, and to evaluate compliance with regulations through periodic examinations, audits and investigations of the affairs of insurance providers. As a result of regulatory or private action in any jurisdiction, we may be temporarily or permanently suspended from continuing some or all of our reinsurance activities, or otherwise fined or penalized or suffer an adverse judgment, which could adversely affect our business and results of operations.
Environmental compliance costs and liabilities associated with operating our stores may adversely affect our results of operations.
Under various U.S. federal, state and local laws, ordinances and regulations, a current or previous owner, developer or operator of real estate may be liable for the costs of removal or remediation of certain hazardous or toxic substances, which could be substantial. Such laws often impose liability without regard to whether the owner or operator knew of, or was responsible for, the release or presence of such hazardous substances. From time to time, we may acquire properties, or interests in properties, with known adverse environmental conditions for which we believe that the environmental liabilities associated with these conditions are quantifiable and that the acquisition will yield a superior risk-adjusted return.
Costs associated with complying with the Americans with Disabilities Act of 1990 may result in unanticipated expenses.
Under the ADA, places of public accommodation are required to meet certain federal requirements related to access and use by disabled persons. A number of additional U.S. federal, state and local laws may also require modifications to our stores, or restrict certain further renovations of the stores, with respect to access thereto by disabled persons. If one or more of our stores is not in compliance with the ADA or other legislation, then we would be required to incur additional costs to bring the facility into compliance.
There is significant competition among self-storage operators and from other storage alternatives.
Competition in the local markets in which many of our stores are located is significant and has affected our occupancy levels, rental rates and operating expenses. Development of self-storage facilities has increased in recent years, which has intensified competition, and we expect it will continue to do so as newly developed facilities are opened. Development of self-storage facilities by other operators could continue to increase in the future. Actions by our competitors may decrease or prevent increases in our occupancy and rental rates, while increasing our operating expenses, which could adversely affect our business and results of operations.
We may not be successful in identifying and consummating suitable acquisitions that meet our criteria, which may impede our growth.
Our ability to expand through acquisitions is integral to our business strategy and requires us to identify suitable acquisition candidates or investment opportunities that meet our criteria and are compatible with our growth strategy. We may not be successful in identifying suitable stores or other assets that meet our acquisition criteria or in consummating acquisitions or investments on satisfactory terms or at all. Failure to identify or consummate acquisitions will slow our growth, which could in turn adversely affect our stock price.
Our ability to acquire stores on favorable terms and successfully integrate and operate them may be constrained by the following significant risks
•competition from local investors and other real estate investors with significant capital, including other publicly-traded REITs and institutional investment funds;
•competition from other potential acquirers may significantly increase the purchase price which could reduce our profitability;
•the inability to achieve satisfactory completion of due diligence investigations and other customary closing conditions; and
•we may acquire stores subject to liabilities without any recourse, or with only limited recourse, with respect to unknown liabilities such as liabilities for clean-up of undisclosed environmental contamination, claims by persons dealing with the former owners of the stores and claims for indemnification by general partners, directors, officers and others indemnified by the former owners of the stores.
We and our vendors rely on information technology, and any material failure, inadequacy, interruption or security failure of that technology could harm our business.
We rely on information technology networks and systems, including the Internet, to process, transmit and store electronic information, and to manage or support a variety of business processes, including financial transactions and records, personally identifiable information, and tenant and lease data. We purchase some of our information technology from vendors, on whom our systems depend. We rely on commercially available systems, software, tools and monitoring to provide security for processing, transmission and storage of confidential tenant and other sensitive information. Our information technology systems and those of our third-party service providers, strategic partners and other contractors or consultants are vulnerable to attack and damage or interruption from computer viruses and malware (e.g. ransomware), malicious code, natural disasters, terrorism, war, telecommunication and electrical failures, hacking, cyberattacks, phishing attacks and other social engineering schemes, employee theft or misuse, human error (e.g., social engineering, phishing), fraud, denial or degradation of service attacks, sophisticated nation-state and nation-state-supported actors or unauthorized access or use by persons inside our organization, or persons with access to systems inside our organization. Although we have taken steps to protect the security of our information systems and the data maintained in those systems, it is possible that our safety and security measures will not be able to prevent the systems’ improper functioning or damage, or the improper access or disclosure of personally identifiable information such as in the event of cyber-attacks. Security breaches, including physical or electronic break-ins, computer viruses, attacks by hackers and similar breaches, can create system disruptions, shutdowns or unauthorized disclosure of confidential information.
We and certain of our service providers are from time to time, subject to cyberattacks and security incidents. While to date, we do not believe that we have experienced any significant system failure, accident or security breach, this risk has generally increased as the number, intensity and sophistication of such breaches and attempted breaches from around the world have increased. Furthermore, because the technologies used to obtain unauthorized access to, or to sabotage or disrupt, systems change frequently and often are not recognized until launched against a target, we may be unable to anticipate these techniques or implement adequate preventative measures. We may also experience security breaches that may remain undetected for an extended period. Even if identified, we may be unable to adequately investigate or remediate incidents or breaches due to attackers increasingly using tools and techniques that are designed to circumvent controls, to avoid detection, and to remove or obfuscate forensic evidence. Any failure to maintain proper function, security and availability of our information systems could interrupt our operations, damage our reputation, divert significant management attention and resources to remedy any damages that result, subject us to liability claims or regulatory penalties and have a material adverse effect on our business and results of operations. Further, our insurance coverage may not be sufficient to cover the financial, legal, business or reputational losses that may result from an interruption or breach of our systems.
Failure to comply with laws and regulations relating to data privacy and protection, could adversely affect our business and our financial condition.
In the United States, both federal and various state governments have adopted, or are considering, laws, guidelines or rules for the collection, distribution, use and storage of information collected from or about consumers or their devices. For example, the California Consumer Privacy Act of 2018 ("CCPA") went into effect on January 1, 2020, and creates individual privacy rights for California consumers and increases the privacy and security obligations of entities handling certain personal information. The CCPA provides for civil penalties for violations, as well as a private right of action for data breaches that has increased the likelihood of, and risks associated with, data breach litigation. Further, the California Privacy Rights Act ("CPRA") generally went into effect in January 2023, and significantly amends the CCPA and will impose additional data protection obligations on covered businesses, including additional consumer rights processes, limitations on data uses, new audit requirements for higher risk data, and opt outs for certain uses of sensitive data. It also creates a new California data protection agency authorized to issue substantive regulations and could result in increased privacy and information security enforcement. Additional compliance investment and potential business process changes may be required. Similar laws have passed in Virginia, Utah, Connecticut and Colorado, and have been proposed in other states and at the federal level, reflecting a trend toward more stringent privacy legislation in the United States. The enactment of such laws could have potentially conflicting requirements that would make compliance challenging.
Although we work to comply with applicable laws, regulations and standards, our contractual obligations and other legal obligations, these requirements are evolving and may be modified, interpreted and applied in an inconsistent manner from one jurisdiction to another, and may conflict with one another or other legal obligations with which we must comply. Any failure or perceived failure by us or our employees, representatives, contractors, consultants, collaborators, or other third parties to
comply with such requirements or adequately address privacy and security concerns, even if unfounded, could result in additional cost and liability to us, damage our reputation, and adversely affect our business and results of operations.
Our property taxes could increase due to reassessment or property tax rate changes.
Real property taxes on our properties may increase as our properties are reassessed by taxing authorities or as property tax rates change. Therefore, the amount of property taxes we are required to pay could increase substantially from the property taxes we currently pay or have paid in the past, including on a retroactive basis. If our property taxes we pay increase, our cash flow would be adversely impacted, and our ability to pay any expected dividends to our stockholders and unitholders could be adversely affected.
Public health emergencies, such as pandemics including the COVID-19 pandemic, and measures intended to prevent the spread of a public health emergency, could adversely affect our results of operations.
We face risks related to public health emergencies, such as epidemics and pandemics, including the COVID-19 pandemic, which impacted our business in 2020, and could materially and adversely impact our results of operations in the future. The impact of a public health emergency, and measures to prevent the spread of a virus or the underlying causes of a health crisis, could lower demand for storage facilities due to, among other things, stay-at home orders and other restrictions which may lead to lower rental rates, reduced late fee collection and impaired ability to hold auctions resulting in higher accounts receivable and bad debt. In addition, a public health emergency could cause general economic and market disruptions which could impair our ability to expand our business, raise capital and adversely affect the value of our securities. Although the self-storage industry has historically been resilient to ordinary market downturns, the impact of the COVID-19 pandemic and other pandemics, epidemics or public health emergencies on the U.S. and world economies generally, and on our future results in particular, could be significant and will largely depend on future developments, which are highly uncertain and cannot be predicted.
Climate change may adversely affect our results of operations.
Climate change may cause extreme weather, changes in precipitation and temperature, increases in wild fire risk and rising sea levels in the areas in which we operate which may cause physical damage to our stores or a decrease in demand for rental space in the areas affected by these conditions. Should the impact of climate change be material in nature or occur for lengthy periods of time, our financial condition or results of operations may be adversely affected, and may negatively impact the types and pricing of insurance we are able to procure. In addition, changes in federal, state and local legislation and regulation on climate change could result in increased operating costs (for example, increased utility costs) and/or increased capital expenditures to improve the energy efficiency of our existing stores and could also require us to spend more on our new stores without a corresponding increase in revenue. Further, the impact of climate change may increase the cost of, or make unavailable, property insurance or other hazard insurance on terms we find acceptable or necessary to adequately protect our properties.
Risks Related to Our Organization and Structure
Conflicts of interest could arise as a result of our relationship with our Operating Partnership.
Conflicts of interest could arise in the future as a result of the relationships between us and our affiliates, and our Operating Partnership or any partner thereof. Our directors and officers have duties to our Company under applicable Maryland law in connection with their management of our Company. At the same time, we, through our wholly-owned subsidiary, have fiduciary duties, as a general partner, to our Operating Partnership and to the limited partners under Delaware law in connection with the management of our Operating Partnership. Our duties, through our wholly-owned subsidiary, as a general partner to our Operating Partnership and its partners may come into conflict with the duties of our directors and officers to our Company. The partnership agreement of our Operating Partnership does not require us to resolve such conflicts in favor of either our Company or the limited partners in our Operating Partnership. Unless otherwise provided for in the relevant partnership agreement, Delaware law generally requires a general partner of a Delaware limited partnership to adhere to fiduciary duty standards under which it owes its limited partners the highest duties of good faith, fairness, and loyalty and which generally prohibit such general partner from taking any action or engaging in any transaction as to which it has a conflict of interest.
Additionally, the partnership agreement expressly limits our liability by providing that neither we, our direct wholly-owned Massachusetts business trust subsidiary, as the general partner of the Operating Partnership, nor any of our or their trustees, directors or officers, will be liable or accountable in damages to our Operating Partnership, the limited partners or assignees for errors in judgment, mistakes of fact or law or for any act or omission if we, or such trustee, director or officer, acted in good faith. In addition, our Operating Partnership is required to indemnify us, our affiliates and each of our respective
trustees, officers, directors, employees and agents to the fullest extent permitted by applicable law against any and all losses, claims, damages, liabilities (whether joint or several), expenses (including, without limitation, attorneys’ fees and other legal fees and expenses), judgments, fines, settlements and other amounts arising from any and all claims, demands, actions, suits or proceedings, civil, criminal, administrative or investigative, that relate to the operations of the Operating Partnership, provided that our Operating Partnership will not indemnify for (1) willful misconduct or a knowing violation of the law, (2) any transaction for which such person received an improper personal benefit in violation or breach of any provision of the partnership agreement, or (3) in the case of a criminal proceeding, the person had reasonable cause to believe the act or omission was unlawful.
The provisions of Delaware law that allow the common law fiduciary duties of a general partner to be modified by a partnership agreement have not been resolved in a court of law, and we have not obtained an opinion of counsel covering the provisions set forth in the partnership agreement that purport to waive or restrict our fiduciary duties that would be in effect under common law were it not for the partnership agreement.
Our joint venture investments could be adversely affected by our lack of sole decision-making authority.
As of December 31, 2022, we held interests in 319 operating stores through joint ventures. Some of these arrangements could be adversely affected by our lack of sole decision-making authority, our reliance on co-venturers' financial conditions and disputes between us and our co-venturers. We expect to continue our joint venture strategy by entering into more joint ventures for the purpose of developing new stores and acquiring existing stores. In such event, we would not be in a position to exercise sole decision-making authority regarding the property, partnership, joint venture or other entity. The decision-making authority regarding the stores we currently hold through joint ventures is either vested exclusively with our joint venture partners, is subject to a majority vote of the joint venture partners or is equally shared by us and the joint venture partners. In addition, investments in partnerships, joint ventures or other entities may, under certain circumstances, involve risks not present were a third party not involved, including the possibility that partners or co-venturers might become bankrupt or fail to fund their share of required capital contributions. Partners or co-venturers may have economic or other business interests or goals which are inconsistent with our business interests or goals, and may be in a position to take actions contrary to our policies or objectives. Such investments may also have the potential risk of impasses on decisions, such as a sale, because neither we nor the partner or co-venturer would have full control over the partnership or joint venture. Disputes between us and partners or co-venturers may result in litigation or arbitration that would increase our expenses and prevent our officers and/or directors from focusing their time and efforts on our business. Consequently, actions by or disputes with partners or co-venturers might result in subjecting stores owned by the partnership or joint venture to additional risk. In addition, we may in certain circumstances be liable for the actions of our third-party partners or co-venturers, which could harm our financial condition.
Certain provisions of Maryland law and our organizational documents, including the stock ownership limit imposed by our charter, may inhibit market activity in our stock and could prevent or delay a change in control transaction.
Our charter, subject to certain exceptions, authorizes our directors to take such actions as are necessary and desirable to preserve our qualification as a REIT and to limit any person to actual or constructive ownership of no more than 7.0% (by value or by number of shares, whichever is more restrictive) of our outstanding common stock or 7.0% (by value or by number of shares, whichever is more restrictive) of our outstanding capital stock. Our board of directors, in its sole discretion, may exempt a proposed transferee from the ownership limit. However, our board of directors may not grant an exemption from the ownership limit to any proposed transferee whose ownership could jeopardize our qualification as a REIT. These restrictions on ownership will not apply if our board of directors determines that it is no longer in our best interests to attempt to qualify, or to continue to qualify, as a REIT. The ownership limit may delay or impede a transaction or a change of control that might involve a premium price for our securities or otherwise be in the best interests of our stockholders. Different ownership limits apply to the family of Kenneth M. Woolley, certain of his affiliates, family members and estates and trusts formed for the benefit of the foregoing; to Spencer F. Kirk, certain of his affiliates, family members and estates and trusts formed for the benefit of the foregoing; and to certain designated investment entities as defined in our charter.
Our board of directors has the power to issue additional shares of our stock in a manner that may not be in the best interest of our stockholders.
Our charter authorizes our board of directors to issue additional authorized but unissued shares of common stock or preferred stock and to increase the aggregate number of authorized shares or the number of shares of any class or series without stockholder approval. In addition, our board of directors may classify or reclassify any unissued shares of common stock or preferred stock and set the preferences, rights and other terms of the classified or reclassified shares. Our board of directors could issue additional shares of our common stock or establish a series of preferred stock that could have the effect of delaying, deferring or preventing a change in control or other transaction that might involve a premium price for our securities or otherwise not be in the best interests of our stockholders.
Our rights and the rights of our stockholders to take action against our directors and officers are limited.
Maryland law provides that a director or officer has no liability in that capacity if he or she performs his or her duties in good faith, in a manner he or she reasonably believes to be in our best interests and with the care that an ordinarily prudent person in a like position would use under similar circumstances. In addition, our charter eliminates our directors’ and officers’ liability to us and our stockholders for money damages except for liability resulting from actual receipt of an improper benefit in money, property or services or active and deliberate dishonesty established by a final judgment and which is material to the cause of action. Our bylaws require us to indemnify our directors and officers for liability resulting from actions taken by them in those capacities to the maximum extent permitted by Maryland law. As a result, we and our stockholders may have more limited rights against our directors and officers than might otherwise exist under common law. In addition, we may be obligated to fund the defense costs incurred by our directors and officers.
Risks Related to Our Debt Financings
Disruptions in the financial markets could affect our ability to obtain debt financing on reasonable terms and have other adverse effects on us.
Uncertainty in the credit and financial markets may negatively impact our ability to access additional debt financing or to refinance existing debt maturities on favorable terms (or at all), which may negatively affect our ability to make acquisitions and fund development projects. Credit and financial markets can be volatile and may be impacted by diminished liquidity and credit availability, rising interest and inflation rates, declines in economic growth and uncertainty about economic stability as well as geopolitical events such as the ongoing conflict between Russia and Ukraine, terrorism, civil unrest and acts of war. A downturn in the credit and financial markets may cause us to seek alternative sources of potentially less attractive financing, and may require us to adjust our business plan accordingly. In addition, these factors may make it more difficult for us to sell stores or may adversely affect the price we receive for stores that we do sell, as prospective buyers may experience increased costs of debt financing or difficulties in obtaining debt financing.
Required payments of principal and interest on borrowings may leave us with insufficient cash to operate our stores or to pay the distributions currently contemplated or necessary to maintain our qualification as a REIT and may expose us to the risk of default under our debt obligations.
As of December 31, 2022, we had approximately $7.4 billion of outstanding indebtedness. We may incur additional debt in connection with future acquisitions and development. We may borrow under our Credit Lines or borrow new funds to finance these future stores. Additionally, we do not anticipate that our internally generated cash flow will be adequate to repay our existing indebtedness upon maturity and, therefore, we expect to repay our indebtedness through refinancings and equity and/or debt offerings. Further, we may need to borrow funds in order to make cash distributions to maintain our qualification as a REIT or to make our expected distributions. To qualify as a REIT, we generally must distribute to our stockholders at least 90% of our REIT taxable income each year, determined without regard to the dividends paid deduction and excluding net capital gains, and we are subject to U.S. federal corporate income tax to the extent that we distribute less than 100% of our REIT taxable income each year, determined without regard to the deduction for dividends paid and including net capital gains.
If we are required to utilize our Credit Lines for purposes other than acquisition activity, this will reduce the amount available for acquisitions and could slow our growth. Therefore, our level of debt and the limitations imposed on us by our debt agreements could have significant adverse consequences, including the following:
•our cash flow may be insufficient to meet our required principal and interest payments;
•we may be unable to borrow additional funds as needed or on favorable terms, including to make acquisitions or to continue to make distributions required to maintain our qualification as a REIT;
•we may be unable to refinance our indebtedness at maturity or the refinancing terms may be less favorable than the terms of our original indebtedness;
•because a portion of our debt bears interest at variable rates, an increase in interest rates could materially increase our interest expense;
•we may be forced to dispose of one or more of our stores, possibly on disadvantageous terms;
•after debt service, the amount available for cash distributions to our stockholders is reduced;
•we may experience increased vulnerability to economic and industry downturns, reducing our ability to respond to changing business and economic conditions;
•we may default on our obligations and the lenders or mortgagees may foreclose on our stores that secure their loans and receive an assignment of rents and leases and/or enforce our guarantees;
•we may violate restrictive covenants in our loan documents, which would entitle the lenders to accelerate our debt obligations; and
•our default under any one of our mortgage loans with cross-default or cross-collateralization provisions could result in a default on other indebtedness or result in the foreclosures of other stores.
Increases in interest rates may increase our interest expense and adversely affect our cash flow and our ability to service our indebtedness and make cash distributions to our stockholders.
As of December 31, 2022, we had approximately $7.4 billion of debt outstanding, of which approximately $2.6 billion, or 35.3% was subject to variable interest rates (excluding debt with interest rate swaps). This variable rate debt had a weighted average interest rate of approximately 5.5% per annum. Increases in interest rates on this variable rate debt would increase our interest expense, which could harm our cash flow and our ability to pay cash distributions.
Failure to hedge effectively against interest rate changes may adversely affect our results of operations.
In certain cases we may seek to manage our exposure to interest rate volatility by using interest rate hedging arrangements. Hedging involves risks, such as the risk that the counterparty may fail to honor its obligations under an arrangement. Failure to hedge effectively against interest rate changes may adversely affect our financial condition, results of operations and ability to make cash distributions to our stockholders.
Changes in the method pursuant to which the London Interbank Offered Rate (“LIBOR”) is determined and the transition to other benchmarks may adversely affect our financial results.
LIBOR and certain other “benchmarks” have been the subject of continuing national, international and other regulatory guidance and proposals for reform. In July 2017, the United Kingdom’s Financial Conduct Authority (“FCA”), which regulates LIBOR, publicly announced that it intends to phase out LIBOR, and on March 5, 2021, the FCA announced that USD LIBOR will no longer be provided by any administrator or no longer be representative immediately after December 31, 2021, in the case of one week and two month USD settings, and immediately after June 30, 2023, in the case of the remaining USD settings. In anticipation of the planned discontinuation of LIBOR, we have converted most of our contracts from LIBOR to the Secured Overnight Financing Rate ("SOFR"), and expect to have converted all remaining contracts indexed to LIBOR to SOFR by June 30, 2023. SOFR is a measure of the cost of borrowing cash overnight, collateralized by U.S. Treasury securities, and is based on directly observable U.S. Treasury-backed repurchase transactions.
The ongoing transition from LIBOR to SOFR has and may continue to impact our business, including by affecting interest on loans and amounts received and paid on derivative instruments. These risks arise in connection with transitioning contracts to an alternative rate, including any resulting value transfer that may occur, and may vary by contract. The value of loans, securities, or derivative instruments tied to LIBOR, as well as interest rates on our current or future indebtedness, have been and will continue to be impacted by the transition from LIBOR to SOFR or other benchmark rates. In addition, transitioning to an alternative reference rate can be challenging, especially if we cannot agree with the respective counterparty about how to make the transition.
These risks may have a material adverse effect on our financing costs, and as a result, our financial condition, operating results and cash flows.
Our existing indebtedness contains covenants that limit our operating flexibility and failure to comply with all covenants in our debt agreements could materially and adversely affect us.
Our debt agreements, including our credit agreement governing the revolving credit facility and term loans and the indentures governing our public traded notes, contain various financial and other covenants that we and our operating partnership must comply with including total debt to asset ratios, secured debt to total asset ratios, adjusted EBITDA to fixed charged ratios and minimum ratios of unencumbered assets to unsecured debt which we must maintain.
These covenants may limit our operating flexibility and could prevent us from taking advantage of business opportunities as they arise, growing our business or competing effectively. Our ability to meet these covenants may be affected by events beyond our control, and we may be unable to maintain compliance with these covenants. If we fail to meet these requirements, we may be unable to obtain waivers from the lenders or indenture trustee, as applicable, or amend the covenants.
A breach of any of the covenants or other provisions in our debt agreements could result in an event of default, which if not cured or waived, could result in such debt becoming due and payable, either automatically or after an election to accelerate by the required percentage of the holders of the indebtedness or by an agent for the holders of the indebtedness. This, in turn, could cause our other debt, including the notes and our revolving credit facility, to become due and payable as a result of cross-default or cross-acceleration provisions contained in the agreements governing the other debt and permit certain of our lenders to
foreclose on our assets, if any, that secure this debt. In the event that some or all of our debt is accelerated and becomes immediately due and payable, we may not have the funds to repay, or the ability to refinance our debt.
Risks Related to Qualification and Operation as a REIT
Dividends payable by REITs may be taxed at higher rates.
Dividends payable by REITs may be taxed at higher rates than dividends of non-REIT corporations. The maximum U.S. federal income tax rate for qualified dividends paid by domestic non-REIT corporations to U.S. stockholders that are individuals, trust or estates is generally 20%. Dividends paid by REITs to such stockholders are generally not eligible for that rate, but under current tax law, such stockholders may deduct up to 20% of ordinary dividends (i.e., dividends not designated as capital gain dividends or qualified dividend income) received from a REIT for taxable years beginning before January 1, 2026. Although this deduction reduces the effective tax rate applicable to certain dividends paid by REITs, such tax rate may still be higher than the tax rate applicable to regular corporate qualified dividends. This may cause investors to view REIT investments as less attractive than investments in non-REIT corporations, which in turn may adversely affect the value of stock of REITs, including our stock. In addition, the relative attractiveness of real estate in general may be adversely affected by the favorable tax treatment given to corporate dividends, which could negatively affect the value of our stores.
Possible legislative or other actions affecting REITs could adversely affect our stockholders.
The rules dealing with U.S. federal income taxation are constantly under review by persons involved in the legislative process and by the Internal Revenue Service ("IRS") and the U.S. Department of the Treasury. Changes to the tax laws, with or without retroactive application, could adversely affect our investors or us in ways we cannot predict. New legislation, Treasury Regulations, administrative interpretations or court decisions could significantly and negatively affect our ability to qualify as a REIT, the U.S. federal income tax consequences of such qualification, or the U.S. federal income tax consequences of an investment in us. Also, the law relating to the tax treatment of other entities, or an investment in other entities, could change, making an investment in such other entities more attractive relative to an investment in a REIT.
Our failure to qualify as a REIT would have significant adverse consequences to us and the value of our stock.
We believe we operate in a manner that allows us to qualify as a REIT for U.S. federal income tax purposes under the Internal Revenue Code. If we fail to qualify as a REIT or lose our qualification as a REIT at any time, we will face serious tax consequences that would substantially reduce the funds available for distribution for each of the years involved because:
•we would not be allowed a deduction for distributions to stockholders in computing our taxable income and would be subject to U.S. federal corporate income tax on our taxable income;
•we also could be subject to the U.S. federal alternative minimum income tax for taxable years prior to 2018 and possibly increased state and local taxes; and
•unless we are entitled to relief under applicable statutory provisions, we could not elect to be taxed as a REIT for four taxable years following a year during which we were disqualified.
In addition, if we fail to qualify as a REIT, we will not be required to make distributions to stockholders, and all distributions to stockholders will be subject to tax as regular corporate dividends to the extent of our current and accumulated earnings and profits. This means that our U.S. individual stockholders would be taxed on our dividends at capital gains rates, and our U.S. corporate stockholders would be entitled to the dividends received deduction with respect to such dividends, subject, in each case, to applicable limitations under the Internal Revenue Code. If we fail to qualify as a REIT for U.S. federal income tax purposes and are able to avail ourselves of one or more of the relief provisions under the Internal Revenue Code in order to maintain our REIT status, we may nevertheless be required to pay penalty taxes of $50,000 or more for each such failure. As a result of all these factors, our failure to qualify as a REIT also could impair our ability to expand our business and raise capital, and could adversely affect the value of our securities.
Qualification as a REIT involves the application of highly technical and complex Internal Revenue Code provisions for which there are only limited judicial and administrative interpretations. The complexity of these provisions and of the applicable Treasury regulations that have been promulgated under the Internal Revenue Code is greater in the case of a REIT that, like us, holds its assets through a partnership. The determination of various factual matters and circumstances not entirely within our control may affect our ability to qualify as a REIT. In order to qualify as a REIT, we must satisfy a number of requirements, including requirements regarding the composition of our assets, the sources of our gross income and the owners of our stock. Our ability to satisfy the asset tests depends upon our analysis of the fair market value of our assets, some of which are not susceptible to precise determination, and for which we will not obtain independent appraisals. Our ability to satisfy the income tests depends on the sources and amounts of our gross income, which we may not be able to control. Also, we must
make distributions to stockholders aggregating annually at least 90% of our REIT taxable income, determined without regard to the dividends paid deduction and excluding net capital gains, and we will be subject to U.S. federal corporate income tax to the extent we distribute less than 100% of our REIT taxable income, without regard to the dividends paid deduction and including net capital gains.
We own and may acquire direct or indirect interests in entities that have elected or will elect to be taxed as REITs under the Internal Revenue Code (each, a “Subsidiary REIT”). A Subsidiary REIT is subject to the various REIT qualification requirements and other limitations described herein that are applicable to us. If a Subsidiary REIT were to fail to qualify as a REIT, then (i) that Subsidiary REIT would become subject to U.S. federal income tax, (ii) shares in such Subsidiary REIT would cease to be qualifying assets for purposes of the asset tests applicable to REITs, and (iii) it is possible that we would fail certain of the asset tests applicable to REITs, in which event we would fail to qualify as a REIT unless we could avail ourselves of certain relief provisions.
In addition, legislation, new regulations, administrative interpretations or court decisions may adversely affect our investors, our ability to qualify as a REIT for U.S. federal income tax purposes or the desirability of an investment in a REIT relative to other investments. Although we believe that we have been organized and have operated in a manner that is intended to allow us to qualify for taxation as a REIT, we can give no assurance that we have qualified or will continue to qualify as a REIT for U.S. federal income tax purposes. We have not requested and do not plan to request a ruling from the IRS regarding our qualification as a REIT.
We will pay some taxes, reducing cash available for stockholders.
Even though we qualify as a REIT for U.S. federal income tax purposes, we will be required to pay some U.S. federal, state and local taxes on our income and property. Extra Space Management, Inc. manages stores for our joint ventures and stores owned by third parties. We, jointly with certain corporate subsidiaries, including Extra Space Management, Inc., elected to treat each such subsidiary as a taxable REIT subsidiary (“TRS”) of our Company for U.S. federal income tax purposes. A TRS is subject to U.S. federal corporate income tax, and may also be subject to state and local taxes, on its taxable income. ESM Reinsurance Limited, a wholly-owned subsidiary of Extra Space Management, Inc., generates income from insurance premiums that are subject to U.S. federal income tax and state insurance premiums tax, and pays certain insurance royalties to us. In addition, we will be subject to a 100% penalty tax on certain amounts if the economic arrangements among our tenants, our TRS and us are not comparable to similar arrangements among unrelated parties. Also, if we sell property as a dealer (i.e., to customers in the ordinary course of our trade or business), we will be subject to a 100% penalty tax on any gain arising from such sales. While we do not intend to sell stores as a dealer, the IRS could take a contrary position. To the extent that we are, or any of our TRSs is, required to pay U.S. federal, state or local taxes, we will have less cash available for distribution to stockholders.
Item 1B. Unresolved Staff Comments
None.
Item 2. Properties
As of December 31, 2022, we owned or had ownership interests in 1,451 operating stores. Of these stores, 1,132 are wholly-owned, one is in a consolidated joint venture, and 318 are in unconsolidated joint ventures. In addition, we managed 887 stores for third parties bringing the total number of stores which we own and/or manage to 2,338. These stores are located in 41 states, and Washington, D.C. The majority of our stores are clustered around large population centers. The clustering of assets around these population centers enables us to reduce our operating costs through economies of scale. Our acquisitions have given us an increased scale in many core markets as well as a foothold in many markets where we had no previous presence.
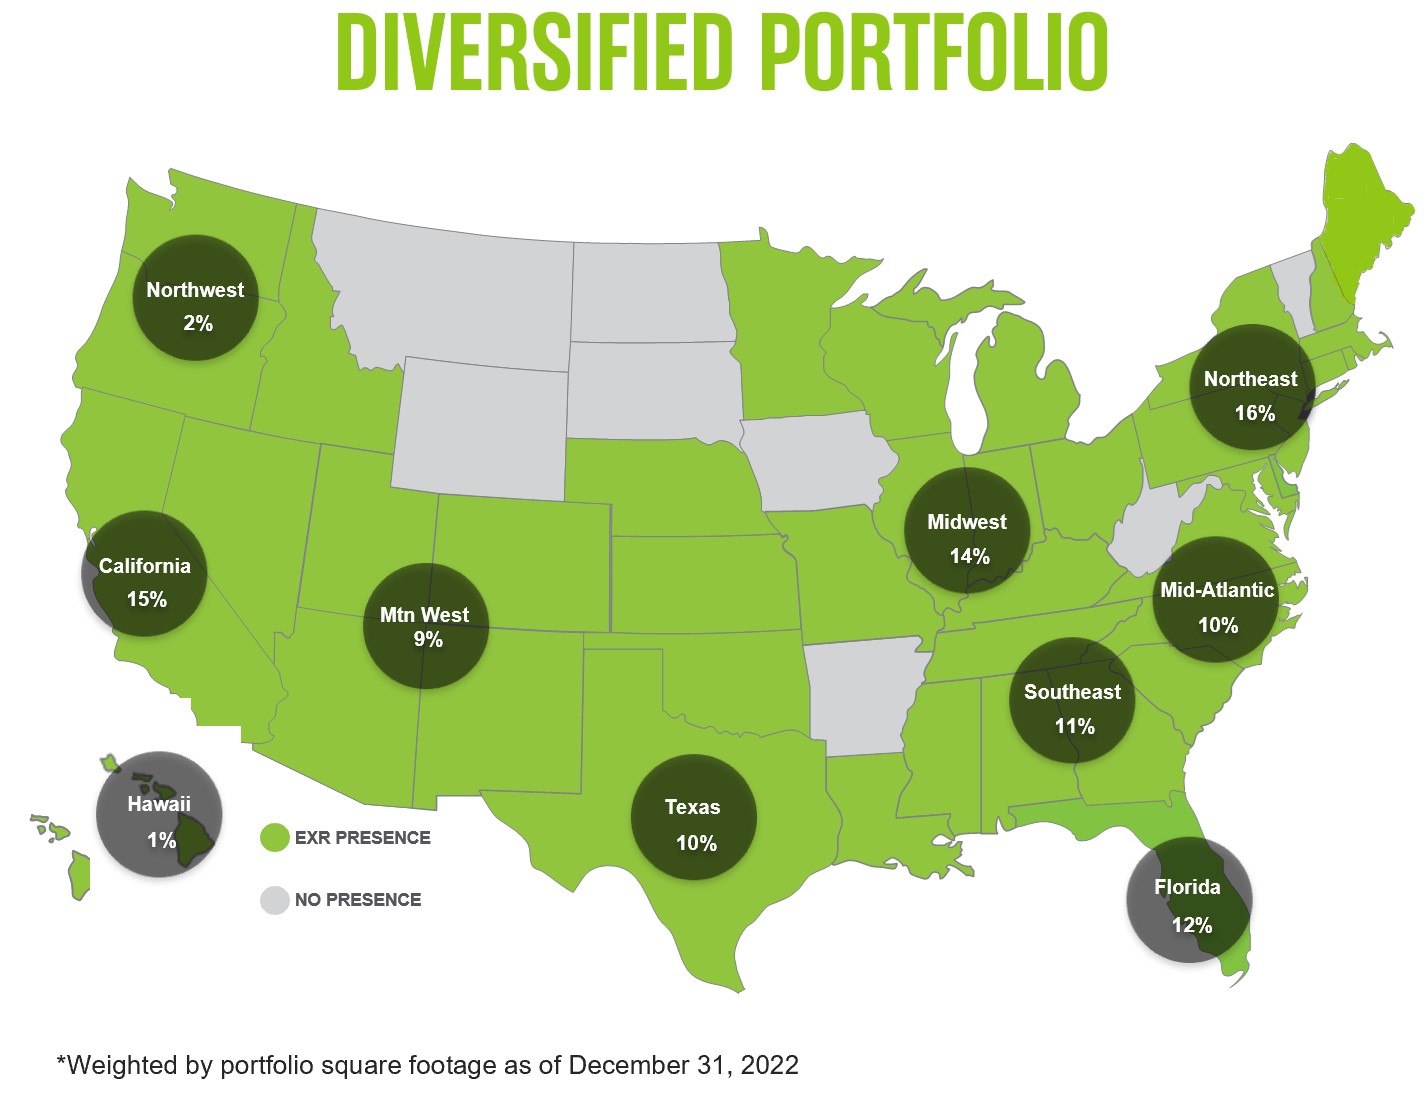
As of December 31, 2022, approximately 1,335,000 tenants were leasing storage units at the operating stores that we own and/or manage, primarily on a month-to-month basis, providing the flexibility to increase rental rates over time as market conditions permit. Existing tenants generally receive rate increases at least annually, for which no direct correlation has been drawn to our vacancy trends. Although leases are short-term in duration, the typical tenant tends to remain at our stores for an extended period of time. For stores that were stabilized as of December 31, 2022, the average length of stay was approximately 16.4 months.
The average annual rent per square foot for our existing customers at stabilized stores, net of discounts and bad debt, was $21.09 for the year ended December 31, 2022, compared to $17.68 for the year ended December 31, 2021. Average annual rent per square foot for new leases was $18.55 for the year ended December 31, 2022, compared to $19.30 for the year ended December 31, 2021. The average discounts, as a percentage of rental revenues, during these periods were 2.9% and 3.3%, respectively.
Our store portfolio is made up of different types of construction and building configurations. Most often sites are what we consider “hybrid” facilities, a mix of both drive-up buildings and multi-floor buildings. We have a number of multi-floor buildings with elevator access only, and a number of facilities featuring ground-floor access only.
The following table presents additional information regarding net rentable square feet and the number of stores by state: | | | | | | | | | | | | | | | | | | | | | | | | | | |
| As of December 31, 2022 |
| REIT Owned | JV Owned | Managed | Total |
| Location | Property Count (1) | Net Rentable Square Feet | Property Count | Net Rentable Square Feet | Property Count | Net Rentable Square Feet | Property Count | Net Rentable Square Feet |
| Alabama | 9 | | 677,643 | | 2 | | 150,808 | | 4 | | 276,695 | | 15 | | 1,105,146 | |
| | | | | | | | |
| Arizona | 25 | | 1,781,391 | | 10 | | 767,735 | | 21 | | 1,813,435 | | 56 | | 4,362,561 | |
| | | | | | | | |
| California | 177 | | 13,617,759 | | 49 | | 3,589,268 | | 101 | | 9,245,648 | | 327 | | 26,452,675 | |
| Colorado | 17 | | 1,148,067 | | 9 | | 664,076 | | 26 | | 1,889,128 | | 52 | | 3,701,271 | |
| Connecticut | 7 | | 538,856 | | 7 | | 575,724 | | 8 | | 512,463 | | 22 | | 1,627,043 | |
| Delaware | — | | — | | 2 | | 143,330 | | 2 | | 149,951 | | 4 | | 293,281 | |
| Florida | 112 | | 8,666,633 | | 44 | | 3,648,367 | | 111 | | 8,681,681 | | 267 | | 20,996,681 | |
| Georgia | 67 | | 5,188,222 | | 15 | | 1,215,893 | | 23 | | 1,758,268 | | 105 | | 8,162,383 | |
| Hawaii | 14 | | 942,888 | | — | | — | | 3 | | 159,393 | | 17 | | 1,102,281 | |
| Idaho | 2 | | 131,569 | | — | | — | | 1 | | 78,180 | | 3 | | 209,749 | |
| Illinois | 60 | | 3,692,816 | | 10 | | 740,744 | | 30 | | 2,104,187 | | 100 | | 6,537,747 | |
| Indiana | 91 | | 3,941,553 | | 1 | | 57,866 | | 20 | | 1,463,018 | | 112 | | 5,462,437 | |
| | | | | | | | |
| Kansas | 1 | | 50,059 | | 2 | | 108,920 | | 3 | | 228,935 | | 6 | | 387,914 | |
| Kentucky | 13 | | 958,359 | | 1 | | 51,771 | | 9 | | 782,473 | | 23 | | 1,792,603 | |
| Louisiana | 5 | | 386,984 | | — | | — | | 11 | | 808,823 | | 16 | | 1,195,807 | |
| Maine | — | | — | | — | | — | | 8 | | 572,791 | | 8 | | 572,791 | |
| Maryland | 35 | | 2,951,121 | | 11 | | 898,882 | | 39 | | 2,758,372 | | 85 | | 6,608,375 | |
| Massachusetts | 47 | | 3,006,416 | | 9 | | 613,696 | | 30 | | 1,919,036 | | 86 | | 5,539,148 | |
| Michigan | 8 | | 667,567 | | 4 | | 309,126 | | 9 | | 646,509 | | 21 | | 1,623,202 | |
| Minnesota | 7 | | 584,395 | | 4 | | 304,882 | | 16 | | 1,171,513 | | 27 | | 2,060,790 | |
| Mississippi | 3 | | 234,245 | | — | | — | | — | | — | | 3 | | 234,245 | |
| Missouri | 6 | | 431,381 | | 2 | | 119,650 | | 13 | | 985,543 | | 21 | | 1,536,574 | |
| | | | | | | | |
| Nebraska | — | | — | | — | | — | | 3 | | 277,866 | | 3 | | 277,866 | |
| Nevada | 14 | | 1,039,354 | | 4 | | 474,116 | | 8 | | 764,572 | | 26 | | 2,278,042 | |
| New Hampshire | 2 | | 134,764 | | 2 | | 84,165 | | 5 | | 332,146 | | 9 | | 551,075 | |
| New Jersey | 64 | | 5,113,817 | | 17 | | 1,228,570 | | 38 | | 2,891,480 | | 119 | | 9,233,867 | |
| New Mexico | 11 | | 698,987 | | 10 | | 683,085 | | 12 | | 899,202 | | 33 | | 2,281,274 | |
| New York | 28 | | 2,046,133 | | 18 | | 1,511,452 | | 36 | | 2,214,518 | | 82 | | 5,772,103 | |
| North Carolina | 23 | | 1,727,329 | | 5 | | 401,432 | | 21 | | 1,638,229 | | 49 | | 3,766,990 | |
| | | | | | | | |
| Ohio | 24 | | 1,463,573 | | 5 | | 325,138 | | 8 | | 645,184 | | 37 | | 2,433,895 | |
| Oklahoma | 1 | | 61,983 | | — | | — | | 19 | | 1,502,667 | | 20 | | 1,564,650 | |
| Oregon | 8 | | 549,012 | | 1 | | 65,165 | | 10 | | 737,843 | | 19 | | 1,352,020 | |
| Pennsylvania | 21 | | 1,547,076 | | 9 | | 678,998 | | 34 | | 2,497,016 | | 64 | | 4,723,090 | |
| Rhode Island | 2 | | 134,752 | | — | | — | | 3 | | 241,095 | | 5 | | 375,847 | |
| South Carolina | 23 | | 1,713,004 | | 11 | | 708,571 | | 27 | | 2,272,571 | | 61 | | 4,694,146 | |
| | | | | | | | |
| Tennessee | 22 | | 1,855,296 | | 13 | | 880,621 | | 12 | | 898,630 | | 47 | | 3,634,547 | |
| Texas | 111 | | 9,108,367 | | 27 | | 2,124,488 | | 85 | | 7,491,410 | | 223 | | 18,724,265 | |
| Utah | 10 | | 697,387 | | — | | — | | 24 | | 1,950,333 | | 34 | | 2,647,720 | |
| | | | | | | | |
| Virginia | 53 | | 4,267,954 | | 9 | | 703,835 | | 26 | | 1,735,604 | | 88 | | 6,707,393 | |
| Washington | 9 | | 684,906 | | — | | — | | 13 | | 1,060,316 | | 22 | | 1,745,222 | |
| Washington, DC | 1 | | 99,939 | | 1 | | 103,553 | | 4 | | 310,872 | | 6 | | 514,364 | |
| | | | | | | | |
| Wisconsin | — | | — | | 4 | | 370,993 | | 11 | | 856,701 | | 15 | | 1,227,694 | |
| | | | | | | | |
| | | | | | | | |
| Totals | 1,133 | | 82,541,557 | | 318 | | 24,304,920 | | 887 | | 69,224,297 | | 2,338 | | 176,070,774 | |
(1) REIT owned property count includes one store owned in a consolidated joint venture.
Item 3. Legal Proceedings
We are involved in various legal proceedings and are subject to various claims and complaints arising in the ordinary course of business. Because litigation is inherently unpredictable, the outcome of these matters cannot presently be determined with any degree of certainty. In accordance with applicable accounting guidance, management establishes an accrued liability for litigation when those matters present loss contingencies that are both probable and reasonably estimable. In such cases, there may be an exposure to loss in excess of any amounts accrued. The estimated loss, if any, is based upon currently available information and is subject to significant judgment, a variety of assumptions, and known and unknown uncertainties. We could in the future incur judgments or enter into settlements of claims that could have a material adverse effect on our results of operations in any particular period, notwithstanding the fact that we are currently vigorously defending any legal proceedings against us. For more information on our legal accruals, refer to the Commitments and Contingencies footnote in the notes to the consolidated financial statements in Item 8 of this Form 10-K.
Item 4. Mine Safety Disclosures
Not applicable.
PART II
Item 5. Market for Registrant’s Common Equity, Related Stockholder Matters and Issuer Purchases of Equity Securities
Market Information
Our common stock is traded under the symbol “EXR” on the New York Stock Exchange ("NYSE") since our IPO on August 17, 2004. On February 22, 2023, the closing price of our common stock as reported by the NYSE was $154.30. At February 22, 2023, we had 480 holders of record of our common stock. Certain shares of the Company are held in “street” name and accordingly, the number of beneficial owners of such shares is not known or included in the foregoing number.
Holders of shares of common stock are entitled to receive distributions when declared by our board of directors out of any assets legally available for that purpose. As a REIT, we are required to distribute at least 90% of our “REIT taxable income,” which is generally equivalent to our net taxable ordinary income, determined without regard to the deduction for dividends paid to our stockholders, annually in order to maintain our REIT qualification for U.S. federal income tax purposes. We have historically made regular quarterly distributions to our stockholders.
Information about our equity compensation plans is incorporated by reference in Item 12 of Part III of this Annual Report on Form 10-K.
Issuer Purchases of Equity Securities
In October 2020, our board of directors authorized a three-year share repurchase program allowing the repurchase of shares with an aggregate value up to $400.0 million. During the year ended December 31, 2022, we repurchased 381,786 shares at an average price of $165.03 per share, paying a total of $63.0 million. As of December 31, 2022, we had remaining authorization to repurchase shares with an aggregate value up to $337.0 million.
Unregistered Sales of Equity Securities
All unregistered sales of equity securities during the year ended December 31, 2022 have previously been disclosed in filings with the SEC.
Item 6. Selected Financial Data
Not required.
Item 7. Management’s Discussion and Analysis of Financial Condition and Results of Operations
The following discussion should be read in conjunction with the financial statements and notes thereto appearing elsewhere in this report. We make statements in this section that are forward-looking statements within the meaning of the federal securities laws. For a complete discussion of forward-looking statements, see the section in this Form 10-K entitled “Statements Regarding Forward-Looking Information.” Certain risk factors may cause actual results, performance or achievements to differ materially from those expressed or implied by the following discussion. For a discussion of such risk factors, see the section in this Form 10-K entitled “Risk Factors.” Dollar amounts in thousands, except share and per share data, unless otherwise stated.
OVERVIEW
We are a fully integrated, self-administered and self-managed real estate investment trust (“REIT”), formed to own, operate, manage, acquire, develop and redevelop self-storage properties (“stores”). We derive substantially all of our revenues from our two segments: storage operations and tenant reinsurance. Primary sources of revenue for our storage operations segment include rents received from tenants under leases at each of our wholly-owned stores. Our operating results depend materially on our ability to lease available self-storage units, to actively manage unit rental rates, and on the ability of our tenants to make required rental payments. Consequently, management spends a significant portion of their time maximizing cash flows from our diverse portfolio of stores. Revenue from our tenant reinsurance segment consists of insurance revenues from the reinsurance of risks relating to the loss of goods stored by tenants in our stores.
Our stores are generally situated in highly visible locations clustered around large population centers. The clustering of our assets around these population centers enables us to reduce our operating costs through economies of scale. To maximize the performance of our stores, we employ industry-leading revenue management systems. Developed by our management team, these systems enable us to analyze, set and adjust rental rates in real time across our portfolio in order to respond to changing market conditions. We believe our systems and processes allow us to more pro-actively manage revenues.
We operate in competitive markets, often where consumers have multiple stores from which to choose. Competition has impacted, and will continue to impact, our store results. We experience seasonal fluctuations in occupancy levels, with occupancy levels generally higher in the summer months due to increased moving activity. We believe that we are able to respond quickly and effectively to changes in local, regional and national economic conditions by adjusting rental rates through the combination of our revenue management team and our industry-leading technology systems. We consider a store to be in the lease-up stage after it has been issued a certificate of occupancy, but before it has achieved stabilization. We consider a store to be stabilized once it has achieved either an 80% occupancy rate for a full year measured as of January 1 of the current year, or has been open for three years prior to January 1 of the current year.
CRITICAL ACCOUNTING POLICIES AND ESTIMATES
Our financial statements have been prepared in accordance with U.S. generally accepted accounting principles. The preparation of these financial statements requires us to make estimates and assumptions that affect the reported amount of assets and liabilities at the date of the financial statements and the reported amount of revenues and expenses during the reporting period. On an ongoing basis, we evaluate our estimates and assumptions, including those that impact our most critical accounting policies. We base our estimates and assumptions on historical experience and on various other factors that we believe are reasonable under the circumstances. A summary of significant accounting policies is also provided in the notes to our consolidated financial statements (see Note 2 to our consolidated financial statements). Actual results may differ from these estimates. We believe the following are our most critical accounting policies and estimates:
CONSOLIDATION: Arrangements that are not controlled through voting or similar rights are accounted for as variable interest entities (“VIEs”). An enterprise is required to consolidate a VIE if it is the primary beneficiary of the VIE.
Under certain circumstances when we enter into arrangements for the formation of joint ventures, a VIE may be created. The primary factors that require the most judgment in determining whether the joint venture is a VIE are whether the decisions that most significantly impact the entity’s economic performance were controlled by the equity holders as a group, and whether the joint venture has sufficient equity to finance its activities without additional subordinated support.
If the joint venture is determined to be a VIE, we perform a qualitative analysis, including considering which party, if any, has the power to direct the activities most significant to the economic performance of each VIE and whether that party has the obligation to absorb losses of the VIE or the right to receive benefits from the VIE that could be significant to the VIE. If we are determined to be the primary beneficiary of the VIE, the assets, liabilities and operations of the VIE are consolidated within
our financial statements. Otherwise, our investment is generally accounted for under the equity method. Our ability to correctly assess the influence or control over an entity affects the presentation of the investment in our consolidated financial statements.
REAL ESTATE ASSETS: We account for the acquisition of stores, including by merger and other acquisitions of real estate, in accordance with ASC 805-10, "Business Combinations." We use our judgment to determine if assets acquired meet the definition of a business or if the acquisition should be considered an asset acquisition. We must make significant assumptions and estimates in determining the fair value of the tangible and intangible assets and liabilities acquired and consideration transferred. These fair value estimates are sensitive to: price of land per square foot and current replacement cost estimates, including adjustments for the age, class, height, square footage, condition, location, and turnkey factor. These assumptions and estimates require judgment, and therefore others could come to materially different conclusions as to the estimated fair values, which could result in differences in depreciation and amortization expense, gains and losses on the sale of real estate assets, and real estate and intangible asset values.
EVALUATION OF ASSET IMPAIRMENT: Long lived assets held for use are evaluated for impairment when events or circumstances indicate that there may be impairment. We review each store at least annually to determine if any such events or circumstances have occurred or exist. We focus on stores where occupancy and/or rental income have decreased by a significant amount. For these stores, we determine whether the decrease is temporary or permanent and whether the store will likely recover the lost occupancy and/or revenue in the short term. In addition, we review stores in the lease-up stage and compare actual operating results to original projections. We may not have identified all material facts and circumstances that affect impairment of our stores. No material impairments were recorded in the year ended December 31, 2022.
We evaluate goodwill for impairment at least annually and whenever events, circumstances, and other related factors indicate that fair value of the related reporting unit may be less than the carrying value. If the fair value of the reporting unit is determined to exceed the aggregate carrying amount, no impairment charge is recorded. Otherwise, an impairment charge is recorded to the extent the carrying amount of the goodwill exceeds the amount that would be allocated to goodwill if the reporting unit were acquired for estimated fair value. No impairments were recorded in our evaluations for any period presented herein.
DERIVATIVE INSTRUMENTS AND HEDGING ACTIVITIES: We hold a number of derivative instruments which we use to hedge our exposure to variability in expected future cash flows, mainly related to our interest rates on variable interest debt. We do not use derivatives for trading or speculative purposes. We assess our derivatives both at inception, and on an ongoing quarterly basis, for whether the derivatives used in hedging transactions are effective. The rules and interpretations relating to the accounting for derivatives are complex. Failure to apply this guidance correctly may require us to recognize all changes in fair value of the hedged derivative in earnings, which may materially impact our results.
INCOME TAXES: We have elected to be treated as a REIT under Sections 856 through 860 of the Internal Revenue Code. In order to maintain our qualification as a REIT, among other requirements, we are required to distribute at least 90% of our REIT taxable income to our stockholders and meet certain tests regarding the nature of our income and assets. As a REIT, we are not subject to U.S. federal income tax with respect to that portion of our income which meets certain criteria and is distributed annually to our stockholders. We plan to continue to operate so that we meet the requirements for taxation as a REIT. Many of these requirements, however, are highly technical and complex. For any taxable year that we fail to qualify as a REIT and for which applicable statutory relief provisions did not apply, we would be subject to U.S. federal corporate income tax on all of our taxable income for at least that year and the ensuing four years. We could also be subject to penalties and interest, and our net income may be materially different from the amounts reported in our financial statements.
We have elected to treat certain corporate subsidiaries, including Extra Space Management, Inc., as a TRS. In general, a TRS may perform additional services for tenants and generally may engage in any real estate or non-real estate related business. A TRS is subject to U.S. federal corporate income tax and may also be subject to state and local income taxes. Interest and penalties relating to uncertain tax positions will be recognized in income tax expense when incurred. If tax authorities determine that amounts paid by any of our TRSs to us are not reasonable compared to similar arrangements among unrelated parties, we could be subject to a penalty tax on the excess payments.
RECENT ACCOUNTING PRONOUNCEMENTS
For a discussion of recent accounting pronouncements affecting our business, see Item 8, “Financial Statements and Supplementary Data–Recently Issued Accounting Standards.”
RESULTS OF OPERATIONS
Comparison of the Year Ended December 31, 2022 to the Year Ended December 31, 2021
Overview
Results for the year ended December 31, 2022 included the operations of 1,451 stores (1,132 wholly-owned, one in a consolidated joint venture, and 318 in joint ventures accounted for using the equity method) compared to the results for the year ended December 31, 2021, which included the operations of 1,268 stores (981 wholly-owned, four in a consolidated joint venture, and 283 in joint ventures accounted for using the equity method). Material or unusual changes in the results of our operations are discussed below.
Revenues
The following table presents information on revenues earned for the years indicated: | | | | | | | | | | | | | | | | | | | | | | | |
| | For the Year Ended December 31, | | | | |
| | 2022 | | 2021 | | $ Change | | % Change |
| | | | | | | |
| Property rental | $ | 1,654,735 | | | $ | 1,340,990 | | | $ | 313,745 | | | 23.4 | % |
| Tenant reinsurance | 185,531 | | | 170,108 | | | 15,423 | | | 9.1 | % |
| Management fees and other income | 83,904 | | | 66,264 | | | 17,640 | | | 26.6 | % |
| Total revenues | $ | 1,924,170 | | | $ | 1,577,362 | | | $ | 346,808 | | | 22.0 | % |
Property Rental—The increase in property rental revenues for the year ended December 31, 2022 was primarily the result of an increase of $220,629 at our stabilized stores related to high occupancy and increased rents to existing customers. Property rental revenue also increased by $100,601 associated with acquisitions completed in 2022 and 2021. We acquired 153 stores during the year ended December 31, 2022 and we acquired 74 stores during the year ended December 31, 2021. Property rental revenue also increased by $5,431 during the year ended December 31, 2022 as a result of increases in occupancy at our lease-up stores. These increases were offset by approximately $15,460 related to the sale of 16 stores into a new joint venture and 16 stores to a third party during 2021.
Tenant Reinsurance—The increase in tenant reinsurance revenues was due primarily to an increase in the number of stores operated and the higher average occupancy across the portfolio. We operated 2,338 stores at December 31, 2022, compared to 2,096 stores at December 31, 2021.
Management Fees and Other Income—Management fees and other income represent the fees collected for our management of stores owned by third parties and unconsolidated joint ventures and other transaction fee income. The increase for the year ended December 31, 2022 was primarily due to an increase in the number of stores managed. As of December 31, 2022, we managed 1,206 stores for third parties and joint ventures compared to 1,115 stores as of December 31, 2021.
Expenses
The following table presents information on expenses for the years indicated: | | | | | | | | | | | | | | | | | | | | | | | |
| | For the Year Ended December 31, | | | | |
| | 2022 | | 2021 | | $ Change | | % Change |
| | | | | | | |
| Property operations | $ | 435,342 | | | $ | 368,608 | | | $ | 66,734 | | | 18.1 | % |
| Tenant reinsurance | 33,560 | | | 29,488 | | | 4,072 | | | 13.8 | % |
| Transaction related costs | 1,548 | | | — | | | 1,548 | | | — | |
| General and administrative | 129,251 | | | 102,194 | | | 27,057 | | | 26.5 | % |
| Depreciation and amortization | 288,316 | | | 241,879 | | | 46,437 | | | 19.2 | % |
| Total expenses | $ | 888,017 | | | $ | 742,169 | | | $ | 145,848 | | | 19.7 | % |
Property Operations—The increase in property operations expense consists primarily of an increase of $32,242 at stabilized stores due to increased payroll, credit card processing fees, utilities, property taxes and insurance. The increase was also attributed to $34,547 related to acquisitions completed in 2022 and 2021. We acquired 153 stores during the year ended December 31, 2022 and acquired 74 stores during the year ended December 31, 2021. The increase was partially offset by a decrease in expense of $6,934 related to property sales.
Tenant Reinsurance—Tenant reinsurance expense represents the costs that are incurred to provide tenant reinsurance. The increase in tenant reinsurance expense for the year ended December 31, 2022 was due primarily to the increase in total number of stores operated compared to the prior year and major storm events that occurred causing an increase in claim payouts. Tenant reinsurance expense included a $3,000 charge for tenant reinsurance claims related to damages incurred from Hurricane Ian. We operated 2,338 stores at December 31, 2022, compared to 2,096 stores at December 31, 2021.
Transaction Related Costs—This represents the costs that were incurred as part of the acquisition of Bargold Storage Systems, LLC ("Bargold").
General and Administrative—General and administrative expenses primarily include all expenses not directly related to our stores, including corporate payroll, travel and professional fees. These expenses are recognized as incurred. Our overall expense has increased due to acquisitions, business combinations and growth through our joint venture partners and managed portfolio. During 2021, we experienced higher than average turnover and extended times to fill. We experienced wage pressure which led to increases in wages of approximately 10% nationwide. During 2022, we continued to see these trends but to a lesser extent and as such we do not expect these trends to continue in 2023. No other material trends in specific travel or other expenses were observed.
Depreciation and Amortization—Depreciation and amortization expense increased as a result of the acquisition of new stores. We acquired 153 stores during the year ended December 31, 2022, and acquired 74 stores during the year ended December 31, 2021.
Other Income and Expenses
The following table presents information on other revenues and expenses for the years indicated: | | | | | | | | | | | | | | | | | | | | | | | |
| | For the Year Ended December 31, | | | | |
| | 2022 | | 2021 | | $ Change | | % Change |
| Gain on real estate transactions | $ | 14,249 | | | $ | 140,760 | | | $ | (126,511) | | | (89.9) | % |
| Interest expense | (219,171) | | | (166,183) | | | (52,988) | | | 31.9 | % |
| | | | | | | |
| Interest income | 69,422 | | | 49,703 | | | 19,719 | | | 39.7 | % |
| | | | | | | |
| Equity in earnings and dividend income from unconsolidated real estate entities | 41,428 | | | 32,358 | | | 9,070 | | | 28.0 | % |
| Equity in earnings of unconsolidated real estate ventures - gain on sale of real estate assets | — | | | 6,251 | | | (6,251) | | | 100.0 | % |
| Income tax expense | (20,925) | | | (20,324) | | | (601) | | | 3.0 | % |
| Total other expense, net | $ | (114,997) | | | $ | 42,565 | | | $ | (157,562) | | | (370.2) | % |
Gain on Real Estate Transactions — During the year ended December 31, 2022 we sold two stores. We recognized a total gain of $14,249 related to the sale of these assets. During the first quarter of 2021, we sold 16 stores to a newly established unconsolidated joint venture for a total sales price of $168,885 resulting in a gain of $63,477. Additionally, we sold 16 stores during the fourth quarter of 2021 to a third party for a total sales price of $204,500 resulting in a gain of $73,854.
Interest Expense—The increase in interest expense during the year ended December 31, 2022 was the result of higher overall debt and a higher average interest rate when compared to the same period in the prior year. Information on the total face value of debt and the average interest rate for the years ended December 31, 2022 and December 31, 2021 is set forth in the following table:
| | | | | | | | | | | | | | | | | | | | | | | |
| | For the Year Ended December 31, | | | | | | |
| | 2022 | | 2021 | | | | | | | | | | | | |
| Total face value of debt | $ | 7,364,424 | | | $ | 5,984,113 | | | | | | | | | | | | | |
| Average interest rate | 4.1 | % | | 2.6 | % | | | | | | | | | | | | |
Interest Income—Interest income represents interest earned on bridge loans and debt securities, income earned on notes receivable from common and preferred Operating Partnership unit holders and amounts earned on cash and cash equivalents deposited with financial institutions. The total principal balance of bridge loans receivable as of December 31, 2022 was $491,879, compared to $279,042 as of December 31, 2021. The increase in interest income during the year ended December 31, 2022 was primarily the result of the higher bridge loan balances along with higher interest rates.
Equity in Earnings and Dividend Income from Unconsolidated Real Estate Entities—Equity in earnings of unconsolidated real estate ventures represents the income earned through our ownership interests in unconsolidated real estate ventures. In joint ventures, we and our joint venture partners generally receive a preferred return on our invested capital. To the extent that cash or profits in excess of these preferred returns are generated, we receive a higher percentage of the excess cash or profits, as applicable. We added a total of 37 stores to new and existing joint ventures for the year ended December 31, 2022 resulting in higher earnings when compared to the prior year. Dividend income represents dividends from our $200,000 investment in preferred stock of SmartStop.
Equity in Earnings of Unconsolidated Real Estate Ventures—Gain on Sale of Real Estate Assets and Purchase of Joint Venture Partner's Interest—In June 2021, we sold our interest in two unconsolidated single store joint ventures to our joint ventures partner. We received proceeds of $1,888 in cash and recorded a gain of $525. Also, as of June 2021, the WICNN JV LLC and GFN JV LLC joint ventures sold all 17 of the stores owned by the joint ventures to a third party. Subsequent to the sales, these joint ventures were dissolved. As a result of these transactions, we recorded a gain of $5,739.
Income Tax Expense—For the year ended December 31, 2022, the increase in income tax expense was the result of an increase in income earned by our TRS when compared to the same period in the prior year.
Comparison of the Year Ended December 31, 2021 to the Year Ended December 31, 2020
The results of operations for the years ended December 31, 2021 compared to December 31, 2020 was included in our Annual Report on Form 10-K for the year ended December 31, 2021 on page 21, under Part II, Item 7, “Management’s Discussion and Analysis of Financial Condition and Results of Operations,” which was filed with the SEC on February 28, 2022.
FUNDS FROM OPERATIONS
Funds from operations ("FFO") provides relevant and meaningful information about our operating performance that is necessary, along with net income and cash flows, for an understanding of our operating results. We believe FFO is a meaningful disclosure as a supplement to net earnings. Net earnings assume that the values of real estate assets diminish predictably over time as reflected through depreciation and amortization expenses. The values of real estate assets fluctuate due to market conditions and we believe FFO more accurately reflects the value of our real estate assets. FFO is defined by the National Association of Real Estate Investment Trusts, Inc. (“NAREIT”) as net income computed in accordance with U.S. generally accepted accounting principles (“GAAP”), excluding gains or losses on sales of operating stores and impairment write-downs of depreciable real estate assets, plus real estate related depreciation and amortization and after adjustments to record unconsolidated partnerships and joint ventures on the same basis. We believe that to further understand our performance, FFO should be considered along with the reported net income and cash flows in accordance with GAAP, as presented in the consolidated financial statements. FFO should not be considered a replacement of net income computed in accordance with GAAP.
The computation of FFO may not be comparable to FFO reported by other REITs or real estate companies that do not define the term in accordance with the current NAREIT definition or that interpret the current NAREIT definition differently. FFO does not represent cash generated from operating activities determined in accordance with GAAP, and should not be considered as an alternative to net income as an indication of our performance, as an alternative to net cash flow from operating activities as a measure of our liquidity, or as an indicator of our ability to make cash distributions.
The following table presents the calculation of FFO for the periods indicated: | | | | | | | | | | | | | | | | | | | | |
| | | For the Year Ended December 31, |
| | | 2022 | | 2021 | | 2020 |
| Net income attributable to common stockholders | | $ | 860,688 | | | $ | 827,649 | | | $ | 481,779 | |
| | | | | | |
| Adjustments: | | | | | | |
| Real estate depreciation | | 263,923 | | | 229,133 | | | 214,345 | |
| Amortization of intangibles | | 13,623 | | | 4,420 | | | 1,900 | |
| Gain on real estate transactions | | (14,249) | | | (140,760) | | | (18,075) | |
| Unconsolidated joint venture real estate depreciation and amortization | | 16,644 | | | 11,954 | | | 9,021 | |
| Unconsolidated joint venture gain on sale of real estate assets and purchase of partner's interest | | — | | | (6,251) | | | — | |
| Distributions paid on Series A Preferred Operating Partnership units | | (2,288) | | | (2,288) | | | (2,288) | |
| Income allocated to Operating Partnership noncontrolling interests | | 60,468 | | | 50,109 | | | 35,803 | |
| Funds from operations attributable to common stockholders and unit holders | | $ | 1,198,809 | | | $ | 973,966 | | | $ | 722,485 | |
SAME-STORE RESULTS
Comparison of the Year Ended December 31, 2022 to the Year Ended December 31, 2021
Our same-store pool for the periods presented consists of 867 stores that are wholly-owned and operated and that were stabilized by the first day of the earliest calendar year presented. We consider a store to be stabilized once it has been open for three years or has sustained average square foot occupancy of 80% or more for one calendar year. We believe that by providing same-store results from a stabilized pool of stores, with accompanying operating metrics including, but not limited to: occupancy, rental revenue growth, operating expense growth, net operating income growth, etc., stockholders and potential investors are able to evaluate operating performance without the effects of non-stabilized occupancy levels, rent levels, expense levels, acquisitions or completed developments. Same-store results should not be used as a basis for future same-store performance or for the performance of our stores as a whole. The following table presents operating data for our same-store portfolio: | | | | | | | | | | | | | | | | | | | | | | | |
| | | | | | For the Year Ended December 31, | | Percent |
| | | | | | | | 2022 | | 2021 | | Change |
| Same-store rental revenues | | | | | | | $ | 1,443,327 | | | $ | 1,229,688 | | | 17.4% |
| Same-store operating expenses | | | | | | | $ | 339,195 | | | $ | 311,718 | | | 8.8% |
| Same-store net operating income | | | | | | | $ | 1,104,132 | | | $ | 917,970 | | | 20.3% |
| | | | | | | | | | | | | | | | | | | | | | | |
| Same-store square foot occupancy as of year end | | | | | | | 94.2 | % | | 95.3 | % | | |
| | | | | | | | | | | |
| Properties included in same-store | | | | | | | 867 | | | 867 | | | |
Same-store revenues for the year ended December 31, 2022 increased compared to the same periods in 2021
due to higher average rates to existing customers and higher other operating income partially offset by lower occupancy.
Same-store expenses increased for the three months and year ended December 31, 2022 compared to the same periods in 2021
due to increases in payroll, credit card processing fees, utilities, property taxes and insurance. The same-store expense growth
rate for the year ended December 31, 2022 is amplified by negative expense growth in the 2021 comparable period.
The following table presents a reconciliation of same-store net operating income to net income as presented on our condensed consolidated statements of operations for the periods indicated: | | | | | | | | | | | | | | | |
| | | For the Year Ended December 31, |
| | | | | 2022 | | 2021 |
| Net Income | | | | | $ | 921,156 | | | $ | 877,758 | |
| Adjusted to exclude: | | | | | | | |
| Gain on real estate transactions | | | | | (14,249) | | | (140,760) | |
| Equity in earnings and dividend income from unconsolidated real estate entities | | | | | (41,428) | | | (32,358) | |
| Equity in earnings of unconsolidated real estate ventures - gain on sale of real estate assets | | | | | — | | | (6,251) | |
| | | | | | | |
| Interest expense | | | | | 219,171 | | | 166,183 | |
| Depreciation and amortization | | | | | 288,316 | | | 241,879 | |
| Income tax expense | | | | | 20,925 | | | 20,324 | |
| Transaction related costs | | | | | 1,548 | | | — | |
| General and administrative | | | | | 129,251 | | | 102,194 | |
| Management fees, other income and interest income | | | | | (153,326) | | | (115,967) | |
| Net tenant insurance | | | | | (151,971) | | | (140,620) | |
| Non same-store rental revenue | | | | | (211,408) | | | (111,302) | |
| Non same-store operating expense | | | | | 96,147 | | | 56,890 | |
| Total same-store net operating income | | | | | $ | 1,104,132 | | | $ | 917,970 | |
| | | | | | | |
Comparison of the Year Ended December 31, 2021 to the Year Ended December 31, 2020
The same-store results for the years ended December 31, 2021 compared to December 31, 2020 was included in our Annual Report on Form 10-K for the year ended December 31, 2021 on page 21, under Part II, Item 7, “Management’s Discussion and Analysis of Financial Condition and Results of Operations,” which was filed with the SEC on February 28, 2022.
CASH FLOWS
Cash flows from operating activities increased as expected due to our continued growth in revenues and through the increase in the number of properties we own and operate. Cash flows used in investing activities relate primarily to our acquisitions and development of new stores, sales of stores, investments in unconsolidated real estate entities and notes receivable from bridge loans, and fluctuate depending on our actions in those areas. Cash flows from financing activities depend primarily on our debt and equity financing activities. A summary of cash flows along with significant components are as follows:
| | | | | | | | | | | | | | | | | |
| For the Year Ended December 31, |
| 2022 | | 2021 | | 2020 |
| Net cash provided by operating activities | $ | 1,238,139 | | | $ | 952,436 | | | $ | 771,232 | |
| Net cash used in investing activities | $ | (1,648,459) | | | $ | (837,540) | | | $ | (955,427) | |
| Net cash provided by (used in) financing activities | $ | 431,861 | | | $ | (166,711) | | | $ | 241,471 | |
| | | | | |
| Significant components of net cash flow included: | | | | | |
| Net income | $ | 921,156 | | | $ | 877,758 | | | $ | 517,582 | |
| Depreciation and amortization | $ | 288,316 | | | $ | 241,879 | | | $ | 224,444 | |
| Acquisition, development and redevelopment of stores | $ | (1,353,510) | | | $ | (1,289,524) | | | $ | (387,448) | |
| Cash paid for business combination | $ | (157,302) | | | $ | — | | | $ | — | |
| Gain on real estate transactions | $ | (14,249) | | | $ | (140,760) | | | $ | (18,075) | |
| Investment in unconsolidated real estate entities | $ | (118,963) | | | $ | (54,602) | | | $ | (64,792) | |
| Issuance and purchase of notes receivable | $ | (529,245) | | | $ | (317,482) | | | $ | (313,355) | |
| Investment in debt securities | $ | — | | | $ | — | | | $ | (300,000) | |
| Proceeds from sale of notes receivable | $ | 210,048 | | | $ | 172,002 | | | $ | 62,764 | |
| Principal payments received from notes receivable | $ | 283,636 | | | $ | 51,463 | | | $ | 10,102 | |
| Proceeds from the sale of common stock, net of offering costs | $ | — | | | $ | 273,189 | | | $ | 103,468 | |
| Proceeds from sale of real estate assets and investments in real estate ventures | $ | 39,367 | | | $ | 572,728 | | | $ | 44,024 | |
| Net proceeds from our debt financing and repayment activities | $ | 1,376,411 | | | $ | 206,691 | | | $ | 691,270 | |
| Repurchase of common stock | $ | (63,008) | | | $ | — | | | $ | (67,873) | |
| Proceeds from issuance of public bonds, net | $ | 396,100 | | | $ | 1,040,349 | | | $ | — | |
| Dividends paid on common stock | $ | (805,311) | | | $ | (600,994) | | | $ | (467,765) | |
We believe that cash flows generated by operations, along with our existing cash and cash equivalents, the availability of funds under our existing lines of credit, and our access to capital markets will be sufficient to meet all of our reasonably anticipated cash needs during the next twelve months. These cash needs include operating expenses, monthly debt service payments, recurring capital expenditures, acquisitions, funding for the bridge loan program, building redevelopments and expansions, distributions to unit holders and dividends to stockholders necessary to maintain our REIT qualification.
We expect to generate positive cash flow from operations and we consider projected cash flows in our sources and uses of cash. These cash flows are principally derived from rents paid by our tenants. A significant deterioration in projected cash flows from operations could cause us to increase our reliance on available funds under our existing lines of credit, curtail planned capital expenditures, or seek other additional sources of financing.
LIQUIDITY AND CAPITAL RESOURCES
Financing Strategy
We will continue to employ leverage in our capital structure in amounts reviewed from time to time by our board of directors. Although our board of directors has not adopted a policy which limits the total amount of indebtedness that we may incur, we will consider a number of factors in evaluating our level of indebtedness from time to time, as well as the amount of such indebtedness that will be either fixed or variable rate. In making financing decisions, we will consider factors including but not limited to:
•the interest rate of the proposed financing;
•the extent to which the financing impacts flexibility in managing our stores;
•prepayment penalties and restrictions on refinancing;
•the purchase price of stores acquired with debt financing;
•long-term objectives with respect to the financing;
•target investment returns;
•the ability of particular stores, and our company as a whole, to generate cash flow sufficient to cover expected debt service payments;
•overall level of consolidated indebtedness;
•timing of debt maturities;
•provisions that require recourse and cross-collateralization; and
•corporate credit ratios including fixed charge coverage ratio and max secured/unsecured indebtedness.
Our indebtedness may be recourse, non-recourse, cross-collateralized, cross-defaulted, secured or unsecured. In addition, we may invest in stores subject to existing loans collateralized by mortgages or similar liens, or may refinance stores acquired on a leveraged basis. We may use the proceeds from any borrowings to refinance existing indebtedness, to refinance investments, including the redevelopment of existing stores, for general working capital or to purchase additional interests in partnerships or joint ventures or for other purposes when we believe it is advisable.
As of December 31, 2022, we had $92,868 available in cash and cash equivalents. Our cash and cash equivalents are held in accounts managed by third party financial institutions and consist of invested cash and cash in our operating accounts. During 2022 and 2021, we experienced no loss or lack of access to our cash or cash equivalents; however, there can be no assurance that access to our cash and cash equivalents will not be impacted by adverse conditions in the financial markets.
As of December 31, 2022, we had $7,364,424 face value of debt, resulting in a debt to total enterprise value ratio of 25.8%. As of December 31, 2021, we had $5,984,113 face value of debt, resulting in a debt to total enterprise value ratio of 15.6%. As of December 31, 2022, the ratio of total fixed-rate debt and other instruments to total debt was 64.7% (including $1,837,714 on which we have interest rate swaps that have been included as fixed-rate debt). As of December 31, 2021, the ratio of total fixed-rate debt and other instruments to total debt was 75.3% (including $1,983,145 on which we have interest rate swaps that have been included as fixed-rate debt). The weighted average interest rate of total debt at December 31, 2022 and 2021 was 4.1% and 2.6%, respectively. As of December 31, 2022, the weighted average interest rate for all fixed rate debt was 3.4%, and the weighted average interest rate on all variable rate debt was 5.5%. As of December 31, 2021, the weighted average interest rate for all fixed rate debt was 3.1%, and the weighted average interest rate on all variable rate debt was 1.3%.
In January 2021, we received a Baa2 rating from Moody's Investors Service and in July 2019, we obtained a BBB/Stable rating from S&P. We intend to manage our balance sheet to preserve such ratings. Certain of our real estate assets are pledged as collateral for our debt. We have a total of 908 unencumbered stores as defined by our public bonds. Our unencumbered asset value is calculated as $17,142,473 and our total asset value is calculated as $22,155,942 according to the calculations as defined by our public bonds. We are subject to certain restrictive covenants relating to our outstanding debt. We were in compliance with all financial covenants at December 31, 2022.
We expect to fund our short-term and long-term liquidity requirements, including operating expenses, recurring capital expenditures, dividends to stockholders, distributions to holders of Operating Partnership units and interest on our outstanding indebtedness, out of our operating cash flow, cash on hand and borrowings under our revolving lines of credit. In addition, we are pursuing additional sources of financing based on anticipated funding needs.
Our liquidity needs consist primarily of operating expenses, monthly debt service payments, recurring capital expenditures, distributions to unit holders and dividends to stockholders necessary to maintain our REIT qualification. We may from time to time seek to repurchase our outstanding debt, shares of common stock or other securities in open market purchases, privately negotiated transactions or otherwise. Such repurchases, if any, will depend on prevailing market
conditions, our liquidity requirements, contractual restrictions and other factors. In addition, we evaluate, on an ongoing basis, the merits of strategic acquisitions and other relationships, which may require us to raise additional funds. We may also use Operating Partnership units as currency to fund acquisitions from self-storage owners who desire tax-deferral in their exiting transactions.
CONTRACTUAL OBLIGATIONS
For more information on our contractual obligations related to real estate acquisitions, refer to our commitments and contingencies footnote in the notes to the consolidated financial statements in Item 8 of this Form 10-K.
SEASONALITY
The self-storage business has been subject to seasonal fluctuations. A greater portion of revenues and profits is typically realized from May through September. Historically, our highest level of occupancy has been at the end of July, while our lowest level of occupancy has been in late February and early March. Results for any quarter may not be indicative of the results that may be achieved for the full fiscal year.
Item 7A. Quantitative and Qualitative Disclosures About Market Risk
Market Risk
Market risk refers to the risk of loss from adverse changes in market prices and interest rates. Our future income, cash flows and fair values of financial instruments are dependent upon prevailing market interest rates.
Interest Rate Risk
Interest rate risk is highly sensitive to many factors, including governmental monetary and tax policies, domestic and international economic and political considerations and other factors beyond our control.
As of December 31, 2022, we had approximately $7,364,424 in total face value debt, of which approximately $2,602,228 was subject to variable interest rates (excluding debt with interest rate swaps). If benchmark index rates were to increase or decrease by 100 basis points, the increase or decrease in interest expense on the variable rate debt would increase or decrease future earnings and cash flows by approximately $26,022 annually.
Interest rate risk amounts were determined by considering the impact of hypothetical interest rates on our financial instruments. These analyses do not consider the effect of any change in overall economic activity that could occur. Further, in the event of a change of that magnitude, we may take actions to further mitigate our exposure to the change. However, due to the uncertainty of the specific actions that would be taken and their possible effects, these analyses assume no changes in our financial structure.
Derivative Instruments
We use derivative instruments to help manage interest rate risk using designated hedge relationships. Interest rate swaps involve the exchange of fixed-rate and variable-rate interest payments between two parties based on a contractual underlying notional amount, but do not involve the exchange of the underlying notional amounts. See our Derivatives footnote in our Notes to consolidated financial statements in Item 8 for additional information about our use of derivative contracts.
Item 8. Financial Statements and Supplementary Data
EXTRA SPACE STORAGE INC.
INDEX TO CONSOLIDATED FINANCIAL STATEMENTS
All other schedules have been omitted since the required information is not present or not present in amounts sufficient to require submission of the schedule, or because the information required is included in the consolidated financial statements or notes thereto.
Report of Independent Registered Public Accounting Firm
To the Stockholders and the Board of Directors of Extra Space Storage Inc.
Opinion on the Financial Statements
We have audited the accompanying consolidated balance sheets of Extra Space Storage Inc. (the Company) as of December 31, 2022 and 2021, the related consolidated statements of operations, comprehensive income, stockholders' equity and cash flows for each of the three years in the period ended December 31, 2022, and the related notes and financial statement schedule listed in the Index at Item 8 (collectively referred to as the “consolidated financial statements”). In our opinion, the consolidated financial statements present fairly, in all material respects, the financial position of the Company at December 31, 2022 and 2021, and the results of its operations and its cash flows for each of the three years in the period ended December 31, 2022, in conformity with U.S. generally accepted accounting principles.
We also have audited, in accordance with the standards of the Public Company Accounting Oversight Board (United States) (PCAOB), the Company's internal control over financial reporting as of December 31, 2022, based on criteria established in Internal Control-Integrated Framework issued by the Committee of Sponsoring Organizations of the Treadway Commission (2013 framework), and our report dated February 28, 2023 expressed an unqualified opinion thereon.
Basis for Opinion
These financial statements are the responsibility of the Company's management. Our responsibility is to express an opinion on the Company’s financial statements based on our audits. We are a public accounting firm registered with the PCAOB and are required to be independent with respect to the Company in accordance with the U.S. federal securities laws and the applicable rules and regulations of the Securities and Exchange Commission and the PCAOB.
We conducted our audits in accordance with the standards of the PCAOB. Those standards require that we plan and perform the audit to obtain reasonable assurance about whether the financial statements are free of material misstatement, whether due to error or fraud. Our audits included performing procedures to assess the risks of material misstatement of the financial statements, whether due to error or fraud, and performing procedures that respond to those risks. Such procedures included examining, on a test basis, evidence regarding the amounts and disclosures in the financial statements. Our audits also included evaluating the accounting principles used and significant estimates made by management, as well as evaluating the overall presentation of the financial statements. We believe that our audits provide a reasonable basis for our opinion.
Critical Audit Matter
The critical audit matter communicated below is a matter arising from the current period audit of the financial statements that was communicated or required to be communicated to the audit committee and that: (1) relates to accounts or disclosures that are material to the financial statements and (2) involved our especially challenging, subjective, or complex judgments. The communication of the critical audit matter does not alter in any way our opinion on the consolidated financial statements, taken as a whole, and we are not, by communicating the critical audit matter below, providing a separate opinion on the critical audit matter or on the account or disclosure to which it relates.
| | | | | |
| Purchase price allocation |
| |
| Description of the Matter | For the year ended December 31, 2022, the Company completed the acquisition of 153 self-storage properties (“stores”) for a total purchase price of $1.37 billion. As further discussed in Note 2 of the consolidated financial statements, the transactions were accounted for as asset acquisitions, and the purchase price was allocated to the real estate assets acquired based on their relative fair values, which are estimated using unobservable inputs. |
| |
| Auditing the accounting for the Company’s 2022 acquisitions of stores was subjective because in determining the fair value of acquired land and buildings, the Company had to rely on unobservable inputs due to the lack of available directly comparable market information. In particular, the fair value estimates were sensitive to assumptions such as price of land per square foot, and current replacement cost estimates, including adjustments for the age, class, height, square footage, condition, location, and turnkey factor associated with the acquired assets. |
| |
| How We Addressed the Matter in Our Audit | We obtained an understanding, evaluated the design, and tested the operating effectiveness of controls over management’s accounting for acquired stores, including controls over the review of assumptions underlying the purchase price allocation and accuracy of the underlying data used. For example, we tested controls over the determination of the fair value of the land and building assets, including the controls over the review of the valuation models and the underlying assumptions used to develop such estimates. |
| |
| For the 2022 store acquisitions described above, our procedures included, but were not limited to, evaluating the Company’s valuation methodologies and evaluating the significant assumptions used to determine the fair value of the assets acquired. For certain of these asset acquisitions, we tested the completeness and accuracy of the underlying data by, among other things, recalculating the current replacement cost of buildings and comparing the adjustments for the age, class, height, square footage, condition, location, and turnkey factor with the acquired assets to industry publications. Additionally, we also compared significant assumptions, including prices per square foot to third-party sources such as recent land sales. For certain of these asset acquisitions, we involved our valuation specialists to assist in the assessment of the methodology utilized by the Company, in addition to performing corroborative analyses to assess whether the conclusions in the valuation were supported by observable market data. For example, our valuation specialists used independently identified data sources to evaluate management’s selected comparable land sales and replacement cost assumptions. |
/s/ Ernst & Young LLP
We have served as the Company’s auditor since 2005.
Salt Lake City, Utah
February 28, 2023
Extra Space Storage Inc.
Consolidated Balance Sheets
(dollars in thousands, except share data) | | | | | | | | | | | |
| December 31, 2022 | | December 31, 2021 |
| Assets: | | | |
| Real estate assets, net | $ | 9,997,978 | | | $ | 8,834,649 | |
| Real estate assets - operating lease right-of-use assets | 221,725 | | | 227,949 | |
| Investments in unconsolidated real estate entities | 582,412 | | | 457,326 | |
| Investments in debt securities and notes receivable | 858,049 | | | 719,187 | |
| Cash and cash equivalents | 92,868 | | | 71,126 | |
| | | |
| | | |
| Other assets, net | 414,426 | | | 164,240 | |
| Total assets | $ | 12,167,458 | | | $ | 10,474,477 | |
| Liabilities, Noncontrolling Interests and Equity: | | | |
| Notes payable, net | $ | 1,288,555 | | | $ | 1,320,755 | |
| Unsecured term loans, net | 2,340,116 | | | 1,741,926 | |
| Unsecured senior notes, net | 2,757,791 | | | 2,360,066 | |
| Revolving lines of credit | 945,000 | | | 535,000 | |
| Operating lease liabilities | 229,035 | | | 233,356 | |
| Cash distributions in unconsolidated real estate ventures | 67,352 | | | 63,582 | |
| Accounts payable and accrued expenses | 171,680 | | | 142,285 | |
| Other liabilities | 289,655 | | | 291,531 | |
| Total liabilities | 8,089,184 | | | 6,688,501 | |
| Commitments and contingencies | | | |
| Noncontrolling Interests and Equity: | | | |
| Extra Space Storage Inc. stockholders' equity: | | | |
Preferred stock, $0.01 par value, 50,000,000 shares authorized, no shares issued or outstanding | — | | | — | |
Common stock, $0.01 par value, 500,000,000 shares authorized, 133,921,020 and 133,922,305 shares issued and outstanding at December 31, 2022 and 2021, respectively | 1,339 | | | 1,339 | |
| Additional paid-in capital | 3,345,332 | | | 3,285,948 | |
| Accumulated other comprehensive income (loss) | 48,798 | | | (42,546) | |
| Accumulated deficit | (135,872) | | | (128,245) | |
| Total Extra Space Storage Inc. stockholders' equity | 3,259,597 | | | 3,116,496 | |
| Noncontrolling interest represented by Preferred Operating Partnership units, net | 261,502 | | | 259,110 | |
| Noncontrolling interests in Operating Partnership, net and other noncontrolling interests | 557,175 | | | 410,370 | |
| Total noncontrolling interests and equity | 4,078,274 | | | 3,785,976 | |
| Total liabilities, noncontrolling interests and equity | $ | 12,167,458 | | | $ | 10,474,477 | |
See accompanying notes
Extra Space Storage Inc.
Consolidated Statements of Operations
(dollars in thousands, except share data) | | | | | | | | | | | | | | | | | |
| | For the Year Ended December 31, |
| | 2022 | | 2021 | | 2020 |
| Revenues: | | | | | |
| Property rental | $ | 1,654,735 | | | $ | 1,340,990 | | | $ | 1,157,522 | |
| Tenant reinsurance | 185,531 | | | 170,108 | | | 146,561 | |
| Management fees and other income | 83,904 | | | 66,264 | | | 52,129 | |
| Total revenues | 1,924,170 | | | 1,577,362 | | | 1,356,212 | |
| Expenses: | | | | | |
| Property operations | 435,342 | | | 368,608 | | | 360,615 | |
| Tenant reinsurance | 33,560 | | | 29,488 | | | 26,494 | |
| Transaction related costs | 1,548 | | | — | | | — | |
| General and administrative | 129,251 | | | 102,194 | | | 96,594 | |
| Depreciation and amortization | 288,316 | | | 241,879 | | | 224,444 | |
| Total expenses | 888,017 | | | 742,169 | | | 708,147 | |
| Gain on real estate transactions | 14,249 | | | 140,760 | | | 18,075 | |
| Income from operations | 1,050,402 | | | 975,953 | | | 666,140 | |
| | | | | |
| Interest expense | (219,171) | | | (166,183) | | | (168,626) | |
| Non-cash interest expense related to amortization of discount on equity component of exchangeable senior notes | — | | | — | | | (3,675) | |
| Interest income | 69,422 | | | 49,703 | | | 15,192 | |
| | | | | |
| Income before equity in earnings and dividend income from unconsolidated real estate entities and income tax expense | 900,653 | | | 859,473 | | | 509,031 | |
| Equity in earnings and dividend income from unconsolidated real estate entities | 41,428 | | | 32,358 | | | 22,361 | |
| Equity in earnings of unconsolidated real estate ventures - gain on sale of real estate assets | — | | | 6,251 | | | — | |
| Income tax expense | (20,925) | | | (20,324) | | | (13,810) | |
| Net income | 921,156 | | | 877,758 | | | 517,582 | |
| Net income allocated to Preferred Operating Partnership noncontrolling interests | (17,623) | | | (14,697) | | | (12,882) | |
| Net income allocated to Operating Partnership and other noncontrolling interests | (42,845) | | | (35,412) | | | (22,921) | |
| Net income attributable to common stockholders | $ | 860,688 | | | $ | 827,649 | | | $ | 481,779 | |
| Earnings per common share | | | | | |
| Basic | $ | 6.41 | | | $ | 6.20 | | | $ | 3.71 | |
| Diluted | $ | 6.41 | | | $ | 6.19 | | | $ | 3.71 | |
| Weighted average number of shares | | | | | |
| Basic | 134,050,815 | | | 133,374,938 | | | 129,541,531 | |
| Diluted | 141,681,388 | | | 140,016,028 | | | 129,584,829 | |
See accompanying notes
Extra Space Storage Inc.
Consolidated Statements of Comprehensive Income
(amounts in thousands) | | | | | | | | | | | | | | | | | |
| | For the Year Ended December 31, |
| | 2022 | | 2021 | | 2020 |
| Net income | $ | 921,156 | | | $ | 877,758 | | | $ | 517,582 | |
| Other comprehensive income: | | | | | |
| Change in fair value of interest rate swaps | 96,249 | | | 59,325 | | | (73,686) | |
| Total comprehensive income | 1,017,405 | | | 937,083 | | | 443,896 | |
| Less: comprehensive income attributable to noncontrolling interests | 65,373 | | | 52,887 | | | 32,244 | |
| Comprehensive income attributable to common stockholders | $ | 952,032 | | | $ | 884,196 | | | $ | 411,652 | |
See accompanying notes
| | | | | | | | | | | | | | | | | | | | | | | | | | | | | | | | | | | | | | | | | | | | | | | | | | | | | | | | | | | | | |
Extra Space Storage Inc. Consolidated Statements of Stockholders' Equity (amounts in thousands, except share data) |
| | | | | | | | | | | | | |
| | | | | | | | | | Noncontrolling Interests | | Extra Space Storage Inc. Stockholders' Equity | | |
| | | | Preferred Operating Partnership | | Operating Partnership | | Other | | | | | | Additional Paid-in Capital | | Accumulated Other Comprehensive Income (Loss) | | Accumulated Deficit | | Total Noncontrolling Interests and Equity |
| | | | | | | | | | | | Shares | | Par Value | |
| Balances at December 31, 2019 | | | | | | | | | $ | 175,948 | | | $ | 205,419 | | | $ | 366 | | | 129,534,407 | | | $ | 1,295 | | | $ | 2,868,681 | | | $ | (28,966) | | | $ | (301,049) | | | $ | 2,921,694 | |
| Issuance of common stock upon the exercise of options | | | | | | | | | — | | | — | | | — | | | 134,930 | | | 1 | | | 4,758 | | | — | | | — | | | 4,759 | |
| Issuance of common stock in connection with share based compensation | | | | | | | | | — | | | — | | | — | | | 143,187 | | | 1 | | | 16,280 | | | — | | | — | | ` | 16,281 | |
| | | | | | | | | | | | | | | | | | | | | | | | | |
| Restricted stock grants cancelled | | | | | | | | | — | | | — | | | — | | | (5,083) | | | — | | | — | | | — | | | — | | | — | |
| Issuance of common stock, net of offering costs | | | | | | | | | — | | | — | | | — | | | 899,048 | | | 9 | | | 103,459 | | | — | | | — | | | 103,468 | |
| Buyback of common stock, net of offering costs | | | | | | | | | — | | | — | | | — | | | (826,797) | | | (8) | | | — | | | — | | | (67,865) | | | (67,873) | |
| | | | | | | | | | | | | | | | | | | | | | | | | |
| Redemption of Operating Partnership units for stock | | | | | | | | | — | | | (4,572) | | | — | | | 123,993 | | | 1 | | | 4,571 | | | — | | | — | | | — | |
| Repurchase of equity portion of 2015 exchangeable senior notes | | | | | | | | | — | | | — | | | — | | | 1,323,781 | | | 14 | | | (14) | | | — | | | — | | | — | |
| Repayment of receivable with Preferred operating units pledged as collateral on loan | | | | | | | | | — | | | 16,213 | | | — | | | — | | | — | | | — | | | — | | | — | | | 16,213 | |
| | | | | | | | | | | | | | | | | | | | | | | | | |
| Redemption of Preferred B Units in the Operating Partnership for cash | | | | | | | | | (1,000) | | | — | | | — | | | — | | | — | | | — | | | — | | | — | | | (1,000) | |
| Redemption of Preferred D Units in the Operating Partnership for stock | | | | | | | | | (2,724) | | | — | | | — | | | 30,495 | | | 1 | | | 2,723 | | | — | | | — | | | — | |
| | | | | | | | | | | | | | | | | | | | | | | | | |
| Noncontrolling interest in consolidated joint venture | | | | | | | | | — | | | — | | | 66 | | | — | | | — | | | — | | | — | | | — | | | 66 | |
| Net income (loss) | | | | | | | | | 12,882 | | | 22,952 | | | (31) | | | — | | | — | | | — | | | — | | | 481,779 | | | 517,582 | |
| Other comprehensive loss | | | | | | | | | (456) | | | (3,103) | | | — | | | — | | | — | | | — | | | (70,127) | | | — | | | (73,686) | |
| Distributions to Operating Partnership units held by noncontrolling interests | | | | | | | | | (12,598) | | | (21,017) | | | — | | | — | | | — | | | — | | | — | | | — | | | (33,615) | |
Dividends paid on common stock at $3.60 per share | | | | | | | | | — | | | — | | | — | | | — | | | — | | | — | | | — | | | (467,765) | | | (467,765) | |
| Balances at December 31, 2020 | | | | | | | | | $ | 172,052 | | | $ | 215,892 | | | $ | 401 | | | 131,357,961 | | | $ | 1,314 | | | $ | 3,000,458 | | | $ | (99,093) | | | $ | (354,900) | | | $ | 2,936,124 | |
| | | | | | | | | | | | | | | | | | | | | | | | | | | | | | | | | | | | | | | | | | | | | | | | | | | | | | | | | | | | | |
Extra Space Storage Inc. Consolidated Statements of Stockholders' Equity (amounts in thousands, except share data) |
| | | | | | | | | | | | | |
| | | | | | | | | | Noncontrolling Interests | | Extra Space Storage Inc. Stockholders' Equity | | |
| | | | Preferred Operating Partnership | | Operating Partnership | | Other | | | | | | Additional Paid-in Capital | | Accumulated Other Comprehensive Income (Loss) | | Accumulated Deficit | | Total Noncontrolling Interests and Equity |
| | | | | | | | | | | | Shares | | Par Value | |
| Balances at December 31, 2020 | | | | | | | | | $ | 172,052 | | | $ | 215,892 | | | $ | 401 | | | 131,357,961 | | | $ | 1,314 | | | $ | 3,000,458 | | | $ | (99,093) | | | $ | (354,900) | | | $ | 2,936,124 | |
| Issuance of common stock upon the exercise of options | | | | | | | | | — | | | — | | | — | | | 62,322 | | | — | | | 4,572 | | | — | | | — | | | 4,572 | |
| Issuance of common stock in connection with share based compensation | | | | | | | | | — | | | — | | | — | | | 148,228 | | | — | | | 17,303 | | | — | | | — | | | 17,303 | |
| Restricted stock grants cancelled | | | | | | | | | — | | | — | | | — | | | (12,808) | | | — | | | — | | | — | | | — | | | — | |
| Issuance of common stock, net of offering costs | | | | | | | | | — | | | — | | | — | | | 2,185,685 | | | 22 | | | 273,167 | | | — | | | — | | | 273,189 | |
| Redemption of Operating Partnership units for stock | | | | | | | | | — | | | (6,373) | | | — | | | 165,652 | | | 2 | | | 6,371 | | | — | | | — | | | — | |
| Redemption of Preferred B Units in the Operating Partnership for stock | | | | | | | | | (2,834) | | | — | | | — | | | 15,265 | | | 1 | | | 2,833 | | | — | | | — | | | — | |
| Redemption of Operating Partnership units for cash | | | | | | | | | — | | | (173) | | | — | | | — | | | — | | | (615) | | | — | | | — | | | (788) | |
| Repayment of receivable with Operating Partnership units pledged as collateral | | | | | | | | | — | | | 411 | | | — | | | — | | | — | | | — | | | — | | | — | | | 411 | |
| Issuance of Operating Partnership units in conjunction with acquisitions | | | | | | | | | — | | | 188,319 | | | — | | | — | | | — | | | — | | | — | | | — | | | 188,319 | |
| Issuance of Preferred D units in the Operating Partnership in conjunction with acquisitions | | | | | | | | | 88,074 | | | — | | | — | | | — | | | — | | | — | | | — | | | — | | | 88,074 | |
| Purchase of remaining equity interest in existing consolidated joint venture | | | | | | | | | — | | | — | | | — | | | — | | | — | | | (18,141) | | | — | | | — | | | (18,141) | |
| Noncontrolling interest in consolidated joint venture | | | | | | | | | — | | | — | | | (82) | | | — | | | — | | | — | | | — | | | — | | | (82) | |
| Net income (loss) | | | | | | | | | 14,697 | | | 35,414 | | | (2) | | | — | | | — | | | — | | | — | | | 827,649 | | | 877,758 | |
| Other comprehensive income | | | | | | | | | 366 | | | 2,412 | | | — | | | — | | | — | | | — | | | 56,547 | | | — | | | 59,325 | |
| Distributions to Operating Partnership units held by noncontrolling interests | | | | | | | | | (13,245) | | | (25,849) | | | — | | | — | | | — | | | — | | | — | | | — | | | (39,094) | |
Dividends paid on common stock at $4.50 per share | | | | | | | | | — | | | — | | | — | | | — | | | — | | | — | | | — | | | (600,994) | | | (600,994) | |
| Balances at December 31, 2021 | | | | | | | | | $ | 259,110 | | | $ | 410,053 | | | $ | 317 | | | 133,922,305 | | | $ | 1,339 | | | $ | 3,285,948 | | | $ | (42,546) | | | $ | (128,245) | | | $ | 3,785,976 | |
| | | | | | | | | | | | | | | | | | | | | | | | | | | | | | | | | | | | | | | | | | | | | | | | | | | | | | | | | | | | | |
Extra Space Storage Inc. Consolidated Statements of Stockholders' Equity (amounts in thousands, except share data) |
| | | | | | | | | | | | | |
| | | | | | | | | | Noncontrolling Interests | | Extra Space Storage Inc. Stockholders' Equity | | |
| | | | Preferred Operating Partnership | | Operating Partnership | | Other | | | | | | Additional Paid-in Capital | | Accumulated Other Comprehensive Income (Loss) | | Accumulated Deficit | | Total Noncontrolling Interests and Equity |
| | | | | | | | | | | | Shares | | Par Value | |
| Balances at December 31, 2021 | | | | | | | | | $ | 259,110 | | | $ | 410,053 | | | $ | 317 | | | 133,922,305 | | | $ | 1,339 | | | $ | 3,285,948 | | | $ | (42,546) | | | $ | (128,245) | | | $ | 3,785,976 | |
| | | | | | | | | | | | | | | | | | | | | | | | | |
| Issuance of common stock in connection with share based compensation | | | | | | | | | — | | | — | | | — | | | 204,349 | | | 2 | | | 21,386 | | | — | | | — | | | 21,388 | |
| Restricted stock grants cancelled | | | | | | | | | — | | | — | | | — | | | (10,614) | | | — | | | — | | | — | | | — | | | — | |
| | | | | | | | | | | | | | | | | | | | | | | | | |
| | | | | | | | | | | | | | | | | | | | | | | | | |
| Redemption of Operating Partnership units for cash | | | | | | | | | — | | | (1,654) | | | — | | | — | | | — | | | (2,963) | | | — | | | — | | | (4,617) | |
| Redemption of Preferred B Units in the Operating Partnership for cash | | | | | | | | | (4,500) | | | — | | | — | | | — | | | — | | | — | | | — | | | — | | | (4,500) | |
| Issuance of Operating Partnership units in conjunction with business combination | | | | | | | | | — | | | 16,000 | | | — | | | — | | | — | | | — | | | — | | | — | | | 16,000 | |
| Issuance of Operating Partnership units in conjunction with acquisitions | | | | | | | | | — | | | 125,000 | | | — | | | — | | | — | | | — | | | — | | | — | | | 125,000 | |
| Issuance of Preferred D units in the Operating Partnership in conjunction with business combination | | | | | | | | | 6,000 | | | — | | | — | | | — | | | — | | | — | | | — | | | — | | | 6,000 | |
| Issuance of common stock in conjunction with acquisitions | | | | | | | | | — | | | — | | | — | | | 186,766 | | | 2 | | | 40,961 | | | — | | | — | | | 40,963 | |
| Repurchase of common stock, net of offering costs | | | | | | | | | — | | | — | | | — | | | (381,786) | | | (4) | | | — | | | — | | | (63,004) | | | (63,008) | |
| | | | | | | | | | | | | | | | | | | | | | | | | |
| Noncontrolling interest in consolidated joint venture | | | | | | | | | — | | | — | | | 771 | | | — | | | — | | | — | | | — | | | — | | | 771 | |
| Net income | | | | | | | | | 17,623 | | | 42,853 | | | (8) | | | — | | | — | | | — | | | — | | | 860,688 | | | 921,156 | |
| Other comprehensive income | | | | | | | | | 577 | | | 4,328 | | | — | | | — | | | — | | | — | | | 91,344 | | | — | | | 96,249 | |
| Distributions to Operating Partnership units held by noncontrolling interests | | | | | | | | | (17,308) | | | (40,485) | | | — | | | — | | | — | | | — | | | — | | | — | | | (57,793) | |
Dividends paid on common stock at $6.00 per share | | | | | | | | | — | | | — | | | — | | | — | | | — | | | — | | | — | | | (805,311) | | | (805,311) | |
| Balances at December 31, 2022 | | | | | | | | | $ | 261,502 | | | $ | 556,095 | | | $ | 1,080 | | | 133,921,020 | | | $ | 1,339 | | | $ | 3,345,332 | | | $ | 48,798 | | | $ | (135,872) | | | $ | 4,078,274 | |
See accompanying notes
Extra Space Storage Inc.
Consolidated Statements of Cash Flows
(amounts in thousands)
| | | | | | | | | | | | | | | | | |
| | For the Year Ended December 31, |
| | 2022 | | 2021 | | 2020 |
| Cash flows from operating activities: | | | | | |
| Net income | $ | 921,156 | | | $ | 877,758 | | | $ | 517,582 | |
| Adjustments to reconcile net income to net cash provided by operating activities: | | | | | |
| Depreciation and amortization | 288,316 | | | 241,879 | | | 224,444 | |
| Amortization of deferred financing costs | 8,773 | | | 10,587 | | | 9,386 | |
| Non-cash interest expense related to amortization of discount on equity component of exchangeable senior notes | — | | | — | | | 3,675 | |
| Non-cash lease expense | 1,903 | | | 1,869 | | | 1,173 | |
| Compensation expense related to stock-based awards | 21,386 | | | 17,303 | | | 16,281 | |
| Accrual of interest income added to principal of debt securities and notes receivable | (38,412) | | | (34,550) | | | (8,059) | |
| Gain on real estate transactions | (14,249) | | | (140,760) | | | (18,075) | |
| Equity in earnings of unconsolidated real estate ventures - gain on sale of real estate assets | — | | | (6,251) | | | |
| Distributions from unconsolidated real estate ventures | 13,162 | | | 7,035 | | | 6,893 | |
| Changes in operating assets and liabilities: | | | | | |
| | | | | |
| Other assets | (1,208) | | | (23,891) | | | (19,674) | |
| Accounts payable and accrued expenses | 29,027 | | | 10,951 | | | 17,974 | |
| Other liabilities | 8,285 | | | (9,494) | | | 19,632 | |
| Net cash provided by operating activities | 1,238,139 | | | 952,436 | | | 771,232 | |
| Cash flows from investing activities: | | | | | |
| Acquisition of real estate assets | (1,291,491) | | | (1,233,298) | | | (320,148) | |
| Cash paid for business combination | (157,302) | | | — | | | — | |
| Development and redevelopment of real estate assets | (62,019) | | | (56,226) | | | (67,300) | |
| Proceeds from sale of real estate assets and investments in real estate ventures | 39,367 | | | 572,728 | | | 44,024 | |
| | | | | |
| Investment in unconsolidated real estate entities | (118,963) | | | (54,602) | | | (64,792) | |
| Return of investment in unconsolidated real estate ventures | 342 | | | 31,534 | | | 371 | |
| Issuance and purchase of notes receivable | (529,245) | | | (317,482) | | | (313,355) | |
| Investment in debt securities | — | | | — | | | (300,000) | |
| Proceeds from sale of notes receivable | 210,048 | | | 172,002 | | | 62,764 | |
| Principal payments received from notes receivable | 283,636 | | | 51,463 | | | 10,102 | |
| Purchase of equipment and fixtures | (22,832) | | | (3,659) | | | (7,093) | |
| Net cash used in investing activities | (1,648,459) | | | (837,540) | | | (955,427) | |
| Cash flows from financing activities: | | | | | |
| Proceeds from the sale of common stock, net of offering costs | — | | | 273,189 | | | 103,468 | |
| Proceeds from notes payable and revolving lines of credit | 5,188,011 | | | 4,666,632 | | | 3,281,000 | |
| Principal payments on notes payable and revolving lines of credit | (4,207,700) | | | (5,500,290) | | | (2,014,730) | |
| | | | | |
| Proceeds from issuance of public bonds, net | 396,100 | | | 1,040,349 | | | — | |
| Deferred financing costs | (9,321) | | | (10,698) | | | (4,052) | |
| Repurchase of exchangeable senior notes | — | | | — | | | (575,000) | |
| Proceeds from principal payments on note receivable collateralized by OP Units | — | | | 411 | | | 16,213 | |
| Net proceeds from exercise of stock options | — | | | 4,572 | | | 4,759 | |
| Repurchase of common stock | (63,008) | | | — | | | (67,873) | |
| Redemption of Preferred B Units for cash | (4,500) | | | — | | | — | |
| Redemption of Operating Partnership units held by noncontrolling interests | (4,617) | | | (788) | | | (1,000) | |
| Contributions from noncontrolling interests | — | | | — | | | 66 | |
| Dividends paid on common stock | (805,311) | | | (600,994) | | | (467,765) | |
| Distributions to noncontrolling interests | (57,793) | | | (39,094) | | | (33,615) | |
| Net cash provided by (used in) financing activities | 431,861 | | | (166,711) | | | 241,471 | |
| Net increase (decrease) in cash, cash equivalents, and restricted cash | 21,541 | | | (51,815) | | | 57,276 | |
| Cash, cash equivalents, and restricted cash, beginning of the period | 76,194 | | | 128,009 | | | 70,733 | |
| Cash, cash equivalents, and restricted cash, end of the period | $ | 97,735 | | | $ | 76,194 | | | $ | 128,009 | |
| Cash and equivalents, including restricted cash at the beginning of the period: | | | | | |
| Cash and equivalents | $ | 71,126 | | | $ | 109,124 | | | $ | 65,746 | |
| Restricted cash included in other assets | 5,068 | | | 18,885 | | | 4,987 | |
| $ | 76,194 | | | $ | 128,009 | | | $ | 70,733 | |
| Cash and equivalents, including restricted cash at the end of the period: | | | | | |
| Cash and equivalents | $ | 92,868 | | | $ | 71,126 | | | $ | 109,124 | |
| Restricted cash included in other assets | 4,867 | | | 5,068 | | | 18,885 | |
| $ | 97,735 | | | $ | 76,194 | | | $ | 128,009 | |
| Supplemental schedule of cash flow information | | | | | |
| Interest paid | $ | 197,069 | | | $ | 152,170 | | | $ | 159,597 | |
| Income taxes paid | $ | 18,957 | | | $ | 26,252 | | | $ | 5,181 | |
| Supplemental schedule of noncash investing and financing activities: | | | | | |
| Redemption of Operating Partnership units held by noncontrolling interests for common stock | | | | | |
| Noncontrolling interests in Operating Partnership | $ | — | | | $ | (6,373) | | | $ | (4,005) | |
| Common stock and paid-in capital | $ | — | | | $ | 6,373 | | | $ | 4,005 | |
| | | | | |
| | | | | |
| | | | | |
| Redemption of Preferred Operating Partnership units for common stock | | | | | |
| Preferred Operating Partnership units | $ | — | | | $ | (2,834) | | | $ | (2,724) | |
| Additional paid-in capital | $ | — | | | $ | 2,834 | | | $ | 2,724 | |
| | | | | |
| | | | | |
| | | | | |
| Issuance of OP and Preferred OP units in conjunction with business combination | | | | | |
| Preferred OP units issued | $ | (6,000) | | | $ | — | | | $ | — | |
| OP units issued | $ | (16,000) | | | $ | — | | | $ | — | |
| | | | | |
| | | | | |
| | | | | |
| Acquisition and establishment of operating lease right of use assets and lease liabilities | | | | | |
| Real estate assets - operating lease right-of-use assets | $ | 16,298 | | | $ | 6,655 | | | $ | 8,014 | |
| Operating lease liabilities | $ | (16,298) | | | $ | (6,655) | | | $ | (8,014) | |
| | | | | |
| Acquisitions of real estate assets | | | | | |
| Real estate assets, net | $ | 171,703 | | | $ | 318,036 | | | $ | 41,491 | |
| Value of equity issued | $ | (165,965) | | | $ | (276,393) | | | $ | — | |
| Notes payable assumed | $ | — | | | $ | (20,028) | | | $ | — | |
| Investment in unconsolidated real estate ventures | $ | 1,085 | | | $ | 5,383 | | | $ | — | |
| Finance lease liability | $ | (6,823) | | | $ | (26,998) | | | $ | (41,491) | |
| Accrued construction costs and capital expenditures | | | | | |
| Acquisition of real estate assets | $ | 368 | | | $ | 1,323 | | | $ | 656 | |
| | | | | |
| Accounts payable and accrued expenses | $ | (368) | | | $ | (1,323) | | | $ | (656) | |
| | | | | |
| | | | | |
| | | | | |
| | | | | |
| | | | | |
| | | | | |
| | | | | |
| | | | | |
See accompanying notes
EXTRA SPACE STORAGE INC.
NOTES TO CONSOLIDATED FINANCIAL STATEMENTS
Amounts in thousands, except store and share data, unless otherwise stated
1. DESCRIPTION OF BUSINESS
Extra Space Storage Inc. (the “Company”) is a fully integrated, self-administered and self-managed real estate investment trust (“REIT”), formed as a Maryland corporation on April 30, 2004, to own, operate, manage, acquire, develop and redevelop professionally managed self-storage properties located throughout the United States. The Company was formed to continue the business of Extra Space Storage LLC and its subsidiaries, which had engaged in the self-storage business since 1977. The Company’s interest in its stores is held through its operating partnership, Extra Space Storage LP (the “Operating Partnership”), which was formed on May 5, 2004. The Company’s primary assets are general partner and limited partner interests in the Operating Partnership. This structure is commonly referred to as an umbrella partnership REIT, or UPREIT.
The Company invests in stores by acquiring wholly-owned stores or by acquiring an equity interest in real estate entities. At December 31, 2022, the Company had direct and indirect equity interests in 1,451 storage facilities. In addition, the Company managed 887 stores for third parties bringing the total number of stores which it owns and/or manages to 2,338. These stores are located in 41 states and Washington, D.C. The Company also offers tenant reinsurance at its owned and managed stores that insures the value of goods in the storage units.
2. SUMMARY OF SIGNIFICANT ACCOUNTING POLICIES
Basis of Presentation
The consolidated financial statements are presented on the accrual basis of accounting in accordance with U.S. generally accepted accounting principles (“GAAP”) and include the accounts of the Company and its wholly- or majority-owned subsidiaries. All intercompany balances and transactions have been eliminated in consolidation.
Principles of Consolidation
The Company accounts for arrangements that are not controlled through voting or similar rights as variable interest entities (“VIEs”). An enterprise is required to consolidate a VIE if it is the primary beneficiary of the VIE. A VIE is created when (i) the equity investment at risk is not sufficient to permit the entity to finance its activities without additional subordinated financial support from other parties, or (ii) the entity’s equity holders as a group either: (a) lack the power, through voting or similar rights, to direct the activities of the entity that most significantly impact the entity’s economic performance, (b) are not obligated to absorb expected losses of the entity if they occur, or (c) do not have the right to receive expected residual returns of the entity if they occur. If an entity is deemed to be a VIE, the enterprise that is deemed to have a variable interest, or combination of variable interests, that provides the enterprise with a controlling financial interest in the VIE, is considered the primary beneficiary and must consolidate the VIE.
The Company has concluded that under certain circumstances when the Company enters into arrangements for the formation of joint ventures or when entering into a new bridge loan agreement, a VIE may be created under condition (i), (ii), (b) or (c) of the previous paragraph. For each VIE created, the Company has performed a qualitative analysis, including considering which party, if any, has the power to direct the activities most significant to the economic performance of each VIE and whether that party has the obligation to absorb losses of the VIE or the right to receive benefits from the VIE that could be significant to the VIE. If the Company is determined to be the primary beneficiary of the VIE, the assets, liabilities and operations of the VIE are consolidated with the Company’s financial statements.
The Company determined that its operating partnership met the definition of a VIE and is consolidated. Additionally, as of December 31, 2021 the Company determined in addition to its operating partnership that it had one consolidated joint venture VIE, consisting of four stores.
Substantially all of the assets and liabilities of the Company are related to the operating partnership VIE. The assets and credit of the VIE can only be used to satisfy the VIE's own contractual obligations, and the VIE's creditors have no recourse to the general credit of the Company.
The Company’s investments in real estate joint ventures, where the Company has significant influence, but not control, and joint ventures which are VIEs in which the Company is not the primary beneficiary, are recorded under the equity method of accounting on the accompanying consolidated financial statements.
EXTRA SPACE STORAGE INC.
NOTES TO CONSOLIDATED FINANCIAL STATEMENTS (continued)
Amounts in thousands, except store and share data, unless otherwise stated
Use of Estimates
The preparation of financial statements in conformity with GAAP requires management to make estimates and assumptions that affect the reported amounts of assets and liabilities and disclosure of contingent assets and liabilities at the date of the financial statements and the reported amounts of revenues and expenses during the reporting period. Actual results could differ from those estimates.
Fair Value Disclosures
Derivative financial instruments
Currently, the Company uses interest rate swaps to manage its interest rate risk. The valuation of these instruments is determined using widely accepted valuation techniques including discounted cash flow analysis on the expected cash flows of each derivative. This analysis reflects the contractual terms of the derivatives, including the period to maturity, and uses observable market-based inputs, including interest rate curves. The fair values of interest rate swaps are determined using the market standard methodology of netting the discounted future fixed cash payments and the discounted expected variable cash receipts. The variable cash receipts are based on an expectation of future interest rates (forward curves) derived from observable market interest rate forward curves.
The Company incorporates credit valuation adjustments to appropriately reflect both its own nonperformance risk and the respective counterparty’s nonperformance risk in the fair value measurements. In adjusting the fair value of its derivative contracts for the effect of nonperformance risk, the Company has considered the impact of netting and any applicable credit enhancements, such as collateral postings, thresholds, mutual puts, and guarantees. In conjunction with the Financial Accounting Standard Board’s fair value measurement guidance, the Company made an accounting policy election to measure the credit risk of its derivative financial instruments that are subject to master netting agreements on a net basis by counterparty portfolio.
Although the Company has determined that the majority of the inputs used to value its derivatives fall within Level 2 of the fair value hierarchy, the credit valuation adjustments associated with its derivatives utilize Level 3 inputs, such as estimates of current credit spreads to evaluate the likelihood of default by itself and its counterparties. However, as of December 31, 2022, the Company has assessed the significance of the impact of the credit valuation adjustments on the overall valuation of its derivative positions and has determined that the credit valuation adjustments are not significant to the overall valuation of its derivatives. As a result, the Company has determined that its derivative valuations in their entirety are classified in Level 2 of the fair value hierarchy.
The table below presents the Company’s assets and liabilities measured at fair value on a recurring basis as of December 31, 2022, aggregated by the level in the fair value hierarchy within which those measurements fall.
| | | | | | | | | | | | | | | | | | | | | | | |
| | | | Fair Value Measurements at Reporting Date Using |
| Description | December 31, 2022 | | Quoted Prices in Active Markets for Identical Assets (Level 1) | | Significant Other Observable Inputs (Level 2) | | Significant Unobservable Inputs (Level 3) |
| Other assets - Cash flow hedge swap agreements | $ | 54,839 | | | $ | — | | | $ | 54,839 | | | $ | — | |
| Other liabilities - Cash flow hedge swap agreements | $ | 73 | | | $ | — | | | $ | 73 | | | $ | — | |
There were no transfers of assets and liabilities between Level 1 and Level 2 during the year ended December 31, 2022. The Company did not have any significant assets or liabilities that are re-measured on a recurring basis using significant unobservable inputs as of December 31, 2022 or 2021.
Assets and Liabilities Measured at Fair Value on a Nonrecurring Basis
Long-lived assets held for use are evaluated for impairment when events or circumstances indicate there may be impairment. The Company reviews each store at least annually to determine if any such events or circumstances have occurred or exist. The Company focuses on stores where occupancy and/or rental income have decreased by a significant amount. For these stores, the Company determines whether the decrease is temporary or permanent, and whether the store will likely recover the lost occupancy and/or revenue in the short term. In addition, the Company reviews stores in the lease-up stage and compares actual operating results to original projections.
EXTRA SPACE STORAGE INC.
NOTES TO CONSOLIDATED FINANCIAL STATEMENTS (continued)
Amounts in thousands, except store and share data, unless otherwise stated
When the Company determines that an event that may indicate impairment has occurred, the Company compares the carrying value of the related long-lived assets to the undiscounted future net operating cash flows attributable to the assets. An impairment loss is recorded if the net carrying value of the assets exceeds the undiscounted future net operating cash flows attributable to the assets. The impairment loss recognized equals the excess of net carrying value over the related fair value of the assets.
When real estate assets are identified by management as held for sale, the Company discontinues depreciating the assets and estimates the fair value of the assets, net of selling costs. The Company compares the carrying value of the related long-lived assets to the undiscounted future net operating cash flows attributable to the assets (categorized within Level 3 of the fair value hierarchy). If the estimated fair value, net of selling costs, of the assets that have been identified as held for sale is less than the net carrying value of the assets, the Company would recognize a loss on the assets held for sale. The operations of assets held for sale or sold during the period are presented as part of normal operations for all periods presented.
The Company assesses annually whether there are any indicators that the value of the Company’s investments in unconsolidated real estate entities may be impaired and when events or circumstances indicate that there may be impairment. An investment is impaired if management’s estimate of the fair value of the investment is less than its carrying value. To the extent impairment has occurred, and is considered to be other than temporary, the loss is measured as the excess of the carrying amount of the investment over the fair value of the investment.
The Company evaluates goodwill for impairment at least annually and whenever events, circumstances, and other related factors indicate that fair value of the related reporting unit may be less than the carrying value. If the fair value of the reporting unit is determined to exceed the aggregate carrying amount, no impairment charge is recorded. Otherwise, an impairment charge is recorded to the extent the carrying amount of the goodwill exceeds the amount that would be allocated to goodwill if the reporting unit were acquired for estimated fair value. No impairments of goodwill were recorded for any period presented herein.
As of December 31, 2022 and 2021, the Company did not have any assets or liabilities measured at fair value on a nonrecurring basis.
Fair Value of Financial Instruments
The carrying values of cash and cash equivalents, restricted cash, receivables, other financial instruments included in other assets, accounts payable and accrued expenses, variable-rate notes payable, investments in debt securities and notes receivable, revolving lines of credit and other liabilities reflected in the consolidated balance sheets at December 31, 2022 and 2021, approximate fair value.
The fair values of the Company’s notes receivable and notes receivable from Preferred and Common Operating Partnership unit holders were based on the discounted estimated future cash flow of the notes (categorized within Level 3 of the fair value hierarchy); the discount rate used approximated the current market rate for loans with similar maturities and credit quality. The fair values of the Company’s fixed rate notes payable were estimated using the discounted estimated future cash payments to be made on such debt (categorized within Level 3 of the fair value hierarchy); the discount rates used approximated current market rates for loans, or groups of loans, with similar maturities and credit quality.
The fair values of the Company’s fixed-rate assets and liabilities were as follows for the periods indicated: | | | | | | | | | | | | | | | | | | | | | | | |
| | December 31, 2022 | | December 31, 2021 |
| Fair
Value | | Carrying
Value | | Fair
Value | | Carrying
Value |
| Notes receivable from Preferred and Common Operating Partnership unit holders | $ | 95,965 | | | $ | 101,900 | | | $ | 101,824 | | | $ | 101,900 | |
| Fixed rate notes receivable | $ | 5,191 | | | $ | 5,241 | | | $ | 105,954 | | | $ | 104,251 | |
| Fixed rate debt | $ | 4,320,014 | | | $ | 4,762,196 | | | $ | 4,643,072 | | | $ | 4,506,435 | |
| | | | | | | |
Real Estate Assets
Real estate assets are stated at cost, less accumulated depreciation. Direct and allowable internal costs associated with the development, construction, renovation, and improvement of real estate assets are capitalized. Interest, property taxes, and other
EXTRA SPACE STORAGE INC.
NOTES TO CONSOLIDATED FINANCIAL STATEMENTS (continued)
Amounts in thousands, except store and share data, unless otherwise stated
costs associated with development incurred during the construction period are capitalized. The construction period begins when expenditures for the real estate assets have been made and activities that are necessary to prepare the asset for its intended use are in progress. The construction period ends when the asset is substantially complete and ready for its intended use.
Expenditures for maintenance and repairs are charged to expense as incurred. Major replacements and betterments that improve or extend the life of the asset are capitalized and depreciated over their estimated useful lives. Depreciation is computed using the straight-line method over the estimated useful lives of the buildings and improvements, which are generally between five and 39 years.
The purchase of stores are considered asset acquisitions. As such, the purchase price is allocated to the real estate assets acquired based on their relative fair values, which are estimated using significant unobservable inputs. The value of the tangible assets, consisting of land and buildings, is determined as if vacant. Intangible assets, which represent the value of existing tenant relationships, are recorded at their relative fair values based on the avoided cost to replace the current leases. The Company measures the value of tenant relationships based on the rent lost due to the amount of time required to replace existing customers, which is based on the Company’s historical experience with turnover in its stores. Any debt assumed as part of the acquisition is recorded at fair value based on current interest rates compared to contractual rates. Acquisition-related transaction costs are capitalized as part of the purchase price.
Intangible lease rights represent: (1) purchase price amounts allocated to leases on three stores that cannot be classified as ground or building leases; these rights are amortized to expense over the life of the leases and (2) intangibles related to ground leases on eight stores where the leases were assumed by the Company at rates that were lower than the current market rates for similar leases. The values associated with these assumed leases were recorded as intangibles, which will be amortized over the lease terms.
Real Estate Sales
In general, sales of real estate and related profits/losses are recognized when all consideration has changed hands and risks and rewards of ownership have been transferred. Certain types of continuing involvement preclude sale treatment and related profit recognition; other forms of continuing involvement allow for sale recognition but require deferral of profit recognition.
Investments in Unconsolidated Real Estate Entities
Investments in unconsolidated real estate entities and Cash distributions in unconsolidated real estate ventures represent the Company's noncontrolling interest in real estate joint ventures that own stores and the Company's interest in preferred stock of SmartStop Self Storage REIT, Inc. ("SmartStop"). The Company’s investments in real estate joint ventures, where the Company has significant influence, but not control and joint ventures which are VIEs in which the Company is not the primary beneficiary, are recorded under the equity method of accounting in the accompanying consolidated financial statements.
Under the equity method, the Company’s investment in real estate ventures is stated at cost and adjusted for the Company’s share of net earnings or losses and reduced by distributions. Equity in earnings of real estate ventures is generally recognized based on the Company’s ownership interest in the earnings of each of the unconsolidated real estate ventures. For the purposes of presentation in the statement of cash flows, the Company follows the “nature of distribution” approach for classification of distributions from joint ventures. Under this approach, cash flows are classified on the basis of the nature of the activity or activities of the investee that generated the distribution as either a return on investment (classified as a cash inflow from operating activities) or a return of investment (classified as a cash inflow from investing activities).
The Company evaluated its investments in preferred stock of non-public real estate entities and determined it did not have significant influence over the entity, and the investment in preferred stock does not have a readily determinable fair value, therefore it has been recorded at the transaction price. The Company periodically evaluates the investment for impairment. No impairments were recorded during the year ended December 31, 2022.
EXTRA SPACE STORAGE INC.
NOTES TO CONSOLIDATED FINANCIAL STATEMENTS (continued)
Amounts in thousands, except store and share data, unless otherwise stated
Investments in Debt Securities and Notes Receivable
The Company accounts for its investment in debt securities and loans receivable at amortized cost. The Company recognizes interest income related to the debt securities and notes receivable using the effective interest method, with deferred fees and costs amortized over the lives of the related loans as yield adjustment.
Cash and Cash Equivalents
The Company’s cash is deposited with financial institutions located throughout the United States and at times may exceed federally insured limits. The Company considers all highly liquid debt instruments with a maturity date of three months or less to be cash equivalents.
Other Assets
Other assets consist of restricted cash, equipment and fixtures, capitalized software, rents receivable from our tenants, other receivables, other intangible assets, deferred tax assets, prepaid expenses, the fair value of interest rate swaps, and goodwill. Depreciation of equipment and fixtures is computed on a straight-line basis over three to five years. The Company capitalizes certain costs during the application development stage when developing software for internal use. As of December 31, 2022 and 2021, unamortized software costs were $23,165 and $21,493. During the year ended December 31, 2022 and 2021, the Company recorded amortization expense of $5,147 and $3,072, respectively, relating to capitalized software costs.
Derivative Instruments and Hedging Activities
The Company records all derivatives on the balance sheet at fair value. The accounting for changes in the fair value of derivatives depends on the intended use of the derivative, whether the Company has elected to designate a derivative in a hedging relationship and apply hedge accounting and whether the hedging relationship has satisfied the criteria necessary to apply hedge accounting. Derivatives designated and qualifying as a hedge of the exposure to changes in the fair value of an asset, liability or firm commitment attributable to a particular risk, such as interest rate risk, are considered fair value hedges. Derivatives designated and qualifying as a hedge of the exposure to variability in expected future cash flows, or other types of forecasted transactions, are considered cash flow hedges. Hedge accounting generally provides for the matching of the timing of gain or loss recognition on the hedging instrument with the recognition of the changes in the fair value of the hedged asset or liability that are attributable to the hedged risk in a fair value hedge or the earnings effect of the hedged forecasted transactions in a cash flow hedge. The Company may enter into derivative contracts that are intended to economically hedge certain of its risk, even though hedge accounting does not apply or the Company elects not to apply hedge accounting. The Company made an accounting policy election to measure the credit risk of its derivative financial instruments that are subject to master netting agreements on a net basis by counterparty portfolio.
Risk Management and Use of Financial Instruments
In the normal course of its ongoing business operations, the Company encounters economic risk. There are three main components of economic risk: interest rate risk, credit risk and market risk. The Company is subject to interest rate risk on its interest-bearing liabilities. Credit risk is the risk of inability or unwillingness of tenants to make contractually required payments. Market risk is the risk of declines in the value of stores due to changes in rental rates, interest rates or other market factors affecting the value of stores held by the Company. The Company has entered into interest rate swap agreements to manage a portion of its interest rate risk.
Redemption of Common Operating Partnership Units
The Company has the option to redeem common Operating Partnership Units in cash or shares of common stock. Redemption of common Operating Partnership units for shares of common stock, when redeemed under the original provisions of the Operating Partnership agreement, is accounted for by reclassifying the underlying net book value of the units from noncontrolling interest to the Company’s equity. Redemption of common Operating Partnership units for cash is accounted for by reducing the underlying net book value of the units from noncontrolling interest.
EXTRA SPACE STORAGE INC.
NOTES TO CONSOLIDATED FINANCIAL STATEMENTS (continued)
Amounts in thousands, except store and share data, unless otherwise stated
Revenue and Expense Recognition
Rental revenues are recognized as earned based upon amounts that are currently due from tenants. Leases are generally on month-to-month terms. Prepaid rents are recognized on a straight-line basis over the term of the leases. Promotional discounts are recognized as a reduction to rental income over the promotional period. Late charges, administrative fees and merchandise sales are recognized as income when earned.
The Company's management fees are earned subject to the terms of the related management services agreements ("MSAs"). These MSAs provide that the Company will perform management services, which include leasing and operating the property and providing accounting, marketing, banking, maintenance and other services. These services are provided in exchange for monthly management fees, which are based on a percentage of revenues collected from stores owned by third parties and unconsolidated joint ventures. MSAs generally have original terms from three to five years, after which management services are provided on a month-to-month basis unless terminated. Management fees are due on the last day of each calendar month that management services are provided.
The Company accounts for the management services provided to a customer as a single performance obligation which are rendered over time each month. The total amount of consideration from the contract is variable as it is based on monthly revenues, which are influenced by multiple factors, some of which are outside the Company's control. Therefore, the Company recognizes the revenue at the end of each month once the uncertainty is resolved. Due to the standardized terms of the MSAs, the Company accounts for all MSAs in a similar, consistent manner. Therefore, no disaggregated information relating to MSAs is presented.
Property expenses, including utilities, property taxes, repairs and maintenance and other costs to manage the facilities are recognized as incurred. The Company accrues for property tax expense based upon invoice amounts and estimates. If these estimates are incorrect, the timing of expense recognition could be affected.
Tenant reinsurance premiums are recognized as revenue over the period of insurance coverage. The Company records an unpaid claims liability at the end of each period based on existing unpaid claims and historical claims payment history. The unpaid claims liability represents an estimate of the ultimate cost to settle all unpaid claims as of each period end, including both reported but unpaid claims and claims that may have been incurred but have not been reported. The Company uses a third party claims administrator to adjust all tenant reinsurance claims received. The administrator evaluates each claim to determine the ultimate claim loss and includes an estimate for claims that may have been incurred but not reported. Annually, a third party actuary evaluates the adequacy of the unpaid claims liability. Prior year claim reserves are adjusted as experience develops or new information becomes known. The impact of such adjustments is included in the current period operations. The unpaid claims liability is not discounted to its present value. Each tenant chooses the amount of insurance coverage they want through the tenant reinsurance program. Tenants can purchase policies in amounts of 2,000 dollars to 10,000 dollars of insurance coverage in exchange for a monthly fee. As of December 31, 2022, the average insurance coverage for tenants was approximately 3,500 dollars (coverage numbers not in thousands). The Company’s exposure per claim is limited by the maximum amount of coverage chosen by each tenant.
For the years ended December 31, 2022, 2021 and 2020, the number of individual claims made were 8,542, 8,748 and 8,226, respectively (claim numbers not in thousands).
EXTRA SPACE STORAGE INC.
NOTES TO CONSOLIDATED FINANCIAL STATEMENTS (continued)
Amounts in thousands, except store and share data, unless otherwise stated
The following table presents information on the portion of the Company’s unpaid claims liability, which is included in other liabilities on the Company's consolidated balance sheets, that relates to tenant insurance for the periods indicated: | | | | | | | | | | | | | | | | | |
| | For the Year Ended December 31, |
| Tenant Reinsurance Claims: | 2022 | | 2021 | | 2020 |
| Unpaid claims liability at beginning of year | $ | 9,112 | | | $ | 8,294 | | | $ | 8,109 | |
| Claims and claim adjustment expense for claims incurred in the current year | 20,533 | | | 16,901 | | | 14,534 | |
| Claims and claim adjustment expense (benefit) for claims incurred in the prior years | 179 | | | 122 | | | (1,351) | |
| Payments for current year claims | (18,137) | | | (11,913) | | | (9,697) | |
| Payments for prior year claims | (5,289) | | | (4,292) | | | (3,301) | |
| Unpaid claims liability at the end of the year | $ | 6,398 | | | $ | 9,112 | | | $ | 8,294 | |
Advertising Costs
The Company incurs advertising costs primarily attributable to digital and other advertising. These costs are expensed as incurred. The Company recognized $19,285, $18,793 and $28,336 in advertising expense for the years ended December 31, 2022, 2021 and 2020, respectively, which are included in property operating expenses on the Company’s consolidated statements of operations.
Income Taxes
The Company has elected to be treated as a REIT under Sections 856 through 860 of the Internal Revenue Code of 1986, as amended (the "Internal Revenue Code"). In order to maintain its qualification as a REIT, among other requirements, the Company is required to distribute at least 90% of its REIT taxable income to its stockholders and meet certain tests regarding the nature of its income and assets. As a REIT, the Company is not subject to U.S. federal income tax with respect to that portion of its income which meets certain criteria and is distributed annually to stockholders. The Company plans to continue to operate so that it meets the requirements for taxation as a REIT. Many of these requirements, however, are highly technical and complex. For any taxable year that the Company fails to qualify as a REIT and for which applicable statutory relief provisions did not apply, the Company would be subject to U.S. federal corporate income tax on all of its taxable income for at least that year and the ensuing four years. The Company is subject to certain state and local taxes. Provision for such taxes has been included in income tax expense on the Company’s consolidated statements of operations. For the year ended December 31, 2022, 0% (unaudited) of all distributions to stockholders qualified as a return of capital.
The Company owns and may acquire direct or indirect interests in entities that have elected or will elect to be taxed as REITs under the Internal Revenue Code (each, a “Subsidiary REIT ”). A Subsidiary REIT is subject to the various REIT qualification requirements and other limitations described herein that are applicable to the Company. If a Subsidiary REIT were to fail to qualify as a REIT, then (i) that Subsidiary REIT would become subject to U.S. federal income tax, (ii) shares in such Subsidiary REIT would cease to be qualifying assets for purposes of the asset tests applicable to REITs, and (iii) it is possible that the Company would fail certain of the asset tests applicable to REITs, in which event the Company would fail to qualify as a REIT unless it could avail itself of certain relief provisions.
The Company has elected to treat certain corporate subsidiaries, including Extra Space Management, Inc. (“ESMI”), as a taxable REIT subsidiary (“TRS”). In general, a TRS may perform additional services for tenants and may engage in any real estate or non-real estate related business. A TRS is subject to U.S. federal corporate income tax and may also be subject to state and local income taxes. ESM Reinsurance Limited, a wholly-owned subsidiary of ESMI, generates income from insurance premiums that are subject to U.S. federal corporate income tax and state insurance premiums tax.
Deferred tax assets and liabilities are determined based on differences between financial reporting and tax bases of assets and liabilities. At December 31, 2022 and 2021, there were no material unrecognized tax benefits. Interest and penalties relating to uncertain tax positions will be recognized in income tax expense when incurred. As of December 31, 2022 and 2021, the Company had no interest or penalties related to uncertain tax provisions.
EXTRA SPACE STORAGE INC.
NOTES TO CONSOLIDATED FINANCIAL STATEMENTS (continued)
Amounts in thousands, except store and share data, unless otherwise stated
Stock-Based Compensation
The measurement and recognition of compensation expense for all share-based payment awards to employees and directors are based on estimated fair values. Awards granted are valued at fair value and any compensation expense is recognized over the service periods of each award.
Earnings Per Common Share
Basic earnings per common share is computed using the two-class method by dividing net income attributable to common stockholders by the weighted average number of common shares outstanding during the period. All outstanding unvested restricted stock awards contain rights to non-forfeitable dividends and participate in undistributed earnings with common stockholders; accordingly, they are considered participating securities that are included in the two-class method. Diluted earnings per common share measures the performance of the Company over the reporting period while giving effect to all potential common shares that were dilutive and outstanding during the period. The denominator includes the weighted average number of basic shares and the number of additional common shares that would have been outstanding if the potential common shares that were dilutive had been issued, and is calculated using either the two-class, treasury stock or as if-converted method, whichever is most dilutive. Potential common shares are securities (such as options, convertible debt, Series A Participating Redeemable Preferred Units (“Series A Units”), Series B Redeemable Preferred Units (“Series B Units”), and Series D Redeemable Preferred Units (“Series D Units”) and together with the Series A Units and Series B Units, the “Preferred OP Units") and common Operating Partnership units (“OP Units”)) that do not have a current right to participate in earnings of the Company but could do so in the future by virtue of their option, redemption or conversion right.
For the purposes of computing the diluted impact of the potential exchange of the Preferred OP Units for common shares upon redemption, where the Company has the option to redeem in cash or shares and where the Company has stated the intent and ability to settle the redemption in shares, the Company divided the total liquidation value of the Preferred OP Units by the average share price of $183.21 for the year ended December 31, 2022.
The following table presents the number of weighted OP Units and Preferred OP Units, and the potential common shares, that were excluded from the computation of earnings per share as their effect would have been anti-dilutive: | | | | | | | | | | | | | | | | | |
| | For the Year Ended December 31, |
| | 2022 | | 2021 | | 2020 |
| | Equivalent Shares (if converted) | | Equivalent Shares (if converted) | | Equivalent Shares (if converted) |
| Common OP Units | — | | | — | | | 5,853,814 | |
| Series A Units (Variable Only) | — | | | — | | | 875,480 | |
| Series B Units | 187,664 | | | 246,618 | | | 400,771 | |
| Series D Units | 1,140,513 | | | 726,037 | | | 1,143,547 | |
| 1,328,177 | | | 972,655 | | | 8,273,612 | |
For the purposes of computing the diluted impact on earnings per share of the potential exchange of Series A Units for common shares upon redemption, where the Company has the option to redeem in cash or shares and where the Company has stated the positive intent and ability to settle at least $101,700 of the instrument in cash (or net settle a portion of the Series A Units against the related outstanding note receivable), only the amount of the instrument in excess of $101,700 is considered in the calculation of shares contingently issuable for the purposes of computing diluted earnings per share as allowed by ASC 260-10-45-46. Accordingly, the number of shares included in the computation for diluted earnings per share related to the Series A Units is equal to the number of Series A Units outstanding, with no additional shares included related to the $101,700 fixed amount.
EXTRA SPACE STORAGE INC.
NOTES TO CONSOLIDATED FINANCIAL STATEMENTS (continued)
Amounts in thousands, except store and share data, unless otherwise stated
The computation of earnings per share is as follows for the periods presented: | | | | | | | | | | | | | | | | | |
| | For the Year Ended December 31, |
| | 2022 | | 2021 | | 2020 |
| Net income attributable to common stockholders | $ | 860,688 | | | $ | 827,649 | | | $ | 481,779 | |
| Earnings and dividends allocated to participating securities | (1,201) | | | (1,183) | | | (706) | |
| Earnings for basic computations | 859,487 | | | 826,466 | | | 481,073 | |
| | | | | |
| Income allocated to noncontrolling interest - Preferred Operating Partnership Units and Operating Partnership Units | 50,706 | | | 43,093 | | | — | |
| Fixed component of income allocated to noncontrolling interest - Preferred Operating Partnership (Series A Units) | (2,288) | | | (2,288) | | | — | |
| Net income for diluted computations | $ | 907,905 | | | $ | 867,271 | | | $ | 481,073 | |
| | | | | |
| Weighted average common shares outstanding: | | | | | |
| Average number of common shares outstanding - basic | 134,050,815 | | | 133,374,938 | | | 129,541,531 | |
| OP Units | 6,749,995 | | | 5,752,902 | | | — | |
| Series A Units | 875,480 | | | 875,480 | | | — | |
| | | | | |
| | | | | |
| | | | | |
| Shares related to exchangeable senior notes and dilutive stock options | 5,098 | | | 12,708 | | | 43,298 | |
| Average number of common shares outstanding - diluted | 141,681,388 | | | 140,016,028 | | | 129,584,829 | |
| Earnings per common share | | | | | |
| Basic | $ | 6.41 | | | $ | 6.20 | | | $ | 3.71 | |
| Diluted | $ | 6.41 | | | $ | 6.19 | | | $ | 3.71 | |
Recently Issued Accounting Standards
In June 2016, the FASB issued ASU 2016-13, "Financial Instruments - Credit Losses (Topic 326): Measurement of Credit Losses on Financial Instruments." ASU 2016-13 changes how entities measure credit losses for most financial assets. This standard requires an entity to estimate its lifetime "expected credit loss" and record an allowance that, when deducted from the amortized cost basis of the financial asset, presents the net amount expected to be collected on the financial asset. In November 2018, the FASB issued ASU 2018-19, "Codification Improvements to Topic 326, Financial Instruments - Credit Losses," which clarified that receivables arising from operating leases are within the scope of the leasing standard (ASU 2016-02), and not within the scope of ASU 2016-13. This new standard became effective for the Company on January 1, 2020. The adoption of this standard by the Company did not have a material impact on the Company's consolidated financial statements.
In March 2020, the FASB issued ASU 2020-04, "Reference Rate Reform (Topic 848): Facilitation of the Effects of Reference Rate Reform on Financial Reporting" (“ASU 2020-04”). ASU 2020-04 provides temporary optional guidance that provides transition relief for reference rate reform, including optional expedients and exceptions for applying GAAP to contract modifications, hedging relationships and other transactions that reference LIBOR or a reference rate that is expected to be discontinued as a result of reference rate reform if certain criteria are met. ASU 2020-04 is effective upon issuance, and the provisions generally can be applied prospectively as of January 1, 2020 through December 31, 2024. The Company elected to apply the hedge accounting expedients related to probability and the assessments of effectiveness for future LIBOR-indexed cash flows to assume that the index upon which future hedged transactions will be based matches the index on the corresponding derivatives. The Company also elected to apply additional expedients related to contract modifications, changes in critical terms, and updates to the designated hedged risks as qualifying changes are made to applicable debt and derivative contracts. Application of these expedients preserves the presentation of derivatives and debt contracts consistent with past presentation. In December 2022, the FASB issued ASU 2022-06, Deferral of the Sunset Date of Topic 848 (“ASU 2022-06”) which was issued to defer the sunset date of Reference Rate Reform (Topic 848): Facilitation of the Effects of Reference Rate Reform to December 31, 2024. ASU 2022-06 is effective immediately for all companies. ASU 2022-06 will have no impact on the Company’s consolidated financial statements for the year ended December 31, 2022.
EXTRA SPACE STORAGE INC.
NOTES TO CONSOLIDATED FINANCIAL STATEMENTS (continued)
Amounts in thousands, except store and share data, unless otherwise stated
In June 2022, the FASB issued ASU 2022-03, "Fair Value Measurement (Topic 820): Fair Value Measurement of Equity Securities Subject to Contractual Sale Restrictions" ("ASU 2022-03"). ASU 2022-03 clarifies the guidance on fair value measurement of an equity security that is subject to a contractual sale restriction. Currently, some entities apply a discount to the fair value of an equity security subject to a contractual sale restriction, while others do not. This update eliminates the diversity in practice by clarifying that a recognition of a discount related to a contractual sale restriction is not permitted. The Company occasionally issues Operating Partnership units that are subject to trading restrictions in conjunction with business combinations and asset acquisitions. The Company does not currently recognize a discount related to such trading restrictions. ASU 2022-03 has no impact on the Company's consolidated financial statements and has been early adopted for the year ended December 31, 2022.
3. REAL ESTATE ASSETS
The components of real estate assets are summarized as follows: | | | | | | | | | | | |
| December 31, 2022 | | December 31, 2021 |
| Land | $ | 2,356,746 | | | $ | 2,151,319 | |
| Buildings, improvements and other intangibles | 9,425,468 | | | 8,227,094 | |
| Right of use asset - finance lease | 136,259 | | | 117,718 | |
| Intangible assets - tenant relationships | 152,775 | | | 134,577 | |
| Intangible lease rights | 12,943 | | | 12,443 | |
| 12,084,191 | | | 10,643,151 | |
| Less: accumulated depreciation and amortization | (2,138,524) | | | (1,867,750) | |
| Net operating real estate assets | 9,945,667 | | | 8,775,401 | |
| Real estate under development/redevelopment | 52,311 | | | 59,248 | |
| Real estate assets, net | $ | 9,997,978 | | | $ | 8,834,649 | |
| Real estate assets held for sale included in real estate assets, net | $ | — | | | $ | 8,436 | |
The Company amortizes to expense intangible assets—tenant relationships on a straight-line basis over the average period that a tenant is expected to utilize the facility (currently estimated at 18 months). The Company amortizes to expense the intangible lease rights over the terms of the related leases. Amortization related to the tenant relationships and lease rights was $13,981, $4,778, and $2,258 for the years ended December 31, 2022, 2021 and 2020, respectively. The remaining balance of the unamortized lease rights will be amortized over the next six to 39 years. Accumulated amortization related to intangibles was 144,144 and 130,561 as of December 31, 2022 and 2021, respectively.
4. OTHER ASSETS
The components of other assets are summarized as follows:
| | | | | | | | | | | |
| December 31, 2022 | | December 31, 2021 |
| Equipment and fixtures, net | $ | 42,808 | | | $ | 29,060 | |
| Deferred line of credit financing costs, net | 4,846 | | | 7,408 | |
| Prepaid expenses and deposits | 50,318 | | | 39,384 | |
| Receivables, net | 85,937 | | | 83,050 | |
| Goodwill | 170,811 | | | — | |
| Restricted cash | 4,867 | | | 5,068 | |
| Fair value of interest rate swaps | 54,839 | | | 270 | |
| $ | 414,426 | | | $ | 164,240 | |
EXTRA SPACE STORAGE INC.
NOTES TO CONSOLIDATED FINANCIAL STATEMENTS (continued)
Amounts in thousands, except store and share data, unless otherwise stated
5. PROPERTY ACQUISITIONS AND DISPOSITIONS
Store Acquisition
The following table shows the Company’s acquisitions of stores for the years ended December 31, 2022 and 2021. The table excludes purchases of raw land and improvements made to existing assets. | | | | | | | | | | | | | | | | | | | | | | | | | | | | | | | | | | | | | | | |
| | | Consideration Paid | Total |
| Period | Number of Stores | | Total | | Cash Paid | | Loan Assumed | Finance Lease Liability | Investments in Real Estate Ventures | Net Liabilities/ (Assets) Assumed | Value of Equity Issued | | Real estate assets |
| | | | | | | | | | | | | |
| | | | | | | | | | | | | |
| | | | | | | | | | | | | |
| | | | | | | | | | | | | |
| Total 2022 | 153 | | $ | 1,366,348 | | | $ | 1,193,261 | | | $ | — | | $ | 6,823 | | $ | 1,085 | | $ | (786) | | $ | 165,965 | | | $ | 1,366,348 | |
| | | | | | | | | | | | | |
| | | | | | | | | | | | | |
| | | | | | | | | | | | | |
| | | | | | | | | | | | | |
| | | | | | | | | | | | | |
| Total 2021 | 74 | | $ | 1,344,574 | | | $ | 1,011,483 | | | $ | 20,028 | | $ | 26,998 | | $ | 5,383 | | $ | 4,292 | | $ | 276,390 | | | $ | 1,344,574 | |
| | | | | | | | | | | | | |
| | | | | | | | | | | | | |
| | | | | | | | | | | | | |
| | | | | | | | | | | | | |
| | | | | | | | | | | | | |
| | | | | | | | | | | | | |
On September 15, 2022, the Company completed the acquisition of multiple entities doing business as Storage Express for a purchase price of $590.0 million. A portion of the consideration paid was in the form of the issuance of 619,294 OP units (a total value of $125.0 million) and the remainder in cash. The portfolio included 106 operating stores and eight parcels of land for future development, all located in Illinois, Indiana, Kentucky and Ohio. This acquisition did not meet the definition of a business under ASU 2017-01, "Business Combinations (Topic 805): Clarifying the Definition of a Business" and was therefore recorded as an asset acquisition.
Other Investments
On June 1, 2022, the Company completed the acquisition of Bargold Storage Systems, LLC ("Bargold") for a purchase price of approximately $179.3 million. Bargold leases space in apartment buildings, primarily in New York City and its boroughs, builds out the space as storage units, and subleases the units to tenants. As of June 1, 2022, Bargold had approximately 17,000 storage units with an approximate occupancy of 97%. This acquisition is considered a business combination under ASU 2017-01, "Business Combinations (Topic 805): Clarifying the Definition of a Business."
The following table summarizes the total consideration transferred to acquire Bargold:
| | | | | |
| |
| |
| Total cash paid by the company | $ | 157,302 | |
| Fair value of Series D Units issued | 16,000 | |
| Fair value of OP Units issued | 6,000 | |
| Total consideration transferred | $ | 179,302 | |
As part of this acquisition, we recorded an expense of $1,465 related to transaction costs.
The following table summarizes the preliminary estimated fair values of the assets acquired and liabilities assumed at the acquisition date:
EXTRA SPACE STORAGE INC.
NOTES TO CONSOLIDATED FINANCIAL STATEMENTS (continued)
Amounts in thousands, except store and share data, unless otherwise stated
| | | | | |
| Cash and cash equivalents | $ | 175 | |
| Fixed assets | 6,411 | |
| Developed technology | 500 | |
| Trademarks | 500 | |
| Customer relationships | 1,870 | |
| Other assets | 125 | |
| Accounts payables and accrued liabilities assumed | (1,090) | |
| Nets asset acquired | 8,491 | |
| Goodwill | 170,811 | |
| Total assets acquired | $ | 179,302 | |
The following table summarizes the revenues and earnings related to Bargold since the acquisition date of June 1, 2022, which are included in the Company's consolidated statement of operations for the year ended December 31, 2022:
| | | | | |
| Total revenues | $ | 9,374 | |
| Net income from operations | $ | 1,718 | |
Pro Forma Information
As noted above, during the year ended December 31, 2022, the Company acquired Bargold. The following pro forma financial information is based on the combined historical financial statements of the Company and Bargold, however, only includes revenue and presents the Company's results as if the acquisition had occurred on January 1, 2021. Net income was excluded as it was impracticable to report expenses due to the lack of historical accrual basis accounting.
| | | | | | | | | | | |
| For the Year Ended December 31, 2022 | | For the Year Ended December 31, 2021 |
| Pro Forma | | Pro Forma |
| Total revenues | $ | 1,930,816 | | | $ | 1,592,021 | |
Store Dispositions
The Company disposed of one store on May 18 and one on June 21, 2022, for a total cash consideration of approximately $38.7 million, resulting in a gain of approximately $14.2 million. Both had been classified as held for sale.
On December 16, 2021 the Company sold 16 stores that had been classified as held for sale for total cash consideration of $200,292. The Company recorded a gain of $73,854.
On March 1, 2021 the Company sold 16 stores that had been classified as held for sale to a newly established unconsolidated joint venture. The Company received $132,759 and maintained a 55% interest in the new joint venture valued at $33,878. The Company recognized a gain of $63,477 related to the sale of these properties.
6. INVESTMENTS IN UNCONSOLIDATED REAL ESTATE ENTITIES
Investments in unconsolidated real estate entities and Cash distributions in unconsolidated real estate ventures represent the Company's interest in preferred stock of SmartStop Self Storage REIT, Inc. ("SmartStop") and the Company's noncontrolling interest in real estate joint ventures that own stores. The Company accounts for its investment in SmartStop preferred stock, which does not have a readily determinable fair value, at the transaction price less impairment, if any. The Company accounts for its investments in joint ventures using the equity method of accounting. The Company initially records these investments at cost and subsequently adjusts for cash contributions, distributions and net equity in income or loss, which is allocated in accordance with the provisions of the applicable partnership or joint venture agreement.
EXTRA SPACE STORAGE INC.
NOTES TO CONSOLIDATED FINANCIAL STATEMENTS (continued)
Amounts in thousands, except store and share data, unless otherwise stated
In these joint ventures, the Company and the joint venture partner generally receive a preferred return on their invested capital. To the extent that cash or profits in excess of these preferred returns are generated through operations or capital transactions, the Company would receive a higher percentage of the excess cash or profits, as applicable, than its equity interest.
The Company separately reports investments with net equity less than zero in Cash distributions in unconsolidated real estate ventures in the consolidated balance sheets. The net equity of certain joint ventures is less than zero because distributions have exceeded the Company's investment in and share of income from these joint ventures. This is generally the result of financing distributions, capital events or operating distributions that are usually greater than net income, as net income includes non-cash charges for depreciation and amortization while distributions do not.
Net Investments in unconsolidated real estate entities and Cash distributions in unconsolidated real estate ventures consist of the following: | | | | | | | | | | | | | | | | | | | | | | | | | | | | | |
| | Number of Stores | | Equity Ownership % | | Excess Profit % (1) | | December 31, |
| | | 2022 | | 2021 |
| PRISA Self Storage LLC | 84 | | 4% | | 4% | | $ | 8,596 | | | $ | 8,792 | |
| Storage Portfolio II JV LLC | 36 | | 10% | | 30% | | (7,200) | | | (6,116) | |
| Storage Portfolio IV JV LLC | 32 | | 10% | | 30% | | 49,139 | | | 40,174 | |
| Storage Portfolio I LLC | 24 | | 34% | | 49% | | (41,372) | | | (40,168) | |
| PR II EXR JV LLC | 23 | | 25% | | 25% | | 110,172 | | | 70,403 | |
| ESS-CA TIVS JV LP | 16 | | 55% | | 60% | | 30,778 | | | 32,288 | |
| VRS Self Storage, LLC | 16 | | 45% | | 54% | | (15,399) | | | (14,269) | |
| ARA-EXR JV LLC | 12 | | 10% | | 30% | | 19,137 | | | — | |
| ESS-NYFL JV LP | 11 | | 16% | | 24% | | 11,332 | | | 11,796 | |
| Extra Space Northern Properties Six LLC | 10 | | 10% | | 35% | | (3,382) | | | (3,029) | |
| Alan Jathoo JV LLC | 9 | | 10% | | 10% | | 7,414 | | | 7,621 | |
| ESS Bristol Investments LLC | 8 | | 10% | | 30% | | 2,110 | | | 2,628 | |
| ESS - BGO Atlanta GA JV LLC | 7 | | 20% | | 35% | | 30,467 | | | — | |
| Storage Portfolio V JV LLC | 6 | | 10% | | 30% | | 9,517 | | | — | |
| PR EXR Self Storage, LLC | 5 | | 25% | | 40% | | 58,476 | | | 59,393 | |
| Storage Portfolio III JV LLC | 5 | | 10% | | 30% | | 5,467 | | | 5,596 | |
| Other unconsolidated real estate ventures | 14 | | 20-50% | | 20-50% | | 39,808 | | | 18,635 | |
SmartStop Self Storage REIT, Inc. Preferred Stock (2) | n/a | | n/a | | n/a | | 200,000 | | | 200,000 | |
| Net Investments in and Cash distributions in unconsolidated real estate entities | 318 | | | | | | $ | 515,060 | | | $ | 393,744 | |
(1)Includes pro-rata equity ownership share and promoted interest.
(2)The Company invested in shares of convertible preferred stock of SmartStop. The dividend rate for the preferred shares is 6.25% per annum, subject to increase after five years. The preferred shares are generally not redeemable for five years, except in the case of a change of control or initial listing of SmartStop. Dividend income from this investment is included on the equity in earnings and dividend income from unconsolidated real estate entities line on the Company's consolidated statement of operations.
In June 2021, the Company sold its interest in two unconsolidated joint ventures to its joint venture partner. The Company received proceeds of $1,888 in cash, and recorded a gain of $525 which is included in Equity in earnings of unconsolidated real estate ventures - gain on sale of real estate assets and purchase of joint venture partner's interest in the Company's condensed consolidated statements of operations. The Company also purchased its joint venture partners' interests in two unconsolidated joint ventures.
EXTRA SPACE STORAGE INC.
NOTES TO CONSOLIDATED FINANCIAL STATEMENTS (continued)
Amounts in thousands, except store and share data, unless otherwise stated
Also in June 2021, the WICNN JV LLC and GFN JV, LLC joint ventures sold all 17 of the stores owned by the joint ventures to a third party. Subsequent to the sales, these joint ventures were dissolved. As a result of these transactions, the Company recorded a gain of $5,739, which is included in Equity in earnings of unconsolidated real estate ventures - gain on sale of real estate assets and purchase of joint venture partner's interest in the Company's consolidated statements of operations.
In accordance with ASC 810, the Company reviews all of its joint venture relationships annually to ensure that there are no entities that require consolidation. As of December 31, 2022, there were no previously unconsolidated entities that were required to be consolidated as a result of this review.
The Company entered into four new unconsolidated real estate joint ventures of which added a total of 27 stores and a total investment of $66,592 to the Company's portfolio during the year ended December 31, 2022. Additionally, the Company's existing joint ventures added 10 stores for a total investment of $54,724 during the year ended December 31, 2022. The Company accounts for its investment in these ventures under the equity method of accounting.
Equity in earnings and dividend income from unconsolidated real estate entities consists of the following: | | | | | | | | | | | | | | | | | |
| | For the Year Ended December 31, |
| | 2022 | | 2021 | | 2020 |
| Dividend income from SmartStop preferred stock | $ | 12,509 | | | $ | 12,500 | | | $ | 9,968 | |
| Equity in earnings of PRISA Self Storage LLC | 3,272 | | | 2,719 | | | 2,229 | |
| Equity in earnings of Storage Portfolio II JV LLC | 3,398 | | | 1,802 | | | 559 | |
| Equity in earnings of Storage Portfolio IV JV LLC | 917 | | | 112 | | | — | |
| Equity in earnings of Storage Portfolio I LLC | 4,684 | | | 2,833 | | | 1,636 | |
| Equity in earnings of PR II EXR JV LLC | 1,229 | | | (8) | | | — | |
| Equity in earnings of ESS-CA TIVS JV LP | 2,753 | | | 1,274 | | | — | |
| Equity in earnings of VRS Self Storage, LLC | 5,401 | | | 4,352 | | | 3,509 | |
| Equity in earnings of ARA-EXR JV LLC | 180 | | | — | | | — | |
| Equity in earnings of ESS-NYFL JV LLC | 803 | | | 427 | | | (331) | |
| Equity in earnings of Extra Space Northern Properties Six LLC | 1,734 | | | 1,363 | | | 1,088 | |
| Equity in earnings of ESS-BGO Atlanta GA JV LLC | 55 | | | — | | | — | |
| Equity in earnings of Alan Jathoo JV LLC | 482 | | | 270 | | | 57 | |
| Equity in earnings of Bristol Investments LLC | 350 | | | 177 | | | (67) | |
| Equity in earnings of Storage Portfolio V JV LLC | (33) | | | — | | | — | |
| Equity in earnings of PR EXR Self Storage, LLC | 1,030 | | | 491 | | | (211) | |
| | | | | |
| Equity in earnings of WICNN JV LLC | — | | | 1,050 | | | 1,878 | |
| Equity in earnings of GFN JV, LLC | — | | | 546 | | | 788 | |
| Equity in earnings of other minority owned stores | 2,664 | | | 2,450 | | | 1,258 | |
| $ | 41,428 | | | $ | 32,358 | | | $ | 22,361 | |
| | | | | |
Equity in earnings of certain of our joint ventures includes the amortization of the Company’s excess purchase price of $24,839 of these equity investments over its original basis. The excess basis is amortized over 39 years.
The Company provides management services to joint ventures for a fee. Management fee revenues for affiliated real estate joint ventures for the years ended December 31, 2022, 2021 and 2020 were $24,389, $17,619 and $15,657, respectively.
7. INVESTMENTS IN DEBT SECURITIES AND NOTES RECEIVABLE
Investments in debt securities and notes receivable consists of the Company's investment in mandatorily redeemable preferred stock of Jernigan Capital, Inc. ("JCAP") in connection with JCAP's acquisition by affiliates of NexPoint Advisors, L.P. ("NexPoint") and receivables due to the Company under its bridge loan program. Information about these balances is as
EXTRA SPACE STORAGE INC.
NOTES TO CONSOLIDATED FINANCIAL STATEMENTS (continued)
Amounts in thousands, except store and share data, unless otherwise stated
follows: | | | | | | | | | | | |
| December 31, 2022 | | December 31, 2021 |
| Debt securities - NexPoint Preferred Stock | $ | 300,000 | | | $ | 300,000 | |
| Notes Receivable - Bridge Loans | 491,879 | | | 279,042 | |
| Notes Receivable - Senior Mezzanine Loan, net | — | | | 102,079 | |
| Dividends and Interest Receivable | 66,170 | | | 38,066 | |
| $ | 858,049 | | | $ | 719,187 | |
| | | |
In November 2020, the Company invested $300,000 in the preferred stock of JCAP in connection with the acquisition of JCAP by affiliates of NexPoint. This investment consisted of 200,000 Series A Preferred Shares valued at a total of $200,000, and 100,000 Series B Preferred Shares valued at a total of $100,000. In December 2022, the Company completed a modification with Nexpoint Storage Partners (as successor in interest to JCAP) that exchanged the Series A and B Preferred Shares for 300,000 Series D Preferred Shares, valued at a total of $300,000. The JCAP Series D preferred stock is mandatorily redeemable after six years from the modification in December 2022, with two one-year extension options. NexPoint may redeem the Preferred Shares at any time, subject to certain prepayment penalties. The Company accounts for the JCAP preferred stock as a held to maturity debt security at amortized cost. The Series D Preferred Shares have initial dividend rates of 8.5%. If the investment is not retired after six years, the preferred dividends increase annually.
In July 2020, the Company purchased a senior mezzanine note receivable with a principal amount of $103,000. The note receivable bore interest at 5.5%, with a maturity in December 2023 and was collateralized through an equity interest in which it or its subsidiaries wholly own 62 storage facilities. The Company paid cash of $101,142 for the note receivable and accounted for the discount at amortized cost. The discount was being amortized over the term of the note receivable. In February 2022, a junior mezzanine lender exercised its right to buy the Company’s position for the full principal balance plus interest due, as a result of which the Company sold this note for a total of $103,315 in cash. The remaining unamortized discount was recognized in that quarter as interest income.
The Company provides bridge loan financing to third-party self-storage operators. These notes receivable consist of mortgage loans receivable, collateralized by self-storage properties. These notes receivable typically have a term of three years with two one-year extensions, and have variable interest rates. The Company intends to sell some of the mortgage receivables. In certain scenarios the notes may be sold at a premium or discount. When this occurs, a gain or loss is recorded at the time of sale. During the year ended December 31, 2022, the Company sold a total principal amount of $211,240 of its mortgage bridge loans receivable to third parties and closed on $529,245 in new mortgage bridge loans. There were no material gains or losses recorded for the year ended December 31, 2022.
EXTRA SPACE STORAGE INC.
NOTES TO CONSOLIDATED FINANCIAL STATEMENTS (continued)
Amounts in thousands, except store and share data, unless otherwise stated
8. DEBT
In March 2022, the Operating Partnership executed a public bond issuance by selling $400.0 million principal amount of 3.900% Senior Notes due 2029 (the "Notes Due 2029"). Interest on the Notes Due 2029 is paid semi-annually in arrears on April 1 and October 1 of each year. The Notes Due 2029 will mature on April 1, 2029, and the Operating Partnership may redeem the Notes Due 2029 at its option and sole discretion at any time prior to April 1, 2029 for cash equal to the outstanding principal amount plus the present value of the remaining scheduled interest payments, plus any accrued but unpaid interest.
In September 2021, the Operating Partnership executed a public bond issuance by selling $600.0 million principal amount of 2.350% Senior Notes due 2032 (the "Notes Due 2032"). Interest on the Notes Due 2032 is paid semi-annually in arrears on March 15 and September 15 of each year. The Notes Due 2032 will mature on March 15, 2032, and the Operating Partnership may redeem the Notes Due 2032 at its option and sole discretion at any time prior to March 15, 2032 for cash equal to the outstanding principal amount plus the present value of the remaining scheduled interest payments, plus any accrued but unpaid interest.
In May 2021, the Operating Partnership executed its initial public bond issuance by selling $450.0 million principal amount of 2.550% Senior Notes due 2031 (the "Notes Due 2031"). Interest on the Notes Due 2031 is paid semi-annually in arrears on June 1 and December 1 of each year. The Notes Due 2031 will mature on June 1, 2031, and the Operating Partnership may redeem the Notes Due 2031 at its option and sole discretion at any time prior to March 31, 2031 for cash equal to the outstanding principal amount plus the present value of the remaining scheduled interest payments, plus any accrued but unpaid interest.
The Operating Partner may redeem the Notes Due 2029, the Notes Due 2031, and/or the Notes Due in 2032 (collectively, the "Notes") in whole at any time or in part from time to time, at the Operating Partnership’s option and sole discretion, at a redemption price equal to the greater of (i) 100% of the principal amount of the notes being redeemed and (ii) a make-whole premium calculated in accordance with the indenture governing the notes, plus, in each case, accrued and unpaid interest thereon to, but not including, the applicable redemption date. Notwithstanding the foregoing, on or after the date three months prior to the maturity date of the applicable notes, the redemption price will be equal to 100% of the principal amount of the notes being redeemed, plus accrued and unpaid interest thereon to, but not including, the applicable redemption date.
Certain events are considered events of default, which may result in the accelerated maturity of the Notes, including, among other things, a default for 30 days in the payment of any installment of interest under the notes or a default in the payment of the principal amount or redemption price due with respect to the notes, when the same become due and payable.
The Notes are unsecured, and are fully and unconditionally guaranteed by the Company, ESS Holdings Business Trust I, and ESS Holdings Business Trust II (the "Guarantors," and together with the Operating Partnership, the "Obligated Group"), on a joint and several basis. The guarantee of the Notes will be a senior unsecured obligation of each Guarantor. The Guarantors have no material operations separate from the operation of the Operating Partnership and no material assets, other than their respective investments directly or indirectly in the Operating Partnership, and therefore the assets, liabilities, and results of operations of the Obligated Group are not materially different than those reported in the Company's financial statements.
EXTRA SPACE STORAGE INC.
NOTES TO CONSOLIDATED FINANCIAL STATEMENTS (continued)
Amounts in thousands, except store and share data, unless otherwise stated
The components of term debt are summarized as follows:
| | | | | | | | | | | | | | | | | | | | | | | | | | | | | |
| Term Debt | December 31, 2022 | | December 31, 2021 | | Fixed Rate | | Variable Rate (2) | | Maturity Dates |
Secured fixed-rate (1) | $ | 521,820 | | | $ | 930,830 | | | 2.55% - 4.50% | | | | July 2023 - February 2030 |
Secured variable-rate (1) | 772,604 | | | 392,679 | | | | | 5.36% - 5.80% | | August 2023 - September 2030 |
| Unsecured fixed-rate | 4,240,376 | | | 3,575,000 | | | 2.35% - 5.12% | | | | February 2024 - March 2032 |
| Unsecured variable-rate | 884,624 | | | 550,000 | | | | | 5.41% | | January 2025 - January 2028 |
| Total | 6,419,424 | | | 5,448,509 | | | | | | | |
| | | | | | | | | |
| Less: Unamortized debt issuance costs | (32,962) | | | (25,762) | | | | | | | |
| Total | $ | 6,386,462 | | | $ | 5,422,747 | | | | | | | |
| | | | | | | | | |
| (1) The loans are collateralized by mortgages on real estate assets and the assignment of rents. |
| (2) Basis rates include 30-day USD LIBOR, Term SOFR and Daily Simple SOFR |
At December 31, 2022, the terms of the Second Amended and Restated Credit Agreement dated June 22, 2021 (the "Credit Agreement") are as follows:
| | | | | | | | | | | | | | |
| | Debt Capacity | | Maturity Date |
| Revolving Credit Facility | | $ | 1,250,000 | | | June 2025 |
Tranche 1 Term Loan Facility (1) | | 400,000 | | | January 2027 |
Tranche 2 Term Loan Facility (1) | | 425,000 | | | October 2026 |
Tranche 3 Term Loan Facility (1) | | 245,000 | | | January 2025 |
Tranche 4 Term Loan Facility (1) | | 255,000 | | | June 2026 |
Tranche 5 Term Loan Facility (1) | | 425,000 | | | February 2024 |
Tranche 6 Term Loan Facility (1) | | 175,000 | | | January 2028 |
Tranche 7 Term Loan Facility (1) | | 425,000 | | | July 2029 |
| | $ | 3,600,000 | | | |
(1) The term loan amounts have been fully drawn as of December 31, 2022.
Pursuant to the terms of the Credit Agreement, the Company may request an extension of the term of the revolving credit facility for up to two additional periods of six months each, after satisfying certain conditions.
As of December 31, 2022, amounts outstanding under the revolving credit facility bore interest at floating rates, at the Company’s option, equal to either (i) Adjusted Term SOFR/Adjusted Daily Simple SOFR ("ASOFR") plus the applicable margin or (ii) the applicable base rate which is the applicable margin plus the highest of (a) 0.0%, (b) the federal funds rate plus 0.50%, (c) U.S. Bank’s prime rate or (d) the SOFR rate plus 1.00%. Per the Credit Agreement, the applicable SOFR rate margin and applicable base rate margin are based on the Company’s achieved debt rating, with the SOFR rate margin ranging from 0.7% to 1.6% per annum and the applicable base rate margin ranging from 0.00% to 0.60% per annum.
The Credit Agreement is guaranteed by the Company and is not secured by any assets of the Company. The Company's unsecured debt is subject to certain financial covenants. As of December 31, 2022, the Company was in compliance with all of its financial covenants.
In July 2022, the Company completed an accordion transaction in its credit facility, which added a $175.0 million unsecured debt tranche maturing January 2028 and a $425.0 million unsecured debt tranche maturing July 2029. The current interest rates for the tranches are ASOFR + 0.95% and ASOFR + 1.25%, respectively.
EXTRA SPACE STORAGE INC.
NOTES TO CONSOLIDATED FINANCIAL STATEMENTS (continued)
Amounts in thousands, except store and share data, unless otherwise stated
The following table summarizes the scheduled maturities of term debt, excluding available extensions, at December 31, 2022: | | | | | |
| |
| 2023 | $ | 386,684 | |
| 2024 | 425,000 | |
| 2025 | 709,899 | |
| 2026 | 808,960 | |
| 2027 | 872,884 | |
| Thereafter | 3,215,997 | |
| $ | 6,419,424 | |
All of the Company’s lines of credit are guaranteed by the Company. The following table presents information on the Company’s lines of credit, the proceeds of which are used to repay debt and for general corporate purposes, for the periods indicated:
| | | | | | | | | | | | | | | | | | | | | | | | | | | | | |
| As of December 31, 2022 | | | | |
| Revolving Lines of Credit | Amount Drawn | | Capacity | | Interest Rate | | Maturity | | Basis Rate (1) |
Credit Line 1 (2) | $ | 35,000 | | | $ | 140,000 | | | 5.7% | | 7/1/2023 | | SOFR plus 1.35% |
Credit Line 2 (3)(4) | 910,000 | | | 1,250,000 | | | 5.3% | | 6/20/2025 | | SOFR plus 0.95% |
| $ | 945,000 | | | $ | 1,390,000 | | | | | | | |
| | | | | | | | | |
| (1) Term SOFR or Daily Simple SOFR |
(2) Secured by mortgages on certain real estate assets. On January 13, 2023 the maturity date was extended to July 1, 2026 with one one-year extension available. |
(3) Unsecured. Two six-month extensions available. |
| (4) Basis Rate as of December 31, 2022. Rate is subject to change based on our investment grade rating. |
As of December 31, 2022, the Company’s percentage of fixed-rate debt to total debt was 64.7%. The weighted average interest rates of the Company’s fixed and variable-rate debt were 3.4% and 5.5%, respectively. The combined weighted average interest rate was 4.1%.
9. DERIVATIVES
The Company is exposed to certain risk arising from both its business operations and economic conditions. The Company principally manages its exposures to a wide variety of business and operational risks through management of its core business activities. The Company manages economic risks, including interest rate, liquidity, and credit risk primarily by managing the amount, sources and duration of its debt funding and the use of derivative financial instruments. Specifically, the Company enters into derivative financial instruments to manage exposures that arise from business activities that result in the receipt or payment of future known and uncertain cash amounts, the value of which are determined by interest rates. The Company’s derivative financial instruments are used to manage differences in the amount, timing and duration of the Company’s known or expected cash payments principally related to the Company’s borrowings.
Cash Flow Hedges of Interest Rate Risk
The Company’s objectives in using interest rate derivatives are to add stability to interest expense and to manage its exposure to interest rate movements. To accomplish this objective, the Company primarily uses interest rate swaps as part of its interest rate risk management strategy. Interest rate swaps designated as cash flow hedges involve the receipt of variable amounts from a counterparty in exchange for the Company making fixed-rate payments over the life of the agreements without exchange of the underlying notional amount.
The effective portion of changes in the fair value of derivatives designated and that qualify as cash flow hedges is recorded in accumulated other comprehensive income (“OCI”) and is subsequently reclassified into earnings in the period that
EXTRA SPACE STORAGE INC.
NOTES TO CONSOLIDATED FINANCIAL STATEMENTS (continued)
Amounts in thousands, except store and share data, unless otherwise stated
the hedged forecasted transaction affects earnings. A portion of these changes is excluded from accumulated other comprehensive income as it is allocated to noncontrolling interests. During the years ended December 31, 2022, 2021 and 2020, such derivatives were used to hedge the variable cash flows associated with existing variable-rate debt. During 2023, the Company estimates that $37,005 will be reclassified as a decrease to interest expense.
The following table summarizes the terms of the Company’s 19 derivative financial instruments, which have a total combined notional amount of $1,837,714 as of December 31, 2022:
| | | | | | | | | | | | | | | | | | | | | | | | | | |
| Hedge Product | | Range of Notional Amounts | | Strike | | Effective Dates | | Maturity Dates |
| Swap Agreements | | $32,014 - $220,000 | | 1.07% - 4.20% | | 2/1/2016 - 1/31/2024 | | 2/1/2023 - 10/13/2026 |
Fair Values of Derivative Instruments
The table below presents the fair value of the Company’s derivative financial instruments as well as their classification on the consolidated balance sheets: | | | | | | | | | | | |
| Asset / Liability Derivatives |
| Derivatives designated as hedging instruments: | December 31, 2022 | | December 31, 2021 |
| Other assets | $ | 54,839 | | | $ | 271 | |
| Other liabilities | $ | 73 | | | $ | 39,569 | |
Effect of Derivative Instruments
The tables below present the effect of the Company’s derivative financial instruments on the consolidated statements of operations for the periods presented. No tax effect has been presented as the derivative instruments are held by the Company:
| | | | | | | | | | | | | | | | | | | | | | | | | | | | | | | | | | | | | | |
| | | Gain recognized in OCI for the Year Ended December 31, | | Location of amounts reclassified from OCI into income | | Loss reclassified from OCI for the Year Ended December 31, |
| Type | | 2022 | | 2021 | | 2022 | | 2021 | | 2020 |
| Swap Agreements | | $ | 88,372 | | | $ | 23,580 | | | Interest expense | | $ | (7,877) | | | $ | (35,764) | | | $ | (26,794) | |
Credit-Risk-Related Contingent Features
The Company has agreements with some of its derivative counterparties that contain provisions pursuant to which, the Company could be declared in default of its derivative obligations if the Company defaults on any of its indebtedness, including default where repayment of the indebtedness has not been accelerated by the lender.
The Company also has an agreement with some of its derivative counterparties that incorporates the loan covenant provisions of the Company’s indebtedness with a lender affiliate of the derivative counterparty. Failure to comply with the loan covenant provisions would result in the Company being in default on any derivative instrument obligations covered by the agreement.
As of December 31, 2022, the fair value of derivatives in a net liability position, which includes accrued interest but excludes any adjustment for nonperformance risk, related to these agreements was $0.
EXTRA SPACE STORAGE INC.
NOTES TO CONSOLIDATED FINANCIAL STATEMENTS (continued)
Amounts in thousands, except store and share data, unless otherwise stated
10. EXCHANGEABLE SENIOR NOTES
In September 2015, the Operating Partnership issued $575,000 of its 3.125% Exchangeable Senior Notes due 2035. Costs incurred to issue the 2015 Notes were approximately $11,992, consisting primarily of a 2.0% underwriting fee. These costs were amortized as an adjustment to interest expense over five years, which represented the estimated term based on the first available redemption date, and were included in exchangeable senior notes, net, in the consolidated balance sheets. The 2015 Notes were general unsecured senior obligations of the Operating Partnership and were fully guaranteed by the Company. Interest was payable on April 1 and October 1 of each year. The Notes bore interest at 3.125% per annum and contained an exchange settlement feature, which provided that the 2015 Notes could, under certain circumstances, be exchangeable for cash (for the principal amount of the 2015 Notes) and, with respect to any excess exchange value, for cash, shares of the Company’s common stock, or a combination of cash and shares of the Company’s common stock, at the Company’s option.
The Operating Partnership could redeem the 2015 Notes at any time to preserve the Company’s status as a REIT. In addition, on or after October 5, 2020, the Operating Partnership could redeem the 2015 Notes for cash, in whole or in part, at 100% of the principal amount plus accrued and unpaid interest, upon at least 30 days but not more than 60 days prior written notice to the holders of the 2015 Notes. The holders of the 2015 Notes had the right to require the Operating Partnership to repurchase the 2015 Notes for cash, in whole or in part, on October 1 of the years 2020, 2025 and 2030, (unless the Operating Partnership had called the 2015 Notes for redemption), and upon the occurrence of certain designated events, in each case for a repurchase price equal to 100% of the principal amount of the 2015 Notes plus accrued and unpaid interest. Additionally, the 2015 Notes could have been exchanged during any calendar quarter, if the last reported sale price of the common stock of the Company was greater than or equal to 130% of the exchange price for at least 20 trading days during a period of 30 consecutive trading days ending on the last trading day of the immediately preceding calendar quarter. The Company redeemed all outstanding 2015 Notes on November 2, 2020.
GAAP requires entities with convertible debt instruments that may be settled entirely or partially in cash upon conversion to separately account for the liability and equity components of the instrument in a manner that reflects the issuer’s economic interest cost. The Company therefore accounted for the liability and equity component of the 2015 Notes separately. The equity components were included in paid-in capital in stockholders’ equity in the consolidated balance sheets, and the value of the equity components were treated as original issue discount for purposes of accounting for the debt components. The discount was amortized as interest expense over the remaining period of the debt through its first redemption date, October 1, 2020 for the 2015 Notes. The effective interest rate on the liability components of the 2015 Notes was 4.0%, which approximates the market rate of interest of similar debt without exchange features (i.e. nonconvertible debt) at the time of issuance.
The amount of interest cost recognized relating to the contractual interest rate and the amortization of the discount on the liability component for the Notes were as follows for the periods indicated: | | | | | | | | | | | | | | | | | |
| | For the Year Ended December 31, |
| | 2022 | | 2021 | | 2020 |
| Contractual interest | $ | — | | | $ | — | | | $ | 13,476 | |
| Amortization of discount | — | | | — | | | 3,675 | |
| Total interest expense recognized | $ | — | | | $ | — | | | $ | 17,151 | |
Repurchase of 2015 Notes
On October 1, 2020, the holders of $71,513 principal amount of the 2015 Notes exchanged their Notes. The Company paid cash of $71,513 for the principal amount and issued 124,819 shares of common stock with a value of $13,495 for the exchange value in excess of the principal amount. On November 2, 2020, the holders of an additional $503,432 principal amount of the 2015 Notes exchanged their Notes. The Company paid cash of $503,487 for the principal amount and issued 1,198,962 shares of common stock with a value of $138,900 for the exchange value in excess of the principal amount. Also on November 2, 2020, the Company redeemed the remaining $55 of outstanding principal amount of the 2015 Notes for cash.
The Company allocated the value of the consideration paid to repurchase the 2013 Notes and the 2015 Notes (1) to the extinguishment of the liability component and (2) to the reacquisition of the equity component. The amount allocated to the extinguishment of the liability component is equal to the fair value of that component immediately prior to extinguishment. The
EXTRA SPACE STORAGE INC.
NOTES TO CONSOLIDATED FINANCIAL STATEMENTS (continued)
Amounts in thousands, except store and share data, unless otherwise stated
difference between the consideration attributed to the extinguishment of the liability component and the sum of (a) the net carrying amount of the repurchased liability component, and (b) the related unamortized debt issuance costs, is recognized as a gain on debt extinguishment. The remaining settlement consideration is allocated to the reacquisition of the equity component of the repurchased 2013 Notes and 2015 Notes and recognized as a reduction of stockholders’ equity.
Information about the repurchases is as follows:
| | | | | | | | | | | | | | | | | |
| For the Year Ended December 31, |
| 2022 | | 2021 | | 2020 |
| Principal amount repurchased | $ | — | | | $ | — | | | $ | 575,000 | |
| | | | | |
| Amount allocated to: | | | | | |
| Extinguishment of liability component | $ | — | | | $ | — | | | $ | 575,000 | |
| Reacquisition of equity component | — | | | — | | | — | |
| Total consideration paid for repurchase | $ | — | | | $ | — | | | $ | 575,000 | |
| Exchangeable senior notes repurchased | $ | — | | | $ | — | | | $ | 575,000 | |
| Extinguishment of liability component | — | | | — | | | (575,000) | |
| Discount on exchangeable senior notes | — | | | — | | | — | |
| Related debt issuance costs | — | | | — | | | — | |
| Gain/(loss) on repurchase | $ | — | | | $ | — | | | $ | — | |
11. STOCKHOLDERS’ EQUITY
The Company’s charter provides that it can issue up to 500,000,000 shares of common stock, $0.01 par value per share and 50,000,000 shares of preferred stock, $0.01 par value per share. As of December 31, 2022, 133,921,020 shares of common stock were issued and outstanding, and no shares of preferred stock were issued or outstanding.
All holders of the Company's common stock are entitled to receive dividends and to one vote on all matters submitted to a vote of stockholders. The transfer agent and registrar for the Company’s common stock is American Stock Transfer & Trust Company.
During the year ended December 31, 2022, the Company sold no shares of common stock.
On August 9, 2021, the Company filed its $800,000 "at the market" equity program with the Securities and Exchange Commission using a shelf registration statement on Form S-3, and entered into separate equity distribution agreements with ten sales agents. No shares have been sold under the current "at the market" equity program. From January 1, 2021, through August 8, 2021, the Company sold 585,685 shares of common stock under its prior "at the market" equity program at an average sales price of $115.90 per share resulting in net proceeds of $66,617.
On March 23, 2021, the Company sold 1,600,000 shares of its common stock in a registered offering structured as a bought deal at a price of $129.13 per share resulting in net proceeds of $206,572.
On October 15, 2020, the Company's board of directors authorized a share repurchase program allowing for the repurchase of shares with an aggregate value up to $400,000. During the year ended December 31, 2022, the Company repurchased 381,786 shares at an average price of $165.03 per share, paying a total of $63,008. As of December 31, 2022, the Company had remaining authorization to repurchase shares with an aggregate value up to $336,992.
EXTRA SPACE STORAGE INC.
NOTES TO CONSOLIDATED FINANCIAL STATEMENTS (continued)
Amounts in thousands, except store and share data, unless otherwise stated
12. NONCONTROLLING INTEREST REPRESENTED BY PREFERRED OPERATING PARTNERSHIP UNITS
Classification of Noncontrolling Interests
GAAP requires a company to present ownership interests in subsidiaries held by parties other than the company in the consolidated financial statements within the equity section, but separate from the company’s equity. It also requires the amount of consolidated net income attributable to the parent and to the noncontrolling interest to be clearly identified and presented on the face of the consolidated statement of operations and requires changes in ownership interest to be accounted for similarly as equity transactions. If noncontrolling interests are determined to be redeemable, they are to be carried at their redemption value as of the balance sheet date and reported as temporary equity.
The Company has evaluated the terms of the Operating Partnership’s preferred units and classifies the noncontrolling interest represented by such preferred units as stockholders’ equity in the accompanying consolidated balance sheets. The Company will periodically evaluate individual noncontrolling interests for the ability to continue to recognize the noncontrolling amount as permanent equity in the consolidated balance sheets. Any noncontrolling interests that fail to qualify as permanent equity will be reclassified as temporary equity and adjusted to the greater of (1) the carrying amount, or (2) its redemption value as of the end of the period in which the determination is made.
At December 31, 2022 and 2021, the noncontrolling interests represented by the Preferred OP Units qualified for classification as permanent equity on the Company's consolidated balance sheets. The partnership agreement of the Operating Partnership (as amended, the "Partnership Agreement") provides for the designation and issuance of the OP Units. As of December 31, 2022 and 2021, noncontrolling interests in Preferred OP Units were presented net of notes receivable from Preferred Operating Partnership unit holders of $100,000 as of December 31, 2022 and 2021, respectively, as more fully described below. The balances for each of the specific preferred OP units as presented in the Statement of Noncontrolling Interests and Equity as of the periods indicated is as follows:
| | | | | | | | | | | |
| December 31, 2022 | | December 31, 2021 |
| Series A Units | $ | 16,498 | | | $ | 15,606 | |
| Series B Units | 33,568 | | | 38,068 | |
| Series D Units | 211,436 | | | 205,436 | |
| $ | 261,502 | | | $ | 259,110 | |
Series A Participating Redeemable Preferred Units
The Partnership Agreement provides for the designation and issuance of the Series A Units. The Series A Units have priority over all other partnership interests of the Operating Partnership with respect to distributions and liquidation.
The Series A Units were issued in June 2007. Series A Units in the amount of $101,700 bear a fixed priority return of 2.3%, and originally had a fixed liquidation value of $115,000. The remaining balance participates in distributions with, and has a liquidation value equal to, that of the common OP Units. The Series A Units are redeemable at the option of the holder, which redemption obligation may be satisfied, at the Company’s option, in cash or shares of its common stock. As a result of the redemption of 114,500 Series A Units in October 2014, the remaining fixed liquidation value was reduced to $101,700 which represents 875,480 Series A Units.
On June 25, 2007, the Operating Partnership loaned the holders of the Series A Units $100,000. The note receivable bears interest at 2.1%. The loan is secured by the borrower’s Series A Units. No future redemption of Series A Units can be made unless the loan secured by the Series A Units is also repaid. The Series A Units are shown on the balance sheet net of the $100,000 loan because the borrower under the loan is also the holder of the Series A Units.
On January 25, 2023, the remaining balance of the Series A units were redeemed for $5,000 in cash, 851,698 shares of common stock, and the repayment of the $100,000 note receivable.
EXTRA SPACE STORAGE INC.
NOTES TO CONSOLIDATED FINANCIAL STATEMENTS (continued)
Amounts in thousands, except store and share data, unless otherwise stated
Series B Redeemable Preferred Units
The Partnership Agreement provides for the designation and issuance of the Series B Units. The Series B Units rank junior to the Series A Units, on parity with the Series C Units (defined below) and Series D Units, and senior to all other partnership interests of the Operating Partnership with respect to distributions and liquidation.
The Series B Units were issued in 2013 and 2014, have been redeemed at various times, and have a liquidation value of $25.00 per unit for a current fixed liquidation value of $33,568 which represents 1,342,727 Series B Units outstanding at December 31, 2022. Holders of the Series B Units receive distributions at an annual rate of 6.0%. These distributions are cumulative. The Series B Units became redeemable at the option of the holder on the first anniversary of the date of issuance, which redemption obligations may be satisfied at the Company’s option in cash or shares of its common stock.
On August 31, 2021, 113,360 Series B Units were redeemed for 15,265 shares of common stock.
Series C Convertible Redeemable Preferred Units
The Partnership Agreement provides for the designation and issuance of the Series C Convertible Redeemable Preferred Units ("Series C Units").
The Series C Units were issued in 2013 and 2014.
In December 2014, the Operating Partnership loaned holders of the Series C Units $20,230. The note receivable, which was collateralized by the Series C Units, bears interest at 5.0% and matures on December 15, 2024. The Series C Units were shown on the balance sheet net of the loan because the borrower under the loan receivable was also the holder of the Series C Units.
In 2018, certain holders of the Series C Units converted their Series C Units into common OP Units and the remaining Series C Units were converted into common OP Units in 2019. The remaining outstanding balance of the loan receivable of $1,900 and $1,900 is shown as a reduction of the noncontrolling interests related to the OP Units as of December 31, 2022 and December 31, 2021, respectively. See footnote 13 for further discussion of noncontrolling interests.
Series D Redeemable Preferred Units
The Partnership Agreement provides for the designation and issuance of the Series D Units. The Series D Units rank junior to the Series A Units, on parity with the Series B Units and Series C Units, and senior to all other partnership interest of the Operating Partnership with respect to distributions and liquidation.
The Series D Units have a liquidation value of $25.00 per unit, for a current fixed liquidation value of $211,436 which represents 8,457,422 Series D Units outstanding at December 31, 2022. Holders of the Series D Units receive distributions at an annual rate between 3.0% and 5.0%. These distributions are cumulative. The Series D Units become redeemable at the option of the holder on the first anniversary of the date of issuance, which redemption obligation may be satisfied at the Company’s option in cash or shares of its common stock. In addition, certain of the Series D Units are exchangeable for common OP Units until the tenth anniversary of the date of issuance, with the number of common OP Units to be issued equal to $25.00 per Series D Unit, divided by the value of a share of common stock as of the exchange date.
The Series D Units have been issued at various times from 2014 to 2022. During the year ended December 31, 2022, the Operating Partnership issued a total of 88,319 Series D Units in conjunction with store acquisitions.
On January 3, 2023, 890,594 Series D units were redeemed for 154,307 shares of common stock.
EXTRA SPACE STORAGE INC.
NOTES TO CONSOLIDATED FINANCIAL STATEMENTS (continued)
Amounts in thousands, except store and share data, unless otherwise stated
13. NONCONTROLLING INTEREST IN OPERATING PARTNERSHIP AND OTHER NONCONTROLLING INTERESTS
Noncontrolling interest in Operating Partnership
The Company’s interest in its stores is held through the Operating Partnership. Between its general partner and limited partner interests, the Company held a 93.3% majority ownership interest in the Operating Partnership as of December 31, 2022. The remaining ownership interests in the Operating Partnership (including Preferred OP Units) of 6.7% are held by certain former owners of assets acquired by the Operating Partnership. As of December 31, 2022 and 2021, the noncontrolling interests in the Operating Partnership are shown on the balance sheet net of notes receivable of $1,900 and $1,900, respectively, because the borrowers under the loan receivable are also holders of OP Units (Note 12). This loan receivable bears interest at 5.0% per annum and matures on December 15, 2024.
The noncontrolling interest in the Operating Partnership represents OP Units that are not owned by the Company. OP Units are redeemable at the option of the holder, which redemption may be satisfied at the Company's option in cash based upon the fair market value of an equivalent number of shares of the Company’s common stock (based on the ten-day average trading price) at the time of the redemption, or shares of the Company's common stock on a one-for-one basis, subject to anti-dilution adjustments provided in the Operating Partnership agreement. As of December 31, 2022, the ten-day average closing stock price was $147.10 and there were 7,214,649 OP Units outstanding. Assuming that all of the OP Unit holders exercised their right to redeem all of their OP Units on December 31, 2022 and the Company elected to pay the OP Unit holders cash, the Company would have paid $1,061,275 in cash consideration to redeem the units.
OP Unit activity is summarized as follows for the periods presented: | | | | | | | | | | | |
| For the Year Ended December 31, |
| 2022 | 2021 | 2020 |
| OP Units redeemed for common stock | — | | 165,652 | | 123,993 | |
| OP Units redeemed for cash | 24,824 | | 4,500 | | — | |
| Cash paid for OP Units redeemed | $ | 4,617 | | $ | 788 | | $ | — | |
| OP Units issued in conjunction with business combination and acquisitions | 711,037 | | 897,803 | | — | |
| Value of OP Units issued in conjunction with business combination and acquisitions | $ | 141,000 | | $ | 188,319 | | $ | — | |
GAAP requires a company to present ownership interests in subsidiaries held by parties other than the company in the consolidated financial statements within the equity section but separate from the company’s equity. It also requires the amount of consolidated net income attributable to the parent and to the noncontrolling interest to be clearly identified and presented on the face of the consolidated statement of operations and requires changes in ownership interest to be accounted for similarly as equity transactions. If noncontrolling interests are determined to be redeemable, they are to be carried at their redemption value as of the balance sheet date and reported as temporary equity.
The Company has evaluated the terms of the common OP Units and classifies the noncontrolling interest represented by the common OP Units as stockholders’ equity in the accompanying consolidated balance sheets. The Company will periodically evaluate individual noncontrolling interests for the ability to continue to recognize the noncontrolling amount as permanent equity in the consolidated balance sheets. Any noncontrolling interests that fail to qualify as permanent equity will be reclassified as temporary equity and adjusted to the greater of (1) the carrying amount, or (2) its redemption value as of the end of the period in which the determination is made.
Other Noncontrolling Interests
Other noncontrolling interests represent the ownership interest of partners in five consolidated joint ventures as of December 31, 2022. One joint venture owns one operating store in Florida and the others own four properties all under development. The voting interests of the partners are 10% or less.
EXTRA SPACE STORAGE INC.
NOTES TO CONSOLIDATED FINANCIAL STATEMENTS (continued)
Amounts in thousands, except store and share data, unless otherwise stated
14. LEASES
Lessee Accounting
The Company accounts for leases under ASC 842, "Leases." Right-of-use assets associated with operating leases are included in “Real estate assets - operating lease right-of-use assets” and operating lease liabilities are included in “Operating lease liabilities” on the Company's consolidated balance sheets. Right-of-use assets associated with finance leases are included in "Real estate assets, net" and finance lease liabilities are included in "Other liabilities" on the Company's consolidated balance sheets.
During the year ended December 31, 2022, the Company recorded new finance lease right-of-use assets and finance lease liabilities totaling $6,823 associated with the acquisition of two stores with land leases.
The Company is lessee under several types of lease agreements. Generally, these leases fall into the following categories:
•Leases of real estate at 60 stores classified as wholly-owned or in consolidated joint ventures. These leases generally have original lease terms between 10-99 years. Under these leases, the Company typically has the option to extend the lease term for additional terms of 5-35 years.
•Leases of its corporate offices and call center. These leases have original lease terms between five and 14 years, with no extension options. In 2021 the Company modified and extended the lease of its corporate offices to add additional space and extend the lease until 2034.
•Leases of 15 regional offices. These leases have original lease terms between two and five years. The Company has the option on certain of these leases to extend the lease term for up to three additional years.
•Leases of small district offices. These leases generally have terms of 12 months or less. The Company has made an election to account for these under the short-term lease exception outlined under ASC 842. Therefore, no lease assets or liabilities are recorded related to these leases.
The Company has included lease extension options in the lease term for calculations of its right-of-use assets and liabilities related to the real estate asset leases at its stores when it is reasonably certain that the Company plans to extend the lease terms as the options arise.
Several of the leases of real estate at the Company’s stores include escalation clauses based on an index or rate, such as the Consumer Price Index (CPI). The Company included these lease payments in its calculations of right-of-use assets and liabilities based on the prevailing index or rate as of the adoption date. The Company will recognize changes to these variable lease payments in earnings in the period of change.
One of the real estate leases includes variable lease payments that are based upon a percentage of gross revenues. Certain other leases include additional variable payments relating to a percentage of sales in excess of a specified amount, common area maintenance, property taxes, and similar items. These payments are variable lease payments that do not depend on an index or rate and are excluded from the measurement of the lease liabilities and right-of-use-assets for these leases. The Company will recognize costs from these variable lease payments in the period in which the obligation for those payments is incurred.
As the Company’s leases do not provide an implicit rate, the Company uses its incremental borrowing rate based on the information available surrounding the Company’s unsecured borrowing rates and implied secured spread at the lease commencement date in determining the present value of lease payments. These discount rates vary depending on the term of the specific leases.
EXTRA SPACE STORAGE INC.
NOTES TO CONSOLIDATED FINANCIAL STATEMENTS (continued)
Amounts in thousands, except store and share data, unless otherwise stated
Following is information on our total lease costs as of the period indicated: | | | | | | | | | | | |
| For the Year Ended December 31, |
| 2022 | | 2021 |
| | | |
| Finance lease cost: | | | |
| Amortization of finance lease right-of-use assets | $ | 3,751 | | | $ | 3,049 | |
| Interest expense related to finance lease liabilities | 4,018 | | | 2,812 | |
| Operating lease cost | 32,182 | | | 29,258 | |
| Variable lease cost | 11,287 | | | 8,100 | |
| Short-term lease cost | 32 | | | 51 | |
| Total lease cost | $ | 51,270 | | | $ | 43,270 | |
| | | |
| | | |
| Cash paid for amounts included in the measurement of lease liabilities | | | |
| Operating cash outflows for finance lease payments | $ | 4,018 | | | $ | 2,812 | |
| Operating cash outflows for operating lease payments | 25,384 | | | 23,961 | |
| | | |
| Total cash flows for lease liability measurement | $ | 29,402 | | | $ | 26,773 | |
| | | |
| Right-of-use assets obtained in exchange for new operating lease liabilities | $ | 16,298 | | | $ | 6,655 | |
| Right-of-use assets obtained in exchange for new finance lease liabilities | $ | 6,823 | | | $ | 67,992 | |
| | | |
| Weighted average remaining lease term - finance leases (years) | 54.16 | | 54.97 |
| Weighted average remaining lease term - operating leases (years) | 20.03 | | 21.25 |
| Weighted average discount rate - finance leases | 3.31 | % | | 3.18 | % |
| Weighted average discount rate - operating leases | 3.65 | % | | 3.63 | % |
The following table presents information about the Company’s undiscounted cash flows on an annual basis for operating and finance leases, including a reconciliation of the undiscounted cash flows to the finance lease and operating lease liabilities recognized in the Company’s consolidated balance sheets: | | | | | | | | | | | | | | | | | |
| Operating | | Finance | | Total |
| 2023 | $ | 30,716 | | | $ | 6,433 | | | $ | 37,149 | |
| 2024 | 30,584 | | | 6,542 | | | 37,126 | |
| 2025 | 30,344 | | | 6,571 | | | 36,915 | |
| 2026 | 30,598 | | | 6,715 | | | 37,313 | |
| 2027 | 31,063 | | | 6,842 | | | 37,905 | |
| Thereafter | 143,651 | | | 360,936 | | | 504,587 | |
| Total | $ | 296,956 | | | $ | 394,039 | | | $ | 690,995 | |
| Present value adjustments | (67,921) | | | (248,486) | | | (316,407) | |
| Lease liabilities | $ | 229,035 | | | $ | 145,553 | | | $ | 374,588 | |
EXTRA SPACE STORAGE INC.
NOTES TO CONSOLIDATED FINANCIAL STATEMENTS (continued)
Amounts in thousands, except store and share data, unless otherwise stated
Lessor Accounting
The Company's property rental revenue is primarily related to rents received from tenants at its operating stores. The Company's leases with its self-storage tenants are generally on month-to-month terms, include automatic monthly renewals, allow flexibility to increase rental rates over time as market conditions permit, and provide for the collection of contingent fees such as late fees. These leases do not include any terms or conditions that allow the tenants to purchase the leased space. All self-storage leases for which the Company acts as lessor have been classified as operating leases. The real estate assets related to the Company's stores are included in "Real estate assets, net" on the Company's condensed consolidated balance sheets and are presented at historical cost less accumulated depreciation and impairment, if any. Rental income related to these operating leases is included in "Property rental" revenue on the Company's condensed consolidated statements of operations, and is recognized each month during the month-to-month terms at the rental rate in place during each month.
15. STOCK-BASED COMPENSATION
As of December 31, 2022, 784,635 shares were available for issuance under the Company’s 2015 Incentive Award Plan (the “Plan”).
Options are exercisable once vested. Options are exercisable at such times and subject to such terms as determined by the Compensation Committee, but under no circumstances may be exercised if such exercise would cause a violation of the ownership limit in the Company’s charter. Options expire 10 years from the date of grant.
Also as defined under the terms of the Plan, restricted stock grants may be awarded. The stock grants are subject to a vesting period over which the restrictions are released and the stock certificates are given to the grantee. During the vesting period, the grantee is not permitted to sell, transfer, pledge, encumber or assign shares of restricted stock granted under the Plan; however, the grantee has the ability to vote the shares and receive nonforfeitable dividends paid on shares. Unless otherwise determined by the Compensation Committee at the time of grant, the forfeiture and transfer restrictions on the shares lapse over a one-year period or a four-year period beginning on the date of grant. For actions taken prior to July 2020, references to the Compensation Committee refer to its predecessor, the CNG Committee; the Board split the CNG Committee into two committees, the Compensation Committee and the Nominating and Governance Committee, effective July 1, 2020.
Option Grants
A summary of stock option activity is as follows: | | | | | | | | | | | | | | | | | | | | | | | |
| Options | Number of Shares | | Weighted Average Exercise Price | | Weighted Average Remaining Contractual Life (Years) | | Aggregate Intrinsic Value as of December 31, 2022 |
| | | | | | | |
| Outstanding at December 31, 2019 | 206,524 | | | $ | 48.88 | | | | | |
| | | | | | | |
| Exercised | (134,930) | | | 35.26 | | | | | |
| | | | | | | |
| Outstanding at December 31, 2020 | 71,594 | | | $ | 74.54 | | | | | |
| | | | | | | |
| Exercised | (62,322) | | | 73.36 | | | | | |
| | | | | | | |
| Outstanding at December 31, 2021 | 9,272 | | | 82.47 | | | | | |
| | | | | | | |
| Exercised | — | | | — | | | | | |
| | | | | | | |
| Outstanding at December 31, 2022 | 9,272 | | | $ | 82.47 | | | 2.98 | | $600 |
| | | | | | | |
| Vested | 9,272 | | | $ | 82.47 | | | 2.98 | | $600 |
| Ending Exercisable | 9,272 | | | $ | 82.47 | | | 2.98 | | $600 |
The aggregate intrinsic value in the table above represents the total value (the difference between the Company’s closing stock price on the last trading day of 2022 and the exercise price, multiplied by the number of in-the-money options) that would have been received by the option holders had all option holders exercised their options on December 31, 2022. The amount of
EXTRA SPACE STORAGE INC.
NOTES TO CONSOLIDATED FINANCIAL STATEMENTS (continued)
Amounts in thousands, except store and share data, unless otherwise stated
aggregate intrinsic value will change based on the fair market value of the Company’s stock. The total intrinsic value of options exercised for the years ended December 31, 2022, 2021 and 2020 was $0, $3,925 and $10,016, respectively.
There have been no options granted since 2016. The fair value of each option grant was estimated on the date of grant using the Black-Scholes option-pricing model. The Black-Scholes model incorporates assumptions to value stock-based awards. The risk-free rate is based on the U.S. Treasury yield curve in effect at the time of the grant for the estimated life of the option. The Company uses actual historical data to calculate the expected price volatility, dividend yield and average expected term. The forfeiture rate, which is estimated at a weighted-average of 4.6% of unvested options outstanding as of December 31, 2022, is adjusted periodically based on the extent to which actual forfeitures differ, or are expected to differ, from the previous estimates.
A summary of stock options outstanding and exercisable as of December 31, 2022, is as follows:
| | | | | | | | | | | | | | | | | | | | | | | | | | | | | | | | |
| | | Options Outstanding | | Options Exercisable |
| Exercise Price | | Shares | | Weighted Average Remaining Contractual Life | | Weighted Average Exercise Price | | Shares | | Weighted Average Exercise Price |
$65.36 - $65.36 | | 1,582 | | | 2.15 | | $ | 65.36 | | | 1,582 | | | $ | 65.36 | |
$85.99 - $85.99 | | 7,690 | | | 3.15 | | 85.99 | | | 7,690 | | | 85.99 | |
| | | | | | | | | | |
| | | | | | | | | | |
| | | | | | | | | | |
| | | | | | | | | | |
The Company recorded compensation expense relating to outstanding options of $0, $0 and $27 in general and administrative expense for the years ended December 31, 2022, 2021 and 2020, respectively. Net proceeds received for the years ended December 31, 2022, 2021 and 2020, related to option exercises was $0, $4,572 and $4,759, respectively. At December 31, 2022, there was no unrecognized compensation expense related to non-vested stock options under the Plan.
Common Stock Granted to Employees and Directors
The Company recorded $12,086, $9,260 and $9,244 of expense in general and administrative expense in its statement of operations related to restricted stock awards granted to employees and directors for the years ended December 31, 2022, 2021 and 2020, respectively. The forfeiture rate, which is estimated at a weighted-average of 10.0% of unvested awards outstanding as of December 31, 2022, is adjusted periodically based on the extent to which actual forfeitures differ, or are expected to differ, from the previous estimates. At December 31, 2022 there was $20,465 of total unrecognized compensation expense related to non-vested restricted stock awards under the Plan. That cost is expected to be recognized over a weighted-average period of 2.22 years. The fair value of common stock awards is determined based on the closing trading price of the Company’s common stock on the grant date.
EXTRA SPACE STORAGE INC.
NOTES TO CONSOLIDATED FINANCIAL STATEMENTS (continued)
Amounts in thousands, except store and share data, unless otherwise stated
A summary of the Company’s employee and director share grant activity is as follows: | | | | | | | | | | | |
| Restricted Stock Grants | Shares | | Weighted-Average Grant-Date Fair Value |
| Unreleased at December 31, 2019 | 212,608 | | | $ | 91.62 | |
| Granted | 95,671 | | | 98.81 | |
| Released | (94,164) | | | 89.43 | |
| Cancelled | (5,083) | | | 93.16 | |
| Unreleased at December 31, 2020 | 209,032 | | | $ | 95.86 | |
| Granted | 99,802 | | | 132.75 | |
| Released | (96,248) | | | 91.65 | |
| Cancelled | (12,808) | | | 113.89 | |
| Unreleased at December 31, 2021 | 199,778 | | | $ | 115.16 | |
| Granted | 105,677 | | | 201.12 | |
| Released | (86,781) | | | 112.31 | |
| Cancelled | (10,614) | | | 147.03 | |
| Unreleased at December 31, 2022 | 208,060 | | | $ | 158.38 | |
Performance-based Stock Units
The performance-based stock units (the "PSUs") granted to executives represent the right to earn shares of the Company's common stock. These awards have two financial performance components: (1) the Company's core FFO performance ("FFO Target"), and (2) the Company's total stockholder return relative to the performance of a defined group of peers ("TSR Target"). Each of these performance components are weighted 50% and are measured over the performance period, which is defined as the three-year period ending December 31 from the year of grant. At the end of the performance period, the financial performance components are reviewed to determine the number of shares actually granted to executives, which can be as low as zero shares and up to a maximum of two shares issued for each PSU. A summary of the PSU activity is as follows:
| | | | | | | | | | | | | | |
| Performance-Based Stock Units | | Units | | Weighted-Average Grant-Date Fair Value |
| Unvested at December 31, 2019 | | 108,140 | | | $ | 95.94 | |
| Granted | | 45,242 | | | 129.38 | |
| Released | | (30,071) | | | $ | 112.16 | |
| Unvested at December 31, 2020 | | 123,311 | | | $ | 104.25 | |
| Granted | | 40,832 | | | 138.04 | |
| Released | | (28,735) | | | $ | 117.19 | |
| Unvested at December 31, 2021 | | 135,408 | | | $ | 111.69 | |
| Granted | | 61,085 | | | 223.96 | |
| Released | | (49,334) | | | $ | 194.21 | |
| Unvested at December 31, 2022 | | 147,159 | | | $ | 130.63 | |
EXTRA SPACE STORAGE INC.
NOTES TO CONSOLIDATED FINANCIAL STATEMENTS (continued)
Amounts in thousands, except store and share data, unless otherwise stated
The Company recorded $9,299, $8,043 and $7,048 of expense in general and administrative expense in its statement of operations related to PSUs granted to employees for the years ended December 31, 2022, 2021 and 2020, respectively. The Company estimated the fair value of the PSUs as of the grant date, using the closing trading price of the Company's common stock on the grant date to value the FFO Target portion. A Monte Carlo simulation model was used to calculate the fair value of the TSR Target portion of the PSUs, using the following assumptions: | | | | | | | | | | | | | | | | | | | | |
| | For the Year Ended December 31, |
| | 2022 | | 2021 | | 2020 |
| Intrinsic value | | $21,659 | | $30,701 | | $12,266 |
| Risk-free rate | | 1.8% | | 0.22% | | 1.42% |
| Volatility | | 29.3% | | 28.5% | | 18.4% |
| Expected term (in years) | | 2.9 | | 2.9 | | 2.9 |
| Dividend yield | | —% | | —% | | —% |
| Unrecognized compensation cost | | $13,241 | | $8,859 | | $6,406 |
| Term over which compensation cost recognized (in years) | | 3 | | 3 | | 3 |
Under the terms of the PSUs, dividends for the entire measurement period are paid in cash when the shares are released, so a dividend yield of zero was used. The valuation model applied in this calculation utilizes subjective assumptions that could potentially change over time, including the probabilities associated with achieving the FFO Targets (categorized within Level 3 of the fair value hierarchy). Therefore, the amount of unrecognized compensation expense at December 31, 2022 noted above does not necessarily represent the expense that will ultimately be realized by the Company in the statement of operations.
16. EMPLOYEE BENEFIT PLAN
The Company has a retirement savings plan under Section 401(k) of the Internal Revenue Code under which eligible employees can contribute up to 60% of their annual salary, subject to a statutory prescribed annual limit. For the years ended December 31, 2022, 2021 and 2020, the Company made matching contributions to the plan of $5,169, $4,239, and $3,980 respectively, based on 100% of the first 3% and up to 50% of the next 2% of an employee’s compensation.
17. INCOME TAXES
As a REIT, the Company is generally not subject to U.S. federal income tax with respect to that portion of its income which is distributed annually to its stockholders. However, the Company has elected to treat certain of its corporate subsidiaries, including Extra Space Management, Inc., as a TRS. In general, a TRS may perform additional services for tenants and generally may engage in any real estate or non-real estate related business. A TRS is subject to U.S. federal corporate income tax and may be subject to state and local income taxes. The Company accounts for income taxes in accordance with the provisions of ASC 740, “Income Taxes.” Deferred tax assets and liabilities are determined based on differences between financial reporting and tax bases of assets and liabilities. The Company has elected to use the Tax-Law-Ordering approach to determine when excess tax benefits will be realized.
On August 16, 2022, President Biden signed into law the Inflation Reduction Act (“IRA”). The provisions include the new Corporate Alternative Minimum Tax (“CAMT”), an excise tax on stock buybacks, and significant tax incentives for energy and climate initiatives, and all of these provisions are effective for tax year 2023. The Company has evaluated the impact of these provisions and does not expect the enactment of these provisions to have a material impact on the Company's consolidated financial statements.
EXTRA SPACE STORAGE INC.
NOTES TO CONSOLIDATED FINANCIAL STATEMENTS (continued)
Amounts in thousands, except store and share data, unless otherwise stated
The income tax provision for the years ended December 31, 2022, 2021 and 2020, is comprised of the following components: | | | | | | | | | | | | | | | | | |
| | For the Year Ended December 31, 2022 |
| | Federal | | State | | Total |
| Current expense | $ | 20,592 | | | $ | 4,546 | | | $ | 25,138 | |
| Tax credits/true-up | (6,071) | | | 31 | | | (6,040) | |
| Change in deferred expense/(benefit) | 1,909 | | | (82) | | | 1,827 | |
| Total tax expense | $ | 16,430 | | | $ | 4,495 | | | $ | 20,925 | |
| | | | | | | | | | | | | | | | | |
| | For the Year Ended December 31, 2021 |
| | Federal | | State | | Total |
| Current expense | $ | 21,017 | | | $ | 3,520 | | | $ | 24,537 | |
| Tax credits/true-up | (4,979) | | | (138) | | | (5,117) | |
| Change in deferred expense | 818 | | | 86 | | | 904 | |
| Total tax expense | $ | 16,856 | | | $ | 3,468 | | | $ | 20,324 | |
| | | | | | | | | | | | | | | | | |
| | For the Year Ended December 31, 2020 |
| | Federal | | State | | Total |
| Current expense | $ | 15,553 | | | $ | 3,347 | | | $ | 18,900 | |
| Tax credits/true-up | (5,610) | | | (135) | | | (5,745) | |
| Change in deferred benefit | 594 | | | 61 | | | 655 | |
| Total tax expense | $ | 10,537 | | | $ | 3,273 | | | $ | 13,810 | |
A reconciliation of the statutory income tax provisions to the effective income tax provisions for the periods indicated is as follows: | | | | | | | | | | | | | | | | | | | | | | | | | | | | | | | | | | | |
| | For the Year Ended December 31, |
| | 2022 | | 2021 | | 2020 |
| Expected tax at statutory rate | $ | 197,887 | | | 21.0 | % | | $ | 188,600 | | | 21.0 | % | | $ | 111,760 | | | 21.0 | % |
| Non-taxable REIT income | (172,966) | | | (18.4) | % | | (166,137) | | | (18.5) | % | | (94,270) | | | (17.7) | % |
| State and local tax expense - net of federal benefit | 4,160 | | | 0.4 | % | | 3,259 | | | 0.4 | % | | 3,075 | | | 0.6 | % |
| Change in valuation allowance | (1,093) | | | (0.1) | % | | (1,061) | | | (0.1) | % | | (363) | | | (0.1) | % |
| Tax credits/true-up | (6,040) | | | (0.6) | % | | (5,117) | | | (0.6) | % | | (5,745) | | | (1.1) | % |
| | | | | | | | | | | |
| Miscellaneous | (1,023) | | | (0.1) | % | | 780 | | | 0.1 | % | | (647) | | | (0.1) | % |
| Total provision | $ | 20,925 | | | 2.2 | % | | $ | 20,324 | | | 2.3 | % | | $ | 13,810 | | | 2.6 | % |
EXTRA SPACE STORAGE INC.
NOTES TO CONSOLIDATED FINANCIAL STATEMENTS (continued)
Amounts in thousands, except store and share data, unless otherwise stated
The major sources of temporary differences stated at their deferred tax effects are as follows: | | | | | | | | | | | |
| December 31, 2022 | | December 31, 2021 |
| Deferred tax liabilities: | | | |
| Fixed assets | $ | (32,551) | | | $ | (30,499) | |
| Operating and Finance lease right-of-use assets | (6,610) | | | (6,016) | |
| Other | (48) | | | (61) | |
| State deferred taxes | (3,607) | | | (3,842) | |
| Total deferred tax liabilities | (42,816) | | | (40,418) | |
| | | |
| Deferred tax assets: | | | |
| Captive insurance subsidiary | 335 | | | 396 | |
| Accrued liabilities | 2,541 | | | 2,383 | |
| Stock compensation | 3,467 | | | 3,076 | |
| | | |
| Operating and Finance lease liabilities | 8,418 | | | 7,936 | |
| | | |
| Other | 48 | | | 916 | |
| State deferred taxes | 5,232 | | | 6,548 | |
| Total deferred tax assets | 20,041 | | | 21,255 | |
| | | |
| Valuation allowance | (1,148) | | | (2,241) | |
| | | |
| Net deferred income tax liabilities | $ | (23,923) | | | $ | (21,404) | |
The state income tax net operating losses expire between 2023 and 2042. The valuation allowance is associated with the state income tax net operating losses. The tax years 2018 through 2021 remain open related to the state returns, and 2019 through 2021 for the federal returns.
18. SEGMENT INFORMATION
The Company’s segment disclosures present the measure used by the chief operating decision makers ("CODMs") for purposes of assessing each segment’s performance. The Company’s CODMs are comprised of several members of its executive management team who use net operating income ("NOI") to assess the performance of the business for the Company’s reportable operating segments. The Company’s segments are comprised of two reportable segments: (1) self-storage operations and (2) tenant reinsurance. NOI for self-storage operations represents total property revenue less direct property operating expenses. NOI for tenant reinsurance represents tenant reinsurance revenues less tenant reinsurance expense.
The self-storage operations activities include rental operations of wholly-owned stores and Bargold. The Company's consolidated revenues equal total segment revenues plus property management fees and other income. Tenant reinsurance activities include the reinsurance of risks relating to the loss of goods stored by tenants in the stores operated by the Company. Excluded from segment revenues and net operating income is property management fees and other income.
For all periods presented, substantially all real estate assets, intangible assets, other assets, and accrued and other liabilities are associated with the self-storage operations segment. Financial information for the Company’s business segments is set forth below:
EXTRA SPACE STORAGE INC.
NOTES TO CONSOLIDATED FINANCIAL STATEMENTS (continued)
Amounts in thousands, except store and share data, unless otherwise stated
| | | | | | | | | | | | | | | | | |
| Year Ended December 31, |
| 2022 | | 2021 | | 2020 |
| Revenues: | | | | | |
| Self-Storage Operations | $ | 1,654,735 | | | $ | 1,340,990 | | | $ | 1,157,522 | |
| Tenant Reinsurance | 185,531 | | | 170,108 | | | 146,561 | |
| Total segment revenues | $ | 1,840,266 | | | $ | 1,511,098 | | | $ | 1,304,083 | |
| | | | | |
| Operating expenses: | | | | | |
| Self-Storage Operations | $ | 435,342 | | | $ | 368,608 | | | $ | 360,615 | |
| Tenant Reinsurance | 33,560 | | | 29,488 | | | 26,494 | |
| Total segment operating expenses | $ | 468,902 | | | $ | 398,096 | | | $ | 387,109 | |
| | | | | |
| Net operating income: | | | | | |
| Self-Storage Operations | $ | 1,219,393 | | | $ | 972,382 | | | $ | 796,907 | |
| Tenant Reinsurance | 151,971 | | | 140,620 | | | 120,067 | |
| Total segment net operating income: | $ | 1,371,364 | | | $ | 1,113,002 | | | $ | 916,974 | |
| | | | | |
| Total segment net operating income | $ | 1,371,364 | | | $ | 1,113,002 | | | $ | 916,974 | |
| Other components of net income: | | | | | |
| Property management fees and other income | 83,904 | | | 66,264 | | | 52,129 | |
| Transaction related costs | (1,548) | | | — | | | — | |
| General and administrative expense | (129,251) | | | (102,194) | | | (96,594) | |
| Depreciation and amortization expense | (288,316) | | | (241,879) | | | (224,444) | |
| Gain on real estate transactions | 14,249 | | | 140,760 | | | 18,075 | |
| | | | | |
| Interest expense | (219,171) | | | (166,183) | | | (168,626) | |
| Non-cash interest expense related to amortization of discount on equity component of exchangeable senior notes | — | | | — | | | (3,675) | |
| Interest income | 69,422 | | | 49,703 | | | 15,192 | |
| | | | | |
| Equity in earnings and dividend income from unconsolidated real estate entities | 41,428 | | | 32,358 | | | 22,361 | |
| Equity in earnings of unconsolidated real estate ventures - gain on sale of real estate assets | — | | | 6,251 | | | — | |
| Income tax expense | (20,925) | | | (20,324) | | | (13,810) | |
| Net income | $ | 921,156 | | | $ | 877,758 | | | $ | 517,582 | |
19. COMMITMENTS AND CONTINGENCIES
As of December 31, 2022, the Company was under agreement to acquire 12 stores at a total purchase price of $156,678. Ten stores are scheduled to close in 2023 and two are scheduled to close in 2024. Additionally, the Company is under agreement to acquire seven stores in 2023 with joint venture partners, for a total investment of $26,002.
The Company is involved in various legal proceedings and is subject to various claims and complaints arising in the ordinary course of business. Because litigation is inherently unpredictable, the outcome of these matters cannot presently be determined with any degree of certainty. In accordance with applicable accounting guidance, management establishes an accrued liability for litigation when those matters present loss contingencies that are both probable and reasonably estimable. In such cases, there may be an exposure to loss in excess of any amounts accrued. The estimated loss, if any, is based upon currently available information and is subject to significant judgment, a variety of assumptions, and known and unknown uncertainties. The Company could in the future incur judgments or enter into settlements of claims that could have a material
EXTRA SPACE STORAGE INC.
NOTES TO CONSOLIDATED FINANCIAL STATEMENTS (continued)
Amounts in thousands, except store and share data, unless otherwise stated
adverse effect on its results of operations in any particular period, notwithstanding the fact that the Company is currently vigorously defending any legal proceedings against it. As of December 31, 2022, the Company was involved in various legal proceedings and was subject to various claims and complaints arising in the ordinary course of business. In the opinion of management, such litigation, claims and complaints are not expected to have a material adverse effect on the Company’s financial condition or results of operations.
Although there can be no assurance, the Company is not aware of any material environmental liability, for which it believes it will be ultimately responsible, that could have a material adverse effect on its financial condition or results of operations. However, changes in applicable environmental laws and regulations, the uses and conditions of properties in the vicinity of the Company’s properties, the activities of its tenants and other environmental conditions of which the Company is unaware with respect to its properties could result in future material environmental liabilities.
Extra Space Storage Inc.
Schedule III
Real Estate and Accumulated Depreciation
(Dollars in thousands)
As of December 31, 2022
| | | | | | | | | | | | | | | | | | | | | | | | | | | | | |
| | | | Building and Improvements Initial Cost | Adjustments and Costs to Land and Building Subsequent to Acquisition | Gross carrying amount at December 31, 2022 | |
| Self - Storage Facilities by State: | Store Count | | Land Initial Cost | | Building and Improvements | | Accumulated Depreciation |
| Debt | Land | Total |
| AL | 9 | $ | 5,687 | | $ | 12,759 | | $ | 78,243 | | $ | 4,164 | | $ | 12,759 | | $ | 82,407 | | $ | 95,166 | | $ | 12,590 | |
| AZ | 25 | 23,676 | | 37,192 | | 150,772 | | 12,588 | | 37,190 | | 163,362 | | 200,552 | | 36,053 | |
| CA | 177 | 334,247 | | 665,423 | | 1,394,380 | | 199,150 | | 663,569 | | 1,595,384 | | 2,258,953 | | 379,484 | |
| CO | 17 | 28,137 | | 17,224 | | 81,144 | | 18,733 | | 17,942 | | 99,159 | | 117,101 | | 28,713 | |
| CT | 7 | 6,609 | | 9,789 | | 61,688 | | 5,631 | | 9,789 | | 67,319 | | 77,108 | | 12,866 | |
| FL | 112 | 170,965 | | 203,643 | | 869,142 | | 102,902 | | 205,335 | | 970,352 | | 1,175,687 | | 189,822 | |
| GA | 67 | 74,374 | | 89,898 | | 455,894 | | 42,551 | | 89,882 | | 498,461 | | 588,343 | | 100,924 | |
| HI | 14 | — | | 28,537 | | 160,978 | | 14,085 | | 28,537 | | 175,063 | | 203,600 | | 38,133 | |
| ID | 2 | — | | 4,047 | | 25,235 | | 20 | | 4,047 | | 25,255 | | 29,302 | | 162 | |
| IL | 60 | 16,627 | | 61,580 | | 344,755 | | 38,447 | | 61,033 | | 383,749 | | 444,782 | | 62,487 | |
| IN | 91 | — | | 64,531 | | 494,469 | | 8,141 | | 64,528 | | 502,613 | | 567,141 | | 20,388 | |
| KS | 1 | — | | 366 | | 1,897 | | 1,123 | | 366 | | 3,020 | | 3,386 | | 1,442 | |
| KY | 13 | 31,483 | | 8,531 | | 77,872 | | 19,485 | | 9,303 | | 96,585 | | 105,888 | | 18,590 | |
| LA | 5 | — | | 10,005 | | 51,934 | | 5,144 | | 10,006 | | 57,077 | | 67,083 | | 6,501 | |
| MA | 47 | 33,948 | | 77,617 | | 276,254 | | 60,272 | | 77,798 | | 336,345 | | 414,143 | | 110,133 | |
| MD | 35 | 77,135 | | 109,414 | | 345,585 | | 33,514 | | 108,822 | | 379,690 | | 488,512 | | 99,014 | |
| MI | 8 | 5,486 | | 10,900 | | 63,388 | | 5,498 | | 10,900 | | 68,886 | | 79,786 | | 11,008 | |
| MN | 7 | — | | 9,696 | | 74,960 | | 6,537 | | 9,696 | | 81,497 | | 91,193 | | 7,755 | |
| MO | 6 | — | | 5,633 | | 34,252 | | 7,499 | | 5,591 | | 41,793 | | 47,384 | | 8,587 | |
| MS | 3 | — | | 2,914 | | 29,630 | | 1,410 | | 2,914 | | 31,040 | | 33,954 | | 4,105 | |
| NC | 23 | — | | 38,463 | | 150,475 | | 12,017 | | 38,461 | | 162,494 | | 200,955 | | 22,883 | |
| NH | 2 | — | | 754 | | 4,054 | | 1,401 | | 817 | | 5,392 | | 6,209 | | 2,881 | |
| NJ | 64 | 109,010 | | 142,724 | | 651,442 | | 57,849 | | 145,950 | | 706,065 | | 852,015 | | 184,072 | |
| NM | 11 | 18,648 | | 31,826 | | 68,779 | | 5,978 | | 31,826 | | 74,758 | | 106,584 | | 14,760 | |
| NV | 14 | 30,597 | | 15,252 | | 74,376 | | 7,085 | | 15,252 | | 81,461 | | 96,713 | | 17,259 | |
| NY | 28 | 13,807 | | 121,945 | | 237,795 | | 46,207 | | 122,680 | | 283,267 | | 405,947 | | 85,218 | |
| OH | 24 | 11,374 | | 19,973 | | 77,180 | | 10,995 | | 19,973 | | 88,175 | | 108,148 | | 18,509 | |
| OK | 1 | — | | 721 | | 6,125 | | — | | 721 | | 6,125 | | 6,846 | | 65 | |
| OR | 8 | 16,431 | | 15,066 | | 68,044 | | 2,617 | | 15,066 | | 70,661 | | 85,727 | | 12,199 | |
| PA | 21 | 10,894 | | 39,704 | | 203,360 | | 17,340 | | 39,032 | | 221,371 | | 260,403 | | 38,174 | |
| RI | 2 | 3,835 | | 3,191 | | 6,926 | | 1,550 | | 3,191 | | 8,476 | | 11,667 | | 3,729 | |
| SC | 23 | 27,850 | | 36,617 | | 148,900 | | 12,120 | | 36,618 | | 161,019 | | 197,637 | | 33,901 | |
| TN | 22 | 44,489 | | 35,981 | | 151,674 | | 13,587 | | 35,981 | | 165,262 | | 201,243 | | 30,348 | |
| TX | 111 | 111,417 | | 205,385 | | 760,041 | | 75,963 | | 205,237 | | 836,152 | | 1,041,389 | | 166,839 | |
| UT | 10 | 16,670 | | 9,008 | | 39,295 | | 3,615 | | 9,008 | | 42,910 | | 51,918 | | 13,949 | |
| VA | 53 | 58,133 | | 156,074 | | 517,534 | | 32,574 | | 156,075 | | 550,107 | | 706,182 | | 108,891 | |
| WA | 9 | 5,030 | | 13,762 | | 60,926 | | 12,572 | | 13,764 | | 73,496 | | 87,260 | | 16,483 | |
| DC | 1 | 7,864 | | 14,394 | | 18,172 | | 566 | | 14,394 | | 18,738 | | 33,132 | | 3,383 | |
| Other corporate assets | | — | | — | | — | | 207,609 | | — | | 207,609 | | 207,609 | | 67,700 | |
| Intangible tenant relationships and lease rights | | — | | — | | 165,718 | | — | | — | | 165,718 | | 165,718 | | 144,144 | |
| Construction in Progress/Undeveloped Land | | — | | 23,263 | | 2,778 | | 51,836 | | 22,693 | | 55,184 | | 77,877 | | 632 | |
| Right of use asset - finance lease | | — | | — | | — | | 136,259 | | — | | 136,259 | | 136,259 | | 3,748 | |
Totals (1) | 1,133 | $ | 1,294,423 | | $ | 2,353,802 | | $ | 8,486,066 | | $ | 1,296,634 | | $ | 2,356,746 | | $ | 9,779,756 | | $ | 12,136,502 | | $ | 2,138,524 | |
(1) No right-of-use assets related to operating leases are included in the ending net real estate assets information above.
Extra Space Storage Inc. Schedule III (continued)
Activity in real estate facilities during the years ended December 31, 2022, 2021 and 2020 is as follows: | | | | | | | | | | | | | | | | | |
| 2022 | | 2021 | | 2020 |
| Operating facilities | | | | | |
| Balance at beginning of year | $ | 10,643,722 | | | $ | 9,507,788 | | | $ | 9,129,558 | |
| Acquisitions | 1,390,463 | | | 1,500,703 | | | 255,235 | |
| Improvements | 95,282 | | | 80,131 | | | 66,693 | |
| Transfers from construction in progress | 70,565 | | | 62,462 | | | 40,988 | |
| Dispositions and other | (116,007) | | | (507,362) | | | 15,314 | |
| Balance at end of year | $ | 12,084,025 | | | $ | 10,643,722 | | | $ | 9,507,788 | |
| Accumulated depreciation: | | | | | |
| Balance at beginning of year | $ | 1,868,321 | | | $ | 1,681,429 | | | $ | 1,473,851 | |
| Depreciation expense | 276,155 | | | 230,445 | | | 217,364 | |
| Dispositions and other | (6,081) | | | (43,553) | | | (9,786) | |
| Balance at end of year | $ | 2,138,395 | | | $ | 1,868,321 | | | $ | 1,681,429 | |
| Real estate under development/redevelopment: | | | | | |
| Balance at beginning of year | $ | 59,248 | | | $ | 67,443 | | | $ | 41,157 | |
| Current development | 63,597 | | | 54,267 | | | 67,274 | |
| Transfers to operating facilities | (70,565) | | | (62,462) | | | (40,988) | |
| Dispositions and other | 68 | | | — | | | — | |
| Balance at end of year | $ | 52,348 | | | $ | 59,248 | | | $ | 67,443 | |
| Net non-lease real estate assets | $ | 9,997,978 | | | $ | 8,834,649 | | | $ | 7,893,802 | |
(1) No right-of-use assets related to operating leases are included in the ending net real estate assets information above.
As of December 31, 2022, the aggregate cost of real estate for U.S. federal income tax purposes was $9,886,378.
Item 9. Changes in and Disagreements with Accountants on Accounting and Financial Disclosure
None.
Item 9A. Controls and Procedures
(i)Disclosure Controls and Procedures
We maintain disclosure controls and procedures to ensure that information required to be disclosed in the reports we file pursuant to the Securities Exchange Act of 1934, as amended (the “Exchange Act”), are recorded, processed, summarized and reported within the time periods specified in the rules and forms of the SEC, and that such information is accumulated and communicated to our management, including our Chief Executive Officer and Chief Financial Officer, as appropriate, to allow timely decisions regarding required disclosure based on the definition of “disclosure controls and procedures” in Rule 13a-15(e) of the Exchange Act. In designing and evaluating the disclosure controls and procedures, management recognized that any controls and procedures, no matter how well designed and operated, can only provide reasonable assurance of achieving the desired control objectives, and in reaching a reasonable level of assurance, management necessarily was required to apply its judgment in evaluating the cost-benefit relationship of possible controls and procedures.
We have a disclosure committee that is responsible for considering the materiality of information and determining the disclosure obligations of the Company on a timely basis. The disclosure committee meets quarterly and reports directly to our Chief Executive Officer and Chief Financial Officer.
We carried out an evaluation, under the supervision and with the participation of management, including our Chief Executive Officer and Chief Financial Officer, of the effectiveness of the design and operation of our disclosure controls and procedures as of the end of the period covered by this Annual Report. Based upon that evaluation, our Chief Executive Officer and Chief Financial Officer concluded that our disclosure controls and procedures were effective at the reasonable assurance level as of the end of the period covered by this report.
(ii)Internal Control over Financial Reporting
1.Management’s Report on Internal Control over Financial Reporting
Our management is responsible for establishing and maintaining adequate internal control over financial reporting as defined in Rule 13a-15(f) of the Exchange Act. Under the supervision and with the participation of our management, including our Chief Executive Officer and Chief Financial Officer, we conducted an evaluation of the effectiveness of our internal control over financial reporting based on the framework in Internal Control—Integrated Framework issued by the Committee of Sponsoring Organizations of the Treadway Commission (2013 framework). Based on our evaluation, our management concluded that our internal control over financial reporting was effective as of December 31, 2022. Because of its inherent limitations, internal control over financial reporting may not prevent or detect misstatements. Projections of any evaluation of effectiveness to future periods are subject to the risk that controls may become inadequate because of changes in conditions, or that the degree of compliance with the policies or procedures may deteriorate. Our independent registered public accounting firm, Ernst & Young LLP, has issued the following attestation report over our internal control over financial reporting.
(b)Attestation Report of the Registered Public Accounting Firm
Report of Independent Registered Public Accounting Firm
To the Stockholders and the Board of Directors of Extra Space Storage Inc.
Opinion on Internal Control Over Financial Reporting
We have audited Extra Space Storage Inc.’s internal control over financial reporting as of December 31, 2022, based on criteria established in Internal Control—Integrated Framework issued by the Committee of Sponsoring Organizations of the Treadway Commission (2013 framework) (the COSO criteria). In our opinion, Extra Space Storage Inc. (the Company) maintained, in all material respects, effective internal control over financial reporting as of December 31, 2022, based on the COSO criteria.
We also have audited, in accordance with the standards of the Public Company Accounting Oversight Board (United States) (PCAOB), the consolidated balance sheets of the Company as of December 31, 2022 and 2021, the related consolidated statements of operations, comprehensive income, stockholders' equity and cash flows for each of the three years in the period ended December 31, 2022, and the related notes and financial statement schedule listed in the Index at Item 8 and our report dated February 28, 2023 expressed an unqualified opinion thereon.
Basis for Opinion
The Company’s management is responsible for maintaining effective internal control over financial reporting and for its assessment of the effectiveness of internal control over financial reporting included in the accompanying Management’s Report on Internal Control over Financial Reporting. Our responsibility is to express an opinion on the Company’s internal control over financial reporting based on our audit. We are a public accounting firm registered with the PCAOB and are required to be independent with respect to the Company in accordance with the U.S. federal securities laws and the applicable rules and regulations of the Securities and Exchange Commission and the PCAOB.
We conducted our audit in accordance with the standards of the PCAOB. Those standards require that we plan and perform the audit to obtain reasonable assurance about whether effective internal control over financial reporting was maintained in all material respects.
Our audit included obtaining an understanding of internal control over financial reporting, assessing the risk that a material weakness exists, testing and evaluating the design and operating effectiveness of internal control based on the assessed risk, and performing such other procedures as we considered necessary in the circumstances. We believe that our audit provides a reasonable basis for our opinion.
Definition and Limitations of Internal Control Over Financial Reporting
A company’s internal control over financial reporting is a process designed to provide reasonable assurance regarding the reliability of financial reporting and the preparation of financial statements for external purposes in accordance with generally accepted accounting principles. A company’s internal control over financial reporting includes those policies and procedures that (1) pertain to the maintenance of records that, in reasonable detail, accurately and fairly reflect the transactions and dispositions of the assets of the company; (2) provide reasonable assurance that transactions are recorded as necessary to permit preparation of financial statements in accordance with generally accepted accounting principles, and that receipts and expenditures of the company are being made only in accordance with authorizations of management and directors of the company; and (3) provide reasonable assurance regarding prevention or timely detection of unauthorized acquisition, use, or disposition of the company’s assets that could have a material effect on the financial statements.
Because of its inherent limitations, internal control over financial reporting may not prevent or detect misstatements. Also, projections of any evaluation of effectiveness to future periods are subject to the risk that controls may become inadequate because of changes in conditions, or that the degree of compliance with the policies or procedures may deteriorate.
/s/ Ernst & Young LLP
Salt Lake City, Utah
February 28, 2023
(c)Changes in Internal Control over Financial Reporting
There was no change in our internal control over financial reporting (as such term is defined in Exchange Act Rule 13a-15(f)) that occurred during our most recent quarter that has materially affected, or is reasonably likely to materially affect, our internal control over financial reporting.
Item 9B. Other Information
None.
Item 9C. Disclosure Regarding Foreign Jurisdictions that Prevent Inspections
None.
PART III
Item 10. Directors, Executive Officers and Corporate Governance
Information required by this item is incorporated by reference to the information set forth under the captions “Executive Officers,” and “Information About the Board of Directors and its Committees” in our definitive Proxy Statement to be filed with the Securities and Exchange Commission pursuant to Regulation 14A within 120 days after December 31, 2022.
We have adopted a Code of Business Conduct and Ethics in compliance with rules of the SEC that applies to all of our personnel, including our board of directors, Chief Executive Officer, Chief Financial Officer and principal accounting officer. The Code of Business Conduct and Ethics is available free of charge on the “Investor Relations—Corporate Governance” section of our web site at www.extraspace.com. We intend to satisfy any disclosure requirements under Item 5.05 of Form 8-K regarding amendment to, or waiver from, a provision of this Code of Business Conduct and Ethics by posting such information on our web site at the address and location specified above.
The board of directors has adopted Corporate Governance Guidelines and charters for our Audit Committee and Compensation, Nominating and Governance Committee, each of which is posted on our website at the address and location specified above. Investors may obtain a free copy of the Code of Business Conduct and Ethics, the Corporate Governance Guidelines and the committee charters by contacting the Investor Relations Department at 2795 East Cottonwood Parkway, Suite 300, Salt Lake City, Utah 84121, Attn: Jeff Norman or by telephoning (801) 365-4600.
Item 11. Executive Compensation
Information with respect to executive compensation is incorporated by reference to the information set forth under the caption “Executive Compensation” in our definitive Proxy Statement to be filed with the Securities and Exchange Commission pursuant to Regulation 14A within 120 days after December 31, 2022.
Item 12. Security Ownership of Certain Beneficial Owners and Management and Related Stockholder Matters
Information with respect to security ownership of certain beneficial owners and management and related stockholder matters is incorporated by reference to the information set forth under the captions “Executive Compensation” and “Security Ownership of Directors and Officers” in our definitive Proxy Statement to be filed with the Securities and Exchange Commission pursuant to Regulation 14A within 120 days after December 31, 2022.
Item 13. Certain Relationships and Related Transactions, and Director Independence
Information with respect to certain relationships and related transactions is incorporated by reference to the information set forth under the captions “Information about the Board of Directors and its Committees” and “Review and Approval of Related Party Transactions” in our Proxy Statement to be filed with the Securities and Exchange Commission pursuant to Regulation 14A within 120 days after December 31, 2022.
Item 14. Principal Accounting Fees and Services
Information with respect to principal accounting fees and services is incorporated by reference to the information set forth under the caption “Ratification of the Engagement of Ernst & Young LLP as the Company’s Independent Registered Public Accounting Firm for 2023” in our Proxy Statement to be filed with the Securities and Exchange Commission pursuant to Regulation 14A within 120 days after December 31, 2022.
PART IV
Item 15. Exhibits and Financial Statement Schedules
(a)Documents filed as part of this report:
(1) and (2). All Financial Statements and Financial Statement Schedules filed as part of this Annual Report on 10-K are included in Item 8—“Financial Statements and Supplementary Data” of this Annual Report on 10-K and reference is made thereto.
(3) The following documents are filed or incorporated by references as exhibits to this report: | | | | | | | | | | | | | | | | | | | | |
Exhibit Number | | Exhibit Description | Incorporated by Reference | Filed Herewith |
| | | Form | Date | Number | |
| 3.1 | | | S-11 | August 10, 2004 | 3.1 | |
| 3.2 | | | 8-K | October 3, 2007 | 3.1 | |
| 3.3 | | | 8-K | August 29, 2013 | 3.1 | |
| 3.4 | | | 8-K | May 28, 2014 | 3.1 | |
| 3.5 | | | 8-K | January 17, 2018 | 3.1 | |
| 3.6 | | | 8-K | December 6, 2013 | 10.1 | |
| 4.1 | | | 10-K | February 26, 2010 | 4.3 | |
| 4.2 | | | 10-K | February 25, 2020 | 4.6 | |
| 4.3 | | Indenture, dated as of May 11, 2021, among Extra Space Storage LP, as issuer, Extra Space Storage Inc., ESS Holdings Business Trust I and ESS Holdings Business Trust II, as guarantors, and Wells Fargo Bank, National Association, as trustee. | 8-K | May 11, 2021 | 4.1 | |
| 4.4 | | First Supplemental Indenture, dated as of May 11, 2021, among Extra Space Storage LP, as issuer, Extra Space Storage Inc., ESS Holdings Business Trust I and ESS Holdings Business Trust II, as guarantors, and Wells Fargo Bank, National Association, as trustee, including the form of the Notes and the Guarantee. | 8-K | May 11, 2021 | 4.2 | |
| 4.5 | | Second Supplemental Indenture, dated as of September 22, 2021, among Extra Space Storage LP, as issuer, Extra Space Storage Inc., ESS Holdings Business Trust I and ESS Holdings Business Trust II, as guarantors, and Wells Fargo Bank, National Association, as trustee, including the form of the Notes and the Guarantee. | 8-K | September 22, 2021 | 4.2 | |
| 10.1 | | | S-11/A | August 10, 2004 | 10.1 | |
| 10.2 | | | S-11/A | July 26, 2004 | 10.14 | |
| 10.3 | | | 8-K | June 24, 2005 | 10.2 | |
| 10.4 | | | 8-K | August 2, 2005 | 10.1 | |
| 10.5 | | | 8-K | June 26, 2007 | 10.2 | |
| 10.6 | | | 8-K | June 26, 2007 | 10.3 | |
| | | | | | | | | | | | | | | | | | | | |
Exhibit Number | | Exhibit Description | Incorporated by Reference | Filed Herewith |
| | | Form | Date | Number | |
| 10.7 | | | 10-K | February 26, 2010 | 10.26 | |
| 10.8 | | | 8-K | April 16, 2012 | 10.1 | |
| 10.9 | | | 8-K | August 31, 2010 | 10.1 | |
| 10.10 | | Letter Agreement, dated as of November 22, 2013, amending the Contribution Agreement, dated June 15, 2007, among Extra Space Storage LP and various limited partnerships affiliated with AAAAA Rent-A-Space, and the Promissory Note, dated June 25, 2007, among Extra Space Storage LP, H. James Knuppe and Barbara Knuppe. | 10-Q | May 8, 2014 | 10.1 | |
| 10.11 | | | 10-Q | May 5, 2017 | 10.1 | |
| 10.12* | | | DEFA14A | April 14, 2015 | Definitive Proxy Statement | |
| 10.13* | | | 10-K | February 26, 2020 | 10.13 | |
| 10.15* | | | DEFA14A | April 14, 2008 | Definitive Proxy Statement | |
| 10.16* | | | 10-K | February 26, 2010 | 10.11 | |
| 10.17* | | | 10-K | February 26, 2010 | 10.12 | |
| 10.18* | | | 10-K | February 26, 2010 | 10.13 | |
| 10.19* | | | 10-Q | November 7, 2007 | 10.2 | |
| 10.20* | | | 10-Q | November 7, 2007 | 10.4 | |
| 10.21* | | | 10-K/A | March 20, 2007 | 10.22 | |
| 10.22 | | | 8-K | June 25, 2021 | 10.1 | |
| 21.1 | | | | | | X |
| 22.1 | | | | | | X |
| 23.1 | | | | | | X |
| 31.1 | | | | | | X |
| 31.2 | | | | | | X |
| 32.1 | | | | | | X |
| | | | | | | | | | | | | | | | | | | | |
Exhibit Number | | Exhibit Description | Incorporated by Reference | Filed Herewith |
| | | Form | Date | Number | |
| 101 | | The following financial information from Registrant’s Annual Report on Form 10-K for the period ended December 31, 2022, formatted in Extensible Business Reporting Language (XBRL): (i) Consolidated Balance Sheets as of December 31, 2022 and 2021; (ii) Consolidated Statements of Operations for the years ended December 31, 2022, 2021 and 2020; (iii) Consolidated Statements of Comprehensive Income for the years ended December 31, 2022, 2021 and 2020; (iv) Consolidated Statements of Stockholders’ Equity for the years ended December 31, 2022, 2021 and 2020; (v) Consolidated Statements of Cash Flows for the years ended December 31, 2022, 2021 and 2020; and (vi) Notes to Consolidated Financial Statements. | | | | X |
| 104 | | Cover Page Interactive Data File (formatted as inline XBRL and contained in Exhibit 101). | | | | X |
* Management compensatory plan or arrangement
(1)Incorporated by reference to Registration Statement on Form S-11 (File No. 333-115436 dated August 11, 2004).
Item 16. Form 10-K Summary
None.
SIGNATURES
Pursuant to the requirements of Section 13 or 15(d) of the Securities Exchange Act of 1934, the registrant has duly caused this report to be signed on its behalf by the undersigned, thereunto duly authorized. | | | | | | | | | | | | | | |
| | EXTRA SPACE STORAGE INC. |
| Date: February 28, 2023 | | By: | | /s/ JOSEPH D. MARGOLIS |
| | | | Joseph D. Margolis Chief Executive Officer |
Pursuant to the requirements of the Securities Exchange Act of 1934, this report has been signed below by the following persons on behalf of the registrant and in the capacities and on the dates indicated.
| | | | | | | | | | | | | | |
| Date: February 28, 2023 | | By: | | /s/ JOSEPH D. MARGOLIS |
| | | | Joseph D. Margolis Chief Executive Officer (Principal Executive Officer) |
| | | | |
| Date: February 28, 2023 | | By: | | /s/ P. SCOTT STUBBS |
| | | | P. Scott Stubbs Executive Vice President and Chief Financial Officer (Principal Financial Officer) |
| | | | |
| Date: February 28, 2023 | | By: | | /s/ GRACE KUNDE |
| | | | Grace Kunde Senior Vice President, Accounting and Finance (Principal Accounting Officer) |
| | | | |
| Date: February 28, 2023 | | By: | | /s/ KENNETH M. WOOLLEY |
| | | | Kenneth M. Woolley Chairman of the Board |
| | | | |
| Date: February 28, 2023 | | By: | | /s/ JOSEPH J. BONNER |
| | | | Joseph J. Bonner Director |
| | | | |
| Date: February 28, 2023 | | By: | | /s/ GARY CRITTENDEN |
| | | | Gary Crittenden Director |
| | | | |
| Date: February 28, 2023 | | By: | | /s/ SPENCER F. KIRK |
| | | | Spencer F. Kirk Director |
| | | | |
| Date: February 28, 2023 | | By: | | /s/ DENNIS LETHAM |
| | | | Dennis Letham Director |
| | | | |
| Date: February 28, 2023 | | By: | | /s/ DIANE OLMSTEAD |
| | | | Diane Olmstead Director |
| | | | |
| Date: February 28, 2023 | | By: | | /s/ ROGER B. PORTER |
| | | | Roger B. Porter Director |
| | | | |
| Date: February 28, 2023 | | By: | | /s/ JULIA VANDER PLOEG |
| | | | Julia Vander Ploeg Director |
| | | | |
| Date: February 28, 2023 | | By: | | /s/ JEFFERSON S. SHREVE |
| | | | Jefferson S. Shreve Director |