|
TOTAL PRO FORMA GROSS ASSETS BY ASSET TYPE |
TOTAL ADJUSTED REVENUE BY ASSET TYPE |
|
|
|
UNITED STATES
SECURITIES AND EXCHANGE COMMISSION
Washington, D.C. 20549
FORM
(Mark One)
For the fiscal year ended
or
For the transition period from to
Commission file number
Commission file number
(Exact Name of Registrant as Specified in Its Charter)
|
|
|
|
|
(State or Other Jurisdiction of Incorporation or Organization) |
|
(IRS Employer Identification No.) |
|
|
|
|
|
(Address of Principal Executive Offices) |
|
(Zip Code) |
(
(Registrant’s telephone number, including area code)
Securities registered pursuant to Section 12(b) of the Act:
|
Title of each class |
Trading Symbol |
Name of each exchange on which registered |
|
|
|
|
Securities registered pursuant to Section 12(g) of the Act:
None
Indicate by check mark if the registrant is a well-known seasoned issuer, as defined in Rule 405 of the Securities Act.
Medical Properties Trust, Inc.
Indicate by check mark if the registrant is not required to file reports pursuant to Section 13 or Section 15(d) of the Act.
Medical Properties Trust, Inc. Yes ☐
Indicate by check mark whether the registrant (1) has filed all reports required to be filed by Section 13 or 15(d) of the Securities Exchange Act of 1934 during the preceding 12 months (or for such shorter period that the registrant was required to file such reports), and (2) has been subject to such filing requirements for the past 90 days.
Medical Properties Trust, Inc.
Indicate by check mark whether the registrant has submitted electronically every Interactive Data File required to be submitted pursuant to Rule 405 of Regulation S-T (§ 232.405 of this chapter) during the preceding 12 months (or for such shorter period that the registrant was required to submit such files).
Medical Properties Trust, Inc.
Indicate by check mark whether the registrant is a large accelerated filer, an accelerated filer, a non-accelerated filer, a smaller reporting company, or an emerging growth company. See the definitions of “large accelerated filer,” “accelerated filer,” “smaller reporting company,” and “emerging growth company” in Rule 12b-2 of the Exchange Act.
Medical Properties Trust, Inc.
|
|
|
☒ |
|
Accelerated filer |
|
☐ |
|
Non-accelerated filer |
|
☐ |
|
Smaller reporting company |
|
|
|
|
|
|
|
Emerging growth company |
|
|
MPT Operating Partnership, L.P.
|
Large accelerated filer |
|
☐ |
|
Accelerated filer |
|
☐ |
|
|
|
☒ |
|
Smaller reporting company |
|
|
|
|
|
|
|
Emerging growth company |
|
|
If an emerging growth company, indicate by check mark if the registrant has elected not to use the extended transition period for complying with any new or revised financial accounting standards provided pursuant to Section 13(a) of the Exchange Act. ☐
Indicate by check mark whether the registrant has filed a report on and attestation to its management’s assessment of the effectiveness of its internal control over financial reporting under Section 404(b) of the Sarbans-Oxley Act (15 U.S.C. 7262(b)) by the registered public accounting firm that prepared or issued its audit report.
Indicate by check mark whether the registrant is a shell company (as defined in 12b-2 of the Act).
Medical Properties Trust, Inc. Yes
As of June 30, 2020, the aggregate market value of the 523.8 million shares of common stock, par value $0.001 per share (“Common Stock”), held by non-affiliates of Medical Properties Trust, Inc. was $
As of February 19, 2021,
DOCUMENTS INCORPORATED BY REFERENCE
Portions of the definitive Proxy Statement of Medical Properties Trust, Inc. for the Annual Meeting of Stockholders to be held on May 26, 2021 are incorporated by reference into Items 10 through 14 of Part III, of this Annual Report on Form 10-K.
EXPLANATORY NOTE
This report combines the Annual Reports on Form 10-K for the year ended December 31, 2020, of Medical Properties Trust, Inc., a Maryland corporation, and MPT Operating Partnership, L.P., a Delaware limited partnership, through which Medical Properties Trust, Inc. conducts substantially all of its operations. Unless otherwise indicated or unless the context requires otherwise, all references in this report to “we,” “us,” “our,” “our company,” “Medical Properties,” “MPT,” or the “company” refer to Medical Properties Trust, Inc. together with its consolidated subsidiaries, including MPT Operating Partnership, L.P. Unless otherwise indicated or unless the context requires otherwise, all references to “operating partnership” or “the operating partnership” refer to MPT Operating Partnership, L.P. together with its consolidated subsidiaries.
On November 19, 2020, the Securities and Exchange Commission (“SEC”) adopted amendments to Regulation S-K Items 301, 302, and 303, which became effective on February 10, 2021. Although mandatory compliance is not required until our fiscal year ending December 31, 2021, early adoption is permitted, and we have elected to early adopt amended Regulation S-K Items 301, 302, and 303 in this Annual Report on Form 10-K.
2
TABLE OF CONTENTS
|
4 |
|||
|
|
|
|
|
|
|
|
|
|
|
ITEM 1 |
|
6 |
|
|
ITEM 1A. |
|
19 |
|
|
ITEM 1B. |
|
33 |
|
|
ITEM 2. |
|
34 |
|
|
ITEM 3. |
|
35 |
|
|
ITEM 4. |
|
36 |
|
|
|
|
|
|
|
|
|
|
|
|
ITEM 5. |
|
37 |
|
|
ITEM 6. |
|
38 |
|
|
ITEM 7. |
|
Management’s Discussion and Analysis of Financial Condition and Results of Operations |
39 |
|
ITEM 7A. |
|
54 |
|
|
ITEM 8. |
|
56 |
|
|
ITEM 9. |
|
Changes in and Disagreements With Accountants on Accounting and Financial Disclosure |
98 |
|
ITEM 9A. |
|
98 |
|
|
ITEM 9B. |
|
99 |
|
|
|
|
|
|
|
|
|
|
|
|
ITEM 10. |
|
100 |
|
|
ITEM 11. |
|
100 |
|
|
ITEM 12. |
|
Security Ownership of Certain Beneficial Owners and Management and Related Stockholder Matters |
100 |
|
ITEM 13. |
|
Certain Relationships and Related Transactions, and Director Independence |
100 |
|
ITEM 14. |
|
100 |
|
|
|
|
|
|
|
|
|
|
|
|
ITEM 15. |
|
101 |
|
|
ITEM 16. |
|
106 |
|
|
|
|
107 |
|
3
A WARNING ABOUT FORWARD LOOKING STATEMENTS
We make forward-looking statements in this Annual Report on Form 10-K that are subject to risks and uncertainties. These forward-looking statements include information about possible or assumed future results of our business, financial condition, liquidity, results of operations, plans, and objectives. Statements regarding the following subjects, among others, are forward-looking by their nature:
|
|
• |
our business strategy; |
|
|
• |
our projected operating results; |
|
|
• |
our ability to close on any pending transactions discussed herein on the time schedule or terms described or at all; |
|
|
• |
our ability to acquire, develop, and/or manage additional facilities in the United States (“U.S.”), Europe, Australia, South America, or other foreign locations; |
|
|
• |
availability of suitable facilities to acquire or develop; |
|
|
• |
our ability to enter into, and the terms of, our prospective leases and loans; |
|
|
• |
our ability to raise additional funds through offerings of debt and equity securities, joint venture arrangements, and/or property disposals; |
|
|
• |
our ability to obtain future financing arrangements; |
|
|
• |
estimates relating to, and our ability to pay, future distributions; |
|
|
• |
our ability to service our debt and comply with all of our debt covenants; |
|
|
• |
our ability to compete in the marketplace; |
|
|
• |
lease rates and interest rates; |
|
|
• |
market trends; |
|
|
• |
projected capital expenditures; and |
|
|
• |
the impact of technology on our facilities, operations, and business. |
Forward-looking statements are based on our beliefs, assumptions, and expectations of our future performance, taking into account information currently available to us. These beliefs, assumptions, and expectations can change as a result of many possible events or factors, not all of which are known to us. If a change occurs, our business, financial condition, liquidity, and results of operations may vary materially from those expressed in our forward-looking statements. You should carefully consider these risks before you make an investment decision with respect to our common stock and other securities, along with, among others, the following factors that could cause actual results to vary from our forward-looking statements:
|
|
• |
the factors referenced in this Annual Report on Form 10-K, including those set forth under the sections captioned “Risk Factors,” “Management’s Discussion and Analysis of Financial Condition and Results of Operations,” and “Business;” |
|
|
• |
the political, economic, business, real estate, and other market conditions in the U.S. (both national and local), Europe (in particular the United Kingdom, Germany, Switzerland, Spain, Italy, and Portugal), Australia, South America (in particular Colombia), and other foreign jurisdictions where we may own healthcare facilities or transact business, which may have a negative effect on the following, among other things: |
|
|
• |
the financial condition of our tenants, our lenders, or institutions that hold our cash balances or are counterparties to certain hedge agreements, which may expose us to increased risks of default by these parties; |
|
|
• |
our ability to obtain equity or debt financing on attractive terms or at all, which may adversely impact our ability to pursue acquisition and development opportunities, refinance existing debt, and our future interest expense; and |
|
|
• |
the value of our real estate assets, which may limit our ability to dispose of assets at attractive prices or obtain or maintain debt financing secured by our real estate assets or on an unsecured basis. |
|
|
• |
the impact of the novel coronavirus (“COVID-19”) pandemic on our business, our joint ventures, and the business of our tenants/borrowers and the economy in general, as well as other factors that may affect our business, our joint ventures or that of our tenants/borrowers that are beyond our control, including natural disasters, health crises, or pandemics and subsequent government actions in reaction to such matters; |
|
|
• |
the risk that a condition to closing under the agreements governing any or all of our pending transactions that have not closed as of the date hereof (including the transactions described in Note 8 to Item 8 of this Annual Report on Form 10-K) may not be satisfied; |
4
|
|
• |
the possibility that the anticipated benefits from any or all of the transactions we enter into will take longer to realize than expected or will not be realized at all; |
|
|
• |
the competitive environment in which we operate; |
|
|
• |
the execution of our business plan; |
|
|
• |
financing risks; |
|
|
• |
acquisition and development risks; |
|
|
• |
potential environmental contingencies and other liabilities; |
|
|
• |
adverse developments affecting the financial health of one or more of our tenants, including insolvency; |
|
|
• |
other factors affecting the real estate industry generally or the healthcare real estate industry in particular; |
|
|
• |
our ability to maintain our status as a REIT for income tax purposes; |
|
|
• |
our ability to attract and retain qualified personnel; |
|
|
• |
changes in foreign currency exchange rates; |
|
|
• |
changes in federal, state, or local tax laws in the U.S., Europe, Australia, South America, or other jurisdictions in which we may own healthcare facilities or transact business; and |
|
|
• |
healthcare and other regulatory requirements in the U.S., Europe, Australia, South America, and other foreign countries. |
When we use the words “believe,” “expect,” “may,” “potential,” “anticipate,” “estimate,” “plan,” “will,” “could,” “intend,” or similar expressions, we are identifying forward-looking statements. You should not place undue reliance on these forward-looking statements. Except as required by law, we disclaim any obligation to update such statements or to publicly announce the result of any revisions to any of the forward-looking statements contained in this Annual Report on Form 10-K.
5
PART I
|
ITEM 1. |
Business |
Overview
We are a self-advised real estate investment trust (“REIT”) formed in 2003 to acquire and develop net-leased healthcare facilities. We currently have investments in approximately 430 facilities and approximately 43,000 licensed beds in 33 states in the U.S., in six countries in Europe, across Australia, and in Colombia in South America. We have operated as a REIT since April 6, 2004, and accordingly, elected REIT status upon the filing of our calendar year 2004 federal income tax return. Medical Properties Trust, Inc. was incorporated under Maryland law on August 27, 2003, and MPT Operating Partnership, L.P. was formed under Delaware law on September 10, 2003. We conduct substantially all of our business through MPT Operating Partnership, L.P.
We acquire and develop healthcare facilities and lease the facilities to healthcare operating companies under long-term net leases, which require the tenant to bear most of the costs associated with the property. We also make mortgage loans to healthcare operators collateralized by their real estate assets. In addition, we selectively make loans to certain of our operators through our taxable REIT subsidiaries (“TRS”), the proceeds of which are typically used for acquisition and working capital. Finally, from time-to-time, we acquire a profits or other equity interest in our tenants that gives us a right to share in such tenant’s profits and losses. Our business model facilitates acquisitions and recapitalization, and allows operators of healthcare facilities to unlock the value of their real estate assets to fund facility improvements, technology upgrades, and other investments in operations.
Our investments in healthcare real estate, other loans, and any equity investments in our tenants are considered a single reportable segment as further discussed in Note 1 of Item 8 in Part II of this Annual Report on Form 10-K.
At December 31, 2020 and 2019, our total assets were made up of the following (dollars in thousands):
|
|
|
2020 |
|
|
|
|
|
|
2019 |
|
|
|
|
|
||
|
Real estate (gross) |
|
$ |
14,089,849 |
|
|
|
83.7 |
% |
|
$ |
10,163,056 |
|
|
|
70.2 |
% |
|
Accumulated real estate depreciation and amortization |
|
|
(833,529 |
) |
|
|
(5.0 |
)% |
|
|
(570,042 |
) |
|
|
(3.9 |
)% |
|
Mortgage loans |
|
|
248,080 |
|
|
|
1.5 |
% |
|
|
1,275,022 |
|
|
|
8.8 |
% |
|
Other loans |
|
|
858,368 |
|
|
|
5.1 |
% |
|
|
544,832 |
|
|
|
3.8 |
% |
|
Cash and cash equivalents |
|
|
549,884 |
|
|
|
3.3 |
% |
|
|
1,462,286 |
|
|
|
10.1 |
% |
|
Equity investments |
|
|
1,123,623 |
|
|
|
6.7 |
% |
|
|
926,990 |
|
|
|
6.4 |
% |
|
Other |
|
|
792,739 |
|
|
|
4.7 |
% |
|
|
665,187 |
|
|
|
4.6 |
% |
|
Total assets(1) |
|
$ |
16,829,014 |
|
|
|
100.0 |
% |
|
$ |
14,467,331 |
|
|
|
100.0 |
% |
|
(1) |
At December 31, 2020, our total pro forma gross assets were $20.4 billion, which represents total assets plus accumulated depreciation and amortization adjusted for our unconsolidated real estate joint ventures and assumes funding of all binding real estate commitments and unfunded amounts on development deals and commenced capital improvement projects at December 31, 2020 – see section titled “Non-GAAP Financial Measures” in “Management’s Discussion and Analysis of Financial Condition and Results of Operations” in Item 7 of this Annual Report on Form 10-K. |
Revenues
The following is a breakdown of our revenue for the years ended December 31 (dollars in thousands):
|
|
|
2020 |
|
|
|
|
|
|
2019 |
|
|
|
|
|
|
2018 |
|
|
|
|
|
|||
|
Rent billed |
|
$ |
741,311 |
|
|
|
59.4 |
% |
|
$ |
474,151 |
|
|
|
55.6 |
% |
|
$ |
473,343 |
|
|
|
60.3 |
% |
|
Straight-line rent |
|
|
158,881 |
|
|
|
12.7 |
% |
|
|
110,456 |
|
|
|
12.9 |
% |
|
|
74,741 |
|
|
|
9.5 |
% |
|
Income from financing leases |
|
|
206,550 |
|
|
|
16.5 |
% |
|
|
119,617 |
|
|
|
14.0 |
% |
|
|
73,983 |
|
|
|
9.5 |
% |
|
Interest and other income |
|
|
142,496 |
|
|
|
11.4 |
% |
|
|
149,973 |
|
|
|
17.5 |
% |
|
|
162,455 |
|
|
|
20.7 |
% |
|
Total revenues(1) |
|
$ |
1,249,238 |
|
|
|
100.0 |
% |
|
$ |
854,197 |
|
|
|
100.0 |
% |
|
$ |
784,522 |
|
|
|
100.0 |
% |
|
(1) |
For 2020, 2019, and 2018, our adjusted revenues were $1.4 billion, $938.2 million, and $816.9 million, respectively, which adjusts actual total revenues to include our pro rata portion of similar revenues in our unconsolidated real estate joint venture arrangements. See section titled “Non-GAAP Financial Measures” in “Management’s Discussion and Analysis of Financial Condition and Results of Operations” in Item 7 of this Annual Report on Form 10-K. |
See “Overview” in Item 7 of this Annual Report on Form 10-K for details of transaction activity for 2020, 2019, and 2018. More information is available at www.medicalpropertiestrust.com.
6
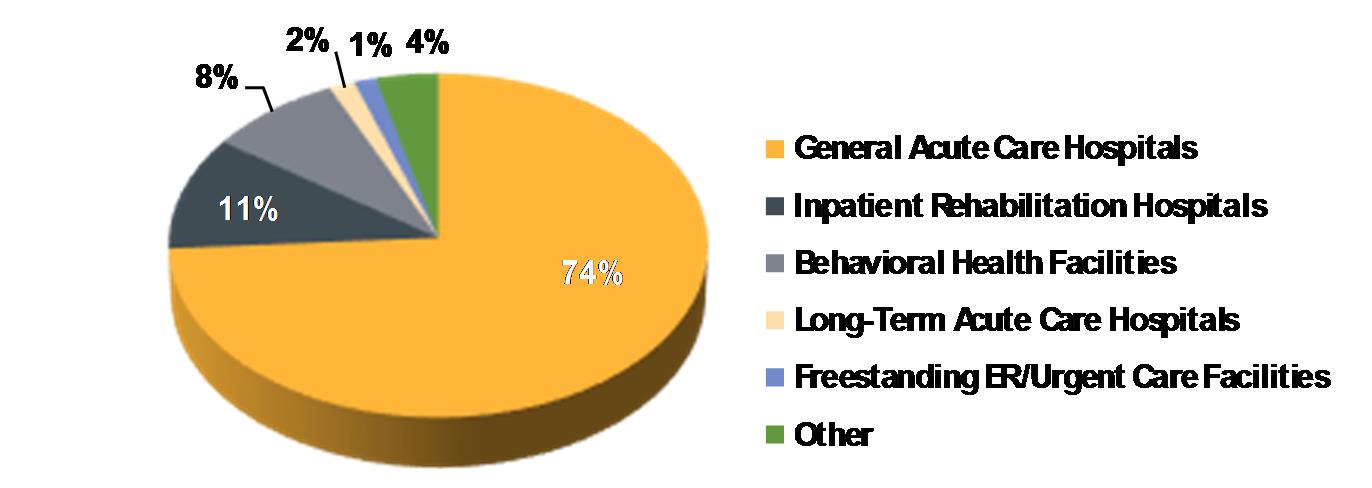
Portfolio of Properties
As of February 19, 2021, our portfolio consisted of 430 properties: 404 facilities are leased to 47 tenants, two are under development, five are in the form of mortgage loans to three operators, and 19 properties, representing less than 1% of total pro forma gross assets, are not currently leased to a tenant, as discussed in Note 3 to Item 8 of this Annual Report on Form 10-K. Of our portfolio of properties, 99 facilities are owned by way of our five unconsolidated real estate joint venture arrangements in which we share control with our joint venture partners. Our facilities consist of 202 general acute care hospitals, 112 inpatient rehabilitation hospitals (“IRFs”), 20 long-term acute care hospitals (“LTACHs”), 51 freestanding ER/urgent care facilities (“FSERs”), and 45 behavioral health facilities.
Outlook and Strategy
Our strategy is to lease the facilities that we acquire or develop to experienced healthcare operators pursuant to long-term net leases. Alternatively, we have selectively structured certain of our investments as long-term, interest-only mortgage loans to healthcare operators. Our mortgage loans are structured such that we obtain annual cash returns similar to our net leases. In addition, we have obtained and may continue to obtain profits or other interests in certain of our tenants’ operations in order to enhance our overall return.
The market for healthcare real estate is extensive and includes real estate owned by a variety of healthcare operators. For example, there are 5,198 community hospitals (according to the American Hospital Association) and an estimated $500-$750 billion of operator-owned hospital real estate in the U.S. alone. We focus on acquiring and developing those net-leased facilities that are specifically designed to reflect the latest trends in healthcare delivery methods and that focus on the most critical components of healthcare. We typically invest in facilities that have the highest intensity of care including:
|
|
• |
General acute care hospitals — provides inpatient care for the treatment of acute conditions and manifestations of chronic conditions. This type of facility also provides ambulatory care through onsite emergency rooms. |
|
|
• |
FSERs — provides emergency medical services comparable to most hospital emergency rooms, while not physically attached to a hospital campus. Urgent care centers operate similarly, but generally provide care for non-emergent injuries and illnesses. |
|
|
• |
IRFs — provides rehabilitation to patients with various neurological, musculoskeletal orthopedic, and other medical conditions following stabilization of their acute medical issues. |
|
|
• |
LTACHs — specialty-care hospitals designed for patients with serious medical problems that require intense, specialized treatment for an extended period of time, sometimes requiring a hospital stay averaging in excess of three weeks. |
|
|
• |
Behavioral health facilities — specialty facilities focused on the treatment of mental, social, and even physical illnesses, while promoting the health and well-being of the body, mind, and spirit. Behavioral health services range in acuity of care from outpatient therapy and drug and alcohol rehabilitation services to secured, inpatient mental health hospital care. |
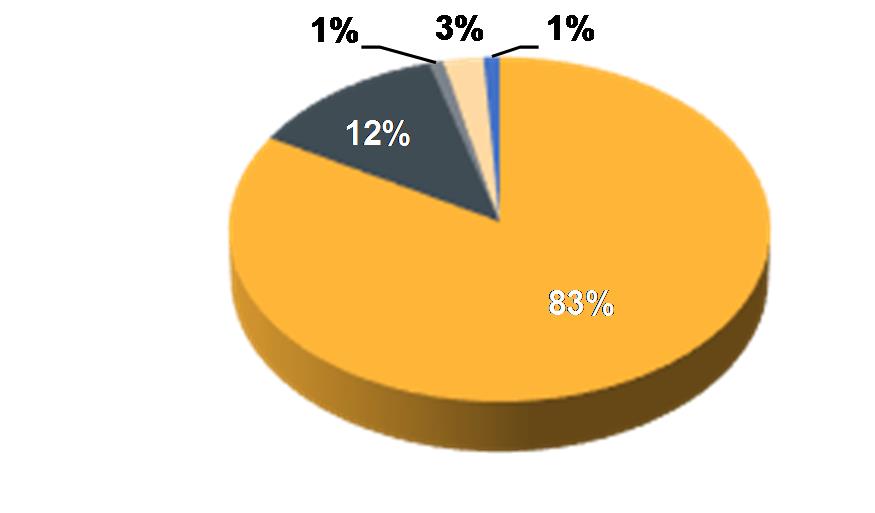
On a property type basis, our total pro forma gross assets at December 31, 2020 and total adjusted revenues for the 2020 year are as follows:
|
TOTAL PRO FORMA GROSS ASSETS BY ASSET TYPE |
TOTAL ADJUSTED REVENUE BY ASSET TYPE |
|
|
|
7
Diversification
A fundamental component of our business plan is the continued diversification of our portfolio. We monitor diversification in several ways, including concentration in any one facility, our tenant relationships, the types of hospitals we own, and the geographic areas in which we invest.
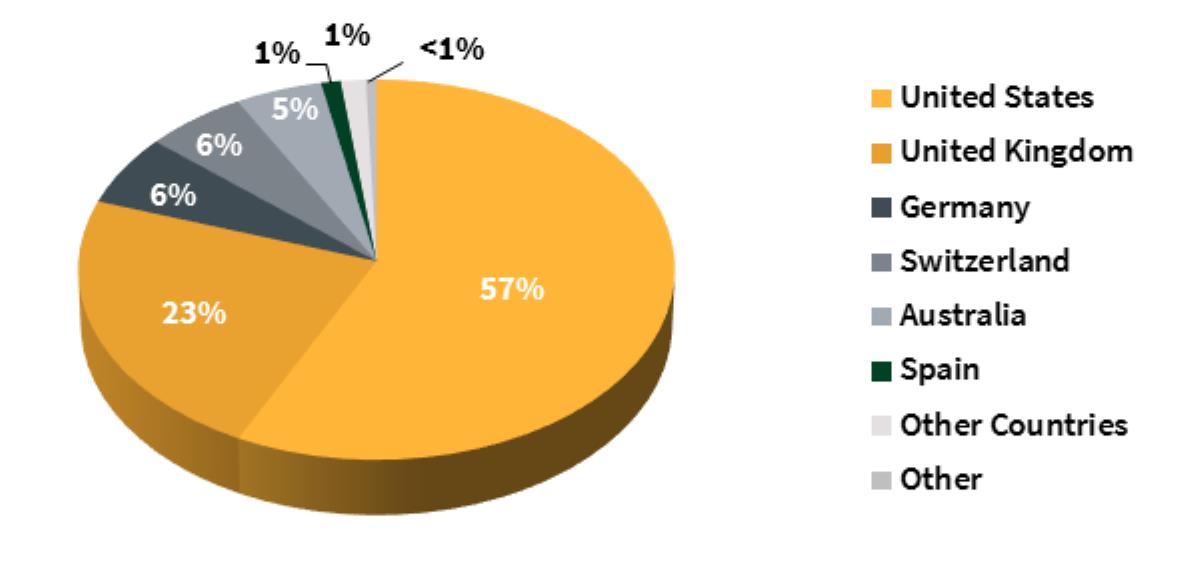
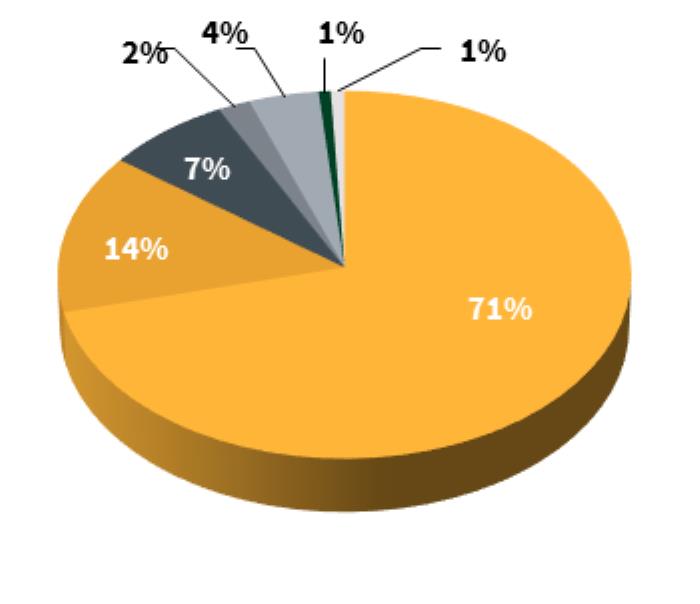
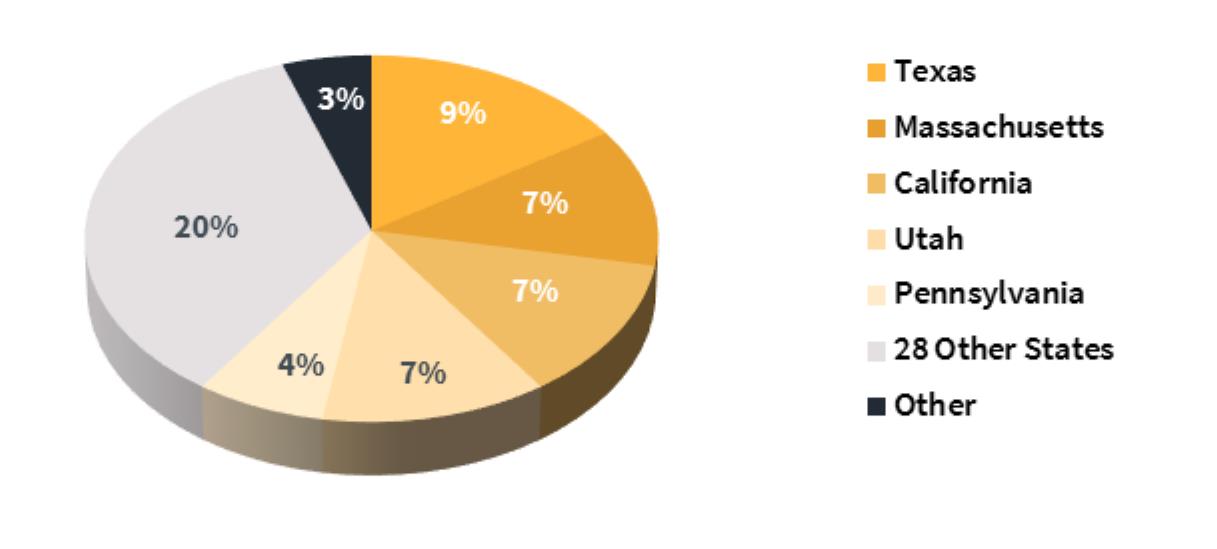
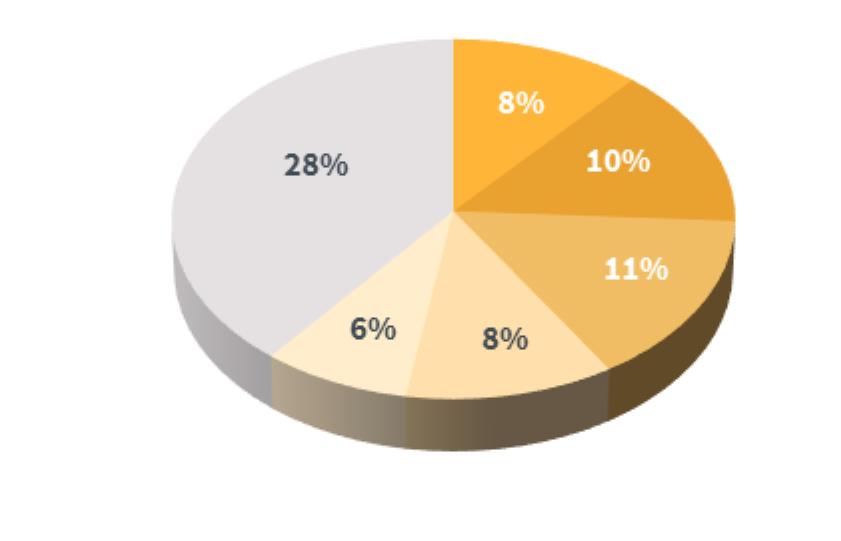
At December 31, 2020, no single property accounted for more than 4% of our total assets (or 3% of our total pro forma gross assets), similar to the prior year. From a tenant relationship perspective, see section titled “Significant Tenants” below for detail. See sections titled “Portfolio of Properties” and “Outlook and Strategy” above for information on the diversification of our hospital types. From a geographical perspective, we have investments across the U.S., and in Europe, Australia, and South America. See below for investment and revenue concentration in the U.S. and our global concentration at December 31, 2020:
|
TOTAL PRO FORMA GROSS ASSETS BY COUNTRY |
TOTAL ADJUSTED REVENUE BY COUNTRY |
|
|
|
|
|
|
|
PRO FORMA GROSS ASSETS BY U.S. STATE |
ADJUSTED REVENUE BY U.S. STATE |
|
|
|
Underwriting/Asset Management
Our revenue is derived from rents we earn pursuant to the lease agreements with our tenants, from interest income from loans to our tenants and other facility owners, and from profits or equity interests in certain of our tenants’ operations. Our tenants operate in the healthcare industry, generally providing medical, surgical, rehabilitative, and behavioral health care to patients. The capacity of our tenants to pay our rents and interest is dependent upon their ability to conduct their operations at profitable levels. We believe that the business environment of the industry segments in which our tenants operate is generally positive for efficient operators. However, our tenants’ operations are subject to economic, regulatory, healthcare, and market conditions that may affect their profitability, which could impact our results. Accordingly, we monitor certain key performance indicators that we believe provides us with early indications of conditions that could affect the level of risk in our portfolio.
8
Key factors that we consider in underwriting prospective tenants and in our ongoing monitoring of our tenants’ (and guarantors’) performance include the following:
|
|
• |
the scope and breadth of clinical services and programs, including utilization trends (both inpatient and outpatient) by service type; |
|
|
• |
the size and composition of medical staff and physician leadership at our facilities, including specialty, tenure, and number of procedures performed and/or referrals; |
|
|
• |
an evaluation of our operator's administrative team, as applicable, including background and tenure within the healthcare industry; |
|
|
• |
facility operating performance measured by current, historical, and prospective operating margins (measured by a tenant's earnings before interest, taxes, depreciation, amortization, management fees, and facility rent) of each tenant and at each facility; |
|
|
• |
the ratio of our tenants' operating earnings to facility rent and to other fixed costs, including debt costs; |
|
|
• |
changes in revenue sources of our tenants, including the relative mix of public payors (including Medicare, Medicaid/MediCal, and managed care in the U.S., as well as equivalent payors in Europe, Australia, and South America) and private payors (including commercial insurance and private pay patients); |
|
|
• |
historical support (financial or otherwise) from governments and/or other public payor systems during major economic downturns/depressions; |
|
|
• |
trends in tenants' cash collections, including comparison to recorded net patient service revenues; |
|
|
• |
tenants' free cash flow; |
|
|
• |
the potential impact of healthcare pandemics/epidemics, legislation, and other regulations (including changes in reimbursement) on our tenants' profitability and liquidity; |
|
|
• |
the potential impact of any legal, regulatory, or compliance proceedings with our tenants; |
|
|
• |
an ongoing assessment of the operating environment of our tenants, including demographics, competition, market position, status of compliance, accreditation, quality performance, and health outcomes as measured by The Centers for Medicare and Medicaid Services ("CMS"), Joint Commission, and other governmental bodies in which our tenants operate; and |
|
|
• |
the level of investment in the hospital infrastructure and health IT systems. |
In addition to the key factors above, we analyze the physician relationships with the hospital and study admissions to understand how broad such referrals are to the hospital. Finally, we always address two primary questions when underwriting an investment – 1) is this hospital truly needed in the market and 2) would the community suffer were the hospital not there. We believe answers to these two questions provide significant insight on whether or not to move forward with a particular investment.
Healthcare Industry
The delivery of healthcare services, whether in the U.S. or elsewhere, requires real estate. The global outbreak of COVID-19 has further validated this, as hospitals during the pandemic have proven invaluable. As a consequence, healthcare providers depend on real estate to maintain and grow their businesses. We believe that the healthcare real estate market provides investment opportunities due to the:
|
|
• |
compelling demographics driving the demand for health services; |
|
|
• |
specialized nature of healthcare real estate investing; and |
|
|
• |
consolidation of the fragmented healthcare real estate sector. |
9
As noted previously, we have investments in nine different countries around the world and across four continents. Although there are regulatory, cultural, and other differences between these countries, the importance of healthcare and its impact on the economy is a consistent theme. See below for details of the healthcare industry in each of the countries in which we do business:
United States
|
|
• |
U.S. citizens receive healthcare primarily through private (via insurance carried by the individual or its employer) or public (Medicare/Medicaid) payors. |
|
|
• |
U.S. currently ranks highest in overall health expenditure in the world with $3.8 trillion in 2019, or $11,582 per person. U.S. health expenditures as a percentage of Gross Domestic Product (“GDP”) were 17.7% in 2019. |
|
|
• |
National health spending is projected to grow at an average annual rate of 5.4% between 2019 and 2028. |
|
|
• |
The largest share of total health spending was sponsored by the federal government at 29.0% and the households at 28.4%, while private business accounted for 19.1%, state and local governments made up 16.1%, and other private revenues accounted for 7.4% of total healthcare spending. |
|
|
• |
Medicare spending grew 6.7% to $799.4 billion in 2019, or 21% of National Health Expenditures (“NHE”). Among major payers, Medicare is expected to experience the fastest spending growth (7.6% per year over 2019 to 2028), largely as a result of having the highest projected enrollment growth. |
|
|
• |
Medicaid spending grew 2.9% to $613.5 billion in 2019, or 16% of total NHE. |
|
|
• |
Hospital expenditures grew 6.2% to $1,192.0 billion in 2019. |
|
|
• |
Prescription drug spending increased 5.7% to $369.7 billion in 2019. |
United Kingdom
|
|
• |
All English residents are entitled to public healthcare through the National Health Service (“NHS”), including hospital, physician, and mental health care. |
|
|
• |
In 2015, 10.5% of the United Kingdom population carried voluntary supplemental insurance to gain more rapid access to elective care. |
|
|
• |
Publicly owned hospitals are organized either as NHS trusts accountable to the Department of Health (53 as of 2018) or as foundation trusts (133 as of 2018) regulated by NHS Improvement. |
|
|
• |
There were approximately 515 private hospitals in the United Kingdom as of 2017. |
|
|
• |
As of 2015-2016, 7.6% of the NHS revenue was spent on private hospitals. |
|
|
• |
Healthcare expenditures increased from £197.3 billion in 2017 to £214.0 billion in 2018, a 5.5% increase. |
|
|
• |
In 2019, the United Kingdom spent 10.3% of GDP on healthcare, which ranked seventh out of all European countries. |
|
|
• |
In 2018, 75% of private healthcare for United Kingdom-based patients was funded by private insurance. |
Germany
|
|
• |
As of 2017, approximately 11% of the German population was covered by private health insurance while approximately 87% was covered by public health insurance. |
|
|
• |
Health expenditures were €390.6 billion, or €4,712 per person, in 2018, which was a 4% increase from 2017. |
|
|
• |
Health expenditures were 11.7% of GDP in 2018, the second highest share of GDP in all of Europe. |
|
|
• |
Health insurance in Germany is compulsory and consequently offers almost universal coverage. |
|
|
• |
Germany has the highest number of hospital beds in Europe, about eight per 1,000 people. |
|
|
• |
Hospital activity is very high in Germany with 257 discharges per 100,000 people, much higher than the European Union average of 172 per 100,000. |
|
|
• |
In 2017, 28% of healthcare expenditures were related to hospitals. |
10
Switzerland
|
|
• |
Switzerland operates a universal healthcare system which is highly decentralized with the cantons, or states, playing a key role in its operation. |
|
|
• |
Health expenditures were 12.2% of GDP as of 2016, which was the highest in all of Europe. |
|
|
• |
Publicly financed healthcare accounted for 63% of health spending in 2016. |
|
|
• |
General taxes financed 17% of total health expenditures in 2016. |
|
|
• |
In 2016, there were 283 total hospitals (102 general and 181 specialty). |
|
|
• |
In 2016, hospital care represented 35% of total health expenditures. |
Australia
|
|
• |
In 2018-2019, 68% of health spending was by governments. Of this, the Australian Government contributed 60% and state and territory governments contributed 40%. Private insurance funded 9% of the total. |
|
|
• |
From 2018 to 2019, total health spending increased by 3.1% to A$195.7 billion, or A$7,772 per person. |
|
|
• |
The majority of health spending went towards hospitals (40%) and primary health care (34%). |
|
|
• |
In 2018-2019, health spending accounted for 10% of GDP in Australia. |
|
|
• |
Private hospitals account for 22%, or A$17 billion, of total hospital expenditures in Australia. |
Spain
|
|
• |
The Spanish healthcare system provides universal coverage and access to healthcare without additional expense to the patient. |
|
|
• |
The healthcare system is primarily paid for from general taxation, with approximately 71% of health spending in 2015 being publicly funded. |
|
|
• |
Health expenditures as a percentage of GDP were 8.9% in 2018. |
|
|
• |
56% of all hospitals were private in 2018. |
|
|
• |
As of 2015, Spain had the highest life expectancy among all European Union countries at 83 years. |
Italy
|
|
• |
Italy’s healthcare system provides universal coverage for all citizens and legal foreign residents. |
|
|
• |
The healthcare system is funded by corporate and value-added tax revenues collected by the central government. |
|
|
• |
In 2018, total health expenditures were 8.8% of GDP. |
|
|
• |
Annual private healthcare spending has increased by approximately 15% from 2012 to 2018, totaling nearly €40 billion. |
|
|
• |
Approximately 10% of the population have some form of voluntary health insurance. |
Portugal
|
|
• |
Portugal provides universal health coverage to its citizens through its National Health Service, which is financed through taxation. |
|
|
• |
Private health insurance complements the public sector and approximately 15% of the population have private health insurance, mainly through corporate group policies. |
|
|
• |
Several private healthcare corporations operate hospitals in Portugal. |
|
|
• |
Health spending in Portugal accounted for 9.6% of GDP in 2019. |
Colombia
|
|
• |
Colombia provides universal public and private coverage where all citizens are entitled to a comprehensive health benefit package. |
11
|
|
• |
Private health insurance is available for purchase through different private companies. |
|
|
• |
In 2019, health expenditures were 7.3% of GDP. |
|
|
• |
As of 2016, there were 1,124 hospitals and clinics in Colombia, with 32% of these being private. |
Our Leases and Loans
The leases for our facilities are generally “net” leases with terms requiring the tenant to pay all ongoing operating and maintenance expenses of the facility, including property, casualty, general liability, and other insurance coverages, utilities, and other charges incurred in the operation of the facilities, as well as real estate and certain other taxes, ground lease rent (if any), and the costs of capital expenditures, repairs, and maintenance (including any repairs mandated by regulatory requirements). Similarly, borrowers under our mortgage loan arrangements retain the responsibilities of ownership, including physical maintenance and improvements and all costs and expenses. Our leases and loans typically require our tenants to indemnify us for any past or future environmental liabilities. Our current leases and loans have a weighted-average remaining initial term of 15.5 years (see Item 2 for more information on remaining lease and loan terms) and most include renewal options at the election of our tenants. Based on current monthly revenue, approximately 99% of our leases and mortgage loans provide for some type of inflation-protected annual rent or interest escalations based on increases in the consumer price index (“CPI”), or similar indexes for properties outside the U.S., and/or fixed minimum annual rent or interest escalations ranging from 0.5% to 3.0%.
RIDEA and Similar Investments
We have made, and may make in the future, investments in certain of our tenants in the form of equity investments, loans (with equity like returns), or profit interests. Some of these investments fall under a structure permitted by the REIT Investment Diversification and Empowerment Act of 2007 (“RIDEA”), which was signed into law under the Housing and Economic Recovery Act of 2008. Under the provisions of RIDEA, a REIT may lease “qualified health care properties” on an arm’s length basis to a TRS if the property is operated by an entity who qualifies as an “eligible independent contractor.” We view RIDEA as a structure primarily to be used on properties that present attractive valuation entry points. At December 31, 2020, our RIDEA and similarly structured investments totaled approximately $171.4 million.
Significant Tenants
On a total pro forma gross asset basis, as more fully described in the section titled “Non-GAAP Financial Measures” in “Management’s Discussion and Analysis of Financial Condition and Results of Operations” in Item 7 of this Annual Report on Form 10-K, our top five tenants were as follows (dollars in thousands):
Total Pro Forma Gross Assets by Operator
|
|
|
As of December 31, 2020 |
|
|
As of December 31, 2019 |
|
||||||||||||
|
Operators |
|
Total Pro Forma Gross Assets |
|
|
|
Percentage of Total Pro Forma Gross Assets |
|
|
Total Pro Forma Gross Assets |
|
|
|
Percentage of Total Pro Forma Gross Assets |
|
||||
|
Steward |
|
$ |
4,506,173 |
|
|
|
|
22.0 |
% |
|
$ |
4,052,162 |
|
|
|
|
24.5 |
% |
|
Circle |
|
|
2,520,019 |
|
|
|
|
12.3 |
% |
|
|
2,152,951 |
|
|
|
|
13.0 |
% |
|
Prospect |
|
|
1,597,950 |
|
|
|
|
7.8 |
% |
|
|
1,563,642 |
|
|
|
|
9.5 |
% |
|
Priory |
|
|
1,566,087 |
|
|
|
|
7.7 |
% |
|
|
— |
|
|
|
|
— |
|
|
MEDIAN |
|
|
1,261,035 |
|
|
|
|
6.2 |
% |
|
|
1,025,765 |
|
|
|
|
6.2 |
% |
|
Other operators |
|
|
8,185,578 |
|
|
|
|
40.1 |
% |
|
|
6,831,211 |
|
|
|
|
41.4 |
% |
|
Other assets |
|
|
792,739 |
|
|
|
|
3.9 |
% |
|
|
903,543 |
|
|
|
|
5.4 |
% |
|
Total |
|
$ |
20,429,581 |
|
|
|
|
100.0 |
% |
|
$ |
16,529,274 |
|
|
|
|
100.0 |
% |
Steward
Affiliates of Steward Health Care System LLC (collectively, “Steward”) lease 36 facilities pursuant to one master lease agreement, which had an initial 15-year term (ending in October 2031) with three five-year extension options, plus annual inflation-based escalators. At December 31, 2020, these facilities had an average remaining initial lease term of 10.8 years. The master lease agreement includes extension options that must include all or none of the master leased properties and a right of first refusal for the repurchase of the leased properties. In addition to the master lease, we hold a promissory note which consists of three tranches with varying terms and a 9.9% equity investment in Steward.
12
Circle
Affiliates of Circle Health Ltd. (collectively, “Circle”) lease 36 facilities pursuant to separate lease agreements. Of these leases, 30 are cross-defaulted individual leases guaranteed by Circle and have initial fixed terms ending in 2050, with two five-year extension options plus annual inflation-based escalators. The remaining six facilities are leased pursuant to five separate leases with a weighted-average remaining lease life of 13.9 years along with annual inflation-based escalators and extension options.
Prospect
Affiliates of Prospect Medical Holdings, Inc. (collectively, “Prospect”) lease 13 facilities pursuant to two master lease agreements. Both master leases had initial fixed terms of 15 years (ending in August 2034) and contain three extension options plus annual inflation-based escalators. In addition to these master leases, we hold a mortgage loan secured by a first mortgage on an acute care hospital and a term loan, which we expect will be converted into the acquisition of two additional acute care hospitals upon the satisfaction of certain conditions. The master leases, mortgage loan, and term loan are all cross-defaulted and cross-collateralized.
Priory
On December 30, 2020, we entered into definitive agreements to acquire 35 to 40 behavioral health facilities owned and operated by Priory Group (“Priory”) for approximately £800 million, as more fully described in Note 8 to Item 8 of this Annual Report on Form 10-K. The facilities we acquire will be subject to a master lease type structure with an initial term of 25 years and two 10-year extension options, with annual inflation-based escalators.
MEDIAN
Affiliates of Median Kliniken S.á.r.l. (“MEDIAN”) lease 78 facilities (70 of which are owned by a joint venture arrangement – see Note 3 of Item 8 of this Annual Report on Form 10-K for more information) pursuant to four master lease agreements and one stand-alone lease. None of the master lease agreements have renewal or repurchase options. The master leases provide for inflation-based escalators. The lease term for all the master leases ends in 2040 or later.
No other tenant accounted for more than 6% of our total pro forma gross assets at December 31, 2020.
Environmental Matters
Under various U.S. federal, state, and local environmental laws and regulations and similar international laws, a current or previous owner, operator, or tenant of real estate may be required to remediate hazardous or toxic substance releases or threats of releases. There may also be certain obligations and liabilities on property owners with respect to asbestos containing materials. Investigation, remediation, and monitoring costs may be substantial. The confirmed presence of contamination or the failure to properly remediate contamination on a property may adversely affect our ability to sell or rent that property or to borrow funds using such property as collateral and may adversely impact our investment in that property. Generally, prior to completing any acquisition or closing any mortgage loan, we obtain Phase I environmental assessments (or similar studies outside the U.S.) in order to attempt to identify potential environmental concerns at the facilities. These assessments are carried out in accordance with an appropriate level of due diligence and generally include a physical site inspection, a review of relevant environmental and health agency database records, one or more interviews with appropriate site-related personnel, review of the property’s chain of title, and review of historic aerial photographs and other information on past uses of the property. We may also conduct limited subsurface investigations and test for substances of concern where the results of the Phase I environmental assessments or other information indicates possible contamination or where our consultants recommend such procedures. Upon closing and for the remainder of the lease or loan term, our transaction documents require our tenants to repair and remediate environmental issues at the applicable facility, and to comply in full with all environmental laws and regulations.
Seismic Standards
California Seismic Standards
The Alfred E. Alquist Hospital Facilities Seismic Safety Act of 1983 (“Alquist Act”), establishes, under the jurisdiction of the Office of Statewide Health Planning and Development (“OSHPD”), a program of seismic safety building standards for certain hospitals constructed on and after March 7, 1973. The law requires the California Building Standards Commission to adopt earthquake performance categories, seismic evaluation procedures, standards and timeframes for upgrading certain facilities, and seismic retrofit building standards. This legislation was adopted to avoid the loss of life and the disruption of operations and the provision of emergency medical services that may result from structural damage sustained to hospitals resulting from an earthquake. A violation of any provision of the act is a misdemeanor.
13
Under the Alquist Act and related rules and regulations, all general acute care hospital buildings in California are assigned a structural performance category (“SPC”). SPC ratings range from 1 to 5 with SPC-1 assigned to buildings that may be at risk of collapse during a strong earthquake and SPC 5 assigned to buildings reasonably capable of providing services to the public following a strong earthquake. Pursuant to the Alquist Act, state law initially required all SPC-1 buildings to be removed from providing general acute care services by 2020 and all SPC-2 buildings to be removed from providing general acute care services by 2030. However, in 2017, OSHPD adopted a new performance category that allowed hospitals to explore the possibilities of upgrading nonconforming buildings to a new performance level that is not as rigorous. Under SPC-4D, buildings undergoing a retrofit to this level can continue functioning indefinitely beyond 2030. In addition, California AB 2190 bill required OSHPD to grant an additional extension of time to an owner who was subject to the January 1, 2020, deadline if specified conditions were met. The bill authorized the additional extension to be until July 1, 2022, if the compliance plan was based upon replacement or retrofit or up to five years if the compliance plan was for a rebuild.
As of December 31, 2020, we have 23 licensed hospitals in California totaling investments of approximately $1.4 billion. Exclusive of one hospital granted an OSHPD extension to 2022 (representing less than 0.7% of our total assets), under California AB 2190, all of our California hospitals are seismically compliant through 2030 as determined by OSHPD. We expect full compliance by 2022 for the one remaining hospital.
Colombia Seismic Standards
Similar to California, the design, construction, and technical supervision of buildings in Colombia must meet certain minimum seismic standards. Such standards divide the country into seismic hazard zones: low threat, intermediate threat, and high threat. Two of our facilities are located in Bogotá, an intermediate threat zone, and one is located in Pereira, a high threat zone.
In addition, all buildings are classified into use groups. Clinical hospitals and health centers fall into Group IV, which are deemed indispensable buildings and are held to a higher standard of earthquake resistant construction. Buildings in Group IV are considered essential for the recovery of the community after the occurrence of an emergency, including an earthquake, and the additional structural requirements are in place to ensure that they can remain operational.
As of December 31, 2020, we estimate that our three facilities need approximately $7 million of seismic upgrades to become compliant under Colombian law. The deadline for making such upgrades is December 2021, which we fully expect to meet.
Under our current lease and loan agreements, our tenants (or borrowers) are responsible for capital expenditures in connection with seismic laws. We do not expect California or Colombia seismic standards to have a negative impact on our financial condition or cash flows. We also do not expect compliance with seismic standards to materially impact the financial condition of our tenants.
Competition
We compete in acquiring and developing facilities with financial institutions, other lenders, real estate developers, healthcare operators, other REITs, other public and private real estate companies, and private real estate investors. Among the factors that may adversely affect our ability to compete are the following:
|
|
• |
we may have less knowledge than our competitors of certain markets in which we seek to invest in or develop facilities; |
|
|
• |
some of our competitors may have greater financial and operational resources than we have; |
|
|
• |
some of our competitors may have lower costs of capital than we do; |
|
|
• |
our competitors or other entities may pursue a strategy similar to ours; and |
|
|
• |
some of our competitors may have existing relationships with our potential tenants/operators. |
To the extent that we experience vacancies in our facilities, we will also face competition in leasing those facilities to prospective tenants. The actual competition for tenants varies depending on the characteristics of each local market. Virtually all of our facilities operate in highly competitive environments, and patients and referral sources, including physicians, may change their preferences for healthcare facilities from time-to-time. The operators of our properties compete on a local and regional basis with operators of properties that provide comparable services. Operators compete for patients based on a number of factors including quality of care, reputation, physical appearance of a facility, location, services offered, physicians, staff, and price. We also face competition from other healthcare facilities for tenants, such as physicians and other healthcare providers that provide comparable facilities and services.
For additional information, see “Risk Factors” in Item 1A of this Annual Report on Form 10-K.
14
Insurance
Our leases and mortgage loans require our tenants to maintain several types of insurance, including but not limited to property, business interruption, general liability and professional liability insurance. In addition, we have a comprehensive insurance program to further protect our interests. At December 31, 2020, we believe that the policy specifications and insured limits are appropriate given the relative risk of loss, the cost of the coverage, and standard industry practice.
Healthcare Regulatory Matters
The following discussion describes certain material federal healthcare laws and regulations that may affect our operations and those of our tenants. The discussion, however, does not address all applicable federal healthcare laws, and does not address state healthcare laws and regulations, except as otherwise indicated. These state laws and regulations, like the federal healthcare laws and regulations, could affect the operations of our tenants and, accordingly, our operations. In addition, in some instances we own a minority interest in our tenants’ operations and, in addition to the effect on our tenant’s ability to meet its financial obligations to us, our ownership and investment returns may also be negatively impacted by such laws and regulations. Moreover, the discussion relating to reimbursement for healthcare services addresses matters that are subject to frequent review and revision by Congress and the agencies responsible for administering federal payment programs. Consequently, predicting future reimbursement trends or changes, along with the potential impact to us, is inherently difficult and imprecise. Finally, though we have not included a comprehensive discussion of applicable foreign laws or regulations, our tenants in Europe, Australia, and South America are subject to similar laws and regulations governing the ownership or operation of healthcare facilities including, without limitation, laws governing patient care and safety, reimbursement, licensure, and data protection.
Ownership and operation of hospitals and other healthcare facilities are subject, directly and indirectly, to substantial U.S. federal, state, and local government healthcare laws, rules, and regulations. Our tenants’ failure to comply with these laws and regulations could adversely affect their ability to meet their obligations to us. Physician investment in our facilities or in real estate joint ventures also will be subject to such laws and regulations. Although we are not a healthcare provider or in a position to influence the referral of patients or ordering of items and services reimbursable by the federal government, to the extent that a healthcare provider engages in transactions with our tenants, such as sublease or other financial arrangements, the Anti-Kickback Statute and the Stark Law (both discussed in this section), and any state counterparts thereto, could be implicated. Our leases and mortgage loans require our tenants to comply with all applicable laws, including healthcare laws. We intend for all of our business activities and operations to conform in all material respects with all applicable laws, rules, and regulations, including healthcare laws, rules, and regulations.
As in the U.S. under HIPAA, our tenants in foreign jurisdictions are typically subject to strict laws and regulations governing data protection, generally, and the protection of a patient’s personal health information, specifically. Tenants may also be subject to laws and regulations addressing billing and reimbursement for healthcare items and services. Furthermore, in certain cases, as with certificate of need laws in the U.S., government approval may also be required prior to the transfer of a healthcare facility or prior to the establishment of new or replacement facilities, the addition of beds, the addition or expansion of services, and certain capital expenditures. Our leases and loan documents require our tenants, both domestic and foreign, to comply with all applicable laws, including healthcare laws, and we intend for all our business activities and operations in such jurisdictions to conform in all material respects with all applicable healthcare laws, rules, and regulations.
Applicable Laws (not intended to be a complete list)
Anti-Kickback Statute. The federal Anti-Kickback Statute (codified at 42 U.S.C. § 1320a-7b(b)) prohibits, among other things, the offer, payment, solicitation, or acceptance of remuneration, directly or indirectly, in return for referring an individual to a provider of items or services for which payment may be made in whole, or in part, under a federal healthcare program, including the Medicare or Medicaid programs. Violation of the Anti-Kickback Statute is a crime, punishable by fines of up to $100,000 per violation, ten years imprisonment, or both. Violations may also result in civil sanctions, including civil monetary penalties of up to $50,000 per violation, exclusion from participation in federal healthcare programs, including Medicare and Medicaid, and additional monetary penalties in amounts treble to the underlying remuneration. The Anti-Kickback Statute is an intent based statute, and has been broadly interpreted. As an example, courts have held that there is a violation of the Anti-Kickback Statute if just one purpose of an arrangement is to generate referrals despite the fact that there may be one or more other lawful purposes to the arrangement at issue.
The Office of Inspector General of the Department of Health and Human Services (“OIG”) has issued “Safe Harbor Regulations” that describe practices that will not be considered violations of the Anti-Kickback Statute. Nonetheless, the fact that a particular arrangement does not meet safe harbor requirements does not also mean that the arrangement violates the Anti-Kickback Statute. Rather, the safe harbor regulations simply provide a guaranty that qualifying arrangements will not be prosecuted under the Anti-Kickback Statute. The OIG recently issued revisions to the Safe Harbor Regulations aimed at reducing barriers to care coordination and allowing for greater flexibility in pursuing value-based care arrangements. Among other things, the revisions include new safe harbor protection for certain arrangements involving value-based care, patient engagement and support, cybersecurity technology and services, and outcomes-based payments. We intend to use commercially reasonable efforts to structure our
15
arrangements so as to satisfy, or meet as closely as possible, all safe harbor conditions. We cannot assure you, however, that we will meet all the conditions for an applicable safe harbor.
Physician Self-Referral Statute (“Stark Law”). Unless subject to an exception, the Ethics in Patient Referrals Act of 1989, or the Stark Law (codified at 42 U.S.C. § 1395nn) prohibits a physician from making a referral to an “entity” furnishing “designated health services” (which would include, without limitation, certain inpatient and outpatient hospital services) paid by Medicare or Medicaid if the physician or a member of his immediate family has a “financial relationship” with that entity. A reciprocal prohibition bars the entity from billing Medicare or Medicaid for any services furnished pursuant to a prohibited referral. Sanctions for violating the Stark Law include denial of payment, refunding amounts received for services provided pursuant to prohibited referrals, civil monetary penalties of up to $15,000 per prohibited service provided, and exclusion from the participation in federal healthcare programs. The statute also provides for a penalty of up to $100,000 for a circumvention scheme.
There are exceptions to the self-referral prohibition for many of the customary financial arrangements between physicians and providers, including, without limitation, employment contracts, rental of office space or equipment, personal services agreements and recruitment agreements. Unlike safe harbors under the Anti-Kickback Statute, the Stark Law imposes strict liability on the parties to an arrangement, and an arrangement must comply with every requirement of a Stark Law exception or the arrangement is in violation of the Stark Law.
CMS has issued multiple phases of final regulations implementing the Stark Law and continues to make changes to these regulations. For example, consistent with the OIG’s safe harbor revisions noted above, CMS recently adopted new exceptions for value-based arrangements and finalized protection for certain non-abusive arrangements, such as donations of cybersecurity technology. These and other proposals continue to focus on lowering barriers to care coordination and management to make it easier for providers to enter into value-based arrangements without running afoul of self-referral (and kickback) laws. Although our lease and loan agreements require lessees and borrowers to comply with the Stark Law and we intend for our tenants to comply with the Stark Law, we cannot offer assurance that the arrangements entered into by us and our facilities will be found to be in compliance with the Stark Law, as it ultimately may be implemented or interpreted. In addition, changes to the Stark Law could require our tenants to restructure certain arrangements with physicians, which could impact the business of our tenants.
False Claims Act. The federal False Claims Act prohibits the making or presenting of any false claim for payment to the federal government. It is the civil equivalent to federal criminal provisions prohibiting the submission of false claims to federally funded programs. Additionally, qui tam, or whistleblower, provisions of the federal False Claims Act allow private individuals to bring actions on behalf of the federal government alleging that the defendant has defrauded the federal government. Whistleblowers may collect a portion of the federal government’s recovery — an incentive for private parties to bring such actions. A successful federal False Claims Act case may result in a penalty of three times the actual damages, plus additional civil penalties payable to the government, plus reimbursement of the fees of counsel for the whistleblower. Many states have enacted similar statutes preventing the presentation of a false claim to a state government.
The Civil Monetary Penalties Law. The Civil Monetary Penalties Law (“CMPL”) is a comprehensive statute that covers an array of fraudulent and abusive activities and is very similar to the False Claims Act. Among other things, the CMPL prohibits the knowing presentation of a claim for certain healthcare services that is false or fraudulent, the presentation of false or misleading information in connection with claims for payment, and other acts involving fraudulent conduct. Violation of the CMPL may result in penalties ranging from $20,000 to in excess of $100,000 (penalties are periodically adjusted). Notably, such penalties apply to each instance of prohibited conduct, including, for example, each item or service not provided as claimed, and each provision of false information or each false record. In addition, violators of the CMPL may be penalized up to three times the amount unlawfully claimed and may be excluded from participation in federal healthcare programs.
Licensure. Our tenants are subject to extensive federal, state, and local licensure, certification, and inspection laws and regulations including, in some cases, certificate of need laws. Further, various licenses and permits are required to dispense narcotics, operate pharmacies, handle radioactive materials, and operate equipment. Failure to comply with any of these laws could result in loss of licensure, certification, or accreditation, denial of reimbursement, imposition of fines, and suspension or decertification from federal and state healthcare programs.
EMTALA. Our tenants that provide emergency care in the U.S. are subject to the Emergency Medical Treatment and Active Labor Act (“EMTALA”). Regardless of an individual’s ability to pay, this federal law requires such healthcare facilities to conduct an appropriate medical screening examination of every individual who presents to the hospital’s emergency room for treatment and, if the individual is suffering from an emergency medical condition, to either stabilize the condition or make an appropriate transfer of the individual to a facility able to handle the condition. Liability for violations of EMTALA are severe and include, among other things, civil monetary penalties and exclusion from participation in federal healthcare programs. Our lease and mortgage loan agreements require our tenants to comply with EMTALA, and we believe our tenants conduct business in substantial compliance with EMTALA.
16
Reimbursement Pressures. Healthcare facility operating margins have faced significant pressure due to the deterioration in pricing flexibility and payor mix, a continued shift toward alternative payment models, increases in operating expenses that exceed increases in payments under the Medicare program, reductions in levels of Medicaid funding due to state budget shortfalls, and other similar cost pressures on our tenants. More specifically, certain facilities and departments such as IRFs, LTACHs, and Hospital Outpatient Departments (“HOPDs”) face reimbursement pressures because of legislative and regulatory restrictions and limitations on reimbursement. We cannot predict how and to what extent these or other initiatives will impact the business of our tenants or whether our business will be adversely impacted.
Healthcare Reform. The Patient Protection and Affordable Care Act, as amended by the Health Care and Education Reconciliation Act of 2010 (collectively, the “ACA”) has expanded health insurance coverage through tax subsidies and federal health insurance programs, individual and employer mandates for health insurance coverage, and health insurance exchanges. A number of reforms stem from the ACA and federal agencies, including CMS, continue to propose and implement policies founded in the ACA. These include various cost containment initiatives, quality improvement efforts, pay-for-performance criteria, and value-based purchasing programs, among others. Health information technology standards for healthcare providers also continue to be implemented as a means of improving quality and reducing costs. The new presidential administration has indicated that it will maintain and build upon the ACA and has suggested proposals that would include the adoption of a public health insurance option, increasing the value of current tax credits related to insurance premiums, and expanding coverage to low-income individuals. We cannot predict the impact of the new presidential administration’s proposals, if adopted, on our business, as some aspects may benefit the operations of our tenants, while other aspects may present challenges.
COVID-19 Pandemic. The global outbreak of COVID-19 in 2020, including in countries where we own and lease facilities, has further validated our business model, which focuses on hospitals as the centerpiece of healthcare delivery across the world. Countries have sought to ensure that their populations have access to hospitals during this time and we, along with our operators, have executed on several accretive growth initiatives during 2020 and early 2021 despite the environment created by the COVID-19 pandemic.
In 2020, we invested approximately $3.6 billion in hospital real estate, and we have invested another $1.1 billion in 2021. Despite the economic impact of the COVID-19 pandemic, which caused many of our tenants to have temporary disruption in their business to save beds for potential COVID-19 patients, we have collected approximately 98% of our expected rent and interest payments for 2020, and we have agreements in place to collect the remaining deferred portions with interest. Since October 1, 2020, we have received all of our rent and interest as expected. Additionally, we have maintained liquidity during the COVID-19 pandemic by raising more than $1.1 billion in proceeds through sales of our common stock in our at-the-market program during 2020 and an underwritten public offering in January 2021, receiving more than $500.0 million from payoffs on our loan portfolio and divestitures, and completing a $1.3 billion, 3.50% senior unsecured notes offering, of which approximately $833 million was used to refinance higher interest-rate debt.
Human Capital
Our employees are our most valuable asset. Led by our three founding executives, we have a total of 106 high-performing employees as of February 19, 2021, located in the U.S., Luxembourg, and Australia. As we continue to grow, we expect our head count to increase as well. However, we do not believe that any year-over-year adjustments to the number of employees will have a material effect on our operations or to general and administrative expense as a percent of revenues. None of our employees are members of any union.
We believe that our relations with our employees are good, and we are committed to providing a dynamic and supportive workplace for our employees that encourages both personal and professional growth through significant training and continuing education opportunities. We offer employees the opportunity to attend continuing education courses in order to maintain their professional certifications, participate in seminars and workshops on topics related to their job responsibilities, and build upon their leadership abilities through management development programs. In addition, we provide regular training for all employees on topics such as personal safety, cybersecurity, and data security awareness, and we have established company-wide human rights, and health and safety policies.
We offer a competitive benefits package including annual performance-based bonuses and stock compensation, a 401(k) plan, leading healthcare and insurance benefits, paid time off, health and wellness reimbursement programs, etc. designed to help recruit and retain high-quality, motivated employees, and to ensure their health and security. We routinely evaluate and benchmark the competitiveness of our compensation and benefit programs to ensure that we are rewarding our employees and supporting their needs. During the majority of 2020, most of our employees worked remotely and will continue to do so for the foreseeable future in order to protect their health and that of their families. For those employees who needed to work in the office from time-to-time, we monitored their symptoms, provided access to personal protective equipment, and established proper social distancing and sanitary procedures.
Given the value placed on our employees and their interests, we believe it is important to improve the communities in which they live. We do this by providing financial support for private and public non-profit programs aimed at improving community public
17
health and supporting the diverse interests of our employees. In addition, we encourage each of our employees to get involved in their communities to make a positive difference, and we provide time off to do so.
We are firmly committed to providing equal opportunity in all aspects of employment. We forbid discrimination against any person or harassment, intimidation, or hostility of any kind, including on the basis of race, religion, color, sex, sexual orientation, sexual or gender identity, age, disability, national origin, military or veteran status, retaliation or any other characteristic or conduct that may be protected by applicable local, state, or federal law. Our hiring process includes a robust search for the best available candidate and having each candidate interview with numerous MPT employees in order to thoroughly vet him or her. The company also retains the services of an experienced independent industrial psychologist to ensure a strong fit exists between the company and the candidate and that the candidate meets the standards for the specific job and the needs of the company. We provide regular training on anti-harassment policies. Our commitment to a diverse and inclusive workplace is demonstrated by the following:

Available Information
Our website address is www.medicalpropertiestrust.com and provides access in the “Investor Relations” section, free of charge, to our annual reports on Form 10-K, quarterly reports on Form 10-Q, current reports on Form 8-K, including exhibits, and all amendments to these reports as soon as reasonably practicable after such material is electronically filed with or furnished to the SEC. We use, and intend to continue to use, the “Investor Relations” section of our website as a means of disclosing material nonpublic information and of complying with our disclosure obligations under Regulation FD, including, without limitation, through the posting of investor presentations that may include material nonpublic information. Accordingly, investors should monitor the “Investor Relations” section, in addition to following our press releases, SEC filings, public conference calls, presentations, and webcasts. Also available on our website, free of charge, are our Corporate Governance Guidelines, the charters of our Ethics, Nominating, and Corporate Governance, Audit and Compensation Committees and our Code of Ethics and Business Conduct. If you are not able to access our website, the information is available in print free of charge to any stockholder who should request the information directly from us at (205) 969-3755. Information on or connected to our website is neither part of nor incorporated by reference into this Annual Report on Form 10-K or any other SEC filings.
18
|
ITEM 1A. |
Risk Factors |
The risks and uncertainties described herein are not the only ones facing us and there may be additional risks that we do not presently know of or that we currently consider not likely to have a significant impact on us. All of these risks could adversely affect our business, results of operations, financial condition, and our ability to service our debt and make distributions to our stockholders. Some statements in this report including statements in the following risk factors constitute forward-looking statements. Please refer to the section entitled “Cautionary Language Regarding Forward Looking Statements” at the beginning of this Annual Report.
RISKS RELATED TO OUR BUSINESS AND GROWTH STRATEGY
The ongoing outbreak of COVID-19 could adversely impact our financial condition and results of operations.
The spread of the COVID-19 virus during 2020 and beyond has negatively affected economies around the globe and the healthcare industry has experienced significant volatility, which has adversely affected our tenants’ respective businesses, financial condition, liquidity and results of operations. We own hospitals throughout the U.S., as well as in some of the hardest hit countries in Europe, including Germany, Spain, Italy and the United Kingdom. As the pandemic evolved in 2020, many countries reacted by instituting quarantines and restrictions on travel, closing financial markets and/or restricting trade, including requiring non-critical surgeries and treatments be deferred at hospitals to make beds available for COVID-19 patients. Deferring these treatments resulted in reductions in revenue for our tenant operators, while funding continued for the physicians, nurses, equipment, drugs, and supplies that this particular illness required. Accordingly, many operators in the hospital industry, including our tenants, looked to their cash reserves and/or government support to bridge the disruption in their cash flows.
Although most hospitals are back accepting patients and performing medically necessary elective procedures, the COVID-19 pandemic continues to evolve, and the extent of its effect will depend on future developments, which are highly uncertain and cannot be predicted with confidence, including the duration, scope and severity of the pandemic, the actions taken to contain or mitigate its impact (including vaccines), and the direct and indirect economic effects of the pandemic and related containment measures, among others. The COVID-19 pandemic continues to present material uncertainty and risk with respect to the performance, financial condition, results of operations, and cash flows of our tenant operators, and thus on their continued ability to pay us rent and interest in a timely manner or at all. If our tenant operators are unable to meet their payment obligations to us, our performance, financial condition, and cash flows could be materially adversely effected, along with our ability to grow our portfolio through new investments, service our debt in accordance with our debt agreements, and make quarterly distributions to our shareholders (whether at reduced levels or at all).
Adverse U.S. and global market, economic and political conditions, health crises and other events beyond our control could have a material adverse effect on our business, results of operations, and financial condition.
Another economic or financial crisis, significant concerns over energy costs, geopolitical issues, the availability and cost of credit, or a declining real estate market in the U.S. or abroad can contribute to increased volatility, diminished expectations for the economy and the markets, and high levels of structural unemployment by historical standards. As was the case from 2008 through 2010, these factors, combined with volatile oil prices and fluctuating business and consumer confidence, can precipitate a steep economic decline.
Adverse U.S. and global market, economic and political conditions, including dislocations and volatility in the credit markets and general global economic uncertainty, could have a material adverse effect on our business, results of operations, and financial condition as a result of the following potential consequences, among others:
|
|
• |
reduced values of our properties may limit our ability to dispose of assets at attractive prices, or at all, or to obtain debt financing secured by our properties and may reduce the availability of unsecured loans; and |
|
|
• |
our ability to obtain financing on terms and conditions that we find acceptable, or at all, may be limited, which could reduce our ability to pursue acquisition and redevelopment opportunities and refinance existing debt, reduce our returns from our acquisition and redevelopment activities and increase our future interest expense. |
Public health crises, pandemics and epidemics, such as those caused by new strains of viruses such as H5N1 (avian flu), severe acute respiratory syndrome (SARS) and, most recently, COVID-19, could adversely impact our and our tenants’ business by disrupting supply chains and transactional activities, and negatively impacting local, national, or global economies.
19
Our revenues are dependent upon our relationships with and success of our tenants, particularly our largest tenants, like Steward, Circle, Prospect, Priory, and MEDIAN.
Our relationships with tenants and their financial performance and resulting ability to satisfy their lease and loan obligations to us are material to our financial results and our ability to service our debt and make distributions to our stockholders. We are dependent upon the ability of these tenants to make rent and loan payments to us, and any failure to meet these obligations could have a material adverse effect on our financial condition and results of operations.
As of December 31, 2020, our largest tenants – Steward, Circle, Prospect, Priory, and MEDIAN – represented 22.0%, 12.3%, 7.8%, 7.7%, and 6.2%, respectively, of our total pro forma gross assets (which consists primarily of real estate leases and loans).
Our tenants operate in the healthcare industry, which is highly regulated by U.S. federal, state, and local laws along with laws in Europe, Australia, and South America and changes in regulations may temporarily impact our tenants’ operations until they are able to make the appropriate adjustments to their business. From time-to-time, our tenants are subject to various federal and state inquiries, investigations, and other proceedings and would expect such government compliance and enforcement activities to be ongoing at any given time with respect to one or more of our tenants, either on a confidential or public basis. Other large acute hospital operators have defended similar allegations in the past, sometimes resulting in financial settlements and agreements with regulators to modify admission policies, resulting in lower reimbursements for those patients.
In addition, our tenants experience operational challenges from time-to-time, and this can be even more of a risk for those tenants that grow (or have grown) via acquisitions in a short time frame, like Steward, Circle, and others. The ability of our tenants and operators to integrate newly acquired businesses into their existing operational, financial reporting, and collection systems is critical towards ensuring their continued success. If such integration is not successfully implemented in a timely manner, operators can be negatively impacted in the form of write-offs of uncollectible accounts receivable, higher expenses, or even insolvency in certain extreme cases.
Any adverse result to our tenants (particularly Steward, Circle, Prospect, Priory, or MEDIAN) in regulatory proceedings or financial or operational setbacks may have a material adverse effect on the relevant tenant’s operations and on its ability to make required lease and loan payments to us. If any one of these tenants were to file for bankruptcy protection, we may not be able to collect any pre-filing amounts owed to us by such tenant. In a bankruptcy proceeding, such tenant may terminate our lease(s), in which case we would have a general unsecured claim that would likely be for less than the full amount owed to us. Any secured claims we have against such tenant may only be paid to the extent of the value of the collateral, which may not cover all or any of our losses. The protections that we have in our leases, which can include letters of credit, cross default provisions, parent guarantees, repair reserves, and the right to exercise remedies including the termination of the lease and replacement of the operator, may prove to be insufficient, in whole or in part, or may entail further delays. In instances where we have an equity investment in our tenant’s operations, in addition to the effect on these tenants’ ability to meet their financial obligation to us, our ownership and investment interests may also be negatively impacted.
We have experienced rapid growth, and our failure to effectively manage our growth may adversely impact our financial condition and cash flows, which could negatively affect our ability to service our debt and make distributions.
We have experienced rapid growth through investments in healthcare properties. Year-over-year, our total assets grew by more than 16%, and we have expanded our presence to nine countries. In addition, we continually evaluate property acquisition and development opportunities as they arise, and we typically have a number of potential acquisition and development transactions under active consideration.
There is no assurance that we will be able to adapt our management, administrative, accounting, and operational systems, or hire and retain sufficient operational staff, to manage the facilities we have acquired and those that we may acquire or develop in the future. Additionally, investing in real estate located in foreign countries creates risks associated with the uncertainty of foreign laws, economies, and markets, and exposes us to local economic downturns and adverse market developments.
Our failure to manage such growth effectively may adversely impact our financial condition and cash flows, which could negatively affect our ability to service our debt and make distributions to our stockholders. Our rapid growth could also increase our capital requirements, which may require us to issue potentially dilutive equity securities and/or incur additional debt.
It may be costly to replace defaulting tenants and we may not find suitable replacements on suitable terms.
Failure on the part of a tenant to comply materially with the terms of a lease could give us the right to terminate the lease, repossess the facility, cross default certain other leases and loans with that tenant, and enforce the payment obligations under the lease. The process of terminating a lease with a defaulting tenant and repossessing the applicable facility may be costly and require a disproportionate amount of management’s attention. In addition, defaulting tenants may initiate litigation in connection with a lease termination or repossession against us. If a tenant-operator defaults and we choose to terminate the lease, we would then be required to find another tenant-operator or to sell the facility. The transfer of most types of healthcare facilities is highly regulated, which may
20
result in delays and increased costs in locating a suitable replacement tenant. The lease of these properties to entities other than healthcare operators may be difficult due to the added cost and time of refitting the properties. If we are unable to re-let the properties, we may be forced to sell the properties at a loss. Alternatively, we may be required to spend substantial amounts to adapt the facility to other uses. There can be no assurance that we would be able to find another tenant in a timely fashion, or at all, or that, if another tenant were found, we would be able to enter into a new lease on favorable terms. Defaults by our tenants under our leases may adversely affect our results of operations, financial condition, and our ability to make distributions to our stockholders. Defaults by our significant tenants under master leases (like Steward, Circle, Prospect, Priory, and MEDIAN) will have an even greater effect.
It may be costly to find new tenants when lease terms end and we may not be able to replace such tenants with suitable replacements on suitable terms.
Failure on the part of a tenant to renew or extend the lease at the end of its fixed term could result in us having to search for, negotiate with, and execute new lease agreements. The process of finding and negotiating with a new tenant along with costs (such as maintenance, property taxes, utilities, ground lease expenses, etc.) that we will incur while the facility is untenanted may be costly and require a disproportionate amount of our management’s attention. There can be no assurance that we would be able to find another tenant in a timely fashion, or at all, or that, if another tenant were found, we would be able to enter into a new lease on favorable terms. If we are unable to re-let the properties to healthcare operators, we may be forced to sell the properties at a loss due to the repositioning expenses likely to be incurred by non-healthcare purchasers. Alternatively, we may be required to spend substantial amounts to adapt the facility to other uses. Thus, the non-renewal or extension of leases may adversely affect our results of operations, financial condition, and our ability to make distributions to our stockholders. This risk is even greater for those properties under master leases (like Steward, Circle, Prospect, Priory, and MEDIAN) because several properties have the same lease ending dates.
We have made investments in the operators of certain of our healthcare facilities and the cash flows (and related returns) from these investments are subject to more volatility than our properties with the traditional net leasing structure.
At December 31, 2020, we have approximately $171.4 million of investments in the operations of certain of our healthcare facilities by utilizing RIDEA or similar investments. These investments include profits interest and equity investments that generate returns dependent upon the operator’s performance. As a result, the cash flow and returns from these investments may be more volatile than that of our traditional triple-net leasing structure. Our business, results of operations, and financial condition may be adversely affected if the related operators fail to successfully operate the facilities efficiently and in a manner that is in our best interest.
We have less experience with healthcare facilities located outside the U.S.
At December 31, 2020, we had approximately 43% of our total pro forma gross assets located outside the U.S. We have less experience investing in healthcare properties or other real estate-related assets located outside the U.S. Investing in real estate located in foreign countries, including the United Kingdom, Germany, Italy, Spain, Portugal, Switzerland, Australia, and Colombia creates risks associated with the uncertainty of foreign laws and markets including, without limitation, laws respecting foreign ownership, the enforceability of loan and lease documents, and foreclosure laws. Foreign real estate and tax laws are complex and subject to change, and we cannot assure you we will always be in compliance with those laws or that compliance will not expose us to additional expense. The properties we have acquired internationally will face risks in connection with unexpected changes in regulatory requirements, political and economic instability, potential imposition of adverse or confiscatory taxes, possible challenges to the anticipated tax treatment of the structures that allow us to acquire and hold investments, possible currency transfer restrictions, the difficulty in enforcing obligations in other countries, the impact from Brexit and future developments in the European Union, and the burden of complying with a wide variety of foreign laws. In addition, to qualify as a REIT, we generally will be required to operate any non-U.S. investments in accordance with the rules applicable to U.S. REITs, which may be inconsistent with local practices. We may also be subject to fluctuations in local real estate values or markets or the economy as a whole, which may adversely affect our investments.
In addition, the rents under our leases of foreign assets and expenses incurred internationally are denominated in either euros, British pounds, Swiss francs, Australian dollars, or Colombian pesos, which could expose us to losses resulting from fluctuations in exchange rates to the extent we have not hedged our position, which in turn could adversely affect our revenues, operating margins, and dividends, and may also affect the book value of our assets and the amount of stockholders’ equity. While we may hedge some of our foreign currency risk, we may not be able to do so successfully and may incur losses on our investments as a result of exchange rate fluctuations. Furthermore, we are subject to laws and regulations, such as the Foreign Corrupt Practices Act and similar local anti-bribery laws, which generally prohibit companies and their employees, agents, and contractors from making improper payments to governmental officials for the purpose of obtaining or retaining business. Failure to comply with these laws could subject us to civil and criminal penalties that could materially adversely affect our results of operations, the value of our international investments, and our ability to make distributions to our stockholders.
21
We have exposure to contingent rent escalators, which could hinder our growth and profitability.
We receive a significant portion of our revenues by leasing assets under long-term net leases that generally provide for fixed rental rates subject to annual escalations. These annual escalations may be contingent on changes in CPI (or a similar index internationally), typically with specified caps and floors. If, as a result of weak economic conditions or other factors, the CPI does not increase, our growth and profitability may be hindered by these leases. In addition, if strong economic conditions result in significant increases in CPI, but the escalations under our leases are capped, our growth and profitability may be limited.
The bankruptcy or insolvency of our tenants or investees could harm our operating results and financial condition.
Some of our tenants may be newly organized, have limited or no operating history and may be dependent on loans from us to acquire the facility’s operations and for initial working capital. Any bankruptcy filings by one of our tenants could bar us from collecting pre-bankruptcy debts from that tenant or their property, unless we receive an order permitting us to do so from the bankruptcy court. A tenant bankruptcy can be expected to delay our efforts to collect past due balances under our leases and loans, and could ultimately preclude collection of these sums. If a lease is assumed by a tenant in bankruptcy, we expect that all pre-bankruptcy balances due under the lease would be paid to us in full. However, if a lease is rejected by a tenant in bankruptcy, we would have only a general unsecured claim for damages. Any secured claims we have against our tenants may only be paid to the extent of the value of the collateral, which may not cover any or all of our losses. Any unsecured claim (such as our equity interests in our tenants) we hold against a bankrupt entity may be paid only to the extent that funds are available and only in the same percentage as is paid to all other holders of unsecured claims. We may recover none or substantially less than the full value of any unsecured claims, which would harm our financial condition.
Our business is highly competitive and we may be unable to compete successfully.
We compete for development opportunities and opportunities to purchase healthcare facilities with, among others: private investors, including large private equity funds; healthcare providers, including physicians; other REITs; real estate developers; government-sponsored and/or not-for-profit agencies; financial institutions; and other lenders. Some of these competitors may have substantially greater financial resources than we have and may have better relationships with lenders and sellers. Competition for healthcare facilities from competitors may adversely affect our ability to acquire or develop healthcare facilities and the prices we pay for those facilities. If we are unable to acquire or develop facilities or if we pay too much for facilities, our revenue, earnings growth, and financial return could be materially adversely affected. Certain of our facilities, or facilities we may acquire or develop in the future will face competition from other nearby facilities that provide services comparable to those offered at our facilities. Some of those facilities are owned by governmental agencies and supported by tax revenues, and others are owned by tax-exempt corporations and may be supported to a large extent by endowments and charitable contributions. Those types of support are not generally available to our facilities. In addition, competing healthcare facilities located in the areas served by our facilities may provide healthcare services that are not available at our facilities. From time-to-time, referral sources, including physicians and managed care organizations, may change the healthcare facilities to which they refer patients, which could adversely affect our tenants and thus our rental revenues, interest income, and/or our earnings from equity investments.
Many of our tenants have an option to purchase the facilities we lease to them which could disrupt our operations.
Many of our tenants have the option to purchase the facilities we lease to them. There is no assurance that the formulas we have developed for setting the purchase price will yield a fair market value purchase price.
In the event our tenants decide to purchase the facilities at the end of the lease term, we may not be able to re-invest the capital on as favorable terms, or at all. Our inability to effectively manage the turnover of our facilities could materially adversely affect our ability to execute our business plan and our results of operations.
We have 128 leased properties that are subject to purchase options as of December 31, 2020. For 104 of these properties, the purchase option generally allows the lessee to purchase the real estate at the end of the lease term, assuming not currently in default, at a price equivalent to the greater of (i) fair market value or (ii) our original purchase price (increased, in some cases, by a certain annual rate of return from the lease commencement date). The lease agreements provide for an appraisal process to determine fair market value. For 17 of these properties, the purchase option generally allows the lessee to purchase the real estate at the end of the lease term, assuming not currently in default, at our purchase price (increased, in some cases, by a certain annual rate of return from lease commencement date). For the remaining 7 leases, the purchase options approximate fair value.
In certain circumstances, a prospective purchaser of our hospital real estate may be deemed to be subject to Anti-Kickback and Stark statutes, which are described in the “Healthcare Regulatory Matters” section in Item 1 of this Annual Report on Form 10-K. In such event, it may not be practicable for us to sell a property to such prospective purchaser at a price other than fair market value.
22
Merger and acquisition activity or consolidation in the healthcare industry may result in a change of control of, or a competitor’s investment in, one or more of our tenants or operators, which could have a material adverse effect on us.
The healthcare industry continues to experience consolidation, including among owners of real estate and healthcare providers. We compete with other healthcare REITs, healthcare providers, healthcare lenders, real estate partnerships, banks, insurance companies, private equity firms, and other investors that pursue a variety of investments, which may include investments in our tenants. We have historically developed strong, long-term relationships with many of our tenants. A competitor’s investment in one of our tenants, any change of control of a tenant, or a change in the tenant’s management team could enable our competitor to influence or control that tenant’s business and strategy. This influence could have a material adverse effect on us by impairing our relationship with the tenant, negatively affecting our interest, or impacting the tenant’s financial and operational performance, including their ability to pay us rent or interest. Depending on our contractual agreements and the specific facts and circumstances, we may have consent rights, termination rights, remedies upon default, or other rights and remedies related to a competitor’s investment in, a change of control of, or other transactions impacting a tenant. In deciding whether to exercise our rights and remedies, including termination rights or remedies upon default, we assess numerous factors, including legal, contractual, regulatory, business, and other relevant considerations.
Our investments in joint ventures could be adversely affected by our lack of control, our partners’ failure to meet their obligations, and disputes with our partners.
We have entered into five real estate joint ventures with independent parties with a total investment of approximately $900 million at December 31, 2020. Joint venture arrangements involve risks including the possibility that the other party may refuse or not be able to make capital contributions when due, that our partner might have economic or other business interests that are inconsistent with the joint venture’s interests, or that we may become engaged in a dispute with our partner. If any of these events occur, we might need to provide additional funding to the joint ventures to meet its obligations, incur additional expenses to resolve disputes, or be forced to buy out the partner’s interest or to sell our interests at a time that is not advantageous to us. Any loss of income, cash flow, or disruption of management’s time could have a negative impact on the rest of our business.
RISKS RELATED TO FINANCING OUR BUSINESS
Limited access to capital may restrict our growth.
Our business plan contemplates growth through acquisitions and development of facilities. As a REIT, we are required to make cash distributions, which reduce our ability to fund acquisitions and developments with retained earnings. Thus, access to the capital markets, bank borrowings, and other financing vehicles are important to fund new opportunistic investments. Due to market or other conditions, we may not be able to obtain additional equity or debt capital or dispose of assets on favorable terms, if at all, at the time we need additional capital to acquire healthcare properties, which could have a material adverse effect on our results of operations and our ability to make distributions to our stockholders.
Our indebtedness could adversely affect our financial condition and may otherwise adversely impact our business operations and our ability to make distributions to stockholders.
As of February 19, 2021, we had approximately $10.2 billion of debt outstanding.
Our indebtedness could have significant effects on our business. For example, it could require us to use a substantial portion (or all) of our cash flow from operations to service our indebtedness, which would reduce the available cash flow to fund working capital, development projects, and other general corporate purposes and reduce cash for distributions; force us to dispose of one or more of our properties, possibly on disadvantageous terms, to make payments on our debt; increase our vulnerability to general adverse economic and industry conditions; limit our flexibility in planning for, or reacting to, changes in our business and the industry in which we operate; restrict us from making strategic acquisitions or exploiting other business opportunities; and place us at a competitive disadvantage compared to our competitors that have less debt.
Our future borrowings under our loan facilities may bear interest at variable rates in addition to the $1.6 billion in variable interest rate debt that we had outstanding as of February 19, 2021 (excluding the variable rate debt that we have fixed through interest rate swaps). If interest rates increase significantly, our operating results would decline along with the cash available for distributions to our stockholders.
In July 2017, the Financial Conduct Authority that regulates the London Interbank Offered Rate (“LIBOR”) announced that it intends to stop compelling banks to submit rates for the calculation of LIBOR after 2021, thereby discontinuing LIBOR after the end of 2021. While we expect LIBOR to be available in substantially its current form until then, it is possible that LIBOR will become unavailable prior to that point. As of February 19, 2021, approximately $3.5 billion of our outstanding debt (along with our interest rate swaps) is indexed to LIBOR or other interbank offered rates. We are monitoring and evaluating any risks related to potential discontinuation of LIBOR, including transitioning to a new alternative rate and any resulting value transfer that may occur. If the
23
methods of calculating the new index significantly change from their current form, interest rates on our indebtedness currently indexed to LIBOR may be adversely affected.
In addition, most of our current debt is, and we anticipate that much of our future debt will be, non-amortizing and payable in balloon payments. Therefore, we will likely need to refinance at least a portion of that debt as it matures. There is a risk that we may not be able to refinance debt maturing in future years or that the terms of any refinancing will not be as favorable as the terms of the then-existing debt. If principal payments due at maturity cannot be refinanced, extended, or repaid with proceeds from other sources, such as new equity capital, joint venture proceeds, or sales of facilities, our cash flow may not be sufficient to repay all maturing debt in years when significant balloon payments come due. See Item 7 of Part II of this Annual Report on Form 10-K for further information on our current debt maturities.
Covenants in our debt instruments limit our operational flexibility, and a breach of these covenants could materially affect our financial condition and results of operations.
The terms of our unsecured credit facility (“Credit Facility”) and the indentures governing our outstanding unsecured senior notes, and other debt instruments that we may enter into in the future are subject to customary financial and operational covenants. For example, our Credit Facility imposes certain restrictions on us, including restrictions on our ability to: incur debts; create or incur liens; provide guarantees in respect of obligations of any other entity; make redemptions and repurchases of our capital stock; prepay, redeem, or repurchase debt; engage in mergers or consolidations; enter into affiliated transactions; dispose of real estate; and change our business. In addition, the agreements governing our Credit Facility and the indentures governing our senior unsecured notes limit the amount of dividends we can pay. Finally, our senior unsecured notes require us to maintain total unencumbered assets (as defined in the related indenture) of not less than 150% of our unsecured indebtedness. From time-to-time, the lenders of our Credit Facility may adjust certain covenants to give us more flexibility to complete a transaction; however, such modified covenants are temporary, and we must be in a position to meet the lowered reset covenants in the future. Our continued ability to incur debt and operate our business is subject to compliance with the covenants in our debt instruments, which limit operational flexibility. Breaches of these covenants could result in defaults under applicable debt instruments and other debt instruments due to cross-default provisions, even if payment obligations are satisfied. Financial and other covenants that limit our operational flexibility, as well as defaults resulting from a breach of any of these covenants in our debt instruments, could have a material adverse effect on our financial condition and results of operations.
Failure to hedge effectively against interest rate changes may adversely affect our results of operations and our ability to make distributions to our stockholders.
As of February 19, 2021, we had approximately $3.5 billion in variable interest rate debt along with €655 million in our joint venture arrangement with Primotop Holdings S.à.r.l. (“Primotop”). This variable rate debt subjects us to interest rate volatility. To manage this interest rate volatility, we have entered into interest rate swaps to fix the interest rate on all but $1.6 billion of this debt. However, even these hedging arrangements involve risk, including the risk that counterparties may fail to honor their obligations, that these arrangements may not be effective in reducing our exposure to interest rate changes and that these arrangements may result in higher interest rates than we would otherwise have. Moreover, no hedging activity can completely insulate us from the risks associated with changes in interest rates. Failure to hedge effectively against interest rate changes may materially adversely affect our results of operations and our ability to make distributions to our stockholders.
The market price and trading volume of our common stock may be volatile.
The market price of our common stock may be highly volatile and be subject to wide fluctuations. In addition, the trading volume in our common stock may fluctuate and cause significant price variations to occur. If the market price of our common stock declines significantly, you may be unable to sell your shares at or above your purchase price.
We cannot assure you that the market price of our common stock will not fluctuate or decline significantly in the future. Some of the factors that could negatively affect our share price or result in fluctuations in the price or trading volume of our common stock include:
|
|
• |
actual or anticipated variations in our quarterly operating results or distributions; |
|
|
• |
changes in our earnings estimates, or publication of research reports about us or the real estate industry; |
|
|
• |
changes in market valuations of similar companies; |
|
|
• |
changes in the market value of our facilities; |
|
|
• |
adverse market reaction to any increased indebtedness we incur in the future; |
|
|
• |
additions or departures of key management personnel; |
24
|
|
• |
actions by institutional stockholders; |
|
|
• |
an oversupply of, or a reduction in demand for, IRFs, LTACHs, behavioral health facilities, freestanding ER/urgent care facilities, or general acute care hospitals; |
|
|
• |
speculation in the press or investment community; and |
|
|
• |
general market and economic conditions. |
Future sales of common stock may have adverse effects on our stock price.
We cannot predict the effect, if any, of future sales of common stock on the market price of our common stock. Sales of substantial amounts of common stock, or the perception that these sales could occur, may adversely affect prevailing market prices for our common stock. If the market price of our common stock declines significantly, you may be unable to sell your shares at or above your purchase price. In addition, such a share price decline could impair our ability to raise future capital through a sale of additional equity securities.
Downgrades in our credit ratings could have a material adverse effect on our cost and availability of capital.
As of February 19, 2021, our issue-level rating on our unsecured notes remained at BBB-, while our corporate credit rating from S&P remained at BB+ and our corporate family rating from Moody’s Investors Service was Ba1. There can be no assurance that we will be able to maintain our current credit ratings. Any downgrades in terms of ratings or outlook by any or all of the rating agencies could have a material adverse effect on our cost and availability of capital, which could in turn have a material adverse effect on our financial condition and results of operations.
An increase in market interest rates may have an adverse effect on the market price of our securities.
One of the factors that investors may consider in deciding whether to buy or sell our securities is our dividend rate as a percentage of our price per share of common stock, relative to market interest rates. If market interest rates increase, prospective investors may desire a higher distribution on our securities or seek securities paying higher distributions. The market price of our common stock likely will be based primarily on the earnings that we derive from rental and interest income with respect to our facilities and our related distributions to stockholders, and not from the underlying appraised value of the facilities themselves. As a result, interest rate fluctuations and capital market conditions can affect the market price of our common stock. In addition, rising interest rates would result in increased interest expense on our variable-rate debt, thereby adversely affecting cash flow and our ability to service our indebtedness and make distributions.
RISKS RELATING TO REAL ESTATE INVESTMENTS
Our investments are and are expected to continue to be concentrated in a single industry segment, making us more vulnerable economically than if our investments were more diversified.
We acquire, develop, and make investments in healthcare real estate. In addition, we selectively make RIDEA investments (or similar investments) in healthcare operators. We are subject to risks inherent in concentrating investments in real estate. The risks resulting from a lack of diversification become even greater as a result of our business strategy to invest solely in healthcare facilities. A downturn in the real estate industry could materially adversely affect the value of our facilities. A downturn in the healthcare industry could negatively affect our tenants’ ability to make lease or loan payments to us as well as our return on our equity investments. Consequently, our ability to meet debt service obligations or make distributions to our stockholders is dependent on the real estate and healthcare industries.
Our facilities may not have efficient alternative uses, which could impede our ability to find replacement tenants in the event of termination or default under our leases.
Primarily all of the facilities in our current portfolio are net-leased healthcare facilities. If we, or our tenants, terminate the leases for these facilities, or if these tenants lose their regulatory authority to operate these facilities, we may not be able to locate suitable replacement tenants to lease the facilities for their specialized uses. Alternatively, we may be required to spend substantial amounts to adapt the facilities to other uses. Any loss of revenues or additional capital expenditures occurring as a result could have a material adverse effect on our financial condition and results of operations and could hinder our ability to meet debt service obligations or make distributions to our stockholders.
25
Illiquidity of real estate investments could significantly impede our ability to respond to adverse changes in the performance of our facilities and harm our financial condition.
Real estate investments are relatively illiquid. Additionally, the real estate market is affected by many factors beyond our control, including adverse changes in global, national, and local economic and market conditions and the availability, costs, and terms of financing. Our ability to quickly sell or exchange any of our facilities in response to changes in economic and other conditions will be limited. No assurances can be given that we will recognize full value for any facility that we are required to sell for liquidity reasons. Our inability to respond rapidly to changes in the performance of our investments could adversely affect our financial condition and results of operations.
Development and construction risks could adversely affect our ability to make distributions to our stockholders.
We have developed and constructed facilities in the past and are currently developing two facilities. Our development and related construction activities may subject us to the following risks: we may have to compete for suitable development sites; our ability to complete construction is dependent on there being no title, environmental, or other legal proceedings arising; we may be subject to delays due to weather conditions, strikes, and other contingencies beyond our control; we may be unable to obtain, or suffer delays in obtaining, necessary zoning, land-use, building, occupancy, and other required governmental permits, which could result in increased costs, delays, or our abandonment of these projects; and we may incur construction costs for a facility which exceed our original estimates due to increased costs for materials or labor or other costs that we did not anticipate.
We expect to fund our development projects over time. The time frame required for development and construction of these facilities means that we may have to wait for some time to earn significant cash returns. In addition, our tenants may not be able to obtain managed care provider contracts in a timely manner or at all. Risks associated with our development projects may reduce anticipated rental revenue which could affect the timing of, and our ability to make, distributions to our stockholders.
We may be subject to risks arising from future acquisitions of real estate.
We may be subject to risks in connection with our acquisition of healthcare real estate, including:
|
|
• |
we may have no previous business experience with the tenants at the facilities acquired, and we may face difficulties in working with them; |
|
|
• |
underperformance of the acquired facilities due to various factors, including unfavorable terms and conditions of any acquired lease agreements, disruptions caused by the management of our tenants, or changes in economic conditions; |
|
|
• |
diversion of our management’s attention away from other business concerns; |
|
|
• |
exposure to any undisclosed or unknown potential liabilities (including environmental liabilities) relating to the acquired facilities (or entities acquired in a share deal); and |
|
|
• |
potential underinsured losses on the acquired facilities. |
We cannot assure you that we will be able to manage the new properties without encountering difficulties or that any such difficulties will not have a material adverse effect on us.
Our facilities may not achieve expected results, which may harm our financial condition and operating results and our ability to make the distributions to our stockholders required to maintain our REIT status.
Acquisitions and developments entail risks that investments will fail to perform in accordance with expectations and that estimates of the costs of necessary improvements may prove inaccurate, as well as general investment risks associated with any new real estate investment. Newly-developed or newly-renovated facilities may not have operating histories that are helpful in making objective pricing decisions. The purchase prices of these facilities will be based in part upon projections by management as to the expected operating results of the facilities, subjecting us to risks that these facilities may not achieve anticipated operating results or may not achieve these results within anticipated time frames. If our facilities do not achieve expected results and generate ample cash flows from operations, amounts available for distribution to stockholders could be adversely affected and we could be required to reduce distributions, thereby jeopardizing our ability to maintain our status as a REIT.
We may suffer losses that are not covered by insurance or that are in excess of our insurance coverage limits.
Our leases and mortgage loans generally require our tenants/borrowers to carry property, general liability, professional liability, loss of earnings, all risk, and extended coverage insurance in amounts sufficient to permit the replacement of the facility in the event of a total loss, subject to applicable deductibles. We carry general liability insurance and loss of earnings coverage on all of our properties as a contingent measure in case our tenant’s coverage is not sufficient. However, there are certain types of losses, generally of a catastrophic nature, such as earthquakes, floods, hurricanes, and acts of terrorism, which may be uninsurable or not insurable at a
26
price we or our tenants/borrowers can afford. Inflation, changes in building codes and ordinances, environmental considerations, and other factors also might make it impracticable to use insurance proceeds to replace a facility after it has been damaged or destroyed. Under such circumstances, the insurance proceeds we receive might not be adequate to restore our economic position with respect to the affected facility. If any of these or similar events occur, it may reduce our return from the facility and the value of our investment. We continually review the insurance maintained by our tenants/borrowers and believe the coverage provided to be adequate and customary for similarly situated companies in our industry. However, we cannot provide any assurances that such insurance will be available at a reasonable cost in the future. Also, we cannot assure you that material uninsured losses, or losses in excess of insurance proceeds, will not occur in the future.
Capital expenditures for facility renovation may be greater than anticipated and may adversely impact rent payments by our tenants and our ability to make distributions to stockholders.
Facilities, particularly those that consist of older structures, have an ongoing need for capital improvements, including periodic replacement of fixtures and fixed equipment. Although our leases generally require our tenants to be primarily responsible for the cost of such expenditures, renovation of facilities involves certain risks, including the possibility of environmental problems, regulatory requirements, construction cost overruns and delays, uncertainties as to market demand or deterioration in market demand after commencement of renovation, and the emergence of unanticipated competition from other facilities. All of these factors could adversely impact rent and loan payments by our tenants and returns on our equity investments, which in turn could have a material adverse effect on our financial condition, results of operations, and our ability to make distributions to our stockholders.
All of our healthcare facilities are subject to property taxes that may increase in the future and adversely affect our business.
Our facilities are subject to real and personal property taxes that may increase as property tax rates change and as the facilities are assessed or reassessed by taxing authorities. Our leases generally provide that the property taxes are charged to our tenants as an expense related to the facilities that they occupy. As the owner of the facilities, however, we are ultimately responsible for payment of the taxes to the government. If property taxes increase, our tenants may be unable to make the required tax payments, ultimately requiring us to pay the taxes. If we incur these tax liabilities, our ability to make expected distributions to our stockholders could be adversely affected. In addition, if such taxes increase on properties in which we have an equity investment in the tenant, our return on investment maybe negatively affected.
As the owner and lessor of real estate, we are subject to risks under environmental laws, the cost of compliance with which and any violation of which could materially adversely affect us.
Various environmental laws may impose liability on the current or prior owner or operator of real property for removal or remediation of hazardous or toxic substances. Current or prior owners or operators may also be liable for government fines and damages for injuries to persons, natural resources, and adjacent property. These environmental laws often impose liability whether or not the owner or operator knew of, or was responsible for, the presence or disposal of the hazardous or toxic substances. The cost of complying with environmental laws could materially adversely affect amounts available for distribution to our stockholders and could exceed the value of all of our facilities. In addition, the presence of hazardous or toxic substances, or the failure of our tenants to properly manage, dispose of, or remediate such substances, including medical waste generated by other healthcare operators, may adversely affect our tenants or our ability to use, sell, or rent such property or to borrow using such property as collateral which, in turn, could reduce our revenue and our financing ability. We typically obtain Phase I environmental assessments (or similar studies) on facilities we acquire or develop or on which we make mortgage loans. However, even if the Phase I environmental assessment reports do not reveal any material environmental contamination, it is possible that material environmental contamination and liabilities may exist, of which we are unaware.
Although our leases and mortgage loans require our operators to comply with laws and regulations governing their operations, including the disposal of medical waste, and to indemnify us for environmental liabilities, the scope of their obligations may be limited. We cannot assure you that our tenants would be able to fulfill their indemnification obligations and, therefore, any material violation of environmental laws could have a material adverse effect on us. In addition, environmental laws are constantly evolving, and changes in laws or regulations, or changes in interpretations of the foregoing, could create liabilities where none exist today.
Our interests in facilities through ground leases expose us to the loss of the facility upon breach or termination of the ground lease, may limit our use of the facility, and may result in additional expense to us if our tenants vacate our facility.
We have acquired interests in 29 facilities, at least in part, by acquiring leasehold interests in the land on which the facility is located rather than an ownership interest in the property. As lessee under ground leases, we are exposed to the possibility of losing the property upon termination, or an earlier breach by us, which could be a negative impact to our financial condition. Ground leases may also restrict our use of facilities, which may limit our flexibility in renting the facility and may impede our ability to sell the property. Finally, if our lease expires or is terminated for whatever reason resulting in the tenant vacating the facility, we would be responsible
27
for the ground lease payments until we found a replacement tenant, which would negatively impact our cash flows and results of operations.
RISKS RELATING TO THE HEALTHCARE INDUSTRY
The continued pressure on fee-for-service reimbursement from third-party payors and the shift towards alternative payment models, could adversely affect the profitability of our tenants and hinder their ability to make payments to us.
Sources of revenue for our tenants may include the Medicare and Medicaid programs, private insurance carriers, and health maintenance organizations, among others. In addition to ongoing efforts to reduce healthcare costs, the failure of any of our tenants to comply with various laws and regulations could jeopardize their ability to continue participating in Medicare, Medicaid, and other government-sponsored payment programs.
The shift in our tenants' payor mix away from fee-for-service payors results in an increase in the percentage of revenues attributable to alternative payment models implemented by private and government payors, which can lead to reductions in reimbursement for services provided by our tenants. There is continued focus on transitioning Medicare from its traditional fee-for-service model to models that employ one or more capitated, value-based, or bundled payment approaches, and private payors have implemented similar types of alternative payment models. Such efforts from private and government payors, in addition to general industry trends, continue to place pressures on our tenants to control healthcare costs. Furthermore, pressures to control healthcare costs and a shift away from traditional health insurance reimbursement have resulted in an increase in the number of patients whose healthcare coverage is provided under managed care plans, such as health maintenance organizations and preferred provider organizations. These shifts place further cost pressures on our tenants. We also continue to believe that, due to the aging of the population and the expansion of governmental payor programs, there will be a marked increase in the number of patients relying on healthcare coverage provided by governmental payors. In instances where we have an equity investment in our tenants’ operations, in addition to the effect on these tenants’ ability to meet their financial obligations to us, our ownership and investment interests may also be negatively impacted.
The Centers for Medicare and Medicaid’s (“CMS”) regulatory restrictions on reimbursement for LTACHs and IRFs can lead to reduced reimbursement for our tenants that operate such facilities and departments. CMS continues to explore restrictions on LTACH and IRF reimbursement focused on more restrictive facility and patient level criteria.
The Reform Law enacted in 2010 represented a major shift in the U.S. healthcare industry by, among other things, allowing millions of formerly uninsured individuals to obtain health insurance coverage and by significantly expanding Medicaid. Though efforts to repeal and replace the Reform Law was the focus of the previous administration, with a new democratic party controlled government starting in 2021, such efforts are expected to stop. Regardless, we believe that certain trends, including, but not limited to, various quality and reimbursement initiatives discussed above, will continue.
We cannot predict with absolute precision how these changes will affect the long-term financial condition of our tenants. However, any significant negative impact to our tenants could have a material adverse effect on our financial condition and results of operations and could negatively affect our ability to make distributions to our stockholders.
Significant regulation and loss of licensure or certification or failure to obtain licensure or certification could negatively impact our tenants' financial condition and results of operations and affect their ability to make payments to us.
The U.S. healthcare industry is highly regulated by federal, state, and local laws and is directly affected by federal conditions of participation, state licensing requirements, facility inspections, state and federal reimbursement policies, regulations concerning capital and other expenditures, certification requirements and other such laws, regulations, and rules. As with the U.S. healthcare industry, our tenants in Australia, the United Kingdom, and other parts of Europe are also subject in some instances to comparable types of laws, regulations, and rules that affect their ownership and operation of healthcare facilities. Although our lease and mortgage loan agreements require our tenants/borrowers to comply with applicable laws, and we intend for these facilities to comply with such laws, we do not actively monitor compliance. Therefore, we cannot offer any assurance that our tenants/borrowers will be found to be in compliance with such, as the same may ultimately be implemented or interpreted.
From time-to-time, our tenants are subject to various federal and state inquiries, investigations, and other proceedings and would expect such governmental compliance and enforcement activities to be ongoing at any given time with respect to one or more of our tenants, either on a confidential or public basis. An adverse result to our tenant/borrower in one or more such governmental proceedings may have a material adverse effect on their operations and financial condition and on its ability to make required lease and/or loan payments to us. In instances where we have an equity investment in the operator, in addition to the effect on these tenants’/borrowers’ ability to meet their financial obligation to us, our ownership and investment interests may also be negatively impacted.
28
In the U.S., licensed health care facilities must comply with minimum health and safety standards and are subject to survey and inspection by state and federal agencies and their agents or affiliates, including CMS, the Joint Commission, and state departments of health. CMS develops Conditions of Participation and Conditions for Coverage that health care organizations must meet in order to begin and continue participating in the Medicare and Medicaid programs and receive payment under such programs. These minimum health and safety standards are aimed at improving quality and protecting the health and safety of beneficiaries, and there are several common criteria that exist across health entities. The failure to comply with any of these standards could jeopardize a healthcare organization’s Medicare certification and, in turn, its right to receive payment under the Medicare and Medicaid programs.
Further, many hospitals and other institutional providers in the U.S. are accredited by accrediting organizations, such as the Joint Commission. The Joint Commission was created to accredit healthcare providers, including our tenants that meet its minimum health and safety standards. A national accrediting organization, such as the Joint Commission, enforces standards that meet or exceed such requirements. Surveyors for the Joint Commission, after achieving a minimum number of patients and approximately every three years thereafter, conduct on site surveys of facilities for compliance with a multitude of patient safety, treatment, and administrative requirements. Facilities may lose accreditation for failure to meet such requirements, which in turn may result in the loss of license or certification including under the Medicare and Medicaid programs.
Finally, healthcare facility reimbursement practices and quality of care issues may result in loss of license or certification- such as engaging in the practice of “upcoding,” whereby services are billed for higher procedure codes, or an event involving poor quality of care, which leads to the serious injury or death of a patient. The failure of any tenant/borrower to comply with such laws, requirements, and regulations resulting in a loss of its license would affect its ability to continue its operation of the facility and would adversely affect its ability to make lease and/or loan payments to us. This, in turn, could have a material adverse effect on our financial condition and results of operations and could negatively affect our ability to make distributions to our stockholders.
In addition, establishment of healthcare facilities and transfers of operations of healthcare facilities in the U.S are typically subject to regulatory approvals, such as state certificate of need laws in the U.S. Restrictions and delays in transferring the operations of healthcare facilities, in obtaining new third-party payor contracts, including Medicare and Medicaid provider agreements, and in receiving licensure and certification approval from appropriate state and federal agencies by new tenants, may affect our ability to terminate lease agreements, remove tenants that violate lease terms, and replace existing tenants with new tenants. Furthermore, these matters may affect a new tenant’s/borrower’s ability to obtain reimbursement for services rendered, which could adversely affect its ability to make lease and/or loan payments to us. In instances where we have an equity investment in the operator, in addition to the effect on these tenants’/borrowers’ ability to meet their financial obligations to us, our ownership and investment interests may also be negatively impacted.
Our tenants are subject to fraud and abuse laws, the violation of which by a tenant may jeopardize the tenant’s ability to make payments to us and adversely affect their profitability.
As noted earlier, in the U.S., the federal government and numerous state governments have passed laws and regulations that attempt to eliminate healthcare fraud and abuse by prohibiting business arrangements that induce patient referrals or the ordering of specific ancillary services, or the submission of false claim for payment. The trend toward increased investigation and enforcement activity in the areas of fraud and abuse and patient self-referrals to detect and eliminate fraud and abuse in the Medicare and Medicaid programs is likely to continue in future years. As described above, the penalties for violations of these laws can be substantial and may result in the imposition of criminal and civil penalties and possible exclusion from federal and state healthcare programs. Imposition of any of these penalties upon any of our tenants could jeopardize a tenant’s ability to operate a facility or to make lease and/or loan payments, thereby potentially adversely affecting us.
In the case of an acquisition of a provider’s operations, some of our tenants have accepted an assignment of the previous operator’s Medicare provider agreement. Such operators that take assignment of Medicare provider agreements might be subject to liability for federal or state regulatory, civil, and criminal investigations of the previous owner’s operations and claims submissions. These types of issues may not be discovered prior to purchase or after our tenants commence operations in our facilities. Adverse decisions, fines, or recoupments might negatively impact our tenants’ financial condition, and in turn their ability to make lease and/or loan payments to us.
Certain of our lease arrangements may be subject to laws related to fraud and abuse or physician self-referrals.
Physician investment in subsidiaries that lease our facilities could subject our leases to scrutiny under fraud and abuse and physician self-referral laws. Under the Stark Law, and its implementing regulations, if our leases do not satisfy the requirements of an applicable exception, the ability of our tenants to bill for services provided to Medicare beneficiaries pursuant to referrals from physician investors could be adversely impacted and subject our tenants to fines, which could impact our tenants’ ability to make lease and/or loan payments to us. In instances where we have an equity investment in our tenants’ operations, in addition to the effect on the tenants’ ability to meet their financial obligations to us, our ownership and investment interests may also be negatively impacted. Therefore, in all cases, we intend to use our good faith efforts to structure our lease arrangements to comply with these laws.
29
We may be required to incur substantial renovation costs to make our healthcare properties suitable for other tenants.
Healthcare facilities are typically highly customized and subject to healthcare-specific building code requirements. The improvements generally required to conform a property to healthcare use can be costly and at times tenant-specific. A new or replacement operator may require different features in a property, depending on that operator’s particular business. If a current operator is unable to pay rent and/or vacates a property, we may incur substantial expenditures to modify a property before we are able to secure another tenant. Also, if the property needs to be renovated to accommodate multiple tenants, or regulatory requirements, we may incur substantial expenditures before we are able to re-lease the space. These expenditures or renovations may have a material adverse effect on our business, results of operations, and financial condition.
State certificate of need laws may adversely affect our development of facilities and the operations of our tenants.
Certain healthcare facilities in which we invest may be subject to state laws in the U.S. which require regulatory approval in the form of a certificate of need prior to the transfer of a healthcare facility or prior to initiation of certain projects, including the establishment of new or replacement facilities, the addition of beds, the addition or expansion of services, and certain capital expenditures. State certificate of need laws are not uniform throughout the U.S., are subject to change, and may delay developments of facilities or acquisitions or certain other transfers of ownership of facilities. We cannot predict the impact of state certificate of need laws on any of the preceding activities or on the operations of our tenants. Certificate of need laws often materially impact the ability of competitors to enter into the marketplace of our facilities. As a result, a portion of the value of the facility may be related to the limitation on new competitors. In the event of a change in the certificate of need laws, this value may markedly change.
RISKS RELATING TO OUR ORGANIZATION AND STRUCTURE
We depend on key personnel, the loss of any one of whom may threaten our ability to operate our business successfully.
We depend on the services of our executive officers to carry out our business and investment strategy. If we were to lose any of these executive officers, it may be more difficult for us to locate attractive acquisition targets, complete our acquisitions, and manage the facilities that we have acquired or developed. Additionally, as we expand, we will continue to need to attract and retain additional qualified officers and employees. The loss of the services of any of our executive officers, or our inability to recruit and retain qualified personnel in the future, could have a material adverse effect on our business and financial results.
Pursuant to Maryland law, our charter and bylaws contain provisions that may have the effect of deterring changes in management and third-party acquisition proposals, which in turn could depress the price of our common stock or cause dilution.
Our charter contains ownership limitations that may restrict business combination opportunities, inhibit change of control transactions, and reduce the value of our common stock. To qualify as a REIT under the Internal Revenue Code of 1986, as amended, or the Code, no more than 50% in value of our outstanding stock, after taking into account options to acquire stock, may be owned, directly or indirectly, by five or fewer persons during the last half of each taxable year. Our charter generally prohibits direct or indirect ownership by any person of more than 9.8% in value or in number, whichever is more restrictive, of outstanding shares of any class or series of our securities, including our common stock. Generally, our common stock owned by affiliated owners will be aggregated for purposes of the ownership limitation. The ownership limitation could have the effect of delaying, deterring, or preventing a change in control or other transaction in which holders of common stock might receive a premium for their common stock over the then-current market price or which such holders otherwise might believe to be in their best interests. The ownership limitation provisions also may make our common stock an unsuitable investment vehicle for any person seeking to obtain, either alone or with others as a group, ownership of more than 9.8% of either the value or number of the outstanding shares of our common stock.
Our charter and bylaws contain provisions that may impede third-party acquisition proposals. Our charter and bylaws also provide restrictions on replacing or removing directors. Directors may only be removed by the affirmative vote of the holders of two-thirds of our common stock. Additionally, stockholders are required to give us advance notice of director nominations. Special meetings of stockholders can only be called by our president, our board of directors, or the holders of at least 25% of stock entitled to vote at the meetings. These and other charter and bylaw provisions may delay or prevent a change of control or other transaction in which holders of our common stock might receive a premium for their common stock over the then-current market price or which such holders otherwise might believe to be in their best interests.
We rely on information technology in our operations, and any material failure, inadequacy, interruption, or security failure of our technology (or that of our third-party vendors) could harm our business.
We rely on information technology networks and systems, including the Internet, to process, transmit, and store electronic information, and to manage or support a variety of business processes, including financial transactions and records, and maintaining personal identifying information (in accordance with GDPR law in Europe and similar laws elsewhere) along with tenant and lease
30
data. We purchase or license some of our information technology from vendors. We rely on commercially available systems, software, tools, and monitoring to provide security for the processing, transmission, and storage of confidential data. Although we have taken steps to protect the security of our information systems and the data maintained in those systems, it is possible that our safety and security measures will not prevent the systems’ improper functioning or the improper access or disclosure of our or our tenant’s information such as in the event of cyber-attacks.
Even well-protected information systems remain potentially vulnerable because the techniques used in security breaches evolve and generally are not recognized until launched against a target, and in some cases are designed not to be detected and, in fact, may not be detected. Accordingly, we may be unable to anticipate these techniques or to implement adequate security barriers or other preventative measures, and thus it is impossible for us to entirely mitigate this risk.
A security breach, including physical or electronic break-ins, computer viruses, attacks by hackers and similar breaches, or other significant disruption involving our IT networks and related systems (or that of our third-party vendors) could:
|
|
• |
disrupt the proper functioning of our networks and systems and therefore our operations; |
|
|
• |
result in misstated financial reports, violations of loan covenants, and/or missed reporting deadlines; |
|
|
• |
result in our inability to properly monitor our compliance with regulations regarding our qualification as a REIT; |
|
|
• |
result in the unauthorized access to, and destruction, loss, theft, misappropriation or release of proprietary, confidential, sensitive or otherwise valuable information of ours or others, which others could use to compete against us or for disruptive, destructive or otherwise harmful purposes; |
|
|
• |
require management attention and resources to remedy any resulting damages; |
|
|
• |
subject us to liability claims or regulatory penalties; or |
|
|
• |
damage our reputation among our tenants and investors generally. |
Any of the foregoing could have a materially adverse effect on our business, financial condition, and results of operations.
Unfavorable resolution of pending and future litigation matters could have a material adverse effect on our financial condition.
From time-to-time, we are involved in legal proceedings, lawsuits, and other claims. We also are named as defendants in lawsuits allegedly arising out of our actions or the actions of our tenants in which such tenants have agreed to indemnify, defend, and hold us harmless from and against various claims, litigation, and liabilities arising in connection with their respective businesses. An unfavorable resolution of pending or future litigation or legal proceedings may have a material adverse effect on our business, results of operations, and financial condition. Regardless of its outcome, litigation may result in substantial costs and expenses, significantly divert the attention of management, and could damage our reputation. We cannot guarantee losses incurred in connection with any current or future legal or regulatory proceedings or actions will not exceed any available insurance coverage.
Changes in accounting pronouncements could adversely affect us and the reported financial performance of our tenants.
Uncertainties posed by various initiatives of accounting standard-setting by the Financial Accounting Standards Board (“FASB”) and the SEC, which create and interpret applicable accounting standards for U.S. companies, may change the financial accounting and reporting standards or their interpretation and application of these standards that govern the preparation of our financial statements.
These changes could have a material impact on our reported financial condition and results of operations. In some cases, we could be required to apply a new or revised standard retroactively, resulting in potentially material restatements of prior period financial statements. Similarly, these changes could have a material impact on our tenants’/borrowers’ reported financial condition or results of operations or could affect our tenants’ preferences regarding leasing real estate.
TAX RISKS
Loss of our tax status as a REIT would have significant adverse consequences to us and the value of our common stock.
We believe that we qualify as a REIT for federal income tax purposes and have elected to be taxed as a REIT under the federal income tax laws commencing with our taxable year that began on April 6, 2004, and ended on December 31, 2004. In addition, we own a direct interest in a subsidiary REIT that has elected to be taxed as a REIT commencing with the 2019 tax year. The REIT qualification requirements are extremely complex, and interpretations of the federal income tax laws governing qualification as a REIT are limited. Accordingly, there is no assurance that we will be successful in operating so as to qualify as a REIT. At any time, new laws, regulations, interpretations, or court decisions may change the federal tax laws relating to, or the federal income tax consequences of, qualification as a REIT. It is possible that future economic, market, legal, tax, or other considerations may cause our board of directors to revoke the REIT election, which it may do without stockholder approval.
If we lose or revoke our REIT status, we will face serious tax consequences that will substantially reduce the funds available for distribution because we would not be allowed a deduction for distributions to stockholders in computing our taxable income;
31
therefore, we would be subject to federal income tax at regular corporate rates, and we might need to borrow money or sell assets in order to pay any such tax. We also could be subject to increased state and local taxes, and unless we are entitled to relief under statutory provisions, we also would be disqualified from taxation as a REIT for the four taxable years following the year during which we ceased to qualify.
As a result of all these factors, a loss or revocation of our REIT status could have a material adverse effect on our financial condition and results of operations and would adversely affect the value of our common stock.
Failure to make required distributions as a REIT would subject us to tax.
In order to qualify as a REIT, each year we must distribute to our stockholders at least 90% of our REIT taxable income, excluding net capital gains. To the extent that we satisfy the distribution requirement, but distribute less than 100% of our taxable income, we will be subject to federal corporate income tax on our undistributed income. In addition, we will incur a 4% nondeductible excise tax on the amount, if any, by which our distributions in any year are less than the sum of (1) 85% of our ordinary income for that year; (2) 95% of our capital gain net income for that year; and (3) 100% of our undistributed taxable income from prior years.
We may be required to make distributions to stockholders at disadvantageous times or when we do not have funds readily available for distribution. Differences in timing between the recognition of income and the related cash receipts or the effect of required debt amortization payments could require us to borrow money or sell assets to pay out enough of our taxable income to satisfy the distribution requirement and to avoid corporate income tax and the 4% excise tax in a particular year. In the future, we may borrow to pay distributions to our stockholders. Any funds that we borrow would subject us to interest rate and other market risks.
Complying with REIT requirements may cause us to forego otherwise attractive opportunities.
To qualify as a REIT for U.S. federal income tax purposes, we must continually satisfy tests concerning, among other things, the sources of our income, the nature and diversification of our assets, the amounts we distribute to our stockholders, and the ownership of our stock. In order to meet these tests, we may be required to forego attractive business or investment opportunities. Currently, no more than 20% of the value of our assets may consist of securities of one or more TRS and no more than 25% of the value of our assets may consist of securities that are not qualifying assets under the test requiring that 75% of a REIT’s assets consist of real estate and other related assets. In addition, at least 75% of our gross income must be generated from either rents from real estate or interest on loans secured by real estate (i.e. mortgage loans). Further, a TRS may not directly or indirectly operate or manage a healthcare facility. Compliance with current and future changes to REIT requirements may limit our flexibility in executing our business plan.
If certain sale-leaseback transactions are not characterized by the Internal Revenue Service (“IRS”) or similar tax authorities internationally as “true leases,” we may be subject to adverse tax consequences.
We have purchased certain properties and leased them back to the sellers of such properties. We intend for any such sale-leaseback transaction to be structured in a manner that the lease will be characterized as a “true lease,” thereby allowing us to be treated as the owner of the property for income tax purposes. However, depending on the terms of any specific transaction, taxing authorities might take the position that the transaction is not a “true lease”. In the event any sale-leaseback transaction is challenged and successfully re-characterized, we might not be able to deduct depreciation expense on the real estate, resulting in potential higher income taxes.
Transactions with TRSs may be subject to excise tax.
We have historically entered into lease and other transactions with our TRS and its subsidiaries and expect to continue to do so in the future. Under applicable rules, transactions such as leases between our TRS and its parent REIT that are not conducted on a market terms basis may be subject to a 100% excise tax. While we believe that all of our transactions with our TRS are at arm’s length, imposition of a 100% excise tax could have a material adverse effect on our financial condition and results of operations.
Loans to our tenants could be characterized as equity, in which case our income from that tenant might not be qualifying income under the REIT rules and we could lose our REIT status.
Our TRS will make loans to tenants of our facilities to acquire operations or for working capital purposes. The IRS may take the position that certain loans to tenants should be treated as equity interests rather than debt, and that our interest income from such tenant should not be treated as qualifying income for purposes of the REIT gross income tests. If the IRS were to successfully treat a loan to a particular tenant as equity interests, the tenant would be a “related party tenant” with respect to our company and the rent that we receive from the tenant would not be qualifying income for purposes of the REIT gross income tests. As a result, we could be in jeopardy of failing the 75% income test discussed above, which if we did would cause us to lose our REIT status. In addition, if the IRS were to successfully treat a particular loan as interests held by our operating partnership rather than by our TRS, we could fail the 5% asset test, and if the IRS further successfully treated the loan as other than straight debt, we could fail the 10% asset test with
32
respect to such interest. As a result of the failure of either test, we could lose our REIT status, which would subject us to corporate level income tax and adversely affect our ability to make distributions to our stockholders.
Certain transfers may generate prohibited transaction income, resulting in a penalty tax on gain attributable to the transaction.
From time-to-time, we may transfer or otherwise dispose of some of our properties, including by contributing properties to our co-investment ventures. Under the Code, any gain resulting from transfers of properties we hold as inventory or primarily for sale to customers in the ordinary course of business is treated as income from a prohibited transaction subject to a 100% penalty tax. We do not believe that our transfers or disposals of property or our contributions of properties into our co-investment ventures are prohibited transactions. However, whether property is held for investment purposes is a question of fact that depends on all the facts and circumstances surrounding the particular transaction. The IRS may contend that certain transfers or dispositions of properties by us or contributions of properties into our co-investment ventures are prohibited transactions. While we believe that the IRS would not prevail in any such dispute, if the IRS were to argue successfully that a transfer, disposition, or contribution of property constituted a prohibited transaction, we would be required to pay a 100% penalty tax on any gain allocable to us from the prohibited transaction. In addition, income from a prohibited transaction might adversely affect our ability to satisfy the income tests for qualification as a REIT.
Changes in U.S. or foreign tax laws, regulations, including changes to tax rates, may adversely affect our results of operations.
We are headquartered in the U.S. with subsidiaries and investments globally and are subject to income taxes in these jurisdictions. Significant judgment is required in determining our provision for income taxes. Although we believe that we have adequately assessed and accounted for our potential tax liabilities, and that our tax estimates are reasonable, there can be no assurance that additional taxes will not be due upon audit of our tax returns or as a result of changes to applicable tax laws. The U.S. government as well as the governments of many of the locations in which we operate (such as Australia, Germany, the United Kingdom, Colombia, and Luxembourg, which is where most of our Europe entities are domiciled) are actively discussing changes to corporate taxation. Our future tax expense could be adversely affected by these changes in tax laws or their interpretation, both domestically and internationally. Potential tax reforms being considered by many countries include changes that could impact, among other things, global tax reporting, intercompany transfer pricing arrangements, the definition of taxable permanent establishments, and other legal or financial arrangements. The nature and timing of any changes to each jurisdiction’s tax laws and the impact on our future tax exposure both in the U.S. and abroad cannot be predicted with any accuracy but could materially and adversely impact our results of operations and cash flows.
Dividends payable by REITs do not qualify for the reduced tax rates available for some dividends.
Income from “qualified dividends” payable to U.S. stockholders that are individuals, trusts, and estates are generally subject to tax at preferential rates. Dividends payable by REITs, however, generally are not eligible for the preferential tax rates applicable to qualified dividend income. Although these rules do not adversely affect the taxation of REITs or dividends payable by REITs, to the extent that the preferential rates continue to apply to regular corporate qualified dividends, investors who are individuals, trusts, and estates may perceive investments in REITs to be relatively less attractive than investments in the stocks of non-REIT corporations that pay dividends, which could materially and adversely affect the value of the shares of REITs, including the per share trading price of our capital stock.
The Tax Cuts and Jobs Act provides a deduction to non-corporate taxpayers (e.g., individuals, trusts, and estates) of 20% on dividends paid by a REIT that are not classified as capital gains. This provides closer parity between the treatment under the law of ordinary REIT dividends and qualified dividends. The law also provides for a maximum individual marginal tax rate on ordinary income, without regard to the effect of this deduction, of 37%. For non-corporate taxpayers, this would reduce the maximum marginal tax rate on ordinary REIT dividends to 33.4% (including the 3.8% Medicare tax that is applied before the 20% deduction). The tax law’s 20% deduction on dividends paid by a REIT to non-corporate taxpayers and the reduced individual tax rates are scheduled to sunset for tax years beginning after 2025, absent further legislation.
Loss of our tax status as a Managed Investment Trust for our Australia subsidiary would result in additional foreign tax liability.
We have structured our Australia investment through a Managed Investment Trust which provides certain tax benefits to us. In order to obtain these tax benefits, we must meet specific qualifying conditions on an annual basis. If these conditions are not met, we will be subject to higher foreign income taxes related to our Australian investment. We believe all qualifying conditions have been met; however, these qualifications can be subjective and could result in differing interpretations by the local tax authorities.
|
ITEM 1B. |
Unresolved Staff Comments |
None.
33
|
ITEM 2. |
Properties |
At December 31, 2020, our portfolio (including properties in our five real estate joint ventures) consisted of 392 properties: 364 facilities (of the 386 facilities that we owned) were in operation and leased to 45 operators, six assets were in the form of first mortgage loans to four operators, and two properties were under construction.
|
|
|
Total Properties |
|
|
Total 2020 Revenue |
|
|
Total Assets(A) |
|
|
|||
|
|
|
(Dollars in thousands) |
|
|
|||||||||
|
United States: |
|
|
|
|
|
|
|
|
|
|
|
|
|
|
Alabama |
|
|
2 |
|
|
$ |
791 |
|
|
$ |
8,911 |
|
|
|
Arizona |
|
|
16 |
|
|
|
51,810 |
|
|
|
495,592 |
|
(C) |
|
Arkansas |
|
|
2 |
|
|
|
9,068 |
|
|
|
99,683 |
|
|
|
California |
|
|
23 |
|
|
|
146,705 |
|
|
|
1,342,172 |
|
(B) |
|
Colorado |
|
|
13 |
|
|
|
10,768 |
|
|
|
98,400 |
|
|
|
Connecticut |
|
|
3 |
|
|
|
46,412 |
|
|
|
475,487 |
|
|
|
Florida |
|
|
4 |
|
|
|
18,509 |
|
|
|
233,198 |
|
|
|
Idaho |
|
|
6 |
|
|
|
30,412 |
|
|
|
301,430 |
|
|
|
Illinois |
|
|
— |
|
|
|
211 |
|
|
|
— |
|
|
|
Indiana |
|
|
4 |
|
|
|
4,856 |
|
|
|
83,004 |
|
|
|
Iowa |
|
|
1 |
|
|
|
4,927 |
|
|
|
57,029 |
|
|
|
Kansas |
|
|
11 |
|
|
|
25,825 |
|
|
|
305,767 |
|
|
|
Kentucky |
|
|
1 |
|
|
|
7,770 |
|
|
|
66,300 |
|
|
|
Louisiana |
|
|
6 |
|
|
|
14,370 |
|
|
|
152,086 |
|
|
|
Massachusetts |
|
|
10 |
|
|
|
139,326 |
|
|
|
1,462,614 |
|
|
|
Michigan |
|
|
2 |
|
|
|
4,297 |
|
|
|
29,875 |
|
|
|
Missouri |
|
|
4 |
|
|
|
19,457 |
|
|
|
170,921 |
|
|
|
Montana |
|
|
1 |
|
|
|
1,733 |
|
|
|
17,934 |
|
|
|
Nevada |
|
|
1 |
|
|
|
10,411 |
|
|
|
87,698 |
|
|
|
New Jersey |
|
|
6 |
|
|
|
30,716 |
|
|
|
313,172 |
|
|
|
New Mexico |
|
|
2 |
|
|
|
4,608 |
|
|
|
44,934 |
|
|
|
Ohio |
|
|
7 |
|
|
|
13,383 |
|
|
|
131,321 |
|
(C) |
|
Oklahoma |
|
|
1 |
|
|
|
6,647 |
|
|
|
73,154 |
|
|
|
Oregon |
|
|
1 |
|
|
|
10,038 |
|
|
|
110,000 |
|
|
|
Pennsylvania |
|
|
10 |
|
|
|
78,682 |
|
|
|
864,273 |
|
|
|
Rhode Island |
|
|
2 |
|
|
|
8,471 |
|
|
|
112,019 |
|
|
|
South Carolina |
|
|
8 |
|
|
|
13,038 |
|
|
|
186,311 |
|
|
|
Texas |
|
|
59 |
|
|
|
110,261 |
|
|
|
1,586,983 |
|
(C) |
|
Utah |
|
|
7 |
|
|
|
110,781 |
|
|
|
1,292,601 |
|
|
|
Virginia |
|
|
2 |
|
|
|
2,846 |
|
|
|
25,577 |
|
|
|
Washington |
|
|
2 |
|
|
|
12,653 |
|
|
|
136,600 |
|
|
|
West Virginia |
|
|
1 |
|
|
|
814 |
|
|
|
17,257 |
|
|
|
Wisconsin |
|
|
1 |
|
|
|
3,281 |
|
|
|
29,062 |
|
|
|
Wyoming |
|
|
3 |
|
|
|
9,032 |
|
|
|
102,676 |
|
|
|
Other assets |
|
|
— |
|
|
|
— |
|
|
|
405,166 |
|
|
|
Total United States |
|
|
222 |
|
|
$ |
962,909 |
|
|
$ |
10,919,207 |
|
|
|
International: |
|
|
|
|
|
|
|
|
|
|
|
|
|
|
Australia |
|
|
11 |
|
|
$ |
55,874 |
|
|
$ |
989,849 |
|
|
|
Colombia |
|
|
3 |
|
|
|
1,646 |
|
|
|
139,703 |
|
|
|
Germany |
|
|
82 |
|
|
|
34,646 |
|
|
|
811,549 |
|
(D) |
|
Italy |
|
|
8 |
|
|
|
— |
|
|
|
98,103 |
|
(D) |
|
Portugal |
|
|
1 |
|
|
|
1,788 |
|
|
|
37,479 |
|
|
|
Spain |
|
|
3 |
|
|
|
472 |
|
|
|
99,841 |
|
(D) |
|
Switzerland |
|
|
17 |
|
|
|
384 |
|
|
|
558,809 |
|
(D) |
|
United Kingdom |
|
|
45 |
|
|
|
191,519 |
|
|
|
3,070,547 |
|
|
|
Other assets |
|
|
— |
|
|
|
— |
|
|
|
103,927 |
|
|
|
Total International |
|
|
170 |
|
|
$ |
286,329 |
|
|
$ |
5,909,807 |
|
|
|
Total |
|
|
392 |
|
|
$ |
1,249,238 |
|
|
$ |
16,829,014 |
|
|
|
(A) |
Represents total assets at December 31, 2020. |
|
(B) |
Includes two development projects still under construction at December 31, 2020. |
34
|
(C) |
Arizona and Ohio each include one facility that was vacant at December 31, 2020. Texas includes 18 facilities that were vacant at December 31, 2020. Our investment in facilities that were vacant at December 31, 2020 is less than 1.0% of total assets. |
|
(D) |
For Germany, Switzerland, Italy, and Spain, we own properties through five real estate joint venture arrangements. The table below shows revenues earned from our joint venture arrangements: |
|
|
|
Total Properties |
|
|
Total 2020 Revenue |
|
||
|
|
|
(Dollars in thousands) |
|
|||||
|
Germany |
|
|
71 |
|
|
$ |
63,966 |
|
|
Switzerland |
|
|
17 |
|
|
|
24,795 |
|
|
Italy |
|
|
8 |
|
|
|
8,090 |
|
|
Spain |
|
|
3 |
|
|
|
8,907 |
|
|
Total |
|
|
99 |
|
|
$ |
105,758 |
|
A breakout of our facilities at December 31, 2020 based on property type is as follows:
|
|
|
Number of Properties |
|
|
Total Square Footage |
|
|
Total Licensed Beds(A) |
|
|||
|
General acute care hospitals |
|
|
204 |
|
|
|
38,457,440 |
|
|
|
23,989 |
|
|
IRFs |
|
|
112 |
|
|
|
12,492,025 |
|
|
|
16,498 |
|
|
LTACHs |
|
|
20 |
|
|
|
1,150,075 |
|
|
|
1,081 |
|
|
FSERs |
|
|
51 |
|
|
|
384,745 |
|
|
|
— |
|
|
Behavioral health facilities |
|
|
5 |
|
|
|
383,044 |
|
|
|
507 |
|
|
|
|
|
392 |
|
|
|
52,867,329 |
|
|
|
42,075 |
|
|
(A) |
Excludes our two facilities that are under development. |
The following table shows lease and loan expirations, assuming that none of the tenants/borrowers exercise any of their renewal options (dollars in thousands):
|
Total Lease and Loan Portfolio(1) |
|
Total Leases/ Loans(2) |
|
|
Annualized Base Rent/ Interest(3) |
|
|
% of Total Annualized Base Rent/ Interest |
|
|
Total Square Footage |
|
|
Total Licensed Beds |
|
|||||
|
2021 |
|
|
1 |
|
|
$ |
2,250 |
|
|
|
0.2 |
% |
|
|
95,445 |
|
|
|
126 |
|
|
2022 |
|
|
16 |
|
|
|
55,622 |
|
|
|
4.6 |
% |
|
|
3,860,484 |
|
|
|
2,719 |
|
|
2023 |
|
|
4 |
|
|
|
13,748 |
|
|
|
1.1 |
% |
|
|
912,652 |
|
|
|
823 |
|
|
2024 |
|
|
1 |
|
|
|
2,731 |
|
|
|
0.2 |
% |
|
|
204,325 |
|
|
|
170 |
|
|
2025 |
|
|
7 |
|
|
|
17,225 |
|
|
|
1.4 |
% |
|
|
1,636,236 |
|
|
|
850 |
|
|
2026 |
|
|
2 |
|
|
|
8,850 |
|
|
|
0.7 |
% |
|
|
212,272 |
|
|
|
187 |
|
|
2027 |
|
|
1 |
|
|
|
3,183 |
|
|
|
0.3 |
% |
|
|
102,948 |
|
|
|
13 |
|
|
2028 |
|
|
4 |
|
|
|
5,591 |
|
|
|
0.5 |
% |
|
|
141,725 |
|
|
|
74 |
|
|
2029 |
|
|
12 |
|
|
|
44,854 |
|
|
|
3.7 |
% |
|
|
2,375,756 |
|
|
|
1,154 |
|
|
2030 |
|
|
5 |
|
|
|
4,509 |
|
|
|
0.4 |
% |
|
|
177,066 |
|
|
|
16 |
|
|
Thereafter |
|
|
356 |
|
|
|
1,046,041 |
|
|
|
86.9 |
% |
|
|
44,720,824 |
|
|
|
37,538 |
|
|
Total |
|
|
409 |
|
|
$ |
1,204,604 |
|
|
|
100.0 |
% |
|
|
54,439,733 |
|
|
|
43,670 |
|
|
(1) |
Schedule includes leases and mortgage loans. |
|
(2) |
Includes all properties, including 99 properties owned through our five real estate joint ventures and an estimated 40 properties to be acquired in the Priory transaction, except 20 vacant properties representing less than 1% of our total assets, and two facilities that are under development. |
|
(3) |
The most recent monthly base rent and mortgage loan interest annualized. This does not include tenant recoveries, additional rents, and other lease/loan-related adjustments to revenue (i.e., straight-line rents and deferred revenues). |
|
ITEM 3. |
Legal Proceedings |
From time-to-time, there are various legal proceedings pending to which we are a party or to which some of our properties are subject to arising in the normal course of business. At this time, we do not believe that the ultimate resolution of these proceedings will have a material adverse effect on our consolidated financial position or results of operations.
35
|
ITEM 4. |
Mine Safety Disclosures |
None.
36
PART II
|
ITEM 5. |
Market for Registrant’s Common Equity, Related Stockholder Matters, and Issuer Purchases of Equity Securities |
(a) Medical Properties’ common stock is traded on the New York Stock Exchange under the symbol “MPW.” The following table sets forth the high and low sales prices for the common stock for the periods indicated, as reported by the New York Stock Exchange Composite Tape, and the dividends per share declared by us with respect to each such period.
|
|
|
High |
|
|
Low |
|
|
Dividends |
|
|||
|
Year Ended December 31, 2020 |
|
|
|
|
|
|
|
|
|
|
|
|
|
First Quarter |
|
$ |
24.29 |
|
|
$ |
12.35 |
|
|
$ |
0.27 |
|
|
Second Quarter |
|
|
20.90 |
|
|
|
14.20 |
|
|
|
0.27 |
|
|
Third Quarter |
|
|
20.72 |
|
|
|
16.10 |
|
|
|
0.27 |
|
|
Fourth Quarter |
|
|
21.96 |
|
|
|
17.13 |
|
|
|
0.27 |
|
|
Year Ended December 31, 2019 |
|
|
|
|
|
|
|
|
|
|
|
|
|
First Quarter |
|
$ |
18.89 |
|
|
$ |
15.50 |
|
|
$ |
0.25 |
|
|
Second Quarter |
|
|
18.92 |
|
|
|
16.83 |
|
|
|
0.25 |
|
|
Third Quarter |
|
|
19.67 |
|
|
|
17.06 |
|
|
|
0.26 |
|
|
Fourth Quarter |
|
|
21.63 |
|
|
|
18.94 |
|
|
|
0.26 |
|
On February 19, 2021, the closing price for our common stock, as reported on the New York Stock Exchange, was $21.86 per share. As of February 19, 2021, there were 71 holders of record of our common stock. This figure does not reflect the beneficial ownership of shares held in nominee name.
To qualify as a REIT, we must distribute at least 90% of our REIT taxable income, excluding net capital gain, as dividends to our stockholders. If dividends are declared in a quarter, those dividends will be paid during the subsequent quarter. We expect to continue the policy of distributing our taxable income through regular cash dividends on a quarterly basis, although there is no assurance as to future dividends because they depend on future earnings, capital requirements, and our financial condition. In addition, our Credit Facility limits the amounts of dividends we can pay — see Note 4 of Item 8 of this Annual Report on Form 10-K for more information.
(b) Not applicable.
(c) None.
37
The following graph provides comparison of cumulative total stockholder return for the period from December 31, 2015 through December 31, 2020, among us, the Russell 2000 Index, NAREIT All Equity REIT Index, and SNL US REIT Healthcare Index. The stock performance graph assumes an investment of $100 in us and the three indices, and the reinvestment of dividends. The historical information below is not indicative of future performance.

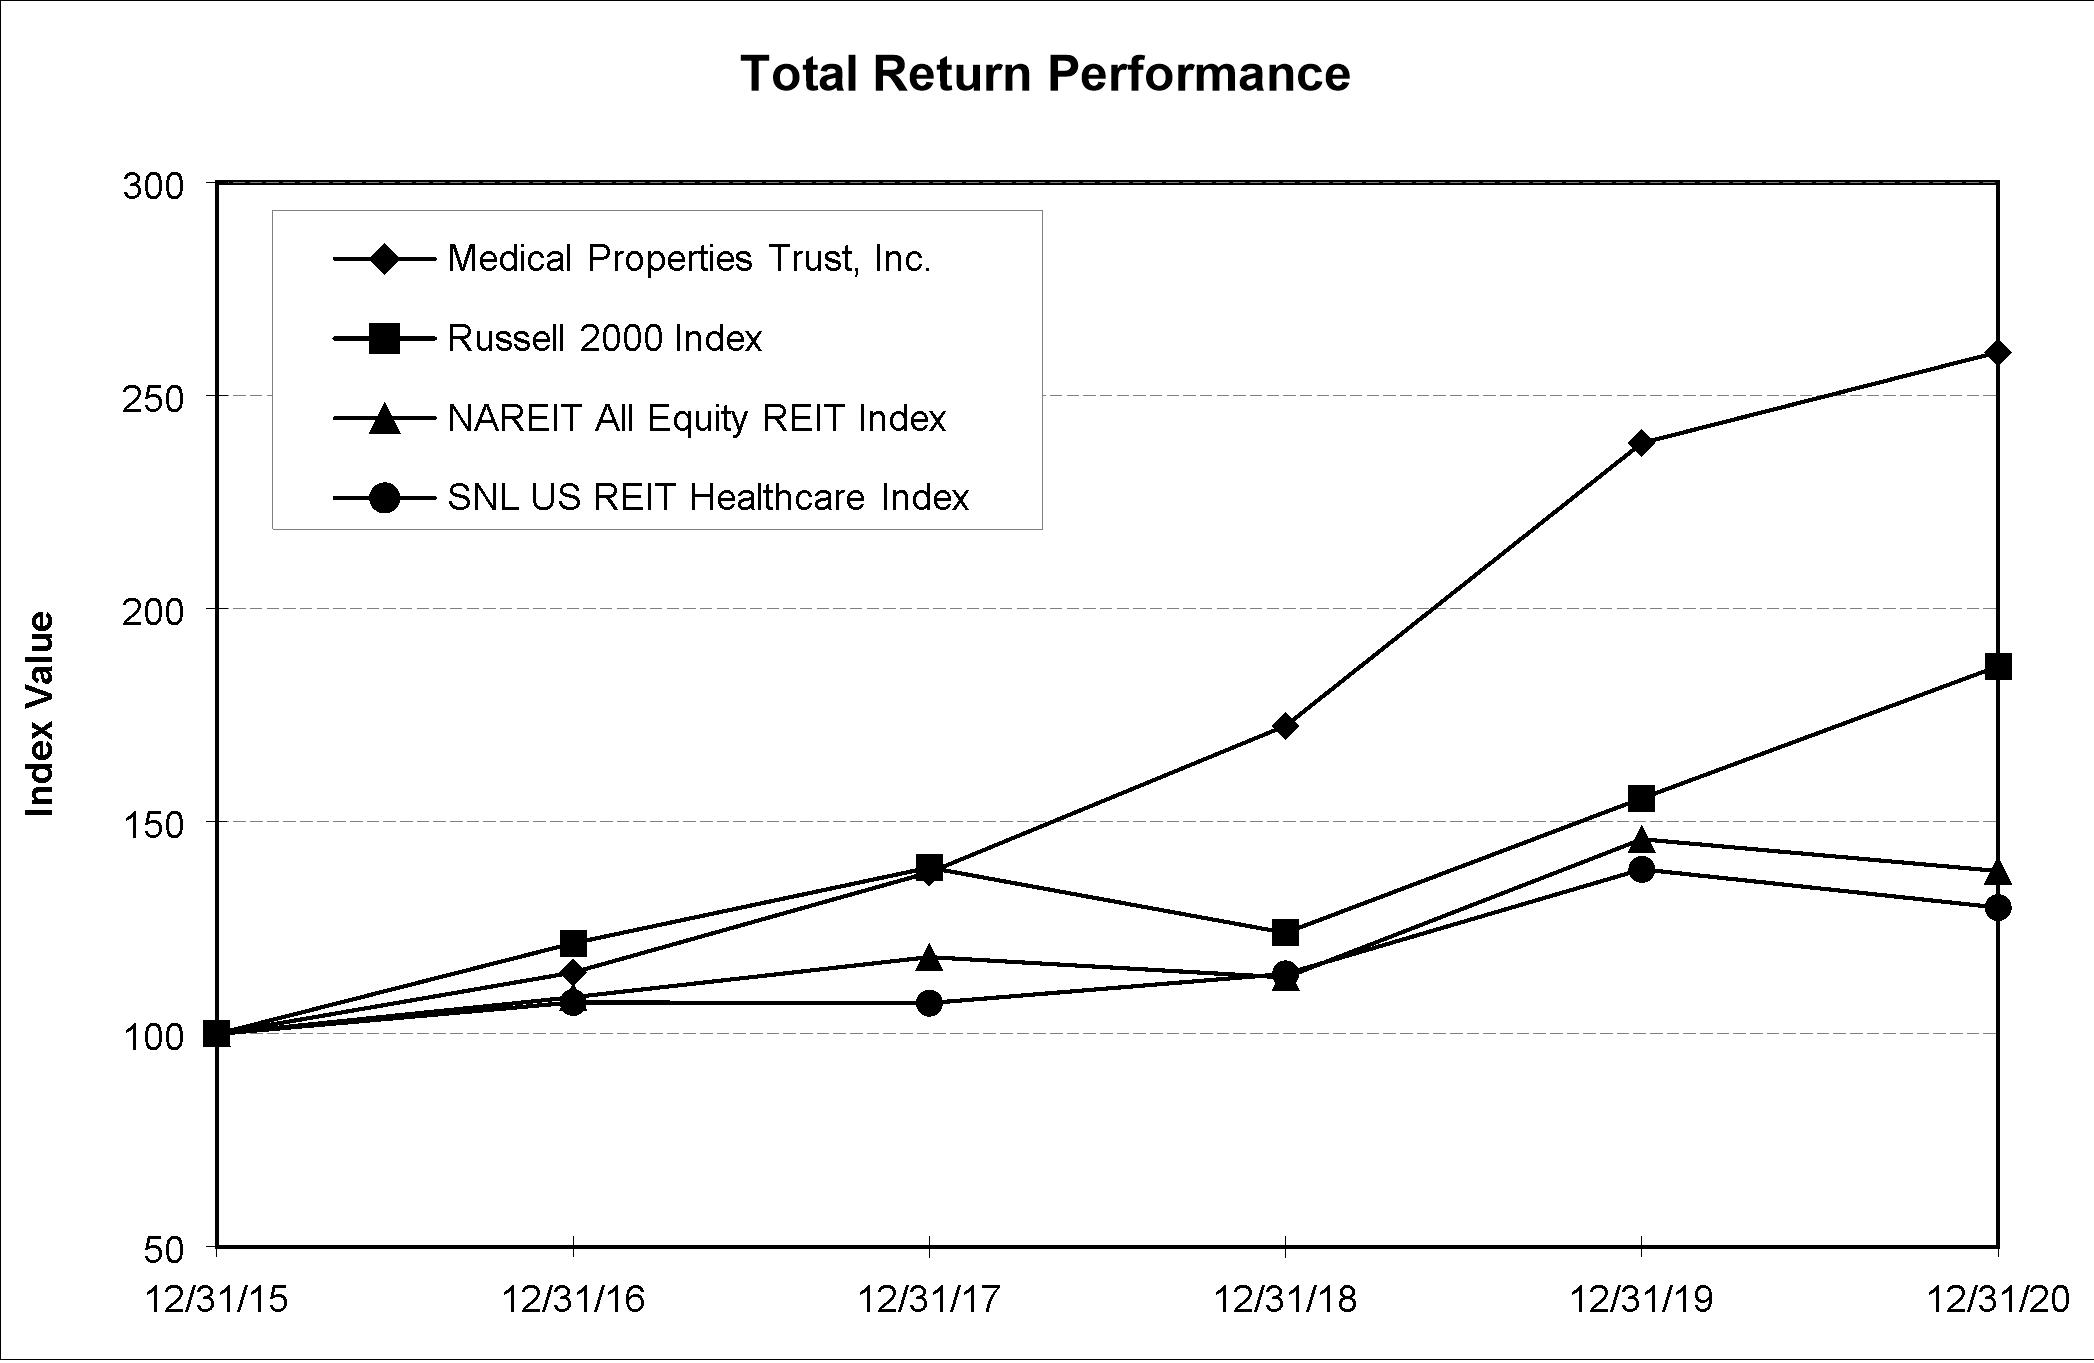
|
|
|
Period Ending |
|
|||||||||||||||||||||
|
Index |
|
12/31/2015 |
|
|
12/31/2016 |
|
|
12/31/2017 |
|
|
12/31/2018 |
|
|
12/31/2019 |
|
|
12/31/2020 |
|
||||||
|
Medical Properties Trust, Inc. |
|
|
100.00 |
|
|
|
114.44 |
|
|
|
137.94 |
|
|
|
172.38 |
|
|
|
238.81 |
|
|
|
260.15 |
|
|
Russell 2000 |
|
|
100.00 |
|
|
|
121.31 |
|
|
|
139.08 |
|
|
|
123.76 |
|
|
|
155.35 |
|
|
|
186.36 |
|
|
NAREIT All Equity REIT Index |
|
|
100.00 |
|
|
|
108.63 |
|
|
|
118.05 |
|
|
|
113.28 |
|
|
|
145.75 |
|
|
|
138.28 |
|
|
SNL US REIT Healthcare |
|
|
100.00 |
|
|
|
107.42 |
|
|
|
107.26 |
|
|
|
114.12 |
|
|
|
138.67 |
|
|
|
129.69 |
|
The graph and accompanying text shall not be deemed incorporated by reference by any general statement incorporating by reference this Annual Report on Form 10-K into any filing under the Securities Act of 1933, as amended, or under the Securities Exchange Act of 1934, as amended.
|
ITEM 6. |
Reserved. |
38
|
ITEM 7. |
Management’s Discussion and Analysis of Financial Condition and Results of Operations |
Unless otherwise indicated, references to “our,” “we,” and “us” in this management’s discussion and analysis of financial condition and results of operations refer to Medical Properties Trust, Inc. and its consolidated subsidiaries, including MPT Operating Partnership, L.P.
Overview
We were incorporated in Maryland on August 27, 2003, primarily for the purpose of investing in and owning net-leased healthcare facilities. We also make real estate mortgage loans and other loans to our tenants. We conduct our business operations in one segment. We currently have healthcare investments in the U.S., Europe, Australia, and South America. We have operated as a REIT since April 6, 2004, and accordingly, elected REIT status upon the filing of our calendar year 2004 U.S. federal income tax return. Our existing tenants are, and our prospective tenants will generally be, healthcare operating companies and other healthcare providers that use substantial real estate assets in their operations. We offer financing to these operators through 100% lease and mortgage financing and generally seek lease and loan terms on a long-term basis (typically 15 years) with a series of shorter renewal terms at the option of our tenants and borrowers. We also have included and intend to include in our lease and loan agreements annual contractual minimum rate increases. Our existing portfolio’s minimum escalators generally range from 0.5% to 3%. In addition, most of our leases and loans include rate increases based on the general rate of inflation if greater than the minimum contractual increases. Beyond rent or mortgage interest, our leases and loans typically require our tenants to pay all operating costs and expenses associated with the facility. Finally, we may acquire a profits or other equity interest in our tenants that gives us a right to share in the tenant’s income or loss.
We selectively make loans to certain of our operators through our TRSs, which the operators use for acquisitions and working capital. We consider our lending business an important element of our overall business strategy for two primary reasons: (1) it provides opportunities to make income-earning investments that yield attractive risk-adjusted returns in an industry in which our management has expertise, and (2) by making debt capital available to certain qualified operators, we believe we create for our company a competitive advantage over other buyers of, and financing sources for, healthcare facilities.
At December 31, 2020, our portfolio (including real estate assets in joint ventures) consisted of 392 properties leased or loaned to 49 operators, of which two were under development and six were in the form of mortgage loans.
39
Selected Financial Data
The following sets forth selected consolidated financial and operating data. You should read the following selected financial data in conjunction with the consolidated financial statements and notes thereto of each of Medical Properties Trust, Inc. and MPT Operating Partnership, L.P. and their respective subsidiaries included in Item 8, in this Annual Report on Form 10-K.
|
|
|
For the Years Ended December 31, |
|
|||||||||
|
|
|
2020 |
|
|
2019 |
|
|
2018 |
|
|||
|
|
|
(In thousands except per share data) |
|
|||||||||
|
OPERATING DATA |
|
|
|
|
|
|
|
|
|
|
|
|
|
Total revenues |
|
$ |
1,249,238 |
|
|
$ |
854,197 |
|
|
$ |
784,522 |
|
|
Expenses: |
|
|
|
|
|
|
|
|
|
|
|
|
|
Interest |
|
|
328,728 |
|
|
|
237,830 |
|
|
|
223,274 |
|
|
Real estate depreciation and amortization |
|
|
264,245 |
|
|
|
152,313 |
|
|
|
133,083 |
|
|
Property-related |
|
|
24,890 |
|
|
|
23,992 |
|
|
|
9,237 |
|
|
General and administrative |
|
|
131,663 |
|
|
|
96,411 |
|
|
|
81,003 |
|
|
Total expenses |
|
|
749,526 |
|
|
|
510,546 |
|
|
|
446,597 |
|
|
Other income (expense): |
|
|
|
|
|
|
|
|
|
|
|
|
|
(Loss) gain on sale of real estate |
|
|
(2,833 |
) |
|
|
41,560 |
|
|
|
719,392 |
|
|
Real estate impairment charges |
|
|
(19,006 |
) |
|
|
(21,031 |
) |
|
|
(48,007 |
) |
|
Earnings from equity interests |
|
|
20,417 |
|
|
|
16,051 |
|
|
|
14,165 |
|
|
Debt refinancing and unutilized financing costs |
|
|
(28,180 |
) |
|
|
(6,106 |
) |
|
|
— |
|
|
Other (including mark-to-market adjustments on equity securities) |
|
|
(6,782 |
) |
|
|
(345 |
) |
|
|
(4,071 |
) |
|
Income tax (expense) benefit |
|
|
(31,056 |
) |
|
|
2,621 |
|
|
|
(927 |
) |
|
Net income |
|
|
432,272 |
|
|
|
376,401 |
|
|
|
1,018,477 |
|
|
Net income attributable to non-controlling interests |
|
|
(822 |
) |
|
|
(1,717 |
) |
|
|
(1,792 |
) |
|
Net income attributable to MPT common stockholders |
|
$ |
431,450 |
|
|
$ |
374,684 |
|
|
$ |
1,016,685 |
|
|
Net income attributable to MPT common stockholders per diluted share |
|
$ |
0.81 |
|
|
$ |
0.87 |
|
|
$ |
2.76 |
|
|
Weighted-average shares outstanding — diluted |
|
|
530,461 |
|
|
|
428,299 |
|
|
|
366,271 |
|
|
OTHER DATA |
|
|
|
|
|
|
|
|
|
|
|
|
|
Dividends declared per common share |
|
$ |
1.08 |
|
|
$ |
1.02 |
|
|
$ |
1.00 |
|
|
FFO(1) |
|
$ |
757,677 |
|
|
$ |
535,768 |
|
|
$ |
485,335 |
|
|
Normalized FFO(1) |
|
$ |
831,209 |
|
|
$ |
557,413 |
|
|
$ |
501,004 |
|
|
Normalized FFO per share(1) |
|
$ |
1.57 |
|
|
$ |
1.30 |
|
|
$ |
1.37 |
|
|
Cash paid for acquisitions and other related investments |
|
$ |
3,414,437 |
|
|
$ |
4,565,594 |
|
|
$ |
666,548 |
|
|
|
|
December 31, |
|
|||||||||
|
|
|
2020 |
|
|
2019 |
|
|
2018 |
|
|||
|
|
|
(In thousands) |
|
|||||||||
|
BALANCE SHEET DATA |
|
|
|
|
|
|
|
|
|
|
|
|
|
Real estate assets — at cost |
|
$ |
14,337,929 |
|
|
$ |
11,438,078 |
|
|
$ |
7,165,834 |
|
|
Real estate accumulated depreciation/amortization |
|
|
(833,529 |
) |
|
|
(570,042 |
) |
|
|
(464,984 |
) |
|
Cash and cash equivalents |
|
|
549,884 |
|
|
|
1,462,286 |
|
|
|
820,868 |
|
|
Equity investments |
|
|
1,123,623 |
|
|
|
926,990 |
|
|
|
520,058 |
|
|
Other loans |
|
|
858,368 |
|
|
|
544,832 |
|
|
|
373,198 |
|
|
Other assets |
|
|
792,739 |
|
|
|
665,187 |
|
|
|
428,669 |
|
|
Total assets |
|
$ |
16,829,014 |
|
|
$ |
14,467,331 |
|
|
$ |
8,843,643 |
|
|
Debt, net |
|
$ |
8,865,458 |
|
|
$ |
7,023,679 |
|
|
$ |
4,037,389 |
|
|
Other liabilities |
|
|
619,699 |
|
|
|
415,498 |
|
|
|
245,316 |
|
|
Total Medical Properties Trust, Inc. stockholders’ equity |
|
|
7,338,532 |
|
|
|
7,028,047 |
|
|
|
4,547,108 |
|
|
Non-controlling interests |
|
|
5,325 |
|
|
|
107 |
|
|
|
13,830 |
|
|
Total equity |
|
|
7,343,857 |
|
|
|
7,028,154 |
|
|
|
4,560,938 |
|
|
Total liabilities and equity |
|
$ |
16,829,014 |
|
|
$ |
14,467,331 |
|
|
$ |
8,843,643 |
|
|
(1) |
See section titled “Non-GAAP Financial Measures” for an explanation of why these non-GAAP financial measures are useful along with a reconciliation to our GAAP earnings. |
40
2020 Highlights
The global outbreak of COVID-19 in 2020, including in countries where we own and lease facilities, has further validated our business model, which focuses on hospitals as the centerpiece of healthcare delivery across the world. As COVID-19 ramped up, governments around the world looked to hospitals and hospital operators to provide necessary care to victims of the pandemic. In the early stages of the pandemic, our tenants were impacted by the governmental mandates to defer elective surgeries, the takeover of certain facilities by the governments in certain countries, and the overall downturn in the economy in general. By the 2020 third quarter, our tenants were back accepting patients and performing medically necessary elective procedures, resulting in improved volumes compared to the 2020 second quarter. Despite all of this, we received all but 2% of our annual rent and interest payments in 2020. For the 2% not collected as scheduled, we have agreements in place to collect such deferred amounts plus interest. We expect to continue to receive substantially all future rent and interest payments; however, no assurances can be made that if the pandemic continues for an extended period of time that our rent and interest payments will not be delayed into the future until our tenants can recover.
In addition to the collection of almost all of our rent and interest during the pandemic, we, along with our operators, executed on several accretive growth initiatives during 2020 despite the environment created by the COVID-19 pandemic. In 2020, we invested approximately $3.6 billion in hospital real estate. Additionally, we have maintained liquidity during the COVID-19 pandemic by raising more than $400.0 million in proceeds through sales of our common stock in our at-the-market program, receiving more than $500.0 million from payoffs on our loan portfolio and divestitures, and completing a $1.3 billion 3.50% senior unsecured notes offering, of which approximately $833 million was used to refinance debt with a weighted-average interest rate of 6%. We also increased our dividend to $0.27 per share per quarter in 2020, which is the 6th year in a row for such an increase. Finally, shortly after year-end, we were able to extend and improve pricing of our revolving credit and term loan facility (“Credit Facility”).
A summary of our 2020 highlights is as follows:
|
|
• |
Acquired the following real estate assets: |
|
|
• |
Acquired 30 acute care hospitals in the United Kingdom for a purchase price of approximately £1.5 billion. These facilities are leased to Circle; |
|
|
• |
Formed a new joint venture for the purpose of investing in the operations of international hospitals and originated a $205 million acquisition loan as part of this formation. We have a 49% interest in this joint venture, which simultaneously purchased from Steward the rights and existing assets related to all present and future international opportunities previously owned by Steward for strategic, regulatory, and risk management purposes; |
|
|
• |
Completed construction and began recording rental income on two general acute care facilities and one IRF; |
|
|
• |
Commenced the development of two IRFs in California for a total budget of $95.6 million. These facilities will be leased to Ernest Health, Inc. (“Ernest”) upon completion in the fourth quarter of 2021 and first quarter of 2022; |
|
|
• |
Acquired the fee simple real estate of two general acute care hospitals in Utah for a total investment of $950 million in exchange for the reduction of the mortgage loans made to Steward for such properties and additional cash consideration of $200 million based on their relative fair value; |
|
|
• |
Acquired an inpatient rehabilitation facility in Germany for approximately €12.5 million leased to MEDIAN; |
|
|
• |
Acquired two private acute care facilities in the United Kingdom for a total of approximately £115 million leased to Circle; |
|
|
• |
Acquired a general acute care hospital in Lynwood, California for a total investment of approximately $300 million. This facility is leased to affiliates of Prime Healthcare Services, Inc. (collectively, “Prime”); |
|
|
• |
Acquired a general acute care facility in the United Kingdom for £50.0 million leased to a new tenant, The Royal Marsden NHS Foundation Trust; |
|
|
• |
Financed three general acute care hospitals in Colombia for approximately $135 million operated by the new international joint venture; |
|
|
• |
Acquired two inpatient rehabilitation facilities, one in Texas and one in Indiana, for a total of approximately $58 million leased to Curahealth Hospitals, a new tenant to us; |
|
|
• |
Acquired an additional equity ownership in Infracore SA (“Infracore”) for CHF 206.5 million; and |
|
|
• |
Acquired an inpatient rehabilitation facility in South Carolina for $17.0 million leased to Ernest. |
Subsequent to December 31, 2020, we entered into definitive agreements to acquire 35 to 40 behavioral health facilities currently owned and operated by Priory for an aggregate purchase price of approximately £800 million along with a £250 million short-term acquisition loan. To help fund these investments subsequent to year-end, we completed an underwritten public offering of 36.8 million shares of our common stock, resulting in net proceeds of approximately $711.0 million, after deducting
41
underwriting discounts and commissions and offering expenses, along with utilizing approximately £500 million of a $900 million interim credit facility at terms similar to our Credit Facility.
2019 Highlights
In 2019, we invested in approximately $4.5 billion in healthcare real estate assets. These significant investments enhanced the size and scale of our healthcare portfolio, while expanding our geographic footprint in the U.S. and Europe, and entering into new territories such as Australia. To fund these new investments, we raised $2.5 billion in proceeds from equity sales during 2019, received proceeds of $837 million from an Australian term loan facility in June 2019, and completed $900 million and £1 billion senior unsecured notes offerings in July and December 2019, respectively.
A summary of our 2019 highlights was as follows:
|
|
• |
Acquired real estate assets or commenced development projects totaling more than $4.5 billion, as noted below: |
|
|
• |
Invested in three acute care hospitals and one IRF for an aggregate investment of approximately $135 million, leased to four separate operators; |
|
|
• |
Invested in a portfolio of 13 acute care campuses and two additional properties in Switzerland for a combined purchase price of approximately CHF 236.6 million, effected through our purchase of a minority interest in a Swiss healthcare real estate company, Infracore. These facilities are leased to Swiss Medical Network. Additionally, we purchased a 4.9% stake in Aevis Victoria SA, previous majority shareholder of Infracore, for CHF 47 million; |
|
|
• |
Acquired 11 hospitals in Australia for a purchase price of approximately A$1.2 billion plus stamp duties and registration fees of A$66.6 million. These facilities are leased to Healthscope Ltd. (“Healthscope”); |
|
|
• |
Acquired seven community hospitals in Kansas for approximately $145.4 million. These facilities are leased to Saint Luke’s Health System; |
|
|
• |
Acquired 14 acute care hospitals and two behavioral health facilities for a combined purchase price of approximately $1.55 billion. These facilities are leased to Prospect; |
|
|
• |
Acquired eight private hospitals located throughout England for an aggregate purchase price of £347 million. These facilities are leased to Ramsay Health Care; |
|
|
• |
Acquired 10 post-acute facilities in various states throughout the U.S. for approximately $268 million. These facilities are leased to Vibra Healthcare, LLC; |
|
|
• |
Commenced the development of a behavioral hospital in Houston, Texas for $27.5 million, which opened in the 2020 fourth quarter and leased to NeuroPsychiatric Hospitals; |
|
|
• |
Acquired an acute care hospital in Portugal for approximately €28.2 million. This facility is leased to José de Mello; |
|
|
• |
Acquired two acute care hospitals in Spain for €117.3 million, effected through our purchase of a 45% interest in a joint venture. These facilities are leased to HM Hospitales; and |
|
|
• |
Acquired 10 acute care hospitals in six U.S. states for approximately $700.0 million leased to LifePoint Health, Inc. (“LifePoint”). |
|
|
• |
To help fund the investments in 2019, we used cash on-hand and generated proceeds through equity offerings, utilization of our at-the-market equity program, through new issuances of unsecured notes, and from sales of real estate. Details of such activities are as follows: |
|
|
• |
Sold 36.1 million shares under our at-the-market equity program, generating proceeds of approximately $650 million; |
|
|
• |
Received proceeds from an Australian term facility of approximately $837 million in June 2019 and fixed the interest rate to approximately 2.45% in July 2019 using an interest rate swap; |
|
|
• |
Completed an underwritten public offering of 51.75 million shares of our common stock in July 2019, resulting in net proceeds of approximately $860 million, after deducting underwriting discounts and commissions and offering expenses; |
|
|
• |
Completed a $900 million senior unsecured notes offering in July 2019 with a rate of 4.625%; |
|
|
• |
Completed an underwritten public offering of 57.5 million shares of our common stock in November 2019, resulting in net proceeds of $1.026 billion, after deducting underwriting discounts and commissions and offering expenses; |
|
|
• |
Completed a £400 million and £600 million unsecured notes offering in December 2019 with a rate of 2.550% and 3.692%, respectively; and |
42
|
|
• |
Sold five properties in 2019 generating a gain of $41.6 million. |
2018 Highlights
In 2018, we demonstrated the value of our portfolio through strategic property sales that generated gains exceeding $700 million and cash proceeds of approximately $2 billion.
A summary of our 2018 highlights was as follows:
|
|
• |
Sold the real estate of 76 properties (71 of which were contributed to a joint venture arrangement) and sold our equity interest in Ernest (along with the repayment of all outstanding loans and accrued interest) for a net gain of approximately $720 million, as noted below: |
|
|
• |
Sold two acute care hospitals in Houston, Texas for a net gain of approximately $100 million; |
|
|
• |
Sold three long-term acute care hospitals located in California, Texas, and Oregon, for $53 million of cash and resulting in a net gain of $19.1 million; |
|
|
• |
Sold 71 properties located in Germany for a net gain of approximately €500 million by way of a joint venture arrangement, for which we own a 50% interest; and |
|
|
• |
Sold our investment in the operations of Ernest and were repaid outstanding loans and accrued interest generating over $176 million in cash. |
|
|
• |
Acquired the following real estate assets: |
|
|
• |
Acquired three inpatient rehabilitation hospitals in Germany for a combined purchase price of €17.3 million. These facilities are leased to MEDIAN; |
|
|
• |
Acquired five acute care hospitals from Steward in exchange for the reduction of $764 million in mortgage loans plus cash, which further increased the strength of our portfolio; and |
|
|
• |
Acquired an acute care hospital in Pasco, Washington for $17.5 million. This facility is leased to LifePoint. |
|
|
• |
After completing our strategic dispositions, we repaid over $800 million in outstanding revolver debt. |
|
|
• |
Sold 5.6 million shares under our at-the-market equity program, generating proceeds of approximately $95 million. |
Critical Accounting Policies
In order to prepare financial statements in conformity with generally accepted accounting principles (“GAAP”) in the U.S., we must make estimates about certain types of transactions and account balances. We believe that our estimates of the amount and timing of credit losses, fair value adjustments (either as part of a purchase price allocation or impairment analyses), and periodic depreciation of our real estate assets, along with our assessment as to whether investments we make in certain businesses/entities should be consolidated with our results, have significant effects on our financial statements. Each of these items involves estimates that require us to make subjective judgments. We rely on our experience, collect historical and current market data, and develop relevant assumptions to arrive at what we believe to be reasonable estimates. Under different conditions or assumptions, materially different amounts could be reported related to the critical accounting policies described below. In addition, application of these critical accounting policies involves the exercise of judgment on the use of assumptions as to future uncertainties (such as the ultimate impact from the COVID-19 pandemic) and, as a result, actual results could materially differ from these estimates. See Note 2 to Item 8 of this Annual Report on Form 10-K for more information regarding our accounting policies and recent accounting developments. Our accounting estimates include the following:
Credit Losses:
Losses from Rent Receivables: For all leases, we continuously monitor the performance of our existing tenants including, but not limited to: admission levels and surgery/procedure volumes by type; current operating margins; ratio of our tenants’ operating margins both to facility rent and to facility rent plus other fixed costs; trends in revenue, cash collections, patient mix; and the effect of evolving healthcare regulations, adverse economic and political conditions, and other events ongoing (such as the recent health crisis caused by the COVID-19 outbreak) on tenants’ profitability and liquidity.
Losses from Operating Lease Receivables: We utilize the information above along with the tenants’ payment and default history in evaluating (on a property-by-property basis) whether or not a provision for losses on outstanding billed rent and/or straight-line rent receivables is needed. A provision for losses on rent receivables (including straight-line rent receivables) is ultimately recorded when it becomes probable that the receivable will not be collected in full. The provision is an
43
amount which reduces the receivable to its estimated net realizable value based on a determination of the eventual amounts to be collected either from the debtor or from existing collateral, if any.
Losses on Financing Lease Receivables: Upon the adoption of Accounting Standards Update (“ASU”) No. 2016-13 “Measurement of Credit Losses on Financial Instruments" ("ASU 2016-13") on January 1, 2020, we began applying a new forward-looking “expected loss” model to all of our financing receivables, including financing leases and loans. With this change, we have grouped our financial instruments into two primary pools of similar credit risk: secured and unsecured. The secured instruments include our investments in financing receivables as all are secured by the underlying real estate among other collateral. Within the two primary pools, we further grouped our instruments into sub-pools based on several tenant/borrower characteristics, including years of experience in the healthcare industry and in a particular market or region and overall capitalization. We then determined a credit loss percentage per pool based on our history over a period of time that closely matches the remaining terms of the financial instruments being analyzed and adjusted as needed for current trends or unusual circumstances. We have applied these credit loss percentages to the book value of the related instruments to establish a credit loss reserve on our financing lease receivables and such credit loss reserve (including the underlying assumptions) is reviewed and adjusted quarterly. If a financing receivable is underperforming and is deemed uncollectible based on the lessee’s overall financial condition, we will adjust the credit loss reserve based on the fair value of the underlying collateral.
With the adoption of ASU 2016-13, we made the accounting policy election to exclude interest receivables from the credit loss reserve analysis. Such receivables are impaired and an allowance recorded when it is deemed probable that we will be unable to collect all amounts due. Like operating lease receivables, the need for an allowance is based upon our assessment of the lessee’s overall financial condition, economic resources and payment record, the prospects for support from any financially responsible guarantors, and, if appropriate, the realizable value of any collateral. Financing leases are placed on non-accrual status when we determine that the collectability of contractual amounts is not reasonably assured. If on non-accrual status, we generally account for the financing lease on a cash basis, in which income is recognized only upon receipt of cash.
Loans: Loans consist of mortgage loans, working capital loans, and other loans. Mortgage loans are collateralized by interests in real property. Working capital and other loans are generally collateralized by interests in receivables and corporate and individual guarantees. We record loans at cost. Like our financing lease receivables, we are using ASU 2016-13 to establish credit loss reserves on all outstanding loans based on historical credit losses on similar instruments. Such credit loss reserves, including the underlying assumptions, are reviewed and adjusted quarterly. If a loan’s performance worsens and foreclosure is deemed probable for our collateral-based loans (after considering the borrower’s overall financial condition as described above for leases), we will adjust the allowance for expected credit losses based on the current fair value of such collateral at the time the loan is deemed uncollectible. If the loan is not collateralized, the loan will be written-off once it is determined that such loan is no longer collectible. Interest receivables on loans are excluded from ASU 2016-13 and we assess their collectability similar to how we assess collectability for interest receivables on financing leases described above.
Investments in Real Estate: We maintain our investments in real estate at cost, and we capitalize improvements and replacements when they extend the useful life or improve the efficiency of the asset. While our tenants are generally responsible for all operating costs at a facility, to the extent that we incur costs of repairs and maintenance, we expense those costs as incurred. We compute depreciation using the straight-line method over the weighted-average useful life of approximately 39.0 years for buildings and improvements.
When circumstances indicate a possible impairment of the value of our real estate investments, we review the recoverability of the facility’s carrying value. The review of the recoverability is generally based on our estimate of the future undiscounted cash flows from the facility’s use and eventual disposition. Our forecast of these cash flows considers factors such as expected future operating income, market and other applicable trends, and residual value, as well as the effects of leasing demand, competition, and other factors. If impairment exists due to the inability to recover the carrying value of a facility on an undiscounted basis, an impairment loss is recorded to the extent that the carrying value exceeds the estimated fair value of the facility. In making estimates of fair value for purposes of impairment assessments, we will look to a number of sources including independent appraisals, available broker data, or our internal data from recent transactions involving similar properties in similar markets. We do not believe that the value of any of our facilities was impaired at December 31, 2020; however, given the highly specialized aspects of our properties no assurance can be given that future impairment charges will not be taken.
Acquired Real Estate Purchase Price Allocation: For properties acquired for operating leasing purpose, we currently account for such acquisition based on asset acquisition accounting rules. Under this accounting method, we allocate the purchase price of acquired properties to net tangible and identified intangible assets acquired based on their fair values. In making estimates of fair value for purposes of allocating purchase prices of acquired real estate, we may utilize a number of sources, including available real estate broker data, independent appraisals that may be obtained in connection with the acquisition or financing of the respective property, internal data from previous acquisitions or developments, and other market data. We also consider information obtained about each property as a result of our pre-acquisition due diligence, marketing, and leasing activities in estimating the fair value of the tangible and intangible assets acquired.
44
We record above-market and below-market in-place lease values, if any, for the facilities we own which are based on the present value of the difference between (i) the contractual amounts to be paid pursuant to the in-place leases and (ii) management’s estimate of fair market lease rates for the corresponding in-place leases, measured over a period equal to the remaining non-cancelable term of the lease. We amortize any resulting capitalized above-market lease values as a reduction of rental income over lease term. We amortize any resulting capitalized below-market lease values as an increase to rental income over the lease term. Because our strategy to a large degree involves the origination and acquisition of long-term lease arrangements at market rates with independent parties, we do not expect the above-market and below-market in-place lease values to be significant for many of our transactions.
We measure the aggregate value of other lease intangible assets to be acquired based on the difference between (i) the property valued with new or in-place leases adjusted to market rental rates and (ii) the property valued as if vacant when acquired. Management’s estimates of value are made using methods similar to those used by independent appraisers (e.g., discounted cash flow analysis). Factors considered by management in our analysis include an estimate of carrying costs during hypothetical expected lease-up periods, considering current market conditions, and costs to execute similar leases. We also consider information obtained about each targeted facility as a result of our pre-acquisition due diligence, marketing, and leasing activities in estimating the fair value of the intangible assets acquired. In estimating carrying costs, management includes real estate taxes, insurance, and other operating expenses, and estimates of lost rentals at market rates during the expected lease-up periods, which we expect to be about six months (based on experience) but can be longer depending on specific local market conditions. Management also estimates costs to execute similar leases including leasing commissions, legal costs, and other related expenses to the extent that such costs are not already incurred in connection with a new lease origination.
Other intangible assets acquired may include customer relationship intangible values, which are based on management’s evaluation of the specific characteristics of each prospective tenant’s lease and our overall relationship with that tenant. Characteristics to be considered by management in allocating these values include the nature and extent of our existing business relationships with the tenant, growth prospects for developing new business with the tenant, the tenant’s credit quality, and expectations of lease renewals, including those existing under the terms of the lease agreement, among other factors. At December 31, 2020, we have not assigned any value to customer relationship intangibles.
We amortize the value of lease intangibles to expense over the term of the respective leases, which have a weighted-average useful life of 26.1 years at December 31, 2020. If a lease is terminated early, the unamortized portion of the lease intangible is charged to expense.
Principles of Consolidation: Property holding entities and other subsidiaries of which we own 100% of the equity or have a controlling financial interest evidenced by ownership of a majority voting interest are consolidated. All inter-company balances and transactions are eliminated. For entities in which we own less than 100% of the equity interest, we consolidate the property if we have the direct or indirect ability to control the entities’ activities based upon the terms of the respective entities’ ownership agreements. For these entities, we record a non-controlling interest representing equity held by non-controlling interests.
We continually evaluate all of our transactions and investments to determine if they represent variable interests in a variable interest entity. If we determine that we have a variable interest in a variable interest entity, we then evaluate if we are the primary beneficiary of the variable interest entity. The evaluation is a qualitative assessment as to whether we have the ability to direct the activities of a variable interest entity that most significantly impact the entity’s economic performance. We consolidate each variable interest entity in which we, by virtue of or transactions with our investments in the entity, are considered to be the primary beneficiary. At December 31, 2020 and 2019, we determined that we were not the primary beneficiary of any variable interest entity in which we hold a variable interest because we do not control the activities (such as the day-to-day operations) that most significantly impact the economic performance of these entities.
Liquidity and Capital Resources
Our typical sources of cash include our monthly rent and interest receipts, distributions from our five real estate joint venture agreements, borrowings under our revolving credit facility, public issuances of debt and equity securities, and proceeds from bank debt, asset dispositions (either one-off or group asset sales through joint venture transactions), and principal payments on loans. Our primary uses of cash include dividend distributions, debt service (including principal and interest), new investments (including acquisitions, developments, or capital improvement projects), loan advances, property expenses, and general and administrative expenses.
Absent our requirements to make distributions to maintain our REIT qualification (as more fully described in Note 5 within Item 8 of this Annual Report on Form 10-K) and our current contractual commitments discussed later, we do not have any material off-balance sheet arrangements that we expect would materially affect our liquidity and capital resources.
See below for highlights of our sources and uses of cash for the past three years:
45
2020 Cash Flow Activity
We generated cash of $617.6 million from operating activities during 2020, primarily consisting of rent and interest from mortgage and other loans. We used these operating cash flows to fund our dividends of $568 million and certain investing activities.
In regards to other investing and financing activities in 2020, we did the following:
|
|
a) |
Invested $3.6 billion in real estate assets and other loans, net of $835 million in mortgage loan conversions, representing over 40 facilities across five countries, headlined by the £1.5 billion Circle acquisition of 30 properties in January 2020; |
|
|
b) |
Funded approximately $167.2 million of development, capital addition, and other projects; |
|
|
c) |
Issued 21.0 million shares of common stock under our at-the-market equity offering program, resulting in net proceeds of approximately $411 million; |
|
|
d) |
Closed on a £700 million British pound sterling term loan to help fund the Circle acquisition in January 2020; |
|
|
e) |
Received approximately $1.3 billion in loan principal repayments; |
|
|
f) |
Sold 15 facilities generating net proceeds of $94 million; and |
|
|
g) |
Completed a $1.3 billion, 3.5% senior unsecured notes offering on December 4, 2020, using proceeds to pay off $800 million of senior unsecured notes with a weighted-average interest rate of 6%. |
Subsequent to December 31, 2020, we invested another £1.1 billion as part of the Priory transaction funded using a combination of sources including a completed underwritten public offering of 36.8 million shares, resulting in net proceeds of approximately $711.0 million, after deducting underwriting discounts and commissions and offering expenses, and utilizing approximately £500 million of a $900 million interim credit facility.
2019 Cash Flow Activity
We generated cash of $494.1 million from operating activities during 2019, primarily consisting of rent and interest from mortgage and other loans. We used these operating cash flows along with cash on-hand to fund our dividends of $412 million and certain investing activities including the additional funding of our development activities.
In regards to other investing and financing activities in 2019, we did the following:
|
|
a) |
Purchased $4.5 billion in real estate assets representing over 80 facilities across seven countries; |
|
|
b) |
Funded approximately $377.0 million of development, capital addition, and other projects; |
|
|
c) |
In 2019, we sold 36.1 million shares of common stock under our at-the-market equity offering program, resulting in net proceeds of approximately $650 million; |
|
|
d) |
On June 3, 2019, we received proceeds from an Australian term loan facility of approximately $837 million to help fund the Healthscope acquisition; |
|
|
e) |
On July 18, 2019, we completed an underwritten public offering of 51.75 million shares, resulting in net proceeds of $858 million; |
|
|
f) |
On July 26, 2019, we completed a $900 million senior unsecured notes offering resulting in net proceeds of approximately $885 million; |
|
|
g) |
In 2019, we sold facilities generating net proceeds of $112 million; |
|
|
h) |
On November 8, 2019, we completed an underwritten public offering of 57.5 million shares of our common stock, resulting in net proceeds of $1.026 billion; |
|
|
i) |
On December 5, 2019, we completed a £400 million and £600 million unsecured notes offering resulting in net proceeds of approximately £993 million, of which £367 million was used to pay down our balance on the revolving credit facility; and |
|
|
j) |
On December 27, 2019, we established a new at-the-market equity program, giving us the ability to sell up to $1.0 billion of stock. |
2018 Cash Flow Activity
We generated cash of $449.1 million from operating activities during 2018, primarily consisting of rent and interest from mortgage and other loans. We used these operating cash flows along with cash on-hand to fund our dividends of $364 million and certain investing activities including the additional funding of our development activities.
46
In regards to other investing and financing activities in 2018, we did the following:
|
|
a) |
In 2018, we generated more than $2 billion of cash proceeds from the joint venture transaction with Primotop (which included the disposal of 71 inpatient rehabilitation hospitals in Germany and issuance of secured debt) and the sale of five other acute care and long-term acute care properties. Approximately $580 million was reinvested in the joint venture with Primotop in the form of an equity interest and shareholder loan; |
|
|
b) |
On August 31, 2018, we funded the acquisition of one property in Pasco, Washington for $17.5 million; |
|
|
c) |
On August 28, 2018, we funded the acquisition of three properties in Germany for €17.3 million; |
|
|
d) |
Originated $212 million in mortgage and other loans; |
|
|
e) |
Funded less than $200 million for development and capital improvement projects; |
|
|
f) |
Acquired five facilities operated by Steward by converting the $764.4 million in mortgage loans on the same properties plus cash consideration; |
|
|
g) |
We used the net cash received from property disposals to reduce our revolver by approximately $810 million; |
|
|
h) |
On October 4, 2018, we finalized our recapitalization agreement with Ernest generating $176.3 million (which included the sale of our equity investment in Ernest and repayment in full of non-mortgage loans outstanding plus accrued interest); and |
|
|
i) |
In the fourth quarter of 2018, we sold 5.6 million shares of common stock under our at-the-market equity program generating approximately $95 million. |
Debt Restrictions and REIT Requirements
Our debt facilities impose certain restrictions on us, including, but not limited to, restrictions on our ability to: incur debt; create or incur liens; provide guarantees in respect of obligations of any other entity; make redemptions and repurchases of our capital stock; prepay, redeem, or repurchase debt; engage in mergers or consolidations; enter into affiliated transactions; dispose of real estate or other assets; and change our business. In addition, the credit agreement governing our Credit Facility limits the amount of dividends we can pay to 95% of NAFFO, as defined in the agreements, on a rolling four quarter basis. The indentures governing our senior unsecured notes also limit the amount of dividends we can pay based on the sum of 95% of funds from operations, proceeds of equity issuances, and certain other net cash proceeds. Finally, our senior unsecured notes require us to maintain total unencumbered assets (as defined in the related indenture) of not less than 150% of our unsecured indebtedness.
In addition to these restrictions, the Credit Facility contains customary financial and operating covenants, including covenants relating to our total leverage ratio, fixed charge coverage ratio, secured leverage ratio, unsecured leverage ratio, consolidated adjusted net worth, and unsecured interest coverage ratio. This facility also contains customary events of default, including among others, nonpayment of principal or interest, material inaccuracy of representations, and failure to comply with our covenants. If an event of default occurs and is continuing under the facility, the entire outstanding balance may become immediately due and payable. At December 31, 2020, we were in compliance with all such financial and operating covenants.
In order for us to continue to qualify as a REIT we are required to distribute annual dividends equal to a minimum of 90% of our REIT taxable income, computed without regard to the dividends paid deduction and our net capital gains. See section titled “Distribution Policy” within this Item 7 of this Annual Report on Form 10-K for further information on our dividend policy along with the historical dividends paid on a per share basis.
Short-term Liquidity Requirements:
As of February 19, 2021, we have no debt principal payments due within the next twelve months. In January 2021, we amended our revolving credit facility to extend it until February 2024 and improve pricing. At February 19, 2021, and after our funding of the £1.1 billion Priory transaction using proceeds from the January 2020 equity offering that raised approximately $711 million and utilizing approximately £500 million of a $900 million interim loan facility, availability under our revolving credit facility plus cash on-hand approximated $1.3 billion. We believe this liquidity along with our current monthly cash receipts from rent and loan interest, regular distributions from our joint venture arrangements, approximately $584.3 million of availability under our at-the-market equity program, and approximately £250 million expected to be repaid by Waterland pursuant to the Priory short-term loan is sufficient to fund our operations, dividends in order to comply with REIT requirements, and our current firm commitments and debt service obligations as noted below for the next twelve months.
Long-term Liquidity Requirements:
As of February 19, 2021, our liquidity approximates $1.3 billion and we believe our liquidity, along with our current monthly cash receipts from rent and loan interest, regular distributions from our joint venture arrangements, and approximately $584.3 million
47
of availability under our at-the-market equity program, is sufficient to fund our operations, debt and interest obligations, our firm commitments, and dividends in order to comply with REIT requirements for the foreseeable future.
However, in order to fund additional investments, to fund debt maturities coming due starting in 2022 and beyond (as outlined below in our commitment schedule), or to strategically refinance any existing debt in order to reduce interest rates, we may need to access one or a combination of the following sources of capital:
|
|
• |
sale of equity securities; |
|
|
• |
issuance of new USD, EUR, or GBP denominated debt securities, including senior unsecured notes; |
|
|
• |
entering into new bank term loans; |
|
|
• |
placing new secured loans on real estate located outside the U.S.; and/or |
|
|
• |
proceeds from strategic property sales or joint ventures. |
However, there is no assurance that conditions will be favorable for such possible transactions (particularly in light of the ongoing COVID-19 pandemic) or that our plans will be successful.
Contractual Commitments
The following table summarizes known material contractual commitments including debt service commitments (principal and interest payments) as of February 19, 2021 (amounts in thousands):
|
|
|
2021 |
|
|
2022 |
|
|
2023 |
|
|
2024 |
|
|
2025 |
|
|
Thereafter |
|
|
Total |
|
|||||||
|
Senior unsecured notes(1) |
|
$ |
229,183 |
|
|
$ |
879,055 |
|
|
$ |
809,507 |
|
|
$ |
234,571 |
|
|
$ |
840,521 |
|
|
$ |
5,617,105 |
|
|
$ |
8,609,942 |
|
|
Revolving credit facility(1)(2) |
|
|
9,926 |
|
|
|
11,453 |
|
|
|
11,453 |
|
|
|
661,108 |
|
|
|
— |
|
|
|
— |
|
|
|
693,940 |
|
|
Term loan |
|
|
2,932 |
|
|
|
3,204 |
|
|
|
3,204 |
|
|
|
3,213 |
|
|
|
3,204 |
|
|
|
200,281 |
|
|
|
216,038 |
|
|
Australian term loan facility(1) |
|
|
23,135 |
|
|
|
23,135 |
|
|
|
23,135 |
|
|
|
953,407 |
|
|
|
— |
|
|
|
— |
|
|
|
1,022,812 |
|
|
British pound sterling term loan(1) |
|
|
19,385 |
|
|
|
19,385 |
|
|
|
19,385 |
|
|
|
19,438 |
|
|
|
981,917 |
|
|
|
— |
|
|
|
1,059,510 |
|
|
Interim credit facility to fund Priory transaction(1) |
|
|
6,758 |
|
|
|
701,144 |
|
|
|
— |
|
|
|
— |
|
|
|
— |
|
|
|
— |
|
|
|
707,902 |
|
|
Operating lease commitments(3) |
|
|
6,927 |
|
|
|
7,844 |
|
|
|
7,616 |
|
|
|
6,687 |
|
|
|
5,791 |
|
|
|
262,204 |
|
|
|
297,069 |
|
|
Purchase obligations(1)(4) |
|
|
188,576 |
|
|
|
86,514 |
|
|
|
60,793 |
|
|
|
39,870 |
|
|
|
39,204 |
|
|
|
193,288 |
|
|
|
608,245 |
|
|
Totals |
|
$ |
486,822 |
|
|
$ |
1,731,734 |
|
|
$ |
935,093 |
|
|
$ |
1,918,294 |
|
|
$ |
1,870,637 |
|
|
$ |
6,272,878 |
|
|
$ |
13,215,458 |
|
|
(1) |
We used the exchange rates at February 19, 2021 in preparing this table. |
|
(2) |
As of February 19, 2021, we have a $1.3 billion revolving credit facility. This table assumes the balance outstanding under the revolver (which was $660.2 million as of February 19, 2021) and interest rate in effect at February 19, 2021 remain in effect through maturity. |
|
(3) |
Much of our contractual obligations to make operating lease payments are related to ground leases for which we are reimbursed by our tenants along with corporate office and equipment leases. |
|
(4) |
Includes approximately $61.1 million of future expenditures related to development projects and $547.1 million of future expenditures on committed capital improvement projects. |
Results of Operations
Our operating results may vary significantly from year-to-year due to a variety of reasons including acquisitions made during the year, incremental revenues and expenses from acquisitions made in the prior year, revenues and expenses from completed development properties, property disposals, annual escalation provisions, foreign currency exchange rate changes, new or amended debt agreements, issuances of shares through an equity offering, impact from accounting changes, etc. Thus, our operating results for the current year are not necessarily indicative of the results that may be expected in future years.
Year Ended December 31, 2020 Compared to the Year Ended December 31, 2019
Net income for the year ended December 31, 2020, was $431.5 million compared to net income of $374.7 million for the year ended December 31, 2019. This 15% increase in net income is primarily due to incremental revenue from new investments made in 2019 and 2020, including revenue from the Circle transaction in January 2020. Such increase in revenue was partially offset by higher interest expense (from additional debt to partially finance these new investments) and depreciation expense. In addition, we incurred higher general and administrative costs and income tax expense due to the growth of the company internationally, including $9 million of higher income tax expense related to the increase in corporate tax rates in the United Kingdom. Finally, we had $42 million of gains on property disposals in 2019 versus a small loss in 2020. Normalized FFO, after adjusting for certain items (as more fully described in the section titled “Non-GAAP Financial Measures” in this Item 7 of this Annual Report on Form 10-K), was $831.2 million, or $1.57 per diluted share for 2020, as compared to $557.4 million, or $1.30 per diluted share, for 2019. This 21% increase in Normalized FFO per share is primarily due to incremental revenue from new investments in 2019 and 2020.
48
A comparison of revenues for the years ended December 31, 2020 and 2019 is as follows (dollar amounts in thousands):
|
|
|
2020 |
|
|
|
|
|
|
2019 |
|
|
|
|
|
|
Change |
|
|||
|
Rent billed |
|
$ |
741,311 |
|
|
|
59.4 |
% |
|
$ |
474,151 |
|
|
|
55.6 |
% |
|
$ |
267,160 |
|
|
Straight-line rent |
|
|
158,881 |
|
|
|
12.7 |
% |
|
|
110,456 |
|
|
|
12.9 |
% |
|
|
48,425 |
|
|
Income from financing leases |
|
|
206,550 |
|
|
|
16.5 |
% |
|
|
119,617 |
|
|
|
14.0 |
% |
|
|
86,933 |
|
|
Interest and other income |
|
|
142,496 |
|
|
|
11.4 |
% |
|
|
149,973 |
|
|
|
17.5 |
% |
|
|
(7,477 |
) |
|
Total revenues |
|
$ |
1,249,238 |
|
|
|
100.0 |
% |
|
$ |
854,197 |
|
|
|
100.0 |
% |
|
$ |
395,041 |
|
Our total revenues for 2020 are up $395.0 million or 46% over the prior year. This increase is made up of the following:
|
|
• |
Operating lease revenue (including rent billed and straight-line rent) — up $315.6 million over the prior year of which approximately $209.3 million is revenue from acquisitions made in 2020 (including $151.6 million of which relates to the Circle acquisition in the first quarter of 2020 and $47.8 million that relates to the two Utah properties acquired from proceeds of the mortgage loan conversions) and $127.3 million of incremental revenue from 2019 acquisitions, $14.0 million is from the commencement of rent on three development properties, $8.1 million is from capital additions in 2020, and approximately $0.4 million is from favorable foreign currency fluctuations. This increase is partially offset by $43.5 million of lower revenue from disposals (in 2019 and 2020) and properties vacated in 2020, as well as more straight-line rent write-offs than in 2019 from the property disposals, re-leasing activities, and other lease modifications as described in Note 3 to Item 8 of this Annual Report on Form 10-K. |
|
|
• |
Income from financing leases — up $86.9 million compared to 2019 due to $89.3 million of revenue from the Prospect acquisition in the 2019 third quarter, partially offset by the impact from the reclassification of six properties from deferred financing leases to operating leases due to certain lease modifications in the fourth quarter of 2020. |
|
|
• |
Interest and other income — down $7.5 million from the prior year due to the following: |
|
|
• |
Interest from loans — down $7.7 million over the prior year of which $25.9 million is the result of lower interest revenue related to Steward mortgage loans converted to fee simple assets in the third quarter of 2020 (as more fully described in Note 3 to Item 8 of this Annual Report on Form 10-K) and $5.7 million is from the repayment of Prime loans in the fourth quarter of 2020. This decrease is partially offset by $24.0 million of incremental revenue earned on new loan investments, including $10.2 million earned on the loan made to the new international joint venture in May 2020 (see Note 3 to Item 8 of this Annual Report on Form 10-K for additional details) and $7.9 million of incremental interest revenue from the Prospect loans made in August 2019, along with $0.4 million from favorable foreign currency fluctuations. |
|
|
• |
Other income — up $0.2 million from the prior year due to additional properties acquired in 2019 and 2020, whereby we received more direct reimbursements from our tenants for ground lease, property taxes, and insurance. |
Interest expense for 2020 and 2019 totaled $328.7 million and $237.8 million, respectively. This increase is primarily related to new debt issuances in 2020 and 2019 as our weighted-average interest rate year-over-year decreased from 4.45% in 2019 to 3.88% in 2020.
Real estate depreciation and amortization during 2020 increased to $264.2 million from $152.3 million in 2019 due to new investments made in 2019 and 2020.
Property-related expenses for 2020 increased slightly compared to 2019. This increase is primarily due to property taxes and other expenses incurred on vacant properties. Of the $24.9 million of property expenses in 2020, approximately $14 million represents costs that were reimbursed by our tenants and included in “Interest and other income” line on our consolidated statements of net income.
As a percentage of revenue, general and administrative expenses represent 10.5% for 2020, a decline from the 11.3% in the prior year. On a dollar basis, general and administrative expenses totaled $131.7 million for 2020, which is a $35.3 million increase from 2019. Of this increase, $21.7 million relates to compensation primarily related to higher stock compensation expense from our performance-based awards. The balance of the increase is primarily related to other corporate expenses, which are higher due to the growth of the company, in particular our international expansion.
During the year ended December 31, 2020, we disposed of nine properties and six ancillary properties resulting in a net loss of $2.8 million. In addition, we made a $19.0 million adjustment to lower the carrying value of the real estate on certain Adeptus Health,
49
Inc. (“Adeptus”) properties and one Alecto Healthcare Services LLC (“Alecto”) facility in the first quarter of 2020 (see Note 3 to Item 8 of this Annual Report on Form 10-K for further details). In comparison, we sold five properties in 2019 for a gain of $41.6 million and incurred $21.0 million of real estate impairment charges on certain vacant properties.
Earnings from equity interests was $20.4 million for 2020, up $4.4 million from 2019 primarily due to incremental income generated on our investments in Infracore and HM Hospitales made in the second and fourth quarters of 2019, respectively.
Debt refinancing and unutilized financing costs were $28.2 million in 2020 due to the redemption premiums and accelerated amortization of deferred debt issuance cost incurred as a result of the prepayment of our $800 million senior unsecured notes in the fourth quarter of 2020. The redeemed unsecured notes had a weighted-average interest rate of 6%, which we refinanced at 3.5%. In 2019, we incurred $6.1 million of bridge loan fees and accelerated commitment fee amortization expense associated with our Australian and GBP term loan facilities.
Other expense of $6.8 million for 2020 is primarily related to non-cash fair value adjustments to mark our investment in Aevis Victoria SA stock to market. This stock declined during 2020 due to the COVID-19 pandemic. We acquired this stock as part of our overall Switzerland investment in May 2019.
Income tax expense includes U.S. federal and state income taxes on our domestic TRS entities, as well as non-U.S. income based or withholding taxes on certain investments located in jurisdictions outside the U.S. The $31.1 million income tax expense for 2020 is primarily from the income generated by our investments in the United Kingdom, including a one-time adjustment of approximately $9 million to reflect the revaluation of our deferred tax liabilities due to an increase in the United Kingdom corporate tax rate from 17% to 19% in the third quarter of 2020. In comparison, we incurred a $2.6 million income tax benefit in 2019 from the benefit on losses incurred by our TRS during 2019. The 2019 tax benefit was partially offset by tax expense on income generated by our international investments.
We utilize the asset and liability method of accounting for income taxes. Deferred tax assets are recorded to the extent we believe these assets will more likely than not be realized. In making such determination, all available positive and negative evidence is considered, including scheduled reversals of deferred tax liabilities, projected future taxable income, tax planning strategies, and recent financial performance. Based upon our review of all positive and negative evidence, including our three-year cumulative pre-tax book loss position in certain entities, we concluded that a valuation allowance of approximately $37 million should be reflected against certain of our international and domestic net deferred tax assets at December 31, 2020. In the future, if we determine that it is more likely than not that we will realize our net deferred tax assets, we will reverse the applicable portion of the valuation allowance, recognize an income tax benefit in the period in which such determination is made, and incur higher income taxes in future periods as income is earned. For more detailed information, see Note 5 to Item 8 of this Annual Report on Form 10-K.
Year Ended December 31, 2019 Compared to the Year Ended December 31, 2018
Net income for the year ended December 31, 2019, was $374.7 million compared to net income of $1.02 billion for the year ended December 31, 2018. This decrease is primarily due to the approximate $720 million of gains on the sales of real estate recognized in 2018 from the disposal of five properties in the U.S. and the joint venture transaction with Primotop described in Note 3 to Item 8 of this Annual Report on Form 10-K. This decrease is partially offset by approximately $70 million more in revenues from new investments in 2019. Normalized FFO, after adjusting for certain items (as more fully described in the section titled “Non-GAAP Financial Measures” in this Item 7 of this Annual Report on Form 10-K), was $557.4 million, or $1.30 per diluted share for 2019, as compared to $501.0 million, or $1.37 per diluted share, for 2018. This increase in Normalized FFO dollars is primarily due to incremental revenue from new investments in 2019, while Normalized FFO per share is lower due to approximately 145 million of new shares issued to fund new investments in 2019.
A comparison of revenues for the years ended December 31, 2019 and 2018 is as follows (dollar amounts in thousands):
|
|
|
2019 |
|
|
|
|
|
|
2018 |
|
|
|
|
|
|
Change |
|
|||
|
Rent billed |
|
$ |
474,151 |
|
|
|
55.6 |
% |
|
$ |
473,343 |
|
|
|
60.3 |
% |
|
$ |
808 |
|
|
Straight-line rent |
|
|
110,456 |
|
|
|
12.9 |
% |
|
|
74,741 |
|
|
|
9.5 |
% |
|
|
35,715 |
|
|
Income from financing leases |
|
|
119,617 |
|
|
|
14.0 |
% |
|
|
73,983 |
|
|
|
9.5 |
% |
|
|
45,634 |
|
|
Interest and other income |
|
|
149,973 |
|
|
|
17.5 |
% |
|
|
162,455 |
|
|
|
20.7 |
% |
|
|
(12,482 |
) |
|
Total revenues |
|
$ |
854,197 |
|
|
|
100.0 |
% |
|
$ |
784,522 |
|
|
|
100.0 |
% |
|
$ |
69,675 |
|
Our total revenues for 2019 were up $69.7 million or 9% over the prior year. This increase is made up of the following:
|
|
• |
Operating lease revenue (including rent billed and straight-line rent) — up $36.5 million over the prior year of which $54.8 million of additional lease revenue is related to the conversion of five Steward mortgage loans to fee simple assets |
50
|
|
in 2018, and approximately $68.7 million of incremental revenue from acquisitions ($30.0 million of which relates to Healthscope). This increase is partially offset by a net $82.8 million of lower revenues due to property dispositions in 2018 (majority of which relates to the formation of the Primotop joint venture in the 2018 third quarter) and approximately $5.7 million from unfavorable foreign currency fluctuations. |
|
|
• |
Income from financing leases — up $45.6 million over the prior year due to $50 million of revenue from the Prospect acquisition in the 2019 third quarter, partially offset by approximately $5 million of lower revenue on two Alecto properties that closed during 2019. See Note 3 to Item 8 of this Annual Report on Form 10-K for more details. |
|
|
• |
Interest and other income — down $12.5 million from the prior year due to the following: |
|
|
• |
Interest from loans — down $26.2 million over the prior year of which $35.6 million is the result of lower interest revenue related to Steward mortgage loans converted to fee simple assets in 2018 and $13.3 million is from the payoff of our Ernest acquisition and other loans in the fourth quarter of 2018. This decrease is partially offset by $18.6 million of incremental interest revenue earned on loan investments, including $10.9 million from the Primotop joint venture shareholder loan made in August 2018 and $4.4 million related to Prospect loans made in 2019. |
|
|
• |
Other income — up $13.7 million due to the implementation of the lease accounting standard on January 1, 2019, whereby we are now reflecting certain payments made by our tenants, including ground lease payments and reimbursements of property taxes and insurance, as revenue. This revenue is offset by a corresponding expense in the “Property-related” line on the consolidated statements of net income. |
Interest expense for 2019 and 2018 totaled $237.8 million and $223.3 million, respectively. This increase is primarily related to new debt issuances in 2019 including the £1 billion senior unsecured notes issued in December 2019, the $900 million of senior unsecured notes issued in July 2019, and the A$1.2 billion term loan funded in June 2019. In addition, we incurred $6.1 million of bridge loan fees and accelerated commitment fee amortization expense associated with our Australian and GBP term loan facilities in 2019. These increases were partially offset by lower interest in 2019 from the paydown of our revolver, in addition to a reduction in our weighted-average interest rate year-over-year from 4.55% in 2018 to 4.45% in 2019.
Real estate depreciation and amortization during 2019 increased to $152.3 million from $133.1 million in 2018 due to new investments made in 2018 and 2019 and the conversion of the five Steward mortgage loans to fee simple assets, partially offset by property sales in 2018.
Property-related expenses for 2019 increased $14.8 million compared to 2018. As noted above under the caption “Other income”, this increase was primarily due to the grossing up of certain expenses (such as ground lease, property taxes, and insurance) as part of our implementation of the lease accounting standard on January 1, 2019.
General and administrative expenses in 2019 totaled $96.4 million, which is a $16.3 million increase from 2018. The majority of the increase relates to stock compensation expense from our performance-based awards. Given our strong performance in 2019 including a 39% total shareholder return and significant growth from $4.5 billion of new investments, certain performance awards were earned at maximum level, resulting in higher stock compensation expense in 2019.
During the year ended December 31, 2019, we sold five properties resulting in a total gain of $41.6 million. In addition, we made a $21 million adjustment to lower the carrying value of the real estate on certain vacant facilities in 2019– see Note 3 to Item 8 of this Annual Report on Form 10-K for further details. In 2018, we sold five properties in the U.S. and 71 properties as part of the joint venture transaction with Primotop resulting in a gain of $719.4 million. In addition, we made a $48 million adjustment to lower the carrying value of the real estate to fair value on seven of our transitioning Adeptus facilities and four of our Alecto facilities in 2018.
Earnings from equity interests was $16.1 million for 2019, up $1.9 million from 2018 due to our investment in the Primotop joint venture in the third quarter of 2018 and our investment in Infracore made at the end of the second quarter of 2019, partially offset by a lower return year-over-year in our Hoboken investment.
Income tax expense typically includes U.S. federal and state income taxes on our TRS entities, as well as non-U.S. income based or withholding taxes on certain investments located in jurisdictions outside the U.S. The $2.6 million income tax benefit for 2019 is primarily related to the benefit on losses incurred by our TRS during the year. The benefit is partially offset by tax expense on income generated by our international investments. In comparison, we incurred $0.9 million of income tax expense in 2018 primarily from income generated by our international investments that was partially offset by $4.4 million of valuation allowances released related to U.S. federal and state deferred tax assets of our TRS.
51
We utilize the asset and liability method of accounting for income taxes. Deferred tax assets are recorded to the extent we believe these assets will more likely than not be realized. In making such determination, all available positive and negative evidence is considered, including scheduled reversals of deferred tax liabilities, projected future taxable income, tax planning strategies, and recent financial performance. Based upon our review of all positive and negative evidence, including our three-year cumulative pre-tax book loss position in certain entities, we concluded that a full valuation allowance of $11.4 million should continue to be recorded against certain of our international and domestic net deferred tax assets at December 31, 2019. In the future, if we determine that it is more likely than not that we will realize our net deferred tax assets, we will reverse the applicable portion of the valuation allowance, recognize an income tax benefit in the period in which such determination is made, and incur higher income taxes in future periods as income is earned. For more detailed information, see Note 5 to Item 8 of this Annual Report on Form 10-K.
Non-GAAP Financial Measures
We consider non-GAAP financial measures to be useful supplemental measures of our operating performance. A non-GAAP financial measure is a measure of financial performance, financial position, or cash flows that excludes or includes amounts that are not so excluded from or included in the most directly comparable measure calculated and presented in accordance with GAAP. Described below are the non-GAAP financial measures used by management to evaluate our operating performance and that we consider most useful to investors, together with reconciliations of these measures to the most directly comparable GAAP measures.
Funds From Operations and Normalized Funds From Operations
Investors and analysts following the real estate industry utilize funds from operations, or FFO, as a supplemental performance measure. FFO, reflecting the assumption that real estate asset values rise or fall with market conditions, principally adjusts for the effects of GAAP depreciation and amortization of real estate assets, which assumes that the value of real estate diminishes predictably over time. We compute FFO in accordance with the definition provided by the National Association of Real Estate Investment Trusts, or Nareit, which represents net income (loss) (computed in accordance with GAAP), excluding gains (losses) on sales of real estate and impairment charges on real estate assets, plus real estate depreciation and amortization and after adjustments for unconsolidated partnerships and joint ventures.
In addition to presenting FFO in accordance with the Nareit definition, we also disclose normalized FFO, which adjusts FFO for items that relate to unanticipated or non-core events or activities or accounting changes that, if not noted, would make comparison to prior period results and market expectations less meaningful to investors and analysts.
We believe that the use of FFO, combined with the required GAAP presentations, improves the understanding of our operating results among investors and the use of normalized FFO makes comparisons of our operating results with prior periods and other companies more meaningful. While FFO and normalized FFO are relevant and widely used supplemental measures of operating and financial performance of REITs, they should not be viewed as a substitute measure of our operating performance since the measures do not reflect either depreciation and amortization costs or the level of capital expenditures and leasing costs necessary to maintain the operating performance of our properties, which can be significant economic costs that could materially impact our results of operations. FFO and normalized FFO should not be considered an alternative to net income (loss) (computed in accordance with GAAP) as indicators of our financial performance or to cash flow from operating activities (computed in accordance with GAAP) as an indicator of our liquidity.
52
The following table presents a reconciliation of net income attributable to MPT common stockholders to FFO and Normalized FFO for the years ended December 31, 2020, 2019, and 2018, (amounts in thousands except per share data):
|
|
|
For the Years Ended December 31, |
|
|||||||||
|
|
|
2020 |
|
|
2019 |
|
|
2018 |
|
|||
|
FFO Information |
|
|
|
|
|
|
|
|
|
|
|
|
|
Net income attributable to MPT common stockholders |
|
$ |
431,450 |
|
|
$ |
374,684 |
|
|
$ |
1,016,685 |
|
|
Participating securities’ share in earnings |
|
|
(2,105 |
) |
|
|
(2,308 |
) |
|
|
(3,685 |
) |
|
Net income, less participating securities’ share in earnings |
|
$ |
429,345 |
|
|
$ |
372,376 |
|
|
$ |
1,013,000 |
|
|
Depreciation and amortization |
|
|
306,493 |
|
|
|
183,921 |
|
|
|
143,720 |
|
|
Loss (gain) on sale of real estate |
|
|
2,833 |
|
|
|
(41,560 |
) |
|
|
(719,392 |
) |
|
Real estate impairment charges |
|
|
19,006 |
|
|
|
21,031 |
|
|
|
48,007 |
|
|
Funds from operations |
|
$ |
757,677 |
|
|
$ |
535,768 |
|
|
$ |
485,335 |
|
|
Write-off of straight-line rent and other |
|
|
26,415 |
|
|
|
22,447 |
|
|
|
20,074 |
|
|
Non-cash fair value adjustments |
|
|
9,642 |
|
|
|
(6,908 |
) |
|
|
— |
|
|
Income taxes - rate change/release of valuation allowance |
|
|
9,295 |
|
|
|
— |
|
|
|
(4,405 |
) |
|
Debt refinancing and unutilized financing costs |
|
|
28,180 |
|
|
|
6,106 |
|
|
|
— |
|
|
Normalized funds from operations |
|
$ |
831,209 |
|
|
$ |
557,413 |
|
|
$ |
501,004 |
|
|
Per diluted share data |
|
|
|
|
|
|
|
|
|
|
|
|
|
Net income, less participating securities’ share in earnings |
|
$ |
0.81 |
|
|
$ |
0.87 |
|
|
$ |
2.76 |
|
|
Depreciation and amortization |
|
|
0.57 |
|
|
|
0.43 |
|
|
|
0.39 |
|
|
Loss (gain) on sale of real estate |
|
|
0.01 |
|
|
|
(0.10 |
) |
|
|
(1.96 |
) |
|
Real estate impairment charges |
|
|
0.04 |
|
|
|
0.05 |
|
|
|
0.13 |
|
|
Funds from operations |
|
$ |
1.43 |
|
|
$ |
1.25 |
|
|
$ |
1.32 |
|
|
Write-off of straight-line rent and other |
|
|
0.05 |
|
|
|
0.05 |
|
|
|
0.06 |
|
|
Non-cash fair value adjustments |
|
|
0.02 |
|
|
|
(0.01 |
) |
|
|
— |
|
|
Income taxes - rate change/release of valuation allowance |
|
|
0.02 |
|
|
|
— |
|
|
|
(0.01 |
) |
|
Debt refinancing and unutilized financing costs |
|
|
0.05 |
|
|
|
0.01 |
|
|
|
— |
|
|
Normalized funds from operations |
|
$ |
1.57 |
|
|
$ |
1.30 |
|
|
$ |
1.37 |
|
Total Pro Forma Gross Assets
Pro forma gross assets is total assets before accumulated depreciation/amortization (adjusted for our unconsolidated joint ventures) and assumes all real estate commitments on new investments and unfunded amounts on development deals and commenced capital improvement projects as of the applicable reporting periods are fully funded, and assumes cash on hand is used in these transactions. We believe total pro forma gross assets is useful to investors as it provides a more current view of our portfolio and allows for a better understanding of our concentration levels as our commitments close and our other commitments are fully funded. The following table presents a reconciliation of total assets to total pro forma gross assets (in thousands):
|
|
|
As of December 31, 2020 |
|
|
As of December 31, 2019 |
|
||
|
Total assets |
|
$ |
16,829,014 |
|
|
$ |
14,467,331 |
|
|
Add: |
|
|
|
|
|
|
|
|
|
Real estate commitments on new investments(1) |
|
|
1,901,087 |
|
|
|
1,988,550 |
|
|
Unfunded amounts on development deals and commenced capital improvement projects(2) |
|
|
166,258 |
|
|
|
163,370 |
|
|
Accumulated depreciation and amortization |
|
|
833,529 |
|
|
|
570,042 |
|
|
Incremental gross assets of our joint ventures(3) |
|
|
1,287,077 |
|
|
|
563,911 |
|
|
Proceeds from new debt and equity subsequent to period-end |
|
|
1,479,961 |
|
|
|
927,990 |
|
|
Less: |
|
|
|
|
|
|
|
|
|
Cash used for funding the transactions above(4) |
|
|
(2,067,345 |
) |
|
|
(2,151,920 |
) |
|
Total pro forma gross assets |
|
$ |
20,429,581 |
|
|
$ |
16,529,274 |
|
|
(1) |
The 2020 column reflects investments made in 2021 including the Priory transaction that was funded on January 19, 2021. The 2019 column reflects the acquisition of 30 facilities in the United Kingdom on January 8, 2020. |
|
(2) |
Includes $65.5 million and $41.7 million of unfunded amounts on ongoing development projects and $100.8 million and $121.7 million of unfunded amounts on capital improvement projects and development projects that have commenced rent, as of December 31, 2020 and 2019, respectively. |
|
(3) |
Adjustment to reflect our share of our joint ventures’ gross assets. |
53
|
(4) |
Includes cash available on-hand plus cash generated from activities subsequent to period-end including proceeds from new debt, equity, and loan repayments. |
Adjusted Revenues
Adjusted revenues are total revenues adjusted for our pro rata portion of similar revenues in our real estate joint venture arrangements. We believe adjusted revenue is useful to investors as it provides a more complete view of revenue across all of our investments and allows for better understanding of our revenue concentration. The following table presents a reconciliation of total revenues to total adjusted revenues (in thousands):
|
|
|
For the Years Ended December 31, |
|
|||||||||
|
|
|
2020 |
|
|
2019 |
|
|
2018 |
|
|||
|
Total revenues |
|
$ |
1,249,238 |
|
|
$ |
854,197 |
|
|
$ |
784,522 |
|
|
Revenue from real estate properties owned through joint venture arrangements |
|
|
105,758 |
|
|
|
83,962 |
|
|
|
32,343 |
|
|
Total adjusted revenues |
|
$ |
1,354,996 |
|
|
$ |
938,159 |
|
|
$ |
816,865 |
|
Distribution Policy
We have elected to be taxed as a REIT commencing with our taxable year that began on April 6, 2004 and ended on December 31, 2004. To qualify as a REIT, we must meet a number of organizational and operational requirements, including a requirement that we distribute at least 90% of our REIT taxable income, excluding net capital gain, to our stockholders. It is our current intention to comply with these requirements and maintain such status going forward.
The table below is a summary of our distributions declared for the three year period ended December 31, 2020:
|
Declaration Date |
|
Record Date |
|
Date of Distribution |
|
Distribution per Share |
|
|
|
November 12, 2020 |
|
December 10, 2020 |
|
January 7, 2021 |
|
$ |
0.27 |
|
|
August 13, 2020 |
|
September 10, 2020 |
|
October 8, 2020 |
|
$ |
0.27 |
|
|
May 21, 2020 |
|
June 18, 2020 |
|
July 16, 2020 |
|
$ |
0.27 |
|
|
February 14, 2020 |
|
March 12, 2020 |
|
April 9, 2020 |
|
$ |
0.27 |
|
|
November 21, 2019 |
|
December 12, 2019 |
|
January 9, 2020 |
|
$ |
0.26 |
|
|
August 15, 2019 |
|
September 12, 2019 |
|
October 10, 2019 |
|
$ |
0.26 |
|
|
May 23, 2019 |
|
June 13, 2019 |
|
July 11, 2019 |
|
$ |
0.25 |
|
|
February 14, 2019 |
|
March 14, 2019 |
|
April 11, 2019 |
|
$ |
0.25 |
|
|
November 15, 2018 |
|
December 13, 2018 |
|
January 10, 2019 |
|
$ |
0.25 |
|
|
August 16, 2018 |
|
September 13, 2018 |
|
October 11, 2018 |
|
$ |
0.25 |
|
|
May 24, 2018 |
|
June 14, 2018 |
|
July 12, 2018 |
|
$ |
0.25 |
|
|
February 15, 2018 |
|
March 15, 2018 |
|
April 12, 2018 |
|
$ |
0.25 |
|
On February 18, 2021, we announced that our Board of Directors declared a regular quarterly cash dividend of $0.28 per share of common stock to be paid on April 8, 2021, to stockholders of record on March 18, 2021.
We intend to pay to our stockholders, within the time periods prescribed by the Internal Revenue Code of 1986, as amended (“Code”), all or substantially all of our annual taxable income, including taxable gains from the sale of real estate and recognized gains on the sale of securities. It is our policy to make sufficient cash distributions to stockholders in order for us to maintain our status as a REIT under the Code and to avoid corporate income and excise taxes on undistributed income. However, our Credit Facility limits the amounts of dividends we can pay — see Note 4 to our consolidated financial statements in Item 8 to this Annual Report on Form 10-K for further information.
|
ITEM 7A. |
Quantitative and Qualitative Disclosures about Market Risk |
Market risk includes risks that arise from changes in interest rates, foreign currency exchange rates, commodity prices, equity prices, and other market changes that affect market sensitive instruments. We seek to mitigate the effects of fluctuations in interest rates by matching the terms of new investments with new long-term fixed rate borrowings to the extent possible. We may or may not elect to use financial derivative instruments to hedge interest rate or foreign currency exposure. For interest rate hedging, these decisions are principally based on our policy to match investments with comparable borrowings, but are also based on the general trend in interest rates at the applicable dates and our perception of the future volatility of interest rates. For foreign currency hedging,
54
these decisions are principally based on how our investments are financed, the long-term nature of our investments, the need to repatriate earnings back to the U.S., and the general trend in foreign currency exchange rates.
In addition, the value of our facilities will be subject to fluctuations based on changes in local and regional economic conditions and changes in the ability of our tenants to generate profits. The changes in the value of our facilities would be impacted also by changes in “cap” rates, which is measured by the current base rent divided by the current market value of a facility.
Our primary exposure to market risks relates to fluctuations in interest rates and foreign currency. The following analyses present the sensitivity of the market value, earnings, and cash flows of our significant financial instruments to hypothetical changes in interest rates and exchange rates as if these changes had occurred. The hypothetical changes chosen for these analyses reflect our view of changes that are reasonably possible over a one-year period. These forward looking disclosures are selective in nature and only address the potential impact from these hypothetical changes. They do not include other potential effects which could impact our business as a result of changes in market conditions (such as the impact caused by COVID-19). In addition, they do not include measures we may take to minimize our exposure such as entering into future interest rate swaps to hedge against interest rate increases on our variable rate debt.
Interest Rate Sensitivity
For fixed rate debt, interest rate changes affect the fair market value but do not impact net income to common stockholders or cash flows. Conversely, for floating rate debt, interest rate changes generally do not affect the fair market value but do impact net income to common stockholders and cash flows, assuming other factors are held constant. At December 31, 2020, our outstanding debt totaled $8.9 billion, which consisted of fixed-rate debt of approximately $8.5 billion (after considering interest rate swaps in-place) and variable rate debt of $0.4 billion. If market interest rates increase by 1%, the fair value of our debt at December 31, 2020 would decrease by approximately $7.3 million. Changes in the fair value of our fixed rate debt will not have any impact on us unless we decided to repurchase the debt in the open market.
If market rates of interest on our variable rate debt increase by 1%, the increase in annual interest expense on our variable rate debt would decrease future earnings and cash flows by $0.1 million per year. If market rates of interest on our variable rate debt decrease by 1%, the decrease in interest expense on our variable rate debt would increase future earnings and cash flows by $0.1 million per year. This assumes that the average amount outstanding under our variable rate debt for a year is $0.4 billion, the balance of such variable rate debt at December 31, 2020.
Foreign Currency Sensitivity
With our investments in the United Kingdom, Germany, Spain, Italy, Portugal, Switzerland, Australia, and Colombia, we are subject to fluctuations in the euro, British pound, Swiss franc, Australian dollar, and Colombian peso to U.S. dollar currency exchange rates. Although we generally deem investments in these countries to be of a long-term nature, are able to match any non-U.S. dollar borrowings with investments in such currencies, and historically have not needed to repatriate a material amount of earnings back to the U.S., increases or decreases in the value of the respective non-U.S. dollar currencies to U.S. dollar exchange rates may impact our financial condition and/or our results of operations. Based solely on our 2020 operating results, a 5% change to the following exchange rates would have impacted our net income and FFO by the amounts below (in thousands):
|
|
|
Net Income Impact |
|
|
FFO Impact |
|
||
|
British pound (£) |
|
$ |
1,515 |
|
|
$ |
4,546 |
|
|
Euro (€) |
|
|
101 |
|
|
|
1,881 |
|
|
Swiss franc (CHF) |
|
|
273 |
|
|
|
891 |
|
|
Australian dollar (A$) |
|
|
587 |
|
|
|
1,562 |
|
|
Colombian peso (COP) |
|
|
573 |
|
|
|
573 |
|
55
|
ITEM 8. |
Financial Statements and Supplementary Data |
Report of Independent Registered Public Accounting Firm
To the Board of Directors and Stockholders of Medical Properties Trust, Inc.
Opinions on the Financial Statements and Internal Control over Financial Reporting
We have audited the accompanying consolidated balance sheets of Medical Properties Trust, Inc. and its subsidiaries (the “Company”) as of December 31, 2020 and 2019, and the related consolidated statements of net income, of comprehensive income, of equity and of cash flows for each of the three years in the period ended December 31, 2020, including the related notes and financial statement schedules listed in the index appearing under Item 15(a) (collectively referred to as the “consolidated financial statements”). We also have audited the Company's internal control over financial reporting as of December 31, 2020, based on criteria established in Internal Control - Integrated Framework (2013) issued by the Committee of Sponsoring Organizations of the Treadway Commission (COSO).
In our opinion, the consolidated financial statements referred to above present fairly, in all material respects, the financial position of the Company as of December 31, 2020 and 2019, and the results of its operations and its cash flows for each of the three years in the period ended December 31, 2020 in conformity with accounting principles generally accepted in the United States of America. Also in our opinion, the Company maintained, in all material respects, effective internal control over financial reporting as of December 31, 2020, based on criteria established in Internal Control - Integrated Framework (2013) issued by the COSO.
Basis for Opinions
The Company's management is responsible for these consolidated financial statements, for maintaining effective internal control over financial reporting, and for its assessment of the effectiveness of internal control over financial reporting, included in Management’s Report on Internal Control over Financial Reporting appearing under Item 9A. Our responsibility is to express opinions on the Company’s consolidated financial statements and on the Company's internal control over financial reporting based on our audits. We are a public accounting firm registered with the Public Company Accounting Oversight Board (United States) (PCAOB) and are required to be independent with respect to the Company in accordance with the U.S. federal securities laws and the applicable rules and regulations of the Securities and Exchange Commission and the PCAOB.
We conducted our audits in accordance with the standards of the PCAOB. Those standards require that we plan and perform the audits to obtain reasonable assurance about whether the consolidated financial statements are free of material misstatement, whether due to error or fraud, and whether effective internal control over financial reporting was maintained in all material respects.
Our audits of the consolidated financial statements included performing procedures to assess the risks of material misstatement of the consolidated financial statements, whether due to error or fraud, and performing procedures that respond to those risks. Such procedures included examining, on a test basis, evidence regarding the amounts and disclosures in the consolidated financial statements. Our audits also included evaluating the accounting principles used and significant estimates made by management, as well as evaluating the overall presentation of the consolidated financial statements. Our audit of internal control over financial reporting included obtaining an understanding of internal control over financial reporting, assessing the risk that a material weakness exists, and testing and evaluating the design and operating effectiveness of internal control based on the assessed risk. Our audits also included performing such other procedures as we considered necessary in the circumstances. We believe that our audits provide a reasonable basis for our opinions.
Definition and Limitations of Internal Control over Financial Reporting
A company’s internal control over financial reporting is a process designed to provide reasonable assurance regarding the reliability of financial reporting and the preparation of financial statements for external purposes in accordance with generally accepted accounting principles. A company’s internal control over financial reporting includes those policies and procedures that (i) pertain to the maintenance of records that, in reasonable detail, accurately and fairly reflect the transactions and dispositions of the assets of the company; (ii) provide reasonable assurance that transactions are recorded as necessary to permit preparation of financial statements in accordance with generally accepted accounting principles, and that receipts and expenditures of the company are being made only in accordance with authorizations of management and directors of the company; and (iii) provide reasonable assurance regarding prevention or timely detection of unauthorized acquisition, use, or disposition of the company’s assets that could have a material effect on the financial statements.
Because of its inherent limitations, internal control over financial reporting may not prevent or detect misstatements. Also, projections of any evaluation of effectiveness to future periods are subject to the risk that controls may become inadequate because of changes in conditions, or that the degree of compliance with the policies or procedures may deteriorate.
56
Critical Audit Matters
The critical audit matter communicated below is a matter arising from the current period audit of the consolidated financial statements that was communicated or required to be communicated to the audit committee and that (i) relates to accounts or disclosures that are material to the consolidated financial statements and (ii) involved our especially challenging, subjective, or complex judgments. The communication of critical audit matters does not alter in any way our opinion on the consolidated financial statements, taken as a whole, and we are not, by communicating the critical audit matter below, providing a separate opinion on the critical audit matter or on the accounts or disclosures to which it relates.
Acquired Real Estate Purchase Price Allocations
As described in Notes 2 and 3 to the consolidated financial statements, management allocates the purchase price of acquired properties to tangible and identified lease intangible assets based on their fair values. In 2020, the Company acquired a total of $3.6 billion of land, building and intangible lease assets. In making estimates of fair values for purposes of allocating purchase prices of acquired real estate to tangible and identified lease intangible assets, management utilizes information from a number of sources including available real estate broker data, independent appraisals that may be obtained in connection with the acquisition of the respective property, internal data from previous acquisitions or developments, other market data, and significant assumptions such as capitalization rates and market rental rates.
The principal considerations for our determination that performing procedures relating to the acquired real estate purchase price allocations is a critical audit matter are (i) the significant judgment by management when developing the fair value measurements and allocating the purchase price of the acquired properties to the tangible and lease intangible assets acquired, which in turn led to a high degree of auditor judgment and subjectivity in performing procedures and evaluating audit evidence, (ii) significant audit effort was required in assessing the reasonableness of significant assumptions such as capitalization rates and market rental rates used by management to estimate the fair value of each tangible and lease intangible asset component, and (iii) the audit effort involved the use of professionals with specialized skill and knowledge.
Addressing the matter involved performing procedures and evaluating audit evidence in connection with forming our overall opinion on the financial statements. These procedures included testing the effectiveness of controls relating to management’s acquired real estate purchase price allocations, including controls over the fair value of each tangible and lease intangible asset acquired. These procedures also included, among others, testing management’s process by evaluating the significant assumptions related to capitalization rates and market rental rates, and the methodology used by management in developing the estimated fair values and allocations of the purchase price to the tangible and lease intangible assets acquired. Testing management’s process included using professionals with specialized skill and knowledge to assist in evaluating the valuation methodologies and significant assumptions used by management, such as capitalization rates and market rental rates, for certain acquisitions. Evaluating the reasonableness of assumptions involved considering internal data from previous acquisitions, where relevant.
/s/ PricewaterhouseCoopers LLP
Birmingham, Alabama
March 1, 2021
We have served as the Company’s auditor since 2008.
57
Report of Independent Registered Public Accounting Firm
To the Partners of MPT Operating Partnership, L.P.:
Opinions on the Financial Statements and Internal Control over Financial Reporting
We have audited the accompanying consolidated balance sheets of MPT Operating Partnership, L.P. and its subsidiaries (the “Company”) as of December 31, 2020 and 2019, and the related consolidated statements of net income, of comprehensive income, of capital and of cash flows for each of the three years in the period ended December 31, 2020, including the related notes and financial statement schedules listed in the index appearing under Item 15(a) (collectively referred to as the “consolidated financial statements”). We also have audited the Company's internal control over financial reporting as of December 31, 2020, based on criteria established in Internal Control - Integrated Framework (2013) issued by the Committee of Sponsoring Organizations of the Treadway Commission (COSO).
In our opinion, the consolidated financial statements referred to above present fairly, in all material respects, the financial position of the Company as of December 31, 2020 and 2019, and the results of its operations and its cash flows for each of the three years in the period ended December 31, 2020 in conformity with accounting principles generally accepted in the United States of America. Also in our opinion, the Company maintained, in all material respects, effective internal control over financial reporting as of December 31, 2020, based on criteria established in Internal Control - Integrated Framework (2013) issued by the COSO.
Basis for Opinions
The Company's management is responsible for these consolidated financial statements, for maintaining effective internal control over financial reporting, and for its assessment of the effectiveness of internal control over financial reporting, included in Management’s Report on Internal Control over Financial Reporting appearing under Item 9A. Our responsibility is to express opinions on the Company’s consolidated financial statements and on the Company's internal control over financial reporting based on our audits. We are a public accounting firm registered with the Public Company Accounting Oversight Board (United States) (PCAOB) and are required to be independent with respect to the Company in accordance with the U.S. federal securities laws and the applicable rules and regulations of the Securities and Exchange Commission and the PCAOB.
We conducted our audits in accordance with the standards of the PCAOB. Those standards require that we plan and perform the audits to obtain reasonable assurance about whether the consolidated financial statements are free of material misstatement, whether due to error or fraud, and whether effective internal control over financial reporting was maintained in all material respects.
Our audits of the consolidated financial statements included performing procedures to assess the risks of material misstatement of the consolidated financial statements, whether due to error or fraud, and performing procedures that respond to those risks. Such procedures included examining, on a test basis, evidence regarding the amounts and disclosures in the consolidated financial statements. Our audits also included evaluating the accounting principles used and significant estimates made by management, as well as evaluating the overall presentation of the consolidated financial statements. Our audit of internal control over financial reporting included obtaining an understanding of internal control over financial reporting, assessing the risk that a material weakness exists, and testing and evaluating the design and operating effectiveness of internal control based on the assessed risk. Our audits also included performing such other procedures as we considered necessary in the circumstances. We believe that our audits provide a reasonable basis for our opinions.
Definition and Limitations of Internal Control over Financial Reporting
A company’s internal control over financial reporting is a process designed to provide reasonable assurance regarding the reliability of financial reporting and the preparation of financial statements for external purposes in accordance with generally accepted accounting principles. A company’s internal control over financial reporting includes those policies and procedures that (i) pertain to the maintenance of records that, in reasonable detail, accurately and fairly reflect the transactions and dispositions of the assets of the company; (ii) provide reasonable assurance that transactions are recorded as necessary to permit preparation of financial statements in accordance with generally accepted accounting principles, and that receipts and expenditures of the company are being made only in accordance with authorizations of management and directors of the company; and (iii) provide reasonable assurance regarding prevention or timely detection of unauthorized acquisition, use, or disposition of the company’s assets that could have a material effect on the financial statements.
Because of its inherent limitations, internal control over financial reporting may not prevent or detect misstatements. Also, projections of any evaluation of effectiveness to future periods are subject to the risk that controls may become inadequate because of changes in conditions, or that the degree of compliance with the policies or procedures may deteriorate.
Critical Audit Matters
58
The critical audit matter communicated below is a matter arising from the current period audit of the consolidated financial statements that was communicated or required to be communicated to the audit committee and that (i) relates to accounts or disclosures that are material to the consolidated financial statements and (ii) involved our especially challenging, subjective, or complex judgments. The communication of critical audit matters does not alter in any way our opinion on the consolidated financial statements, taken as a whole, and we are not, by communicating the critical audit matter below, providing a separate opinion on the critical audit matter or on the accounts or disclosures to which it relates.
Acquired Real Estate Purchase Price Allocations
As described in Notes 2 and 3 to the consolidated financial statements, management allocates the purchase price of acquired properties to tangible and identified lease intangible assets based on their fair values. In 2020, the Company acquired a total of $3.6 billion of land, building and intangible lease assets. In making estimates of fair values for purposes of allocating purchase prices of acquired real estate to tangible and identified lease intangible assets, management utilizes information from a number of sources including available real estate broker data, independent appraisals that may be obtained in connection with the acquisition of the respective property, internal data from previous acquisitions or developments, other market data, and significant assumptions such as capitalization rates and market rental rates.
The principal considerations for our determination that performing procedures relating to the acquired real estate purchase price allocations is a critical audit matter are (i) the significant judgment by management when developing the fair value measurements and allocating the purchase price of the acquired properties to the tangible and lease intangible assets acquired, which in turn led to a high degree of auditor judgment and subjectivity in performing procedures and evaluating audit evidence, (ii) significant audit effort was required in assessing the reasonableness of significant assumptions such as capitalization rates and market rental rates used by management to estimate the fair value of each tangible and lease intangible asset component, and (iii) the audit effort involved the use of professionals with specialized skill and knowledge.
Addressing the matter involved performing procedures and evaluating audit evidence in connection with forming our overall opinion on the financial statements. These procedures included testing the effectiveness of controls relating to management’s acquired real estate purchase price allocations, including controls over the fair value of each tangible and lease intangible asset acquired. These procedures also included, among others, testing management’s process by evaluating the significant assumptions related to capitalization rates and market rental rates, and the methodology used by management in developing the estimated fair values and allocations of the purchase price to the tangible and lease intangible assets acquired. Testing management’s process included using professionals with specialized skill and knowledge to assist in evaluating the valuation methodologies and significant assumptions used by management, such as capitalization rates and market rental rates, for certain acquisitions. Evaluating the reasonableness of assumptions involved considering internal data from previous acquisitions, where relevant.
/s/ PricewaterhouseCoopers LLP
Birmingham, Alabama
March 1, 2021
We have served as the Company’s auditor since 2008.
59
MEDICAL PROPERTIES TRUST, INC. AND SUBSIDIARIES
Consolidated Balance Sheets
|
|
|
December 31, |
|
|||||
|
|
|
2020 |
|
|
2019 |
|
||
|
|
|
(Amounts in thousands, except for per share data) |
|
|||||
|
ASSETS |
|
|
|
|
|
|
|
|
|
Real estate assets |
|
|
|
|
|
|
|
|
|
Land |
|
$ |
|
|
|
$ |
|
|
|
Buildings and improvements |
|
|
|
|
|
|
|
|
|
Construction in progress |
|
|
|
|
|
|
|
|
|
Intangible lease assets |
|
|
|
|
|
|
|
|
|
Investment in financing leases |
|
|
|
|
|
|
|
|
|
Mortgage loans |
|
|
|
|
|
|
|
|
|
Gross investment in real estate assets |
|
|
|
|
|
|
|
|
|
Accumulated depreciation |
|
|
( |
) |
|
|
( |
) |
|
Accumulated amortization |
|
|
( |
) |
|
|
( |
) |
|
Net investment in real estate assets |
|
|
|
|
|
|
|
|
|
Cash and cash equivalents |
|
|
|
|
|
|
|
|
|
Interest and rent receivables |
|
|
|
|
|
|
|
|
|
Straight-line rent receivables |
|
|
|
|
|
|
|
|
|
Equity investments |
|
|
|
|
|
|
|
|
|
Other loans |
|
|
|
|
|
|
|
|
|
Other assets |
|
|
|
|
|
|
|
|
|
Total Assets |
|
$ |
|
|
|
$ |
|
|
|
LIABILITIES AND EQUITY |
|
|
|
|
|
|
|
|
|
Liabilities |
|
|
|
|
|
|
|
|
|
Debt, net |
|
$ |
|
|
|
$ |
|
|
|
Accounts payable and accrued expenses |
|
|
|
|
|
|
|
|
|
Deferred revenue |
|
|
|
|
|
|
|
|
|
Obligations to tenants and other lease liabilities |
|
|
|
|
|
|
|
|
|
Total Liabilities |
|
|
|
|
|
|
|
|
|
Commitments and Contingencies |
|
|
|
|
|
|
|
|
|
Equity |
|
|
|
|
|
|
|
|
|
Preferred stock, $ |
|
|
|
|
|
|
|
|
|
Common stock, $ |
|
|
|
|
|
|
|
|
|
Additional paid-in capital |
|
|
|
|
|
|
|
|
|
Retained (deficit) earnings |
|
|
( |
) |
|
|
|
|
|
Accumulated other comprehensive loss |
|
|
( |
) |
|
|
( |
) |
|
Treasury shares, at cost |
|
|
( |
) |
|
|
( |
) |
|
Total Medical Properties Trust, Inc. stockholders’ equity |
|
|
|
|
|
|
|
|
|
Non-controlling interests |
|
|
|
|
|
|
|
|
|
Total Equity |
|
|
|
|
|
|
|
|
|
Total Liabilities and Equity |
|
$ |
|
|
|
$ |
|
|
See accompanying notes to consolidated financial statements.
60
MEDICAL PROPERTIES TRUST, INC. AND SUBSIDIARIES
Consolidated Statements of Net Income
|
|
|
For the Years Ended December 31, |
|
|||||||||
|
|
|
2020 |
|
|
2019 |
|
|
2018 |
|
|||
|
|
|
(Amounts in thousands, except for per share data) |
|
|||||||||
|
Revenues |
|
|
|
|
|
|
|
|
|
|
|
|
|
Rent billed |
|
$ |
|
|
|
$ |
|
|
|
$ |
|
|
|
Straight-line rent |
|
|
|
|
|
|
|
|
|
|
|
|
|
Income from financing leases |
|
|
|
|
|
|
|
|
|
|
|
|
|
Interest and other income |
|
|
|
|
|
|
|
|
|
|
|
|
|
Total revenues |
|
|
|
|
|
|
|
|
|
|
|
|
|
Expenses |
|
|
|
|
|
|
|
|
|
|
|
|
|
Interest |
|
|
|
|
|
|
|
|
|
|
|
|
|
Real estate depreciation and amortization |
|
|
|
|
|
|
|
|
|
|
|
|
|
Property-related |
|
|
|
|
|
|
|
|
|
|
|
|
|
General and administrative |
|
|
|
|
|
|
|
|
|
|
|
|
|
Total expenses |
|
|
|
|
|
|
|
|
|
|
|
|
|
|
|
|
|
|
|
|
|
|
|
|
|
|
|
Other income (expense) |
|
|
|
|
|
|
|
|
|
|
|
|
|
(Loss) gain on sale of real estate |
|
|
( |
) |
|
|
|
|
|
|
|
|
|
Real estate impairment charges |
|
|
( |
) |
|
|
( |
) |
|
|
( |
) |
|
Earnings from equity interests |
|
|
|
|
|
|
|
|
|
|
|
|
|
Debt refinancing and unutilized financing costs |
|
|
( |
) |
|
|
( |
) |
|
|
— |
|
|
Other (including mark-to-market adjustments on equity securities) |
|
|
( |
) |
|
|
( |
) |
|
|
( |
) |
|
Total other income (expense) |
|
|
( |
) |
|
|
|
|
|
|
|
|
|
|
|
|
|
|
|
|
|
|
|
|
|
|
|
Income before income tax |
|
|
|
|
|
|
|
|
|
|
|
|
|
Income tax (expense) benefit |
|
|
( |
) |
|
|
|
|
|
|
( |
) |
|
|
|
|
|
|
|
|
|
|
|
|
|
|
|
Net income |
|
|
|
|
|
|
|
|
|
|
|
|
|
Net income attributable to non-controlling interests |
|
|
( |
) |
|
|
( |
) |
|
|
( |
) |
|
Net income attributable to MPT common stockholders |
|
$ |
|
|
|
$ |
|
|
|
$ |
|
|
|
Earnings per share — basic |
|
|
|
|
|
|
|
|
|
|
|
|
|
Net income attributable to MPT common stockholders |
|
$ |
|
|
|
$ |
|
|
|
$ |
|
|
|
Weighted-average shares outstanding — basic |
|
|
|
|
|
|
|
|
|
|
|
|
|
Earnings per share — diluted |
|
|
|
|
|
|
|
|
|
|
|
|
|
Net income attributable to MPT common stockholders |
|
$ |
|
|
|
$ |
|
|
|
$ |
|
|
|
Weighted-average shares outstanding — diluted |
|
|
|
|
|
|
|
|
|
|
|
|
See accompanying notes to consolidated financial statements.
61
MEDICAL PROPERTIES TRUST, INC. AND SUBSIDIARIES
Consolidated Statements of Comprehensive Income
|
|
|
For the Years Ended December 31, |
|
|||||||||
|
(In thousands) |
|
2020 |
|
|
2019 |
|
|
2018 |
|
|||
|
Net income |
|
$ |
|
|
|
$ |
|
|
|
$ |
|
|
|
Other comprehensive income: |
|
|
|
|
|
|
|
|
|
|
|
|
|
Unrealized loss on interest rate swap, net of tax |
|
|
( |
) |
|
|
( |
) |
|
|
( |
) |
|
Foreign currency translation gain (loss) |
|
|
|
|
|
|
|
|
|
|
( |
) |
|
Total comprehensive income |
|
|
|
|
|
|
|
|
|
|
|
|
|
Comprehensive income attributable to non-controlling interests |
|
|
( |
) |
|
|
( |
) |
|
|
( |
) |
|
Comprehensive income attributable to MPT common stockholders |
|
$ |
|
|
|
$ |
|
|
|
$ |
|
|
See accompanying notes to consolidated financial statements.
62
MEDICAL PROPERTIES TRUST, INC. AND SUBSIDIARIES
Consolidated Statements of Equity
For the Years Ended December 31, 2020, 2019 and 2018
(Amounts in thousands, except per share data)
|
|
|
Preferred |
|
|
Common |
|
|
|
|
|
|
|
|
|
|
|
|
|
|
|
|
|
|
|
|
|
|
|
|
|
||||||||||
|
|
|
Shares |
|
|
Par Value |
|
|
Shares |
|
|
Par Value |
|
|
Additional Paid-in Capital |
|
|
Retained Earnings (Deficit) |
|
|
Accumulated Other Comprehensive Loss |
|
|
Treasury Shares |
|
|
Non- Controlling Interests |
|
|
Total Equity |
|
||||||||||
|
Balance at December 31, 2017 |
|
|
— |
|
|
$ |
— |
|
|
|
|
|
|
$ |
|
|
|
$ |
|
|
|
$ |
( |
) |
|
$ |
( |
) |
|
$ |
( |
) |
|
$ |
|
|
|
$ |
|
|
|
Net income |
|
|
— |
|
|
|
— |
|
|
|
— |
|
|
|
— |
|
|
|
— |
|
|
|
|
|
|
|
— |
|
|
|
— |
|
|
|
|
|
|
|
|
|
|
Cumulative effect of change in accounting principles |
|
|
— |
|
|
|
— |
|
|
|
— |
|
|
|
— |
|
|
|
— |
|
|
|
|
|
|
|
— |
|
|
|
— |
|
|
|
— |
|
|
|
|
|
|
Unrealized loss on interest rate swap, net of tax |
|
|
— |
|
|
|
— |
|
|
|
— |
|
|
|
— |
|
|
|
— |
|
|
|
— |
|
|
|
( |
) |
|
|
— |
|
|
|
— |
|
|
|
( |
) |
|
Foreign currency translation loss |
|
|
— |
|
|
|
— |
|
|
|
— |
|
|
|
— |
|
|
|
— |
|
|
|
— |
|
|
|
( |
) |
|
|
— |
|
|
|
— |
|
|
|
( |
) |
|
Stock vesting and amortization of stock-based compensation |
|
|
— |
|
|
|
— |
|
|
|
|
|
|
|
|
|
|
|
|
|
|
|
— |
|
|
|
— |
|
|
|
— |
|
|
|
— |
|
|
|
|
|
|
Redemption of MOP units |
|
|
— |
|
|
|
— |
|
|
|
— |
|
|
|
— |
|
|
|
( |
) |
|
|
— |
|
|
|
— |
|
|
|
— |
|
|
|
— |
|
|
|
( |
) |
|
Distributions to non-controlling interests |
|
|
— |
|
|
|
— |
|
|
|
— |
|
|
|
— |
|
|
|
— |
|
|
|
— |
|
|
|
— |
|
|
|
— |
|
|
|
( |
) |
|
|
( |
) |
|
Proceeds from offering (net of offering costs) |
|
|
— |
|
|
|
— |
|
|
|
|
|
|
|
|
|
|
|
|
|
|
|
— |
|
|
|
— |
|
|
|
— |
|
|
|
— |
|
|
|
|
|
|
Dividends declared ($ |
|
|
— |
|
|
|
— |
|
|
|
— |
|
|
|
— |
|
|
|
— |
|
|
|
( |
) |
|
|
— |
|
|
|
— |
|
|
|
— |
|
|
|
( |
) |
|
Balance at December 31, 2018 |
|
|
— |
|
|
$ |
— |
|
|
|
|
|
|
$ |
|
|
|
$ |
|
|
|
$ |
|
|
|
$ |
( |
) |
|
$ |
( |
) |
|
$ |
|
|
|
$ |
|
|
|
Net income |
|
|
— |
|
|
|
— |
|
|
|
— |
|
|
|
— |
|
|
|
— |
|
|
|
|
|
|
|
— |
|
|
|
— |
|
|
|
|
|
|
|
|
|
|
Unrealized loss on interest rate swap, net of tax |
|
|
— |
|
|
|
— |
|
|
|
— |
|
|
|
— |
|
|
|
— |
|
|
|
— |
|
|
|
( |
) |
|
|
— |
|
|
|
— |
|
|
|
( |
) |
|
Foreign currency translation gain |
|
|
— |
|
|
|
— |
|
|
|
— |
|
|
|
— |
|
|
|
— |
|
|
|
— |
|
|
|
|
|
|
|
— |
|
|
|
— |
|
|
|
|
|
|
Stock vesting and amortization of stock-based compensation |
|
|
— |
|
|
|
— |
|
|
|
|
|
|
|
|
|
|
|
|
|
|
|
— |
|
|
|
— |
|
|
|
— |
|
|
|
— |
|
|
|
|
|
|
Distributions to non-controlling interests, net |
|
|
— |
|
|
|
— |
|
|
|
— |
|
|
|
— |
|
|
|
— |
|
|
|
— |
|
|
|
— |
|
|
|
— |
|
|
|
( |
) |
|
|
( |
) |
|
Proceeds from offering (net of offering costs) |
|
|
— |
|
|
|
— |
|
|
|
|
|
|
|
|
|
|
|
|
|
|
|
— |
|
|
|
— |
|
|
|
— |
|
|
|
— |
|
|
|
|
|
|
Dividends declared ($ |
|
|
— |
|
|
|
— |
|
|
|
— |
|
|
|
— |
|
|
|
— |
|
|
|
( |
) |
|
|
— |
|
|
|
— |
|
|
|
— |
|
|
|
( |
) |
|
Balance at December 31, 2019 |
|
|
— |
|
|
$ |
— |
|
|
|
|
|
|
$ |
|
|
|
$ |
|
|
|
$ |
|
|
|
$ |
( |
) |
|
$ |
( |
) |
|
$ |
|
|
|
$ |
|
|
|
Net income |
|
|
— |
|
|
|
— |
|
|
|
— |
|
|
|
— |
|
|
|
— |
|
|
|
|
|
|
|
— |
|
|
|
— |
|
|
|
|
|
|
|
|
|
|
Cumulative effect of change in accounting principles |
|
|
— |
|
|
|
— |
|
|
|
— |
|
|
|
— |
|
|
|
— |
|
|
|
( |
) |
|
|
— |
|
|
|
— |
|
|
|
— |
|
|
|
( |
) |
|
Unrealized loss on interest rate swap, net of tax |
|
|
— |
|
|
|
— |
|
|
|
— |
|
|
|
— |
|
|
|
— |
|
|
|
— |
|
|
|
( |
) |
|
|
— |
|
|
|
— |
|
|
|
( |
) |
|
Foreign currency translation gain |
|
|
— |
|
|
|
— |
|
|
|
— |
|
|
|
— |
|
|
|
— |
|
|
|
— |
|
|
|
|
|
|
|
— |
|
|
|
— |
|
|
|
|
|
|
Stock vesting and amortization of stock-based compensation |
|
|
— |
|
|
|
— |
|
|
|
|
|
|
|
|
|
|
|
|
|
|
|
— |
|
|
|
— |
|
|
|
— |
|
|
|
— |
|
|
|
|
|
|
Sale of non-controlling interests |
|
|
— |
|
|
|
— |
|
|
|
— |
|
|
|
— |
|
|
|
— |
|
|
|
— |
|
|
|
— |
|
|
|
— |
|
|
|
|
|
|
|
|
|
|
Redemption of MOP units |
|
|
— |
|
|
|
— |
|
|
|
— |
|
|
|
— |
|
|
|
( |
) |
|
|
— |
|
|
|
— |
|
|
|
— |
|
|
|
— |
|
|
|
( |
) |
|
Distributions to non-controlling interests |
|
|
— |
|
|
|
— |
|
|
|
— |
|
|
|
— |
|
|
|
— |
|
|
|
— |
|
|
|
— |
|
|
|
— |
|
|
|
( |
) |
|
|
( |
) |
|
Proceeds from offering (net of offering costs) |
|
|
— |
|
|
|
— |
|
|
|
|
|
|
|
|
|
|
|
|
|
|
|
— |
|
|
|
— |
|
|
|
— |
|
|
|
— |
|
|
|
|
|
|
Dividends declared ($ |
|
|
— |
|
|
|
— |
|
|
|
— |
|
|
|
— |
|
|
|
— |
|
|
|
( |
) |
|
|
— |
|
|
|
— |
|
|
|
— |
|
|
|
( |
) |
|
Balance at December 31, 2020 |
|
|
— |
|
|
$ |
— |
|
|
|
|
|
|
$ |
|
|
|
$ |
|
|
|
$ |
( |
) |
|
$ |
( |
) |
|
$ |
( |
) |
|
$ |
|
|
|
$ |
|
|
See accompanying notes to consolidated financial statements.
63
MEDICAL PROPERTIES TRUST, INC. AND SUBSIDIARIES
Consolidated Statements of Cash Flows
|
|
|
For the Years Ended December 31, |
|
|||||||||
|
|
|
2020 |
|
|
2019 |
|
|
2018 |
|
|||
|
|
|
(Amounts in thousands) |
|
|||||||||
|
Operating activities |
|
|
|
|
|
|
|
|
|
|
|
|
|
Net income |
|
$ |
|
|
|
$ |
|
|
|
$ |
|
|
|
Adjustments to reconcile net income to net cash provided by operating activities: |
|
|
|
|
|
|
|
|
|
|
|
|
|
Depreciation and amortization |
|
|
|
|
|
|
|
|
|
|
|
|
|
Amortization of deferred financing costs and debt discount |
|
|
|
|
|
|
|
|
|
|
|
|
|
Straight-line rent revenue and other |
|
|
( |
) |
|
|
( |
) |
|
|
( |
) |
|
Share-based compensation |
|
|
|
|
|
|
|
|
|
|
|
|
|
Loss (gain) from sale of real estate |
|
|
|
|
|
|
( |
) |
|
|
( |
) |
|
Impairment charges |
|
|
|
|
|
|
|
|
|
|
|
|
|
Straight-line rent and other write-off |
|
|
|
|
|
|
|
|
|
|
|
|
|
Debt refinancing and unutilized financing costs |
|
|
|
|
|
|
|
|
|
|
— |
|
|
Pre-acquisition rent collected - Circle Transaction |
|
|
( |
) |
|
|
— |
|
|
|
— |
|
|
Other adjustments |
|
|
|
|
|
|
( |
) |
|
|
( |
) |
|
Changes in: |
|
|
|
|
|
|
|
|
|
|
|
|
|
Interest and rent receivables |
|
|
( |
) |
|
|
|
|
|
|
|
|
|
Other assets |
|
|
|
|
|
|
( |
) |
|
|
( |
) |
|
Accounts payable and accrued expenses |
|
|
( |
) |
|
|
|
|
|
|
( |
) |
|
Deferred revenue |
|
|
|
|
|
|
|
|
|
|
|
|
|
Net cash provided by operating activities |
|
|
|
|
|
|
|
|
|
|
|
|
|
Investing activities |
|
|
|
|
|
|
|
|
|
|
|
|
|
Cash paid for acquisitions and other related investments |
|
|
( |
) |
|
|
( |
) |
|
|
( |
) |
|
Net proceeds from sale of real estate |
|
|
|
|
|
|
|
|
|
|
|
|
|
Principal received on loans receivable |
|
|
|
|
|
|
|
|
|
|
|
|
|
Investment in loans receivable |
|
|
( |
) |
|
|
( |
) |
|
|
( |
) |
|
Construction in progress and other |
|
|
( |
) |
|
|
( |
) |
|
|
( |
) |
|
Return of equity investment |
|
|
|
|
|
|
— |
|
|
|
— |
|
|
Capital additions and other investments, net |
|
|
( |
) |
|
|
( |
) |
|
|
( |
) |
|
Net cash (used for) provided by investing activities |
|
|
( |
) |
|
|
( |
) |
|
|
|
|
|
Financing activities |
|
|
|
|
|
|
|
|
|
|
|
|
|
Proceeds from term debt, net of discount |
|
|
|
|
|
|
|
|
|
|
|
|
|
Payments of term debt |
|
|
( |
) |
|
|
— |
|
|
|
— |
|
|
Revolving credit facilities, net |
|
|
|
|
|
|
( |
) |
|
|
( |
) |
|
Dividends paid |
|
|
( |
) |
|
|
( |
) |
|
|
( |
) |
|
Lease deposits and other obligations to tenants |
|
|
|
|
|
|
( |
) |
|
|
( |
) |
|
Proceeds from sale of common shares, net of offering costs |
|
|
|
|
|
|
|
|
|
|
|
|
|
Payment of debt refinancing, deferred financing costs and other financing activities |
|
|
( |
) |
|
|
( |
) |
|
|
( |
) |
|
Net cash provided by (used for) financing activities |
|
|
|
|
|
|
|
|
|
|
( |
) |
|
(Decrease) increase in cash, cash equivalents, and restricted cash for the year |
|
|
( |
) |
|
|
|
|
|
|
|
|
|
Effect of exchange rate changes |
|
|
|
|
|
|
( |
) |
|
|
( |
) |
|
Cash, cash equivalents, and restricted cash at beginning of year |
|
|
|
|
|
|
|
|
|
|
|
|
|
Cash, cash equivalents, and restricted cash at end of year |
|
$ |
|
|
|
$ |
|
|
|
$ |
|
|
|
Interest paid, including capitalized interest of $ and $ |
|
$ |
|
|
|
$ |
|
|
|
$ |
|
|
|
Supplemental schedule of non-cash financing activities: |
|
|
|
|
|
|
|
|
|
|
|
|
|
Dividends declared, unpaid |
|
$ |
|
|
|
$ |
|
|
|
$ |
|
|
|
Cash, cash equivalents, and restricted cash are comprised of the following: |
|
|
|
|
|
|
|
|
|
|
|
|
|
Beginning of period: |
|
|
|
|
|
|
|
|
|
|
|
|
|
Cash and cash equivalents |
|
$ |
|
|
|
$ |
|
|
|
$ |
|
|
|
Restricted cash, included in Other assets |
|
|
|
|
|
|
|
|
|
|
|
|
|
|
|
$ |
|
|
|
$ |
|
|
|
$ |
|
|
|
End of period: |
|
|
|
|
|
|
|
|
|
|
|
|
|
Cash and cash equivalents |
|
$ |
|
|
|
$ |
|
|
|
$ |
|
|
|
Restricted cash, included in Other assets |
|
|
|
|
|
|
|
|
|
|
|
|
|
|
|
$ |
|
|
|
$ |
|
|
|
$ |
|
|
See accompanying notes to consolidated financial statements.
64
MPT OPERATING PARTNERSHIP, L.P. AND SUBSIDIARIES
Consolidated Balance Sheets
|
|
|
December 31, |
|
|||||
|
|
|
2020 |
|
|
2019 |
|
||
|
|
|
(Amounts in thousands, except for per unit data) |
|
|||||
|
ASSETS |
|
|
|
|
|
|
|
|
|
Real estate assets |
|
|
|
|
|
|
|
|
|
Land |
|
$ |
|
|
|
$ |
|
|
|
Buildings and improvements |
|
|
|
|
|
|
|
|
|
Construction in progress |
|
|
|
|
|
|
|
|
|
Intangible lease assets |
|
|
|
|
|
|
|
|
|
Investment in financing leases |
|
|
|
|
|
|
|
|
|
Mortgage loans |
|
|
|
|
|
|
|
|
|
Gross investment in real estate assets |
|
|
|
|
|
|
|
|
|
Accumulated depreciation |
|
|
( |
) |
|
|
( |
) |
|
Accumulated amortization |
|
|
( |
) |
|
|
( |
) |
|
Net investment in real estate assets |
|
|
|
|
|
|
|
|
|
Cash and cash equivalents |
|
|
|
|
|
|
|
|
|
Interest and rent receivables |
|
|
|
|
|
|
|
|
|
Straight-line rent receivables |
|
|
|
|
|
|
|
|
|
Equity investments |
|
|
|
|
|
|
|
|
|
Other loans |
|
|
|
|
|
|
|
|
|
Other assets |
|
|
|
|
|
|
|
|
|
Total Assets |
|
$ |
|
|
|
$ |
|
|
|
LIABILITIES AND CAPITAL |
|
|
|
|
|
|
|
|
|
Liabilities |
|
|
|
|
|
|
|
|
|
Debt, net |
|
$ |
|
|
|
$ |
|
|
|
Accounts payable and accrued expenses |
|
|
|
|
|
|
|
|
|
Deferred revenue |
|
|
|
|
|
|
|
|
|
Obligations to tenants and other lease liabilities |
|
|
|
|
|
|
|
|
|
Payable due to Medical Properties Trust, Inc. |
|
|
|
|
|
|
|
|
|
Total Liabilities |
|
|
|
|
|
|
|
|
|
Commitments and Contingencies |
|
|
|
|
|
|
|
|
|
Capital |
|
|
|
|
|
|
|
|
|
General partner — issued and outstanding — |
|
|
|
|
|
|
|
|
|
Limited partners: |
|
|
|
|
|
|
|
|
|
Common units — issued and outstanding — 2020 and |
|
|
|
|
|
|
|
|
|
LTIP units — issued and outstanding — |
|
|
— |
|
|
|
— |
|
|
Accumulated other comprehensive loss |
|
|
( |
) |
|
|
( |
) |
|
Total MPT Operating Partnership, L.P. capital |
|
|
|
|
|
|
|
|
|
Non-controlling interests |
|
|
|
|
|
|
|
|
|
Total Capital |
|
|
|
|
|
|
|
|
|
Total Liabilities and Capital |
|
$ |
|
|
|
$ |
|
|
See accompanying notes to consolidated financial statements.
65
MPT OPERATING PARTNERSHIP, L.P. AND SUBSIDIARIES
Consolidated Statements of Net Income
|
|
|
For the Years Ended December 31, |
|
|||||||||
|
|
|
2020 |
|
|
2019 |
|
|
2018 |
|
|||
|
|
|
(Amounts in thousands, except for per unit data) |
|
|||||||||
|
Revenues |
|
|
|
|
|
|
|
|
|
|
|
|
|
Rent billed |
|
$ |
|
|
|
$ |
|
|
|
$ |
|
|
|
Straight-line rent |
|
|
|
|
|
|
|
|
|
|
|
|
|
Income from financing leases |
|
|
|
|
|
|
|
|
|
|
|
|
|
Interest and other income |
|
|
|
|
|
|
|
|
|
|
|
|
|
Total revenues |
|
|
|
|
|
|
|
|
|
|
|
|
|
Expenses |
|
|
|
|
|
|
|
|
|
|
|
|
|
Interest |
|
|
|
|
|
|
|
|
|
|
|
|
|
Real estate depreciation and amortization |
|
|
|
|
|
|
|
|
|
|
|
|
|
Property-related |
|
|
|
|
|
|
|
|
|
|
|
|
|
General and administrative |
|
|
|
|
|
|
|
|
|
|
|
|
|
Total expenses |
|
|
|
|
|
|
|
|
|
|
|
|
|
|
|
|
|
|
|
|
|
|
|
|
|
|
|
Other income (expense) |
|
|
|
|
|
|
|
|
|
|
|
|
|
(Loss) gain on sale of real estate |
|
|
( |
) |
|
|
|
|
|
|
|
|
|
Real estate impairment charges |
|
|
( |
) |
|
|
( |
) |
|
|
( |
) |
|
Earnings from equity interests |
|
|
|
|
|
|
|
|
|
|
|
|
|
Debt refinancing and unutilized financing costs |
|
|
( |
) |
|
|
( |
) |
|
|
— |
|
|
Other (including mark-to-market adjustments on equity securities) |
|
|
( |
) |
|
|
( |
) |
|
|
( |
) |
|
Total other income (expense) |
|
|
( |
) |
|
|
|
|
|
|
|
|
|
|
|
|
|
|
|
|
|
|
|
|
|
|
|
Income before income tax |
|
|
|
|
|
|
|
|
|
|
|
|
|
Income tax (expense) benefit |
|
|
( |
) |
|
|
|
|
|
|
( |
) |
|
|
|
|
|
|
|
|
|
|
|
|
|
|
|
Net income |
|
|
|
|
|
|
|
|
|
|
|
|
|
Net income attributable to non-controlling interests |
|
|
( |
) |
|
|
( |
) |
|
|
( |
) |
|
Net income attributable to MPT Operating Partnership partners |
|
$ |
|
|
|
$ |
|
|
|
$ |
|
|
|
Earnings per unit — basic |
|
|
|
|
|
|
|
|
|
|
|
|
|
Net income attributable to MPT Operating Partnership partners |
|
$ |
|
|
|
$ |
|
|
|
$ |
|
|
|
Weighted-average units outstanding — basic |
|
|
|
|
|
|
|
|
|
|
|
|
|
Earnings per unit — diluted |
|
|
|
|
|
|
|
|
|
|
|
|
|
Net income attributable to MPT Operating Partnership partners |
|
$ |
|
|
|
$ |
|
|
|
$ |
|
|
|
Weighted-average units outstanding — diluted |
|
|
|
|
|
|
|
|
|
|
|
|
See accompanying notes to consolidated financial statements.
66
MPT OPERATING PARTNERSHIP, L.P. AND SUBSIDIARIES
Consolidated Statements of Comprehensive Income
|
|
|
For the Years Ended December 31, |
|
|||||||||
|
(In thousands) |
|
2020 |
|
|
2019 |
|
|
2018 |
|
|||
|
Net income |
|
$ |
|
|
|
$ |
|
|
|
$ |
|
|
|
Other comprehensive income: |
|
|
|
|
|
|
|
|
|
|
|
|
|
Unrealized loss on interest rate swap, net of tax |
|
|
( |
) |
|
|
( |
) |
|
|
( |
) |
|
Foreign currency translation gain (loss) |
|
|
|
|
|
|
|
|
|
|
( |
) |
|
Total comprehensive income |
|
|
|
|
|
|
|
|
|
|
|
|
|
Comprehensive income attributable to non-controlling interests |
|
|
( |
) |
|
|
( |
) |
|
|
( |
) |
|
Comprehensive income attributable to MPT Operating Partnership partners |
|
$ |
|
|
|
$ |
|
|
|
$ |
|
|
See accompanying notes to consolidated financial statements.
67
MPT OPERATING PARTNERSHIP, L.P. AND SUBSIDIARIES
Consolidated Statements of Capital
For the Years Ended December 31, 2020, 2019 and 2018
(Amounts in thousands, except per unit data)
|
|
|
General |
|
|
Limited Partners |
|
|
Accumulated |
|
|
|
|
|
|
|
|
|
|||||||||||||||||||
|
|
|
Partner |
|
|
Common |
|
|
LTIPs |
|
|
Other |
|
|
Non- |
|
|
|
|
|
|||||||||||||||||
|
|
|
Units |
|
|
Unit Value |
|
|
Units |
|
|
Unit Value |
|
|
Units |
|
|
Unit Value |
|
|
Comprehensive Loss |
|
|
Controlling Interests |
|
|
Total Capital |
|
|||||||||
|
Balance at December 31, 2017 |
|
|
|
|
|
$ |
|
|
|
|
|
|
|
$ |
|
|
|
|
|
|
|
$ |
— |
|
|
$ |
( |
) |
|
$ |
|
|
|
$ |
|
|
|
Net income |
|
|
— |
|
|
|
|
|
|
|
— |
|
|
|
|
|
|
|
— |
|
|
|
— |
|
|
|
— |
|
|
|
|
|
|
|
|
|
|
Cumulative effect of change in accounting principles |
|
|
— |
|
|
|
|
|
|
|
— |
|
|
|
|
|
|
|
— |
|
|
|
— |
|
|
|
— |
|
|
|
— |
|
|
|
|
|
|
Unrealized loss on interest rate swap, net of tax |
|
|
— |
|
|
|
— |
|
|
|
— |
|
|
|
— |
|
|
|
— |
|
|
|
— |
|
|
|
( |
) |
|
|
— |
|
|
|
( |
) |
|
Foreign currency translation loss |
|
|
— |
|
|
|
— |
|
|
|
— |
|
|
|
— |
|
|
|
— |
|
|
|
— |
|
|
|
( |
) |
|
|
— |
|
|
|
( |
) |
|
Unit vesting and amortization of unit-based compensation |
|
|
|
|
|
|
|
|
|
|
|
|
|
|
|
|
|
|
— |
|
|
|
— |
|
|
|
— |
|
|
|
— |
|
|
|
|
|
|
Conversion of LTIP units to common units |
|
|
— |
|
|
|
— |
|
|
|
|
|
|
|
— |
|
|
|
( |
) |
|
|
— |
|
|
|
— |
|
|
|
— |
|
|
|
— |
|
|
Redemption of common units |
|
|
— |
|
|
|
— |
|
|
|
( |
) |
|
|
( |
) |
|
|
— |
|
|
|
— |
|
|
|
— |
|
|
|
— |
|
|
|
( |
) |
|
Distributions to non-controlling interests |
|
|
— |
|
|
|
— |
|
|
|
— |
|
|
|
— |
|
|
|
— |
|
|
|
— |
|
|
|
— |
|
|
|
( |
) |
|
|
( |
) |
|
Proceeds from offering (net of offering costs) |
|
|
|
|
|
|
|
|
|
|
|
|
|
|
|
|
|
|
— |
|
|
|
— |
|
|
|
— |
|
|
|
— |
|
|
|
|
|
|
Distributions declared ($ |
|
|
— |
|
|
|
( |
) |
|
|
— |
|
|
|
( |
) |
|
|
— |
|
|
|
— |
|
|
|
— |
|
|
|
— |
|
|
|
( |
) |
|
Balance at December 31, 2018 |
|
|
|
|
|
$ |
|
|
|
|
|
|
|
$ |
|
|
|
|
|
|
|
$ |
— |
|
|
$ |
( |
) |
|
$ |
|
|
|
$ |
|
|
|
Net income |
|
|
— |
|
|
|
|
|
|
|
— |
|
|
|
|
|
|
|
— |
|
|
|
— |
|
|
|
— |
|
|
|
|
|
|
|
|
|
|
Unrealized loss on interest rate swap, net of tax |
|
|
— |
|
|
|
— |
|
|
|
— |
|
|
|
— |
|
|
|
— |
|
|
|
— |
|
|
|
( |
) |
|
|
— |
|
|
|
( |
) |
|
Foreign currency translation gain |
|
|
— |
|
|
|
— |
|
|
|
— |
|
|
|
— |
|
|
|
— |
|
|
|
— |
|
|
|
|
|
|
|
— |
|
|
|
|
|
|
Unit vesting and amortization of unit-based compensation |
|
|
|
|
|
|
|
|
|
|
|
|
|
|
|
|
|
|
— |
|
|
|
— |
|
|
|
— |
|
|
|
— |
|
|
|
|
|
|
Distributions to non-controlling interests |
|
|
— |
|
|
|
— |
|
|
|
— |
|
|
|
— |
|
|
|
— |
|
|
|
— |
|
|
|
— |
|
|
|
( |
) |
|
|
( |
) |
|
Proceeds from offering (net of offering costs) |
|
|
|
|
|
|
|
|
|
|
|
|
|
|
|
|
|
|
— |
|
|
|
— |
|
|
|
— |
|
|
|
— |
|
|
|
|
|
|
Distributions declared ($ |
|
|
— |
|
|
|
( |
) |
|
|
— |
|
|
|
( |
) |
|
|
— |
|
|
|
— |
|
|
|
— |
|
|
|
— |
|
|
|
( |
) |
|
Balance at December 31, 2019 |
|
|
|
|
|
$ |
|
|
|
|
|
|
|
$ |
|
|
|
|
|
|
|
$ |
— |
|
|
$ |
( |
) |
|
$ |
|
|
|
$ |
|
|
|
Net income |
|
|
— |
|
|
|
|
|
|
|
— |
|
|
|
|
|
|
|
— |
|
|
|
— |
|
|
|
— |
|
|
|
|
|
|
|
|
|
|
Cumulative effect of change in accounting principles |
|
|
— |
|
|
|
( |
) |
|
|
— |
|
|
|
( |
) |
|
|
— |
|
|
|
— |
|
|
|
— |
|
|
|
— |
|
|
|
( |
) |
|
Unrealized loss on interest rate swap, net of tax |
|
|
— |
|
|
|
— |
|
|
|
— |
|
|
|
— |
|
|
|
— |
|
|
|
— |
|
|
|
( |
) |
|
|
— |
|
|
|
( |
) |
|
Foreign currency translation gain |
|
|
— |
|
|
|
— |
|
|
|
— |
|
|
|
— |
|
|
|
— |
|
|
|
— |
|
|
|
|
|
|
|
— |
|
|
|
|
|
|
Unit vesting and amortization of unit-based compensation |
|
|
|
|
|
|
|
|
|
|
|
|
|
|
|
|
|
|
— |
|
|
|
— |
|
|
|
— |
|
|
|
— |
|
|
|
|
|
|
Sale of non-controlling interests |
|
|
— |
|
|
|
— |
|
|
|
— |
|
|
|
— |
|
|
|
— |
|
|
|
— |
|
|
|
— |
|
|
|
|
|
|
|
|
|
|
Conversion of LTIP units to common units |
|
|
— |
|
|
|
— |
|
|
|
|
|
|
|
— |
|
|
|
( |
) |
|
|
— |
|
|
|
— |
|
|
|
— |
|
|
|
— |
|
|
Redemption of common units |
|
|
— |
|
|
|
— |
|
|
|
( |
) |
|
|
( |
) |
|
|
— |
|
|
|
— |
|
|
|
— |
|
|
|
— |
|
|
|
( |
) |
|
Distributions to non-controlling interests |
|
|
— |
|
|
|
— |
|
|
|
— |
|
|
|
— |
|
|
|
— |
|
|
|
— |
|
|
|
— |
|
|
|
( |
) |
|
|
( |
) |
|
Proceeds from offering (net of offering costs) |
|
|
|
|
|
|
|
|
|
|
|
|
|
|
|
|
|
|
— |
|
|
|
— |
|
|
|
— |
|
|
|
— |
|
|
|
|
|
|
Distributions declared ($ |
|
|
— |
|
|
|
( |
) |
|
|
— |
|
|
|
( |
) |
|
|
— |
|
|
|
— |
|
|
|
— |
|
|
|
— |
|
|
|
( |
) |
|
Balance at December 31, 2020 |
|
|
|
|
|
$ |
|
|
|
|
|
|
|
$ |
|
|
|
|
— |
|
|
$ |
— |
|
|
$ |
( |
) |
|
$ |
|
|
|
$ |
|
|
See accompanying notes to consolidated financial statements.
68
MPT OPERATING PARTNERSHIP, L.P. AND SUBSIDIARIES
Consolidated Statements of Cash Flows
|
|
|
For the Years Ended December 31, |
|
|||||||||
|
|
|
2020 |
|
|
2019 |
|
|
2018 |
|
|||
|
|
|
(Amounts in thousands) |
|
|||||||||
|
Operating activities |
|
|
|
|
|
|
|
|
|
|
|
|
|
Net income |
|
$ |
|
|
|
$ |
|
|
|
$ |
|
|
|
Adjustments to reconcile net income to net cash provided by operating activities: |
|
|
|
|
|
|
|
|
|
|
|
|
|
Depreciation and amortization |
|
|
|
|
|
|
|
|
|
|
|
|
|
Amortization of deferred financing costs and debt discount |
|
|
|
|
|
|
|
|
|
|
|
|
|
Straight-line rent revenue and other |
|
|
( |
) |
|
|
( |
) |
|
|
( |
) |
|
Unit-based compensation |
|
|
|
|
|
|
|
|
|
|
|
|
|
Loss (gain) from sale of real estate |
|
|
|
|
|
|
( |
) |
|
|
( |
) |
|
Impairment charges |
|
|
|
|
|
|
|
|
|
|
|
|
|
Straight-line rent and other write-off |
|
|
|
|
|
|
|
|
|
|
|
|
|
Debt refinancing and unutilized financing costs |
|
|
|
|
|
|
|
|
|
|
— |
|
|
Pre-acquisition rent collected - Circle Transaction |
|
|
( |
) |
|
|
— |
|
|
|
— |
|
|
Other adjustments |
|
|
|
|
|
|
( |
) |
|
|
( |
) |
|
Changes in: |
|
|
|
|
|
|
|
|
|
|
|
|
|
Interest and rent receivables |
|
|
( |
) |
|
|
|
|
|
|
|
|
|
Other assets |
|
|
|
|
|
|
( |
) |
|
|
( |
) |
|
Accounts payable and accrued expenses |
|
|
( |
) |
|
|
|
|
|
|
( |
) |
|
Deferred revenue |
|
|
|
|
|
|
|
|
|
|
|
|
|
Net cash provided by operating activities |
|
|
|
|
|
|
|
|
|
|
|
|
|
Investing activities |
|
|
|
|
|
|
|
|
|
|
|
|
|
Cash paid for acquisitions and other related investments |
|
|
( |
) |
|
|
( |
) |
|
|
( |
) |
|
Net proceeds from sale of real estate |
|
|
|
|
|
|
|
|
|
|
|
|
|
Principal received on loans receivable |
|
|
|
|
|
|
|
|
|
|
|
|
|
Investment in loans receivable |
|
|
( |
) |
|
|
( |
) |
|
|
( |
) |
|
Construction in progress and other |
|
|
( |
) |
|
|
( |
) |
|
|
( |
) |
|
Return of equity investment |
|
|
|
|
|
|
— |
|
|
|
— |
|
|
Capital additions and other investments, net |
|
|
( |
) |
|
|
( |
) |
|
|
( |
) |
|
Net cash (used for) provided by investing activities |
|
|
( |
) |
|
|
( |
) |
|
|
|
|
|
Financing activities |
|
|
|
|
|
|
|
|
|
|
|
|
|
Proceeds from term debt, net of discount |
|
|
|
|
|
|
|
|
|
|
|
|
|
Payments of term debt |
|
|
( |
) |
|
|
— |
|
|
|
— |
|
|
Revolving credit facilities, net |
|
|
|
|
|
|
( |
) |
|
|
( |
) |
|
Distributions paid |
|
|
( |
) |
|
|
( |
) |
|
|
( |
) |
|
Lease deposits and other obligations to tenants |
|
|
|
|
|
|
( |
) |
|
|
( |
) |
|
Proceeds from sale of units, net of offering costs |
|
|
|
|
|
|
|
|
|
|
|
|
|
Payment of debt refinancing, deferred financing costs, and other financing activities |
|
|
( |
) |
|
|
( |
) |
|
|
( |
) |
|
Net cash provided by (used for) financing activities |
|
|
|
|
|
|
|
|
|
|
( |
) |
|
(Decrease) increase in cash, cash equivalents, and restricted cash for the year |
|
|
( |
) |
|
|
|
|
|
|
|
|
|
Effect of exchange rate changes |
|
|
|
|
|
|
( |
) |
|
|
( |
) |
|
Cash, cash equivalents, and restricted cash at beginning of year |
|
|
|
|
|
|
|
|
|
|
|
|
|
Cash, cash equivalents and restricted cash at end of year |
|
$ |
|
|
|
$ |
|
|
|
$ |
|
|
|
Interest paid, including capitalized interest of $ and $ |
|
$ |
|
|
|
$ |
|
|
|
$ |
|
|
|
Supplemental schedule of non-cash financing activities: |
|
|
|
|
|
|
|
|
|
|
|
|
|
Dividends declared, unpaid |
|
$ |
|
|
|
$ |
|
|
|
$ |
|
|
|
Cash, cash equivalents, and restricted cash are comprised of the following: |
|
|
|
|
|
|
|
|
|
|
|
|
|
Beginning of period: |
|
|
|
|
|
|
|
|
|
|
|
|
|
Cash and cash equivalents |
|
$ |
|
|
|
$ |
|
|
|
$ |
|
|
|
Restricted cash, included in Other assets |
|
|
|
|
|
|
|
|
|
|
|
|
|
|
|
$ |
|
|
|
$ |
|
|
|
$ |
|
|
|
End of period: |
|
|
|
|
|
|
|
|
|
|
|
|
|
Cash and cash equivalents |
|
$ |
|
|
|
$ |
|
|
|
$ |
|
|
|
Restricted cash, included in Other assets |
|
|
|
|
|
|
|
|
|
|
|
|
|
|
|
$ |
|
|
|
$ |
|
|
|
$ |
|
|
See accompanying notes to consolidated financial statements.
69
MEDICAL PROPERTIES TRUST, INC. AND SUBSIDIARIES
MPT OPERATING PARTNERSHIP, L.P. AND SUBSIDIARIES
Notes To Consolidated Financial Statements
1. Organization
Medical Properties Trust, Inc., a Maryland corporation, was formed on August 27, 2003, under the Maryland General Corporation Law for the purpose of engaging in the business of investing in, owning, and leasing healthcare real estate. Our operating partnership subsidiary, MPT Operating Partnership, L.P., (the “Operating Partnership”) through which we conduct all of our operations, was formed in September 2003. Through another wholly-owned subsidiary, Medical Properties Trust, LLC, we are the sole general partner of the Operating Partnership. At present, we directly own all of the limited partnership interests in the Operating Partnership and have elected to report our required disclosures and that of the Operating Partnership on a combined basis, except where material differences exist.
We have operated as a real estate investment trust (“REIT”) since April 6, 2004, and accordingly, elected REIT status upon the filing in September 2005 of the calendar year 2004 federal income tax return. Accordingly, we will generally not be subject to United States (“U.S.”) federal income tax, provided that we continue to qualify as a REIT and our distributions to our stockholders equal or exceed our taxable income. Certain non-real estate activities we undertake are conducted by entities which we elected to be treated as taxable REIT subsidiaries (“TRS”). Our TRS entities are subject to both U.S. federal and state income taxes. For our properties located outside the U.S., we are subject to the local taxes of the jurisdictions where our properties reside and/or legal entities are domiciled; however, we do not expect to incur substantial additional taxes in the U.S. from foreign based income as the majority of such income flows through our REIT.
Our primary business strategy is to acquire and develop real estate and improvements, primarily for long-term lease to providers of healthcare services, such as operators of general acute care hospitals, inpatient physical rehabilitation hospitals, long-term acute care hospitals, freestanding ER/urgent care facilities, and behavioral health facilities. We also make mortgage and other loans to operators of similar facilities. In addition, we may obtain profits or equity interests in our tenants, from time-to-time, in order to enhance our overall return.
Our business model facilitates acquisitions and recapitalizations, and allows operators of healthcare facilities to unlock the value of their real estate to fund facility improvements, technology upgrades, and other investments in operations. At December 31, 2020, we have investments in
2. Summary of Significant Accounting Policies
Use of Estimates: The preparation of our consolidated financial statements in conformity with accounting principles generally accepted in the U.S. requires management to make estimates and assumptions that affect the reported amounts of assets and liabilities and disclosure of contingent assets and liabilities at the date of the financial statements and the reported amounts of revenues and expenses during the reporting period. During 2020, the global outbreak of a novel coronavirus, or COVID-19, spread all over the world including countries where we own and lease facilities. The World Health Organization designated COVID-19 as a pandemic, and numerous countries, including the U.S., declared national emergencies with respect to COVID-19. As the global impact of the outbreak evolved, many countries reacted by instituting quarantines and restrictions on travel, closing financial markets and/or restricting trade- including requiring medically necessary elective surgeries at hospitals to be deferred. Although hospitals are back accepting patients and performing medically necessary elective surgeries, many of these trade restrictions are still in place. We believe the estimates and assumptions underlying our consolidated financial statements are reasonable and supportable based on the information available as of December 31, 2020 (particularly as it relates to our assessments of the recoverability of our real estate and the adequacy of our credit loss reserves on loans and financing receivables). However, the ultimate impact to our tenants’ results of operations and liquidity and their ability to pay our rent and interest due to the impact of COVID-19 cannot be predicted with 100% confidence, particularly given the full scope, severity, and duration of the pandemic and the actions needed (including vaccine rollouts worldwide) to contain the pandemic or mitigate its impact is uncertain. This makes any estimates and assumptions as of December 31, 2020 inherently less certain than they would be absent the potential impact of COVID-19. Actual results could differ from those estimates.
Principles of Consolidation: Property holding entities and other subsidiaries of which we own
70
We continually evaluate all of our transactions and investments to determine if they represent variable interests in a variable interest entity. If we determine that we have a variable interest in a variable interest entity, we then evaluate if we are the primary beneficiary of the variable interest entity. The evaluation is a qualitative assessment as to whether we have the ability to direct the activities of a variable interest entity that most significantly impact the entity’s economic performance. We consolidate each variable interest entity in which we, by virtue of or transactions with our investments in the entity, are considered to be the primary beneficiary.
At December 31, 2020, we had loans and/or equity investments in certain variable interest entities approximating $
Investments in Unconsolidated Entities: Investments in entities in which we have the ability to significantly influence (but not control) are accounted for by the equity method, such as our joint venture with Primotop Holdings S.à.r.l. (“Primotop”) as discussed in Note 3. Under the equity method of accounting, our share of the investee’s earnings or losses are included in the “Earnings from equity interests” line of our consolidated statements of net income. Except for our joint venture with Primotop, we have elected to record our share of such investee’s earnings or losses on a lag basis. The initial carrying value of investments in unconsolidated entities is based on the amount paid to purchase the interest in the investee entity. Subsequently, our investments are increased/decreased by our share in the investees’ earnings/losses and decreased by cash distributions from our investees. To the extent that our cost basis is different from the basis reflected at the investee entity level, the basis difference is generally amortized over the lives of the related assets and liabilities, and such amortization is included in our share of equity in earnings of the investee.
We evaluate our equity method investments for impairment based upon a comparison of the fair value of the equity method investment to its carrying value, when impairment indicators exist. If we determine a decline in the fair value of an investment in an unconsolidated investee entity below its carrying value is other-than-temporary, an impairment is recorded.
Investments in entities in which we do not control nor do we have the ability to significantly influence and for which there is no readily determinable fair value (such as our investments in Steward Health Care System LLC (“Steward”) and Median Kliniken S.á.r.l. (“MEDIAN”)) are accounted for at cost, less any impairment, plus or minus changes resulting from observable price changes in orderly transactions involving the investee. Any cash distributions on these types of investments are recorded to income upon receipt. For similar investments but for which there are readily determinable fair values, such investments are measured at fair value, with unrealized gains and losses recorded in income.
Cash and Cash Equivalents: Certificates of deposit, short-term investments with original maturities of three months or less, and money-market mutual funds are considered cash equivalents. The majority of our cash and cash equivalents are held at major commercial banks, which at times may exceed the Federal Deposit Insurance Corporation limit. We have not experienced any losses to-date on our invested cash. Cash and cash equivalents which have been restricted as to its use are recorded in other assets.
Revenue Recognition: Our revenues are primarily from leases and loans. On
Operating Lease Revenue
We receive income from operating leases based on the fixed required rents (base rents) per the lease agreements. Rent revenue from base rents is recorded on the straight-line method over the terms of the related lease agreements for new leases and the remaining terms of existing leases for those acquired as part of a property acquisition. The straight-line method records the periodic average amount of base rents earned over the term of a lease, taking into account contractual rent increases over the lease term. The straight-line method typically has the effect of recording more rent revenue from a lease than a tenant is required to pay early in the term of the lease. During the later parts of a lease term, this effect reverses with less rent revenue recorded than a tenant is required to pay. Rent revenue, as recorded on the straight-line method, in the consolidated statements of net income is presented as two amounts: rent billed and straight-line rent. Rent billed revenue is the amount of base rent actually billed to our tenants each period as required by the lease. Straight-line rent revenue is the difference between rent revenue earned based on the straight-line method and the amount recorded as rent billed revenue. We record the difference between rent revenues earned and amounts due per the respective lease agreements, as applicable, as an increase or decrease to straight-line rent receivables.
71
Rental payments received prior to their recognition as income are classified as deferred revenue.
Financing Lease Revenue
Under the lease accounting rules adopted on January 1, 2019, if an acquisition and subsequent lease of a property to the seller does not meet the definition of a sale, we must account for the transaction as a financing with income recognized using the imputed interest method.
Another type of financing lease that we carried forward from the previous lease accounting guidance is a direct financing lease (“DFL”). For leases accounted for as DFLs, the future minimum lease payments are recorded as a receivable. The difference between the future minimum lease payments and the estimated residual values less the cost of the properties is recorded as unearned income. Unearned income is deferred and amortized to income over the lease terms to provide a constant yield when collectability of the lease payments is reasonably assured. Investments in DFLs are presented net of unearned income.
Other Leasing Revenue
We begin recording base rent income from our development projects when the lessee takes physical possession of the facility, which may be different from the stated start date of the lease. Also, during construction of our development projects, we may be entitled to accrue rent based on the cost paid during the construction period (construction period rent). We accrue construction period rent as a receivable with a corresponding offset to deferred revenue during the construction period. When the lessee takes physical possession of the facility, we begin recognizing the deferred construction period revenue on the straight-line method over the term of the lease.
We also receive additional rent (contingent rent) under some leases based on increases in the consumer price index (“CPI”) (or similar index outside the U.S.) or when CPI exceeds the annual minimum percentage increase as stipulated in the lease. Contingent rents are recorded as rent billed revenue in the period earned.
Starting January 1, 2019 (with the adoption of ASU 2016-02), tenant payments for ground leases along with other operating expenses, such as property taxes and insurance, that are paid directly by us and reimbursed by our tenants are presented on a gross basis with the related revenues recorded in “Interest and other income” and the related expenses in “Property-related” in our consolidated statements of net income. All payments of other operating expenses made directly by the tenant to the applicable government or appropriate third-party vendor are recorded on a net basis, consistent with how all tenant payments or reimbursements pursuant to our “triple-net” leases were accounted for prior to the adoption of ASU 2016-02.
Interest Revenue
We receive interest income from our tenants/borrowers on mortgage loans, working capital loans, and other long-term loans. Interest income from these loans is recognized as earned based upon the principal outstanding and terms of the loans.
Other Revenue
Commitment fees received from lessees for development and leasing services are initially recorded as deferred revenue and recognized as income over the initial term of a lease to produce a constant effective yield on the lease (interest method). Commitment and origination fees from lending services are also recorded as deferred revenue initially and recognized as income over the life of the loan using the interest method.
Acquired Real Estate Purchase Price Allocation: We account for acquisitions of real estate under asset acquisition accounting rules. Under this accounting standard, we allocate the purchase price (including any third-party transaction costs directly related to the acquisition) of acquired properties to tangible and identified intangible assets acquired and liabilities assumed (if any) based on their fair values. In making estimates of fair values for purposes of allocating purchase prices of acquired real estate, we may utilize a number of sources, from time-to-time, including available real estate broker data, independent appraisals that may be obtained in connection with the acquisition, internal data from previous acquisitions or developments, and other market data, including market comparables for significant assumptions such as market rental, capitalization, and discount rates. We also consider information obtained about each property as a result of our pre-acquisition due diligence, marketing, and leasing activities in estimating the fair value of the tangible and intangible assets acquired.
We measure the aggregate value of lease intangible assets acquired based on the difference between (i) the property valued with new or in-place leases adjusted to market rental rates and (ii) the property valued as if vacant. Management’s estimates of value are made using methods similar to those used by independent appraisers (e.g., discounted cash flow analysis). Factors considered by management in our analysis include an estimate of carrying costs during hypothetical expected lease-up periods, considering current market conditions, and costs to execute similar leases. We also consider information obtained about each targeted facility as a result of
72
our pre-acquisition due diligence, marketing, and leasing activities in estimating the fair value of the intangible assets acquired. In estimating carrying costs, management includes real estate taxes, insurance, and other operating expenses and estimates of lost rentals at market rates during the expected lease-up periods, which we expect to be about
Other intangible assets acquired may include customer relationship intangible values which are based on management’s evaluation of the specific characteristics of each prospective tenant’s lease and our overall relationship with that tenant. Characteristics to be considered by management in allocating these values include the nature and extent of our existing business relationships with the tenant, growth prospects for developing new business with the tenant, the tenant’s credit quality, and expectations of lease renewals, including those existing under the terms of the lease agreement, among other factors.
We amortize the value of our lease intangible assets to expense over the term of the respective leases. If a lease is terminated early, the unamortized portion of the lease intangibles are charged to expense.
We record above-market and below-market in-place lease values, if any, for our facilities, which are based on the present value of the difference between (i) the contractual amounts to be paid pursuant to the in-place leases and (ii) management’s estimate of fair market lease rates for the corresponding in-place leases, measured over a period equal to the remaining non-cancelable term of the lease. We amortize any resulting capitalized above-market lease values as a reduction of rental income over the lease term. We amortize any resulting capitalized below-market lease values as an increase to rental income over the lease term. If a lease is terminated early, the unamortized portion of the capitalized above/below market lease value is recognized in rental income at that time.
Real Estate and Depreciation: Real estate, consisting of land, buildings and improvements, are maintained at cost. Although typically paid by our tenants, any expenditure for ordinary maintenance and repairs that we pay are expensed to operations as incurred. Significant renovations and improvements which improve and/or extend the useful life of the asset are capitalized and depreciated over their estimated useful lives. We record impairment losses on long-lived assets used in operations when events and circumstances indicate that the assets might be impaired and the undiscounted cash flows estimated to be generated by those assets, including an estimated liquidation amount, during the expected holding periods are less than the carrying amounts of those assets. Impairment losses are measured as the difference between carrying value and fair value of the assets. For assets held for sale, we cease recording depreciation expense and adjust the assets’ value to the lower of its carrying value or fair value, less cost of disposal. Fair value is based on estimated cash flows discounted at a risk-adjusted rate of interest. We classify real estate assets as held for sale when we have commenced an active program to sell the assets, and in the opinion of management, it is probable the asset will be sold within the next 12 months.
Construction in progress includes the cost of land, the cost of construction of buildings, improvements, and fixed equipment, and costs for design and engineering. Other costs, such as interest, legal, property taxes, and corporate project supervision, which can be directly associated with the project during construction, are also included in construction in progress. We commence capitalization of costs associated with a development project when the development of the future asset is probable and activities necessary to get the underlying property ready for its intended use have been initiated. We stop the capitalization of costs when the property is substantially complete and ready for its intended use.
Depreciation is calculated on the straight-line method over the estimated useful lives of the related real estate and other assets. Our weighted-average useful lives at December 31, 2020 are as follows:
|
Buildings and improvements |
|
|
|
Lease intangibles |
|
|
|
Leasehold improvements |
|
|
|
Furniture, equipment, and other |
|
|
Credit Losses:
Losses from Rent Receivables: For all leases, we continuously monitor the performance of our existing tenants including, but not limited to: admission levels and surgery/procedure volumes by type; current operating margins; ratio of our tenants’ operating margins both to facility rent and to facility rent plus other fixed costs; trends in cash collections; trends in revenue and patient mix; and the effect of evolving healthcare regulations, adverse economic and political conditions, and other events ongoing (such as the recent health crisis caused by the COVID-19 pandemic) on tenants’ profitability and liquidity.
Losses from Operating Lease Receivables: We utilize the information above along with the tenant’s payment and default history in evaluating (on a property-by-property basis) whether or not a provision for losses on outstanding billed rent
73
and/or straight-line rent receivables is needed. A provision for losses on rent receivables (including straight-line rent receivables) is ultimately recorded when it becomes probable that the receivable will not be collected in full. The provision is an amount which reduces the receivable to its estimated net realizable value based on a determination of the eventual amounts to be collected either from the debtor or from existing collateral, if any.
Losses on Financing Lease Receivables: Upon the adoption of ASU No. 2016-13 “Measurement of Credit Losses on Financial Instruments" ("ASU 2016-13") on
With the adoption of ASU 2016-13, we made the accounting policy election to exclude interest receivables from the credit loss reserve analysis. Such receivables are impaired and an allowance recorded when it is deemed probable that we will be unable to collect all amounts due. Like operating lease receivables, the need for an allowance is based upon our assessment of the lessee’s overall financial condition, economic resources and payment record, the prospects for support from any financially responsible guarantors, and, if appropriate, the realizable value of any collateral. Financing leases are placed on non-accrual status when we determine that the collectability of contractual amounts is not reasonably assured. If on non-accrual status, we generally account for the financing lease on a cash basis, in which income is recognized only upon receipt of cash.
Loans: Loans consist of mortgage loans, working capital loans, and other loans. Mortgage loans are collateralized by interests in real property. Working capital and other loans are generally collateralized by interests in receivables and corporate and individual guarantees. We record loans at cost. Like our financing lease receivables, we are using ASU 2016-13 to establish credit loss reserves on all outstanding loans based on historical credit losses on similar instruments. Such credit loss reserves, including the underlying assumptions, are reviewed and adjusted quarterly. If a loan’s performance worsens and foreclosure is deemed probable for our collateral-based loans (after considering the borrower’s overall financial condition as described above for leases), we will adjust the allowance for expected credit losses based on the current fair value of such collateral at the time the loan is deemed uncollectible. If the loan is not collateralized, the loan will be written-off once it is determined that such loan is no longer collectible. Interest receivables on loans are excluded from ASU 2016-13 and we assess their collectability similar to how we assess collectability for interest receivables on financing leases described above.
Upon adoption of ASU 2016-13, we recorded a credit loss reserve of $
Earnings Per Share/Units: Basic earnings per common share/unit is computed by dividing net income by the weighted-average number of shares/units outstanding during the period. Diluted earnings per common share/unit is calculated by including the effect of dilutive securities.
Our unvested restricted stock awards contain non-forfeitable rights to dividends, and accordingly, these awards are deemed to be participating securities. These participating securities are included in the earnings allocation in computing both basic and diluted earnings per common share/unit.
Income Taxes: We conduct our business as a REIT under Sections 856 through 860 of the Internal Revenue Code of 1986, as amended (“the Code”). To qualify as a REIT, we must meet certain organizational and operational requirements, including a requirement to distribute to stockholders at least
Our financial statements include the operations of a TRS, MPT Development Services, Inc. (“MDS”), and with many other entities, which are single member LLCs that are disregarded for tax purposes and are reflected in the tax returns of MDS. MDS is not
74
entitled to a dividends paid deduction and is subject to U.S. federal, state, and local income taxes. MDS is authorized to provide property development, leasing, and management services for third-party owned properties, and we will make non-mortgage loans to and/or investments in our lessees through this entity.
With the property acquisitions and investments in Europe, Australia, and South America, we are subject to income taxes internationally. However, we do not expect to incur any additional income taxes in the U.S. as such income from our international properties flows through our REIT income tax returns. For our TRS and international subsidiaries, we determine deferred tax assets and liabilities based on the differences between the financial reporting and tax bases of assets and liabilities using enacted tax rates in effect for the year in which the differences are expected to reverse. Any increase or decrease in our deferred tax assets/liabilities that results from a change in circumstances and that causes us to change our judgment about expected future tax consequences of events, is reflected in our tax provision when such changes occur. Deferred income taxes also reflect the impact of operating loss carryforwards. A valuation allowance is provided if we believe it is more likely than not that all or some portion of our deferred tax assets will not be realized. Any increase or decrease in the valuation allowance that results from a change in circumstances, and that causes us to change our judgment about our ability to realize the related deferred tax asset, is reflected in our tax provision when such changes occur.
The calculation of our income taxes involves dealing with uncertainties in the application of complex tax laws and regulations in a multitude of jurisdictions across our global operations. An income tax benefit from an uncertain tax position may be recognized when it is more likely than not that the position will be sustained upon examination, including resolutions of any related appeals or litigation processes, on the basis of technical merits. However, if a more likely than not position cannot be reached, we record a liability as an offset to the tax benefit and adjust the liabilities when our judgment changes as a result of the evaluation of new information not previously available. Because of the complexity of some of these uncertainties, the ultimate resolution may result in a payment that is materially different from our current estimate of the uncertain tax position liabilities. These differences will be reflected as increases or decreases to income tax expense in the period in which new information is available.
Stock-Based Compensation: We adopted the 2019 Equity Incentive Plan (the “Equity Incentive Plan”) during the second quarter of 2019. Awards of restricted stock and other equity-based awards with service conditions are valued at the average stock price per share on the date of grant and are amortized to compensation expense over the service periods (typically
Deferred Costs: Costs incurred that directly relate to the offerings of stock are deferred and netted against proceeds received from the offering. Leasing commissions and other leasing costs that would not have been incurred if the lease was not obtained are capitalized as deferred leasing costs and amortized on the straight-line method over the terms of the related lease agreements. Costs identifiable with loans made to borrowers are capitalized and recognized as a reduction in interest income over the life of the loan.
Deferred Financing Costs: We generally capitalize financing costs incurred in connection with new financings and refinancings of debt. These costs are amortized over the lives of the related debt as an addition to interest expense. For debt with defined principal re-payment terms, the deferred costs are amortized to produce a constant effective yield on the debt (interest method) and are included within “Debt, net” on our consolidated balance sheets. For debt without defined principal repayment terms, such as our revolving credit facility, the deferred costs are amortized on the straight-line method over the term of the debt and are included as a component of “Other assets” on our consolidated balance sheets.
Foreign Currency Translation and Transactions: Certain of our international subsidiaries’ functional currencies are the local currencies of their respective countries. We translate the results of operations of our foreign subsidiaries into U.S. dollars using average rates of exchange in effect during the period, and we translate balance sheet accounts using exchange rates in effect at the end of the period. We record resulting currency translation adjustments in “Accumulated other comprehensive income (loss)”, a component of stockholders’ equity on our consolidated balance sheets.
Certain of our U.S. subsidiaries will enter into short-term and long-term transactions denominated in a foreign currency from time-to-time. Gains or losses resulting from these foreign currency transactions are revalued into U.S. dollars at the rates of exchange prevailing at the dates of the transactions. The effects of revaluation gains or losses on our short-term transactions are included in other income in the consolidated statements of income, while the revaluation effects on our long-term investments are recorded in “Accumulated other comprehensive income (loss)” on our consolidated balance sheets.
Derivative Financial Investments and Hedging Activities: During our normal course of business, we may use certain types of derivative instruments for the purpose of managing interest rate and/or foreign currency risk. We record our derivative and hedging instruments at fair value on the balance sheet. Changes in the estimated fair value of derivative instruments that are not designated as
75
hedges or that do not meet the criteria for hedge accounting are recognized in earnings. For derivatives designated as cash flow hedges, the change in the estimated fair value of the effective portion of the derivative is recognized in “Accumulated other comprehensive income (loss)” on our consolidated balance sheets, whereas the change in the estimated fair value of the ineffective portion is recognized in earnings. For derivatives designated as fair value hedges, the change in the estimated fair value of the effective portion of the derivatives offsets the change in the estimated fair value of the hedged item, whereas the change in the estimated fair value of the ineffective portion is recognized in earnings.
To qualify for hedge accounting, we formally document all relationships between hedging instruments and hedged items, as well as our risk management objective and strategy for undertaking the hedge prior to entering into a derivative transaction. This process includes specific identification of the hedging instrument and the hedge transaction, the nature of the risk being hedged and how the hedging instrument’s effectiveness in hedging the exposure to the hedged transaction’s variability in cash flows attributable to the hedged risk will be assessed. Both at the inception of the hedge and on an ongoing basis, we assess whether the derivatives that are used in hedging transactions are highly effective in offsetting changes in cash flows or fair values of hedged items. In addition, for cash flow hedges, we assess whether the underlying forecasted transaction will occur. We discontinue hedge accounting if a derivative is not determined to be highly effective as a hedge or that it is probable that the underlying forecasted transaction will not occur.
Fair Value Measurement: We measure and disclose the estimated fair value of financial assets and liabilities utilizing a hierarchy of valuation techniques based on whether the inputs to a fair value measurement are considered to be observable or unobservable in a marketplace. Observable inputs reflect market data obtained from independent sources, while unobservable inputs reflect our market assumptions. This hierarchy requires the use of observable market data when available. These inputs have created the following fair value hierarchy:
|
|
• |
Level 1 — quoted prices for identical instruments in active markets; |
|
|
• |
Level 2 — quoted prices for similar instruments in active markets; quoted prices for identical or similar instruments in markets that are not active; and model-derived valuations in which significant inputs and significant value drivers are observable in active markets; and |
|
|
• |
Level 3 — fair value measurements derived from valuation techniques in which one or more significant inputs or significant value drivers are unobservable. |
We measure fair value using a set of standardized procedures that are outlined herein for all assets and liabilities which are required to be measured at their estimated fair value on either a recurring or non-recurring basis. When available, we utilize quoted market prices from an independent third party source to determine fair value and classify such items in Level 1. In some instances where a market price is available, but the instrument is in an inactive or over-the-counter market, we apply the dealer (market maker) pricing estimate and classify the asset or liability in Level 2.
If quoted market prices or inputs are not available, fair value measurements are based upon valuation models that utilize current market or independently sourced market inputs, such as interest rates, option volatilities, credit spreads, market capitalization rates, etc. Items valued using such internally-generated valuation techniques are classified according to the lowest level input that is significant to the fair value measurement. As a result, the asset or liability could be classified in either Level 2 or 3 even though there may be some significant inputs that are readily observable. Internal fair value models and techniques that have been used by us include discounted cash flow and Monte Carlo valuation models. We also consider counterparty’s and our own credit risk on derivatives and other liabilities measured at their estimated fair value.
Fair Value Option Election: For our equity investment in the new international joint venture along with any related investments such as loans (see Note 3 for more details), we have elected to account for these investments at fair value due to the size of the investments and because we believe this method is more reflective of current values. We have not made a similar election for other investments that existed at December 31, 2020.
Leases (Lessee)
Pursuant to ASU 2016-02, we are required to apply a dual approach, classifying leases as either financing or operating leases based on the principle of whether or not the lease is effectively a financed purchase by the lessee. This classification determines whether lease expense is recognized based on an effective interest method (for finance leases) or on a straight-line basis (for operating leases) over the term of the lease. Starting January 1, 2019, we began recording a right-of-use asset and a lease liability for all material leases with a term greater than 12 months regardless of their classification. Leases with a term of 12 months or less are off balance sheet with lease expense recognized on a straight-line basis over the lease term, similar to previous guidance for operating leases.
Reclassifications: Certain amounts in the consolidated financial statements for prior periods have been reclassified to conform to the current period presentation.
76
Recent Accounting Developments
Reference Rate Reform
In March 2020, the Financial Accounting Standards Board (“FASB”) issued ASU No. 2020-04, “Reference Rate Reform (Topic 848): Facilitation of the Effects of Reference Rate Reform on Financial Reporting” (“ASU 2020-04”) to simplify the accounting for contract modifications made to replace LIBOR or other reference rates that are expected to be discontinued because of reference rate reform. The guidance provides optional expedients and exceptions for applying U.S. GAAP to contracts, hedging relationships, and other transactions affected by reference rate reform if certain criterion are met. The optional expedients and exceptions can be applied to contract modifications made until December 31, 2022. On January 7, 2021, the FASB issued ASU No. 2021-01, “Reference Rate Reform (Topic 848)” (“ASU 2021-01”), which clarifies that certain optional expedients and exceptions in Topic 848 for contract modifications and hedge accounting apply to derivatives that are affected by the discounting transition. The amendments in ASU 2021-01 are elective and apply to our debt and derivative instruments that may be modified as a result of reference rate reform. We are continuing to evaluate these standards, as well as the timing of the transition of various rates in our debt and derivative instruments affected by reference rate reform.
3. Real Estate Activities
New Investments
For the years ended December 31, 2020, 2019, and 2018, we acquired or invested in the following net assets (in thousands):
|
|
|
2020 |
|
|
2019 |
|
|
2018 |
|
|||
|
|
|
|
|
|
|
|
|
|
|
|
|
|
|
Land and land improvements |
|
$ |
|
|
|
$ |
|
|
|
$ |
|
|
|
Buildings |
|
|
|
|
|
|
|
|
|
|
|
|
|
Intangible lease assets — subject to amortization (weighted-average useful life of |
|
|
|
|
|
|
|
|
|
|
|
|
|
Investment in financing leases |
|
|
|
|
|
|
|
|
|
|
— |
|
|
Equity investments |
|
|
|
|
|
|
|
|
|
|
|
|
|
Mortgage loans |
|
|
|
|
|
|
|
|
|
|
— |
|
|
Other loans and assets |
|
|
|
|
|
|
|
|
|
|
|
|
|
Liabilities assumed |
|
|
( |
) |
|
|
( |
) |
|
|
— |
|
|
Total assets acquired |
|
$ |
|
|
|
$ |
|
|
|
$ |
|
|
|
Loans repaid(1) |
|
|
( |
) |
|
|
— |
|
|
|
( |
) |
|
Total net assets acquired |
|
$ |
|
|
|
$ |
|
|
|
$ |
|
|
|
|
(1) |
|
2020 Activity
Circle Transaction
On January 8, 2020, we acquired a portfolio of
77
Other Transactions
On December 31, 2020, we acquired an inpatient rehabilitation hospital in South Carolina for approximately $
On December 29, 2020, we increased our equity ownership and related investment in Infracore SA (“Infracore”) by investing an additional CHF
On November 17, 2020, we invested in the real estate of
On August 13, 2020, we acquired a general acute care hospital in Lynwood, California for a total investment of approximately $
On July 8, 2020, we acquired the fee simple real estate of
On June 24, 2020, we originated a CHF
On May 13, 2020, we formed a joint venture for the purpose of investing in the operations of international hospitals. As part of the formation, we originated a $
Other acquisitions in 2020 included
2019 Activity
LifePoint Acquisition
On December 17, 2019, we acquired a portfolio of
Prospect Transaction
On August 23, 2019, we invested in a portfolio of
78
The agreements provide for the potential for a future purchase price adjustment of up to an additional $
Ramsay Acquisition
On August 16, 2019, we acquired freehold interests in
Australia Transaction
On June 6, 2019, we acquired
Switzerland Transactions
On May 27, 2019, we invested in a portfolio of
Other Transactions
On December 3, 2019, we invested in
On November 28, 2019, we acquired an acute care hospital in Portugal for approximately €
On August 30, 2019, we invested in a portfolio of facilities throughout various states for approximately $
On June 10, 2019, we acquired
Other acquisitions during 2019 included
2018 Activity
Joint Venture Transaction
On August 31, 2018, we completed a joint venture arrangement with Primotop pursuant to which we contributed
79
Other Transactions
On August 31, 2018, we acquired an acute care facility in Pasco, Washington for $
On August 28, 2018, we acquired
During 2018, we acquired the fee simple real estate of
Development Activities
2020 Activity
On November 23, 2020, we agreed to finance the development of and lease an inpatient rehabilitation facility in Stockton, California for $
On May 15, 2020, we agreed to finance the development of and lease an inpatient rehabilitation facility in Bakersfield, California for $
During the 2020 second quarter, we completed construction on
During the 2020 first quarter, we completed construction and began recording rental income on a general acute care facility located in Idaho Falls, Idaho. This facility commenced rent on January 21, 2020 and is leased to Surgery Partners, Inc. pursuant to an existing long-term lease.
2019 Activity
On October 25, 2019, we entered into an agreement to finance the development of and lease a behavioral hospital in Houston, Texas, for $
2018 Activity
During the year ended December 31, 2018, we completed the construction of Ernest Flagstaff. This $
See table below for a status summary of our current development projects (in thousands):
|
Property |
|
Commitment |
|
|
Costs Incurred as of December 31, 2020 |
|
|
Estimated Rent Commencement Date |
||
|
Ernest (Bakersfield, California) |
|
$ |
|
|
|
$ |
|
|
|
|
|
Ernest (Stockton, California) |
|
|
|
|
|
|
|
|
|
|
|
|
|
$ |
|
|
|
$ |
|
|
|
|
80
Disposals
2020 Activity
During 2020, we completed the sale of
2019 Activity
During 2019, we completed the sale of
2018 Activity
On October 4, 2018, we finalized a recapitalization agreement in which we sold our investment in the operations of Ernest and were repaid for our outstanding acquisition loans, working capital loans, and any unpaid interest. Total proceeds received from this transaction approximated $
On August 31, 2018, we completed the previously described joint venture arrangement with Primotop, in which we contributed the real estate of
On August 31, 2018, we sold general acute care hospital located in Houston, Texas that was leased and operated by North Cypress for $
On June 4, 2018, we sold
On March 1, 2018, we sold the real estate of St. Joseph Medical Center in Houston, Texas, for approximately $
Summary of Operations for Disposed Assets in 2018
The following represents the operating results (excluding the St. Joseph sale in March 2018) of the properties sold in 2018 for the periods presented (in thousands):
|
|
|
For the Year Ended |
|
|
|
|
|
2018 |
|
|
|
Revenues |
|
$ |
|
|
|
Real estate depreciation and amortization |
|
|
( |
) |
|
Property-related expenses |
|
|
( |
) |
|
Other(1) |
|
|
|
|
|
Income from real estate dispositions, net |
|
$ |
|
|
|
|
(1) |
|
Intangible Assets
At December 31, 2020 and 2019, our intangible lease assets were $
81
We recorded amortization expense related to intangible lease assets of $
|
For the Year Ended December 31: |
|
|
|
|
|
2021 |
|
$ |
|
|
|
2022 |
|
|
|
|
|
2023 |
|
|
|
|
|
2024 |
|
|
|
|
|
2025 |
|
|
|
|
As of December 31, 2020, capitalized lease intangibles have a weighted-average remaining life of
Leasing Operations (Lessor)
We acquire and develop healthcare facilities and lease the facilities to healthcare operating companies under long-term net leases (typical initial fixed terms of
The following table summarizes total future minimum lease payments to be received, excluding operating expense reimbursements, from tenants under noncancelable leases as of December 31, 2020 (amounts in thousands):
|
|
|
Total Under Operating Leases |
|
|
Total Under Financing Leases |
|
|
Total |
|
|||
|
2021 |
|
$ |
|
|
|
$ |
|
|
|
$ |
|
|
|
2022 |
|
|
|
|
|
|
|
|
|
|
|
|
|
2023 |
|
|
|
|
|
|
|
|
|
|
|
|
|
2024 |
|
|
|
|
|
|
|
|
|
|
|
|
|
2025 |
|
|
|
|
|
|
|
|
|
|
|
|
|
Thereafter |
|
|
|
|
|
|
|
|
|
|
|
|
|
|
|
$ |
|
|
|
$ |
|
|
|
$ |
|
|
At December 31, 2020, leases on
|
|
|
As of December 31, 2020 |
|
|
As of December 31, 2019 |
|
||
|
Minimum lease payments receivable |
|
$ |
|
|
|
$ |
|
|
|
Estimated residual values |
|
|
|
|
|
|
|
|
|
Less: Unearned income and allowance for credit loss |
|
|
( |
) |
|
|
( |
) |
|
Net investment in direct financing leases |
|
|
|
|
|
|
|
|
|
Other financing leases (net of allowance for credit loss) |
|
|
|
|
|
|
|
|
|
Total investment in financing leases |
|
$ |
|
|
|
$ |
|
|
Rent Deferrals
Due to the COVID-19 pandemic and its impact on our tenants’ business during 2020, we agreed to defer collection on less than
82
Adeptus Health
As discussed in previous filings, our original real estate portfolio of approximately
Alecto Facilities
As noted in previous filings, we originally leased
Other Leasing Activity
On July 24, 2020, we re-leased our
Loans
The following is a summary of our loans (net of allowance for credit loss in 2020) ($ amounts in thousands):
|
|
|
As of December 31, 2020 |
|
|
As of December 31, 2019 |
|
||||||||||
|
|
|
Balance |
|
|
Weighted-Average Interest Rate |
|
|
Balance |
|
|
Weighted-Average Interest Rate |
|
||||
|
Mortgage loans |
|
$ |
|
|
|
|
|
% |
|
$ |
|
|
|
|
|
% |
|
Acquisition loans |
|
|
|
|
|
|
|
% |
|
|
|
|
|
|
|
% |
|
Other loans |
|
|
|
|
|
|
|
% |
|
|
|
|
|
|
|
% |
|
|
|
$ |
|
|
|
|
|
|
|
$ |
|
|
|
|
|
|
Our mortgage loans at December 31, 2020 cover
The increase in acquisition loans primarily relates to the $
Other loans consist of loans to our tenants for working capital and other purposes and include our shareholder loan made to the joint venture with Primotop on August 31, 2018 (as more fully described above in this Note 3) in the amount of €
83
Concentration of Credit Risks
We monitor concentration risk in several ways due to the nature of our real estate assets that are vital to the communities in which they are located and given our history of being able to replace inefficient operators of our facilities, if needed, with more effective operators:
|
|
1) |
Facility concentration – We had |
|
|
2) |
Operator concentration – For the year ended December 31, 2020, revenue from Steward, Circle, and Prospect represented |
|
|
3) |
Geographic concentration – At December 31, 2020, investments in the U.S, Europe, Australia, and South America represented approximately |
|
|
4) |
Facility type concentration – For the year ended December 31, 2020, approximately |
Related Party Transactions
Lease and interest revenue earned from tenants and real estate joint ventures in which we had an equity interest (accounted for under either the equity or fair value option methods) during the year were $
See subsections “New Investments” and “Disposals” in this Note 3 as it relates to our investments in the new international, Primotop, and Infracore ventures and the Ernest recapitalization for other related party transactions during 2020, 2019, and 2018.
4. Debt
The following is a summary of debt (dollar amounts in thousands):
|
|
|
As of December 31, 2020 |
|
|
As of December 31, 2019 |
|
||
|
Revolving credit facility(A) |
|
$ |
|
|
|
$ |
— |
|
|
Term loan |
|
|
|
|
|
|
|
|
|
British pound sterling term loan(B) |
|
|
|
|
|
|
— |
|
|
Australian term loan facility(B) |
|
|
|
|
|
|
|
|
|
|
|
|
|
|
|
|
|
|
|
|
|
|
|
|
|
|
|
|
|
|
|
|
— |
|
|
|
|
|
|
|
|
|
— |
|
|
|
|
|
|
|
|
|
|
|
|
|
|
|
|
|
|
|
|
|
|
|
|
|
|
|
|
|
|
|
|
|
|
|
|
|
|
|
|
|
|
|
|
|
|
|
|
|
|
|
|
|
|
|
|
|
|
|
|
|
|
|
— |
|
|
|
|
$ |
|
|
|
$ |
|
|
|
Debt issue costs and discount, net |
|
|
( |
) |
|
|
( |
) |
|
|
|
$ |
|
|
|
$ |
|
|
|
(A) |
|
|
(B) |
|
84
As of December 31, 2020, principal payments due on our debt (which exclude the effects of any discounts, premiums, or debt issue costs recorded) are as follows ($ amounts in thousands):
|
2021 |
|
$ |
|
|
|
2022 |
|
|
|
|
|
2023 |
|
|
|
|
|
2024 |
|
|
|
|
|
2025 |
|
|
|
|
|
Thereafter |
|
|
|
|
|
Total |
|
$ |
|
|
Credit Facility
Our current unsecured credit facility (“Credit Facility”) includes a $
At our election, loans under the Credit Facility could be made as either ABR Loans or Eurodollar Loans. The applicable margin for term loans that are ABR Loans was adjustable on a sliding scale from
At December 31, 2020, we had $
At December 31, 2020 and 2019, the interest rate in effect on our term loan was
Our Credit Facility was amended in January 2021 – see Note 13 for details of this amendment.
Non-U.S. Term Loans
British Pound Sterling Term Loan
On January 6, 2020, we entered into a £
Australian Term Loan
On May 23, 2019, we entered into an A$
At December 31, 2020 and 2019, we had a derivative liability of approximately $
Senior Unsecured Notes
The following are the basic terms of our senior unsecured notes. Typically, we may redeem some or all of the notes at any time, but may require a redemption premium that will decrease over time. In the event of a change of control, each holder of the notes may
85
require us to repurchase some or all of our notes at a repurchase price equal to
4.000% Senior Unsecured Notes due 2022
On August 19, 2015, we completed a €
2.550% Senior Unsecured Notes due 2023
On December 5, 2019, we completed a £
5.500% Senior Unsecured Notes due 2024
On April 17, 2014, we completed a $
6.375% Senior Unsecured Notes due 2024
On February 22, 2016, we completed a $
3.325% Senior Unsecured Notes due 2025
On March 24, 2017, we completed a €
5.250% Senior Unsecured Notes due 2026
On July 22, 2016, we completed a $
5.000% Senior Unsecured Notes due 2027
On September 7, 2017, we completed a $
3.692% Senior Unsecured Notes due 2028
On December 5, 2019, we completed a £
4.625% Senior Unsecured Notes due 2029
On July 26, 2019, we completed a $
3.500% Senior Unsecured Notes due 2031
On December 4, 2020, we completed a $
Other Activity
In preparation of the joint venture with Primotop described under “2018 Activity” in Note 3, we issued secured debt on August 3, 2018, resulting in gross proceeds of €
86
Debt Refinancing and Unutilized Financing Costs
2020
With proceeds from our $
2019
On July 10, 2019, we received a commitment to provide a senior unsecured bridge loan facility to fund our investment in Prospect. With this commitment, we paid approximately $
In anticipation of funding our Australian acquisition in June 2019 and the Circle transaction in January 2020, we entered into term loans on the date these deals were signed that had a delayed draw feature. This feature allowed for us to not draw on the term loans until needed to fund these transactions. However, with this type of structure, we incurred approximately $
Covenants
Our debt facilities impose certain restrictions on us, including restrictions on our ability to: incur debts; create or incur liens; provide guarantees in respect of obligations of any other entity; make redemptions and repurchases of our capital stock; prepay, redeem, or repurchase debt; engage in mergers or consolidations; enter into affiliated transactions; dispose of real estate or other assets; and change our business. In addition, the credit agreements governing our Credit Facility limit the amount of dividends we can pay as a percentage of normalized adjusted funds from operations (“NAFFO”), as defined in the agreements, on a rolling four quarter basis. Through 2020, the dividend restriction was
In addition to these restrictions, the Credit Facility contains customary financial and operating covenants, including covenants relating to our total leverage ratio, fixed charge coverage ratio, secured leverage ratio, consolidated adjusted net worth, unsecured leverage ratio, and unsecured interest coverage ratio. The Credit Facility also contains customary events of default, including among others, nonpayment of principal or interest, material inaccuracy of representations, and failure to comply with our covenants. If an event of default occurs and is continuing under the Credit Facility, the entire outstanding balance may become immediately due and payable. At December 31, 2020, we were in compliance with all such financial and operating covenants.
5. Income Taxes
Medical Properties Trust, Inc.
We have maintained and intend to maintain our election as a REIT under the Code. To qualify as a REIT, we must meet a number of organizational and operational requirements, including a requirement to distribute at least
87
From our TRS and our foreign operations, income tax benefit (expense) were as follows (in thousands):
|
|
|
For the Years Ended December 31, |
|
|||||||||
|
|
|
2020 |
|
|
2019 |
|
|
2018 |
|
|||
|
Current income tax benefit (expense): |
|
|
|
|
|
|
|
|
|
|
|
|
|
Domestic |
|
$ |
|
|
|
$ |
|
|
|
$ |
|
|
|
Foreign |
|
|
( |
) |
|
|
( |
) |
|
|
( |
) |
|
|
|
|
( |
) |
|
|
( |
) |
|
|
( |
) |
|
Deferred income tax benefit (expense): |
|
|
|
|
|
|
|
|
|
|
|
|
|
Domestic |
|
|
( |
) |
|
|
|
|
|
|
|
|
|
Foreign |
|
|
( |
) |
|
|
( |
) |
|
|
( |
) |
|
|
|
|
( |
) |
|
|
|
|
|
|
|
|
|
Income tax benefit (expense) |
|
$ |
( |
) |
|
$ |
|
|
|
$ |
( |
) |
A reconciliation of income tax benefit (expense) from the statutory income tax rate to the effective tax rate based on income before income taxes for the years ended December 31, 2020, 2019, and 2018 is as follows (in thousands):
|
|
|
For the Years Ended December 31, |
|
|||||||||
|
|
|
2020 |
|
|
2019 |
|
|
2018 |
|
|||
|
Income before income tax |
|
$ |
|
|
|
$ |
|
|
|
$ |
|
|
|
Income tax at the U.S. statutory federal rate ( 2020, 2019 and 2018) |
|
|
( |
) |
|
|
( |
) |
|
|
( |
) |
|
Decrease (increase) in income tax resulting from: |
|
|
|
|
|
|
|
|
|
|
|
|
|
Foreign rate differential |
|
|
|
|
|
|
|
|
|
|
|
|
|
State income taxes, net of federal benefit |
|
|
|
|
|
|
|
|
|
|
( |
) |
|
U.S. earnings not subject to federal income tax |
|
|
|
|
|
|
|
|
|
|
|
|
|
Equity investments |
|
|
|
|
|
|
|
|
|
|
|
|
|
Change in valuation allowance |
|
|
( |
) |
|
|
( |
) |
|
|
|
|
|
Statutory tax rate change |
|
|
( |
) |
|
|
— |
|
|
|
— |
|
|
Other items, net |
|
|
( |
) |
|
|
|
|
|
|
( |
) |
|
Total income tax benefit (expense) |
|
$ |
( |
) |
|
$ |
|
|
|
$ |
( |
) |
The foreign provision for income taxes is based on foreign profit before income taxes of $
The domestic provision for income taxes is based on income before income taxes of $
At December 31, 2020 and 2019, components of our deferred tax assets and liabilities were as follows (in thousands):
|
|
|
2020 |
|
|
2019 |
|
||
|
Deferred tax assets: |
|
|
|
|
|
|
|
|
|
Operating loss and interest deduction carry forwards |
|
$ |
|
|
|
$ |
|
|
|
Interest rate swap |
|
|
|
|
|
|
|
|
|
Other |
|
|
|
|
|
|
|
|
|
Total deferred tax assets |
|
|
|
|
|
|
|
|
|
Valuation allowance |
|
|
( |
) |
|
|
( |
) |
|
Total net deferred tax assets |
|
$ |
|
|
|
$ |
|
|
|
Deferred tax liabilities: |
|
|
|
|
|
|
|
|
|
Property and equipment |
|
$ |
( |
) |
|
$ |
( |
) |
|
Net unbilled revenue |
|
|
( |
) |
|
|
( |
) |
|
Other |
|
|
( |
) |
|
|
( |
) |
|
Total deferred tax liabilities |
|
|
( |
) |
|
|
( |
) |
|
Net deferred tax asset (liability) |
|
$ |
( |
) |
|
$ |
|
|
88
At December 31, 2020, we had net NOL and other tax attribute carryforwards as follows (in thousands):
|
|
U.S. |
|
|
Foreign |
|
||
|
Gross NOL carryforwards |
$ |
|
|
|
$ |
|
|
|
|
|
|
|
|
|
|
|
|
Tax-effected NOL carryforwards |
$ |
|
|
|
$ |
|
|
|
Valuation allowance |
|
( |
) |
|
|
( |
) |
|
Net deferred tax asset - NOL carryforwards |
$ |
|
|
|
$ |
|
|
|
Expiration periods |
|
|
|
|
|
||
Valuation Allowance
A valuation allowance has been recorded on certain foreign and domestic net operating loss carryforwards and other net deferred tax assets that may not be realized. As of each reporting date, we consider all new evidence that could impact the future realization of our deferred tax assets. In the evaluation of the need for a valuation allowance on our deferred income tax assets, we consider all available positive and negative evidence, including scheduled reversals of deferred income tax liabilities, carryback of future period losses to prior periods, projected future taxable income, tax planning strategies, and recent financial performance.
During 2020, a valuation allowance of $
We have
REIT Status
We have met the annual REIT distribution requirements by payment of at least
A schedule of per share distributions we paid and reported to our stockholders is set forth in the following:
|
|
|
For the Years Ended December 31, |
|
|||||||||
|
|
|
2020 |
|
|
2019 |
|
|
2018 |
|
|||
|
Common share distribution |
|
$ |
|
|
|
$ |
|
|
|
$ |
|
|
|
Ordinary income |
|
|
|
|
|
|
|
|
|
|
|
|
|
Capital gains(1) |
|
|
— |
|
|
|
|
|
|
|
|
|
|
Unrecaptured Sec. 1250 gain |
|
|
— |
|
|
|
|
|
|
|
|
|
|
Section 199A Dividends |
|
|
|
|
|
|
|
|
|
|
|
|
|
Return of capital |
|
|
|
|
|
|
|
|
|
|
— |
|
|
|
(1)Capital gains include unrecaptured Sec. 1250 gains. |
MPT Operating Partnership, L.P.
As a partnership, the allocated share of income of the Operating Partnership is included in the income tax returns of the general and limited partners. Accordingly, no accounting for income taxes is generally required for such income of the Operating Partnership. However, the Operating Partnership has formed a TRS on behalf of Medical Properties Trust, Inc., which is subject to U.S. federal, state, and local income taxes at regular corporate rates, and its international subsidiaries are subject to income taxes in the jurisdictions in which they operate. See discussion above under Medical Properties Trust, Inc. for more details of income taxes associated with our TRS and international operations.
89
6. Earnings Per Share/Unit
Medical Properties Trust, Inc.
Our earnings per share were calculated based on the following (amounts in thousands):
|
|
|
For the Years Ended December 31, |
|
|||||||||
|
|
|
2020 |
|
|
2019 |
|
|
2018 |
|
|||
|
Numerator: |
|
|
|
|
|
|
|
|
|
|
|
|
|
Net income |
|
$ |
|
|
|
$ |
|
|
|
$ |
|
|
|
Non-controlling interests’ share in earnings |
|
|
( |
) |
|
|
( |
) |
|
|
( |
) |
|
Participating securities’ share in earnings |
|
|
( |
) |
|
|
( |
) |
|
|
( |
) |
|
Net income, less participating securities’ share in earnings |
|
$ |
|
|
|
$ |
|
|
|
$ |
|
|
|
Denominator: |
|
|
|
|
|
|
|
|
|
|
|
|
|
Basic weighted-average common shares |
|
|
|
|
|
|
|
|
|
|
|
|
|
Dilutive potential common shares |
|
|
|
|
|
|
|
|
|
|
|
|
|
Diluted weighted-average common shares |
|
|
|
|
|
|
|
|
|
|
|
|
MPT Operating Partnership, L.P.
Our earnings per unit were calculated based on the following (amounts in thousands):
|
|
|
For the Years Ended December 31, |
|
|||||||||
|
|
|
2020 |
|
|
2019 |
|
|
2018 |
|
|||
|
Numerator: |
|
|
|
|
|
|
|
|
|
|
|
|
|
Net income |
|
$ |
|
|
|
$ |
|
|
|
$ |
|
|
|
Non-controlling interests’ share in earnings |
|
|
( |
) |
|
|
( |
) |
|
|
( |
) |
|
Participating securities’ share in earnings |
|
|
( |
) |
|
|
( |
) |
|
|
( |
) |
|
Net income, less participating securities’ share in earnings |
|
$ |
|
|
|
$ |
|
|
|
$ |
|
|
|
Denominator: |
|
|
|
|
|
|
|
|
|
|
|
|
|
Basic weighted-average units |
|
|
|
|
|
|
|
|
|
|
|
|
|
Dilutive potential units |
|
|
|
|
|
|
|
|
|
|
|
|
|
Diluted weighted-average units |
|
|
|
|
|
|
|
|
|
|
|
|
7. Stock Awards
Stock Awards
Our Equity Incentive Plan, adopted during the second quarter of 2019 and replaced the previous plan, authorizes the issuance of common stock options, restricted stock, restricted stock units, deferred stock units, stock appreciation rights, performance units, and awards of interests in our Operating Partnership. Our Equity Incentive Plan is administered by the Compensation Committee of the Board of Directors. We have reserved
For the past three years, we have only granted restricted stock and restricted stock units pursuant to our Equity Incentive Plan. These stock-based awards have been granted in the form of service-based awards and performance awards based on company-specific performance hurdles. See below for further details on each of these stock-based awards:
90
Service-Based Awards
In 2020, 2019, and 2018, the Compensation Committee granted service-based awards to employees and non-employee directors. Service-based awards vest as the employee/director provides the required service (typically over
Performance-Based Awards
In 2020, 2019, and 2018, the Compensation Committee granted performance-based awards to employees. Generally, dividends are not paid on performance awards until the award is earned. See below for details of such performance-based award grants:
In 2020, 2019, and 2018, a target number of stock awards were granted to employees that could be earned based on the achievement of specific performance thresholds as set by our Compensation Committee. The performance thresholds were based on a period with the opportunity to earn a portion of the award earlier. More or less shares than the target number of shares are available to be earned based on our performance compared to the set thresholds. At the end of each of the performance periods, any earned shares during such period will vest on January 1 of the following calendar year. The performance thresholds for 2020 awards were based on funds from operations growth, EBITDA, and acquisitions; whereas, the 2019 and 2018 performance thresholds were based on return on equity, EBITDA, and acquisitions.
Certain performance awards granted were subject to a modifier which increases or decreases the actual shares earned in each performance period. The modifier for the 2020 awards was based on two components: 1) how our total shareholder return (“TSR”) compared to the SNL U.S. REIT Healthcare Index (“SNL Index”) and 2) how our TSR compared to a threshold set by the Compensation Committee. For 2019 and 2018 awards, the modifier was based on how our TSR compared to the SNL Index.
The following summarizes stock-based award activity in 2020 and 2019 (which includes awards granted in 2020, 2019, 2018, and any applicable prior years), respectively:
For the Year Ended December 31, 2020:
|
|
|
Vesting Based on Service |
|
|
Vesting Based on Market/Performance Conditions |
|
||||||||||
|
|
|
Shares |
|
|
Weighted-Average Value at Award Date |
|
|
Shares |
|
|
Weighted-Average Value at Award Date |
|
||||
|
Nonvested awards at beginning of the year |
|
|
|
|
|
$ |
|
|
|
|
|
|
|
$ |
|
|
|
Awarded |
|
|
|
|
|
$ |
|
|
|
|
|
|
|
$ |
|
|
|
Vested |
|
|
( |
) |
|
$ |
|
|
|
|
( |
) |
|
$ |
|
|
|
Forfeited |
|
|
( |
) |
|
$ |
|
|
|
|
( |
) |
|
$ |
|
|
|
Nonvested awards at end of year |
|
|
|
|
|
$ |
|
|
|
|
|
|
|
$ |
|
|
For the Year Ended December 31, 2019:
|
|
|
Vesting Based on Service |
|
|
Vesting Based on Market/Performance Conditions |
|
||||||||||
|
|
|
Shares |
|
|
Weighted-Average Value at Award Date |
|
|
Shares |
|
|
Weighted-Average Value at Award Date |
|
||||
|
Nonvested awards at beginning of the year |
|
|
|
|
|
$ |
|
|
|
|
|
|
|
$ |
|
|
|
Awarded |
|
|
|
|
|
$ |
|
|
|
|
|
|
|
$ |
|
|
|
Vested |
|
|
( |
) |
|
$ |
|
|
|
|
( |
) |
|
$ |
|
|
|
Forfeited |
|
|
( |
) |
|
$ |
|
|
|
|
( |
) |
|
$ |
|
|
|
Nonvested awards at end of year |
|
|
|
|
|
$ |
|
|
|
|
|
|
|
$ |
|
|
The value of stock-based awards is charged to compensation expense over the service periods. For the years ended December 31, 2020, 2019, and 2018, we recorded $
91
8. Commitments and Contingencies
Commitments
On December 30, 2020, we entered into definitive agreements to acquire a portfolio of between
Upon closing of the first phase of the transaction on January 19, 2021, we funded an £800 million interim acquisition loan secured by mortgages on an identified portfolio of Priory Group real estate assets. In phase two, in a series of transactions we expect will be completed during the first half of 2021, we will acquire a portfolio of select real estate assets from Priory Group (now owned by Waterland VII) in individual sale-and-leaseback transactions, subject to customary real estate and other closing conditions. As all conditions to closing for a particular asset are satisfied, the applicable purchase price for the asset will be paid by us by proportionally converting and reducing the principal balance of the interim acquisition loan we made to Waterland VII in phase one. The aggregate purchase price for the real estate assets we acquire from the Priory Group is thus expected to be approximately £
The properties we acquire will be subject to a master lease type structure with an initial term of
In addition to the £800 million initial interim acquisition loan described above, we also agreed to provide Waterland VII with a 364-day £
In connection with these transactions, we also acquired a
To help fund this acquisition, we entered into a $
Contingencies
We are a party to various legal proceedings incidental to our business. In the opinion of management, after consultation with legal counsel, the ultimate liability, if any, with respect to these proceedings is not presently expected to materially affect our financial position, results of operations, or cash flows.
92
9. Common Stock/Partner’s Capital
Medical Properties Trust, Inc.
2020 Activity
In 2020, we sold
2019 Activity
On November 4, 2019, we filed Articles of Amendment to our charter with the Maryland State Department of Assessments and Taxation increasing the number of authorized shares of common stock, par value $
On November 8, 2019, we completed an underwritten public offering of
On July 18, 2019, we completed an underwritten public offering of
In 2019, we sold
On December 27, 2019, we entered into a new at-the-market equity offering program, which gives us the ability to sell up to $
2018 Activity
In the 2018 fourth quarter, we sold
MPT Operating Partnership, L.P.
At December 31, 2020, the Operating Partnership is made up of a general partner, Medical Properties Trust, LLC (“General Partner”) and limited partners, including the Company (which owns
In regards to distributions, the Operating Partnership shall distribute cash at such times and in such amounts as are determined by the General Partner in its sole and absolute discretion, to common unit holders who are common unit holders on the record date. However, per the Second Amended and Restated Agreement of Limited Partnership of MPT Operating Partnership, L.P. (“Operating Partnership Agreement”), the General Partner shall use its reasonable efforts to cause the Operating Partnership to distribute amounts sufficient to enable the Company to pay stockholder dividends that will allow the Company to (i) meet its distribution requirement for qualification as a REIT and (ii) avoid any U.S. federal income or excise tax liability imposed by the Code, other than to the extent the Company elects to retain and pay income tax on its net capital gain. In accordance with the Operating Partnership Agreement, LTIP units are treated as common units for distribution purposes.
The Operating Partnership’s net income will generally be allocated first to the General Partner to the extent of any cumulative losses and then to the limited partners in accordance with their respective percentage interests in the common units issued by the Operating Partnership. Any losses of the Operating Partnership will generally be allocated first to the limited partners until their capital account is zero and then to the General Partner. In accordance with the Operating Partnership Agreement, LTIP units are treated as common units for purposes of income and loss allocations. Limited partners have the right to require the Operating Partnership to redeem part or all of their common units. It is at the Operating Partnership’s discretion to redeem such common units for cash based on the fair market value of an equivalent number of shares of the Company’s common stock at the time of redemption or, alternatively, redeem the common units for shares of the Company’s common stock on a one-for-one basis, subject to adjustment in the event of stock splits, stock dividends, or similar events. LTIP units must wait two years from the issuance of the LTIP units to be redeemed, and then converted to common units. On December 28, 2020, approximately
For each share of common stock issued by Medical Properties Trust, Inc., the Operating Partnership issues a corresponding number of operating partnership units.
93
10. Fair Value of Financial Instruments
We have various assets and liabilities that are considered financial instruments. We estimate that the carrying value of cash and cash equivalents and accounts payable and accrued expenses approximate their fair values. We estimate the fair value of our interest and rent receivables using Level 2 inputs such as discounting the estimated future cash flows using the current rates at which similar receivables would be made to others with similar credit ratings and for the same remaining maturities. The fair value of our mortgage loans and other loans are estimated by using Level 2 inputs such as discounting the estimated future cash flows using the current rates which similar loans would be made to borrowers with similar credit ratings and for the same remaining maturities. We determine the fair value of our senior unsecured notes using Level 2 inputs such as quotes from securities dealers and market makers. We estimate the fair value of our revolving credit facility and term loans using Level 2 inputs based on the present value of future payments, discounted at a rate which we consider appropriate for such debt.
Fair value estimates are made at a specific point in time, are subjective in nature, and involve uncertainties and matters of significant judgment. Settlement of such fair value amounts may not be a prudent management decision.
|
|
|
December 31, 2020 |
|
|
December 31, 2019 |
|
||||||||||
|
Asset (Liability) |
|
Book Value |
|
|
Fair Value |
|
|
Book Value |
|
|
Fair Value |
|
||||
|
Interest and rent receivables |
|
$ |
|
|
|
$ |
|
|
|
$ |
|
|
|
$ |
|
|
|
Loans(1) |
|
|
|
|
|
|
|
|
|
|
|
|
|
|
|
|
|
Debt, net |
|
|
( |
) |
|
|
( |
) |
|
|
( |
) |
|
|
( |
) |
|
(1) |
Excludes the $ |
Items Measured at Fair Value on a Recurring Basis
Our equity investment and related loan to the new international joint venture and our loan investment in the real estate of
At December 31, 2020 and 2019, the amounts recorded under the fair value option method were as follows (in thousands):
|
|
|
As of December 31, 2020 |
|
|
As of December 31, 2019 |
|
|
|
||||||||||
|
Asset (Liability) |
|
Fair Value |
|
|
Original Cost |
|
|
Fair Value |
|
|
Original Cost |
|
|
Asset Type Classification |
||||
|
Mortgage loans |
|
$ |
|
|
|
$ |
|
|
|
$ |
|
|
|
$ |
|
|
|
Mortgage loans |
|
Equity investment and other loans |
|
|
|
|
|
|
|
|
|
|
— |
|
|
|
— |
|
|
Equity investments/Other loans |
Our loans to the new international joint venture and its subsidiaries are recorded at fair value based on Level 2 inputs by discounting the estimated cash flows using the market rates which similar loans would be made to borrowers with similar credit ratings and the same remaining maturities. Our equity investment in the international joint venture is recorded at fair value based on Level 3 inputs, by using a discounted cash flow model, which requires significant estimates of our investee such as projected revenue and expenses and appropriate consideration of the underlying risk profile of the forecasted assumptions associated with the investee. We classify the equity investment as Level 3, as we use certain unobservable inputs to the valuation methodology that are significant to the fair value measurement, and the valuation requires management judgment due to absence of quoted market prices. For this cash flow model, our observable inputs include use of a capitalization rate and discount rate (which is based on a weighted-average cost of capital) and our unobservable input includes an adjustment for a marketability discount (“DLOM”).
In regards to the underlying projections used in the discounted cash flow model, such projections are provided by the investee. However, we will modify such projections as needed based on our review and analysis of historical results, meetings with key members of management, and our understanding of trends and developments within the healthcare industry. Given our equity investment is in an entity that was a start-up company in 2020, we have not recognized any unrealized gain/loss on such investment in 2020.
94
Items Measured at Fair Value on a Nonrecurring Basis
In addition to items that are measured at fair value on a recurring basis, we have assets and liabilities that are measured at fair value on a nonrecurring basis, such as long-lived asset impairments (see Note 3). Fair value is based on estimated cash flows discounted at a risk-adjusted rate of interest by using either Level 2 or 3 inputs as more fully described in Note 2.
11. Leases (Lessee)
We lease the land underlying certain of our facilities (for which we sublease to our tenants), along with corporate office and equipment. Our leases have remaining lease terms that vary in years, and some of the leases have initial fixed terms (or renewal options available) that extend the leases up to, or just beyond, the depreciable life of the properties that occupy the leased land. Renewal options that we are reasonably certain to exercise are recognized in our right-of-use assets and lease liabilities. As most of our leases do not provide an implicit rate, we use our incremental borrowing rate based on the information available at lease commencement date in determining the present value of future payments.
The following is a summary of our lease expense (in thousands):
|
|
|
Income Statement |
|
For the Years Ended December 31, |
|
|||||
|
|
|
Classification |
|
2020 |
|
|
2019 |
|
||
|
Operating lease cost (1) |
|
(2) |
|
$ |
|
|
|
$ |
|
|
|
Finance lease cost: |
|
|
|
|
|
|
|
|
|
|
|
Amortization of right-of-use assets |
|
Real estate depreciation and amortization |
|
|
|
|
|
|
|
|
|
Interest on lease liabilities |
|
Interest |
|
|
|
|
|
|
|
|
|
Sublease income |
|
Other |
|
|
( |
) |
|
|
( |
) |
|
Total lease cost |
|
|
|
$ |
|
|
|
$ |
|
|
|
|
(1) |
|
|
|
(2) |
|
For 2018, our total lease expense was $
Fixed minimum payments due over the remaining lease term under non-cancelable leases of more than one year and amounts to be received in the future from non-cancelable subleases over their remaining lease term at December 31, 2020 are as follows (amounts in thousands):
|
|
|
Operating Leases |
|
|
Finance Leases |
|
|
Amounts To Be Received From Subleases |
|
|
Net Payments |
|
|
||||
|
2021 |
|
$ |
|
|
|
$ |
|
|
|
$ |
( |
) |
|
$ |
|
|
|
|
2022 |
|
|
|
|
|
|
|
|
|
|
( |
) |
|
|
|
|
|
|
2023 |
|
|
|
|
|
|
|
|
|
|
( |
) |
|
|
|
|
|
|
2024 |
|
|
|
|
|
|
|
|
|
|
( |
) |
|
|
|
|
|
|
2025 |
|
|
|
|
|
|
|
|
|
|
( |
) |
|
|
|
|
|
|
Thereafter |
|
|
|
|
|
|
|
|
|
|
( |
) |
|
|
|
|
(1) |
|
Total undiscounted minimum lease payments |
|
$ |
|
|
|
$ |
|
|
|
$ |
( |
) |
|
$ |
|
|
|
|
Less: interest |
|
|
( |
) |
|
|
( |
) |
|
|
|
|
|
|
|
|
|
|
Present value of lease liabilities |
|
$ |
|
|
|
$ |
|
|
|
|
|
|
|
|
|
|
|
|
|
(1) |
|
95
Supplemental balance sheet information is as follows (in thousands, except lease terms and discount rate):
|
|
|
Balance Sheet Classification |
|
December 31, 2020 |
|
|
December 31, 2019 |
|
||
|
Right of use assets: |
|
|
|
|
|
|
|
|
|
|
|
Operating leases - real estate |
|
Land |
|
$ |
|
|
|
$ |
|
|
|
Finance leases - real estate |
|
Land |
|
|
|
|
|
|
|
|
|
Total real estate right of use assets |
|
|
|
$ |
|
|
|
$ |
|
|
|
Operating leases - corporate |
|
Other assets |
|
|
|
|
|
|
|
|
|
Total right of use assets |
|
|
|
$ |
|
|
|
$ |
|
|
|
|
|
|
|
|
|
|
|
|
|
|
|
Lease liabilities: |
|
|
|
|
|
|
|
|
|
|
|
Operating leases |
|
Obligations to tenants and other lease liabilities |
|
$ |
|
|
|
$ |
|
|
|
Financing leases |
|
Obligations to tenants and other lease liabilities |
|
|
|
|
|
|
|
|
|
Total lease liabilities |
|
|
|
$ |
|
|
|
$ |
|
|
|
|
|
|
|
|
|
|
|
|
|
|
|
Weighted-average remaining lease term: |
|
|
|
|
|
|
|
|
|
|
|
Operating leases |
|
|
|
|
|
|
|
|
|
|
|
Finance leases |
|
|
|
|
|
|
|
|
|
|
|
Weighted-average discount rate: |
|
|
|
|
|
|
|
|
|
|
|
Operating leases |
|
|
|
|
|
% |
|
|
|
% |
|
Finance leases |
|
|
|
|
|
% |
|
|
|
% |
The following is supplemental cash flow information (in thousands):
|
|
|
For the Years Ended December 31, |
|
|||||||
|
|
|
2020 |
|
|
|
|
2019 |
|
||
|
Cash paid for amounts included in the measurement of lease liabilities: |
|
|
|
|
|
|
|
|
|
|
|
Operating cash flows from operating leases |
|
$ |
|
|
|
|
|
$ |
|
|
|
Operating cash flows from finance leases |
|
|
|
|
|
|
|
|
|
|
|
Financing cash flows from finance leases |
|
|
— |
|
|
|
|
|
|
|
|
Non-cash activities - Right-of-use assets obtained in exchange for lease obligations: |
|
|
|
|
|
|
|
|
|
|
|
Operating leases |
|
|
|
|
|
|
|
|
|
|
|
Finance leases |
|
|
— |
|
|
|
|
|
— |
|
12. Other Assets
The following is a summary of our other assets on our consolidated balance sheets (in thousands):
|
|
|
At December 31, |
|
|||||
|
|
|
2020 |
|
|
2019 |
|
||
|
Debt issue costs, net(1) |
|
$ |
|
|
|
$ |
|
|
|
Other corporate assets |
|
|
|
|
|
|
|
|
|
Prepaids and other assets |
|
|
|
|
|
|
|
|
|
Total other assets |
|
$ |
|
|
|
$ |
|
|
(1)
Other corporate assets include leasehold improvements associated with our corporate offices, furniture and fixtures, equipment, software, deposits, right-of-use assets associated with corporate leases, etc. Included in prepaids and other assets is prepaid insurance, prepaid taxes, deferred income tax assets (net of valuation allowances, if any), and lease inducements made to tenants, among other items.
In addition to the assets above, we have equity investments of $
96
13. Subsequent Events
Equity Offering
On January 11, 2021, we completed an underwritten public offering of
Credit Facility Amendment
On January 15, 2021, we amended our Credit Facility. The amendment extended the maturity of our revolving facility to
In addition to extending the maturity date, the amendment improved interest rate pricing for both facilities. Under the amended Credit Facility and at our election, loans may be made as either ABR Loans or Eurocurrency Loans. The applicable margin for term loans that are ABR Loans is adjustable on a sliding scale from
97
|
ITEM 9. |
Changes in and Disagreements With Accountants on Accounting and Financial Disclosure |
None.
|
ITEM 9A. |
Controls and Procedures |
Medical Properties Trust, Inc.
(a) Evaluation of Disclosure Controls and Procedures. Medical Properties Trust, Inc. maintains disclosure controls and procedures (as defined in Rules 13a-15(e) and 15d-15(e) of the Exchange Act) designed to provide reasonable assurance that information required to be disclosed in its Exchange Act reports is recorded, processed, summarized, and reported within the time periods specified in the SEC’s rules and forms, and that such information is accumulated and communicated to its management, including its Chief Executive Officer (principal executive officer) and Chief Financial Officer (principal financial officer), as appropriate, to allow timely decisions regarding required disclosure. In designing and evaluating the disclosure controls and procedures, we recognize that no controls and procedures, no matter how well designed and operated, can provide absolute assurance of achieving the desired control objectives. As required by Rule 13a-15(b) under the Exchange Act, the management of Medical Properties Trust, Inc., with the participation of its Chief Executive Officer and Chief Financial Officer, carried out an evaluation of the effectiveness of our disclosure controls and procedures. Based on the foregoing, the Chief Executive Officer and Chief Financial Officer concluded that these disclosure controls and procedures are effective as of the end of the period covered by this report.
(b) Management’s Report on Internal Control over Financial Reporting.
The management of Medical Properties Trust, Inc. is responsible for establishing and maintaining adequate internal control over financial reporting for Medical Properties Trust, Inc. (as such term is defined in Rule 13a-15(f) of the Exchange Act). Internal control over financial reporting is a process designed to provide reasonable assurance regarding the reliability of financial reporting and the preparation of Medical Properties Trust, Inc.’s financial statements for external reporting purposes in accordance with GAAP.
Because of inherent limitations, internal control over financial reporting may not prevent or detect misstatements. Also, projections of any evaluation of effectiveness to future periods are subject to the risk that controls may become inadequate because of changes in conditions, or that the degree of compliance with the policies or procedures may deteriorate.
Management has undertaken an assessment of the effectiveness of the internal control over financial reporting for Medical Properties Trust, Inc. as of December 31, 2020 based upon the framework established in Internal Control – Integrated Framework (2013) issued by the Committee of Sponsoring Organizations of the Treadway Commission. Based on this assessment, management has concluded that, as of December 31, 2020, the internal control over financial reporting for Medical Properties Trust, Inc. was effective.
The effectiveness of the internal control over financial reporting for Medical Properties Trust, Inc. as of December 31, 2020 has been audited by PricewaterhouseCoopers LLP, an independent registered public accounting firm, as stated in their report which appears in this Annual Report on Form 10-K.
(c) Changes in Internal Controls over Financial Reporting. There has been no change in the internal control over financial reporting for Medical Properties Trust, Inc. during its most recent fiscal quarter that has materially affected, or is reasonably likely to materially affect, its internal control over financial reporting.
MPT Operating Partnership, L.P.
(a) Evaluation of Disclosure Controls and Procedures. MPT Operating Partnership, L.P. maintains disclosure controls and procedures (as defined in Rules 13a-15(e) and 15d-15(e) of the Exchange Act) designed to provide reasonable assurance that information required to be disclosed in its Exchange Act reports is recorded, processed, summarized, and reported within the time periods specified in the SEC’s rules and forms, and that such information is accumulated and communicated to its management, including its Chief Executive Officer (principal executive officer) and Chief Financial Officer (principal financial officer), as appropriate, of Medical Properties Trust, Inc. (the sole general partner of MPT Operating Partnership, L.P.) to allow timely decisions regarding required disclosure. In designing and evaluating the disclosure controls and procedures, we recognize that no controls and procedures, no matter how well designed and operated, can provide absolute assurance of achieving the desired control objectives. As required by Rule 13a-15(b) under the Exchange Act, the management of MPT Operating Partnership, L.P., with the participation of the Chief Executive Officer and Chief Financial Officer of Medical Properties Trust, Inc. (the sole general partner of MPT Operating Partnership, L.P.), carried out an evaluation of the effectiveness of our disclosure controls and procedures. Based on the foregoing, the Chief Executive Officer and Chief Financial Officer of Medical Properties Trust, Inc. (the sole general partner of MPT Operating Partnership, L.P.) concluded that these disclosure controls and procedures are effective as of the end of the period covered by this report.
98
(b) Management’s Report on Internal Control over Financial Reporting.
The management of MPT Operating Partnership, L.P. is responsible for establishing and maintaining adequate internal control over financial reporting for MPT Operating Partnership, L.P. (as such term is defined in Rule 13a-15(f) of the Exchange Act). Internal control over financial reporting is a process designed to provide reasonable assurance regarding the reliability of financial reporting and the preparation of MPT Operating Partnership, L.P.’s financial statements for external reporting purposes in accordance with GAAP.
Because of inherent limitations, internal control over financial reporting may not prevent or detect misstatements. Also, projections of any evaluation of effectiveness to future periods are subject to the risk that controls may become inadequate because of changes in conditions, or that the degree of compliance with the policies or procedures may deteriorate.
Management has undertaken an assessment of the effectiveness of the internal control over financial reporting for MPT Operating Partnership, L.P. as of December 31, 2020, based upon the framework established in Internal Control – Integrated Framework (2013) issued by the Committee of Sponsoring Organizations of the Treadway Commission. Based on this assessment, management has concluded that, as of December 31, 2020, the internal control over financial reporting for MPT Operating Partnership, L.P. was effective.
The effectiveness of the internal control over financial reporting for MPT Operating Partnership, L.P. as of December 31, 2020 has been audited by PricewaterhouseCoopers LLP, an independent registered public accounting firm, as stated in their report which appears in this Annual Report on Form 10-K.
(c) Changes in Internal Controls over Financial Reporting. There has been no change in the internal control over financial reporting for MPT Operating Partnership, L.P. during its most recent fiscal quarter that has materially affected, or is reasonably likely to materially affect, its internal control over financial reporting.
|
ITEM 9B. |
Other Information |
None.
99
PART III
|
ITEM 10. |
Directors, Executive Officers and Corporate Governance |
The information required by this Item 10 is incorporated by reference to our definitive Proxy Statement for the 2021 Annual Meeting of Stockholders, which will be filed by us with the Commission not later than April 30, 2021.
|
ITEM 11. |
Executive Compensation |
The information required by this Item 11 is incorporated by reference to our definitive Proxy Statement for the 2021 Annual Meeting of Stockholders, which will be filed by us with the Commission not later than April 30, 2021.
|
ITEM 12. |
Security Ownership of Certain Beneficial Owners and Management and Related Stockholder Matters |
The information required by this Item 12 is incorporated by reference to our definitive Proxy Statement for the 2021 Annual Meeting of Stockholders, which will be filed by us with the Commission not later than April 30, 2021.
|
ITEM 13. |
Certain Relationships and Related Transactions, and Director Independence |
The information required by this Item 13 is incorporated by reference to our definitive Proxy Statement for the 2021 Annual Meeting of Stockholders, which will be filed by us with the Commission not later than April 30, 2021.
|
ITEM 14. |
Principal Accountant Fees and Services |
The information required by this Item 14 is incorporated by reference to our definitive Proxy Statement for the 2021 Annual Meeting of Stockholders, which will be filed by us with the Commission not later than April 30, 2021.
100
PART IV
|
ITEM 15. |
Exhibits and Financial Statement Schedules |
(a) Financial Statements and Financial Statement Schedules
Index of Financial Statements of Medical Properties Trust, Inc. and MPT Operating Partnership, L.P. which are included in Part II, Item 8 of this Annual Report on Form 10-K:
|
|
|
|
Report of Independent Registered Public Accounting Firm |
|
|
56 |
|
|
58 |
|
|
|
|
|
Medical Properties Trust, Inc. |
|
|
Consolidated Balance Sheets as of December 31, 2020 and 2019 |
60 |
|
Consolidated Statements of Net Income for the Years Ended December 31, 2020, 2019, and 2018 |
61 |
|
62 |
|
|
Consolidated Statements of Equity for the Years Ended December 31, 2020, 2019, and 2018 |
63 |
|
Consolidated Statements of Cash Flows for the Years Ended December 31, 2020, 2019, and 2018 |
64 |
|
|
|
|
MPT Operating Partnership, L.P. |
|
|
Consolidated Balance Sheets as of December 31, 2020 and 2019 |
65 |
|
Consolidated Statements of Net Income for the Years Ended December 31, 2020, 2019, and 2018 |
66 |
|
67 |
|
|
Consolidated Statements of Capital for the Years Ended December 31, 2020, 2019, and 2018 |
68 |
|
Consolidated Statements of Cash Flows for the Years Ended December 31, 2020, 2019, and 2018 |
69 |
|
|
|
|
Medical Properties Trust, Inc. and MPT Operating Partnership, L.P. |
|
|
70 |
|
|
Financial Statement Schedules |
|
|
108 |
|
|
109 |
|
|
116 |
101
(b) Exhibits
|
Exhibit Number |
|
Description |
|
Form |
|
File Number |
|
Exhibit Number |
|
Filing Date |
|
3.1 |
|
Second Articles of Amendment and Restatement of Medical Properties Trust, Inc. |
|
S-11/A |
|
333-119957 |
|
3.1 |
|
January 6, 2005 |
|
3.2 |
|
|
10-Q |
|
001-32559 |
|
3.1 |
|
November 10, 2005 |
|
|
3.3 |
|
|
8-K |
|
001-32559 |
|
3.1 |
|
January 13, 2009 |
|
|
3.4 |
|
|
8-K |
|
001-32559 |
|
3.1 |
|
January 31, 2012 |
|
|
3.5 |
|
|
8-K |
|
001-32559 |
|
3.1 |
|
June 26, 2015 |
|
|
3.6 |
|
|
10-Q |
|
001-32559 |
|
3.2 |
|
August 10, 2015 |
|
|
3.7 |
|
|
8-K |
|
001-32559 |
|
3.1 |
|
November 8, 2019 |
|
|
3.8 |
|
Second Amended and Restated Bylaws of Medical Properties Trust, Inc. |
|
8-K |
|
001-32559 |
|
3.1 |
|
November 24, 2009 |
|
3.9 |
|
Amendment to Second Amended and Restated Bylaws of Medical Properties Trust, Inc. |
|
8-K |
|
001-32559 |
|
3.2 |
|
June 26, 2015 |
|
3.10 |
|
Amendment to Second Amended and Restated Bylaws of Medical Properties Trust, Inc. |
|
8-K |
|
001-32559 |
|
3.1 |
|
November 16, 2016 |
|
3.11 |
|
Amendment to Second Amended and Restated Bylaws of Medical Properties Trust, Inc. |
|
8-K |
|
001-32559 |
|
3.1 |
|
February 22, 2017 |
|
3.12 |
|
Amendment to Second Amended and Restated Bylaws of Medical Properties Trust, Inc. |
|
8-K |
|
001-32559 |
|
3.1 |
|
May 25, 2018 |
|
3.13 |
|
Amendment to Second Amended and Restated Bylaws of Medical Properties Trust, Inc. |
|
8-K |
|
001-32559 |
|
3.1 |
|
May 22, 2020 |
|
4.1 |
|
|
S-11/A |
|
333-119957 |
|
4.1 |
|
January 6, 2005 |
|
|
4.2 |
|
|
10-K |
|
001-32559 |
|
4.2 |
|
February 27, 2020 |
|
|
4.3 |
|
|
8-K |
|
001-32559 |
|
4.1 |
|
October 16, 2013 |
|
|
4.4 |
|
|
8-K |
|
001-32559 |
|
4.1 |
|
August 21, 2015 |
|
|
4.5 |
|
|
8-K |
|
001-32559 |
|
4.2 |
|
July 22, 2016 |
102
|
Exhibit Number |
|
Description |
|
Form |
|
File Number |
|
Exhibit Number |
|
Filing Date |
|
4.6 |
|
|
8-K |
|
001-32559 |
|
4.2 |
|
March 27, 2017 |
|
|
4.7 |
|
|
10-Q |
|
001-32559 |
|
4.1 |
|
November 9, 2017 |
|
|
4.8 |
|
|
8-K |
|
001-32559 |
|
4.2 |
|
July 29, 2019 |
|
|
4.9 |
|
|
8-K |
|
001-32559 |
|
4.2 |
|
December 11, 2019 |
|
|
4.10 |
|
|
8-K |
|
001-32559 |
|
4.4 |
|
December 11, 2019 |
|
|
4.11 |
|
|
8-K |
|
001-32559 |
|
4.2 |
|
December 7, 2020 |
|
|
10.1 |
|
Second Amended and Restated Agreement of Limited Partnership of MPT Operating Partnership, L.P. |
|
8-K |
|
001-32559 |
|
10.1 |
|
August 6, 2007 |
|
10.2 |
|
Medical Properties Trust, Inc. 2013 Equity Incentive Plan*** |
|
10-K |
|
001-32559 |
|
10.2 |
|
March 1, 2019 |
|
10.3 |
|
Medical Properties Trust, Inc. 2019 Equity Incentive Plan*** |
|
DEF 14A |
|
001-32559 |
|
A |
|
April 26, 2019 |
|
10.4 |
|
|
8-K |
|
001-32559 |
|
10.2 |
|
October 18, 2005 |
|
|
10.5 |
|
|
8-K |
|
001-32559 |
|
10.4 |
|
October 18, 2005 |
|
|
10.6 |
|
|
8-K |
|
001-32559 |
|
10.5 |
|
October 18, 2005 |
|
|
10.7 |
|
|
S-11/A |
|
333-119957 |
|
10.3 |
|
January 6, 2005 |
|
|
10.8 |
|
|
S-11/A |
|
333-119957 |
|
10.4 |
|
January 6, 2005 |
|
|
10.9 |
|
|
S-11/A |
|
333-119957 |
|
10.6 |
|
January 6, 2005 |
|
|
10.10 |
|
|
S-11/A |
|
333-119957 |
|
10.5 |
|
January 6, 2005 |
103
|
Exhibit Number |
|
Description |
|
Form |
|
File Number |
|
Exhibit Number |
|
Filing Date |
|
10.11 |
|
|
S-11/A |
|
333-119957 |
|
10.55 |
|
July 5, 2005 |
|
|
10.12 |
|
|
8-K |
|
001-32559 |
|
10.2 |
|
August 6, 2007 |
|
|
10.13 |
|
|
8-K |
|
001-32559 |
|
10.3 |
|
August 6, 2007 |
|
|
10.14 |
|
|
10-K |
|
001-32559 |
|
10.58 |
|
March 14, 2008 |
|
|
10.15 |
|
|
10-K |
|
001-32559 |
|
10.59 |
|
March 14, 2008 |
|
|
10.16 |
|
|
10-K |
|
001-32559 |
|
10.61 |
|
March 14, 2008 |
|
|
10.17 |
|
|
10-K |
|
001-32559 |
|
10.74 |
|
March 13, 2009 |
|
|
10.18 |
|
|
10-K |
|
001-32559 |
|
10.75 |
|
March 13, 2009 |
|
|
10.19 |
|
|
10-K |
|
001-32559 |
|
10.76 |
|
March 13, 2009 |
|
|
10.20 |
|
|
10-K |
|
001-32559 |
|
10.77 |
|
March 13, 2009 |
|
|
10.21 |
|
|
10-K |
|
001-32559 |
|
10.78 |
|
March 13, 2009 |
|
|
10.22 |
|
|
10-K |
|
001-32559 |
|
10.79 |
|
March 13, 2009 |
|
|
10.23 |
|
|
10-K |
|
001-32559 |
|
10.33 |
|
March 1, 2017 |
|
|
10.24 |
|
|
10-K |
|
001-32559 |
|
10.34 |
|
March 1, 2017 |
|
|
10.25 |
|
|
10-K |
|
001-32559 |
|
10.35 |
|
March 1, 2017 |
|
|
10.26 |
|
|
10-Q |
|
001-32559 |
|
10.1 |
|
August 9, 2017 |
|
|
10.27 |
|
|
10-Q |
|
001-32559 |
|
10.2 |
|
August 9, 2017 |
|
|
10.28 |
|
|
10-Q |
|
001-32559 |
|
10.3 |
|
August 9, 2017 |
104
|
Exhibit Number |
|
Description |
|
Form |
|
File Number |
|
Exhibit Number |
|
Filing Date |
|
10.29 |
|
|
10-Q |
|
001-32559 |
|
10.4 |
|
August 9, 2017 |
|
|
10.30 |
|
|
10-Q |
|
001-32559 |
|
10.5 |
|
August 9, 2017 |
|
|
10.31 |
|
|
10-Q |
|
001-32559 |
|
10.6 |
|
August 9, 2017 |
|
|
10.32 |
|
|
10-Q |
|
001-32559 |
|
10.1 |
|
November 9, 2017 |
|
|
10.33 |
|
|
10-Q |
|
001-32559 |
|
10.2 |
|
November 9, 2017 |
|
|
10.34 |
|
|
10-Q |
|
001-32559 |
|
10.1 |
|
August 9, 2018 |
|
|
10.35 |
|
|
10-Q |
|
001-32559 |
|
10.1 |
|
August 9, 2019 |
|
|
10.36 |
|
|
10-Q |
|
001-32559 |
|
10.2 |
|
November 12, 2019 |
|
|
10.37 |
|
|
10-Q |
|
001-32559 |
|
10.1 |
|
August 7, 2020 |
|
|
21.1* |
|
|
|
|
|
|
|
|
|
|
|
23.1* |
|
|
|
|
|
|
|
|
|
|
|
23.2* |
|
|
|
|
|
|
|
|
|
|
|
31.1* |
|
|
|
|
|
|
|
|
|
|
|
31.2* |
|
|
|
|
|
|
|
|
|
|
|
31.3* |
|
|
|
|
|
|
|
|
|
|
|
31.4* |
|
|
|
|
|
|
|
|
|
105
|
Exhibit Number |
|
Description |
|
Form |
|
File Number |
|
Exhibit Number |
|
Filing Date |
|
32.1** |
|
|
|
|
|
|
|
|
|
|
|
32.2** |
|
|
|
|
|
|
|
|
|
|
|
Exhibit 101.INS |
|
Inline XBRL Instance Document |
|
|
|
|
|
|
|
|
|
Exhibit 101.SCH |
|
Inline XBRL Taxonomy Extension Schema Document |
|
|
|
|
|
|
|
|
|
Exhibit 101.CAL |
|
Inline XBRL Taxonomy Extension Calculation Linkbase Document |
|
|
|
|
|
|
|
|
|
Exhibit 101.DEF |
|
Inline XBRL Taxonomy Extension Definition Linkbase Document |
|
|
|
|
|
|
|
|
|
Exhibit 101.LAB |
|
Inline XBRL Taxonomy Extension Label Linkbase Document |
|
|
|
|
|
|
|
|
|
Exhibit 101.PRE |
|
Inline XBRL Taxonomy Extension Presentation Linkbase Document |
|
|
|
|
|
|
|
|
|
104 |
|
Cover page interactive data file (Formatted as Inline XBRL with applicable taxonomy extension information contained in Exhibits 101.) |
|
|
|
|
|
|
|
|
|
* |
Filed herewith. |
|
** |
Furnished herewith. |
|
*** |
Management contract or compensatory plan or arrangement. |
|
ITEM 16. |
Form 10-K Summary |
None.
106
SIGNATURES
Pursuant to the requirements of Section 13 or 15(d) of the Exchange Act, the registrants have duly caused this Report to be signed on their behalf by the undersigned, thereunto duly authorized.
|
MEDICAL PROPERTIES TRUST, INC. |
||
|
|
|
|
|
By: |
|
/s/ J. Kevin Hanna |
|
|
|
J. Kevin Hanna |
|
|
|
Vice President, Controller, and Chief Accounting Officer |
|
|
||
|
MPT OPERATING PARTNERSHIP, L.P. |
||
|
|
|
|
|
By: |
|
/s/ J. Kevin Hanna |
|
|
|
J. Kevin Hanna |
|
|
|
Vice President, Controller, and Chief Accounting Officer of the sole member of the general partner of MPT Operating Partnership, L.P. |
Date: March 1, 2021
Power of Attorney
KNOW ALL PERSONS BY THESE PRESENTS, that each person whose signature appears below does hereby constitute and appoint J. Kevin Hanna and R. Steven Hamner, and each of them singly, as her or his true and lawful attorneys with full power to them, and each of them singly, to sign for such person and in her or his name in the capacity indicated below, the Annual Report on Form 10-K filed herewith and any and all amendments to said Annual Report on Form 10-K, and generally to do all such things in her or his name and in her or his capacity as officer and director to enable the registrants to comply with the provisions of the Exchange Act, and all requirements of the SEC in connection therewith, hereby ratifying and confirming our signatures as they may be signed by our said attorneys, or any of them, to said Annual Report on Form 10-K and any and all amendments thereto.
Pursuant to the requirements of the Exchange Act, this report has been signed by the following persons on behalf of the registrants and in the capacities and on the dates indicated.
|
Signature |
|
Title |
|
Date |
|
|
|
|
||
|
/s/ Edward K. Aldag, Jr. Edward K. Aldag, Jr. |
|
Chairman of the Board, President, Chief Executive Officer and Director (Principal Executive Officer) |
|
March 1, 2021 |
|
|
|
|
||
|
/s/ R. Steven Hamner R. Steven Hamner |
|
Executive Vice President, Chief Financial Officer and Director (Principal Financial Officer) |
|
March 1, 2021 |
|
|
|
|
||
|
/s/ G. Steven Dawson G. Steven Dawson |
|
Director |
|
March 1, 2021 |
|
|
|
|
||
|
/s/ Caterina A. Mozingo Caterina A. Mozingo |
|
Director |
|
March 1, 2021 |
|
|
|
|
||
|
/s/ Elizabeth N. Pitman Elizabeth N. Pitman |
|
Director |
|
March 1, 2021 |
|
|
|
|
||
|
/s/ D. Paul Sparks, Jr. D. Paul Sparks, Jr. |
|
Director |
|
March 1, 2021 |
|
|
|
|
||
|
/s/ Michael G. Stewart Michael G. Stewart |
|
Director |
|
March 1, 2021 |
|
|
|
|
||
|
/s/ C. Reynolds Thompson, III C. Reynolds Thompson, III |
|
Director |
|
March 1, 2021 |
107
Schedule II: Valuation and Qualifying Accounts
Medical Properties Trust, Inc. and MPT Operating Partnership, L.P.
December 31, 2020
|
|
|
|
|
|
|
Additions |
|
|
|
Deductions |
|
|
|
|
|
|
|||||||
|
Year Ended December 31, |
|
Balance at Beginning of Year(1) |
|
|
Charged Against Operations(1) |
|
|
|
Charged to Other Accounts |
|
|
|
Net Recoveries/ Write-offs(1) |
|
|
|
Balance at End of Year(1) |
|
|||||
|
|
|
(In thousands) |
|
||||||||||||||||||||
|
2020 |
|
$ |
|
|
|
$ |
|
|
(2) |
|
$ |
|
|
(3) |
|
$ |
( |
) |
(4) |
|
$ |
|
|
|
2019 |
|
$ |
|
|
|
$ |
|
|
(5) |
|
$ |
— |
|
|
|
$ |
( |
) |
(6) |
|
$ |
|
|
|
2018 |
|
$ |
|
|
|
$ |
|
|
(7) |
|
$ |
— |
|
|
|
$ |
( |
) |
(8) |
|
$ |
|
|
|
|
(1) |
Includes real estate impairment reserves, allowance for doubtful accounts, straight-line rent reserves, credit loss reserves, tax valuation allowances, and other reserves. |
|
|
(2) |
Represents a $ |
|
|
(3) |
Reflects $ |
|
|
(4) |
Includes a $ |
|
|
(5) |
Represents a $ |
|
|
(6) |
Includes a $ |
|
|
(7) |
Represents a $ |
|
|
(8) |
Includes a $ |
108
SCHEDULE III — REAL ESTATE INVESTMENTS AND ACCUMULATED DEPRECIATION
December 31, 2020
|
|
|
|
|
Initial Costs |
|
|
Additions Subsequent to Acquisition |
|
|
Cost at December 31, 2020(1) |
|
|
Accumulated |
|
|
|
|
|
|
|
|
|
|
Life on which depreciation in latest income statements is |
|
|||||||||||||||||||||
|
Location |
|
Type of Property |
|
Land |
|
|
Buildings |
|
|
Improve- ments |
|
|
Carrying Costs |
|
|
Land |
|
|
Buildings |
|
|
Total |
|
|
Depreciation |
|
|
Encum- brances |
|
|
Date of Construction |
|
Date Acquired |
|
computed (Years) |
|
||||||||||
|
|
|
(Dollar amounts in thousands) |
|
|||||||||||||||||||||||||||||||||||||||||||
|
Ashtead, UK |
|
|
|
$ |
|
|
|
$ |
|
|
|
$ |
|
|
|
$ |
— |
|
|
$ |
|
|
|
$ |
|
|
|
$ |
|
|
|
$ |
|
|
|
$ |
|
|
|
|
|
|
|
|
|
|
|
Bassenheim, Germany |
|
|
|
|
|
|
|
|
|
|
|
|
|
|
|
|
— |
|
|
|
|
|
|
|
|
|
|
|
|
|
|
|
|
|
|
|
|
|
|
|
|
|
|
|
|
|
|
Bath, UK |
|
|
|
|
|
|
|
|
|
|
|
|
— |
|
|
|
— |
|
|
|
|
|
|
|
|
|
|
|
|
|
|
|
|
|
|
|
|
|
|
|
|
|
|
|
|
|
|
Bath, UK |
|
|
|
|
|
|
|
|
|
|
|
|
|
|
|
|
— |
|
|
|
|
|
|
|
|
|
|
|
|
|
|
|
|
|
|
|
|
|
|
|
|
|
|
|
|
|
|
Birmingham, UK |
|
|
|
|
|
|
|
|
|
|
|
|
— |
|
|
|
— |
|
|
|
|
|
|
|
|
|
|
|
|
|
|
|
|
|
|
|
|
|
|
|
|
|
|
|
|
|
|
Birmingham, UK |
|
|
|
|
|
|
|
|
|
|
|
|
|
|
|
|
— |
|
|
|
|
|
|
|
|
|
|
|
|
|
|
|
|
|
|
|
|
|
|
|
|
|
|
|
|
|
|
Birmingham, UK |
|
|
|
|
— |
|
|
|
|
|
|
|
— |
|
|
|
— |
|
|
|
— |
|
|
|
|
|
|
|
|
|
|
|
|
|
|
|
|
|
|
|
|
|
|
|
|
|
|
Braunfels, Germany |
|
|
|
|
|
|
|
|
|
|
|
|
|
|
|
|
— |
|
|
|
|
|
|
|
|
|
|
|
|
|
|
|
|
|
|
|
|
|
|
|
|
|
|
|
|
|
|
Heidelberg, Germany |
|
|
|
|
|
|
|
|
|
|
|
|
|
|
|
|
— |
|
|
|
|
|
|
|
|
|
|
|
|
|
|
|
|
|
|
|
|
|
|
|
|
|
|
|
|
|
|
Cologne, Germany |
|
|
|
|
|
|
|
|
|
|
|
|
|
|
|
|
— |
|
|
|
|
|
|
|
|
|
|
|
|
|
|
|
|
|
|
|
|
|
|
|
|
|
|
|
|
|
|
Bad Salzuflen, Germany |
|
|
|
|
|
|
|
|
|
|
|
|
|
|
|
|
— |
|
|
|
|
|
|
|
|
|
|
|
|
|
|
|
|
|
|
|
|
|
|
|
|
|
|
|
|
|
|
Bad Salzuflen, Germany |
|
|
|
|
|
|
|
|
|
|
|
|
|
|
|
|
— |
|
|
|
|
|
|
|
|
|
|
|
|
|
|
|
|
|
|
|
|
|
|
|
|
|
|
|
|
|
|
Bad Oeynhausen, Germany |
|
|
|
|
|
|
|
|
|
|
|
|
|
|
|
|
— |
|
|
|
|
|
|
|
|
|
|
|
|
|
|
|
|
|
|
|
|
|
|
|
|
|
|
|
|
|
|
Dormagen, Germany |
|
|
|
|
|
|
|
|
|
|
|
|
|
|
|
|
— |
|
|
|
|
|
|
|
|
|
|
|
|
|
|
|
|
|
|
|
|
|
|
|
|
|
|
|
|
|
|
Grefath, Germany |
|
|
|
|
|
|
|
|
|
|
|
|
|
|
|
|
— |
|
|
|
|
|
|
|
|
|
|
|
|
|
|
|
|
|
|
|
|
|
|
|
|
|
|
|
|
|
|
Remscheid, Germany |
|
|
|
|
|
|
|
|
|
|
|
|
|
|
|
|
— |
|
|
|
|
|
|
|
|
|
|
|
|
|
|
|
|
|
|
|
|
|
|
|
|
|
|
|
|
|
|
Houston, TX |
|
|
|
|
|
|
|
|
|
|
|
|
|
|
|
|
|
|
|
|
|
|
|
|
|
|
|
|
|
|
|
|
|
|
|
|
|
|
|
|
|
|
|
|
|
|
|
San Diego, CA |
|
|
|
|
|
|
|
|
|
|
|
|
— |
|
|
|
— |
|
|
|
|
|
|
|
|
|
|
|
|
|
|
|
|
|
|
|
|
|
|
|
|
|
|
|
|
|
|
Alvin, TX |
|
|
|
|
|
|
|
|
|
|
|
|
— |
|
|
|
— |
|
|
|
|
|
|
|
|
|
|
|
|
|
|
|
|
|
|
|
|
|
|
|
|
|
|
|
|
|
|
Houston, TX |
|
|
|
|
|
|
|
|
|
|
|
|
— |
|
|
|
— |
|
|
|
|
|
|
|
|
|
|
|
|
|
|
|
|
|
|
|
|
|
|
|
|
|
|
|
|
|
|
Aurora, CO |
|
|
|
|
|
|
|
|
|
|
|
|
— |
|
|
|
— |
|
|
|
|
|
|
|
|
|
|
|
|
|
|
|
|
|
|
|
|
|
|
|
|
|
|
|
|
|
|
Ft. Worth, TX |
|
|
|
|
|
|
|
|
|
|
|
|
— |
|
|
|
— |
|
|
|
|
|
|
|
|
|
|
|
|
|
|
|
|
|
|
|
|
|
|
|
|
|
|
|
|
|
|
Aberdeen, UK |
|
|
|
|
|
|
|
|
|
|
|
|
|
|
|
|
— |
|
|
|
|
|
|
|
|
|
|
|
|
|
|
|
|
|
|
|
|
|
|
|
|
|
|
|
|
|
|
Ayer, MA |
|
|
|
|
|
|
|
|
|
|
|
|
|
|
|
|
— |
|
|
|
|
|
|
|
|
|
|
|
|
|
|
|
|
|
|
|
|
|
|
|
|
|
|
|
|
|
|
Basingstoke, UK |
|
|
|
|
|
|
|
|
|
|
|
|
|
|
|
|
— |
|
|
|
|
|
|
|
|
|
|
|
|
|
|
|
|
|
|
|
|
|
|
|
|
|
|
|
|
|
|
Beckenham, UK |
|
|
|
|
|
|
|
|
|
|
|
|
|
|
|
|
— |
|
|
|
|
|
|
|
|
|
|
|
|
|
|
|
|
|
|
|
|
|
|
|
|
|
|
|
|
|
|
Bedford, UK |
|
|
|
|
|
|
|
|
|
|
|
|
|
|
|
|
— |
|
|
|
|
|
|
|
|
|
|
|
|
|
|
|
|
|
|
|
|
|
|
|
|
|
|
|
|
|
|
Bellflower, CA |
|
|
|
|
|
|
|
|
— |
|
|
|
— |
|
|
|
— |
|
|
|
|
|
|
|
— |
|
|
|
|
|
|
|
— |
|
|
|
|
|
|
|
|
|
|
|
— |
|
|
Bennettsville, SC |
|
|
|
|
|
|
|
|
|
|
|
|
— |
|
|
|
— |
|
|
|
|
|
|
|
|
|
|
|
|
|
|
|
|
|
|
|
|
|
|
|
|
|
|
|
|
|
|
Big Spring, TX |
|
|
|
|
|
|
|
|
|
|
|
|
— |
|
|
|
— |
|
|
|
|
|
|
|
|
|
|
|
|
|
|
|
|
|
|
|
|
|
|
|
|
|
|
|
|
|
|
Blackburn, UK |
|
|
|
|
|
|
|
|
|
|
|
|
|
|
|
|
— |
|
|
|
|
|
|
|
|
|
|
|
|
|
|
|
|
|
|
|
|
|
|
|
|
|
|
|
|
|
|
Blue Springs, MO |
|
|
|
|
|
|
|
|
|
|
|
|
— |
|
|
|
— |
|
|
|
|
|
|
|
|
|
|
|
|
|
|
|
|
|
|
|
|
|
|
|
|
|
|
|
|
|
|
Boardman, OH |
|
|
|
|
|
|
|
|
|
|
|
|
— |
|
|
|
— |
|
|
|
|
|
|
|
|
|
|
|
|
|
|
|
|
|
|
|
|
|
|
|
|
|
|
|
|
|
|
Boise, ID |
|
|
|
|
|
|
|
|
|
|
|
|
— |
|
|
|
— |
|
|
|
|
|
|
|
|
|
|
|
|
|
|
|
|
|
|
|
|
|
|
|
|
|
|
|
|
|
109
|
|
|
|
|
Initial Costs |
|
|
Additions Subsequent to Acquisition |
|
|
Cost at December 31, 2020(1) |
|
|
Accumulated |
|
|
|
|
|
|
|
|
|
|
Life on which depreciation in latest income statements is |
|
|||||||||||||||||||||
|
Location |
|
Type of Property |
|
Land |
|
|
Buildings |
|
|
Improve- ments |
|
|
Carrying Costs |
|
|
Land |
|
|
Buildings |
|
|
Total |
|
|
Depreciation |
|
|
Encum- brances |
|
|
Date of Construction |
|
Date Acquired |
|
computed (Years) |
|
||||||||||
|
|
|
(Dollar amounts in thousands) |
|
|||||||||||||||||||||||||||||||||||||||||||
|
Bolton, UK |
|
|
|
|
|
|
|
|
|
|
|
|
|
|
|
|
— |
|
|
|
|
|
|
|
|
|
|
|
|
|
|
|
|
|
|
|
|
|
|
|
|
|
|
|
|
|
|
Boonton Township, NJ |
|
|
|
|
|
|
|
|
|
|
|
|
— |
|
|
|
— |
|
|
|
|
|
|
|
|
|
|
|
|
|
|
|
|
|
|
|
|
|
|
|
|
|
|
|
|
|
|
Bossier City, LA |
|
|
|
|
|
|
|
|
|
|
|
|
|
|
|
|
— |
|
|
|
|
|
|
|
|
|
|
|
|
|
|
|
|
|
|
|
|
|
|
|
|
|
|
|
|
|
|
Bowling Green, KY |
|
|
|
|
|
|
|
|
|
|
|
|
— |
|
|
|
— |
|
|
|
|
|
|
|
|
|
|
|
|
|
|
|
|
|
|
|
|
|
|
|
|
|
|
|
|
|
|
Brighton, MA |
|
|
|
|
|
|
|
|
|
|
|
|
|
|
|
|
— |
|
|
|
|
|
|
|
|
|
|
|
|
|
|
|
|
|
|
|
|
|
|
|
|
|
|
|
|
|
|
Brockton, MA |
|
|
|
|
|
|
|
|
|
|
|
|
|
|
|
|
— |
|
|
|
|
|
|
|
|
|
|
|
|
|
|
|
|
|
|
|
|
|
|
|
|
|
|
|
|
|
|
Broomfield, CO |
|
|
|
|
|
|
|
|
|
|
|
|
— |
|
|
|
— |
|
|
|
|
|
|
|
|
|
|
|
|
|
|
|
|
|
|
|
|
|
|
|
|
|
|
|
|
|
|
Bundoora, Australia |
|
|
|
|
|
|
|
|
|
|
|
|
|
|
|
|
— |
|
|
|
|
|
|
|
|
|
|
|
|
|
|
|
|
|
|
|
|
|
|
|
|
|
|
|
|
|
|
Casper, WY |
|
|
|
|
|
|
|
|
— |
|
|
|
— |
|
|
|
— |
|
|
|
|
|
|
|
— |
|
|
|
|
|
|
|
— |
|
|
|
|
|
|
|
|
|
|
|
— |
|
|
Glendale, AZ |
|
|
|
|
|
|
|
|
|
|
|
|
— |
|
|
|
— |
|
|
|
|
|
|
|
|
|
|
|
|
|
|
|
|
|
|
|
|
|
|
|
|
|
|
|
|
|
|
New Orleans, LA |
|
|
|
|
|
|
|
|
|
|
|
|
— |
|
|
|
— |
|
|
|
|
|
|
|
|
|
|
|
|
|
|
|
|
|
|
|
|
|
|
|
|
|
|
|
|
|
|
Campbelltown, Australia |
|
|
|
|
|
|
|
|
|
|
|
|
|
|
|
|
— |
|
|
|
|
|
|
|
|
|
|
|
|
|
|
|
|
|
|
|
|
|
|
|
|
|
|
|
|
|
|
Canterbury, UK |
|
|
|
|
|
|
|
|
|
|
|
|
|
|
|
|
— |
|
|
|
|
|
|
|
|
|
|
|
|
|
|
|
|
|
|
|
|
|
|
|
|
|
|
|
|
|
|
Carmarthen, UK |
|
|
|
|
|
|
|
|
|
|
|
|
|
|
|
|
— |
|
|
|
|
|
|
|
|
|
|
|
|
|
|
|
|
|
|
|
|
|
|
|
|
|
|
|
|
|
|
Carrollton, TX |
|
|
|
|
|
|
|
|
|
|
|
|
|
|
|
|
— |
|
|
|
|
|
|
|
|
|
|
|
|
|
|
|
|
|
|
|
|
|
|
|
|
|
|
|
|
|
|
Caterham, UK |
|
|
|
|
|
|
|
|
|
|
|
|
|
|
|
|
— |
|
|
|
|
|
|
|
|
|
|
|
|
|
|
|
|
|
|
|
|
|
|
|
|
|
|
|
|
|
|
Cedar Hill. TX |
|
|
|
|
|
|
|
|
|
|
|
|
— |
|
|
|
— |
|
|
|
|
|
|
|
|
|
|
|
|
|
|
|
|
|
|
|
|
|
|
|
|
|
|
|
|
|
|
Spring, TX |
|
|
|
|
|
|
|
|
|
|
|
|
— |
|
|
|
— |
|
|
|
|
|
|
|
|
|
|
|
|
|
|
|
|
|
|
|
|
|
|
|
|
|
|
|
|
|
|
Chandler, AZ |
|
|
|
|
|
|
|
|
|
|
|
|
— |
|
|
|
— |
|
|
|
|
|
|
|
|
|
|
|
|
|
|
|
|
|
|
|
|
|
|
|
|
|
|
|
|
|
|
Chandler, AZ |
|
|
|
|
|
|
|
|
|
|
|
|
— |
|
|
|
— |
|
|
|
|
|
|
|
|
|
|
|
|
|
|
|
|
|
|
|
|
|
|
|
|
|
|
|
|
|
|
Cheadle, UK |
|
|
|
|
|
|
|
|
|
|
|
|
|
|
|
|
— |
|
|
|
|
|
|
|
|
|
|
|
|
|
|
|
|
|
|
|
|
|
|
|
|
|
|
|
|
|
|
Cheraw, SC |
|
|
|
|
|
|
|
|
|
|
|
|
— |
|
|
|
— |
|
|
|
|
|
|
|
|
|
|
|
|
|
|
|
|
|
|
|
|
|
|
|
|
|
|
|
|
|
|
Crown Point, IN |
|
|
|
|
|
|
|
|
|
|
|
|
— |
|
|
|
— |
|
|
|
|
|
|
|
|
|
|
|
|
|
|
|
|
|
|
|
|
|
|
|
|
|
|
|
|
|
|
Katy, TX |
|
|
|
|
|
|
|
|
|
|
|
|
— |
|
|
|
— |
|
|
|
|
|
|
|
|
|
|
|
|
|
|
|
|
|
|
|
|
|
|
|
|
|
|
|
|
|
|
Webster, TX |
|
|
|
|
|
|
|
|
|
|
|
|
— |
|
|
|
— |
|
|
|
|
|
|
|
|
|
|
|
|
|
|
|
|
|
|
|
|
|
|
|
|
|
|
|
|
|
|
Clarksville, TX |
|
|
|
|
|
|
|
|
|
|
|
|
— |
|
|
|
— |
|
|
|
|
|
|
|
|
|
|
|
|
|
|
|
— |
|
|
|
|
|
|
|
|
|
|
|
|
|
|
Commerce City, TX |
|
|
|
|
|
|
|
|
|
|
|
|
— |
|
|
|
— |
|
|
|
|
|
|
|
|
|
|
|
|
|
|
|
|
|
|
|
|
|
|
|
|
|
|
|
|
|
|
Conroe, TX |
|
|
|
|
|
|
|
|
|
|
|
|
— |
|
|
|
— |
|
|
|
|
|
|
|
|
|
|
|
|
|
|
|
|
|
|
|
|
|
|
|
|
|
|
|
|
|
|
Converse, TX |
|
|
|
|
|
|
|
|
|
|
|
|
— |
|
|
|
— |
|
|
|
|
|
|
|
|
|
|
|
|
|
|
|
|
|
|
|
|
|
|
|
|
|
|
|
|
|
|
Croydon, UK |
|
|
|
|
|
|
|
|
|
|
|
|
|
|
|
|
— |
|
|
|
|
|
|
|
|
|
|
|
|
|
|
|
|
|
|
|
|
|
|
|
|
|
|
|
|
|
|
The Woodlands, TX |
|
|
|
|
|
|
|
|
|
|
|
|
— |
|
|
|
— |
|
|
|
|
|
|
|
|
|
|
|
|
|
|
|
|
|
|
|
|
|
|
|
|
|
|
|
|
|
|
Houston, TX |
|
|
|
|
|
|
|
|
|
|
|
|
— |
|
|
|
— |
|
|
|
|
|
|
|
|
|
|
|
|
|
|
|
|
|
|
|
|
|
|
|
|
|
|
|
|
|
|
Dahlen, Germany |
|
|
|
|
|
|
|
|
|
|
|
|
|
|
|
|
— |
|
|
|
|
|
|
|
|
|
|
|
|
|
|
|
|
|
|
|
|
|
|
|
|
|
|
|
|
|
|
Dallas, TX |
|
|
|
|
|
|
|
|
|
|
|
|
— |
|
|
|
|
|
|
|
|
|
|
|
|
|
|
|
|
|
|
|
|
|
|
|
|
|
|
|
|
|
|
|
|
|
|
Darlington, UK |
|
|
|
|
|
|
|
|
|
|
|
|
|
|
|
|
— |
|
|
|
|
|
|
|
|
|
|
|
|
|
|
|
|
|
|
|
|
|
|
|
|
|
|
|
|
|
|
Denver, CO |
|
|
|
|
|
|
|
|
|
|
|
|
— |
|
|
|
— |
|
|
|
|
|
|
|
|
|
|
|
|
|
|
|
|
|
|
|
|
|
|
|
|
|
|
|
|
|
|
Denville, NJ |
|
|
|
|
|
|
|
|
|
|
|
|
— |
|
|
|
— |
|
|
|
|
|
|
|
|
|
|
|
|
|
|
|
|
|
|
|
|
|
|
|
|
|
|
|
|
|
|
DeSoto, TX |
|
|
|
|
|
|
|
|
|
|
|
|
— |
|
|
|
— |
|
|
|
|
|
|
|
|
|
|
|
|
|
|
|
|
|
|
|
|
|
|
|
|
|
|
|
|
|
|
Detroit, MI |
|
|
|
|
|
|
|
|
|
|
|
|
— |
|
|
|
( |
) |
|
|
|
|
|
|
|
|
|
|
|
|
|
|
|
|
|
|
|
|
|
|
|
|
|
|
|
|
|
San Antonio, TX |
|
|
|
|
|
|
|
|
|
|
|
|
— |
|
|
|
— |
|
|
|
|
|
|
|
|
|
|
|
|
|
|
|
|
|
|
|
|
|
|
|
|
|
|
|
|
|
|
Dodge City, KS |
|
|
|
|
|
|
|
|
|
|
|
|
— |
|
|
|
— |
|
|
|
|
|
|
|
|
|
|
|
|
|
|
|
|
|
|
|
|
|
|
|
|
|
|
|
|
|
|
Dorchester, MA |
|
|
|
|
|
|
|
|
|
|
|
|
|
|
|
|
— |
|
|
|
|
|
|
|
|
|
|
|
|
|
|
|
|
|
|
|
|
|
|
|
|
|
|
|
|
|
|
Dorchester, UK |
|
|
|
|
|
|
|
|
|
|
|
|
|
|
|
|
— |
|
|
|
|
|
|
|
|
|
|
|
|
|
|
|
|
|
|
|
|
|
|
|
|
|
|
|
|
|
110
|
|
|
|
|
Initial Costs |
|
|
Additions Subsequent to Acquisition |
|
|
Cost at December 31, 2020(1) |
|
|
Accumulated |
|
|
|
|
|
|
|
|
|
|
Life on which depreciation in latest income statements is |
|
|||||||||||||||||||||
|
Location |
|
Type of Property |
|
Land |
|
|
Buildings |
|
|
Improve- ments |
|
|
Carrying Costs |
|
|
Land |
|
|
Buildings |
|
|
Total |
|
|
Depreciation |
|
|
Encum- brances |
|
|
Date of Construction |
|
Date Acquired |
|
computed (Years) |
|
||||||||||
|
|
|
(Dollar amounts in thousands) |
|
|||||||||||||||||||||||||||||||||||||||||||
|
Dover, NJ |
|
|
|
|
|
|
|
|
|
|
|
|
— |
|
|
|
— |
|
|
|
|
|
|
|
|
|
|
|
|
|
|
|
|
|
|
|
|
|
|
|
|
|
|
|
|
|
|
Droitwich, UK |
|
|
|
|
— |
|
|
|
|
|
|
|
|
|
|
|
— |
|
|
|
|
|
|
|
|
|
|
|
|
|
|
|
|
|
|
|
|
|
|
|
|
|
|
|
|
|
|
El Paso, TX |
|
|
|
|
|
|
|
|
|
|
|
|
— |
|
|
|
— |
|
|
|
|
|
|
|
|
|
|
|
|
|
|
|
— |
|
|
|
|
|
|
|
|
|
|
|
|
|
|
Euxton, UK |
|
|
|
|
|
|
|
|
|
|
|
|
|
|
|
|
— |
|
|
|
|
|
|
|
|
|
|
|
|
|
|
|
|
|
|
|
|
|
|
|
|
|
|
|
|
|
|
Houston, TX |
|
|
|
|
|
|
|
|
|
|
|
|
— |
|
|
|
— |
|
|
|
|
|
|
|
|
|
|
|
|
|
|
|
|
|
|
|
|
|
|
|
|
|
|
|
|
|
|
Fairmont, CA |
|
|
|
|
|
|
|
|
|
|
|
|
|
|
|
|
— |
|
|
|
|
|
|
|
|
|
|
|
|
|
|
|
|
|
|
|
|
|
|
|
|
|
|
|
|
|
|
Fall River, MA |
|
|
|
|
|
|
|
|
|
|
|
|
|
|
|
|
— |
|
|
|
|
|
|
|
|
|
|
|
|
|
|
|
|
|
|
|
|
|
|
|
|
|
|
|
|
|
|
Firestone, TX |
|
|
|
|
|
|
|
|
|
|
|
|
— |
|
|
|
— |
|
|
|
|
|
|
|
|
|
|
|
|
|
|
|
|
|
|
|
|
|
|
|
|
|
|
|
|
|
|
Flagstaff, AZ |
|
|
|
|
|
|
|
|
|
|
|
|
— |
|
|
|
— |
|
|
|
|
|
|
|
|
|
|
|
|
|
|
|
|
|
|
|
|
|
|
|
|
|
|
|
|
|
|
Florence, AZ |
|
|
|
|
|
|
|
|
|
|
|
|
|
|
|
|
— |
|
|
|
|
|
|
|
|
|
|
|
|
|
|
|
|
|
|
|
|
|
|
|
|
|
|
|
|
|
|
Folsom, CA |
|
|
|
|
|
|
|
|
|
|
|
|
— |
|
|
|
— |
|
|
|
|
|
|
|
|
|
|
|
|
|
|
|
|
|
|
|
|
|
|
|
|
|
|
|
|
|
|
Fort Lauderdale, FL |
|
|
|
|
|
|
|
|
|
|
|
|
— |
|
|
|
|
|
|
|
|
|
|
|
|
|
|
|
|
|
|
|
|
|
|
|
|
|
|
|
|
|
|
|
|
|
|
Fountain, CO |
|
|
|
|
|
|
|
|
|
|
|
|
— |
|
|
|
— |
|
|
|
|
|
|
|
|
|
|
|
|
|
|
|
|
|
|
|
|
|
|
|
|
|
|
|
|
|
|
Fresno, CA |
|
|
|
|
|
|
|
|
|
|
|
|
— |
|
|
|
— |
|
|
|
|
|
|
|
|
|
|
|
|
|
|
|
|
|
|
|
|
|
|
|
|
|
|
|
|
|
|
Frisco, TX |
|
|
|
|
|
|
|
|
|
|
|
|
|
|
|
|
( |
) |
|
|
|
|
|
|
|
|
|
|
|
|
|
|
|
|
|
|
|
|
|
|
|
|
|
|
|
|
|
Garden Grove, CA |
|
|
|
|
|
|
|
|
|
|
|
|
— |
|
|
|
|
|
|
|
|
|
|
|
|
|
|
|
|
|
|
|
|
|
|
|
|
|
|
|
|
|
|
|
|
|
|
Garland, TX |
|
|
|
|
|
|
|
|
|
|
|
|
— |
|
|
|
— |
|
|
|
|
|
|
|
|
|
|
|
|
|
|
|
|
|
|
|
|
|
|
|
|
|
|
|
|
|
|
Garden Grove, CA |
|
|
|
|
|
|
|
|
|
|
|
|
— |
|
|
|
|
|
|
|
|
|
|
|
|
|
|
|
|
|
|
|
|
|
|
|
|
|
|
|
|
|
|
|
|
|
|
Gilbert, AZ |
|
|
|
|
|
|
|
|
|
|
|
|
— |
|
|
|
— |
|
|
|
|
|
|
|
|
|
|
|
|
|
|
|
|
|
|
|
|
|
|
|
|
|
|
|
|
|
|
Gilbert, AZ |
|
|
|
|
|
|
|
|
|
|
|
|
— |
|
|
|
— |
|
|
|
|
|
|
|
|
|
|
|
|
|
|
|
|
|
|
|
|
|
|
|
|
|
|
|
|
|
|
Glasgow, UK |
|
|
|
|
|
|
|
|
|
|
|
|
|
|
|
|
— |
|
|
|
|
|
|
|
|
|
|
|
|
|
|
|
|
|
|
|
|
|
|
|
|
|
|
|
|
|
|
Glen Waverly, Australia |
|
|
|
|
|
|
|
|
|
|
|
|
|
|
|
|
— |
|
|
|
|
|
|
|
|
|
|
|
|
|
|
|
|
|
|
|
|
|
|
|
|
|
|
|
|
|
|
Glendale, AZ |
|
|
|
|
|
|
|
|
|
|
|
|
— |
|
|
|
— |
|
|
|
|
|
|
|
|
|
|
|
|
|
|
|
|
|
|
|
|
|
|
|
|
|
|
|
|
|
|
Gloucester, UK |
|
|
|
|
|
|
|
|
|
|
|
|
|
|
|
|
— |
|
|
|
|
|
|
|
|
|
|
|
|
|
|
|
|
|
|
|
|
|
|
|
|
|
|
|
|
|
|
Goodyear, AZ |
|
|
|
|
|
|
|
|
|
|
|
|
— |
|
|
|
— |
|
|
|
|
|
|
|
|
|
|
|
|
|
|
|
|
|
|
|
|
|
|
|
|
|
|
|
|
|
|
Great Missenden, UK |
|
|
|
|
|
|
|
|
|
|
|
|
|
|
|
|
— |
|
|
|
|
|
|
|
|
|
|
|
|
|
|
|
|
|
|
|
|
|
|
|
|
|
|
|
|
|
|
Guildford, UK |
|
|
|
|
|
|
|
|
|
|
|
|
|
|
|
|
— |
|
|
|
|
|
|
|
|
|
|
|
|
|
|
|
|
|
|
|
|
|
|
|
|
|
|
|
|
|
|
Halsall, UK |
|
|
|
|
|
|
|
|
|
|
|
|
|
|
|
|
— |
|
|
|
|
|
|
|
|
|
|
|
|
|
|
|
|
|
|
|
|
|
|
|
|
|
|
|
|
|
|
Harrow, UK |
|
|
|
|
|
|
|
|
|
|
|
|
|
|
|
|
— |
|
|
|
|
|
|
|
|
|
|
|
|
|
|
|
|
|
|
|
|
|
|
|
|
|
|
|
|
|
|
Hartsville, SC |
|
|
|
|
|
|
|
|
|
|
|
|
— |
|
|
|
— |
|
|
|
|
|
|
|
|
|
|
|
|
|
|
|
|
|
|
|
|
|
|
|
|
|
|
|
|
|
|
Hastings, PA |
|
|
|
|
|
|
|
|
|
|
|
|
— |
|
|
|
— |
|
|
|
|
|
|
|
|
|
|
|
|
|
|
|
|
|
|
|
|
|
|
|
|
|
|
|
|
|
|
Hausman, TX |
|
|
|
|
|
|
|
|
|
|
|
|
— |
|
|
|
— |
|
|
|
|
|
|
|
|
|
|
|
|
|
|
|
|
|
|
|
|
|
|
|
|
|
|
|
|
|
|
Haverhill, MA |
|
|
|
|
|
|
|
|
|
|
|
|
|
|
|
|
— |
|
|
|
|
|
|
|
|
|
|
|
|
|
|
|
|
|
|
|
|
|
|
|
|
|
|
|
|
|
|
Helotes, TX |
|
|
|
|
|
|
|
|
|
|
|
|
— |
|
|
|
— |
|
|
|
|
|
|
|
|
|
|
|
|
|
|
|
|
|
|
|
|
|
|
|
|
|
|
|
|
|
|
Highland Village, TX |
|
|
|
|
|
|
|
|
|
|
|
|
— |
|
|
|
— |
|
|
|
|
|
|
|
|
|
|
|
|
|
|
|
|
|
|
|
|
|
|
|
|
|
|
|
|
|
|
Hill County, TX |
|
|
|
|
|
|
|
|
|
|
|
|
— |
|
|
|
— |
|
|
|
|
|
|
|
|
|
|
|
|
|
|
|
|
|
|
|
|
|
|
|
|
|
|
|
|
|
|
Warren, OH |
|
|
|
|
|
|
|
|
|
|
|
|
|
|
|
|
— |
|
|
|
|
|
|
|
|
|
|
|
|
|
|
|
|
|
|
|
|
|
|
|
|
|
|
|
|
|
|
Hoover, AL |
|
|
|
|
— |
|
|
|
|
|
|
|
— |
|
|
|
— |
|
|
|
— |
|
|
|
|
|
|
|
|
|
|
|
|
|
|
|
|
|
|
|
|
|
|
|
|
|
|
Hoover, AL |
|
|
|
|
— |
|
|
|
|
|
|
|
|
|
|
|
— |
|
|
|
— |
|
|
|
|
|
|
|
|
|
|
|
|
|
|
|
|
|
|
|
|
|
|
|
|
|
|
Hope, AR |
|
|
|
|
|
|
|
|
|
|
|
|
|
|
|
|
— |
|
|
|
|
|
|
|
|
|
|
|
|
|
|
|
|
|
|
|
|
|
|
|
|
|
|
|
|
|
|
Hot Springs, AR |
|
|
|
|
|
|
|
|
|
|
|
|
|
|
|
|
— |
|
|
|
|
|
|
|
|
|
|
|
|
|
|
|
|
|
|
|
|
|
|
|
|
|
|
|
|
|
|
Houston, TX |
|
|
|
|
|
|
|
|
|
|
|
|
|
|
|
|
— |
|
|
|
|
|
|
|
|
|
|
|
|
|
|
|
|
|
|
|
|
|
|
|
|
|
|
|
|
|
111
|
|
|
|
|
Initial Costs |
|
|
Additions Subsequent to Acquisition |
|
|
Cost at December 31, 2020(1) |
|
|
Accumulated |
|
|
|
|
|
|
|
|
|
|
Life on which depreciation in latest income statements is |
|
|||||||||||||||||||||
|
Location |
|
Type of Property |
|
Land |
|
|
Buildings |
|
|
Improve- ments |
|
|
Carrying Costs |
|
|
Land |
|
|
Buildings |
|
|
Total |
|
|
Depreciation |
|
|
Encum- brances |
|
|
Date of Construction |
|
Date Acquired |
|
computed (Years) |
|
||||||||||
|
|
|
(Dollar amounts in thousands) |
|
|||||||||||||||||||||||||||||||||||||||||||
|
Houston, TX |
|
|
|
|
|
|
|
|
|
|
|
|
— |
|
|
|
— |
|
|
|
|
|
|
|
|
|
|
|
|
|
|
|
— |
|
|
|
|
|
|
|
|
|
|
|
|
|
|
Highlands Ranch, CO |
|
|
|
|
|
|
|
|
|
|
|
|
— |
|
|
|
— |
|
|
|
|
|
|
|
|
|
|
|
|
|
|
|
|
|
|
|
|
|
|
|
|
|
|
|
|
|
|
Idaho Falls, ID |
|
|
|
|
|
|
|
|
|
|
|
|
|
|
|
|
|
|
|
|
|
|
|
|
|
|
|
|
|
|
|
|
|
|
|
|
|
|
|
|
|
|
|
|
|
|
|
Idaho Falls, ID |
|
|
|
|
|
|
|
|
|
|
|
|
— |
|
|
|
— |
|
|
|
|
|
|
|
|
|
|
|
|
|
|
|
|
|
|
|
|
|
|
|
|
|
|
|
|
|
|
Johnstown, PA |
|
|
|
|
|
|
|
|
|
|
|
|
— |
|
|
|
|
|
|
|
|
|
|
|
|
|
|
|
|
|
|
|
|
|
|
|
|
|
|
|
|
|
|
|
|
|
|
Kansas City, KS |
|
|
|
|
|
|
|
|
|
|
|
|
— |
|
|
|
— |
|
|
|
|
|
|
|
|
|
|
|
|
|
|
|
|
|
|
|
|
|
|
|
|
|
|
|
|
|
|
Kansas City, MO |
|
|
|
|
|
|
|
|
|
|
|
|
— |
|
|
|
— |
|
|
|
|
|
|
|
|
|
|
|
|
|
|
|
|
|
|
|
|
|
|
|
|
|
|
|
|
|
|
Katy, TX |
|
|
|
|
|
|
|
|
|
|
|
|
— |
|
|
|
— |
|
|
|
|
|
|
|
|
|
|
|
|
|
|
|
|
|
|
|
|
|
|
|
|
|
|
|
|
|
|
Kingswood, Australia |
|
|
|
|
|
|
|
|
|
|
|
|
|
|
|
|
— |
|
|
|
|
|
|
|
|
|
|
|
|
|
|
|
|
|
|
|
|
|
|
|
|
|
|
|
|
|
|
Camden, SC |
|
|
|
|
— |
|
|
|
|
|
|
|
— |
|
|
|
— |
|
|
|
— |
|
|
|
|
|
|
|
|
|
|
|
|
|
|
|
|
|
|
|
|
|
|
|
|
|
|
Lafayette, IN |
|
|
|
|
|
|
|
|
|
|
|
|
( |
) |
|
|
— |
|
|
|
|
|
|
|
|
|
|
|
|
|
|
|
|
|
|
|
|
|
|
|
|
|
|
|
|
|
|
Lander, WY |
|
|
|
|
|
|
|
|
|
|
|
|
— |
|
|
|
— |
|
|
|
|
|
|
|
|
|
|
|
|
|
|
|
|
|
|
|
|
|
|
|
|
|
|
|
|
|
|
Lawton, OK |
|
|
|
|
|
|
|
|
|
|
|
|
— |
|
|
|
— |
|
|
|
|
|
|
|
|
|
|
|
|
|
|
|
|
|
|
|
|
|
|
|
|
|
|
|
|
|
|
Layton, UT |
|
|
|
|
|
|
|
|
|
|
|
|
|
|
|
|
— |
|
|
|
|
|
|
|
|
|
|
|
|
|
|
|
|
|
|
|
|
|
|
|
|
|
|
|
|
|
|
Leawood, KS |
|
|
|
|
|
|
|
|
|
|
|
|
— |
|
|
|
— |
|
|
|
|
|
|
|
|
|
|
|
|
|
|
|
|
|
|
|
|
|
|
|
|
|
|
|
|
|
|
Lehi, UT |
|
|
|
|
|
|
|
|
|
|
|
|
|
|
|
|
( |
) |
|
|
|
|
|
|
|
|
|
|
|
|
|
|
|
|
|
|
|
|
|
|
|
|
|
|
|
|
|
Lewiston, ID |
|
|
|
|
|
|
|
|
|
|
|
|
— |
|
|
|
— |
|
|
|
|
|
|
|
|
|
|
|
|
|
|
|
|
|
|
|
|
|
|
|
|
|
|
|
|
|
|
Little Elm, TX |
|
|
|
|
|
|
|
|
|
|
|
|
— |
|
|
|
— |
|
|
|
|
|
|
|
|
|
|
|
|
|
|
|
|
|
|
|
|
|
|
|
|
|
|
|
|
|
|
Liverpool, Australia |
|
|
|
|
|
|
|
|
|
|
|
|
|
|
|
|
— |
|
|
|
|
|
|
|
|
|
|
|
|
|
|
|
|
|
|
|
|
|
|
|
|
|
|
|
|
|
|
London, UK |
|
|
|
|
|
|
|
|
|
|
|
|
|
|
|
|
— |
|
|
|
|
|
|
|
|
|
|
|
|
|
|
|
|
|
|
|
|
|
|
|
|
|
|
|
|
|
|
London, UK |
|
|
|
|
|
|
|
|
|
|
|
|
|
|
|
|
— |
|
|
|
|
|
|
|
|
|
|
|
|
|
|
|
|
|
|
|
|
|
|
|
|
|
|
|
|
|
|
London, UK |
|
|
|
|
|
|
|
|
|
|
|
|
|
|
|
|
— |
|
|
|
|
|
|
|
|
|
|
|
|
|
|
|
|
|
|
|
|
|
|
|
|
|
|
|
|
|
|
Longmont, CO |
|
|
|
|
|
|
|
|
|
|
|
|
— |
|
|
|
— |
|
|
|
|
|
|
|
|
|
|
|
|
|
|
|
|
|
|
|
|
|
|
|
|
|
|
|
|
|
|
Lubbock, TX |
|
|
|
|
|
|
|
|
|
|
|
|
|
|
|
|
— |
|
|
|
|
|
|
|
|
|
|
|
|
|
|
|
|
|
|
|
|
|
|
|
|
|
|
|
|
|
|
Lynwood, CA |
|
|
|
|
|
|
|
|
|
|
|
|
— |
|
|
|
— |
|
|
|
|
|
|
|
|
|
|
|
|
|
|
|
|
|
|
|
|
|
|
|
|
|
|
|
|
|
|
Mandeville, LA |
|
|
|
|
|
|
|
|
|
|
|
|
— |
|
|
|
— |
|
|
|
|
|
|
|
|
|
|
|
|
|
|
|
|
|
|
|
|
|
|
|
|
|
|
|
|
|
|
Marrero, LA |
|
|
|
|
|
|
|
|
|
|
|
|
— |
|
|
|
— |
|
|
|
|
|
|
|
|
|
|
|
|
|
|
|
|
|
|
|
|
|
|
|
|
|
|
|
|
|
|
McKinney, TX |
|
|
|
|
|
|
|
|
|
|
|
|
— |
|
|
|
— |
|
|
|
|
|
|
|
|
|
|
|
|
|
|
|
|
|
|
|
|
|
|
|
|
|
|
|
|
|
|
McMinnville, OR |
|
|
|
|
|
|
|
|
|
|
|
|
— |
|
|
|
— |
|
|
|
|
|
|
|
|
|
|
|
|
|
|
|
|
|
|
|
|
|
|
|
|
|
|
|
|
|
|
Melbourne, FL |
|
|
|
|
|
|
|
|
|
|
|
|
|
|
|
|
— |
|
|
|
|
|
|
|
|
|
|
|
|
|
|
|
|
|
|
|
|
|
|
|
|
|
|
|
|
|
|
Mesa, AZ |
|
|
|
|
|
|
|
|
|
|
|
|
|
|
|
|
— |
|
|
|
|
|
|
|
|
|
|
|
|
|
|
|
|
|
|
|
|
|
|
|
|
|
|
|
|
|
|
Meyersdale, PA |
|
|
|
|
|
|
|
|
|
|
|
|
— |
|
|
|
— |
|
|
|
|
|
|
|
|
|
|
|
|
|
|
|
|
|
|
|
|
|
|
|
|
|
|
|
|
|
|
Milton Keynes, UK |
|
|
|
|
|
|
|
|
|
|
|
|
|
|
|
|
— |
|
|
|
|
|
|
|
|
|
|
|
|
|
|
|
|
|
|
|
|
|
|
|
|
|
|
|
|
|
|
Mount Pleasant, SC |
|
|
|
|
|
|
|
|
|
|
|
|
— |
|
|
|
— |
|
|
|
|
|
|
|
|
|
|
|
|
|
|
|
|
|
|
|
|
|
|
|
|
|
|
|
|
|
|
Phoenix, AZ |
|
|
|
|
|
|
|
|
|
|
|
|
— |
|
|
|
— |
|
|
|
|
|
|
|
|
|
|
|
|
|
|
|
|
|
|
|
|
|
|
|
|
|
|
|
|
|
|
Methuen, MA |
|
|
|
|
|
|
|
|
|
|
|
|
|
|
|
|
— |
|
|
|
|
|
|
|
|
|
|
|
|
|
|
|
|
|
|
|
|
|
|
|
|
|
|
|
|
|
|
Bloomington, IN |
|
|
|
|
|
|
|
|
|
|
|
|
|
|
|
|
|
|
|
|
|
|
|
|
|
|
|
|
|
|
|
|
|
|
|
|
|
|
|
|
|
|
|
|
|
|
|
Montclair, NJ |
|
|
|
|
|
|
|
|
|
|
|
|
|
|
|
|
— |
|
|
|
|
|
|
|
|
|
|
|
|
|
|
|
|
|
|
|
|
|
|
|
|
|
|
|
|
|
|
San Antonio, TX |
|
|
|
|
|
|
|
|
|
|
|
|
— |
|
|
|
— |
|
|
|
|
|
|
|
|
|
|
|
|
|
|
|
|
|
|
|
|
|
|
|
|
|
|
|
|
|
|
Newark, NJ |
|
|
|
|
|
|
|
|
|
|
|
|
— |
|
|
|
— |
|
|
|
|
|
|
|
|
|
|
|
|
|
|
|
|
|
|
|
|
|
|
|
|
|
|
|
|
|
|
New Braunfels, TX |
|
|
|
|
|
|
|
|
|
|
|
|
— |
|
|
|
— |
|
|
|
|
|
|
|
|
|
|
|
|
|
|
|
|
|
|
|
|
|
|
|
|
|
|
|
|
|
|
Colorado Springs, CO |
|
|
|
|
|
|
|
|
|
|
|
|
— |
|
|
|
— |
|
|
|
|
|
|
|
|
|
|
|
|
|
|
|
|
|
|
|
|
|
|
|
|
|
|
|
|
|
112
|
|
|
|
|
Initial Costs |
|
|
Additions Subsequent to Acquisition |
|
|
Cost at December 31, 2020(1) |
|
|
Accumulated |
|
|
|
|
|
|
|
|
|
|
Life on which depreciation in latest income statements is |
|
|||||||||||||||||||||
|
Location |
|
Type of Property |
|
Land |
|
|
Buildings |
|
|
Improve- ments |
|
|
Carrying Costs |
|
|
Land |
|
|
Buildings |
|
|
Total |
|
|
Depreciation |
|
|
Encum- brances |
|
|
Date of Construction |
|
Date Acquired |
|
computed (Years) |
|
||||||||||
|
|
|
(Dollar amounts in thousands) |
|
|||||||||||||||||||||||||||||||||||||||||||
|
Northland, MO |
|
|
|
|
|
|
|
|
|
|
|
|
— |
|
|
|
— |
|
|
|
|
|
|
|
|
|
|
|
|
|
|
|
|
|
|
|
|
|
|
|
|
|
|
|
|
|
|
Norwood, MA |
|
|
|
|
|
|
|
|
|
|
|
|
|
|
|
|
— |
|
|
|
|
|
|
|
|
|
|
|
|
|
|
|
|
|
|
|
|
|
|
|
|
|
|
|
|
|
|
Nottingham, UK |
|
|
|
|
|
|
|
|
|
|
|
|
|
|
|
|
— |
|
|
|
|
|
|
|
|
|
|
|
|
|
|
|
|
|
|
|
|
|
|
|
|
|
|
|
|
|
|
Altoona, WI |
|
|
|
|
— |
|
|
|
|
|
|
|
— |
|
|
|
— |
|
|
|
— |
|
|
|
|
|
|
|
|
|
|
|
|
|
|
|
|
|
|
|
|
|
|
|
|
|
|
Odessa, TX |
|
|
|
|
|
|
|
|
|
|
|
|
|
|
|
|
— |
|
|
|
|
|
|
|
|
|
|
|
|
|
|
|
|
|
|
|
|
|
|
|
|
|
|
|
|
|
|
Ogden, UT |
|
|
|
|
|
|
|
|
|
|
|
|
— |
|
|
|
— |
|
|
|
|
|
|
|
|
|
|
|
|
|
|
|
|
|
|
|
|
|
|
|
|
|
|
|
|
|
|
Olathe, KS |
|
|
|
|
|
|
|
|
|
|
|
|
— |
|
|
|
— |
|
|
|
|
|
|
|
|
|
|
|
|
|
|
|
|
|
|
|
|
|
|
|
|
|
|
|
|
|
|
Olympia, WA |
|
|
|
|
|
|
|
|
|
|
|
|
|
|
|
|
— |
|
|
|
|
|
|
|
|
|
|
|
|
|
|
|
|
|
|
|
|
|
|
|
|
|
|
|
|
|
|
Orpington, UK |
|
|
|
|
|
|
|
|
|
|
|
|
|
|
|
|
— |
|
|
|
|
|
|
|
|
|
|
|
|
|
|
|
|
|
|
|
|
|
|
|
|
|
|
|
|
|
|
Ottumwa, IA |
|
|
|
|
|
|
|
|
|
|
|
|
— |
|
|
|
— |
|
|
|
|
|
|
|
|
|
|
|
|
|
|
|
|
|
|
|
|
|
|
|
|
|
|
|
|
|
|
Overland Park, KS |
|
|
|
|
|
|
|
|
|
|
|
|
— |
|
|
|
— |
|
|
|
|
|
|
|
|
|
|
|
|
|
|
|
|
|
|
|
|
|
|
|
|
|
|
|
|
|
|
Overland Park, KS |
|
|
|
|
|
|
|
|
|
|
|
|
— |
|
|
|
— |
|
|
|
|
|
|
|
|
|
|
|
|
|
|
|
|
|
|
|
|
|
|
|
|
|
|
|
|
|
|
Overlook, TX |
|
|
|
|
|
|
|
|
|
|
|
|
|
|
|
|
— |
|
|
|
|
|
|
|
|
|
|
|
|
|
|
|
|
|
|
|
|
|
|
|
|
|
|
|
|
|
|
Palestine, TX |
|
|
|
|
|
|
|
|
|
|
|
|
— |
|
|
|
— |
|
|
|
|
|
|
|
|
|
|
|
|
|
|
|
|
|
|
|
|
|
|
|
|
|
|
|
|
|
|
San Diego, CA |
|
|
|
|
|
|
|
|
|
|
|
|
— |
|
|
|
|
|
|
|
|
|
|
|
|
|
|
|
|
|
|
|
|
|
|
|
|
|
|
|
|
|
|
|
|
|
|
Parker, CO |
|
|
|
|
|
|
|
|
|
|
|
|
— |
|
|
|
— |
|
|
|
|
|
|
|
|
|
|
|
|
|
|
|
|
|
|
|
|
|
|
|
|
|
|
|
|
|
|
Pasco, WA |
|
|
|
|
|
|
|
|
|
|
|
|
— |
|
|
|
— |
|
|
|
|
|
|
|
|
|
|
|
|
|
|
|
|
|
|
|
|
|
|
|
|
|
|
|
|
|
|
Pearland, TX |
|
|
|
|
|
|
|
|
|
|
|
|
— |
|
|
|
— |
|
|
|
|
|
|
|
|
|
|
|
|
|
|
|
|
|
|
|
|
|
|
|
|
|
|
|
|
|
|
Perth, Australia |
|
|
|
|
|
|
|
|
|
|
|
|
|
|
|
|
— |
|
|
|
|
|
|
|
|
|
|
|
|
|
|
|
|
|
|
|
|
|
|
|
|
|
|
|
|
|
|
Petersburg, VA |
|
|
|
|
|
|
|
|
|
|
|
|
— |
|
|
|
— |
|
|
|
|
|
|
|
|
|
|
|
|
|
|
|
|
|
|
|
|
|
|
|
|
|
|
|
|
|
|
Phoenix, AZ |
|
|
|
|
|
|
|
|
|
|
|
|
|
|
|
|
— |
|
|
|
|
|
|
|
|
|
|
|
|
|
|
|
|
|
|
|
|
|
|
|
|
|
|
|
|
|
|
Phoenix, AZ |
|
|
|
|
|
|
|
|
|
|
|
|
|
|
|
|
— |
|
|
|
|
|
|
|
|
|
|
|
|
|
|
|
|
|
|
|
|
|
|
|
|
|
|
|
|
|
|
Plano, TX |
|
|
|
|
|
|
|
|
|
|
|
|
— |
|
|
|
— |
|
|
|
|
|
|
|
|
|
|
|
|
|
|
|
|
|
|
|
|
|
|
|
|
|
|
|
|
|
|
Poole, UK |
|
|
|
|
|
|
|
|
|
|
|
|
|
|
|
|
— |
|
|
|
|
|
|
|
|
|
|
|
|
|
|
|
|
|
|
|
|
|
|
|
|
|
|
|
|
|
|
Poplar Bluff, MO |
|
|
|
|
|
|
|
|
|
|
|
|
— |
|
|
|
|
|
|
|
|
|
|
|
|
|
|
|
|
|
|
|
|
|
|
|
|
|
|
|
|
|
|
|
|
|
|
Port Arthur, TX |
|
|
|
|
|
|
|
|
|
|
|
|
|
|
|
|
— |
|
|
|
|
|
|
|
|
|
|
|
|
|
|
|
|
|
|
|
|
|
|
|
|
|
|
|
|
|
|
Port Huron, MI |
|
|
|
|
|
|
|
|
|
|
|
|
— |
|
|
|
— |
|
|
|
|
|
|
|
|
|
|
|
|
|
|
|
|
|
|
|
|
|
|
|
|
|
|
|
|
|
|
Post Falls, ID |
|
|
|
|
|
|
|
|
|
|
|
|
|
|
|
|
— |
|
|
|
|
|
|
|
|
|
|
|
|
|
|
|
|
|
|
|
|
|
|
|
|
|
|
|
|
|
|
Princes Risborough, UK |
|
|
|
|
|
|
|
|
— |
|
|
|
— |
|
|
|
— |
|
|
|
|
|
|
|
— |
|
|
|
|
|
|
|
— |
|
|
|
|
|
|
N/A |
|
|
|
|
|
|
|
San Antonio, TX |
|
|
|
|
|
|
|
|
|
|
|
|
— |
|
|
|
— |
|
|
|
|
|
|
|
|
|
|
|
|
|
|
|
|
|
|
|
|
|
|
|
|
|
|
|
|
|
|
Reading, UK |
|
|
|
|
|
|
|
|
|
|
|
|
|
|
|
|
— |
|
|
|
|
|
|
|
|
|
|
|
|
|
|
|
|
|
|
|
|
|
|
|
|
|
|
|
|
|
|
Reading, UK |
|
|
|
|
|
|
|
|
|
|
|
|
|
|
|
|
— |
|
|
|
|
|
|
|
|
|
|
|
|
|
|
|
— |
|
|
|
|
|
|
|
|
|
|
|
|
|
|
Redding, CA |
|
|
|
|
|
|
|
|
|
|
|
|
— |
|
|
|
|
|
|
|
|
|
|
|
|
|
|
|
|
|
|
|
|
|
|
|
|
|
|
|
|
|
|
|
|
|
|
Richmond, VA |
|
|
|
|
|
|
|
|
|
|
|
|
— |
|
|
|
— |
|
|
|
|
|
|
|
|
|
|
|
|
|
|
|
|
|
|
|
|
|
|
|
|
|
|
|
|
|
|
Ringwood, Australia |
|
|
|
|
|
|
|
|
|
|
|
|
|
|
|
|
— |
|
|
|
|
|
|
|
|
|
|
|
|
|
|
|
|
|
|
|
|
|
|
|
|
|
|
|
|
|
|
Riverton, WY |
|
|
|
|
|
|
|
|
|
|
|
|
— |
|
|
|
— |
|
|
|
|
|
|
|
|
|
|
|
|
|
|
|
|
|
|
|
|
|
|
|
|
|
|
|
|
|
|
Austin, TX |
|
|
|
|
|
|
|
|
|
|
|
|
— |
|
|
|
— |
|
|
|
|
|
|
|
|
|
|
|
|
|
|
|
|
|
|
|
|
|
|
|
|
|
|
|
|
|
|
Roaring Springs, PA |
|
|
|
|
|
|
|
|
|
|
|
|
— |
|
|
|
— |
|
|
|
|
|
|
|
|
|
|
|
|
|
|
|
|
|
|
|
|
|
|
|
|
|
|
|
|
|
|
Rochdale, MA |
|
|
|
|
|
|
|
|
|
|
|
|
— |
|
|
|
— |
|
|
|
|
|
|
|
|
|
|
|
|
|
|
|
|
|
|
|
|
|
|
|
|
|
|
|
|
|
|
Rochdale, MA |
|
|
|
|
|
|
|
|
|
|
|
|
— |
|
|
|
— |
|
|
|
|
|
|
|
|
|
|
|
|
|
|
|
|
|
|
|
|
|
|
|
|
|
|
|
|
|
|
Rochdale, UK |
|
|
|
|
|
|
|
|
|
|
|
|
|
|
|
|
— |
|
|
|
|
|
|
|
|
|
|
|
|
|
|
|
|
|
|
|
|
|
|
|
|
|
|
|
|
|
|
Rockledge, FL |
|
|
|
|
|
|
|
|
|
|
|
|
|
|
|
|
— |
|
|
|
|
|
|
|
|
|
|
|
|
|
|
|
|
|
|
|
|
|
|
|
|
|
|
|
|
|
|
Roeland Park, KS |
|
|
|
|
|
|
|
|
|
|
|
|
— |
|
|
|
— |
|
|
|
|
|
|
|
|
|
|
|
|
|
|
|
|
|
|
|
|
|
|
|
|
|
|
|
|
|
|
Rosenberg, TX |
|
|
|
|
|
|
|
|
|
|
|
|
— |
|
|
|
— |
|
|
|
|
|
|
|
|
|
|
|
|
|
|
|
|
|
|
|
|
|
|
|
|
|
|
|
|
|
113
|
|
|
|
|
Initial Costs |
|
|
Additions Subsequent to Acquisition |
|
|
Cost at December 31, 2020(1) |
|
|
Accumulated |
|
|
|
|
|
|
|
|
|
|
Life on which depreciation in latest income statements is |
|
|||||||||||||||||||||
|
Location |
|
Type of Property |
|
Land |
|
|
Buildings |
|
|
Improve- ments |
|
|
Carrying Costs |
|
|
Land |
|
|
Buildings |
|
|
Total |
|
|
Depreciation |
|
|
Encum- brances |
|
|
Date of Construction |
|
Date Acquired |
|
computed (Years) |
|
||||||||||
|
|
|
(Dollar amounts in thousands) |
|
|||||||||||||||||||||||||||||||||||||||||||
|
Rowley, UK |
|
|
|
|
|
|
|
|
|
|
|
|
|
|
|
|
— |
|
|
|
|
|
|
|
|
|
|
|
|
|
|
|
|
|
|
|
|
|
|
|
|
|
|
|
|
|
|
Columbus, OH |
|
|
|
|
|
|
|
|
— |
|
|
|
— |
|
|
|
— |
|
|
|
|
|
|
|
— |
|
|
|
|
|
|
|
— |
|
|
|
|
|
|
|
|
|
|
- |
|
|
|
Salt Lake City, UT |
|
|
|
|
|
|
|
|
|
|
|
|
|
|
|
|
— |
|
|
|
|
|
|
|
|
|
|
|
|
|
|
|
|
|
|
|
|
|
|
|
|
|
|
|
|
|
|
San Antonio, TX |
|
|
|
|
|
|
|
|
|
|
|
|
|
|
|
|
— |
|
|
|
|
|
|
|
|
|
|
|
|
|
|
|
|
|
|
|
|
|
|
|
|
|
|
|
|
|
|
San Bernardino, CA |
|
|
|
|
|
|
|
|
|
|
|
|
— |
|
|
|
— |
|
|
|
|
|
|
|
|
|
|
|
|
|
|
|
|
|
|
|
|
|
|
|
|
|
|
|
|
|
|
San Dimas, CA |
|
|
|
|
|
|
|
|
|
|
|
|
— |
|
|
|
|
|
|
|
|
|
|
|
|
|
|
|
|
|
|
|
|
|
|
|
|
|
|
|
|
|
|
|
|
|
|
San Dimas, CA |
|
|
|
|
|
|
|
|
|
|
|
|
— |
|
|
|
|
|
|
|
|
|
|
|
|
|
|
|
|
|
|
|
|
|
|
|
|
|
|
|
|
|
|
|
|
|
|
Phoenix, AZ |
|
|
|
|
|
|
|
|
|
|
|
|
— |
|
|
|
— |
|
|
|
|
|
|
|
|
|
|
|
|
|
|
|
|
|
|
|
|
|
|
|
|
|
|
|
|
|
|
Sebastian, FL |
|
|
|
|
|
|
|
|
|
|
|
|
|
|
|
|
— |
|
|
|
|
|
|
|
|
|
|
|
|
|
|
|
|
|
|
|
|
|
|
|
|
|
|
|
|
|
|
Sharon, PA |
|
|
|
|
|
|
|
|
|
|
|
|
|
|
|
|
— |
|
|
|
|
|
|
|
|
|
|
|
|
|
|
|
|
|
|
|
|
|
|
|
|
|
|
|
|
|
|
Shawnee, KS |
|
|
|
|
|
|
|
|
|
|
|
|
— |
|
|
|
— |
|
|
|
|
|
|
|
|
|
|
|
|
|
|
|
|
|
|
|
|
|
|
|
|
|
|
|
|
|
|
Sheffield, UK |
|
|
|
|
|
|
|
|
|
|
|
|
|
|
|
|
— |
|
|
|
|
|
|
|
|
|
|
|
|
|
|
|
|
|
|
|
|
|
|
|
|
|
|
|
|
|
|
Sherman, TX |
|
|
|
|
|
|
|
|
|
|
|
|
— |
|
|
|
— |
|
|
|
|
|
|
|
|
|
|
|
|
|
|
|
|
|
|
|
|
|
|
|
|
|
|
|
|
|
|
Sienna, TX |
|
|
|
|
|
|
|
|
|
|
|
|
— |
|
|
|
— |
|
|
|
|
|
|
|
|
|
|
|
|
|
|
|
|
|
|
|
|
|
|
|
|
|
|
|
|
|
|
Spartanburg, SC |
|
|
|
|
|
|
|
|
|
|
|
|
— |
|
|
|
— |
|
|
|
|
|
|
|
|
|
|
|
|
|
|
|
|
|
|
|
|
|
|
|
|
|
|
|
|
|
|
St. Albans Park, Australia |
|
|
|
|
|
|
|
|
|
|
|
|
|
|
|
|
— |
|
|
|
|
|
|
|
|
|
|
|
|
|
|
|
|
|
|
|
|
|
|
|
|
|
|
|
|
|
|
Stockton, CA |
|
|
|
|
|
|
|
|
— |
|
|
|
— |
|
|
|
— |
|
|
|
|
|
|
|
— |
|
|
|
|
|
|
|
— |
|
|
|
|
|
|
|
|
|
|
|
|
|
|
Strathpine, Australia |
|
|
|
|
|
|
|
|
|
|
|
|
|
|
|
|
— |
|
|
|
|
|
|
|
|
|
|
|
|
|
|
|
|
|
|
|
|
|
|
|
|
|
|
|
|
|
|
Sunnybank, Australia |
|
|
|
|
|
|
|
|
|
|
|
|
|
|
|
|
— |
|
|
|
|
|
|
|
|
|
|
|
|
|
|
|
|
|
|
|
|
|
|
|
|
|
|
|
|
|
|
Sussex, NJ |
|
|
|
|
|
|
|
|
|
|
|
|
— |
|
|
|
— |
|
|
|
|
|
|
|
|
|
|
|
|
|
|
|
|
|
|
|
|
|
|
|
|
|
|
|
|
|
|
Swindon, UK |
|
|
|
|
|
|
|
|
|
|
|
|
|
|
|
|
— |
|
|
|
|
|
|
|
|
|
|
|
|
|
|
|
|
|
|
|
|
|
|
|
|
|
|
|
|
|
|
Houston, TX |
|
|
|
|
|
|
|
|
|
|
|
|
— |
|
|
|
— |
|
|
|
|
|
|
|
|
|
|
|
|
|
|
|
|
|
|
|
|
|
|
|
|
|
|
|
|
|
|
Taunton, MA |
|
|
|
|
|
|
|
|
|
|
|
|
|
|
|
|
— |
|
|
|
|
|
|
|
|
|
|
|
|
|
|
|
|
|
|
|
|
|
|
|
|
|
|
|
|
|
|
Tempe, AZ |
|
|
|
|
|
|
|
|
|
|
|
|
|
|
|
|
— |
|
|
|
|
|
|
|
|
|
|
|
|
|
|
|
|
|
|
|
|
|
|
|
|
|
|
|
|
|
|
Texarkana, TX |
|
|
|
|
|
|
|
|
— |
|
|
|
— |
|
|
|
— |
|
|
|
|
|
|
|
— |
|
|
|
|
|
|
|
— |
|
|
|
|
|
|
|
|
|
|
- |
|
|
|
Thornton, CO |
|
|
|
|
|
|
|
|
|
|
|
|
— |
|
|
|
— |
|
|
|
|
|
|
|
|
|
|
|
|
|
|
|
|
|
|
|
|
|
|
|
|
|
|
|
|
|
|
Toledo, OH |
|
|
|
|
|
|
|
|
|
|
|
|
— |
|
|
|
— |
|
|
|
|
|
|
|
|
|
|
|
|
|
|
|
|
|
|
|
|
|
|
|
|
|
|
|
|
|
|
Tomball, TX |
|
|
|
|
|
|
|
|
|
|
|
|
— |
|
|
|
— |
|
|
|
|
|
|
|
|
|
|
|
|
|
|
|
|
|
|
|
|
|
|
|
|
|
|
|
|
|
|
Torquay, UK |
|
|
|
|
|
|
|
|
|
|
|
|
|
|
|
|
— |
|
|
|
|
|
|
|
|
|
|
|
|
|
|
|
|
|
|
|
|
|
|
|
|
|
|
|
|
|
|
Houston, TX |
|
|
|
|
|
|
|
|
|
|
|
|
— |
|
|
|
— |
|
|
|
|
|
|
|
|
|
|
|
|
|
|
|
|
|
|
|
|
|
|
|
|
|
|
|
|
|
|
League City, TX |
|
|
|
|
|
|
|
|
|
|
|
|
— |
|
|
|
— |
|
|
|
|
|
|
|
|
|
|
|
|
|
|
|
|
|
|
|
|
|
|
|
|
|
|
|
|
|
|
Anaheim, CA |
|
|
|
|
|
|
|
|
|
|
|
|
— |
|
|
|
|
|
|
|
|
|
|
|
|
|
|
|
|
|
|
|
|
|
|
|
|
|
|
|
|
|
|
|
|
|
|
Viseu, Portugal |
|
|
|
|
|
|
|
|
|
|
|
|
|
|
|
|
— |
|
|
|
|
|
|
|
|
|
|
|
|
|
|
|
|
|
|
|
|
|
|
|
|
|
|
|
|
|
|
Wantirna, Australia |
|
|
|
|
|
|
|
|
|
|
|
|
|
|
|
|
— |
|
|
|
|
|
|
|
|
|
|
|
|
|
|
|
|
|
|
|
|
|
|
|
|
|
|
|
|
|
|
Warren, OH |
|
|
|
|
|
|
|
|
|
|
|
|
|
|
|
|
— |
|
|
|
|
|
|
|
|
|
|
|
|
|
|
|
|
|
|
|
|
|
|
|
|
|
|
|
|
|
|
Watsonville, CA |
|
|
|
|
|
|
|
|
|
|
|
|
— |
|
|
|
— |
|
|
|
|
|
|
|
|
|
|
|
|
|
|
|
|
|
|
|
|
|
|
|
|
|
|
|
|
|
|
West Jordan, UT |
|
|
|
|
|
|
|
|
|
|
|
|
|
|
|
|
— |
|
|
|
|
|
|
|
|
|
|
|
|
|
|
|
|
|
|
|
|
|
|
|
|
|
|
|
|
|
|
West Monroe, LA |
|
|
|
|
|
|
|
|
|
|
|
|
|
|
|
|
— |
|
|
|
|
|
|
|
|
|
|
|
|
|
|
|
|
|
|
|
|
|
|
|
|
|
|
|
|
|
|
San Antonio, TX |
|
|
|
|
|
|
|
|
|
|
|
|
— |
|
|
|
— |
|
|
|
|
|
|
|
|
|
|
|
|
|
|
|
|
|
|
|
|
|
|
|
|
|
|
|
|
|
|
West Valley City, UT |
|
|
|
|
|
|
|
|
|
|
|
|
|
|
|
|
( |
) |
|
|
|
|
|
|
|
|
|
|
|
|
|
|
|
|
|
|
|
|
|
|
|
|
|
|
|
|
|
Wichita, KS |
|
|
|
|
|
|
|
|
|
|
|
|
— |
|
|
|
|
|
|
|
|
|
|
|
|
|
|
|
|
|
|
|
|
|
|
|
|
|
|
|
|
|
|
|
|
|
|
Winchester, UK |
|
|
|
|
|
|
|
|
|
|
|
|
|
|
|
|
— |
|
|
|
|
|
|
|
|
|
|
|
|
|
|
|
|
|
|
|
|
|
|
|
|
|
|
|
|
|
|
Windsor, UK |
|
|
|
|
|
|
|
|
|
|
|
|
|
|
|
|
— |
|
|
|
|
|
|
|
|
|
|
|
|
|
|
|
|
|
|
|
|
|
|
|
|
|
|
|
|
|
|
Worthing, UK |
|
|
|
|
|
|
|
|
|
|
|
|
|
|
|
|
— |
|
|
|
|
|
|
|
|
|
|
|
|
|
|
|
|
|
|
|
|
|
|
|
|
|
|
|
|
|
|
Youngstown, OH |
|
|
|
|
|
|
|
|
|
|
|
|
|
|
|
|
— |
|
|
|
|
|
|
|
|
|
|
|
|
|
|
|
|
|
|
|
|
|
|
|
|
|
|
|
|
|
|
|
|
|
|
$ |
|
|
|
$ |
|
|
|
$ |
|
|
|
$ |
|
|
|
$ |
|
|
|
$ |
|
|
|
$ |
|
|
|
$ |
|
|
|
|
|
|
|
|
|
|
|
|
|
|
|
|
(1) |
The aggregate cost for federal income tax purposes is $ |
114
The changes in total real estate assets (excluding construction in progress, intangible lease assets, investment in financing leases, and mortgage loans) are as follows for the years ended (in thousands):
|
|
|
December 31, 2020 |
|
|
|
December 31, 2019 |
|
|
December 31, 2018 |
|
|
|||
|
COST |
|
|
|
|
|
|
|
|
|
|
|
|
|
|
|
Balance at beginning of period |
|
$ |
|
|
|
|
$ |
|
|
|
$ |
|
|
|
|
Acquisitions |
|
|
|
|
|
|
|
|
|
|
|
|
|
|
|
Transfers from construction in progress |
|
|
|
|
|
|
|
— |
|
|
|
|
|
|
|
Additions |
|
|
|
|
|
|
|
|
|
|
|
|
|
|
|
Dispositions |
|
|
( |
) |
|
|
|
( |
) |
|
|
( |
) |
|
|
Other |
|
|
|
|
(2) |
|
|
|
|
(2) |
|
( |
) |
(2) |
|
Balance at end of period |
|
$ |
|
|
|
|
$ |
|
|
|
$ |
|
|
|
The changes in accumulated depreciation are as follows for the years ended (in thousands):
|
|
|
December 31, 2020 |
|
|
|
December 31, 2019 |
|
|
December 31, 2018 |
|
|
|||
|
ACCUMULATED DEPRECIATION |
|
|
|
|
|
|
|
|
|
|
|
|
|
|
|
Balance at beginning of period |
|
$ |
|
|
|
|
$ |
|
|
|
$ |
|
|
|
|
Depreciation |
|
|
|
|
|
|
|
|
|
|
|
|
|
|
|
Depreciation on disposed property |
|
|
( |
) |
|
|
|
( |
) |
|
|
( |
) |
|
|
Other |
|
|
|
|
|
|
|
|
|
|
|
( |
) |
|
|
Balance at end of period |
|
$ |
|
|
|
|
$ |
|
|
|
$ |
|
|
|
|
(2) |
|
115
SCHEDULE IV — MORTGAGE LOANS ON REAL ESTATE
MEDICAL PROPERTIES TRUST, INC. AND MPT OPERATING PARTNERSHIP, L.P.
December 31, 2020
|
Column A |
|
Column B |
|
|
Column C |
|
Column D |
|
Column E |
|
|
Column F |
|
|
Column G(1) |
|
|
Column H |
|
|||||
|
Description |
|
Interest Rate |
|
|
Final Maturity Date |
|
Periodic Payment Terms |
|
Prior Liens |
|
|
Face Amount of Mortgages |
|
|
Carrying Amount of Mortgages |
|
|
Principal Amount of Loans Subject to Delinquent Principal or Interest |
|
|||||
|
|
|
(Dollar amounts in thousands) |
|
|||||||||||||||||||||
|
Long-term first mortgage loan: |
|
|
|
|
|
|
|
installments of interest plus principal payable in full at maturity |
|
|
|
|
|
|
|
|
|
|
|
|
|
|
|
|
|
Olympia Medical Center |
|
|
|
% |
|
|
(2) |
|
|
|
(3 |
) |
|
$ |
|
|
|
$ |
|
|
|
|
|
) |
|
East Ohio Regional Hospital |
|
|
|
% |
|
|
|
|
|
|
(3 |
) |
|
|
|
|
|
|
|
|
|
|
|
) |
|
Colombia(5) |
|
|
|
% |
|
|
|
|
|
|
(3 |
) |
|
|
|
|
|
|
|
|
|
|
|
) |
|
St. Luke's Hospital |
|
|
|
|
|
|
|
|
|
(3 |
) |
|
|
|
|
|
|
|
|
|
|
|
) |
|
|
Vibra |
|
|
|
% |
|
|
|
|
|
|
(3 |
) |
|
|
|
|
|
|
|
|
|
|
|
) |
|
Prospect |
|
|
|
% |
|
|
|
|
|
|
(3 |
) |
|
|
|
|
|
|
|
|
|
|
|
) |
|
|
|
|
|
|
|
|
|
|
|
|
|
|
|
$ |
|
|
|
$ |
|
|
|
|
|
) |
|
(1) |
The aggregate cost for federal income tax purposes is $ |
|
(2) |
Loan was paid off subsequent to December 31, 2020. |
|
(3) |
There were |
|
(4) |
The mortgage loan was not delinquent with respect to principal or interest. |
|
(5) |
Mortgage loans covering |
|
(6) |
Principal only due to short-term nature of loan. |
|
(7) |
Excludes allowance for credit loss of $ |
Changes in mortgage loans (excluding allowance for credit loss for 2020 only and unamortized loan issue costs for 2019 and 2018 only) for the years ended December 31, 2020, 2019, and 2018 are summarized as follows:
|
|
|
Year Ended December 31, |
|
|||||||||
|
|
|
2020 |
|
|
2019 |
|
|
2018 |
|
|||
|
|
|
(Dollar amounts in thousands) |
|
|||||||||
|
Balance at beginning of year |
|
$ |
|
|
|
$ |
|
|
|
$ |
|
|
|
Additions during year: |
|
|
|
|
|
|
|
|
|
|
|
|
|
New mortgage loans and additional advances on existing loans |
|
|
|
|
|
|
|
|
|
|
|
|
|
Exchange rate fluctuations |
|
|
|
|
|
|
— |
|
|
|
— |
|
|
|
|
|
|
|
|
|
|
|
|
|
|
|
|
Deductions during year: |
|
|
|
|
|
|
|
|
|
|
|
|
|
Collection of principal |
|
|
( |
) |
(8) |
|
— |
|
|
|
( |
) |
|
|
|
|
( |
) |
|
|
— |
|
|
|
( |
) |
|
Balance at end of year |
|
$ |
|
|
|
$ |
|
|
|
$ |
|
|
|
(8) |
Includes $ |
116