false2021FY000128005800012800582021-01-012021-12-3100012800582021-06-30iso4217:USD00012800582022-02-22xbrli:shares00012800582021-12-3100012800582020-12-31iso4217:USDxbrli:shares0001280058blkb:RecurringMember2021-01-012021-12-310001280058blkb:RecurringMember2020-01-012020-12-310001280058blkb:RecurringMember2019-01-012019-12-310001280058us-gaap:TechnologyServiceMember2021-01-012021-12-310001280058us-gaap:TechnologyServiceMember2020-01-012020-12-310001280058us-gaap:TechnologyServiceMember2019-01-012019-12-3100012800582020-01-012020-12-3100012800582019-01-012019-12-3100012800582019-12-3100012800582018-12-310001280058us-gaap:CommonStockMember2018-12-310001280058us-gaap:AdditionalPaidInCapitalMember2018-12-310001280058us-gaap:TreasuryStockMember2018-12-310001280058us-gaap:AccumulatedOtherComprehensiveIncomeMember2018-12-310001280058us-gaap:RetainedEarningsMember2018-12-310001280058us-gaap:RetainedEarningsMember2019-01-012019-12-310001280058us-gaap:CommonStockMember2019-01-012019-12-310001280058us-gaap:AdditionalPaidInCapitalMember2019-01-012019-12-310001280058us-gaap:TreasuryStockMember2019-01-012019-12-310001280058us-gaap:AccumulatedOtherComprehensiveIncomeMember2019-01-012019-12-310001280058us-gaap:CommonStockMember2019-12-310001280058us-gaap:AdditionalPaidInCapitalMember2019-12-310001280058us-gaap:TreasuryStockMember2019-12-310001280058us-gaap:AccumulatedOtherComprehensiveIncomeMember2019-12-310001280058us-gaap:RetainedEarningsMember2019-12-310001280058us-gaap:RetainedEarningsMember2020-01-012020-12-310001280058us-gaap:TreasuryStockMember2020-01-012020-12-310001280058us-gaap:CommonStockMember2020-01-012020-12-310001280058us-gaap:AdditionalPaidInCapitalMember2020-01-012020-12-310001280058us-gaap:AccumulatedOtherComprehensiveIncomeMember2020-01-012020-12-310001280058us-gaap:CommonStockMember2020-12-310001280058us-gaap:AdditionalPaidInCapitalMember2020-12-310001280058us-gaap:TreasuryStockMember2020-12-310001280058us-gaap:AccumulatedOtherComprehensiveIncomeMember2020-12-310001280058us-gaap:RetainedEarningsMember2020-12-310001280058us-gaap:RetainedEarningsMember2021-01-012021-12-310001280058us-gaap:CommonStockMember2021-01-012021-12-310001280058us-gaap:AdditionalPaidInCapitalMember2021-01-012021-12-310001280058us-gaap:TreasuryStockMember2021-01-012021-12-310001280058us-gaap:AccumulatedOtherComprehensiveIncomeMember2021-01-012021-12-310001280058us-gaap:CommonStockMember2021-12-310001280058us-gaap:AdditionalPaidInCapitalMember2021-12-310001280058us-gaap:TreasuryStockMember2021-12-310001280058us-gaap:AccumulatedOtherComprehensiveIncomeMember2021-12-310001280058us-gaap:RetainedEarningsMember2021-12-3100012800582021-01-012021-09-300001280058srt:MinimumMember2021-01-012021-12-310001280058srt:MaximumMember2021-01-012021-12-310001280058us-gaap:CustomerRelationshipsMember2021-01-012021-12-310001280058us-gaap:CustomerRelationshipsMembersrt:MinimumMember2021-01-012021-12-310001280058us-gaap:CustomerRelationshipsMembersrt:MaximumMember2021-01-012021-12-310001280058us-gaap:MarketingRelatedIntangibleAssetsMember2021-01-012021-12-310001280058us-gaap:MarketingRelatedIntangibleAssetsMembersrt:MinimumMember2021-01-012021-12-310001280058us-gaap:MarketingRelatedIntangibleAssetsMembersrt:MaximumMember2021-01-012021-12-310001280058us-gaap:ComputerSoftwareIntangibleAssetMember2021-01-012021-12-310001280058srt:MinimumMemberus-gaap:ComputerSoftwareIntangibleAssetMember2021-01-012021-12-310001280058srt:MaximumMemberus-gaap:ComputerSoftwareIntangibleAssetMember2021-01-012021-12-310001280058us-gaap:MediaContentMember2021-01-012021-12-310001280058srt:MaximumMemberus-gaap:MediaContentMember2021-01-012021-12-310001280058srt:MinimumMemberus-gaap:SoftwareDevelopmentMember2021-01-012021-12-310001280058srt:MaximumMemberus-gaap:SoftwareDevelopmentMember2021-01-012021-12-310001280058us-gaap:AllowanceForCreditLossMember2020-12-310001280058us-gaap:AllowanceForCreditLossMember2021-01-012021-12-310001280058us-gaap:AllowanceForCreditLossMember2021-12-310001280058us-gaap:AllowanceForCreditLossMember2019-12-310001280058us-gaap:AllowanceForCreditLossMember2020-01-012020-12-310001280058us-gaap:AllowanceForCreditLossMember2018-12-310001280058us-gaap:AllowanceForCreditLossMember2019-01-012019-12-3100012800582020-01-010001280058blkb:AllowanceforReturnsMember2020-12-310001280058blkb:AllowanceforReturnsMember2021-01-012021-12-310001280058blkb:AllowanceforReturnsMember2021-12-310001280058blkb:AllowanceforReturnsMember2019-12-310001280058blkb:AllowanceforReturnsMember2020-01-012020-12-310001280058blkb:AllowanceforReturnsMember2018-12-310001280058blkb:AllowanceforReturnsMember2019-01-012019-12-310001280058blkb:EVERFIMember2021-12-312021-12-310001280058blkb:EVERFIMember2021-12-310001280058blkb:EVERFIMember2021-01-012021-12-310001280058us-gaap:TechnologyBasedIntangibleAssetsMemberblkb:EVERFIMember2021-12-312021-12-310001280058us-gaap:CustomerRelationshipsMemberblkb:EVERFIMember2021-12-312021-12-310001280058us-gaap:MarketingRelatedIntangibleAssetsMemberblkb:EVERFIMember2021-12-312021-12-310001280058us-gaap:MediaContentMemberblkb:EVERFIMember2021-12-312021-12-310001280058blkb:YourCauseMember2019-01-022019-01-020001280058us-gaap:CustomerRelationshipsMember2021-12-310001280058us-gaap:CustomerRelationshipsMember2020-12-310001280058us-gaap:MarketingRelatedIntangibleAssetsMember2021-12-310001280058us-gaap:MarketingRelatedIntangibleAssetsMember2020-12-310001280058us-gaap:TechnologyBasedIntangibleAssetsMember2021-12-310001280058us-gaap:TechnologyBasedIntangibleAssetsMember2020-12-310001280058us-gaap:MediaContentMember2021-12-310001280058us-gaap:MediaContentMember2020-12-310001280058blkb:CostOfRecurringMember2021-01-012021-12-310001280058blkb:CostOfRecurringMember2020-01-012020-12-310001280058blkb:CostOfRecurringMember2019-01-012019-12-310001280058blkb:CostOfOneTimeServicesAndOtherMember2021-01-012021-12-310001280058blkb:CostOfOneTimeServicesAndOtherMember2020-01-012020-12-310001280058blkb:CostOfOneTimeServicesAndOtherMember2019-01-012019-12-310001280058us-gaap:CostOfSalesMember2021-01-012021-12-310001280058us-gaap:CostOfSalesMember2020-01-012020-12-310001280058us-gaap:CostOfSalesMember2019-01-012019-12-310001280058us-gaap:OperatingExpenseMember2021-01-012021-12-310001280058us-gaap:OperatingExpenseMember2020-01-012020-12-310001280058us-gaap:OperatingExpenseMember2019-01-012019-12-310001280058us-gaap:FairValueInputsLevel1Memberus-gaap:FairValueMeasurementsRecurringMember2021-12-310001280058us-gaap:FairValueInputsLevel2Memberus-gaap:FairValueMeasurementsRecurringMember2021-12-310001280058us-gaap:FairValueInputsLevel3Memberus-gaap:FairValueMeasurementsRecurringMember2021-12-310001280058us-gaap:FairValueMeasurementsRecurringMember2021-12-310001280058us-gaap:FairValueInputsLevel1Memberus-gaap:FairValueMeasurementsRecurringMember2020-12-310001280058us-gaap:FairValueInputsLevel2Memberus-gaap:FairValueMeasurementsRecurringMember2020-12-310001280058us-gaap:FairValueInputsLevel3Memberus-gaap:FairValueMeasurementsRecurringMember2020-12-310001280058us-gaap:FairValueMeasurementsRecurringMember2020-12-310001280058blkb:GlobalHQMember2021-01-012021-12-310001280058us-gaap:PropertyPlantAndEquipmentMember2021-01-012021-12-310001280058us-gaap:LandMember2021-12-310001280058us-gaap:LandMember2020-12-310001280058us-gaap:BuildingMember2021-01-012021-12-310001280058us-gaap:BuildingMember2021-12-310001280058us-gaap:BuildingMember2020-12-310001280058srt:MinimumMemberus-gaap:BuildingImprovementsMember2021-01-012021-12-310001280058srt:MaximumMemberus-gaap:BuildingImprovementsMember2021-01-012021-12-310001280058us-gaap:BuildingImprovementsMember2021-12-310001280058us-gaap:BuildingImprovementsMember2020-12-310001280058us-gaap:EquipmentMembersrt:MinimumMember2021-01-012021-12-310001280058us-gaap:EquipmentMembersrt:MaximumMember2021-01-012021-12-310001280058us-gaap:EquipmentMember2021-12-310001280058us-gaap:EquipmentMember2020-12-310001280058us-gaap:ComputerEquipmentMembersrt:MinimumMember2021-01-012021-12-310001280058srt:MaximumMemberus-gaap:ComputerEquipmentMember2021-01-012021-12-310001280058us-gaap:ComputerEquipmentMember2021-12-310001280058us-gaap:ComputerEquipmentMember2020-12-310001280058srt:MinimumMemberblkb:ComputerSoftwareMember2021-01-012021-12-310001280058srt:MaximumMemberblkb:ComputerSoftwareMember2021-01-012021-12-310001280058blkb:ComputerSoftwareMember2021-12-310001280058blkb:ComputerSoftwareMember2020-12-310001280058us-gaap:ConstructionInProgressMember2021-12-310001280058us-gaap:ConstructionInProgressMember2020-12-310001280058us-gaap:FurnitureAndFixturesMembersrt:MinimumMember2021-01-012021-12-310001280058srt:MaximumMemberus-gaap:FurnitureAndFixturesMember2021-01-012021-12-310001280058us-gaap:FurnitureAndFixturesMember2021-12-310001280058us-gaap:FurnitureAndFixturesMember2020-12-310001280058us-gaap:LeaseholdImprovementsMember2021-12-310001280058us-gaap:LeaseholdImprovementsMember2020-12-310001280058us-gaap:SoftwareDevelopmentMember2021-01-012021-12-310001280058blkb:RecurringMember2021-12-310001280058blkb:RecurringMember2020-12-310001280058us-gaap:TechnologyServiceMember2021-12-310001280058us-gaap:TechnologyServiceMember2020-12-310001280058us-gaap:RevolvingCreditFacilityMember2021-12-310001280058us-gaap:RevolvingCreditFacilityMember2020-12-31xbrli:pure0001280058us-gaap:SecuredDebtMember2021-12-310001280058us-gaap:SecuredDebtMember2020-12-310001280058us-gaap:MortgagesMember2021-12-310001280058us-gaap:MortgagesMember2020-12-310001280058us-gaap:LoansPayableMember2021-12-310001280058us-gaap:LoansPayableMember2020-12-310001280058us-gaap:ShortTermDebtMember2021-12-310001280058us-gaap:ShortTermDebtMember2020-12-310001280058us-gaap:LongTermDebtMember2021-12-310001280058us-gaap:LongTermDebtMember2020-12-3100012800582017-06-022017-06-0200012800582017-06-0200012800582020-10-012020-10-3000012800582020-10-300001280058us-gaap:RevolvingCreditFacilityMember2020-10-300001280058us-gaap:SecuredDebtMember2020-10-300001280058us-gaap:SecuredDebtMember2020-10-012020-10-300001280058us-gaap:RevolvingCreditFacilityMember2020-10-012020-10-300001280058us-gaap:StandbyLettersOfCreditMember2020-10-300001280058blkb:SwinglineloansMember2020-10-300001280058us-gaap:ForeignLineOfCreditMember2020-10-300001280058us-gaap:FederalFundsEffectiveSwapRateMember2020-10-012020-10-300001280058us-gaap:EurodollarMember2020-10-012020-10-300001280058srt:MinimumMemberus-gaap:BaseRateMember2020-10-012020-10-300001280058srt:MaximumMemberus-gaap:BaseRateMember2020-10-012020-10-300001280058srt:MinimumMemberus-gaap:LondonInterbankOfferedRateLIBORMember2020-10-012020-10-300001280058srt:MaximumMemberus-gaap:LondonInterbankOfferedRateLIBORMember2020-10-012020-10-300001280058srt:MinimumMember2020-10-012020-10-300001280058srt:MaximumMember2020-10-012020-10-300001280058srt:MaximumMember2020-10-300001280058us-gaap:SecuredDebtMember2021-12-312021-12-310001280058us-gaap:FederalFundsEffectiveSwapRateMember2021-12-312021-12-310001280058us-gaap:SecuredOvernightFinancingRateSofrOvernightIndexSwapRateMember2021-12-312021-12-310001280058srt:MinimumMemberus-gaap:BaseRateMember2021-12-312021-12-310001280058srt:MaximumMemberus-gaap:BaseRateMember2021-12-312021-12-310001280058us-gaap:SecuredOvernightFinancingRateSofrOvernightIndexSwapRateMembersrt:MinimumMember2021-12-312021-12-310001280058srt:MaximumMemberus-gaap:SecuredOvernightFinancingRateSofrOvernightIndexSwapRateMember2021-12-312021-12-310001280058blkb:DailyMemberus-gaap:SecuredOvernightFinancingRateSofrOvernightIndexSwapRateMember2021-12-310001280058us-gaap:SecuredOvernightFinancingRateSofrOvernightIndexSwapRateMemberblkb:OneMonthMember2021-12-310001280058us-gaap:SecuredOvernightFinancingRateSofrOvernightIndexSwapRateMemberblkb:ThreeMonthMember2021-12-310001280058us-gaap:SecuredOvernightFinancingRateSofrOvernightIndexSwapRateMemberblkb:SixMonthMember2021-12-310001280058blkb:SeniorSecuredNoteSeriesA1Memberblkb:GlobalHQMember2020-08-310001280058blkb:GlobalHQMemberblkb:SeniorSecuredNoteSeriesA2Member2020-08-310001280058blkb:GlobalHQMember2020-08-310001280058us-gaap:LoansPayableMember2019-12-310001280058us-gaap:LoansPayableMember2020-01-310001280058blkb:November2020Swap1Member2020-11-300001280058blkb:November2020Swap2Member2020-11-300001280058blkb:November2020Swap3Member2020-11-300001280058blkb:November2020Swap4Member2020-11-300001280058blkb:July2021SwapMember2021-07-310001280058us-gaap:InterestRateSwapMemberus-gaap:PrepaidExpensesAndOtherCurrentAssetsMemberus-gaap:DesignatedAsHedgingInstrumentMember2021-12-310001280058us-gaap:InterestRateSwapMemberus-gaap:PrepaidExpensesAndOtherCurrentAssetsMemberus-gaap:DesignatedAsHedgingInstrumentMember2020-12-310001280058us-gaap:InterestRateSwapMemberus-gaap:DesignatedAsHedgingInstrumentMemberblkb:AccruedexpensesandothercurrentliabilitiesMember2021-12-310001280058us-gaap:InterestRateSwapMemberus-gaap:DesignatedAsHedgingInstrumentMemberblkb:AccruedexpensesandothercurrentliabilitiesMember2020-12-310001280058us-gaap:InterestRateSwapMemberus-gaap:OtherAssetsMemberus-gaap:DesignatedAsHedgingInstrumentMember2021-12-310001280058us-gaap:InterestRateSwapMemberus-gaap:OtherAssetsMemberus-gaap:DesignatedAsHedgingInstrumentMember2020-12-310001280058us-gaap:InterestRateSwapMemberus-gaap:DesignatedAsHedgingInstrumentMemberus-gaap:OtherLiabilitiesMember2021-12-310001280058us-gaap:InterestRateSwapMemberus-gaap:DesignatedAsHedgingInstrumentMemberus-gaap:OtherLiabilitiesMember2020-12-310001280058us-gaap:InterestRateSwapMemberus-gaap:DesignatedAsHedgingInstrumentMember2021-12-310001280058us-gaap:InterestRateSwapMemberus-gaap:DesignatedAsHedgingInstrumentMember2020-12-310001280058us-gaap:InterestRateSwapMemberus-gaap:CashFlowHedgingMember2021-01-012021-12-310001280058us-gaap:InterestRateSwapMemberus-gaap:CashFlowHedgingMemberus-gaap:InterestExpenseMember2021-01-012021-12-310001280058us-gaap:InterestRateSwapMemberus-gaap:CashFlowHedgingMember2020-01-012020-12-310001280058us-gaap:InterestRateSwapMemberus-gaap:CashFlowHedgingMemberus-gaap:InterestExpenseMember2020-01-012020-12-310001280058us-gaap:InterestRateSwapMemberus-gaap:CashFlowHedgingMember2019-01-012019-12-310001280058us-gaap:InterestRateSwapMemberus-gaap:CashFlowHedgingMemberus-gaap:InterestExpenseMember2019-01-012019-12-310001280058blkb:ChangeInAccountingEstimateWorkforceStrategyMember2021-01-012021-12-310001280058blkb:ChangeInAccountingEstimateWorkforceStrategyMember2020-01-012020-12-310001280058blkb:AccruedexpensesandothercurrentliabilitiesMember2021-12-310001280058blkb:AccruedexpensesandothercurrentliabilitiesMember2020-12-310001280058blkb:OperatingLeaseLiabilitiesNetOfCurrentPortionMember2021-12-310001280058blkb:OperatingLeaseLiabilitiesNetOfCurrentPortionMember2020-12-310001280058blkb:ThirdpartyTechnologyMember2021-12-310001280058srt:MinimumMember2021-12-310001280058srt:MaximumMember2021-12-31blkb:cases0001280058country:US2021-01-012021-12-310001280058country:CA2021-01-012021-12-310001280058country:ES2021-09-012021-09-30iso4217:EUR0001280058us-gaap:ForeignCountryMember2021-01-012021-12-310001280058us-gaap:ForeignCountryMember2020-01-012020-12-310001280058us-gaap:ForeignCountryMember2019-01-012019-12-310001280058us-gaap:StateAndLocalJurisdictionMember2021-01-012021-12-310001280058us-gaap:StateAndLocalJurisdictionMember2020-01-012020-12-310001280058us-gaap:StateAndLocalJurisdictionMember2019-01-012019-12-310001280058us-gaap:DomesticCountryMember2021-12-310001280058us-gaap:ForeignCountryMember2021-12-310001280058us-gaap:StateAndLocalJurisdictionMember2021-12-310001280058blkb:ValuationAllowanceChangeAcquisitionRelatedMember2021-01-012021-12-310001280058blkb:ValuationAllowanceChangeChargesToExpenseMember2021-01-012021-12-310001280058blkb:ValuationAllowanceChangeAcquisitionRelatedMember2020-01-012020-12-310001280058blkb:ValuationAllowanceChangeChargesToExpenseMember2020-01-012020-12-310001280058blkb:ValuationAllowanceChangeAcquisitionRelatedMember2019-01-012019-12-310001280058blkb:ValuationAllowanceChangeChargesToExpenseMember2019-01-012019-12-310001280058us-gaap:RestrictedStockMember2021-12-310001280058us-gaap:RestrictedStockMember2020-12-310001280058us-gaap:RestrictedStockUnitsRSUMember2021-12-310001280058us-gaap:RestrictedStockUnitsRSUMember2020-12-310001280058us-gaap:EmployeeStockOptionMember2021-01-012021-12-310001280058us-gaap:RestrictedStockMember2021-01-012021-12-310001280058us-gaap:RestrictedStockUnitsRSUMember2021-01-012021-12-310001280058us-gaap:TechnologyServiceMember2021-01-012021-12-310001280058us-gaap:TechnologyServiceMember2020-01-012020-12-310001280058us-gaap:TechnologyServiceMember2019-01-012019-12-310001280058us-gaap:SellingAndMarketingExpenseMember2021-01-012021-12-310001280058us-gaap:SellingAndMarketingExpenseMember2020-01-012020-12-310001280058us-gaap:SellingAndMarketingExpenseMember2019-01-012019-12-310001280058us-gaap:ResearchAndDevelopmentExpenseMember2021-01-012021-12-310001280058us-gaap:ResearchAndDevelopmentExpenseMember2020-01-012020-12-310001280058us-gaap:ResearchAndDevelopmentExpenseMember2019-01-012019-12-310001280058us-gaap:GeneralAndAdministrativeExpenseMember2021-01-012021-12-310001280058us-gaap:GeneralAndAdministrativeExpenseMember2020-01-012020-12-310001280058us-gaap:GeneralAndAdministrativeExpenseMember2019-01-012019-12-310001280058us-gaap:RestrictedStockMember2020-01-012020-12-310001280058us-gaap:RestrictedStockMember2019-01-012019-12-310001280058us-gaap:RestrictedStockUnitsRSUMember2020-01-012020-12-310001280058us-gaap:RestrictedStockUnitsRSUMember2019-01-012019-12-310001280058us-gaap:StockAppreciationRightsSARSMember2019-01-012019-12-310001280058us-gaap:CashFlowHedgingMember2020-12-310001280058us-gaap:CashFlowHedgingMember2019-12-310001280058us-gaap:CashFlowHedgingMember2018-12-310001280058us-gaap:CashFlowHedgingMember2021-01-012021-12-310001280058us-gaap:CashFlowHedgingMember2020-01-012020-12-310001280058us-gaap:CashFlowHedgingMember2019-01-012019-12-310001280058us-gaap:CashFlowHedgingMember2021-12-310001280058us-gaap:AccumulatedTranslationAdjustmentMember2020-12-310001280058us-gaap:AccumulatedTranslationAdjustmentMember2019-12-310001280058us-gaap:AccumulatedTranslationAdjustmentMember2018-12-310001280058us-gaap:AccumulatedTranslationAdjustmentMember2021-01-012021-12-310001280058us-gaap:AccumulatedTranslationAdjustmentMember2020-01-012020-12-310001280058us-gaap:AccumulatedTranslationAdjustmentMember2019-01-012019-12-310001280058us-gaap:AccumulatedTranslationAdjustmentMember2021-12-310001280058srt:MinimumMember2020-01-012020-12-310001280058srt:MinimumMember2019-01-012019-12-310001280058srt:MaximumMember2020-01-012020-12-310001280058srt:MaximumMember2019-01-012019-12-310001280058blkb:COVID19Member2020-01-012020-12-310001280058country:US2021-12-310001280058country:US2020-12-310001280058us-gaap:NonUsMember2021-12-310001280058us-gaap:NonUsMember2020-12-3100012800582021-01-012021-12-310001280058country:US2020-01-012020-12-310001280058country:US2019-01-012019-12-310001280058country:GB2021-01-012021-12-310001280058country:GB2020-01-012020-12-310001280058country:GB2019-01-012019-12-310001280058us-gaap:NonUsMember2021-01-012021-12-310001280058us-gaap:NonUsMember2020-01-012020-12-310001280058us-gaap:NonUsMember2019-01-012019-12-310001280058blkb:USMarketsGroupMember2021-01-012021-12-310001280058blkb:USMarketsGroupMember2020-01-012020-12-310001280058blkb:USMarketsGroupMember2019-01-012019-12-310001280058blkb:InternationalMarketsGroupMember2021-01-012021-12-310001280058blkb:InternationalMarketsGroupMember2020-01-012020-12-310001280058blkb:InternationalMarketsGroupMember2019-01-012019-12-310001280058us-gaap:AllOtherSegmentsMember2021-01-012021-12-310001280058us-gaap:AllOtherSegmentsMember2020-01-012020-12-310001280058us-gaap:AllOtherSegmentsMember2019-01-012019-12-310001280058blkb:ContractualRecurringMember2021-01-012021-12-310001280058blkb:ContractualRecurringMember2020-01-012020-12-310001280058blkb:ContractualRecurringMember2019-01-012019-12-310001280058blkb:TransactionalRecurringMember2021-01-012021-12-310001280058blkb:TransactionalRecurringMember2020-01-012020-12-310001280058blkb:TransactionalRecurringMember2019-01-012019-12-310001280058blkb:MaximumThroughDecember312023Memberus-gaap:SubsequentEventMember2022-01-310001280058blkb:MaximumAfterDecember312023Memberus-gaap:SubsequentEventMember2022-01-310001280058us-gaap:SubsequentEventMember2022-01-310001280058us-gaap:SubsequentEventMemberus-gaap:FederalFundsEffectiveSwapRateMember2022-01-312022-01-310001280058us-gaap:EurodollarMemberus-gaap:SubsequentEventMember2022-01-312022-01-310001280058srt:MinimumMemberus-gaap:BaseRateMemberus-gaap:SubsequentEventMember2022-01-312022-01-310001280058srt:MaximumMemberus-gaap:BaseRateMemberus-gaap:SubsequentEventMember2022-01-312022-01-310001280058srt:MinimumMemberus-gaap:LondonInterbankOfferedRateLIBORMemberus-gaap:SubsequentEventMember2022-01-312022-01-310001280058srt:MaximumMemberus-gaap:LondonInterbankOfferedRateLIBORMemberus-gaap:SubsequentEventMember2022-01-312022-01-31
UNITED STATES
SECURITIES AND EXCHANGE COMMISSION
Washington, D.C. 20549
FORM 10-K
| | | | | |
| ☑ | ANNUAL REPORT PURSUANT TO SECTION 13 OR 15(d) OF THE SECURITIES EXCHANGE ACT OF 1934 |
| For the fiscal year ended December 31, 2021 |
or
| | | | | |
| ☐ | TRANSITION REPORT PURSUANT TO SECTION 13 OR 15(d) OF THE SECURITIES EXCHANGE ACT OF 1934 |
| For the transition period from to . |
Commission file number: 000-50600
Blackbaud, Inc.
(Exact name of registrant as specified in its charter)
| | | | | |
| |
| Delaware | 11-2617163 |
| (State or other jurisdiction of incorporation or organization) | (I.R.S. Employer Identification No.) |
65 Fairchild Street
Charleston, South Carolina 29492
(Address of principal executive offices, including zip code)
(843) 216-6200
(Registrant's telephone number, including area code)
| | | | | | | | |
| | |
| Securities Registered Pursuant to Section 12(b) of the Act: |
| Title of Each Class | Trading Symbol(s) | Name of Each Exchange on which Registered |
| Common Stock, $0.001 Par Value | BLKB | Nasdaq Global Select Market |
Securities Registered Pursuant to Section 12(g) of the Act: None |
| | |
Indicate by check mark if the registrant is a well-known seasoned issuer, as defined in Rule 405 of the Securities Act. Yes ☑ No ☐
Indicate by check mark if the registrant is not required to file reports pursuant to Section 13 or Section 15(d) of the Act. Yes ☐ No ☑
Indicate by check mark whether the registrant (1) has filed all reports required to be filed by Section 13 or 15(d) of the Securities Exchange Act of 1934 during the preceding 12 months (or for such shorter period that the registrant was required to file such reports), and (2) has been subject to such filing requirements for the past 90 days. Yes ☑ No ☐
Indicate by check mark whether the registrant has submitted electronically every Interactive Data File required to be submitted pursuant to Rule 405 of Regulation S-T (Section 232.405 of this chapter) during the preceding 12 months (or for such shorter period that the registrant was required to submit such files). Yes ☑ No ☐
Indicate by check mark whether the registrant is a large accelerated filer, an accelerated filer, a non-accelerated filer, a smaller reporting company, or an emerging growth company. See the definitions of “large accelerated filer,” “accelerated filer,” “smaller reporting company,” and "emerging growth company" in Rule 12b-2 of the Exchange Act.
| | | | | | | | | | | | | | |
| Large accelerated filer | ☑ | | Accelerated filer | ☐ |
| Non-accelerated filer | ☐ | | Smaller reporting company | ☐ |
| | | Emerging growth company | ☐ |
If an emerging growth company, indicate by check mark if the registrant has elected not to use the extended transition period for complying with any new or revised financial accounting standards provided pursuant to Section 13(a) of the Exchange Act. ☐
Indicate by check mark whether the registrant has filed a report on and attestation to its management’s assessment of the effectiveness of its internal control over financial reporting under Section 404(b) of the Sarbanes-Oxley Act (15 U.S.C. 7262(b)) by the registered public accounting firm that prepared or issued its audit report. ☑
Indicate by check mark whether registrant is a shell company (as defined in Rule 12b-2 of the Exchange Act). Yes ☐ No ☑
The aggregate market value of the registrant's common stock held by non-affiliates of the registrant on June 30, 2021 (based on the closing sale price of $76.57 on that date) was approximately $2,865,911,731. Common stock held by each officer and director and by each person known to the registrant who owned 10% or more of the outstanding common stock have been excluded in that such persons may be deemed to be affiliates. This determination of affiliate status is not necessarily a conclusive determination for other purposes.
The number of shares of the registrant’s common stock outstanding as of February 22, 2022 was 51,966,285.
DOCUMENTS INCORPORATED BY REFERENCE
Portions of the registrant's definitive Proxy Statement for the 2022 Annual Meeting of Stockholders currently scheduled to be held June 9, 2022 are incorporated by reference into Part III hereof. Such definitive Proxy Statement will be filed with the U.S. Securities and Exchange Commission no later than 120 days after the conclusion of the registrant's fiscal year ended December 31, 2021.
TABLE OF CONTENTS
| | | | | | | | |
| | CAUTIONARY STATEMENT REGARDING FORWARD-LOOKING STATEMENTS |
This Annual Report on Form 10-K, including the documents incorporated herein by reference, contains forward-looking statements that anticipate results based on our estimates, assumptions and plans that are subject to uncertainty. These "forward-looking statements" are made subject to the safe-harbor provisions of the Private Securities Litigation Reform Act of 1995, Section 27A of the Securities Act of 1933, as amended, and Section 21E of the Securities Exchange Act of 1934, as amended. Forward-looking statements consist of, among other things, specific and overall impacts of the COVID-19 global pandemic on our financial condition and results of operations and on the markets and communities in which we and our customers and partners operate, trend analyses, statements regarding future events, future financial performance, our anticipated growth, the effect of general economic and market conditions, our business strategy and our plan to build and grow our business, our operating results, our ability to successfully integrate acquired businesses and technologies, the effect of foreign currency exchange rate and interest rate fluctuations on our financial results, the impact of expensing stock-based compensation, the sufficiency of our capital resources, our ability to meet our ongoing debt and obligations as they become due, cybersecurity and data protection risks and related liabilities, and current or potential legal proceedings involving us, all of which are based on current expectations, estimates, and forecasts, and the beliefs and assumptions of our management. Words such as “believes,” “seeks,” “expects,” “may,” “might,” “should,” “intends,” “could,” “would,” “likely,” “will,” “targets,” “plans,” “anticipates,” “aims,” “projects,” “estimates,” or any variations of such words and similar expressions are also intended to identify such forward-looking statements. These forward-looking statements are subject to risks, uncertainties and assumptions that are difficult to predict. Accordingly, they should not be viewed as assurances of future performance, and actual results may differ materially and adversely from those expressed in any forward-looking statements.
Important factors that could cause actual results to differ materially from our expectations expressed in forward-looking statements include, but are not limited to, those summarized under “Item 1A. Risk factors” and elsewhere in this report and in our other SEC filings. Forward-looking statements represent our management's beliefs and assumptions only as of the date of this Annual Report on Form 10-K. We undertake no obligation to update or revise any forward-looking statements, or to update the reasons actual results could differ materially from those anticipated in any forward-looking statements, whether as a result of new information, future events or otherwise.
ITEM 1. BUSINESS
We are the world’s leading cloud software company powering social good. Serving the entire social good community—nonprofits, higher education institutions, K–12 schools, healthcare organizations, faith communities, arts and cultural organizations, foundations, companies and individual change agents—we connect and empower organizations and individuals to increase their impact through cloud software, services, data intelligence and expertise. Blackbaud brings over four decades of leadership to this sector: since originally incorporating in New York in 1982 and later reincorporating as a South Carolina corporation in 1991 and as a Delaware corporation in 2004, our tailored portfolio of software and services has grown to support the unique needs of vertical markets, with solutions for fundraising and CRM, marketing, advocacy, peer-to-peer fundraising, corporate social responsibility (CSR) and environmental, social and governance (ESG), school management, ticketing, grantmaking, financial management, payment processing and analytics. Our solutions are designed to meet the needs of virtually all types of organizations in the social good community, from major global institutions to small charities to individuals. During 2021, we had nearly 40,000 customers with contractual billing arrangements and nearly 100,000 customers that paid Blackbaud through transactional fees. Through our customers and our solutions, Blackbaud supports millions of users and we connect millions of supporters to over 150,000 organizations and causes in over 100 countries. We are deeply proud to play a part in our customers’ success in their missions to provide healthcare and cure diseases, advance education, preserve and share arts and culture, protect the environment, support those in need and much more.
The social good industry is significant, spanning far beyond philanthropy, and our addressable market is substantial and growing
Worldwide there are millions of social good organizations including nonprofits, foundations, companies involved in corporate social responsibility and ESG, education institutions and healthcare organizations. Billions of individuals are also active participants in the social good community by donating funds, volunteering their time, advocating for a cause, receiving services from or otherwise engaging with social good organizations.
Our estimated current total addressable market ("TAM") is greater than $20 billion. This includes our acquisition of EVERFI, Inc. ("EVERFI") in December 2021, as described in Note 3 to our consolidated financial statements in this report. EVERFI is an international technology company driving social impact through education to address the most challenging issues affecting society ranging from financial wellness to mental health to workplace conduct and other critical topics. EVERFI's educational solutions reach both adult and K-12 learners. To date, EVERFI has reached more than 45 million learners globally.
Traditional methods of fundraising and organizational management are often costly and inefficient
Many social good organizations use manual methods or software applications not specifically designed for fundraising and organizational management for institutions like theirs. Such methods are often costly and inefficient because of the difficulties in effectively collecting, sharing and using donation-related information. Furthermore, general purpose software applications frequently have limited functionality for the unique needs of our customer base and do not efficiently integrate multiple databases. Some social good organizations have developed proprietary software, but doing so is expensive, requiring on-site technical personnel for development, implementation and maintenance.
The nonprofit industry faces particular operational challenges
Nonprofit organizations, education institutions, healthcare organizations and houses of worship must efficiently:
•Solicit funds and build relationships with major and institutional donors;
•Garner small cash contributions from numerous contributors;
•Manage and develop complex relationships with large numbers of constituents;
•Advocate for policies and behaviors that advance their cause or institution;
•Communicate their accomplishments and the importance of their mission online and offline;
•Comply with complex accounting, tax and reporting requirements that differ from those for for-profit businesses;
•Solicit cash and in-kind contributions from businesses to help raise money or deliver products and services;
•Provide a wide array of programs and services to individual constituents and beneficiaries; and
•Improve the data collection and information sharing capabilities of their employees, volunteers and donors by creating and providing distributed access to centralized databases.
Because of these challenges, we believe nonprofits, education institutions, healthcare organizations and houses of worship can benefit from software applications and services specifically designed to serve their particular needs and workflows to grow revenue, work effectively and accomplish their missions.
Companies, grantmaking institutions and foundations also face unique challenges
Companies, grantmaking institutions and foundations, face their own unique challenges in their social good efforts, including the need to:
•Quantify and improve the impact of their grants;
•Cultivate better relationships with grantees;
•Achieve better internal collaboration and alignment with board members, reviewers and other stakeholders;
•Illustrate the impact of their corporate philanthropy and education efforts to the communities they serve;
•Engage employees in meaningful volunteering, giving and other activities;
•Ensure that their philanthropic efforts align with their business initiatives;
•Manage all of a foundation's activities, including fundraising and accounting;
•Expand the reach of their fundraising efforts; and
•Cultivate new and existing donors.
Our objective is to maintain and extend our position as the leading provider of cloud software and services for the global social good community, supporting our customers' missions from securing resources and managing their operations, to delivering their programs and measuring their impact. Our key strategies for achieving this objective are described below.
Execute on our Four-Point Growth Strategy
During 2021, we continued to execute our four-point growth strategy targeted to drive solution and service innovation, quality enhancement, increased operating efficiency and improved financial performance:
1.Expand Total Addressable Market ("TAM")
In December 2021, we doubled our TAM when we acquired EVERFI, an industry leader in global social impact technology. Adding EVERFI advances our position as a leader in the rapidly evolving ESG and CSR spaces and offers cross-selling and upselling opportunities through complementary product offerings with YourCause® solutions. Our TAM now stands at over $20 billion, and we remain active in the evaluation of opportunities to further expand our addressable market through acquisitions and internal product development.
2.Lead with World Class Teams and Operations
We have been investing in sales and marketing to better address our market opportunity with a focus on digital lead generation. One way we are equipping our salesforce to be more effective is by investing in the necessary technology and resources to efficiently drive an increased number of quality leads and better cover our large addressable market. We have implemented software tools to enhance our digital footprint and drive lead generation across the company. We are taking a multi-touch attribution approach to measuring the effectiveness of our marketing campaigns to drive efficiency in our go-to-market efforts and improve returns on our marketing dollars. This is just one of many examples of how we are optimizing our structure, tools and processes to better address our large vertical market opportunities. We have also taken lessons learned throughout the pandemic and re-evaluated elements of our go-to-market strategy with a digital-first mindset, and we have a significant opportunity to leverage the investments into digital to reduce our customer acquisition cost and increase our sales velocity, ultimately, driving a more scalable and cost-effective go-to-market model.
3.Delight Customers with Innovative Cloud Solutions
This strategy reflects our relentless focus on driving value and outcomes for our customers through our solutions. Blackbaud SKY®, our platform for cloud innovation, is a core tenant of this strategy and continues to power an elevated level of innovation by our engineers. It is also enabling our growing ecosystem of partners who are also passionate about social good, to extend and expand the capabilities available to our customers. During 2021, we continued making critical investments in research and development. Through our commitment to giving customers the flexibility to benefit, not just from Blackbaud's innovation, but the innovation happening outside of our walls, we developed more tools designed to create new capabilities that extend Blackbaud solutions. We now have over 6,000 non-Blackbaud developers registered in our ecosystem and we have seen substantial growth in the Blackbaud marketplace, where over 6,500 organizations have found a curated app to help them work smarter. Some of the use cases we have seen in the market include: an app that integrates Shopify with Raiser's Edge NXT® and a new API integrating YourCause with Workday, enabling our customers to easily connect employee data into the YourCause platform for more effective employee engagement. We have also enabled non-developers with low-code or no-code tools, such as our Microsoft Power Platform connector, to build automated workflows with our APIs without having to be seasoned developers and we continue to innovate as online gifts become a greater share of our customers' total donations.
The customers we serve require vertical specific business solutions to automate their operations. In 2021, we released a variety of enhancements enabling them to maximize their time, team, and relationships, including substantial updates to Blackbaud Grantmaking and a significant release for accounts receivable functionality in Blackbaud Financial Edge NXT® is now with early adopters.
4.Focus on Employees, Culture and ESG Initiatives
During the first quarter of 2021, we elevated a specific strategy focused on our employees, culture and ESG initiatives. This is not new for us. It is something that is in our DNA and is a big advantage as we look to attract and retain top talent. This is evident in our 2020 social responsibility report, which was released in April 2021. We are fully committed to continuing to create a diverse and inclusive environment at all levels of the organization. Early in 2021, we established an ESG Steering Committee with our CEO as the executive sponsor, and Board of Directors involvement. During the first quarter of 2021, we also joined the United Nations Global Compact. Building on our culture of innovation, we launched a new ideation initiative called "Imagine Week," inviting employees across the globe to pitch their ideas directly to the executive leadership team. Employees at every level and length of tenure in the company made proposals ranging from fundraising to customer service improvements. These ideas are making their way into our go-forward plans. In addition, we recently decided, effective in December 2021, to permanently close our fixed office locations (with the exception of our global headquarters facility in Charleston, South Carolina) to align our real estate footprint with our transition to a remote-first workforce. We may enter into arrangements for smaller more flexible workspaces where necessary. This decision did not include EVERFI's office locations.
Delight Our Customers
We intend to make our customers' experience with us effective, efficient and satisfying from their initial interest in our solutions and services through their decision to purchase, engage with customer support and implement and use our solutions. We continue to focus on initiatives aimed at improving the consistency and quality of user experience across our offerings. We also continue to evolve the way we package and sell our offerings to provide high quality and value combined with flexibility to meet the unique needs of our existing and prospective customers. For example, we have increased the number of our cloud solutions sold under a subscription pricing model, which can make it easier for customers to purchase our solutions. In addition, we are continuing to integrate value-adding capabilities such as payment services, analytics and business intelligence into our suite of solutions to better address our customers' needs with comprehensive offerings. We will continue to focus on providing the highest level of solution support, enhancing our existing solutions, extending our solutions through open APIs and developing new solutions and services designed to help our customers be more effective and achieve their missions.
Attract and Retain Top Talent and Actively Engage Employee Base
Our higher purpose is to help good take over the world, and we have incredible customers whose missions make the world a better place. Driven by this purpose, our employees work knowing they make a real difference. Collaboration, innovation and high standards are core to our culture and help to enable the great work we do. We strive to hire, develop and retain the best employees and provide a supportive and inclusive environment where their talents and potential are realized. During 2021, we expanded our workforce strategy to become "Remote First" which signals Blackbaud's goal to attract talent globally. For additional information, see “Human Capital Resources” below.
Drive Strength in Our Sector as an Industry Thought Leader
In our over 40 years of operation, we have gained significant insight into the overall market and industry segments in which we operate. We produce a wide range of thought leadership resources, including blogs, monthly indices and white papers, which provide insights and guidance to the social good community. We also participate in and convene a number of industry forums, where we exchange views and engage with industry and government leaders. Our annual user conference, bbcon®, serves in part as a forum to offer thought leadership to our customers, as do other market-specific user conferences, events and customer gatherings. The Blackbaud Institute for Philanthropic Impact (the "Blackbaud Institute") brings together leading experts in philanthropy to develop and share leading-edge research and insight that accelerates the impact of the social good community. The research and reports the Blackbaud Institute produces serve to strengthen the social good community as a whole. sgENGAGE, our blog and podcast, provides free best practices resources that drive impact across the social good community, as well.
In 2020, we announced Blackbaud Social Good Startup Program, a year-long accelerator designed to support innovative startups with the potential to impact the ecosystem of good. In alignment with our commitment to diversity in the tech community, we focused our January 2021 cohort on founders from underrepresented backgrounds.
We offer the social good community comprehensive cloud solutions to advance their missions, backed by our data intelligence services, which deliver insights powered by what we believe to be the world's most robust philanthropic data set. Our solutions can be combined with a range of payment processing, analytic and business intelligence services, consulting, training and professional services, as well as maintenance and technical support. The Blackbaud portfolio is delivered primarily through cloud solutions tailored to the unique needs of vertical markets, offering fundraising and relationship management, marketing and engagement, financial management, grant and award management, organizational and program management (such as education management, church management and ticketing), social responsibility, payment services and analytics.
Our specific solutions and services include:
Fundraising and Relationship Management
Blackbaud Raiser's Edge NXT® is our flagship cloud fundraising and relationship management solution. Blackbaud Raiser's Edge NXT is the first and only cloud fundraising and relationship management solution that is all-inclusive, fully integrated with data, analytics, marketing tools, payment processing and tailored user-specific experiences. Blackbaud Raiser's Edge NXT is, we believe, the most advanced technology available to nonprofits seeking to operate more efficiently and raise more support for their missions.
Blackbaud CRM™ is a comprehensive, configurable fundraising and relationship management solution. It is our lead offering for enterprise-level organizations seeking a powerful, yet adaptable solution for fundraising, marketing, and program management across the engagement lifecycle, specializing in supporting sophisticated major giving, membership and high-volume direct marketing programs. Blackbaud CRM helps organizations build deeper and more personalized relationships with constituents, build their brands through online engagement and multichannel communication tools, and more effectively fundraise, leveraging campaign management, business intelligence and analytics. Blackbaud CRM can be sold as an integrated solution with our enterprise online solutions to enable multi-channel marketing, online engagement and event fundraising.
Blackbaud eTapestry® is a simple, cloud fundraising and donor management solution built specifically for smaller, developing nonprofits in need of a cloud solution to support basic fundraising needs. It offers nonprofit organizations a cost-effective way to manage donors, process gifts, create reports, accept online donations and communicate with constituents. This technology provides a system that is simple to maintain, efficient to operate and is intuitively easy to learn without extensive training.
Blackbaud TeamRaiser® is the industry’s most comprehensive cloud solution designed specifically for event fundraising. Powering thousands of events each year, Blackbaud TeamRaiser allows nonprofits’ supporters to create personal or team fundraising web pages and send email donation appeals in support of events such as walks, runs and rides.
JustGiving® from Blackbaud® is one of the world's leading social platforms for giving. JustGiving provides world-class technology and innovative tools to connect people with the causes they care about. By making giving more simple, social and rewarding, this platform helps all causes, charities and people in need to reach more people and raise more money.
Blackbaud Guided Fundraising™ and Blackbaud Volunteer Network Fundraising™ can work together or independently to help higher education institutions meet their advancement targets and development campaign goals. Blackbaud Guided Fundraising is used by institutions seeking to manage all the details behind the sophisticated, person-to-person solicitation strategies that drive fundraising results. Blackbaud Volunteer Network Fundraising helps institutions manage volunteer fundraising campaigns with tools for project management, communication and reporting.
Marketing and Engagement
Blackbaud Luminate Online®, delivered in the cloud, helps our customers better understand their online supporters, make the right ask at the right time and raise money online. It includes tools to build online fundraising campaigns as part of an organization's existing website or as a stand-alone fundraising site. Donation forms, gift processing and tools for communicating through web pages and email give our customers the essentials for building sustainable donor relationships.
Blackbaud Online Express™ is a simple, cloud fundraising and marketing tool designed for smaller nonprofit organizations using Blackbaud Raiser's Edge NXT. It provides nonprofits with easy-to-use, fully integrated features and functionality such as email marketing, donation forms, event registrations and dashboard metrics.
Blackbaud School Website System™ is a content management system that gives schools the flexibility to build and edit webpages, with easy access to content types including photos, videos, downloads, text and more. It allows users to share material and contribute content across an entire school community.
Financial Management
Blackbaud Financial Edge NXT® is the first-of-its-kind cloud accounting solution for nonprofits that is intuitive, fully integrated, and built the way nonprofits need it on our modern Blackbaud SKY cloud platform. Blackbaud Financial Edge NXT is advanced technology with powerful reporting tools to help accounting teams drive transparency, stewardship, and compliance while enabling them to seamlessly manage transactions and eliminate manual processes. It seamlessly integrates with Blackbaud Raiser's Edge NXT to simplify gift entry processing and relates information from both systems in an informative manner to eliminate redundant tasks and manual processes. Blackbaud Financial Edge NXT provides nonprofit organizations with the means to help manage fiscal and fiduciary responsibility, enabling them to be more accountable to their constituents.
Blackbaud Tuition Management™ benefits schools by giving administrators better access to financial data and payment services, and by giving parents more ways to remit tuition payments. The solution helps ease the burden for administrative staff by offering invoicing, payment processing, customer service, enhanced communication with parents and later payer follow-up services.
Blackbaud Financial Aid Management™ offers schools the ability to accept online, customized applications for financial aid and to make better financial aid decisions with a proprietary Hobbies, Interest and Lifestyles ("HIL") profile. The HIL profile provides in-depth information on an applicant, delivering to the school a way to make more informed decisions on how they distribute financial aid awards.
Grant and Award Management
Blackbaud Grantmaking™ is a cloud solution built with core functions that provide comprehensive grant making capabilities, but with many additional capabilities and features, such as visual dashboards. It has a modern user interface, is user friendly and can be highly personalized. Coupled with Blackbaud Outcomes™ funders and nonprofits are empowered to collaborate around their intended outcomes and work together to achieve impact. Both the funder and the nonprofit can tell an impact story using ROI-focused results and a common outcomes measurement language.
Blackbaud Award Management™ is a comprehensive, integrated scholarship management platform for higher education and K-12 institutions and foundations, allowing students to apply for all awards using one intuitive and streamlined application process and eliminating many time-consuming administrative tasks. This leads to improved awarding, reporting, compliance, communication and stewardship.
Organizational and Program Management
Blackbaud Student Information System™ makes it easy for schools to manage schedules, transcripts and GPAs. A new Student Information System that works directly with Blackbaud Learning Management System™, Blackbaud Student Information System simplifies the process of sharing student data and academic records securely.
Blackbaud Learning Management System™ is a learning management system that makes it easy to manage, connect, and share information with students, parents, and an entire school community. Developed with direct input from our customers, Blackbaud Learning Management System gives teachers the tools to meet the demands of a modern private school.
Blackbaud Enrollment Management System™ is an enrollment management system that simplifies a school’s admissions process. Blackbaud Enrollment Management System helps admissions teams and prospective families manage and track their progress, from inquiry and application through acceptance and enrollment.
Blackbaud Altru® is a cloud solution that helps arts and cultural organizations consolidate admissions, membership, fundraising, merchandise, marketing and more, giving users a comprehensive view of their supporters. By helping general admissions arts and cultural organizations gain a clear, 360-degree view of their organization, it enables them to operate more efficiently, engage and cultivate patrons and supporters, streamline external and internal communication efforts, and reduce IT costs. Blackbaud Altru contains tools for constituent and membership management, program sales, retail sales and ticketing, volunteer management and events management. It also has sophisticated reporting functionality and tools to manage marketing, communications and fundraising.
Blackbaud Church Management™ is a comprehensive, end-to-end cloud solution to manage church operations, relationships with congregants, and essential financial management needs. With Blackbaud Church Management, faith communities can track gifts and tithing, assimilate new members, directly communicate with congregations through multiple channels, enable members to make online and mobile contributions, manage small groups and volunteers, implement secure child check-in, conduct background checks, provide bulk tax statements, manage facilities, and more. Faith communities can also add other Blackbaud capabilities from the new Cloud Solution for Faith Communities as their needs scale all through one integrated experience.
Social Responsibility and ESG
YourCause GrantsConnect® and YourCause CSRconnect® are cloud solutions for employee giving, volunteering, and grantmaking used to support corporate philanthropy by building meaningful connections between corporations, employees and nonprofits. After implementing YourCause solutions, customers typically show significant growth in volunteers, donations, engagement and more. These reported successes demonstrate a larger trend: overall ability to attract employees and customers alike by strengthening a company's reputation.
EVERFI is a SaaS software platform building digital education content that addresses the Missing Learning Layer and equips organizations to deliver Impact as a Service in their communities, empowering individuals with the tools and skills to drive ecosystems of change and inspire lifelong success. EVERFI offers programs on important societal topics such as financial literacy, health and well-being, social and emotional learning, STEM and digital literacy, among many others. EVERFI also delivers adult-focused content in the HR and compliance training space for companies and institutions. Through the platform and program offerings, EVERFI is able to yield anonymized learner data to reflect the true impact of their educational offerings.
Payment Services
Our solutions provide our customers payment processing capabilities that enable their donors to make donations and purchase goods and services using numerous payment options, including credit card and automated clearing house (“ACH”) checking transactions, through secure online transactions.
Blackbaud Merchant Services™ is a value-added service integrated with our solutions that makes credit card processing simple and secure. Customers are charged one rate for credit card transactions, making Blackbaud Merchant Services a competitive option. The service also provides customers with a payment card industry (“PCI”) compliant process and streamlined bank reconciliation. We also provide our K-12 private school customers with student tuition payment processing services.
Blackbaud Purchase Cards provide an efficient and convenient alternative to traditional procurement methods and paper-based payables processes such as checks, purchase orders and invoices for travel and operational purchases. Organizations can also set spend controls for individual cardholders, track business expenses across the organization and ensure that policies are being enforced—all managed online and integrated with Blackbaud Financial Edge NXT.
Data Intelligence
Our data intelligence offerings provide solutions for data health, insights and performance, enabling nonprofits to define effective campaign strategies and maximize fundraising results. These services either integrate with or are already integrated into our software solutions to give our customers a comprehensive view of their supporters and the market and provide information essential to making well-informed operating decisions.
Blackbaud’s Intelligence for Good® is our unique, comprehensive approach through which we combine artificial intelligence, analytics, big data, and expertise to deliver high-impact data intelligence. This powerful approach enables social good organizations to transform data into insights and outcomes.
Data Intelligence is the Blackbaud portfolio of solutions and services that use data science and AI to turn customer data into valuable insights that inform decision-making and help them achieve their goals efficiently. Blackbaud's Data Intelligence portfolio consists of three key outcome areas:
Data Health solutions enhance and maintain constituent data so the customer is always working with accurate and up-to-date information. Examples of these solutions include: identifying outdated or invalid constituent addresses in the database and making corrections based on United States Postal Service data and using name and address matching to append additional contact or demographic data points to constituent records to support better segmentation and engagement.
Insights inform strategic decision-making and actions that increase efficiency and drive successful outcomes. Insights are extracted by combining customer data with licensed and proprietary data before leveraging advanced AI capabilities and expertise from Blackbaud’s dedicated team of data scientists. Some examples of constituent insights include: numerical scores that predict the likelihood of a constituent making a gift to a customer, wealth screening software that allows customers to screen their affluent constituents against publicly available records to build detailed wealth profiles and persona cluster segmentation that sorts constituents into groups based on shared traits with guidance for how to craft targeted messaging for each group.
Performance solutions help customers to assess their fundraising performance across donor segments, benchmark themselves against peer organizations and understand industry trends. These solutions provide a holistic view of donor performance that goes beyond standard campaign-based reporting, with KPIs related to acquisition, upgrading, retention and reactivation. Customers use our performance solutions to identify areas of weakness and opportunities for improvement, track the donor impact of strategic initiatives, understand and respond to industry trends, set realistic benchmarks and fundraising goals and maintain a consistent reporting methodology to assess growth over time.
Customer Success
Our Customer Success organization is responsible for ensuring our customers are able to achieve their desired outcomes through Blackbaud solutions, starting at onboarding and continuing through the customer lifecycle. Our Customer Success team develops and fosters relationships within all levels of the customer organization to build more demonstrated value in our solutions and services, while helping customers achieve their desired outcomes. Our customer success resources work to proactively communicate to drive overall satisfaction and retention of our customer's business. They work to collect and analyze actionable information, whether that is through direct customer relationships or through aggregated analytics that drives future one-to-one or one-to-many interactions. Their goal is to partner with customers to ensure that they are fully engaged and have an advocate within Blackbaud who works to meet their needs. Customer success resources bring industry knowledge and expertise to the customer relationship and strive to help our customers achieve positive growth and outcomes.
Customer Support
For our cloud subscription solutions, access to Customer Support is included as part of the solution with no additional charge. Benefits, such as priority routing or additional support channels, are continuously enhanced. Customers enrolled in the programs enjoy fast, reliable customer support, receive regular software updates, stay up-to-date with regular communication and can leverage a unified customer portal for quick and easy access to these resources. Customers also have around-the-clock access to support resources for mission-critical needs.
Professional and Managed Services
Our expert consultants, and those in our partner program, provide data conversion, implementation and customization services for each of our software solutions. These services include:
•System implementation;
•Data conversion, business process analysis and application customization;
•Database merging and enrichment, and secure credit card transaction processing;
•Database production activities; and
•Website design services.
In addition, we, and our delivery partners, apply our industry knowledge and experience, combined with expert knowledge of our solutions, to evaluate an organization's needs and consult on how to improve a business process.
Training
We provide a variety of onsite, instructor-led online and on-demand training services to our customers relating to the use of our solutions and application of best practices, including our highly-rated Blackbaud University curriculum, through which customers can achieve certifications on Blackbaud software, which can serve as important catalysts for professional growth in the nonprofit industry. Our instructors have extensive training in the use of our solutions and present course material that is designed to include hands-on lab exercises, as well as course materials with examples and problems to solve.
We have updated our methodology for counting customers to better represent our current offerings and our growing population of customers with contractual billing arrangements and customers that pay us through solutions usage or transaction fees, some of which are in lieu of contractual billing arrangements. During 2021, we had nearly 40,000 customers with contractual billing arrangements and nearly 100,000 customers that paid us through transactional fees. Through our customers and our solutions, we support millions of users and we connect millions of supporters to over 150,000 organizations and causes in over 100 countries. Our largest single customer accounted for less than 0.2% of our 2021 consolidated revenue.
Most of our solutions and related services are sold through our direct sales force. Our direct sales force is complemented by a team of business development representatives responsible for sales lead generation and qualification. These sales and marketing professionals are primarily located throughout the United States, the U.K., Canada and Australia. As of December 31, 2021, we had 330 direct sales employees.
Our marketing organization, which includes brand, digital, content, product, event and demand generation marketing and corporate communications, develops and launches multi-channel campaigns designed to create brand recognition and market awareness for our solutions and services. Through the Blackbaud Institute, we also give back to the social good community by developing in-depth research and thought leadership content to help to drive better outcomes for their organizations with data, technology and expertise.
Our digital demand generation motion focuses on targeted account-based marketing plays, as well as intent-based programs including paid search, retargeting, social and content syndication programs. We supplement the digital motion with select participation at virtual and in-person third-party trade shows, technical conferences, and technology seminars. We also target publication of our thought leadership content and position our subject matter experts in industry journals and publications. We have a large base of loyal customers and strategic partners that provide references and recommendations often featured in our advertising and promotional activities.
The market for software and related services targeting philanthropic-focused for-profit and nonprofit organizations is competitive and highly fragmented. For certain areas of the market, entry barriers are low, as general tools for small businesses can usually be configured to manage the most basic marketing, contact management, and accounting needs of social good organizations. In parallel, as software development evolves from a highly-complex tradecraft with nuanced understanding of architectural patterns and discrete languages, to click-to-code and drag-and-drop development with natively cloud-based infrastructure, it becomes easier for competitors to quickly spin up basic applications to solve common nonprofit problems. However, once basic needs are met, programs unique to social good organizations like the stewardship of relationships critical to major gift fundraising, the cultivation and management of gifts and grants, the multi-level networking required for peer-to-peer activism and the sensitive data behind critical programs run by healthcare and education institutions ensure the ongoing need for highly specialized tools. These specialized applications have a higher barrier of entry as they require industry insight to accurately articulate the business workflow that generates the requirements for software products. Moreover, because social good organizations rely heavily on relationships with and among their supporters, integration of systems drives value beyond mere efficiency. Hence, we believe our insight, the full spectrum of our current solutions and our ability to deliver future solutions make us a strong competitor. We expect to continue to see new entrants as focus on social investment solutions increases to satisfy Millennial and Gen Z donors, the barriers of entry continue to decline with natively cloud solutions and social good organizations more readily require digital transformation of business processes and data-driven decision making.
Our competition falls into four primary categories:
•Niche products are usually developed as a solution for a single problem at an organization and are adopted by similar organizations to solve a specialized need. These are typically offered by vendors who may have deep industry expertise but may not have the resources to expand beyond a specialized area. We believe we compete against these solutions by offering a set of integrated solutions rather than a single point solution, which we believe improves the overall customer experience. In addition, our open platform allows integration to specialized applications so the opportunity for disruption from these competitors is minimized.
•Vertical-specific solutions are offered by competitors seeking to meet the enterprise-wide needs of a specific sub-segment of the social good community. Typically, these solutions are offered by vendors who may offer either a point solution or integrated suite of products used by a vertical. We believe we compete successfully against these competitors through a combination of our integrated suite of offerings within verticals where we compete, offering solutions with market leading robustness as well as the scale, reach, and reputation of our organization.
•General business software vendors, such as Microsoft, Oracle and Salesforce.com, compete with us in certain areas of our business. While there is a growing trend toward social investment that is prompting philanthropic solutions from these general business vendors, most do not have a complete nonprofit specific focus and, therefore, do not offer or intend to offer nonprofit-specific versions for outside sales. However, there is a subset of general business software competitors who have introduced nonprofit-specific versions of their products. These products generally do not satisfy the needs of nonprofits from end-to-end as they were not designed to support the specific needs of nonprofits during the original architecture, design, and requirements elicitation phases; therefore, we believe that because these products were not originally designed for nonprofits, they are not yet fully capable of meeting market needs without significant customization. The significant customization required to transform general business products into nonprofit solutions often requires the use of consultants to guide the implementation, without which, leave the adoption of general business software limited to very basic operations and simple needs. We believe our solutions compete successfully against general business software as a nonprofit’s needs grow more complex. As a result, we believe we can compete successfully to meet nonprofit-specific requirements, often integrating with general business platforms used for their more generalized operations.
•Consumer-oriented fundraising platforms, such as GoFundMe and Facebook compete with our business where consumers raise funds directly. To drive adoption of their platforms, these vendors rely on a combination of direct-to-consumer marketing, marketing to nonprofits who in turn market to their supporters, and marketing to intermediate entities such as an event sponsor who will market to participants. We believe we compete well in this market through a combination of positive brand recognition among all three of these groups and the combination of our consumer- and organization-oriented tools relative to those of the competition.
Less frequently, we compete with providers of traditional, non-automated fundraising service providers, including parties providing services in support of traditional direct mail or email campaigns, special events fundraising, peer to peer, telemarketing and personal solicitations. We believe we compete successfully against these traditional fundraising service providers, primarily because our solutions and services are more automated, more robust, more tailored to the needs of nonprofit organizations and more efficient.
| | |
| Technology and Architecture |
Blackbaud SKY forms the foundation of our technology strategy. The SKY platform consists of several key building blocks including cloud operations, developer tools, data intelligence and core services. The SKY Engineering System, architecture and integrated core shared services empower our developers to create highly available and easy-to-use cloud capabilities that surface to our customers as modern, effective, purpose-built functionality within most current products as well as new solutions. The best-in-class infrastructure of SKY enables rapid innovation with high levels of reliability, availability and security, and lets Blackbaud evolve services over time at asymmetric paces as tech trends and tools emerge. Overall, Blackbaud SKY prioritizes customer value, including risk management, and speed of delivery. It enables continuous releases, scalable and high-quality services, and speedy time to market. Blackbaud SKY also provides a toolset for customers, partners, and developers to create and deploy self-contained services within the Blackbaud SKY ecosystem. SKY API enables developers to augment Blackbaud solutions with industry-standard REST APIs, standards-based authentication protocols, and a best-in-class developer experience. SKY UX allows developers to create applications with the same consistent, cohesive user interface as Blackbaud’s native solutions using an open-source framework that implements Blackbaud design patterns and provides guidelines and tooling for the entire application lifecycle. Additionally, the Blackbaud Marketplace features a curated list of applications that can help amplify an organization's impact in the Social Good sector. Blackbaud customers can discover applications in the Marketplace that extend new capabilities to their Blackbaud solutions. These tools enable Blackbaud customers to benefit not just from the innovation of Blackbaud’s own large team of developers, but also from an exponentially larger community of partners and third-party developers.
The development strategy for all Blackbaud cloud solutions emphasizes:
•Flexibility: Customers and partners can extend our component-based architecture to accommodate changing demands without modifying source code.
•Adaptability: The architecture of our applications allows us to easily add functionality or integrate with third-party applications to adapt to customer needs and market demands.
•Scalability: Scalable architecture and the performance, capacity and load balancing of our customers' industry-standard web servers and databases ensure that applications can scale to meet the needs of large organizations.
| | |
| Intellectual Property and Other Proprietary Rights |
To protect our intellectual property, we rely on a combination of patent, trademark, copyright and trade secret laws in various jurisdictions, as well as employee and third-party nondisclosure agreements and confidentiality procedures. We maintain many trademarks, including, but not limited to “Blackbaud,” “Raiser's Edge NXT” and “Luminate.” We currently have two active patents on our technology and have one pending patent application.
As of December 31, 2021, we had over 3,600 employees, none of whom are represented by unions or are covered by collective bargaining agreements. We are not involved in any material disputes with any of our employees, and we believe that relations with our employees are strong.
We benefit from an engaged and driven employee base motivated to join the Company by our higher purpose, which is "to help good take over the world." Our purpose attracts and retains talented, competitive applicants, with 91% of employees saying the fact that Blackbaud operates in a socially responsible manner is important to them. This differentiator not only builds stronger employee engagement, but also helps us provide a higher level of service to our customers across the social good community, with 72% of employees report that they continued to volunteer during the pandemic despite its unique challenges and one in five serve on a nonprofit board or committee—direct experience that enables them to better serve our customer base.
Blackbaud also attracts and promotes talented employees through effective and targeted recruiting strategies. In 2020, Blackbaud announced the launch of a new workforce strategy, allowing for many employees to have the option to work from other geographic locations within the country of the position, helping to expand the pool of qualified applicants for roles and internal career progression. In 2021, we expanded our workforce strategy to become permanently "Remote First" which signals Blackbaud's goal to attract talent globally.
Employee engagement is a focus at Blackbaud, and we continually work to understand what matters and to make our workplace better to attract, develop, and retain talent. In 2021, nearly every employee at Blackbaud participated in "the Blackbaud Way" — a training designed to connect employees with Blackbaud's mission, values and expectations for our customers and Company culture for the best experience for all. Employee feedback on this experience was overwhelmingly positive. Every manager at Blackbaud is required to take a multi-course "Engagement Labs" training designed to equip them with the practical skills to ensure their teams are highly engaged. We assess and measure progress on engagement and growth opportunities at the individual level through quarterly check-ins, which focus on impact and learnings, and a global career framework that guides employee progression on both management and individual contributor career paths; we also assess engagement on the team and company level through regular employee surveying as well as "Ask Anything" sessions with senior leaders and dedicated "live" Q&A sessions in our company-wide All Hands meetings. We enable employees to have opportunities for career development through on-demand and company-led trainings. Our compensation framework is designed so that employees are compensated equitably and competitively, including through base salary, variable pay, equity awards and benefits. We also seek to support the whole person, through benefits that support overall wellness and financial health.
Ultimately, we believe that Blackbaud is an excellent place to work due to our active participation in the Ecosystem of Good®: we govern our business ethically, contribute to causes and communities that matter to our employees through corporate philanthropy, we pursue sustainability, and we work every day to ensure our workplace is supportive, inclusive and engaging. We offer an array of philanthropy programs aimed at engaging our employees as agents of good, including matching gifts, competitive grants that honor noteworthy examples of volunteerism, employee-led grant committees, skills-based volunteerism initiatives, as well as science, technology, engineering and mathematics focused community programs.
Our commitment to diversity, inclusion and belonging supports our efforts to attract, develop and retain a high-performing employee base. In September 2020, we welcomed our first Diversity and Inclusion Officer, as part of our strategy to further accelerate our diversity, inclusion and belonging efforts, while continuing to strengthen relationships with our people and the communities in which we operate. This new leadership focus will amplify and accelerate the significant initiatives already in place at Blackbaud, including: ongoing workshops on creating an inclusive culture; respect in the workplace training for all employees and enhanced training for managers; affinity groups, including veterans, LGBTQ employees, women in technology, women in sales, Black employees, employees interested in sustainability and, our newest team, those employees with a disability.
Additional information related to our human capital strategy can be found in our 2020 Social Responsibility Report, which is available on the Corporate Social Responsibility section of our website. Information contained on or accessible through our websites is not incorporated into, and does not form a part of, this Annual Report or any other report or document we file with the SEC, and any references to our websites are intended to be inactive textual references only.
For a discussion of seasonal variations in our business, see “Management’s Discussion and Analysis of Financial Conditions and Results of Operations — Seasonality” in Item 7 in this report.
For a discussion of our working capital practices, see “Management’s Discussion and Analysis of Financial Conditions and Results of Operations — Liquidity and Capital Resources” in Item 7 in this report.
Our website address is www.blackbaud.com. We make available, free of charge through our website, our annual report on Form 10-K, quarterly reports on Form 10-Q, current reports on Form 8-K and all amendments to those reports pursuant to Section 13(a) or 15(d) of the Exchange Act as soon as reasonably practicable after we electronically file such material with, or furnish it to, the SEC, but other information on our website is not incorporated into this report. The SEC maintains an Internet site that contains these reports, proxy and information statements, and other information regarding issuers that file electronically with the SEC at www.sec.gov.
| | |
| Information About Our Executive Officers |
The following table sets forth information concerning our executive officers as of February 15, 2022:
| | | | | | | | | | | | | | |
| Name | | Age | | Title |
| Michael P. Gianoni | | 61 | | | President and Chief Executive Officer |
| Anthony W. Boor | | 59 | | | Executive Vice President and Chief Financial Officer |
| Kevin P. Gregoire | | 54 | | | Executive Vice President and President, U.S. Markets |
| Kevin R. McDearis | | 54 | | | Executive Vice President and Chief Products Officer |
| Kevin W. Mooney | | 63 | | | Executive Vice President, Strategy and Corporate Development |
| Jon W. Olson | | 58 | | | Senior Vice President and General Counsel |
Michael P. Gianoni joined us as President and Chief Executive Officer in January 2014. Prior to joining us, he served as Executive Vice President and Group President, Financial Institutions at Fiserv, Inc., a global technology provider serving the financial services industry, from January 2010 to December 2013. He joined Fiserv as President of its Investment Services division in December 2007. Mr. Gianoni was Executive Vice President and General Manager of CheckFree Investment Services, which provided investment management solutions to financial services organizations, from June 2006 until December 2007 when CheckFree was acquired by Fiserv. From May 1994 to November 2005, he served as Senior Vice President of DST Systems Inc., a global provider of technology-based service solutions. Mr. Gianoni is a member of the Board of Directors of Teradata Corporation, a publicly traded global big data analytics company. Mr. Gianoni has served on several nonprofit boards across several segments, including relief organizations, hospitals and higher education. He currently is a board member of the International African American Museum. He holds an AS in electrical engineering from Waterbury State Technical College, a BS with a business concentration from Charter Oak State College, and an MBA and an honorary Doctorate from the University of New Haven.
Anthony W. Boor joined us as Executive Vice President and Chief Financial Officer in November 2011 and served as our interim President and Chief Executive Officer from August 2013 to January 2014. Prior to joining us, he served as an executive with Brightpoint, Inc., a global provider of device lifecycle services to the wireless industry, beginning in 1999, most recently as its Executive Vice President, Chief Financial Officer and Treasurer. He also served as the interim President of Europe, Middle East and Africa during Brightpoint's significant restructuring of that region. Mr. Boor served as Director of Business Operations for Brightpoint North America from August 1998 to July 1999. Prior to joining Brightpoint, Mr. Boor was employed in various financial positions with Macmillan Computer Publishing, Inc., a Viacom owned book publishing company specializing in computer hardware and software related topics, Day Dream Publishing, Inc., a publishing company specializing in calendars, posters and time management materials, Ernst & Young LLP, an accounting firm, Expo New Mexico, a state-owned fair and expo grounds and live pari-mutual horse racing venue, KPMG LLP, an accounting firm, and Ernst & Whinney LLP, an accounting firm. He holds a BS in Accounting from New Mexico State University.
Kevin P. Gregoire has served as our Executive Vice President and President of U.S. Markets since April 2021. He joined us as Executive Vice President and President, Enterprise Markets Group in April 2018. Prior to joining us, Mr. Gregoire was Group President of the Financial Institutions Group at Fiserv, a global technology provider serving the financial services industry, from March 2014 until February 2018. He joined Fiserv in December 2002 and served in other key leadership roles including Division President and Chief Operating Officer, Card Services, and Senior Vice President of Product and Network Strategy. Mr. Gregoire is also a veteran of the United States Army, where he served as Lieutenant in the Corps of Engineers and was awarded three Army Commendation Medals. He holds a BS from the United States Military Academy at West Point, and an MBA from the F.W. Olin School of Business at Babson College.
Kevin R. McDearis has served as our Executive Vice President and Chief Products Officer since October 2016. He joined us in August 2014 as our Senior Vice President of Global Product Development. Prior to joining us, Mr. McDearis was the Chief Information Officer at Manhattan Associates, Inc., a technology leader in supply chain and omnichannel commerce, from August 2012 to July 2014. He was responsible for leading a global IT organization in strategy development, organization development, portfolio and project management, software and infrastructure engineering, service delivery and operations. Prior to that, Mr. McDearis served as Chief Technology Officer for the Enterprise Technology Group and other key leadership positions at Fiserv (formerly CheckFree), a global technology provider serving the financial services industry, from October 1996 to August 2012. Mr. McDearis serves on the Board of Directors for the USS Yorktown Foundation. He also served on the Board of Directors of the Technology Association of Georgia ("TAG") from 2011 to 2016 and as Vice Chairman of the Board in 2014. He holds a BS in Management from The Georgia Institute of Technology.
Kevin W. Mooney has served as our Executive Vice President of Strategy and Business Development since April 2021. Before that he was the Executive Vice President and President, General Markets Group since January 2010. He joined us in July 2008 as our Chief Commercial Officer. Before joining Blackbaud, Mr. Mooney was a senior executive at Travelport GDS from August 2007 to May 2008. As Chief Commercial Officer of Travelport GDS, one of the world's largest providers of information services and transaction processing to the travel industry, Mr. Mooney was responsible for global sales, marketing, training, service and support activities. Prior to that he was Chief Financial Officer for Worldspan from March 2005 until it was acquired by Travelport in August 2007. Mr. Mooney has also held key executive positions in the telecommunications industry and he served as a member of the Board of Directors of Level 3 Communications, Inc., a publicly traded global managed network services company, from October 2014 to November 2017. Prior to that he served on the Board of Directors of tw telecom from August 2005 until it was acquired by Level 3 in October 2014. He holds a BS in Finance from Seton Hall University, and an MBA in Finance from Georgia State University.
Jon W. Olson joined us as Senior Vice President and General Counsel in September 2008. Mr. Olson is responsible for Blackbaud's legal and real estate activities. Prior to joining us, he was an attorney with Alcatel-Lucent USA, the U.S. subsidiary of France-based Alcatel-Lucent (now owned by Nokia Corporation) that designs, develops, and builds wireline, wireless, and converged communications networks, from July 1997 to September 2008. Prior to joining Alcatel-Lucent, Mr. Olson was employed in legal positions with MCI, Inc., a global business and residential communications company, from September 1996 to July 1997, and Unisys Corporation, a global information technology company, from July 1992 to September 1996. Mr. Olson is a member of the MUSC (Medical University of South Carolina) Hollings Cancer Center Advisory Board and is on the board of the Charleston Symphony and Charleston Jazz. He holds a BS from Georgetown University, a JD from Dickinson School of Law and an MBA from Seton Hall University.
ITEM 1A. RISK FACTORS
Our business operations face a number of risks. These risks should be read and considered with other information provided in this report.
Our failure to compete successfully could cause our revenue or market share to decline.
Our market is highly competitive and rapidly evolving, and there are limited barriers to entry for many segments of this market.
The companies we compete with and other potential competitors may have greater financial, technical and marketing resources and generate greater revenue and better name recognition than we do. Also, a large diversified software enterprise could decide to enter the market directly, including through acquisitions. Competitive pressures can adversely impact our business by limiting the prices we can charge our customers and making the adoption and renewal of our solutions more difficult.
Our competitors might also establish or strengthen cooperative relationships with resellers and third-party consulting firms or other parties with whom we have had relationships, thereby limiting our ability to promote our solutions.
These competitive pressures could cause our revenue and market share to decline.
Because competition for highly qualified personnel is intense, we might not be able to attract and retain key personnel needed to support our planned growth.
To meet our objectives successfully, we must attract and retain highly qualified personnel with specialized skill sets. If we are unable to attract and retain suitably qualified management, there could be a material adverse impact on our business.
Further, we use equity incentive programs and equity awards in lieu of cash as part of our overall employee compensation agreements to both attract and retain personnel. A decline in our stock price could negatively impact the value of these equity incentive and related compensation programs as retention and recruiting tools. We may need to create new or additional equity incentive programs and/or compensation packages to remain competitive, which could be dilutive to our existing stockholders and/or adversely affect our results of operations.
More rapid than expected success in implementing our strategic shift from a license-based and one-time services business model to a cloud subscription business model with partners delivering some of our services could negatively impact our total revenue growth and financial performance.
We continue to intentionally shift our focus towards selling cloud subscription solutions, which generally require less customization services. Also, our cloud solution contracts now frequently include subscription-based professional, analytic and training services or those services can be delivered through our partner program. This strategic shift to migrate our existing customers, sell new customers our cloud subscription solutions and have some services delivered by our partners results in a decrease in our one-time services contracts and revenue. Although our business model seeks to anticipate the rate of migration and resulting negative impact on our total revenue growth, more rapid than expected success in implementing this strategic shift could negatively impact our total revenue growth and financial performance.
The market for software and services for the social good community might not grow and the organizations in that community might not continue to adopt our solutions and services.
Many organizations in the social good community, including nonprofits, foundations, companies, education institutions and healthcare organizations, have not traditionally used integrated and comprehensive software and services for their specific needs. We cannot be certain that the market for such solutions and services will continue to develop and grow or that these organizations will elect to adopt our solutions and services rather than continue to use traditional, less automated methods, attempt to develop software internally, rely upon legacy software systems, or use software solutions not specifically designed for this market. Organizations that have already invested substantial resources in other fundraising methods or other non-integrated software solutions might be reluctant to adopt our solutions and services to supplement or replace their existing systems or methods. In addition, the implementation of one or more of our software solutions can involve significant capital commitments by our customers, which they may be unwilling or unable to make, especially due to disruption in the social good community due to COVID-19. If demand for and market acceptance of our solutions and services does not increase, we might not grow our business as we expect.
If we fail to respond to technological changes or successfully introduce new and improved solutions, our competitive position may be harmed and our business may suffer.
The introduction of solutions encompassing new technologies can render existing solutions obsolete and unmarketable. As a result, our future success will depend, in part, upon our ability to continue to enhance existing solutions and develop and introduce in a timely manner or acquire new solutions that keep pace with technological developments, satisfy increasingly sophisticated customer requirements and achieve market acceptance. If we are unable to develop or acquire on a timely and cost-effective basis new software solutions or enhancements to existing solutions or if such new solutions or enhancements do not achieve market acceptance, our business, results of operations and financial condition may be materially adversely affected.
If we do not successfully address the risks inherent in the expansion of our international operations, our business could suffer.
We currently have non-U.S. operations primarily in the U.K., Canada, Australia and Costa Rica, and we intend to expand further into international markets. Expansion of our international operations will require a significant amount of attention from our management and substantial financial resources and might require us to add qualified management in these markets. Our direct sales model requires us to attract, retain and manage qualified sales personnel capable of selling into markets outside the United States. In some cases, our costs of sales might increase if our customers require us to sell through local distributors. If we are unable to grow our international operations in a cost-effective and timely manner, our business and operating results could be harmed.
We expect that an increasing portion of our international revenues will be denominated in foreign currencies, subjecting us to fluctuations in foreign currency exchange rates. If we expand our international operations, exposures to gains and losses on foreign currency transactions may increase.
Doing business internationally involves additional risks that could harm our operating results. Along with risks similar to those faced by our U.S. operations, our international operations are also subject to risks related to differing legal, political, social and regulatory requirements and economic conditions, including:
•the imposition of additional withholding taxes or other tax on our foreign income, tariffs or restrictions on foreign trade or investment, including currency exchange controls;
•greater risk of a failure of our employees and partners to comply with both U.S. and foreign laws, including antitrust regulations, the U.S. Foreign Corrupt Practices Act, the U.K. Bribery Act of 2010, and any trade regulations ensuring fair trade practices; and
•the imposition of, or unexpected adverse changes in, foreign laws or regulatory requirements, including those pertaining to export restrictions, privacy and data protection, trade and employment restrictions and intellectual protections.
Unfavorable media coverage related to peer-to-peer fundraising campaigns on our social platforms could negatively impact our business.
Our online social giving platforms receive a high degree of media coverage for particularly news-worthy or controversial fundraising campaigns, as well as for our fee-based business model. Although our terms of service provide express limitations on the platforms' user-initiated fundraising campaigns and reserve our right to remove content that violates our terms of service, it may not always be possible to remove such content prior to it receiving attention in the media. Negative publicity related to our online social giving platforms could have an adverse effect on the size, engagement and loyalty of our user base and could result in decreased revenue, which could adversely affect our business and financial results.
Acquisitions could be difficult to consummate and integrate into our operations, and they could disrupt our business, dilute stockholder value or impair our financial results.
As part of our business strategy, we will continue from time to time to seek to grow our business through acquisitions of new or complementary businesses, technologies or products that we believe can improve our ability to compete in our existing customer markets or allow us to enter new markets. The potential risks associated with acquisitions and investment transactions include, but are not limited to:
•failure to realize anticipated returns on investment, cost savings and synergies;
•difficulty in assimilating the operations, policies and personnel of the acquired company;
•unanticipated costs associated with acquisitions;
•challenges in combining product offerings and entering into new markets in which we may not have experience;
•distraction of management’s attention from normal business operations;
•potential loss of key employees of the acquired company;
•difficulty implementing effective internal controls over financial reporting, disclosure controls and procedures and data protection procedures;
•impairment of relationships with customers or suppliers; and
•issues not discovered in due diligence, which may include product quality issues or legal or other contingencies.
Acquisitions, including for example our recent acquisition of EVERFI, Inc. (as further described in Note 3), may also result in potentially dilutive issuances of equity securities, the incurrence of debt and contingent liabilities, the expenditure of available cash, and amortization expenses or write-downs related to intangible assets such as goodwill, any of which could have a material adverse effect on our operating results or financial condition. We may experience risks relating to the challenges and costs of closing a business combination and the risk that an announced business combination may not close. There can be no assurance that we will be successful in making additional acquisitions in the future or in integrating or executing on our business plan for existing or future acquisitions.
A reduction in the growth or amount of charitable giving could adversely affect our operating results and financial condition.
A large percentage of our customers are nonprofits, foundations, education institutions, healthcare organizations and other members of the social good community that fully or partially rely on charitable donations. If charitable giving, including online giving, does not continue to grow or declines, it could limit our current and potential customers' ability to use and pay for our solutions and services, which could adversely affect our operating results and financial condition.
In addition, we derive a significant portion of our revenue from transaction-based payment processing fees that we collect from our customers through our Blackbaud Merchant Services solution, which enables our customers' donors to make donations and purchase goods and services using various payment options. A reduction in the growth of, or a decline in, charitable giving to these customers, whether due to deteriorating general economic conditions, the impact of recent or future changes to applicable tax laws, or otherwise, could negatively impact the volume and size of such payment processing transactions and thereby adversely affect our operating results and financial condition.
Our failure to obtain licenses for, or our use of, third-party technologies could harm our business.
We expect to continue licensing technologies from third parties, including applications used in our research and development activities, technologies that are integrated into our solutions and solutions that we resell. We believe that the loss of any third-party technologies currently integrated into our solutions could have a material adverse effect on our business. Our inability in the future to obtain any third-party licenses on commercially reasonable terms, or at all, could delay future solution development until equivalent technology can be identified, licensed or developed and integrated. This inability in turn could harm our business and operating results.
Our use of third-party technologies also exposes us to increased risks including, but not limited to, risks associated with the integration of new technology into our solutions, the diversion of our resources from development of our own proprietary technology and our inability to generate revenue from licensed technology sufficient to offset associated acquisition and maintenance costs.
The U.K.'s departure from the European Union ("E.U.") could adversely affect us.
Effective January 31, 2020, the U.K. is no longer a member of the E.U. Effective January 1, 2021, the relationship between the U.K. and the E.U. is governed primarily by the Trade and Cooperation Agreement, which sets forth, among other things, terms regarding the trade of goods and services, workers’ rights and social and environmental matters, while separate negotiations have continued and agreements have been entered into regarding, among other things, data sharing, data privacy and financial services. Because we currently conduct business in the U.K. and in Europe, the U.K.’s exit from the E.U. under such circumstances creates uncertainty and could affect the business of and/or our relationships with our customers and partners as well as the value of the British Pound and the Euro relative to the U.S. dollar. The effects of Brexit on us, including those mentioned above and others we cannot now anticipate, are difficult to predict and could adversely affect our business, business opportunities, results of operations or financial condition in both the short-term and thereafter.
If the security of our software is breached, we fail to securely collect, store and transmit customer information, or we fail to safeguard confidential donor data, we could be exposed to liability, litigation, penalties and remedial costs and our reputation and business could suffer.
Fundamental to the use of our solutions is the secure collection, storage and transmission of confidential donor and end user data and transaction data, including in our payment services. Despite the network, application and physical security procedures and internal control measures we employ to safeguard our systems, we have been and in the future may be vulnerable to a security breach, intrusion, loss or theft of confidential donor data and transaction data, which has in the past harmed and may in the future harm our business, reputation and future financial results. Furthermore, our reliance on remote access to information systems and global disruptions in response to COVID-19, as described above, increases our exposure to potential cybersecurity incidents.
Like many major businesses, we are, from time to time, a target of cyberattacks, phishing and social engineering schemes, such as the Security Incident (as described below and in Note 11 to our consolidated financial statements in this report), and we expect these threats to continue, some of which have been, and in the future may be, successful to varying degrees. Because the numerous and evolving cybersecurity threats used to obtain unauthorized access, disable, degrade or sabotage systems have become increasingly more complex and sophisticated, it may be difficult to anticipate these acts or to detect them for periods of time, as with the Security Incident, and we may be unable to respond adequately or timely. As these threats continue to evolve and increase, we have already devoted and expect to continue to devote significant resources in order to modify and enhance our security controls and to identify and remediate any security vulnerabilities.
A compromise of our data security, such as the Security Incident, that results in customer or customer constituent personal or payment card data being obtained by unauthorized persons could adversely affect our reputation with our customers and others, as well as our operations, results of operations, financial condition and liquidity and could result in litigation against us or the imposition of fines and penalties. We might be required to expend significant additional capital and other resources to rectify problems caused by a security breach, including notification under data privacy laws and regulations, and incur expenses related to remediating our information security systems. Even though we may carry cyber-technology insurance policies that provide insurance coverage under certain circumstances, we have in the past suffered losses and may in the future suffer losses as a result of a security breach that exceed the coverage available under our insurance policies or for which we do not have coverage. (See Note 11 to our consolidated financial statements in this report for expense and insurance coverage information related to the Security Incident.) Furthermore, in the future such insurance may not be available on commercially reasonable terms, or at all. A security breach and any efforts we make to address such breach could also result in a disruption of our operations, particularly our online sales operations.
The occurrence of actual cyber security events, such as the Security Incident, could magnify the severity of the adverse effects of future incidents on our business. The techniques used to obtain unauthorized access, disable or degrade service, or sabotage information systems can be difficult to detect for long periods of time and can involve difficult or prolonged assessment or remediation periods even once detected. We, therefore, cannot assure you that all potential causes of past significant incidents, including the Security Incident, have been fully identified and remediated. The steps we take may not be sufficient to prevent future significant incidents and, as a result, such incidents may occur again.
The Security Incident has had, and may continue to have, numerous adverse effects on our business, results of operations, financial condition and cash flows.
As previously disclosed, on July 16, 2020, we contacted certain customers to inform them about the Security Incident, including that in May 2020 we discovered and stopped a ransomware attack. Prior to our successfully preventing the cybercriminal from blocking our system access and fully encrypting files, and ultimately expelling them from our system with no significant disruption to our operations, the cybercriminal removed a copy of a subset of data from our self-hosted environment. Although the nature of the incident, our research and third party (including law enforcement) investigation have provided no reason to believe that any data went beyond the cybercriminal, was or will be misused, or will be disseminated or otherwise made available publicly, our investigation into the Security Incident remains ongoing and may provide additional information.
To date, we have received approximately 260 specific requests for reimbursement of expenses ("Customer Reimbursement Requests") and approximately 400 reservations of the right to seek expense recovery in the future from customers or their attorneys in the U.S., U.K. and Canada related to the Security Incident (none of which have as yet been filed in court) and are in the process of assessing what liability may exist pursuant to such claims. In addition, insurance companies representing various customers’ interests through subrogation claims have contacted us. Customer and insurer subrogation claims generally seek reimbursement of their costs and expenses associated with notifying their own customers of the Security Incident and taking steps to assure that personal information has not been compromised as a result of the Security Incident. In addition, presently, we are a defendant in 19 putative consumer class action cases [17 in U.S. federal courts (which have been consolidated under multi district litigation to a single federal court) and 2 in Canadian courts] alleging harm from the Security Incident. The plaintiffs in these cases, who generally purport to represent various classes of individual constituents of our customers, generally claim to have been harmed by alleged actions and/or omissions by us in connection with the Security Incident and assert a variety of common law and statutory claims seeking monetary damages, injunctive relief, costs and attorneys’ fees, and other related relief. To date, we also have received a consolidated, multi-state Civil Investigative Demand issued on behalf of 48 state Attorneys General and the District of Columbia and separate Civil Investigative Demands from the offices of the Illinois Attorney General and the California Attorney General relating to the Security Incident. In addition, we are subject to governmental actions or investigations by the U.S. Federal Trade Commission, the U.S. Department of Health and Human Services, the U.S. Securities and Exchange Commission, the Information Commissioner’s Office in the United Kingdom (the “ICO”) under the U.K. Data Protection Act 2018, the Office of the Australian Information Commissioner, the Office of the Privacy Commissioner of Canada, the Spanish Data Protection Authority and the Data Protection Commission of Ireland. (See Note 11 to our consolidated financial statements included in this report for a more detailed description of the Security Incident and related matters.)
We may be named as a party in additional lawsuits, other claims may be asserted by or on behalf of our customers or their constituents, and we may be subject to additional governmental inquires, requests or investigations. Responding to and resolving these current and any future lawsuits, claims and/or investigations could result in material remedial and other expenses that will not be covered by insurance. Governmental authorities also may seek to impose undertakings, injunctive relief, consent decrees, or other civil or criminal penalties, which could, among other things, materially increase our data security costs or otherwise require us to alter how we operate our business. Although we intend to defend ourselves vigorously against the claims asserted against us, we cannot predict the potential outcomes, cost and expenses associated with current and any future claims, lawsuits, inquiries and investigations.
In addition, any legislative or regulatory changes adopted in reaction to the Security Incident or other companies’ data breaches could require us to make modifications to the operation of our business that could have an adverse effect and/or increase or accelerate our compliance costs.
Significant management time and Company resources have been, and are expected to continue to be, devoted to the Security Incident. For example, we currently expect net cash outlays of $25 million to $35 million for ongoing legal fees related to the Security Incident for full year 2022. Although we carry insurance against certain losses related to the Security Incident, we exceeded the limit of that insurance coverage during the first quarter of 2022. As a result, we will be responsible for all expenses or other losses (including penalties, fines or other judgements) or all types of claims that may arise in connection with the Security Incident, which could materially and adversely affect our liquidity and results of operations. (See Note 11 to our consolidated financial statements included in this report.) If any such fines or penalties were great enough that we could not pay them through funds generated from operating activities and/or cause a default under our credit facility, we may be forced to renegotiate or obtain a waiver under our credit facility and/or seek additional debt or equity financing. Such renegotiation or financing may not be available on acceptable terms, or at all. In these circumstances, if we were unable to obtain sufficient financing, we may not be able to meet our obligations as they come due.
In addition, publicity or developments related to the Security Incident could in the future have a range of other adverse effects on our business or prospects, including causing or contributing to loss of customer confidence, reduced customer demand, reduced customer retention, strategic growth opportunities, and associated retention and recruiting difficulties, some or all of which could be material.
The COVID-19 pandemic has disrupted, and is expected to continue to disrupt, our business, which is likely to adversely affect our operations and financial performance.
The outbreak of COVID-19 in countries across the globe, including each country in which we currently operate, has adversely impacted the U.S. and global economies. We have experienced disruptions to our business thus far from COVID-19, and the pandemic continues to impact each of our markets. Governmental authorities have taken, and continue to take, countermeasures to slow the outbreak, including shelter-in-place and business closure orders and large-scale restrictions on travel. Furthermore, because the pandemic is a rapidly evolving situation, we cannot anticipate with certainty the length, scope or severity of such restrictions in the jurisdictions in which we operate.
Certain vertical markets we serve are especially vulnerable to the ongoing global business disruption. For example:
•Many arts and cultural organizations, including museums, zoos, performing arts centers and theaters, among others, have had to cancel events or have seen a significant decline in attendance due to COVID-19. Many of these organizations have also suspended their operations temporarily.
•We believe that a number of K-12 private schools, that would have ordinarily considered purchasing our cloud solutions for the 2021-2022 academic school year, have delayed their expenditure decisions due to the uncertainty of COVID-19.
•A number of our nonprofit customers have also been negatively impacted by the postponement or cancellation of mass-participation events, such as marathons and other endurance sporting events, galas, auctions and other fundraisers.
We believe that COVID-19 has impacted and will continue to impact all of our vertical markets across all of our geographies to some degree, but the significance and duration of the impact on our business cannot be determined at this time due to numerous uncertainties, including the duration of the outbreak, travel restrictions and business closures, the effectiveness of vaccination programs and other actions taken to contain the disease and other unforeseeable consequences. This impact could include:
•further declines in customer demand and our ability to build pipeline of new customer contracts;
•continued elongated sales cycles;
•our relationship with, and the financial and operational capacities of, our service providers, suppliers and business partners, including their ability to fulfill their obligations to us;
•further declines in our customers' ability to pay for our solutions and services;
•reduced workforce availability and productivity due to potential health effects and concerns;
•risks associated with our indebtedness (including available borrowing capacity, compliance with financial covenants and ability to refinance or repay indebtedness on favorable terms);
•the adequacy of our cash flows and earnings and other conditions that may affect our liquidity;
•disruptions to our technology network and other critical systems; and
•impairment charges against our goodwill and other intangible assets, operating lease right-of-use assets and other long-lived assets.
We believe that business disruption relating to COVID-19 will continue to negatively impact the U.S. and global economies and may continue to materially adversely impact our business, financial condition and results of operations.
Defects, delays or interruptions in our cloud solutions and hosting services could diminish demand for these services and subject us to substantial liability.
We currently utilize data center hosting facilities to provide cloud solutions to most of our subscription customers and hosting services to our on-premise license customers. Any damage to, or failure of, these data center systems generally could result in interruptions in service to our customers, notwithstanding any business continuity or disaster recovery agreements that may currently be in place at these facilities. Because our cloud solutions and hosting service offerings are complex and we have incorporated a variety of new computer hardware and software systems at our data centers, our services might have errors or defects that users identify after they begin using our services. This could result in unanticipated downtime for our customers and harm to our reputation and business results. Internet-based services sometimes contain undetected errors when first introduced or when new versions or enhancements are released. We have from time to time found defects in our web-based services and new errors might again be detected in the future. In addition, our customers might use our Internet-based offerings in unanticipated ways that cause a disruption in service for other customers attempting to access their data.
Because our customers use these services for important aspects of their businesses, any defects, delays or disruptions in service or other performance problems with our services could hurt our reputation and damage our customers' businesses. If that occurs, customers could elect to cancel their service, delay or withhold payment to us, not purchase from us in the future or make claims against us, which could result in an increase in our provision for credit losses, an increase in collection cycles for accounts receivable or the expense and risk of litigation. Any of these could harm our business and reputation.
Material defects or errors in the software we use to deliver our services could harm our reputation, result in significant costs to us and impair our ability to sell our services.
The software applications underlying our services are inherently complex and may contain material defects or errors, particularly when first introduced or when new versions or enhancements are released. We have from time to time found defects in our software, and new errors in our existing software may be detected in the future.
After the release of our software, defects or errors may also be identified from time to time by our internal team and our customers. The costs incurred in correcting any material defects or errors in our software may be substantial and could harm our operating results. Furthermore, our customers may use our software together with solutions from other companies. As a result, when problems occur, it might be difficult to identify the source of the problem. Even when our software does not cause these problems, the existence of these errors might cause us to incur significant costs, divert the attention of our technical personnel from our solution development efforts, impact our reputation and cause significant customer relations problems.
If we are unable, or our customers believe we may be unable, to detect and prevent unauthorized use of payment card or other private financial or personal information, we could be subject to financial liability, our reputation could be harmed and customers may be reluctant to use our solutions and services.
The rules of payment card associations in which we participate require that we comply with Payment Card Industry Data Security Standard ("PCI DSS") in order to preserve security of payment card data. Under PCI DSS, we are required to adopt and implement internal controls over the use, storage and security of payment card data to help prevent card fraud. Conforming our solutions and services to PCI DSS or other payment services related regulations or requirements imposed by payment networks or our customers or payment processing partners is expensive and time-consuming. However, failure to comply may subject us to fines, penalties, damages and civil liability, may impair the security of payment card data in our possession, and may harm our reputation and our business prospects, including by limiting our ability to process transactions. All Blackbaud products in scope for PCI DSS compliance meet applicable PCI DSS security requirements.
In addition, we routinely subject our various data protection processes and controls to voluntary third-party review, audit or reporting, including, for example, the American Institute of Certified Public Accountants’ System and Organization Controls reporting. Failure to conduct these voluntary data protection process and control reviews or to obtain and maintain audits or reports covering our data protection processes and controls may harm our reputation or our business prospects and our ability to market our solutions to our customers.
Our operations might be affected by the occurrence of a natural disaster or other catastrophic event.
We depend on our principal executive offices and other facilities for the continued operation of our business. Although we have contingency plans in effect for natural disasters or other catastrophic events, these events, including terrorist attacks, computer hacker attacks and natural disasters such as hurricanes, flooding and earthquakes, could disrupt one or more of these facilities and adversely affect our operations. Our principal executive offices are located in a coastal region that has experienced hurricanes and earthquakes in the past. Even though we carry business interruption insurance policies and typically have provisions in our commercial contracts that protect us in certain events, we might suffer losses as a result of business interruptions that exceed the coverage available under our insurance policies or for which we do not have coverage. Any natural disaster or catastrophic event affecting us could have a significant negative impact on our operations.
Complications with the design or implementation of our new global enterprise resource planning ("ERP") system could adversely affect our operations and operating results
We rely extensively on information systems and technology to manage our business and summarize our operating results. We have implemented a new ERP system, which replaced our previous core financial systems. The new ERP system was designed to accurately maintain our financial records, enhance the flow of financial information, improve data management, and provide timely information to our management team. Failure in the design and implementation of the new ERP system could harm our business, financial condition and operating results. Additionally, failure in the design or implementation of the new ERP system as planned or if the ERP system does not operate as intended, the effectiveness of our internal control over financial reporting could be negatively affected.
Because a significant portion of our revenue is recognized over time on a ratable basis over the contract term, downturns in sales may not be immediately reflected in our revenue.
We generally recognize our subscription and maintenance revenue ratably over time over the contract term. Our subscription arrangements are generally for a term of three years at contract inception with one to three-year renewals thereafter. Most of our maintenance arrangements are for a one-year term. As a result, much of the revenue we report in each quarter is attributable to arrangements entered into during previous quarters. Consequently, a decline in sales to new customers, renewals by existing customers or market acceptance of our solutions in any one quarter will not necessarily be fully reflected in the revenues in that quarter and could negatively affect our revenues and profitability in future quarters.
If our customers do not renew their subscriptions for our solutions or annual maintenance and support arrangements or if they do not renew them on terms that are favorable to us, our business might suffer.
Our subscription arrangements are generally for a term of three years at contract inception with one to three-year renewals thereafter. Most of our maintenance arrangements are for a one-year term. As the end of the contract term approaches, we seek the renewal of the agreement with the customer. Historically, subscription and maintenance renewals have represented a significant portion of our total revenue. Because of this characteristic of our business, if our customers choose not to renew their subscriptions or maintenance and support arrangements with us on beneficial terms or at all, our business, operating results and financial condition could be harmed. Our customers' renewal rates may decline or fluctuate as a result of a number of factors, including their level of satisfaction with our solutions and services and their ability to continue their operations and spending levels due to COVID-19 or otherwise.
We significantly increased our leverage in connection with acquisitions.
We incurred a substantial amount of indebtedness in connection with acquisitions, including our recent acquisition of EVERFI, Inc. (as described in Note 3) and the purchase of our global headquarters facility in 2020. As a result of this indebtedness, our interest payment obligations have increased. In addition, we have been named as a party in various lawsuits in connection with the Security Incident, other claims may be asserted by or on behalf of our customers or their constituents, and we are subject to various governmental inquires, requests or investigations. Responding to and resolving these current and any future lawsuits, claims and/or investigations could result in material remedial and other expenses. Although we intend to defend ourselves vigorously against the claims asserted against us, we cannot predict the potential outcomes, cost and expenses associated with current and any future claims, lawsuits, inquiries and investigations, which could require that we incur additional indebtedness to fund. (See Note 11 to our consolidated financial statements in this report for additional information regarding the Security Incident.)
The degree to which we are leveraged could have adverse effects on our business, including the following:
•Requiring us to dedicate a substantial portion of our cash flow from operations to payments on our indebtedness, thereby reducing the availability of our cash flow to fund working capital, capital expenditures, acquisitions, dividends, share repurchases and other general corporate purposes;
•Limiting our flexibility in planning for, or reacting to, changes in our business and the industries in which we operate;
•Restricting us from making additional strategic acquisitions or exploiting business opportunities;
•Placing us at a competitive disadvantage compared to our competitors that have less debt;
•Reducing our currently available borrowing capacity or limiting our ability to borrow additional funds; and
•Decreasing our ability to compete effectively or operate successfully under adverse economic and industry conditions.
If we incur additional debt, these risks may intensify. Our ability to meet our debt service obligations will depend upon our future performance, which will be subject to the financial, business and other factors affecting our operations, many of which are beyond our control.
Our balance sheet includes significant amounts of goodwill and intangible assets. The impairment of a significant portion of these assets could negatively affect our operating results.
As of December 31, 2021, we had $1.1 billion and $698.1 million of goodwill and intangible assets, respectively, which reflects an increase of $422.8 million and $457.4 million, respectively, as a result of our recent acquisition of EVERFI. On at least an annual basis, we assess whether there have been impairments in the carrying value of goodwill and intangible assets. If the carrying value of an asset is determined to be impaired, then it is written down to fair value by a non-cash charge to operating earnings. Changes in circumstances that could indicate that the carrying value of goodwill or intangible assets may not be recoverable include declines in our stock price, market capitalization, cash flows and slower growth rates in our industry. We cannot accurately predict the likelihood or potential amount and timing of any impairment of goodwill or other intangible assets. An impairment of a significant portion of goodwill or intangible assets could materially and negatively affect our results of operations and financial condition.
Restrictions in our credit facility may limit our activities, including dividend payments, share repurchases and acquisitions.
Our credit facility contains restrictions, including covenants limiting our ability to incur additional debt, grant liens, make acquisitions and other investments, prepay specified debt, consolidate, merge or acquire other businesses, sell assets, pay dividends and other distributions, repurchase stock and enter into transactions with affiliates. There can be no assurance that we will be able to remain in compliance with the covenants to which we are subject in the future and, if we fail to do so, that we will be able to obtain waivers from our lenders or amend the covenants.
In the event of a default under our credit facility, we could be required to immediately repay all outstanding borrowings, which we might not be able to do. In addition, certain of our material domestic subsidiaries are required to guarantee amounts borrowed under the credit facility, and we have pledged the shares of certain of our subsidiaries as collateral for our obligations under the credit facility. Any such default could have a material adverse effect on our ability to operate, including allowing lenders under the credit facility to enforce guarantees of our subsidiaries, if any, or exercise their rights with respect to the shares pledged as collateral.
We cannot guarantee that our stock repurchase program will be fully consummated or that it will enhance long-term stockholder value. Share repurchases could also increase the volatility of the trading price of our stock and will diminish our cash reserves.
Although our board of directors has authorized a stock repurchase program that does not have an expiration date, the program does not obligate us to repurchase any specific dollar amount or to acquire any specific number of shares of our common stock. We cannot guarantee that the program will be fully consummated or that it will enhance long-term stockholder value. The program could affect the trading price of our stock and increase volatility, and any announcement of a termination of this program may result in a decrease in the trading price of our stock. In addition, this program will diminish our cash reserves, which may impact our ability to finance future growth, to pursue possible future strategic opportunities and acquisitions and fund liabilities and expenses related to the Security Incident. (See Note 14 to our consolidated financial statements in this report for additional information related to our stock repurchase program.)
We have recorded significant deferred tax assets, and we might never realize their full value, which would result in a charge against our earnings.
As of December 31, 2021, we had deferred tax assets of $137.4 million. Realization of our deferred tax assets is dependent upon our generating sufficient taxable income in future years to realize the tax benefit from those assets. Deferred tax assets are reviewed at least annually for realizability. A charge against our earnings would result if, based on the available evidence, it is more likely than not that some portion of the deferred tax asset will not be realized beyond our existing valuation allowance. This could be caused by, among other things, deterioration in performance, adverse market conditions, adverse changes in applicable laws or regulations, including changes that restrict the activities of or affect the solutions sold by our business and a variety of other factors. For example, during 2020, we recorded an increase in our valuation allowance attributable to state tax credit carryforwards for which we do not expect to realize benefit. (See Note 12 to our consolidated financial statements in this report for additional details.) If a deferred tax asset net of our valuation allowance was determined to be not realizable in a future period, the charge to earnings would be recognized as an expense in our results of operations in the period the determination is made.
Additionally, if we are unable to utilize our deferred tax assets, our cash flow available to fund operations could be adversely affected.
Depending on future circumstances, it is possible that we might never realize the full value of our deferred tax assets. Any future impairment charges related to a significant portion of our deferred tax assets would have an adverse effect on our financial condition and results of operations.
| | |
| Legal and Compliance Risks |
Privacy and data protection concerns, including evolving domestic and international government regulation in the area of consumer data privacy or data protection, could adversely affect our business and operating results.
The effectiveness of our software solutions relies on our customers' storage and use of data concerning their customers, including financial, personally identifying or other sensitive data. Our customers' collection and use of this data for donor profiling, data analytics or communications outreach might raise privacy and data protection concerns and negatively impact the demand for our solutions and services. For example, our custom modeling and analytical services rely heavily on processing and using of data we gather from customers and various sources. Privacy and data protection laws could add restrictions or regulatory burdens, which could limit our ability to market and profit from those services.
Governments in some jurisdictions have enacted or are considering enacting consumer data privacy or data protection legislation, including laws and regulations applying to the solicitation, collection, transfer, processing and use of personal data. This legislation could reduce the demand for our software solutions if we fail to design or enhance our solutions to enable our customers to comply with the privacy and data protection measures required by the legislation. Moreover, we may be exposed to liability under existing or new consumer privacy or data protection legislation. For example, when providing our solutions to certain customers in the healthcare industry, we must comply with applicable provisions of the Health Insurance Portability and Accountability Act of 1996 ("HIPAA"), and might be subject to similar provisions of other legislation, including, without limitation, the Gramm-Leach-Bliley Act and related regulations, and the California Consumer Privacy Act of 2018, which became effective January 1, 2020, and may apply to some of our customers and areas of business. Even technical violations of these laws may result in penalties that are assessed for each non-compliant transaction.
Blackbaud, and some of our customers, are subject to the E.U. General Data Protection Regulation (“GDPR”), which became effective in the E.U. in May 2018 and its provisions continue to apply in the U.K. after Brexit by virtue of legislation incorporating the GDPR into U.K. data protection law, known as the "U.K. GDPR." The law requires companies to meet requirements regarding the handling of personal data, including rights such as the portability of personal data. We completed an extensive program of product and operational changes to address GDPR requirements and all future solutions sold to customers subject to GDPR must include GDPR features. The implementation of GDPR has affected our ability to offer some features and services to customers in the E.U. and U.K. Furthermore, actions and investigations by regulatory authorities related to data security incidents and privacy violations continue to increase, which could impact us through increased costs or restrictions on our business, and noncompliance could result in significant regulatory penalties and legal liability.
If our customers or we were found to be subject to and in violation of any privacy or data protection laws or regulations, our business may be materially and adversely impacted and we and/or our customers would likely have to change our business practices. In addition, these laws and regulations could impose significant costs on our customers and us and make it more difficult for donors to make online donations. (See Note 11 to our consolidated financial statements included in this report for a description of the Security Incident and related legal proceedings and regulatory matters.)
We are in the information technology business, and our solutions and services store, retrieve, transfer, manipulate and manage our customers’ information and data. The effectiveness of our software solutions relies on our customers’ storage and use of data concerning their donors, including financial, personally identifying and other sensitive data and our business uses similar systems that require us to store and use data with respect to our customers and personnel. Our collection and our customers’ collection and use of this data might raise privacy and data protection concerns and negatively impact our business or the demand for our solutions and services. If a breach of data security, such as the Security Incident, were to occur, or other violation of privacy or data protection laws and regulations were to be alleged, our business may be materially and adversely impacted and solutions may be perceived as less desirable, which would negatively affect our business and operating results.
Claims that we or our technologies infringe upon the intellectual property or other proprietary rights of a third party may require us to incur significant costs, enter into royalty or licensing agreements or develop or license substitute technology.
We have been, and may in the future be subject to claims that the technologies in our solutions and services infringe upon the intellectual property or other proprietary rights of a third party. In addition, the vendors providing us with technology that we use in our own solutions could become subject to similar infringement claims. Although we believe that our solutions and services do not infringe any intellectual property or other proprietary rights, we cannot be certain that our solutions and services do not, or that they will not in the future, infringe intellectual property or other proprietary rights held by others. Any claims of infringement could cause us to incur substantial costs to defend against the claim, even if the claim is without merit, and could distract our management from our business. Moreover, any settlement or adverse judgment resulting from the claim could require us to pay substantial amounts, or obtain a license to continue to use the technology and services that are the subject of the claim, and/or otherwise restrict or prohibit our use of the same. There can be no assurance that we would be able to obtain a license on commercially reasonable terms from the third party asserting any particular claim, or that we would be able to successfully develop alternative technology on a timely basis, or that we would be able to obtain a license from another provider of suitable alternative technology to permit us to continue offering, and our customers to continue using, the solutions and services. In addition, we generally provide in our customer arrangements for certain solutions and services that we will indemnify our customers against third-party infringement claims relating to technology we provide to those customers, which could obligate us to pay damages if the solutions and services were found to be infringing. Infringement claims asserted against us, our vendors or our customers may have a material adverse effect on our business, prospects, financial condition and results of operations.
Our solutions utilize open source software, which may subject us to litigation, require us to re-engineer our solutions, or otherwise divert resources away from our development efforts.
We use open source software in connection with certain of our solutions. Such open source software is generally licensed by its authors or other third parties under open source licenses, including, for example, the GNU General Public License, the GNU Lesser General Public License, “Apache-style” licenses, “BSD-style” licenses and other open source licenses. There is little legal precedent governing the interpretation of many of the terms of some of these licenses and, therefore, the potential impact of these terms on our business is currently unable to be determined and may result in unanticipated obligations regarding our solutions and technologies. From time to time, companies that incorporate open source software into their products have faced claims challenging the ownership of open source software and/or compliance with open source license terms. Therefore, we could be subject to litigation by parties claiming ownership of open source software or noncompliance with open source licensing terms. Some open source software licenses require users who distribute open source software as part of their own software to publicly disclose all or part of the source code to such software and/or make available any derivative works of the open source code on unfavorable terms or at no cost. While we monitor our use of open source software and try to ensure that none is used in a manner that would require us to disclose the source code or that would otherwise breach the terms of an open source agreement, such use could inadvertently occur and we may be required to release proprietary source code, pay damages for breach of contract, re-engineer our applications, discontinue sales in the event re-engineering cannot be accomplished on a timely basis, or take other remedial action that may divert resources away from our development efforts, any of which could adversely affect our business.
We rely upon trademark, copyright, patent and trade secret laws to protect our proprietary rights, which might not provide us with adequate protection.
Our success and ability to compete depends to a significant degree upon the protection of our proprietary technology rights. We might not be successful in protecting our proprietary technology and our proprietary rights might not provide us with a meaningful competitive advantage. To protect our core proprietary technology, we rely on a combination of patent, trademark, copyright and trade secret laws, as well as nondisclosure agreements, each of which affords only limited protection.
Changing domestic and international laws, government regulations and policies could adversely affect our business and operating results by increasing compliance costs, reducing customer demand for our solutions or damaging our reputation.
Certain of our solutions, in particular, our financial management and payment services solutions, relate to activity heavily regulated by government agencies in the U.S., the U.K. and other countries in which we operate. The laws and regulations enforced by these agencies are proposed or enacted to deter fraud and other illicit financial transactions and to protect consumers and the financial system and are often revised or increased in scope. We have procedures and controls in place to monitor compliance with numerous federal, state and foreign laws and regulations. However, because these laws and regulations are complex, differ between jurisdictions, and are often subject to interpretation, or as a result of unintended errors, we may, from time to time, inadvertently violate these laws and regulations. Compliance with these laws and regulations is expensive and requires the time and attention of management. These costs divert capital and focus away from efforts intended to grow our business. If we do not successfully comply with laws, regulations, or policies, we could incur fines or penalties, be subject to litigation, lose existing or new customer contracts or other business, and suffer damage to our reputation.
In addition, changes in certain laws, regulations or policies could impact our customers, alter our business environment and limit our operations. For example, various financial institutions subscribe to our EVERFI training solution, which they may then provide free of charge to schools in low-income and moderate-income communities as a means of satisfying their obligations under the Community Reinvestment Act of 1977, as amended (the “CRA”). Repeal or significant modification of the CRA or the many government agency regulations and policies implementing its provisions could cause financial institutions to limit or eliminate their purchases of these EVERFI solutions and thereby negatively impact our operating results and financial condition.
Anti-takeover provisions in our charter documents and Delaware law may delay or prevent an acquisition of our Company.
Provisions of Delaware law, our certificate of incorporation and bylaws may have the effect of delaying or preventing a change in control of our company or deterring tender offers for our common stock that other stockholders may consider in their best interests. Our certificate of incorporation authorizes “blank check” preferred stock, which could be issued by the board of directors without stockholder approval and may contain voting, liquidation, dividend and other rights superior to our common stock. Stockholder approval is not necessary to issue preferred stock in this manner. Issuance of these shares of preferred stock could have the effect of making it more difficult and more expensive for a person or group to acquire control of us, and could effectively be used as an anti-takeover device. Currently there are no shares of our preferred stock issued or outstanding. Our bylaws provide for an advance notice procedure for stockholders to nominate director candidates for election or to bring business before an annual meeting of stockholders, including proposed nominations of persons for election to our board of directors, and limit the persons who may call special meetings of stockholders. The anti-takeover provisions of Delaware law and provisions in our organizational documents may prevent our stockholders from receiving the benefit from any premium to the market price of our common stock offered by a bidder in a takeover context. Even in the absence of a takeover attempt, the existence of these provisions may adversely affect the prevailing market price of our common stock if they are viewed as discouraging takeover attempts in the future.
ITEM 1B. UNRESOLVED STAFF COMMENTS
None.
ITEM 2. PROPERTIES
We own our LEED Gold certified global headquarters facility in Charleston, South Carolina, which consists of approximately 172,000 square feet. We believe that it is in good operating condition and adequately serves our current business operations.
In October 2021, we made the decision to permanently close our fixed office locations (with the exception of our global headquarters facility), effective in December 2021. This change was intended to align our real estate footprint with our transition to a remote-first workforce. We enter into arrangements for smaller more flexible workspaces where necessary.
As discussed above, in December 2021, we acquired EVERFI and assumed a lease for office space in Washington, D.C.
ITEM 3. LEGAL PROCEEDINGS
For a discussion of our legal proceedings, see Note 11 to our consolidated financial statements in this report.
ITEM 4. MINE SAFETY DISCLOSURES
Not applicable.
ITEM 5. MARKET FOR REGISTRANT'S COMMON EQUITY, RELATED STOCKHOLDER MATTERS AND ISSUER PURCHASES OF EQUITY SECURITIES
Our common stock is trading on the Nasdaq Stock Market LLC (“Nasdaq”) under the symbol “BLKB.” As of February 22, 2022, there were approximately 173 stockholders of record of our common stock. Because many of our shares of common stock are held by brokers and other institutions on behalf of stockholders, this number is not representative of the total number of beneficial owners of our stock. On February 22, 2022, the closing price of our common stock was $61.69.
The following performance graph shall not be deemed to be “soliciting material” or “filed” or incorporated by reference in future filings with the SEC, or subject to the liabilities of Section 18 of the Exchange Act except as shall be expressly set forth by specific reference in such filing. The performance graph compares the performance of our common stock to the Nasdaq Composite Index and the Nasdaq Computer and Data Processing Index. The graph covers the most recent five-year period ended December 31, 2021. The graph assumes that the value of the investment in our common stock and each index was $100.00 at December 31, 2016, and that all dividends are reinvested.
| | | | | | | | | | | | | | | | | | | | | | | | | | | | | | | | | | | |
| December 31, | 2016 | | 2017 | | 2018 | | 2019 | | 2020 | | 2021 |
| Blackbaud, Inc. | $100.00 | | $148.49 | | $99.37 | | $126.50 | | $91.63 | | $125.73 |
| Nasdaq Composite Index | 100.00 | | 129.64 | | 125.96 | | 172.17 | | 249.51 | | 304.85 |
| Nasdaq Computer & Data Processing Index | 100.00 | | 139.43 | | 142.28 | | 199.78 | | 286.00 | | 372.90 |
| | |
| Issuer Purchases of Equity Securities |
The following table provides information about shares of common stock acquired or repurchased during the three months ended December 31, 2021 under the stock repurchase program then in effect, as well as common stock withheld by us to satisfy the minimum tax obligations of employees due upon vesting of restricted stock awards and units.
| | | | | | | | | | | | | | | | | | | | | | | | | | |
| Period | | Total number of shares purchased(1) | | Average
price
paid
per
share | | Total number of shares purchased as part of publicly announced plans or programs(2) | | Approximate dollar value of shares that may yet be purchased under the plans or programs (in thousands)(2) |
| Beginning balance, October 1, 2021 | | | | | | | | $ | 110,646 | |
| October 1, 2021 through October 31, 2021 | | 138,785 | | | $ | 72.51 | | | 138,785 | | | 100,583 | |
| November 1, 2021 through November 30, 2021 | | 4,903 | | | 79.94 | | | — | | | 100,583 | |
| December 1, 2021 through December 31, 2021 | | — | | | — | | | — | | | 250,000 | |
| Total | | 143,688 | | | $ | 72.76 | | | 138,785 | | | $ | 250,000 | |
(1)Includes 4,903 shares in November withheld by us to satisfy the minimum tax obligations of employees due upon vesting of restricted stock awards and units. The level of this acquisition activity varies from period to period based upon the timing of award grants and vesting.
(2)In December 2021, our Board of Directors reauthorized and replenished our stock repurchase program to authorize us to purchase up to $250.0 million of our outstanding shares of common stock. The program does not have an expiration date.
Our Board of Directors had previously adopted a dividend policy which reflected an intention to distribute to our stockholders a portion of the cash generated by our business that exceeds our operating needs and capital expenditures as regular quarterly dividends.
As a part of a series of measures to better enable us to weather the extraordinary business challenges occasioned by COVID-19 and further effect our long-term strategy to deliver the greatest value to our stockholders, we announced on April 6, 2020 that our Board of Directors had rescinded its previously announced policy to pay an annual dividend at a rate of $0.48 per share of common stock and discontinued the declaration and payment of all cash dividends beginning with the second quarter of 2020 and thereafter until such time, if any, as the Board of Directors may determine in its sole discretion. As a result, we paid a first quarter dividend of $0.12 per share in 2020 resulting in aggregate dividend payments to stockholders of $6.0 million, but no further dividends were declared or paid in 2020 or 2021. We currently do not anticipate declaring or paying any cash dividends for the foreseeable future.
ITEM 6. [RESERVED]
ITEM 7. MANAGEMENT'S DISCUSSION AND ANALYSIS OF FINANCIAL CONDITION AND RESULTS OF OPERATIONS
The following discussion and analysis of our financial condition and results of operations should be read in conjunction with Item 1A Risk factors and our consolidated financial statements and related notes included elsewhere in this Annual Report on Form 10-K. The following discussion and analysis presents financial information denominated in millions of dollars which can lead to differences from rounding when compared to similar information contained in the consolidated financial statements and related notes, which are primarily denominated in thousands of dollars.
We are the world’s leading cloud software company powering social good. Serving the entire social good community—nonprofits, higher education institutions, K–12 schools, healthcare organizations, faith communities, arts and cultural organizations, foundations, companies and individual change agents—we connect and empower organizations and individuals to increase their impact through cloud software, services, expertise and data intelligence. Our portfolio is tailored to the unique needs of vertical markets, with solutions for fundraising and CRM, marketing, advocacy, peer-to-peer fundraising, corporate social responsibility (CSR) and environmental, social and governance (ESG), school management, ticketing, grantmaking, financial management, payment processing and analytics. Serving the industry for more than four decades, we are a remote-first company headquartered in Charleston, South Carolina, with operations in the United States, Australia, Canada, Costa Rica and the United Kingdom. During 2021, we had nearly 40,000 customers with contractual billing arrangements and nearly 100,000 customers that paid us through transactional fees. Through our customers and our solutions, we support millions of users and we connect millions of supporters to over 150,000 organizations and causes in over 100 countries.
Our revenue is primarily generated from the following sources: (i) charging for the use of our software solutions in cloud and hosted environments; (ii) providing payment and transaction services; (iii) providing software maintenance and support services; and (iv) providing professional services, including implementation, consulting, training, analytic and other services.
COVID-19 Impact
The economic impact of COVID-19 on the social good industry remains somewhat uncertain, although we are seeing signs of recovery in the industry. We believe the COVID-19 pandemic has accelerated the shift to a digital-first world. The percentage of giving done online grew by approximately 40% in 2020 with roughly a quarter of that giving taking place on mobile devices. If our existing and prospective customers remain cautious in their purchase decisions, our operating environment may continue to be challenging. Notwithstanding these conditions, we remain focused on continuing to execute our four-point strategy and strengthening our leadership position.
Four-Point Growth Strategy
| | | | | | | | | | | | | | |
| 1 | | Expand Total Addressable Market | |
| | | | |
| 2 | | Lead with World Class Teams and Operations | |
| | | | |
| 3 | | Delight Customers with Innovative Cloud Solutions | |
| | | | |
| 4 | | Focus on Employees, Culture and ESG Initiatives | |
1.Expand TAM
In December 2021, we doubled our TAM when we acquired EVERFI, an industry leader in global social impact technology. Adding EVERFI advances our position as a leader in the rapidly evolving ESG and CSR spaces and offers cross-selling and upselling opportunities through complementary product offerings with YourCause solutions. Our TAM now stands at over $20 billion, and we remain active in the evaluation of opportunities to further expand our addressable market through acquisitions and internal product development.
2.Lead with World Class Teams and Operations
We have been investing in sales and marketing to better address our market opportunity with a focus on digital lead generation. One way we are equipping our salesforce to be more effective is by investing in the necessary technology and resources to efficiently drive an increased number of quality leads and better cover our large addressable market. We have implemented software tools to enhance our digital footprint and drive lead generation across the company. We are taking a multi-touch attribution approach to measuring the effectiveness of our marketing campaigns to drive efficiency in our go-to-market efforts and improve returns on our marketing dollars. This is just one of many examples of how we are optimizing our structure, tools and processes to better address our large vertical market opportunities. We have also taken lessons learned throughout the pandemic and re-evaluated elements of our go-to-market strategy with a digital-first mindset, and we have a significant opportunity to leverage the investments into digital to reduce our customer acquisition cost and increase our sales velocity, ultimately, driving a more scalable and cost-effective go-to-market model.
3.Delight Customers with Innovative Cloud Solutions
This strategy reflects our relentless focus on driving value and outcomes for our customers through our solutions. Blackbaud SKY®, our platform for cloud innovation, is a core tenant of this strategy and continues to power an elevated level of innovation by our engineers. It is also enabling our growing ecosystem of partners who are also passionate about social good, to extend and expand the capabilities available to our customers. During 2021, we continued making critical investments in research and development. Through our commitment to giving customers the flexibility to benefit, not just from Blackbaud's innovation, but the innovation happening outside of our walls, we developed more tools designed to create new capabilities that extend Blackbaud solutions. We now have over 6,000 non-Blackbaud developers registered in our ecosystem and we have seen substantial growth in the Blackbaud marketplace, where over 6,500 organizations have found a curated app to help them work smarter. Some of the use cases we have seen in the market include: an app that integrates Shopify with Raiser's Edge NXT and a new API integrating YourCause with Workday, enabling our customers to easily connect employee data into the YourCause platform for more effective employee engagement. We have also enabled non developers with low-code or no-code tools, such as our Microsoft Power Platform connector, to build automated workflows with our APIs without having to be seasoned developers, and we continue to innovate as online gifts become a greater share of our customers' total donations.
The customers we serve require vertical specific business solutions to automate their operations. In 2021, we released a variety of enhancements enabling them to maximize their time, team, and relationships, including substantial updates to Blackbaud Grantmaking and a significant release for accounts receivable functionality in Blackbaud Financial Edge NXT is now with early adopters.
4.Focus on Employees, Culture and ESG Initiatives
During the first quarter of 2021, we elevated a specific strategy focused on our employees, culture and ESG initiatives. This is not new for us. It is something that is in our DNA and is a big advantage as we look to attract and retain top talent. This is evident in our 2020 social responsibility report, which was released in April 2021. We are fully committed to continuing to create a diverse and inclusive environment at all levels of the organization. Early in 2021, we established an ESG Steering Committee with our CEO as the executive sponsor, and Board of Directors involvement. During the first quarter of 2021, we also joined the United Nations Global Compact. Building on our culture of innovation, we launched a new ideation initiative called "Imagine Week," inviting employees across the globe to pitch their ideas directly to the executive leadership team. Employees at every level and length of tenure in the company made proposals ranging from fundraising to customer service improvements. These ideas are making their way into our go-forward plans. In addition, we recently decided, effective in December 2021, to permanently close our fixed office locations (with the exception of our global headquarters facility in Charleston, South Carolina) to align our real estate footprint with our transition to a remote-first workforce. We enter into arrangements for smaller more flexible workspaces where necessary. This decision did not include EVERFI's office locations.
Financial Summary
| | | | | | | | |
| Total Revenue ($M) | | Income from Operations ($M) |
| YoY Growth (%) | | YoY Growth (%) |
Total revenue increased by $14.5 million during 2021, driven largely by the following:
| | | | | | | | | | | |
| + | | Growth in recurring revenue related to increase in transactional revenue from the continued shift toward virtual fundraising and online charitable giving and, to a lesser extent, early progress in initiatives to bring our pricing in line with the market; also included in the increase in recurring revenue is an increase related to fluctuations in foreign currency exchange rates of $8.6 million |
| - | | Decrease in one-time consulting revenue due primarily to less implementation and customization services, in line with our multi-year strategic shift from a license-based and one-time services business model to a cloud subscription business model. Our cloud subscription offerings generally require less implementation and customization services. |
| - | | Decrease in one-time analytics revenue as analytics are generally integrated in our cloud solutions |
For additional information on the impact of foreign currency fluctuations on our financial results, see Foreign Currency Exchange Rates below on page 44.
Income from operations decreased by $12.3 million during 2021, driven largely by the following:
| | | | | | | | | | | |
| - | | Increase in stock-based compensation expense of $33.1 million due to: •Certain changes to our compensation program that are expected to cause stock-based compensation expense to remain higher than historical levels, including: ◦replacement of our annual cash bonus plans with a short-term performance-based equity award plan ◦decrease in the vesting period for our annual long-term incentive time-based equity awards from 4 years (1/4 per year) to 3 years (1/3 per year), beginning in February 2021; and ◦replacement of cash sign-on and retention bonuses with time-based equity awards. •Increases in the grant date fair values of our annual equity awards granted to employees; and •Overall Company performance against 2020 and 2021 goals. |
| - | | Increase in transaction-based costs of $9.6 million related to payment services integrated in our cloud solutions |
| - | | Increases in third-party contractor and hosting costs of $6.9 million and $3.4 million, respectively, as we continue to migrate our cloud infrastructure to leading public cloud service providers and invest in security |
| - | | Increase in corporate costs of $3.5 million primarily related to increases in third-party consulting fees and insurance costs, partially offset by a decrease in bad debt expense |
| - | | Increase in marketing costs of $3.5 million primarily due to investments in digital marketing and, to a lesser extent, incremental spending on advertising campaigns |
| | | |
| - | | Increase in acquisition-related expenses and integration costs of $2.8 million |
| + | | Increase in total revenue, as described above |
| + | | Decrease in real estate activity costs of $11.2 million due to our workforce strategy changes made in the third quarter of 2020 |
| + | | Decrease in rent expense of $9.2 million related to the purchase of our global headquarters facility during the third quarter of 2020 and our exit of certain other office leases globally during the second half of 2020 in-line with the changes to our workforce strategy at that time |
| + | | Decrease in amortization of intangible assets from business combinations of $4.8 million |
| + | | Decrease in compensation costs other than stock-based compensation of $3.5 million primarily due to a decrease in headcount, partially offset by base salary merit increases in July 2021 and the return of our 401(k)-match program effective January 1, 2021 |
| + | | Decrease in travel costs of $3.5 million due to our restriction on non-essential employee travel in response to the COVID-19 pandemic |
| + | | Decrease in employee severance of $3.4 million, related to a modest and targeted headcount reduction during the three months ended June 30, 2020, in response to the COVID-19 pandemic |
We are continuing to make critical investments in the business in areas such as digital marketing, engineering, security, customer success and our continued shift of cloud infrastructure to leading public cloud service providers. While we are making good progress, some of these investments have pushed into early 2022, particularly in areas where we are increasing headcount.
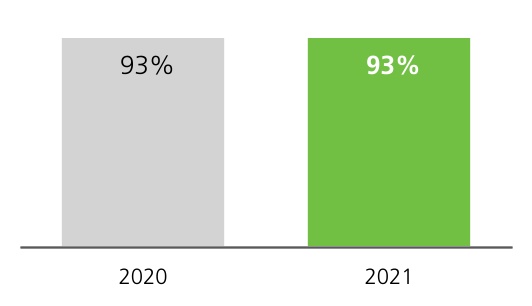
Our recurring revenue contracts are generally for a term of three years at contract inception with one to three-year renewals thereafter. We anticipate a continued decrease in maintenance contract renewals as we transition our solution portfolio and maintenance customers from a perpetual license-based model to a cloud subscription delivery model. In the long term, we also anticipate an increase in recurring subscription contract renewals as we continue focusing on innovation, quality and the integration of our cloud solutions, which we believe will provide value-adding capabilities to better address our customers' needs. Due primarily to these factors, we believe a recurring revenue customer retention measure that combines recurring subscription, maintenance and service customer contracts provides a better representation of our customers' overall behavior. During 2021 and 2020, approximately 93% of our customers with recurring revenue contracts were retained. This customer retention rate reflects our efforts to rationalize our portfolio of solutions and migrate customers from legacy solutions towards our next generation cloud solutions. We are investing in innovation, which we believe will increase customer retention over the long-term.
Balance sheet and cash flow
At December 31, 2021, our cash and cash equivalents were $55.1 million and the carrying amount of our debt under the 2020 Credit Facility was $895.6 million. Our net leverage ratio was 3.31 to 1.00.
During 2021, we generated $213.7 million in cash flow from operations and had a net increase in borrowings of $429.2 million, which was primarily used to finance our acquisition of EVERFI on December 31, 2021. Additionally, we returned $108.4 million to stockholders by way of share repurchases and had aggregate cash outlays of $52.2 million for purchases of property and equipment and capitalized software development costs.
Security Incident update
As discussed in Note 11 to our consolidated financial statements included in this report, total costs related to the Security Incident have exceeded the limit of our insurance coverage during the first quarter of 2022. Accordingly, we expect that the Security Incident will negatively impact our GAAP profitability and GAAP cash flow for the foreseeable future (see discussion regarding non-GAAP adjusted free cash flow on page 51). For full year 2022, we currently expect net cash outlays of approximately $25 million to $35 million for ongoing legal fees related to the Security Incident. In line with our policy, legal fees, are expensed as incurred. We have not recorded a liability for a loss contingency related to the Security Incident as of December 31, 2021 because we are unable at this time to reasonably estimate the possible loss or range of loss.
Reportable segment
We report our operating results and financial information in one operating and reportable segment. See Note 16 of our consolidated financial statements in this report for additional information.
Comparison of 2021 vs. 2020 and 2020 vs. 2019
Acquisitions
During 2021 and 2019, we acquired companies that provided us with strategic opportunities to expand our TAM and share of the philanthropic giving market through the integration of complementary solutions and services to serve the changing needs of our customers. The following are the companies we acquired and their respective acquisition dates:
•EVERFI, Inc. ("EVERFI") on December 31, 2021
•YourCause Holdings, LLC ("YourCause") on January 2, 2019
We have included the results of operations of acquired companies in our consolidated results of operations from the date of their respective acquisitions. In accordance with applicable accounting rules, we determined that the impact of the EVERFI and YourCause acquisitions were not material to our consolidated financial statements; therefore, revenue and earnings since the acquisition date and pro forma information are not required or presented. See Note 3 to our consolidated financial statements in this report for a summary of these acquisitions.
Revenue and Cost of Revenue
| | | | | | | | | | | | | | |
| Recurring | | | | |
| Revenue ($M) | | Cost of revenue ($M) | | Gross profit ($M)
and gross margin (%) |
| YoY Growth (%) | | YoY Growth (%) | | |
Recurring revenue is comprised of fees for the use of our subscription-based software solutions, which includes providing access to cloud solutions, hosting services, payment services, online training programs and subscription-based analytic services. Recurring revenue also includes fees from maintenance services for our on-premises solutions, services included in our renewable subscription contracts, retained and managed services contracts that we expect to have a term consistent with our cloud solution contracts, and variable transaction revenue associated with the use of our solutions.
Cost of recurring revenue is primarily comprised of compensation costs for customer support and production IT personnel, hosting and data center costs, third-party contractor expenses, third-party royalty and data expenses, allocated depreciation, facilities and IT support costs, amortization of intangible assets from business combinations, amortization of software development costs, transaction-based costs related to payments services including remittances of amounts due to third-parties and other costs incurred in providing support and recurring services to our customers.
Our customers continue to prefer cloud subscription offerings with integrated analytics, training and payment services. Recurring subscription contracts are typically for a term of three years at contract inception with one to three-year renewals thereafter. We intend to continue focusing on innovation, quality and integration of our cloud solutions, which we believe will drive future revenue growth.
Recurring revenue increased by $30.1 million, or 3.5%, driven primarily by the following:
| | | | | | | | | | | |
| + | | Increase in transactional revenue of $20.0 million primarily due to the continued shift toward virtual fundraising and online charitable giving; also included in the increase in transactional revenue is an increase related to fluctuations in foreign currency exchange rates of $4.7 million |
| + | | Increase in contractual recurring revenue of $10.1 million related to the performance of our cloud solutions and early progress in initiatives to bring our pricing in line with the market, partially offset by a decrease in maintenance revenue as customers migrate to our cloud solutions; also included in the increase in contractual recurring revenue is an increase related to fluctuations in foreign currency exchange rates of $3.9 million |
For additional information on the impact of foreign currency fluctuations on our financial results, see Foreign Currency Exchange Rates below on page 44.
Cost of recurring revenue increased by $21.1 million, or 5.7%, driven primarily by the following:
| | | | | | | | | | | |
| + | | Increase in compensation costs of $10.3 million primarily related to stock-based compensation due to the factors discussed above on page 36 and a shift in resources historically supporting one-time services and other towards recurring revenue |
| + | | Increase in transaction-based costs of $9.6 million related to payment services integrated in our cloud solutions |
| + | | Increase in third-party contractor and hosting costs of $7.8 million as we continue to migrate our cloud infrastructure to leading public cloud service providers and make investments in security |
| - | | Decrease in amortization of intangible assets from business combinations of $3.7 million |
| - | | Decrease in rent expense of $1.3 million largely due to a decrease in leased hardware, including servers, network gear and storage |
| - | | Decrease in amortization of software development costs of $0.8 million |
| | | |
| | | |
| | | |
Recurring gross margin decreased by 0.9% primarily due to the increase in cost of recurring revenue outpacing the increase in recurring revenue.
Recurring revenue increased by $19.1 million, or 2.3%, driven primarily by the following:
| | | | | | | | | | | |
| + | | Increase in transactional revenue of $18.3 million, including an accelerated shift toward virtual and online fundraising and charitable giving related to COVID-19 |
| + | | Increase in contractual recurring revenue of $15.5 million related to positive demand from customers across our portfolio of cloud solutions |
| - | | Decrease in maintenance revenue of $14.7 million primarily related to our continuing efforts to migrate customers from legacy on-premises solutions onto our solutions powered by Blackbaud SKY, our modern cloud platform |
Partially offsetting contractual recurring revenue was a decrease in the mix of retained and managed services contracts we present in recurring revenue. Revenue from retained and managed service contracts that we do not expect to have a term consistent with our cloud solution contracts is included in one-time services and other revenue beginning January 1, 2020. This change in presentation resulted in a decrease in recurring revenue and an offsetting increase to one-time services and other revenue of $16.7 million during the twelve months ended December 31, 2020.
Cost of recurring revenue increased by $11.7 million, or 3.3%, driven primarily by the following:
| | | | | | | | | | | |
| + | | Increase in transaction-based costs of $7.5 million related to payment services integrated in our cloud solutions |
| + | | Increase in amortization of software development costs of $6.8 million due to investments made on innovation, quality and the integration of our cloud solutions |
| + | | Impairment charge of $4.3 million during the three months ended June 30, 2020, against certain previously capitalized software development costs that reduced the carrying value of those assets to zero. The impairment charge resulted primarily from our decision to accelerate the end of customer support for certain solutions. |
| + | | Increase in hosting and data center costs of $3.8 million as we are migrating our cloud infrastructure to leading public cloud service providers |
| - | | Decrease in amortization of intangible assets from business combinations of $5.7 million |
| - | | Decrease in compensation costs primarily associated with the decision to replace our 2020 cash bonus plans with grants of performance-based equity awards, which were recognized as stock-based compensation expense between May 1, 2020 and May 1, 2021. These awards were earned and became eligible for vesting on May 1, 2021 subject to meeting certain performance conditions and the recipient's continued employment with us |
| - | | Decrease in costs associated with certain retained and managed services contracts for which revenue is included in one-time services and other revenue beginning January 1, 2020, as discussed above |
Recurring gross margin decreased by 0.4%, driven primarily by an increase in the mix of payments revenue, which generally have lower gross margins than our contractual recurring revenue, the impairment of previously capitalized software development costs, and incremental costs associated with our continued shift toward selling cloud solutions, including data center costs and amortization of software development costs.
| | | | | | | | | | | | | | |
| One-time services and other | | | | |
| Revenue ($M) | | Cost of revenue ($M) | | Gross profit ($M)
and gross margin (%) |
| YoY Growth (%) | | YoY Growth (%) | | |
One-time services and other revenue is comprised of fees for one-time consulting, analytic and onsite training services, fees for retained and managed services contracts that we do not expect to have a term consistent with our cloud solution contracts, revenue from the sale of our software sold under perpetual license arrangements, fees from user conferences and third-party software referral fees.
Cost of one-time services and other is primarily comprised of compensation costs for professional services and onsite training personnel, other costs incurred in providing onsite customer training, third-party contractor expenses, data expense incurred to perform one-time analytic services, third-party software royalties, costs of user conferences, allocated depreciation, facilities and IT support costs and amortization of intangible assets from business combinations.
One-time services and other revenue decreased by $15.6 million, or 24.9%, driven primarily by the following:
| | | | | | | | | | | |
| - | | Decrease in one-time consulting revenue of $10.5 million due primarily to less implementation and customization services, in line with our multi-year strategic shift from a license-based and one-time services business model to a cloud subscription business model. Our cloud subscription offerings generally require less implementation and customization services. |
| - | | Decrease in one-time analytics revenue of $4.2 million as analytics are generally integrated in our cloud solutions |
| - | | Decrease in onsite training revenue of $0.7 million due to COVID-19 |
Cost of one-time services and other decreased $6.0 million or 10.3%, primarily driven by the following:
| | | | | | | | | | | |
| - | | Decrease in allocated costs of $2.0 million primarily related to a decrease in rent expense, as discussed below in General and Administrative |
| - | | Decrease in third-party contractor costs of $1.5 million, primarily due to a decrease in partners delivering services |
| - | | Decrease in compensation costs other than stock-based compensation of $1.1 million largely due to a decrease in headcount, as well as a shift in resources historically supporting one-time services and other towards recurring revenue |
| - | | Decreases in amortization intangible assets from business combinations and employee severance |
| | | |
One-time services and other gross margin decreased by 18.3%, primarily due to the significant reductions in one-time consulting and analytics revenue discussed.
One-time services and other revenue decreased by $6.3 million, or 9.2%, driven primarily by the following:
| | | | | | | | | | | |
| + | | Increase in the mix of retained and managed services contracts we present in one-time services and other. Revenue from retained and managed service contracts that we do not expect to have a term consistent with our cloud solution contracts is included in one-time services and other revenue beginning January 1, 2020. This change in presentation resulted in an increase to one-time services and other revenue and an offsetting decrease in recurring revenue of $16.7 million during the twelve months ended December 31, 2020. |
| - | | Decrease in one-time consulting revenue of $12.1 million primarily from less one-time sales related to changes in our compensation plans to place greater emphasis on subscription sales of our cloud solutions. Services increasingly being embedded in our renewable cloud solution contracts also contributed to the decrease in one-time services revenue. Our embedded services are recorded as recurring revenue. |
| - | | Decrease in one-time analytics revenue of $4.2 million as analytics are generally integrated in our cloud solutions |
| - | | Decrease in conference revenue of $3.6 million as our annual conference, bbcon, was held virtually and provided free of charge |
| - | | Decrease in onsite training revenue of $1.3 million due to COVID-19 |
Cost of one-time services and other decreased $2.1 million or 3.4%, primarily driven by the following:
| | | | | | | | | | | |
| + | | Increase in compensation costs of $3.4 million primarily related to an increase in stock-based compensation expense as we replaced our 2020 cash bonus plans and annual merit-based salary increases for our employees with grants of equity awards |
| - | | Decrease of $4.2 million in costs related to providing our annual user conference, bbcon, virtually |
| - | | Insignificant decrease in travel costs due to our restriction on non-essential employee travel in response to COVID-19 |
One-time services and other gross margin decreased by 5.6%, primarily as the reductions in one-time consulting and analytics revenue discussed above outpaced the decrease in related costs.
Operating Expenses
| | | | | | | | | | | | | | |
Sales, marketing and
customer success ($M) | | Research and
development ($M) | | General and
administrative ($M) |
| Percentages indicate expenses as a percentage of total revenue |
Sales, marketing and customer success
Sales, marketing and customer success expense includes compensation costs, variable sales commissions, travel-related expenses, advertising and marketing materials, public relations costs, variable reseller commissions and allocated depreciation, facilities and IT support costs.
We see a large market opportunity in the long-term and will continue to make investments to drive sales effectiveness. We have also implemented software tools to enhance our digital footprint and drive lead generation. In response to the COVID-19 pandemic, we implemented a modest and targeted headcount reduction during the second quarter of 2020, including a reduction in our sales headcount with a focus on retaining our most highly productive sales executives. The enhancements we are making in our go-to-market approach are expected to significantly reduce our average customer acquisition cost as well as the related payback period while increasing sales velocity. As a result, we do not expect our sales, marketing and customer success expense to return to pre-pandemic levels.
Sales, marketing and customer success expenses decreased by $23.4 million, or 11.2%. The decreases in dollars and as a percentage of total revenue were primarily driven by the following:
| | | | | | | | | | | |
| - | | Decrease in compensation costs other than stock-based compensation of $20.7 million primarily due to the targeted reduction in sales headcount during the second quarter of 2020, as discussed above |
| - | | Decrease in allocated costs of $7.0 million primarily related to a decrease in rent expense and the impact of the targeted reduction in sales headcount during the second quarter of 2020, as discussed above |
| - | | Decrease in travel costs of $1.9 million due to our restriction on non-essential employee travel in response to the COVID-19 pandemic, which went into effect during March 2020 |
| - | | Decrease in commissions expense of $1.9 million related to a decrease in overall commissionable bookings during 2020 due to the COVID-19 pandemic and a decrease in commissionable one-time services and other bookings during 2021 |
| + | | Increase in stock-based compensation costs of $4.8 million due to the factors discussed beginning on page 36 |
| + | | Increase in advertising costs of $3.5 million primarily due to incremental spending on advertising campaigns and investments in digital marketing |
Sales, marketing and customer success expenses decreased by $14.4 million, or 6.4%. The decreases in dollars and as a percentage of total revenue were primarily driven by the following:
| | | | | | | | | | | |
| - | | Decrease in compensation costs of $6.5 million primarily related to the decision to replace our 2020 cash bonus plans with grants of performance-based equity awards, which were recognized as stock-based compensation expense between May 1, 2020 and May 1, 2021. These awards were earned and became eligible for vesting on May 1, 2021 subject to meeting certain performance conditions and the recipient's continued employment with us |
| - | | Decrease in travel costs of $5.7 million due to our restriction on non-essential employee travel in response to COVID-19 |
| - | | Decrease in commissions costs of $1.4 million related to a decrease in commissionable sales |
Research and development
Research and development expense includes compensation costs for engineering and product management personnel, third-party contractor expenses, software development tools and other expenses related to developing new solutions or upgrading and enhancing existing solutions that do not qualify for capitalization, and allocated depreciation, facilities and IT support costs.
We continue to make investments to delight our customers with innovative cloud solutions. Research and development expense increased by $24.4 million, or 24.4%. The increases in dollars and as a percentage of total revenue were primarily driven by the following:
| | | | | | | | | | | |
| + | | Increase in compensation costs of $18.9 million primarily related to our increased engineering hiring and, to a lesser extent, stock-based compensation due to the factors discussed above on page 36 |
| + | | Increase in third-party contractor costs of $3.5 million as we continue to migrate our cloud infrastructure to leading public cloud service providers and make investments in security |
| + | | Decrease in software development costs of $2.1 million that were required to be capitalized under the internal-use software guidance |
Not included in research and development expense for 2021 and 2020 were $39.4 million and $41.5 million, respectively, of qualifying costs associated with development activities that are required to be capitalized under the internal-use software accounting guidance such as those for our cloud solutions, as well as development costs associated with acquired companies. Qualifying capitalized software development costs associated with our cloud solutions are subsequently amortized to cost of subscriptions revenue over the related asset's estimated useful life, which generally range from three to seven years. We expect that the amount of software development costs capitalized will be relatively consistent in the near-term as we continue making investments in innovation, quality, security and the integration of our solutions, which we believe will drive long-term revenue growth.
Research and development expenses decreased by $6.0 million, or 5.7%. The decreases in dollars and as a percentage of total revenue were primarily driven by the following:
| | | | | | | | | | | |
| - | | Decrease in compensation costs of $5.8 million primarily associated with the decision to replace our 2020 cash bonus plans with grants of performance-based equity awards, which were recognized as stock-based compensation expense between May 1, 2020 and May 1, 2021. These awards were earned and became eligible for vesting on May 1, 2021 subject to meeting certain performance conditions and the recipient's continued employment with us |
| - | | Decrease in third-party contractor costs of $1.5 million |
| - | | Decrease in travel costs of $1.2 million due to our restriction on non-essential employee travel in response to COVID-19 |
| + | | Partially offset by a decrease in software development costs of $4.5 million that were required to be capitalized under the internal-use software guidance |
Not included in research and development expense for 2020 and 2019 were $41.5 million and $46.0 million, respectively, of qualifying costs associated with development activities that are required to be capitalized under the internal-use software accounting guidance such as those for our cloud solutions, as well as development costs associated with acquired companies.
General and administrative
General and administrative expense consists primarily of compensation costs for general corporate functions, including senior management, finance, accounting, legal, human resources and corporate development, third-party professional fees, insurance, allocated depreciation, facilities and IT support costs, acquisition-related expenses and other administrative expenses.
During the third quarter of 2020, we adjusted our workforce strategy to provide more flexibility for our employees to work remotely. As a result, during the three months ended September 30, 2020, we reduced the estimated useful lives of our operating lease ROU assets for certain of our office locations we expected to exit, which resulted in an increase in operating lease costs during the third and fourth quarters of 2020. For these same office locations, we also reduced the estimated useful lives of certain facilities-related fixed assets, which resulted in an increase in depreciation expense. We incurred approximately $23.1 million of pre-tax costs related to these real estate activities during the third and fourth quarters of 2020.
In October 2021, we made the decision to permanently close our fixed office locations (with the exception of our global headquarters facility in Charleston, South Carolina), effective in December 2021. This change was intended to align our real estate footprint with our transition to a remote-first workforce. We enter into arrangements for smaller more flexible workspaces where necessary. As a result, during the three months ended December 31, 2021, we reduced the estimated useful lives of our operating lease ROU assets for certain of our office locations we expected to exit, which resulted in incremental operating lease costs during the fourth quarter of 2021. For these same office locations, we also reduced the estimated useful lives of certain facilities-related fixed assets, which resulted in incremental depreciation expense during the fourth quarter of 2021. During the three months ended December 31, 2021, we also recorded impairments of operating lease ROU assets and certain facilities-related fixed assets we have ceased using as a result of our adjusted workforce strategy. These impairment charges are reflected in general and administrative expense. We incurred approximately $12.5 million of pre-tax costs related to these real estate activities during the fourth quarter of 2021.
General and administrative expenses increased by $11.4 million, or 8.5%. The increases in dollars and as a percentage of total revenue were primarily driven by the following:
| | | | | | | | | | | |
| + | | Increase in stock-based compensation costs of $13.2 million due to the factors discussed above on page 36 |
| + | | Increase in compensation expense, excluding stock-based compensation costs, of $4.3 million due to base salary merit increases on July 2021, as well as an increase in headcount |
| + | | Increase in corporate costs of $3.9 million primarily related to increases in third-party consulting fees and insurance costs, partially offset by decreases in bad debt expense |
| + | | Increases in amortization expense of capitalized cloud computing implementation costs and third-party contractor costs of $1.0 million and $0.6 million, respectively |
| - | | Decrease in real estate activity costs of $7.7 million due to our workforce strategy changes made in the third quarter of 2020 |
| - | | Decrease in rent expense, net of allocated costs, of $2.4 million primarily related to the purchase of our global headquarters facility during the third quarter of 2020 and our exit of certain other office leases globally during the second half of 2020 in-line with changes to our workforce strategy at that time |
| - | | Decreases in depreciation expense and travel costs of $1.9 million and $0.9 million, respectively |
| | | |
| | | |
| | | |
| | | |
| | | |
General and administrative expenses increased by $21.4 million, or 18.9%. The increases in dollars and as a percentage of total revenue were primarily driven by the following:
| | | | | | | | | | | |
| + | | Increase in real estate activity costs of $23.1 million due to our workforce strategy changes in response to COVID-19, as discussed above |
| + | | Increase in corporate costs $5.9 million primarily related to an increase in bad debt expense |
| - | | Decrease in rent expense of $4.1 million primarily related to the purchase of our global headquarters facility, see Note 7 to our consolidated financial statements in this report |
| - | | Decrease in travel costs of $2.4 million due to our restriction on non-essential employee travel in response to COVID-19 |
| - | | Decrease in compensation costs of $1.8 million primarily related to the decision to replace our 2020 cash bonus plans with grants of performance-based equity awards, which were recognized as stock-based compensation expense between May 1, 2020 and May 1, 2021. These awards were earned and became eligible for vesting on May 1, 2021 subject to meeting certain performance conditions and the recipient's continued employment with us |
Restructuring
During 2017, in an effort to further our organizational objectives including, improved operating efficiency, customer outcomes and employee satisfaction, we initiated a multi-year plan to consolidate and relocate some of our existing offices to highly modern and more collaborative workspaces with short-term financial commitments. We substantially completed our facilities optimization restructuring plan as of December 2019. During the year ended December 31, 2019, we incurred $5.8 million, in before-tax restructuring charges related to these activities. Such charges during the years ended December 31, 2021 and 2020 were insignificant.
Restructuring costs incurred prior to our adoption of ASU 2016-02 Leases (Topic 842) ("ASU 2016-02") on January 1, 2019 consisted primarily of costs to terminate lease agreements, contractual lease payments, net of estimated sublease income, upon vacating space as part of the plan, as well as insignificant costs to relocate affected employees and write-off facilities-related fixed assets that we would no longer use.
Upon adoption of ASU 2016-02 at January 1, 2019, we reduced our operating lease ROU assets recognized at transition by the carrying amounts of the restructuring liabilities for certain leased office spaces that we ceased using prior to December 31, 2018. Restructuring costs incurred during the year ended December 31, 2019 consisted primarily of operating lease ROU asset impairment costs and, to a lesser extent, lease payments for offices we had ceased using and write-offs of facilities-related fixed assets that we would no longer use.
Interest Expense
| | | | | | | | |
| Interest expense ($M) | | |
| Percentages indicate expenses as a percentage of total revenue | | |
Interest expense increased during 2021 when compared to 2020, primarily due to the Real Estate Loans assumed for the purchase of our global headquarters facility in August 2020 and the deferred financing costs and debt discount associated with the 2020 Credit Facility, which was entered into in October 2020. We expect interest expense as well as interest expense as a percentage of total revenue to increase in 2022 as a result of our acquisition of EVERFI in December 2021.
Interest expense decreased in dollars and as a percentage of revenue during 2020, when compared to 2019, primarily due to a decrease in our average daily borrowings. Our acquisition of YourCause in January 2019 drove the increase in borrowings during 2019 and no business acquisitions were made in 2020.
Deferred Revenue
The table below compares the components of deferred revenue from our consolidated balance sheets:
| | | | | | | | | | | | | | |
| (dollars in millions) | Timing of recognition | December 31,
2021 | December 31,
2020 | Change |
| Recurring | Over the period billed in advance, generally one year | $ | 360.9 | | $ | 303.8 | | 18.8 | % |
| One-time services and other | As services are delivered | 17.9 | | 13.1 | | 36.6 | % |
Total deferred revenue(1) | | 378.7 | | 316.9 | | 19.5 | % |
| Less: Long-term portion | | 4.2 | | 4.7 | | (9.2) | % |
Current portion(1) | | $ | 374.5 | | $ | 312.2 | | 19.9 | % |
(1)The individual amounts for each year may not sum to total deferred revenue or current portion of deferred revenue due to rounding.
To the extent that our customers are billed for our solutions and services in advance of delivery, we record such amounts in deferred revenue. Our recurring revenue contracts are generally for a term of three years at contract inception with one to three-year renewals thereafter, billed annually in advance and non-cancelable. We generally invoice our customers with recurring revenue contracts in annual cycles 30 days prior to the end of the contract term.
Deferred revenue from recurring revenue contracts as well as one-time services and other increased during 2021, primarily due to the inclusion of EVERFI deferred revenue balances and, to a much lesser extent, early progress in initiatives to bring our pricing in line with the market.
We have acquired businesses whose net tangible assets include deferred revenue. Prior to our adoption of Accounting Standards Update ("ASU") 2021-08 Business Combinations (Topic 805) – Accounting for Contract Assets and Contract Liabilities from Contracts with Customers ("ASU 2021-08") effective October 1, 2021 (See Note 2 to our consolidated financial statements in this report), and in accordance with historical GAAP reporting requirements, we recorded write-downs of deferred revenue from customer arrangements predating the acquisition to fair value, which resulted in lower recorded deferred revenue as of the acquisition date than the actual amounts paid in advance for solutions and services under those customer arrangements. Therefore, our deferred revenue after the historical acquisitions did not reflect the full amount of deferred revenue that would have been reported if the acquired deferred revenue was not written down to fair value. Further explanation of this impact is included below under the caption "Non-GAAP financial measures".
Income Taxes
| | | | | | | | |
Income tax provision (benefit) ($M) | | |
| Percentages indicate effective income tax rates | | |
Our effective income tax rate may fluctuate quarterly and annually as a result of factors, including changes in tax law in jurisdictions where we conduct business, transactions entered into, changes in the geographic distribution of our earnings or losses, and our assessment of certain tax contingencies and valuation allowances.
We have deferred tax assets for federal, state, and international net operating loss carryforwards and tax credits. The federal and state net operating loss carryforwards are subject to various Internal Revenue Code limitations and applicable state tax laws. A portion of the foreign and state net operating loss carryforwards and a portion of state tax credits have a valuation reserve due to the uncertainty of realizing such carryforwards and credits in the future.
We file income tax returns in the U.S. for federal and various state jurisdictions as well as in foreign jurisdictions including Canada, the U.K., Australia, Ireland and Costa Rica. We are generally subject to U.S. federal income tax examination for calendar tax years ending 2018 through 2021, as well as state and foreign income tax examinations for various years depending on statute of limitations of those jurisdictions.
We have taken federal and state tax positions for which it is reasonably possible that the total amount of unrecognized tax benefits may decrease within the next twelve months. The possible decrease could result from the expiration of statutes of limitations. The reasonably possible decrease at December 31, 2021 was insignificant.
We recognize accrued interest and penalties, if any, related to unrecognized tax benefits as a component of income tax expense.
The decrease in our effective income tax rate in 2021 when compared to 2020, was primarily due to prior year increase in valuation allowance attributable to state tax credit carryforwards for which we do not expect to realize benefit. Furthermore, our 2021 effective income tax rate was positively impacted by increased benefit attributable to stock-based compensation deduction and a reduction to unrecognized tax benefit as a result of IRS audit settlement and statute of limitation lapses offset against negative impacts of the U.K.-enacted tax rate increase and increase in non-deductible compensation.
The total amount of unrecognized tax benefit that, if recognized, would favorably affect the effective income tax rate, was $3.2 million and $4.2 million at December 31, 2021 and December 31, 2020, respectively.
The increase in our effective tax rate in 2020 when compared to 2019, was primarily due to increase in valuation allowance attributable to state tax credit carryforwards for which we do not expect to realize benefit. Furthermore, our 2020 effective tax rate was negatively impacted by reduced benefit attributable to research tax credit and stock based compensation deduction. Lastly, higher 2020 earnings lessened impact of other non-deductible items.
Non-GAAP Financial Measures
The operating results analyzed below are presented on a non-GAAP basis. We use non-GAAP financial measures internally in analyzing our operational performance. Accordingly, we believe these non-GAAP measures are useful to investors, as a supplement to GAAP measures, in evaluating our ongoing operational performance. While we believe these non-GAAP measures provide useful supplemental information, non-GAAP financial measures should not be considered in isolation from, or as a substitute for, financial information prepared in accordance with GAAP. In addition, these non-GAAP financial measures may not be completely comparable to similarly titled measures of other companies due to potential differences in the exact method of calculation between companies.
We have acquired businesses whose net tangible assets include deferred revenue. Prior to our adoption of ASU 2021-08 effective October 1, 2021 (See Note 2 to our consolidated financial statements in this report) and in accordance with historical GAAP reporting requirements, we recorded write-downs of deferred revenue under arrangements predating the acquisition to fair value, which resulted in lower recognized revenue than the contributed purchase price until the related obligations to provide services under such arrangements are fulfilled. Therefore, our GAAP revenues after the historical acquisitions did not reflect the full amount of revenue that would have been reported if the acquired deferred revenue was not written down to fair value. The non-GAAP measures described below reverse the acquisition-related deferred revenue write-downs so that the full amount of revenue booked by the acquired companies is included, which we believe provides a more accurate representation of a revenue run-rate in a given period and, therefore, provides more meaningful comparative results.
The non-GAAP financial measures discussed below exclude the impact of certain transactions because we believe they are not directly related to our operating performance in any particular period, but are for our long-term benefit over multiple periods. We believe that these non-GAAP financial measures reflect our ongoing business in a manner that allows for meaningful period-to-period comparisons and analysis of trends in our business.
| | | | | | | | | | | | | | | | | |
| Years ended December 31, |
| (dollars in millions, except per share amounts) | 2021 | Change | 2020 | Change | 2019 |
| GAAP Revenue | $ | 927.7 | | 1.6 | % | $ | 913.2 | | 1.4 | % | $ | 900.4 | |
| Non-GAAP adjustments: | | | | | |
Add: Acquisition-related deferred revenue write-down(1) | — | | — | % | — | | (100.0) | % | 1.9 | |
Non-GAAP revenue(2) | $ | 927.7 | | 1.6 | % | $ | 913.2 | | 1.2 | % | $ | 902.4 | |
| | | | | |
| GAAP gross profit | $ | 484.5 | | (0.1) | % | $ | 485.2 | | 0.7 | % | $ | 482.0 | |
| GAAP gross margin | 52.2 | % | | 53.1 | % | | 53.5 | % |
| Non-GAAP adjustments: | | | | | |
Add: Acquisition-related deferred revenue write-down(1) | — | | — | % | — | | (100.0) | % | 1.9 | |
| Add: Stock-based compensation expense | 20.0 | | 49.2 | % | 13.4 | | 297.3 | % | 3.4 | |
| Add: Amortization of intangibles from business combinations | 34.8 | | (10.7) | % | 39.0 | | (13.0) | % | 44.8 | |
| Add: Employee severance | — | | (96.8) | % | 0.9 | | (25.7) | % | 1.2 | |
| | | | | |
Subtotal(2) | 54.8 | | 2.9 | % | 53.2 | | 3.8 | % | 51.3 | |
Non-GAAP gross profit(2) | $ | 539.3 | | 0.2 | % | $ | 538.4 | | 1.0 | % | $ | 533.3 | |
| Non-GAAP gross margin | 58.1 | % | | 59.0 | % | | 59.1 | % |
| | | | | |
| GAAP income from operations | $ | 24.9 | | (33.1) | % | $ | 37.2 | | 37.2 | % | $ | 27.1 | |
| GAAP operating margin | 2.7 | % | | 4.1 | % | | 3.0 | % |
| Non-GAAP adjustments: | | | | | |
Add: Acquisition-related deferred revenue write-down(1) | — | | — | % | — | | (100.0) | % | 1.9 | |
| Add: Stock-based compensation expense | 120.4 | | 38.0 | % | 87.3 | | 48.8 | % | 58.6 | |
| Add: Amortization of intangibles from business combinations | 37.0 | | (11.6) | % | 41.9 | | (16.4) | % | 50.1 | |
| Add: Employee severance | 1.5 | | (69.0) | % | 4.9 | | 10.2 | % | 4.4 | |
| Add: Acquisition-related integration costs | (0.1) | | (7.5) | % | (0.1) | | (105.6) | % | 2.4 | |
| Add: Acquisition-related expenses | 3.2 | | 800.3 | % | 0.4 | | (69.6) | % | 1.2 | |
| Add: Restructuring and other real estate activities | 12.1 | | (48.0) | % | 23.3 | | 301.0 | % | 5.8 | |
Add: Security Incident-related costs, net of insurance(3) | 1.8 | | 100.0 | % | — | | — | % | — | |
Subtotal(2) | 175.9 | | 11.7 | % | 157.5 | | 26.6 | % | 124.4 | |
Non-GAAP income from operations(2) | $ | 200.8 | | 3.1 | % | $ | 194.8 | | 28.5 | % | $ | 151.6 | |
| Non-GAAP operating margin | 21.6 | % | | 21.3 | % | | 16.8 | % |
| | | | | |
| GAAP income before provision for income taxes | $ | 7.1 | | (67.2) | % | $ | 21.6 | | 104.2 | % | $ | 10.6 | |
| GAAP net income | $ | 5.7 | | (26.2) | % | $ | 7.7 | | (35.2) | % | $ | 11.9 | |
| Shares used in computing GAAP diluted earnings per share | 48,230,438 | | (1.0) | % | 48,696,341 | | 0.8 | % | 48,312,271 | |
| GAAP diluted earnings per share | $ | 0.12 | | (25.0) | % | $ | 0.16 | | (36.0) | % | $ | 0.25 | |
| Non-GAAP adjustments: | | | | | |
| Add: GAAP income tax provision (benefit) | 1.4 | | (90.0) | % | 13.9 | | (1,150.4) | % | (1.3) | |
| Add: Total Non-GAAP adjustments affecting loss from operations | 175.9 | | 11.7 | % | 157.5 | | 26.6 | % | 124.4 | |
| | | | | |
| | | | | |
| Non-GAAP income before provision for income taxes | 183.0 | | 2.1 | % | 179.1 | | 32.7 | % | 135.0 | |
Assumed non-GAAP income tax provision(4) | 36.6 | | 2.1 | % | 35.8 | | 32.7 | % | 27.0 | |
Non-GAAP net income(2) | $ | 146.4 | | 2.1 | % | $ | 143.3 | | 32.7 | % | $ | 108.0 | |
| | | | | |
| Shares used in computing Non-GAAP diluted earnings per share | 48,230,438 | | (1.0) | % | 48,696,341 | | 0.8 | % | 48,312,271 | |
| Non-GAAP diluted earnings per share | $ | 3.04 | | 3.4 | % | $ | 2.94 | | 31.3 | % | $ | 2.24 | |
(1)We early adopted ASU 2021-08, Business Combinations (Topic 805) – Accounting for Contract Assets and Contract Liabilities from Contracts with Customers in the fourth quarter of 2021. See Note 2 for additional details.
(2)The individual amounts for each year may not sum to non-GAAP revenue, subtotal, non-GAAP gross profit, non-GAAP income from operations, non-GAAP income before provision for income taxes or non-GAAP net income due to rounding.
(3)Includes Security Incident-related costs incurred during the twelve months ended December 31, 2021 of $40.6 million net of probable insurance recoveries during the same period of $38.7 million. Recorded expenses consisted primarily of payments to third-party service providers and consultants, including legal fees, as well as settlements of customer claims. Not included in this adjustment were costs associated with enhancements to our cybersecurity program.
(4)We apply a non-GAAP effective tax rate of 20.0% when calculating non-GAAP net income and non-GAAP diluted earnings per share.
Non-GAAP organic revenue growth
In addition, we use non-GAAP organic revenue growth, non-GAAP organic revenue growth on a constant currency basis and non-GAAP organic recurring revenue growth, in analyzing our operating performance. We believe that these non-GAAP measures are useful to investors, as a supplement to GAAP measures, for evaluating the periodic growth of our business on a consistent basis. Each of these measures of non-GAAP organic revenue growth excludes incremental acquisition-related revenue attributable to companies acquired in the current fiscal year. For companies, if any, acquired in the immediately preceding fiscal year, each of these non-GAAP organic revenue growth measures reflects presentation of full year incremental non-GAAP revenue derived from such companies as if they were combined throughout the prior period. In addition, each of these non-GAAP organic revenue growth measures excludes prior period revenue associated with divested businesses. The exclusion of the prior period revenue is to present the results of the divested businesses within the results of the combined company for the same period of time in both the prior and current periods. We believe this presentation provides a more comparable representation of its current business’ organic revenue growth and revenue run-rate.
As a result of our adoption of ASU 2021-08 effective October 1, 2021 (See Note 2 to our consolidated financial statements in this report), our calculations of non-GAAP organic revenue growth, non-GAAP organic revenue growth on a constant currency basis and non-GAAP organic recurring revenue growth, will no longer include the non-GAAP revenue attributable to acquired companies, as if there were no acquisition-related write-downs of acquired deferred revenue to fair value as required by historical GAAP.
| | | | | | | | |
| Years ended December 31, |
| (dollars in millions) | 2021 | 2020 |
| GAAP revenue | $ | 927.7 | | $ | 913.2 | |
| GAAP revenue growth | 1.6 | % | |
(Less) Add: Non-GAAP acquisition-related revenue(1) | — | | — | |
Non-GAAP organic revenue(2) | $ | 927.7 | | $ | 913.2 | |
| Non-GAAP organic revenue growth | 1.6 | % | |
| | |
Non-GAAP organic revenue(2) | 927.7 | | 913.2 | |
Foreign currency impact on Non-GAAP organic revenue(3) | (9.2) | | — | |
Non-GAAP organic revenue on constant currency basis(3) | $ | 918.6 | | $ | 913.2 | |
| Non-GAAP organic revenue growth on constant currency basis | 0.6 | % | |
| | |
| GAAP recurring revenue | $ | 880.9 | | $ | 850.7 | |
| GAAP recurring revenue growth | 3.5 | % | |
(Less) Add: Non-GAAP acquisition-related revenue(1) | — | | — | |
| Non-GAAP organic recurring revenue | $ | 880.9 | | $ | 850.7 | |
| Non-GAAP organic recurring revenue growth | 3.5 | % | |
(1)Non-GAAP acquisition-related revenue excludes incremental acquisition-related revenue calculated in accordance with GAAP that is attributable to companies acquired in the current fiscal year. For companies acquired in the immediately preceding fiscal year, non-GAAP acquisition-related revenue reflects presentation of full-year incremental non-GAAP revenue derived from such companies, as if they were combined throughout the prior period.
(2)Non-GAAP organic revenue for the prior year periods presented herein will not agree to non-GAAP organic revenue presented in the respective prior period quarterly financial information solely due to the manner in which non-GAAP organic revenue growth is calculated.
(3)To determine non-GAAP organic revenue growth on a constant currency basis, revenues from entities reporting in foreign currencies were translated to U.S. Dollars using the comparable prior period's quarterly weighted average foreign currency exchange rates. The primary foreign currencies creating the impact are the Australian Dollar, British Pound, Canadian Dollar and EURO.
Rule of 40
Rule of 40 is defined as non-GAAP organic revenue growth plus non-GAAP adjusted EBITDA margin. Non-GAAP adjusted EBITDA is defined as GAAP net income plus interest, net; income tax provision (benefit); depreciation; amortization of intangible assets from business combinations; amortization of software development costs; stock-based compensation; acquisition-related integration costs; acquisition-related expenses; employee severance; restructuring and other real estate activities; and Security Incident-related costs.
| | | | | | | | | |
| Years ended December 31, | |
| (dollars in millions) | 2021 | 2020 | |
| GAAP net income | $ | 5.7 | | $ | 7.7 | | |
| Non-GAAP adjustments: | | | |
| Add: Interest, net | 17.6 | | 15.6 | | |
| Add: GAAP income tax (benefit) provision | 1.4 | | 13.9 | | |
Add: Depreciation(1) | 12.7 | | 14.6 | | |
| Add: Amortization of intangibles from business combinations | 37.0 | | 41.9 | | |
Add: Amortization of software development costs(2) | 32.8 | | 32.5 | | |
Subtotal(3) | 101.5 | | 118.5 | | |
Non-GAAP EBITDA(3) | $ | 107.2 | | $ | 126.3 | | |
| Non-GAAP EBITDA margin | 11.6 | % | | |
| | | |
| Non-GAAP adjustments: | | | |
| | | |
| Add: Stock-based compensation expense | 120.4 | | 87.3 | | |
| Add: Employee severance | 1.5 | | 4.9 | | |
| Add: Acquisition-related integration costs | (0.1) | | (0.1) | | |
| Add: Acquisition-related expenses | 3.2 | | 0.4 | | |
| Add: Restructuring and other real estate activities | 12.1 | | 23.3 | | |
Add: Security Incident-related costs, net of insurance(4) | 1.8 | | — | | |
Subtotal(3) | 138.9 | | 115.6 | | |
Adjusted Non-GAAP EBITDA(3) | $ | 246.1 | | $ | 241.9 | | |
| Adjusted Non-GAAP EBITDA margin | 26.5 | % | | |
| | | |
Rule of 40(5) | 28.1 | % | | |
| | | |
| Non-GAAP adjusted EBITDA | 246.1 | | 241.9 | | |
Foreign currency impact on Non-GAAP adjusted EBITDA(6) | (3.6) | | 0.7 | | |
Non-GAAP adjusted EBITDA on constant currency basis(6) | 242.5 | | 242.6 | | |
| Non-GAAP adjusted EBITDA margin on constant currency basis | 26.4 | % | | |
| | | |
Rule of 40 on constant currency basis(7) | 27.0 | % | | |
(1)During the third quarter of 2020 and the fourth quarter of 2021, we reduced the estimated useful lives of our operating lease right-of-use assets for certain of our office locations we expected to exit. For these same office locations, we also reduced the estimated useful lives of certain facilities-related fixed assets, which resulted in increases in depreciation expense. The accelerated portions of the fixed asset depreciation expense related to these activities of $1.7 million and $3.2 million for the three months ended December 31, 2021 and 2020, respectively, and $1.7 million and $4.6 million for the twelve months ended December 31, 2021 and 2020, respectively, was presented in the "Restructuring and other real estate activities" line of the reconciliation of GAAP to non-GAAP financial measures. Total depreciation expense was $4.9 million and $6.9 million, for the three months ended December 31, 2021 and 2020, respectively, and $14.4 million and $19.2 million for the twelve months ended December 31, 2021 and 2020, respectively.
(2)Includes amortization expense related to software development costs and amortization expense from capitalized cloud computing implementation costs.
(3)The individual amounts for each year may not sum to subtotal, non-GAAP EBITDA or adjusted non-GAAP EBITDA due to rounding.
(4)Includes Security Incident-related costs incurred, net of probable insurance recoveries. See additional details in the reconciliation of GAAP to Non-GAAP operating income above.
(5)Measured by non-GAAP organic revenue growth plus non-GAAP adjusted EBITDA margin. See Non-GAAP organic revenue growth table above.
(6)To determine non-GAAP adjusted EBITDA on a constant currency basis, non-GAAP adjusted EBITDA from entities reporting in foreign currencies were translated to U.S. Dollars using the comparable prior period's quarterly weighted average foreign currency exchange rates. The primary foreign currencies creating the impact are the Australian Dollar, British Pound, Canadian Dollar and EURO.
(7)Measured by non-GAAP organic revenue growth on constant currency basis plus non-GAAP adjusted EBITDA margin on constant currency basis.
Non-GAAP free cash flow
Non-GAAP free cash flow is defined as operating cash flow less capital expenditures, including costs required to be capitalized for software development, and capital expenditures for property and equipment.
| | | | | | | | | | | | | | | | | |
| Years ended December 31, |
| (dollars in millions) | 2021 | Change | 2020 | Change | 2019 |
| GAAP net cash provided by operating activities | $ | 213.7 | | 44.4 | % | $ | 148.0 | | (18.9) | % | $ | 182.5 | |
| Less: purchase of property and equipment | (11.7) | | (60.7) | % | (29.7) | | 158.4 | % | (11.5) | |
| Less: capitalized software development costs | (40.5) | | (4.0) | % | (42.2) | | (10.1) | % | (46.9) | |
| Non-GAAP free cash flow | $ | 161.5 | | 112.2 | % | $ | 76.1 | | (38.7) | % | $ | 124.1 | |
During 2022, in order to provide a meaningful basis for comparison, we will also use non-GAAP adjusted free cash flow in analyzing our operating performance. Non-GAAP adjusted free cash flow is defined as operating cash flow less capital expenditures, including costs required to be capitalized for software development, capital expenditures for property and equipment, and less cash outflows, net of insurance, related to the Security Incident. We believe non-GAAP free cash flow and non-GAAP adjusted free cash flow will provide useful measures of the company's operating performance. Non-GAAP adjusted free cash flow is not intended to represent and should not be viewed as the amount of residual cash flow available for discretionary expenditures.
Seasonality
Our revenues normally fluctuate as a result of certain seasonal variations in our business. Our first quarter has historically been the seasonal low for bookings, with the second and fourth quarters historically being seasonally higher, and our bookings tend to be back-end loaded within individual quarters given our quarterly quota plans. Transactional revenue is non-contractual and less predictable given the susceptibility to certain drivers such as timing and number of events and marketing campaigns, as well as fluctuations in donation volumes and tuition payments. Our transactional revenue has historically been at its lowest in the first quarter due to the timing of customer fundraising initiatives and events. We have historically experienced seasonal highs during the fourth quarter due to year-end giving campaigns and during the second quarter when a large number of events are held. Our revenue from professional services has historically been lower in the first quarter when many of those services commence and in the fourth quarter due to the holiday season. As a result of these and other factors, our total revenue has historically been lower in the first quarter than in the remainder of our fiscal year, with the fourth quarter historically achieving the highest total revenue. Our expenses, other than transaction-based costs related to our payment services, do not vary significantly as a result of these factors, but do fluctuate on a quarterly basis due to varying timing of expenditures.
Our cash flow from operations normally fluctuates quarterly due to the combination of the timing of customer contract renewals including renewals associated with customers of acquired companies, delivery of professional services and occurrence of customer events, as well as merit-based salary increases, among other factors. Historically, due to lower revenues in our first quarter, combined with the payment of certain annual vendor contracts, our cash flow from operations has been lowest in our first quarter. Due to the timing of customer contract renewals and student enrollments, many of which take place at or near the beginning of our third quarter, our cash flow from operations has been lower in our second quarter as compared to our third and fourth quarters. Partially offsetting these favorable drivers of cash flow from operations in our third and fourth quarters are base salary merit increases, which were replaced in 2020 with performance-based equity awards due to COVID-19, but returned in July 2021. In addition, deferred revenues can vary on a seasonal basis for the same reasons. Our cash flow from financing is negatively impacted in our first quarter when most of our equity awards vest, as we pay taxes on behalf of our employees related to the settlement or exercise of equity awards. During the second quarter of 2021, however, we experienced an increase in the amount of taxes we paid on behalf of our employees related to the settlement of equity awards when compared to the same period in 2020, as the equity granted in May 2020 in lieu of cash bonus plans and base salary merit increases vested. These patterns may change as a result of the continued shift to online giving, growth in volume of transactions for which we process payments, or as a result of acquisitions, new market opportunities, new solution introductions, the COVID-19 pandemic or other factors.
| | |
| Liquidity and Capital Resources |
The following table presents selected financial information about our financial position:
| | | | | | | | | | | |
| (dollars in millions) | December 31,
2021 | December 31,
2020 | Change |
| Cash and cash equivalents | $ | 55.1 | | $ | 35.8 | | 54.3 | % |
| Property and equipment, net | 111.4 | | 105.2 | | 5.9 | % |
| Software development costs, net | 121.4 | | 111.8 | | 8.5 | % |
| Total carrying value of debt | 956.2 | | 531.0 | | 80.1 | % |
| Working capital | (258.7) | | (194.3) | | (33.1) | % |
The following table presents selected financial information about our cash flows:
| | | | | | | | | | | | | | | | | |
| Years ended December 31, |
| (dollars in millions) | 2021 | | Change | 2020 | | Change | 2019 | |
| Net cash provided by operating activities | $ | 213.7 | | 44.4 | % | $ | 148.0 | | (18.9) | % | $ | 182.5 | |
| Net cash used in investing activities | (471.3) | | 555.9 | % | (71.8) | | 57.0 | % | (167.2) | |
| Net cash provided by (used in) financing activities | 264.1 | | (2,573.2) | % | (10.7) | | (109.6) | % | 111.2 | |
Our principal sources of liquidity are operating cash flow, funds available under the 2020 Credit Facility and cash on hand. Our operating cash flow depends on continued customer renewal of our subscription and maintenance arrangements and market acceptance of our solutions and services. Based on current estimates of revenue and expenses, we believe that the currently available sources of funds and anticipated cash flows from operations will be adequate for at least the next twelve months to finance our operations, fund anticipated capital expenditures and meet our debt obligations. We also believe that we will be able to continue to meet our long-term cash requirements due to our anticipated cash flow from operations, solid financial position and ability to access capital from financial markets. To the extent we undertake future material acquisitions, investments or unanticipated capital or operating expenditures, including in connection with the Security Incident, we may require additional capital. In that context, we regularly evaluate opportunities to enhance our capital structure including through potential debt or equity issuances.
As a well-known seasoned issuer, we filed an automatic shelf registration statement for an undetermined amount of debt and equity securities with the SEC on January 14, 2022. Under this universal shelf registration statement we may offer and sell, from time to time, debt securities, common stock, preferred stock, depositary shares, warrants, stock purchase contracts and stock purchase units. Subject to certain conditions, this registration statement will be effective through January 13, 2024.
At December 31, 2021, our total cash and cash equivalents balance included approximately $15.4 million of cash that was held outside the U.S. While these funds may not be needed to fund our U.S. operations for at least the next twelve months, if we need these funds, we may be required to accrue and pay taxes to repatriate a portion of the funds. We currently do not intend or anticipate a need to repatriate our cash held outside the U.S.
Operating Cash Flow
Throughout 2021, 2020 and 2019, our cash flows from operations were derived principally from: (i) our earnings from on-going operations prior to non-cash expenses such as depreciation, amortization, stock-based compensation, deferred income taxes, amortization of deferred financing costs and debt discount and adjustments to our provision for credit losses and sales returns; and (ii) changes in our working capital.
Working capital changes are comprised of changes in accounts receivable, prepaid expenses and other assets, trade accounts payable, accrued expenses and other liabilities and deferred revenue.
Net cash provided by operating activities increased by $65.7 million during the year ended December 31, 2021, when compared to the same period in 2020, primarily due a $49.7 million increase in cash flow from operations associated with working capital, and a $16.1 million increase in net income adjusted for non-cash expenses.
The increase in cash flow from operations associated with working capital during 2021, when compared to 2020, was primarily due to:
•the payment of our 2019 cash bonus plans in 2020 and the replacement of our 2020 cash bonus plans with performance-based equity awards (which we expect will continue going forward);
•an increase in the collection of our accounts receivable balances, including early progress in initiatives to bring our pricing in line with the market; and
•fluctuations in the timing of vendor payments; partially offset by
•an increase in income tax payments.
Net cash provided by operating activities decreased by $34.5 million during the year ended December 31, 2020, when compared to the same period in 2019, primarily due a $81.0 million decrease in cash flow from operations associated with working capital, partially offset by a $46.5 million increase in net income adjusted for non-cash expenses.
The decrease in cash flow from operations associated with working capital during 2020, when compared to 2019, was primarily due to:
•an increase in current period bonus payments as a result of an increase in amounts accrued as of December 31, 2019 for over-performance against 2019 targets;
•a decrease in current period bonus accrual due to our decision to replace cash payments for our 2020 bonus plans with performance-based equity awards;
•a decrease in customer billings and payment collections due to the declines in our 2020 bookings performance compared to 2019 as a result of the COVID-19 pandemic;
•an increase in the aging of customer receivable balances, primarily due to COVID-19;
•an increase in one-time cash payments associated with the exit of a number of our leases; and
•fluctuations in the timing of vendor payments.
Security Incident update
As discussed in Note 11 to our consolidated financial statements included in this report, total costs related to the Security Incident have exceeded the limit of our insurance coverage during the first quarter of 2022. Accordingly, we expect that the Security Incident will negatively impact our GAAP profitability and GAAP cash flow for the foreseeable future (see discussion regarding non-GAAP adjusted free cash flow on page 51). For full year 2022, we currently expect net cash outlays of approximately $25 million to $35 million for ongoing legal fees related to the Security Incident. In line with our policy, legal fees, are expensed as incurred. We have not recorded a liability for a loss contingency related to the Security Incident as of December 31, 2021 because we are unable at this time to reasonably estimate the possible loss or range of loss.
Investing Cash Flow
During 2022, we expect our total capital expenditures, including estimated outlays for capitalized software development costs, to be between approximately $60.0 million and $70.0 million.
Net cash used in investing activities of $471.3 million increased by $399.4 million during 2021, when compared to 2020.
We spent $419.1 million for our acquisition of EVERFI in 2021 and we did not make any similar investments during 2020. We used $40.5 million for software development costs, which was relatively consistent with cash spent during 2020. We continue to invest in our innovative cloud solutions, as well as development activities for Blackbaud SKY, our modern cloud platform.
We also spent $11.7 million of cash for purchases of property and equipment during 2021, which was down $18.0 million from cash spent in 2020. The decrease in cash expended was primarily due to our purchase of our global headquarters facility in 2020.
Net cash used in investing activities of $71.8 million decreased by $95.4 million during 2020, when compared to 2019.
We spent $109.4 million for our acquisition of YourCause in 2019 and we did not make any similar investments during 2020. We used $42.2 million for software development costs, which was down $4.7 million from cash spent during 2019. We continue to invest in our innovative cloud solutions, as well as development activities for Blackbaud SKY, our modern cloud platform.
We also spent $29.7 million of cash for purchases of property and equipment during 2020, which was up $18.2 million from cash spent in 2019. The additional cash expended was primarily used to purchase our global headquarters facility.
Financing Cash Flow
During 2021, we had a net increase in borrowings of $429.2 million attributable to our acquisition of EVERFI, compared to a net increase in borrowings of $0.9 million in 2020. During 2021, we spent $108.4 million on repurchases of our common stock compared to $41.0 million during 2020 (see additional details below regarding our stock repurchase program which began in the fourth quarter of 2020). During 2020, we paid dividends of $6.0 million and we did not pay dividends during 2021, as we discontinued the declaration and payment of all cash dividends beginning with the second quarter of 2020.
We paid $39.4 million to satisfy tax obligations of employees upon settlement or exercise of equity awards during 2021 compared to $21.4 million during 2020. The increase was primarily attributable to our decision to replace our annual cash bonus plans with a short-term performance-based equity award plan. The amount of taxes paid by us on behalf of employees related to the settlement or exercise of equity awards varies from period to period based upon the timing of grants and vesting, as well as the market price for shares of our common stock at the time of settlement. Most of our equity awards currently vest in our first quarter.
During 2021, cash flow from financing activities associated with changes in restricted cash due to customers decreased $13.5 million, compared to an increase of $61.2 million during 2020. This line in the statement of cash flows represents the change in the amount of restricted cash held and payable by us to customers from one period to the next.
During 2020, we had a net increase in borrowings of $0.9 million, compared to a net increase in borrowings of $79.5 million in 2019, which was primarily attributable to our acquisition of YourCause. During 2020, we spent $41.0 million on repurchases of our common stock (see additional details below regarding our stock repurchase program). In addition, during 2020, we paid dividends of $6.0 million, which was down compared to 2019, as we discontinued the declaration and payment of all cash dividends beginning with the second quarter of 2020.
We paid $21.4 million to satisfy tax obligations of employees upon settlement or exercise of equity awards during 2020 compared to $23.8 million during 2019.
Cash flow from financing activities associated with changes in restricted cash due to customers decreased $16.6 million during 2020, when compared to 2019, as the amount of restricted cash held and payable by us to customers as of December 31, 2019 was significantly larger than at the same date in 2018 primarily due to the timing of year-end donations. Additionally, effective August 3, 2020, a significant amount of restricted cash related to charitable giving transacted through our social responsibility and grantmaking solutions is now held and disbursed by the Blackbaud Giving Fund, an independent nonprofit organization, strategic partner of ours, and sponsoring organization for a donor advised fund. This change was made primarily to better support our YourCause CSR Connect and YourCause Grants Connect solutions.
Stock repurchase program
Under our stock repurchase program, we are authorized to repurchase shares from time to time in accordance with applicable laws both on the open market, including under trading plans established pursuant to Rule 10b5-1 under the Securities Exchange Act of 1934, as amended, and in privately negotiated transactions. The timing and amount of repurchases depends on several factors, including market and business conditions, the trading price of our common stock and the nature of other investment opportunities. The repurchase program does not have an expiration date and may be limited, suspended or discontinued at any time without prior notice.
During the year ended December 31, 2021, we purchased 1,592,933 shares for $108.4 million. In December 2021, our Board of Directors reauthorized and replenished our stock repurchase program that authorizes us to purchase up to $250.0 million of our outstanding shares of common stock. The remaining amount available to purchase stock under the stock repurchase program was $250.0 million as of December 31, 2021.
2020 Credit Facility
In October 2020, we entered into a 5-year $900.0 million Amended and Restated Credit Agreement (the “2020 Credit Facility”). Upon closing, we drew $400.0 million on a term loan and used the proceeds to repay the outstanding principal balance of the term loan under our previous credit facility, and repay $124.4 million of outstanding revolving credit loans under the previous credit facility.
Historically, we have drawn on our credit facility from time to time to help us meet financial needs primarily due to the seasonality of our cash flows from operations and financing for business acquisitions. At December 31, 2021, our available borrowing capacity under the 2020 Credit Facility was $239.5 million. The 2020 Credit Facility matures in October 2025.
On December 31, 2021, we borrowed a total of $435 million under the 2020 Credit Facility, including $250.0 million under the 2021 Incremental Term Loan (as defined in Note 9 to our consolidated financial statements in this report) and $185 million of revolving credit loans, to fund a portion of the consideration and expenses related to our acquisition of EVERFI.
At December 31, 2021, the carrying amount of our debt under the 2020 Credit Facility was $895.6 million. Our average daily borrowings were $482.4 million during 2021.
The term loans under the 2020 Credit Facility and our other debt require periodic principal payments. The balance of the term loans and any amounts drawn on the revolving credit loans are due upon maturity of the 2020 Credit Facility in October 2025. The Real Estate Loans also require periodic principal payments and the balances of the real estate loans are due upon maturity in April 2038.
Following is a summary of the financial covenants under the 2020 Credit Facility:
| | | | | | | | |
| Financial Covenant | Requirement | Ratio as of December 31, 2021 |
Net Leverage Ratio(1) | ≤ 4.25 to 1.00 | 3.31 to 1.00 |
| Interest Coverage Ratio | ≥ 2.50 to 1.00 | 17.45 to 1.00 |
(1)Under the terms of the 2020 Credit Facility, the Net Leverage Ratio requirement may be increased by up to 0.50 provided we satisfy certain requirements, including a permitted business acquisition, and provided that the maximum Net Leverage Ratio shall not exceed 4.25 to 1.00.
Under the 2020 Credit Facility, we also have restrictions on our ability to declare and pay dividends and our ability to repurchase shares of our common stock. In order to pay any cash dividends and/or repurchase shares of stock: (i) no default or event of default shall have occurred and be continuing under the 2020 Credit Facility, and (ii) our pro forma net leverage ratio, as set forth in the 2020 Credit Facility, must be 0.25 less than the net leverage ratio requirement at the time of dividend declaration or share repurchase. At December 31, 2021, we were in compliance with our debt covenants under the 2020 Credit Facility.
First amendment to 2020 Credit Facility
On January 31, 2022, we entered into the First Amendment to Credit Agreement which amends the 2020 Credit Facility to, among other things, (i) modify the definition of “Applicable Margin”, (ii) modify the net leverage ratio financial covenant to require a net leverage ratio of (A) 4.00:1.00 or less for the fiscal quarter ended December 31, 2021 and for fiscal quarters ending thereafter through December 31, 2023 and (B) 3.75:1.00 or less for the fiscal quarters ending March 31, 2024 and thereafter, (iii) reset the $250.0 million fixed dollar basket with respect to the accordion feature, and (iv) modify certain negative covenants to provide additional operational flexibility. See Note 19 to our consolidated financial statements in this report for additional details.
Commitments and Contingencies
| | | | | | | | | | | |
| Payments due by period |
| (in millions) | Less than
1 year | More than
1 year | Total(1) |
| Recorded contractual obligations: | | | |
| Debt | $ | 18.7 | | $ | 942.5 | | $ | 961.2 | |
| Operating leases | 11.7 | | 64.1 | | 75.8 | |
| Unrecorded contractual obligations: | | | |
| Purchase obligations | 21.9 | | 11.6 | | 33.6 | |
| Interest payments on debt | 21.1 | | 81.6 | | 102.7 | |
Total contractual obligations(1) | $ | 73.5 | | $ | 1,099.8 | | $ | 1,173.3 | |
(1)The individual amounts may not sum to the total due to rounding.
Debt
As of December 31, 2021, we had total remaining principal payments of $961.2 million. These payments represent principal payments only, under the following assumptions: (i) that the amounts outstanding under the 2020 Credit Facility, our real estate loans and our other debt at December 31, 2021 will remain outstanding until maturity, with minimum payments occurring as currently scheduled, and (ii) that there are no assumed future borrowings on the 2020 Revolving Facility for the purposes of determining minimum commitment amounts. See Note 9 to our consolidated financial statements in this report for more information.
Interest payments on debt
In addition to principal payments, as of December 31, 2021, we expect to pay interest expense over the life of our debt obligations of approximately $102.7 million. The actual interest expense recognized in our consolidated statements of comprehensive income will depend on the amount of debt, the length of time the debt is outstanding and the interest rate, which could be different from our assumptions on our remaining principal payments described above.
Operating leases
As of December 31, 2021, we had remaining operating lease payments of $75.8 million. These payments have not been reduced by sublease income, incentive payments, reimbursement of leasehold improvements or the amount representing imputed interest of $13.3 million. Our operating leases are generally for corporate offices, subleased offices and certain equipment and furniture. Given our remote-first workforce strategy and real estate footprint optimization efforts, as discussed above, we do not anticipate entering any new, material operating leases for offices for the foreseeable future. See Note 11 to our consolidated financial statements in this report for more information.
Purchase obligations
As of December 31, 2021, we had remaining purchase obligations of $33.6 million. These purchase obligations are for third-party technology used in our solutions and for other services we purchase as part of our normal operations. In certain cases, these arrangements require a minimum annual purchase commitment by us. Our purchase obligations are not recorded as liabilities on our consolidated balance sheets as of December 31, 2021, as we had not received the related services. See Note 11 to our consolidated financial statements in this report for more information.
The total liability for uncertain tax positions as of December 31, 2021 and December 31, 2020, was $3.7 million and $4.6 million, respectively. Our accrued interest and penalties related to tax positions taken on our tax returns was insignificant and $1.1 million as of December 31, 2021 and 2020, respectively.
| | |
| Foreign Currency Exchange Rates |
Approximately 16% of our total revenue for 2021 was generated by operations outside the U.S. We do not have significant operations in countries in which the economy is considered to be highly inflationary. Our consolidated financial statements are denominated in U.S. dollars and, accordingly, changes in the exchange rate between foreign currencies and the U.S. dollar will affect the translation of our subsidiaries’ financial results into U.S. dollars for purposes of reporting our consolidated financial results. The accumulated currency translation adjustment, recorded within other comprehensive income (loss) as a component of stockholders’ equity, was income of $1.3 million as of December 31, 2021 and income of $0.6 million as of December 31, 2020.
The vast majority of our contracts are entered into by our U.S. or U.K. entities. The contracts entered into by the U.S. entity are almost always denominated in U.S. dollars or Canadian dollars, and contracts entered into by our U.K., Australian and Irish subsidiaries are generally denominated in British Pounds, Australian dollars and Euros, respectively. Historically, as the U.S. dollar weakened, foreign currency translation resulted in an increase in our revenues and expenses denominated in non-U.S. currencies. Conversely, as the U.S. dollar strengthened, foreign currency translation resulted in a decrease in our revenues and expenses denominated in non-U.S. currencies. During 2021, foreign translation resulted in increases in our revenues and expenses denominated in non-U.S. currencies. Though we have exposure to fluctuations in currency exchange rates, the impact has generally not been material to our consolidated results of operations or financial position. During 2021, the fluctuation in foreign currency exchange rates increased our total revenue and our income from operations by $9.2 million and $3.1 million, respectively. We will continue monitoring such exposure and take action as appropriate. To determine the impacts on revenue (or income from operations) from fluctuations in currency exchange rates, current period revenues (or income from operations) from entities reporting in foreign currencies were translated into U.S. dollars using the comparable prior year period's weighted average foreign currency exchange rates. These impacts are non-GAAP financial information and are not in accordance with, or an alternative to, information prepared in accordance with GAAP.
We do not believe that inflation has had a material effect on our business, financial condition or results of operations. If our costs were to become subject to significant inflationary pressures, we may not be able to fully offset such higher costs through price increases. Our inability or failure to do so could harm our business, financial condition and results of operations. In addition, if inflationary pressures impact the rate of giving to our customers, there could be adverse impacts to our business, financial condition and results of operations.
| | |
| Critical Accounting Estimates |
Our discussion and analysis of financial condition and results of operations are based upon our consolidated financial statements, which have been prepared in accordance with accounting principles generally accepted in the United States ("GAAP"). The preparation of these financial statements requires us to make estimates and assumptions that affect the reported amounts of assets and liabilities and disclosure of contingent assets and liabilities at the date of the financial statements, as well as the reported amounts of revenues and expenses during the reporting periods. On an ongoing basis, we reconsider and evaluate our estimates and assumptions.
We base our estimates on historical experience, current trends and various other assumptions that we believe to be reasonable under the circumstances, the results of which form the basis for making judgments about the carrying values of assets and liabilities that are not readily apparent from other sources. Actual results could materially differ from any of our estimates under different assumptions or conditions. Our significant accounting policies are discussed in Note 2 to our consolidated financial statements in this report. We believe the accounting estimates listed below are the most critical to aid in fully understanding and evaluating our reported financial results, and they require our most difficult, subjective or complex judgments, resulting from the need to make estimates about the effect of matters that are inherently uncertain.
| | | | | | | | |
| Revenue Recognition | | |
| Description | Judgments and Uncertainties | Effect if Actual Results Differ
From Assumptions |
See Note 2 to our consolidated financial statements in this report for a complete discussion of our revenue recognition policies.
Revenues are recognized when control of our services is transferred to our customers, in an amount that reflects the consideration we expect to be entitled to in exchange for those services.
We determine revenue recognition through the following steps:
(1) Identification of the contract, or contracts, with a customer;
(2) Identification of the performance obligations in the contract;
(3) Determination of the transaction price;
(4) Allocation of the transaction price to the performance obligations in the contract; and
(5) Recognition of revenue when, or as, we satisfy a performance obligation. We have not made any material changes in the accounting methodology we use to recognize revenue during the year ended December 31, 2021. | Our revenue recognition accounting methodology contains uncertainties because it requires us to make significant estimates and assumptions, and to apply judgment.
For example, for arrangements that have multiple performance obligations, we must exercise judgment and use estimates in order to (1) determine whether performance obligations are distinct and should be accounted for separately; (2) determine the standalone selling price of each performance obligation; (3) allocate the transaction price among the various performance obligations on a relative standalone selling price basis; and (4) determine whether revenue for each performance obligation should be recognized at a point in time or over time.
In addition, we exercise judgment in certain transactions when determining whether we should recognize revenue based on the gross amount billed to a customer (as a principal) or the net amount retained (as an agent). These judgments are based on our determination of whether or not we control the service before it is transferred to the customer.
| If we were to change any of these judgments or estimates, it could cause a material increase or decrease in the amount of revenue or deferred revenue that we report in a particular period. |
| | | | | | | | |
| Costs of Obtaining Contracts | | |
| Description | Judgments and Uncertainties | Effect if Actual Results Differ
From Assumptions |
We pay sales commissions at the time contracts with customers are signed or shortly thereafter, depending on the size and duration of the sales contract. Sales commissions and related fringe benefits earned by our sales force are considered incremental and recoverable costs of obtaining a contract with a customer. These costs are deferred and then amortized in a manner that aligns with the expected period of benefit, which we have determined to be five years. We do not generally pay commissions for contract renewals. The related amortization expense is included in sales, marketing and customer success expense in our consolidated statements of comprehensive income. We have not made any material changes in the accounting methodology we use to record costs of obtaining contracts during the year ended December 31, 2021. | Our accounting methodology for determining the period over which we amortize costs of obtaining contracts with customers contains uncertainties because it requires us to make significant estimates and assumptions, and to apply judgment.
For example, we must exercise judgment and use estimates in order to determine the expected period of benefit of our sales commissions. We take into consideration our customer contracts, including renewals, retention, our technology and other factors. | If we were to change any of these judgments or estimates, it could cause a material increase or decrease in the amount of assets, operating expenses or income that we report in a particular period. |
| | | | | | | | |
| Business Combinations | | |
| Description | Judgments and Uncertainties | Effect if Actual Results Differ
From Assumptions |
We allocate the purchase price of an acquired business to its identifiable assets acquired and liabilities assumed at the acquisition date based upon their estimated fair values. The excess of the purchase price over the amount allocated to the identifiable assets acquired and liabilities assumed, if any, is recorded as goodwill.
We use available information to estimate fair values. We typically engage outside appraisal firms to assist in the fair value determination of long-lived and identifiable intangible assets, and any other significant assets or liabilities. We adjust the preliminary purchase price allocation, as necessary, up to one year after the acquisition closing date as we obtain new information about facts and circumstances that existed as of the closing date. We have not made any material changes in the accounting methodology we use for business combinations during the year ended December 31, 2021. | Our purchase price allocation methodology contains uncertainties because it requires us to make significant estimates and assumptions, and to apply judgment to estimate the fair value of assets acquired and liabilities assumed, especially with respect to long-lived and intangible assets.
Management estimates the fair value of assets acquired and liabilities assumed based on quoted market prices, the carrying value of the acquired assets and widely accepted valuation techniques, including discounted cash flows, market multiple analyses and replacement cost.
We apply significant judgement in estimating the fair value of intangible assets acquired, which involves the use of significant assumptions. Significant assumptions used in the valuation of customer relationships include future revenue and operating expenses, customer attrition rates, contributory asset charges, tax amortization benefit, and discount rates. Significant assumptions used in the valuation of certain developed technology assets include future revenue, proprietary technology obsolescence curve, royalty rate, and discount rate. Significant assumptions used in the valuation of marketing assets include assumptions about the period of time the brand will continue to be valuable, royalty rate, and discount rate. Significant assumptions used in the valuation of content intangible assets include cost-based assumptions. Our estimates of fair value are based upon assumptions we believe to be reasonable, but which are inherently uncertain and unpredictable, and unanticipated events and changes in circumstances may occur. | If actual results are materially different than the assumptions we used to determine fair value of the assets acquired and liabilities assumed through a business combination as well as the estimated useful lives of the acquired intangible assets, it is possible that adjustments to the carrying values of such assets and liabilities will have a material impact on our financial position and results of operations.
See Note 3 to our consolidated financial statements in this report for information regarding our business acquisitions. |
| | | | | | | | |
| Income Taxes | | |
| Description | Judgments and Uncertainties | Effect if Actual Results Differ
From Assumptions |
We make estimates and judgments in accounting for income taxes. Our income tax returns, like those of most companies, are periodically audited by domestic and foreign tax authorities.
We measure and recognize uncertain tax positions. To recognize uncertain tax positions, we must first determine if it is more likely than not that the position will be sustained upon audit. We must then measure the benefit as the largest amount that is more than 50% likely of being realized upon ultimate settlement.
We make estimates in determining tax assets and liabilities, which arise from differences in the timing of recognition of revenue and expense for tax and financial reporting purposes. We record valuation allowances to reduce our deferred tax assets to the amount expected to be realized. We have not made any material changes in the accounting methodology we use to assess income tax during the year ended December 31, 2021. | The calculation of our income tax provision requires estimates due to transactions, credits and calculations where the ultimate tax determination is uncertain. Uncertainties arise as a consequence of the actual source of taxable income between domestic and foreign locations, the outcome of tax audits and the ultimate utilization of tax credits.
Our effective income tax rate is also affected by changes in the geographic distribution of our earnings or losses, changes in tax law in jurisdictions where we conduct business.
Significant judgment is required in the identification and measurement of uncertain tax positions. Our liability for unrecognized tax benefits contains uncertainties because management is required to make assumptions and to apply judgment to estimate the exposures associated with our various filing positions.
In assessing the adequacy of a recorded valuation allowance significant judgment is required. We consider all positive and negative evidence and a variety of factors including the scheduled reversal of deferred tax liabilities, historical and projected future taxable income, and prudent and feasible tax planning strategies. | Although we believe that the judgments and estimates discussed herein are reasonable, actual results could differ, and we may be exposed to losses or gains that could be material.
To the extent actual results differ from estimated amounts recorded, such differences will impact the income tax provision in the period in which the determination is made.
If we determine there is less than a 50% likelihood that we will be able to use a deferred tax asset in the future in excess of its net carrying value, then an adjustment to the deferred tax asset valuation allowance is made to increase income tax expense, thereby reducing net income in the period such determination was made. |
| | | | | | | | |
| Long-lived Assets and Intangible Assets Other Than Goodwill |
| Description | Judgments and Uncertainties | Effect if Actual Results Differ
From Assumptions |
We review our long-lived assets and intangible assets other than goodwill for impairment when events or changes in circumstances indicate the carrying amount may not be recoverable. If such events or changes in circumstances occur, we use the undiscounted cash flow method to determine whether our long-lived and intangible assets other than goodwill are impaired. To the extent that the carrying value of the asset exceeds the undiscounted cash flows over the estimated remaining life of the asset, we measure the impairment using discounted cash flows. We have not made any material changes in the accounting methodology we use to assess impairment loss during the year ended December 31, 2021. | When measuring impairment of an asset using discounted cash flows, we make assumptions and apply judgment in estimating future cash flows and asset fair values, including annual revenue growth rates, a terminal year growth rate and selecting a discount rate that reflects the risk inherent in future cash flows.
| During 2021, we recorded impairment charges against certain property and equipment assets and certain operating lease ROU assets. For additional information, see Notes 7 and 11 to our consolidated financial statements in this report. We do not believe there is a reasonable likelihood that there will be a material change in the future estimates or assumptions we use to assess impairment losses. However, if actual results are not consistent with our estimates or assumptions, we may be exposed to an impairment charge that could materially adversely impact our consolidated financial position and results of operations. |
| | |
| Recently Issued Accounting Pronouncements |
For a discussion of the impact that recently issued accounting pronouncements are expected to have on our financial position and results of operations when adopted in the future, see Note 2 to our consolidated financial statements in this report.
ITEM 7A. QUANTITATIVE AND QUALITATIVE DISCLOSURES ABOUT MARKET RISK
We have market rate sensitivity for interest rates and foreign currency exchange rates.
Our variable rate debt is our primary financial instrument with market risk exposure for changing interest rates. We manage our variable rate interest rate risk through a combination of short-term and long-term borrowings and the use of derivative instruments entered into for hedging purposes. Our interest rate exposure includes LIBOR rates. The Financial Conduct Authority in the U.K. has stated that it plans to phase out all tenors of LIBOR by June 2023. We do not currently anticipate a significant impact to our financial position or results of operations as a result of this action as we expect that our financial contracts currently indexed to LIBOR will either expire or be modified without significant financial impact before the phase out occurs. Due to the nature of our debt, the materiality of the fair values of the derivative instruments and the highly liquid, short-term nature and level of our cash and cash equivalents as of December 31, 2021, we believe that the risk of exposure to changing interest rates for those positions is immaterial. There were no significant changes in how we manage interest rate risk between December 31, 2020 and December 31, 2021.
For a discussion of our exposure to foreign currency exchange rate fluctuations, see “Management’s Discussion and Analysis of Financial Condition and Results of Operations — Foreign Currency Exchange Rates” in Item 7 of this report.
ITEM 8. FINANCIAL STATEMENTS AND SUPPLEMENTARY DATA
BLACKBAUD, INC.
Index to consolidated financial statements
Report of Independent Registered Public Accounting Firm
To the Board of Directors and Stockholders of Blackbaud, Inc.
Opinions on the Financial Statements and Internal Control over Financial Reporting
We have audited the accompanying consolidated balance sheets of Blackbaud, Inc. and its subsidiaries (the “Company”) as of December 31, 2021 and 2020, and the related consolidated statements of comprehensive income, of stockholders’ equity and of cash flows for each of the three years in the period ended December 31, 2021, including the related notes (collectively referred to as the “consolidated financial statements”). We also have audited the Company's internal control over financial reporting as of December 31, 2021, based on criteria established in Internal Control - Integrated Framework (2013) issued by the Committee of Sponsoring Organizations of the Treadway Commission (COSO).
In our opinion, the consolidated financial statements referred to above present fairly, in all material respects, the financial position of the Company as of December 31, 2021 and 2020, and the results of its operations and its cash flows for each of the three years in the period ended December 31, 2021 in conformity with accounting principles generally accepted in the United States of America. Also in our opinion, the Company maintained, in all material respects, effective internal control over financial reporting as of December 31, 2021, based on criteria established in Internal Control - Integrated Framework (2013) issued by the COSO.
Basis for Opinions
The Company's management is responsible for these consolidated financial statements, for maintaining effective internal control over financial reporting, and for its assessment of the effectiveness of internal control over financial reporting, included in Management’s Report on Internal Control Over Financial Reporting appearing under Item 9A. Our responsibility is to express opinions on the Company’s consolidated financial statements and on the Company's internal control over financial reporting based on our audits. We are a public accounting firm registered with the Public Company Accounting Oversight Board (United States) (PCAOB) and are required to be independent with respect to the Company in accordance with the U.S. federal securities laws and the applicable rules and regulations of the Securities and Exchange Commission and the PCAOB.
We conducted our audits in accordance with the standards of the PCAOB. Those standards require that we plan and perform the audits to obtain reasonable assurance about whether the consolidated financial statements are free of material misstatement, whether due to error or fraud, and whether effective internal control over financial reporting was maintained in all material respects.
Our audits of the consolidated financial statements included performing procedures to assess the risks of material misstatement of the consolidated financial statements, whether due to error or fraud, and performing procedures that respond to those risks. Such procedures included examining, on a test basis, evidence regarding the amounts and disclosures in the consolidated financial statements. Our audits also included evaluating the accounting principles used and significant estimates made by management, as well as evaluating the overall presentation of the consolidated financial statements. Our audit of internal control over financial reporting included obtaining an understanding of internal control over financial reporting, assessing the risk that a material weakness exists, and testing and evaluating the design and operating effectiveness of internal control based on the assessed risk. Our audits also included performing such other procedures as we considered necessary in the circumstances. We believe that our audits provide a reasonable basis for our opinions.
As described in Management’s Report on Internal Control Over Financial Reporting, management has excluded EVERFI, Inc. from its assessment of internal control over financial reporting as of December 31, 2021, because it was acquired by the Company in a purchase business combination during 2021. We have also excluded EVERFI, Inc. from our audit of internal control over financial reporting. EVERFI, Inc. is a wholly-owned subsidiary whose total assets and total revenues excluded from management’s assessment and our audit of internal control over financial reporting represent approximately 6% and 0%, respectively, of the related consolidated financial statement amounts as of and for the year ended December 31, 2021.
Definition and Limitations of Internal Control over Financial Reporting
A company’s internal control over financial reporting is a process designed to provide reasonable assurance regarding the reliability of financial reporting and the preparation of financial statements for external purposes in accordance with generally accepted accounting principles. A company’s internal control over financial reporting includes those policies and procedures that (i) pertain to the maintenance of records that, in reasonable detail, accurately and fairly reflect the transactions and dispositions of the assets of the company; (ii) provide reasonable assurance that transactions are recorded as necessary to permit preparation of financial statements in accordance with generally accepted accounting principles, and that receipts and expenditures of the company are being made only in accordance with authorizations of management and directors of the company; and (iii) provide reasonable assurance regarding prevention or timely detection of unauthorized acquisition, use, or disposition of the company’s assets that could have a material effect on the financial statements.
Because of its inherent limitations, internal control over financial reporting may not prevent or detect misstatements. Also, projections of any evaluation of effectiveness to future periods are subject to the risk that controls may become inadequate because of changes in conditions, or that the degree of compliance with the policies or procedures may deteriorate.
Critical Audit Matters
The critical audit matters communicated below are matters arising from the current period audit of the consolidated financial statements that were communicated or required to be communicated to the audit committee and that (i) relate to accounts or disclosures that are material to the consolidated financial statements and (ii) involved our especially challenging, subjective, or complex judgments. The communication of critical audit matters does not alter in any way our opinion on the consolidated financial statements, taken as a whole, and we are not, by communicating the critical audit matters below, providing separate opinions on the critical audit matters or on the accounts or disclosures to which they relate.
Acquisition of EVERFI, Inc. - Valuation of the Customer Relationships, Certain Developed Technology Assets, Marketing Assets, and Content Intangible Assets
As described in Notes 2 and 3 to the consolidated financial statements, on December 31, 2021, the Company acquired EVERFI, Inc. for an aggregate purchase price of $743.8 million, which resulted in $326.6 million of customer relationships, $72.0 million of developed technology, $40.9 million of marketing assets, and $17.9 million of content intangible assets being recorded. Management estimated the fair values of the customer relationships, marketing assets, and a substantial portion of the developed technology based on variations of the income approach, which estimates fair value based upon the present value of cash flows that the assets are expected to generate, and which included the relief-from-royalty method and multi-period excess earnings method, depending on the intangible asset being valued. Management estimated the fair value of content and a portion of the developed technology using the replacement cost method. Management applied significant judgment in estimating the fair value of intangible assets acquired, which involved the use of significant assumptions including future revenue and operating expenses, customer attrition rates, contributory asset charges, tax amortization benefit, and discount rates used in the valuation of customer relationships; future revenue, proprietary technology obsolescence curve, royalty rate, and discount rate used in the valuation of certain developed technology assets; assumptions about the period of time the brand will continue to be valuable, royalty rate, and discount rate used in the valuation of marketing assets; and cost-based assumptions used in the valuation of content intangible assets.
The principal considerations for our determination that performing procedures relating to the valuation of customer relationships, certain developed technology assets, marketing assets, and content intangible assets related to the acquisition of EVERFI, Inc. is a critical audit matter are the significant judgment by management in developing the fair value of the customer relationships, certain developed technology assets, marketing assets, and content intangible assets, which led to significant auditor judgment, subjectivity, and effort in performing procedures and evaluating management’s aforementioned significant assumptions used in the valuation of the customer relationships, certain developed technology assets, marketing assets, and content intangible assets. In addition, the audit effort involved the use of professionals with specialized skill and knowledge.
Addressing the matter involved performing procedures and evaluating audit evidence in connection with forming our overall opinion on the consolidated financial statements. These procedures included testing the effectiveness of controls relating to the acquisition accounting, including controls over management’s valuation of the customer relationships, developed technology assets, marketing assets, and content intangible assets, as well as controls over the development
of the aforementioned significant assumptions related to the valuation of these intangible assets. These procedures also included, among others, reading the purchase agreement and testing management’s process for estimating the fair value of the customer relationships, certain developed technology assets, marketing assets, and content intangible assets. Testing management’s process included (i) evaluating the appropriateness of the valuation methods, (ii) testing the completeness and accuracy of data provided by management, and (iii) evaluating the reasonableness of the aforementioned significant assumptions used in the valuation of the customer relationships, certain developed technology assets, marketing assets, and content intangible assets. Evaluating the reasonableness of the future revenue used in the valuation of the customer relationships and certain developed technology assets, operating expenses, customer attrition rates, and contributory asset charges used in the valuation of the customer relationships, and the cost-based assumptions used in the valuation of content intangible assets involved considering the past performance of the acquired business, consistency with external market and industry data, and whether these assumptions were consistent with evidence obtained in other areas of the audit. Evaluating the reasonableness of the proprietary technology obsolescence curve used in the valuation of certain developed technology assets and royalty rates used in the valuation of certain developed technology assets and marketing assets involved evaluating the consistency of these assumptions with external market and industry data. Evaluating the reasonableness of the discount rates used in the valuation of the customer relationships, certain developed technology assets, and marketing assets involved considering the cost of capital of comparable benchmark rates and other industry factors. Professionals with specialized skill and knowledge were used to assist in the evaluation of the appropriateness of the Company’s relief-from-royalty, multi-period excess earnings, and replacement cost methods and in evaluating the reasonableness of the significant assumptions related to customer attrition rates and tax amortization benefit used in the valuation of the customer relationships, assumptions about the period of time the brand will continue to be valuable used in the valuation of marketing assets, cost-based assumptions used in the valuation of content intangible assets, royalty rates used in the valuation of certain developed technology assets and marketing assets, and discount rates used in the valuation of the customer relationships, certain developed technology assets, and marketing assets.
Revenue recognition - Contracts with Multiple Performance Obligations
As described in Note 2 to the consolidated financial statements, the Company has some contracts with customers that contain multiple performance obligations. For these contracts, management accounts for individual performance obligations separately if they are distinct. As described by management, management exercises judgment and uses estimates in order to (1) determine whether performance obligations are distinct and should be accounted for separately; (2) determine the standalone selling price of each performance obligation; (3) allocate the transaction price among the various performance obligations on a relative standalone selling price basis; and (4) determine whether revenue for each performance obligation should be recognized at a point in time or over time. For the year ended December 31, 2021, the Company’s total revenue was $927.7 million.
The principal considerations for our determination that performing procedures relating to revenue recognition, contracts with multiple performance obligations, is a critical audit matter are the significant judgment by management in identifying, evaluating and accounting for performance obligations in contracts with multiple performance obligations, which led to significant auditor judgment and effort in performing procedures and evaluating whether contracts with multiple performance obligations were appropriately identified, evaluated and accounted for by management.
Addressing the matter involved performing procedures and evaluating audit evidence in connection with forming our overall opinion on the consolidated financial statements. These procedures included testing the effectiveness of controls relating to the revenue recognition process, including controls over the identification, evaluation and accounting for contracts with multiple performance obligations. These procedures also included, among others, testing management’s process for identifying, evaluating and accounting for performance obligations. Testing management’s process included, (i) examining revenue arrangements on a test basis, including evaluating the terms and conditions of the arrangements and testing the identification, evaluation and accounting of the performance obligations; (ii) testing the allocation of the transaction price between performance obligations based on the estimated standalone selling prices on a test basis; (iii) performing procedures to test the completeness and accuracy of the data used to determine stand-alone selling price; and (iv) evaluating the reasonableness of the approach used to determine stand-alone selling price.
/s/ PricewaterhouseCoopers LLP
Atlanta, Georgia
March 1, 2022
We have served as the Company's auditor since 2000.
Blackbaud, Inc.
Consolidated Balance Sheets
| | | | | | | | |
| (dollars in thousands) | December 31,
2021 | December 31,
2020 |
| Assets | | |
| Current assets: | | |
| Cash and cash equivalents | $ | 55,146 | | $ | 35,750 | |
| Restricted cash | 596,616 | | 609,219 | |
Accounts receivable, net of allowance of $11,155 and $10,292 at December 31, 2021 and December 31, 2020, respectively | 102,726 | | 95,404 | |
| Customer funds receivable | 977 | | 321 | |
| Prepaid expenses and other current assets | 95,506 | | 78,366 | |
| Total current assets | 850,971 | | 819,060 | |
| Property and equipment, net | 111,428 | | 105,177 | |
| Operating lease right-of-use assets | 53,883 | | 22,671 | |
| Software development costs, net | 121,377 | | 111,827 | |
| Goodwill | 1,058,640 | | 635,854 | |
| Intangible assets, net | 698,052 | | 277,506 | |
| Other assets | 77,266 | | 72,639 | |
| Total assets | $ | 2,971,617 | | $ | 2,044,734 | |
| Liabilities and stockholders’ equity | | |
| Current liabilities: | | |
| Trade accounts payable | $ | 22,067 | | $ | 27,836 | |
| Accrued expenses and other current liabilities | 100,096 | | 52,228 | |
| Due to customers | 594,273 | | 608,264 | |
| Debt, current portion | 18,697 | | 12,840 | |
| Deferred revenue, current portion | 374,499 | | 312,236 | |
| Total current liabilities | 1,109,632 | | 1,013,404 | |
| Debt, net of current portion | 937,483 | | 518,193 | |
| Deferred tax liability | 148,465 | | 54,086 | |
| Deferred revenue, net of current portion | 4,247 | | 4,678 | |
| Operating lease liabilities, net of current portion | 53,386 | | 17,357 | |
| Other liabilities | 1,344 | | 10,866 | |
| Total liabilities | 2,254,557 | | 1,618,584 | |
| Commitments and contingencies (see Note 11) | | |
| Stockholders’ equity: | | |
Preferred stock; 20,000,000 shares authorized, none outstanding | — | | — | |
Common stock, $0.001 par value; 180,000,000 shares authorized, 66,165,666 and 60,904,638 shares issued at December 31, 2021 and December 31, 2020, respectively | 66 | | 61 | |
| Additional paid-in capital | 968,927 | | 544,963 | |
Treasury stock, at cost; 14,182,805 and 12,054,268 shares at December 31, 2021 and December 31, 2020, respectively | (500,911) | | (353,091) | |
| Accumulated other comprehensive income (loss) | 6,522 | | (2,497) | |
| Retained earnings | 242,456 | | 236,714 | |
| Total stockholders’ equity | 717,060 | | 426,150 | |
| Total liabilities and stockholders’ equity | $ | 2,971,617 | | $ | 2,044,734 | |
| | |
The accompanying notes are an integral part of these consolidated financial statements. |
Blackbaud, Inc.
Consolidated Statements of Comprehensive Income
| | | | | | | | | | | |
| (dollars in thousands, except per share amounts) | Years ended December 31, |
| 2021 | 2020 | 2019 |
| Revenue | | | |
| Recurring | $ | 880,850 | | $ | 850,745 | | $ | 831,609 | |
| One-time services and other | 46,890 | | 62,474 | | 68,814 | |
| Total revenue | 927,740 | | 913,219 | | 900,423 | |
| Cost of revenue | | | |
| Cost of recurring | 390,803 | | 369,681 | | 357,988 | |
| Cost of one-time services and other | 52,392 | | 58,384 | | 60,436 | |
| Total cost of revenue | 443,195 | | 428,065 | | 418,424 | |
| Gross profit | 484,545 | | 485,154 | | 481,999 | |
| Operating expenses | | | |
| Sales, marketing and customer success | 186,314 | | 209,762 | | 224,152 | |
| Research and development | 124,573 | | 100,146 | | 106,164 | |
| General and administrative | 146,262 | | 134,852 | | 113,414 | |
| Amortization | 2,227 | | 2,915 | | 5,316 | |
| Restructuring | 263 | | 236 | | 5,808 | |
| Total operating expenses | 459,639 | | 447,911 | | 454,854 | |
| Income from operations | 24,906 | | 37,243 | | 27,145 | |
| Interest expense | (18,003) | | (17,287) | | (20,618) | |
| Other income, net | 180 | | 1,658 | | 4,058 | |
| Income before provision for income taxes | 7,083 | | 21,614 | | 10,585 | |
| Income tax provision (benefit) | 1,385 | | 13,897 | | (1,323) | |
| Net income | $ | 5,698 | | $ | 7,717 | | $ | 11,908 | |
| Earnings per share | | | |
| Basic | $ | 0.12 | | $ | 0.16 | | $ | 0.25 | |
| Diluted | $ | 0.12 | | $ | 0.16 | | $ | 0.25 | |
| Common shares and equivalents outstanding | | | |
| Basic weighted average shares | 47,412,306 | | 48,184,714 | | 47,695,383 | |
| Diluted weighted average shares | 48,230,438 | | 48,696,341 | | 48,312,271 | |
| Other comprehensive income (loss) | | | |
| Foreign currency translation adjustment | 661 | | 4,571 | | 2,641 | |
| Unrealized gain (loss) on derivative instruments, net of tax | 8,358 | | (1,778) | | (2,821) | |
| Total other comprehensive income (loss) | 9,019 | | 2,793 | | (180) | |
| Comprehensive income | $ | 14,717 | | $ | 10,510 | | $ | 11,728 | |
| | | |
The accompanying notes are an integral part of these consolidated financial statements. |
Blackbaud, Inc.
Consolidated Statements of Cash Flows
| | | | | | | | | | | |
| | Years ended December 31, |
| (dollars in thousands) | 2021 | 2020 | 2019 |
| Cash flows from operating activities | | | |
| Net income | $ | 5,698 | | $ | 7,717 | | $ | 11,908 | |
| Adjustments to reconcile net income to net cash provided by operating activities: | | | |
| Depreciation and amortization | 82,410 | | 92,735 | | 85,693 | |
| Provision for credit losses and sales returns | 11,450 | | 13,230 | | 8,725 | |
| Stock-based compensation expense | 120,379 | | 87,257 | | 58,633 | |
| Deferred taxes | (2,429) | | 8,837 | | (3,600) | |
| Amortization of deferred financing costs and discount | 1,570 | | 781 | | 752 | |
| Other non-cash adjustments | 10,490 | | 2,958 | | 4,906 | |
| Changes in operating assets and liabilities, net of acquisition and disposal of businesses: | | | |
| Accounts receivable | (6,525) | | (18,414) | | (6,569) | |
| Prepaid expenses and other assets | (2,048) | | 22,568 | | 6,383 | |
| Trade accounts payable | (9,670) | | (19,997) | | 12,900 | |
| Accrued expenses and other liabilities | (8,190) | | (49,232) | | (9,718) | |
| Deferred revenue | 10,526 | | (485) | | 12,464 | |
| Net cash provided by operating activities | 213,661 | | 147,955 | | 182,477 | |
| Cash flows from investing activities | | | |
| Purchase of property and equipment | (11,664) | | (29,690) | | (11,492) | |
| Capitalized software development costs | (40,489) | | (42,157) | | (46,874) | |
| Purchase of net assets of acquired companies, net of cash and restricted cash acquired | (419,120) | | — | | (109,353) | |
| | | |
| | | |
| Other investing activities | — | | — | | 500 | |
| Net cash used in investing activities | (471,273) | | (71,847) | | (167,219) | |
| Cash flows from financing activities | | | |
| Proceeds from issuance of debt | 582,200 | | 748,500 | | 424,000 | |
| Payments on debt | (152,971) | | (747,563) | | (344,500) | |
| Debt issuance costs | (3,106) | | (4,586) | | — | |
| Employee taxes paid for withheld shares upon equity award settlement | (39,404) | | (21,425) | | (23,781) | |
| Proceeds from exercise of stock options | — | | 4 | | 7 | |
| Change in due to customers | (13,464) | | 61,214 | | 77,793 | |
| Change in customer funds receivable | (731) | | 138 | | 1,301 | |
| Purchase of treasury stock | (108,416) | | (41,001) | | — | |
| Dividend payments to stockholders | — | | (5,960) | | (23,607) | |
| Net cash provided by (used in) financing activities | 264,108 | | (10,679) | | 111,213 | |
| Effect of exchange rate on cash, cash equivalents and restricted cash | 297 | | 2,245 | | 978 | |
| Net increase in cash, cash equivalents and restricted cash | 6,793 | | 67,674 | | 127,449 | |
| Cash, cash equivalents and restricted cash, beginning of year | 644,969 | | 577,295 | | 449,846 | |
| Cash, cash equivalents and restricted cash, end of year | $ | 651,762 | | $ | 644,969 | | $ | 577,295 | |
| | | |
| Supplemental disclosure of cash flow information | | | |
| Cash (paid) received during the year for: | | | |
| Interest | $ | (16,386) | | $ | (15,716) | | $ | (19,926) | |
| Taxes, net of refunds | (10,073) | | (3,563) | | (383) | |
| Non-cash investing and financing activities: | | | |
| Purchase of EVERFI through the issuance of stock (see Note 3) | (303,633) | | — | | — | |
| Purchase of property and equipment by assuming directly related liabilities | — | | (61,064) | | — | |
| Purchase of equipment and other assets included in accounts payable | (1,747) | | (840) | | (794) | |
| Acquired restricted cash liabilities due to customers | — | | — | | 46,838 | |
The following table provides a reconciliation of cash and cash equivalents and restricted cash reported within the consolidated balance sheets that sum to the total of the same such amounts shown above in the consolidated statements of cash flows:
| | | | | | | | |
| (dollars in thousands) | December 31,
2021 | December 31,
2020 |
| Cash and cash equivalents | $ | 55,146 | | $ | 35,750 | |
| Restricted cash | 596,616 | | 609,219 | |
| Total cash, cash equivalents and restricted cash in the statement of cash flows | $ | 651,762 | | $ | 644,969 | |
| | |
| The accompanying notes are an integral part of these consolidated financial statements. |
Blackbaud, Inc.
Consolidated Statements of Stockholders' Equity
| | | | | | | | | | | | | | | | | | | | | | | |
| (dollars in thousands) | Common stock | Additional
paid-in
capital | Treasury
stock | Accumulated
other
comprehensive
loss | Retained
earnings | Total stockholders' equity |
| Shares | Amount |
| Balance at December 31, 2018 | 59,327,633 | | $ | 59 | | $ | 399,241 | | $ | (266,884) | | $ | (5,110) | | $ | 246,477 | | $ | 373,783 | |
| Net income | — | | — | | — | | — | | — | | 11,908 | | 11,908 | |
Payment of dividends ($0.48 per share) | — | | — | | — | | — | | — | | (23,607) | | (23,607) | |
| Exercise of stock options and stock appreciation rights and vesting of restricted stock units | 267,455 | | — | | 7 | | — | | — | | — | | 7 | |
Employee taxes paid for 305,780 withheld shares upon equity award settlement | — | | — | | — | | (23,781) | | — | | — | | (23,781) | |
| Stock-based compensation | — | | — | | 58,556 | | — | | — | | 77 | | 58,633 | |
| Restricted stock grants | 723,868 | | 1 | | — | | — | | — | | — | | 1 | |
| Restricted stock cancellations | (112,865) | | — | | — | | — | | — | | — | | — | |
| Other comprehensive loss | — | | — | | — | | — | | (180) | | — | | (180) | |
| Balance at December 31, 2019 | 60,206,091 | | $ | 60 | | $ | 457,804 | | $ | (290,665) | | $ | (5,290) | | $ | 234,855 | | $ | 396,764 | |
| Net income | — | | — | | — | | — | | — | | 7,717 | | 7,717 | |
Payment of dividends ($0.12 per share)(1) | — | | — | | — | | — | | — | | (5,960) | | (5,960) | |
Purchase of 714,000 treasury shares under stock repurchase program | — | | — | | — | | (41,001) | | — | | — | | (41,001) | |
| Exercise of stock options and vesting of restricted stock units | 218,141 | | — | | 4 | | — | | — | | — | | 4 | |
Employee taxes paid for 273,914 withheld shares upon equity award settlement | — | | — | | — | | (21,425) | | — | | — | | (21,425) | |
| Stock-based compensation | — | | — | | 87,155 | | — | | — | | 102 | | 87,257 | |
| Restricted stock grants | 657,483 | | 1 | | — | | — | | — | | — | | 1 | |
| Restricted stock cancellations | (177,077) | | — | | — | | — | | — | | — | | — | |
| Other comprehensive income | — | | — | | — | | — | | 2,793 | | — | | 2,793 | |
| Balance at December 31, 2020 | 60,904,638 | | $ | 61 | | $ | 544,963 | | $ | (353,091) | | $ | (2,497) | | $ | 236,714 | | $ | 426,150 | |
| Net income | — | | — | | — | | — | | — | | 5,698 | | 5,698 | |
Common stock issued in purchase of EVERFI (see Note 3) | 3,844,423 | | 4 | | 303,629 | | — | | — | | — | | 303,633 | |
Purchase of 1,592,933 treasury shares under stock repurchase program | — | | — | | — | | (108,416) | | — | | — | | (108,416) | |
| Vesting of restricted stock units | 1,014,562 | | 1 | | — | | — | | — | | — | | 1 | |
Employee taxes paid for 535,604 withheld shares upon equity award settlement | — | | — | | — | | (39,404) | | — | | — | | (39,404) | |
| Stock-based compensation | — | | — | | 120,335 | | — | | — | | 44 | | 120,379 | |
| Restricted stock grants | 596,763 | | — | | — | | — | | — | | — | | — | |
| Restricted stock cancellations | (194,720) | | — | | — | | — | | — | | — | | — | |
| Other comprehensive income | — | | — | | — | | — | | 9,019 | | — | | 9,019 | |
| Balance at December 31, 2021 | 66,165,666 | | $ | 66 | | $ | 968,927 | | $ | (500,911) | | $ | 6,522 | | $ | 242,456 | | $ | 717,060 | |
| (1) Represents dividends paid in Q1 2020. Refer to the discussion of our Board of Directors' decision to discontinue the declaration and payments of all cash dividends beginning in Q2 2020 in Note 14 of our Annual Report on Form 10-K for the fiscal year ended December 31, 2020, as filed with the SEC on February 23, 2021. |
| | | | | | | |
| The accompanying notes are an integral part of these consolidated financial statements. |
Blackbaud, Inc.
Notes to Consolidated Financial Statements
We are the world’s leading cloud software company powering social good. Serving the entire social good community—nonprofits, higher education institutions, K–12 schools, healthcare organizations, faith communities, arts and cultural organizations, foundations, companies and individual change agents—we connect and empower organizations to increase their impact through cloud software, services, expertise and data intelligence. Our portfolio is tailored to the unique needs of vertical markets, with solutions for fundraising and CRM, marketing, advocacy, peer-to-peer fundraising, corporate social responsibility (CSR) and environmental, social and governance (ESG), school management, ticketing, grantmaking, financial management, payment processing and analytics. Serving the industry for more than four decades, we are a remote-first company headquartered in Charleston, South Carolina, with operations in the United States, Australia, Canada, Costa Rica and the United Kingdom.
Basis of presentation
The consolidated financial statements have been prepared in accordance with accounting principles generally accepted in the United States (“GAAP”).
Basis of consolidation
The consolidated financial statements include the accounts of Blackbaud, Inc. and its wholly owned subsidiaries. All intercompany balances and transactions have been eliminated in consolidation.
Risks and uncertainties related to COVID-19
We are subject to risks and uncertainties as a result of the global COVID-19 pandemic. We believe that COVID-19 may continue to impact our vertical markets and geographies, but the magnitude of the impact on our business cannot be determined at this time due to numerous uncertainties, including the duration of the outbreak, the severity of variants which may develop, travel restrictions and business closures, the effectiveness of vaccination programs and other actions taken to contain the disease and other unforeseeable consequences.
Use of estimates
The preparation of financial statements in conformity with GAAP requires management to make estimates and assumptions that affect the reported amounts of assets and liabilities and disclosure of contingent assets and liabilities at the date of the financial statements, as well as the reported amounts of revenues and expenses during the reporting periods. On an ongoing basis, we reconsider and evaluate our estimates and assumptions, including those that impact revenue recognition, long-lived and intangible assets, income taxes, business combinations, stock-based compensation, capitalization of software development costs, our allowances for credit losses and sales returns, costs of obtaining contracts, valuation of derivative instruments, loss contingencies and insurance recoveries, among others. Changes in the facts or circumstances underlying these estimates, including due to COVID-19, could result in material changes and actual results could materially differ from these estimates.
Blackbaud, Inc.
Notes to Consolidated Financial Statements
Recently adopted accounting pronouncements
In October 2021, the Financial Accounting Standards Board issued Accounting Standards Update ("ASU") 2021-08, Business Combinations (Topic 805) – Accounting for Contract Assets and Contract Liabilities from Contracts with Customers ("ASU 2021-08"). ASU 2021-08 requires that an entity recognize and measure contract assets and deferred revenue (a contract liability) acquired in a business combination in accordance with Accounting Standards Codification (“ASC”) 606, Revenue from Contracts from Customers (“ASC 606”). At the acquisition date, an acquirer should account for the related revenue contracts in accordance with ASC 606 as if it had originated the contracts. To achieve this, an acquirer may assess how the acquiree applied ASC 606 to determine what to record for the acquired revenue contracts. Generally, this should result in an acquirer recognizing and measuring the acquired contract assets and deferred revenue consistent with how they were recognized and measured in the acquiree’s financial statements (if the acquiree financial statements were prepared in accordance with GAAP). We early adopted ASU 2021-08 as of October 1, 2021 and applied the guidance to the deferred revenue recorded for EVERFI as of December 31, 2021. See Note 3 to these consolidated financial statements for further information on our acquisition of EVERFI.
Recently issued accounting pronouncements
There are no recently issued accounting pronouncements that are expected to have a material impact on our financial position or results of operations when adopted in the future.
Summary of significant accounting policies
Revenue recognition
Our revenue is primarily generated from the following sources: (i) charging for the use of our software solutions in cloud and hosted environments; (ii) providing payment and transaction services; (iii) providing software maintenance and support services; and (iv) providing professional services, including implementation, consulting, training, analytic and other services. Revenues are recognized when control of these services is transferred to our customers, in an amount that reflects the consideration we expect to be entitled to in exchange for those services.
We determine revenue recognition through the following steps:
•Identification of the contract, or contracts, with a customer;
•Identification of the performance obligations in the contract;
•Determination of the transaction price;
•Allocation of the transaction price to the performance obligations in the contract; and
•Recognition of revenue when, or as, we satisfy a performance obligation.
Recurring
Recurring revenue represents stand-ready performance obligations in which we are making our solutions or services available to our customers continuously over time or the value of the contract renews. Therefore, recurring revenue is generally recognized over time on a ratable basis over the contract term, beginning on the date that the solution or service is made available to the customer. Our recurring revenue contracts are generally for a term of 3 years at contract inception with 1 to 3-year renewals thereafter, billed annually in advance and non-cancelable.
Recurring revenue is comprised of fees for the use of our subscription-based software solutions, which includes providing access to cloud solutions, hosting services, payment services, online training programs, subscription-based analytic services, such as donor acquisitions and data enrichment services. Recurring revenue also includes fees from maintenance services for our on-premises solutions, services included in our renewable subscription contracts, retained and managed services contracts that we expect to have a term consistent with our cloud solution contracts, and variable transaction revenue associated with the use of our solutions.
Blackbaud, Inc.
Notes to Consolidated Financial Statements
Our payment services are offered with the assistance of third-party vendors. In general, when we are the principal in a transaction based on the factors identified in ASC 606-10-55-36 through 55-40, we record the revenue and related costs on a gross basis. Otherwise, we net the cost of revenue associated with the service against the gross revenue (amount billed to the customer) and record the net amount as revenue. For payment and transaction services, we have the right to invoice the customer in an amount that directly corresponds with the value to the customer of our performance to date. Therefore, we recognize revenue for these services over time based on the amount billable to the customer in accordance with the 'as invoiced' practical expedient in ASC 606-10-55-18.
One-time services and other
One-time services and other revenue is primarily comprised of fees for one-time consulting, analytic and onsite training services, fees for retained and managed services contracts that we do not expect to have a term consistent with our cloud solution contracts, and fees from user conferences.
We generally bill consulting services based on hourly rates plus reimbursable travel-related expenses. Fixed price consulting engagements are generally billed as milestones towards completion are reached. Revenue for one-time consulting services is generally recognized over time as the services are performed.
We generally recognize analytic services revenue from donor prospect research engagements, the sale of lists of potential donors, data enrichment engagements and benchmarking studies at a point in time (upon delivery).
In certain cases, we sell training at a fixed rate for each specific class at a per attendee price or at a packaged price for several attendees, and recognize the related revenue upon the customer attending and completing training.
Fees for retained and managed services contracts are generally billed in advance and recognized over time on a ratable basis over the contract term, beginning on the date the service is made available to the customer.
Contracts with multiple performance obligations
Some of our contracts with customers contain multiple performance obligations. For these contracts, we account for individual performance obligations separately if they are distinct. The transaction price is allocated to the separate performance obligations on a relative standalone selling price basis. Standalone selling prices of our solutions and services are typically estimated based on observable transactions when the solutions or services are sold on a standalone basis.
Costs of obtaining contracts, contract assets and deferred revenue
We pay sales commissions at the time contracts with customers are signed or shortly thereafter, depending on the size and duration of the sales contract. Sales commissions and related fringe benefits earned by our sales force are considered incremental and recoverable costs of obtaining a contract with a customer. These costs are deferred and then amortized in a manner that aligns with the expected period of benefit, which we have determined to be 5 years. We determined the period of benefit by taking into consideration our customer contracts, including renewals, retention, our technology and other factors. We do not generally pay commissions for contract renewals. The related amortization expense is included in sales, marketing and customer success expense in our consolidated statements of comprehensive income.
A contract asset is recorded when revenue is recognized in advance of our right to receive consideration (i.e., we must satisfy additional performance obligations in order to receive consideration). Amounts are recorded as receivables when our right to consideration is unconditional (i.e., only the passage of time is required before payment of the consideration is due). Our contract assets are recorded within prepaid expenses and other current assets on our consolidated balance sheets. To the extent that our customers are billed for our solutions and services in advance of us satisfying the related performance obligations, we record such amounts in deferred revenue.
Sales taxes
We present sales taxes and other taxes collected from customers and remitted to governmental authorities on a net basis and, as such, exclude them from revenues.
Blackbaud, Inc.
Notes to Consolidated Financial Statements
Fair value measurements
We measure certain financial assets and liabilities at fair value on a recurring basis, including derivative instruments. Fair value is defined as the price that would be received to sell an asset or paid to transfer a liability (an exit price) in an orderly transaction between market participants at the measurement date. An active market is defined as a market in which transactions for the asset or liability take place with sufficient frequency and volume to provide pricing information on an ongoing basis. We use a three-tier fair value hierarchy to measure fair value. This hierarchy prioritizes the inputs into three broad levels as follows:
•Level 1 - Quoted prices for identical assets or liabilities in active markets;
•Level 2 - Quoted prices for similar assets and liabilities in active markets, quoted prices for identical or similar assets in markets that are not active, and model-derived valuations in which all significant inputs and significant value drivers are observable in active markets; and
•Level 3 - Valuations derived from valuation techniques in which one or more significant inputs are unobservable.
Our financial assets and liabilities are classified in their entirety within the hierarchy based on the lowest level of input that is significant to fair value measurement. Changes to a financial asset's or liability's level within the fair value hierarchy are determined as of the end of a reporting period. All methods of assessing fair value result in a general approximation of value, and such value may never actually be realized.
Derivative instruments
We generally use derivative instruments to manage interest rate risk. We view derivative instruments as risk management tools and do not use them for trading or speculative purposes. Our policy requires that derivatives used for hedging purposes be designated and effective as a hedge of the identified risk exposure at the inception of the contract. Accordingly, changes in fair value of the derivative contract must be highly correlated with changes in the fair value of the underlying hedged item at inception of the hedge and over the life of the hedge contract.
We record all derivative instruments on our consolidated balance sheets at fair value as either an asset or liability. If the derivative is designated as a cash flow hedge, the effective portions of the changes in fair value of the derivative are recorded in other comprehensive income and reclassified to earnings in a manner that matches the timing of the earnings impact of the hedged transactions. Ineffective portions of the changes in the fair value of cash flow hedges are recognized currently in earnings. See Note 10 to these consolidated financial statements for further discussion of our derivative instruments.
Cash and cash equivalents
We consider all highly liquid investments purchased with an original maturity of three months or less and cash items in transit to be cash equivalents.
Restricted cash due to customers; Customer funds receivable; Due to customers
Restricted cash due to customers consists of monies collected by us and payable to our customers, net of the associated transaction fees earned. Monies associated with amounts due to customers are segregated in separate bank accounts and used exclusively for the payment of amounts due to customers. This usage restriction is either legally or internally imposed and reflects our intention with regard to such deposits. Customer funds receivable consists of monies we expect to collect and remit to our customers.
Concentration of credit risk
Financial instruments that potentially subject us to concentrations of credit risk consist of cash and cash equivalents, restricted cash due to customers and accounts receivable. Our cash and cash equivalents and restricted cash due to customers are placed with high credit-quality financial institutions. Our accounts receivable is derived from sales to customers who primarily operate in the nonprofit sector. With respect to accounts receivable, we perform ongoing evaluations of our customers and maintain an allowance for credit losses based on historical experience and our expectations of future credit losses. As of and for the years ended December 31, 2021, 2020 and 2019, there were no significant concentrations with respect to our consolidated revenues or accounts receivable.
Blackbaud, Inc.
Notes to Consolidated Financial Statements
Property and equipment
We record property and equipment assets at cost and depreciate them over their estimated useful lives using the straight-line method. Leasehold improvements are depreciated over the lesser of the term of the lease or the estimated useful life of the asset. Upon retirement or sale, the cost of assets disposed of and the related accumulated depreciation are removed from the accounts and any resulting gain or loss is credited or charged to earnings. Repair and maintenance costs are expensed as incurred.
Construction-in-progress primarily related to purchases of facilities and information technology assets which had not been placed in service at the respective balance sheet dates. We transfer these assets to the applicable property and equipment category on the date they are placed in service. There was no capitalized interest applicable to construction-in-progress for the years ended December 31, 2021, 2020 and 2019.
Business combinations
We include the operating results of acquired companies as well as the net assets acquired and liabilities assumed in our consolidated financial statements from the date of acquisition. We are required to allocate the purchase price of acquired companies to the tangible and intangible assets acquired and liabilities assumed at the acquisition date based upon their estimated fair values. Goodwill as of the acquisition date represents the excess of the purchase consideration of an acquired business over the fair value of the underlying net tangible and intangible assets acquired and liabilities assumed.
We apply significant judgement in estimating the fair value of intangible assets acquired, which involves the use of significant assumptions. Significant assumptions used in the valuation of customer relationships include future revenue and operating expenses, customer attrition rates, contributory asset charges, tax amortization benefit, and discount rates. Significant assumptions used in the valuation of certain developed technology assets include future revenue, proprietary technology obsolescence curve, royalty rate, and discount rate. Significant assumptions used in the valuation of marketing assets include assumptions about the period of time the brand will continue to be valuable, royalty rate, and discount rate. Significant assumptions used in the valuation of content intangible assets include cost-based assumptions. Our estimates of fair value are based upon assumptions we believe to be reasonable, but which are inherently uncertain and unpredictable, and unanticipated events and changes in circumstances may occur.
Goodwill
Goodwill represents the purchase price in excess of the net amount assigned to assets acquired and liabilities assumed by us in a business combination. Goodwill is not amortized, but tested annually for impairment on the first day of our fourth quarter, or more frequently if indicators of potential impairment arise.
Accounting guidance permits entities to first assess qualitative factors to determine whether it is more likely than not that the fair value of a reporting unit is less than its carrying amount as a basis to determine whether it is necessary to perform the quantitative impairment test. Significant judgment is required in the assessment of qualitative factors, including but not limited to an evaluation of macroeconomic conditions as they relate to our business, industry and market trends, as well as the overall future financial performance of identified reporting units and future opportunities in the markets in which we operate.
The quantitative impairment test compares the fair values of identified reporting units with their respective carrying amounts. If the carrying amount of a reporting unit exceeds its fair value, an impairment loss is recognized in an amount equal to that excess. Based on our current internal reporting structure, we currently have one operating segment, one reportable segment, and one reporting unit. In each of 2021, 2020 and 2019, we performed the quantitative impairment test, which indicated that the estimated fair values of the identified reporting units significantly exceeded their respective carrying values. There was no impairment of goodwill during 2021, 2020 and 2019.
Blackbaud, Inc.
Notes to Consolidated Financial Statements
Intangible assets other than goodwill
We amortize finite-lived intangible assets over their estimated useful lives as follows.
| | | | | | | | |
| Basis of amortization | Amortization
period
(in years) |
| Customer relationships | Straight-line and accelerated(1) | 8-17 |
| Marketing assets | Straight-line and accelerated(1) | 2-15 |
| Developed technology | Straight-line and accelerated(1) | 5-14 |
| Content | Straight-line | 9 |
| | |
(1)Certain of the customer relationships, marketing assets and developed technology assets are amortized on an accelerated basis.
We write off the gross carrying amount and accumulated amortization balances for all fully amortized intangible assets. We evaluate the estimated useful lives and the potential for impairment of finite and indefinite-lived intangible assets on an annual basis or more frequently if events or circumstances indicate revised estimates of useful lives may be appropriate or that the carrying amount may be impaired. If the carrying amount of a finite-lived intangible asset is no longer recoverable based upon the undiscounted cash flows of the asset, the amount of impairment is the difference between the carrying amount and the fair value of the asset. Substantially all of our intangible assets were acquired in business combinations. There were no impairments of acquired intangible assets during 2021 and 2020. See Note 6 to these consolidated financial statements for a discussion of our impairment of certain acquired intangible assets during 2019.
Impairment of long-lived assets
We review long-lived assets for impairment when events change or circumstances indicate the carrying amount may not be recoverable. Events or changes in circumstances that indicate the carrying amount may not be recoverable include, but are not limited to, a significant decrease in the market value of the business or asset acquired, a significant adverse change in the extent or manner in which the business or asset acquired is used or significant adverse change in the business climate. If such events or changes in circumstances are present, the undiscounted cash flow method is used to determine whether the asset is impaired. See Note 6 to these consolidated financial statements for a discussion of our impairment of certain long-lived assets during 2021 and 2019. There were no impairments of long-lived assets during 2020.
Deferred financing costs and debt discount
Deferred financing costs included in other assets represent the direct third-party costs of entering into the revolving (line-of-credit) portion of our credit facility in October 2020 and portions of the unamortized deferred financing costs from prior facilities. These costs are amortized ratably over the term of the credit facility as interest expense.
Other debt issuance costs, as well as the debt discount associated with our 2020 Credit facility (as defined below) and portions of the unamortized balances from prior facilities, are recorded as a direct deduction from debt. These costs are amortized over the term of the credit facility as interest expense.
Stock-based compensation
We measure stock-based compensation cost at the grant date based on the fair value of the award and recognize it as expense over the requisite service period, which is the vesting period. We determine the fair value of stock options and stock appreciation rights using a Black-Scholes option pricing model, which requires us to use significant judgment to make estimates regarding the life of the award, volatility of our stock price, the risk-free interest rate and the dividend yield of our stock over the life of the award. We determine the fair value of awards that contain market conditions using a Monte Carlo simulation model. Changes to these estimates would result in different fair values of awards.
We recognize the effect of awards for which the requisite service period is not rendered when the award is forfeited (that is, we recognize the effect of forfeitures in compensation cost when they occur). Previously recognized compensation cost for an award is reversed in the period that the award is forfeited. Income tax benefits resulting from the vesting and exercise of stock-based compensation awards are recognized in the period the unit or award is vested or option or right is exercised.
Blackbaud, Inc.
Notes to Consolidated Financial Statements
Income taxes
We make estimates and judgments in accounting for income taxes. The calculation of the income tax provision requires estimates due to transactions, credits and calculations where the ultimate tax determination is uncertain. Uncertainties arise as a consequence of the actual source of taxable income between domestic and foreign locations, the outcome of tax audits and the ultimate utilization of tax credits. To the extent actual results differ from estimated amounts recorded, such differences will impact the income tax provision in the period in which the determination is made.
We make estimates in determining tax assets and liabilities, which arise from differences in the timing of recognition of revenue and expense for tax and financial statement purposes. We record valuation allowances to reduce our deferred tax assets to the amount expected to be realized. In assessing the adequacy of a recorded valuation allowance significant judgment is required. We consider all positive and negative evidence and a variety of factors including the scheduled reversal of deferred tax liabilities, historical and projected future taxable income, and prudent and feasible tax planning strategies. If we determine there is less than a 50% likelihood that we will be able to use a deferred tax asset in the future in excess of its net carrying value, then an adjustment to the deferred tax asset valuation allowance is made to increase income tax expense, thereby reducing net income in the period such determination was made.
We measure and recognize uncertain tax positions. To recognize such positions, we must first determine if it is more likely than not that the position will be sustained upon audit. We must then measure the benefit as the largest amount that is more than 50% likely of being realized upon ultimate settlement. Significant judgment is required in the identification and measurement of uncertain tax positions.
Foreign currency
Net assets recorded in a foreign currency are translated at the exchange rate on the balance sheet date. Revenue and expense items are translated using an average of monthly exchange rates. The resulting translation adjustments are recorded in accumulated other comprehensive income.
Gains and losses resulting from foreign currency transactions denominated in currency other than the functional currency are recorded at the approximate rate of exchange at the transaction date in other income, net. For the years ended December 31, 2021, 2020 and 2019, we recorded net foreign currency losses that were $1.6 million, $1.1 million and insignificant, respectively.
Research and development
Research and development costs are expensed as incurred except as noted below under Software development costs. These costs include compensation costs for engineering and product management personnel, third-party contractor expenses, software development tools and other expenses related to researching and developing new solutions or upgrading and enhancing existing solutions that do not qualify for capitalization, and allocated depreciation, facilities and IT support costs.
Software development costs
We incur certain costs associated with the development of internal-use software, which are primarily related to activities performed to develop our cloud solutions. Internal and external costs incurred in the preliminary project stage of internal-use software development are expensed as incurred. Once the software being developed has reached the application development stage, qualifying internal costs including payroll and payroll-related costs of employees who are directly associated with and devote time to the software project as well as external direct costs of materials and services are capitalized. Capitalization ceases at the point at which the developed software is substantially complete and ready for its intended use, which is typically upon completion of all substantial testing. Qualifying costs capitalized during the application development stage include those related to specific upgrades and enhancements when it is probable that those costs incurred will result in additional functionality. Overhead costs, including general and administrative costs, as well as maintenance, training and all other costs associated with post-implementation stage activities are expensed as incurred. In addition, internal costs that cannot be reasonably separated between maintenance and relatively minor upgrades and enhancements are expensed as incurred.
Blackbaud, Inc.
Notes to Consolidated Financial Statements
Qualifying capitalized software development costs are amortized on a straight-line basis over the software asset's estimated useful life, which is generally 3 to 7 years. We evaluate the useful lives of these assets on an annual basis and test for impairment whenever events or changes in circumstances occur that could impact the recoverability of these assets. See Note 6 to these consolidated financial statements for a discussion of our impairment of certain capitalized software development costs during 2020. There were no impairment charges related to capitalized software development costs during 2021 and 2019. We write off the gross carrying amount and accumulated amortization balances for all fully amortized software development cost assets.
Allowance for credit losses
Our accounts receivable consist of a single portfolio segment. Accounts receivable are recorded at original invoice amounts less an allowance for credit losses, an amount we estimate to be sufficient to provide adequate protection against lifetime expected losses resulting from extending credit to our customers. In judging the adequacy of the allowance for credit losses, we consider multiple factors including historical bad debt experience, the current aging of our receivables and current economic conditions that may affect our customers' ability to pay. A considerable amount of judgment is required in assessing these factors and if any receivables were to deteriorate, an additional provision for credit losses could be required. Accounts are written off after all means of collection are exhausted and recovery is considered remote. Provisions for credit losses are recorded in general and administrative expense.
Below is a summary of the changes in our allowance for credit losses.
| | | | | | | | | | | | | | | | | |
Years ended December 31,
(in thousands) | Balance at
beginning of year | Provision/
adjustment | Write-off | Recovery | Balance at
end of year |
2021 | $ | 9,016 | | $ | 4,483 | | $ | (4,565) | | $ | 441 | | $ | 9,375 | |
2020(1) | 4,011 | | 6,787 | | (2,363) | | 581 | | 9,016 | |
2019 | 1,345 | | 2,476 | | (2,617) | | 679 | | 1,883 | |
(1)Upon adoption of ASU 2016-13 at January 1, 2020, we reclassified certain balances previously disclosed within the allowance for sales returns to the allowance for credit losses, as these amounts reflect the credit risk associated with our accounts receivable. The amount reclassified was $2.1 million.
Our allowance for credit losses remained relatively unchanged during the year ended December 31, 2021. The amount of write-offs during the year ended December 31, 2021 was higher than during 2020 as we temporarily suspended sending past due customer accounts to collections during the second and third quarters of 2020 due to payment delays related to COVID-19.
Allowance for sales returns
We maintain a reserve for returns and credits which is estimated based on several factors including historical experience, known credits yet to be issued, the aging of customer accounts and the nature of service level commitments. A considerable amount of judgment is required in assessing these factors. Provisions for sales returns and credits are charged against the related revenue items.
Below is a summary of the changes in our allowance for sales returns.
| | | | | | | | | | | | | | |
Years ended December 31,
(in thousands) | Balance at
beginning of year | Provision/
adjustment | Deduction | Balance at
end of year |
2021 | $ | 1,276 | | $ | 6,967 | | $ | (6,463) | | $ | 1,780 | |
2020(1) | 1,518 | | 6,443 | | (6,685) | | 1,276 | |
2019 | 3,377 | | 6,232 | | (5,963) | | 3,646 | |
(1)As discussed above, we reclassified certain balances previously disclosed within the allowance for sales returns to the allowance for credit losses upon adoption of ASU 2016-13 at January 1, 2020. The amount reclassified was $2.1 million.
Advertising costs
We expense advertising costs as incurred, which were $7.1 million, $3.0 million and $3.1 million for the years ended December 31, 2021, 2020 and 2019, respectively.
Blackbaud, Inc.
Notes to Consolidated Financial Statements
Restructuring costs
Restructuring costs include charges for the costs of exit or disposal activities. The liability for costs associated with exit or disposal activities is measured initially at fair value and only recognized when the liability is incurred. For details of our restructuring activities, see Note 18 to these consolidated financial statements.
Leases
We determine if an arrangement is a lease at inception. Operating leases are included in operating lease ROU assets, accrued expense and other current liabilities, and operating lease liabilities, net of current portion in our consolidated balance sheet as of December 31, 2021 and 2020.
ROU assets represent our right to use an underlying asset for the lease term and lease liabilities represent our obligation to make lease payments arising from the lease. Operating lease ROU assets and liabilities are recognized at the lease commencement date based on the present value of lease payments over the lease term. As most of our leases do not provide an implicit rate, we generally use our incremental borrowing rate in determining the present value of lease payments. Our incremental borrowing rate is based on the estimated rate of interest for collateralized borrowing over a similar term of the lease payments at the commencement date. We use the implicit rate when readily determinable. The operating lease ROU asset also includes any initial direct costs and lease payments made and excludes lease incentives. Our lease terms may include options to extend or terminate the lease when it is reasonably certain that we will exercise that option. Lease expense for lease payments related to our operating leases is recognized on a straight-line basis over the lease term. We have lease agreements with lease and non-lease components, which are generally accounted for separately. We do not recognize short-term leases (those that, at the commencement date, have a lease term of 12 months or less) on our consolidated balance sheets. Variable lease payments, which are primarily comprised of common-area maintenance, utilities and real estate taxes that are passed on from the lessor in proportion to the space leased by us, are recognized in operating expenses in the period in which the obligation for those payments is incurred.
Contingencies
We are subject to the possibility of various loss contingencies in the normal course of business. We record an accrual for a contingency when it is both probable that a liability has been incurred and the amount of the loss can be reasonably estimated. Often these issues are subject to substantial uncertainties and, therefore, the probability of loss and the estimation of damages are difficult to ascertain. These assessments can involve a series of complex judgments about future events and can rely heavily on estimates and assumptions that have been deemed reasonable by us. Although we believe we have substantial defenses in these matters, we could incur judgments or enter into settlements of claims that could have a material adverse effect on our consolidated financial position, results of operations or cash flows in any particular period.
Earnings per share
We compute basic earnings per share by dividing net income available to common stockholders by the weighted average number of common shares outstanding during the period. Diluted earnings per share is computed by dividing net income available to common stockholders by the weighted average number of common shares and dilutive potential common shares outstanding during the period. Diluted earnings per share reflect the assumed exercise, settlement and vesting of all dilutive securities using the “treasury stock method” except when the effect is anti-dilutive. Potentially dilutive securities consist of shares issuable upon the exercise of stock options and stock appreciation rights and vesting of restricted stock awards and units.
Blackbaud, Inc.
Notes to Consolidated Financial Statements
2021 Acquisition
EVERFI
On December 31, 2021, we acquired all of the outstanding equity securities, including all voting equity interests, of EVERFI, Inc., a Delaware corporation ("EVERFI"), pursuant to an agreement and plan of merger. The acquisition advances our position as a leader in the rapidly evolving ESG and CSR spaces. We acquired the equity securities for approximately $440.1 million in cash consideration and 3,844,423 shares of the company's common stock, valued at approximately $303.6 million, for an aggregate purchase price of approximately $743.8 million, subject to closing adjustments. The cash consideration and related expenses were funded primarily through cash on hand and new borrowings under the 2020 Credit Facility (as defined below). As a result of the acquisition, EVERFI has become a wholly owned subsidiary of ours. The operating results of EVERFI have been included in our consolidated financial statements from the date of acquisition. During the year ended December 31, 2021, we incurred $2.9 million of acquisition-related expenses associated with the acquisition, which were recorded in general and administrative expense. In accordance with applicable accounting rules, we determined that the impact of this acquisition was not material to our consolidated financial statements; therefore, revenue and earnings since the acquisition date and pro forma information are not required or presented.
The fair values assigned to the assets acquired and liabilities assumed in the table below are based on our best estimates and assumptions as of the reporting date and are considered preliminary pending finalization. The estimates and assumptions are subject to change as we obtain additional information during the measurement period, which may be up to one year from the acquisition date. The assets and liabilities, pending finalization, include the valuation of intangible assets as well as the assumed deferred income tax balances.
| | | | | |
| (in thousands) | Purchase price allocation |
| Net working capital, excluding deferred revenue | $ | (3,279) | |
| Operating lease ROU assets | 44,845 | |
| Other long-term assets | 10,322 | |
| Identifiable intangible assets | 457,449 | |
| Deferred tax liability | (93,925) | |
| Deferred revenue | (51,770) | |
| Operating lease liabilities, net of current portion | (42,068) | |
| Other long-term liabilities | (645) | |
| Goodwill | 422,846 | |
| Total purchase price | $ | 743,775 | |
The estimated fair value of accounts receivable acquired approximates the contractual value of $12.9 million and $14.7 million of EVERFI's historic carryover goodwill is deductible for income tax purposes. The estimated goodwill recognized is attributable primarily to the opportunities for expected synergies from combining the operations and assembled workforce of EVERFI.
Blackbaud, Inc.
Notes to Consolidated Financial Statements
The EVERFI acquisition resulted in the identification of the following identifiable intangible assets:
| | | | | | | | |
| Intangible assets acquired | Weighted average amortization period |
| EVERFI | (in thousands) | (in years) |
| Developed technology | $ | 72,000 | | 7 |
| Customer relationships | 326,649 | | 16 |
| Marketing assets | 40,900 | | 14 |
| Content | 17,900 | | 9 |
| Total intangible assets | $ | 457,449 | | 14 |
The estimated fair values of the customer relationships, marketing assets, and a substantial portion of the developed technology were based on variations of the income approach, which estimates fair value based upon the present value of cash flows that the assets are expected to generate, and which included the relief-from-royalty method and multi-period excess earnings method, depending on the intangible asset being valued. The estimated fair value of the content intangible asset and a small portion of the developed technology was based on the cost approach and included the replacement cost method. The method of amortization of identifiable finite-lived intangible assets is based on the expected pattern in which the estimated economic benefits of the respective assets are consumed or otherwise used up. Customer relationships, marketing assets and a substantial portion of the developed technology assets are being amortized on an accelerated basis. A small portion of the developed technology and content assets are being amortized on a straight-line basis.
2019 Acquisition
YourCause
On January 2, 2019, we acquired all of the outstanding equity securities, including all voting equity interests, of YourCause Holdings, LLC, a Delaware limited liability company ("YourCause"), pursuant to a purchase agreement and plan of merger. The acquisition expanded our footprint in corporate social responsibility and employee engagement and enhanced our position as a leader in providing solutions to both nonprofit organizations and for-profit companies committed to addressing social issues. We acquired the equity securities for an aggregate purchase price of $157.7 million in cash, net of closing adjustments. The purchase price and related expenses were funded primarily through borrowings under the 2017 Credit Facility (as defined below). As a result of the acquisition, YourCause became a wholly owned subsidiary of ours. We finalized the purchase price allocation of YourCause, including the valuation of assets acquired and liabilities assumed, during the fourth quarter of 2019. All measurement period adjustments were insignificant. In accordance with applicable accounting rules, we determined that the impact of this acquisition was not material to our consolidated financial statements; therefore, revenue and earnings since the acquisition date and pro forma information are not required or presented.
| | |
| 4. Goodwill and Other Intangible Assets |
The change in our goodwill during 2021 consisted of the following:
| | | | | |
| (dollars in thousands) | Total |
| Balance at December 31, 2020 | $ | 635,854 | |
| Additions related to current year business combinations | 422,846 | |
| |
| Effect of foreign currency translation | (60) | |
| Balance at December 31, 2021 | $ | 1,058,640 | |
Blackbaud, Inc.
Notes to Consolidated Financial Statements
We have recorded intangible assets acquired in various business combinations based on their fair values at the date of acquisition. The table below sets forth the balances of each class of intangible asset and related amortization as of:
| | | | | | | | |
| December 31, |
| (dollars in thousands) | 2021 | 2020 |
| Finite-lived gross carrying amount | | |
| Customer relationships | $ | 606,409 | | $ | 287,116 | |
| Marketing assets | 74,731 | | 34,642 | |
| Developed technology | 211,552 | | 232,339 | |
| Content | 17,900 | | — | |
| | |
| | |
| Total finite-lived gross carrying amount | 910,592 | | 554,097 | |
| Accumulated amortization | | |
| Customer relationships | (151,258) | | (138,635) | |
| Marketing assets | (7,269) | | (5,918) | |
| Developed technology | (54,013) | | (132,038) | |
| Content | — | | — | |
| | |
| | |
| Total accumulated amortization | (212,540) | | (276,591) | |
| | |
| | |
| Intangible assets, net | $ | 698,052 | | $ | 277,506 | |
During the year ended December 31, 2021, changes to the gross carrying amounts of intangible asset classes were primarily related to our acquisition of EVERFI as described in Note 3 to these consolidated financial statements, write-offs of fully amortized intangible assets and the effect of foreign currency translation.
During the year ended December 31, 2019, we recorded an impairment charge of $0.9 million against an acquired marketing asset that reduced the carrying value of the asset to zero. The impairment charge resulted from our decision during the year to rebrand the solution to which the asset related. This impairment charge was recorded as amortization on our consolidated statements of comprehensive income.
Amortization expense
Amortization expense related to finite-lived intangible assets acquired in business combinations is allocated to cost of revenue on the consolidated statements of comprehensive income based on the revenue stream to which the asset contributes, except for marketing assets and non-compete agreements, for which the associated amortization expense is included in operating expenses.
The following table summarizes amortization expense of our finite-lived intangible assets:
| | | | | | | | | | | |
| Years ended December 31, |
| (dollars in thousands) | 2021 | 2020 | 2019 |
| Included in cost of revenue: | | | |
| Cost of recurring | $ | 33,132 | | $ | 36,835 | | $ | 42,565 | |
| Cost of one-time services and other | 1,680 | | 2,133 | | 2,204 | |
| Total included in cost of revenue | 34,812 | | 38,968 | | 44,769 | |
| Included in operating expenses | 2,227 | | 2,915 | | 5,316 | |
| Total amortization of intangibles from business combinations | $ | 37,039 | | $ | 41,883 | | $ | 50,085 | |
Blackbaud, Inc.
Notes to Consolidated Financial Statements
The following table outlines the estimated future amortization expense for each of the next five years for our finite-lived intangible assets as of December 31, 2021:
| | | | | |
Years ending December 31,
(dollars in thousands) | Amortization
expense |
| 2022 | 52,677 | |
| 2023 | 57,371 | |
| 2024 | 63,110 | |
| 2025 | 66,832 | |
| 2026 | 65,545 | |
| Total | $ | 305,535 | |
The following table sets forth the computation of basic and diluted earnings per share:
| | | | | | | | | | | |
| | Years ended December 31, |
| (dollars in thousands, except per share amounts) | 2021 | 2020 | 2019 |
| Numerator: | | | |
| Net income | $ | 5,698 | | $ | 7,717 | | $ | 11,908 | |
| Denominator: | | | |
| Weighted average common shares | 47,412,306 | | 48,184,714 | | 47,695,383 | |
| Add effect of dilutive securities: | | | |
| Stock-based awards | 818,132 | | 511,627 | | 616,888 | |
| Weighted average common shares assuming dilution | 48,230,438 | | 48,696,341 | | 48,312,271 | |
| Earnings per share: | | | |
| Basic | $ | 0.12 | | $ | 0.16 | | $ | 0.25 | |
| Diluted | $ | 0.12 | | $ | 0.16 | | $ | 0.25 | |
| | | |
| Anti-dilutive shares excluded from calculations of diluted earnings per share | 974,110 | | 956,303 | | 241,336 | |
Blackbaud, Inc.
Notes to Consolidated Financial Statements
| | |
| 6. Fair Value Measurements |
Recurring fair value measurements
Assets and liabilities that are measured at fair value on a recurring basis consisted of the following, as of the dates indicated below:
| | | | | | | | | | | | | | | | | | | | | | | |
| Fair value measurement using | | |
| (dollars in thousands) | Level 1 | | Level 2 | | Level 3 | | Total |
| Fair value as of December 31, 2021 | | | | | | | |
| Financial assets: | | | | | | | |
| Derivative instruments | $ | — | | | $ | 7,160 | | | $ | — | | | $ | 7,160 | |
| Total financial assets | $ | — | | | $ | 7,160 | | | $ | — | | | $ | 7,160 | |
| | | | | | | |
| | | | | | | |
| | | | | | | |
| | | | | | | |
| | | | | | | |
| | | | | | | |
| | | | | | | |
| | | | | | | |
| | | | | | | |
| | | | | | | |
| | | | | | | |
| Fair value as of December 31, 2020 | | | | | | | |
| Financial liabilities: | | | | | | | |
| Derivative instruments | $ | — | | | $ | 4,159 | | | $ | — | | | $ | 4,159 | |
| Total financial liabilities | $ | — | | | $ | 4,159 | | | $ | — | | | $ | 4,159 | |
Our derivative instruments within the scope of Accounting Standards Codification ("ASC") 815, Derivatives and Hedging, are required to be recorded at fair value. Our derivative instruments that are recorded at fair value include interest rate swaps.
The fair value of our interest rate swaps was based on model-driven valuations using LIBOR rates, which are observable at commonly quoted intervals. Accordingly, our interest rate swaps are classified within Level 2 of the fair value hierarchy. The Financial Conduct Authority in the U.K. has stated that it plans to phase out all tenors of LIBOR by June 2023. We do not currently anticipate a significant impact to our financial position or results of operations as a result of this action as we expect that our financial contracts currently indexed to LIBOR will either expire or be modified without significant financial impact before the phase out occurs.
We believe the carrying amounts of our cash and cash equivalents, restricted cash, accounts receivable, trade accounts payable, accrued expenses and other current liabilities and due to customers approximate their fair values at December 31, 2021 and December 31, 2020, due to the immediate or short-term maturity of these instruments.
We believe the carrying amount of our debt approximates its fair value at December 31, 2021 and December 31, 2020, as the debt bears interest rates that approximate market value. As LIBOR rates are observable at commonly quoted intervals, our debt under the 2020 Credit Facility (as defined below) is classified within Level 2 of the fair value hierarchy. Our fixed rate debt is classified within Level 2 of the fair value hierarchy.
We did not transfer any assets or liabilities among the levels within the fair value hierarchy during the years ended December 31, 2021, 2020 and 2019. Additionally, we did not hold any Level 3 assets or liabilities during the years ended December 31, 2021, 2020 and 2019.
Blackbaud, Inc.
Notes to Consolidated Financial Statements
Non-recurring fair value measurements
Assets and liabilities that are measured at fair value on a non-recurring basis include long-lived assets, intangible assets, goodwill and operating lease ROU assets. These assets are recognized at fair value during the period in which an acquisition is completed or at lease commencement, from updated estimates and assumptions during the measurement period, or when they are considered to be impaired. These non-recurring fair value measurements, primarily for long-lived assets, intangible assets acquired and operating lease ROU assets, are based on Level 3 unobservable inputs. In the event of an impairment, we determine the fair value of these assets other than goodwill using a discounted cash flow approach, which contains significant unobservable inputs and, therefore, is considered a Level 3 fair value measurement. The unobservable inputs in the analysis generally include future cash flow projections and a discount rate. For goodwill impairment testing, we estimate fair value using market-based methods including the use of market capitalization and consideration of a control premium.
As more fully described in Note 7 and Note 11 to these consolidated financial statements, during the year ended December 31, 2021, we recorded impairment charges of $1.7 million against certain property and equipment assets and $3.6 million against our operating lease ROU assets.
During the year ended December 31, 2020, we recorded impairment charges of $4.3 million against certain previously capitalized software development costs and $4.0 million against our operating lease ROU assets. See Notes 7 and 11, respectively, to these consolidated financial statements for additional details.
During the year ended December 31, 2019, we recorded impairment charges of $3.8 million against our operating lease ROU assets, $1.4 million against certain property and equipment assets and $0.9 million against certain finite-lived intangible assets. See Notes 11, 7 and 4, respectively, to these consolidated financial statements for additional details.
There were no other non-recurring fair value adjustments during 2021, 2020 and 2019 except for certain business combination accounting adjustments to the initial fair value estimates of the assets acquired and liabilities assumed at the acquisition date from updated estimates and assumptions during the measurement period. See Note 3 to these consolidated financial statements for additional details.
| | |
| 7. Property and Equipment and Software Development Costs |
Property and equipment
Property and equipment consisted of the following as of:
| | | | | | | | | | | |
| Estimated
useful life
(years) | December 31, |
| (dollars in thousands) | 2021 | 2020 |
| Land | — | | $ | 9,548 | | $ | 9,548 | |
| Building | 39 | 61,284 | | 61,284 | |
Building improvements(1) | 7 - 20 | 10,874 | | 9,942 | |
| Equipment | 1 - 5 | 2,320 | | 2,865 | |
| Computer hardware | 1 - 5 | 47,768 | | 56,202 | |
| Computer software | 1 - 5 | 21,347 | | 23,116 | |
| Construction in progress | — | | 2,135 | | 3,435 | |
| Furniture and fixtures | 1 - 7 | 2,658 | | 2,796 | |
| Leasehold improvements | Lesser of lease term or estimated useful life | 12,086 | | 6,044 | |
| Total property and equipment | | 170,020 | | 175,232 | |
| Less: accumulated depreciation | | (58,592) | | (70,055) | |
| Property and equipment, net | | $ | 111,428 | | $ | 105,177 | |
(1)Upon acquisition of our global headquarters facility in August 2020, we reclassified related leasehold improvement costs of $5.5 million to building improvements given the acquisition of the underlying assets.
Blackbaud, Inc.
Notes to Consolidated Financial Statements
Depreciation expense was $14.4 million, $19.2 million and $15.0 million for the years ended December 31, 2021, 2020 and 2019, respectively.
During the year ended December 31, 2021, we recorded impairment charges of $1.7 million against certain property and equipment assets. These impairment charges resulted primarily from our decision to close our Austin office. This impairment charge is reflected in general and administrative expense on the statements of comprehensive income.
During the year ended December 31, 2019, we recorded impairment charges of $1.4 million against certain property and equipment assets that reduced the carrying value of the assets to zero. These impairment charges are reflected in restructuring on the statements of comprehensive income and resulted primarily from our facilities optimization restructuring as we wrote-off facilities-related fixed assets that we would no longer use. See Note 18 to these consolidated financial statements for additional details regarding our facilities optimization restructuring.
Software development costs
Software development costs consisted of the following as of:
| | | | | | | | | | | |
| Estimated
useful life
(years) | December 31, |
| (dollars in thousands) | 2021 | 2020 |
| Software development costs | 3 - 7 | $ | 196,337 | | $ | 164,665 | |
| Less: accumulated amortization | | (74,960) | | (52,838) | |
| Software development costs, net | | $ | 121,377 | | $ | 111,827 | |
During the year ended December 31, 2020, we recorded an impairment charge of $4.3 million against certain previously capitalized software development costs that reduced the carrying value of those assets to zero. The impairment charge was reflected in cost of recurring revenue and resulted primarily from our decision to accelerate the end of customer support for certain solutions. Other changes to the gross carrying amount of software development costs were primarily related to qualifying costs associated with development activities that are required to be capitalized under the internal-use software accounting guidance such as those for our cloud solutions, write-offs of fully amortized assets, and the effect of foreign currency translation.
Amortization expense related to software development costs was $31.0 million, $31.7 million and $20.7 million for the years ended December 31, 2021, 2020 and 2019, respectively, and is included primarily in cost of recurring.
| | |
| 8. Consolidated Financial Statement Details |
Restricted cash
| | | | | | | | |
| (dollars in thousands) | December 31,
2021 | December 31,
2020 |
| Restricted cash due to customers | $ | 593,296 | | $ | 607,943 | |
| Letters of credit for operating leases | 2,256 | | — | |
| Real estate escrow balances | 1,064 | | 1,276 | |
| Total restricted cash | $ | 596,616 | | $ | 609,219 | |
Blackbaud, Inc.
Notes to Consolidated Financial Statements
Prepaid expenses and other assets
| | | | | | | | |
| (dollars in thousands) | December 31,
2021 | December 31,
2020 |
Costs of obtaining contracts(1)(2) | $ | 78,465 | | $ | 84,914 | |
Prepaid software maintenance and subscriptions(3) | 28,880 | | 24,471 | |
Receivables for probable insurance recoveries(4) | 18,202 | | 6,288 | |
Implementation costs for cloud computing arrangements, net(5)(6) | 11,892 | | 11,298 | |
| Derivative instruments | 7,160 | | — | |
| Unbilled accounts receivable | 5,443 | | 10,385 | |
| Prepaid insurance | 5,363 | | 1,426 | |
| Taxes, prepaid and receivable | 3,986 | | 1,891 | |
| Deferred tax assets | 1,546 | | 1,592 | |
| Other assets | 11,835 | | 8,740 | |
| Total prepaid expenses and other assets | 172,772 | | 151,005 | |
| Less: Long-term portion | 77,266 | | 72,639 | |
| Prepaid expenses and other current assets | $ | 95,506 | | $ | 78,366 | |
(1)Amortization expense from costs of obtaining contracts was $35.5 million, $37.4 million and $38.1 million for the years ended December 31, 2021, 2020 and 2019, respectively, and is included in sales, marketing and customer success expense in our consolidated statements of comprehensive income.
(2)The current portion of costs of obtaining contracts as of December 31, 2021 and 2020 was $30.2 million and $31.9 million, respectively.
(3)The current portion of prepaid software maintenance and subscriptions as of December 31, 2021 and December 31, 2020 was $24.7 million and $19.8 million, respectively.
(4)See discussion of the Security Incident at Note 11 to these consolidated financial statements.
(5)These costs primarily relate to the multi-year implementations of our new global enterprise resource planning and customer relationship management systems.
(6)Amortization expense from capitalized cloud computing implementation costs was $1.9 million, $0.8 million and insignificant for the years ended December 31, 2021, 2020 and 2019, respectively. Accumulated amortization for these costs was $3.0 million and $1.1 million as of December 31, 2021 and 2020, respectively.
Accrued expenses and other liabilities
| | | | | | | | |
| (dollars in thousands) | December 31,
2021 | December 31,
2020 |
Taxes payable(1) | $ | 19,777 | | $ | 19,577 | |
Amounts payable to former EVERFI option holders(2) | 17,404 | | — | |
Accrued legal costs(3) | 11,724 | | 4,808 | |
| Operating lease liabilities, current portion | 9,170 | | 9,359 | |
| Customer credit balances | 8,403 | | 5,874 | |
| Accrued commissions and salaries | 7,872 | | 5,010 | |
| Accrued bonuses | 5,829 | | — | |
| Accrued transaction-based costs related to payments services | 5,427 | | — | |
| Accrued health care costs | 3,042 | | 2,341 | |
| Accrued vacation costs | 2,234 | | 2,311 | |
| Unrecognized tax benefit | 1,248 | | 3,351 | |
| Derivative instruments | — | | 4,159 | |
| Other liabilities | 9,310 | | 6,304 | |
| Total accrued expenses and other liabilities | 101,440 | | 63,094 | |
| Less: Long-term portion | 1,344 | | 10,866 | |
| Accrued expenses and other current liabilities | $ | 100,096 | | $ | 52,228 | |
(1)We deferred payments of the employer's portion of Social Security taxes during 2020 under the Coronavirus, Aid, Relief and Economic Security Act ("CARES Act"), half of which was due by the end of calendar year 2021 with the remainder due by the end of calendar year 2022.
Blackbaud, Inc.
Notes to Consolidated Financial Statements
(2)Represents amounts not yet paid by EVERFI to its former option holders as of December 31, 2021, solely due to the timing of the acquisition on the last day of 2021. See Note 3 to these consolidated financial statements for additional information regarding our acquisition of EVERFI.
(3)All accrued legal costs are classified as current. The increase in accrued legal costs from December 31, 2020 was primarily due to the Security Incident. See Note 11 to these consolidated financial statements.
Deferred revenue
| | | | | | | | |
| (dollars in thousands) | December 31,
2021 | December 31,
2020 |
| Recurring | $ | 360,890 | | $ | 303,840 | |
| One-time services and other | 17,856 | | 13,074 | |
| Total deferred revenue | 378,746 | | 316,914 | |
| Less: Long-term portion | 4,247 | | 4,678 | |
| Deferred revenue, current portion | $ | 374,499 | | $ | 312,236 | |
Other income, net
| | | | | | | | | | | |
| Years ended December 31, |
| (dollars in thousands) | 2021 | 2020 | 2019 |
| Interest income | $ | 392 | | $ | 1,660 | | $ | 2,802 | |
| Other (expense) income, net | (212) | | (2) | | 1,256 | |
| Other income, net | $ | 180 | | $ | 1,658 | | $ | 4,058 | |
The following table summarizes our debt balances and the related weighted average effective interest rates, which includes the effect of interest rate swap agreements.
| | | | | | | | | | | | | | | | | |
| Debt balance at | | Weighted average
effective interest rate at |
| (dollars in thousands) | December 31,
2021 | December 31,
2020 | | December 31,
2021 | December 31,
2020 |
| Credit facility: | | | | | |
| Revolving credit loans | $ | 260,000 | | $ | 69,625 | | | 3.27 | % | 1.83 | % |
| Term loans | 640,000 | | 400,000 | | | 3.02 | % | 3.12 | % |
| Real estate loans | 59,480 | | 60,626 | | | 5.22 | % | 5.22 | % |
| Other debt | 1,694 | | 3,926 | | | 5.00 | % | 5.00 | % |
| Total debt | 961,174 | | 534,177 | | | 3.23 | % | 3.21 | % |
| Less: Unamortized discount and debt issuance costs | 4,994 | | 3,144 | | | | |
| Less: Debt, current portion | 18,697 | | 12,840 | | | 3.11 | % | 2.61 | % |
| Debt, net of current portion | $ | 937,483 | | $ | 518,193 | | | 3.23 | % | 3.22 | % |
2020 refinancing
We were previously party to a 5-year $700.0 million credit facility entered into during June 2017. The credit facility included: a dollar and a designated currency revolving credit facility with sublimits for letters of credit, swingline loans and multicurrency borrowings (the “2017 Revolving Facility”) and a term loan (the “2017 Term Loan”) together, (the “2017 Credit Facility”).
Blackbaud, Inc.
Notes to Consolidated Financial Statements
In October 2020, we entered into a 5-year $900.0 million Amended and Restated Credit Agreement (the “2020 Credit Facility”). The 2020 Credit Facility matures in October 2025 and replaced the 2017 Credit Facility by amending and restating it to include a $500.0 million revolving credit facility (the “2020 Revolving Facility”) and a $400.0 million term loan facility (the “2020 Term Loan”). Upon closing, we borrowed $400.0 million pursuant to the 2020 Term Loan and used the proceeds to repay the outstanding principal balance of the term loan under the 2017 Credit Facility, and repay $124.4 million of outstanding revolving credit loans under the 2017 Revolving Facility.
In connection with the amendment and restatement of the 2017 Credit Facility, the existing Pledge Agreement dated June 2, 2017, by us in favor of Bank of America, N.A., as administrative agent, was likewise amended and restated.
Certain lenders of the 2020 Term Loan participated in the 2017 Term Loan and the change in present value of our future cash flows to these lenders under the 2017 Term Loan and under the 2020 Term Loan was less than 10%. Accordingly, we accounted for the refinancing event as a debt modification. Certain lenders of the 2017 Term Loan did not participate in the 2020 Term Loan. Accordingly, we accounted for the refinancing event for these lenders as a debt extinguishment. Certain lenders of the 2017 Revolving Facility participated in the 2020 Revolving Facility and provided increased borrowing capacities. Accordingly, we accounted for the refinancing event for these lenders as a debt modification. Certain lenders of the 2017 Revolving Facility did not participate in the 2020 Revolving Facility. Accordingly, we accounted for the refinancing event for these lenders as a debt extinguishment.
We recorded an insignificant loss on debt extinguishment related to the write-off of debt discount and deferred financing costs for the portions of the 2017 Credit Facility considered to be extinguished. This loss was recognized in the consolidated statements of comprehensive income within other income, net.
Summary of the 2020 Credit Facility
The 2020 Revolving Facility includes (i) a $50.0 million sublimit available for the issuance of standby letters of credit, (ii) a $50.0 million sublimit available for swingline loans, and (iii) a $100.0 million sublimit available for multicurrency borrowings.
Our obligations under the 2020 Credit Facility are secured by the stock and limited liability company interests of certain of our direct subsidiaries and any of our material domestic subsidiaries, if any, and the proceeds therefrom pledged pursuant to an Amended and Restated Pledge Agreement dated as of October 30, 2020, by us in favor of Bank of America, N.A., as administrative agent, for the ratable benefit of itself and the secured parties referred to therein.
Dollar tranche loans under the 2020 Revolving Facility and 2020 Term Loan bear interest at a rate per annum equal to (a) a base rate equal to the highest of (i) the Federal Funds Rate plus 0.50%, (ii) the prime rate announced by Bank of America, N.A., and (iii) the Eurocurrency Rate (which varies depending on the currency in which the loan is denominated) plus 1.00% (the “Base Rate”), plus (b) an applicable margin as specified in the 2020 Credit Facility (the “Applicable Margin”). Each Eurocurrency Rate Loan under the 2020 Credit Facility shall bear interest at a rate per annum equal to the Eurocurrency Rate, plus the Applicable Margin. The Applicable Margin shall be adjusted quarterly, varies based on our net leverage ratio and varies based on whether the loan is a Base Rate Loan (0.375% to 1.125%) or a Eurocurrency Rate Loan (1.375% to 2.125%).
We also pay a quarterly commitment fee on the unused portion of the 2020 Revolving Facility from 0.250% to 0.375% per annum, depending on our net leverage ratio. At December 31, 2021, the commitment fee was 0.25%.
The term loan under the 2020 Credit Facility requires periodic principal payments. The balance of the term loan and any amounts drawn on the revolving credit loans are due upon maturity of the 2020 Credit Facility in October 2025. We evaluate the classification of our debt as current or non-current based on the required annual maturities of the 2020 Credit Facility. We may prepay the 2020 Credit Facility in whole or in part at any time without premium or penalty, other than customary breakage costs with respect to certain types of loans.
The 2020 Credit Facility contains various representations, warranties and affirmative, negative and financial covenants customary for financings of this type. Financial covenants include a net leverage ratio and an interest coverage ratio. At December 31, 2021, we were in compliance with our debt covenants under the 2020 Credit Facility.
Blackbaud, Inc.
Notes to Consolidated Financial Statements
Under the terms of the 2020 Credit Facility, we are entitled on one or more occasions, subject to the satisfaction of certain conditions, to request an increase in the commitments under the Revolving Credit Facility and/or request additional incremental term loans in the aggregate principal amount of up to $250.0 million plus an amount, if any, such that the net leverage ratio shall be no greater than 3.25 to 1.00. At December 31, 2021, our available borrowing capacity under the 2020 Credit Facility was $239.5 million.
First incremental term loan
In December 2021, we entered into the First Incremental Term Loan Agreement (the "Incremental Amendment"). The Incremental Amendment amends the 2020 Credit Facility and, among other things, provides for a $250.0 million incremental term loan (the “2021 Incremental Term Loan”).
The 2021 Incremental Term Loan bears interest at a rate per annum equal to, at the option of the Company: (a) a base rate equal to the highest of (i) the Federal Funds Rate plus 0.50%, (ii) the prime rate announced by Bank of America, N.A., and (iii) the Daily SOFR rate plus 1.00% (the “Base Rate”), plus an applicable margin as specified in the Incremental Amendment (the “Applicable Margin”); (b) the Daily SOFR rate plus a SOFR adjustment rate as specified in the Incremental Amendment (the “SOFR Adjustment”) plus the Applicable Margin; or (c) the Term SOFR rate plus the SOFR Adjustment plus the Applicable Margin. The Applicable Margin shall be adjusted quarterly, varies based on our net leverage ratio and varies based on whether the loan is a Base Rate loan (0.375% to 1.50%) or a SOFR Rate loan (1.375% to 2.50%). The SOFR Adjustment varies based on the applicable interest period and equals 0.10% for Daily SOFR loans and for Term SOFR loans with a one-month interest period, 0.15% for Term SOFR loans with a three-month interest period and 0.25% for Term SOFR loans with a six-month interest period. The 2021 Incremental Term Loan matures in October 2025, which is the maturity date of the existing term loan under the 2020 Credit Facility, and is otherwise subject to substantially the same terms and conditions as the existing term loan under the 2020 Credit Facility.
Financing costs
In connection with our entry into the 2020 Credit Facility, we paid $4.0 million in financing costs, of which $1.2 million were capitalized in other assets and, together with a portion of the unamortized deferred financing costs from the 2017 Credit Facility and prior facilities, are being amortized into interest expense over the term of the new facility. We recorded aggregate financing costs of $2.0 million as a direct deduction from the carrying amount of our debt liability, which related to debt discount (fees paid to lenders) and debt issuance costs for the 2020 Term Loan.
In connection with our entry into the 2021 Incremental Term Loan, we paid $3.1 million in financing costs which were recorded as a direct deduction from the carrying amount of our debt liability.
As of December 31, 2021, deferred financing costs totaling $1.2 million were included in other assets on our consolidated balance sheets.
Financing for EVERFI acquisition
On December 31, 2021, we acquired EVERFI for approximately $440.1 million in cash consideration and 3,844,423 shares of the company's common stock, valued at approximately $303.6 million, for an aggregate purchase price of approximately $743.8 million, subject to closing adjustments. We financed the cash consideration and related expenses through cash on hand and new borrowings under the 2020 Credit Facility, including $250.0 million under the First Incremental Term Loan (as defined above).
Blackbaud, Inc.
Notes to Consolidated Financial Statements
Real estate loans
In August 2020, we completed the purchase of our global headquarters facility. As part of the purchase price, we assumed the Seller’s obligations under (i) a 5.12% Senior Secured Note, Series A1, in the outstanding principal amount of $49.1 million, dated May 2, 2018, and (ii) a 5.61% Senior Secured Note, Series A2, in the outstanding principal amount of $12.0 million, dated May 2, 2018, or an aggregate outstanding principal amount of $61.1 million (collectively, the “Real Estate Loans”). The Series A1 Note provides that we will pay the remaining principal amount due thereunder together with interest thereon at the rate indicated above, in monthly installments until it matures in April 2038. The Series A2 Note provides that we pay interest only in monthly installments at the rate indicated above with the principal amount due at maturity in April 2038. The Real Estate Loans are secured by a first priority lien on the real property constituting the global headquarters facility. Our assumption of the Real Estate Loans was a noncash investing and financing transaction and is reflected in our supplemental disclosure of cash flow information. At December 31, 2021, we were in compliance with our debt covenants under the Real Estate Loans.
Other debt
From time to time, we enter into third-party financing agreements for purchases of software and related services for our internal use. Generally, the agreements are non-interest-bearing notes requiring annual payments. Interest associated with the notes is imputed at the rate we would incur for amounts borrowed under our then-existing credit facility at the inception of the notes.
The following table summarizes our currently effective financing agreements as of December 31, 2021:
| | | | | | | | | | | | | | |
| (dollars in thousands) | Term
in Months | Number of
Annual Payments | First Annual
Payment Due | Original Loan
Value |
| Effective dates of agreements: | | | | |
| December 2019 | 51 | 4 | | January 2020 | $ | 2,150 | |
| January 2020 | 39 | 3 | | March 2020 | 3,470 | |
| | | | |
As of December 31, 2021, the required annual maturities related to the 2020 Credit Facility, the Real Estate Loans and our other debt were as follows:
| | | | | |
Years ending December 31,
(dollars in thousands) | Annual
maturities |
| 2022 | $ | 18,697 | |
| 2023 | 18,232 | |
| 2024 | 17,859 | |
| 2025 | 853,034 | |
| 2026 | 1,969 | |
| Thereafter | 51,383 | |
| Total required maturities | $ | 961,174 | |
| | |
| 10. Derivative Instruments |
Cash flow hedges
We generally use derivative instruments to manage our variable interest rate risk. We have entered into interest rate swap agreements, which effectively convert portions of our variable rate debt under the 2020 Credit Facility to a fixed rate for the term of the swap agreements. We designated each of the interest rate swap agreements as a cash flow hedge at the inception of the contracts.
Blackbaud, Inc.
Notes to Consolidated Financial Statements
The terms and notional values of our derivative instruments were as follows as of December 31, 2021:
| | | | | | | | |
| (dollars in thousands) | Term of derivative instrument | Notional
value |
| Derivative instruments designated as hedging instruments: | | |
| Interest rate swap | November 2020 - October 2024 | $ | 60,000 | |
| Interest rate swap | November 2020 - October 2024 | 60,000 | |
| Interest rate swap | June 2021 - October 2024 | 120,000 | |
| Interest rate swap | July 2021 - October 2024 | 120,000 | |
| Interest rate swap | July 2021 - October 2024 | 75,000 | |
| | $ | 435,000 | |
The fair values of our derivative instruments were as follows as of:
| | | | | | | | | | | | | | | | | | | | | | | |
| | Asset Derivatives | | | Liability Derivatives |
| (dollars in thousands) | Balance sheet location | December 31,
2021 | December 31,
2020 | | Balance sheet location | December 31,
2021 | December 31,
2020 |
| Derivative instruments designated as hedging instruments: | | | | | | | |
| Interest rate swaps, current portion | Prepaid expenses
and other current assets | $ | — | | $ | — | | | Accrued expenses
and other current liabilities | $ | — | | $ | 2,698 | |
Interest rate swaps, long-term portion | Other assets | 7,160 | | — | | | Other liabilities | — | | 1,461 | |
| Total derivative instruments designated as hedging instruments | | $ | 7,160 | | $ | — | | | | $ | — | | $ | 4,159 | |
| | | | | | | |
| | | | | | | |
| | | | | | | |
| | | | | | | |
| | | | | | | |
| | | | | | | |
The effects of derivative instruments in cash flow hedging relationships were as follows:
| | | | | | | | | | | |
| Gain (loss) recognized
in accumulated other
comprehensive
loss as of | Location
of gain (loss)
reclassified from
accumulated other
comprehensive
loss into income | Gain (loss) reclassified from accumulated
other comprehensive loss into income |
| (dollars in thousands) | December 31,
2021 | Year ended
December 31, 2021 |
| Interest rate swaps | $ | 7,160 | | Interest expense | $ | (3,714) | |
| | | |
| December 31,
2020 | | Year ended
December 31, 2020 |
| Interest rate swaps | $ | (4,159) | | Interest expense | $ | (3,827) | |
| | | |
| December 31,
2019 | | Year ended
December 31, 2019 |
| Interest rate swaps | $ | (1,757) | | Interest expense | $ | 573 | |
Blackbaud, Inc.
Notes to Consolidated Financial Statements
Our policy requires that derivatives used for hedging purposes be designated and effective as a hedge of the identified risk exposure at the inception of the contract. Accumulated other comprehensive income (loss) includes unrealized gains or losses from the change in fair value measurement of our derivative instruments each reporting period and the related income tax expense or benefit. Changes in the fair value measurements of the derivative instruments and the related income tax expense or benefit are reflected as adjustments to accumulated other comprehensive income (loss) until the actual hedged expense is incurred or until the hedge is terminated at which point the unrealized gain (loss) is reclassified from accumulated other comprehensive income (loss) to current earnings. The estimated accumulated other comprehensive income as of December 31, 2021 that is expected to be reclassified into earnings within the next twelve months is insignificant. There were no ineffective portions of our interest rate swap derivatives during the years ended December 31, 2021, 2020 and 2019. See Note 14 to these consolidated financial statements for a summary of the changes in accumulated other comprehensive income (loss) by component.
We did not have any undesignated derivative instruments during 2021, 2020 and 2019.
| | |
| 11. Commitments and Contingencies |
Leases
We have operating leases for corporate offices, subleased offices and certain equipment and furniture. In August 2020, we completed the purchase of our global headquarters facility that we previously leased. As of December 31, 2021, we did not have any operating leases that had not yet commenced.
With the acquisition of EVERFI, we assumed a lease for office space in Washington, D.C. At December 31, 2021, we had a standby letter of credit of $2.1 million for a security deposit for this lease.
The following table summarizes the components of our lease expense:
| | | | | | | | | | | |
| Year ended
December 31, |
| (dollars in thousands) | 2021 | 2020 | 2019 |
Operating lease cost(1) | $ | 9,636 | | $ | 41,210 | | $ | 27,519 | |
| Variable lease cost | 2,478 | | 4,266 | | 4,035 | |
| Sublease income | (1,516) | | (3,120) | | (3,189) | |
| Net lease cost | $ | 10,598 | | $ | 42,356 | | $ | 28,365 | |
(1)Includes short-term lease costs, which were immaterial.
In October 2021, we made the decision to permanently close our fixed office locations (with the exception of our global headquarters facility in Charleston, South Carolina), effective in December 2021. This change was intended to align our real estate footprint with our transition to a remote-first workforce. We enter into arrangements for smaller more flexible workspaces where necessary. As a result, during the twelve months ended December 31, 2021, we reduced the estimated useful lives of our operating lease ROU assets for certain of our office locations we expected to exit. We recorded $5.3 million in incremental operating lease costs during 2021 related to this change in accounting estimate. For these same office locations, we also reduced the estimated useful lives of certain facilities-related fixed assets, which resulted in incremental depreciation expense of $1.7 million during 2021 (see Note 7 to these consolidated financial statements). During the twelve months ended December 31, 2021, we also recorded $3.6 million in impairments of operating lease ROU assets associated with certain leased office spaces we have ceased using as a result of our adjusted workforce strategy. These impairment charges are reflected in general and administrative expense.
During the twelve months ended December 31, 2020, we reduced the estimated useful lives of our operating lease ROU assets for certain of our office locations we expected to exit. We recorded $16.2 million in incremental operating lease costs during 2020 related to this change in accounting estimate, which accounts for a substantial portion of the increase in operating lease costs during 2020. For these same office locations, we also reduced the estimated useful lives of certain facilities-related fixed assets, which resulted in incremental depreciation expense of $4.6 million during 2020 (see Note 7 to these consolidated financial statements). During the twelve months ended December 31, 2020, we also recorded $4.0 million in impairments of operating lease ROU assets associated with certain leased office spaces we ceased using. These impairment charges are reflected in general and administrative expense.
Blackbaud, Inc.
Notes to Consolidated Financial Statements
During the twelve months ended December 31, 2019, we recorded $3.8 million in impairments of operating lease ROU assets associated with certain leased office spaces we ceased using as part of our facilities optimization restructuring. These impairments, which were based on our estimates about our inability to sublease the office spaces, were recorded as restructuring expense on our consolidated statements of comprehensive income. See Note 18 to these consolidated financial statements for additional details regarding our facilities optimization restructuring.
Maturities of our operating lease liabilities as of December 31, 2021 were as follows:
| | | | | |
Years ending December 31,
(dollars in thousands) | Operating leases |
| 2022 | 11,706 | |
| 2023 | 10,328 | |
| 2024 | 7,886 | |
| 2025 | 6,805 | |
| 2026 | 6,109 | |
| Thereafter | 32,997 | |
| Total lease payments | 75,831 | |
| Less: Amount representing interest | 13,275 | |
| Present value of future payments | $ | 62,556 | |
Our ROU assets and lease liabilities are included in the following line items in our consolidated balance sheet:
| | | | | | | | |
| (dollars in thousands) | December 31,
2021 | December 31,
2020 |
| Operating leases | | |
Operating lease ROU assets | $ | 53,883 | | $ | 22,671 | |
| | |
| Accrued expenses and other current liabilities | $ | 9,170 | | $ | 9,359 | |
| Operating lease liabilities, net of current portion | 53,386 | | 17,357 | |
| Total operating lease liabilities | $ | 62,556 | | $ | 26,716 | |
The increase in operating lease ROU assets and operating lease liabilities during 2021 was primarily due to leases for office space we assumed with our acquisition of EVERFI. See Note 3 to these consolidated financial statements for details.
The weighted average remaining lease terms and discount rates were as follows:
| | | | | | | | | | | |
| (dollars in thousands) | December 31,
2021 | December 31,
2020 | December 31,
2019 |
| Operating leases | | | |
| Weighted average remaining lease term (years) | 8.9 | 4.6 | 12.5 |
| Weighted average discount rate | 4.68 | % | 5.70 | % | 5.96 | % |
Supplemental cash flow information related to leases was as follows:
| | | | | | | | | | | |
| Year ended
December 31, |
| (dollars in thousands) | 2021 | 2020 | 2019 |
| Cash paid for amounts included in the measurement of lease liabilities: | | | |
Operating cash flows from operating leases(1) | $ | 11,338 | | $ | 26,713 | | $ | 24,569 | |
| Right-of-use assets obtained in exchange for lease obligations (non-cash): | | | |
| Operating leases | 5,358 | | 11,002 | | 102,245 | |
(1)The 2020 amount was revised to correct an immaterial disclosure error in the previously filed consolidated financial statements.
Blackbaud, Inc.
Notes to Consolidated Financial Statements
Other commitments
The term loans under the 2020 Credit Facility require periodic principal payments. The balance of the term loans and any amounts drawn on the revolving credit loans are due upon maturity of the 2020 Credit Facility in October 2025. The Real Estate Loans also require periodic principal payments and the balance of the Real Estate Loans are due upon maturity in April 2038.
We have contractual obligations for third-party technology used in our solutions and for other services we purchase as part of our normal operations. In certain cases, these arrangements require a minimum annual purchase commitment by us. As of December 31, 2021, the remaining aggregate minimum purchase commitment under these arrangements was approximately $33.6 million through 2025.
Solution and service indemnifications
In the ordinary course of business, we provide certain indemnifications of varying scope to customers against claims of intellectual property infringement made by third parties arising from the use of our solutions or services. If we determine that it is probable that a loss has been incurred related to solution or service indemnifications, any such loss that could be reasonably estimated would be recognized. We have not identified any losses and, accordingly, we have not recorded a liability related to these indemnifications.
Legal proceedings
We are subject to legal proceedings and claims that arise in the ordinary course of business, as well as certain other non-ordinary course proceedings, claims and inquiries, as described below. We make a provision for a loss contingency when it is both probable that a material liability has been incurred and the amount of the loss can be reasonably estimated. If only a range of estimated losses can be determined, we accrue an amount within the range that, in our judgment, reflects the most likely outcome; if none of the estimates within that range is a better estimate than any other amount, we accrue the low end of the range. For proceedings in which an unfavorable outcome is reasonably possible but not probable and an estimate of the loss or range of losses arising from the proceeding can be made, we disclose such an estimate, if material. If such a loss or range of losses is not reasonably estimable, we disclose that fact. We review any such loss contingency provisions at least quarterly and adjust them to reflect the impacts of negotiations, settlements, rulings, advice of legal counsel and other information and events pertaining to a particular case. We recognize insurance recoveries, if any, when they are probable of receipt. All associated costs due to third-party service providers and consultants, including legal fees, are expensed as incurred.
Legal proceedings are inherently unpredictable. However, we believe that we have valid defenses with respect to the legal matters pending or threatened against us and intend to defend ourselves vigorously against all claims asserted. It is possible that our consolidated financial position, results of operations or cash flows could be materially negatively affected in any particular period by an unfavorable resolution of one or more of such legal proceedings.
Security incident
As previously disclosed, we are subject to risks and uncertainties as a result of a ransomware attack against us in May 2020 in which a cybercriminal removed a copy of a subset of data from our self-hosted environment (the "Security Incident"). Based on the nature of the Security Incident, our research and third party (including law enforcement) investigation, we have no reason to believe that any data went beyond the cybercriminal, was or will be misused, or will be disseminated or otherwise made available publicly. Our investigation into the Security Incident by our cybersecurity team and third-party forensic advisors remains ongoing.
As a result of the Security Incident, we are currently subject to certain legal proceedings, claims, inquiries and investigations, as discussed below, and could be the subject of additional legal proceedings, claims, inquires and investigations in the future that might result in adverse judgments, settlements, fines, penalties, or other resolution. To limit our exposure to losses related to claims against us, including data breaches such as the Security Incident, we maintain $50 million of insurance above a $250 thousand deductible payable by us. As noted below, this coverage has reduced our financial exposure related to the Security Incident, and we will continue to seek recoveries under these insurance policies.
Blackbaud, Inc.
Notes to Consolidated Financial Statements
We recorded expenses and offsetting probable insurance recoveries related to the Security Incident as follows:
| | | | | | | | | |
| Years ended December 31, | |
| (dollars in thousands) | 2021 | 2020 | |
Gross expense(1) | $ | 40,560 | | $ | 9,831 | | |
| Offsetting probable insurance recoveries | (38,746) | | (9,363) | | |
| Net expense | $ | 1,814 | | $ | 468 | | |
(1)The 2020 amount has been revised to exclude costs associated with enhancements to our cybersecurity program.
The following summarizes our cumulative expenses, probable insurance recoveries and insurance recoveries paid as of:
| | | | | | | | |
| (dollars in thousands) | December 31,
2021 | December 31,
2020 |
Cumulative gross expense(1) | $ | 50,391 | | $ | 9,831 | |
| Cumulative offsetting insurance recoveries | (48,109) | | (9,363) | |
| Cumulative net expense | $ | 2,282 | | $ | 468 | |
| | |
| Cumulative offsetting insurance recoveries paid | $ | (29,968) | | $ | (3,075) | |
(1)The 2020 amount has been revised to exclude costs associated with enhancements to our cybersecurity program.
Due to the time required to submit and process such insurance claims, we have not yet received all of the accrued insurance recoveries. Recorded expenses consisted primarily of payments for legal fees related to governmental inquiries and investigations and customer constituent class actions. We present expenses and insurance recoveries related to the Security Incident in general and administrative expense on our consolidated statements of comprehensive income and as operating activities on our consolidated statements of cash flows. Based on our review of expenses incurred to date, total costs related to the Security Incident have exceeded the limit of our insurance coverage during the first quarter of 2022. We expect to continue to experience significant expenses related to our response to the Security Incident, resolution of legal proceedings, claims, inquiries and investigations discussed below, and our efforts to further enhance our security measures. For full year 2022, we currently expect net cash outlays of approximately $25.0 million to $35.0 million for ongoing legal fees related to the Security Incident. In line with our policy as discussed above, legal fees, are expensed as incurred.
Based on our analysis of the factors described above, we have not recorded a liability for a loss contingency related to the Security Incident as of December 31, 2021 because we are unable at this time to reasonably estimate the possible loss or range of loss.
Customer claims. To date, we have received approximately 260 specific requests for reimbursement of expenses ("Customer Reimbursement Requests") and approximately 400 reservations of the right to seek expense recovery in the future from customers or their attorneys in the U.S., U.K. and Canada related to the Security Incident (none of which have as yet been filed in court). Of the Customer Reimbursement Requests received to date, approximately 180 have been fully resolved and closed. In addition, insurance companies representing various customers’ interests through subrogation claims have contacted us. One insurance company has filed a subrogation claim in court. Customer and insurer subrogation claims generally seek reimbursement of their costs and expenses associated with notifying their own customers of the Security Incident and taking steps to assure that personal information has not been compromised as a result of the Security Incident. Our review of customer and subrogation claims includes analyzing individual customer contracts into which we have entered, the specific claims made and applicable law.
Customer constituent class actions. Presently, we are a defendant in 19 putative consumer class action cases [17 in U.S. federal courts (which have been consolidated under multi district litigation to a single federal court) and 2 in Canadian courts] alleging harm from the Security Incident. The plaintiffs in these cases, who purport to represent various classes of individual constituents of our customers, generally claim to have been harmed by alleged actions and/or omissions by us in connection with the Security Incident and assert a variety of common law and statutory claims seeking monetary damages, injunctive relief, costs and attorneys’ fees, and other related relief.
Blackbaud, Inc.
Notes to Consolidated Financial Statements
Lawsuits that are putative class actions require a plaintiff to satisfy a number of procedural requirements before proceeding to trial. These requirements include, among others, demonstration to a court that the law proscribes in some manner our activities, the making of factual allegations sufficient to suggest that our activities exceeded the limits of the law and a determination by the court—known as class certification—that the law permits a group of individuals to pursue the case together as a class. If these procedural requirements are not met, the lawsuit cannot proceed as a class action and the plaintiff may lose the financial incentive to proceed with the case. Frequently, a court’s determination as to these procedural requirements is subject to appeal to a higher court. As a result of these uncertainties, we may be unable to determine the probability of loss until, or after, a court has finally determined that a plaintiff has satisfied the applicable class action procedural requirements.
Furthermore, for putative class actions, it is often not possible to estimate the possible loss or a range of loss amounts, even where we have determined that a loss is reasonably possible. Generally, class actions involve a large number of people and raise complex legal and factual issues that result in uncertainty as to their outcome and, ultimately, making it difficult for us to estimate the amount of damages that a plaintiff might successfully prove. This analysis is further complicated by the fact that the plaintiffs lack contractual privity with us.
Governmental inquiries and investigations. To date, we have received a consolidated, multi-state Civil Investigative Demand issued on behalf of 48 state Attorneys General and the District of Columbia and separate Civil Investigative Demands from the offices of the Illinois Attorney General and the California Attorney General relating to the Security Incident. We also are subject to the following pending governmental actions:
•an investigation by the U.S. Federal Trade Commission;
•a formal investigation by the SEC;
•an investigation by the U.S. Department of Health and Human Services;
•an investigation by the Office of the Australian Information Commissioner; and
•an investigation by the Office of the Privacy Commissioner of Canada.
On September 28, 2021, the Information Commissioner’s Office in the United Kingdom under the U.K. Data Protection Act 2018 (the "ICO") notified us that it has closed its investigation of the Security Incident. Based on its investigation and having considered our actions before, during and after the Security Incident, the ICO issued our European subsidiary a reprimand in accordance with Article 58(2)(b) of the U.K. General Data Protection Regulation ("U.K. GDPR") due to our non-compliance, in the ICO's view, with the requirements set out in Article 32 of the U.K. GDPR regarding the processing of personal data. The ICO did not impose a penalty related to the Security Incident, nor did it impose any requirements for further action by us.
On September 24, 2021, we received notice from the Spanish Data Protection Authority that it has concluded its investigation of the Security Incident, pursuant to which our European subsidiary paid a penalty of €60,000 in relation to the alleged late notification of two Spanish data controllers regarding the Security Incident.
On January 15, 2021, we were notified by the Data Protection Commission of Ireland that it has concluded its investigation of the Security Incident without taking any action against us.
We continue to cooperate with all ongoing inquiries and investigations, which include various requests for documents, policies, narratives and communications, as well as requests to interview or depose various Company-related personnel. As noted above, each of these separate governmental inquiries and investigations could result in adverse judgements, settlements, fines, penalties, or other resolution, the amount, scope and timing of which we are currently unable to predict, but could have a material adverse impact on our results of operations, cash flows, or financial condition.
Blackbaud, Inc.
Notes to Consolidated Financial Statements
We file income tax returns in the U.S. for federal and various state jurisdictions as well as in foreign jurisdictions including Canada, the U.K., Australia, Ireland and Costa Rica. We are generally subject to U.S. federal income tax examination for calendar tax years 2018 through 2021 as well as state and foreign income tax examinations for various years depending on statutes of limitations of those jurisdictions. We entered into settlement with the IRS Appeals Office in relation to one of our uncertain tax positions which resulted in release of the corresponding liability for uncertain tax position.
The following summarizes the components of income tax expense (benefit):
| | | | | | | | | | | |
| Years ended December 31, |
| (dollars in thousands) | 2021 | | 2020 | | 2019 | |
| Current taxes: | | | |
| U.S. Federal | $ | (2,499) | | $ | (407) | | $ | 1,534 | |
| U.S. State and local | (257) | | 1,563 | | 613 | |
| International | 6,570 | | 3,904 | | 130 | |
| Total current taxes | 3,814 | | 5,060 | | 2,277 | |
| Deferred taxes: | | | |
| U.S. Federal | (4,615) | | (1,064) | | (1,724) | |
| U.S. State and local | 222 | | 7,725 | | (2,235) | |
| International | 1,964 | | 2,176 | | 359 | |
| Total deferred taxes | (2,429) | | 8,837 | | (3,600) | |
| Total income tax provision (benefit) | $ | 1,385 | | $ | 13,897 | | $ | (1,323) | |
The following summarizes the components of income before provision for income taxes:
| | | | | | | | | | | |
| Years ended December 31, |
| (dollars in thousands) | 2021 | | 2020 | | 2019 | |
| U.S. | $ | (23,180) | | $ | (4,112) | | $ | 5,149 | |
| International | 30,263 | | 25,726 | | 5,436 | |
| Income before provision for income taxes | $ | 7,083 | | $ | 21,614 | | $ | 10,585 | |
Blackbaud, Inc.
Notes to Consolidated Financial Statements
A reconciliation between the effect of applying the federal statutory rate and the effective income tax rate used to calculate our income tax provision (benefit) is as follows:
| | | | | | | | | | | |
| Years ended December 31, |
| 2021 | | 2020 | | 2019 | |
| Federal statutory rate | 21.0 | % | 21.0 | % | 21.0 | % |
| Effect of: | | | |
| State income taxes, net of federal benefit | 4.4 | | 5.9 | | (1.7) | |
| Change in foreign income tax rate applied to deferred tax balances | 42.6 | | 4.0 | | 2.0 | |
| | | |
| Change in state income tax rate applied to deferred tax balances | 2.3 | | 0.1 | | (3.1) | |
| Section 162(m) limitation | 75.0 | | 17.5 | | 30.8 | |
| Change in valuation reserve (primarily state credit reserves) | 26.1 | | 38.2 | | 3.7 | |
| Acquisition costs | 8.7 | | — | | — | |
| Nondeductible meals, entertainment and transportation | 1.1 | | 3.3 | | 11.3 | |
| GILTI inclusion | — | | 1.3 | | 5.9 | |
| | | |
| FDII benefit | — | | — | | (1.5) | |
| | | |
| | | |
| | | |
| DTA Adjustment – NOLs | — | | (3.3) | | — | |
| Return to accrual adjustment | (4.2) | | (4.1) | | (10.6) | |
| Foreign tax rate | (6.0) | | (1.7) | | 0.3 | |
| State credits, net of federal benefit | (32.6) | | (2.3) | | (15.4) | |
| Unrecognized tax benefit | (32.7) | | 1.3 | | 4.4 | |
| Stock-based compensation | (36.2) | | (1.2) | | (20.2) | |
| Federal credits generated | (54.5) | | (17.4) | | (37.6) | |
| Other | 4.6 | | 1.7 | | (1.8) | |
| Income tax provision (benefit) effective rate | 19.6 | % | 64.3 | % | (12.5) | % |
The decrease in our effective income tax rate in 2021 when compared to 2020, was primarily due to prior year increase in valuation allowance attributable to state tax credit carryforwards for which we do not expect to realize benefit. Furthermore, our 2021 effective income tax rate was positively impacted by increased benefit attributable to stock based compensation deduction and a reduction to the unrecognized tax benefit as a result of IRS audit settlement and statute of limitation lapses offset against negative impacts of the U.K.-enacted tax rate increase and an increase in non-deductible compensation.
Blackbaud, Inc.
Notes to Consolidated Financial Statements
The significant components of our deferred tax assets and liabilities were as follows:
| | | | | | | | |
| December 31, |
| (dollars in thousands) | 2021 | | 2020 | |
| Deferred tax assets relating to: | | |
| Federal and state and foreign net operating loss carryforwards | $ | 21,456 | | $ | 5,592 | |
| Federal, state and foreign tax credits | 52,283 | | 42,598 | |
| Stock-based compensation | 21,432 | | 17,434 | |
| Operating leases | 23,795 | | 13,375 | |
| Allowance for credit losses | 2,524 | | 2,399 | |
| Intangible assets | 1,070 | | 1,663 | |
| Deferred revenue | 1,057 | | 524 | |
| Accrued bonuses | 218 | | — | |
| Other | 13,515 | | 9,111 | |
| Total deferred tax assets | 137,350 | | 92,696 | |
| Deferred tax liabilities relating to: | | |
| Intangible assets | (168,392) | | (45,757) | |
| Capitalized software development costs | (31,326) | | (28,804) | |
| Costs of obtaining contracts | (18,046) | | (20,256) | |
| Operating leases | (23,582) | | (12,333) | |
| Fixed assets | (8,483) | | (8,458) | |
| Other | (2,515) | | (398) | |
| Total deferred tax liabilities | (252,344) | | (116,006) | |
| Valuation allowance | (31,974) | | (29,184) | |
| Net deferred tax liability | $ | (146,968) | | $ | (52,494) | |
As of December 31, 2021, our federal, foreign and state net operating loss carryforwards for income tax purposes were approximately $76.8 million, $8.5 million and $137.6 million, respectively. The federal and state net operating loss carryforwards are subject to various Internal Revenue Code limitations and applicable state tax laws. If not utilized, the federal net operating loss carryforwards will begin to expire in 2028 and the state net operating loss carryforwards will expire over various periods beginning in 2022. Of our foreign net operating loss carryforwards, $425 thousand expires in 2024 with the remainder having an unlimited carryforward period. Our federal tax credit carryforwards for income tax purposes were approximately $22.1 million. Our state tax credit carryforwards for income tax purposes were approximately $32.8 million, net of federal benefit. If not utilized, the federal tax credit carryforwards will begin to expire in 2036 and the state tax credit carryforwards will begin to expire in 2022. A portion of the foreign and state net operating loss carryforwards and state credit carryforwards have a valuation reserve due to management's uncertainty regarding the future ability to use such carryforwards.
The following table illustrates the change in our deferred tax asset valuation allowance:
| | | | | | | | | | | | | | |
Years ended December 31,
(dollars in thousands) | Balance
at beginning
of year | Acquisition-
related
change | Charges to
expense | Balance at
end of
year |
|
| 2021 | $ | 29,184 | | $ | 893 | | $ | 1,897 | | $ | 31,974 | |
| 2020 | 6,453 | | — | | 22,731 | | 29,184 | |
| 2019 | 6,855 | | — | | (402) | | 6,453 | |
Blackbaud, Inc.
Notes to Consolidated Financial Statements
The following table sets forth the change to our unrecognized tax benefit for the years ended December 31, 2021, 2020 and 2019:
| | | | | | | | | | | |
| Years ended December 31, |
| (dollars in thousands) | 2021 | | 2020 | | 2019 | |
| Balance at beginning of year | $ | 4,625 | | $ | 4,346 | | $ | 3,704 | |
| Increases from prior period positions | 6 | | 414 | | 1,183 | |
| Decreases in prior year positions | (57) | | (614) | | (385) | |
| Increases from current period positions | 1,751 | | 491 | | 456 | |
| Settlements (payments) | (1,192) | | — | | — | |
| Lapse of statute of limitations | (1,482) | | (12) | | (612) | |
| Balance at end of year | $ | 3,651 | | $ | 4,625 | | $ | 4,346 | |
The total amount of unrecognized tax benefit that, if recognized, would favorably affect the effective tax rate was $3.2 million at December 31, 2021. Certain prior period amounts relating to our 2014 acquisitions are covered under indemnification agreements and, therefore, we have recorded a corresponding indemnification asset. We recognize accrued interest and penalties, if any, related to unrecognized tax benefits as a component of income tax expense. The total amount of accrued interest and penalties included in the consolidated balance sheet as of December 31, 2021 and December 31, 2020 was insignificant and $1.1 million, respectively. The total amount of interest and penalties included in the consolidated statements of comprehensive income as an increase or decrease in income tax expense for 2021, 2020 and 2019 was insignificant.
We have taken federal and state tax positions for which it is reasonably possible that the total amounts of unrecognized tax benefits might decrease within the next twelve months. This possible decrease could result from the expiration of statutes of limitations. The reasonably possible decrease at December 31, 2021 was insignificant.
For our undistributed earnings of foreign subsidiaries, which we do not consider to be significant, we concluded that these earnings would be permanently reinvested in the local jurisdictions and not repatriated to the United States. Accordingly, we have not provided for U.S. state income taxes and foreign withholding taxes on those undistributed earnings of our foreign subsidiaries. If some or all of such earnings were to be remitted, the amount of taxes payable would be insignificant.
| | |
| 13. Stock-based Compensation |
Employee stock-based compensation plans
Under the 2016 Equity and Incentive Compensation Plan Amended and Restated as of June 10, 2021 (the "2016 Equity Plan"), we may grant incentive stock options, nonstatutory stock options, stock appreciation rights, restricted stock, restricted stock units, other stock awards and cash incentive awards to employees, directors and consultants. Our Compensation Committee of the Board of Directors administers this plan and the stock-based awards are granted under terms determined by it.
The total number of authorized stock-based awards available under our plan was 3,500,423 as of December 31, 2021. We issue common stock from our pool of authorized stock upon exercise of stock options and stock appreciation rights, vesting of restricted stock units or upon granting of restricted stock.
Blackbaud, Inc.
Notes to Consolidated Financial Statements
Historically, we have issued four types of awards under our plans: restricted stock awards, restricted stock units, stock options and stock appreciation rights ("SARs"). There have been no new stock options or SARs granted since 2005 and 2013, respectively. The following table sets forth the number of awards outstanding for each award type as of:
| | | | | | | | |
| Outstanding at December 31, |
| Award type | 2021 | | 2020 |
| Restricted stock awards | 1,192,810 | | 1,277,109 | |
| Restricted stock units | 1,279,270 | | 1,170,885 | |
| | |
| | |
Options and SARs granted under the 2016 Equity Plan have a 10-year contractual term. Awards granted to our executive officers and certain members of management are subject to accelerated vesting upon a change in control as defined in the employees’ retention agreement.
Expense recognition
We recognize compensation expense associated with stock options and awards with performance or market based vesting conditions on an accelerated basis over the requisite service period of the individual grantees, which generally equals the vesting period. We recognize compensation expense associated with restricted stock awards and SARs on a straight-line basis over the requisite service period of the individual grantees, which generally equals the vesting period. We recognize the effect of awards for which the requisite service period is not rendered when the award is forfeited (that is, we recognize the effect of forfeitures in compensation cost when they occur). Previously recognized compensation cost for an award is reversed in the period that the award is forfeited.
Stock-based compensation expense is allocated to cost of revenue and operating expenses on the consolidated statements of comprehensive income based on where the associated employee’s compensation is recorded. The following table summarizes stock-based compensation expense:
| | | | | | | | | | | |
| Years ended December 31, |
| (in thousands) | 2021 | 2020 | 2019 |
| Included in cost of revenue: | | | |
| Cost of recurring | $ | 12,405 | | $ | 5,793 | | $ | 1,879 | |
| Cost of one-time services and other | 7,547 | | 7,581 | | 1,487 | |
| Total included in cost of revenue | 19,952 | | 13,374 | | 3,366 | |
| Included in operating expenses: | | | |
| Sales, marketing and customer success | 20,283 | | 15,514 | | 11,203 | |
| Research and development | 27,080 | | 18,527 | | 11,115 | |
| General and administrative | 53,064 | | 39,842 | | 32,949 | |
| Total included in operating expenses | 100,427 | | 73,883 | | 55,267 | |
| Total stock-based compensation expense | $ | 120,379 | | $ | 87,257 | | $ | 58,633 | |
The total amount of compensation cost related to unvested awards not recognized was $97.8 million at December 31, 2021. It is expected that this amount will be recognized over a weighted average period of 1.3 years.
Restricted stock awards
We have granted shares of common stock subject to certain restrictions under the 2016 Equity Plan. Restricted stock awards granted to employees vest in equal annual installments generally over 3 years from the grant date subject to the recipient’s continued employment with us. Restricted stock awards granted to non-employee directors vest after one year from the date of grant or, if earlier, immediately prior to the next annual election of directors, provided the non-employee director is serving as a director at that time. The fair market value of the stock at the time of the grant is amortized on a straight-line basis to expense over the period of vesting. Recipients of restricted stock awards have the right to vote such shares and receive dividends, if declared.
Blackbaud, Inc.
Notes to Consolidated Financial Statements
The following table summarizes our unvested restricted stock awards as of December 31, 2021, and changes during the year then ended:
| | | | | | | | | | | | | | | |
| Restricted stock awards | Restricted
stock awards | Weighted
average
grant-date
fair value | | | Aggregate intrinsic value(1) (in thousands) |
| Unvested at January 1, 2021 | 1,277,109 | | $ | 79.54 | | | | |
| Granted | 596,763 | | 77.39 | | | | |
| Vested | (486,342) | | 79.21 | | | | |
| Forfeited | (194,720) | | 78.67 | | | | |
| Unvested at December 31, 2021 | 1,192,810 | | 78.73 | | | | $ | 94,208 | |
(1)The intrinsic value is calculated as the market value as of the end of the fiscal period.
The total fair value of restricted stock awards that vested during the years ended December 31, 2021, 2020 and 2019 was $38.5 million, $39.9 million and $37.5 million, respectively. The weighted average grant-date fair value of restricted stock awards granted during the years ended December 31, 2020 and 2019 was $77.16 and $78.39, respectively.
Restricted stock units
We have also granted restricted stock units subject to certain restrictions under the 2016 Equity Plan. Restricted stock units granted to employees vest in equal annual installments generally over 3 years from the grant date subject to the recipient’s continued employment with us. We have also granted restricted stock units for which vesting is subject to meeting certain performance and/or market conditions. Restricted stock units granted with a market condition had a fair market value assigned at the grant date based on the use of a Monte Carlo simulation model. The fair market value of the stock at the time of the grant is amortized to expense on a straight-line basis over the period of vesting except for awards with market or performance conditions, which are amortized on an accelerated basis over the period of vesting.
The following table summarizes our unvested restricted stock units as of December 31, 2021, and changes during the year then ended:
| | | | | | | | | | | | | | | |
| Restricted stock units | Restricted
stock units | Weighted
average
grant-date
fair value | | | Aggregate intrinsic value(1) (in thousands) |
| Unvested at January 1, 2021 | 1,170,885 | | $ | 63.62 | | | | |
| Granted | 1,126,266 | | 73.47 | | | | |
| Forfeited | (110,722) | | 66.11 | | | | |
| | | | | |
| Vested | (907,159) | | 59.83 | | | | |
| Unvested at December 31, 2021 | 1,279,270 | | 74.77 | | | | $ | 101,037 | |
(1)The intrinsic value is calculated as the market value as of the end of the fiscal period.
The total fair value of restricted stock units that vested during the years ended December 31, 2021, 2020 and 2019 was $54.3 million, $18.9 million, and $19.2 million, respectively. The weighted average grant date fair value of restricted stock units granted for the years ended December 31, 2020 and 2019 was $59.59 and $77.90, respectively.
Stock appreciation rights
All SARs previously granted were fully vested as of December 31, 2017. There were no SARs exercised during 2021 and 2020. The total intrinsic value of SARs exercised during the year ended December 31, 2019 was $3.6 million. SARs granted with a market condition had a fair market value assigned at the grant date based on the use of a Monte Carlo simulation model. All other SARs granted had a fair market value assigned at the grant date based on the use of the Black-Scholes option pricing model.
Blackbaud, Inc.
Notes to Consolidated Financial Statements
Preferred stock
Our Board of Directors may fix the relative rights and preferences of each series of preferred stock in a resolution of the Board of Directors.
Stock repurchase program
Under our stock repurchase program, we are authorized to repurchase shares from time to time in accordance with applicable laws both on the open market, including under trading plans established pursuant to Rule 10b5-1 under the Securities Exchange Act of 1934, as amended, and in privately negotiated transactions. The timing and amount of repurchases depends on several factors, including market and business conditions, the trading price of our common stock and the nature of other investment opportunities. The repurchase program does not have an expiration date and may be limited, suspended or discontinued at any time without prior notice. Under the 2020 Credit Facility, we have restrictions on our ability to repurchase shares of our common stock, which are summarized on page 56 in this report.
We account for purchases of treasury stock under the cost method. During the year ended December 31, 2021, we purchased 1,592,933 shares for $108.4 million. In December 2021, our Board of Directors reauthorized and replenished our stock repurchase program that authorizes us to purchase up to $250.0 million of our outstanding shares of common stock. The remaining amount available to purchase stock under the stock repurchase program was $250.0 million as of December 31, 2021.
Changes in accumulated other comprehensive loss by component
The changes in accumulated other comprehensive loss by component, consisted of the following:
| | | | | | | | | | | |
| Years ended December 31, |
| (in thousands) | 2021 | 2020 | 2019 |
| Accumulated other comprehensive loss, beginning of period | $ | (2,497) | | $ | (5,290) | | $ | (5,110) | |
| By component: | | | |
| Gains and losses on cash flow hedges: | | | |
| Accumulated other comprehensive (loss) income balance, beginning of period | $ | (3,101) | | $ | (1,323) | | $ | 1,498 | |
Other comprehensive (loss) income before reclassifications, net of tax effects of $(1,982), $1,625 and $860 | 5,617 | | (4,602) | | (2,399) | |
| Amounts reclassified from accumulated other comprehensive income (loss) to interest expense | 3,714 | | 3,827 | | (573) | |
| | | |
| Tax (benefit) expense included in provision for income taxes | (973) | | (1,003) | | 151 | |
| Total amounts reclassified from accumulated other comprehensive income (loss) | 2,741 | | 2,824 | | (422) | |
| Net current-period other comprehensive income (loss) | 8,358 | | (1,778) | | (2,821) | |
| Accumulated other comprehensive income (loss) balance, end of period | $ | 5,257 | | $ | (3,101) | | $ | (1,323) | |
| Foreign currency translation adjustment: | | | |
| Accumulated other comprehensive income (loss) balance, beginning of period | $ | 604 | | $ | (3,967) | | $ | (6,608) | |
| Translation adjustments | 661 | | 4,571 | | 2,641 | |
| Accumulated other comprehensive income (loss) balance, end of period | 1,265 | | 604 | | (3,967) | |
| Accumulated other comprehensive income (loss), end of period | $ | 6,522 | | $ | (2,497) | | $ | (5,290) | |
Blackbaud, Inc.
Notes to Consolidated Financial Statements
| | |
| 15. Defined Contribution Plan |
We have a defined contribution 401(k) plan (the "401K Plan") covering substantially all employees. Employees were able to contribute between 1% and 75% of their salaries in 2021, 2020 and 2019. We match 50% of qualified employees’ contributions up to 6% of their salary. The 401K Plan also provides for additional employer contributions to be made at our discretion. We suspended our 401(k) match program between April 1, 2020 and December 31, 2020 in response to COVID-19. Total matching contributions to the 401K Plan for the years ended December 31, 2021, 2020 and 2019 were $6.5 million, $1.9 million and $8.7 million, respectively.
In December 2020, we made a discretionary matching contribution to eligible employees 401(k) plans totaling $1.2 million, given our financial performance during the fourth quarter. There were no discretionary contributions by us to the 401K Plan in 2021 and 2019.
Our chief operating decision maker is our chief executive officer ("CEO"). Our chief operating decision maker uses consolidated financial information to make operating decisions, assess financial performance and allocate resources. We have one operating segment and one reportable segment.
The following table presents long-lived assets by geographic region based on the location of the assets.
| | | | | | | | |
| Years ended
December 31, |
| (dollars in thousands) | 2021 | 2020 |
| United States | $ | 110,613 | | $ | 103,123 | |
| Other countries | 815 | | 2,054 | |
| Total property and equipment | $ | 111,428 | | $ | 105,177 | |
See Note 17 to these consolidated financial statements for information about our revenues by geographic region.
Transaction price allocated to the remaining performance obligations
As of December 31, 2021, approximately $1.0 billion of revenue is expected to be recognized from remaining performance obligations. We expect to recognize revenue on approximately 60% of these remaining performance obligations over the next 12 months, with the remainder recognized thereafter.
We applied the practical expedient in ASC 606-10-50-14 and have excluded the value of unsatisfied performance obligations for (i) contracts with an original expected length of one year or less (one-time services); and (ii) contracts for which we recognize revenue at the amount to which we have the right to invoice for services performed (payment services and usage).
We also applied the practical expedient in ASC 606-10-65-1-(f)(3), whereby the transaction price allocated to the remaining performance obligations, or an explanation of when we expect to recognize that amount as revenue for all reporting periods presented before the date of the initial application, is not disclosed.
Blackbaud, Inc.
Notes to Consolidated Financial Statements
Contract balances
Our contract assets as of December 31, 2021 and December 31, 2020 were insignificant. Our opening and closing balances of deferred revenue were as follows:
| | | | | | | | |
| (in thousands) | December 31,
2021 | December 31,
2020 |
| | |
| Total deferred revenue | $ | 378,746 | | $ | 316,914 | |
Deferred revenue increased during 2021, primarily due to the inclusion of EVERFI deferred revenue balances and, to a much lesser extent, early progress in initiatives to bring our pricing in line with the market. The amount of revenue recognized during the 2021 that was included in the deferred revenue balance at the beginning of the period was approximately $288 million. The amount of revenue recognized during the 2021 from performance obligations satisfied in prior periods was insignificant.
Disaggregation of revenue
We sell our cloud solutions and related services in three primary geographical markets: to customers in the United States, to customers in the United Kingdom and to customers located in other countries. The following table presents our revenue by geographic area based on the address of our customers:
| | | | | | | | | | | |
| Years ended
December 31, |
| (dollars in thousands) | 2021 | 2020 | 2019 |
| United States | $ | 777,333 | | $ | 772,188 | | $ | 775,308 | |
| United Kingdom | 89,688 | | 84,121 | | 65,176 | |
| Other countries | 60,719 | | 56,910 | | 59,939 | |
| Total revenue | $ | 927,740 | | $ | 913,219 | | $ | 900,423 | |
Beginning in the second quarter of 2021, we combined our General Markets Group and Enterprise Markets Group into a single U.S. Markets Group ("UMG") and moved our Corporations vertical under our International Markets Group ("IMG"). This change was made to better align our resources toward customer retention and growth, which are key objectives as we progress toward our long-term aspirational goals.
The UMG and the IMG comprised our go-to-market organizations as of December 31, 2021. The following is a description of each market group as of that date:
•The UMG focuses on sales primarily to all prospects and customers inside of the U.S.; and
•The IMG focuses on sales primarily to all prospects and customers outside of the U.S, as well as corporations.
The following table presents our revenue by market group:
| | | | | | | | | | | |
| Years ended
December 31, |
| (dollars in thousands) | 2021 | 2020(1) | 2019(1) |
UMG | $ | 733,663 | | $ | 730,482 | | $ | 750,007 | |
| IMG | 193,632 | | 181,948 | | 147,147 | |
| Other | 445 | | 789 | | 3,269 | |
| Total revenue | $ | 927,740 | | $ | 913,219 | | $ | 900,423 | |
(1)Due to the market group changes discussed above, we have recast our revenue by market group for the years ended December 31, 2020 and 2019 to present them on a consistent basis with the current year.
Blackbaud, Inc.
Notes to Consolidated Financial Statements
The following table presents our recurring revenue by type:
| | | | | | | | | | | |
| Years ended
December 31, |
| (dollars in thousands) | 2021 | 2020 | 2019 |
| Contractual recurring | $ | 601,397 | | $ | 591,272 | | $ | 590,464 | |
| Transactional recurring | 279,453 | | 259,473 | | 241,145 | |
| Total recurring revenue | $ | 880,850 | | $ | 850,745 | | $ | 831,609 | |
During 2017, in an effort to further our organizational objectives, including improved operating efficiency, customer outcomes and employee satisfaction, we initiated a multi-year plan to consolidate and relocate some of our existing offices to highly modern and more collaborative workspaces with short-term financial commitments. We substantially completed our facilities optimization restructuring plan as of December 2019. During the year ended December 31, 2019, we incurred $5.8 million in before-tax restructuring charges related to these activities. Such charges during the years ended December 31, 2021 and 2020 were insignificant.
Restructuring costs incurred prior to our adoption of ASU 2016-02 Leases (Topic 842) ("ASU 2016-02") on January 1, 2019 consisted primarily of costs to terminate lease agreements, contractual lease payments, net of estimated sublease income, upon vacating space as part of the plan, as well as insignificant costs to relocate affected employees and write-off facilities-related fixed assets that we would no longer use.
Upon adoption of ASU 2016-02 at January 1, 2019, we reduced our operating lease ROU assets recognized at transition by the carrying amounts of the restructuring liabilities for certain leased office spaces that we ceased using prior to December 31, 2018. Restructuring costs incurred during the year ended December 31, 2019 consisted primarily of operating lease ROU asset impairment costs and, to a lesser extent, lease payments for offices we had ceased using and write-offs of facilities-related fixed assets that we would no longer use.
Shelf registration statement
As a well-known seasoned issuer, we filed an automatic shelf registration statement for an undetermined amount of debt and equity securities with the SEC on January 14, 2022. Under this universal shelf registration statement we may offer, from time to time, debt securities, common stock, preferred stock, depositary shares, warrants, stock purchase contracts and stock purchase units. Subject to certain conditions, this registration statement will be effective through January 13, 2024.
First amendment to 2020 Credit Facility
On January 31, 2022, we entered into the First Amendment to Credit Agreement (the “Amendment”). The Amendment amends the 2020 Credit Facility to, among other things, (i) modify the definition of “Applicable Margin”, (ii) modify the net leverage ratio financial covenant to require a net leverage ratio of (A) 4.00:1.00 or less for the fiscal quarter ended December 31, 2021 and for fiscal quarters ending thereafter through December 31, 2023 and (B) 3.75:1.00 or less for the fiscal quarters ending March 31, 2024 and thereafter, (iii) reset the $250.0 fixed dollar basket with respect to the accordion feature and (iv) modify certain negative covenants to provide additional operational flexibility.
Blackbaud, Inc.
Notes to Consolidated Financial Statements
Under the Amended Credit Agreement, revolving loans and term loans (other than the $250.0 million 2021 Incremental Term Loan incurred in December 2021 (as defined above)) bear interest at a rate per annum equal to, at the option of the Company: (a) a base rate equal to the highest of (i) the Federal Funds Rate plus 0.50%, (ii) the prime rate announced by Bank of America, N.A., and (iii) Eurocurrency Rate plus 1.00% (the “Base Rate”), plus an applicable margin as specified in the Amendment (the “Applicable Margin”); or (b) Eurocurrency Rate plus the Applicable Margin. The Incremental Term Loan bear interest at a rate per annum equal to, at the option of the Company, the Base Rate, the Daily SOFR rate plus a SOFR adjustment rate as specified in the Amendment (the “SOFR Adjustment”) plus the Applicable Margin or the Term SOFR rate plus the SOFR Adjustment plus the Applicable Margin. The Applicable Margin shall be adjusted quarterly, varies based on our net leverage ratio and varies based on whether the loan is a Base Rate loan (0.375% to 1.50%), a Eurocurrency Rate loan (1.375% to 2.50%) or, solely in the case of the Incremental Term Loan, a SOFR Rate loan (1.375% to 2.50%). With respect to the Incremental Term Loan, the SOFR Adjustment varies based on the applicable interest period and equals 0.10% for Daily SOFR loans and for Term SOFR loans with a one-month interest period, 0.15% for Term SOFR loans with a three-month interest period and 0.25% for Term SOFR loans with a six-month interest period.
ITEM 9. CHANGES IN AND DISAGREEMENTS WITH ACCOUNTANTS ON ACCOUNTING AND FINANCIAL DISCLOSURE
On October 11, 2021, we decided to dismiss PricewaterhouseCoopers LLP (“PwC”), as our independent registered public accounting firm, effective upon the completion of PwC’s audit of our consolidated financial statements for the fiscal year ended December 31, 2021 (the “2021 Audit”), which occurred on March 1, 2022. Also, on October 11, 2021, we decided to engage Ernst & Young LLP as our new independent registered public accountants for the fiscal year ending December 31, 2022, which became effective immediately following the completion by PwC of the 2021 Audit. The disclosure required under this Item 9 was previously reported on a Current Report on Form 8-K filed with the SEC on October 14, 2021.
ITEM 9A. CONTROLS AND PROCEDURES
| | |
| Evaluation of Disclosure Controls and Procedures |
Disclosure controls and procedures (as defined in Exchange Act Rule 13a-15(e) and 15d-15(e)) are designed only to provide reasonable assurance that they will meet their objectives. As of the end of the period covered by this report, we carried out an evaluation, under the supervision and with the participation of our management, including our Chief Executive Officer (principal executive officer) and Chief Financial Officer (principal financial and accounting officer), of the effectiveness of our disclosure controls and procedures (as defined in Rule 13a-15(e) and 15d-15(e)) pursuant to Exchange Act Rule 13a-15(b). Based upon that evaluation, our Chief Executive Officer and Chief Financial Officer have concluded that our disclosure controls and procedures are effective to provide the reasonable assurance discussed above.
| | |
| Changes in Internal Control Over Financial Reporting |
Although we do not believe it materially affected, or is reasonably likely to materially affect, our internal control over financial reporting, our evaluation of the effectiveness of internal control over financial reporting as of December 31, 2021 excluded EVERFI as discussed below. We are working to integrate EVERFI into our overall internal control over financial reporting processes. No change in internal control over financial reporting occurred during the fiscal quarter ended December 31, 2021 with respect to our operations that has materially affected, or is reasonably likely to materially affect, our internal control over financial reporting.
| | |
| Management’s Report on Internal Control Over Financial Reporting |
Our management is responsible for establishing and maintaining adequate internal control over financial reporting (as defined in Rules 13a-15(f) and 15d-15(f) under the Exchange Act). Internal control over financial reporting is a process designed to provide reasonable assurance regarding the reliability of financial reporting and the preparation of financial statements for external purposes in accordance with U.S. GAAP. Our internal control over financial reporting includes those policies and procedures that: (i) pertain to the maintenance of records that, in reasonable detail, accurately and fairly reflect the transactions and dispositions of our assets; (ii) provide reasonable assurance that transactions are recorded as necessary to permit preparation of financial statements in accordance with U.S. GAAP, and that our receipts and expenditures are being made only in accordance with authorizations of our management and directors; and (iii) provide reasonable assurance regarding prevention or timely detection of unauthorized acquisition, use, or disposition of our assets that could have a material effect on the financial statements.
Our management conducted an evaluation of the effectiveness of our internal control over financial reporting as of December 31, 2021, based on the framework in Internal Control - Integrated Framework issued by the Committee of Sponsoring Organizations of the Treadway Commission (2013 framework). Based on this evaluation under the Internal Control - Integrated Framework, management concluded that our internal control over financial reporting was effective as of December 31, 2021.
We excluded EVERFI from our evaluation of the effectiveness of internal control over financial reporting as of December 31, 2021, as permitted by the guidance issued by the Office of the Chief Accountant of the Securities and Exchange Commission (not to extend more than one year beyond the date of the acquisition or for more than one annual reporting period). The acquisition of EVERFI was completed on December 31, 2021. As of and for the year ended December 31, 2021, EVERFI's assets represented approximately 6% of our consolidated total assets and its revenue represented 0% of our consolidated total revenue.
The effectiveness of our internal control over financial reporting as of December 31, 2021, has been audited by our independent registered public accounting firm, as stated in their attestation report, which is included in Item 8 of this Annual Report on Form 10-K.
ITEM 9B. OTHER INFORMATION
None.
ITEM 9C. DISCLOSURE REGARDING FOREIGN JURISDICTIONS THAT PREVENT INSPECTIONS
Not applicable.
ITEM 10. DIRECTORS, EXECUTIVE OFFICERS AND CORPORATE GOVERNANCE
The information required by Item 10 with respect to Directors and Executive Officers is incorporated by reference from the information under the captions “Election of Directors,” “Information Regarding Meetings of the Board and Committees,” “Delinquent Section 16(a) Reports,” and “Code of Business Conduct and Ethics and Code of Ethics,” contained in Blackbaud’s Proxy Statement for the 2022 Annual Meeting of Stockholders expected to be held on June 9, 2022, except for "Information about our Executive Officers" which is set forth in Part I of this report.
ITEM 11. EXECUTIVE COMPENSATION
The information required by Item 11 is incorporated by reference from the information under the captions "Director Compensation," “Executive Compensation,” “Compensation Discussion and Analysis,” “2021 Summary Compensation Table” and "CEO Pay Ratio" contained in Blackbaud’s Proxy Statement for the 2022 Annual Meeting of Stockholders expected to be held on June 9, 2022.
ITEM 12. SECURITY OWNERSHIP OF CERTAIN BENEFICIAL OWNERS AND MANAGEMENT AND RELATED STOCKHOLDER MATTERS
The information required by Item 12 is incorporated by reference from information under the captions “Stock Ownership” and "Equity Compensation Plan Information" contained in Blackbaud’s Proxy Statement for the 2022 Annual Meeting of Stockholders expected to be held on June 9, 2022.
ITEM 13. CERTAIN RELATIONSHIPS AND RELATED TRANSACTIONS, AND DIRECTOR INDEPENDENCE
The information required by Item 13 is incorporated by reference from the information under the captions “Transactions with Related Persons,” and “Independence of Directors” contained in Blackbaud’s Proxy Statement for the 2022 Annual Meeting of Stockholders expected to be held on June 9, 2022.
ITEM 14. PRINCIPAL ACCOUNTANT FEES AND SERVICES
The information required by Item 14 is incorporated by reference from the information under the caption “Audit Committee Report,” contained in Blackbaud’s Proxy Statement for the 2022 Annual Meeting of Stockholders expected to be held on June 9, 2022.
ITEM 15. EXHIBITS AND FINANCIAL STATEMENT SCHEDULES
(a) The following documents are included as part of the Annual Report on Form 10-K:
1. Financial statements
See the "Index to consolidated financial statements" in Part II Item 8 of this report.
There were no retrospective changes to the Consolidated Statement of Operations for any quarters in the two most recent fiscal years that would require disclosure under Item 302, as amended.
2.Financial statement schedules
Schedules not listed above have been omitted because the information required to be set forth therein is not applicable or is shown in the financial statements thereto.
3.Exhibits
The exhibits listed below are filed or incorporated by reference as part of this report:
| | | | | | | | | | | | | | | | | | | | | | | | | | | | | | | | |
| | | | | Filed In |
Exhibit
Number | | Description of Document | | Registrant’s
Form | | Dated | | Exhibit
Number | | Filed
Herewith |
| | | | S-1/A | | 4/6/2004 | | 2.1 | | |
| | | | 8-K | | 1/17/2012 | | 2.4 | | |
| | | | 10-K | | 2/29/2012 | | 2.7 | | |
| | Purchase Agreement, dated August 30, 2014, by and among MicroEdge Holdings, LLC, Blackbaud, Inc, direct and indirect holders of all of the outstanding equity interests of MicroEdge Holdings, LLC, and VFF I AIV I, L.P., as Sellers’ Representative. | | 8-K | | 10/2/2014 | | 10.76 | | |
| | | | 8-K | | 10/8/2015 | | 10.78 | | |
| | | | 8-K | | 10/8/2015 | | 10.79 | | |
| | | | 8-K | | 1/3/2022 | | 2.1 | | |
| | | | DEF 14A | | 4/30/2009 | | | | |
| | | | 8-K | | 6/14/2019 | | 3.1 | | |
| | | | | | | | | | |
| | | | | | | | | | | | | | | | | | | | | | | | | | | | | | | | |
| | | | Filed In |
Exhibit
Number | | Description of Document | | Registrant’s
Form | | Dated | | Exhibit
Number | | Filed
Herewith |
| | | | 10-K | | 2/20/2020 | | 4.1 | | |
| † | | | 10-K | | 2/27/2013 | | 10.65 | | |
| † | | | 10-K | | 2/27/2013 | | 10.65 | | |
| † | | | DEF 14A | | 4/26/2016 | | Appendix C | | |
| | | | 10-Q | | 8/4/2016 | | 10.84 | | |
| | | | 10-Q | | 11/4/2016 | | 10.87 | | |
| † | | | 10-Q | | 8/4/2017 | | 10.92 | | |
| | | | 10-K | | 2/20/2018 | | 10.93 | | |
| | | | 10-K | | 2/20/2018 | | 10.94 | | |
| | | | 10-Q | | 5/4/2018 | | 10.95 | | |
| † | | | DEF 14A | | 4/24/2019 | | Appendix B | | |
| † | | | 10-Q | | 5/3/2019 | | 10.96 | | |
| † | | | 10-Q | | 5/3/2019 | | 10.97 | | |
| † | | | 8-K | | 12/13/2019 | | 10.99 | | |
| | | | 10-Q | | 8/4/2020 | | 10.1 | | |
| | | | 10-Q | | 8/4/2020 | | 10.2 | | |
| | | | 10-Q | | 8/4/2020 | | 10.3 | | |
| | | | 10-Q | | 8/4/2020 | | 10.4 | | |
| | | | | | | | | | |
| | | | | | | | | | | | | | | | | | | | | | | | | | | | | | | | |
| | | | Filed In |
Exhibit
Number | | Description of Document | | Registrant’s
Form | | Dated | | Exhibit
Number | | Filed
Herewith |
| | | | 10-Q | | 8/4/2020 | | 10.5 | | |
| | | | 10-Q | | 8/4/2020 | | 10.7 | | |
| | | | 10-Q | | 11/3/2020 | | 10.3 | | |
| | Amended and Restated Credit Agreement, dated as of October 30, 2020, by and among Blackbaud, Inc., and certain of its subsidiaries, as Borrowers, the lenders referred to therein, Bank of America, N.A., as Administrative Agent, Swingline Lender and Issuing Lender, PNC Bank, National Association, as Syndication Agent, and Regions Bank, BBVA USA and Fifth Third Bank, National Association, as Co-Documentation Agents, with BofA Securities, Inc., PNC Bank, National Association, Regions Capital Markets, BBVA USA and Fifth Third Bank, National Association as Joint Lead Arrangers and Joint Bookrunners. | | 10-Q | | 11/3/2020 | | 10.4 | | |
| | | | 10-Q | | 11/3/2020 | | 10.5 | | |
| | | | 10-Q | | 5/4/2021 | | 10.1 | | |
| | | | 10-Q | | 11/4/2021 | | 10.1 | | |
| | | | 8-K | | 1/3/2022 | | 10.1 | | |
| | Registration Rights Agreement, dated as of December 31, 2021, by and among Blackbaud, Inc., EverFi, Inc., TPG Eon, L.P., each other shareholder party thereto and Eon Stockholder Representative, LLC | | 8-K | | 1/3/2022 | | 10.2 | | |
| | | | 8-K | | 2/3/2022 | | 10.1 | | |
| | | | | | | | | | |
| | | | | | | | | | | | | | | | | | | | | | | | | | | | | | | | |
| | | | Filed In |
Exhibit
Number | | Description of Document | | Registrant’s
Form | | Dated | | Exhibit
Number | | Filed
Herewith |
| | | | | | | | | | X |
| | | | | | | | | | X |
| | | | | | | | | | X |
| | | | | | | | | | X |
| | | | | | | | | | X |
| | | | | | | | | | X |
| 101.INS | | Inline XBRL Instance Document - the Instance Document does not appear in the interactive data file because its XBRL tags are embedded within the Inline XBRL Document. | | | | | | | | X |
| 101.SCH | | Inline XBRL Taxonomy Extension Schema Document | | | | | | | | X |
| 101.CAL | | Inline XBRL Taxonomy Extension Calculation Linkbase Document | | | | | | | | X |
| 101.DEF | | Inline XBRL Taxonomy Extension Definition Linkbase Document | | | | | | | | X |
| 101.LAB | | Inline XBRL Taxonomy Extension Label Linkbase Document | | | | | | | | X |
| 101.PRE | | Inline XBRL Taxonomy Extension Presentation Linkbase Document | | | | | | | | X |
| 104 | | Cover Page Interactive Data File (formatted as Inline XBRL and contained in Exhibit 101). | | | | | | | | X |
| | | | | |
| † | Indicates management contract or compensatory plan, contract or arrangement. |
ITEM 16. Form 10-K Summary
Not applicable.
Pursuant to the requirements of Section 13 or 15(d) of the Securities Exchange Act of 1934, the Registrant has duly caused this Form 10-K to be signed on its behalf by the undersigned, thereunto duly authorized.
| | | | | | | | |
| | |
| | Blackbaud, Inc. |
| | |
| Signed: | March 1, 2022 | /S/ MICHAEL P. GIANONI |
| | President and Chief Executive Officer |
| | (Principal Executive Officer) |
Pursuant to the requirements of the Securities Exchange Act of 1934, this Form 10-K has been signed below by the following persons on behalf of the Registrant and on the dates indicated.
| | | | | | | | | | | | | | | | | | | | | | | | | | |
| | | | | | | | |
| | | | | | | | |
| /S/ | MICHAEL P. GIANONI | | President, Chief Executive Officer and Director (Principal Executive Officer) | | Date: | March 1, 2022 |
| | | Michael P. Gianoni | | | | |
| | | | | | | | |
| /S/ | ANTHONY W. BOOR | | Executive Vice President and Chief Financial Officer (Principal Financial and Accounting Officer) | | Date: | March 1, 2022 |
| | | Anthony W. Boor | | | | |
| | | | | | | | |
| /S/ | ANDREW M. LEITCH | | Chairman of the Board of Directors | | Date: | March 1, 2022 |
| | | Andrew M. Leitch | | | | |
| | | | | | | | |
| /S/ | TIMOTHY CHOU | | Director | | Date: | March 1, 2022 |
| | | Timothy Chou | | | | |
| | | | | | | | |
| /S/ | GEORGE H. ELLIS | | Director | | Date: | March 1, 2022 |
| | | George H. Ellis | | | | |
| | | | | | | | |
| /S/ | D. ROGER NANNEY | | Director | | Date: | March 1, 2022 |
| | | D. Roger Nanney | | | | |
| | | | | | | | |
| /S/ | SARAH E. NASH | | Director | | Date: | March 1, 2022 |
| | | Sarah E. Nash | | | | |
| | | | | | | | |
| /S/ | JOYCE M. NELSON | | Director | | Date: | March 1, 2022 |
| | | Joyce M. Nelson | | | | |