Endeavour Silver Corp.: Exhibit 99.2 - Filed by newsfilecorp.com
MANAGEMENT'S DISCUSSION AND ANALYSIS
FOR THE PERIOD ENDED JUNE 30, 2022
This Management Discussion and Analysis ("MD&A") should be read in conjunction with the condensed consolidated interim financial statements of Endeavour Silver Corp. ("Endeavour" or "the Company") for the three and six months ended June 30, 2022 and the related notes contained therein, which were prepared in accordance with IAS34 Interim financial reporting of the International Financial Reporting Standards ("IFRS") as issued by the International Accounting Standards Board ("IASB"). The Company uses certain non-IFRS financial measures in this MD&A as described under "Non-IFRS Measures". Additional information relating to the Company, including the most recent Annual Information Form (the "Annual Information Form"), is available on SEDAR at www.sedar.com, and the Company's most recent annual report on Form 40-F has been filed with the U.S. Securities and Exchange Commission (the "SEC") on EDGAR at www.sec.gov. This MD&A contains "forward-looking statements" that are subject to risk factors set out in a cautionary note contained herein. All dollar ($) amounts are expressed in United States ("$.") dollars and tabular amounts are expressed in thousands of U.S. dollars unless Canadian dollars (CAN$) are otherwise indicated. This MD&A is dated as of August 4, 2022 and all information contained is current as of August 4, 2022 unless otherwise stated.
Cautionary Note to U.S. Investors Regarding Mineral Reserves and Resources
This MD&A has been prepared in accordance with the requirements of Canadian provincial securities laws, which differ from the requirements of U.S. securities laws. As a result, the Company reports the mineral reserves and resources of the projects it has an interest in according to Canadian standards. Canadian reporting requirements for disclosure of mineral properties are governed by National Instrument 43-101 - Standards of Disclosure for Mineral Projects ("NI-43 101"). NI-43 101 is a rule developed by the Canadian Securities Administrators that establishes standards for all public disclosure an issuer makes of scientific and technical information concerning mineral projects. These standards differ from the requirements of the SEC that are applicable to domestic United States reporting companies under subpart 1300 of Regulation S-K ("S-K 1300") under the Exchange Act. As an issuer that prepares and files its reports with the SEC pursuant to the MJDS, the Company is not subject to the requirements of S-K 1300. Any mineral reserves and mineral resources reported by the Company in accordance with NI 43-101 may not qualify as such under or differ from those prepared in accordance with S-K 1300. Accordingly, information included or incorporated by reference in this MD&A concerning descriptions of mineralization and estimates of mineral reserves and resources under Canadian standards may not be comparable to similar information made public by United States companies subject to the reporting and disclosure requirements of S-K 130.
Forward-Looking Statements
This MD&A contains "forward-looking statements" within the meaning of the U.S. Securities Litigation Reform Act of 1995, as amended and "forward-looking information" within the meaning of applicable Canadian securities legislation. Such forward-looking statements and information include, but are not limited to, statements regarding Endeavour's anticipated performance in 2022, including silver and gold production, financial results, timing and expenditures to develop new silver mines and mineralized zones, silver and gold grades and recoveries, cash costs per ounce (oz), capital expenditures and sustaining capital and the impact of the COVID 19 pandemic on operations. Forward-looking statements are frequently characterized by words such as "plan", "expect", "forecast", "project", "intend", "believe", "anticipate", "outlook" and other similar words, or statements that certain events or conditions "may" or "will" occur. Forward- looking statements are based on the opinions and estimates of management at the dates the statements are made, and are subject to a variety of risks and uncertainties and other factors that could cause actual events or results to differ materially from those projected in the forward-looking statements.
The Company does not intend to, and does not assume any obligation to, update such forward-looking statements or information, other than as required by applicable law. Forward-looking statements or information involve known and unknown risks, uncertainties and other factors and are based on assumptions that may cause the actual results, level of activity, performance or achievements of the Company and its operations to be materially different from those expressed or implied by such statements. Such factors and assumptions include, among others: the ultimate impact of the COVID 19 pandemic on operations and results, fluctuations in the prices of silver and gold, fluctuations in the currency markets (particularly the Mexican peso, Chilean peso, Canadian dollar and U.S. dollar); changes in national and local governments, legislation, taxation, controls, regulations and political or economic developments in Canada and Mexico; operating or technical difficulties in mineral exploration, development and mining activities; risks and hazards of mineral exploration, development and mining (including, but not limited to environmental hazards, industrial accidents, unusual or unexpected geological conditions, pressures, cave-ins and flooding); inadequate insurance, or inability to obtain insurance; availability of and costs associated with mining inputs and labour; the speculative nature of mineral exploration and development, diminishing quantities or grades of mineral reserves as properties are mined; the ability to successfully integrate acquisitions; risks in obtaining necessary licenses and permits, and challenges to the Company's title to properties; as well as those factors described under "Risk Factors" in the Company's Annual Information Form. Although the Company has attempted to identify important factors that could cause actual results to differ materially from those contained in forward-looking statements or information, there may be other factors that cause results to be materially different from those anticipated, described, estimated, assessed or intended. There can be no assurance that any forward-looking statements or information will prove to be accurate as actual results and future events could differ materially from those anticipated in such statements or information. Accordingly, readers should not place undue reliance on forward-looking statements or information.
Qualified Person
The scientific and technical information contained in this MD&A relating to the Company's mines and mineral projects has been reviewed and approved by Dale Mah, B.Sc., P.Geo., Vice President Corporate Development of Endeavour, a Qualified Person within the meaning of NI 43-101.
Table of Contents
OPERATING HIGHLIGHTS
| Three Months Ended June 30 |
Q2 2022 Highlights |
Six Months Ended June 30 |
| 2022 |
2021 |
% Change |
2022 |
2021 |
% Change |
| |
|
|
Production |
|
|
|
| 1,359,207 |
1,073,724 |
27% |
Silver ounces produced |
2,674,162 |
2,121,824 |
26% |
| 9,289 |
11,166 |
(17%) |
Gold ounces produced |
17,984 |
22,275 |
(19%) |
| 1,346,276 |
1,062,267 |
27% |
Payable silver ounces produced |
2,649,816 |
2,098,977 |
26% |
| 9,117 |
10,955 |
(17%) |
Payable gold ounces produced |
17,666 |
21,849 |
(19%) |
| 2,102,327 |
1,967,004 |
7% |
Silver equivalent ounces produced(1) |
4,112,882 |
3,903,824 |
5% |
| 10.08 |
13.03 |
(23%) |
Cash costs per silver ounce(2)(3) |
10.14 |
10.48 |
(3%) |
| 14.26 |
19.55 |
(27%) |
Total production costs per ounce(2)(4) |
14.69 |
17.51 |
(16%) |
| 19.56 |
25.39 |
(23%) |
All-in sustaining costs per ounce (2)(5) |
20.22 |
22.69 |
(11%) |
| 201,361 |
242,018 |
(17%) |
Processed tonnes |
407,508 |
451,471 |
(10%) |
| 132.63 |
119.94 |
11% |
Direct operating costs per tonne(2)(6) |
127.69 |
116.43 |
10% |
| 148.11 |
141.61 |
5% |
Direct costs per tonne(2)(6) |
148.32 |
134.48 |
10% |
| 14.12 |
18.52 |
(24%) |
Silver co-product cash costs(7) |
14.74 |
16.89 |
(13%) |
| 1,144 |
1,289 |
(11%) |
Gold co-product cash costs(7) |
1,169 |
1,116 |
5% |
| |
|
|
Financial |
|
|
|
| 30.8 |
47.7 |
(35%) |
Revenue ($ millions) |
88.5 |
82.2 |
8% |
| 602,894 |
1,120,266 |
(46%) |
Silver ounces sold |
2,320,662 |
1,743,645 |
33% |
| 9,792 |
9,810 |
(0%) |
Gold ounces sold |
18,173 |
20,473 |
(11%) |
| 22.72 |
26.82 |
(15%) |
Realized silver price per ounce |
23.95 |
26.95 |
(11%) |
| 1,840 |
1,866 |
(1%) |
Realized gold price per ounce |
1,900 |
1,781 |
7% |
| (11.9) |
6.7 |
(279%) |
Net earnings (loss) ($ millions) |
(0.3) |
18.9 |
(101%) |
| (11.9) |
0.8 |
(1,504%) |
Adjusted net earnings (loss) (11) ($ millions) |
(0.3) |
(3.7) |
93% |
| 4.5 |
10.2 |
56% |
Mine operating earnings ($ millions) |
24.7 |
15.9 |
56% |
| 8.8 |
17.2 |
(49%) |
Mine operating cash flow before taxes ($ millions)(8) |
35.5 |
30.5 |
16% |
| 3.6 |
8.7 |
(58%) |
Operating cash flow before working capital changes(9) |
24.2 |
13.9 |
74% |
| (4.3) |
15.9 |
(127%) |
EBITDA(10) ($ millions) |
21.3 |
39.8 |
(47%) |
| 149.7 |
146.8 |
2% |
Working capital (12) ($ millions) |
149.7 |
146.8 |
2% |
| |
|
|
Shareholders |
|
|
|
| (0.07) |
0.04 |
(275%) |
Earnings (loss) per share - basic ($) |
0.00 |
0.12 |
(100%) |
| (0.07) |
0.01 |
(1,407%) |
Adjusted earnings (loss) per share - basic ($)(11) |
(0.00) |
(0.02) |
93% |
| 0.02 |
0.05 |
(61%) |
Operating cash flow before working capital changes per share(9) |
0.14 |
0.08 |
62% |
| 180,974,609 |
168,383,755 |
7% |
Weighted average shares outstanding |
176,291,929 |
164,051,368 |
7% |
(1) Silver equivalents are calculated using an 80:1 (Ag/Au) ratio.
(2) The Company reports non-IFRS measures and ratios which include cash costs net of by-product revenue on a payable silver basis, total production costs per oz, all-in sustaining costs ("AISC") per oz, direct operating cost per tonne, direct cost per tonne, silver co-product cash costs and gold co-product cash costs in order to manage and evaluate operating performance at each of the Company's mines. These measures, some established by the Silver Institute (Production Cost Standards, June 2011), are widely used in the silver mining industry as a benchmark for performance, but do not have a standardized meaning. These measures are reported on a production basis. See Reconciliations to IFRS beginning on page 17.
(3) Cash costs net of by-product revenue per payable silver oz include mining, processing (including smelting, refining, transportation and selling costs), and direct overhead, net of gold credits. See Reconciliation to IFRS on pages 20 and 21.
(4) Total production costs per oz include mining, processing (including smelting, refining, transportation and selling costs), direct overhead, amortization, depletion and amortization at the operation sites net of by-product revenues. See Reconciliation to IFRS on pages 20 and 21.
(5) AlSC per oz include mining, processing (including smelting, refining, transportation and selling costs), direct overhead, corporate general and administration expenses, on-site exploration, share-based compensation, reclamation and sustaining capital net of gold credits. See Reconciliation to IFRS on page 22.
(6) Direct operating costs per tonne include mining, processing (including smelting, refining, transportation and selling costs) and direct overhead at the operation sites. Direct cost per tonne include all direct operating costs, royalties and special mining duty. See Reconciliation to IFRS on pages 20 and 21.
(7) Silver co-product cash cost and gold co-product cash cost include mining, processing (including smelting, refining, transportation and selling costs), and direct overhead allocated on pro-rated basis of realized metal value. See Reconciliation to IFRS on pages 23 and 24.
(8) Mine operating cash flow is calculated by adding back amortization, depletion, inventory write-downs and share-based compensation to mine operating earnings. Mine operating earnings and mine operating cash flow are before taxes. See Reconciliation to IFRS on page 18.
(9) See Reconciliation to IFRS on page 18 for the reconciliation of operating cash flow before working capital changes and for the operating cash flow before working capital changes per share.
(10) See Reconciliation of Earnings before interest, taxes, depreciation and amortization on page 19.
(11) Adjusted net earnings for three month period ended June 30, 2021 is calculated by adding back the gain on disposal of the El Cubo mine and for the six months period ended June 30, 2021 is calculated by adding back reversals of impairment on non-current assets for the El Cubo mine and the gain on disposal of the El Cubo mine, which had a significant effect on reported net earnings.
(12) Working capital is calculated by deducting current liabilities from current assets. See Reconciliation to IFRS on page 17.
The above highlights are key measures used by management, however they should not be the sole measures used in determining the performance of the Company's operations.
HISTORY AND STRATEGY
The Company is engaged in silver mining in Mexico and related activities including property acquisition, exploration, development, mineral extraction, processing, refining and reclamation. The Company is also engaged in exploration activities in Chile and Nevada, USA. Since 2002, the Company's business strategy has been to focus on acquiring advanced-stage silver mining properties in Mexico. Mexico, despite its long and prolific history of metal production, appears to be relatively under-explored using modern exploration techniques and offers promising geological potential for precious metals exploration and production.
The Company's Guanaceví and Bolañitos mines acquired in 2004 and 2007, respectively, demonstrate its initial business model of acquiring fully built and permitted silver mines that were about to close for lack of ore. Investing resources expertise needed to discover new silver ore-bodies, the Company successfully re-opened and expanded these mines to realize their full potential. The benefit of acquiring fully built and permitted mining and milling infrastructure is that, if new exploration efforts are successful, the mine development cycle from discovery to production only takes a matter of months instead of the several years normally required in the traditional mining business model.
In addition to operating the Guanaceví and Bolañitos mines in 2021, the Company also operated the El Compas mine. The Company acquired the El Compas mine in 2016, which was commissioned in March 2019, and operated until August 2021, when the Company suspended mining and milling operations due to exhaustion of reserves and it currently remains on care and maintenance. Management is currently evaluating it alternatives for the asset.
In 2012, the Company acquired the El Cubo silver-gold mine located in Guanajuato, Mexico, which was operated until November 2019. On March 17, 2021, the Company signed a definitive agreement to sell the El Cubo mine and related assets to Guanajuato Silver Company Ltd. ("GSilver") (formerly known as VanGold Mining Corp.) for a combination of cash and share payments plus additional contingency payments with completion of the sale on April, 9, 2021.
The Company is advancing the Terronera development project and on September 9, 2021 released a positive feasibility study for the project. The Company intends to make a formal construction decision, subject to completion of a financing package and receipt of amended permits in the coming months.
On August 31, 2021 the Company acquired the Bruner Property, a gold exploration project, located in Nye County, Nevada. The Company paid $10 million in cash for 100% of the Bruner Gold Project which includes mineral claims, mining rights, property assets, water rights, and government authorizations and permits.
On January 12, 2022, the Company entered into a definitive agreement to purchase the Pitarrilla project in Durango State, Mexico from SSR Mining Inc. ("SSR") for total consideration of $70 million, consisting of $35 million in common shares and a further $35 million in cash or in common shares at the election of SSR and agreed to by the Company, and a grant of a 1.25% NSR royalty. The acquisition was completed on July 6, 2022. Total consideration paid included 8,577,380 shares of the Company issued on July 6, 2022 with a deemed value of $34,909,937 and a $35,066,829 cash payment.
The Company is advancing several other exploration projects in order to achieve its goal to become a premier senior producer in the silver mining sector.
The Company has historically funded its acquisition, exploration and development activities through equity financings, debt facilities and convertible debentures. In recent years, the Company has financed most of its acquisition, exploration, development and operating activities from production cash flows, treasury and equity financings. The Company may choose to undertake equity, debt, convertible debt or other financings, on an as-needed basis, in order to facilitate its growth.
As of June 30, 2022, the Company held $116.2 million in cash and $149.7 million in working capital. Management believes there is sufficient working capital to meet the Company's current obligations.
REVIEW OF OPERATING RESULTS
The Company operates the Guanaceví and Bolañitos mines. The Company suspended mining operations at the El Compas mine in August 2021 due to exhaustion of reserves and it currently remains on care and maintenance.
Consolidated Production Results for the Three and Six Months Ended June 30, 2022 and 2021
| Three Months Ended June 30 |
CONSOLIDATED |
Six Months Ended June 30 |
| 2022 |
2021 |
% Change |
|
2022 |
2021 |
% Change |
| 201,361 |
242,018 |
(17%) |
Ore tonnes processed |
407,508 |
451,471 |
(10%) |
| 246 |
163 |
51% |
Average silver grade (gpt) |
238 |
170 |
40% |
| 85.4 |
84.9 |
1% |
Silver recovery (%) |
85.7 |
85.8 |
(0%) |
| 1,359,207 |
1,073,724 |
27% |
Total silver ounces produced |
2,674,162 |
2,121,824 |
26% |
| 1,346,276 |
1,062,267 |
27% |
Payable silver ounces produced |
2,649,816 |
2,098,977 |
26% |
| 1.58 |
1.63 |
(3%) |
Average gold grade (gpt) |
1.52 |
1.76 |
(13%) |
| 90.6 |
87.9 |
3% |
Gold recovery (%) |
90.0 |
87.2 |
3% |
| 9,289 |
11,166 |
(17%) |
Total gold ounces produced |
17,984 |
22,275 |
(19%) |
| 9,117 |
10,955 |
(17%) |
Payable gold ounces produced |
17,666 |
21,849 |
(19%) |
| 2,102,327 |
1,967,004 |
7% |
Silver equivalent ounces produced(1) |
4,112,882 |
3,903,824 |
5% |
| 10.08 |
13.03 |
(23%) |
Cash costs per silver ounce(2)(3) |
10.14 |
10.48 |
(3%) |
| 14.26 |
19.55 |
(27%) |
Total production costs per ounce(2)(4) |
14.69 |
17.51 |
(16%) |
| 19.56 |
25.39 |
(23%) |
All in sustaining costs per ounce (2)(5) |
20.22 |
22.69 |
(11%) |
| 132.63 |
119.94 |
11% |
Direct operating costs per tonne(2)(6) |
127.69 |
116.43 |
10% |
| 148.11 |
141.61 |
5% |
Direct costs per tonne(2)(6) |
148.32 |
134.48 |
10% |
| 14.12 |
18.52 |
(24%) |
Silver co-product cash costs(7) |
14.74 |
16.89 |
(13%) |
| 1,144 |
1,289 |
(11%) |
Gold co-product cash costs(7) |
1,169 |
1,116 |
5% |
(1) Silver equivalents are calculated using an 80:1 (Ag/Au) ratio.
(2) The Company reports non-IFRS measures which include cash costs net of by-product revenue on a payable silver basis, total production costs per oz, AISC per oz, direct operating cost per tonne, direct cost per tonne, silver co-product cash costs and gold co-product cash costs in order to manage and evaluate operating performance at each of the Company's mines. These measures, some established by the Silver Institute (Production Cost Standards, June 2011), are widely used in the silver mining industry as a benchmark for performance, but do not have a standardized meaning. These measures are reported on a production basis. See Reconciliations to IFRS on page 17.
(3) Cash costs net of by-product revenue per payable silver oz include mining, processing (including smelting, refining, transportation and selling costs), and direct overhead, net of gold credits. See Reconciliation to IFRS on pages 20 and 21.
(4) Total production costs per oz include mining, processing (including smelting, refining, transportation and selling costs), direct overhead, amortization, depletion and amortization at the operation sites net of by product revenues. See Reconciliation to IFRS on pages 20 and 21.
(5) AISC per oz include mining, processing (including smelting, refining, transportation and selling costs), direct overhead, corporate general and administration expenses, on-site exploration, share-based compensation, reclamation and sustaining capital net of gold credits. See Reconciliation to IFRS on pages 22.
(6) Direct operating cost per tonne include mining, processing (including smelting, refining, transportation and selling costs) and direct overhead at the operation sites. Direct cost per tonne include all direct operating costs, royalties and special mining duty. See Reconciliation to IFRS on pages 20 and 21.
(7) Silver co-product cash cost and gold co-product cash cost include mining, processing (including smelting, refining, transportation and selling costs), and direct overhead allocated on pro-rated basis of realized metal value. See Reconciliation to IFRS on pages 23 and 24.
(1) Silver equivalents are calculated using an 80:1 (Ag/Au) ratio.
Consolidated Production
Three months ended June 30, 2022 (compared to the three months ended June 30, 2021)
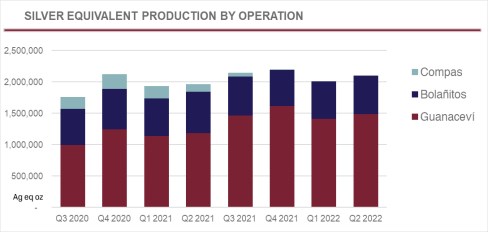
Consolidated silver production during Q2, 2022 was 1,359,207 oz, an increase of 27% compared to 1,073,724 oz in Q2, 2021, and gold production was 9,289 oz, a decrease of 17% compared to 11,166 oz in Q2, 2021. Plant throughput was 201,361 tonnes at average grades of 246 grams per tonne (gpt) silver and 1.58 gpt gold, compared to 242,018 tonnes grading 163 gpt silver and 1.63 gpt gold in Q2, 2021. The 27% increase in consolidated silver production, compared to Q2, 2021, is driven by a 27% increase in silver production at the Guanaceví mine and a 37% increase in silver production at the Bolañitos mine, partially offset by the suspension of the El Compas operations. Consolidated gold production decreased by 17% compared to Q2, 2021, primarily due to the suspension of the El Compas operation and a 17% decrease at the Bolañitos mine, partially offset by a 27% increase in gold production at the Guanaceví mine. The increase in silver and gold production at the Guanaceví mine was driven by a 51% increase in ore silver grade and a 40% increase in ore gold grade, offset by a 16% decrease in throughput with similar recoveries. At the Bolañitos mine the increase in silver production was attributable to a 38% increase in ore silver grade with similar throughput and recoveries. The decrease in gold production was attributable to an 17% decrease in ore gold grade.
Six months ended June 30, 2022 (compared to the six months ended June 30, 2021)
Consolidated silver production during the first half of 2022 was 2,674,162 oz, an increase of 26% compared to 2,121,824 oz in the first half of 2021, and gold production was 17,984 oz, a decrease of 19% compared to 22,275 oz in the first half of 2021. Plant throughput was 407,508 tonnes at average grades of 238 grams per tonne (gpt) silver and 1.52 gpt gold, compared to 451,471 tonnes grading 170 gpt silver and 1.76 gpt gold in the first half of, 2021. The 26% increase in consolidated silver production, compared to 2021, is driven by a 25% increase in silver production at the Guanaceví mine and a 53% increase in silver production at the Bolañitos mine, partially offset by the suspension of the El Compas operations. Consolidated gold production decreased by 19% compared to 2021, primarily due to the suspension of the El Compas operation and a 16% decrease at the Bolañitos mine, partially offset by a 23% increase in gold production at the Guanaceví mine. The increase in silver and gold production at the Guanaceví mine was driven by a 30% increase in silver grade and a 27% increase in gold grade, with slightly lower throughput and similar recoveries. At the Bolañitos mine the increase in silver production was attributable to a 3% increase in throughput, a 46% increase in ore silver grade offset with similar recoveries. The decrease in gold production was attributable to an 19% decrease in ore gold grade and a slight increase in throughput.
Consolidated Operating Costs
Three months ended June 30, 2022 (compared to the three months ended June 30, 2021)
Direct operating costs per tonne in Q2, 2022 increased 11% to $132.63 compared with Q2, 2021 due to a reduction in ore tonnes processed and higher operating costs at both Guanaceví and Bolañitos. Guanaceví and Bolañitos have seen increased labour, power and consumable costs and at Guanaceví, increased third party ore purchased has increased compared to the prior year. Including royalties and special mining duty, direct costs per tonne increased 5% to $148.11. Compared to Q2, 2021, royalties have decreased 50% to $2.2 million with the majority of the decrease in Guanaceví.
At Guanacevi the decrease in royalty expense recognized during Q2, 2022 is due to both a reduction in the realized silver price and the increase in unsold ounces in finished goods at June 30, 2022 compared to June 30, 2021. Increased profitability increased special mining duty from $0.7 million in Q2, 2021 to $0.8 million in Q2, 2022.
Consolidated cash costs per oz, net of by-product credits decreased 23% to $10.08 driven by increased silver grades, reduced royalty costs and increased by-product gold sales, offset by increased direct costs per tonne. All-In-Sustaining Costs ("AISC") decreased by 23% on a per oz basis compared to Q2, 2021 as a result of a 27% increase in ounces produced driven by a 51% increase in silver grade, decreased allocated general and administrative costs and a decrease in mine site exploration offset by increased sustaining capital expenditures.
Corporate general and administrative expenses included a $1.6 million mark-to-market recovery of cash-settled deferred share units, whereas the mark-to-market expense was $1.6 million in Q2, 2021, attributable to period end changes in the Company's share price.
On a co-product cash costs basis, silver cost per oz decreased by 24% and gold cost per oz decreased 11% compared to the Q2, 2021. Increase silver production due to improved silver ore grade was offset by higher operating costs and gold co-product cash costs decreased due to a reduction in proportional costs resulting from decrease gold production.
Six months ended June 30, 2022 (compared to the six months ended June 30, 2021)
Direct operating costs per tonne in the first half of 2022 increased 10%, to $127.69 compared with the same period of 2021 due to higher operating costs at both Guanaceví and Bolañitos. Guanaceví and Bolañitos have seen increased labour, power and consumable costs and at Guanaceví, increased third party ore purchased has increased compared to the prior year. Including royalties and special mining duty, direct costs per tonne increased 10% to $148.32. Compared to the first half of 2021, royalties have decreased 4% to $6.5 million with the decrease primarily due to the recognition of royalties for El Compas in the prior period. Increased profitability increased special mining duty from $1.3 million to $1.9 million for the first half of 2022 compared to the same period in 2021.
Consolidated cash costs per oz, net of by-product credits decreased 3% to $10.14 due to increased silver grades offset by higher direct costs per tonne and lower gold credit. All-In-Sustaining Costs ("AISC") decreased by 11% on a per oz basis compared to the first half of 2021 as a result of a 26% increase in ounces produced driven by a 40% increase in silver grade, decreased allocated general and administrative costs and a decrease in mine site exploration offset by increased sustaining capital expenditures.
Corporate general and administrative expenses included a $1.0 million mark-to-market recovery of cash-settled deferred share units, whereas the mark-to-market expense was $1.9 million in first half of 2021, attributable to period end changes in the Company's share price.
On a co-product cash costs basis, silver cost per oz decreased 13% and gold cost per oz increased 5% compared to the first half of 2021. Increase silver production due to improved silver ore grade was offset by higher operating costs and gold co-product cash costs increased due to a reduction in the average realized gold price.
GUANACEVÍ OPERATIONS
The Guanaceví operation is currently producing from three underground silver-gold mines along a five kilometre ("km") length of the prolific Santa Cruz vein. Guanaceví provides steady employment to over 550 people and engages over 330 contractors.
In July 2019, the Company acquired a 10 year right to explore and exploit the El Porvenir and El Curso concessions from Ocampo Mining SA de CV ("Ocampo"), a subsidiary of Grupo Frisco. The Company agreed to meet certain minimum production targets from the properties, subject to various terms and conditions and pay Ocampo a $12 fixed per tonne production payment plus a floating net smelter return royalty based on the spot silver price. The Company pays a 4% royalty on sales below $15.00 per silver oz, 9% above $15.00 per silver oz, 13% above $20.00 per silver oz, and a maximum of 16% above $25 per silver oz, based on then current realized prices. On December 12, 2021, the Company executed an amendment to the agreement whereby two additional concessions, adjacent to the existing and historic mine workings, were included in the existing agreement.
Production Results for the Three and Six Months Ended June 30, 2022 and 2021
| Three Months Ended June 30 |
GUANACEVÍ |
Six Months Ended June 30 |
| 2022 |
2021 |
% Change |
|
2022 |
2021 |
% Change |
| 94,017 |
111,893 |
(16%) |
Ore tonnes processed |
195,270 |
200,525 |
(3%) |
| 465 |
308 |
51% |
Average silver grade (g/t) |
435 |
335 |
30% |
| 85.0 |
84.8 |
0% |
Silver recovery (%) |
85.2 |
86.0 |
(1%) |
| 1,194,150 |
939,241 |
27% |
Total silver ounces produced |
2,328,000 |
1,857,458 |
25% |
| 1,190,568 |
936,424 |
27% |
Payable silver ounces produced |
2,321,016 |
1,851,886 |
25% |
| 1.37 |
0.98 |
40% |
Average gold grade (g/t) |
1.28 |
1.01 |
27% |
| 88.9 |
87.5 |
2% |
Gold recovery (%) |
89.1 |
89.5 |
(0%) |
| 3,680 |
3,084 |
19% |
Total gold ounces produced |
7,157 |
5,827 |
23% |
| 3,668 |
3,075 |
19% |
Payable gold ounces produced |
7,135 |
5,810 |
23% |
| 1,488,550 |
1,185,961 |
26% |
Silver equivalent ounces produced(1) |
2,900,560 |
2,323,618 |
25% |
| 10.35 |
17.06 |
(39%) |
Cash costs per silver ounce(2)(3) |
11.26 |
14.19 |
(21%) |
| 12.90 |
19.98 |
(35%) |
Total production costs per ounce(2)(4) |
14.16 |
17.01 |
(17%) |
| 17.66 |
24.68 |
(28%) |
All in sustaining costs per ounce (2)(5) |
19.06 |
21.93 |
(13%) |
| 170.75 |
149.81 |
14% |
Direct operating costs per tonne(2)(6) |
162.61 |
145.86 |
11% |
| 201.84 |
193.09 |
5% |
Direct costs per tonne(2)(6) |
203.00 |
182.33 |
11% |
| 12.72 |
18.72 |
(32%) |
Silver co-product cash costs(7) |
13.69 |
16.30 |
(16%) |
| 1,030 |
1,303 |
(21%) |
Gold co-product cash costs(7) |
1,086 |
1,078 |
1% |
(1) Silver equivalents are calculated using an 80:1 (silver/gold) ratio.
(2) The Company reports non-IFRS measures which include cash costs net of by-product revenue on a payable silver basis, total production costs per oz, AISC per oz, direct operating cost per tonne, direct cost per tonne, silver co-product cash costs and gold co-product cash costs in order to manage and evaluate operating performance at each of the Company's mines. These measures, some established by the Silver Institute (Production Cost Standards, June 2011), are widely used in the silver mining industry as a benchmark for performance, but do not have a standardized meaning. These measures are reported on a production basis. See Reconciliations to IFRS on page 17.
(3) Cash costs net of by-product revenue per payable silver oz include mining, processing (including smelting, refining, transportation and selling costs), and direct overhead, net of gold credits. See Reconciliation to IFRS on pages 20 and 21.
(4) Total production costs per oz include mining, processing (including smelting, refining, transportation and selling costs), direct overhead, amortization, depletion and amortization at the operation sites net of by product revenues. See Reconciliation to IFRS on page 20 and 21.
(5) AISC per oz include mining, processing (including smelting, refining, transportation and selling costs), direct overhead, corporate general and administration expenses, on-site exploration, share-based compensation, reclamation and sustaining capital net of gold credits. See Reconciliation to IFRS on page 22.
(6) Direct operating costs per tonne include mining, processing (including smelting, refining, transportation and selling costs) and direct overhead at the operation sites. Direct cost per tonne include all direct operating costs, royalties and special mining duty. See Reconciliation to IFRS on pages 20 and 21.
(7) Silver co-product cash cost and gold co-product cash cost include mining, processing (including smelting, refining, transportation and selling costs), and direct overhead allocated on pro-rated basis of realized metal value. See Reconciliation to IFRS on pages 23 and 24.
Guanaceví Production Results
Three months ended June 30, 2022 (compared to the three months ended June 30, 2021)
Silver production at the Guanaceví mine during Q2, 2022 was 1,194,150 oz, an increase of 27% compared to 939,241 oz in Q2, 2021, and gold production was 3,680 oz, an increase of 19% compared to 3,084 oz in Q2, 2021. Plant throughput was 16% lower in Q2, 2022 with 94,017 tonnes at average grades of 465 gpt silver and 1.37 gpt gold, compared to 111,893 tonnes grading 308 gpt silver and 0.98 gpt gold in Q2, 2021. The 27% increase in silver production is due to a 51% increase in silver grades offset by lower throughput and the 19% increase in gold production is due to a 40% increase in gold grades and slightly increased recoveries offset by somewhat lower throughput. During a portion of Q2, 2022, the plant throughput was slowed for installation of a new cone crusher and maintenance of leach tanks. The purchase of third-party ores continued to supplement mine production.
Six months ended June 30, 2022 (compared to the six months ended June 30, 2021)
Consolidated silver production during the first half of 2022 was 2,328,000 oz, an increase of 25% compared to 1,857,458 oz in the first half of 2021, and gold production was 7,157 oz, an increase of 23% compared to 5,827 oz in the first half of 2021. Plant throughput was 195,270 tonnes at average grades of 435 grams per tonne (gpt) silver and 1.28 gpt gold compared to 200,525 tonnes at average grades of 335 gpt silver and 1.01 gpt gold in the first half of 2021. The 3% decrease in throughput was a result of reducing throughput during Q2, 2022 for the installation of a new cone crusher and maintenance of leach tanks. The 25% increase in silver production and 23% increase in gold production compared to 2021 is primarily due to the substantially higher grades offset by slightly lower throughput with similar recoveries.
Guanaceví Operating Costs
Three months ended June 30, 2022 (compared to the three months ended June 30, 2021)
Direct operating costs per tonne for the three months ended June 30, 2022 increased 14% to $170.75 compared with the same period in 2021, resulting from increased purchase of local third-party ores, increased labour, power and consumables costs, and an increase in operating development. The local third-party ore contributed $27.44 per tonne during Q2, 2022 compared to $21.15 per tonne in Q2, 2021 due to increased tonnes and grades. There was a decrease in royalty expense recognized during Q2, 2022 due to both a reduction in the realized silver price and the increase in unsold ounces in finished goods at June 30, 2022 compared to June 30, 2021. Royalty expense decreased from $4.3 million to $2.2 million, which are included in cost per tonne and oz metrics. The decrease in royalty costs during the three months ended June 30, 2022 compared to the prior period is due to the timing of sales.
Cash costs per oz, net of by-product credits, decreased 39% to $10.35 compared to $17.06 for the same period in 2021, with the decrease due to increased silver production resulting from increased silver grades mined and increased gold credit offset by higher direct costs per tonne. Similarly, AISC per oz decreased 28% to $17.66 per oz for the three months ended June 30, 2022, due to increased silver production and decreased allocated general and administrative expenses offset by the increase in sustaining capital expenditures.
Six months ended June 30, 2022 (compared to the six months ended June 30, 2021)
Direct operating costs per tonne in the first half of 2022 increased 11% to $162.61 compared with the same period in 2021, as a result of increased purchase of local third-party ores, increased labour costs, and an increase in operating development. The local third-party ore contributed $28.16 per tonne during the first half of, 2022 compared to $21.50 per tonne in the comparable period in 2021 due to increased tonnes and grades. Including royalty and special mining duty costs direct cost per tonne increased 11% to $203.00 compared with the same period in 2021. Royalty expense was flat during the three months ended June 30, 2022 compared to the prior period primarily due to the timing of sales. The increased metal ore grades resulted in improved profitability and higher special mining duty payable to the Mexican government.
Cash costs per oz, net of by-product credits, decreased 21% to $11.26 compared to $14.16 for the same period in 2021, with the decrease due to increased silver production resulting from increased silver grades offset by higher direct costs per tonne and lower gold credit. Similarly, AISC per oz decreased 13% to $19.06 per oz for the six months ended June 30, 2022,
due to increased silver production and decreased allocated general and administrative expenses offset by the increase in sustaining capital expenditures.
BOLAÑITOS OPERATIONS
The Bolañitos operation encompasses three underground silver-gold mines and a flotation plant. Bolañitos provides steady employment for over 490 people and engages over 150 contractors.
Production Results for the Three and Six Months Ended June 30, 2022 and 2021
| Three Months Ended June 30 |
BOLAÑITOS |
Six Months Ended June 30 |
| 2022 |
2021 |
% Change |
|
2022 |
2021 |
% Change |
| 107,344 |
107,912 |
(1%) |
Ore tonnes processed |
212,238 |
205,604 |
3% |
| 54 |
39 |
38% |
Average silver grade (g/t) |
57 |
39 |
46% |
| 88.6 |
88.7 |
(0%) |
Silver recovery (%) |
89.0 |
87.8 |
1% |
| 165,057 |
120,044 |
37% |
Total silver ounces produced |
346,162 |
226,271 |
53% |
| 155,708 |
112,456 |
38% |
Payable silver ounces produced |
328,800 |
211,444 |
56% |
| 1.77 |
2.14 |
(17%) |
Average gold grade (g/t) |
1.75 |
2.15 |
(19%) |
| 91.8 |
91.0 |
1% |
Gold recovery (%) |
90.7 |
91.0 |
(0%) |
| 5,609 |
6,753 |
(17%) |
Total gold ounces produced |
10,827 |
12,935 |
(16%) |
| 5,449 |
6,584 |
(17%) |
Payable gold ounces produced |
10,531 |
12,612 |
(17%) |
| 613,777 |
660,284 |
(7%) |
Silver equivalent ounces produced(1) |
1,212,322 |
1,261,071 |
(4%) |
| 8.01 |
(30.39) |
126% |
Cash costs per silver ounce(2)(3) |
2.24 |
(27.16) |
108% |
| 24.66 |
4.76 |
(418%) |
Total production costs per ounce(2)(4) |
18.40 |
9.73 |
(89%) |
| 34.10 |
19.56 |
74% |
All in sustaining costs per ounce (2)(5) |
28.46 |
22.05 |
29% |
| 99.25 |
78.66 |
26% |
Direct operating costs per tonne(2)(6) |
95.57 |
77.99 |
23% |
| 101.05 |
81.69 |
24% |
Direct costs per tonne(2)(6) |
98.02 |
80.65 |
22% |
| 17.51 |
14.94 |
17% |
Silver co-product cash costs(7) |
17.26 |
15.34 |
13% |
| 1,419 |
1,040 |
36% |
Gold co-product cash costs(7) |
1,369 |
1,014 |
35% |
(1) Silver equivalents are calculated using an 80:1 (silver/gold) ratio.
(2) The Company reports non-IFRS measures which include cash costs net of by-product revenue on a payable silver basis, total production costs per oz, AISC per oz, direct operating cost per tonne, direct cost per tonne, silver co-product cash costs and gold co-product cash costs in order to manage and evaluate operating performance at each of the Company's mines. These measures, some established by the Silver Institute (Production Cost Standards, June 2011), are widely used in the silver mining industry as a benchmark for performance, but do not have a standardized meaning. These measures are reported on a production basis. See Reconciliations to IFRS on page 17.
(3) Cash costs net of by-product revenue per payable silver oz include mining, processing (including smelting, refining, transportation and selling costs), and direct overhead, net of gold credits. See Reconciliation to IFRS on pages 20 and 21.
(4) Total production costs per oz include mining, processing (including smelting, refining, transportation and selling costs), direct overhead, amortization, depletion and amortization at the operation sites net of by product revenues. See Reconciliation to IFRS on page 20 and 21.
(5) AISC per oz include mining, processing (including smelting, refining, transportation and selling costs), direct overhead, corporate general and administration expenses, on-site exploration, share-based compensation, reclamation and sustaining capital net of gold credits. See Reconciliation to IFRS on page 22.
(6) Direct operating costs per tonne include mining, processing (including smelting, refining, transportation and selling costs) and direct overhead at the operation sites. Direct cost per tonne include all direct operating costs, royalties and special mining duty. See Reconciliation to IFRS on pages 20 and 21.
(7) Silver co-product cash cost and gold co-product cash cost include mining, processing (including smelting, refining, transportation and selling costs), and direct overhead allocated on pro-rated basis of realized metal value. See Reconciliation to IFRS on pages 23 and 24.
Bolañitos Production Results
Three months ended June 30, 2022 (compared to the three months ended June 30, 2021)
Silver production at the Bolañitos mine was 165,057 oz in Q2, 2022, an increase of 37% compared to 120,044 oz in Q2, 2021, and gold production was 5,609 oz in Q2, 2022, a decrease of 17% compared to 6,753 oz in Q2, 2021. Plant throughput in Q2, 2022 was 107,344 tonnes at average grades of 54 gpt silver and 1.77 gpt gold, compared to 107,912 tonnes at average grades of 39 gpt silver and 2.14 gpt gold in Q2, 2021. The 37% increase in silver production and 17% decrease in gold production compared to Q2, 2021 is primarily due to the fluctuations of ore grades from accessing different areas of the mine. There was a 38% increase in silver grades and a 17% decrease in gold grades with similar throughput and recoveries.
Six months ended June 30, 2022 (compared to the six months ended June 30, 2021)
Silver production at the Bolañitos mine was 346,162 oz in the first half of 2022, an increase of 53% compared to 226,271 oz in the first half of 2021, and gold production was 10,827 oz in the first half of 2022, a decrease of 16% compared to 12,935 oz in the first half of 2021. Plant throughput in the first half of 2022 was 212,238 tonnes at average grades of 57 gpt silver and 1.75 gpt gold, compared to 205,604 tonnes at average grades of 39 gpt silver and 2.15 gpt gold. The 53% increase in silver production and 16% decrease in gold production compared to the first half of 2021 is primarily due to the fluctuations of ore grades from accessing different areas of the mine. There was a 46% increase in silver grades and a 19% decrease in gold grades with a 3% increase in throughput and similar recoveries.
Bolañitos Operating Costs
Three months ended June 30, 2022 (compared to the three months ended June 30, 2021)
Direct costs per tonne in Q2, 2022 increased 24% to $99.25 per tonne, primarily due to increased labour, power and consumables and increased operating development costs offset with similar throughput tonnes compared to the same period in 2021. Cash costs net of by-product credits, were $8.01 per oz of payable silver in Q2, 2022 compared to negative $30.39 per oz in Q2, 2021 due to the increased costs compared to the same period in the prior year, and a significant reduction in gold production due to a reduction in the gold grade and realized gold price. AISC increased in Q2, 2022 to $34.10 per oz primarily due to an increase in cash costs net of by-product offset by a decreased allocated general and administrative expenses and a decrease in sustaining capital expenditures.
On a co-product cash costs basis, silver cost per oz increased 17% compared to Q2, 2021 and gold co-product costs increased 36% to $17.51 per silver oz and $1,419 per gold oz, respectively. The increases in the silver cost on a co-product basis were primarily driven by the higher direct costs per tonne offset by higher silver grades and the increase in the gold co-product cost was driven by the higher operating costs and the 17% decrease in gold grade.
Six months ended June 30, 2022 (compared to the six months ended June 30, 2021)
Direct costs per tonne for the first half of 2022 increased 22% to $98.02 per tonne, primarily due to increased labour, power and consumables and increased operating development costs offset with slight increase in throughput tonnes compared to the same period in 2021. Cash costs, net of by-product credits, were $2.24 per oz of payable silver compared to negative $27.16 per oz in the same period in 2021 due to the increased costs and a significant reduction in the gold grade. AISC increased 29% to $28.46 per oz primarily due to the increase in cash costs net of by-product credit offset by a decreased allocated general and administrative expenses and a decrease in sustaining capital expenditures.
On a co-product cash costs basis, silver cost per oz increased 13% compared to 2021 and gold co-product costs increased 35% to $17.26 per silver oz and $1,369 per gold oz, respectively. The increases in the silver cost on a co-product basis were primarily driven by the higher direct costs per tonne offset by higher silver grades and the increase in the gold co-product cost was driven by the higher operating costs and the 19% decrease in gold grade.
EL COMPAS OPERATIONS
The El Compas operation is a small but high grade, permitted gold-silver mine with a small leased flotation plant in the historic silver mining district of Zacatecas. The leased floatation plant has a nominal plant capacity of 250 tpd.
El Compas employed close to 200 people and engaged over 55 contractors until the suspension of operations in mid-August 2021 as the mineral reserves were exhausted. The mine, plant and tailings facilities are on short term care and maintenance, while management conducts an evaluation of the alternatives including final closure.
There remain several brownfield exploration opportunities on concessions owned by the Company, however further resource definition and evaluation is required to recommence production. Temporary closure costs were $0.2 million and $0.4 million for the three and six months ended June 30, 2022 respectively. Company management and contract personnel continue to maintain the security of the mine, plant, and tailings facilities.
DEVELOPMENT ACTIVITIES
Terronera Project
The Terronera project, located 40 km northeast of Puerto Vallarta in the state of Jalisco, Mexico, features a high-grade silver-gold mineral resource in the Terronera vein, which is now over 1,400 metres long, 400 metres deep, 3 to 16 metres thick, and remains open along strike to the southeast and down dip.
Wood PLC completed an independent Feasibility Study ("FS") which has an effective date of September 9, 2021 and the full report was filed on SEDAR and EDGAR and posted to the Company's website on October 25, 2021.
The FS base case assumed a silver price of $20 per oz and a gold price of $1,575 per oz with an implied 79:1 silver to gold ratio, and a Mexico peso to U.S. dollar exchange rate of 20:1. At base case prices, the improved economics estimated an after-tax net present value of $174.1 million at a 5% discount rate, internal rate of return of 21.3%, and payback period of 3.6 years. Initial capital expenditures were estimated to be $175 million with capital expenditures during production estimated to be $108.5 million. The 12-year life of mine was estimated to produce an average of 3.3 million silver oz and 32,874 gold oz per year generating $476 million pre-tax, $311 million after-tax, free cash flow over the life of the project.
The Company has commenced initial earthworks and the procurement of long lead items and intends to make a formal construction decision, subject to completion of a financing package and receipt of additional amended permits, in the coming months. A budget of $23.0 million was approved for January to July 2022 to continue to advance the site clearing, preparations for initial earthworks, a temporary and permanent camp, road construction and procuring of long lead items and expects to spend an additional $18.0 million to the end of October on detailed engineering, mine portal development, and the continuation of road construction, earthworks, permanent camp and procurement of long lead items during August to October 2022.
The Company continues to further evaluate cost benefit initiatives and technologies to further enhance the operating flexibility of the project and economics during the construction preparation phase.
The Company re-classified the Terronera Project from an exploration and evaluation project to a development project in September 2021 and has subsequently invested $27.1 million on land acquisition, initial development and capital assets to advance development and $6.1 million on exploration and evaluation activities and administrative costs.
EXPLORATION RESULTS
In 2022, the Company plans to spend $13.0 million drilling 50,000 metres on brownfields projects, greenfields exploration and development engineering across its portfolio of mines and properties. At the Guanaceví mine 11,000 metres of core drilling are planned at a cost of $1.8 million and at the Bolañitos mine 10,000 metres of core drilling are planned at a cost of $1.5 million to replace reserves and expand resources.
At the Terronera development project management intends to invest $1.9 million including 11,000 metres planned to test multiple regional targets identified in 2021 to expand resources within the district. At the Parral project in Chihuahua state, 7,000 metres are planned at a cost of $1.7 million to delineate existing resources, expand resources and test new targets. In the second half of the year, the Company expects to initiate a preliminary economic assessment.
In Chile, management intends to invest $1.5 million to test the Aida exploration project located in the northern Chile Region II along the Argentina border accessible by paved highway and dirt road. The Company plans to drill 3,000 metres to test a manto target with significant silver-manganese-lead-zinc anomaly at surface in the second half of 2022. Additionally, the Company plans to advance mapping, sampling and surface exploration on its other exploration projects in Chile, estimated to cost $0.9 million including administration costs in the country.
At the Bruner project, management plans to invest $1.9 million to evaluate and verify historical data to define a current resource, map and sample new targets and drill 3,000 metres verifying historical data and testing new targets.
At the recently acquired Pitarrilla project management plans on investing $1.8 million on exploration activities to verify the historical data and define a current resource.
At Guanaceví, the Company drilled 5,417 metres in 22 holes at a total expense of $0.7 million to delineate the extension El Curso ore bodies. Drilling confirmed expectations and intersected significant mineralization with similar ore grades and vein widths to historical results.
At Bolañitos, the Company drilled 5,874 metres in 28 holes at total expense of $0.6 million to target the Tepetateras, La Cuesta, Gina and Maru veins in Bolañitos South. The Company intersected significant mineralization with ore grades over mineable widths.
At Terronera, the drill program targeted the regional area acquired in 2020. A total of 6,112 metres were drilled in 21 holes at a total expense of $1.0 million. Surface drilling was conducted on the Coral vein which is located south of the Los Cuates vein, which is approximately 10 km to the northwest of the Terronera Project, and on the Pena Gorda vein located in the Real Alto area at the southern end of the project area. Assays returned various amounts of mineralization requiring interpretation and follow up.
At Parral, the Company drilled 30 holes totalling 6,941 metres, with a cost of $1.1 million targeting various areas of the Veta Colorada vein. Drilling confirmed expectations in a number of areas, intersecting significant mineralization with meaningful vein widths. Management will continue the exploration program in 2022 with the intention to expand the resource estimate published in December 2019 and initiate an economic study in 2022.
At Bruner, the Company conducted sampling and geological mapping activities and in Chile, the Company completed initial exploration activities on the Catalina and Blanca properties.
CONSOLIDATED FINANCIAL RESULTS
Three months ended June 30, 2022 (compared to the three months ended June 30, 2021)
In Q2, 2022, the Company's mine operating earnings were $4.5 million (Q2, 2021 - $10.2 million) on net revenue of $30.8 million (Q2, 2021 - $47.7 million) with cost of sales of $26.3 million (Q2, 2021 - $37.5 million).
In Q2, 2022, the Company had an operating loss of $1.3 million (Q2, 2021 - operating earnings of $0.8 million) after exploration and evaluations costs of $3.8 million (Q2, 2021 - $5.0 million), general and administrative expense of $1.3 million (Q2, 2021 - $4.3 million), write off of exploration properties of $0.5 million (Q2, 2022 - $Nil) and care and maintenance expense of $0.2 million (Q2, 2021 - $0.1 million).
The loss before taxes for Q2, 2022 was $8.8 million (Q2, 2021 - earnings before tax $8.9 million) after finance costs of $0.3 million (Q2, 2021 - $0.2 million), a foreign exchange loss of $0.3 million (Q2, 2021 - gain of $0.7 million) and investment and other expense of $6.9 million (Q2, 2021 - investment and other income of $1.8 million). The Company realized a net loss for the period of $11.9 million (Q2, 2021 - net earnings of $6.7 million) after an income tax expense of $3.1 million (Q2, 2021 - $2.2 million). In Q2, 2022 earnings were significantly impacted by a $7.6 million mark-to-market adjustment to investments included in investment and other expense. The Q2, 2021 income included a $5.8 million gain on disposal of the El Cubo mine and related assets.
Net revenue of $30.8 million in Q2, 2022, net of $0.9 million of smelting and refining costs, decreased by 35% compared to $47.7 million, net of $0.6 million of smelting and refining costs, in Q2, 2021. Gross sales of $31.7 million in Q2, 2022 represented a 34% decrease over the $48.3. million for the same period in 2021. Silver oz sold decreased 46% due to the buildup of the larger finished goods inventory. There was a 15% decrease in the realized silver price resulting in a 54% decrease to silver sales. Gold oz sold remained flat with a 1% decrease in realized gold prices resulting in a 1% decrease in gold sales. The decrease in gold sales is primarily driven by the decreased gold grades at the Bolañitos mine and the suspension of production from the El Compas mine. During the period, the Company sold 602,894 oz silver and 9,792 oz gold, for realized prices of $22.72 and $1,840 per oz, respectively, compared to sales of 1,120,266 oz silver and 9,810 oz gold, for realized prices of $26.82 and $1,866 per oz, respectively, in the same period of 2021. For the three months ended June 30, 2022, the realized prices of silver and gold within 2% of the London spot prices. Silver and gold London spot prices averaged $22.60 and $1,871, respectively, during the three months ended June 30, 2022.
The Company increased its finished goods silver inventory and slightly decreased its finished goods gold inventory to 1,411,764 oz silver and 3,167 oz gold, at June 30, 2022 compared to 668,382 oz silver and 3,841 oz gold at March 31, 2022. The cost allocated to these finished goods was $20.8 million at June 30, 2022, compared to $13.5 million at March 31, 2022 and $10.1 million at June 30, 2021. At June 30, 2022, the finished goods inventory fair market value was $34.5 million, compared to $24.1 million at March 31, 2022.
Cost of sales for Q2, 2022 was $26.3 million, a decrease of 30% over the cost of sales of 37.5 million for Q2, 2021. The cost of sales in Q2, 2022 significantly impacted by the delay in recognition of costs associated with the increase in the quantity of silver ounces in finished goods at the end of the period and offset by increased input costs. Overall costs for Q2, 2022 were impacted by higher labour, power and consumables costs as the Company is experiencing significant inflationary.
Exploration and evaluation expenses were $3.8 million, decrease of 24% compared to $5.0 million incurred in the same period of 2021 primarily due to the timing of exploration activities. General and administrative expenses decreased to $1.3 million in Q2, 2022 compared to $4.3 million for the same period of 2021 primarily due to the mark-to-market impact of cash-settled director's deferred share units, which comparatively decreased costs by $3.2 million while labour, legal and investor relations costs increased incrementally.
The Company incurred a foreign exchange loss of $0.3 million in Q2, 2022 compared to a foreign exchange gain of $0.7 million in Q2, 2021 due to timing of the settlements of the working capital balances and a weakening of the Mexican peso at the end of the quarter. The Company incurred $0.3 million in finance charges primarily related to mobile equipment purchased compared to $0.2 million in the same period in 2021. The Company recognized expense of $6.9 million in investment and other income compared to $1.8 million in investment and other income in Q2, 2021 primarily resulting from recognizing an unrealized loss on marketable securities and warrants of $7.6 million (Q2, 2021 - gain $1.4 million), $0.3 million in interest income (Q2, 2021 - $0.3 million), $0.1 million in royalty income (Q2, 2021 - $0.1 million) and $0.3 million in other income (Q2, 2021 - $Nil).
Income tax expense was $3.1 million in Q2, 2022 compared to $2.2 million in Q2, 2021. The $3.1 million tax expense is comprised of $1.3 million in current income tax expense (Q2, 2021 - $1.1 million) and $1.8 million in deferred income tax expense (Q2, 2021 - $1.1 million). The current income tax expense consists of $0.9 million of special mining duty taxes and $0.4 million of income taxes. The deferred income tax expense of $1.8 million is primarily due to the use of loss carry forwards to offset taxable income generated at the Guanaceví and Bolañitos operations.
Six months ended June 30, 2022 (compared to the six months ended June 30, 2021)
For the six-month period ended June 30, 2022, the Company's mine operating earnings was $24.7 million (2021 - $15.9 million) on net revenue of $88.5 million (2021 - $82.2 million) with cost of sales of $63.8 million (2021 - $66.3 million).
The Company had operating earnings of $11.2 million (2021 - $15.1 million) after exploration costs of $7.0 million (2021 - $9.2 million), general and administrative costs of $5.6 million (2021 - $7.8 million), write off of exploration properties of $0.5 million (2021 - $Nil) and care and maintenance expense for the Compas operation of $0.4 million (2021 - $0.6 million). In the six months ended June 30, 2021 operating earnings included an impairment reversal of $16.8 million as a result of the valuation assessment done as a result of the El Cubo mine and related assets a liabilities classification as held for sale.
The earnings before taxes was $10.0 million (2021 - $24.9 million) after finance costs of $0.6 million (2021 - $0.5 million), a foreign exchange gain of $0.5 million (2021 - gain $35 thousand ) and investment and other expense of $1.1 million (2021 - gain $4.5 million). In the six months ended June 30, 2021 earnings before taxes included a gain on disposal of the El Cubo assets of $5.8 million. The Company realized net loss for the period of $0.3 million (2021 - $18.9 million) after an income tax expense of $10.3 million (2021 - $6.0 million).
Net revenue of $88.5 million in for the first half of 2022, net of $1.6 million of smelting and refining costs, increased by 8% compared to $82.2 million, net of $1.2 million of smelting and refining costs in 2021. Gross sales of $90.1 million in 2022 represented an 8% increase over the $83.4 million for the same period in 2021. There was a 33% increase in silver ounces sold and a 11% decrease in the realized silver price resulting in a 18% increase to silver sales. There was a 11% decrease in gold ounces sold with a 7% increase in realized gold prices resulting in a 5% decrease in gold sales. During the period, the Company sold 2,320,662 oz silver and 18,173 oz gold, for realized prices of $23.95 and $1,900 per oz respectively, compared to sales of 1,743,645 oz silver and 20,473 oz gold, for realized prices of $26.95 and $1,781 per oz, respectively, in the same period of 2021. For the six months ended June 30, 2022, the realized prices of silver and gold were within approximately 3% and 1% respectively to London spot prices. During the same period, silver and gold spot prices averaged $23.32 and $1,874, respectively.
The Company increased its finished goods silver inventory and reduced its finished goods gold inventory to 1,411,764 oz and 3,167 oz, respectively at June 30, 2022 compared to 1,082,610 oz silver and 3,674 oz gold at December 31, 2021. The cost allocated to these finished goods was $20.8 million at June 30, 2022, compared to $15.6 million at December 31, 2021 and $10.1 million at June 30, 2021. At June 30, 2022, the finished goods inventory fair market value was $34.6 million, compared to $31.7 million at December 31, 2021 and $17.3 million at June 30, 2021.
Cost of sales for 2022 was $63.8 million, a decrease of 4% over the cost of sales of $66.3 million for the same period of 2021. The cost of sales in Q2, 2022 significantly impacted by the delay in recognition of costs associated with the increase in the quantity of silver ounces in finished goods at the end of the period and offset by increased input costs. Royalties decreased 4% to $6.5 million due to the timing of sales and the reduction in the realized silver price.
Exploration and evaluation expenses decreased in 2022 to $7.0 million from $9.2 million for the same period of 2021 primarily based on prior period additional expenditures to advance the Terronera Feasibility Study. General and administrative expenses decreased to $5.6 million in 2022 compared to $7.8 million for the same period of 2021, due to mark-to-market fluctuations for director's deferred share units which comparatively decreased costs by $2.9 million, offset by $0.4 million increase in share-based compensation and $0.3 million increase in salaries, wages and benefits.
The Company incurred a foreign exchange gain of $0.5 million in 2022 compared to a foreign exchange loss of $35 thousand in 2021 as the exchange rate has been fairly flat during the 2021 period and there was a weakening of the Mexican Peso at the end of Q2, 2022, which resulted in lower valuations of peso denominated tax receivables and cash balances. The Company incurred $0.6 million in finance charges primarily related to mobile equipment purchased in 2022 compared to $0.5 million in the same period in 2021 due to changes in the outstanding loan balances. The Company recognized $1.1 million in investment and other expenses compared to investment and other income of $4.5 million in 2021 with the majority of the expense in 2022 derived from a loss on marketable securities of $2.3 million offset by interest and royalty income. The $4.5 million in investment and other income in 2021 was derived from a gain on marketable securities of $3.8 million and interest received on IVA collections. In 2021, the Company also recognized a gain on the sale of the El Cubo mine of $5.8 million.
Income tax expense was $10.3 million in 2022 compared to an income tax expense of $6.0 million in 2021. The $10.3 million tax expense is comprised of $2.3 million in current income tax expense (2021 - $1.8 million) and $8.0 million in deferred income tax expense (2021 - $4.2 million). The current income tax expense consists of $1.9 million of special mining duty taxes and $0.4 million of income taxes. The deferred income tax expense of $8 million is due to the use of loss carry forwards to offset taxable income generated at the Guanaceví and Bolañitos.
The recoverable amounts of the Company's cash-generating units ("CGUs"), which include mining properties, plant and equipment, are determined at the end of each reporting period, if impairment indicators are identified. In previous years, commodity price declines led the Company to determine there were impairment indicators and assessed the recoverable amounts of its CGUs. The recoverable amounts were based on each CGUs future cash flows expected to be derived from the Company's mining properties and represent each CGU's value in use. The cash flows were determined based on the life-of-mine after-tax cash flow forecast which incorporates management's best estimates of future metal prices, production based on current estimates of recoverable reserves and resources, exploration potential, future operating costs and non-expansionary capital expenditures discounted at risk adjusted rates based on the CGUs weighted average cost of capital.
During Q1, 2021, the El Cubo mine project, consisting of the land rights, plant, buildings and the related reclamation liability were classified as held for sale and immediately prior to the classification to assets and liabilities held for sale, the carrying amounts of the land rights, plant and building were remeasured and the historical gross impairments of $216.9 million net of depletion and depreciation of $200.1 million, were reversed resulting in a $16.8 million impairment reversal. During Q2, 2021 the sale of the El Cubo assets was completed with a gain on disposal of $5.8 million. The reclamation provision for the El Cubo mine of $4.6 million transferred to VanGold upon acquisition of the related mining concessions.
NON-IFRS MEASURES
Non-IFRS and Other Financial Measures and Ratios
We have included certain non-IFRS financial measures and ratios in this MD&A, as discussed below. We believe that these measures, in addition to conventional measures prepared in accordance with IFRS, provide investors an improved ability to evaluate the underlying performance of the Company. The non-IFRS measures and ratios are intended to provide additional information and should not be considered in isolation or as a substitute for measures of performance prepared in accordance with IFRS. These financial measures and ratios do not have any standardized meaning prescribed under IFRS, and therefore may not be comparable to other issuers.
Non-IFRS financial measures are defined in National Instrument 52-112 - Non-GAAP and Other Financial Measures Disclosure ("NI 52-112") as a financial measure disclosed that (a) depicts the historical or expected future financial performance, financial position or cash flow of an entity, (b) with respect to its composition, excludes an amount that is included in, or includes an amount that is excluded from, the composition of the most directly comparable financial measure disclosed in the primary financial statements of the entity, (c) is not disclosed in the financial statements of the entity, and (d) is not a ration, fraction, percentage or similar representation.
A non-IFRS ration is defined by 52-112 as a financial measure disclosed that (a) is in the form of a ratio, fraction, percentage or similar representation, (b) has a non-IFRS financial measure as one or more of its components, and (c) is not disclosed in the financial statements.
Working capital is a non-IFRS measure that is a common measure of liquidity but does not have any standardized meaning. The most directly comparable measure prepared in accordance with IFRS is current assets and current liabilities. Working capital is calculated by deducting current liabilities from current assets. Working capital should not be considered in isolation or as a substitute from measures prepared in accordance with IFRS. The measure is intended to assist readers in evaluating our liquidity.
|
Expressed in thousands US dollars
|
As at June 30, 2022
|
As at December 31, 2021
|
|
Current assets
|
$186,454
|
$161,762
|
|
Current liabilities
|
36,733
|
40,554
|
|
Working capital
|
$149,721
|
$121,208
|
Adjusted earnings and adjusted earnings per share ("EPS") are non-IFRS measures that supplement information to the Company's consolidated financial statements. The Company believes that, in addition to the conventional measures prepared in accordance with IFRS, the Company and certain investors and analysts use this information to evaluate the Company's underlying core operating performance. The presentation of adjusted earnings and adjusted earnings per share is not meant to be a substitute of net income and net income per share presented in accordance with IFRS, but rather should be evaluated in conjunction with such IFRS measures.
The Company defines he adjusted earnings as net income adjusted to include certain non-cash and unusual item, and items that in the Company's judgement are subject to volatility as a result of factors which are unrelated to the Company's operation in the period. Certain items that become applicable in a period may be adjusted for, with the Company retroactively presenting comparable periods with an adjustment for such items and, conversely, items no longer applicable may be removed from the calculation. During the current period, the Company has included changes in the fair value of its investments in marketable securities and made retroactive adjustments to prior periods for the same. The following table provides a detailed reconciliation of net income as reported in the Company's financial statement to adjusted earnings and adjusted earnings per share.
|
Expressed in thousands US dollars
|
Three Months Ended June 30
|
Six Months Ended June 30
|
|
(except for share numbers and per share amounts)
|
2022
|
2021
|
2022
|
2021
|
|
Net earnings (loss) for the period per financial statements
|
($11,923)
|
$6,656
|
($261)
|
$18,905
|
|
Impairment (reversal) of non-current assets, net of tax
|
-
|
-
|
-
|
(16,791)
|
|
Gain on disposal of El Cubo mine and equipment, net of tax
|
-
|
(5,807)
|
-
|
(5,807)
|
|
Change in fair value of investments
|
7,626
|
1,539
|
2,269
|
9
|
|
Adjusted net earnings (loss)
|
($4,297)
|
$2,388
|
$2,008
|
($3,684)
|
|
Basic weighted average share outstanding
|
180,974,609
|
168,383,755
|
176,291,929
|
164,051,368
|
|
Adjusted net earnings (loss) per share
|
($0.02)
|
$0.01
|
$0.01
|
($0.02)
|
Mine operating cash flow before taxes is a non-IFRS measure that does not have a standardized meaning prescribed by IFRS and therefore may not be comparable to similar measures presented by other issuers. Mine operating cash flow is calculated as revenue minus direct production costs and royalties. Mine operating cash flow is used by management to assess the performance of the mine operations, excluding corporate and exploration activities and is provided to investors as a measure of the Company's operating performance.
|
Expressed in thousands US dollars
|
Three Months Ended June 30
|
Six Months Ended June 30
|
|
|
2022
|
2021
|
2022
|
2021
|
| Mine operating earnings per financial statements |
$4,472
|
$10,205
|
$24,741
|
$15,869
|
|
Share-based compensation
|
113
|
111
|
240
|
229
|
|
Amortization and depletion
|
4,175
|
6,624
|
10,481
|
14,120
|
|
Write down of inventory to net realizable value
|
-
|
272
|
-
|
272
|
|
Mine operating cash flow before taxes
|
$8,760
|
$17,212
|
$35,462
|
$30,490
|
Operating cash flow before working capital changes per share is a non-IFRS measure that does not have a standardized meaning prescribed by IFRS and therefore may not be comparable to similar measures presented by other issuers. Operating cash flow per share is calculated by dividing cash from operating activities by the weighted average shares outstanding. Operating cash flow per share is used by management to assess operating performance on a per share basis, irrespective of working capital changes and is provided to investors as a measure of the Company's operating performance.
|
Expressed in thousands US dollars
|
Three Months Ended June 30
|
Six Months Ended June 30
|
|
(except for per share amounts)
|
2022
|
2021
|
2022
|
2021
|
|
Cash from (used in) operating activities per financial statements
|
($18,548)
|
$9,467
|
$3,185
|
$5,544
|
|
Net changes in non-cash working capital per financial statements
|
(22,160)
|
806
|
(21,046)
|
(8,360)
|
|
Operating cash flow before working capital changes
|
$3,612
|
$8,661
|
$24,231
|
$13,904
|
|
Basic weighted average shares outstanding
|
180,974,609
|
168,383,755
|
176,291,929
|
164,051,368
|
|
Operating cash flow before working capital changes per share
|
$0.02
|
$0.05
|
$0.14
|
$0.08
|
EBITDA is a non-IFRS financial measure, which excludes the following from net earnings:
- Income tax expense;
- Finance costs;
- Amortization and depletion.
Adjusted EBITDA excludes the following additional items from EBITDA:
- Share based compensation;
- Non-recurring impairments (reversals);
- Significant non-routine items.
Adjusted EBITDA per share is calculated by dividing Adjusted EBITDA by the basic weighted average number of shares outstanding for the period.
Management believes EBITDA is a valuable indicator of the Company's ability to generate liquidity by producing operating cash flow to fund working capital needs, service debt obligations, and fund capital expenditures. Management uses EBITDA for this purpose. EBITDA is also frequently used by investors and analysts for valuation purposes whereby EBITDA is multiplied by a factor or "EBITDA multiple" based on an observed or inferred relationship between EBITDA and market values to determine the approximate total enterprise value of a Company.
EBITDA is intended to provide additional information to investors and analysts. It does not have any standardized definition under IFRS and should not be considered in isolation or as a substitute for measures of operating performance prepared in accordance with IFRS. EBITDA excludes the impact of cash costs of financing activities and taxes, and the effects of changes in operating working capital balances, and therefore is not necessarily indicative of operating profit or cash flow from operations as determined by IFRS. Other companies may calculate EBITDA and Adjusted EBITDA differently.
Certain items that become applicable in a period may be adjusted for, with the Company retroactively presenting comparable periods with an adjustment for such items and, conversely, items no longer applicable may be removed from the calculation. During the current period, the Company has included changes in the fair value of its investments in marketable securities and made retroactive adjustments to prior periods for the same
|
Expressed in thousands US dollars
|
Three Months Ended June 30
|
Six Months Ended June 30
|
|
|
2022
|
2021
|
2022
|
2021
|
| Net earnings (loss) for the period per financial statements |
($11,923)
|
$6,656
|
($261)
|
$18,905
|
|
Depreciation and depletion - cost of sales
|
4,175
|
6,624
|
10,481
|
14,120
|
|
Depreciation and depletion - exploration
|
98
|
72
|
205
|
151
|
|
Depreciation and depletion - general & administration
|
51
|
38
|
99
|
72
|
|
Depreciation and depletion - care & maintenance
|
30
|
(11)
|
60
|
4
|
|
Depreciation and depletion - inventory write down
|
-
|
6
|
-
|
6
|
|
Finance costs
|
212
|
216
|
389
|
507
|
|
Current income tax expense
|
1,325
|
1,146
|
2,340
|
1,817
|
|
Deferred income tax expense
|
1,752
|
1,116
|
7,974
|
4,243
|
|
EBITDA
|
($4,280)
|
$15,863
|
$21,287
|
$39,825
|
|
Share based compensation
|
972
|
1,028
|
2,499
|
2,193
|
|
Impairment (reversal) of non-current assets, net of tax
|
-
|
-
|
-
|
(16,791)
|
|
Gain on disposal of El Cubo mine and equipment, net of tax
|
-
|
(5,807)
|
-
|
(5,807)
|
|
Change in fair value of investments
|
7,626
|
1,539
|
2,269
|
9
|
|
Adjusted EBITDA
|
$4,318
|
$12,623
|
$26,055
|
$19,429
|
Cash costs per silver oz, total production costs per oz, direct operating costs per tonne and direct costs per tonne are measures developed by precious metals companies in an effort to provide a comparable standard; however, there can be no assurance that the Company's reporting of these non-IFRS measures and ratios are similar to those reported by other mining companies. Cash costs per oz, total production costs per oz and direct costs per tonne are measures used by the Company to manage and evaluate operating performance at each of the Company's operating mining units. They are widely reported in the silver mining industry as a benchmark for performance, but do not have a standardized meaning and are disclosed in addition to IFRS measures. Direct operating costs include mining, processing (including smelting, refining, transportation and selling costs) and direct overhead at the operation sites. Direct costs include all direct operating costs plus royalties and special mining duty. Cash costs include all direct costs less by-product gold sales and changes in finished gold inventories. Total production costs include all cash costs plus amortization and depletion, changes in amortization and depletion in finished goods inventory and site share-based compensation. Cash costs per silver ounce and total production costs per ounce are calculated by dividing cash costs and total production costs by the payable silver ounces produced. Direct operating cost per tonne and direct costs per tonne are calculated by dividing direct operating costs and direct costs by the number of processed tonnes. The following tables provide a detailed reconciliation of these measures to the Company's direct production costs, as reported in its consolidated financial statements.
|
Expressed in thousands US dollars
|
Three Months Ended June 30, 2022
|
Three Months Ended June 30, 2021
|
|
Guanaceví
|
Bolañitos
|
Total
|
Guanaceví
|
Bolañitos
|
El Compas
|
Total
|
|
Direct production costs per financial statements
|
$7,797
|
$12,031
|
$19,828
|
$15,713
|
$7,770
|
$2,740
|
$26,223
|
|
Smelting and refining costs included in net revenue
|
-
|
937
|
937
|
-
|
514
|
68
|
582
|
|
Opening finished goods
|
(7,908)
|
(2,995)
|
(10,903)
|
(5,935)
|
(204)
|
(442)
|
(6,581)
|
|
Finished goods NRV adjustment
|
-
|
-
|
-
|
-
|
-
|
266
|
266
|
|
Closing finished goods
|
16,164
|
681
|
16,845
|
6,985
|
408
|
1,145
|
8,538
|
|
Direct operating costs
|
16,053
|
10,654
|
26,707
|
16,763
|
8,488
|
3,777
|
29,028
|
|
Royalties
|
2,128
|
66
|
2,194
|
4,158
|
70
|
112
|
4,340
|
|
Special mining duty (1)
|
795
|
127
|
922
|
684
|
257
|
(38)
|
903
|
|
Direct costs
|
18,976
|
10,847
|
29,823
|
21,605
|
8,815
|
3,851
|
34,271
|
|
By-product gold sales
|
(5,719)
|
(12,302)
|
(18,021)
|
(4,209)
|
(11,909)
|
(2,187)
|
(18,305)
|
|
Opening gold inventory fair market value
|
3,724
|
3,763
|
7,487
|
1,925
|
309
|
662
|
2,896
|
|
Closing gold inventory fair market value
|
(4,662)
|
(1,061)
|
(5,723)
|
(3,349)
|
(633)
|
(1,038)
|
(5,020)
|
|
Cash costs net of by-product
|
12,319
|
1,247
|
13,566
|
15,972
|
(3,418)
|
1,288
|
13,842
|
|
Amortization and depletion
|
940
|
3,235
|
4,175
|
2,487
|
3,800
|
337
|
6,624
|
|
Share-based compensation
|
57
|
56
|
113
|
54
|
51
|
6
|
111
|
|
Opening finished goods depreciation and depletion
|
(1,689)
|
(897)
|
(2,586)
|
(1,137)
|
(118)
|
(133)
|
(1,388)
|
|
NRV depreciation cost adjustment
|
-
|
-
|
-
|
-
|
-
|
6
|
-
|
|
Closing finished goods depreciation and depletion
|
3,733
|
199
|
3,932
|
1,333
|
220
|
30
|
1,583
|
|
Total production costs
|
$15,360
|
$3,840
|
$19,200
|
$18,709
|
$535
|
$1,534
|
$20,772
|
|
|
Three Months Ended June 30, 2022
|
Three Months Ended June 30, 2021
|
|
|
Guanaceví
|
Bolañitos
|
Total
|
Guanaceví
|
Bolañitos
|
El Compas
|
Total
|
|
Throughput tonnes
|
94,017
|
107,344
|
201,361
|
111,893
|
107,912
|
22,213
|
242,018
|
|
Payable silver ounces
|
1,190,568
|
155,708
|
1,346,276
|
936,424
|
112,456
|
13,387
|
1,062,267
|
| |
|
|
|
|
|
|
|
|
Cash costs per silver ounce
|
$10.35
|
$8.01
|
$10.08
|
$17.06
|
($30.39)
|
$96.21
|
$13.03
|
|
Total production costs per ounce
|
$12.90
|
$24.66
|
$14.26
|
$19.98
|
$4.76
|
$114.59
|
$19.55
|
|
Direct operating costs per tonne
|
$170.75
|
$99.25
|
$132.63
|
$149.81
|
$78.66
|
$170.04
|
$119.94
|
|
Direct costs per tonne
|
$201.84
|
$101.05
|
$148.11
|
$193.09
|
$81.69
|
$173.37
|
$141.61
|
|
Expressed in thousands US dollars
|
Six Months Ended June 30, 2022
|
Six Months Ended June 30, 2021
|
|
Guanaceví
|
Bolañitos
|
Total
|
Guanaceví
|
Bolañitos
|
El Compas
|
Total
|
|
Direct production costs per financial statements
|
$25,681
|
$20,868
|
$46,549
|
$23,773
|
$14,875
|
$6,303
|
$44,951
|
|
Smelting and refining costs included in net revenue
|
-
|
1,591
|
1,591
|
-
|
1,003
|
206
|
1,209
|
|
Opening finished goods
|
(10,093)
|
(2,857)
|
(12,950)
|
(1,509)
|
(250)
|
(642)
|
(2,401)
|
|
Finished goods NRV adjustment
|
-
|
-
|
-
|
-
|
-
|
266
|
266
|
|
Closing finished goods
|
16,164
|
681
|
16,845
|
6,985
|
408
|
1,145
|
8,538
|
|
Direct operating costs
|
31,752
|
20,283
|
52,035
|
29,249
|
16,036
|
7,278
|
52,563
|
|
Royalties
|
6,362
|
149
|
6,511
|
6,371
|
138
|
291
|
6,800
|
|
Special mining duty (1)
|
1,526
|
371
|
1,897
|
941
|
408
|
-
|
1,349
|
|
Direct costs
|
39,640
|
20,803
|
60,443
|
36,561
|
16,582
|
7,569
|
60,712
|
|
By-product gold sales
|
(10,741)
|
(23,790)
|
(34,531)
|
(7,673)
|
(22,438)
|
(6,352)
|
(36,463)
|
|
Opening gold inventory fair market value
|
1,900
|
4,784
|
6,684
|
735
|
746
|
1,283
|
2,764
|
|
Closing gold inventory fair market value
|
(4,662)
|
(1,061)
|
(5,723)
|
(3,349)
|
(633)
|
(1,038)
|
(5,020)
|
|
Cash costs net of by-product
|
26,137
|
736
|
26,873
|
26,274
|
(5,743)
|
1,462
|
21,993
|
|
Amortization and depletion
|
4,850
|
5,631
|
10,481
|
4,080
|
7,593
|
2,447
|
14,120
|
|
Share-based compensation
|
120
|
120
|
240
|
93
|
91
|
45
|
229
|
|
Opening finished goods depreciation and depletion
|
(1,965)
|
(635)
|
(2,600)
|
(271)
|
(104)
|
(804)
|
(1,179)
|
|
NRV depreciation and depletion cost adjustment
|
-
|
-
|
-
|
-
|
-
|
6
|
6
|
|
Closing finished goods depreciation and depletion
|
3,733
|
199
|
3,932
|
1,333
|
220
|
30
|
1,583
|
|
Total production costs
|
$32,875
|
$6,051
|
$38,926
|
$31,509
|
$2,057
|
$3,186
|
$36,752
|
|
|
Six Months Ended June 30, 2022
|
Six Months Ended June 30, 2021
|
|
|
Guanaceví
|
Bolañitos
|
Total
|
Guanaceví
|
Bolañitos
|
El Compas
|
Total
|
|
Throughput tonnes
|
195,270
|
212,238
|
407,508
|
200,525
|
205,604
|
45,342
|
451,471
|
|
Payable silver ounces
|
2,321,016
|
328,800
|
2,649,816
|
1,851,886
|
211,444
|
35,647
|
2,098,977
|
| |
|
|
|
|
|
|
|
|
Cash costs per silver ounce
|
$11.26
|
$2.24
|
$10.14
|
$14.19
|
($27.16)
|
$41.01
|
$10.48
|
|
Total production costs per ounce
|
$14.16
|
$18.40
|
$14.69
|
$17.01
|
$9.73
|
$89.38
|
$17.51
|
|
Direct operating costs per tonne
|
$162.61
|
$95.57
|
$127.69
|
$145.86
|
$77.99
|
$160.51
|
$116.43
|
|
Direct costs per tonne
|
$203.00
|
$98.02
|
$148.32
|
$182.33
|
$80.65
|
$166.93
|
$134.48
|
Note: Production at El Compas was suspended in August 2021.
(1) Special mining duty is an EBITDA royalty tax presented as a current income tax in accordance with IFRS.
| |
Expressed in thousands US dollars |
Six Months Ended June 30, 2022 |
Six Months Ended June 30, 2021 |
| |
Guanaceví |
Bolañitos |
Total |
Guanaceví |
Bolañitos |
El Compas |
Total |
| |
| |
Closing finished goods |
16,164 |
681 |
16,845 |
6,985 |
408 |
1,145 |
8,538 |
| |
Closing finished goods depletion |
3,733 |
199 |
3,932 |
1,333 |
220 |
30 |
1,583 |
| |
Finished goods inventory |
$19,897 |
$880 |
$20,777 |
$8,318 |
$628 |
$1,175 |
$10,121 |
AISC per oz and all-in costs per oz are measures developed by the World Gold Council (and used as a standard of the Silver Institute) in an effort to provide a comparable standard within the precious metal industry; however, there can be no assurance that the Company's reporting of these non-IFRS measures are similar to those reported by other mining companies. These measures are used by the Company to manage and evaluate operating performance at each of the Company's operating mining units and consolidated group, and are widely reported in the silver mining industry as a benchmark for performance, but do not have a standardized meaning and are disclosed in addition to IFRS measures. The following tables provide a detailed reconciliation of these measures to the Company's cost of sales, as reported in the Company's consolidated financial statements.
|
Expressed in thousands US dollars
|
Three Months Ended June 30, 2022
|
Three Months Ended June 30, 2021
|
|
|
|
Guanaceví
|
Bolañitos
|
Total
|
Guanaceví
|
Bolañitos
|
El Compas
|
Total
|
|
Cash costs net of by-product
|
$12,319
|
$1,247
|
$13,566
|
$15,972
|
($3,418)
|
$1,288
|
$13,842
|
|
Operations share-based compensation
|
57
|
56
|
113
|
39
|
40
|
39
|
118
|
|
Corporate general and administrative
|
401
|
155
|
556
|
2,013
|
1,093
|
277
|
3,383
|
|
Corporate share-based compensation
|
527
|
214
|
741
|
460
|
250
|
64
|
773
|
|
Reclamation - amortization/accretion
|
69
|
53
|
122
|
13
|
11
|
3
|
27
|
|
Mine site expensed exploration
|
360
|
308
|
668
|
538
|
305
|
2
|
845
|
|
Intangible payments
|
(0)
|
0
|
(0)
|
80
|
29
|
(16)
|
94
|
|
Equipment loan payments
|
246
|
488
|
734
|
300
|
524
|
-
|
824
|
|
Capital expenditures sustaining
|
7,050
|
2,788
|
9,838
|
3,696
|
3,366
|
-
|
7,062
|
|
All-In-Sustaining Costs
|
$21,028
|
$5,310
|
$26,338
|
$23,112
|
$2,200
|
$1,656
|
$26,968
|
|
Growth exploration and evaluation
|
|
|
2,901
|
|
|
|
3,963
|
|
Growth capital expenditures
|
|
|
5,613
|
|
|
|
1,102
|
|
All-In-Costs
|
|
|
$34,852
|
|
|
|
$32,033
|
|
|
Three Months Ended June 30, 2022
|
Three Months Ended June 30, 2021
|
|
|
Guanaceví
|
Bolañitos
|
Total
|
Guanaceví
|
Bolañitos
|
El Compas
|
Total
|
|
Throughput tonnes
|
94,017
|
107,344
|
201,361
|
111,893
|
107,912
|
22,213
|
242,018
|
|
Payable silver ounces
|
1,190,568
|
155,708
|
1,346,276
|
936,424
|
112,456
|
13,387
|
1,062,267
|
|
Silver equivalent production (ounces)
|
1,488,550
|
613,777
|
2,102,327
|
1,185,961
|
660,284
|
120,759
|
1,967,004
|
|
Sustaining cost per ounce
|
$17.66
|
$34.10
|
$19.56
|
$24.68
|
$19.56
|
$123.73
|
$25.39
|
|
All-In-costs per ounce
|
|
|
$25.89
|
|
|
|
$30.16
|
| |
|
|
|
|
Expressed in thousands US dollars
|
Six Months Ended June 30, 2022
|
Six Months Ended June 30, 2021
|
|
|
|
Guanaceví
|
Bolañitos
|
Total
|
Guanaceví
|
Bolañitos
|
El Compas
|
Total
|
|
Cash costs net of by-product
|
$26,137
|
$736
|
$26,873
|
$26,274
|
($5,743)
|
$1,462
|
$21,993
|
|
Operations share-based compensation
|
120
|
120
|
240
|
93
|
91
|
45
|
229
|
|
Corporate general and administrative
|
2,468
|
1,031
|
3,499
|
3,622
|
1,966
|
498
|
6,086
|
|
Corporate share-based compensation
|
1,444
|
603
|
2,047
|
987
|
536
|
136
|
1,658
|
|
Reclamation - amortization/accretion
|
134
|
106
|
240
|
25
|
22
|
5
|
52
|
|
Mine site expensed exploration
|
712
|
558
|
1,270
|
994
|
539
|
195
|
1,728
|
|
Intangible payments
|
29
|
12
|
41
|
111
|
60
|
15
|
187
|
|
Equipment loan payments
|
491
|
977
|
1,468
|
608
|
1,092
|
-
|
1,700
|
|
Capital expenditures sustaining
|
12,696
|
5,214
|
17,910
|
7,900
|
6,100
|
-
|
14,000
|
|
All-In-Sustaining Costs
|
$44,230
|
$9,358
|
$53,588
|
$40,615
|
$4,663
|
$2,355
|
$47,633
|
|
Growth exploration and evaluation
|
|
|
5,314
|
|
|
|
6,970
|
|
Growth capital expenditures
|
|
|
10,538
|
|
|
|
1,434
|
|
All-In-Costs
|
|
|
$69,440
|
|
|
|
$56,037
|
| |
|
|
|
|
|
Six Months Ended June 30, 2022
|
Six Months Ended June 30, 2021
|
|
|
|
Guanaceví
|
Bolañitos
|
Total
|
Guanaceví
|
Bolañitos
|
El Compas
|
Total
|
|
Throughput tonnes
|
195,270
|
212,238
|
407,508
|
200,525
|
205,604
|
45,342
|
451,471
|
|
Payable silver ounces
|
2,321,016
|
328,800
|
2,649,816
|
1,851,886
|
211,444
|
35,647
|
2,098,977
|
|
Silver equivalent production (ounces)
|
2,900,560
|
1,212,322
|
4,112,882
|
2,323,618
|
1,261,071
|
319,135
|
3,903,824
|
| |
|
|
|
|
|
|
|
|
Sustaining cost per ounce
|
$19.06
|
$28.46
|
$20.22
|
$21.93
|
$22.05
|
$66.07
|
$22.69
|
|
All-In-costs per ounce
|
|
|
$26.21
|
|
|
|
$26.70
|
|
Expressed in thousands US dollars
|
Three Months Ended June 30
|
Six Months Ended June 30
|
|
|
2022
|
2021
|
2022
|
2021
|
| Capital expenditures sustaining |
$9,838
|
$7,062
|
$17,910
|
$14,000
|
|
Growth capital expenditures
|
5,613
|
1,102
|
10,538
|
1,434
|
|
Property, plant and equipment expenditures per Consolidated
Statement of Cash Flows
|
$15,451
|
$8,164
|
$28,448
|
$15,434
|
| Expressed in thousands US dollars |
Three Months Ended June 30 |
Six Months Ended June 30 |
| |
2022 |
2021 |
2022 |
2021 |
| Mine site expensed exploration |
$668 |
$845 |
$1,270 |
$1,728 |
| Growth exploration and evaluation |
2,901 |
3,963 |
5,314 |
6,970 |
| Total exploration and evaluation |
3,569 |
4,808 |
6,584 |
8,698 |
| Exploration depreciation and depletion |
98 |
72 |
205 |
151 |
| Exploration share-based compensation |
117 |
145 |
211 |
306 |
| Exploration and evaluation expense |
$3,784 |
$5,025 |
$7,000 |
$9,155 |
Silver co-product cash costs and gold co-product cash costs are measures used by the Company to manage and evaluate operating performance at each of the Company's operating mining units and consolidated group, but do not have a standardized meaning and are disclosed in addition to IFRS measures. The following tables provide a detailed reconciliation of these measures to the Company's cost of sales, as reported in its consolidated financial statements.
|
Expressed in thousands US dollars
|
Three Months Ended June 30, 2022
|
Three Months Ended June 30, 2021
|
|
|
Guanaceví
|
Bolañitos
|
Total
|
Guanaceví
|
Bolañitos
|
El Compas
|
Total
|
|
Direct production costs per financial statements
|
$7,797
|
$12,031
|
$19,828
|
$15,713
|
$7,770
|
$2,740
|
$26,223
|
|
Smelting and refining costs included in net revenue
|
-
|
937
|
937
|
-
|
514
|
68
|
582
|
|
Royalties
|
2,128
|
66
|
2,194
|
4,158
|
70
|
112
|
4,340
|
|
Special mining duty (1)
|
795
|
127
|
922
|
684
|
257
|
(38)
|
903
|
|
Opening finished goods
|
(7,908)
|
(2,995)
|
(10,903)
|
(5,935)
|
(204)
|
(442)
|
(6,581)
|
|
Finished goods NRV adjustment
|
-
|
-
|
-
|
-
|
-
|
266
|
266
|
|
Closing finished goods
|
16,164
|
681
|
16,845
|
6,985
|
408
|
1,145
|
8,538
|
|
Direct costs
|
$18,976
|
$10,847
|
$29,823
|
$21,605
|
$8,815
|
$3,851
|
$34,271
|
|
|
Three Months Ended June 30, 2022
|
Three Months Ended June 30, 2021
|
|
|
Guanaceví
|
Bolañitos
|
Total
|
Guanaceví
|
Bolañitos
|
El Compas
|
Total
|
|
Silver production (ounces)
|
1,194,150
|
165,057
|
1,359,207
|
939,241
|
120,044
|
14,439
|
1,073,724
|
|
Average realized silver price ($)
|
22.72
|
22.72
|
22.72
|
26.82
|
26.82
|
26.82
|
26.82
|
|
Silver value ($)
|
27,131,580
|
3,750,163
|
30,881,743
|
25,186,472
|
3,219,073
|
387,193
|
28,792,738
|
| |
|
|
|
|
|
|
|
|
Gold production (ounces)
|
3,680
|
5,609
|
9,289
|
3,084
|
6,753
|
1,329
|
11,166
|
|
Average realized gold price ($)
|
1,840
|
1,840
|
1,840
|
1,866
|
1,866
|
1,866
|
1,866
|
|
Gold value ($)
|
6,772,598
|
10,322,691
|
17,095,289
|
5,754,599
|
12,600,781
|
2,479,852
|
20,835,232
|
| |
|
|
|
|
|
|
|
|
Total metal value ($)
|
33,904,178
|
14,072,854
|
47,977,032
|
30,941,072
|
15,819,854
|
2,867,045
|
49,627,970
|
|
Pro-rated silver costs (%)
|
80%
|
27%
|
64%
|
81%
|
20%
|
14%
|
58%
|
|
Pro-rated gold costs (%)
|
20%
|
73%
|
36%
|
19%
|
80%
|
86%
|
42%
|
| |
|
|
|
|
|
|
|
|
Pro-rated silver costs ($)
|
15,185
|
2,891
|
19,196
|
17,587
|
1,794
|
520
|
19,883
|
|
Pro-rated gold costs ($)
|
3,791
|
7,956
|
10,627
|
4,018
|
7,021
|
3,331
|
14,388
|
| |
|
|
|
|
|
|
|
|
Silver co-product cash costs ($)
|
12.72
|
17.51
|
14.12
|
18.72
|
14.94
|
36.02
|
18.52
|
|
Gold co-product cash costs ($)
|
1,030
|
1,419
|
1,144
|
1,303
|
1,040
|
2,506
|
1,289
|
|
Expressed in thousands US dollars
|
Six Months Ended June 30, 2022
|
Six Months Ended June 30, 2021
|
|
|
Guanaceví
|
Bolañitos
|
Total
|
Guanaceví
|
Bolañitos
|
El Compas
|
Total
|
|
Direct production costs per financial statements
|
$25,681
|
$20,868
|
$46,549
|
$23,773
|
$14,875
|
$6,303
|
$44,951
|
|
Smelting and refining costs included in net revenue
|
-
|
$1,591
|
$1,591
|
-
|
1,003
|
206
|
1,209
|
|
Royalties
|
6,362
|
149
|
6,511
|
6,371
|
138
|
291
|
6,800
|
|
Special mining duty (1)
|
1,526
|
371
|
1,897
|
941
|
408
|
-
|
1,349
|
|
Opening finished goods
|
(10,093)
|
(2,857)
|
(12,950)
|
(1,509)
|
(250)
|
(642)
|
(2,401)
|
|
Finished goods NRV adjustment
|
-
|
-
|
-
|
-
|
-
|
266
|
266
|
|
Closing finished goods
|
16,164
|
681
|
16,845
|
6,985
|
408
|
1,145
|
8,538
|
|
Direct costs
|
39,640
|
20,803
|
60,443
|
36,561
|
16,582
|
7,569
|
60,712
|
|
|
Six Months Ended June 30, 2022
|
Six Months Ended June 30, 2021
|
|
|
Guanaceví
|
Bolañitos
|
Total
|
Guanaceví
|
Bolañitos
|
El Compas
|
Total
|
|
Silver production (ounces)
|
2,328,000
|
346,162
|
2,674,162
|
1,857,458
|
226,271
|
38,095
|
2,121,824
|
|
Average realized silver price ($)
|
23.95
|
23.95
|
23.95
|
26.95
|
26.95
|
26.95
|
26.95
|
|
Silver value ($)
|
55,757,752
|
8,290,900
|
64,048,652
|
50,053,984
|
6,097,454
|
1,026,568
|
57,178,006
|
| |
|
|
|
|
|
|
|
|
Gold production (ounces)
|
7,157
|
10,827
|
17,984
|
5,827
|
12,935
|
3,513
|
22,275
|
|
Average realized gold price ($)
|
1,900
|
1,900
|
1,900
|
1,781
|
1,781
|
1,781
|
1,781
|
|
Gold value ($)
|
13,599,206
|
20,572,670
|
34,171,876
|
10,378,054
|
23,037,606
|
6,256,754
|
39,672,414
|
| |
|
|
|
|
|
|
|
|
Total metal value ($)
|
69,356,958
|
28,863,570
|
98,220,528
|
60,432,038
|
29,135,060
|
7,283,321
|
96,850,420
|
|
Pro-rated silver costs (%)
|
80%
|
29%
|
65%
|
83%
|
21%
|
14%
|
59%
|
|
Pro-rated gold costs (%)
|
20%
|
71%
|
35%
|
17%
|
79%
|
86%
|
41%
|
| |
|
|
|
|
|
|
|
|
Pro-rated silver costs ($)
|
31,868
|
5,976
|
39,414
|
30,282
|
3,470
|
1,067
|
35,843
|
|
Pro-rated gold costs ($)
|
7,772
|
14,827
|
21,029
|
6,279
|
13,112
|
6,502
|
24,869
|
| |
|
|
|
|
|
|
|
|
Silver co-product cash costs ($)
|
13.69
|
17.26
|
14.74
|
16.30
|
15.34
|
28.00
|
16.89
|
|
Gold co-product cash costs ($)
|
1,086
|
1,369
|
1,169
|
1,078
|
1,014
|
1,851
|
1,116
|
(1) Special mining duty is an EBITDA royalty tax presented as a current income tax in accordance with IFRS.
QUARTERLY RESULTS AND TRENDS
The following table presents selected financial information for each of the most recent eight quarters:
|
Table in thousands of U.S. dollars except for share
numbers and per share amounts
|
2022
|
|
2021
|
|
2020
|
|
Q2
|
Q1
|
Q4
|
Q3
|
Q2
|
Q1
|
Q4
|
Q3
|
|
Gross Sales
|
$31,719
|
$58,394
|
$48,875
|
$34,954
|
$48,357
|
$35,093
|
$61,238
|
$36,148
|
|
Smelting and refining costs included in net revenue
|
937
|
654
|
358
|
392
|
582
|
627
|
491
|
562
|
|
Total Revenue
|
30,782
|
57,740
|
48,517
|
34,562
|
47,775
|
34,466
|
60,747
|
35,586
|
|
Direct production costs
|
19,828
|
26,721
|
26,013
|
18,639
|
26,223
|
18,728
|
26,115
|
18,682
|
|
Royalties
|
2,194
|
4,317
|
4,285
|
2,698
|
4,340
|
2,460
|
4,434
|
2,029
|
|
Mine operating cash flow before taxes
|
8,760
|
26,702
|
18,219
|
13,225
|
17,212
|
13,278
|
30,198
|
14,875
|
|
Share-based compensation
|
113
|
127
|
87
|
105
|
111
|
118
|
60
|
87
|
|
Amortization and depletion
|
4,175
|
6,306
|
5,014
|
4,843
|
6,624
|
7,496
|
8,919
|
8,497
|
|
Write down on inventory
|
-
|
-
|
896
|
-
|
272
|
-
|
405
|
-
|
|
Mine operating earnings (loss)
|
$4,472
|
$20,269
|
$12,222
|
$8,277
|
$10,205
|
$5,664
|
$20,814
|
$6,291
|
| |
|
|
|
|
|
|
|
|
|
Basic earnings (loss) per share
|
($0.07)
|
$0.07
|
$0.00
|
($0.03)
|
$0.04
|
$0.08
|
$0.13
|
$0.00
|
|
Diluted earnings (loss) per share
|
($0.07)
|
$0.07
|
$0.00
|
($0.03)
|
$0.04
|
$0.07
|
$0.13
|
$0.00
|
|
Weighted shares outstanding
|
180,974,609
|
171,557,220
|
180,974,609
|
170,432,326
|
168,383,755
|
159,670,842
|
157,536,658
|
156,265,280
|
| |
|
|
|
|
|
|
|
|
|
Net earnings (loss)
|
($11,923)
|
$11,662
|
($471)
|
($4,479)
|
$6,656
|
$12,249
|
$19,923
|
$451
|
|
Amortization and depletion
|
4,354
|
6,491
|
5,194
|
4,986
|
6,723
|
7,624
|
8,965
|
8,296
|
|
Finance costs
|
212
|
177
|
22
|
195
|
216
|
291
|
332
|
359
|
|
Current income tax
|
1,325
|
1,015
|
1,005
|
659
|
1,146
|
671
|
1,937
|
595
|
|
Deferred income tax
|
1,752
|
6,222
|
4,992
|
3,017
|
1,116
|
3,127
|
(7,112)
|
556
|
|
NRV cost adjustment
|
-
|
-
|
-
|
|
6
|
-
|
231
|
375
|
|
EBITDA
|
($4,280)
|
$25,567
|
$10,742
|
$4,378
|
$15,863
|
$23,962
|
$24,276
|
$10,632
|
*For Q4, 2020 write downs on inventory at period end have been shown as a separate line item in the above reconciliation. For prior periods, it has been included as components of direct costs and amortization and depletion.
The following table presents selected production information for each of the most recent eight quarters:
|
Highlights
|
2022
|
2021
|
2020
|
|
|
|
Q2
|
Q1
|
Q4
|
Q3
|
Q2
|
Q1
|
Q4
|
Q3
|
|
Processed tonnes
|
201,361
|
206,147
|
213,492
|
222,461
|
242,018
|
209,453
|
237,389
|
206,324
|
|
Guanaceví
|
94,017
|
101,253
|
108,334
|
105,496
|
111,893
|
88,632
|
106,425
|
83,816
|
|
Bolañitos
|
107,344
|
104,894
|
105,158
|
107,752
|
107,912
|
97,692
|
107,332
|
98,945
|
|
El Compas
|
-
|
-
|
-
|
9,213
|
22,213
|
23,129
|
23,632
|
23,563
|
|
Silver ounces
|
1,359,207
|
1,314,955
|
1,443,199
|
1,305,399 |
1,073,724 |
1,048,100 |
1,117,289
|
942,274
|
|
Guanaceví
|
1,194,150
|
1,133,850
|
1,301,941
|
1,174,168
|
939,241
|
918,217
|
991,697
|
806,917
|
|
Bolañitos
|
165,057
|
181,105
|
141,258
|
123,883
|
120,044
|
106,227
|
99,417
|
112,094
|
|
El Compas
|
-
|
-
|
-
|
7,348
|
14,439
|
23,656
|
26,175
|
23,263
|
|
Silver grade
|
246
|
231
|
235
|
204
|
163
|
179
|
169
|
162
|
|
Guanaceví
|
465
|
407
|
417
|
387
|
308
|
369
|
331
|
336
|
|
Bolañitos
|
54
|
61
|
48
|
41
|
39
|
38
|
34
|
42
|
|
El Compas
|
-
|
-
|
-
|
24
|
30
|
47
|
50
|
48
|
|
Silver recovery
|
85.4
|
85.9
|
89.4
|
89.3
|
84.9
|
86.9
|
86.8
|
87.6
|
|
Guanaceví
|
85.0
|
85.6
|
89.6
|
89.5
|
84.8
|
87.3
|
87.6
|
89.1
|
|
Bolañitos
|
88.6
|
88.0
|
87.0
|
87.2
|
88.7
|
89.0
|
84.7
|
83.9
|
|
El Compas
|
-
|
-
|
-
|
103.4
|
67.4
|
67.7
|
68.9
|
64.0
|
|
Gold ounces
|
9,289
|
8,695
|
9,387
|
10,541
|
11,166
|
11,109
|
12,586
|
10,260
|
|
Guanaceví
|
3,680
|
3,477
|
3,885
|
3,605
|
3,084
|
2,743
|
3,198
|
2,342
|
|
Bolañitos
|
5,609
|
5,218
|
5,502
|
6,215
|
6,753
|
6,182
|
6,754
|
5,779
|
|
El Compas
|
N/A
|
-
|
59
|
721
|
1,329
|
2,184
|
2,634
|
2,139
|
|
Gold grade
|
1.58
|
1.46
|
1.52
|
1.57
|
1.63
|
1.90
|
1.90
|
1.82
|
|
Guanaceví
|
1.37
|
1.19
|
1.21
|
1.13
|
0.98
|
1.05
|
1.01
|
0.95
|
|
Bolañitos
|
1.77
|
1.73
|
1.83
|
1.98
|
2.14
|
2.15
|
2.22
|
2.04
|
|
El Compas
|
-
|
-
|
-
|
1.81
|
2.45
|
4.12
|
4.41
|
3.98
|
|
Gold recovery
|
90.6
|
89.6
|
90.2
|
93.9
|
87.9
|
86.7
|
87.0
|
85.0
|
|
Guanaceví
|
88.9
|
89.8
|
92.2
|
94.1
|
87.5
|
91.7
|
92.5
|
91.5
|
|
Bolañitos
|
91.8
|
89.4
|
88.9
|
90.6
|
91.0
|
91.5
|
88.2
|
89.1
|
|
El Compas
|
-
|
-
|
-
|
134.5
|
76.0
|
71.3
|
78.6
|
70.9
|
|
Cash costs per oz (1)
|
$10.08
|
$10.21
|
$8.65
|
$8.16
|
$13.03
|
$7.86
|
$6.83
|
$3.69
|
|
Guanaceví
|
$10.35
|
$12.22
|
$10.74
|
$10.40
|
$17.06
|
$11.25
|
$13.21
|
$9.64
|
|
Bolañitos
|
$8.01
|
($2.95)
|
($10.69)
|
($16.82)
|
($30.39)
|
($23.49)
|
($44.56)
|
($40.89)
|
|
El Compas
|
-
|
-
|
-
|
$49.17
|
$96.21
|
$7.77
|
($50.04)
|
$0.44
|
|
AISC per oz (1)
|
$19.56
|
$20.90
|
$19.48
|
$17.46
|
$25.39
|
$19.94
|
$18.52
|
$17.48
|
|
Guanaceví
|
$17.66
|
$20.52
|
$18.74
|
$16.12
|
$24.68
|
$19.07
|
$19.67
|
$17.76
|
|
Bolañitos
|
$34.10
|
$23.39
|
$27.46
|
$28.88
|
$19.56
|
$24.31
|
$16.98
|
$10.51
|
|
El Compas
|
-
|
-
|
-
|
$48.16
|
$123.73
|
$36.19
|
($20.19)
|
$40.39
|
|
Direct costs per tonne (1)
|
$148.11
|
$148.53
|
$136.62
|
$130.38
|
$141.61
|
$126.23
|
$129.66
|
$112.37
|
|
Guanaceví
|
$201.84
|
$204.08
|
$193.87
|
$176.50
|
$193.09
|
$168.74
|
$179.34
|
$146.26
|
|
Bolañitos
|
$101.05
|
$94.91
|
$77.68
|
$81.53
|
$81.69
|
$79.50
|
$75.82
|
$67.82
|
|
El Compas
|
-
|
-
|
-
|
$173.67
|
$173.37
|
$160.71
|
$150.52
|
$178.92
|
(1) Cash cost per oz, AISC per oz and direct costs per tonne are not-IFRS measures.
(2) El Compas operations were suspended in August 2021.
Key Economic Trends
Precious Metal Price Trends
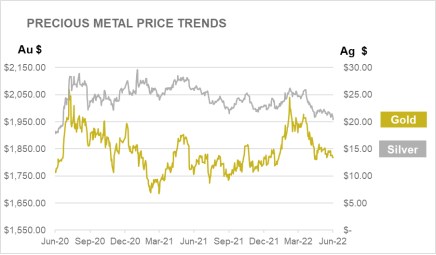
The prices of silver and gold are the largest single factor in determining profitability and cash flow from operations. The financial performance of the Company has been, and is expected to continue to be, closely linked to the prices of silver and gold.
During the six months ended June 30, 2022, the average price of silver was $23.32 per ounce, with silver trading between $20.42 and $26.18 per oz based on the London Fix silver price. This compares to an average of $26.47 per oz for the six months ended June 30, 2021, with a low of $24.00 and a high of $29.59 per oz. During the first half of 2022, the Company realized an average price of $23.95 per silver oz compared with $26.95 for the first half of 2021.
During the six months ended June 30, 2022, the average price of gold was $1,874 per oz, with gold trading between $1,788 and $2,039 per oz based on the London Fix PM gold price. This compares to an average of $1,805 per oz during the six months ended June 30, 2021, with a low of $1,684 and a high of $1,943 per oz. During the first half of 2022, the Company realized an average price of $1,900 per oz compared with $1,781 for the first half of 2021.
During the year ended December 31, 2021, the average price of silver was $25.14 per oz, with silver trading between $21.53 and $29.59 per oz based on the London Fix silver price. This compares to an average of $20.53 per oz for the year ended December 31, 2020, with a low of $12.01 and a high of $28.89 per oz. For the year ended December 31, 2021, the Company realized an average price of $25.22 per silver oz compared with $21.60 for the year ended December 31, 2020.
During the year ended December 31, 2021, the average price of gold was $1,799 per oz, with gold trading between $1,684 and $1,943 per oz based on the London Fix PM gold price. This compares to an average of $1,771 per oz during the year ended December 31, 2020, with a low of $1,474 and a high of $2,067 per oz. During the year ended December 31, 2021, the Company realized an average price of $1,790 per oz compared with $1,846 for the year ended December 31, 2020.
The impact of measures to combat the spread of COVID-19 on global economy resulted in significant volatility in the financial markets, including the gold and silver market in March 2020. During March 2020, silver prices capitulated on expectations of a global recession with the expectation of reduced industrial demand, then subsequently significantly rebounded as investment demand increased due to the monetary aspects of silver, rising demand as a "green" metal and rising geopolitical tension. Government signals of higher interest rates to offset inflation concerns impacted the price of silver in the second half of 2021 and into 2022.
Currency Fluctuations
The Company's operations are located in Mexico and therefore a significant portion of operating costs and capital expenditures are denominated in Mexican pesos. The Company's corporate activities are based in Vancouver, Canada with the significant portion of these expenditures being denominated in Canadian dollars. Generally, as the U.S. dollar strengthens, these currencies weaken, and as the U.S. dollar weakens, these currencies strengthen.
During the six months ended June 30, 2022, the Mexican peso was relatively flat. The average foreign exchange rate was $20.50 Mexican pesos per U.S. dollar, with the peso trading within a range of $19.88 to $21.35. This compares to an average of $20.17, with a range of $19.61 to $21.42 Mexican pesos per U.S. dollar in the first half of 2021.
During the year ended December 31, 2021, the Mexican peso was relatively flat. The average foreign exchange rate was $20.27 Mexican pesos per U.S. dollar, with the peso trading within a range of $19.61 to $21.90. This compares to an average of $21.48, with a range of $18.53 to $25.00 Mexican pesos per U.S. dollar in 2020.
During the year ended December 31, 2020, the Mexican peso was relatively flat until a significant decrease in oil prices followed by the COVID-19 crisis in March 2020 when the Mexican peso significantly depreciated against the U.S. dollar as funds flowed to safe haven markets and assets. Subsequently, the Mexican peso gradually appreciated against the U.S. dollar back to levels slightly lower than pre-crisis levels as investment risk was re-established.
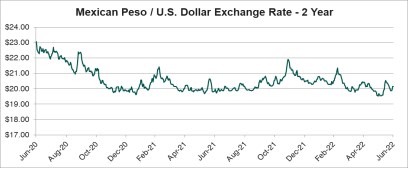
During the first half of 2022, the Canadian dollar was relatively flat. The average foreign exchange rate was $1.27 Canadian dollars per U.S. dollar, with the Canadian dollar trading within a range of $1.25 to $1.28. This compares to an average of $1.247, with a range of $1.205 to $1.283 Canadian dollars per U.S. dollar in first half of 2021.
During the year ended December 31, 2021, the Canadian dollar was relatively flat although it initially appreciated compared to the U.S. dollar with the strengthening of oil prices and then weakened again towards the end of the year. During 2021, the average foreign exchange rate was $1.253 Canadian dollars per U.S. dollar, with the Canadian dollar trading within a range of $1.204 to $1.292. This compares to an average of $1.3409, with a range of $1.272 to $1.453 Canadian dollars per U.S. dollar during 2020.
During the year ended December 31, 2020, the Canadian dollar was flat until a significant decrease in oil prices and then the COVID-19 crisis in March 2020 when the Canadian dollar significantly depreciated against the U.S. dollar as funds invested in safe haven markets and assets. Subsequently, the Canadian dollar gradually appreciated against the U.S. dollar back to levels slightly lower than pre-crisis levels as investment risk was re-established.
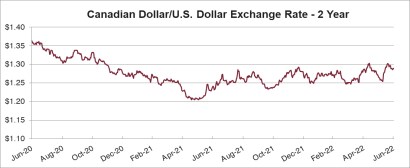
Cost Trends
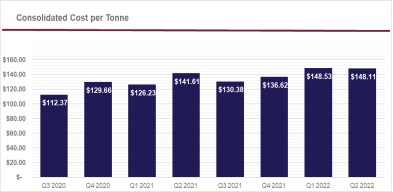
The Company's profitability is subject to industry wide cost pressures on development and operating costs with respect to labour, energy, consumables and capital expenditures. Underground mining is labour intensive and approximately 33% of the Company's production costs are directly tied to labour. In order to mitigate the impact of higher labour and consumable costs, the Company focuses on continuous improvement by promoting more efficient use of materials and supplies and by pursuing more advantageous pricing while increasing performance and without compromising operational integrity. During first half of 2022, mining, processing and indirect costs all increased due to inflationary and industry cost pressuresand improved profitability resulted in increased special mining duties paid to the government.
ANNUAL OUTLOOK
Production
The Company has increased the consolidated production guidance to 7.6 to 8.0 million oz silver equivalents from the initial forecast of 6.7 - 7.6 million oz. The updates to the full year 2022 consolidated production are driven by strong performance and higher silver and gold grades at Guanacevi, while production at Bolañitos remains similar as originally planned.
In 2022, silver production is expected to range from 4.9 to 5.1 million oz and gold production is expected to range from 34,000 to 36,000 oz. Silver equivalent production is forecasted to total 7.6 to 8.0 million oz using an 80:1 silver:gold ratio.
|
Mine
|
Ag (M oz)
|
Au (K oz)
|
Ag Eq (M oz)
|
Tonnes/ Day (tpd)
|
|
Guanaceví
|
4.3-4.5
|
13.0 -14.0
|
5.3-5.6
|
1,100-1,200
|
|
Bolañitos
|
0.6-0.6
|
21.0-22.0
|
2.3-2.4
|
1,000-1,200
|
|
Total
|
4.9-5.1
|
34.0 -36.0
|
7.6-8 .0
|
2,100-2,40 0
|
At Guanaceví, throughput has been 1,079 tpd compared to the guided throughput range of 1,100 tpd to 1,200 tpd. The lower than planned throughput was due to the installation of a new cone crusher and repairs of processing tanks in the first half of the year. Management expects to meet plant capacity in the second half of the year. As planned, a significant portion of production is mined from the Porvenir Cuatro extension on the El Curso concessions. The El Curso concessions were leased from a third party with no up-front costs but with significant royalty payments on production. The El Curso ore grades have continued to exceed estimates resulting in higher grade ore milled. Ore grades are expected to be slightly lower than the grades reported for the first half of 2022 but remain above initial plan.
Operating Costs
In 2022, cash costs, net of gold by-product credits, were budgeted to be $9.00-$10.00 per oz of silver produced. Consolidated cash costs on a co-product basis are anticipated to be $13.00-$14.00 per oz silver and $1,100-$1,200 per oz gold.
AISC, net of gold by-product credits, in accordance with the World Gold Council standard, were estimated to be $20.00-$21.00 per oz of silver produced. When non-cash items such as stock-based compensation and accretion are excluded, AISC are forecasted to be in the $19.00-$20.00 range.
Direct operating costs per tonne were estimated to be $95-$100 with inflationary pressures expected to continue in 2022. Direct costs, which include royalties and special mining duties are estimated to be in the range of $120-$125 per tonne.
Direct operating costs per tonne were expected to increase in 2022, primarily due to the impact of inflation on power costs, reagent costs and salaries as well as higher estimated royalty and mining duty payments. Inflationary pressures have been greater than estimated resulting in operating costs being higher than budgeted. The higher ore grades have offset the increased operating cost per tonne resulting costs metric on a per ounce basis to slightly exceed the high end range of guidance. Management estimates the costs on a per ounce basis will be near the high end range of guidance for the year.
Management made the following assumptions in calculating its 2022 cost forecasts: $22 per oz silver price, $1,760 per oz gold price and 20:1 Mexican peso to U.S. dollar exchange rate.
Sustaining Capital Investments
In 2022, Endeavour's preliminary plan was to invest $34.3 million in sustaining capital, including $32.6 million at its two operating mines and $1.7 million to maintain the exploration concessions and cover corporate infrastructure. Inflationary pressures have been greater than estimated and sustaining capital is anticipated to be higher. At current metal prices, the sustaining capital investments should be covered by operating cash flow.
Pitarrilla Acquisition
On January 17, 2022, the Company entered into a definitive agreement to purchase the Pitarrilla project, a large undeveloped silver, lead, and zinc project, located in Durango State, Mexico, by acquiring all of the issued and outstanding shares of SSR Durango, S.A. de C.V. from SSR Mining Inc. for a total consideration of US$70 million (consisting of $35 million in Company's shares and a further $35 million in cash or in the Company's shares at the election of SSR Mining and as agreed to by the Company) and a 1.25% net smelter returns royalty. SSR Mining retains a 1.25% NSR Royalty in Pitarrilla. Endeavour will have matching rights to purchase the NSR Royalty in the event SSR Mining proposes to sell it. The acquisition was completed on July 6, 2022. Total consideration paid included 8,577,380 shares of the Company issued on July 6, 2022 with a deemed value of $34,909,937 and a $35,066,829 cash payment. The shares are subject to a hold period of four months and one day following the date of closing.
Management plans to invest $1.8 million for drilling to verify the historical data and define a current resource in 2022.
Development Investment and Expenditures
At Terronera, expected expenditures are $41.0 million for the first ten months of 2022 to continue with final detailed engineering, mine portal development, road construction, earth works, a permanent camp, critical contracts and procurement of long lead items. The Company intends to make a formal construction decision, subject to completions of a financing package and receipt of amended permits, in the coming months.
LIQUIDITY AND CAPITAL RESOURCES
Cash and cash equivalents increased from $103.3 million at December 31, 2021 to $116.2 million at June 30, 2022. The Company had working capital of $149.7 million at June 30, 2022 (December 31, 2021 - $121.2 million). The $28.5 million increase in working capital is primarily due to the net proceeds of an equity offering of $43.2 million and $2.4 million provided from exercise of options, offset by $28.4 million invested in property, plant and equipment, $2.1 million for the purchase of other investments, $2.4 million in loan and lease payments, $2.7 million for the withholding taxes on the settlement of performance share units and an increase in non-cash working capital of $21.0 million.
Operating activities provided $3.2 million during the first half of 2022 compared to providing $5.5 million in same period of 2021. The significant non-cash adjustments to the net loss of $0.3 million (2021 – $18.9 million) were amortization and depletion of $10.8 million (2021 – $14.3 million), share-based compensation of $2.5 million (2021 – $2.2 million), a deferred income tax expense of $8.0 million (2021 – $4.2 million), finance costs of $0.6 million (2021 – $0.5 million), a loss on other investments of $2.3 million (2021 – gain on other investments of $3.9 million), write off of exploration properties $0.5 million (2021 – $Nil) and an increase in non-cash working capital of $21.0 million (2021 – $8.4 million). In first half of 2021 there was also an impairment reversal of non-current assets of $16.8 million of the El Cubo mine and equipment upon reclassification as held for sale and a gain on the disposal of the sale of the El Cubo mine and equipment. The increase in non-cash working capital is a result of an increase in the carrying cost of inventories of $8.2 million, an increase in prepaid expenses of $6.4 million and a decrease in accounts payable and accrued liabilities of $5.6 million.
The Company's Mexican subsidiaries pay Impuesto al Valor Agregado ("IVA") on the purchase and sale of goods and services. The net amount paid is recoverable but is subject to review and assessment by the tax authorities. The Company regularly files the required IVA returns and all supporting documentation with the tax authorities, however, the Company has been advised that certain IVA amounts receivable from the tax authorities are being withheld pending completion of the authorities' audit of certain of the Company's third-party suppliers. Under Mexican law, the Company has legal rights to those IVA refunds and the results of the third-party audits should have no impact on refunds. A smaller portion of IVA refund requests are from time to time denied based on the alleged lack of compliance of certain formal requirements and information returns by the Company's third-party suppliers. The Company takes necessary legal action on the delayed refunds as well as any denied refunds. The Company is in regular contact with the tax authorities in respect of its IVA filings and believes that the full amount of its IVA receivables will ultimately be received; however, the timing of recovery of these amounts and the nature and extent of any adjustments to the Company's IVA receivables remains uncertain.
Investing activities during first half of 2022 used net $30.5 million compared to generating $0.6 million in the same period in 2021. The capital investments were primarily for sustaining capital at existing operations and for development capital at the Terronera Project. Capital investments totaled $32.6 million in property, plant and equipment during first half of 2022 compared to $15.4 million in the same period in 2021. The Company used $2.1 million for investments in marketable securities during the first half of 2022 compared to generating net $9.3 million on the sale and purchase of marketable securities in the same period in 2021 and receiving cash of $7.5 million on sale of the El Cubo mine.
At Guanaceví, the Company invested $12.7 million, with $8.9 million spent on 2.6 km of mine development and acquired $1.6 million of mobile equipment. The Company continued to invest on upgrades for the plant and surrounding infrastructure, including $0.6 million on building and $1.4 million on plant upgrades, mine site improvements and the tailings facility and $0.2 million on office, building infrastructure and light vehicles.
At Bolañitos, the Company invested $5.2 million, with $4.1 million spent on 2.7 km of mine development and acquired $0.6 million of mobile equipment. The Company continued to invest in upgrades for the plant and surrounding infrastructure, totaling $0.5 million.
At Terronera, the Company invested $14.3 million, with $7.1 million spent on land payments and preliminary development, $6.9 million in mobile equipment and $0.3 million on light vehicles, office and IT infrastructure.
Exploration and general and administrative investments were $0.4 million spent on holding costs, mobile equipment, office, building infrastructure and light vehicles.
Financing activities for the first half of the 2022 increased cash by $40.1 million, compared to increasing cash by $57.9 million in the same period in 2021. During the six months ended June 30, 2022 the Company received gross proceeds of $46.0 million through a prospectus equity offering, paid $2.8 million in share issuance costs, received $2.4 million on the exercise of employee stock options, paid $2.8 million in interest and principal repayments on loans and leases and paid $2.7 million on redemption of performance share units. By comparison, during the same period in 2021, the Company raised gross proceeds through an ATM financing of $59.1 million, paid $1.3 million in share issue costs, received $4.6 million on the exercise of employee options and paid $2.3 million in interest and principal repayments on loans and leases and paid $2.2 million on redemption of performance share units.
On March 22, 2022, the Company completed a prospectus equity financing with the offering co-led by BMO Capital Markets and PI Financial Corp., together with a syndicate of underwriters consisting of CIBC World Markets Inc., B. Riley Securities Inc., and H.C. Wainwright & Co., LLC. The Company issued a total of 9,293,150 common shares at a price of $4.95 per share for aggregate gross proceeds of $46,001, less commission of $2,524 and recognized $273 of other transaction costs related to the financing as share issuance costs, which have been presented net within share capital. The Company plans to use the net proceeds of the offering of $43.2 million to pay the $35 million cash consideration payable to SSR on pending completion of the Company's acquisition of the Pitarrilla project in Durango State, Mexico and for the Company's general corporate purposes and working capital.
The net proceeds have been used as follows:
|
Use of proceeds (thousands)
|
|
|
Net proceeds received
|
$43,189
|
|
Pitarrilla acquisition - cash payment
|
-
|
|
Allocated to working capital
|
$43,189
|
Management of the Company believes that operating cash flow and existing working capital will be sufficient to cover 2022 capital requirements and commitments. The Company is assessing financing alternatives, including equity or debt or a combination of both to fund future growth, including the development of the Terronera project.
Contingencies
Minera Santa Cruz y Garibaldi SA de CV ("MSCG"), a subsidiary of the Company, received a Mexican peso ("MXN") 238 million assessment on October 12, 2010 by Mexican fiscal authorities for failure to provide the appropriate support for certain expense deductions taken in MSCG's 2006 tax return, failure to provide appropriate support for loans made to MSCG from affiliated companies, and deemed an unrecorded distribution of dividends to shareholders, among other individually immaterial items. MSCG immediately initiated a Nullity action and filed an administrative attachment to dispute the assessment.
In June 2015, the Superior Court ruled in favour of MSCG on a number of the matters under appeal; however, the Superior Court ruled against MSCG for failure to provide appropriate support for certain deductions taken in MSCG's 2006 tax return. In June 2016, the Company received a MXN 122.9 million ($6.1 million) tax assessment based on the June 2015 ruling. The 2016 tax assessment comprised of MXN 41.8 million in taxes owed ($2.1 million), MXN 17.7 million ($0.9 million) in inflationary charges, MXN 40.4 million ($2.0 million) in interest and MXN 23.0 million ($1.1 million) in penalties. The 2016 tax assessment was issued for failure to provide the appropriate support for certain expense deductions taken in MSCG's 2006 tax return and failure to provide appropriate support for loans made to MSCG from affiliated companies. If MSCG agrees to pay the tax assessment, or a lesser settled amount, it is eligible to apply for forgiveness of 100% of the penalties and 50% of the interest.
The Company filed an appeal against the June 2016 tax assessment on the basis that certain items rejected by the courts were included in the new tax assessment and a number of deficiencies exist within the assessment. Since issuance of the assessment interest charges of MXN 14.9 million ($0.7 million) and inflationary charges of MXN 22.3 million ($1.1 million) has accumulated.
Included in the Company's consolidated financial statements are net assets of $964,000 held by MSCG. Following the Tax Court's rulings, MSCG has been in discussions with the tax authorities with regards to the shortfall of assets within MSCG to settle its estimated tax liability. An alternative settlement option would be to transfer the shares and assets of MSCG to the tax authorities. The Company recognized an allowance for transferring the shares and assets of MSCG amounting to $964,000 in a prior year. The Company is currently assessing MSCG's settlement options based on ongoing court proceedings and discussion with the tax authorities. The Company has been advised that the appeal filed with the Federal Tax Court and Supreme Court of Justice, against the June 2016 tax assessment has been rejected. The Company continues to assess MSCG's settlement options.
Compania Minera Del Cubo SA de CV ("Cubo"), a subsidiary of the Company, received a MXN 58.5 million ($2.9 million) assessment in 2019 by Mexican fiscal authorities for failure to provide the appropriate support for depreciation deductions taken in the Cubo 2016 tax return and denied deductions of certain suppliers. The tax assessment consists of MXN 24.1 million ($1.2 million) for taxes, MXN 21.0 million ($1.1 million) for penalties, 10.4 million ($0.5 million) for interest and MXN 3.0 million ($0.1 million) for inflation. At the time of the tax assessment the Cubo entity had and continues to have sufficient loss carry forwards which would be applied against the assessed difference of taxable income. The Mexican tax authorities did not consider these losses in the assessment.
Due to the denial of certain suppliers for income tax purposes in the Cubo assessment, the invoices from these suppliers have been assessed as ineligible for refunds of IVA (value-added taxes) paid on the invoices. The assessment includes MXN 14.7 million ($0.7 million) for re-payment of IVA refunded on these supplier payments. In the Company's judgement, the suppliers and invoices meet the necessary requirements to be deductible for income tax purposes and the recovery of IVA.
The Company filed an administrative appeal related to the 2016 Cubo tax assessment. The Company had previously provided a lien on certain El Cubo mining concessions during the appeal process. To facilitate the sale of the El Cubo mine and related assets, the Company elected to pay the assessed amount of $3.5 million during Q1, 2021. During the appeal process the amount paid has been classified as a non-current income tax recoverable. Since issuance of the assessment interest charges of MXN 9.9 million ($0.5 million) and inflationary charges of MXN 1.6 million ($0.1 million) had accumulated. The Company continues to assess that it is probable that its appeal will prevail, and no provision is recognized in respect of the Cubo tax assessment.
The Company is required to use judgement to determine certain tax treatments in calculating income tax expense and IVA recoverable. A number of these judgements are subject to various uncertainties. From time to time, Mexican authorities may apply, re-interpret legislation or disregard precedents and it is possible that of these uncertainties may be resolved unfavorably for the Company.
Capital Requirements
As of June 30, 2022, the Company held $116.2 million in cash and $149.7 million in working capital. The duration and severity of the global COVID-19 pandemic could have a material impact on the Company's liquidity. The Mexican government declared mining as an essential business, however in Mexico positive COVID-19 cases continue at a significant rate. A local outbreak, an impediment to supply or market logistics or change in government health orders remains a significant risk. The mines are operating under strict safety protocols with the expectations of operating near throughput capacity.
The Company may be required to raise additional funds through future debt or equity financings in order to finance the development of the Terronera Project and may need to raise additional funds to carry out other business plans. The Company will continue to monitor capital markets, economic conditions, the COVID-19 global pandemic and assess its short term and long term capital needs.
See Annual Outlook on page 28 for discussion on planned capital and exploration expenditures.
Contractual Obligations
The Company had the following undiscounted contractual obligations at June 30, 2022:
| Payments due by period (in thousands of dollars) |
|
|
|
|
|
|
|
|
|
|
|
|
|
|
|
| Contractual Obligations |
|
Total |
|
|
Less than 1
year |
|
|
1 - 3 years |
|
|
3 - 5 years |
|
|
More than 5
years |
|
| Capital asset purchases |
$ |
24,587 |
|
$ |
24,587 |
|
$ |
- |
|
$ |
- |
|
$ |
- |
|
| Loans payable |
|
13,598 |
|
|
5,712 |
|
|
6,452 |
|
|
1,434 |
|
|
- |
|
| Lease liabilities |
|
1,079 |
|
|
228 |
|
|
346 |
|
|
326 |
|
|
179 |
|
| Other contracts(1) |
|
710 |
|
|
159 |
|
|
217 |
|
|
217 |
|
|
117 |
|
| Other Long-Term Liabilities (2) |
|
10,934 |
|
|
- |
|
|
154 |
|
|
2,116 |
|
|
8,664 |
|
| Total |
$ |
50,908 |
|
$ |
30,686 |
|
$ |
7,169 |
|
$ |
4,093 |
|
$ |
8,960 |
|
(1) Other contracts consist of office premises operating costs and short-term leases.
(2) The $11,080 of other long-term liabilities is the undiscounted cost estimate to settle the Company's reclamation costs of the Guanacevi, Bolañitos and El Compas mines in Mexico. These costs include land rehabilitation, decommissioning of buildings and mine facilities, ongoing care and maintenance and other costs.
TRANSACTIONS WITH RELATED PARTIES
The Company shares common administrative services and office space with Aztec Metals Corp., which is considered a related party company by virtue of Bradford Cooke, the Company's Executive Chairman, being a common director. From time to time, the Company incurs third-party costs on behalf of related parties, which are charged on a full cost recovery basis. The charges for these costs totaled $3,000 and $9,000 for the three and six months ended June 30, 2022 (June 30, 2021 - $1,000 and $2,000 respectively). The Company had a $Nil net receivable related to administration costs outstanding as at June 30, 2022 (December 31, 2021 - $1,000).
The Company was charged $72,000 and $342,000 for legal services for the three and six months ended June 30, 2022 by a law firm in which the Company's corporate secretary is a partner (June 30, 2021 - $51,000 and $192,000). The Company has $17,000 payable to the law firm as at June 30, 2022 (December 31, 2021 - $5,000).
FINANCIAL INSTRUMENTS AND FAIR VALUE MEASUREMENTS
As at June 30, 2022, the carrying and fair values of Endeavour's financial instruments by category were as follows:
| Expressed in thousands US dollars |
|
Fair value
through
profit or loss |
|
|
Amortized
cost |
|
|
Carrying
value |
|
|
Estimated
Fair value |
|
| Financial assets: |
|
|
|
|
|
|
|
|
|
|
|
|
| Cash and cash equivalents |
$ |
- |
|
$ |
116,226 |
|
$ |
116,226 |
|
$ |
116,226 |
|
| Other investments |
|
11,236 |
|
|
- |
|
|
11,236 |
|
|
11,236 |
|
| Trade receivables |
|
4,745 |
|
|
- |
|
|
4,745 |
|
|
4,745 |
|
| Other receivables |
|
- |
|
|
8,741 |
|
|
8,741 |
|
|
8,741 |
|
| Total financial assets |
$ |
15,981 |
|
$ |
124,967 |
|
$ |
140,948 |
|
$ |
140,948 |
|
| |
|
|
|
|
|
|
|
|
|
|
|
|
| Financial liabilities: |
|
|
|
|
|
|
|
|
|
|
|
|
| Accounts payable and accrued liabilities |
$ |
4,801 |
|
$ |
21,582 |
|
$ |
26,383 |
|
$ |
26,383 |
|
| Loans payable |
|
- |
|
|
12,571 |
|
|
12,571 |
|
|
12,571 |
|
| Total financial liabilities |
$ |
4,801 |
|
$ |
34,153 |
|
$ |
38,954 |
|
$ |
38,954 |
|
Fair value hierarchy
Fair value is the price that would be received to sell an asset or paid to transfer a liability in an orderly transaction between market participants at the measurement date. The fair value hierarchy establishes three levels to classify the inputs to valuation techniques used to measure fair value. Level 1 inputs are quoted prices (unadjusted) in active markets for identical assets or liabilities. Level 2 inputs are quoted prices in markets that are not active, quoted prices for similar assets or liabilities in active markets, inputs other than quoted prices that are observable for the asset or liability (for example, interest rate and yield curves observable at commonly quoted intervals, forward pricing curves used to value currency and commodity contracts and volatility measurements used to value option contracts), or inputs that are derived principally from or corroborated by observable market data or other means. Level 3 inputs are unobservable (supported by no or little market activity). The fair value hierarchy gives the highest priority to Level 1 inputs and the lowest priority to Level 3 inputs.
Assets and liabilities as at June 30, 2022 that measured at fair value on a recurring basis include:
| As at June 30, 2022 |
|
|
|
|
|
|
|
|
|
|
|
|
| Expressed in thousands US dollars |
|
Total |
|
|
Level 1 |
|
|
Level 2 |
|
|
Level 3 |
|
| Assets: |
|
|
|
|
|
|
|
|
|
|
|
|
| Other investments |
$ |
11,236 |
|
$ |
10,313 |
|
$ |
- |
|
$ |
923 |
|
| Trade receivables |
|
4,745 |
|
|
- |
|
|
4,745 |
|
|
- |
|
| Total financial assets |
$ |
15,981 |
|
$ |
10,313 |
|
$ |
4,745 |
|
$ |
923 |
|
| |
|
|
|
|
|
|
|
|
|
|
|
|
| Liabilities: |
|
|
|
|
|
|
|
|
|
|
|
|
| Deferred share units |
$ |
4,693 |
|
$ |
4,693 |
|
$ |
- |
|
$ |
- |
|
| Share appreciation rights |
$ |
108 |
|
$ |
- |
|
$ |
108 |
|
$ |
- |
|
| Total financial liabilities |
$ |
4,801 |
|
$ |
4,693 |
|
$ |
108 |
|
$ |
- |
|
Other investments
The Company holds marketable securities classified as Level 1 and Level 3 in the fair value hierarchy. The fair values of Level 1 investments are determined based on a market approach reflecting the closing price of each particular security at the reporting date. The closing price is a quoted market price obtained from the stock exchange that is the principal active market for the particular security, being the market with the greatest volume and level of activity for the assets. For Level 3 investments, which consist of share purchase warrants where inputs are not observable, they have an estimated value determined by using an option pricing model. Changes in fair value on available for sale marketable securities are recognized in earnings or loss.
Trade receivables
The trade receivables consist of receivables from provisional silver and gold sales from the Bolañitos mine. The fair value of receivables arising from concentrate sales contracts that contain provisional pricing mechanisms is determined using the appropriate quoted closing price on the measurement date from the exchange that is the principal active market for the particular metal. As such, these receivables, which meet the definition of an embedded derivative, are classified within Level 2 of the fair value hierarchy.
Deferred share units
The Company has a cash settled Deferred Share Unit ("DSU") plan whereby deferred share units may be granted to independent directors of the Company in lieu of compensation in cash or stock options. The DSUs vest immediately and are redeemable for cash based on the market value of the units at the time of a director's retirement. The DSUs are classified as Level 1 in the fair value hierarchy. The liability is determined based on a market approach reflecting the closing price of the Company's common shares at the reporting date. Changes in fair value are recognized in general and administrative expenses.
Share appreciation rights
As part of the Company's bonus program, the Company grants share appreciation rights ("SARs") to its employees in Mexico and Chile. The SARs are subject to vesting conditions and, when exercised, constitute a cash bonus based on the value of the appreciation of the Company's common shares between the SARS grant date and the exercise date.
The SARs are classified as Level 2 in the fair value hierarchy. The liability is valued using a Black-Scholes option pricing model. Changes in fair value are recognized in salaries, wages and benefits.
Financial Instrument Risk Exposure and Risk Management
The Company is exposed in varying degrees to a variety of financial instrument related risks. The Board approves and monitors the risk management process. The types of risk exposure and the way in which such exposure is managed is provided as follows:
Credit Risk
The Company is exposed to credit risk on its bank accounts and accounts receivable. Credit risk exposure on bank accounts is limited through maintaining the Company's balances with high-credit quality financial institutions, maintaining investment policies, assessing institutional exposure and continual discussion with external advisors. Value-added tax receivables are generated on the purchase of supplies and services to produce silver, which are refundable from the Mexican government. Trade receivables are generated on the sale of concentrate inventory to reputable metal traders.
Liquidity Risk
Liquidity risk is the risk that the Company will not be able to meet its financial obligations as they come due. The Company manages its liquidity risk by continually monitoring forecasted and actual cash flows. The Company has in place a planning and budgeting process to help determine the funds required to support its normal operating requirement and development plans. The Company aims to maintain sufficient liquidity to meet its short-term business requirements, taking into account its anticipated cash flows from operations, its holdings of cash and cash equivalents, and its committed and anticipated liabilities.
The Company's Mexican subsidiaries pay IVA on the purchase and sale of goods and services. The net amount paid is recoverable but is subject to review and assessment by the tax authorities. The Company regularly files the required IVA returns and all supporting documentation with the tax authorities, however, the Company has been advised that certain IVA amounts receivable from the tax authorities are being withheld pending completion of the authorities' audit of certain of the Company's third-party suppliers. Under Mexican law, the Company has legal rights to those IVA refunds and the results of the third-party audits should have no impact on refunds. A smaller portion of IVA refund requests are from time to time denied based on the alleged lack of compliance of certain formal requirements and information returns by the Company's third-party suppliers. The Company takes necessary legal action on the delayed refunds as well as any denied refunds. The Company is in regular contact with the tax authorities in respect of its IVA filings and believes that the full amount of its IVA receivables will ultimately be received; however, the timing of recovery of these amounts and the nature and extent of any adjustments to the Company's IVA receivables remains uncertain.
Market Risk
The significant market risk exposures to which the Company is exposed are foreign currency risk, interest rate risk, and commodity price risk.
Foreign Currency Risk - The Company's operations in Mexico and Canada make it subject to foreign currency fluctuations. Certain of the Company's operating expenses are incurred in Mexican pesos and Canadian dollars; therefore, the fluctuation of the U.S. dollar in relation to these currencies will consequently have an impact upon the profitability of the Company and may also affect the value of the Company's assets and the amount of shareholders' equity. The Company has not entered into any agreements or purchased any instruments to hedge possible currency risks.
Interest Rate Risk - In respect of financial assets, the Company's policy is to invest cash at floating rates of interest and cash reserves are to be maintained in cash equivalents in order to maintain liquidity. Fluctuations in interest rates impact the value of cash equivalents. As at June 30, 2022 the Company has $1.1 million in equipment loans with interest rates that are linked to Libor and, with other variables unchanged, a 1% increase in the Libor rate would result in an additional interest expense of $10,000.
Commodity Price Risk - Gold and silver prices have historically fluctuated significantly and are affected by numerous factors outside of the Company's control, including, but not limited to, industrial and retail demand, central bank lending, forward sales by producers and speculators, levels of worldwide production, short-term changes in supply and demand because of speculative hedging activities and certain other factors. The Company has not engaged in any hedging activities, other than short-term metal derivative transactions less than 90 days, to reduce its exposure to commodity price risk. At June 30, 2022, there are 116,710 oz of silver and 4,033 oz of gold, which do not have a final settlement price and the estimated revenues have been recognized at current market prices. As at June 30, 2022, with other variables unchanged, a 10% decrease in the market value of silver and gold would result in a reduction of revenue of $1.0 million.
OUTSTANDING SHARE DATA
As of August 4, 2022, the Company had the following securities issued and outstanding:
- 189,628,734 common shares;
- 4,031,986 common shares issuable under stock options with a weighted average exercise price of CAD$4.16 per share expiring between May 3, 2023 and March 24, 2027;
- 1,420,000 performance share units with a weighted average grant price of CAD$3.79 vesting between March 1, 2023 and March 23, 2025; and
- 96,824 equity settled deferred share units with a weighted average grant prices of CAD$6.17 which are vested.
As at June 30, 2022, the Company's issued share capital was $631.8 million (December 31, 2021 - $585.4 million), representing 181,051,354 common shares (December 31, 2021 - 170,537,307), and the Company had options outstanding to purchase 4,031,986 common shares (December 31, 2021 - 3,848,200) with a weighted average exercise price of CAD$4.16 (December 31, 2021 - CAD$3.68).
The Company considers the items included in the consolidated statement of shareholders’ equity as capital. The Company’s objective when managing capital is to safeguard its ability to continue as a going concern so that it can continue to provide returns for shareholders and benefits for other stakeholders. The Company manages the capital structure and makes adjustments to it in light of changes in economic conditions and the risk characteristics of the underlying assets. In order to maintain or adjust the capital structure, the Company may issue new shares through private placements, prospectus offerings, convertible debentures, asset acquisitions or return capital to shareholders. The Company is not subject to externally imposed capital requirements.
CHANGES IN ACCOUNTING POLICIES AND CRITICAL ACCOUNTING ESTIMATES
Accounting standards adopted during the period:
The accounting policies applied in the Company's condensed consolidated interim financial statements for the three and six months ended June 30, 2022 are the same as those applied in the Company's annual audited consolidated financial statements as at and for the year ended December 31, 2021 except for the following:
Property, Plant and Equipment: Proceeds before Intended Use
On May 14, 2020, the IASB published a narrow scope amendment to IAS 16 Property, Plant and Equipment - Proceeds before Intended Use. The amendment prohibits deducting from the cost of property, plant and equipment amounts received from selling items produced while preparing the asset for its intended use. Instead, amounts received will be recognized as sales proceeds and the related costs in profit or loss. The effective date was for annual periods beginning on or after January 1, 2022 and the Company adopted the policy effective January 1, 2022. As of June 30, 2022, these amendments did not affect our condensed consolidated interim financial statements as no amounts have been received from selling items produced while preparing assets for their intended use.
.
Critical Accounting Estimates
The preparation of financial statements requires the Company to make estimates that affect the reported amounts of assets and liabilities and disclosure of contingent assets and liabilities at the date of the financial statements and the reported amounts of revenues and expenses during the reporting period. Significant areas requiring the use of management's judgment relate to the determination of mineralized reserves and resources, plant and equipment lives, estimating the fair values of financial instruments and derivatives, impairment of non-current assets, reclamation and rehabilitation provisions, recognition of deferred tax assets, and assumptions used in determining the fair value of share-based compensation.
See "Critical Accounting Estimates" in the Company's annual MD&A for the year ended December 31, 2021 for a detailed discussion of the areas in which critical accounting estimates are made.
CONTROLS AND PROCEDURES
Disclosure Controls and Procedures
The Company's management, with the participation of its Chief Executive Officer ("CEO") and Chief Financial Officer ("CFO"), has evaluated the effectiveness of the Company's disclosure controls and procedures. Based on the results of that evaluation, the Company's CEO and CFO have concluded that, as of June 30, 2022, the Company's disclosure controls and procedures were effective to provide reasonable assurance that the information required to be disclosed by the Company in reports it files is recorded, processed, summarized and reported, within the appropriate time periods and is accumulated and communicated to management, including the CEO and CFO, as appropriate to allow timely decisions regarding required disclosure.
Changes in Internal Control over Financial Reporting
Management, including the CEO and CFO, has evaluated the Company's internal controls over financial reporting to determine whether any changes occurred during the period that have materially affected, or are reasonably likely to materially affect, the Company's internal controls over financial reporting.
During the three and six months ended June 30, 2022 there have been no significant changes in internal control over financial reporting that have materially affected, or are reasonably likely to materially affect, the Company's internal control over financial reporting.