Endeavour Silver Corp.: Exhibit 99.2 - Filed by newsfilecorp.com
|
MANAGEMENT'S DISCUSSION AND ANALYSIS
FOR THE PERIOD ENDED MARCH 31, 2021
|
|
This Management Discussion and Analysis ("MD&A") should be read in conjunction with the condensed consolidated interim financial statements of Endeavour Silver Corp. ("Endeavour" or "the Company") for the three months ended March 31, 2021 and the related notes contained therein, which were prepared in accordance with IAS34 Interim financial reporting of the International Financial Reporting Standards ("IFRS") as issued by the International Accounting Standards Board ("IASB"). The Company uses certain non-IFRS financial measures in this MD&A as described under "Non-IFRS Measures". Additional information relating to the Company, including the most recent Annual Information Form (the "Annual Information Form"), is available on SEDAR at www.sedar.com, and the Company's most recent annual report on Form 40-F has been filed with the U.S. Securities and Exchange Commission (the "SEC"). This MD&A contains "forward-looking statements" that are subject to risk factors set out in a cautionary note contained herein. All dollar ($) amounts are expressed in United States ("$.") dollars and tabular amounts are expressed in thousands of U.S. dollars unless Canadian dollars (CAN$) are otherwise indicated. This MD&A is dated as of May 6, 2021 and all information contained is current as of May 6, 2021 unless otherwise stated.
Cautionary Note to U.S. Investors Regarding Mineral Reserves and Resources
This Management Discussion and Analysis has been prepared in accordance with the requirements of Canadian provincial securities laws, which differ from the requirements of U.S. securities laws. Unless otherwise indicated, all mineral reserve and mineral resource estimates included have been prepared in accordance with Canadian National Instrument 43-101- Standards of Disclosure for Mineral Projects ("NI 43-101") and the Canadian Institute of Mining, Metallurgy and Petroleum (the "CIM") - CIM Definition Standards on Mineral Resources and Mineral Reserves, adopted by the CIM Council, as amended. NI 43-101 is an instrument developed by the Canadian Securities Administrators that establishes standards for all public disclosure an issuer makes of scientific and technical information concerning mineral projects. These definitions differ from the definitions in requirements under United States securities laws adopted by the United States Securities and Exchange Commission.
Under Canadian rules, estimates of inferred mineral resources may not form the basis of feasibility or pre-feasibility studies, except in rare cases. Investors are cautioned not to assume that all or any part of an inferred mineral resource exists or is economically or legally mineable. An "inferred mineral resource" is that part of a mineral resource for which quantity and grade or quality are estimated on the basis of limited geological evidence and sampling. Geological evidence is sufficient to imply but not verify geological and grade or quality continuity. An inferred mineral resource has a lower level of confidence than that applying to an indicated mineral resource and must not be converted to a mineral reserve. It is reasonably expected that the majority of inferred mineral resources could be upgraded to indicated mineral resources with continued exploration.
Investors are cautioned not to assume that all or any part of mineral reserves and mineral resources determined in accordance with NI 43-101 and CIM standards will qualify as, or be identical to, mineral reserves and mineral resources estimated under the standards of the SEC applicable to U.S. companies. The SEC has adopted amendments to its disclosure rules to modernize the mineral property disclosure requirements for issuers whose securities are registered with the SEC. As a foreign private issuer that files its annual report on Form 40-F with the SEC pursuant to the multi-jurisdictional disclosure system, the Company is not required to provide disclosure on its mineral properties under the SEC's new rules and will continue to provide disclosure under NI 43-101 and the CIM standards. If the Company ceases to be a foreign private issuer or lose its eligibility to file its annual report on Form 40-F pursuant to the multi-jurisdictional disclosure system, then the Company will be subject to the SEC's new rules, which differ from the requirements of NI 43-101 and the CIM standards.
Accordingly, information contained in this Management Discussion and Analysis that contain descriptions of the Corporation's mineral deposits may not be comparable to similar information made public by U.S. companies subject to the reporting and disclosure requirements under the United States federal securities laws and the rules and regulations thereunder.
Forward-Looking Statements
This MD&A contains "forward-looking statements" within the meaning of the U.S. Securities Litigation Reform Act of 1995, as amended and "forward-looking information" within the meaning of applicable Canadian securities legislation. Such forward-looking statements and information include, but are not limited to, statements regarding Endeavour's anticipated performance in 2021, including silver and gold production, financial results, timing and expenditures to develop new silver mines and mineralized zones, silver and gold grades and recoveries, cash costs per ounce, capital expenditures and sustaining capital and the impact of the COVID 19 pandemic on operations. Forward-looking statements are frequently characterized by words such as "plan", "expect", "forecast", "project", "intend", "believe", "anticipate", "outlook" and other similar words, or statements that certain events or conditions "may" or "will" occur. Forward- looking statements are based on the opinions and estimates of management at the dates the statements are made, and are subject to a variety of risks and uncertainties and other factors that could cause actual events or results to differ materially from those projected in the forward-looking statements.
The Company does not intend to, and does not assume any obligation to, update such forward-looking statements or information, other than as required by applicable law. Forward-looking statements or information involve known and unknown risks, uncertainties and other factors and are based on assumptions that may cause the actual results, level of activity, performance or achievements of the Company and its operations to be materially different from those expressed or implied by such statements. Such factors and assumptions include, among others: the ultimate impact of the COVID 19 pandemic on operations and results, fluctuations in the prices of silver and gold, fluctuations in the currency markets (particularly the Mexican peso, Chilean peso, Canadian dollar and U.S. dollar); changes in national and local governments, legislation, taxation, controls, regulations and political or economic developments in Canada and Mexico; operating or technical difficulties in mineral exploration, development and mining activities; risks and hazards of mineral exploration, development and mining (including, but not limited to environmental hazards, industrial accidents, unusual or unexpected geological conditions, pressures, cave-ins and flooding); inadequate insurance, or inability to obtain insurance; availability of and costs associated with mining inputs and labour; the speculative nature of mineral exploration and development, diminishing quantities or grades of mineral reserves as properties are mined; the ability to successfully integrate acquisitions; risks in obtaining necessary licenses and permits, and challenges to the Company's title to properties; as well as those factors described under "Risk Factors" in the Company's Annual Information Form. Although the Company has attempted to identify important factors that could cause actual results to differ materially from those contained in forward-looking statements or information, there may be other factors that cause results to be materially different from those anticipated, described, estimated, assessed or intended. There can be no assurance that any forward-looking statements or information will prove to be accurate as actual results and future events could differ materially from those anticipated in such statements or information. Accordingly, readers should not place undue reliance on forward-looking statements or information.
Qualified Person
The scientific and technical information contained in this MD&A relating to the Company's mines and mineral projects has been reviewed and approved by Dale Mah, B.Sc., P.Geo., Vice President Corporate Development of Endeavour, a Qualified Person within the meaning of NI 43-101.
TABLE OF CONTENTS
OPERATING HIGHLIGHTS
| Q1 2021 Highlights |
Three Months Ended March 31 |
| 2021 |
2020 |
% Change |
| Production |
|
Silver ounces produced
|
1,048,100
|
857,659
|
22%
|
|
Gold ounces produced
|
11,109
|
8,476
|
31%
|
|
Payable silver ounces produced
|
1,036,710
|
849,791
|
22%
|
|
Payable gold ounces produced
|
10,894
|
8,320
|
31%
|
|
Silver equivalent ounces produced (1)
|
1,936,820
|
1,535,739
|
26%
|
|
Cash costs per silver ounce(2)(3)
|
7.86
|
7.85
|
0%
|
|
Total production costs per ounce(2)(4)
|
15.41
|
16.35
|
(6%)
|
|
All-in sustaining costs per ounce(2)(5)
|
19.94
|
18.38
|
8%
|
|
Processed tonnes
|
209,453
|
199,327
|
5%
|
|
Direct operating costs per tonne(2)(6)
|
112.36
|
96 .90
|
16%
|
|
Direct costs per tonne(2)(6)
|
126 .23
|
101.63
|
24%
|
|
Silver co-product cash costs(7)
|
15.16
|
11.51
|
32%
|
|
Gold co-product cash costs(7)
|
950
|
1,226
|
(22%)
|
|
Financial
|
|
Revenue ($ millions)
|
34.5
|
21.9
|
58%
|
|
Silver ounces sold
|
623,379
|
665,500
|
(6%)
|
|
Gold ounces sold
|
10,663
|
7,454
|
43%
|
|
Realized silver price per ounce
|
27.17
|
15.33
|
77%
|
|
Realized gold price per ounce
|
1,703
|
1,633
|
4%
|
|
Net earnings (loss) ($ millions)
|
12.2
|
(15.9)
|
177%
|
|
Adjusted net earnings (loss) (11) ($ millions)
|
(4.5)
|
(15.9)
|
71%
|
|
Mine operating earnings (loss) ($ millions)
|
5.7
|
(2.9)
|
296%
|
|
Mine operating cash flow ($ millions)(8)
|
13.3
|
4.3
|
211%
|
|
Operating cash flow before working capital changes(9)
|
5.2
|
(5.0)
|
205%
|
|
Earnings before ITDA(10 ) ($ millions)
|
24.0
|
(6.7)
|
457%
|
|
Working capital ($ millions)
|
113.1
|
27.2
|
316%
|
|
Shareholders
|
|
Earnings (loss) per share – basic
|
0.08
|
(0.11)
|
173%
|
|
Adjusted earnings (loss) per share – basic (8)
|
(0.03)
|
(0.11)
|
75%
|
|
Operating cash flow before working capital changes per share(9)
|
0.03
|
(0.04)
|
194%
|
|
Weighted average shares outstanding
|
159,670,842
|
141,810,208
|
13%
|
(1) Silver equivalents are calculated using an 80:1 (Ag/Au) ratio.
(2) The Company reports non-IFRS measures which include cash costs net of by-product revenue on a payable silver basis, total production costs per ounce, all-in sustaining costs per ounce, direct production costs per tonne, silver co-product cash costs and gold co-product cash costs in order to manage and evaluate operating performance at each of the Company's mines. These measures, some established by the Silver Institute (Production Cost Standards, June 2011), are widely used in the silver mining industry as a benchmark for performance, but do not have a standardized meaning. These measures are reported on a production basis. See Reconciliations to IFRS beginning on page 15.
(3) Cash costs net of by-product revenue per payable silver ounce include mining, processing (including smelting, refining, transportation and selling costs), and direct overhead, net of gold credits. See Reconciliation to IFRS on pages 16 & 17.
(4) Total production costs per ounce include mining, processing (including smelting, refining, transportation and selling costs), direct overhead, amortization, depletion and amortization at the operation sites net of by product revenues. See Reconciliation to IFRS on pages 16 & 17.
(5) All-in sustaining cost per ounce include mining, processing (including smelting, refining, transportation and selling costs), direct overhead, corporate general and administration, on-site exploration, share-based compensation, reclamation and sustaining capital net of gold credits. See Reconciliation to IFRS on page 18.
(6) Direct operating costs per tonne include mining, processing (including smelting, refining, transportation and selling costs) and direct overhead at the operation sites. Direct cost per tonne include all direct operating costs, royalties and special mining duty. See Reconciliation to IFRS on pages 16 & 17.
(7) Silver co-product cash cost and gold co-product cash cost include mining, processing (including smelting, refining, transportation and selling costs), and direct overhead allocated on pro-rated basis of realized metal value. See Reconciliation to IFRS on pages 19.
(8) Mine operating cash flow is calculated by adding back amortization, depletion, inventory write-downs and share-based compensation to mine operating earnings. Mine operating earnings and mine operating cash flow are before taxes. See Reconciliation to IFRS on page 15.
(9) See Reconciliation to IFRS on page 15 for the reconciliation of operating cash flow before working capital changes and for the operating cash flow before working capital changes per share.
(10) See Reconciliation of Earnings before interest, taxes, depreciation and amortization on page 16.
(11) Adjusted net earnings is calculated by adding back the reversal of impairment on non-current assets that are held for sale which had a significant effect on reported earnings. See Reconciliation to IFRS on page 15.
The above highlights are key measures used by management, however they should not be the sole measures used in determining the performance of the Company's operations.
HISTORY AND STRATEGY
The Company is engaged in silver mining in Mexico and related activities including property acquisition, exploration, development, mineral extraction, processing, refining and reclamation. The Company is also engaged in exploration activities in Chile. Since 2002, the Company's business strategy has been to focus on acquiring advanced-stage silver mining properties in Mexico. Mexico, despite its long and prolific history of metal production, appears to be relatively under-explored using modern exploration techniques and offers promising geological potential for precious metals exploration and production.
The Company's Guanaceví and Bolañitos mines acquired in 2004 and 2007, respectively, demonstrate its business model of acquiring fully built and permitted silver mines that were about to close for lack of ore. By bringing the money and expertise needed to find new silver ore-bodies, the Company successfully re-opened and expanded these mines to develop their full potential. The benefit of acquiring fully built and permitted mining and milling infrastructure is that, if new exploration efforts are successful, the mine development cycle from discovery to production only takes a matter of months instead of the several years normally required in the traditional mining business model.
In addition to operating the Guanaceví and Bolañitos mines, the Company commissioned the El Compas mine in March 2019. The Company is advancing the Terronera development project and several exploration projects in order to achieve its goal to become a premier senior producer in the silver mining sector. In 2012, the Company acquired the El Cubo silver-gold mine located in Guanajuato, Mexico, which operated until November 2019.
The Company has historically funded its acquisition, exploration and development activities through equity financings, debt facilities and convertible debentures. In recent years, the Company has financed most of its acquisition, exploration, development and operating activities from production cash flows, treasury and equity financings. The Company may choose to undertake equity, debt, convertible debt or other financings, on an as-needed basis, in order to facilitate its growth.
On March 31, 2020, the Mexican government declared a national health emergency with extraordinary measures due to the COVID-19 pandemic. Numerous health precautions were decreed, including the suspension of non-essential businesses, with only essential services to remain open. At March 31, 2020, mining did not qualify as an essential service so for the protection of the Company's staff, employees, contractors and communities, the Company suspended its three mining operations in Mexico as of April 1, 2020 as mandated by the Mexican government. The Company retained essential personnel at each mine site during the suspension period to maintain safety protocols, environmental monitoring, security measures and equipment maintenance. Essential personnel followed the Company's strict COVID-19 safety protocols and non-essential employees were sent home to self-isolate and stay healthy, while continuing to receive their base pay. The suspension of activities ceased in May 2020 as mining was declared an essential business.
The Company implemented measures to minimize the risks of the COVID-19 virus, both to employees and to the business. At each site, the Company is following government health protocols and is closely monitoring the pandemic with local health authorities. The Company has posted health advisories to educate employees about the COVID-19 symptoms, best practices to avoid contracting and spreading the virus, and procedures to follow if symptoms are experienced.
As the COVID-19 global pandemic is dynamic and, given that the ultimate duration and severity of the pandemic remains uncertain, the impact on the Company's 2021 production and costs has greater uncertainty. Globally, and in Mexico, positive COVID-19 continues to spread at a significant rate, while the duration of vaccine distributions remain uncertain. A local outbreak, an impediment to supply or market logistics or change in government health orders remains a significant risk.
The Company's long-term business could be significantly adversely affected by the on-going effects the COVID-19 pandemic. The Company cannot accurately predict the impact COVID-19 will have on third parties' ability to meet their obligations with the Company, including due to uncertainties relating to the ultimate geographic spread of the virus, the severity of the disease, the duration of the outbreak, the duration of vaccine distribution and the length of travel and quarantine restrictions imposed by governments of affected countries.
In particular, the continued spread of COVID-19 globally could materially and adversely impact the Company's business including without limitation, employee health, limitations on travel, the availability of industry experts and personnel, on-going restrictions to mining and processing operations and drill programs, and other factors that will depend on future developments beyond the Company's control. In addition, the COVID 19 pandemic could adversely affect the economies and financial markets of many countries (including those in which the Company operates), resulting in an economic downturn that could negatively impact the Company's operating results and ability to raise capital.
As of March 31, 2021, the Company held $86.0 million in cash and $113.1 million in working capital. Management believes there is sufficient working capital to meet the Company's current obligations, however the ultimate duration and severity of the COVID pandemic remains uncertain and could impact the financial liquidity of the Company.
REVIEW OF OPERATING RESULTS
The Company operates the Guanaceví, Bolañitos and El Compas mines. The Company suspended mining operations at the El Cubo mine on November 30, 2019 due to exhaustion of reserves.
Consolidated Production Results for the Three Months Ended March 31, 2021 and 2020
|
CONSOLIDATED
|
Three Months Ended March 31
|
|
|
2021
|
2020
|
% Change
|
|
Ore tonnes processed
|
209,453
|
199,327
|
5%
|
|
Average silver grade (gpt)
|
179
|
155
|
16%
|
|
Silver recovery (%)
|
86.9
|
86.1
|
1%
|
|
Total silver ounces produced
|
1,048,100
|
857,659
|
22%
|
|
Payable silver ounces produced
|
1,036,710
|
849,791
|
22%
|
|
Average gold grade (gpt)
|
1.90
|
1.57
|
21%
|
|
Gold recovery (%)
|
86.7
|
84.4
|
3%
|
|
Total gold ounces produced
|
11,109
|
8,476
|
31%
|
|
Payable gold ounces produced
|
10,894
|
8,320
|
31%
|
|
Silver equivalent ounces produced (1)
|
1,936,820
|
1,535,739
|
26%
|
|
Cash costs per silver ounce(2)(3)
|
7.86
|
7.85
|
0%
|
|
Total production costs per ounce(2)(4)
|
15.41
|
16.35
|
(6%)
|
|
All in sustaining cost per ounce (2)(5)
|
19.94
|
18.38
|
8%
|
|
Direct operating costs per tonne(2)(6)
|
112.36
|
96.90
|
16%
|
|
Direct costs per tonne(2)(6)
|
126.23
|
101.63
|
24%
|
|
Silver co-product cash costs(7)
|
15.16
|
11.51
|
32%
|
|
Gold co-product cash costs(7)
|
950
|
1,226
|
(22%)
|
(1) Silver equivalents are calculated using an 80:1 (Ag/Au) ratio.
(2) The Company reports non-IFRS measures which include cash costs net of by-product revenue on a payable silver basis, total production costs per ounce, all-in sustaining costs per ounce, direct production costs per tonne, silver co-product cash costs and gold co-product cash costs in order to manage and evaluate operating performance at each of the Company's mines. These measures, some established by the Silver Institute (Production Cost Standards, June 2011), are widely used in the silver mining industry as a benchmark for performance, but do not have a standardized meaning. These measures are reported on a production basis. See Reconciliations to IFRS on page 15.
(3) Cash costs net of by-product revenue per payable silver ounce include mining, processing (including smelting, refining, transportation and selling costs), and direct overhead, net of gold credits. See Reconciliation to IFRS on pages 16 & 17.
(4) Total production costs per ounce include mining, processing (including smelting, refining, transportation and selling costs), direct overhead, amortization, depletion and amortization at the operation sites net of by product revenues. See Reconciliation to IFRS on pages 16& 17.
(5) All-in sustaining costs per ounce include mining, processing (including smelting, refining, transportation and selling costs), direct overhead, corporate general and administration, on-site exploration, share-based compensation, reclamation and sustaining capital net of gold credits. See Reconciliation to IFRS on page 18.
(6) Direct operating costs per tonne include mining, processing (including smelting, refining, transportation and selling costs) and direct overhead at the operation sites. Direct cost per tonne include all direct operating costs, royalties and special mining duty. See Reconciliation to IFRS on pages 16 & 17.
(7) Silver co-product cash cost and gold co-product cash cost include mining, processing (including smelting, refining, transportation and selling costs), and direct overhead allocated on pro-rated basis of realized metal value. See Reconciliation to IFRS on page 19.
(1) Silver equivalents are calculated using an 80:1 (Ag/Au) ratio.
Consolidated Production
Three months ended March 31, 2021 (compared to the three months ended March 31, 2020)
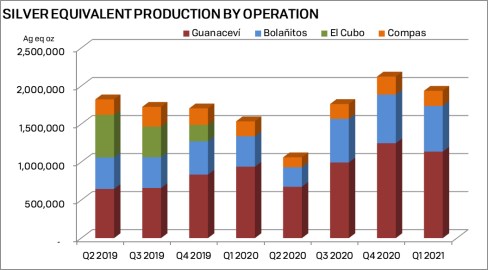
Consolidated silver production during Q1, 2021 was 1,048,100 ounces (oz), an increase of 22% compared to 857,659 oz in Q1, 2020, and gold production was 11,109 oz, an increase of 31% compared to 8,476 oz in Q1, 2020. Plant throughput was 209,453 tonnes at average grades of 179 grams per tonne (gpt) silver and 1.90 gpt gold, a throughput increase of 5% compared to 199,327 tonnes at average grades of 155 gpt silver and 1.57 gpt gold in Q1, 2020. The 22% increase in silver production and 31% increase in gold production compared to Q1, 2020 is primarily due to a significant increase in silver grades at Guanaceví and improved throughput and gold grades at Bolañitos.
For the first quarter of 2021, silver equivalent production was in line with guidance. The COVID-19 pandemic remains prevalent in Mexico, and at the Company's business locations, process and protocols remain in place to ensure staff and workers as well as our communities remain as safe as possible.
Consolidated Operating Costs
Three months ended March 31, 2021 (compared to the three months ended March 31, 2020)
Direct operating costs per tonne in Q1, 2021 increased 16%, to $112.36 compared with Q1, 2020 due to higher operating costs at Guanaceví and Bolañitos, offset by lower costs at El Compas. Guanaceví and Bolañitos have seen increased labour costs and increased third party ore purchased at Guanaceví compared to prior year. Including royalties and special mining duty, direct costs per tonne increased 24% to $126.23. Royalties increase 187% to $2.5 million as increased production from the El Curso concession at Guanaceví and higher prices substantially increased the royalty expense. The higher prices and higher grades increased special mining duty expense to $0.4 million for Q1, 2021.
Consolidated cash costs per oz, net of by-product credits (a non-IFRS measure and a standard of the Silver Institute) was flat at $7.86 as the higher grades and higher gold prices offset the higher direct costs per tonne. All-in sustaining costs (also a non-IFRS measure) increased 8% to $19.94 per oz in Q1, 2021 as a result of higher corporate general and administrative costs and increased capital expenditures at Guanaceví to accelerated mine development within the El Curso ore body. In Q1, 2020 corporate general and administrative included a $1.1 million mark to market recovery of deferred share units expense whereas the mark to market recovery was $0.2 million in 2021, all due to period end changes in the Company's share price.
On a co-product cash costs basis silver cost per ounce increased 32% and gold cost per ounce decreased 22% compared to the Q1, 2020. The improved silver ore grade was offset by higher operating, royalty and special mining duty costs primarily at the Guanaceví mine. Gold co-product cash costs decreased due to higher gold ore grades, higher gold recoveries offset by the higher operating costs at Bolañitos.
GUANACEVÍ OPERATIONS
The Guanaceví operation is currently producing from three underground silver-gold mines along a five kilometre length of the prolific Santa Cruz vein. Guanaceví provides steady employment to over 500 people and engages over 400 contractors.
During 2019, the Company acquired a 10 year right to explore and exploit the El Porvenir and El Curso concessions from Ocampo Mining SA de CV ("Ocampo"), a subsidiary of Grupo Frisco. The Company agreed to meet certain minimum production targets from the properties, subject to various terms and conditions and pay Ocampo a $12 fixed per tonne production payment plus a floating net smelter return royalty based on the spot silver price. The Company pays a 4% royalty on sales below $15.00 per ounce, 9% above $15.00 per ounce 13% above $20.00 per silver ounce, and a maximum 16% above $25 per silver ounce, based on the then current realized prices.
The development of two new orebodies, Milache and SCS and the acquisition of the Ocampo concession rights have provided sufficient ore and flexibility to increase mine output and to reach designed plant capacity. .
Production Results for the Three Months Ended March 31, 2021 and 2020
|
GUANACEVÍ
|
Three Months Ended March 31
|
|
|
2021
|
2020
|
% Change
|
|
Ore tonnes processed
|
88,632
|
94,207
|
(6%)
|
|
Average silver grade (g/ t)
|
369
|
280
|
32%
|
|
Silver recovery (%)
|
87.3
|
87.9
|
(1%)
|
|
Total silver ounces produced
|
918,217
|
745,114
|
23%
|
|
Payable silver ounces produced
|
915,462
|
742,998
|
23%
|
|
Average gold grade (g/ t)
|
1.05
|
0.87
|
21%
|
|
Gold recovery (%)
|
91.7
|
92.1
|
(0%)
|
|
Total gold ounces produced
|
2,743
|
2,427
|
13%
|
|
Payable gold ounces produced
|
2,735
|
2,421
|
13%
|
|
Silver equivalent ounces produced(1)
|
1,137,657
|
939,274
|
21%
|
|
Cash costs per silver ounce(2)(3)
|
11.25
|
9.01
|
25%
|
|
Total production costs per ounce(2)(4)
|
13.98
|
11.73
|
19%
|
|
All in sustaining cost per ounce (2)(5)
|
19.07
|
14.61
|
31%
|
|
Direct operating costs per tonne(2)(6)
|
140 .87
|
103.77
|
36%
|
|
Direct costs per tonne(2)(6)
|
168.74
|
111.89
|
51%
|
|
Silver co-product cash costs(7)
|
13.72
|
10.50
|
31%
|
|
Gold co-product cash costs(7)
|
860
|
1,119
|
(23%)
|
(1) Silver equivalents are calculated using an 80:1 (Ag/Au) ratio.
(2) The Company reports non-IFRS measures which include cash costs net of by-product revenue on a payable silver basis, total production costs per ounce, all-in sustaining costs per ounce and direct production costs per tonne, in order to manage and evaluate operating performance at each of the Company's mines. These measures, some established by the Silver Institute (Production Cost Standards, June 2011), are widely used in the silver mining industry as a benchmark for performance, but do not have a standardized meaning. These measures are reported on a production basis. See Reconciliation to IFRS on page 15.
(3) Cash costs net of by-product revenue per payable silver ounce include mining, processing (including smelting, refining, transportation and selling costs), and direct overhead, net of gold credits. See Reconciliation to IFRS on pages 16 & 17.
(4) Total production costs per ounce include mining, processing (including smelting, refining, transportation and selling costs), direct overhead, amortization, depletion and amortization at the operation sites net of by product revenues. See Reconciliation to IFRS on pages 16 & 17.
(5) All-in sustaining cost per ounce include mining, processing (including smelting, refining, transportation and selling costs), direct overhead, corporate general and administration, on-site exploration, share-based compensation, reclamation and sustaining capital net of gold credits. See Reconciliation to IFRS on page 18.
(6) Direct operating costs per tonne include mining, processing (including smelting, refining, transportation and selling costs) and direct overhead at the operation sites. Direct cost per tonne include all direct operating costs, royalties and special mining duty. See Reconciliation to IFRS on pages 16 & 172.
(7) Silver co-product cash cost and gold co-product cash cost include mining, processing (including smelting, refining, transportation and selling costs), and direct overhead allocated on pro-rated basis of realized metal value. See Reconciliation to IFRS on page 19.
Guanaceví Production Results
Three months ended March 31, 2021 (compared to the three months ended March 31, 2020)
Silver production at the Guanaceví mine during Q1, 2021 was 918,217 oz, an increase of 23% compared to 745,114 oz in Q1, 2020, and gold production was 2,743 oz, an increase of 13% compared to 2,427 oz in Q1, 2020. Plant throughput was 88,632 tonnes at average grades of 369 gpt silver and 1.05 gpt gold, compared to 94,207 tonnes at average grades of 280 gpt silver and 0.87 gpt gold in Q1, 2020. Production increased primarily due to the higher ore grades partly offset by lower throughput. In February, unusually cold weather in northern Mexico resulted in power curtailments effecting mine and process plant production over a three-day period. In March, throughput was lower than initially planned as the refurbishment of the tailings filter presses impacted daily throughput. The plant throughput is expected to approach its 1,200 tonnes per day capacity in Q2, 2021. Stockpiled ore inventory increased during the quarter as the mine output was on plan. With the higher metal prices, the purchase of local third-party ores continued to supplement mine production, amounting to 12% of quarterly throughput, and contributed to the higher ore grades. Ore grades are expected to revert to plan in Q2, 2021 and for the remainder of the year.
Guanaceví Operating Costs
Three months ended December 31, 2021 (compared to the three months ended December 31, 2020)
Direct operating costs per tonne for the three months ended March 31, 2021 increased 36% to $140.87 compared with the same period in 2020, as a result of increased purchase of local third party ores and increased labour costs. Including royalty and special mining duty costs direct cost per tonne increased 51% to $168.74 compared with the same period in 2020. Increased production from the El Curso concessions, higher prices significantly increased the royalties paid during the quarter. The increased metal prices and ore grades resulted in improved profitability and higher special mining duty payable to the Mexican government.
Cash costs per oz, net of by-product credits (a non-IFRS measure and a standard of the Silver Institute) were $11.25, 25% higher due to the higher cost per tonne, offset by the higher metal grades and higher gold credit. Similarly, all-in sustaining costs (also a non-IFRS measure) increased 31% to $19.07 per oz for the three months ended March 31, 2021. The increase in cash costs per oz was the primary driver of the higher all in sustaining costs, while higher capital and exploration expenditures and general and administration expenses contributed to the higher costs compared to the same period in 2020. Mine development advancement exceeded plan in Q1, 2021 increasing development expenditures in Q1, 2021 compared to Q1, 2020.
BOLAÑITOS OPERATIONS
The Bolañitos operation encompasses three underground silver-gold mines and a flotation plant. Bolañitos provides steady employment for over 380 people and engages over 240 contractors.
Production Results for the Three Months Ended March 31, 2021 and 2020
|
BOLAÑITOS
|
Three Months Ended March 31
|
|
|
2021
|
2020
|
% Change
|
|
Ore tonnes processed
|
97,692
|
83,217
|
17%
|
|
Average silver grade (g/ t)
|
38
|
40
|
(5%)
|
|
Silver recovery (%)
|
89.0
|
80.5
|
11%
|
|
Total silver ounces produced
|
106,227
|
86,125
|
23%
|
|
Payable silver ounces produced
|
98,988
|
81,006
|
22%
|
|
Average gold grade (g/ t)
|
2.15
|
1.71
|
26%
|
|
Gold recovery (%)
|
91.5
|
85.7
|
7%
|
|
Total gold ounces produced
|
6,182
|
3,922
|
58%
|
|
Payable gold ounces produced
|
6,028
|
3,817
|
58%
|
|
Silver equivalent ounces produced (1)
|
600,787
|
399,885
|
50%
|
|
Cash costs per silver ounce(2)(3)
|
(23.49)
|
(7.32)
|
221%
|
|
Total production costs per ounce(2)(4)
|
15.38
|
19 .63
|
(22%)
|
|
All in sustaining cost per ounce (2)(5)
|
24.31
|
44.17
|
(45%)
|
|
Direct operating costs per tonne(2)(6)
|
77.26
|
68 .21
|
13%
|
|
Direct costs per tonne(2)(6)
|
79.50
|
68.65
|
16%
|
|
Silver co-product cash costs(7)
|
15.73
|
11.34
|
39%
|
|
Gold co-product cash costs(7)
|
986
|
1,208
|
(18%)
|
(1) Silver equivalents are calculated using an 80:1 (Ag/Au) ratio.
(2) The Company reports non-IFRS measures which include cash costs net of by-product revenue on a payable silver basis, total production costs per ounce, all-in sustaining costs per ounce and direct production costs per tonne, in order to manage and evaluate operating performance at each of the Company's mines. These measures, some established by the Silver Institute (Production Cost Standards, June 2011), are widely used in the silver mining industry as a benchmark for performance, but do not have a standardized meaning. These measures are reported on a production basis. See Reconciliation to IFRS on page 15.
(3) Cash costs net of by-product revenue per payable silver ounce include mining, processing (including smelting, refining, transportation and selling costs), and direct overhead, net of gold credits. See Reconciliation to IFRS on pages 16 & 17.
(4) Total production costs per ounce include mining, processing (including smelting, refining, transportation and selling costs), direct overhead, amortization, depletion and amortization at the operation sites net of by product revenues. See Reconciliation to IFRS on pages 16 & 17.
(5) All-in sustaining cost per ounce include mining, processing (including smelting, refining, transportation and selling costs), direct overhead, corporate general and administration, on-site exploration, share-based compensation, reclamation and sustaining capital net of gold credits. See Reconciliation to IFRS on page 18.
(6) Direct operating costs per tonne include mining, processing (including smelting, refining, transportation and selling costs) and direct overhead at the operation sites. Direct cost per tonne include all direct operating costs, royalties and special mining duty. See Reconciliation to IFRS on pages 16 & 17.
(7) Silver co-product cash cost and gold co-product cash cost include mining, processing (including smelting, refining, transportation and selling costs), and direct overhead allocated on pro-rated basis of realized metal value. See Reconciliation to IFRS on page 19.
Bolañitos Production Results
Three months ended March 31, 2021 (compared to the three months ended March 31, 2020)
Silver production at the Bolañitos mine was 106,227 oz in Q1, 2021, an increase of 23% compared to 86,125 oz in Q1, 2020, and gold production was 6,182 oz in Q1, 2021, an increase of 58% compared to 3,922 oz in Q1, 2020. Plant throughput in Q1, 2021 was 97,692 tonnes at average grades of 38 gpt silver and 2.15 gpt gold, compared to 83,217 tonnes at average grades of 40 gpt silver and 1.71 gpt gold. Both silver and gold recoveries improved in Q1, 2021 compared to Q1, 2020. Recoveries improved as the operations improved ore blending to maximize recoveries compared to the prior period. In Q1, 2020 Bolañitos production was below plan due to slower than expected mine development in two new areas.
Bolañitos Operating Costs
Three months ended March 31, 2021 (compared to the three months ended March 31, 2020)
Direct production costs per tonne in Q1, 2021 increased 16% to $79.50 per tonne due to higher waste tonnes handled during the quarter, and higher labour costs. The significantly lower silver grades resulted in lower silver production, however cash costs net of by-product credits (which is a non-IFRS measure and a standard of the Silver Institute), were negative $23.49 per oz of payable silver in Q1, 2021 compared to negative $7.32 per oz in Q1, 2020 as gold price increased 4% and proportion of gold production increased compared to the same period in prior year. All-in sustaining costs (also a non-IFRS measure) decreased in Q1, 2021 to $24.31 per oz due to lower operating cost per oz, partially offset by higher corporate general and administrative charges.
On a co-product cash costs basis, silver cost per ounce increased compared to Q1, 2020. Silver co-product cash costs increased 39%, while gold co-product costs fell 18% to $15.73 per silver ounce and $958 per gold ounce respectively. The deterioration in the silver cost on a co-product basis was primarily driven by the higher direct costs per tonne and the variation in ore, while the lower gold costs on a co-product basis was driven by the higher ore gold grades, partially offset by the higher direct costs per tonne.
EL COMPAS OPERATIONS
The El Compas operation is a small but high grade, permitted gold-silver mine with a small leased flotation plant in the historic silver mining district of Zacatecas, with good exploration potential to expand resources and scale up production. There is also potential for the Company to acquire other properties in the area to consolidate resources and exploration targets in the district. El Compas has a nominal plant capacity of 250 tonnes per day.
El Compas currently employs close to 200 people and engages over 60 contractors and achieved commercial production during Q1, 2019. The current resource is sufficient to support mining until mid-2021, and brownfields exploration has returned encouraging results on the Calicanto property. Management is reviewing alternative mine plans to ensure positive free cash flow in 2021.
Production Results for the Three Months Ended March 31, 2021 and 2020
|
El Compas
|
Three Months Ended March 31
|
|
|
2021
|
2020
|
% Change
|
|
Ore tonnes processed
|
23,129
|
21,903
|
6%
|
|
Average silver grade (g/ t)
|
47
|
58
|
(19%)
|
|
Silver recovery (%)
|
67.7
|
64.7
|
5%
|
|
Total silver ounces produced
|
23,656
|
26,420
|
(10%)
|
|
Payable silver ounces produced
|
22,260
|
25,787
|
(14%)
|
|
Average gold grade (g/ t)
|
4.12
|
4.02
|
2%
|
|
Gold recovery (%)
|
71.3
|
75.1
|
(5%)
|
|
Total gold ounces produced
|
2,184
|
2,127
|
3%
|
|
Payable gold ounces produced
|
2,131
|
2,082
|
2%
|
|
Silver equivalent ounces produced(1)
|
198,376
|
196,580
|
1%
|
|
Cash costs per silver ounce(2)(3)
|
7.77
|
22.10
|
65%
|
|
Total production costs per ounce(2)(4)
|
74.17
|
138.95
|
(47%)
|
|
All in sustaining cost per ounce (2)(5)
|
36.19
|
45.98
|
(21%)
|
|
Direct operating costs per tonne(2)(6)
|
151.33
|
176.32
|
(14%)
|
|
Direct costs per tonne(2)(6)
|
160.71
|
182.81
|
(12%)
|
|
Silver co-product cash costs(7)
|
23.15
|
15.83
|
46%
|
|
Gold co-product cash costs(7)
|
1,451
|
1,686
|
(14%)
|
(1) Silver equivalents are calculated using an 80:1 (Ag/Au) ratio.
(2) The Company reports non-IFRS measures which include cash costs net of by-products on a payable silver basis, total production costs per ounce, all-in sustaining costs per ounce and direct production costs per tonne, in order to manage and evaluate operating performance at each of the Company's mines. These measures, some established by the Silver Institute (Production Cost Standards, June 2011), are widely used in the silver mining industry as a benchmark for performance, but do not have a standardized meaning. These measures are reported on a production basis. See Reconciliation to IFRS on page 15.
(3) Cash costs net of by-product revenue per payable silver ounce include mining, processing (including smelting, refining, transportation and selling costs), and direct overhead, net of gold credits. See Reconciliation to IFRS on pages 16 & 17.
(4) Total production costs per ounce include mining, processing (including smelting, refining, transportation and selling costs), direct overhead, amortization, depletion and amortization at the operation sites net of by product revenues. See Reconciliation to IFRS on pages 16 & 17.
(5) All-in sustaining cost per ounce include mining, processing (including smelting, refining, transportation and selling costs), direct overhead, corporate general and administration, on-site exploration, share-based compensation, reclamation and sustaining capital net of gold credits. See Reconciliation to IFRS on page 18.
(6) Direct operating costs per tonne include mining, processing (including smelting, refining, transportation and selling costs) and direct overhead at the operation sites. Direct cost per tonne include all direct operating costs, royalties and special mining duty. See Reconciliation to IFRS on pages 16 & 17.
(7) Silver co-product cash cost and gold co-product cash cost include mining, processing (including smelting, refining, transportation and selling costs), and direct overhead allocated on pro-rated basis of realized metal value. See Reconciliation to IFRS on page 19.
El Compas Production Results
Three months ended March 31, 2021 (compared to the three months ended March 31, 2020)
Silver production at the El Compas mine was 23,656 oz and gold production was 2,184 oz in Q1, 2021 compared to 26,420 silver oz and gold 2,127 gold oz in Q1, 2020. Plant throughput in Q1, 2021 was 23,129 tonnes at average grades of 47 gpt silver and 4.12 gpt gold compared to 21,903 tonnes at average grades of 58 gpt silver and 4.02 gpt gold. El Compas production was close to plan with higher throughput offset by lower silver grades. The variations in tonnes and grades are normal course variations and are similar to plan. Final settlements of concentrates resulted in higher silver recoveries and lower gold recoveries recognized during the quarter.
El Compas Operating Costs
Three months ended March 31, 2021 (compared to the three months ended March 31, 2020)
Direct production costs were $160.71 per tonne in Q1, 2021, a 12% decrease from Q1, 2020. Silver cash costs net of by-product credits (which is a non-IFRS measure and a standard of the Silver Institute), were $7.77 per oz of payable silver in Q1, 2021 compared to $22.10 per oz in Q1, 2020. The lower costs per tonne was the primary driver in the lower cash cost metric offset by lower silver grades compared to 2020. The decrease in costs per tonne was a result of normal variations in costs incurred.
On a co-product cash costs basis, both silver cost per ounce increased 46%, while gold co-product costs per ounce fell 14% to $23.15 per ounce and $1,451 per ounce, respectively compared to the Q1, 2020. The silver co-product cost per ounce increased due to the lower silver grade ore partially offset by the lower operating costs on a per tonne basis. The gold co-product cost per ounce decreased due to the lower operating costs on a per tonne basis.
All-in sustaining costs (also a non-IFRS measure) decreased in Q1, 2021 to $36.19 per oz due compared to $45.98 per ounce compared to the same period ended in 2020. The lower all-in sustaining costs is a function of the lower operating costs compared to 2020.
The Company retained essential personnel at El Compas during the 2020 suspension period to maintain safety protocols, environmental monitoring, security measures and day-to-day maintenance. Non-essential employees were sent home to self-isolate and continued to receive their base pay. These costs incurred from April 1st to late May totalled $0.5 million and were allocated to care and maintenance expenses and excluded from mine operating costs or the corresponding metrics.
EL CUBO OPERATIONS
The El Cubo operation includes two previously operating underground silver-gold mines and a flotation plant. which employed over 350 people and engaged over 200 contractors until the suspension of operations at the end of November 2019 as the mineral reserves had been exhausted. The mine, plant and tailings facilities are on care and maintenance.
Company management and contract personnel continue to maintain the security of the mine, plant and tailings facilities. For the three months ended March 31, 2021 the Company incurred $0.5 million (Q1 2020 - $1.0 million) in legal, administrative and care and maintenance expenses. In Q1, 2020 $0.2 million severance costs were incurred and $0.1 million in building and office depreciation.
On March 17, 2021, the Company signed a definitive agreement to sell the El Cubo mine and related assets to VanGold Mining Corp. ("VanGold") for $15.0 million in cash and share payments plus additional contingency payments. On April 9, 2021, VanGold purchased the El Cubo assets for the following consideration:
- $7.5 million cash paid on closing
- $5.0 million in VanGold common shares on closing - priced at CDN$0.30 per share for a total of 21,331,058 shares of VanGold
- $2.5 million in an unsecured promissory note due and payable April 9, 2022
VanGold is required to pay the Company up to an additional $3.0 million in contingent payments based on the following events:
- $1.0 million upon VanGold producing 3.0 million silver equivalent ounces from the El Cubo mill
- $1.0 million if the price of gold closes at or above US$2,000 dollars per ounce for 20 consecutive days prior to April 9, 2023.
- $1.0 million if the price of gold closes at or above US$2,200 dollars per ounce for 20 consecutive days prior to April 9, 2023.
DEVELOPMENT ACTIVITIES
Terronera Project
The Terronera project, located 40 kilometres northeast of Puerto Vallarta in the state of Jalisco, Mexico, features a high-grade silver-gold mineral resource in the Terronera vein, which is now over 1,400 metres long, 400 metres deep, 3 to 16 metres thick, and remains open along strike to the southeast and down dip.
In 2020, the Company engaged an external consultant to update a previous Preliminary Feasibility Study based on updated information gathered in 2019 and 2020. In Q3, 2020 the Company completed an updated summary of the project's economics and published the NI 43-101 Technical Report ("2020 PFS").
The 2020 PFS included significant changes to the operations plan, capital and operating costs compared to the previous study and, as a result, project economics improved with higher certainty on a number of assumptions. The external consultant reviewed all aspects of the previous studies, while further cost-benefit initiatives will continue to be evaluated.
The 2020 PFS base case assumes a two-year trailing average silver price of $15.97 per oz and a gold price of $1,419 per oz. At base case prices, the improved economics estimates a net present value (NPV) of $137 million at a 5% discount rate, internal rate of return (IRR) of 30.0%, and payback period of 2.7 years. Initial capital expenditures are estimated to be $99 million with life of mine capital expenditures estimated to be $60 million. The 10 year life of mine is estimated to produce an average of 3 million silver oz and 32,800 gold ounces per year generating $315 million pre-tax, $217 million after-tax, free cash flow over the life of the project.
The Company is working to complete a Feasibility Study in Q3, 2021 at an estimated cost of $1.8 million. The Company is evaluating a number of opportunities to further enhance the value of the project, including exploration drilling to expand the known resources and to test multiple veins within the district. Additionally, the Company has defined an engineering, procurement and construction strategy and is strategizing commencement of various early work items. An engineering team is being assembled and a $7.3 million budget has been approved for sourcing equipment and machinery and early work items, including camp construction and known earthworks.
EXPLORATION RESULTS
In 2021, the Company plans to spend $10.2 million drilling 50,000 metres of core on brownfields projects, greenfields exploration and development engineering across its portfolio of mines and properties. At the Guanaceví and Bolañitos operating mines, 11,500 metres of core drilling are planned at a cost of $2.0 million and $1.9 million, respectively to replace reserves and expand resources.
On the exploration and development projects, expenditures of $6.3 million are planned to fund 27,000 metres of core drilling at the Terronera project to test multiple regional targets, the Parral project to continue drilling the San Patricio and Veta Colorado vein systems and the Paloma project in Chile. The Company is currently permitting of the Cerro Marquez and Aida projects and will continue to map and sample to prioritize targets for drilling.
At Guanaceví, in Q1 2021 the Company drilled 4,343 metres in 18 holes to delineate the extension of the Porvenir Cuatro and Milache ore bodies. Drilling confirmed expectations and intersected significant mineralization with similar ore grades and vein widths as the 2020 intersections.
At Bolañitos, in Q1 2021 the Company drilled 3,512 metres in 19 holes to target the Melladito vein, the Plateros vein and the Belen vein. The Company intersected significant mineralization with ore grades over mineable widths. Management is currently interpreting the results and will continue to drill these veins throughout 2021.
At Terronera the Company commenced the 2021 drill program targeting the southeast area near the Terronera vein and regional area acquired in 2020. A total of 4,718 metres were drilled in 15 holes intersecting mineralized vein.
At Parral the Company commenced the drill program in March, drilling 3 holes totaling 1,104 metres testing extension of the Colorada vein. The drill program will continue through Q2, 2021.
In Chile, the Company continued drilling on the Paloma properties targeting a bulk tonnage, sulfidation epithermal deposit relate to intrusive domes or the tops of porphyry systems. Interpretation of the results are on-going to determine the next phase of drilling on the project.
CONSOLIDATED FINANCIAL RESULTS
Three months ended March 31, 2021 (compared to the three months ended March 31, 2020)
In Q1, 2021, the Company's mine operating earnings was $5.7 million (Q1, 2020: mine operating loss $2.9 million) on net revenue of $34.5 million (Q1, 2020: $21.9 million) with cost of sales of $28.8 million (Q1, 2020: $24.8 million).
In Q1, 2021, the Company had operating earnings of $14.3 million (Q1, 2020: operating loss $8.6 million) after exploration costs of $4.1 million (Q1, 2020: $2.4 million), general and administrative costs of $3.5 million (Q1, 2020: $2.0 million), care and maintenance expense for the El Cubo operation of $0.5 million (Q1, 2020: $1.3 million)and an impairment reversal of $16.8 million as a result of the valuation assessment done as a result of the El Cubo mine and related assets a liabilities classification as held for sale.
The earnings before taxes for Q1, 2021 was $16.0 million (Q1, 2020: loss before taxes $13.8 million) after finance costs of $0.3 million (Q1, 2020: $0.3 million), a foreign exchange loss of $0.7 million (Q1, 2020: loss of $4.9 million) and investment and interest income of $2.7 million (Q1, 2020: $49 thousand). The Company realized net earnings for the period of $12.2 million (Q1, 2020: net loss of $15.9 million) after an income tax expense of $3.8 million (Q1, 2020: $2.1 million).
Net revenue of $34.5 million in Q1, 2021, net of $0.6 million of smelting and refining costs, increased by 58% compared to $21.9 million, net of $0.5 million of smelting and refining costs in Q1, 2020. Gross sales of $35.1 million in Q1, 2021 represented a 57% increase over the $22.4 million for the same period in 2020. There was a 6% decrease in silver ounces sold and a 77% increase in the realized silver price resulting in a 66% increase to silver sales. There was a 43% increase in gold ounces sold with a 4% increase in realized gold prices resulting in a 49% increase in gold sales. During the period, the Company sold 623,379 oz silver and 10,663 oz gold, for realized prices of $27.17 and $1,703 per oz respectively, compared to sales of 665,500 oz silver and 7,454 oz gold, for realized prices of $15.33 and $1,633 per oz, respectively, in the same period of 2020. For the three months ended March 31, 2021, the realized prices of silver were within approximately 5% to London spot prices. During the same period, silver and gold spot prices averaged $26.26 and $1,794, respectively.
The Company increased its finished goods silver and gold inventory to 529,817 oz and 1,689 oz, respectively at March 31, 2021 compared to 116,484 oz silver and 1,459 oz gold at December 31, 2020. The cost allocated to these finished goods was $8.0 million at March 31, 2021, compared to $3.6 million at December 31, 2020. At March 31, 2021, the finished goods inventory fair market value was $15.9 million, compared to $5.8 million at December 31, 2020.
Cost of sales for Q1, 2021 was $28.8 million, an increase of 16% over the cost of sales of $24.8 million for the same period of 2020. The increase in cost of sales was primarily related to significantly higher labour costs and royalty costs partially offset by improved productivity at the Guanaceví and Bolañitos operations. Royalties increased 187% to $2.5 million due to higher realized prices and the increased mining of the high grade Porvenir and Porvenir Cuatro extensions at the Guanaceví operation which is subject to the significantly higher royalty rates.
Exploration and evaluation expenses increased in Q1, 2021 to $4.1 million from $2.4 million for the same period of 2020 primarily based on additional expenditures to advance the Terronera Feasibility Study and the timing of drill programs. General and administrative expenses increased to $3.5 million in Q1, 2021 compared to $2.0 million for the same period of 2020, due to mark-to-market fluctuations for director's deferred share units which comparatively increased costs by $0.9 million and additional salary costs as during early 2020 senior management took voluntary pay reductions and received lower bonuses.
The Company incurred a foreign exchange loss of $0.7 million in Q1, 2021 compared to a foreign exchange loss of $4.9 million in Q1, 2020 due to the weakening of the Mexican Peso in the quarter, which resulted in lower valuations of peso denominated tax receivables and cash balances. Although the Mexican Peso weakened for each of the periods, during Q1, 2020 there was a significantly sharper decline in value. The Company incurred $0.3 million in finance charges primarily related to mobile equipment purchased in 2019 and early 2020 compared to $0.3 million in the same period in 2020. The Company recognized $2.7 million in investment and other income compared to $49 thousand in Q1, 2020 with the majority of the other income derived from the gain on marketable securities of $2.5 million and interest received on IVA collections
Income tax expense was $3.8 million in Q1, 2021 compared to an income tax expense of $2.1 million in Q1, 2020. The $3.8 million tax expense is comprised of $0.7 million in current income tax expense (Q1, 2020: $0.3 million) and $3.1 million in deferred income tax expense (Q1, 2020: $1.8 million). The current income tax expense consists of $0.5 million of special mining duty taxes and $0.2 million of income taxes. The deferred income tax expense of $3.1 million is due to the use of loss carry forwards to offset taxable income generated at the Guanaceví and Bolañitos operations and the depreciation of the Mexican peso against the US dollar, reducing the value of loss carry forwards.
The recoverable amounts of the Company's cash-generating units (CGUs), which include mining properties, plant and equipment are determined at the end of each reporting period, if impairment indicators are identified. In previous years, commodity price declines led the Company to determine there were impairment indicators and assessed the recoverable amounts of its CGUs. The recoverable amounts were based on each CGUs future cash flows expected to be derived from the Company's mining properties and represent each CGU's value in use. The cash flows were determined based on the life-of-mine after-tax cash flow forecast which incorporates management's best estimates of future metal prices, production based on current estimates of recoverable reserves and resources, exploration potential, future operating costs and non-expansionary capital expenditures discounted at risk adjusted rates based on the CGUs weighted average cost of capital.
During Q1, 2021, the El Cubo mine project, consisting of the land rights, plant, buildings and the related reclamation liability were classified as held for sale and are now presented separately under current assets and current liabilities. Immediately prior to the classification to assets and liabilities held for sale, the carrying amounts of the land rights, plant and building were remeasured and the historical gross impairments of $216.9 million net of depletion and depreciation of $200.1 million, were reversed resulting in a $16.8 million impairment reversal. The reclamation provision for the El Cubo mine of $4.6 million transfers to VanGold upon acquisition of the related mining concessions.
NON-IFRS MEASURES
Adjusted earnings and adjusted earnings per share ("EPS") are non-IFRS measures that do not have standardized meanings prescribed by IFRS and, therefore, may not be comparable to similar measures presented by other issuers.
The Company incurred a reversal of impairments on non-current assets held for sale that had a significant effect on reported earnings. Adjusted earnings and adjusted EPS are measures used by management to assess the performance of the operations prior to the impact of the impairment amounts to appropriately compare to past performance and are provided to investors as a measure of the Company's operating performance.
|
Expressed in thousands US dollars except
|
Three Months Ended March 31
|
|
for share numbers and per share amounts
|
2021
|
2020
|
|
Net earnings (loss) for the period
|
$12,249
|
($15,926)
|
|
Impairment of non-current assets, net of tax
|
($16,791)
|
-
|
|
Adjusted net earnings (loss)
|
($4,542)
|
($15,926)
|
|
Basic weighted average share outstanding
|
159,670,842
|
141,810,208
|
|
Adjusted net earnings (loss) per share
|
($0.03)
|
($0.11)
|
Mine operating cash flow before taxes is a non-IFRS measure that does not have a standardized meaning prescribed by IFRS and therefore may not be comparable to similar measures presented by other issuers. Mine operating cash flow is calculated as revenue minus direct production costs and royalties. Mine operating cash flow is used by management to assess the performance of the mine operations, excluding corporate and exploration activities and is provided to investors as a measure of the Company's operating performance.
|
Expressed in thousands US dollars
|
Three Months Ended March 31
|
|
|
2021
|
20 20
|
|
Mine operating earnings (loss)
|
$5,664
|
($2,886)
|
|
Share-based compensation
|
118
|
91
|
|
Amortization and depletion
|
7,496
|
6,023
|
|
Write down of inventory to net realizable value
|
-
|
1,042
|
|
Mine operating cash flow before taxes
|
$13,278
|
$4,270
|
Operating cash flow before working capital changes per share is a non-IFRS measure that does not have a standardized meaning prescribed by IFRS and therefore may not be comparable to similar measures presented by other issuers. Operating cash flow per share is calculated by dividing cash from operating activities by the weighted average shares outstanding. Operating cash flow per share is used by management to assess operating performance irrespective of working capital changes and is provided to investors as a measure of the Company's operating performance.
|
Expressed in thousands US dollars
|
Three Months Ended March 31
|
|
|
2021
|
2020
|
|
Cash from (used in) operating activities
|
($3,923)
|
($2,349)
|
|
Net changes in non-cash working capital
|
(9,166)
|
2,622
|
|
Operating cash flow before working capital adjustments
|
$5,243
|
($4,971)
|
Operating cash flow before working capital changes per share is a non-IFRS measure that does not have a standardized meaning prescribed by IFRS and therefore may not be comparable to similar measures presented by other issuers. Operating cash flow per share is calculated by dividing cash from operating activities by the weighted average shares outstanding. Operating cash flow per share is used by management to assess operating performance irrespective of working capital changes and is provided to investors as a measure of the Company's operating performance.
|
Expressed in thousands US dollars except
|
Three Months Ended March 31
|
|
for share numbers and per share amounts
|
2021
|
2020
|
|
Operating cash flow before working capital adjustments
|
$5,243
|
($4,971)
|
|
Basic weighted average shares outstanding
|
159,670,842
|
141,810,208
|
|
Operating cash flow before working capital changes per share
|
$0.03
|
($0.04)
|
EBITDA is a non-IFRS financial measure, which excludes the following from net earnings:
- Income tax expense;
- Finance costs;
- Amortization and depletion
Adjusted EBITDA excludes the following additional items from EBITDA
- Share based compensation;
- Non-recurring impairments (reversals)
Management believes EBITDA is a valuable indicator of the Company's ability to generate liquidity by producing operating cash flow to fund working capital needs, service debt obligations, and fund capital expenditures. Management uses EBITDA for this purpose. EBITDA is also frequently used by investors and analysts for valuation purposes whereby EBITDA is multiplied by a factor or "EBITDA multiple" based on an observed or inferred relationship between EBITDA and market values to determine the approximate total enterprise value of a Company.
EBITDA is intended to provide additional information to investors and analysts. It does not have any standardized definition under IFRS and should not be considered in isolation or as a substitute for measures of operating performance prepared in accordance with IFRS. EBITDA excludes the impact of cash costs of financing activities and taxes, and the effects of changes in operating working capital balances, and therefore is not necessarily indicative of operating profit or cash flow from operations as determined by IFRS. Other companies may calculate EBITDA and Adjusted EBITDA differently.
|
Expressed in thousands US dollars
|
Three Months Ended March 31
|
|
|
2021
|
2020
|
|
Net earnings (loss) for the period
|
$12,249
|
($15,926)
|
|
Depreciation and depletion – cost of sales
|
7,496
|
6,023
|
|
Depreciation and depletion – exploration
|
79
|
90
|
|
Depreciation and depletion – general & administration
|
34
|
55
|
|
Depreciation and depletion – care & maintenance
|
15
|
10 0
|
|
Depreciation and depletion – inventory write down
|
-
|
50 0
|
|
Finance costs
|
291
|
310
|
|
Current income tax expense
|
671
|
266
|
|
Deferred income tax expense (recovery)
|
3,127
|
1,864
|
|
EBITDA
|
$23,962
|
($6,718)
|
|
Share based compensation
|
1,165
|
745
|
|
Impairment reversal
|
(16,791)
|
-
|
|
Adjusted EBITDA
|
$8,336
|
($5,973)
|
Cash costs per silver ounce, total production costs per ounce, direct operating costs per tonne and direct production costs per tonne are measures developed by precious metals companies in an effort to provide a comparable standard; however, there can be no assurance that the Company's reporting of these non-IFRS measures are similar to those reported by other mining companies. Cash costs per ounce, production costs per ounce and direct production costs per tonne are measures used by the Company to manage and evaluate operating performance at each of the Company's operating mining units. They are widely reported in the silver mining industry as a benchmark for performance, but do not have a standardized meaning and are disclosed in addition to IFRS measures. The following tables provide a detailed reconciliation of these measures to the Company's cost of sales, as reported in its consolidated financial statements.
|
Expressed in thousands US dollars
|
Three Months Ended March 31, 2021
|
Three Months Ended March 31, 2020
|
|
Guanaceví
|
Bolañitos
|
El Compas
|
Total
|
Guanaceví
|
Bolañitos
|
El Compas
|
Total
|
|
|
|
Direct costs per financial statements
|
$8,060
|
$7,105
|
$3,563
|
$18,728
|
$8,435
|
$5,295
|
$3,070
|
$16,800
|
|
Smelting and refining costs included in net revenue
|
-
|
489
|
138
|
627
|
-
|
341
|
104
|
445
|
|
Opening finished goods
|
(1,509)
|
(250)
|
(642)
|
(2,401)
|
(1,509)
|
(219)
|
(169)
|
(1,897)
|
|
Finished goods NRV adjustment
|
-
|
-
|
-
|
-
|
-
|
-
|
542
|
542
|
|
Closing finished goods
|
5,935
|
204
|
441
|
6,580
|
2,850
|
259
|
315
|
3,424
|
|
Direct operating costs
|
12,486
|
7,548
|
3,500
|
23,534
|
9,776
|
5,676
|
3,862
|
19,314
|
|
Royalties
|
2,213
|
68
|
179
|
2,460
|
678
|
37
|
142
|
857
|
|
Special mining duty (1)
|
257
|
151
|
38
|
446
|
87
|
-
|
-
|
87
|
|
Direct costs
|
14,956
|
7,767
|
3,717
|
26,440
|
10,541
|
5,713
|
4,004
|
20,258
|
|
By-product gold sales
|
(3,464)
|
(10,529)
|
(4,165)
|
(18,158)
|
(3,087)
|
(6,092)
|
(2,994)
|
(12,173)
|
|
Opening gold inventory fair market value
|
735
|
746
|
1,283
|
2,764
|
437
|
244
|
213
|
894
|
|
Closing gold inventory fair market value
|
(1,925)
|
(309)
|
(662)
|
(2,896)
|
(1,197)
|
(458)
|
(653)
|
(2,308)
|
|
Cash costs net of by-product
|
10,302
|
(2,325)
|
173
|
8,150
|
6,694
|
(593)
|
570
|
6,671
|
|
Amortization and depletion
|
1,593
|
3,793
|
2,110
|
7,496
|
1,609
|
2,072
|
2,342
|
6,023
|
|
Share-based compensation
|
39
|
40
|
39
|
118
|
30
|
31
|
30
|
91
|
|
Opening finished goods depletion
|
(271)
|
(104)
|
(804)
|
(1,179)
|
(252)
|
(43)
|
(121)
|
(416)
|
|
NRV depreciation cost adjustment
|
-
|
-
|
-
|
-
|
-
|
-
|
500
|
500
|
|
Closing finished goods depletion
|
1,137
|
118
|
133
|
1,388
|
636
|
123
|
262
|
1,021
|
|
Total production costs
|
$12,800
|
$1,522
|
$1,651
|
$15,973
|
$8,717
|
$1,590
|
$3,583
|
$13,890
|
|
|
Three Months Ended March 31, 2021
|
Three Months Ended March 31, 2020
|
|
|
Guanaceví
|
Bolañitos
|
El Compas
|
Total
|
Guanaceví
|
Bolañitos
|
El Compas
|
Total
|
|
Throughput tonnes
|
88,632
|
97,692
|
23,129
|
209,453
|
94,207
|
83,217
|
21,903
|
199,327
|
|
Payable silver ounces
|
915,462
|
98,988
|
22,260
|
1,036,710
|
742,998
|
81,006
|
25,787
|
849,791
|
|
Cash costs per silver ounce
|
$11.25
|
($23.49)
|
$7.77
|
$7.86
|
$9 .01
|
($7.32)
|
$22.10
|
$7.85
|
|
Total production costs per oz
|
$13.98
|
$15.38
|
$74.17
|
$15.41
|
$11.73
|
$19.63
|
$138.95
|
$16.35
|
|
Direct operating costs per tonne
|
$140.87
|
$77.26
|
$151.33
|
$112.36
|
$103.77
|
$68.21
|
$176.32
|
$96.90
|
|
Direct costs per tonne
|
$168.74
|
$79.50
|
$160.71
|
$126.23
|
$111.89
|
$68.65
|
$182.81
|
$101.63
|
| |
Expressed in thousands US dollars
|
Three Months Ended March 31, 2021
|
Three Months Ended March 31, 2020
|
|
| |
Guanaceví
|
Bolañitos
|
El Compas
|
Total
|
Guanaceví
|
Bolañitos
|
El Compas
|
Total
|
| |
|
| |
Closing finished goods
|
5,935
|
204
|
441
|
6,580
|
2,850
|
259
|
315
|
3,424
|
| |
Closing finished goods depletion
|
1,137
|
118
|
133
|
1,388
|
636
|
123
|
262
|
1,021
|
| |
Finished goods inventory
|
$7,072
|
$322
|
$574
|
$7,968
|
$3,486
|
$382
|
$577
|
$4,445
|
(1) Special mining duty is an EBITDA royalty tax presented as a current income tax in accordance with IFRS.
All-in sustaining costs per ounce and all-in costs per ounce are measures developed by the World Gold Council (and used as a standard of the Silver Institute) in an effort to provide a comparable standard within the precious metal industry; however, there can be no assurance that the Company's reporting of these non-IFRS measures are similar to those reported by other mining companies. These measures are used by the Company to manage and evaluate operating performance at each of the Company's operating mining units and consolidated group, and are widely reported in the silver mining industry as a benchmark for performance, but do not have a standardized meaning and are disclosed in addition to IFRS measures. The following tables provide a detailed reconciliation of these measures to the Company's cost of sales, as reported in the Company's consolidated financial statements.
|
Expressed in thousands US dollars
|
Three Months Ended March 31, 2021
|
Three Months Ended March 31, 2020
|
|
|
Guanaceví
|
Bolañitos
|
El Compas
|
Total
|
Guanaceví
|
Bolañitos
|
El Compas
|
Total
|
|
Cash costs net of by-product
|
$10,302
|
($2,325)
|
$173
|
$8,150
|
$6,694
|
($593)
|
$570
|
$6,671
|
|
Operations stock based compensation
|
39
|
40
|
39
|
118
|
30
|
31
|
30
|
91
|
|
Corporate general and administrative
|
1,588
|
839
|
277
|
2,704
|
720
|
307
|
151
|
1,178
|
|
Corporate stock based compensation
|
520
|
275
|
91
|
886
|
472
|
201
|
99
|
772
|
|
Reclamation - amortization/ accretion
|
12
|
11
|
2
|
25
|
10
|
7
|
2
|
19
|
|
Mine site expensed exploration
|
456
|
234
|
193
|
883
|
281
|
217
|
259
|
757
|
|
Intangible payments
|
31
|
31
|
31
|
93
|
29
|
28
|
28
|
85
|
|
Equipment loan payments
|
308
|
568
|
-
|
876
|
146
|
541
|
-
|
687
|
|
Capital expenditures sustaining
|
4,204
|
2,734
|
-
|
6,938
|
2,473
|
2,839
|
47
|
5,359
|
|
All In Sustaining Costs
|
$17,461
|
$2,407
|
$806
|
$20,673
|
$10,855
|
$3,578
|
$1,186
|
$15,619
|
|
Growth exploration and evaluation
|
|
|
|
3,007
|
|
|
|
1,653
|
|
Growth capital expenditures
|
|
|
|
332
|
|
|
|
153
|
|
All In Costs
|
|
|
|
$24,012
|
|
|
|
$17,425
|
|
|
Three Months Ended March 31, 2021
|
Three Months Ended March 31, 2020
|
|
|
Guanaceví
|
Bolañitos
|
El Compas
|
Total
|
Guanaceví
|
Bolañitos
|
El Compas
|
Total
|
|
Throughput tonnes
|
88,632
|
97,692
|
23,129
|
209,453
|
94,207
|
83,217
|
21,903
|
199,327
|
|
Payable silver ounces
|
915,462
|
98,988
|
22,260
|
1,036,710
|
742,998
|
81,006
|
25,787
|
849,791
|
|
Silver equivalent production (ounces)
|
1,137,657
|
600,787
|
198,376
|
1,936,820
|
939,274
|
399,885
|
196,580
|
1,535,739
|
|
Sustaining cost per ounce
|
$19.07
|
$24.31
|
$36.19
|
19.94
|
$14.61
|
$44.17
|
$45.99
|
$18.38
|
|
All In costs per ounce
|
|
|
|
23.16
|
|
|
|
$20.51
|
| Expressed in thousands US dollars |
Three Months Ended March 31, |
| |
2021 |
2020 |
| Capital expenditures sustaining |
$6,938 |
$5,359 |
| Growth capital expenditures |
332 |
153 |
| Porperty, plant and equipment expenditures |
$7,270 |
$5,512 |
|
Expressed in thousands US dollars
|
Three Months Ended March 31
|
|
|
2021
|
2020
|
|
Mine site expensed exploration
|
$883
|
$757
|
|
Growth exploration and evaluation
|
1,534
|
1,264
|
|
Total exploration and evaluation
|
1,473
|
389
|
|
Exploration expenditures
|
$3,890
|
$2,410
|
|
Exploration depreciation and depletion
|
79
|
90
|
|
Exploration share-based compensation
|
161
|
(118)
|
|
Exploration and evaluation expense
|
$4,130
|
$2,382
|
Silver co-product cash costs and gold co-product cash costs are measures used by the Company to manage and evaluate operating performance at each of the Company's operating mining units and consolidated group, but do not have a standardized meaning and are disclosed in addition to IFRS measures. The following tables provide a detailed reconciliation of these measures to the Company's cost of sales, as reported in its consolidated financial statements.
|
Expressed in thousands US dollars
|
Three Months Ended March 31, 2021
|
Three Months Ended March 31, 2020
|
|
|
Guanaceví
|
Bolañitos
|
El Compas
|
Total
|
Guanaceví
|
Bolañitos
|
El Compas
|
Total
|
|
Direct costs per financial statements
|
$8,060
|
$7,105
|
$3,563
|
$18,728
|
$8,435
|
$5,295
|
$3,070
|
$16,800
|
|
Smelting and refining costs included in net revenue
|
-
|
489
|
138
|
627
|
-
|
341
|
104
|
445
|
|
Royalties
|
2,213
|
68
|
179
|
2,460
|
678
|
37
|
142
|
857
|
|
Special mining duty (1)
|
257
|
151
|
38
|
446
|
87
|
-
|
-
|
87
|
|
Opening finished goods
|
(1,509)
|
(250)
|
(642)
|
(2,401)
|
(1,509)
|
(219)
|
(169)
|
(1,897)
|
|
Finished goods NRV adjustment
|
-
|
-
|
-
|
-
|
-
|
-
|
542
|
542
|
|
Closing finished goods
|
5,935
|
204
|
441
|
6,580
|
2,850
|
259
|
315
|
3,424
|
|
Direct production costs
|
14,956
|
7,767
|
3,717
|
26,440
|
10,541
|
5,713
|
4,004
|
20,258
|
|
|
|
|
|
|
|
|
|
|
|
|
Three Months Ended March 31, 2021
|
Three Months Ended March 31, 2020
|
|
|
Guanaceví
|
Bolañitos
|
El Compas
|
Total
|
Guanaceví
|
Bolañitos
|
El Compas
|
Total
|
|
Silver production (ounces)
|
918,217
|
106,227
|
23,656
|
1,048,100
|
745,114
|
86,125
|
26,420
|
857,659
|
|
Average realized silver price ($)
|
27.17
|
27.17
|
27.17
|
27.17
|
15.33
|
15.33
|
15.33
|
15.33
|
|
Silver value ($)
|
24,947,956
|
2,886,188
|
642,734
|
28,476,877
|
11,422,598
|
1,320,296
|
405,019
|
13,147,912
|
|
|
|
|
|
|
|
|
|
|
|
Gold production (ounces)
|
2,743
|
6,182
|
2,184
|
11,109
|
2,427
|
3,922
|
2,127
|
8,476
|
|
Average realized gold price ($)
|
1,703
|
1,703
|
1,703
|
1,703
|
1,633
|
1,633
|
1,633
|
1,633
|
|
Gold value ($)
|
4,671,329
|
10,527,946
|
3,719,352
|
18,918,627
|
3,963,291
|
6,404,626
|
3,473,391
|
13,841,308
|
|
|
|
|
|
|
|
|
|
|
|
Total metal value ($)
|
29,619,285
|
13,414,134
|
4,362,086
|
47,395,504
|
15,385,889
|
7,724,922
|
3,878,410
|
26,989,220
|
|
Pro-rated silver costs (%)
|
84%
|
22%
|
15%
|
60%
|
74%
|
17%
|
10%
|
49%
|
|
Pro-rated gold costs (%)
|
16%
|
78%
|
85%
|
40%
|
26%
|
83%
|
90%
|
51%
|
| |
|
|
|
|
|
|
|
|
|
Pro-rated silver costs ($)
|
12,597
|
1,671
|
548
|
15,886
|
7,826
|
976
|
418
|
9,869
|
|
Pro-rated gold costs ($)
|
2,359
|
6,096
|
3,169
|
10,554
|
2,715
|
4,737
|
3,586
|
10,389
|
| |
|
|
|
|
|
|
|
|
|
Silver co-product cash costs
|
$13.72
|
$15.73
|
$23.15
|
$15.16
|
$10 .50
|
$11.34
|
$15.83
|
$11.51
|
|
Gold co-product cash costs
|
$860
|
$986
|
$1,451
|
$950
|
$1,119
|
$1,208
|
$1,686
|
$1,226
|
(1) Special mining duty is an EBITDA royalty tax presented as a current income tax in accordance with IFRS.
QUARTERLY RESULTS AND TRENDS
The following table presents selected financial information for each of the most recent eight quarters:
|
Table in thousands of U.S. dollars except for share
|
2021
|
2020
|
2019
|
|
numbers and per share amounts
|
Q1
|
Q4
|
Q3
|
Q2
|
Q1
|
Q4
|
Q3
|
Q2
|
|
Gross Sales
|
$35,093
|
$61,238
|
$36,148
|
$20,529
|
$22,372
|
$34,610
|
$28,589
|
$29,382
|
|
Smelting and refining costs included in net revenue
|
627
|
491
|
562
|
328
|
445
|
1,145
|
947
|
1,089
|
|
Direct costs
|
18,728
|
26,115
|
18,682
|
11,962
|
17,342
|
27,653
|
21,329
|
26,215
|
|
Royalties
|
2,460
|
4,434
|
2,029
|
834
|
857
|
935
|
446
|
336
|
|
Mine operating cash flow before taxes
|
13,278
|
30,198
|
14,875
|
7,405
|
3,728
|
4,877
|
5,867
|
1,742
|
|
Share-based compensation
|
118
|
60
|
87
|
92
|
91
|
37
|
50
|
53
|
|
Amortization and depletion
|
7,496
|
8,919
|
8,497
|
4,197
|
6,523
|
8,055
|
7,531
|
7,794
|
|
Write down on inventory
|
-
|
405
|
-
|
-
|
-
|
576
|
-
|
-
|
|
Mine operating earnings (loss)
|
$5,664
|
$20,814
|
$6,291
|
$3,116
|
($2,886)
|
($3,791)
|
($1,714)
|
($6,105)
|
| |
|
|
|
|
|
|
|
|
|
Basic earnings (loss) per share
|
$0.08
|
$0.13
|
$0.00
|
($0.02)
|
($0.11)
|
($0.13)
|
($0.05)
|
($0.08)
|
|
Diluted earnings (loss) per share
|
$0.07
|
$0.13
|
$0.00
|
($0.02)
|
($0.11)
|
($0.13)
|
($0.05)
|
($0.08)
|
|
Weighted shares outstanding
|
159,670,842
|
157,536,658
|
156,265,280
|
147,862,393
|
141,810,208
|
140,054,885
|
137,739,857
|
132,158,891
|
| |
|
|
|
|
|
|
|
|
|
Net earnings (loss)
|
$12,249
|
$19,923
|
$451
|
($3,289)
|
($15,926)
|
($17,897)
|
($6,768)
|
($10,123)
|
|
Amortization and depletion
|
7,624
|
8,965
|
8,296
|
4,213
|
6,268
|
8,194
|
7,194
|
7,314
|
|
Finance costs
|
291
|
332
|
359
|
356
|
310
|
230
|
177
|
103
|
|
Current income tax
|
671
|
1,937
|
595
|
195
|
266
|
1,308
|
512
|
184
|
|
Deferred income tax
|
3,127
|
(7,112)
|
556
|
(514)
|
1,864
|
3,100
|
(567)
|
(823)
|
|
NRV cost adjustment
|
-
|
231
|
375
|
246
|
500
|
236
|
478
|
644
|
|
EBITDA
|
$23,962
|
$24,276
|
$10,632
|
$1,207
|
($6,718)
|
($4,829)
|
$1,026
|
($2,701)
|
*For Q4, 2020 and Q4, 2019 write downs on inventory at period end have been shown as a separate line item in the above reconciliation. For prior periods, it has been included as components of direct costs and amortization and depletion.
** The Company changed its presentation of concentrate treatment and refining costs of sales to presenting as a reduction in revenue effective Q1, 2020. The prior periods have been reclassified
The following table presents selected production information for each of the most recent eight quarters:
|
Highlights
|
2021
|
2020
|
2019
|
|
|
Q1
|
Q4
|
Q3
|
Q2
|
Q1
|
Q4
|
Q3
|
Q2
|
|
Processed tonnes
|
209,453
|
237,389
|
206,324
|
114,120
|
199,327
|
236,531
|
234,196
|
237,640
|
|
Guanaceví
|
88,632
|
106,425
|
83,816
|
62,231
|
94,207
|
92,323
|
78,517
|
75,591
|
|
Bolañitos
|
97,692
|
107,332
|
98,945
|
41,680
|
83,217
|
82,147
|
71,541
|
76,386
|
|
El Compas
|
23,129
|
23,632
|
23,563
|
10,209
|
21,903
|
22,855
|
21,885
|
21,242
|
|
El Cubo
|
-
|
-
|
-
|
-
|
-
|
39,206
|
62,253
|
64,421
|
|
Silver ounces
|
1,048,100
|
1,117,289
|
942,274
|
596,545
|
857,659
|
939,511
|
948,547
|
1,059,322
|
|
Guanaceví
|
918,217
|
991,697
|
806,917
|
527,347
|
745,114
|
673,559
|
533,923
|
536,966
|
|
Bolañitos
|
106,227
|
99,417
|
112,094
|
55,682
|
86,125
|
109,963
|
147,078
|
171,891
|
|
El Compas
|
23,656
|
26,175
|
23,263
|
13,516
|
26,420
|
33,518
|
43,634
|
24,007
|
|
El Cubo
|
-
|
-
|
-
|
-
|
-
|
122,471
|
223,912
|
326,458
|
|
Silver grade
|
179
|
169
|
162
|
188
|
155
|
140
|
144
|
157
|
|
Guanaceví
|
369
|
331
|
336
|
304
|
280
|
252
|
232
|
242
|
|
Bolañitos
|
38
|
34
|
42
|
47
|
40
|
51
|
77
|
78
|
|
El Compas
|
47
|
50
|
48
|
60
|
58
|
65
|
90
|
72
|
|
El Cubo
|
-
|
-
|
-
|
-
|
-
|
106
|
128
|
178
|
|
Silver recovery
|
86 .9
|
86.8
|
87.6
|
86.3
|
86.1
|
88.3
|
87.6
|
88.5
|
|
Guanaceví
|
87.3
|
87.6
|
89.1
|
86.7
|
87.9
|
90.0
|
91.2
|
91.3
|
|
Bolañitos
|
89 .0
|
84.7
|
83.9
|
88.4
|
80.5
|
81.6
|
83.0
|
89.7
|
|
El Compas
|
67.7
|
68.9
|
64.0
|
68.6
|
64.7
|
70.2
|
68.9
|
48.8
|
|
El Cubo
|
-
|
-
|
-
|
-
|
-
|
91.7
|
87.4
|
88.6
|
|
Gold ounces
|
11,109
|
12,586
|
10,260
|
5,817
|
8,476
|
9,578
|
9,716
|
9,558
|
|
Guanaceví
|
2,743
|
3,198
|
2,342
|
1,847
|
2,427
|
2,025
|
1,557
|
1,367
|
|
Bolañitos
|
6,182
|
6,754
|
5,779
|
2,508
|
3,922
|
4,088
|
3,226
|
3,035
|
|
El Compas
|
2,184
|
2,634
|
2,139
|
1,462
|
2,127
|
2,298
|
2,699
|
2,238
|
|
El Cubo
|
-
|
-
|
-
|
-
|
-
|
1,167
|
2,234
|
2,918
|
|
Gold grade
|
1.90
|
1.90
|
1.82
|
1.84
|
1.57
|
1.53
|
1.49
|
1.51
|
|
Guanaceví
|
1.05
|
1.01
|
0.95
|
1.05
|
0.87
|
0.75
|
0.67
|
0.62
|
|
Bolañitos
|
2.15
|
2.22
|
2.04
|
2.10
|
1.71
|
1.81
|
1.62
|
1.49
|
|
El Compas
|
4.12
|
4.41
|
3.98
|
5.55
|
4.02
|
4.33
|
4.56
|
4.35
|
|
El Cubo
|
-
|
-
|
-
|
-
|
-
|
1.16
|
1.29
|
1.63
|
|
Gold recovery
|
86.7
|
87.0
|
85.0
|
86.3
|
84.4
|
82.2
|
86.7
|
83.0
|
|
Guanaceví
|
91.7
|
92.5
|
91.5
|
87.9
|
92.1
|
91.0
|
92.1
|
90.7
|
|
Bolañitos
|
91.5
|
88.2
|
89.1
|
89.1
|
85.7
|
85.5
|
86.6
|
82.9
|
|
El Compas
|
71.3
|
78.6
|
70.9
|
80.3
|
75.1
|
72.2
|
84.1
|
75.3
|
|
El Cubo
|
-
|
-
|
-
|
-
|
-
|
79.8
|
86.5
|
86.4
|
|
Cash costs per oz (1)
|
$7.86
|
$6.83
|
$3.69
|
$2.78
|
$7.85
|
$13.63
|
$11.51
|
$13.67
|
|
Guanaceví
|
$11.25
|
$13.21
|
$9.64
|
$8.48
|
$9.01
|
$13.54
|
$12.83
|
$17.37
|
|
Bolañitos
|
($23.49)
|
($44.56)
|
($40.89)
|
($30.20)
|
($7.32)
|
$4.82
|
$8.13
|
$11.56
|
|
El Compas
|
$7.77
|
($50.04)
|
$0.44
|
($96 .83)
|
$22.10
|
$10.90
|
($25.37)
|
($1.52)
|
|
El Cubo
|
-
|
-
|
-
|
-
|
-
|
$22.67
|
$17.67
|
$9.63
|
|
AISC per oz (1)
|
$19.94
|
$18.52
|
$17.48
|
$14.91
|
$18.38
|
$23.20
|
$21.53
|
$20.90
|
|
Guanaceví
|
$19.07
|
$19.67
|
$17.76
|
$15.00
|
$14.61
|
$19.48
|
$20.99
|
$24.94
|
|
Bolañitos
|
$24.31
|
$16.98
|
$10.51
|
$29.79
|
$44.17
|
$38.38
|
$29.90
|
$22.64
|
|
El Compas
|
$36.19
|
($20.19)
|
$40.39
|
($48.25)
|
$45.98
|
$47.68
|
$3.46
|
$43.62
|
|
El Cubo
|
-
|
-
|
-
|
-
|
-
|
$24.41
|
$20.77
|
$11.47
|
|
Direct costs per tonne (1)
|
$126.23
|
$129.66
|
$112.37
|
$109.74
|
$101.63
|
$113.47
|
$106.76
|
$114.40
|
|
Guanaceví
|
$168.74
|
$179.34
|
$146.26
|
$126.13
|
$111.89
|
$131.56
|
$116.20
|
$148.84
|
|
Bolañitos
|
$79.50
|
$75.82
|
$67.82
|
$77.02
|
$68.65
|
$80.66
|
$81.03
|
$79.90
|
|
El Compas
|
$160.71
|
$150.52
|
$178.92
|
$143.50
|
$182.81
|
$160.01
|
$137.99
|
$138.03
|
|
El Cubo
|
-
|
-
|
-
|
-
|
-
|
$112.48
|
$113.44
|
$107.09
|
(1) Cash cost per oz, AISC per oz and Direct costs per tonne are not-IFRS measures.
Key Economic Trends
Precious Metal Price Trends
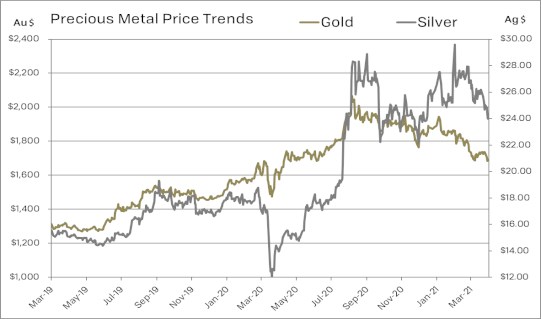
The prices of silver and gold are the largest single factor in determining profitability and cash flow from operations. The financial performance of the Company has been, and is expected to continue to be, closely linked to the prices of silver and gold.
During Q1 2021, the average price of silver was $26.26 per ounce, with silver trading between $24.00 and $29.59 per ounce based on the London Fix silver price. This compares to an average of $16.90 per ounce during Q1 2020, with a low of $12.01 and a high of $18.78 per ounce. During Q1 2021, the Company realized an average price of $27.17 per silver ounce compared with $15.33 for Q1 2020.
During Q1 2021, the average price of gold was $1,794 per ounce, with gold trading between $1,684 and $1,943 per ounce based on the London Fix PM gold price. This compares to an average of $1,583 per ounce during Q1 2020, with a low of $1,474 and a high of $1,684 per ounce. During Q1 2021, the Company realized an average price of $1,703 per ounce compared with $1,633 for Q1 2020.
During the year ended December 31, 2020, the average price of silver was $20.53 per ounce, with silver trading between $12.01 and $28.89 per ounce based on the London Fix silver price. This compares to an average of $16.20 per ounce for the year ended December 31, 2019, with a low of $14.37 and a high of $19.31 per ounce. For the year ended December 31, 2020, the Company realized an average price of $21.60 per silver ounce compared with $16.29 for the year ended December 31, 2019.
During the year ended December 31, 2020, the average price of gold was $1,771 per ounce, with gold trading between $1,474 and $2,067 per ounce based on the London Fix PM gold price. This compares to an average of $1,393 per ounce during the year ended December 31, 2019, with a low of $1,270 and a high of $1,546 per ounce. During the year ended December 31, 2020, the Company realized an average price of $1,846 per ounce compared with $1,422 for the year ended December 31, 2019.
Uncertainty surrounding tariff and trade discussions, the results of the US elections, signals of US economic slowdown and rising geopolitical risk renewed interest in precious metals in 2019. The impact of measures to combat the spread of COVID-19 on global economy resulted in significant volatility in the financial markets, including the gold and silver market in March 2020. Gold prices increased on an anticipated global economic recession and government financial stimulus announced to aid the economic recovery. During March 2020, silver prices capitulated on expectations of a global recession with the expectation of reduced industrial demand, then subsequently significantly rebounded as investment demand increased due to the monetary aspects of silver and rising demand as a "green" metal. The on-going risks and uncertainties from the COVID-19 pandemic has led to further government stimulus and ultimately further investment demand for gold and silver.
Currency Fluctuations
The Company's operations are located in Mexico and therefore a significant portion of operating costs and capital expenditures are denominated in Mexican pesos. The Company's corporate activities are based in Vancouver, Canada with the significant portion of these expenditures being denominated in Canadian dollars. Generally, as the U.S. dollar strengthens, these currencies weaken, and as the U.S. dollar weakens, these currencies strengthen.
During early Q1 2021, the Mexican peso was relatively flat. During Q1 2021, the average foreign exchange rate was $20.33 Mexican pesos per U.S. dollar, with the peso trading within a range of $19.61 to $21.42. This compares to an average of $19.99 during the corresponding three-month period of 2020, with a range of $18.53 to $24.96 Mexican pesos per U.S. dollar over the same period in 2020.
During the year ended December 31, 2020, the Mexican peso was relatively flat until a significant decrease in oil prices followed by the COVID-19 crisis in March 2020 when the Mexican Peso significantly depreciated against the U.S. dollar, as funds flowed to safe haven markets and assets. Subsequently, the Mexican peso gradually appreciated against the U.S. dollar back to levels slightly lower than pre-crisis levels as investment risk was re-established.
During 2020, the average foreign exchange rate was $21.48 Mexican pesos per U.S. dollar, with the peso trading within a range of $18.53 to $25.00. This compares to a relatively flat 2019, with an average of $19.24 during the corresponding period of 2019, with a range of $18.73 to $20.14 Mexican pesos per U.S. dollar. During 2019, the Mexican peso remained relatively stable relative to the U.S. dollar, although volatility occurred throughout the year.
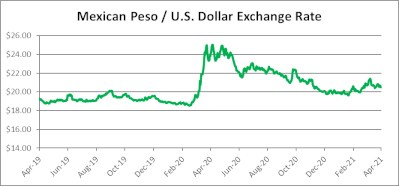
During Q1 2021, the Canadian dollar continued to appreciate compared to the U.S. dollar with the strengthening of oil price. During Q1 2021, the average foreign exchange rate was $1.266 Canadian dollars per U.S. dollar, with the Canadian dollar trading within a range of $1.243 to $1.283. This compares to an average of $1.342 during the corresponding three-month period of 2020, with a range of $1.297 to $1.453 Canadian dollars per U.S. dollar over the same period in 2020.
During the year ended December 31, 2020, the Canadian dollar was flat until a significant decrease in oil prices and then the COVID-19 crisis in March 2020 when the Canadian dollar significantly depreciated against the U.S. dollar as funds invested in safe haven markets and assets. Subsequently, the Canadian dollar gradually appreciated against the U.S. dollar back to levels slightly lower than pre-crisis levels as investment risk was re-established. During 2020, the average foreign exchange rate was $1.3409 Canadian dollars per U.S. dollar, with the Canadian dollar trading within a range of $1.272 to $1.453. This compares to an average of $1.327 during 2019, with a range of $1.302 to $1.364 Canadian dollars per U.S. dollar during 2019.
Cost Trends
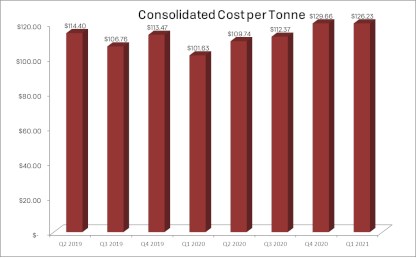
The Company's profitability is subject to industry wide cost pressures on development and operating costs with respect to labour, energy, consumables and capital expenditures. Underground mining is labour intensive and approximately 33% of the Company's production costs are directly tied to labour. In order to mitigate the impact of higher labour and consumable costs, the Company focuses on continuous improvement by promoting more efficient use of materials and supplies and by pursuing more advantageous pricing while increasing performance and without compromising operational integrity. Mining, processing and indirect costs improved on per tonne basis compared to prior year, however royalties paid for ore mined from the Porvenir Cuatro extension increased substantially, a higher proportion of third party ore was purchased and improved profitability resulted in special mining duties paid to the government.
ANNUAL OUTLOOK
The Company has implemented plans to minimize the risks of the COVID-19 virus, both to employees and to the business. The Mexican government declared mining as an essential business, however in Mexico positive COVID-19 cases continue at a significant rate and to date the infection rate has yet to flatten. A local outbreak, an impediment to supply or market logistics or change in government health orders remains a significant risk. The mines are operating under strict safety protocols with the expectations of operating near throughput capacity. At each site, the Company is following government health protocols and is closely monitoring the pandemic with local health authorities. The Company has posted health advisories to educate employees about the COVID-19 symptoms, best practices to avoid contracting and spreading the virus, and procedures to follow if symptoms are experienced.
As the COVID-19 global pandemic is dynamic, the ultimate duration and severity of the pandemic remains uncertain. The pandemic can have a material impact on the Company's 2021 production and cost estimates.
Production
In 2021, silver production is expected to range from 3.6 to 4.3 million oz and gold production is anticipated be in the 31,000 to 35,500 oz range. Silver equivalent production is forecasted to total 6.1-7.1 million oz using an 80:1 silver:gold ratio.
|
Mine
|
Ag (M oz)
|
Au (K oz)
|
Ag Eq (M oz)
|
Tonnes/Day (tpd)
|
|
Guanaceví
|
3.1-3.7
|
8.0-10.0
|
3.7-4.5
|
1,100-1,200
|
|
Bolañitos
|
0.4-0.5
|
21.0-23.0
|
2.1-2.3
|
1,100-1,200
|
|
El Compas
|
0.1-0.1
|
2.0-2.5
|
0.2-0.2
|
200-250
|
|
Total
|
3.6-4.3
|
31.0-35.5
|
6.1-7.1
|
2,400-2,650
|
At Guanaceví, production will range between 1000 tpd to 1200 tpd and average 1100 tpd from the Milache, SCS and P4E orebodies. A significant portion of production will be mined from the Porvenir Cuatro extension on the El Curso concessions. The El Curso concessions were leased from a third party with no upfront costs but with significant royalty payments on production. As a result, the cash cost per ounce will increase in 2021, although direct operating costs per tonne should be similar to 2020.
At Bolañitos, production will range between 1000 tpd to 1200 tpd and average 1,050 tpd from the Plateros-La Luz, Lucero-Karina and Bolañitos-San Miguel vein systems. Ore grades are expected to be similar to 2020 mined grades and the cash cost per oz and direct cost per tonne should be similar to 2020.
At El Compas, production is forecast to continue into Q2, 2021 from the El Compas mine. New resources discovered in the Calicanto and Misie veins on the Calicanto property are currently being evaluated for possible addition to the mine plan.
Sustaining Capital Investments
In 2021, Endeavour plans to invest $32.8 million on capital projects, mainly as sustaining capital at the three operating mines, including $2.0 million in growth capital to maintain the exploration concessions and cover corporate infrastructure. At current metal prices, the sustaining capital investments should be covered by operating cash flow.
At Guanaceví, $16.7 million will be invested on capital projects, the largest of which is the development of 6.8 kilometres (km) of mine access at the Milache, SCS and the P4E orebodies for an estimated $7.2 million. The additional $9.5 million will go to upgrade the mining fleet, support site infrastructure, and expand the tailings dam.
At Bolañitos, $14.1 million will be invested on capital projects, including $7.8 million for 5.3 km of mine development to access reserves and resources in the Plateros-La Luz, Lucero-Karina and Bolañitos-San Miguel vein systems. The additional $5.9 million will go to upgrade the mining fleet, support site infrastructure, raise the tailings dam and commence a new portal for the Belen resources.
At El Compas, management is evaluating new areas for future production on the Calicanto concessions and below the current working areas of the Orito vein.
|
Mine
|
Mine
|
Other
|
Sustaining
|
Growth
|
Total
|
|
Development
|
Capital
|
Capital
|
Capital
|
Capital
|
|
Guanaceví
|
$7.2 million
|
$9.5 million
|
$16.7 million
|
-
|
$16.7 million |
|
Bolañitos
|
$8.7 million
|
$5.4 million
|
$14.1 million
|
-
|
$14.1 million |
|
Corporate
|
-
|
-
|
-
|
$2.0 million
|
$ 2.0 million |
|
Total
|
$15.9 million
|
$14.9 million
|
$30.8 million
|
$2.0 million
|
$32.8 million |
Operating Costs
Cash costs, net of gold by-product credits, are expected to be $7.00-8.00 per oz of silver produced in 2021. Consolidated cash costs on a co-product basis are anticipated to be $13.00-$14.00 per oz silver and $1,000-$1,100 per oz gold.
All-in sustaining costs, net of gold by-product credits, in accordance with the World Gold Council standard, are estimated to be $19.00-$20.00 per oz of silver produced. When non-cash items such as stock-based compensation are excluded, AISC are forecast to be in the $18.00-$19.00 range.
Direct operating costs are estimated to be in the range of $105-$115 per tonne, including royalties and special mining duties, which are both expected to be significantly higher in 2021 compared to 2020.
Management has used a $22 per oz silver price, $1,760 per oz gold price, and 20:1 Mexican peso per US dollar exchange rate for its 2021 cost forecasts.
Development Investment and Expenditures
The Company plans to complete a Feasibility Study in Q3, 2021 at an estimated cost of $1.8 million. During the completion of the Feasibility Study, the Company is evaluating a number of opportunities to further enhance the value of the project, including exploration drilling to expand the known resources and to test multiple veins within the district. Additionally, the Company has defined an engineering, procurement and construction strategy and is strategizing commencement of various early work items. An engineering team is being assembled and a $7.3 million budget has been approved for sourcing equipment and machinery and early work items, including camp construction and known earthworks.
Exploration Expenditures
In 2021, the Company plans to spend $10.2 million drilling 50,000 metres of core on brownfields projects, greenfields exploration and development engineering across its portfolio of mines and properties. At the Guanaceví and Bolañitos operating mines, 11,500 metres of core drilling are planned at a cost of $2.0 million and $1.9 million. respectively to replace reserves and expand resources.
On the exploration and development projects, expenditures of $6.3 million are planned to fund 27,000 metres of core drilling at the Terronera project to test multiple regional targets, the Parral project to continue drilling the San Patricio and Veta Colorado vein systems and the Paloma project in Chile. The Company is currently permitting of the Cerro Marquez and Aida projects and will continue to map and sample to prioritize targets for drilling.
|
Project
|
2021 Activity
|
Drill Metres
|
Expenditures
|
|
Guanaceví
|
Drilling
|
11,500
|
$2.0 million
|
|
Bolañitos
|
Drilling
|
11,500
|
$1.9 million
|
|
Parral
|
Drilling/Economic Study
|
8,000
|
$2.0 million
|
|
Chile - Paloma
|
Drilling
|
3,000
|
$1.2 million
|
|
Chile - Other
|
Evaluation
|
-
|
$0.6 million
|
|
Terronera
|
PFS/Development
|
16,000
|
$ 2.5 million
|
|
Total
|
|
50,000
|
$10.2 million
|
LIQUIDITY AND CAPITAL RESOURCES
Cash and cash equivalents increased from $61.1 million at December 31, 2020 to $86.0 million at March 31, 2021. The Company had working capital of $113.1 million at March 31, 2021 (December 31, 2020 - $70.4 million). The $42.7 million increase in working capital is primarily due to net ATM equity raise of $29.5 million, $3.8 million from proceeds of exercised options, classifying the El Cubo mine assets as current due to the April 9, 2021 sale and cash flow generated by the operations offset by $7.3 million investment in mineral property, plant and equipment and $1.0 million loan repayments.
Operating activities used $3.9 million during Q1, 2021 compared to using $2.3 million in Q1, 2020. The significant non-cash adjustments to the net earnings of $12.2 million were amortization and depletion of $7.6 million (Q1, 2020 - $6.3 million), share-based compensation of $1.2 million (Q1, 2020 - $0.7 million), a deferred income tax expense of $3.1 million (Q1, 2020 - $1.9 million), finance costs of $0.3 million (Q1, 2020 - $0.3 million), a reversal of non-current assets impairment of $16.8 million, a gain on other investments of $2.5 million and an increase in non-cash working capital of $9.1 million (Q1, 2020 - decrease of $2.6 million). The change in non-cash working capital was primarily due to an increase in stockpiled ore, an increase in finished goods, a decrease in accounts payable, increase taxes receivable and increase prepaid expenses offset by a reduction of trade receivables. In Q1, 2020, the significant non-cash adjustments included $1.0 million write down of inventory to net realizable value and $0.7 million unrealized foreign exchange loss.
The Company's Mexican subsidiaries pay IVA, Impuesto al Valor Agregado ("IVA"), on the purchase and sale of goods and services. The net amount paid is recoverable but is subject to review and assessment by the tax authorities. The Company regularly files the required IVA returns and all supporting documentation with the tax authorities, however, the Company has been advised that certain IVA amounts receivable from the tax authorities are being withheld pending completion of the authorities' audit of certain of the Company's third-party suppliers. Under Mexican law the Company has legal rights to those IVA refunds and the results of the third-party audits should have no impact on refunds. A smaller portion of IVA refund requests are from time to time improperly denied based on the alleged lack of compliance of certain formal requirements and information returns by the Company's third-party suppliers. The Company takes necessary legal action on the delayed refunds as well as any improperly denied refunds.
The Company is in regular contact with the tax authorities in respect of its IVA filings and believes that the full amount of its IVA receivables will ultimately be received; however, the timing of recovery of these amounts and the nature and extent of any adjustments to the Company's IVA receivables remains uncertain
Investing activities during the period used net $3.2 million compared to $5.5 million in Q1, 2020. The capital investments in Q1, 2021 were primarily for sustaining capital at existing operations, similar for the comparable period in 2020. The Company received a net $3.6 million on the sale and purchase of marketable securities during Q1, 2021 and received a $0.5 million initial payment related to the sale of the El Cubo mine.
Capital additions totaled $7.3 million in property, plant and equipment for the period ended March 31, 2021.
At Guanaceví, the Company invested $4.2 million, with $2.2 million spent on 1.8 kilometres of mine development and acquired $1.2 million of mobile equipment. The Company continued to invest on upgrades for the plant and surrounding infrastructure, including $0.7 million on plant upgrades, mine site improvements and the tailings facility, $0.1 million was spent on office, building infrastructure and on light vehicles.
At Bolañitos, the Company invested $2.7 million, with $2.4 million spent on 2.4 kilometres of mine. The Company continued to invest on upgrades for mine equipment, the plant and surrounding infrastructure, totaling $0.3 million as of March 31, 2021.
Exploration incurred $0.4 million in holding costs and acquisition of concessions.
Financing activities for Q1,2021, increased cash by $32.1 million, compared to increasing cash by $0.4 million in the same period in 2020. During the three months ended March 31, 2021, the Company received gross proceeds through an at-the-market financing of $30.1 million, paid $0.6 million in share issue costs, received $3.8 million on the exercise of employee options and paid $1.2 million in interest and principal repayments on loans and leases. By comparison, during the same period in 2020, the Company raised gross proceeds of $1.5 million, paid $0.1 million in share issue costs and paid $1.0 million in interest and principal repayments on loans and lease.
In April 2018, the Company filed a short form base shelf prospectus (the "Base Shelf") to qualify for the distribution of up to CAD$150 million of common shares, warrants or units of the Company comprising any combination of common shares and warrants ("Securities"). The distribution of Securities could be effected from time to time in one or more transactions at a fixed price or prices, which could be changed with market prices prevailing at the time of sale, or at prices related to such prevailing market prices to be negotiated with purchasers and as set forth in an accompanying prospectus supplement, including transactions that are deemed to be at the market distributions. The Base Shelf also provided the Company with the ability to conduct an "At-The-Market" offering through an "At-The-Market" facility ("2018 ATM") equity distribution agreement.
On June 13, 2018, the Company entered into an ATM equity facility with BMO Capital Markets (the lead agent), CIBC Capital Markets, H.C. Wainwright & Co., HSBC and TD Securities (together, the "Agents"). Under the terms of this ATM facility, the Company could, from time to time, sell common stock having an aggregate offering value of up to $35.7 million on the New York Stock Exchange. The Company determined, at its sole discretion, the timing and number of shares to be sold under the ATM facility. From January 1st to April 21st 2020, the Company issued 2,164,119 common shares under the ATM facility at an average price of $1.56 per share for gross proceeds of $3.4 million, less commissions of $76 thousand. The ATM program was completed in April 2020.
In April 2020, the Company filed a short form base shelf prospectus to qualify the distribution of up to CAD$150 million of various securities of the Company, including common shares. The distribution of such securities of the Company may be effected from time to time in one or more transactions at a fixed price or prices, which may vary with market prices prevailing at the time of sale, or at prices related to such prevailing market prices to be negotiated with purchasers and as set forth in an accompanying prospectus supplement, including transactions that are deemed to be at the market distributions. The Base Shelf also provides the Company with the ability to conduct an "At-The-Market" offering through an "At-The-Market" facility ("2020 ATM") equity distribution agreement.
On May 14, 2020, the Company entered into an ATM equity facility (the "May 2020 ATM Facility") with a syndicate of agents. Under the terms of the 2020 ATM Facility, the Company could, from time to time, sell common shares having an aggregate offering value of up to $23 million on the New York Stock Exchange. The Company determined, at its sole discretion, the timing and number of shares to be sold under the May 2020 ATM Facility.
From May 14, 2020 to August 17, 2020, the Company issued 11,640,411 common shares under the 2020 ATM Facility at an average price of $1.98 per share for gross proceeds of $23.0 million less commission of $0.6 million and deferred financing costs of $0.3 million which has been presented net of share capital. The ATM program was completed in August 2020.
In total, during 2020, the Company issued 13,804,530 common shares under the combined ATM facilities at an average price of $1.91 per share for gross proceeds of $26.4 million, less commission and financing fees of $1.2 million which has been presented net of share capital.
The purpose of the 2018 and May 2020 ATM Facilities net proceeds were to advance the exploration and development of the Terronera Project and to add to the Company's working capital.
On October 1, 2020, the Company entered into an ATM equity facility (the "October 2020 ATM Facility") with a syndicate of agents. Under the terms of the October 2020 ATM Facility, the Company may, from time to time, sell common shares having an aggregate offering value of up to $60 million on the New York Stock Exchange. The Company determines, at its sole discretion, the timing and number of shares to be sold under the October 2020 ATM Facility during the 20 month sales agreement term.
During the three months ended March 31, 2021, the Company issued 4,955,243 common shares under the October 2020 ATM Facility at an average price of $6.07 per share for gross proceeds of $30.1 million, less commission of $0.6 million and recognized $0.2 million of transaction costs related to the October 2020 ATM Facility.
For the October 2020 ATM Facility, completed in August 2020, the net proceeds were used as follows:
|
Use of proceeds (thousands)
|
|
|
Net proceeds received
|
$29,498
|
|
Advancement of Terronera Project
|
(2,881)
|
|
Advancement of Parral Project
|
(220)
|
|
Allocated to working capital
|
$26,397
|
Subsequent to March 31, 2021 an additional 3,283,204 common shares were issued under the ATM facility at an average price of $5.45 per share for gross proceeds of $17.9 million, less commission of $0.4 million.
Management of the Company believes that operating cash flow and existing working capital will be sufficient to cover 2021 capital requirements and commitments. The Company is assessing financing alternatives, including equity or debt or a combination of both to fund future growth, including the development of the Terronera project.
As at March 31, 2021, the Company's issued share capital was $554.5 million (December 31, 2020 - $517.7 million), representing 164,706,112 common shares (December 31, 2020 - 157,924,708), and the Company had options outstanding to purchase 4,271,700 common shares (December 31, 2020 - 5,978,300) with a weighted average exercise price of CAD$3.69 (December 31, 2020 - CAD$3.29).
Contingencies
Minera Santa Cruz y Garibaldi SA de CV ("MSCG"), a subsidiary of the Company, received a MXN 238 million assessment on October 12, 2010 by Mexican fiscal authorities for failure to provide the appropriate support for certain expense deductions taken in MSCG's 2006 tax return, failure to provide appropriate support for loans made to MSCG from affiliated companies, and deemed an unrecorded distribution of dividends to shareholders, among other individually immaterial items. MSCG immediately initiated a Nullity action and filed an administrative attachment to dispute the assessment.
In June 2015, the Superior Court ruled in favour of MSCG on a number of the matters under appeal; however, the Superior Court ruled against MSCG for failure to provide appropriate support for certain deductions taken in MSCG's 2006 tax return. In June 2016, the Company received a MXN 122.9 million ($6.0 million) tax assessment based on the June 2015 ruling. The 2016 tax assessment comprised of MXN 41.8 million in taxes owed ($2.0 million), MXN 17.7 million ($0.9 million) in inflationary charges, MXN 40.4 million ($2.0 million) in interest and MXN 23.0 million ($1.1 million) in penalties. The 2016 tax assessment was issued for failure to provide the appropriate support for certain expense deductions taken in MSCG's 2006 tax return, failure to provide appropriate support for loans made to MSCG from affiliated companies. If MSCG agrees to pay the tax assessment, or a lesser settled amount, it is eligible to apply for forgiveness of 100% of the penalties and 50% of the interest.
The Company filed an appeal against the June 2016 tax assessment on the basis that certain items rejected by the courts were included in the new tax assessment and a number of deficiencies exist within the assessment. Since issuance of the assessment interest charges of MXN 9.1 million ($0.5 million) and inflationary charges of MXN 13.7 million ($0.7 million) has accumulated.
Included in the Company's consolidated financial statements, are net assets of $595,000, including $42,000 in cash, held by MSCG. Following the Tax Court's rulings, MSCG has been in discussions with the tax authorities with regards to the shortfall of assets within MSCG to settle its estimated tax liability. An alternative settlement option would be to transfer the shares and assets of MSCG to the tax authorities. The Company recognized an allowance for transferring the shares and assets of MSCG amounting to $595,000 in a prior year. The Company is currently assessing MSCG's settlement options based on ongoing court proceedings and discussion with the tax authorities. The Company continues to assess that it is probable its appeal should prevail, and the maximum estimated exposure is the amount of the above allowance.
Compania Minera Del Cubo SA de CV ("Cubo"), a subsidiary of the Company, received an MXN 58.5 million (US $2.9 million) assessment in 2019 by Mexican fiscal authorities for failure to provide the appropriate support for depreciation deductions taken in the Cubo 2016 tax return and denied deductions of certain suppliers. The tax assessment consists of MXN 24.1 million ($1.2 million) for taxes, MXN 21.0 million ($1.1 million) for penalties, 10.4 million ($0.5 million) for interest and MXN 3.0 million ($0.1 million) for inflation. At the time of the tax assessment the Cubo entity had and continues to have sufficient loss carry forwards which would be applied against the assessed difference of taxable income. The Mexican tax authorities did not consider these losses in the assessment.
Due to the denial of certain suppliers for income tax purposes in the Cubo assessment, the invoices from these suppliers have been assessed as ineligible for refunds of IVA (value added taxes) paid on the invoices. The assessment includes MXN 14.7 million ($0.7 million) for re-payment of IVA refunded on these supplier payments. In the Company's judgement the suppliers and invoices meet the necessary requirements to be deductible for income tax purposes and the recovery of IVA.
The Company filed an administrative appeal related to the 2016 Cubo tax assessment. The Company had previously provided a lien on certain El Cubo mining concessions during the appeal process. As a condition of the sale of the El Cubo mine and related assets, the Company elected to pay the assessed amount of $3.5 million during the three months ended March 31, 2021. During the appeal process the amount paid has been classified as a non-current income tax recoverable. Since issuance of the assessment interest charges of MXN 9.9 million ($500) and inflationary charges of MXN 1.6 million ($100) had accumulated. The Company continues to assess that it is probable that its appeal will prevail, and no provision is recognized in respect of the Cubo tax assessment.
The Company is required to use judgement to determine certain tax treatments in calculating income tax expense and IVA recoverable. A number of these judgements are subject to various uncertainties. From time to time, Mexican authorities may improperly apply, re-interpret legislation or disregard precedents and it is possible that of these uncertainties may be resolved unfavorably for the Company.
Capital Requirements
As of March 31, 2021, the Company held $86.0 million in cash and $113.1 million in working capital. The duration and severity of the global COVID-19 pandemic could have a material impact on the Company's liquidity. The Mexican government declared mining as an essential business, however in Mexico positive COVID-19 cases continue at a significant rate and to date, the infection rate has not declined. A local outbreak, an impediment to supply or market logistics or change in government health orders remains a significant risk. The mines are operating under strict safety protocols with the expectations of operating near throughput capacity.
The Company may be required to raise additional funds through future debt or equity financings in order to carry out its business plans. The Company will continue to monitor capital markets, economic conditions, the COVID-19 global pandemic and assess its short-term and long-term capital needs.
See Annual Outlook on page 23 for discussion on planned capital and exploration expenditures.
Contractual Obligations
The Company had the following undiscounted contractual obligations at March 31, 2021:
| Payments due by period (in thousands of dollars) |
|
|
|
|
|
|
|
|
|
|
|
|
|
|
|
| Contractual Obligations |
|
Total |
|
|
Less than 1
year |
|
|
1 - 3 years |
|
|
3 - 5 years |
|
|
More than
5 years |
|
| Capital asset purchases |
$ |
3,712 |
|
$ |
3,712 |
|
$ |
- |
|
$ |
- |
|
$ |
- |
|
| Loans payable |
|
9,590 |
|
|
3,896 |
|
|
5,547 |
|
|
147 |
|
|
- |
|
| Lease liabilities |
|
1,256 |
|
|
236 |
|
|
314 |
|
|
321 |
|
|
385 |
|
| Other contracts |
|
865 |
|
|
162 |
|
|
222 |
|
|
222 |
|
|
259 |
|
| Other Long-Term Liabilities |
|
4,896 |
|
|
- |
|
|
2,048 |
|
|
2,457 |
|
|
391 |
|
| Total |
$ |
20,319 |
|
$ |
8,006 |
|
$ |
8,131 |
|
$ |
3,147 |
|
$ |
1,035 |
|
Transactions with Related Parties
The Company shares common administrative services and office space with Aztec Metals Corp., which is considered a related party company by virtue of Bradford Cooke, the Company's Chief Executive Officer, being a common director. From time to time, the Company incurs third-party costs on behalf of related parties, which are charged on a full cost recovery basis. The charges for these costs totaled $1,000 for the three months ended March 31, 2021 respectively (March 31, 2020 - $1,000). The Company had a $1,000 net receivable related to administration costs outstanding as at March 31, 2021 (December 31, 2020 - $2,000).
The Company was charged $141,000 for legal services for the three months ended March 31, 2021 by a firm in which the Company's corporate secretary is a partner (March 31, 2020 - $38,000). The Company has $73,000 payable to the legal firm as at March 31, 2021 (December 31, 2020 - $26,000).
Financial Instruments and fair value measurements
As at March 31, 2021 and December 31, 2020, the carrying and fair values of Endeavour's financial instruments by category were as follows:
| Expressed in thousands US dollars |
|
Fair value
through profit
or loss |
|
|
Amortized
cost |
|
|
Carrying
value |
|
|
Estimated
Fair value |
|
| Financial assets: |
|
|
|
|
|
|
|
|
|
|
|
|
| Cash and cash equivalents |
$ |
- |
|
$ |
85,989 |
|
$ |
85,989 |
|
$ |
85,989 |
|
| Other investments |
|
3,712 |
|
|
- |
|
|
3,712 |
|
|
3,712 |
|
| Trade receivables |
|
4,800 |
|
|
- |
|
|
4,800 |
|
|
4,800 |
|
| Other receivables |
|
- |
|
|
12,159 |
|
|
12,159 |
|
|
12,159 |
|
| Total financial assets |
$ |
8,512 |
|
$ |
98,148 |
|
$ |
106,660 |
|
$ |
106,660 |
|
| |
|
|
|
|
|
|
|
|
|
|
|
|
| Financial liabilities: |
|
|
|
|
|
|
|
|
|
|
|
|
| Accounts payable and accrued liabilities |
$ |
6,662 |
|
$ |
19,205 |
|
$ |
25,867 |
|
$ |
25,867 |
|
| Loans payable |
|
- |
|
|
8,703 |
|
|
8,703 |
|
|
8,703 |
|
| Total financial liabilities |
$ |
6,662 |
|
$ |
27,908 |
|
$ |
34,570 |
|
$ |
34,570 |
|
Fair value measurements
Fair value hierarchy:
Fair value is the price that would be received to sell an asset or paid to transfer a liability in an orderly transaction between market participants at the measurement date. The fair value hierarchy establishes three levels to classify the inputs to valuation techniques used to measure fair value. Level 1 inputs are quoted prices (unadjusted) in active markets for identical assets or liabilities. Level 2 inputs are quoted prices in markets that are not active, quoted prices for similar assets or liabilities in active markets, inputs other than quoted prices that are observable for the asset or liability (for example, interest rate and yield curves observable at commonly quoted intervals, forward pricing curves used to value currency and commodity contracts and volatility measurements used to value option contracts), or inputs that are derived principally from or corroborated by observable market data or other means. Level 3 inputs are unobservable (supported by no or little market activity). The fair value hierarchy gives the highest priority to Level 1 inputs and the lowest priority to Level 3 inputs.
Assets and liabilities as at March 31, 2021 that measured at fair value on a recurring basis include:
| As at March 31, 2021 |
|
|
|
|
|
|
|
|
|
|
|
|
| Expressed in thousands US dollars |
|
Total |
|
|
Level 1 |
|
|
Level 2 |
|
|
Level 3 |
|
| Assets: |
|
|
|
|
|
|
|
|
|
|
|
|
| Other investments |
$ |
3,712 |
|
$ |
3,712 |
|
$ |
- |
|
$ |
- |
|
| Trade receivables |
|
4,800 |
|
|
- |
|
|
4,800 |
|
|
- |
|
| Total financial assets |
$ |
8,512 |
|
$ |
3,712 |
|
$ |
4,800 |
|
$ |
- |
|
| |
|
|
|
|
|
|
|
|
|
|
|
|
| Liabilities: |
|
|
|
|
|
|
|
|
|
|
|
|
| Deferred share units |
|
6,662 |
|
$ |
6,662 |
|
$ |
- |
|
$ |
- |
|
| Total financial liabilities |
$ |
6,662 |
|
$ |
6,662 |
|
$ |
- |
|
$ |
- |
|
Other investments
The Company holds marketable securities classified as Level 1 and Level 2 in the fair value hierarchy. The fair values of Level 1 investments are determined based on a market approach reflecting the closing price of each particular security at the reporting date. The closing price is a quoted market price obtained from the stock exchange that is the principal active market for the particular security, being the market with the greatest volume and level of activity for the assets. For Level 2 investments, where there is not yet an active market for the securities as a listing on an exchange is pending, the fair value is determined based on the most recent observable transaction for those securities. Changes in fair value on available for sale marketable securities are recognized in earnings or loss.
Trade receivables
The trade receivables consist of receivables from provisional silver and gold sales from the Bolañitos, El Cubo and El Compas mines. The fair value of receivables arising from concentrate sales contracts that contain provisional pricing mechanisms is determined using the appropriate quoted closing price on the measurement date from the exchange that is the principal active market for the particular metal. As such, these receivables, which meet the definition of an embedded derivative, are classified within Level 2 of the fair value hierarchy.
Deferred share units
The Company has a Deferred Share Unit ("DSU") plan whereby deferred share units may be granted to independent directors of the Company in lieu of compensation in cash or stock options. The DSUs vest immediately and are redeemable for cash based on the market value of the units at the time of a director's retirement. The DSUs are classified as Level 1 in the fair value hierarchy. The liability is determined based on a market approach reflecting the closing price of the Company's common shares at the reporting date. Changes in fair value are recognized in general and administrative salaries, wages and benefits.
Share appreciation rights
As part of the Company's bonus program, the Company grants share appreciation rights ("SARs") to its employees in Mexico and Chile. The SARs are subject to vesting conditions and, when exercised, constitute a cash bonus based on the value of the appreciation of the Company's common shares between the SARS grant date and the exercise date.
The SARs are classified as Level 2 in the fair value hierarchy. The liability is valued using a Black-Scholes option pricing model. Changes in fair value are recognized in salaries, wages and benefits.
Financial Instrument Risk Exposure and Risk Management
The Company is exposed in varying degrees to a variety of financial instrument related risks. The Board approves and monitors the risk management process. The types of risk exposure and the way in which such exposure is managed is provided as follows:
Credit Risk
The Company is exposed to credit risk on its bank accounts and accounts receivable. Credit risk exposure on bank accounts is limited through maintaining the Company's balances with high-credit quality financial institutions, maintaining investment policies, assessing institutional exposure and continual discussion with external advisors. Value added tax receivables are generated on the purchase of supplies and services to produce silver, which are refundable from the Mexican government. Trade receivables are generated on the sale of concentrate inventory to reputable metal traders.
Liquidity Risk
Liquidity risk is the risk that the Company will not be able to meet its financial obligations as they come due. We manage our liquidity risk by continually monitoring forecasted and actual cash flows. We have in place a planning and budgeting process to help determine the funds required to support our normal operating requirement and development plans. We aim to maintain sufficient liquidity to meet our short term business requirements, taking into account our anticipated cash flows from operations, our holdings of cash and cash equivalents, and our committed and anticipated liabilities.
The Company's Mexican subsidiaries pay value added tax, IVA, on the purchase and sale of goods and services. The net amount paid is recoverable but is subject to review and assessment by the tax authorities. The Company regularly files the required IVA returns and all supporting documentation with the tax authorities, however, the Company has been advised that certain IVA amounts receivable from the tax authorities are being withheld pending completion of the authorities' audit of certain of the Company's third-party suppliers. Under Mexican law the Company has legal rights to those IVA refunds and the results of the third-party audits should have no impact on refunds. A smaller portion of IVA refund requests are from time to time improperly denied based on the alleged lack of compliance of certain formal requirements and information returns by the Company's third-party suppliers. The Company takes necessary legal action on the delayed refunds as well as any improperly denied refunds.
The Company is in regular contact with the tax authorities in respect of its IVA filings and believes that the full amount of its IVA receivables will ultimately be received; however, the timing of recovery of these amounts and the nature and extent of any adjustments to the Company's IVA receivables remains uncertain.
Market Risk
The significant market risk exposures to which the Company is exposed are foreign currency risk, interest rate risk, and commodity price risk.
Foreign Currency Risk - The Company's operations in Mexico and Canada make it subject to foreign currency fluctuations. Certain of the Company's operating expenses are incurred in Mexican pesos and Canadian dollars; therefore, the fluctuation of the U.S. dollar in relation to these currencies will consequently have an impact upon the profitability of the Company and may also affect the value of the Company's assets and the amount of shareholders' equity. The Company has not entered into any agreements or purchased any instruments to hedge possible currency risks.
Interest Rate Risk - In respect of financial assets, the Company's policy is to invest cash at floating rates of interest and cash reserves are to be maintained in cash equivalents in order to maintain liquidity. Fluctuations in interest rates impact the value of cash equivalents. As at December 31, 2020 the Company has $2.0 million in equipment loans with interest rates that are linked to Libor and with other variables unchanged, a 1% increase in the Libor rate would result in an additional interest expense of $0.1 million.
Commodity Price Risk - Gold and silver prices have historically fluctuated significantly and are affected by numerous factors outside of the Company's control, including, but not limited to, industrial and retail demand, central bank lending, forward sales by producers and speculators, levels of worldwide production, short-term changes in supply and demand because of speculative hedging activities and certain other factors. The Company has not engaged in any hedging activities, other than short-term metal derivative transactions less than 90 days, to reduce its exposure to commodity price risk. At March 31, 2021, there are 85,789 oz of silver and 5,554 oz of gold, which do not have a final settlement price and the estimated revenues have been recognized at current market prices. As at March 31, 2021, with other variables unchanged, a 10% decrease in the market value of silver and gold would result in a reduction of revenue of $1.2 million.
Outstanding Share Data
As of May 6, 2021, the Company had the following securities issued and outstanding:
- 167,990,316 common shares
- 4,270,700 common shares issuable under stock options with a weighted average exercise price of CAD$3.69 per share expiring between May 26, 2021 and March 5, 2026.
The Company considers the items included in the consolidated statement of shareholders' equity as capital. The Company's objective when managing capital is to safeguard its ability to continue as a going concern so that it can continue to provide returns for shareholders and benefits for other stakeholders. The Company manages the capital structure and makes adjustments to it in light of changes in economic conditions and the risk characteristics of the underlying assets. In order to maintain or adjust the capital structure, the Company may issue new shares through private placements, prospectus offerings, convertible debentures, asset acquisitions or return capital to shareholders. The Company is not subject to externally imposed capital requirements.
CHANGES IN ACCOUNTING POLICIES AND CRITICAL ACCOUNTING ESTIMATES
Accounting standards adopted during the period:
The accounting policies applied in the Company's condensed consolidated interim financial statements for the three months ended March 30, 2021 are the same as those applied in the Company's annual audited consolidated financial statements as at and for the year ended December 31, 2020, except for the following:
Assets held for sale
Non-current assets, or disposal groups comprising assets and liabilities, are classified as held-for-sale if it is highly probable that they will be recovered primarily through sale rather than through continuing use. For the sale to be highly probable, management must be committed to , and have a plan to sell the assets, the assets must be available for immediate sale in their present condition and the sale must be expected to qualify for recognition as a completed sale within one year from the date of classification.
Such assets, or disposal groups, are measured at the lower or their original carrying amount and fair value less costs to sell. Impairment losses or impairment reversals on initial classification as held-for-sale and subsequent gains and losses on remeasurement are recognized in earnings or loss. Once classified as held-for-sale, intangible assets and property, plant and equipment are no longer amortized or depreciated.
The following amendment to accounting standards has been issued but not yet adopted in the financial statements:
On May 14, 2020, the IASB published a narrow scope amendment to IAS 16 Property, Plant and Equipment - Proceeds before Intended Use. The amendment prohibits deducting from the cost of property, plant and equipment amounts received from selling items produced while preparing the asset for its intended use. Instead, amounts received will be recognized as sales proceeds and the related costs in profit or loss. The effective date is for annual periods beginning on or after January 1, 2022. The Company is assessing the effect of the narrow scope amendment on its consolidated financial statements.
Critical Accounting Estimates
The preparation of financial statements requires the Company to make estimates that affect the reported amounts of assets and liabilities and disclosure of contingent assets and liabilities at the date of the financial statements and the reported amounts of revenues and expenses during the reporting period. Significant areas requiring the use of management judgment relate to the determination of mineralized reserves, plant and equipment lives, estimating the fair values of financial instruments and derivatives, impairment and impairment reversals of non-current assets, reclamation and rehabilitation provisions, recognition of deferred tax assets, and assumptions used in determining the fair value of share-based compensation.
See "Critical Accounting Estimates" in the Company's annual MD&A for the year ended December 31, 2020 for a detailed discussion of the areas in which critical accounting estimates are made.
CONTROLS AND PROCEDURES
Changes in Internal Control over Financial Reporting
Management, including the CEO and CFO, have evaluated the Company's internal controls over financial reporting to determine whether any changes occurred during the period that have materially affected, or are reasonably likely to materially affect, the Company's internal controls over financial reporting.
During the three months ended March 31, 2021 there have been no significant changes in internal control over financial reporting that have materially affected, or are reasonably likely to materially affect, the Company's internal control over financial reporting.