|
|
|
|
Quarterly Report | August 31, 2019 | |
| |
|
|
2019 3rd Quarter Report | |
|
| |
| Tortoise |
| 2019 3rd Quarter Report to Stockholders |
This combined report provides you with a comprehensive review of our funds that span essential assets.
| Table of contents | ||||
| Letter to Stockholders | 2 | TPZ: Fund Focus | 17 | |
| TYG: Fund Focus | 5 | TEAF: Fund Focus | 20 | |
| NTG: Fund Focus | 8 | Financial Statements | 24 | |
| TTP: Fund Focus | 11 | Notes to Financial Statements | 62 | |
| NDP: Fund Focus | 14 | Additional Information | 80 | |
TTP and TPZ distribution policies
Tortoise Pipeline & Energy Fund, Inc. (“TTP”) and Tortoise Power and Energy Infrastructure Fund, Inc. (“TPZ”) are relying on exemptive relief permitting them to make long-term capital gain distributions throughout the year. Each of TTP and TPZ, with approval of its Board of Directors (the “Board”), has adopted a distribution policy (the “Policy”) with the purpose of distributing over the course of each year, through periodic distributions as nearly equal as practicable and any required special distributions, an amount closely approximating the total taxable income of TTP and TPZ during such year and, if so determined by the Board, all or a portion of the return of capital paid by portfolio companies to TTP and TPZ during such year. In accordance with its Policy, TTP distributes a fixed amount per common share, currently $0.285, each quarter to its common shareholders. Prior to August 2019, the quarterly distribution rate was $0.4075. TPZ distributes a fixed amount per common share, currently $0.125, each month to its common shareholders. These amounts are subject to change from time to time at the discretion of the Board. Although the level of distributions is independent of TTP’s and TPZ’s performance, TTP and TPZ expect such distributions to correlate with its performance over time. Each quarterly and monthly distribution to shareholders is expected to be at the fixed amount established by the Board, except for extraordinary distributions in light of TTP’s and TPZ’s performance for the entire calendar year and to enable TTP and TPZ to comply with the distribution requirements imposed by the Internal Revenue Code. The Board may amend, suspend or terminate the Policy without prior notice to shareholders if it deems such action to be in the best interests of TTP, TPZ and their respective shareholders. For example, the Board might take such action if the Policy had the effect of shrinking TTP’s or TPZ’s assets to a level that was determined to be detrimental to TTP or TPZ shareholders. The suspension or termination of the Policy could have the effect of creating a trading discount (if TTP’s or TPZ’s stock is trading at or above net asset value), widening an existing trading discount, or decreasing an existing premium. You should not draw any conclusions about TTP’s or TPZ’s investment performance from the amount of the distribution or from the terms of TTP’s or TPZ’s distribution policy. Each of TTP and TPZ estimates that it has distributed more than its income and net realized capital gains; therefore, a portion of your distribution may be a return of capital. A return of capital may occur, for example, when some or all of the money that you invested in TTP or TPZ is paid back to you. A return of capital distribution does not necessarily reflect TTP’s or TPZ’s investment performance and should not be confused with “yield” or “income.” The amounts and sources of distributions reported are only estimates and are not being provided for tax reporting purposes. The actual amounts and sources of the amounts for tax reporting purposes will depend upon TTP’s and TPZ’s investment experience during the remainder of their fiscal year and may be subject to changes based on tax regulations. TTP and TPZ will send you a Form 1099-DIV for the calendar year that will tell you how to report these distributions for federal income tax purposes.
| Tortoise |
| 2019 3rd Quarter Report | August 31, 2019 |
| Name/Ticker | Primary focus |
Structure | Total assets ($ millions)1 |
Portfolio mix by asset type2 |
Portfolio mix by structure2 | |
 |
Tortoise Energy NYSE: TYG |
Midstream MLPs |
C-corp | $1,987.2 |
 |
 |
|
Tortoise Midstream NYSE: NTG |
Natural gas infrastructure MLPs |
C-corp | $1,391.5 |
 |
 | |
|
Tortoise Pipeline NYSE: TTP |
North American pipeline companies |
Regulated investment company |
$213.8 |
 |
 | |
 |
Tortoise Energy NYSE: NDP |
North American oil & gas producers |
Regulated investment company |
$97.2 |
 |
 |
 |
Tortoise Power and NYSE: TPZ |
Power & energy infrastructure companies (Fixed income & equity) |
Regulated investment company |
$191.1 |
 |
 |
 |
Tortoise Essential NYSE: TEAF |
Essential assets |
Regulated investment company |
$285.5 |
 |
 |
| 1 | As of 9/30/2019 |
| 2 | As of 8/31/2019 |
| (unaudited) | |
| Tortoise | 1 |
| Tortoise |
| Third quarter 2019 report to closed-end fund stockholders |
Dear stockholders,
At Tortoise, we focus on providing capital to organizations where capital is short, that are essential to the economy and make a positive impact on society. Social infrastructure investments remain compelling as demand for school choice and high-quality senior living facilities continues to grow. Energy demand is at an all-time high and a global energy transition is taking place to reduce global carbon emissions while meeting that demand. In addition, we are witnessing the next phase of U.S. energy independence emerge as the U.S. becomes a net exporter of low-cost energy to the rest of the world. Approximately $15 trillion1 of investment in global energy infrastructure is required to support this energy transition, making it a compelling opportunity, in our opinion, for midstream energy investors.
Energy infrastructure
The broader energy sector, as represented by the S&P Energy Select Sector® Index, fell slightly during the third fiscal quarter ending Aug. 31, 2019, returning -1.3%, bringing fiscal year-to-date performance to -10.6%. Following the fiscal quarter end, attacks against Saudi Arabian oil facilities highlighted the critical nature of energy assets around the world. Geopolitical risk has returned to the forefront, squeezing spare capacity and significantly disrupting production, offsetting demand growth worries. In this market environment, crude oil supply and demand are in better balance.
Upstream
The Tortoise North American Oil and Gas Producers IndexSM returned -11.7% in the third fiscal quarter, bringing fiscal year to date performance to -21.6% as the oil market continued its myopic focus on the trade war driving pressure on demand growth. Escalating tensions in the Middle East, mounting worldwide supply outages and positive news out of both the G20 Summit and OPEC+ all proved insufficient to stimulate a sustained crude oil price response. As such, crude oil prices, represented by West Texas Intermediate (WTI), began the fiscal quarter at $53.50 per barrel, peaked at $60.43 on July 10, 2019, troughed at $51.09 on Aug. 7, 2019 and ended the fiscal quarter close to its start at $55.10.
We continue to expect 2019 U.S. crude oil production to increase as numerous Permian pipeline projects in the Gulf Coast come online at the end of the year.2 The U.S. Energy Information Administration predicts that continued production growth will transform the U.S. into a net exporter of oil and petroleum products by the end of 2019. In addition, the Organization of Petroleum Exporting Countries (OPEC) and Non-OPEC partners formalized the OPEC+ Charter of Cooperation, agreeing to roll over the existing output reduction target of 1.2 million barrels per day (MMbbl/d) for another nine months through March 2020. OPEC also officially adopted the 2010-2014 five-year inventory average of 2.7 billion barrels, for Organization for Economic Co-operation and Development (OECD), as the baseline against which the OECD inventory overhang will be measured. Given the overhang of 231 million barrels as of July 2019, we expect that OPEC+ will continue production cuts forward through 2020 at the next OPEC meeting in December.
Natural gas price pressure continued during the third fiscal quarter, hitting a new low for the fiscal year, $2.02 per million British thermal units (Btus), on Aug. 5, 2019. Prices opened at the high for the period at $2.59 and closed the quarter at $2.35. Prices continued to decline even though natural gas demand remained robust supported by record levels of domestic power burn, increased exports to Mexico and strong liquefied natural gas (LNG) demand. However, surging natural gas production more than offset strong demand, resulting in an elevated pace of inventory builds and pricing pressure needs, likely pressuring prices in the short to medium term.
Midstream
Midstream sector performance was slightly better than broader energy for the third fiscal quarter with the Tortoise North American Pipeline IndexSM return of 0.4% and the Tortoise MLP Index® return of -2.6%, bringing fiscal year to date performance to 8.7% and 2.1%, respectively. Phillips 66 Partners LP (PSXP) announced the elimination of its Incentive Distribution Rights (IDRs) in the third fiscal quarter. As the era of simplification comes to a close, the results have advanced the midstream sector and accomplished widespread cost of capital and corporate governance improvements.
Interest in publicly traded midstream companies and midstream assets, from both public and private entities, remains elevated, highlighting their strategic value and attractive valuation. In addition to the previously announced acquisition of Buckeye Partners by an Australian global institutional funds manager, current bids or announced transactions include ownership stakes in Tallgrass Energy (TGE) and SemGroup Corp (SEMG).
Capital markets activity remained slow during the third fiscal quarter with MLPs and other pipeline companies raising approximately $6.8 billion in total capital, all of which was in debt. Merger and acquisition activity among MLPs and other pipeline companies remained light with $4.8 billion total for the fiscal quarter, with the exception of Pembina Pipeline Corp.’s (PBA) purchase of certain businesses and assets from Kinder Morgan, Inc. (KMI) for $4.4 billion. Our outlook for capital investments remains at approximately $132 billion for 2019 to 2021 in MLPs, pipelines and related organic projects.
| (unaudited) | |
| 2 | Tortoise |
| 2019 3rd Quarter Report | August 31, 2019 |
Downstream
Refiners bounced back during the third fiscal quarter after a tough start to the year due to numerous planned and unplanned refinery outages, decreased oil supply due to sanctions on Iran and Venezuela and refined products demand concerns tied to the trade war. Strong performance was driven by a rally in refining margins resulting from a large fire and subsequent closure of Philadelphia Energy Solutions’ 350 thousand barrel per day Philadelphia refinery, the largest refining complex on the east coast. With the upcoming International Maritime Organization’s Jan. 1, 2020 implementation of sulfur reduction regulations on the shipping industry, U.S. refiners are well positioned to take advantage of higher distillate pricing and more heavily discounted medium-heavy sour crude oils as they have the flexibility to use a wide range of crude oil feedstocks.
Sustainable infrastructure
Solar
Solar accounted for 36% of new electricity generation capacity in the first half of 2019. This strong demand has been driven by traditional utilities, as well as corporate buyers, which accounted for 17% of projects announced year-to-date. Solar power generation has continued to become more cost competitive, with voluntary procurement driving 55% of utility PV announcements in 2019. The growth outlook continues to increase as evidenced by the pipeline of contracted solar projects reaching 37.9 gigawatts, the highest ever on record. One area to watch between now and year end is a potential extension of the Investment Tax Credit which is scheduled to begin a phase down at the end of 2019.3
Wind
Wind installations are at record highs with 736 megawatts (MWs) installed in the second calendar quarter of 2019, the latest reported date, reaching a total installed capacity of 97,960 MW with an additional 41,801 MW of capacity currently under construction or in advanced development. Wind power is expanding rapidly in many regions of the U.S. with more than 200 wind projects underway across 33 states, and 15 of those states have more than 1,000 MW of wind capacity that are expected to come online in the near term.4 The offshore wind sector saw significant activity in the second quarter with new targets legislated in Maryland, Connecticut and New York. New Jersey granted its first offshore renewable energy certificate award to Ørsted’s 1,100 MW Ocean Wind project—the largest offshore project planned in the U.S. so far.
Social infrastructure
Education
K-12 education spending for the 2016 – 2017 school year was $759 billion or approximately 4.1% of GDP according to the National Center for Education Statistics. Charter schools currently account for 5.3% of all K-12 students (public, charter, private, parochial) in the U.S. There are approximately 7,000 charter schools with more than 3.2 million enrolled students. Since the 2001–2002 school year, charter school enrollment has increased annually at 13% versus just 1% annually for all K-12 schools in the U.S. through the 2016–2017 school year. Student access to quality facilities remains a top concern for charter school leaders. Year to date, more than $1.4 billion of tax-exempt charter school facility revenue bonds were publicly issued through the third calendar quarter with more than $300 million of new offerings currently in the market.
There were several significant actions taken by states with regard to charter schools. In Pennsylvania, Governor Wolf directed his Department of Education to develop regulations that would, amongst other things, require changes to bidding and contracting practices. While the actual impact of such a regulation remains to be determined, it has the potential to significantly increase construction costs for charter schools across the state. In California, Governor Newsom signed AB 1505 which allows school districts to reject charter applications if they feel the “fiscal impact” of a proposed school “would substantially undermine existing schools in a neighborhood” and limits appeals in the charter renewal process. In a more positive development, the Florida Court of Appeals upheld the constitutionality of HB 7069, which requires local school boards to provide a fair share of local tax revenues and Title I funding. Despite the ever-shifting political environment across the states, we continue to believe that high-performing charter schools offer an opportunity for exceptional, tax-exempt returns that are largely uncorrelated with the overall market.
Senior Living
According to the National Investment Center for Seniors Housing and Care (NIC), as of Sept. 30, 2019, the national market for senior housing continued to soften as aggregate occupancy hit its lowest level since 2011 at just under 88% occupancy, which is still above breakeven for most projects. Additionally, the local variation between market supply/demand seems to be widening while national construction continues to slow which should help markets with oversupply over the long term.
We remain bullish in the senior living space, with demographic trends pointing to continued growth opportunities. NIC estimates that 881,000 additional units of senior housing inventory would be needed to serve seniors between 2019 and 2030. If you consider the typical senior living facility size of approximately 100 units, that equates to 8,810 different projects.
We continue to rely on our competency in the space and vast network to strategically seek out unique opportunities where significant demand and barriers to entry exist. Anecdotally, skilled nursing facility occupancy is starting to show signs of a rebound, but margins remain tight at roughly 0.5% for all payer mixes.
| (unaudited) | |
| Tortoise | 3 |
Project Finance
Demand for energy-related projects within the project finance sector has remained strong as efforts continue to de-carbonize power generation and fuel production throughout the U.S. In particular, there have been several positive renewable natural gas (RNG) updates. In July 2019, the Coalition for Renewable Natural Gas announced that the North American RNG industry had surpassed the 100-facility milestone, equating to nearly 150% growth over the past five years from the 41 projects built between 1982 and 2014, with more than 50 additional projects under construction or in development. The State of Colorado announced a feasibility study to evaluate the implementation of a low carbon fuel standard, similar to the program adopted by the State of California, which would place a premium on RNG. In addition, the EPA’s proposed 2020 biofuels volume under the Renewable Fuel Standards program includes a 29.2% increase in RNG volume from 2019.
Concluding thoughts
We remain steadfast in our belief that essential assets can make an impact on shareholders’ portfolios and society. Given the geopolitical unknowns, volatility in the energy sector is likely to remain a constant through the end of the year. Despite that, the U.S. will play a critical role as a future supplier of oil and natural gas to countries around the world. As this happens, the U.S. will likely become the largest producer of LNG in the world. We maintain our strong conviction in the future of the U.S. energy sector, we believe the sector is undervalued and underappreciated and we think investors will want exposure to the long-term U.S. energy export story. We are actively pursuing essential asset investments that allow us to leverage our competitive advantages to earn attractive returns for our shareholders.
The S&P Energy Select Sector® Index is a capitalization-weighted index of S&P 500® Index companies in the energy sector involved in the development or production of energy products. The Tortoise North American Oil and Gas Producers IndexSM is a float-adjusted, capitalization-weighted index of North American energy companies engaged primarily in the production of crude oil, condensate, natural gas or natural gas liquids (NGLs). The Tortoise North American Pipeline IndexSM is a float adjusted, capitalization-weighted index of energy pipeline companies domiciled in the United States and Canada. The Tortoise MLP Index® is a float-adjusted, capitalization-weighted index of energy master limited partnerships.
The Tortoise indices are the exclusive property of Tortoise Index Solutions, LLC, which has contracted with S&P Opco, LLC (a subsidiary of S&P Dow Jones Indices LLC) to calculate and maintain the Tortoise MLP Index®, Tortoise North American Pipeline IndexSM and Tortoise North American Oil and Gas Producers IndexSM (the “Indices”). The Indices are not sponsored by S&P Dow Jones Indices or its affiliates or its third party licensors (collectively, “S&P Dow Jones Indices LLC”). S&P Dow Jones Indices will not be liable for any errors or omission in calculating the Indices. “Calculated by S&P Dow Jones Indices” and its related stylized mark(s) are service marks of S&P Dow Jones Indices and have been licensed for use by Tortoise Index Solutions, LLC and its affiliates. S&P® is a registered trademark of Standard & Poor’s Financial Services LLC (“SPFS”), and Dow Jones® is a registered trademark of Dow Jones Trademark Holdings LLC (“Dow Jones”).
It is not possible to invest directly in an index.
Performance data quoted represent past performance; past performance does not guarantee future results. Like any other stock, total return and market value will fluctuate so that an investment, when sold, may be worth more or less than its original cost.
| 1 | Bank of America Merrill Lynch, June 2018 |
| 2 | EIA, September 2019 |
| 3 | Wood Mackenzie, September 2019 |
| 4 | AWEA, September 2019 |
| (unaudited) | |
| 4 | Tortoise |
| 2019 3rd Quarter Report | August 31, 2019 |
| Tortoise |
| Energy Infrastructure Corp. (TYG) |
Fund description
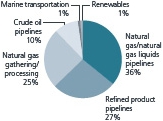
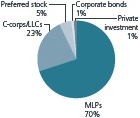
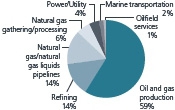
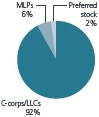
TYG seeks a high level of total return with an emphasis on current distributions paid to stockholders. TYG invests primarily in equity securities of master limited partnerships (MLPs) and their affiliates that transport, gather, process or store natural gas, natural gas liquids (NGLs), crude oil and refined petroleum products.
Fund performance review
Midstream energy performance was slightly better than broader energy for the third fiscal quarter. As the era of simplification comes to a close, the results have advanced the midstream sector and accomplished widespread cost of capital and corporate governance improvements. Average coverage ratios for the fund’s portfolio companies have increased from 1.41x in 1Q19 to 1.43x in 2Q19 while average leverage decreased from 3.73x in 1Q19 to 3.71x in 2Q19. With lower leverage and improved distribution coverage, the equity portion of projects can confidently be funded with discretionary cash flow. Since the fund’s inception, it has paid out more than $35 in cumulative distributions to stockholders. The fund’s market-based and NAV-based returns for the fiscal quarter ending August 31, 2019 were -3.9% and -7.4%, respectively (including the reinvestment of distributions). Comparatively, the Tortoise MLP Index® returned -2.6% for the same period.
| Third fiscal quarter highlights | ||
| Distributions paid per share | $0.6550 | |
| Distribution rate (as of 8/31/2019) | 12.8% | |
| Quarter-over-quarter distribution increase | 0.0% | |
| Year-over-year distribution increase | 0.0% | |
| Cumulative distributions paid per share to | ||
| stockholders since inception in February 2004 | $35.0475 | |
| Market-based total return | (3.9)% | |
| NAV-based total return | (7.4)% | |
| Premium (discount) to NAV (as of 8/31/2019) | (0.2)% |
Key asset performance drivers
| Top five contributors | Company type | Performance driver | ||
| Magellan Midstream Partners, L.P. | Midstream refined product pipeline MLP | Strong 2Q earnings results and increased 2019 financial guidance | ||
| Phillips 66 Partners L.P. | Midstream refined product pipeline MLP | Eliminated incentive distribution rights (IDRs) | ||
| ONEOK, Inc. | Midstream natural gas/natural gas liquids pipeline company | Announced NGL and natural gas expansion projects | ||
| Enterprise Products Partners L.P. | Midstream natural gas/natural gas liquids pipeline MLP | Strong 2Q earnings and solid downstream fundamentals supporting new project announcements | ||
| NuStar Energy L.P. | Refined products pipelines | Strong volume growth from Permian and outlook for St. James and Corpus Christi assets | ||
| Bottom five contributors | Company type | Performance driver | ||
| EQM Midstream Partners, LP | Midstream natural gas/natural gas liquids pipeline company | Uncertainty around Mountain Valley Pipeline project | ||
| Antero Midstream Corporation | Midstream gathering and processing company | Concern around parent (AR) financial health | ||
| Western Midstream Partners LP | Midstream gathering and processing company | Finalizing simplification of General Partner (GP) Limited Partner (LP) | ||
| EnLink Midstream, LLC | Midstream gathering and processing company | Concern around producers slowing drilling activity in Oklahoma | ||
| DCP Midstream LP | Midstream gathering and processing MLP | Lower commodity prices negatively impacted non fee-based contracts |
Unlike the fund return, index return is pre-expenses and taxes.
Performance data quoted represent past performance; past performance does not guarantee future results. Like any other stock, total return and market value will fluctuate so that an investment, when sold, may be worth more or less than its original cost. Portfolio composition is subject to change due to ongoing management of the fund. References to specific securities or sectors should not be construed as a recommendation by the fund or its adviser. See Schedule of Investments for portfolio weighting at the end of the fiscal quarter.
| (unaudited) | |
| Tortoise | 5 |
| Tortoise |
| Energy Infrastructure Corp. (TYG) (continued) |
Fund structure and distribution policy
The fund is structured as a corporation and is subject to federal and state income tax on its taxable income. The fund has adopted a distribution policy in which the Board of Directors considers many factors in determining distributions to stockholders. Over the long term, the fund expects to distribute substantially all of its distributable cash flow (DCF) to holders of common stock. The fund’s Board of Directors reviews the distribution rate quarterly, and may adjust the quarterly distribution throughout the year. Although the level of distributions is independent of the funds’ performance in the short term, the fund expects such distributions to correlate with its performance over time.
Distributable cash flow and distributions
DCF is distributions received from investments less expenses. The total distributions received from investments include the amount received as cash distributions from investments, paid-in-kind distributions, and dividend and interest payments. Income also includes the premiums received from sales of covered call options, net of amounts paid to buy back out-of-the-money options. The total expenses include current or anticipated operating expenses, leverage costs and current income taxes. Current income taxes include taxes paid on net investment income, in addition to foreign taxes, if any. Taxes incurred from realized gains on the sale of investments, expected tax benefits and deferred taxes are not included in DCF.
Income from investments decreased approximately 3.9% as compared to 2nd quarter 2019 primarily due to the impact of merger and acquisition activity within the fund’s portfolio. Operating expenses, consisting primarily of fund advisory fees, decreased approximately 4.4% during the quarter due to lower asset-based fees. Overall leverage costs decreased approximately 0.5% as compared to 2nd quarter 2019 primarily due to lower interest rates during the quarter. As a result of the changes in income and expenses, DCF decreased approximately 4.6% as compared to 2nd quarter 2019. The fund paid a quarterly distribution of $0.655 per share, which was equal to the distribution paid in the prior quarter and 3rd quarter 2018. The fund has paid cumulative distributions to stockholders of $35.0475 per share since its inception in Feb. 2004.
The Key Financial Data table discloses the calculation of DCF and should be read in conjunction with this discussion. The difference between distributions received from investments in the DCF calculation and total investment income as reported in the Statement of Operations, is reconciled as follows: the Statement of Operations, in conformity with U.S. generally accepted accounting principles (GAAP), recognizes distribution income from MLPs and other investments on their ex-dates, whereas the DCF calculation may reflect distribution income on their pay dates; GAAP recognizes that a significant portion of the cash distributions received from MLPs and other investments are characterized as a return of capital and therefore excluded from investment income, whereas the DCF calculation includes the return of capital (net of any distributions deemed to be return of principal); and distributions received from investments in the DCF calculation include the value of dividends paid-in-kind (additional stock or MLP units), whereas such amounts may not be included as income for GAAP purposes and includes distributions related to direct investments when the purchase price is reduced in lieu of receiving cash distributions. Net premiums on options written (premiums received less amounts paid to buy back out-of-the-money options) with expiration dates during the fiscal quarter are included in the DCF calculation, whereas GAAP recognizes the net effect of options written as realized and unrealized gains (losses). Income for DCF purposes is reduced by amortizing the cost of certain investments that may not have a residual value after a known time period and by distributions received from investments deemed to be return of principal. The treatment of expenses in the DCF calculation also differs from what is reported in the Statement of Operations. In addition to the total operating expenses, including fee waiver, as disclosed in the Statement of Operations, the DCF calculation reflects interest expense, realized and unrealized gains (losses) on interest rate swap settlements, distributions to preferred stockholders, other recurring leverage expenses, as well as taxes paid on net investment income.
“Net Investment Income (Loss), before Income Taxes” on the Statement of Operations is adjusted as follows to reconcile to DCF for YTD and 3rd quarter 2019 (in thousands):
| YTD 2019 | 3rd Qtr 2019 | |||||||
| Net Investment Loss, | ||||||||
| before Income Taxes | $ | (13,989 | ) | $ | (4,482 | ) | ||
| Adjustments to reconcile to DCF: | ||||||||
| Distributions characterized as | ||||||||
| return of capital, net | 110,964 | 37,310 | ||||||
| Other | 926 | (855 | ) | |||||
| DCF | $ | 97,901 | $ | 31,973 | ||||
Leverage
The fund’s leverage utilization increased $5.2 million during 3rd quarter 2019 and represented 35.3% of total assets at August 31, 2019. The fund has maintained compliance with its applicable coverage ratios. At quarter-end, including the impact of interest rate swaps, approximately 73% of the leverage cost was fixed, the weighted-average maturity was 3.4 years and the weighted-average annual rate on leverage was 3.67%. These rates will vary in the future as a result of changing floating rates, utilization of the fund’s credit facilities and as leverage and swaps mature or are redeemed.
Income taxes
During 3rd quarter 2019, the fund’s deferred tax liability decreased by $36.5 million to $155.9 million, primarily as a result of a decrease in value of its investment portfolio. The fund had net realized gains of $34.9 million during the quarter. To the extent that the fund has taxable income, it will owe federal and state income taxes. Tax payments can be funded from investment earnings, fund assets, or borrowings.
Please see the Financial Statements and Notes to Financial Statements for additional detail regarding critical accounting policies, results of operations, leverage, taxes and other important fund information.
For further information regarding the calculation of distributable cash flow and distributions to stockholders, as well as a discussion of the tax impact on distributions and results and recent tax reform, please visit www.tortoiseadvisors.com.
| (unaudited) | |
| 6 | Tortoise |
| 2019 3rd Quarter Report | August 31, 2019 |
| TYG Key Financial Data (supplemental unaudited information) |
| (dollar amounts in thousands unless otherwise indicated) |
The information presented below regarding Distributable Cash Flow and Selected Financial Information is supplemental non-GAAP financial information, which the fund believes is meaningful to understanding operating performance. The Distributable Cash Flow Ratios include the functional equivalent of EBITDA for non-investment companies, and the fund believes they are an important supplemental measure of performance and promote comparisons from period-to-period. This information is supplemental, is not inclusive of required financial disclosures (e.g. Total Expense Ratio), and should be read in conjunction with the full financial statements.
| 2018 | 2019 | |||||||||||||||||||
| Q3(1) | Q4(1) | Q1(1) | Q2(1) | Q3(1) | ||||||||||||||||
| Total Income from Investments | ||||||||||||||||||||
| Distributions and dividends from investments | $ | 46,231 | $ | 44,214 | $ | 43,148 | $ | 44,564 | $ | 42,910 | ||||||||||
| Dividends paid in kind | 879 | 113 | 115 | 117 | 269 | |||||||||||||||
| Interest earned on corporate bonds | — | — | — | — | 119 | |||||||||||||||
| Premiums on options written | 5 | 1,258 | 793 | 1,092 | 668 | |||||||||||||||
| Total from investments | 47,115 | 45,585 | 44,056 | 45,773 | 43,966 | |||||||||||||||
| Operating Expenses Before Leverage | ||||||||||||||||||||
| Costs and Current Taxes | ||||||||||||||||||||
| Advisory fees | 5,496 | 5,392 | 4,849 | 5,215 | 4,979 | |||||||||||||||
| Other operating expenses | 442 | 438 | 415 | 420 | 407 | |||||||||||||||
| 5,938 | 5,830 | 5,264 | 5,635 | 5,386 | ||||||||||||||||
| Distributable cash flow before leverage costs and current taxes | 41,177 | 39,755 | 38,792 | 40,138 | 38,580 | |||||||||||||||
| Leverage costs(2) | 6,606 | 6,561 | 6,365 | 6,637 | 6,607 | |||||||||||||||
| Current income tax expense(3) | — | — | — | — | — | |||||||||||||||
| Distributable Cash Flow(4) | $ | 34,571 | $ | 33,194 | $ | 32,427 | $ | 33,501 | $ | 31,973 | ||||||||||
| Net realized gain (loss), net of income taxes, | ||||||||||||||||||||
| for the period | $ | 55,082 | $ | (45,158 | ) | $ | (10,210 | ) | $ | 10,905 | $ | 34,895 | ||||||||
| As a percent of average total assets(5) | ||||||||||||||||||||
| Total from investments | 7.83 | % | 7.91 | % | 8.61 | % | 8.42 | % | 8.38 | % | ||||||||||
| Operating expenses before leverage costs and current taxes | 0.99 | % | 1.01 | % | 1.03 | % | 1.04 | % | 1.03 | % | ||||||||||
| Distributable cash flow before leverage costs and current taxes | 6.84 | % | 6.90 | % | 7.58 | % | 7.38 | % | 7.35 | % | ||||||||||
| As a percent of average net assets(5) | ||||||||||||||||||||
| Total from investments | 12.84 | % | 12.90 | % | 14.36 | % | 14.01 | % | 14.41 | % | ||||||||||
| Operating expenses before leverage costs and current taxes | 1.62 | % | 1.65 | % | 1.72 | % | 1.72 | % | 1.77 | % | ||||||||||
| Leverage costs and current taxes | 1.80 | % | 1.86 | % | 2.08 | % | 2.03 | % | 2.17 | % | ||||||||||
| Distributable cash flow | 9.42 | % | 9.39 | % | 10.56 | % | 10.26 | % | 10.47 | % | ||||||||||
| Selected Financial Information | ||||||||||||||||||||
| Distributions paid on common stock | $ | 35,089 | $ | 35,131 | $ | 35,131 | $ | 35,131 | $ | 35,131 | ||||||||||
| Distributions paid on common stock per share | 0.6550 | 0.6550 | 0.6550 | 0.6550 | 0.6550 | |||||||||||||||
| Total assets, end of period(6) | 2,461,343 | 2,136,339 | 2,129,174 | 2,110,273 | 1,951,035 | |||||||||||||||
| Average total assets during period(6)(7) | 2,387,915 | 2,311,256 | 2,074,901 | 2,157,919 | 2,080,591 | |||||||||||||||
| Leverage(8) | 695,800 | 652,100 | 679,100 | 683,700 | 688,900 | |||||||||||||||
| Leverage as a percent of total assets | 28.3 | % | 30.5 | % | 31.9 | % | 32.4 | % | 35.3 | % | ||||||||||
| Net unrealized depreciation, end of period | (170,043 | ) | (338,892 | ) | (302,159 | ) | (300,530 | ) | (421,920 | ) | ||||||||||
| Net assets, end of period | 1,499,967 | 1,260,300 | 1,245,766 | 1,220,946 | 1,097,489 | |||||||||||||||
| Average net assets during period(9) | 1,455,299 | 1,417,581 | 1,243,981 | 1,296,336 | 1,210,078 | |||||||||||||||
| Net asset value per common share | 27.97 | 23.50 | 23.23 | 22.76 | 20.43 | |||||||||||||||
| Market value per share | 28.12 | 22.59 | 22.91 | 21.90 | 20.39 | |||||||||||||||
| Shares outstanding (000’s) | 53,635 | 53,635 | 53,635 | 53,635 | 53,732 | |||||||||||||||
| (1) |
Q1 is the period from December through February. Q2 is the period from March through May. Q3 is the period from June through August. Q4 is the period from September through November. |
| (2) |
Leverage costs include interest expense, distributions to preferred stockholders, interest rate swap expenses and other recurring leverage expenses. |
| (3) |
Includes taxes paid on net investment income and foreign taxes, if any. Taxes related to realized gains are excluded from the calculation of Distributable Cash Flow (“DCF”). |
| (4) |
"Net investment income (loss), before income taxes" on the Statement of Operations is adjusted as follows to reconcile to DCF: increased by the return of capital on distributions, the dividends paid in stock and increased liquidation value, the premium on dividends paid in kind, the net premiums on options written and amortization of debt issuance costs; and decreased by realized and unrealized gains (losses) on interest rate swap settlements, distributions received that are excluded for DCF purposes and amortization on certain investments. |
| (5) |
Annualized. |
| (6) |
Includes deferred issuance and offering costs on senior notes and preferred stock. |
| (7) |
Computed by averaging month-end values within each period. |
| (8) |
Leverage consists of senior notes, preferred stock and outstanding borrowings under credit facilities. |
| (9) |
Computed by averaging daily net assets within each period. |
| Tortoise | 7 |
| Tortoise |
| Midstream Energy Fund, Inc. (NTG) |
Fund description
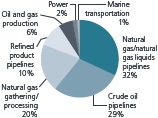
NTG seeks to provide stockholders with a high level of total return with an emphasis on current distributions. NTG invests primarily in midstream energy equities that own and operate a network of pipeline and energy related logistical infrastructure assets with an emphasis on those that transport, gather, process and store natural gas and natural gas liquids (NGLs). NTG targets midstream energy equities, including MLPs benefiting from U.S. natural gas production and consumption expansion, with minimal direct commodity exposure.
Fund performance review
Midstream energy performance was slightly better than broader energy for the third fiscal quarter. As the era of simplification comes to a close, the results have advanced the midstream sector and accomplished widespread cost of capital and corporate governance improvements. Average coverage ratios for the fund’s portfolio companies have increased from 1.41x in 1Q19 to 1.44x in 2Q19 while average leverage decreased from 3.77x in 1Q19 to 3.74x in 2Q19.
With lower leverage and improved distribution coverage, the equity portion of projects can confidently be funded with discretionary cash flow. The fund’s market-based and NAV-based returns for the fiscal quarter ending August 31, 2019 were -5.8% and -8.2%, respectively (including the reinvestment of distributions). Comparatively, the Tortoise MLP Index® returned -2.6% for the same period.
| Third fiscal quarter highlights | ||
| Distributions paid per share | $0.4225 | |
| Distribution rate (as of 08/31/2019) | 14.0% | |
| Quarter-over-quarter distribution increase | 0.0% | |
| Year-over-year distribution increase | 0.0% | |
| Cumulative distributions paid per share to stockholders since inception in July 2010 |
$15.0375 | |
| Market-based total return | (5.8)% | |
| NAV-based total return | (8.2)% | |
| Premium (discount) to NAV (as of 8/31/2019) | (3.3)% |
Key asset performance drivers
| Top five contributors | Company type | Performance driver | ||
| Phillips 66 Partners LP | Midstream refined product pipeline MLP | Eliminated incentive distribution rights (IDRs) | ||
| ONEOK, Inc. | Midstream natural gas/natural gas liquids pipeline company | Announced NGL and natural gas expansion projects | ||
| Magellan Midstream Partners, L.P. | Midstream refined product pipeline MLP | Strong 2Q earnings results and increased 2019 financial guidance | ||
| Enterprise Products Partners L.P. | Midstream natural gas/natural gas liquids pipeline MLP | Strong 2Q earnings and solid downstream fundamentals supporting new project announcements | ||
| NuStar Energy L.P. | Refined products pipelines | Strong volume growth from Permian and outlook for St. James and Corpus Christi assets | ||
| Bottom five contributors | Company type | Performance driver | ||
| EQM Midstream Partners, LP | Midstream natural gas/natural gas liquids pipeline company | Uncertainty around Mountain Valley Pipeline project | ||
| Antero Midstream Corporation | Natural gas pipeline company | Concern around parent (AR) financial health | ||
| Western Midstream Partners LP | Gathering and processing company | Finalizing simplification of General Partner (GP) Limited Partner (LP) | ||
| EnLink Midstream, LLC | Midstream gathering and processing MLP | Concern around producers slowing drilling activity in Oklahoma | ||
| DCP Midstream LP | Midstream gathering and processing MLP | Lower commodity prices negatively impacted non fee-based contracts |
Unlike the fund return, index return is pre-expenses and taxes.
Performance data quoted represent past performance; past performance does not guarantee future results. Like any other stock, total return and market value will fluctuate so that an investment, when sold, may be worth more or less than its original cost. Portfolio composition is subject to change due to ongoing management of the fund. References to specific securities or sectors should not be construed as a recommendation by the fund or its adviser. See Schedule of Investments for portfolio weighting at the end of the fiscal quarter.
| (unaudited) | |
| 8 | Tortoise |
| 2019 3rd Quarter Report | August 31, 2019 |
Fund structure and distribution policy
The fund is structured as a corporation and is subject to federal and state income tax on its taxable income. The fund has adopted a distribution policy in which the Board of Directors considers many factors in determining distributions to stockholders. Over the long term, the fund expects to distribute substantially all of its distributable cash flow (DCF) to holders of common stock. The fund’s Board of Directors reviews the distribution rate quarterly, and may adjust the quarterly distribution throughout the year. Although the level of distributions is independent of the funds’ performance in the short term, the fund expects such distributions to correlate with its performance over time.
Distributable cash flow and distributions
DCF is distributions received from investments less expenses. The total distributions received from investments include the amount received as cash distributions from MLPs, paid-in-kind distributions, and dividend and interest payments. Income also includes the premiums received from sales of covered call options, net of amounts paid to buy back out-of-the-money options. The total expenses include current or anticipated operating expenses, leverage costs and current income taxes. Current income taxes include taxes paid on net investment income in addition to foreign taxes, if any. Taxes incurred from realized gains on the sale of investments, expected tax benefits and deferred taxes are not included in DCF.
Income from investments decreased approximately 1.1% as compared to 2nd quarter 2019 due primarily to the impact of merger and acquisition activity within the fund’s portfolio. Operating expenses, consisting primarily of fund advisory fees, decreased approximately 5.0% during the quarter due to lower asset-based fees. Leverage costs decreased approximately 1.7% as compared to 2nd quarter 2019 primarily due to lower interest rates during the quarter. As a result of the changes in income and expenses, DCF decreased slightly as compared to 2nd quarter 2019. The fund paid a quarterly distribution of $0.4225 per share, which was equal to the distribution paid in the prior quarter and 3rd quarter 2018. The fund has paid cumulative distributions to stockholders of $15.0375 per share since its inception in July 2010.
The Key Financial Data table discloses the calculation of DCF and should be read in conjunction with this discussion. The difference between distributions received from investments in the DCF calculation and total investment income as reported in the Statement of Operations, is reconciled as follows: the Statement of Operations, in conformity with U.S. generally accepted accounting principles (GAAP), recognizes distribution income from MLPs, common stock and other investments on their ex-dates, whereas the DCF calculation may reflect distribution income on their pay dates; GAAP recognizes that a significant portion of the cash distributions received from MLPs, common stock and other investments are characterized as a return of capital and therefore excluded from investment income, whereas the DCF calculation includes the return of capital; and distributions received from investments in the DCF calculation include the value of dividends paid-in-kind (additional stock or MLP units), whereas such amounts may not be included as income for GAAP purposes, and includes distributions related to direct investments when the purchase price is reduced in lieu of receiving cash distributions. Net premiums on options written (premiums received less amounts paid to buy back out-of-the-money options) with expiration dates during the fiscal quarter are included in the DCF calculation, whereas GAAP recognizes the net effect of options written as realized and unrealized gains (losses). The treatment of expenses in the DCF calculation also differs from what is reported in the Statement of Operations. In addition to the total operating expenses, including fee waiver, as disclosed in the Statement of Operations, the DCF calculation reflects interest expense, distributions to preferred stockholders, other recurring leverage expenses, as well as taxes paid on net investment income.
“Net Investment Income (Loss), before Income Taxes” on the Statement of Operations is adjusted as follows to reconcile to DCF for YTD and 3rd quarter 2019 (in thousands):
| YTD 2019 | 3rd Qtr 2019 | |||||||
| Net Investment Loss, before Income Taxes |
$ | (16,720 | ) | $ | (5,422 | ) | ||
| Adjustments to reconcile to DCF: | ||||||||
| Distributions characterized as return of capital |
84,573 | 27,869 | ||||||
| Other | 2,758 | 1,062 | ||||||
| DCF | $ | 70,611 | $ | 23,509 | ||||
Leverage
The fund’s leverage utilization increased by $0.8 million during 3rd quarter 2019 and represented 38.3% of total assets at August 31, 2019. The fund has maintained compliance with its applicable coverage ratios. At quarter-end, approximately 74% of the leverage cost was fixed, the weighted-average maturity was 3.2 years and the weighted-average annual rate on leverage was 3.82%. These rates will vary in the future as a result of changing floating rates, utilization of the fund’s credit facility and as leverage matures or is redeemed.
Income taxes
During 3rd quarter 2019, the fund’s deferred tax liability decreased by $21.6 million to $56.2 million, primarily as a result of the decrease in value of its investment portfolio. The fund had net realized gains of $9.6 million during the quarter. As of November 30, 2018, the fund had net operating losses of $55 million for federal income tax purposes. To the extent that the fund has taxable income in the future that is not offset by net operating losses, it will owe federal and state income taxes. Tax payments can be funded from investment earnings, fund assets, or borrowings.
Please see the Financial Statements and Notes to Financial Statements for additional detail regarding critical accounting policies, results of operations, leverage, taxes and other important fund information.
For further information regarding the calculation of distributable cash flow and distributions to stockholders, as well as a discussion of the tax impact on distributions and results and recent tax reform, please visit www.tortoiseadvisors.com.
(unaudited)
| Tortoise | 9 |
|
NTG Key Financial Data (supplemental unaudited information) |
| (dollar amounts in thousands unless otherwise indicated) |
| 2018 | 2019 | |||||||||||||||
| Q3(1) | Q4(1) | Q1(1) | Q2(1) | Q3(1) | ||||||||||||
| Total Income from Investments | ||||||||||||||||
| Distributions and dividends from investments | $ | 31,413 | $ | 31,874 | $ | 31,399 | $ | 31,824 | $ | 31,244 | ||||||
| Dividends paid in kind | 644 | 68 | 69 | 70 | 179 | |||||||||||
| Interest earned on corporate bonds | — | — | — | — | 85 | |||||||||||
| Premiums on options written | — | 1,254 | 542 | 890 | 927 | |||||||||||
| Total from investments | 32,057 | 33,196 | 32,010 | 32,784 | 32,435 | |||||||||||
| Operating Expenses Before Leverage | ||||||||||||||||
| Costs and Current Taxes | ||||||||||||||||
| Advisory fees, net of fees waived | 3,251 | 3,264 | 3,145 | 3,715 | 3,526 | |||||||||||
| Other operating expenses | 330 | 352 | 334 | 324 | 312 | |||||||||||
| 3,581 | 3,616 | 3,479 | 4,039 | 3,838 | ||||||||||||
| Distributable cash flow before leverage costs and current taxes | 28,476 | 29,580 | 28,531 | 28,745 | 28,597 | |||||||||||
| Leverage costs(2) | 4,231 | 4,749 | 4,999 | 5,175 | 5,088 | |||||||||||
| Current income tax expense(3) | — | — | — | — | — | |||||||||||
| Distributable Cash Flow(4) | $ | 24,245 | $ | 24,831 | $ | 23,532 | $ | 23,570 | $ | 23,509 | ||||||
| Net realized gain (loss), net of income taxes, | ||||||||||||||||
| for the period | $ | 41,385 | $ | (4,243 | ) | $ | (29,889 | ) | $ | (6,278 | ) | $ | 9,631 | |||
| As a percent of average total assets(5) | ||||||||||||||||
| Total from investments | 8.60 | % | 8.38 | % | 8.81 | % | 8.46 | % | 8.73 | % | ||||||
| Operating expenses before leverage costs and current taxes | 0.96 | % | 0.91 | % | 0.96 | % | 1.04 | % | 1.03 | % | ||||||
| Distributable cash flow before leverage costs and current taxes | 7.64 | % | 7.47 | % | 7.85 | % | 7.42 | % | 7.70 | % | ||||||
| As a percent of average net assets(5) | ||||||||||||||||
| Total from investments | 13.86 | % | 13.08 | % | 14.36 | % | 13.79 | % | 14.70 | % | ||||||
| Operating expenses before leverage costs and current taxes | 1.55 | % | 1.42 | % | 1.56 | % | 1.70 | % | 1.74 | % | ||||||
| Leverage costs and current taxes | 1.83 | % | 1.87 | % | 2.24 | % | 2.18 | % | 2.31 | % | ||||||
| Distributable cash flow | 10.48 | % | 9.79 | % | 10.56 | % | 9.91 | % | 10.65 | % | ||||||
| Selected Financial Information | ||||||||||||||||
| Distributions paid on common stock | $ | 20,029 | $ | 26,705 | $ | 26,706 | $ | 26,705 | $ | 26,706 | ||||||
| Distributions paid on common stock per share | 0.4225 | 0.4225 | 0.4225 | 0.4225 | 0.4225 | |||||||||||
| Total assets, end of period(6) | 1,651,973 | 1,506,745 | 1,508,643 | 1,498,278 | 1,380,446 | |||||||||||
| Average total assets during period(6)(7) | 1,479,365 | 1,588,197 | 1,472,955 | 1,536,794 | 1,473,596 | |||||||||||
| Leverage(8) | 457,000 | 517,100 | 522,600 | 527,300 | 528,100 | |||||||||||
| Leverage as a percent of total assets | 27.7 | % | 34.3 | % | 34.6 | % | 35.2 | % | 38.3 | % | ||||||
| Net unrealized appreciation, end of period | 150,762 | 23,424 | 75,853 | 93,595 | 15,163 | |||||||||||
| Net assets, end of period | 1,077,585 | 915,033 | 905,859 | 886,270 | 786,294 | |||||||||||
| Average net assets during period(9) | 917,409 | 1,018,337 | 903,917 | 943,080 | 875,555 | |||||||||||
| Net asset value per common share | 17.05 | 14.48 | 14.33 | 14.02 | 12.44 | |||||||||||
| Market value per common share | 16.27 | 13.72 | 13.66 | 13.21 | 12.03 | |||||||||||
| Shares outstanding (000’s) | 63,208 | 63,208 | 63,208 | 63,208 | 63,208 | |||||||||||
| (1) | Q1 is the period from December through February. Q2 is the period from March through May. Q3 is the period from June through August. Q4 is the period from September through November. |
| (2) | Leverage costs include interest expense, distributions to preferred stockholders and other recurring leverage expenses. |
| (3) | Includes taxes paid on net investment income and foreign taxes, if any. Taxes related to realized gains are excluded from the calculation of Distributable Cash Flow (“DCF”). |
| (4) | "Net investment income (loss), before income taxes" on the Statement of Operations is adjusted as follows to reconcile to DCF: increased by the return of capital on distributions, the dividends paid in stock and increased liquidation value, the premium on dividends paid in kind and amortization of debt issuance costs. |
| (5) | Annualized. |
| (6) | Includes deferred issuance and offering costs on senior notes and preferred stock. |
| (7) | Computed by averaging month-end values within each period. |
| (8) | Leverage consists of senior notes, preferred stock and outstanding borrowings under the credit facility. |
| (9) | Computed by averaging daily net assets within each period. |
| 10 | Tortoise |
| 2019 3rd Quarter Report | August 31, 2019 |
| Tortoise |
| Pipeline & Energy Fund, Inc. (TTP) |
Fund description
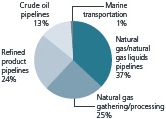
TTP seeks a high level of total return with an emphasis on current distributions paid to stockholders. TTP invests primarily in equity securities of North American pipeline companies that transport natural gas, natural gas liquids (NGLs), crude oil and refined products and, to a lesser extent, in other energy infrastructure companies.
Fund performance review
Midstream energy performance was slightly better than broader energy for the third fiscal quarter. As the era of simplification comes to a close, the results have advanced the midstream sector and accomplished widespread cost of capital and corporate governance improvements. The fund’s market-based and NAV-based returns for the fiscal quarter ending August 31, 2019 were -6.4% and -6.7%, respectively (including the reinvestment of distributions). Comparatively, the Tortoise North American Pipeline IndexSM returned -0.4% for the same period.
| Third fiscal quarter highlights | ||
| Distributions paid per share | $0.2850 | |
| Distribution rate (as of 08/31/2019) | 8.9% | |
| Quarter-over-quarter distribution increase (decrease) | (30.1)% | |
| Year-over-year distribution increase (decrease) | (30.1)% | |
| Cumulative distributions paid per share to stockholders since inception in October 2011 |
$12.8275 | |
| Market-based total return | (6.4)% | |
| NAV-based total return | (6.7)% | |
| Premium (discount) to NAV (as of 08/31/2019) | (10.3)% |
Please refer to the inside front cover of the report for important information about the fund’s distribution policy.
The fund’s covered call strategy, which focuses on independent energy companies that are key pipeline transporters, enabled the fund to generate current income. The notional amount of the fund’s covered calls averaged approximately 7% of total assets, and their out-of-the-money percentage at the time written averaged approximately 6% during the fiscal quarter.
Key asset performance drivers
| Top five contributors | Company type | Performance driver | ||
| ONEOK, Inc. | Midstream natural gas/natural gas liquids pipeline company | Announced NGL and natural gas expansion projects | ||
| Inter Pipeline Ltd. | Midstream crude oil pipeline company | Bid to acquire the company in corporate transaction | ||
| Phillips 66 Partners LP | Midstream refined product pipeline MLP | Eliminated incentive distribution rights (IDRs) | ||
| TC Energy Corporation | Midstream natural gas/natural gas liquids pipeline company | Asset sales leading to reduced leverage | ||
| Magellan Midstream Partners, L.P. | Midstream refined product pipeline MLP | Strong 2Q earnings results and increased 2019 financial guidance | ||
| Bottom five contributors | Company type | Performance driver | ||
| Antero Midstream Corporation | Natural gas pipeline company | Concern around parent (AR) financial health | ||
| Tallgrass Energy LP | Midstream natural gas/natural gas liquids pipeline company | Pipeline re-contracting rate uncertainty | ||
| Equitrans Midstream Corporation | Midstream natural gas/natural gas liquids pipeline company | Uncertainty around Mountain Valley Pipeline project | ||
| EnLink Midstream, LLC | Midstream gathering and processing company | Concern around producers slowing drilling activity in Oklahoma | ||
| Enbridge Inc. | Midstream crude oil pipeline company | Higher leverage leading to divestitures and regulation uncertainty on pipeline project |
Unlike the fund return, index return is pre-expenses.
Performance data quoted represent past performance; past performance does not guarantee future results. Like any other stock, total return and market value will fluctuate so that an investment, when sold, may be worth more or less than its original cost. Portfolio composition is subject to change due to ongoing management of the fund. References to specific securities or sectors should not be construed as a recommendation by the fund or its adviser. See Schedule of Investments for portfolio weighting at the end of the fiscal quarter.
(unaudited)
| Tortoise | 11 |
| Tortoise |
| Pipeline & Energy Fund, Inc. (TTP) (continued) |
Fund structure and distribution policy
The fund is structured to qualify as a Regulated Investment Company (RIC) allowing it to pass-through to shareholders income and capital gains earned, thus avoiding double-taxation. To qualify as a RIC, the fund must meet specific income, diversification and distribution requirements. Regarding income, at least 90 percent of the fund’s gross income must be from dividends, interest and capital gains. The fund must meet quarterly diversification requirements including the requirement that at least 50 percent of the assets be in cash, cash equivalents or other securities with each single issuer of other securities not greater than 5 percent of total assets. No more than 25 percent of total assets can be invested in any one issuer other than government securities or other RIC’s. The fund must also distribute at least 90 percent of its investment company income. RIC’s are also subject to excise tax rules which require RIC’s to distribute approximately 98 percent of net income and net capital gains to avoid a 4 percent excise tax.
The fund has adopted a distribution policy which is included on the inside front cover of this report. To summarize, the fund intends to distribute an amount closely approximating the total taxable income for the year and, if so determined by the Board, distribute all or a portion of the return of capital paid by portfolio companies during the year. The fund may designate a portion of its distributions as capital gains and may also distribute additional capital gains in the last calendar quarter of the year to meet annual excise distribution requirements. Distribution amounts are subject to change from time to time at the discretion of the Board. Although the level of distributions is independent of the funds’ performance in the short term, the fund expects such distributions to correlate with its performance over time.
Distributable cash flow and distributions
Distributable cash flow (DCF) is income from investments less expenses. Income from investments includes the amount received as cash or paid-in-kind distributions from common stock, master limited partnerships (MLPs), affiliates of MLPs, and pipeline and other energy companies in which the fund invests, and dividend payments on short-term investments. Income also includes the premiums received from sales of covered call options, net of amounts paid to buy back out-of-the-money options. The total expenses include current or anticipated operating expenses and leverage costs.
Income from investments decreased approximately 3.7% as compared to 2nd quarter 2019, primarily due to merger and acquisition activity within the fund’s portfolio as well as lower premiums from covered call options. Operating expenses, consisting primarily of fund advisory fees, decreased approximately 6.6% during the quarter, primarily due to lower asset-based fees. Leverage costs decreased 3.2% as compared to 2nd quarter 2019 primarily as a result of a decrease in interest rates during the quarter. As a result of the changes in income and expenses, DCF decreased approximately 3.6% as compared to 2nd quarter 2019. In addition, the fund had net realized losses on investments of $2.7 million during 3rd quarter 2019. The fund paid a quarterly distribution of $0.285 per share, a decrease of 30.1% from the prior quarter and 3rd quarter 2018. The fund has generated a significant amount of investment income from investing in oil and gas producers. The continued weak stock price performance of oil and gas producers made generating the historical level of covered call income unachievable and resulted in elevated fund leverage. We believe that the new distribution level will provide the portfolio management team more flexibility to manage the fund for long-term distribution sustainability, allow for an improved leverage profile and provide a better balance between distributions and capital appreciation with less reliance on covered call writing to generate income. The fund has paid cumulative distributions to stockholders of $12.8275 per share since its inception in October 2011.
The Key Financial Data table discloses the calculation of DCF and should be read in conjunction with this discussion. The difference between income from investments in the DCF calculation and total investment income as reported in the Statement of Operations, is reconciled as follows: (1) the Statement of Operations, in conformity with U.S. generally accepted accounting principles (GAAP), recognizes distributions and dividend income from MLPs, common stock and other investments on their ex-dates, whereas the DCF calculation may reflect distributions and dividend income on their pay dates; (2) GAAP recognizes that a significant portion of the cash distributions received from MLPs, common stock and other investments are characterized as a return of capital and therefore excluded from investment income, whereas the DCF calculation includes the return of capital; (3) income from investments in the DCF calculation includes the value of dividends paid-in-kind (additional stock or units), whereas such amounts may not be included as income for GAAP purposes; and (4) net premiums on options written (premiums received less amounts paid to buy back out-of-the-money options) with expiration dates during the fiscal quarter are included in the DCF calculation, whereas GAAP recognizes the net effect of options written as realized and unrealized gains (losses).
“Net Investment Income (Loss)” on the Statement of Operations is adjusted as follows to reconcile to DCF for YTD and 3rd quarter 2019 (in thousands):
| YTD 2019 | 3rd Qtr 2019 | |||||||
| Net Investment Loss | $ | (1,165 | ) | $ | (183 | ) | ||
| Adjustments to reconcile to DCF: | ||||||||
| Net premiums on options written | 3,139 | 967 | ||||||
| Distributions characterized as return of capital |
8,512 | 2,720 | ||||||
| Other | 192 | 64 | ||||||
| DCF | $ | 10,678 | $ | 3,568 | ||||
Leverage
The fund’s leverage utilization decreased by $1.6 million during 3rd quarter 2019 and represented 29.7% of total assets at August 31, 2019. The fund has maintained compliance with its applicable coverage ratios. At quarter-end, approximately 72% of the leverage cost was fixed, the weighted-average maturity was 3.1 years and the weighted-average annual rate on leverage was 3.93%. These rates will vary in the future as a result of changing floating rates, utilization of the fund’s credit facility and as leverage matures or is redeemed.
Please see the Financial Statements and Notes to Financial Statements for additional detail regarding critical accounting policies, results of operations, leverage and other important fund information.
For further information regarding the calculation of distributable cash flow and distributions to stockholders, as well as a discussion of the tax impact on distributions, please visit www.tortoiseadvisors.com.
| (unaudited) | |
| 12 | Tortoise |
| 2019 3rd Quarter Report | August 31, 2019 |
| TTP Key Financial Data (supplemental unaudited information) |
| (dollar amounts in thousands unless otherwise indicated) |
The information presented below regarding Distributable Cash Flow and Selected Financial Information is supplemental non-GAAP financial information, which the fund believes is meaningful to understanding operating performance. The Distributable Cash Flow Ratios include the functional equivalent of EBITDA for non-investment companies, and the fund believes they are an important supplemental measure of performance and promote comparisons from period-to-period. This information is supplemental, is not inclusive of required financial disclosures (e.g. Total Expense Ratio), and should be read in conjunction with the full financial statements.
| 2018 | 2019 | |||||||||||||||||||
| Q3(1) | Q4(1) | Q1(1) | Q2(1) | Q3(1) | ||||||||||||||||
| Total Income from Investments | ||||||||||||||||||||
| Dividends and distributions from investments, | ||||||||||||||||||||
| net of foreign taxes withheld | $ | 3,716 | $ | 3,649 | $ | 3,617 | $ | 4,032 | $ | 3,905 | ||||||||||
| Dividends paid in kind | 497 | 422 | 53 | 54 | 62 | |||||||||||||||
| Net premiums on options written | 1,235 | 1,154 | 1,133 | 1,039 | 967 | |||||||||||||||
| Total from investments | 5,448 | 5,225 | 4,803 | 5,125 | 4,934 | |||||||||||||||
| Operating Expenses Before Leverage Costs | ||||||||||||||||||||
| Advisory fees, net of fees waived | 734 | 696 | 606 | 643 | 602 | |||||||||||||||
| Other operating expenses | 159 | 147 | 146 | 149 | 138 | |||||||||||||||
| 893 | 843 | 752 | 792 | 740 | ||||||||||||||||
| Distributable cash flow before leverage costs | 4,555 | 4,382 | 4,051 | 4,333 | 4,194 | |||||||||||||||
| Leverage costs(2) | 658 | 668 | 641 | 633 | 626 | |||||||||||||||
| Distributable Cash Flow(3) | $ | 3,897 | $ | 3,714 | $ | 3,410 | $ | 3,700 | $ | 3,568 | ||||||||||
| Net realized gain (loss) on investments and foreign | ||||||||||||||||||||
| currency translation, for the period | $ | 826 | $ | (596 | ) | $ | (6,959 | ) | $ | (5,479 | ) | $ | (2,745 | ) | ||||||
| As a percent of average total assets(4) | ||||||||||||||||||||
| Total from investments | 8.16 | % | 8.29 | % | 8.73 | % | 8.84 | % | 8.96 | % | ||||||||||
| Operating expenses before leverage costs | 1.34 | % | 1.34 | % | 1.37 | % | 1.37 | % | 1.34 | % | ||||||||||
| Distributable cash flow before leverage costs | 6.82 | % | 6.95 | % | 7.36 | % | 7.47 | % | 7.62 | % | ||||||||||
| As a percent of average net assets(4) | ||||||||||||||||||||
| Total from investments | 11.09 | % | 11.43 | % | 12.16 | % | 11.97 | % | 12.63 | % | ||||||||||
| Operating expenses before leverage costs | 1.82 | % | 1.84 | % | 1.90 | % | 1.85 | % | 1.89 | % | ||||||||||
| Leverage costs | 1.34 | % | 1.46 | % | 1.62 | % | 1.48 | % | 1.60 | % | ||||||||||
| Distributable cash flow | 7.93 | % | 8.13 | % | 8.64 | % | 8.64 | % | 9.14 | % | ||||||||||
| Selected Financial Information | ||||||||||||||||||||
| Distributions paid on common stock | $ | 4,082 | $ | 4,082 | $ | 4,082 | $ | 4,081 | $ | 2,855 | ||||||||||
| Distributions paid on common stock per share | 0.4075 | 0.4075 | 0.4075 | 0.4075 | 0.2850 | |||||||||||||||
| Total assets, end of period(5) | 268,532 | 235,259 | 227,676 | 222,673 | 207,072 | |||||||||||||||
| Average total assets during period(5)(6) | 264,986 | 252,876 | 223,114 | 229,950 | 218,436 | |||||||||||||||
| Leverage(7) | 70,800 | 69,800 | 61,800 | 63,100 | 61,500 | |||||||||||||||
| Leverage as a percent of total assets | 26.4 | % | 29.7 | % | 27.1 | % | 28.3 | % | 29.7 | % | ||||||||||
| Net unrealized depreciation, end of period | (6,280 | ) | (34,897 | ) | (23,375 | ) | (19,404 | ) | (28,190 | ) | ||||||||||
| Net assets, end of period | 196,073 | 163,202 | 163,313 | 157,061 | 143,463 | |||||||||||||||
| Average net assets during period(8) | 194,846 | 183,386 | 160,184 | 169,837 | 155,032 | |||||||||||||||
| Net asset value per common share | 19.58 | 16.29 | 16.30 | 15.68 | 14.32 | |||||||||||||||
| Market value per common share | 17.73 | 14.33 | 14.63 | 14.02 | 12.84 | |||||||||||||||
| Shares outstanding (000’s) | 10,016 | 10,016 | 10,016 | 10,016 | 10,016 | |||||||||||||||
| (1) |
Q1 is the period from December through February. Q2 is the period from March through May. Q3 is the period from June through August. Q4 is the period from September through November. |
| (2) |
Leverage costs include interest expense, distributions to preferred stockholders and other recurring leverage expenses. |
| (3) |
"Net investment income (loss)" on the Statement of Operations is adjusted as follows to reconcile to Distributable Cash Flow ("DCF"): increased by net premiums on options written, the return of capital on distributions, the dividends paid in stock and increased liquidation value, the premium on dividends paid in kind and amortization of debt issuance costs. |
| (4) |
Annualized. |
| (5) |
Includes deferred issuance and offering costs on senior notes and preferred stock. |
| (6) | Computed by averaging month-end values within each period. |
| (7) |
Leverage consists of senior notes, preferred stock and outstanding borrowings under the revolving credit facility. |
| (8) |
Computed by averaging daily net assets within each period. |
| Tortoise | 13 |
| Tortoise |
| Energy Independence Fund, Inc. (NDP) |
Fund description
NDP seeks a high level of total return with an emphasis on current distributions paid to stockholders. NDP invests primarily in equity securities of upstream North American energy companies that engage in the exploration and production of crude oil, condensate, natural gas and natural gas liquids that generally have a significant presence in North American oil and gas fields, including shale reservoirs.
Fund performance review
The oil market continued its myopic focus on the trade war driving pressure on demand growth. Escalating tensions in the Middle East, mounting worldwide supply outages and positive news out of both the G20 Summit and OPEC+ meeting barely elicited a crude oil price response. As such, crude oil prices, represented by West Texas Intermediate (WTI), began the fiscal quarter at $53.50 per barrel, peaked at $60.43 on July 10, 2019, troughed at $51.09 on Aug. 7, 2019 and ended the fiscal quarter close to its start at $55.10. The fund’s market-based and NAV-based returns for the fiscal quarter ending August 31, 2019 were -44.8% and -23.8%, respectively (including the reinvestment of distributions). Comparatively, the Tortoise North American Oil and Gas Producers IndexSM returned -11.7% for the same period.
| Third fiscal quarter highlights | ||
| Distributions paid per share | $0.1000 | |
| Distribution rate (as of 08/31/2019) | 10.0% | |
| Quarter-over-quarter distribution increase (decrease) | (77.1)% | |
| Year-over-year distribution increase (decrease) | (77.1)% | |
| Cumulative distributions paid per share to | ||
| stockholders since inception in July 2012 | $11.9125 | |
| Market-based total return | (44.8)% | |
| NAV-based total return | (23.8)% | |
| Premium (discount) to NAV (as of 08/31/2019) | (9.7)% |
The fund utilizes a covered call strategy, which seeks to generate income while reducing overall volatility. The premium income generated from this strategy helped to lower NAV volatility during the quarter. The notional amount of the fund’s covered calls averaged approximately 97% of total assets and their out-of-the-money percentage at the time written averaged approximately 10% during the fiscal quarter.
Key asset performance drivers
| Top five contributors | Company type | Performance driver | ||
| Noble Energy Inc. | Oil and gas production | Accelerated free cash flow generation outlook | ||
| Marathon Petroleum Corp. | Downstream refiner | Corporate positive action unlocked midstream value | ||
| Targa Resources Corp. – Preferred Shares | Midstream gathering and processing company | Preferred security that experienced less volatility than common stocks | ||
| Viper Energy Partners LP | Oil and gas production | Increased dividend and announced an accretive acquisition | ||
| Parsley Energy, Inc. | Upstream oil and gas producer | Improving crude oil prices and well economics of wells drilled in the Permian Basin as well as an acquisition significantly expanded Permian Basin acreage | ||
| Bottom five contributors | Company type | Performance driver | ||
| EQT Corp. | Upstream natural gas producer | Low absolute natural gas prices caused concerns for growth outlook of Marcellus producers | ||
| Cabot Oil & Gas Corp. | Upstream natural gas producer | Low absolute natural gas prices caused concerns for growth outlook of Marcellus producers | ||
| Range Resources Corp. | Upstream natural gas producer | Low absolute natural gas prices caused concerns for growth outlook of Marcellus producers | ||
| Antero Resources Corp. | Upstream oil and natural gas producer |
Low absolute natural gas prices caused concerns for growth outlook of Marcellus producers | ||
| Concho Resources Inc. | Upstream liquids producer |
Unexpected operational challenge tied to well spacing |
Unlike the fund return, index return is pre-expenses.
Performance data quoted represent past performance: past performance does not guarantee future results. Like any other stock, total return and market value will fluctuate so that an investment, when sold, may be worth more or less than its original cost. Portfolio composition is subject to change due to ongoing management of the fund. References to specific securities or sectors should not be construed as a recommendation by the fund or its adviser. See Schedule of Investments for portfolio weighting at the end of the fiscal quarter.
| (unaudited) | |
| 14 | Tortoise |
| 2019 3rd Quarter Report | August 31, 2019 |
Fund structure and distribution policy
The fund is structured to qualify as a Regulated Investment Company (RIC) allowing it to pass-through to shareholders income and capital gains earned, thus avoiding double-taxation. To qualify as a RIC, the fund must meet specific income, diversification and distribution requirements. Regarding income, at least 90 percent of the fund’s gross income must be from dividends, interest and capital gains. The fund must meet quarterly diversification requirements including the requirement that at least 50 percent of the assets be in cash, cash equivalents or other securities with each single issuer of other securities not greater than 5 percent of total assets. No more than 25 percent of total assets can be invested in any one issuer other than government securities or other RIC’s. The fund must also distribute at least 90 percent of its investment company income. RIC’s are also subject to excise tax rules which require RIC’s to distribute approximately 98 percent of net income and net capital gains to avoid a 4 percent excise tax.
The fund has adopted a distribution policy which intends to distribute an amount closely approximating the total taxable income for the year and, if so determined by the Board, distribute all or a portion of the return of capital paid by portfolio companies during the year. The fund may designate a portion of its distributions as capital gains and may also distribute additional capital gains in the last calendar quarter of the year to meet annual excise distribution requirements. Distribution amounts are subject to change from time to time at the discretion of the Board. Although the level of distributions is independent of the funds’ performance in the short term, the fund expects such distributions to correlate with its performance over time.
Distributable cash flow and distributions
Distributable cash flow (DCF) is income from investments less expenses. Income from investments includes the amount received as cash or paid-in-kind distributions from investments and dividend payments on short-term investments. Income also includes the premiums received from sales of covered call options, net of amounts paid to buy back out-of-the-money options. The total expenses include current or anticipated operating expenses and leverage costs.
Income from investments decreased approximately 0.9% as compared to 2nd quarter 2019, primarily due to decreased premiums received on written covered call options. Operating expenses, consisting primarily of fund advisory fees, decreased approximately 23.3% during the quarter due primarily to lower asset-based fees. Total leverage costs decreased approximately 16.6% as compared to 2nd quarter 2019, primarily due to lower average leverage utilization during the quarter. As a result of the changes in income and expenses, DCF increased by approximately 2.9% as compared to 2nd quarter 2019. In addition, the fund had net realized losses on investments of $31.2 million during 3rd quarter 2019.
The fund paid a distribution of $0.10 per share during 3rd quarter 2019, a decrease of 77.1% from the prior quarter and 3rd quarter 2018. The fund has generated a significant amount of investment income from investing in oil and gas producers. The continued weak stock price performance of oil and gas producers made generating the historical level of covered call income unachievable and resulted in elevated fund leverage. In addition, the fund revised its non-fundamental investment policy to reduce the threshold level invested in equity securities of upstream energy companies from at least 70% of total assets to at least 50%. We believe that the new distribution level and revised investment policy will provide the portfolio management team more flexibility to manage the fund for long-term distribution sustainability, allow for an improved leverage profile, and provide a better balance between distributions and capital appreciation with less reliance on covered call writing to generate income. The fund has paid cumulative distributions to stockholders of $11.9125 per share since its inception in July 2012.
The Key Financial Data table discloses the calculation of DCF and should be read in conjunction with this discussion. The difference between income from investments in the DCF calculation and total investment income as reported in the Statement of Operations, is reconciled as follows: (1) the Statement of Operations, in conformity with U.S. generally accepted accounting principles (GAAP), recognizes distributions and dividend income from MLPs, common stock and other investments on their ex-dates, whereas the DCF calculation may reflect distributions and dividend income on their pay dates; (2) GAAP recognizes that a significant portion of the cash distributions received from MLPs, common stock and other investments are characterized as a return of capital and therefore excluded from investment income, whereas the DCF calculation includes the return of capital; (3) income from investments in the DCF calculation includes the value of dividends paid-in-kind (additional stock or units), whereas such amounts may not be included as income for GAAP purposes; and (4) net premiums on options written (premiums received less amounts paid to buy back out-of-the-money options) with expiration dates during fiscal quarter are included in the DCF calculation, whereas GAAP recognizes the net effect of options written as realized and unrealized gains (losses).
“Net Investment Income (Loss)” on the Statement of Operations is adjusted as follows to reconcile to DCF for YTD and 3rd quarter 2019 (in thousands):
| YTD 2019 | 3rd Qtr 2019 | |||||||
| Net Investment Loss | $ | (1,557 | ) | $ | (246 | ) | ||
| Adjustments to reconcile to DCF: | ||||||||
| Net premiums on options written | 15,330 | 5,085 | ||||||
| Distributions characterized | ||||||||
| as return of capital | 1,177 | 67 | ||||||
| DCF | $ | 14,950 | $ | 4,906 | ||||
Leverage
The fund’s leverage utilization decreased $5.9 million as compared to 2nd quarter 2019. The fund utilizes all floating rate leverage that had an interest rate of 2.89% and represented 30.2% of total assets at quarter-end. The fund has maintained compliance with its applicable coverage ratios. The interest rate on the fund’s leverage will vary in the future along with changing floating rates.
Please see the Financial Statements and Notes to Financial Statements for additional detail regarding critical accounting policies, results of operations, leverage and other important fund information.
For further information regarding the calculation of distributable cash flow and distributions to stockholders, as well as a discussion of the tax impact on distributions, please visit www.tortoiseadvisors.com.
| (unaudited) | |
| Tortoise | 15 |
| NDP Key Financial Data (supplemental unaudited information) |
| (dollar amounts in thousands unless otherwise indicated) |
The information presented below regarding Distributable Cash Flow and Selected Financial Information is supplemental non-GAAP financial information, which the fund believes is meaningful to understanding operating performance. The Distributable Cash Flow Ratios include the functional equivalent of EBITDA for non-investment companies, and the fund believes they are an important supplemental measure of performance and promote comparisons from period-to-period. This information is supplemental, is not inclusive of required financial disclosures (e.g. Total Expense Ratio), and should be read in conjunction with the full financial statements.
| 2018 | 2019 | |||||||||||||||||||
| Q3(1) | Q4(1) | Q1(1) | Q2(1) | Q3(1) | ||||||||||||||||
| Total Income from Investments | ||||||||||||||||||||
| Distributions and dividends from investments, | ||||||||||||||||||||
| net of foreign taxes withheld | $ | 1,139 | $ | 1,167 | $ | 1,250 | $ | 394 | $ | 538 | ||||||||||
| Dividends paid in stock | 229 | 152 | — | — | — | |||||||||||||||
| Net premiums on options written | 6,870 | 6,400 | 4,966 | 5,279 | 5,085 | |||||||||||||||
| Total from investments | 8,238 | 7,719 | 6,216 | 5,673 | 5,623 | |||||||||||||||
| Operating Expenses Before Leverage Costs | ||||||||||||||||||||
| Advisory fees, net of fees waived | 671 | 613 | 437 | 421 | 315 | |||||||||||||||
| Other operating expenses | 147 | 134 | 133 | 133 | 110 | |||||||||||||||
| 818 | 747 | 570 | 554 | 425 | ||||||||||||||||
| Distributable cash flow before leverage costs | 7,420 | 6,972 | 5,646 | 5,119 | 5,198 | |||||||||||||||
| Leverage costs(2) | 462 | 486 | 371 | 350 | 292 | |||||||||||||||
| Distributable Cash Flow(3) | $ | 6,958 | $ | 6,486 | $ | 5,275 | $ | 4,769 | $ | 4,906 | ||||||||||
| Net realized gain (loss) on investments and foreign | ||||||||||||||||||||
| currency translation, for the period | $ | 6,433 | $ | (2,031 | ) | $ | (37,544 | ) | $ | (17,350 | ) | $ | (31,152 | ) | ||||||
| As a percent of average total assets(4) | ||||||||||||||||||||
| Total from investments | 13.23 | % | 13.91 | % | 15.48 | % | 15.12 | % | 19.20 | % | ||||||||||
| Operating expenses before leverage costs | 1.31 | % | 1.35 | % | 1.42 | % | 1.48 | % | 1.45 | % | ||||||||||
| Distributable cash flow before leverage costs | 11.92 | % | 12.56 | % | 14.06 | % | 13.64 | % | 17.75 | % | ||||||||||
| As a percent of average net assets(4) | ||||||||||||||||||||
| Total from investments | 18.25 | % | 19.29 | % | 21.38 | % | 20.05 | % | 28.01 | % | ||||||||||
| Operating expenses before leverage costs | 1.81 | % | 1.87 | % | 1.96 | % | 1.96 | % | 2.12 | % | ||||||||||
| Leverage costs | 1.02 | % | 1.21 | % | 1.28 | % | 1.24 | % | 1.45 | % | ||||||||||
| Distributable cash flow | 15.42 | % | 16.21 | % | 18.14 | % | 16.85 | % | 24.44 | % | ||||||||||
| Selected Financial Information | ||||||||||||||||||||
| Distributions paid on common stock | $ | 6,402 | $ | 6,414 | $ | 6,430 | $ | 6,445 | $ | 1,477 | ||||||||||
| Distributions paid on common stock per share | 0.4375 | 0.4375 | 0.4375 | 0.4375 | 0.1000 | |||||||||||||||
| Total assets, end of period | 242,150 | 191,285 | 156,648 | 123,229 | 95,078 | |||||||||||||||
| Average total assets during period(5) | 246,956 | 222,541 | 162,807 | 148,821 | 116,182 | |||||||||||||||
| Leverage(6) | 65,200 | 57,100 | 42,400 | 34,600 | 28,700 | |||||||||||||||
| Leverage as a percent of total assets | 26.9 | % | 29.9 | % | 27.1 | % | 28.1 | % | 30.2 | % | ||||||||||
| Net unrealized depreciation, end of period | (15,314 | ) | (50,328 | ) | (28,074 | ) | (27,092 | ) | (21,503 | ) | ||||||||||
| Net assets, end of period | 172,423 | 132,488 | 111,490 | 87,720 | 65,322 | |||||||||||||||
| Average net assets during period(7) | 179,054 | 160,534 | 117,918 | 112,274 | 79,655 | |||||||||||||||
| Net asset value per common share | 11.76 | 9.02 | 7.57 | 5.94 | 4.42 | |||||||||||||||
| Market value per common share | 12.69 | 9.00 | 8.08 | 7.40 | 3.99 | |||||||||||||||
| Shares outstanding (000’s) | 14,660 | 14,696 | 14,733 | 14,768 | 14,768 | |||||||||||||||
| (1) |
Q1 is the period from December through February. Q2 is the period from March through May. Q3 is the period from June through August. Q4 is the period from September through November. |
| (2) |
Leverage costs include interest expense and other recurring leverage expenses. |
| (3) |
"Net investment income (loss)" on the Statement of Operations is adjusted as follows to reconcile to Distributable Cash Flow ("DCF"): increased by net premiums on options written, the return of capital on distributions the distributions paid in stock and the premium on dividends paid in kind. |
| (4) |
Annualized. |
| (5) |
Computed by averaging month-end values within each period. |
| (6) |
Leverage consists of outstanding borrowings under the revolving credit facility. |
| (7) |
Computed by averaging daily net assets within each period. |
| 16 | Tortoise |
| 2019 3rd Quarter Report | August 31, 2019 |
| Tortoise |
| Power and Energy Infrastructure Fund, Inc. (TPZ) |
Fund description
TPZ seeks to provide a high level of current income to stockholders, with a secondary objective of capital appreciation. TPZ seeks to invest primarily in fixed income and dividend-paying equity securities of power and energy infrastructure companies that provide stable and defensive characteristics throughout economic cycles.
Fund performance review
Midstream energy performance was slightly better than broader energy for the third fiscal quarter. As the era of simplification comes to a close, the results have advanced the midstream sector and accomplished widespread cost of capital and corporate governance improvements. The fund’s market-based and NAV-based returns for the fiscal quarter ending August 31, 2019 were 1.7% and -2.8%, respectively (including the reinvestment of distributions). Comparatively, the TPZ Benchmark Composite* returned 3.7% for the same period. The fund’s fixed income holdings outperformed its equity holdings on a total return basis.
| Third fiscal quarter highlights | ||
| Monthly distributions paid per share | $0.1250 | |
| Distribution rate (as of 8/31/2019) | 8.3% | |
| Quarter-over-quarter distribution increase | 0.0% | |
| Year-over-year distribution increase | 0.0% | |
| Cumulative distribution to stockholders | ||
| since inception in July 2009 | $16.4000 | |
| Market-based total return | 1.7% | |
| NAV-based total return | (2.8)% | |
| Premium (discount) to NAV (as of 8/31/2019) | (5.1)% |
| * | The TPZ Benchmark Composite includes the BofA Merrill Lynch U.S. Energy Index (CIEN), the BofA Merrill Lynch U.S. Electricity Index (CUEL) and the Tortoise MLP Index® (TMLP). It is comprised of a blend of 70% fixed income and 30% equity securities issued by companies in the power and energy infrastructure sectors. |
Please refer to the inside front cover of the report for important information about the fund’s distribution policy.
Key asset performance drivers
| Top five contributors | Company type | Performance driver | ||
| ONEOK, Inc. | Midstream natural gas/natural gas liquids pipeline company | Announced NGL and natural gas expansion projects | ||
| Enbridge Inc. (fixed income) | Midstream crude oil pipeline company | Successful efforts to reduce leverage | ||
| TransCanada Corporation (fixed income) | Midstream natural gas/natural gas liquids pipeline company | Regulated business model and defensive fixed income security | ||
| NextEra Energy, Inc. (fixed income) | Power | Regulated business model with renewable growth | ||
| Magellan Midstream Partners, L.P. | Midstream refined product pipeline MLP | Strong 2Q earnings results and increased 2019 financial guidance | ||
| Bottom five contributors | Company type | Performance driver | ||
| Antero Midstream Corporation | Natural gas pipeline company | Concern around parent (AR) financial health | ||
| Tallgrass Energy LP | Midstream natural gas/natural gas liquids pipeline company | Pipeline re-contracting rate uncertainty | ||
| Western Midstream Partners LP | Midstream gathering and processing company | Finalizing simplification of General Partner (GP) Limited Partner (LP) | ||
| Equitrans Midstream Corporation | Midstream natural gas/natural gas liquids pipeline company | Uncertainty around Mountain Valley Pipeline project | ||
| EnLink Midstream, LLC | Midstream gathering and processing company | Concern around producers slowing drilling activity in Oklahoma |
Unlike the fund return, index return is pre-expenses.
Performance data quoted represent past performance; past performance does not guarantee future results. Like any other stock, total return and market value will fluctuate so that an investment, when sold, may be worth more or less than its original cost. Portfolio composition is subject to change due to ongoing management of the fund. References to specific securities or sectors should not be construed as a recommendation by the fund or its adviser. See Schedule of Investments for portfolio weighting at the end of the fiscal quarter.
| (unaudited) | |
| Tortoise | 17 |
| Tortoise |
| Power and Energy Infrastructure Fund, Inc. (TPZ) (continued) |
Fund structure and distribution policy
The fund is structured to qualify as a Regulated Investment Company (RIC) allowing it to pass-through to shareholders income and capital gains earned, thus avoiding double-taxation. To qualify as a RIC, the fund must meet specific income, diversification and distribution requirements. Regarding income, at least 90 percent of the fund gross income must be from dividends, interest and capital gains. The fund must meet quarterly diversification requirements including the requirement that at least 50 percent of the assets be in cash, cash equivalents or other securities with each single issuer of other securities not greater than 5 percent of total assets. No more than 25 percent of total assets can be invested in any one issuer other than government securities or other RIC’s. The fund must also distribute at least 90 percent of its investment company income. RIC’s are also subject to excise tax rules which require RIC’s to distribute approximately 98 percent of net income and net capital gains to avoid a 4 percent excise tax.
The fund has adopted a distribution policy which is included on the inside front cover of this report. To summarize, the fund intends to distribute an amount closely approximating the total taxable income for the year and, if so determined by the Board, distribute all or a portion of the return of capital paid by portfolio companies during the year. The fund may designate a portion of its distributions as capital gains and may also distribute additional capital gains in the last calendar quarter of the year to meet annual excise distribution requirements. Distribution amounts are subject to change from time to time at the discretion of the Board. Although the level of distributions is independent of the funds’ performance in the short term, the fund expects such distributions to correlate with its performance over time.
Distributable cash flow and distributions
Distributable cash flow (DCF) is income from investments less expenses. Income from investments includes the accrued interest from corporate bonds, cash distributions and paid-in-kind distributions from master limited partnerships (MLPs) and other equity investments and dividends earned from short-term investments. The total expenses include current or anticipated operating expenses and leverage costs.
Income from investments decreased slightly as compared to 2nd quarter 2019 due primarily to merger and acquisition activity, mostly offset by trading activity and increased distributions from investments within the fund’s portfolio. Operating expenses, consisting primarily of fund advisory fees, decreased approximately 3.9% during the quarter due primarily to lower asset-based fees. Total leverage costs decreased approximately 5.7% as compared to 2nd quarter 2019, primarily due to lower interest rates during the quarter. As a result of the changes in income and expenses, DCF increased approximately 1.8% as compared to 2nd quarter 2019. In addition, the fund had net realized gains on investments of $0.1 million during 3rd quarter 2019.
The fund paid monthly distributions of $0.125 per share during 3rd quarter 2019, which was unchanged over the prior quarter and 3rd quarter 2018. The fund’s Board of Directors has declared monthly distributions of $0.125 per share to be paid during 4th quarter 2019. The fund has paid cumulative distributions to stockholders of $16.40 per share since its inception in July 2009.
The Key Financial Data table discloses the calculation of DCF and should be read in conjunction with this discussion. The difference between income from investments in the DCF calculation and total investment income as reported in the Statement of Operations, is reconciled as follows: (1) U.S. generally accepted accounting principles (GAAP), recognizes distribution income from MLPs, common stock and other investments on their ex-dates, whereas the DCF calculation may reflect distribution income on their pay dates; (2) GAAP recognizes that a significant portion of the cash distributions received from MLPs, common stock and other investments are characterized as a return of capital and therefore excluded from investment income, whereas the DCF calculation includes the return of capital; (3) income from investments in the DCF calculation includes the value of dividends paid-in-kind (additional stock or units), whereas such amounts may not be included as income for GAAP purposes; and (4) amortization of premium or discount for all securities is calculated using the yield to worst methodology for GAAP purposes while yield to call is used in calculating amortization for long-dated hybrid securities in the DCF calculation. The treatment of expenses in the DCF calculation also differs from what is reported in the Statement of Operations. In addition to the total operating expenses, including fee waiver, as disclosed in the Statement of Operations, the DCF calculation reflects interest expense and realized and unrealized gains (losses) on interest rate swap settlements as leverage costs.
“Net Investment Income (Loss)” on the Statement of Operations is adjusted as follows to reconcile to DCF for YTD and 3rd quarter 2019 (in thousands):
| YTD 2019 | 3rd Qtr 2019 | |||||
| Net Investment Income | $ | 1,975 | $ | 691 | ||
| Adjustments to reconcile to DCF: | ||||||
| Distributions characterized | ||||||
| as return of capital | 4,672 | 1,568 | ||||
| Other | 187 | 60 | ||||
| DCF | $ | 6,834 | $ | 2,319 | ||
Leverage
The fund’s leverage utilization decreased $0.5 million as compared to 2nd quarter 2019 and represented 29.5% of total assets at August 31, 2019. The fund has maintained compliance with its applicable coverage ratios. At quarter-end, including the impact of interest rate swaps, approximately 70% of the leverage cost was fixed, the weighted-average maturity was 2.2 years and the weighted-average annual rate on leverage was 2.88%. These rates will vary in the future as a result of changing floating rates and as swaps mature or are redeemed.
Please see the Financial Statements and Notes to Financial Statements for additional detail regarding critical accounting policies, results of operations, leverage and other important fund information.
For further information regarding the calculation of distributable cash flow and distributions to stockholders, as well as a discussion of the tax impact on distributions, please visit www.tortoiseadvisors.com.
| (unaudited) | |
| 18 | Tortoise |
| 2019 3rd Quarter Report | August 31, 2019 |
| TPZ Key Financial Data (supplemental unaudited information) |
| (dollar amounts in thousands unless otherwise indicated) |
The information presented below regarding Distributable Cash Flow and Selected Financial Information is supplemental non-GAAP financial information, which the fund believes is meaningful to understanding operating performance. The Distributable Cash Flow Ratios include the functional equivalent of EBITDA for non-investment companies, and the fund believes they are an important supplemental measure of performance and promote comparisons from period-to-period. This information is supplemental, is not inclusive of required financial disclosures (e.g. Total Expense Ratio), and should be read in conjunction with the full financial statements.
| 2018 | 2019 | |||||||||||||||||||
| Q3(1) | Q4(1) | Q1(1) | Q2(1) | Q3(1) | ||||||||||||||||
| Total Income from Investments | ||||||||||||||||||||
| Interest earned on corporate bonds | $ | 1,342 | $ | 1,369 | $ | 1,357 | $ | 1,381 | $ | 1,368 | ||||||||||
| Distributions and dividends from investments, | ||||||||||||||||||||
| net of foreign taxes withheld | 1,713 | 1,654 | 1,841 | 1,909 | 1,907 | |||||||||||||||
| Dividends paid in kind | 348 | 284 | 39 | 40 | 47 | |||||||||||||||
| Total from investments | 3,403 | 3,307 | 3,237 | 3,330 | 3,322 | |||||||||||||||
| Operating Expenses Before Leverage Costs | ||||||||||||||||||||
| Advisory fees | 481 | 473 | 447 | 476 | 462 | |||||||||||||||
| Other operating expenses | 142 | 137 | 140 | 141 | 131 | |||||||||||||||
| 623 | 610 | 587 | 617 | 593 | ||||||||||||||||
| Distributable cash flow before leverage costs | 2,780 | 2,697 | 2,650 | 2,713 | 2,729 | |||||||||||||||
| Leverage costs(2) | 358 | 373 | 413 | 435 | 410 | |||||||||||||||
| Distributable Cash Flow(3) | $ | 2,422 | $ | 2,324 | $ | 2,237 | $ | 2,278 | $ | 2,319 | ||||||||||
| Net realized gain (loss) on investments and foreign | ||||||||||||||||||||
| currency translation, for the period | $ | 1,024 | $ | 3,996 | $ | (520 | ) | $ | 878 | $ | 94 | |||||||||
| As a percent of average total assets(4) | ||||||||||||||||||||
| Total from investments | 6.68 | % | 6.55 | % | 6.85 | % | 6.66 | % | 6.78 | % | ||||||||||
| Operating expenses before leverage costs | 1.22 | % | 1.21 | % | 1.24 | % | 1.23 | % | 1.21 | % | ||||||||||
| Distributable cash flow before leverage costs | 5.46 | % | 5.34 | % | 5.61 | % | 5.43 | % | 5.57 | % | ||||||||||
| As a percent of average net assets(4) | ||||||||||||||||||||
| Total from investments | 9.06 | % | 8.93 | % | 9.54 | % | 9.20 | % | 9.53 | % | ||||||||||
| Operating expenses before leverage costs | 1.66 | % | 1.65 | % | 1.73 | % | 1.70 | % | 1.70 | % | ||||||||||
| Leverage costs | 0.95 | % | 1.01 | % | 1.22 | % | 1.20 | % | 1.18 | % | ||||||||||
| Distributable cash flow | 6.45 | % | 6.27 | % | 6.59 | % | 6.30 | % | 6.65 | % | ||||||||||
| Selected Financial Information | ||||||||||||||||||||
| Distributions paid on common stock | $ | 2,606 | $ | 2,607 | $ | 2,607 | $ | 2,607 | $ | 2,606 | ||||||||||
| Distributions paid on common stock per share | 0.3750 | 0.3750 | 0.3750 | 0.3750 | 0.3750 | |||||||||||||||
| Total assets, end of period | 206,430 | 191,906 | 195,308 | 197,731 | 190,032 | |||||||||||||||
| Average total assets during period(5) | 201,985 | 200,269 | 191,512 | 198,360 | 194,528 | |||||||||||||||
| Leverage(6) | 53,200 | 53,400 | 53,800 | 56,600 | 56,100 | |||||||||||||||
| Leverage as a percent of total assets | 25.8 | % | 27.8 | % | 27.5 | % | 28.6 | % | 29.5 | % | ||||||||||
| Net unrealized appreciation, end of period | 20,917 | 3,956 | 9,850 | 9,939 | 5,062 | |||||||||||||||
| Net assets, end of period | 152,418 | 137,325 | 140,763 | 139,785 | 133,107 | |||||||||||||||
| Average net assets during period(7) | 149,026 | 146,848 | 137,573 | 143,596 | 138,251 | |||||||||||||||
| Net asset value per common share | 21.93 | 19.76 | 20.25 | 20.11 | 19.15 | |||||||||||||||
| Market value per common share | 19.40 | 17.17 | 17.97 | 18.25 | 18.17 | |||||||||||||||
| Shares outstanding (000’s) | 6,951 | 6,951 | 6,951 | 6,951 | 6,951 | |||||||||||||||
| (1) | Q1 is the period from December through February. Q2 is the period from March through May. Q3 is the period from June through August. Q4 is the period from September through November. |
| (2) | Leverage costs include interest expense, interest rate swap expenses and other recurring leverage expenses. |
| (3) | "Net investment income (loss)" on the Statement of Operations is adjusted as follows to reconcile to Distributable Cash Flow ("DCF"): increased by the return of capital on distributions, the dividends paid in stock and increased liquidation value and the premium on dividends paid in kind; and decreased by realized and unrealized gains (losses) on interest rate swap settlements. |
| (4) | Annualized. |
| (5) | Computed by averaging month-end values within each period. |
| (6) | Leverage consists of outstanding borrowings under the revolving credit facility. |
| (7) | Computed by averaging daily net assets within each period. |
| Tortoise | 19 |
| Tortoise |
| Essential Assets Income Term Fund (TEAF) |
Fund description
TEAF seeks to provide a high level of total return with an emphasis on current distributions. TEAF provides investors access to a combination of public and direct investments in essential assets that are making an impact on clients and communities.
Fund performance
We are pleased with the performance of much of the fund’s portfolio, however continue to be frustrated with the volatility in the energy infrastructure sleeve of the portfolio, which negatively impacted NAV during the fiscal quarter. We manage TEAF with a long-term focus and continue to believe the energy infrastructure companies in the fund will benefit from growing natural gas demand over the long and medium term. We continue to have conviction that TEAF’s investment strategy, investments in public and direct investments across social infrastructure, sustainable infrastructure and energy infrastructure, offer investors attractive total return potential while providing stable current income.
We have made great progress in transitioning the portfolio to the targeted allocation of 60% direct investments. As of Sept. 30, 2019, TEAF’s total direct investment commitments were approximately $85 million or approximately 30% of the portfolio. Additionally, we are very pleased to have completed the fund’s allocation to direct sustainable infrastructure investments. The direct investment pipeline remains robust and we anticipate achieving our goal of transitioning the portfolio to 60% direct investments within the first year.
Public Energy Infrastructure
| ● | Energy infrastructure equities were under pressure during the fiscal quarter as natural gas prices remained at depressed levels. |
| ● | Growing natural gas supply has outpaced demand resulting in weak prices in 2019, pressuring both natural gas producers and midstream companies that transport the commodity. |
| ● | We believe over the medium and long term, increasing natural gas demand from exports to Mexico and LNG to the rest of the world along with power generation will normalize prices in the $2.75 - $3.25 range, benefitting the equities in the portfolio. |
| ● | We have not lost conviction that natural gas, in addition to solar and wind, will be a winner in the global energy transition over the next decade and beyond. |
Private Energy Infrastructure
| ● | TEAF funded a preferred equity investment in a natural gas midstream operator in the Permian Basin during the fiscal quarter. |
| – | The deal was committed to in the second fiscal quarter, however it funded in June, during the third fiscal quarter. |
Public Sustainable Infrastructure
| ● | The fund’s global listed sustainable infrastructure securities performed extremely well during the fiscal quarter. |
| ● | Lower benchmark interest rates and a general risk-off environment during the fiscal quarter drove strong performance in integrated utilities equities. Additionally, TEAF’s investment in water infrastructure equities also performed well during the fiscal quarter due to lower benchmark rates and strong fundamental tailwinds in the sector. |
Private Sustainable Infrastructure
| ● | TEAF closed on additional direct sustainable infrastructure investments totaling approximately $18 million during the fiscal quarter. |
| – | Consistent with our strategy, the projects are backed by investment-grade counterparties under long-term Power Purchase Agreements (PPA). |
| – | In total, the projects have nameplate capacity of approximately 11 MW-DC and are located in Massachusetts and California. |
| ● | Additionally, in September after the third fiscal quarter, TEAF closed on an additional direct sustainable infrastructure investment totaling approximately $27 million. |
| – | The investment is in an approximately 11.1 MW-DC portfolio of 14 operating solar assets across Colorado, Florida, New Jersey and Puerto Rico with long-term fixed price PPA contracts, typically 15 – 25 years. |
| (unaudited) | |
| 20 | Tortoise |
| 2019 3rd Quarter Report | August 31, 2019 |
Social Infrastructure
| ● | TEAF closed on four social infrastructure investments during the fiscal quarter totaling approximately $16 million. |
| ● | One of the investments was in the senior housing sector: |
| – | Grace Commons Senior Living ($3.65 million) |
| ● | New senior living facility located in Wisconsin that is scheduled to open in October 2019 |
| ● | The facility features 179 total units and offers a full continuum of care, including independent living, assisted living and memory care |
| ● | Two of the investments were in the education sector: |
| – | Athenian Academy Charter School |
| ● | New Charter school located in Florida that is expected to serve approximately 300 students during the 2019–2020 school year |
| ● | Construction is progressing on a permanent facility that will ultimately have capacity for 1,145 students |
| – | Village Charter School |
| ● | Additional funding to an operating charter school in Idaho |
| ● | The school had 484 students enrolled in the most recent school year |
| ● | One investment was in project finance: |
| – | Debt investment to develop and construct a state-of-the art agricultural-based pulp manufacturing and molded fiber thermoforming facility |
| – | The facility is located in Tennessee and expected to be operational in 2Q 2020 |
Third fiscal quarter highlights
| Monthly distributions paid per share | $ | 0.1085 | |
| Distribution rate (as of 8/31/2019) | 8.0% | ||
| Quarter-over-quarter distribution increase | 0.0% | ||
| Year-over-year distribution increase | 0.0% | ||
| Cumulative distributions paid per share | |||
| to stockholders since inception in March 2019 | $ | 0.4340 | |
| Market-based total return | (10.3)% | ||
| NAV-based total return | (2.7)% | ||
| Premium (discount) to NAV (as of 8/31/2019) | (10.1)% |
Performance data quoted represent past performance; past performance does not guarantee future results. Like any other stock, total return and market value will fluctuate so that an investment, when sold, may be worth more or less than its original cost. Portfolio composition is subject to change due to ongoing management of the fund. References to specific securities or sectors should not be construed as a recommendation by the fund or its adviser. See Schedule of Investments for portfolio weighting at the end of the fiscal quarter.
| (unaudited) | |
| Tortoise | 21 |
| Tortoise |
| Essential Assets Income Term Fund (TEAF) (continued) |
Fund structure and distribution policy
The fund is structured to qualify as a Regulated Investment Company (RIC) allowing it to pass-through to shareholders income and capital gains earned, thus avoiding double-taxation. To qualify as a RIC, the fund must meet specific income, diversification and distribution requirements. Regarding income, at least 90 percent of the fund gross income must be from dividends, interest and capital gains. The fund must meet quarterly diversification requirements including the requirement that at least 50 percent of the assets be in cash, cash equivalents or other securities with each single issuer of other securities not greater than 5 percent of total assets. No more than 25 percent of total assets can be invested in any one issuer other than government securities or other RIC’s. The fund must also distribute at least 90 percent of its investment company income. RIC’s are also subject to excise tax rules which require RIC’s to distribute approximately 98 percent of net income and net capital gains to avoid a 4 percent excise tax.
The fund has adopted a distribution policy which intends to distribute an amount closely approximating the total taxable income for the year and, if so determined by the Board, distribute all or a portion of the return of capital paid by portfolio companies during the year. The fund may designate a portion of its distributions as capital gains and may also distribute additional capital gains in the last calendar quarter of the year to meet annual excise distribution requirements. Distribution amounts are subject to change from time to time at the discretion of the Board. Although the level of distributions is independent of the funds’ performance in the short term, the fund expects such distributions to correlate with its performance over time.
Distributable cash flow and distributions
DCF is income from investments less expenses. Income from investments includes the accrued interest from bonds, the amount received as cash or paid-in-kind distributions from investments and dividend payments on short-term investments. Income also includes the premiums received from sales of covered call options, net of amounts paid to buy back out-of-the-money options. The total expenses include current or anticipated operating expenses and leverage costs. Q3 2019 was the initial full quarter for the fund. In future reports, this section will provide comparative information as it relates to prior periods.
The fund paid monthly distributions of $0.1085 per share during 3rd quarter 2019. The fund’s Board of Directors has declared monthly distributions of $0.1085 per share to be paid during 4th quarter 2019. The fund has paid cumulative distributions to stockholders of $0.434 per share since its inception in March 2019.
The Key Financial Data table discloses the calculation of DCF and should be read in conjunction with this discussion. The difference between income from investments in the DCF calculation and total investment income as reported in the Statement of Operations, is reconciled as follows: (1) the Statement of Operations, in conformity with U.S. generally accepted accounting principles (GAAP), recognizes distributions and dividend income from MLPs, common stock and other investments on their ex-dates, whereas the DCF calculation may reflect distributions and dividend income on their pay dates; (2) GAAP recognizes that a significant portion of the cash distributions received from MLPs, common stock and other investments are characterized as a return of capital and therefore excluded from investment income, whereas the DCF calculation includes the return of capital; (3) income from investments in the DCF calculation includes the value of dividends paid-in-kind (additional stock or units), whereas such amounts may not be included as income for GAAP purposes; and (4) net premiums on options written (premiums received less amounts paid to buy back out-of-the-money options) with expiration dates during fiscal quarter are included in the DCF calculation, whereas GAAP recognizes the net effect of options written as realized and unrealized gains (losses).
“Net Investment Income (Loss)” on the Statement of Operations is adjusted as follows to reconcile to DCF for YTD 2019 and 3rd quarter 2019 (in thousands):
| YTD 2019 | 3rd Qtr 2019 | |||||
| Net Investment Income | $ | 3,553 | $ | 1,743 | ||
| Adjustments to reconcile to DCF: | ||||||
| Distributions characterized | ||||||
| as return of capital | 3,606 | 1,849 | ||||
| Net premiums on options written | 2,565 | 1,429 | ||||
| DCF | $ | 9,724 | $ | 5,021 | ||
Leverage
The fund’s leverage utilization was unchanged as compared to 2nd quarter 2019. The fund utilizes all floating rate leverage that had an interest rate of 2.89% and represented 11.4% of total assets at quarter-end. The fund has maintained compliance with its applicable coverage ratios. The interest rate on the fund’s leverage will vary in the future along with changing floating rates.
Please see the Financial Statements and Notes to Financial Statements for additional detail regarding critical accounting policies, results of operations, leverage and other important fund information.
For further information regarding the calculation of distributable cash flow and distributions to stockholders, as well as a discussion of the tax impact on distributions, please visit www.tortoiseadvisors.com.
| (unaudited) | |
| 22 | Tortoise |
| 2019 3rd Quarter Report | August 31, 2019 |
| TEAF Key Financial Data (supplemental unaudited information) |
| (dollar amounts in thousands unless otherwise indicated) |
The information presented below regarding Distributable Cash Flow and Selected Financial Information is supplemental non-GAAP financial information, which the fund believes is meaningful to understanding operating performance. The Distributable Cash Flow Ratios include the functional equivalent of EBITDA for non-investment companies, and the fund believes they are an important supplemental measure of performance and promote comparisons from period-to-period. This information is supplemental, is not inclusive of required financial disclosures (e.g. Total Expense Ratio), and should be read in conjunction with the full financial statements.
| 2019 | ||||||||
| Q2(1) | Q3(1) | |||||||
| Total Income from Investments | ||||||||
| Interest earned on corporate bonds | $ | 548 | $ | 1,164 | ||||
| Distributions and dividends from investments, net of foreign taxes withheld | 3,805 | 3,576 | ||||||
| Distributions paid in kind | — | 62 | ||||||
| Net premiums on options written | 1,137 | 1,428 | ||||||
| Total from investments | 5,490 | 6,230 | ||||||
| Operating Expenses Before Leverage Costs | ||||||||
| Advisory fees | 546 | 792 | ||||||
| Other operating expenses | 102 | 165 | ||||||
| 648 | 957 | |||||||
| Distributable cash flow before leverage costs | 4,842 | 5,273 | ||||||
| Leverage costs(2) | 139 | 252 | ||||||
| Distributable Cash Flow(3) | $ | 4,703 | $ | 5,021 | ||||
| Net realized loss on investments and foreign currency translation, for the period | $ | (71 | ) | $ | (3,168 | ) | ||
| As a percent of average total assets(4) | ||||||||
| Total from investments | 11.25 | % | 8.65 | % | ||||
| Operating expenses before leverage costs | 1.33 | % | 1.33 | % | ||||
| Distributable cash flow before leverage costs | 9.92 | % | 7.32 | % | ||||
| As a percent of average net assets(4) | ||||||||
| Total from investments | 12.01 | % | 9.73 | % | ||||
| Operating expenses before leverage costs | 1.42 | % | 1.50 | % | ||||
| Leverage costs | 0.30 | % | 0.39 | % | ||||
| Distributable cash flow | 10.29 | % | 7.84 | % | ||||
| Selected Financial Information | ||||||||
| Distributions paid on common stock | $ | 1,464 | $ | 4,391 | ||||
| Distributions paid on common stock per share | 0.1085 | 0.3255 | ||||||
| Total assets, end of period | 288,040 | 276,736 | ||||||
| Average total assets during period(5) | 278,413 | 285,731 | ||||||
| Leverage(6) | 31,500 | 31,500 | ||||||
| Leverage as a percent of total assets | 10.9 | % | 11.4 | % | ||||
| Net unrealized depreciation, end of period | (15,131 | ) | (22,549 | ) | ||||
| Net assets, end of period | 255,534 | 243,882 | ||||||
| Average net assets during period(7) | 260,772 | 253,916 | ||||||
| Net asset value per common share | 18.94 | 18.08 | ||||||
| Market value per common share | 18.45 | 16.25 | ||||||
| Shares outstanding (000’s) | 13,491 | 13,491 | ||||||
| (1) |
Q2 represents the period from March 29, 2019 (commencement of operations) through May 31, 2019. Q3 represents the period from June through August. |
| (2) |
Leverage costs include interest expense and other recurring leverage expenses. |
| (3) |
"Net investment income (loss)" on the Statement of Operations is adjusted as follows to reconcile to Distributable Cash Flow ("DCF"): increased by the return of capital on distributions and the net premiums on options written. |
| (4) |
Annualized. |
| (5) |
Computed by averaging month-end values within each period. |
| (6) |
Leverage consists of outstanding borrowings under the margin loan facility. |
| (7) |
Computed by averaging daily net assets within each period. |
| Tortoise | 23 |
| TYG Consolidated Schedule of Investments (unaudited) |
| August 31, 2019 |
| Shares | Fair Value | ||||
| Master Limited Partnerships — 124.4%(1) | |||||
| Crude Oil Pipelines — 17.8%(1) | |||||
| United States — 17.8%(1) | |||||
| BP Midstream Partners LP | 248,258 | $ | 3,689,114 | ||
| Genesis Energy L.P. | 621,847 | 12,897,107 | |||
| PBF Logistics LP | 856,856 | 17,822,605 | |||
| Plains All American Pipeline, L.P. | 4,688,058 | 100,465,083 | |||
| Shell Midstream Partners, L.P. | 3,155,217 | 60,611,718 | |||
| 195,485,627 | |||||
| Natural Gas/Natural Gas Liquids Pipelines — 41.4%(1) | |||||
| United States — 41.4%(1) | |||||
| Cheniere Energy Partners LP | 300,314 | 13,162,763 | |||
| Energy Transfer LP(2) | 13,772,052 | 187,437,624 | |||
| Enterprise Products Partners L.P. | 5,710,130 | 162,795,806 | |||
| EQM Midstream Partners, LP(3) | 2,995,944 | 90,687,225 | |||
| 454,083,418 | |||||
| Natural Gas Gathering/Processing — 19.1%(1) | |||||
| United States — 19.1%(1) | |||||
| CNX Midstream Partners LP | 2,621,599 | 37,095,626 | |||
| DCP Midstream, LP | 2,268,264 | 55,254,911 | |||
| Enable Midstream Partners LP | 1,053,203 | 13,270,358 | |||
| Hess Midstream Partners LP | 647,635 | 12,298,589 | |||
| Western Midstream Partners, LP | 4,001,796 | 92,201,369 | |||
| 210,120,853 | |||||
| Other — 0.4%(1) | |||||
| United States — 0.4%(1) | |||||
| Westlake Chemical Partners | 206,837 | 4,376,671 | |||
| Refined Product Pipelines — 45.7%(1) | |||||
| United States — 45.7%(1) | |||||
| Holly Energy Partners, L.P. | 2,192,430 | 59,085,989 | |||
| Magellan Midstream Partners, L.P. | 2,219,992 | 148,029,067 | |||
| MPLX LP | 5,415,464 | 151,145,600 | |||
| NuStar Energy L.P. | 2,558,933 | 70,319,479 | |||
| Phillips 66 Partners LP(3) | 1,317,472 | 72,421,436 | |||
| 501,001,571 | |||||
| Total Master Limited Partnerships (Cost $1,298,758,788) |
1,365,068,140 | ||||
| Common Stock — 39.8%(1) | |||||
| Marine Transportation — 1.8%(1) | |||||
| Monaco — 1.8%(1) | |||||
| GasLog Partners LP | 1,039,959 | 19,707,223 | |||
| Natural Gas Gathering/Processing — 22.2%(1) | |||||
| United States — 22.2%(1) | |||||
| Antero Midstream Corporation | 7,132,459 | 50,711,783 | |||
| EnLink Midstream, LLC | 7,304,201 | 57,995,357 | |||
| Rattler Midstream LP | 276,858 | 5,069,270 | |||
| Targa Resources Corp. | 1,888,556 | 68,214,643 | |||
| The Williams Companies, Inc.(3) | 2,624,695 | 61,942,802 | |||
| 243,933,855 | |||||
| Natural Gas/Natural Gas Liquids Pipelines — 15.8%(1) | |||||
| United States — 15.8%(1) | |||||
| Kinder Morgan Inc.(3) | 2,394,639 | 48,539,332 | |||
| ONEOK, Inc.(3) | 974,508 | 69,462,929 | |||
| Tallgrass Energy, LP | 2,809,586 | 55,011,694 | |||
| 173,013,955 | |||||
| Total Common Stock (Cost $499,080,691) |
436,655,033 | ||||
| Preferred Stock — 9.7%(1) | |||||
| Crude Oil Pipelines — 0.4%(1) | |||||
| United States — 0.4%(1) | |||||
| SemGroup Corporation, 7.000%(4)(5)(6) | 6,277 | 5,153,189 | |||
| Natural Gas/Natural Gas Liquids Pipelines — 6.9%(1) | |||||
| United States — 6.9%(1) | |||||
| Altus Midstream Company, 7.000%(4)(5)(7) | 9,899 | 9,897,262 | |||
| Crestwood Equity Partners LP, 9.25% | 7,126,640 | 65,565,088 | |||
| 75,462,350 | |||||
| Natural Gas Gathering/Processing — 2.4%(1) | |||||
| United States — 2.4%(1) | |||||
| Targa Resources Corp., 9.500%(4)(5) | 21,758 | 26,297,990 | |||
| Total Preferred Stock (Cost $102,065,294) |
106,913,529 | ||||
See accompanying Notes to Financial Statements.
| 24 | Tortoise |
| 2019 3rd Quarter Report | August 31, 2019 |
| TYG Consolidated Schedule of Investments (unaudited) (continued) |
| August 31, 2019 |
| Shares | Fair Value | |||||
| Corporate Bonds — 1.7%(1) | ||||||
| Refined Product Pipelines — 1.7%(1) | ||||||
| United States — 1.7%(1) | ||||||
| Buckeye Partners, 5.600%, 10/15/2044 |
3,000,000 | $ | 2,539,420 | |||
| Buckeye Partners, 5.850%, 11/15/2043 |
18,000,000 | 15,498,986 | ||||
| 18,038,406 | ||||||
| Total Corporate Bonds (Cost $18,047,137) |
18,038,406 | |||||
| Private Investment — 1.1%(1) | ||||||
| Renewables — 1.1%(1) | ||||||
| United States — 1.1%(1) | ||||||
| TK NYS Solar Holdco, LLC(4)(5)(8)(9) (Cost $54,481,470) |
N/A | 12,153,147 | ||||
| Short-Term Investment — 0.0%(1) | ||||||
| United States Investment Company — 0.0%(1) | ||||||
|
Invesco Government & Agency Portfolio — Institutional Class, |
272,117 | 272,117 | ||||
| Total Investments — 176.7%(1) (Cost $1,972,705,497) |
1,939,100,372 | |||||
| Interest Rate Swap Contracts — (0.0)%(1) | ||||||
| $10,000,000 notional — net unrealized depreciation(11) | (206,016 | ) | ||||
| Total Value of Options Written (Premiums received $212,009)(12) — (0.0)%(1) |
(185,860 | ) | ||||
| Other Assets and Liabilities — 0.3%(1) | 3,598,406 | |||||
| Deferred Tax Liability — (14.2)%(1) | (155,918,012 | ) | ||||
| Credit Facility Borrowings — (13.1)%(1) | (143,900,000 | ) | ||||
| Senior Notes — (34.6)%(1) | (380,000,000 | ) | ||||
| Mandatory Redeemable Preferred Stock at Liquidation Value — (15.1)%(1) |
(165,000,000 | ) | ||||
| Total Net Assets Applicable to Common Stockholders — 100.0%(1) |
$ | 1,097,488,890 | ||||
| (1) |
Calculated as a percentage of net assets applicable to common stockholders. |
|
(2) |
A portion of the security is segregated as collateral for the unrealized depreciation of interest rate swap contracts of $185,860. |
| (3) |
All or a portion of the security represents cover for outstanding call option contracts written. |
| (4) |
Restricted securities have a total fair value of $53,501,588, which represents 4.9% of net assets. See Note 6 to the financial statements for further disclosure. |
| (5) |
Securities have been valued by using significant unobservable inputs in accordance with fair value procedures and are categorized as level 3 investments, as more fully described in Note 2 to the financial statements. |
| (6) |
Security distributions are paid-in-kind. Cash value of the 7.0% coupon is added to the liquidation preference of the preferred stock. |
| (7) |
Security distributions are paid-in-kind. Cash value of the 7.0% coupon is paid in the form of additional shares. |
| (8) |
Deemed to be an affiliate of the fund. |
| (9) |
See Notes 7 and 13 to the financial statements for further disclosure. |
| (10) |
Rate indicated is the current yield as of August 31, 2019. |
| (11) |
See Schedule of Interest Rate Swap Contracts and Note 12 to the financial statements for further disclosure. |
| (12) |
See Schedule of Options Written and Note 12 to the financial statements for further disclosure. |
See accompanying Notes to Financial Statements.
| Tortoise | 25 |
| NTG Schedule of Investments (unaudited) |
| August 31, 2019 |
| Shares | Fair Value | ||||
| Master Limited Partnerships — 123.4%(1) | |||||
| Crude Oil Pipelines — 22.0%(1) | |||||
| United States — 22.0%(1) | |||||
| BP Midstream Partners LP | 767,388 | $ | 11,403,386 | ||
| Delek Logistics Partners, LP | 422,024 | 12,424,387 | |||
| Genesis Energy L.P. | 447,697 | 9,285,236 | |||
| PBF Logistics LP | 907,612 | 18,878,330 | |||
| Plains All American Pipeline, L.P. | 3,381,269 | 72,460,595 | |||
| Shell Midstream Partners, L.P. | 2,520,450 | 48,417,844 | |||
| 172,869,778 | |||||
| Natural Gas/Natural Gas Liquids Pipelines — 42.0%(1) | |||||
| United States — 42.0%(1) | |||||
| Cheniere Energy Partners LP | 217,634 | 9,538,898 | |||
| Energy Transfer LP | 9,894,608 | 134,665,612 | |||
| Enterprise Products Partners L.P. | 4,225,233 | 120,461,393 | |||
| EQM Midstream Partners, LP(2) | 2,156,194 | 65,267,992 | |||
| 329,933,895 | |||||
| Natural Gas Gathering/Processing — 19.3%(1) | |||||
| United States — 19.3%(1) | |||||
| CNX Midstream Partners, LP | 2,209,401 | 31,263,024 | |||
| DCP Midstream, LP | 1,675,006 | 40,803,146 | |||
| Enable Midstream Partners LP | 1,800,630 | 22,687,938 | |||
| Hess Midstream Partners LP | 429,313 | 8,152,654 | |||
| Noble Midstream Partners LP(2) | 238,293 | 5,797,669 | |||
| Western Midstream Partners, LP | 1,874,332 | 43,184,605 | |||
| 151,889,036 | |||||
| Refined Product Pipelines — 39.7%(1) | |||||
| United States — 39.7%(1) | |||||
| Holly Energy Partners, L.P. | 1,537,640 | 41,439,398 | |||
| Magellan Midstream Partners, L.P. | 998,029 | 66,548,574 | |||
| MPLX LP | 4,080,872 | 113,897,137 | |||
| NuStar Energy L.P. | 1,648,359 | 45,296,905 | |||
| Phillips 66 Partners LP(2) | 824,059 | 45,298,523 | |||
| 312,480,537 | |||||
| Other — 0.4%(1) | |||||
| United States — 0.4%(1) | |||||
| Westlake Chemical Partners | 147,087 | 3,112,361 | |||
| Total Master Limited Partnerships (Cost $965,412,884) |
970,285,607 | ||||
| Common Stock — 41.0%(1) | |||||
| Marine Transportation — 1.7%(1) | |||||
| Monaco — 1.7%(1) | |||||
| Gaslog Partners, LP | 713,490 | 13,520,635 | |||
| Natural Gas Gathering/Processing — 23.1%(1) | |||||
| United States — 23.1%(1) | |||||
| Antero Midstream Corp. | 5,182,473 | 36,847,383 | |||
| EnLink Midstream, LLC | 5,233,731 | 41,555,823 | |||
| Rattler Midstream LP | 198,464 | 3,633,876 | |||
| Targa Resources Corp. | 1,311,486 | 47,370,874 | |||
| The Williams Companies, Inc.(2) | 2,200,742 | 51,937,511 | |||
| 181,345,467 | |||||
| Natural Gas/Natural Gas Liquids Pipelines — 16.2%(1) | |||||
| United States — 16.2%(1) | |||||
| Kinder Morgan Inc.(2) | 1,716,112 | 34,785,590 | |||
| ONEOK, Inc.(2) | 748,127 | 53,326,493 | |||
| Tallgrass Energy, LP | 2,004,134 | 39,240,944 | |||
| 127,353,027 | |||||
| Total Common Stock (Cost $367,922,937) |
322,219,129 | ||||
| Preferred Stock — 8.9%(1) | |||||
| Crude Oil Pipelines — 0.4%(1) | |||||
| United States — 0.4%(1) | |||||
| SemGroup Corporation, 7.000%(3)(4)(5) | 3,763 | 3,089,286 | |||
| Natural Gas Gathering/Processing — 1.9%(1) | |||||
| United States — 1.9%(1) | |||||
| Targa Resources Corp., 9.500% (3)(4) | 12,252 | 14,808,483 | |||
| Natural Gas/Natural Gas Liquids Pipelines — 6.6%(1) | |||||
| United States — 6.6%(1) | |||||
| Altus Midstream Company, 7.000%(3)(4)(6) | 7,078 | 7,076,783 | |||
| Crestwood Equity Partners LP, 9.25% | 4,898,611 | 45,067,221 | |||
| 52,144,004 | |||||
| Total Preferred Stock (Cost $67,556,651) |
70,041,773 | ||||
See accompanying Notes to Financial Statements.
| 26 | Tortoise |
| 2019 3rd Quarter Report | August 31, 2019 |
| NTG Schedule of Investments (unaudited) (continued) |
| August 31, 2019 |
| Shares | Fair Value | |||||
| Corporate Bonds — 1.5%(1) | ||||||
| Refined Product Pipelines — 1.5%(1) | ||||||
| United States — 1.5%(1) | ||||||
| Buckeye Partners, 5.600%, 10/15/2044 |
5,000,000 | $ | 4,232,367 | |||
| Buckeye Partners, 5.850%, 11/15/2043 |
8,950,000 | 7,706,440 | ||||
| 11,938,807 | ||||||
| Total Corporate Bonds (Cost $11,875,958) |
11,938,807 | |||||
| Short-Term Investment — 0.0%(1) | ||||||
| United States Investment Company — 0.0%(1) | ||||||
| First American Government Obligations Fund, 2.03%(7) (Cost $115,929) |
115,929 | 115,929 | ||||
| Total Investments — 174.8%(1) (Cost $1,412,884,359) |
1,374,601,245 | |||||
| Total Value of Options Written (Premiums received $323,847)(8) — (0.0)%(1) |
(282,953 | ) | ||||
| Other Assets and Liabilities — (0.5)%(1) | (3,722,805 | ) | ||||
| Deferred Tax Liability — (7.1)%(1) | (56,201,853 | ) | ||||
| Credit Facility Borrowings — (10.7)%(1) | (84,100,000 | ) | ||||
| Senior Notes — (39.7)%(1) | (312,000,000 | ) | ||||
| Mandatory Redeemable Preferred Stock at Liquidation Value — (16.8)%(1) |
(132,000,000 | ) | ||||
| Total Net Assets Applicable to Common Stockholders — 100.0%(1) |
$ | 786,293,634 | ||||
| (1) |
Calculated as a percentage of net assets applicable to common stockholders. |
| (2) |
All or a portion of the security represents cover for outstanding call option contracts written. |
| (3) |
Restricted securities have a total fair value of $24,974,552, which represents 3.2% of net assets. See Note 6 to the financial statements for further disclosure. |
| (4) |
Securities have been valued by using significant unobservable inputs in accordance with fair value procedures and are categorized as level 3 investments, as more fully described in Note 2 to the financial statements. |
| (5) |
Security distributions are paid-in-kind. Cash value of the 7.0% coupon is added to the liquidation preference of the preferred stock. |
| (6) |
Security distributions are paid-in-kind. Cash value of the 7.0% coupon is paid in the form of additional shares. |
| (7) |
Rate indicated is the current yield as of August 31, 2019. |
| (8) |
See Schedule of Options Written and Note 12 to the financial statements for further disclosure. |
See accompanying Notes to Financial Statements.
| Tortoise | 27 |
| TTP Schedule of Investments (unaudited) |
| August 31, 2019 |
| Shares | Fair Value | ||||
| Common Stock — 102.4%(1) | |||||
| Marine Transportation — 1.4%(1) | |||||
| Monaco — 1.4%(1) | |||||
| GasLog Partners LP | 111,052 | $ | 2,104,435 | ||
| Crude Oil Pipelines — 36.6%(1) | |||||
| Canada — 22.6%(1) | |||||
| Gibson Energy Inc | 188,122 | 3,252,643 | |||
| Enbridge Inc. | 488,750 | 16,353,576 | |||
| Inter Pipeline Ltd. | 324,250 | 5,913,167 | |||
| Pembina Pipeline Corporation | 187,888 | 6,878,219 | |||
| United States — 14.0%(1) | |||||
| Plains GP Holdings, L.P. | 827,799 | 18,145,354 | |||
| SemGroup Corporation | 222,097 | 1,963,337 | |||
| 52,506,296 | |||||
| Natural Gas Gathering/Processing — 22.3%(1) | |||||
| United States — 22.3%(1) | |||||
| Antero Midstream Corporation | 671,725 | 4,775,965 | |||
| EnLink Midstream, LLC | 818,478 | 6,498,714 | |||
| Rattler Midstream LP | 56,814 | 1,040,264 | |||
| Targa Resources Corp. | 280,249 | 10,122,594 | |||
| The Williams Companies, Inc. | 402,880 | 9,507,968 | |||
| 31,945,505 | |||||
| Natural Gas/Natural Gas Liquids Pipelines — 33.3%(1) | |||||
| Canada — 6.3%(1) | |||||
| Keyera Corp. | 82,825 | 1,998,774 | |||
| TC Energy Corporation | 137,605 | 7,050,880 | |||
| United States — 27.0%(1) | |||||
| Equitrans Midstream Corporation | 397,483 | 5,362,046 | |||
| Kinder Morgan Inc. | 303,779 | 6,157,600 | |||
| ONEOK, Inc. | 226,372 | 16,135,796 | |||
| Tallgrass Energy LP | 564,167 | 11,046,390 | |||
| 47,751,486 | |||||
| Oil and Gas Production — 8.8%(1) | |||||
| United States — 8.8%(1) | |||||
| Cabot Oil & Gas Corporation(2) | 75,600 | 1,294,272 | |||
| Cimarex Energy Co.(2) | 15,200 | 650,256 | |||
| Concho Resources Inc.(2)(3) | 8,800 | 643,720 | |||
| Continental Resources, Inc.(2)(3) | 20,800 | 607,360 | |||
| Diamondback Energy, Inc.(2) | 6,400 | 627,712 | |||
| EOG Resources, Inc.(2) | 16,400 | 1,216,716 | |||
| EQT Corporation(2) | 50,400 | 512,568 | |||
| Noble Energy, Inc.(2) | 57,400 | 1,296,092 | |||
| Parsley Energy, Inc.(2)(3) | 38,900 | 696,699 | |||
| Pioneer Natural Resources Company(2) | 9,900 | 1,221,858 | |||
| Viper Energy Partners LP(2) | 89,600 | 2,595,712 | |||
| WPX Energy, Inc.(2)(3) | 120,700 | 1,298,732 | |||
| 12,661,697 | |||||
| Total Common Stock (Cost $174,643,916) |
146,969,419 | ||||
| Master Limited Partnerships — 35.4%(1) | |||||
| Crude Oil Pipelines — 3.9%(1) | |||||
| United States — 3.9%(1) | |||||
| BP Midstream Partners LP | 33,891 | 503,620 | |||
| Genesis Energy L.P. | 46,531 | 965,053 | |||
| PBF Logistics LP | 78,278 | 1,628,182 | |||
| Shell Midstream Partners, L.P. | 132,089 | 2,537,430 | |||
| 5,634,285 | |||||
| Natural Gas/Natural Gas Liquids Pipelines — 12.3%(1) | |||||
| United States — 12.3%(1) | |||||
| Energy Transfer LP | 958,092 | 13,039,637 | |||
| Enterprise Products Partners L.P. | 145,209 | 4,139,909 | |||
| EQM Midstream Partners, LP | 16,045 | 485,682 | |||
| 17,665,228 | |||||
| Natural Gas Gathering/Processing — 4.0%(1) | |||||
| United States — 4.0%(1) | |||||
| CNX Midstream Partners LP | 60,605 | 857,561 | |||
| DCP Midstream, LP | 89,185 | 2,172,547 | |||
| Western Midstream Partners, LP | 114,429 | 2,636,439 | |||
| 5,666,547 | |||||
| Other — 0.2%(1) | |||||
| United States — 0.2%(1) | |||||
| Westlake Chemical Partners | 11,004 | 232,845 | |||
| Refined Product Pipelines — 15.0%(1) | |||||
| United States — 15.0%(1) | |||||
| Holly Energy Partners, L.P. | 162,052 | 4,367,301 | |||
| Magellan Midstream Partners, L.P. | 57,108 | 3,807,961 | |||
| MPLX LP | 233,219 | 6,509,142 | |||
| NuStar Energy L.P. | 135,021 | 3,710,377 | |||
| Phillips 66 Partners LP | 56,933 | 3,129,607 | |||
| 21,524,388 | |||||
| Total Master Limited Partnerships (Cost $51,897,106) |
50,723,293 | ||||
| See accompanying Notes to Financial Statements. | |
| 28 | Tortoise |
| 2019 3rd Quarter Report | August 31, 2019 |
| TTP Schedule of Investments (unaudited) (continued) |
| August 31, 2019 |
| Shares | Fair Value | |||||
| Preferred Stock — 6.1%(1) | ||||||
| Crude Oil Pipelines — 1.6%(1) | ||||||
| United States — 1.6%(1) | ||||||
| SemGroup Corporation., 7.000%(4)(5)(6) | 2,877 | $ | 2,361,912 | |||
| Natural Gas/Natural Gas Liquids Pipelines — 0.4%(1) | ||||||
| United States — 0.4%(1) | ||||||
| Altus Midstream Company, 7.000%(4)(5)(7) | 526 | 525,767 | ||||
| Natural Gas Gathering/Processing — 1.8%(1) | ||||||
| United States — 1.8%(1) | ||||||
| Targa Resources Corp., 9.500%(4)(5) | 2,108 | 2,547,852 | ||||
| Power — 2.3%(1) | ||||||
| United States — 2.3%(1) | ||||||
| Sempra Energy, 6.000%, 01/15/2021 | 28,811 | 3,320,756 | ||||
| Total Preferred Stock (Cost $8,109,124) |
8,756,287 | |||||
| Short-Term Investment — 0.1%(1) | ||||||
| United States Investment Company — 0.1%(1) | ||||||
| Invesco Government & Agency Portfolio — Institutional Class, 2.02%(8) (Cost $158,163) |
158,163 | 158,163 | ||||
| Total Investments — 144.0%(1) (Cost $234,808,309) |
206,607,162 | |||||
| Total Value of Options Written | ||||||
| (Premiums received $129,875)(9) — (0.1)%(1) | (133,191 | ) | ||||
| Other Assets and Liabilities — (1.1)%(1) | (1,510,622 | ) | ||||
| Credit Facility Borrowings — (8.0)%(1) | (11,500,000 | ) | ||||
| Senior Notes — (23.7)%(1) | (34,000,000 | ) | ||||
| Mandatory Redeemable Preferred Stock at Liquidation Value — (11.1)%(1) |
(16,000,000 | ) | ||||
| Total Net Assets Applicable to Common Stockholders — 100.0%(1) |
$ | 143,463,349 | ||||
| (1) | Calculated as a percentage of net assets applicable to common stockholders. |
| (2) | All or a portion of the security represents cover for outstanding call option contracts written. |
| (3) | Non-income producing security. |
| (4) | Restricted securities have a total fair value of $5,435,531, which represents 3.8% of net assets. See Note 6 to the financial statements for further disclosure. |
| (5) | Securities have been valued by using significant unobservable inputs in accordance with fair value procedures and are categorized as level 3 investments, as more fully described in Note 2 to the financial statements. |
| (6) | Security distributions are paid-in-kind. Cash value of the 7.0% coupon is added to the liquidation preference of the preferred stock. |
| (7) | Security distributions are paid-in-kind. Cash value of the 7.0% coupon is paid in the form of additional shares. |
| (8) | Rate indicated is the current yield as of August 31, 2019. |
| (9) | See Schedule of Options Written and Note 12 to the financial statements for further disclosure. |
| See accompanying Notes to Financial Statements. | |
| Tortoise | 29 |
| NDP Schedule of Investments (unaudited) |
| August 31, 2019 |
| Shares | Fair Value | |||||
| Common Stock — 132.8%(1) | ||||||
| Marine Transportation — 2.7%(1) | ||||||
| Monaco — 2.7%(1) | ||||||
| GasLog Partners LP | 91,843 | $ | 1,740,425 | |||
| Natural Gas/Natural Gas Liquids Pipelines — 11.4%(1) | ||||||
| United States — 11.4%(1) | ||||||
| Cheniere Energy, Inc. | 64,300 | 3,839,353 | ||||
| Equitrans Midstream Corporation | 267,875 | 3,613,634 | ||||
| 7,452,987 | ||||||
| Natural Gas Gathering/Processing — 5.0%(1) | ||||||
| United States — 5.0%(1) | ||||||
| Targa Resources Corp. | 14,000 | 505,680 | ||||
| The Williams Companies, Inc. | 117,774 | 2,779,467 | ||||
| 3,285,147 | ||||||
| Oil and Gas Production — 86.3%(1) | ||||||
| United States — 86.3%(1) | ||||||
| Cabot Oil & Gas Corporation(2) | 355,200 | 6,081,024 | ||||
| Concho Resources Inc.(2) | 67,300 | 4,922,995 | ||||
| Continental Resources, Inc.(2)(3) | 95,600 | 2,791,520 | ||||
| Diamondback Energy, Inc.(2) | 64,400 | 6,316,352 | ||||
| EOG Resources, Inc.(2) | 76,200 | 5,653,278 | ||||
| EQT Corporation(2) | 263,000 | 2,674,710 | ||||
| Marathon Oil Corporation(2) | 346,900 | 4,107,296 | ||||
| Noble Energy, Inc.(2) | 177,600 | 4,010,208 | ||||
| Occidental Petroleum Corporation(2) | 64,900 | 2,821,852 | ||||
| Parsley Energy, Inc.(2)(3) | 241,700 | 4,328,847 | ||||
| Pioneer Natural Resources Company(2) | 42,500 | 5,245,350 | ||||
| Range Resources Corporation(2) | 664,300 | 2,364,908 | ||||
| Viper Energy Partners LP(2) | 70,000 | 2,027,900 | ||||
| WPX Energy, Inc.(2)(3) | 279,700 | 3,009,572 | ||||
| 56,355,812 | ||||||
| Oilfield Services — 1.2%(1) | ||||||
| United States — 1.2%(1) | ||||||
| Chart Industries, Inc. | 12,417 | 780,285 | ||||
| Power/Utility — 5.9%(1) | ||||||
| United States — 5.9%(1) | ||||||
| Nextera Energy, Inc. | 17,700 | 3,877,716 | ||||
| Refining — 20.3%(1) | ||||||
| United States — 20.3%(1) | ||||||
| Delek US Holdings, Inc.(2) | 121,100 | 3,966,025 | ||||
| Marathon Petroleum Corporation(2) | 113,700 | 5,595,177 | ||||
| Valero Energy Corporation(2) | 49,400 | 3,718,832 | ||||
| 13,280,034 | ||||||
| Total Common Stock (Cost $109,010,655) |
86,772,406 | |||||
| Master Limited Partnerships — 8.4%(1) | ||||||
| Natural Gas/Natural Gas Liquids Pipelines — 8.4%(1) | ||||||
| United States — 8.4%(1) | ||||||
| Energy Transfer LP | 274,437 | 3,735,088 | ||||
| Enterprise Products Partners L.P. | 60,652 | 1,729,188 | ||||
| 5,464,276 | ||||||
| Total Master Limited Partnerships (Cost $5,528,608) |
5,464,276 | |||||
| Preferred Stock — 3.7%(1) | ||||||
| Natural Gas Gathering/Processing — 3.7%(1) | ||||||
| United States — 3.7%(1) | ||||||
| Targa Resources Corp., 9.500%(4)(5) (Cost $1,688,542) |
1,997 | 2,413,691 | ||||
| Short-Term Investment — 0.4%(1) | ||||||
| United States Investment Company — 0.4%(1) | ||||||
| Invesco Government & Agency Portfolio — Institutional Class, 2.02%(6) (Cost $252,277) |
252,277 | 252,277 | ||||
|
Total Investments — 145.3%(1) |
94,902,650 | |||||
| Total Value of Options Written (Premiums received $522,692)(7) — (0.7)%(1) |
(461,810 | ) | ||||
| Other Assets and Liabilities — (0.7)%(1) | (418,803 | ) | ||||
| Credit Facility Borrowings — (43.9)%(1) | (28,700,000 | ) | ||||
| Total Net Assets Applicable to Common Stockholders — 100.0%(1) |
$ | 65,322,037 | ||||
| (1) | Calculated as a percentage of net assets applicable to common stockholders. |
| (2) | All or a portion of the security represents cover for outstanding call option contracts written. |
| (3) | Non-income producing security. |
| (4) | Restricted securities have a total fair value of $2,413,691, which represents 3.7% of net assets. See Note 6 to the financial statements for further disclosure. |
| (5) | Securities have been valued by using significant unobservable inputs in accordance with fair value procedures and are categorized as level 3 investments, as more fully described in Note 2 to the financial statements. |
| (6) | Rate indicated is the current yield as of August 31, 2019. |
| (7) | See Schedule of Options Written and Note 12 to the financial statements for further disclosure. |
| See accompanying Notes to Financial Statements. | |
| 30 | Tortoise |
| 2019 3rd Quarter Report | August 31, 2019 |
| TPZ Schedule of Investments (unaudited) |
| August 31, 2019 |
| Principal | ||||||
| Amount | Fair Value | |||||
| Corporate Bonds — 75.1%(1) | ||||||
| Crude Oil Pipelines — 12.1%(1) | ||||||
| Canada — 6.4%(1) | ||||||
| Enbridge Inc., | ||||||
| 5.500%, 07/15/2077 | $ | 8,500,000 | $ | 8,524,225 | ||
| United States — 5.7%(1) | ||||||
| SemGroup Corp., | ||||||
| 6.375%, 03/15/2025 | 6,000,000 | 5,670,000 | ||||
| SemGroup Corp., | ||||||
| 5.625%, 11/15/2023 | 2,000,000 | 1,890,000 | ||||
| 16,084,225 | ||||||
| Natural Gas/Natural Gas Liquids Pipelines — 31.8%(1) | ||||||
| Canada — 6.2%(1) | ||||||
| TransCanada Corporation, | ||||||
| 5.625%, 05/20/2075 | 7,000,000 | 7,192,500 | ||||
| TransCanada Corporation, | ||||||
| 5.300%, 03/15/2077 | 1,000,000 | 992,500 | ||||
| United States — 25.6%(1) | ||||||
| Cheniere Corp., | ||||||
| 7.000%, 06/30/2024 | 4,000,000 | 4,615,000 | ||||
| Cheniere Corp., | ||||||
| 5.875%, 03/31/2025 | 2,000,000 | 2,230,000 | ||||
| Florida Gas Transmission Co., LLC, | ||||||
| 5.450%, 07/15/2020(2) | 1,500,000 | 1,538,797 | ||||
| Kinder Morgan, Inc., | ||||||
| 6.500%, 09/15/2020 | 4,000,000 | 4,166,602 | ||||
| Midcontinent Express Pipeline LLC, | ||||||
| 6.700%, 09/15/2019(2) | 2,000,000 | 2,001,500 | ||||
| NGPL PipeCo LLC, | ||||||
| 4.875%, 08/15/2027(2) | 2,000,000 | 2,123,153 | ||||
| ONEOK, Inc., | ||||||
| 4.250%, 02/01/2022 | 4,500,000 | 4,675,774 | ||||
| ONEOK, Inc., | ||||||
| 7.500%, 09/01/2023 | 2,000,000 | 2,351,990 | ||||
| Rockies Express Pipeline LLC, | ||||||
| 4.950%, 07/15/2029(2) | 3,000,000 | 3,058,434 | ||||
| Ruby Pipeline, LLC, | ||||||
| 6.000%, 04/01/2022(2) | 1,181,818 | 1,235,387 | ||||
| Southern Star Central Corp., | ||||||
| 5.125%, 07/15/2022(2) | 3,000,000 | 3,034,530 | ||||
| Tallgrass Energy LP, | ||||||
| 5.500%, 01/15/2028(2) | 3,250,000 | 3,059,063 | ||||
| 42,275,230 | ||||||
| Natural Gas Gathering/Processing — 17.0%(1) | ||||||
| United States — 17.0%(1) | ||||||
| Antero Midstream Partners LP, | ||||||
| 5.750%, 03/01/2027(2) | 2,000,000 | 1,835,000 | ||||
| Blue Racer Midstream, LLC, | ||||||
| 6.625%, 07/15/2026(2) | 5,900,000 | 5,807,842 | ||||
| EnLink Midstream LLC, | ||||||
| 5.375%, 06/01/2029 | 2,000,000 | 1,957,000 | ||||
| Hess Corporation, | ||||||
| 5.625%, 02/15/2026(2) | 4,160,000 | 4,305,600 | ||||
| The Williams Companies, Inc., | ||||||
| 7.875%, 09/01/2021 | 5,000,000 | 5,520,958 | ||||
| The Williams Companies, Inc., | ||||||
| 4.550%, 06/24/2024 | 3,000,000 | 3,248,785 | ||||
| 22,675,185 | ||||||
| Oil and Gas Production — 2.2%(1) | ||||||
| United States — 2.2%(1) | ||||||
| Ascent Resources Utica Holdings, LLC, | ||||||
| 10.000%, 04/01/2022(2) | 1,302,000 | 1,305,255 | ||||
| Ascent Resources Utica Holdings, LLC, | ||||||
| 7.000%, 11/01/2026(2) | 2,000,000 | 1,651,900 | ||||
| 2,957,155 | ||||||
| Power/Utility — 12.0%(1) | ||||||
| United States — 12.0%(1) | ||||||
| The AES Corporation, | ||||||
| 5.500%, 04/15/2025 | 4,000,000 | 4,175,120 | ||||
| Duquesne Light Holdings, Inc., | ||||||
| 6.400%, 09/15/2020(2) | 3,000,000 | 3,112,533 | ||||
| Duquesne Light Holdings, Inc., | ||||||
| 5.900%, 12/01/2021(2) | 2,000,000 | 2,134,228 | ||||
| NextEra Energy, Inc., | ||||||
| 4.800%, 12/01/2077 | 4,500,000 | 4,503,645 | ||||
| NV Energy Inc., | ||||||
| 6.250%, 11/15/2020 | 1,000,000 | 1,045,291 | ||||
| Pattern Energy Group Inc., | ||||||
| 5.875%, 02/01/2024(2) | 1,000,000 | 1,035,000 | ||||
| 16,005,817 | ||||||
| Total Corporate Bonds | ||||||
| (Cost $97,938,127) | 99,997,612 | |||||
| See accompanying Notes to Financial Statements. | |
| Tortoise | 31 |
| TPZ Schedule of Investments (unaudited) (continued) |
| August 31, 2019 |
| Shares | Fair Value | ||||
| Master Limited Partnerships — 33.2%(1) | |||||
| Crude Oil Pipelines — 2.9%(1) | |||||
| United States — 2.9%(1) | |||||
| BP Midstream Partners LP | 25,000 | $ | 371,500 | ||
| PBF Logistics LP | 85,868 | 1,786,054 | |||
| Shell Midstream Partners, L.P. | 89,044 | 1,710,535 | |||
| 3,868,089 | |||||
| Natural Gas/Natural Gas Liquids Pipelines — 9.7%(1) | |||||
| United States — 9.7%(1) | |||||
| Energy Transfer LP | 717,787 | 9,769,080 | |||
| Enterprise Products Partners L.P. | 98,682 | 2,813,424 | |||
| EQM Midstream Partners, LP | 8,010 | 242,463 | |||
| 12,824,967 | |||||
| Natural Gas Gathering/Processing — 5.2%(1) | |||||
| United States — 5.2%(1) | |||||
| CNX Midstream Partners, LP | 47,302 | 669,323 | |||
| DCP Midstream, LP | 96,758 | 2,357,025 | |||
| Western Midstream Partners, LP | 166,906 | 3,845,515 | |||
| 6,871,863 | |||||
| Other — 0.1%(1) | |||||
| United States — 0.1%(1) | |||||
| Westlake Chemical Partners LP | 9,289 | 196,555 | |||
| Refined Product Pipelines — 15.3%(1) | |||||
| United States — 15.3%(1) | |||||
| Holly Energy Partners, L.P. | 136,327 | 3,674,013 | |||
| Magellan Midstream Partners, L.P. | 56,119 | 3,742,015 | |||
| MPLX LP | 282,344 | 7,880,221 | |||
| NuStar Energy L.P. | 102,338 | 2,812,248 | |||
| Phillips 66 Partners LP | 41,654 | 2,289,720 | |||
| 20,398,217 | |||||
| Total Master Limited Partnerships | |||||
| (Cost $39,539,865) | 44,159,691 | ||||
| Common Stock — 26.3%(1) | |||||
| Crude Oil Pipelines — 6.0%(1) | |||||
| United States — 6.0%(1) | |||||
| Enbridge Inc. | 47,888 | 1,602,334 | |||
| Plains GP Holdings, L.P. | 292,549 | 6,412,674 | |||
| 8,015,008 | |||||
| Marine Transportation — 1.2%(1) | |||||
| Monaco — 1.2%(1) | |||||
| GasLog Partners LP | 86,675 | 1,642,491 | |||
| Natural Gas/Natural Gas Liquids Pipelines — 10.5%(1) | |||||
| United States — 10.5%(1) | |||||
| Equitrans Midstream Corporation | 145,093 | 1,957,305 | |||
| ONEOK, Inc. | 69,117 | 4,926,659 | |||
| Tallgrass Energy LP | 362,376 | 7,095,322 | |||
| 13,979,286 | |||||
| Natural Gas Gathering/Processing — 8.6%(1) | |||||
| United States — 8.6%(1) | |||||
| Antero Midstream Corp. | 444,931 | 3,163,459 | |||
| EnLink Midstream LLC | 273,224 | 2,169,399 | |||
| Rattler Midstream LP | 26,343 | 482,340 | |||
| Targa Resources Corp. | 154,583 | 5,583,538 | |||
| 11,398,736 | |||||
| Total Common Stock | |||||
| (Cost $37,439,514) | 35,035,521 | ||||
| See accompanying Notes to Financial Statements. | |
| 32 | Tortoise |
| 2019 3rd Quarter Report | August 31, 2019 |
| TPZ Schedule of Investments (unaudited) (continued) |
| August 31, 2019 |
| Shares | Fair Value | |||||
| Preferred Stock — 6.7%(1) | ||||||
| Crude Oil Pipelines — 1.3%(1) | ||||||
| United States — 1.3%(1) | ||||||
| SemGroup Corporation, 7.000%(2)(3)(4) | 2,120 | $ | 1,740,443 | |||
| Natural Gas Gathering/Processing — 1.5%(1) | ||||||
| United States — 1.5%(1) | ||||||
| Targa Resources Corp., 9.500%(2)(3) | 1,685 | 2,036,590 | ||||
| Natural Gas Liquids Pipelines — 0.4%(1) | ||||||
| United States — 0.4%(1) | ||||||
| Altus Midstream Company, 7.000%(2)(3)(5) | 459 | 458,541 | ||||
| Power/Utility — 3.5%(1) | ||||||
| United States — 3.5%(1) | ||||||
| DTE Energy, | ||||||
| 6.500%, 10/01/2019 | 39,600 | 2,251,656 | ||||
| Sempra Energy, | ||||||
| 6.000%, 01/15/2021 | 21,189 | 2,442,244 | ||||
| 4,693,900 | ||||||
| Total Preferred Stock | ||||||
| (Cost $8,156,231) | 8,929,474 | |||||
| Short-Term Investment — 0.1%(1) | ||||||
| United States Investment Company — 0.1%(1) | ||||||
| Invesco Government & Agency Portfolio — Institutional Class, | ||||||
| 2.30%(6) (Cost $145,693) | 145,693 | 145,693 | ||||
| Total Investments — 141.4%(1) | ||||||
| (Cost $183,219,430) | 188,267,991 | |||||
| Interest Rate Swap Contracts — 0.0%(1) | ||||||
| $9,000,000 notional — net unrealized appreciation(7) | 1,934 | |||||
| Other Assets and Liabilities — 0.7%(1) | 936,612 | |||||
| Credit Facility Borrowings — (42.1)%(1) | (56,100,000 | ) | ||||
| Total Net Assets Applicable to | ||||||
| Common Stockholders — 100.0%(1) | $ | 133,106,537 | ||||
| (1) | Calculated as a percentage of net assets applicable to common stockholders. |
| (2) | Restricted securities have a total fair value of $41,473,796 which represents 31.2% of net assets. See Note 6 to the financial statements for further disclosure. |
| (3) | Securities have been valued by using significant unobservable inputs in accordance with fair value procedures and are categorized as level 3 investments, as more fully described in Note 2 to the financial statements. |
| (4) | Security distributions are paid-in-kind. Cash value of the 7.0% coupon is added to the liquidation preference of the preferred stock. |
| (5) | Security distributions are paid-in-kind. Cash value of the 7.0% coupon is paid in the form of additional shares. |
| (6) | Rate indicated is the current yield as of August 31, 2019. |
| (7) | See Schedule of Interest Rate Swap Contracts and Note 12 to the financial statements for further disclosure. |
See accompanying Notes to Financial Statements.
| Tortoise | 33 |
| TEAF Consolidated Schedule of Investments (unaudited) |
| August 31, 2019 |
| Shares | Fair Value | ||||
| Common Stock — 50.0%(1) | |||||
| Natural Gas/Natural Gas Liquids Pipelines — 8.0%(1) | |||||
| Italy — 1.9%(1) | |||||
| Snam SpA | 925,467 | $ | 4,677,785 | ||
| United States — 6.1%(1) | |||||
| Cheniere Energy Inc.(2)(3) | 85,900 | 5,129,089 | |||
| ONEOK, Inc.(4) | 46,732 | 3,331,057 | |||
| Tallgrass Energy LP(4) | 325,146 | 6,366,359 | |||
| 19,504,290 | |||||
| Natural Gas Gathering/Processing — 7.7%(1) | |||||
| United States — 7.7%(1) | |||||
| Antero Midstream Corp.(4) | 472,617 | 3,360,307 | |||
| EnLink Midstream LLC(4) | 579,347 | 4,600,015 | |||
| Rattler Midstream LP | 38,170 | 698,893 | |||
| Targa Resources Corp.(2) | 136,000 | 4,912,320 | |||
| The Williams Companies, Inc.(4) | 227,307 | 5,364,445 | |||
| 18,935,980 | |||||
| Oil and Gas Production — 5.7%(1) | |||||
| United States — 5.7%(1) | |||||
| Cabot Oil & Gas Corporation(2) | 215,600 | 3,691,072 | |||
| Cimarex Energy Co.(2) | 53,700 | 2,297,286 | |||
| EQT Corporation(2) | 273,300 | 2,779,461 | |||
| Noble Energy, Inc.(2) | 224,000 | 5,057,920 | |||
| 13,825,739 | |||||
| Power — 20.4%(1) | |||||
| Australia — 1.0%(1) | |||||
| APA Group | 340,969 | 2,528,180 | |||
| Canada — 1.6%(1) | |||||
| Algonquin Power & Utilities Corp | 292,764 | 3,826,118 | |||
| France — 2.9%(1) | |||||
| Engie SA | 348,411 | 5,293,865 | |||
| Suez | 106,315 | 1,650,437 | |||
| Italy — 2.6%(1) | |||||
| Enel SpA | 876,942 | 6,355,295 | |||
| Portugal — 3.9%(1) | |||||
| EDP — Energias de Portugal SA | 1,495,410 | 5,650,437 | |||
| REN — Redes Energeticas Nacionais | |||||
| SGPS SA | 1,390,888 | 3,898,057 | |||
| Spain — 1.9%(1) | |||||
| Iberdrola SA | 454,858 | 4,675,157 | |||
| United States — 2.2%(1) | |||||
| Covanta Holding Corp | 316,092 | 5,436,782 | |||
| United Kingdom — 4.3%(1) | |||||
| National Grid PLC | 524,577 | 5,479,836 | |||
| SSE PLC | 350,004 | 4,901,921 | |||
| 49,696,085 | |||||
| Renewables — 6.6%(1) | |||||
| Canada — 2.9%(1) | |||||
| Innergex Renewable Energy Inc | 295,054 | 3,286,504 | |||
| TransAlta Renewables Inc | 389,060 | 3,830,987 | |||
| Germany — 0.8%(1) | |||||
| Encavis AG | 218,296 | 2,053,692 | |||
| Thailand — 0.4%(1) | |||||
| SPCG PCL | 1,456,100 | 885,877 | |||
| United States — 2.5%(1) | |||||
| NextEra Energy Partners LP | 69 | 3,536 | |||
| Pattern Energy Group Inc | 160,244 | 4,350,625 | |||
| TerraForm Power Inc | 105,909 | 1,796,217 | |||
| 16,207,438 | |||||
| Water Infrastructure — 1.6%(1) | |||||
| United Kingdom — 1.6%(1) | |||||
| Pennon Group PLC | 328,335 | 3,017,152 | |||
| Pentair PLC(5)(6) | 23,375 | 839,630 | |||
| 3,856,782 | |||||
| Total Common Stock | |||||
| (Cost $136,361,854) | 122,026,314 | ||||
See accompanying Notes to Financial Statements.
| 34 | Tortoise |
| 2019 3rd Quarter Report | August 31, 2019 |
| TEAF Consolidated Schedule of Investments (unaudited) (continued) |
| August 31, 2019 |
| Shares | Fair Value | ||||
| Master Limited Partnerships — 20.0%(1) | |||||
| Natural Gas/Natural Gas Liquids Pipelines — 10.0%(1) | |||||
| United States — 10.0%(1) | |||||
| Energy Transfer LP(4) | 662,369 | $ | 9,014,842 | ||
| Enterprise Products Partners L.P.(4) | 321,504 | 9,166,079 | |||
| EQM Midstream Partners, LP(4) | 199,732 | 6,045,888 | |||
| 24,226,809 | |||||
| Natural Gas Gathering/Processing — 5.8%(1) | |||||
| United States — 5.8%(1) | |||||
| DCP Midstream, LP(4) | 221,593 | 5,398,005 | |||
| Noble Midstream Partners LP(4) | 110,620 | 2,691,385 | |||
| Western Midstream Partners, LP | 265,582 | 6,119,009 | |||
| 14,208,399 | |||||
| Other — 2.3%(1) | |||||
| United States — 2.3%(1) | |||||
| Enviva Partners LP(4) | 175,439 | 5,559,662 | |||
| Renewables — 1.9%(1) | |||||
| Canada — 1.9%(1) | |||||
| Brookfield Renewable Partners LP | 125,345 | 4,690,317 | |||
| Total Master Limited Partnerships | |||||
| (Cost $55,760,128) | 48,685,187 | ||||
| Exchange-Traded Funds — 7.6%(1) | |||||
| Bonds — 7.6%(1) | |||||
| United States — 7.6%(1) | |||||
| SPDR Bloomberg Barclays Short Term | |||||
| High Yield Bond ETF(4) | 509,804 | 13,780,002 | |||
| SPDR Bloomberg Barclays High Yield | |||||
| Bond ETF | 44,400 | 4,831,150 | |||
| Total Exchange-Traded Funds | |||||
| (Cost $18,688,180) | 18,611,152 | ||||
| Principal | ||||||
| Amount | Fair Value | |||||
| Corporate Bonds — 14.4%(1) | ||||||
| Crude Oil Pipelines — 2.9%(1) | ||||||
| Canada — 1.7%(1) | ||||||
| Enbridge Inc, | ||||||
| 6.250%, 03/01/2078(4) | $ | 4,000,000 | $ | 4,170,000 | ||
| United States — 1.2%(1) | ||||||
| SemGroup Corp., | ||||||
| 6.375%, 03/15/2025(4) | 1,500,000 | 1,417,500 | ||||
| SemGroup Corp., | ||||||
| 7.250%, 03/15/2026(4) | 1,500,000 | 1,432,500 | ||||
| 7,020,000 | ||||||
| Education — 0.3%(1) | ||||||
| United States — 0.3%(1) | ||||||
| IDSHSG | ||||||
| 10.0%, 12/15/2021 | 800,000 | 800,000 | ||||
| Healthcare — 2.2%(1) | ||||||
| United States — 2.2%(1) | ||||||
| Grace Commons Property, | ||||||
| 15.000%, 10/31/2023(7) | 1,825,000 | 1,825,000 | ||||
| Grace Commons Property, | ||||||
| 8.000%, 10/31/2023(7) | 3,650,000 | 3,650,000 | ||||
| 5,475,000 | ||||||
| Natural Gas/Natural Gas Liquids Pipelines — 1.6%(1) | ||||||
| Canada — 1.6%(1) | ||||||
| TransCanada Corporation, | ||||||
| 5.300%, 03/15/2077(4) | 4,000,000 | 3,970,000 | ||||
| Natural Gas Gathering/Processing — 1.2%(1) | ||||||
| United States — 1.2%(1) | ||||||
| Blue Racer Midstream, LLC, | ||||||
| 6.625%, 07/15/2026(4)(7) | 3,000,000 | 2,953,140 | ||||
| Oil and Gas Production — 5.0%(1) | ||||||
| United States — 5.0%(1) | ||||||
| Ascent Resources Utica Holdings, LLC, | ||||||
| 7.000%, 11/01/2026(4)(7) | 3,500,000 | 2,890,825 | ||||
| Gulfport Energy Corp, | ||||||
| 6.375%, 01/15/2026(4) | 1,500,000 | 1,080,000 | ||||
| SM Energy Co, 6.750%, | ||||||
| 09/15/2026(4) | 3,500,000 | 2,975,000 | ||||
| Southwestern Energy Co, | ||||||
| 7.75%, 10/01/2027 | 3,000,000 | 2,610,000 | ||||
| Southwestern Energy Co, | ||||||
| 7.500%, 04/01/2026(4) | 3,000,000 | 2,625,600 | ||||
| 12,181,425 | ||||||
| Other — 1.2%(1) | ||||||
| United States — 1.2%(1) | ||||||
| Genesis Energy LP / | ||||||
| Genesis Energy Finance Corp, | ||||||
| 6.250%, 05/15/2026(4) | 3,000,000 | 2,866,170 | ||||
| Total Corporate Bonds | ||||||
| (Cost $36,590,825) | 35,265,735 | |||||
See accompanying Notes to Financial Statements.
| Tortoise | 35 |
| TEAF Consolidated Schedule of Investments (unaudited) (continued) |
| August 31, 2019 |
| Principal | |||||||
| Amount/Shares | Fair Value | ||||||
| Preferred Bonds — 5.2%(1) | |||||||
| Natural Gas Gathering/Processing — 2.9%(1) | |||||||
| United States — 2.9%(1) | |||||||
| DCP Midstream LP, | |||||||
| 7.375% Perpetuity(4) | $ | 5,000,000 | $ | 4,787,500 | |||
| EnLink Midstream Partners LP, | |||||||
| 6.000%, Perpetuity(4) | 3,000,000 | 2,250,000 | |||||
| 7,037,500 | |||||||
| Natural Gas/Natural Gas Liquids Pipelines — 2.3%(1) | |||||||
| United States — 2.3%(1) | |||||||
| Energy Transfer Operating LP, | |||||||
| 6.250%, Perpetuity(4) | 6,000,000 | 5,588,760 | |||||
| Total Preferred Bonds | |||||||
| (Cost $13,067,329) | 12,626,260 | ||||||
| Preferred Stock — 3.5%(1) | |||||||
| Natural Gas/Natural Gas Liquids Pipelines — 0.6%(1) | |||||||
| United States — 0.6%(1) | |||||||
| Crestwood Equity Partners LP, 9.25%(4) | 161,120 | 1,482,304 | |||||
| Natural Gas Liquids Pipelines — 1.7%(1) | |||||||
| United States — 1.7%(1) | |||||||
| Altus Midstream Company, 7.000%(7)(8)(9) | 4,076 | 4,075,697 | |||||
| Power/Utility — 1.2%(1) | |||||||
| United States — 1.2%(1) | |||||||
| Aqua America Inc., | |||||||
| 6.000%, 04/30/2022 | 50,000 | 3,008,500 | |||||
| Total Preferred Stock | |||||||
| (Cost $8,076,212) | 8,566,501 | ||||||
| Private Investment — 3.3%(1) | |||||||
| Renewables — 3.3%(1) | |||||||
| United States — 3.3%(1) | |||||||
| Renewable Holdco, LLC(5)(7)(9) | |||||||
| (Cost $8,098,695) | N/A | 8,098,695 | |||||
| Municipal Bonds — 5.2%(1) | |||||||
| Other — 5.2%(1) | |||||||
| United States — 5.2%(1) | |||||||
| Florida — 0.2%(1) | |||||||
| Florida Development Finance Corp, | |||||||
| 10.000%, 07/01/2025 | 445,000 | 445,071 | |||||
| Pennsylvania — 1.3%(1) | |||||||
| Philadelphia Authority | |||||||
| for Industrial Development, | |||||||
| 10.000%, 06/15/2030 | 3,135,000 | 3,180,740 | |||||
| Wisconsin — 3.7%(1) | |||||||
| Public Finance Authority, | |||||||
| 9.000%, 06/01/2029 | 8,925,000 | 9,010,948 | |||||
| Total Municipal Bonds | |||||||
| (Cost $12,505,000) | 12,636,759 | ||||||
| Construction Note — 1.5%(1) | |||||||
| Renewables — 1.5%(1) | |||||||
| Bermuda — 1.5%(1) | |||||||
| Saturn Solar Bermuda 1 Ltd., | |||||||
| 6.000%, 02/28/2020 | |||||||
| (Cost $3,770,670)(7)(9) | 3,510,000 | 3,525,464 | |||||
| Short-Term Investment — 1.6%(1) | |||||||
| United States Investment Company — 1.6%(1) | |||||||
| First American Government Obligations Fund, | |||||||
| 2.32%(10) (Cost $3,838,731) | 3,838,731 | 3,838,731 | |||||
| Total Investments — 112.3%(1) | |||||||
| (Cost $296,757,624) | 273,880,798 | ||||||
| Total Value of Options Written | |||||||
| (Premiums received $438,286)(11) — (0.2)%(1) | (442,064 | ) | |||||
| Forward Currency Contracts — 0.2%(1) | |||||||
| $7,264,644 notional — net unrealized appreciation(6) | 348,075 | ||||||
| Other Assets and Liabilities — 0.6%(1) | 1,594,822 | ||||||
| Credit Facility Borrowings — (12.9)%(1) | (31,500,000 | ) | |||||
| Total Net Assets Applicable to | |||||||
| Common Stockholders — 100.0%(1) | $ | 243,881,631 | |||||
| (1) | Calculated as a percentage of net assets applicable to common stockholders. |
| (2) | All or a portion of the security represents cover for outstanding call option contracts written. |
| (3) | Non-income producing security. |
| (4) | All or a portion of the security is segregated as collateral for the margin borrowing facility. See Note 11 to the financial statements for further disclosure. |
| (5) | All or a portion of the security is segregated as collateral for forward currency contracts. |
| (6) | See Schedule of Forward Currency Contracts and Note 12 to the financial statements for further disclosure. |
| (7) | Restricted securities have a total fair value of $27,018,821 which represents 11.1% of net assets. See Note 6 to the financial statements for further disclosure. |
| (8) | Security distributions are paid-in-kind. Cash value of the 7.0% coupon is paid in the form of additional shares. |
| (9) | Securities have been valued by using significant unobservable inputs in accordance with fair value procedures and are categorized as level 3 investments, as more fully described in Note 2 to the financial statements. |
| (10) | Rate indicated is the current yield as of August 31, 2019. |
| (11) | See Schedule of Options Written and Note 12 to the financial statements for further disclosure. |
See accompanying Notes to Financial Statements.
| 36 | Tortoise |
| 2019 3rd Quarter Report | August 31, 2019 |
| Schedule of Interest Rate Swap Contracts (unaudited) |
| August 31, 2019 |
| TYG | |||||||||||||
| Fixed Rate | Floating Rate | ||||||||||||
| Maturity | Notional | Paid by | Received by | Unrealized | |||||||||
| Counterparty | Date | Amount | TYG | TYG | Depreciation | ||||||||
| The Bank of Nova Scotia | 09/02/2021 | $ | 10,000,000 | 2.381% | 1-month U.S. Dollar LIBOR | $ | (206,016 | ) | |||||
| TPZ | |||||||||||||
| Fixed Rate | Floating Rate | Unrealized | |||||||||||
| Maturity | Notional | Paid by | Received by | Appreciation | |||||||||
| Counterparty | Date | Amount | TPZ | TPZ | (Depreciation) | ||||||||
| Wells Fargo Bank, N.A. | 11/29/2019 | $ | 6,000,000 | 1.330% | 3-month U.S. Dollar LIBOR | $ | 12,429 | ||||||
| Wells Fargo Bank, N.A. | 08/06/2020 | 3,000,000 | 2.180% | 3-month U.S. Dollar LIBOR | (10,495 | ) | |||||||
| $ | 9,000,000 | $ | 1,934 | ||||||||||
Schedule of Forward Currency Contracts (unaudited)
August 31, 2019
| TEAF | Contract Amount | ||||||||
| Unrealized | |||||||||
| Counterparty | Settlement Date | Purchases (000’s) | Sales (000’s) | Appreciation | |||||
| Morgan Stanley & Co. LLC | 9/16/19 | USD7,265 | GBP3,250 | $ | 348,075 | ||||
USD = U.S. Dollars
GBP = British Pounds
See accompanying Notes to Financial Statements.
| Tortoise | 37 |
| Schedule of Options Written (unaudited) |
| August 31, 2019 |
| TYG | ||||||||||||||
| Call Options Written | Expiration Date | Strike Price | Contracts | Notional Value | Fair Value | |||||||||
| EQM Midstream Partners, LP | September 2019 | $ | 35.00 | 1,530 | $ | 5,355,000 | $ | (26,775 | ) | |||||
| Kinder Morgan, Inc. | September 2019 | 21.20 | 2,390 | 5,066,800 | (22,487 | ) | ||||||||
| ONEOK, Inc. | September 2019 | 73.50 | 687 | 5,049,450 | (34,350 | ) | ||||||||
| ONEOK, Inc. | September 2019 | 74.00 | 496 | 3,670,400 | (18,600 | ) | ||||||||
| Phillips 66 Partners LP | September 2019 | 55.00 | 910 | 5,005,000 | (72,800 | ) | ||||||||
| The Williams Companies, Inc. | September 2019 | 25.00 | 1,808 | 4,520,000 | (10,848 | ) | ||||||||
| Total Value of Call Options Written (Premiums received $212,009) | $ | 28,666,650 | $ | (185,860 | ) | |||||||||
| NTG | ||||||||||||||
| Call Options Written | Expiration Date | Strike Price | Contracts | Notional Value | Fair Value | |||||||||
| EQM Midstream Partners, LP | September 2019 | $ | 35.00 | 2,170 | $ | 7,595,000 | $ | (37,975 | ) | |||||
| Kinder Morgan, Inc. | September 2019 | 21.20 | 3,408 | 7,224,960 | (32,066 | ) | ||||||||
| Noble Midstream Partners LP | September 2019 | 30.00 | 2,382 | 7,146,000 | (19,056 | ) | ||||||||
| ONEOK, Inc. | September 2019 | 73.50 | 976 | 7,173,600 | (48,800 | ) | ||||||||
| ONEOK, Inc. | September 2019 | 74.00 | 704 | 5,209,600 | (26,400 | ) | ||||||||
| Phillips 66 Partners LP | September 2019 | 55.00 | 1,290 | 7,095,000 | (103,200 | ) | ||||||||
| The Williams Companies, Inc. | September 2019 | 25.00 | 2,576 | 6,440,000 | (15,456 | ) | ||||||||
| Total Value of Call Options Written (Premiums received $323,847) | $ | 47,884,160 | $ | (282,953 | ) | |||||||||
| TTP | ||||||||||||||
| Call Options Written | Expiration Date | Strike Price | Contracts | Notional Value | Fair Value | |||||||||
| Cabot Oil & Gas Corporation | September 2019 | $ | 18.45 | 756 | $ | 1,394,820 | $ | (5,970 | ) | |||||
| Cimarex Energy Co. | September 2019 | 45.00 | 152 | 684,000 | (24,320 | ) | ||||||||
| Concho Resources Inc. | September 2019 | 80.00 | 88 | 704,000 | (4,840 | ) | ||||||||
| Continental Resources, Inc. | September 2019 | 33.50 | 208 | 696,800 | (3,120 | ) | ||||||||
| Diamondback Energy, Inc. | September 2019 | 110.00 | 64 | 704,000 | (2,496 | ) | ||||||||
| EOG Resources, Inc. | September 2019 | 84.00 | 164 | 1,377,600 | (2,624 | ) | ||||||||
| EQT Corporation | September 2019 | 13.60 | 504 | 685,440 | (382 | ) | ||||||||
| Noble Energy, Inc. | September 2019 | 24.50 | 574 | 1,406,300 | (11,872 | ) | ||||||||
| Parsley Energy, Inc. | September 2019 | 17.80 | 389 | 692,420 | (34,639 | ) | ||||||||
| Pioneer Natural Resources Company | September 2019 | 140.00 | 99 | 1,386,000 | (3,267 | ) | ||||||||
| Viper Energy Partners LP | September 2019 | 31.25 | 896 | 2,800,000 | (17,809 | ) | ||||||||
| WPX Energy, Inc. | September 2019 | 11.60 | 1,207 | 1,400,120 | (21,852 | ) | ||||||||
| Total Value of Call Options Written (Premiums received $129,875) | $ | 13,931,500 | $ | (133,191 | ) | |||||||||
See accompanying Notes to Financial Statements.
| 38 | Tortoise |
| 2019 3rd Quarter Report | August 31, 2019 |
| Schedule of Options Written (unaudited) (continued) |
| August 31, 2019 |
| NDP | ||||||||||||||
| Call Options Written | Expiration Date | Strike Price | Contracts | Notional Value | Fair Value | |||||||||
| Cabot Oil & Gas Corporation | September 2019 | $ | 18.75 | 3,356 | $ | 6,292,500 | $ | (15,367 | ) | |||||
| Cabot Oil & Gas Corporation | September 2019 | 19.00 | 196 | 372,400 | (1,470 | ) | ||||||||
| Concho Resources Inc. | September 2019 | 82.40 | 673 | 5,545,520 | (13,946 | ) | ||||||||
| Continental Resources, Inc. | September 2019 | 35.00 | 956 | 3,346,000 | (4,780 | ) | ||||||||
| Delek US Holdings, Inc. | September 2019 | 36.00 | 1,211 | 4,359,600 | (33,457 | ) | ||||||||
| Diamondback Energy, Inc. | September 2019 | 115.00 | 644 | 7,406,000 | (9,660 | ) | ||||||||
| EOG Resources, Inc. | September 2019 | 87.50 | 762 | 6,667,500 | (3,810 | ) | ||||||||
| EQT Corporation | September 2019 | 14.00 | 2,630 | 3,682,000 | (26,300 | ) | ||||||||
| Marathon Oil Corporation | September 2019 | 14.50 | 3,469 | 5,030,050 | (6,938 | ) | ||||||||
| Marathon Petroleum Corporation | September 2019 | 51.50 | 1,137 | 5,855,550 | (90,960 | ) | ||||||||
| Noble Energy, Inc. | September 2019 | 25.40 | 1,776 | 4,511,040 | (15,698 | ) | ||||||||
| Occidental Petroleum Corporation | September 2019 | 52.00 | 649 | 3,374,800 | (3,894 | ) | ||||||||
| Parsley Energy, Inc. | September 2019 | 18.45 | 2,417 | 4,459,365 | (145,466 | ) | ||||||||
| Pioneer Natural Resources Company | September 2019 | 145.00 | 425 | 6,162,500 | (6,375 | ) | ||||||||
| Range Resources Corporation | September 2019 | 4.85 | 6,643 | 3,221,855 | (31,160 | ) | ||||||||
| Valero Energy Corporation | September 2019 | 86.00 | 494 | 4,248,400 | (2,223 | ) | ||||||||
| Viper Energy Partners LP | September 2019 | 32.25 | 700 | 2,257,500 | (5,667 | ) | ||||||||
| WPX Energy, Inc. | September 2019 | 11.70 | 2,797 | 3,272,490 | (44,639 | ) | ||||||||
| Total Value of Call Options Written (Premiums received $522,692) | $ | 80,065,070 | $ | (461,810 | ) | |||||||||
| TEAF | ||||||||||||||
| Call Options Written | Expiration Date | Strike Price | Contracts | Notional Value | Fair Value | |||||||||
| Cabot Oil & Gas Corporation | September 2019 | $ | 17.75 | 2,156 | $ | 3,826,900 | $ | (50,516 | ) | |||||
| Cheniere Energy Inc. | September 2019 | 64.25 | 859 | 5,519,075 | (13,843 | ) | ||||||||
| Cimarex Energy Co. | September 2019 | 44.00 | 537 | 2,362,800 | (94,277 | ) | ||||||||
| EQT Corporation | September 2019 | 13.30 | 2,733 | 3,634,890 | (3,134 | ) | ||||||||
| Noble Energy, Inc. | September 2019 | 23.00 | 2,240 | 5,152,000 | (151,041 | ) | ||||||||
| Targa Resources Corp. | September 2019 | 36.50 | 1,360 | 4,964,000 | (129,253 | ) | ||||||||
| Total Value of Call Options Written (Premiums received $438,286) | $ | 25,459,665 | $ | (442,064 | ) | |||||||||
See accompanying Notes to Financial Statements.
| Tortoise | 39 |
| Statements of Assets & Liabilities (unaudited) |
| August 31, 2019 |
| Tortoise Energy | Tortoise | |||||
| Infrastructure | Midstream Energy | |||||
| Corp.(1) | Fund, Inc. | |||||
| Assets | ||||||
| Investments in unaffiliated securities at fair value(2) | $ | 1,926,947,225 | $ | 1,374,601,245 | ||
| Investments in affiliated securities at fair value(3) | 12,153,147 | — | ||||
| Cash | — | — | ||||
| Receivable for Adviser fee waiver | — | — | ||||
| Receivable for investments sold | 535,218 | 3,047,684 | ||||
| Receivable for premiums on options written | — | — | ||||
| Unrealized appreciation of interest rate swap contracts, net | — | — | ||||
| Unrealized appreciation of forward currency contracts | — | — | ||||
| Dividends, distributions and interest receivable from investments | 920,580 | 588,875 | ||||
| Tax reclaims receivable | — | — | ||||
| Escrow receivable | 1,617,491 | — | ||||
| Current tax asset | 6,440,990 | 1,900,857 | ||||
| Tax payment receivable | 1,500,023 | — | ||||
| Prepaid expenses and other assets | 920,704 | 307,288 | ||||
| Total assets | 1,951,035,378 | 1,380,445,949 | ||||
| Liabilities | ||||||
| Call options written, at fair value(4) | 185,860 | 282,953 | ||||
| Payable to Adviser | 3,325,287 | 2,353,657 | ||||
| Accrued directors' fees and expenses | 53,246 | 47,843 | ||||
| Payable for investments purchased | 350,317 | 3,369,155 | ||||
| Accrued expenses and other liabilities | 6,011,671 | 4,519,538 | ||||
| Unrealized depreciation of interest rate swap contracts | 206,016 | — | ||||
| Deferred tax liability | 155,918,012 | 56,201,853 | ||||
| Credit facility borrowings | 143,900,000 | 84,100,000 | ||||
| Senior notes, net(5) | 379,529,925 | 311,714,855 | ||||
| Mandatory redeemable preferred stock, net(6) | 164,066,154 | 131,562,461 | ||||
| Total liabilities | 853,546,488 | 594,152,315 | ||||
| Net assets applicable to common stockholders | $ | 1,097,488,890 | $ | 786,293,634 | ||
| Net Assets Applicable to Common Stockholders Consist of: | ||||||
| Capital stock, $0.001 par value per share | $ | 53,732 | $ | 63,208 | ||
| Additional paid-in capital | 732,302,133 | 621,577,445 | ||||
| Total distributable earnings (loss) | 365,133,025 | 164,652,981 | ||||
| Net assets applicable to common stockholders | $ | 1,097,488,890 | $ | 786,293,634 | ||
| Capital shares: | ||||||
| Authorized | 100,000,000 | 100,000,000 | ||||
| Outstanding | 53,732,462 | 63,208,377 | ||||
| Net Asset Value per common share outstanding (net assets applicable to common stock, divided by common shares outstanding) |
$ | 20.43 | $ | 12.44 | ||
| (1) Consolidated Statement of Assets and Liabilities (See Note 13 to the financial statements for further disclosure) |
||||||
| (2) Investments in unaffiliated securities at cost | $ | 1,918,224,027 | $ | 1,412,884,359 | ||
| (3) Investments in affiliated securities at cost | $ | 54,481,470 | $ | — | ||
| (4) Call options written, premiums received | $ | 212,009 | $ | 323,847 | ||
| (5) Deferred debt issuance and offering costs | $ | 470,075 | $ | 285,145 | ||
| (6) Deferred offering costs | $ | 933,846 | $ | 437,539 | ||
See accompanying Notes to Financial Statements.
| 40 | Tortoise |
| 2019 3rd Quarter Report | August 31, 2019 |
| Tortoise Power | Tortoise | ||||||||||||
| Tortoise Pipeline | Tortoise Energy | and Energy | Essential Assets | ||||||||||
| & Energy | Independence | Infrastructure | Income Term | ||||||||||
| Fund, Inc. | Fund, Inc. | Fund, Inc. | Fund(1) | ||||||||||
| $ | 206,607,162 | $ | 94,902,650 | $ | 188,267,991 | $ | 265,782,103 | ||||||
| — | — | — | 8,098,695 | ||||||||||
| — | — | — | 53,845 | ||||||||||
| — | — | — | 120,233 | ||||||||||
| — | — | — | — | ||||||||||
| — | — | — | — | ||||||||||
| — | — | 1,934 | — | ||||||||||
| — | — | — | 348,075 | ||||||||||
| 374,155 | 154,090 | 1,734,797 | 2,086,427 | ||||||||||
| — | — | 12,238 | 239,170 | ||||||||||
| — | — | — | — | ||||||||||
| — | — | — | — | ||||||||||
| — | — | — | — | ||||||||||
| 91,086 | 21,411 | 14,994 | 7,684 | ||||||||||
| 207,072,403 | 95,078,151 | 190,031,954 | 276,736,232 | ||||||||||
| 133,191 | 461,810 | — | 442,064 | ||||||||||
| 402,175 | 203,635 | 309,984 | 649,255 | ||||||||||
| 39,175 | 38,407 | 37,283 | 26,348 | ||||||||||
| 1,012,131 | — | — | — | ||||||||||
| 686,492 | 352,262 | 478,150 | 236,934 | ||||||||||
| — | — | — | — | ||||||||||
| — | — | — | — | ||||||||||
| 11,500,000 | 28,700,000 | 56,100,000 | 31,500,000 | ||||||||||
| 33,918,037 | — | — | — | ||||||||||
| 15,917,853 | — | — | — | ||||||||||
| 63,609,054 | 29,756,114 | 56,925,417 | 32,854,601 | ||||||||||
| $ | 143,463,349 | $ | 65,322,037 | $ | 133,106,537 | $ | 243,881,631 | ||||||
| $ | 10,016 | $ | 14,768 | $ | 6,951 | $ | 13,491 | ||||||
| 195,060,316 | 225,251,098 | 128,037,640 | 267,507,456 | ||||||||||
| (51,606,983 | ) | (159,943,829 | ) | 5,061,946 | (23,639,316 | ) | |||||||
| $ | 143,463,349 | $ | 65,322,037 | $ | 133,106,537 | $ | 243,881,631 | ||||||
| 100,000,000 | 100,000,000 | 100,000,000 | 100,000,000 | ||||||||||
| 10,016,413 | 14,767,968 | 6,951,333 | 13,491,127 | ||||||||||
| $ | 14.32 | $ | 4.42 | $ | 19.15 | $ | 18.08 | ||||||
| $ | 234,808,309 | $ | 116,480,082 | $ | 183,219,430 | $ | 288,658,929 | ||||||
| $ | — | $ | — | $ | — | $ | 8,098,695 | ||||||
| $ | 129,875 | $ | 522,692 | $ | — | $ | 438,286 | ||||||
| $ | 81,963 | $ | — | $ | — | $ | — | ||||||
| $ | 82,147 | $ | — | $ | — | $ | — | ||||||
See accompanying Notes to Financial Statements.
| Tortoise | 41 |
| Statements of Operations (unaudited) |
| Period from December 1, 2018 through August 31, 2019 |
| Tortoise Energy | Tortoise | |||||||
| Infrastructure | Midstream Energy | |||||||
| Corp.(1) | Fund, Inc. | |||||||
| Investment Income | ||||||||
| Distributions from master limited partnerships | $ | 99,538,592 | $ | 71,887,447 | ||||
| Dividends and distributions from common stock | 24,269,182 | 18,596,920 | ||||||
| Dividends and distributions from preferred stock | 6,217,383 | 4,084,759 | ||||||
| Dividends and distributions from electronically traded funds | — | — | ||||||
| Dividends and distributions from private investments | 23,215,960 | — | ||||||
| Less return of capital on distributions(3) | (133,080,329 | ) | (84,572,940 | ) | ||||
| Less foreign taxes withheld | — | — | ||||||
| Net dividends and distributions from investments | 20,160,788 | 9,996,186 | ||||||
| Interest from corporate bonds | 119,236 | 84,927 | ||||||
| Dividends from money market mutual funds | 6,837 | 5,625 | ||||||
| Other income | 1,533,755 | — | ||||||
| Total Investment Income | 21,820,616 | 10,086,738 | ||||||
| Operating Expenses | ||||||||
| Advisory fees | 15,059,035 | 10,689,818 | ||||||
| Administrator fees | 370,089 | 344,427 | ||||||
| Professional fees | 273,692 | 182,361 | ||||||
| Directors' fees | 136,743 | 117,209 | ||||||
| Stockholder communication expenses | 136,719 | 92,586 | ||||||
| Custodian fees and expenses | 79,644 | 57,514 | ||||||
| Fund accounting fees | 65,837 | 59,554 | ||||||
| Registration fees | 41,851 | 46,341 | ||||||
| Stock transfer agent fees | 10,755 | 11,272 | ||||||
| Franchise fees | 2,891 | — | ||||||
| Other operating expenses | 123,486 | 58,494 | ||||||
| Total Operating Expenses | 16,300,742 | 11,659,576 | ||||||
| Leverage Expenses | ||||||||
| Interest expense | 13,831,955 | 11,154,881 | ||||||
| Distributions to mandatory redeemable preferred stockholders | 5,189,999 | 4,023,716 | ||||||
| Amortization of debt issuance costs | 311,582 | 188,327 | ||||||
| Other leverage expenses | 191,766 | 83,528 | ||||||
| Total Leverage Expenses | 19,525,302 | 15,450,452 | ||||||
| Total Expenses | 35,826,044 | 27,110,028 | ||||||
| Less fees waived by Adviser (Note 4) | (16,438 | ) | (303,806 | ) | ||||
| Net Expenses | 35,809,606 | 26,806,222 | ||||||
| Net Investment Income (Loss), before Income Taxes | (13,988,990 | ) | (16,719,484 | ) | ||||
| Deferred tax benefit | 2,025,806 | 2,915,040 | ||||||
| Net Investment Income (Loss) | (11,963,184 | ) | (13,804,444 | ) | ||||
| Realized and Unrealized Gain (Loss) on Investments and Foreign Currency | ||||||||
| Net realized gain (loss) on investments in unaffiliated securities | 36,883,848 | (36,782,063 | ) | |||||
| Net realized gain on options | 2,261,003 | 2,259,938 | ||||||
| Net realized gain on interest rate swap settlements | 4,736 | — | ||||||
| Net realized gain on currency futures | — | — | ||||||
| Net realized gain (loss) on foreign currency and translation of other assets and liabilities denominated in foreign currency |
— | — | ||||||
| Net realized gain (loss), before income taxes | 39,149,587 | (34,522,125 | ) | |||||
| Current tax (expense) benefit | (9,586,530 | ) | 1,413,172 | |||||
| Deferred tax benefit | 6,027,116 | 6,572,585 | ||||||
| Income tax (expense) benefit | (3,559,414 | ) | 7,985,757 | |||||
| Net realized gain (loss) | 35,590,173 | (26,536,368 | ) | |||||
| Net unrealized appreciation (depreciation) of investments in unaffiliated securities | (98,095,740 | ) | (11,090,501 | ) | ||||
| Net unrealized depreciation of investments in affiliated securities | (10,663,386 | ) | — | |||||
| Net unrealized appreciation (depreciation) of options | 454,416 | 343,812 | ||||||
| Net unrealized depreciation of interest rate swap contracts | (314,899 | ) | — | |||||
| Net unrealized appreciation of forward currency contracts | — | — | ||||||
| Net unrealized appreciation (depreciation) of other assets and liabilities due to foreign currency translation | — | — | ||||||
| Net unrealized appreciation (depreciation), before income taxes | (108,619,609 | ) | (10,746,689 | ) | ||||
| Deferred tax benefit | 25,591,593 | 2,485,955 | ||||||
| Net unrealized appreciation (depreciation) | (83,028,016 | ) | (8,260,734 | ) | ||||
| Net Realized and Unrealized Gain (Loss) | (47,437,843 | ) | (34,797,102 | ) | ||||
| Net Increase (Decrease) in Net Assets Applicable to Common Stockholders Resulting from Operations |
$ | (59,401,027 | ) | $ | (48,601,546 | ) | ||
| (1) | Consolidated Statement of Operations (See Note 13 to the financial statements for further disclosure). |
| (2) | Fund commenced operations on March 29, 2019. |
| (3) | Return of Capital may be in excess of current year distributions due to prior year adjustments. See Note 2 to the financial statements for further disclosure. |
See accompanying Notes to Financial Statements.
| 42 | Tortoise |
| 2019 3rd Quarter Report | August 31, 2019 |
| Tortoise Power | Tortoise | ||||||||||||||
| Tortoise Pipeline | Tortoise Energy | and Energy | Essential Assets | ||||||||||||
| & Energy | Independence | Infrastructure | Income Term | ||||||||||||
| Fund, Inc. | Fund, Inc. | Fund, Inc. | Fund(1)(2) | ||||||||||||
| $ | 3,557,108 | $ | 783,816 | $ | 2,934,592 | $ | 2,290,697 | ||||||||
| 7,945,155 | 1,249,108 | 2,436,397 | 4,369,908 | ||||||||||||
| 349,680 | 142,286 | 320,297 | 170,098 | ||||||||||||
| — | — | — | 810,716 | ||||||||||||
| — | — | — | — | ||||||||||||
| (8,512,060 | ) | (1,176,895 | ) | (4,672,231 | ) | (3,606,269 | ) | ||||||||
| (294,331 | ) | (5,332 | ) | (31,734 | ) | (300,515 | ) | ||||||||
| 3,045,552 | 992,983 | 987,321 | 3,734,635 | ||||||||||||
| — | — | 4,106,292 | 1,712,051 | ||||||||||||
| 4,578 | 12,497 | 3,899 | 103,255 | ||||||||||||
| — | — | — | — | ||||||||||||
| 3,050,130 | 1,005,480 | 5,097,512 | 5,549,941 | ||||||||||||
| 1,851,100 | 1,173,290 | 1,384,988 | 1,642,451 | ||||||||||||
| 77,219 | 52,540 | 67,781 | 45,840 | ||||||||||||
| 113,629 | 109,543 | 116,809 | 99,448 | ||||||||||||
| 87,212 | 84,348 | 82,729 | 26,348 | ||||||||||||
| 49,608 | 34,352 | 66,673 | 26,436 | ||||||||||||
| 13,438 | 11,189 | 8,774 | 18,089 | ||||||||||||
| 35,310 | 29,331 | 22,192 | 15,166 | ||||||||||||
| 18,705 | 18,922 | 18,304 | 17,459 | ||||||||||||
| 10,078 | 9,628 | 11,875 | 6,964 | ||||||||||||
| — | — | — | — | ||||||||||||
| 27,444 | 25,799 | 16,379 | 11,263 | ||||||||||||
| 2,283,743 | 1,548,942 | 1,796,504 | 1,909,464 | ||||||||||||
| 1,333,004 | 1,013,041 | 1,325,616 | 391,080 | ||||||||||||
| 552,743 | — | — | — | ||||||||||||
| 31,269 | — | — | — | ||||||||||||
| 14,541 | — | — | — | ||||||||||||
| 1,931,557 | 1,013,041 | 1,325,616 | 391,080 | ||||||||||||
| 4,215,300 | 2,561,983 | 3,122,120 | 2,300,544 | ||||||||||||
| — | — | — | (304,159 | ) | |||||||||||
| 4,215,300 | 2,561,983 | 3,122,120 | 1,996,385 | ||||||||||||
| (1,165,170 | ) | (1,556,503 | ) | 1,975,392 | 3,553,556 | ||||||||||
| — | — | — | — | ||||||||||||
| (1,165,170 | ) | (1,556,503 | ) | 1,975,392 | 3,553,556 | ||||||||||
| (15,183,852 | ) | (86,045,509 | ) | 451,901 | (3,177,310 | ) | |||||||||
| 920,668 | 5,434,779 | — | 1,901,830 | ||||||||||||
| — | — | 68,860 | — | ||||||||||||
| — | — | — | 246,833 | ||||||||||||
| 1,253 | — | — | (62,084 | ) | |||||||||||
| (14,261,931 | ) | (80,610,730 | ) | 520,761 | (1,090,731 | ) | |||||||||
| — | — | — | — | ||||||||||||
| — | — | — | — | ||||||||||||
| — | — | — | — | ||||||||||||
| (14,261,931 | ) | (80,610,730 | ) | 520,761 | (1,090,731 | ) | |||||||||
| 7,022,243 | 30,336,267 | 1,232,902 | (21,106,829 | ) | |||||||||||
| — | — | — | — | ||||||||||||
| (316,310 | ) | (1,511,100 | ) | — | (3,778 | ) | |||||||||
| — | — | (126,696 | ) | — | |||||||||||
| — | — | — | 348,075 | ||||||||||||
| 880 | — | — | (1,786,053 | ) | |||||||||||
| 6,706,813 | 28,825,167 | 1,106,206 | (22,548,585 | ) | |||||||||||
| — | — | — | — | ||||||||||||
| 6,706,813 | 28,825,167 | 1,106,206 | (22,548,585 | ) | |||||||||||
| (7,555,118 | ) | (51,785,563 | ) | 1,626,967 | (23,639,316 | ) | |||||||||
| $ | (8,720,288 | ) | $ | (53,342,066 | ) | $ | 3,602,359 | $ | (20,085,760 | ) | |||||
| See accompanying Notes to Financial Statements. | |
| Tortoise | 43 |
| Statements of Changes in Net Assets |
| Tortoise Energy Infrastructure Corp.(1) | Tortoise Midstream Energy Fund, Inc. | |||||||||||||||
| Period From | Period From | |||||||||||||||
| December 1, 2018 | Year Ended | December 1, 2018 | Year Ended | |||||||||||||
| through | November 30, | through | November 30, | |||||||||||||
| August 31, 2019 | 2018 | August 31, 2019 | 2018 | |||||||||||||
| (unaudited) | (unaudited) | |||||||||||||||
| Operations | ||||||||||||||||
| Net investment income (loss) | $ | (11,963,184 | ) | $ | (25,739,125 | ) | $ | (13,804,444 | ) | $ | (22,743,508 | ) | ||||
| Net realized gain (loss) | 35,590,173 | 42,564,712 | (26,536,368 | ) | 46,530,162 | |||||||||||
| Net unrealized appreciation (depreciation) | (83,028,016 | ) | 79,528,704 | (8,260,734 | ) | (946,809 | ) | |||||||||
| Net increase (decrease) in net assets | ||||||||||||||||
| applicable to common stockholders resulting | ||||||||||||||||
| from operations | (59,401,027 | ) | 96,354,291 | (48,601,546 | ) | 22,839,845 | ||||||||||
| Distributions to Common Stockholders | ||||||||||||||||
| From distributable earnings | — | — | — | — | ||||||||||||
| From tax return of capital | (105,392,879 | ) | (138,297,758 | ) | (80,116,618 | ) | (86,693,300 | ) | ||||||||
| Total distributions to common stockholders | (105,392,879 | ) | (138,297,758 | ) | (80,116,618 | ) | (86,693,300 | ) | ||||||||
| Capital Stock Transactions | ||||||||||||||||
| Proceeds from issuance of common shares | ||||||||||||||||
| through offerings | — | 114,529,368 | — | 230,973,008 | ||||||||||||
| Underwriting discounts and offering expenses | ||||||||||||||||
| associated with the issuance of common stock | (6,953 | ) | (349,970 | ) | (21,176 | ) | (8,891,735 | ) | ||||||||
| Issuance of common shares from reinvestment | ||||||||||||||||
| of distributions to stockholders | 1,990,045 | 6,535,303 | — | 2,720,036 | ||||||||||||
| Net increase (decrease) in net assets applicable | ||||||||||||||||
| to common stockholders from capital stock | ||||||||||||||||
| transactions | 1,983,092 | 120,714,701 | (21,176 | ) | 224,801,309 | |||||||||||
| Total increase (decrease) in net assets applicable | ||||||||||||||||
| to common stockholders | (162,810,814 | ) | 78,771,234 | (128,739,340 | ) | 160,947,854 | ||||||||||
| Net Assets | ||||||||||||||||
| Beginning of period | 1,260,299,704 | 1,181,528,470 | 915,032,974 | 754,085,120 | ||||||||||||
| End of period | $ | 1,097,488,890 | $ | 1,260,299,704 | $ | 786,293,634 | $ | 915,032,974 | ||||||||
| Transactions in common shares | ||||||||||||||||
| Shares outstanding at beginning of period | 53,635,054 | 49,379,408 | 63,208,377 | 47,246,780 | ||||||||||||
| Shares issued through offerings | — | 4,013,693 | — | 15,802,094 | ||||||||||||
| Shares issued through reinvestment of distributions | 97,408 | 241,953 | — | 159,503 | ||||||||||||
| Shares outstanding at end of period | 53,732,462 | 53,635,054 | 63,208,377 | 63,208,377 | ||||||||||||
| (1) | Consolidated Statement of Changes in Net Assets (See Note 13 to the financial statements for further disclosure). |
| (2) | Commencement of operations. |
| See accompanying Notes to Financial Statements. | |
| 44 | Tortoise |
| 2019 3rd Quarter Report | August 31, 2019 |
| Tortoise | |||||||||||||||||||||||||||
| Essential Assets | |||||||||||||||||||||||||||
| Tortoise Power and Energy | Income Term | ||||||||||||||||||||||||||
| Tortoise Pipeline & Energy Fund, Inc. | Tortoise Energy Independence Fund, Inc. | Infrastructure Fund, Inc. | Fund(1) | ||||||||||||||||||||||||
| Period From | Period From | Period From | Period from | ||||||||||||||||||||||||
| December 1, 2018 | Year Ended | December 1, 2018 | Year Ended | December 1, 2018 | Year Ended | March 29, 2019(2) | |||||||||||||||||||||
| through | November 30, | through | November 30, | through | November 30, | through | |||||||||||||||||||||
| August 31, 2019 | 2018 | August 31, 2019 | 2018 | August 31, 2019 | 2018 | August 31, 2019 | |||||||||||||||||||||
| (unaudited) | (unaudited) | (unaudited) | (unaudited) | ||||||||||||||||||||||||
| $ | (1,165,170 | ) | $ | (1,506,036 | ) | $ | (1,556,503 | ) | $ | (4,228,300 | ) | $ | 1,975,392 | $ | 1,683,994 | $ | 3,553,556 | ||||||||||
| (14,261,931 | ) | (374,310 | ) | (80,610,730 | ) | 3,657,227 | 520,761 | 9,007,176 | (1,090,731 | ) | |||||||||||||||||
| 6,706,813 | (7,108,381 | ) | 28,825,167 | (30,476,293 | ) | 1,106,206 | (11,182,556 | ) | (22,548,585 | ) | |||||||||||||||||
| (8,720,288 | ) | (8,988,727 | ) | (53,342,066 | ) | (31,047,366 | ) | 3,602,359 | (491,386 | ) | (20,085,760 | ) | |||||||||||||||
| (272,551 | ) | (428,639 | ) | — | — | (6,883,592 | ) | (10,427,000 | ) | (3,553,556 | ) | ||||||||||||||||
| (10,745,503 | ) | (15,898,114 | ) | (14,352,036 | ) | (25,586,654 | ) | (936,658 | ) | — | (2,301,593 | ) | |||||||||||||||
| (11,018,054 | ) | (16,326,753 | ) | (14,352,036 | ) | (25,586,654 | ) | (7,820,250 | ) | (10,427,000 | ) | (5,855,149 | ) | ||||||||||||||
| — | — | — | — | — | — | 269,722,540 | |||||||||||||||||||||
| — | — | — | — | — | — | — | |||||||||||||||||||||
| — | — | 527,905 | 1,233,701 | — | — | — | |||||||||||||||||||||
| — | — | 527,905 | 1,233,701 | — | — | 269,722,540 | |||||||||||||||||||||
| (19,738,342 | ) | (25,315,480 | ) | (67,166,197 | ) | (55,400,319 | ) | (4,217,891 | ) | (10,918,386 | ) | 243,781,631 | |||||||||||||||
| 163,201,691 | 188,517,171 | 132,488,234 | 187,888,553 | 137,324,428 | 148,242,814 | 100,000 | |||||||||||||||||||||
| $ | 143,463,349 | $ | 163,201,691 | $ | 65,322,037 | $ | 132,488,234 | $ | 133,106,537 | $ | 137,324,428 | $ | 243,881,631 | ||||||||||||||
| 10,016,413 | 10,016,413 | 14,696,260 | 14,583,662 | 6,951,333 | 6,951,333 | — | |||||||||||||||||||||
| — | — | — | — | — | — | 13,491,127 | |||||||||||||||||||||
| — | — | 71,708 | 112,598 | — | — | — | |||||||||||||||||||||
| 10,016,413 | 10,016,413 | 14,767,968 | 14,696,260 | 6,951,333 | 6,951,333 | 13,491,127 | |||||||||||||||||||||
| See accompanying Notes to Financial Statements. | |
| Tortoise | 45 |
| Statements of Cash Flows (unaudited) |
| Period from December 1, 2018 through August 31, 2019 |
| Tortoise Energy | Tortoise | |||||||
| Infrastructure | Midstream Energy | |||||||
| Corp.(1) | Fund, Inc. | |||||||
| Cash Flows From Operating Activities | ||||||||
| Dividends, distributions and interest received from investments | $ | 152,905,899 | $ | 94,312,211 | ||||
| Purchases of long-term investments | (513,393,531 | ) | (369,095,270 | ) | ||||
| Proceeds from sales of long-term investments | 464,399,158 | 367,692,206 | ||||||
| Sales (purchases) of short-term investments, net | (39,873 | ) | 185,126 | |||||
| Call options written, net | 2,001,569 | 2,233,241 | ||||||
| Payments on interest rate swap contracts, net | 4,736 | — | ||||||
| Payments on forward currency contracts, net | — | — | ||||||
| Other income received | — | — | ||||||
| Interest received on securities sold, net | — | — | ||||||
| Interest expense paid | (14,500,479 | ) | (10,785,292 | ) | ||||
| Distributions to mandatory redeemable preferred stockholders | (6,920,000 | ) | (4,026,398 | ) | ||||
| Other leverage expenses paid | (294,470 | ) | (152,985 | ) | ||||
| Income taxes paid | (1,147,941 | ) | (20,000 | ) | ||||
| Premium on redemption of senior notes | — | — | ||||||
| Premium on redemption of mandatory redeemable preferred stock | — | — | ||||||
| Operating expenses paid | (16,405,283 | ) | (11,123,889 | ) | ||||
| Net cash provided by (used in) operating activities | 66,609,785 | 69,218,950 | ||||||
| Cash Flows From Financing Activities | ||||||||
| Advances (payments) on credit facilities, net | 36,800,000 | 11,000,000 | ||||||
| Debt issuance costs | — | (81,156 | ) | |||||
| Issuance of common stock | — | — | ||||||
| Common stock issuance costs | (6,953 | ) | (21,176 | ) | ||||
| Distributions paid to common stockholders | (103,402,832 | ) | (80,116,618 | ) | ||||
| Net cash provided by (used in) financing activities | (66,609,785 | ) | (69,218,950 | ) | ||||
| Net change in cash | — | — | ||||||
| Cash — beginning of period | — | — | ||||||
| Cash — end of period | $ | — | $ | — | ||||
| (1) | Consolidated Statement of Cash Flows (See Note 13 to the financial statements for further disclosure). |
| (2) | Fund commenced operations on March 29, 2019. |
| See accompanying Notes to Financial Statements. | |
| 46 | Tortoise |
| 2019 3rd Quarter Report | August 31, 2019 |
| Tortoise Power | Tortoise | ||||||||||||||
| Tortoise Pipeline | Tortoise Energy | and Energy | Essential Assets | ||||||||||||
| & Energy | Independence | Infrastructure | Income Term | ||||||||||||
| Fund, Inc. | Fund, Inc. | Fund, Inc. | Fund(1)(2) | ||||||||||||
| $ | 11,777,793 | $ | 2,067,936 | $ | 9,775,881 | $ | 7,576,970 | ||||||||
| (42,434,267 | ) | (210,096,654 | ) | (32,896,554 | ) | (352,352,729 | ) | ||||||||
| 53,750,309 | 249,480,169 | 30,954,095 | 52,689,807 | ||||||||||||
| 59,701 | 59,708 | 125,382 | (3,838,731 | ) | |||||||||||
| 537,767 | 3,550,482 | — | 2,340,442 | ||||||||||||
| — | — | 68,860 | — | ||||||||||||
| — | — | — | 246,833 | ||||||||||||
| — | — | — | — | ||||||||||||
| — | — | 129,682 | (865,909 | ) | |||||||||||
| (1,417,045 | ) | (1,154,595 | ) | (1,314,856 | ) | (310,439 | ) | ||||||||
| (539,231 | ) | — | — | — | |||||||||||
| — | — | — | — | ||||||||||||
| — | — | — | — | ||||||||||||
| — | — | — | — | ||||||||||||
| — | — | — | — | ||||||||||||
| (2,273,892 | ) | (1,682,897 | ) | (1,722,240 | ) | (899,790 | ) | ||||||||
| 19,461,135 | 42,224,149 | 5,120,250 | (295,413,546 | ) | |||||||||||
| (8,300,000 | ) | (28,400,000 | ) | 2,700,000 | 31,500,000 | ||||||||||
| (143,081 | ) | — | — | — | |||||||||||
| — | — | — | 269,822,540 | ||||||||||||
| — | — | — | — | ||||||||||||
| (11,018,054 | ) | (13,824,149 | ) | (7,820,250 | ) | (5,855,149 | ) | ||||||||
| (19,461,135 | ) | (42,224,149 | ) | (5,120,250 | ) | 295,467,391 | |||||||||
| — | — | — | 53,845 | ||||||||||||
| — | — | — | — | ||||||||||||
| $ | — | $ | — | $ | — | $ | 53,845 | ||||||||
| See accompanying Notes to Financial Statements. | |
| Tortoise | 47 |
| Statements of Cash Flows (unaudited) (continued) |
| Period from December 1, 2018 through August 31, 2019 |
| Tortoise Energy | Tortoise | |||||||
| Infrastructure | Midstream Energy | |||||||
| Corp.(1) | Fund, Inc. | |||||||
| Reconciliation of net increase (decrease) in net assets applicable to common stockholders | ||||||||
| resulting from operations to net cash provided by (used in) operating activities | ||||||||
| Net increase (decrease) in net assets applicable to common stockholders resulting from operations | $ | (59,401,027 | ) | $ | (48,601,546 | ) | ||
| Adjustments to reconcile net increase (decrease) in net assets applicable to common stockholders | ||||||||
| resulting from operations to net cash provided by (used in) operating activities: | ||||||||
| Purchases of long-term investments | (490,499,665 | ) | (372,464,425 | ) | ||||
| Proceeds from sales of long-term investments | 464,934,376 | 370,739,890 | ||||||
| Sales (purchases) of short-term investments, net | (39,873 | ) | 185,126 | |||||
| Call options written, net | 2,001,569 | 2,233,241 | ||||||
| Return of capital on distributions received | 133,080,329 | 84,572,940 | ||||||
| Deferred tax benefit | (33,644,515 | ) | (11,973,580 | ) | ||||
| Net unrealized (appreciation) depreciation | 108,619,609 | 10,746,689 | ||||||
| Amortization (accretion) of market premium (discount), net | (5,574 | ) | (4,020 | ) | ||||
| Net realized (gain) loss | (39,144,851 | ) | 34,522,125 | |||||
| Amortization of debt issuance costs | 311,582 | 188,327 | ||||||
| Changes in operating assets and liabilities: | ||||||||
| (Increase) decrease in dividends, distributions and interest receivable from investments | (489,443 | ) | (343,447 | ) | ||||
| (Increase) Decrease in current tax asset | 8,438,589 | (1,433,172 | ) | |||||
| (Increase) Decrease in tax payment receivable | (1,500,023 | ) | — | |||||
| Increase in receivable for investments sold | (535,218 | ) | (3,047,684 | ) | ||||
| (Increase) decrease in prepaid expenses and other assets | (169,535 | ) | (133,028 | ) | ||||
| Increase (decrease) in payable for investments purchased | (22,893,866 | ) | 3,369,155 | |||||
| Increase (decrease) in payable to Adviser, net of fees waived | (204,401 | ) | 203,216 | |||||
| Increase (decrease) in accrued expenses and other liabilities | (2,248,278 | ) | 459,143 | |||||
| Total adjustments | 126,010,812 | 117,820,496 | ||||||
| Net cash provided by (used in) operating activities | $ | 66,609,785 | $ | 69,218,950 | ||||
| Non-Cash Financing Activities | ||||||||
| Reinvestment of distributions by common stockholders in additional common shares | $ | 1,990,045 | $ | — | ||||
| (1) | Consolidated Statement of Cash Flows (See Note 13 to the financial statements for further disclosure). |
| (2) | Fund commenced operations on March 29, 2019. |
| See accompanying Notes to Financial Statements. | |
| 48 | Tortoise |
| 2019 3rd Quarter Report | August 31, 2019 |
| Tortoise Power | Tortoise | ||||||||||||||
| Tortoise Pipeline | Tortoise Energy | and Energy | Essential Assets | ||||||||||||
| & Energy | Independence | Infrastructure | Income Term | ||||||||||||
| Fund, Inc. | Fund, Inc. | Fund, Inc. | Fund(1)(2) | ||||||||||||
| $ | (8,720,288 | ) | $ | (53,342,066 | ) | $ | 3,602,359 | $ | (20,085,760 | ) | |||||
| (42,508,724 | ) | (210,096,654 | ) | (32,449,276 | ) | (352,352,729 | ) | ||||||||
| 53,750,309 | 249,480,169 | 30,757,483 | 52,689,807 | ||||||||||||
| 59,701 | 59,708 | 125,382 | (3,838,731 | ) | |||||||||||
| 537,767 | 3,550,482 | — | 2,340,442 | ||||||||||||
| 8,512,060 | 1,176,895 | 4,672,231 | 3,606,269 | ||||||||||||
| — | — | — | — | ||||||||||||
| (6,706,813 | ) | (28,825,167 | ) | (1,106,206 | ) | 22,548,585 | |||||||||
| — | — | 255,872 | (53,135 | ) | |||||||||||
| 14,261,931 | 80,610,730 | (451,901 | ) | 1,337,564 | |||||||||||
| 31,269 | — | — | — | ||||||||||||
| 215,603 | (114,439 | ) | (120,052 | ) | (2,392,014 | ) | |||||||||
| — | — | — | — | ||||||||||||
| — | — | — | — | ||||||||||||
| — | — | 196,612 | — | ||||||||||||
| (1,706 | ) | (8,535 | ) | (5,916 | ) | (7,684 | ) | ||||||||
| 74,457 | — | (447,278 | ) | — | |||||||||||
| (54,245 | ) | (195,560 | ) | (3,276 | ) | 529,022 | |||||||||
| 9,814 | (71,414 | ) | 94,216 | 264,818 | |||||||||||
| 28,181,423 | 95,566,215 | 1,517,891 | (275,327,786 | ) | |||||||||||
| $ | 19,461,135 | $ | 42,224,149 | $ | 5,120,250 | $ | (295,413,546 | ) | |||||||
| $ | — | $ | 527,905 | $ | — | $ | — | ||||||||
| See accompanying Notes to Financial Statements. | |
| Tortoise | 49 |
| TYG Financial Highlights |
| Period from | ||||||||||||||||||||||||
| December 1, 2018 | Year Ended | Year Ended | Year Ended | Year Ended | Year Ended | |||||||||||||||||||
| through | November 30, | November 30, | November 30, | November 30, | November 30, | |||||||||||||||||||
| August 31, 2019 | 2018 | 2017 | 2016 | 2015 | 2014 | |||||||||||||||||||
| (unaudited) | ||||||||||||||||||||||||
| Per Common Share Data(1) | ||||||||||||||||||||||||
| Net Asset Value, beginning of period | $ | 23.50 | $ | 23.93 | $ | 28.83 | $ | 29.28 | $ | 49.34 | $ | 43.36 | ||||||||||||
| Income (Loss) from Investment Operations | ||||||||||||||||||||||||
| Net investment loss(2) | (0.22 | ) | (0.49 | ) | (0.65 | ) | (0.78 | ) | (0.62 | ) | (0.66 | ) | ||||||||||||
| Net realized and unrealized gain (loss) | ||||||||||||||||||||||||
| on investments and interest rate | ||||||||||||||||||||||||
| swap contracts(2) | (0.88 | ) | 2.59 | (1.64 | ) | 2.94 | (16.85 | ) | 9.01 | |||||||||||||||
| Total income (loss) from investment | ||||||||||||||||||||||||
| operations | (1.10 | ) | 2.10 | (2.29 | ) | 2.16 | (17.47 | ) | 8.35 | |||||||||||||||
| Distributions to Common Stockholders | ||||||||||||||||||||||||
| From return of capital | (1.97 | ) | (2.62 | ) | (2.62 | ) | (2.62 | ) | (2.59 | ) | (2.38 | ) | ||||||||||||
| Capital Stock Transactions | ||||||||||||||||||||||||
| Premiums less underwriting discounts | ||||||||||||||||||||||||
| and offering costs on issuance of | ||||||||||||||||||||||||
| common stock(3) | (0.00 | ) | 0.09 | 0.01 | 0.01 | (0.00 | ) | 0.01 | ||||||||||||||||
| Net Asset Value, end of period | $ | 20.43 | $ | 23.50 | $ | 23.93 | $ | 28.83 | $ | 29.28 | $ | 49.34 | ||||||||||||
| Per common share market value, | ||||||||||||||||||||||||
| end of period | $ | 20.39 | $ | 22.59 | $ | 25.86 | $ | 30.63 | $ | 26.57 | $ | 46.10 | ||||||||||||
| Total investment return based on | ||||||||||||||||||||||||
| market value(4)(5) | (1.38 | )% | (3.42 | )% | (7.49 | )% | 26.21 | % | (37.86 | )% | (2.54 | )% | ||||||||||||
| Supplemental Data and Ratios | ||||||||||||||||||||||||
| Net assets applicable to common | ||||||||||||||||||||||||
| stockholders, end of period (000’s) | $ | 1,097,489 | $ | 1,260,300 | $ | 1,181,528 | $ | 1,412,274 | $ | 1,405,733 | $ | 2,369,068 | ||||||||||||
| Average net assets (000’s) | $ | 1,250,177 | $ | 1,388,683 | $ | 1,406,724 | $ | 1,345,764 | $ | 1,974,038 | $ | 1,837,590 | ||||||||||||
| Ratio of Expenses to Average Net Assets(6) | ||||||||||||||||||||||||
| Advisory fees | 1.60 | % | 1.58 | % | 1.74 | % | 1.74 | % | 1.76 | % | 1.65 | % | ||||||||||||
| Other operating expenses | 0.13 | 0.13 | 0.12 | 0.12 | 0.10 | 0.13 | ||||||||||||||||||
| Total operating expenses, | ||||||||||||||||||||||||
| before fee waiver | 1.73 | 1.71 | 1.86 | 1.86 | 1.86 | 1.78 | ||||||||||||||||||
| Fee waiver(7) | (0.00 | ) | (0.04 | ) | (0.00 | ) | (0.01 | ) | — | (0.00 | ) | |||||||||||||
| Total operating expenses | 1.73 | 1.67 | 1.86 | 1.85 | 1.86 | 1.78 | ||||||||||||||||||
| Leverage expenses | 2.08 | 1.87 | 1.78 | 2.29 | 1.75 | 1.38 | ||||||||||||||||||
| Income tax expense (benefit)(8) | (2.56 | ) | (11.02 | ) | (5.28 | ) | 4.64 | (24.50 | ) | 7.81 | ||||||||||||||
| Total expenses | 1.25 | % | (7.48 | )% | (1.64 | )% | 8.78 | % | (20.89 | )% | 10.97 | % | ||||||||||||
| See accompanying Notes to Financial Statements. | |
| 50 | Tortoise |
| 2019 3rd Quarter Report | August 31, 2019 |
| Period from | ||||||||||||||||||||||||
| December 1, 2018 | Year Ended | Year Ended | Year Ended | Year Ended | Year Ended | |||||||||||||||||||
| through | November 30, | November 30, | November 30, | November 30, | November 30, | |||||||||||||||||||
| August 31, 2019 | 2018 | 2017 | 2016 | 2015 | 2014 | |||||||||||||||||||
| (unaudited) | ||||||||||||||||||||||||
| Ratio of net investment loss to average | ||||||||||||||||||||||||
| net assets before fee waiver(6) | (1.28 | )% | (1.89 | )% | (2.27 | )% | (2.83 | )% | (1.50 | )% | (1.33 | )% | ||||||||||||
| Ratio of net investment loss to average | ||||||||||||||||||||||||
| net assets after fee waiver(6) | (1.28 | )% | (1.85 | )% | (2.27 | )% | (2.82 | )% | (1.50 | )% | (1.33 | )% | ||||||||||||
| Portfolio turnover rate(4) | 22.47 | % | 17.96 | % | 20.38 | % | 24.23 | % | 12.94 | % | 15.33 | % | ||||||||||||
| Credit facility borrowings, | ||||||||||||||||||||||||
| end of period (000’s) | $ | 143,900 | $ | 107,100 | $ | 112,700 | $ | 109,300 | $ | 66,000 | $ | 162,800 | ||||||||||||
| Senior notes, end of period (000’s) | $ | 380,000 | $ | 380,000 | $ | 412,500 | $ | 442,500 | $ | 545,000 | $ | 544,400 | ||||||||||||
| Preferred stock, end of period (000’s) | $ | 165,000 | $ | 165,000 | $ | 165,000 | $ | 165,000 | $ | 295,000 | $ | 224,000 | ||||||||||||
| Per common share amount of senior | ||||||||||||||||||||||||
| notes outstanding, end of period | $ | 7.07 | $ | 7.08 | $ | 8.35 | $ | 9.03 | $ | 11.35 | $ | 11.34 | ||||||||||||
| Per common share amount of net assets, | ||||||||||||||||||||||||
| excluding senior notes, end of period | $ | 27.50 | $ | 30.58 | $ | 32.28 | $ | 37.86 | $ | 40.63 | $ | 60.68 | ||||||||||||
| Asset coverage, per $1,000 of principal | ||||||||||||||||||||||||
| amount of senior notes and credit | ||||||||||||||||||||||||
| facility borrowings(9) | $ | 3,410 | $ | 3,926 | $ | 3,564 | $ | 3,858 | $ | 3,784 | $ | 4,667 | ||||||||||||
| Asset coverage ratio of senior notes and | ||||||||||||||||||||||||
| credit facility borrowings(9) | 341 | % | 393 | % | 356 | % | 386 | % | 378 | % | 467 | % | ||||||||||||
| Asset coverage, per $10 liquidation value | ||||||||||||||||||||||||
| per share of mandatory redeemable | ||||||||||||||||||||||||
| preferred stock(10) | $ | 26 | $ | 29 | $ | 27 | $ | 30 | $ | 26 | $ | 35 | ||||||||||||
| Asset coverage ratio of preferred stock(10) | 259 | % | 293 | % | 271 | % | 297 | % | 255 | % | 354 | % | ||||||||||||
| (1) |
Information presented relates to a share of common stock outstanding for the entire period. |
| (2) |
The per common share data for the years ended November 30, 2018, 2017, 2016, 2015 and 2014 do not reflect the change in estimate of investment income and return of capital, for the respective year. See Note 2C to the financial statements for further disclosure. |
| (3) |
Represents underwriting and offering costs of less than $0.01 for the period from December 1, 2018 through August 31, 2019. Represents premium on shelf offerings of $0.10 per share, less the underwriting and offering costs of $0.01 per share, for the year ended November 30, 2018. Represents the premium on the shelf offerings of $0.01 per share, less the underwriting and offering costs of less than $0.01 per share for the year ended November 30, 2017. Represents the premium on the shelf offerings of $0.02 per share, less the underwriting and offering costs of less than $0.01 per share for the year ended November 30, 2016. Represents underwriting and offering costs of less than $0.01 per share for the year ended November 30, 2015. Represents the premium on the shelf offerings of $0.02 per share, less the underwriting and offering costs of $0.01 per share for the year ended November 30, 2014. |
| (4) |
Not annualized for periods less than one full year. |
| (5) |
Total investment return is calculated assuming a purchase of common stock at the beginning of the period and a sale at the closing price on the last day of the period reported (excluding brokerage commissions). The calculation also assumes reinvestment of distributions at actual prices pursuant to TYG's dividend reinvestment plan. |
| (6) |
Annualized for periods less than one full year. |
| (7) |
Less than 0.01% for the period from December 1, 2018 through August 31, 2019 and the years ended November 30, 2017 and 2014. |
| (8) |
For the period from December 1, 2018 through August 31, 2019, TYG accrued $9,586,530 for current income tax expense and $33,644,515 for net deferred income tax benefit. For the year ended November 30, 2018, TYG accrued $152,516,725 for net deferred income tax benefit, which included a deferred tax benefit of $125,271,378 due to the impact from the federal tax rate reduction related to the Tax Cuts and Jobs Act. For the year ended November 30, 2017, TYG accrued $35,365,364 for current income tax expense and $109,662,030 for net deferred income tax benefit. For the year ended November 30, 2016, TYG accrued $57,075,786 for current income tax expense and $5,303,392 for net deferred income tax expense. For the year ended November 30, 2015, TYG accrued $66,785,732 for net current income tax expense and $550,449,662 for net deferred income tax benefit. For the year ended November 30, 2014, TYG accrued $52,981,532 for current income tax expense and $90,477,388 for net deferred income tax expense. |
| (9) |
Represents value of total assets less all liabilities and indebtedness not represented by senior notes, credit facility borrowings and preferred stock at the end of the period divided by senior notes and credit facility borrowings outstanding at the end of the period. |
| (10) |
Represents value of total assets less all liabilities and indebtedness not represented by senior notes, credit facility borrowings and preferred stock at the end of the period divided by senior notes, credit facility borrowings and preferred stock outstanding at the end of the period. |
| See accompanying Notes to Financial Statements. | |
| Tortoise | 51 |
| NTG Financial Highlights |
| Period from | ||||||||||||||||||||||||
| December 1, 2018 | Year Ended | Year Ended | Year Ended | Year Ended | Year Ended | |||||||||||||||||||
| through | November 30, | November 30, | November 30, | November 30, | November 30, | |||||||||||||||||||
| August 31, 2019 | 2018 | 2017 | 2016 | 2015 | 2014 | |||||||||||||||||||
| (unaudited) | ||||||||||||||||||||||||
| Per Common Share Data(1) | ||||||||||||||||||||||||
| Net Asset Value, beginning of period | $ | 14.48 | $ | 15.96 | $ | 19.22 | $ | 18.65 | $ | 29.83 | $ | 28.00 | ||||||||||||
| Income (Loss) from Investment Operations | ||||||||||||||||||||||||
| Net investment loss(2) | (0.22 | ) | (0.43 | ) | (0.42 | ) | (0.46 | ) | (0.32 | ) | (0.54 | ) | ||||||||||||
| Net realized and unrealized gain (loss) | ||||||||||||||||||||||||
| on investments(2) | (0.55 | ) | 1.36 | (1.15 | ) | 2.72 | (9.17 | ) | 4.06 | |||||||||||||||
| Total income (loss) from investment | ||||||||||||||||||||||||
| operations | (0.77 | ) | 0.93 | (1.57 | ) | 2.26 | (9.49 | ) | 3.52 | |||||||||||||||
| Distributions to Common Stockholders | ||||||||||||||||||||||||
| From return of capital | (1.27 | ) | (1.69 | ) | (1.69 | ) | (1.69 | ) | (1.69 | ) | (1.69 | ) | ||||||||||||
| Capital stock transactions | ||||||||||||||||||||||||
| Premiums less underwriting discounts | ||||||||||||||||||||||||
| and offering costs on issuance of | ||||||||||||||||||||||||
| common stock(3) | (0.00 | ) | (0.72 | ) | — | (0.00 | ) | (0.00 | ) | — | ||||||||||||||
| Net Asset Value, end of period | $ | 12.44 | $ | 14.48 | $ | 15.96 | $ | 19.22 | $ | 18.65 | $ | 29.83 | ||||||||||||
| Per common share market value, | ||||||||||||||||||||||||
| end of period | $ | 12.03 | $ | 13.72 | $ | 15.90 | $ | 18.90 | $ | 16.18 | $ | 27.97 | ||||||||||||
| Total investment return based on | ||||||||||||||||||||||||
| market value(4)(5) | (3.61 | )% | (4.10 | )% | (7.67 | )% | 27.99 | % | (37.08 | )% | 9.08 | % | ||||||||||||
| Supplemental Data and Ratios | ||||||||||||||||||||||||
| Net assets applicable to common | ||||||||||||||||||||||||
| stockholders, end of period (000’s) | $ | 786,294 | $ | 915,033 | $ | 754,085 | $ | 904,866 | $ | 876,409 | $ | 1,401,926 | ||||||||||||
| Average net assets (000’s) | $ | 907,544 | $ | 887,014 | $ | 892,196 | $ | 862,527 | $ | 1,174,085 | $ | 1,404,751 | ||||||||||||
| Ratio of Expenses to Average Net Assets(6) | ||||||||||||||||||||||||
| Advisory fees | 1.57 | % | 1.54 | % | 1.61 | % | 1.56 | % | 1.56 | % | 1.48 | % | ||||||||||||
| Other operating expenses | 0.14 | 0.15 | 0.14 | 0.16 | 0.12 | 0.10 | ||||||||||||||||||
| Total operating expenses, | ||||||||||||||||||||||||
| before fee waiver | 1.71 | 1.69 | 1.75 | 1.72 | 1.68 | 1.58 | ||||||||||||||||||
| Fee waiver | (0.04 | ) | (0.09 | ) | — | (0.01 | ) | (0.09 | ) | (0.16 | ) | |||||||||||||
| Total operating expenses | 1.67 | 1.60 | 1.75 | 1.71 | 1.59 | 1.42 | ||||||||||||||||||
| Leverage expenses | 2.27 | 1.98 | 1.89 | 1.95 | 1.42 | 1.09 | ||||||||||||||||||
| Income tax expense (benefit)(7) | (1.97 | ) | (6.09 | ) | (4.33 | ) | 7.25 | (21.92 | ) | 7.04 | ||||||||||||||
| Total expenses | 1.97 | % | (2.51 | )% | (0.69 | )% | 10.91 | % | (18.91 | )% | 9.55 | % | ||||||||||||
| See accompanying Notes to Financial Statements. | |
| 52 | Tortoise |
| 2019 3rd Quarter Report | August 31, 2019 |
| Period from | ||||||||||||||||||||||||||||||
| December 1, 2018 | Year Ended | Year Ended | Year Ended | Year Ended | Year Ended | |||||||||||||||||||||||||
| through | November 30, | November 30, | November 30, | November 30, | November 30, | |||||||||||||||||||||||||
| August 31, 2019 | 2018 | 2017 | 2016 | 2015 | 2014 | |||||||||||||||||||||||||
| (unaudited) | ||||||||||||||||||||||||||||||
| Ratio of net investment loss to average | ||||||||||||||||||||||||||||||
| net assets before fee waiver(6) | (2.07 | ) | % | (2.65 | ) | % | (2.22 | ) | % | (2.53 | ) | % | (1.36 | ) | % | (1.97 | ) | % | ||||||||||||
| Ratio of net investment loss to average | ||||||||||||||||||||||||||||||
| net assets after fee waiver(6) | (2.03 | ) | % | (2.56 | ) | % | (2.22 | ) | % | (2.52 | ) | % | (1.27 | ) | % | (1.81 | ) | % | ||||||||||||
| Portfolio turnover rate(4) | 24.96 | % | 13.67 | % | 20.94 | % | 35.47 | % | 17.54 | % | 18.09 | % | ||||||||||||||||||
| Credit facility borrowings, | ||||||||||||||||||||||||||||||
| end of period (000’s) | $ | 84,100 | $ | 73,100 | $ | 49,800 | $ | 46,800 | $ | 62,800 | $ | 68,900 | ||||||||||||||||||
| Senior notes, end of period (000’s) | $ | 312,000 | $ | 312,000 | $ | 284,000 | $ | 284,000 | $ | 348,000 | $ | 348,000 | ||||||||||||||||||
| Preferred stock, end of period (000’s) | $ | 132,000 | $ | 132,000 | $ | 110,000 | $ | 110,000 | $ | 90,000 | $ | 90,000 | ||||||||||||||||||
| Per common share amount of senior | ||||||||||||||||||||||||||||||
| notes outstanding, end of period | $ | 4.94 | $ | 4.94 | $ | 6.01 | $ | 6.03 | $ | 7.40 | $ | 7.40 | ||||||||||||||||||
| Per common share amount of net assets, | ||||||||||||||||||||||||||||||
| excluding senior notes, end of period | $ | 17.38 | $ | 19.42 | $ | 21.97 | $ | 25.25 | $ | 26.05 | $ | 37.23 | ||||||||||||||||||
| Asset coverage, per $1,000 of principal | ||||||||||||||||||||||||||||||
| amount of senior notes and credit | ||||||||||||||||||||||||||||||
| facility borrowings(8) | $ | 3,318 | $ | 3,719 | $ | 3,589 | $ | 4,068 | $ | 3,353 | $ | 4,579 | ||||||||||||||||||
| Asset coverage ratio of senior notes and | ||||||||||||||||||||||||||||||
| credit facility borrowings(8) | 332 | % | 372 | % | 359 | % | 407 | % | 335 | % | 458 | % | ||||||||||||||||||
| Asset coverage, per $25 liquidation value | ||||||||||||||||||||||||||||||
| per share of mandatory redeemable | ||||||||||||||||||||||||||||||
| preferred stock(9) | $ | 62 | $ | 69 | $ | 67 | $ | 76 | $ | 69 | $ | 94 | ||||||||||||||||||
| Asset coverage ratio of preferred stock(9) | 249 | % | 277 | % | 270 | % | 305 | % | 275 | % | 377 | % | ||||||||||||||||||
| (1) | Information presented relates to a share of common stock outstanding for the entire period. |
| (2) | The per common share data for the years ended November 30, 2018, 2017, 2016, 2015, and 2014 do not reflect the change in estimate of investment income and return of capital, for the respective year. See Note 2C to the financial statements for further disclosure. |
| (3) | Represents underwriting and offering costs of less than $0.01 for the period from December 1, 2018 through August 31, 2019. Represents the discounts on shares issued through rights offerings of $0.55, plus the underwriting and offering costs of $0.17 per share for the year ended November 30, 2018. Represents less than $0.01 per share for the years ended November 30, 2016 and 2015. |
| (4) | Not annualized for periods less than one full year. |
| (5) | Total investment return is calculated assuming a purchase of common stock at the beginning of the period and a sale at the closing price on the last day of the period reported (excluding brokerage commissions). This calculation also assumes reinvestment of distributions at actual prices pursuant to NTG's dividend reinvestment plan. |
| (6) | Annualized for periods less than one full year. |
| (7) | For the period from December 1, 2018 to August 31, 2019, NTG accrued $1,413,172 for current tax benefit and $11,973,580 for net deferred income tax benefit. For the year ended November 30, 2018, NTG accrued $54,197,357 for net deferred income tax benefit, which included a deferred tax benefit of $47,436,124 due to the impact from the federal tax rate reduction related to the Tax Cuts and Jobs Act. For the year ended November 30, 2017, NTG accrued $440,504 for current income tax expense and $39,035,257 for net deferred income tax benefit. For the year ended November 30, 2016, NTG accrued $1,891,670 for current income tax expense and $60,652,872 for net deferred income tax expense. For the year ended November 30, 2015, NTG accrued $200,550 for current income tax expense and $257,585,058 for net deferred income tax benefit. For the year ended November 30, 2014, NTG accrued $581,000 for current income tax expense and $98,329,597 for net deferred income tax expense. |
| (8) | Represents value of total assets less all liabilities and indebtedness not represented by senior notes, credit facility borrowings and preferred stock at the end of the period divided by senior notes and credit facility borrowings outstanding at the end of the period. |
| (9) | Represents value of total assets less all liabilities and indebtedness not represented by senior notes, credit facility borrowings and preferred stock at the end of the period divided by senior notes, credit facility borrowings and preferred stock outstanding at the end of the period. |
| See accompanying Notes to Financial Statements. | |
| Tortoise | 53 |
| TTP Financial Highlights |
| Period from | ||||||||||||||||||||||||||||||
| December 1, 2018 | Year Ended | Year Ended | Year Ended | Year Ended | Year Ended | |||||||||||||||||||||||||
| through | November 30, | November 30, | November 30, | November 30, | November 30, | |||||||||||||||||||||||||
| August 31, 2019 | 2018 | 2017 | 2016 | 2015 | 2014 | |||||||||||||||||||||||||
| (unaudited) | ||||||||||||||||||||||||||||||
| Per Common Share Data(1) | ||||||||||||||||||||||||||||||
| Net Asset Value, beginning of period | $ | 16.29 | $ | 18.82 | $ | 23.42 | $ | 19.71 | $ | 35.04 | $ | 30.33 | ||||||||||||||||||
| Income (Loss) from Investment Operations | ||||||||||||||||||||||||||||||
| Net investment income (loss)(2) | (0.12 | ) | (0.15 | ) | (0.05 | ) | 0.04 | 0.22 | 0.08 | |||||||||||||||||||||
| Net realized and unrealized gain (loss)(2) | (0.75 | ) | (0.75 | ) | (2.92 | ) | 5.30 | (13.60 | ) | 6.26 | ||||||||||||||||||||
| Total income (loss) from investment | ||||||||||||||||||||||||||||||
| operations | (0.87 | ) | (0.90 | ) | (2.97 | ) | 5.34 | (13.38 | ) | 6.34 | ||||||||||||||||||||
| Distributions to Common Stockholders | ||||||||||||||||||||||||||||||
| From net investment income | (0.03 | ) | (0.04 | ) | (0.05 | ) | (0.38 | ) | (0.34 | ) | (0.02 | ) | ||||||||||||||||||
| From net realized gains from | ||||||||||||||||||||||||||||||
| investment transactions | — | — | (0.25 | ) | (1.25 | ) | (1.61 | ) | (1.61 | ) | ||||||||||||||||||||
| From return of capital | (1.07 | ) | (1.59 | ) | (1.33 | ) | — | — | — | |||||||||||||||||||||
| Total distributions to common | ||||||||||||||||||||||||||||||
| stockholders | (1.10 | ) | (1.63 | ) | (1.63 | ) | (1.63 | ) | (1.95 | ) | (1.63 | ) | ||||||||||||||||||
| Net Asset Value, end of period | $ | 14.32 | $ | 16.29 | $ | 18.82 | $ | 23.42 | $ | 19.71 | $ | 35.04 | ||||||||||||||||||
| Per common share market value, | ||||||||||||||||||||||||||||||
| end of period | $ | 12.84 | $ | 14.33 | $ | 17.01 | $ | 21.55 | $ | 17.47 | $ | 32.50 | ||||||||||||||||||
| Total investment return based on | ||||||||||||||||||||||||||||||
| market value(3)(4) | (3.23 | ) | % | (7.03 | ) | % | (14.18 | ) | % | 34.89 | % | (41.19 | ) | % | 21.68 | % | ||||||||||||||
| Supplemental Data and Ratios | ||||||||||||||||||||||||||||||
| Net assets applicable to common | ||||||||||||||||||||||||||||||
| stockholders, end of period (000’s) | $ | 143,463 | $ | 163,202 | $ | 188,517 | $ | 234,539 | $ | 197,443 | $ | 350,975 | ||||||||||||||||||
| Average net assets (000’s) | $ | 161,695 | $ | 188,518 | $ | 219,359 | $ | 192,888 | $ | 292,473 | $ | 357,486 | ||||||||||||||||||
| Ratio of Expenses to Average Net Assets(5) | ||||||||||||||||||||||||||||||
| Advisory fees | 1.52 | % | 1.51 | % | 1.43 | % | 1.48 | % | 1.44 | % | 1.37 | % | ||||||||||||||||||
| Other operating expenses | 0.36 | 0.32 | 0.26 | 0.29 | 0.22 | 0.18 | ||||||||||||||||||||||||
| Total operating expenses, | ||||||||||||||||||||||||||||||
| before fee waiver | 1.88 | 1.83 | 1.69 | 1.77 | 1.66 | 1.55 | ||||||||||||||||||||||||
| Fee waiver | — | — | (0.00 | ) | (0.07 | ) | (0.14 | ) | (0.19 | ) | ||||||||||||||||||||
| Total operating expenses | 1.88 | 1.83 | 1.69 | 1.70 | 1.52 | 1.36 | ||||||||||||||||||||||||
| Leverage expenses | 1.59 | 1.40 | 1.06 | 1.23 | 0.93 | 0.75 | ||||||||||||||||||||||||
| Total expenses | 3.47 | % | 3.23 | % | 2.75 | % | 2.93 | % | 2.45 | % | 2.11 | % | ||||||||||||||||||
| See accompanying Notes to Financial Statements. | |
| 54 | Tortoise |
| 2019 3rd Quarter Report | August 31, 2019 |
| Period from | ||||||||||||||||||||||||||||||
| December 1, 2018 | Year Ended | Year Ended | Year Ended | Year Ended | Year Ended | |||||||||||||||||||||||||
| through | November 30, | November 30, | November 30, | November 30, | November 30, | |||||||||||||||||||||||||
| August 31, 2019 | 2018 | 2017 | 2016 | 2015 | 2014 | |||||||||||||||||||||||||
| (unaudited) | ||||||||||||||||||||||||||||||
| Ratio of net investment income (loss) to | ||||||||||||||||||||||||||||||
| average net assets before fee waiver(5) | (0.96 | ) | % | (0.80 | ) | % | (0.21 | ) | % | 0.12 | % | 0.60 | % | 0.02 | % | |||||||||||||||
| Ratio of net investment income (loss) | ||||||||||||||||||||||||||||||
| to average net assets after fee waiver(5) | (0.96 | ) | % | (0.80 | ) | % | (0.21 | ) | % | 0.19 | % | 0.74 | % | 0.21 | % | |||||||||||||||
| Portfolio turnover rate(3) | 19.10 | % | 14.27 | % | 24.23 | % | 90.22 | % | 18.84 | % | 18.45 | % | ||||||||||||||||||
| Credit facility borrowings, | ||||||||||||||||||||||||||||||
| end of period (000’s) | $ | 11,500 | $ | 19,800 | $ | 19,300 | $ | 16,600 | $ | 16,900 | $ | 26,000 | ||||||||||||||||||
| Senior notes, end of period (000’s) | $ | 34,000 | $ | 34,000 | $ | 34,000 | $ | 34,000 | $ | 54,000 | $ | 49,000 | ||||||||||||||||||
| Preferred stock, end of period (000’s) | $ | 16,000 | $ | 16,000 | $ | 16,000 | $ | 16,000 | $ | 16,000 | $ | 16,000 | ||||||||||||||||||
| Per common share amount of senior | ||||||||||||||||||||||||||||||
| notes outstanding, end of period | $ | 3.39 | $ | 3.39 | $ | 3.39 | $ | 3.39 | $ | 5.39 | $ | 4.89 | ||||||||||||||||||
| Per common share amount of net assets, | ||||||||||||||||||||||||||||||
| excluding senior notes, end of period | $ | 17.71 | $ | 19.68 | $ | 22.21 | $ | 26.81 | $ | 25.10 | $ | 39.93 | ||||||||||||||||||
| Asset coverage, per $1,000 of principal | ||||||||||||||||||||||||||||||
| amount of senior notes and credit | ||||||||||||||||||||||||||||||
| facility borrowings(6) | $ | 4,505 | $ | 4,331 | $ | 4,837 | $ | 5,951 | $ | 4,010 | $ | 5,893 | ||||||||||||||||||
| Asset coverage ratio of senior notes and | ||||||||||||||||||||||||||||||
| credit facility borrowings(6) | 450 | % | 433 | % | 484 | % | 595 | % | 401 | % | 589 | % | ||||||||||||||||||
| Asset coverage, per $25 liquidation value | ||||||||||||||||||||||||||||||
| per share of mandatory redeemable | ||||||||||||||||||||||||||||||
| preferred stock(7) | $ | 83 | $ | 83 | $ | 93 | $ | 113 | $ | 82 | $ | 121 | ||||||||||||||||||
| Asset coverage ratio of preferred stock(7) | 333 | % | 334 | % | 372 | % | 452 | % | 327 | % | 486 | % | ||||||||||||||||||
| (1) | Information presented relates to a share of common stock outstanding for the entire period. |
| (2) | The per common share data for the years ended November 30, 2018, 2017, 2016, 2015, and 2014 do not reflect the change in estimate of investment income and return of capital, for the respective year. See Note 2C to the financial statements for further disclosure. |
| (3) | Not annualized for periods less than one full year. |
| (4) | Total investment return is calculated assuming a purchase of common stock at the beginning of the period and a sale at the closing price on the last day of the period reported (excluding brokerage commissions). The calculation also assumes reinvestment of distributions at actual prices pursuant to TTP's dividend reinvestment plan. |
| (5) | Annualized for periods less than one full year. |
| (6) | Represents value of total assets less all liabilities and indebtedness not represented by senior notes, credit facility borrowings and preferred stock at the end of the period divided by senior notes and credit facility borrowings outstanding at the end of the period. |
| (7) | Represents value of total assets less all liabilities and indebtedness not represented by senior notes, credit facility borrowings and preferred stock at the end of the period divided by senior notes, credit facility borrowings and preferred stock outstanding at the end of the period. |
| See accompanying Notes to Financial Statements. | |
| Tortoise | 55 |
| NDP Financial Highlights |
| Period from | ||||||||||||||||||||||||||||||
| December 1, 2018 | Year Ended | Year Ended | Year Ended | Year Ended | Year Ended | |||||||||||||||||||||||||
| through | November 30, | November 30, | November 30, | November 30, | November 30, | |||||||||||||||||||||||||
| August 31, 2019 | 2018 | 2017 | 2016 | 2015 | 2014 | |||||||||||||||||||||||||
| (unaudited) | ||||||||||||||||||||||||||||||
| Per Common Share Data(1) | ||||||||||||||||||||||||||||||
| Net Asset Value, beginning of period | $ | 9.02 | $ | 12.88 | $ | 16.95 | $ | 15.53 | $ | 22.76 | $ | 26.49 | ||||||||||||||||||
| Income (Loss) from Investment Operations | ||||||||||||||||||||||||||||||
| Net investment loss(2) | (0.10 | ) | (0.29 | ) | (0.20 | ) | (0.12 | ) | (0.10 | ) | (0.12 | ) | ||||||||||||||||||
| Net realized and unrealized gain (loss)(2) | (3.52 | ) | (1.82 | ) | (2.12 | ) | 3.29 | (5.38 | ) | (1.86 | ) | |||||||||||||||||||
| Total income (loss) from investment | ||||||||||||||||||||||||||||||
| operations | (3.62 | ) | (2.11 | ) | (2.32 | ) | 3.17 | (5.48 | ) | (1.98 | ) | |||||||||||||||||||
| Distributions to Common Stockholders | ||||||||||||||||||||||||||||||
| From net investment income(3) | — | — | — | — | (0.00 | ) | (0.00 | ) | ||||||||||||||||||||||
| From net realized gains from | ||||||||||||||||||||||||||||||
| investment transactions | — | — | — | — | — | (1.66 | ) | |||||||||||||||||||||||
| From return of capital | (0.98 | ) | (1.75 | ) | (1.75 | ) | (1.75 | ) | (1.75 | ) | (0.09 | ) | ||||||||||||||||||
| Total distributions to common | ||||||||||||||||||||||||||||||
| stockholders | (0.98 | ) | (1.75 | ) | (1.75 | ) | (1.75 | ) | (1.75 | ) | (1.75 | ) | ||||||||||||||||||
| Net Asset Value, end of period | $ | 4.42 | $ | 9.02 | $ | 12.88 | $ | 16.95 | $ | 15.53 | $ | 22.76 | ||||||||||||||||||
| Per common share market value, | ||||||||||||||||||||||||||||||
| end of period | $ | 3.99 | $ | 9.00 | $ | 12.39 | $ | 15.85 | $ | 13.18 | $ | 21.29 | ||||||||||||||||||
| Total investment return based on | ||||||||||||||||||||||||||||||
| market value(4)(5) | (49.01 | ) | % | (15.10 | ) | % | (11.04 | ) | % | 36.27 | % | (31.05 | ) | % | (5.16 | ) | % | |||||||||||||
| Supplemental Data and Ratios | ||||||||||||||||||||||||||||||
| Net assets applicable to common | ||||||||||||||||||||||||||||||
| stockholders, end of period (000’s) | $ | 65,322 | $ | 132,488 | $ | 187,889 | $ | 246,088 | $ | 225,410 | $ | 330,458 | ||||||||||||||||||
| Average net assets (000’s) | $ | 103,175 | $ | 176,481 | $ | 209,940 | $ | 212,528 | $ | 288,672 | $ | 413,380 | ||||||||||||||||||
| Ratio of Expenses to Average Net Assets(6) | ||||||||||||||||||||||||||||||
| Advisory fees | 1.51 | % | 1.50 | % | 1.43 | % | 1.42 | % | 1.33 | % | 1.25 | % | ||||||||||||||||||
| Other operating expenses | 0.49 | 0.32 | 0.26 | 0.29 | 0.21 | 0.16 | ||||||||||||||||||||||||
| Total operating expenses, | ||||||||||||||||||||||||||||||
| before fee waiver | 2.00 | 1.82 | 1.69 | 1.71 | 1.54 | 1.41 | ||||||||||||||||||||||||
| Fee waiver | — | — | (0.01 | ) | (0.13 | ) | (0.13 | ) | (0.17 | ) | ||||||||||||||||||||
| Total operating expenses | 2.00 | 1.82 | 1.68 | 1.58 | 1.41 | 1.24 | ||||||||||||||||||||||||
| Leverage expenses | 1.31 | 0.99 | 0.56 | 0.37 | 0.21 | 0.14 | ||||||||||||||||||||||||
| Total expenses | 3.31 | % | 2.81 | % | 2.24 | % | 1.95 | % | 1.62 | % | 1.38 | % | ||||||||||||||||||
| See accompanying Notes to Financial Statements. | |
| 56 | Tortoise |
| 2019 3rd Quarter Report | August 31, 2019 |
| Period from | ||||||||||||||||||||||||||||||
| December 1, 2018 | Year Ended | Year Ended | Year Ended | Year Ended | Year Ended | |||||||||||||||||||||||||
| through | November 30, | November 30, | November 30, | November 30, | November 30, | |||||||||||||||||||||||||
| August 31, 2019 | 2018 | 2017 | 2016 | 2015 | 2014 | |||||||||||||||||||||||||
| (unaudited) | ||||||||||||||||||||||||||||||
| Ratio of net investment loss to average | ||||||||||||||||||||||||||||||
| net assets before fee waiver(6) | (2.01 | ) | % | (2.40 | ) | % | (1.41 | ) | % | (0.98 | ) | % | (0.61 | ) | % | (0.61 | )% | |||||||||||||
| Ratio of net investment loss to average | ||||||||||||||||||||||||||||||
| net assets after fee waiver(6) | (2.01 | ) | % | (2.40 | ) | % | (1.40 | ) | % | (0.85 | ) | % | (0.48 | ) | % | (0.44 | ) | % | ||||||||||||
| Portfolio turnover rate(4) | 146.96 | % | 143.77 | % | 64.88 | % | 47.03 | % | 15.63 | % | 43.21 | % | ||||||||||||||||||
| Credit facility borrowings, | ||||||||||||||||||||||||||||||
| end of period (000’s) | $ | 28,700 | $ | 57,100 | $ | 64,500 | $ | 63,800 | $ | 61,800 | $ | 56,200 | ||||||||||||||||||
| Asset coverage, per $1,000 of principal | ||||||||||||||||||||||||||||||
| amount of credit facility borrowings(7) | $ | 3,276 | $ | 3,320 | $ | 3,913 | $ | 4,857 | $ | 4,647 | $ | 6,880 | ||||||||||||||||||
| Asset coverage ratio of credit | ||||||||||||||||||||||||||||||
| facility borrowings(7) | 328 | % | 332 | % | 391 | % | 486 | % | 465 | % | 688 | % | ||||||||||||||||||
| (1) | Information presented relates to a share of common stock outstanding for the entire period. |
| (2) | The per common share data for the years ended November 30, 2018, 2017, 2016, 2015 and 2014 do not reflect the change in estimate of investment income and return of capital, for the respective year. See Note 2C to the financial statements for further disclosure. |
| (3) | Less than $0.01 for the years ended November 30, 2015 and 2014. |
| (4) | Not annualized for periods less than one full year. |
| (5) | Total investment return is calculated assuming a purchase of common stock at the beginning of the period and a sale at the closing price on the last day of the period reported (excluding brokerage commissions). The calculation also assumes reinvestment of distributions at actual prices pursuant to NDP's dividend reinvestment plan. |
| (6) | Annualized for periods less than one full year. |
| (7) | Represents value of total assets less all liabilities and indebtedness not represented by credit facility borrowings at the end of the period divided by credit facility borrowings outstanding at the end of the period. |
| See accompanying Notes to Financial Statements. | |
| Tortoise | 57 |
| TPZ Financial Highlights |
| Period from | ||||||||||||||||||||||||||||||
| December 1, 2018 | Year Ended | Year Ended | Year Ended | Year Ended | Year Ended | |||||||||||||||||||||||||
| through | November 30, | November 30, | November 30, | November 30, | November 30, | |||||||||||||||||||||||||
| August 31, 2019 | 2018 | 2017 | 2016 | 2015 | 2014 | |||||||||||||||||||||||||
| (unaudited) | ||||||||||||||||||||||||||||||
| Per Common Share Data(1) | ||||||||||||||||||||||||||||||
| Net Asset Value, beginning of period | $ | 19.76 | $ | 21.33 | $ | 23.89 | $ | 21.23 | $ | 31.08 | $ | 28.12 | ||||||||||||||||||
| Income (loss) from Investment Operations | ||||||||||||||||||||||||||||||
| Net investment income(2) | 0.28 | 0.24 | 0.59 | 0.71 | 0.88 | 0.81 | ||||||||||||||||||||||||
| Net realized and unrealized gain (loss)(2) | 0.23 | (0.31 | ) | (1.65 | ) | 3.49 | (7.87 | ) | 3.65 | |||||||||||||||||||||
| Total income (loss) from investment | ||||||||||||||||||||||||||||||
| operations | 0.51 | (0.07 | ) | (1.06 | ) | 4.20 | (6.99 | ) | 4.46 | |||||||||||||||||||||
| Distributions to Common Stockholders | ||||||||||||||||||||||||||||||
| From net investment income | (0.99 | ) | (1.50 | ) | (1.04 | ) | (1.29 | ) | (0.91 | ) | (0.90 | ) | ||||||||||||||||||
| From net realized gains from | ||||||||||||||||||||||||||||||
| investment transactions | — | — | (0.36 | ) | (0.25 | ) | (1.95 | ) | (0.60 | ) | ||||||||||||||||||||
| From return of capital | (0.13 | ) | — | (0.10 | ) | — | — | — | ||||||||||||||||||||||
| Total distributions to common | ||||||||||||||||||||||||||||||
| stockholders | (1.12 | ) | (1.50 | ) | (1.50 | ) | (1.54 | ) | (2.86 | ) | (1.50 | ) | ||||||||||||||||||
| Net Asset Value, end of period | $ | 19.15 | $ | 19.76 | $ | 21.33 | $ | 23.89 | $ | 21.23 | $ | 31.08 | ||||||||||||||||||
| Per common share market value, | ||||||||||||||||||||||||||||||
| end of period | $ | 18.17 | $ | 17.17 | $ | 19.94 | $ | 21.43 | $ | 18.53 | $ | 26.90 | ||||||||||||||||||
| Total investment return based on | ||||||||||||||||||||||||||||||
| market value(3)(4) | 12.55 | % | (6.82 | ) | % | (0.27 | ) | % | 25.57 | % | (22.54 | ) | % | 14.94 | % | |||||||||||||||
| Total investment return based on | ||||||||||||||||||||||||||||||
| net asset value(3)(5) | 3.07 | % | 0.24 | % | (4.31 | ) | % | 22.18 | % | (23.19 | ) | % | 16.84 | % | ||||||||||||||||
| Supplemental Data and Ratios | ||||||||||||||||||||||||||||||
| Net assets applicable to common | ||||||||||||||||||||||||||||||
| stockholders, end of period (000’s) | $ | 133,107 | $ | 137,324 | $ | 148,243 | $ | 166,073 | $ | 147,563 | $ | 216,048 | ||||||||||||||||||
| Average net assets (000’s) | $ | 139,823 | $ | 147,616 | $ | 162,708 | $ | 146,274 | $ | 187,752 | $ | 208,698 | ||||||||||||||||||
| Ratio of Expenses to Average Net Assets(6) | ||||||||||||||||||||||||||||||
| Advisory fees | 1.32 | % | 1.29 | % | 1.25 | % | 1.27 | % | 1.20 | % | 1.12 | % | ||||||||||||||||||
| Other operating expenses | 0.39 | 0.37 | 0.31 | 0.39 | 0.31 | 0.26 | ||||||||||||||||||||||||
| Total operating expenses, | ||||||||||||||||||||||||||||||
| before fee waiver | 1.71 | 1.66 | 1.56 | 1.66 | 1.51 | 1.38 | ||||||||||||||||||||||||
| Fee waiver | — | — | — | — | (0.01 | ) | (0.07 | ) | ||||||||||||||||||||||
| Total operating expenses | 1.71 | 1.66 | 1.56 | 1.66 | 1.50 | 1.31 | ||||||||||||||||||||||||
| Leverage expenses | 1.26 | 0.98 | 0.59 | 0.44 | 0.26 | 0.19 | ||||||||||||||||||||||||
| Total expenses | 2.97 | % | 2.64 | % | 2.15 | % | 2.10 | % | 1.76 | % | 1.50 | % | ||||||||||||||||||
| See accompanying Notes to Financial Statements. | |
| 58 | Tortoise |
| 2019 3rd Quarter Report | August 31, 2019 |
| Period from | ||||||||||||||||||||||||
| December 1, 2018 | Year Ended | Year Ended | Year Ended | Year Ended | Year Ended | |||||||||||||||||||
| through | November 30, | November 30, | November 30, | November 30, | November 30, | |||||||||||||||||||
| August 31, 2019 | 2018 | 2017 | 2016 | 2015 | 2014 | |||||||||||||||||||
| (unaudited) | ||||||||||||||||||||||||
| Ratio of net investment income to | ||||||||||||||||||||||||
| average net assets before fee waiver(6) | 1.88 | % | 1.14 | % | 2.51 | % | 3.39 | % | 3.25 | % | 2.62 | % | ||||||||||||
| Ratio of net investment income to | ||||||||||||||||||||||||
| average net assets after fee waiver(6) | 1.88 | % | 1.14 | % | 2.51 | % | 3.39 | % | 3.26 | % | 2.69 | % | ||||||||||||
| Portfolio turnover rate(3) | 16.00 | % | 31.41 | % | 30.86 | % | 40.61 | % | 30.99 | % | 18.39 | % | ||||||||||||
| Credit facility borrowings, | ||||||||||||||||||||||||
| end of period (000’s) | $ | 56,100 | $ | 53,400 | $ | 53,400 | $ | 50,600 | $ | 49,900 | $ | 42,400 | ||||||||||||
| Asset coverage, per $1,000 of principal | ||||||||||||||||||||||||
| amount of senior notes and credit | ||||||||||||||||||||||||
| facility borrowings(7) | $ | 3,373 | $ | 3,572 | $ | 3,776 | $ | 4,282 | $ | 3,957 | $ | 6,095 | ||||||||||||
| Asset coverage ratio of senior notes | ||||||||||||||||||||||||
| and credit facility borrowings(7) | 337 | % | 357 | % | 378 | % | 428 | % | 396 | % | 610 | % | ||||||||||||
| (1) | Information presented relates to a share of common stock outstanding for the entire period. |
| (2) | The per common share data for the years ended November 30, 2018, 2017, 2016, 2015 and 2014 do not reflect the change in estimate of investment income and return of capital, for the respective year. See Note 2C to the financial statements for further disclosure. |
| (3) | Not annualized for periods less than one full year. |
| (4) | Total investment return is calculated assuming a purchase of common stock at the beginning of the period and a sale at the closing price on the last day of the period reported (excluding brokerage commissions). The calculation also assumes reinvestment of distributions at actual prices pursuant to TPZ's dividend reinvestment plan. |
| (5) | Total investment return is calculated assuming a purchase of common stock at the beginning of the period and a sale at net asset value on the last day of the period reported. The calculation also assumes reinvestment of distributions at actual prices pursuant to TPZ's dividend reinvestment plan. |
| (6) | Annualized for periods less than one full year. |
| (7) | Represents value of total assets less all liabilities and indebtedness not represented by credit facility borrowings at the end of the period divided by credit facility borrowings outstanding at the end of the period. |
| See accompanying Notes to Financial Statements. | |
| Tortoise | 59 |
| TEAF Financial Highlights |
| Period from | |||||
| March 29, 2019(1) | |||||
| through | |||||
| August 31, 2019 | |||||
| (unaudited) | |||||
| Per Common Share Data(2) | |||||
| Net Asset Value, beginning of period | $ | 20.00 | |||
| Income (loss) from Investment Operations | |||||
| Net investment income | 0.26 | ||||
| Net realized and unrealized loss | (1.75 | ) | |||
| Total loss from investment operations | (1.49 | ) | |||
| Distributions to Common Stockholders | |||||
| From net investment income | (0.43 | ) | |||
| From net realized gains from investment transactions | — | ||||
| From return of capital | — | ||||
| Total distributions to common stockholders | (0.43 | ) | |||
| Net Asset Value, end of period | $ | 18.08 | |||
| Per common share market value, end of period | $ | 16.25 | |||
| Total investment return based on market value(3)(4) | (16.73 | ) | % | ||
| Supplemental Data and Ratios | |||||
| Net assets applicable to common stockholders, end of period (000’s) | $ | 243,882 | |||
| Average net assets (000’s) | $ | 256,729 | |||
| Ratio of Expenses to Average Net Assets(5) | |||||
| Advisory fees | 1.50 | % | |||
| Other operating expenses | 0.24 | ||||
| Total operating expenses, before fee waiver | 1.74 | ||||
| Fee waiver | (0.28 | ) | |||
| Total operating expenses | 1.46 | ||||
| Leverage expenses | 0.36 | ||||
| Total expenses | 1.82 | % | |||
| See accompanying Notes to Financial Statements. | |
| 60 | Tortoise |
| 2019 3rd Quarter Report | August 31, 2019 |
| Period from | ||||
| March 29, 2019(1) | ||||
| through | ||||
| August 31, 2019 | ||||
| (unaudited) | ||||
| Ratio of net investment income to average net assets before fee waiver(5) | 2.96 | % | ||
| Ratio of net investment income to average net assets after fee waiver(5) | 3.24 | % | ||
| Portfolio turnover rate(3) | 21.72 | % | ||
| Credit facility borrowings, end of period (000’s) | $ | 31,500 | ||
| Asset coverage, per $1,000 of principal amount of senior notes and credit facility borrowings(6) | $ | 8,742 | ||
| Asset coverage ratio of senior notes and credit facility borrowings(6) | 874 | % | ||
| (1) | Commencement of operations. |
| (2) | Information presented relates to a share of common stock outstanding for the entire period. |
| (3) | Not annualized. |
| (4) | Total investment return is calculated assuming a purchase of common stock at the beginning of the period and a sale at the closing price on the last day of the period reported (excluding brokerage commissions). The calculation also assumes reinvestment of distributions at actual prices pursuant to TEAF's dividend reinvestment plan. |
| (5) | Annualized. |
| (6) | Represents value of total assets less all liabilities and indebtedness not represented by margin facility borrowings at the end of the period divided by margin facility borrowings outstanding at the end of the period. |
| See accompanying Notes to Financial Statements. | |
| Tortoise | 61 |
| Notes to Financial Statements (unaudited) |
| August 31, 2019 |
1. General Organization
This report covers the following companies, each of which is listed on the New York Stock Exchange (“NYSE”): Tortoise Energy Infrastructure Corp. (“TYG”), Tortoise Midstream Energy Fund, Inc. (“NTG”) (formerly Tortoise MLP Fund, Inc.), Tortoise Pipeline & Energy Fund, Inc. (“TTP”), Tortoise Energy Independence Fund, Inc. (“NDP”), Tortoise Power and Energy Infrastructure Fund, Inc. (“TPZ”), and Tortoise Essential Assets Income Term Fund (“TEAF”). These companies are individually referred to as a “Fund” or by their respective NYSE symbols, or collectively as the “Funds”, and each is a non-diversified, closed-end management investment company under the Investment Company Act of 1940, as amended (the "1940 Act"). Each of TYG, NTG, TTP, NDP and TEAF has a primary investment objective to seek a high level of total return with an emphasis on current distributions. TPZ has a primary investment objective to provide a high level of current income, with a secondary objective of capital appreciation. TEAF commenced operations on March 29, 2019.
2. Significant Accounting Policies
The Funds follow accounting and reporting guidance applicable to investment companies under U.S. generally accepted accounting principles (“GAAP”).
A. Use of Estimates
The preparation of financial statements in conformity with GAAP requires management to make estimates and assumptions that affect the reported amount of assets and liabilities and disclosure of contingent assets and liabilities as of the date of the financial statements, and the amount of income and expenses during the period reported. Actual results could differ from those estimates.
B. Security Valuation
In general, and where applicable, the Funds use readily available market quotations based upon the last updated sales price from the principal market to determine fair value. The Funds primarily own securities that are listed on a securities exchange or are traded in the over-the-counter market. The Funds value those securities at their last sale price on that exchange or over-the-counter market on the valuation date. If the security is listed on more than one exchange, the Funds use the price from the exchange that it considers to be the principal exchange on which the security is traded. If there has been no sale on such exchange or over-the-counter market on such day, the security is valued at the mean between the last bid price and last ask price on such day. Securities listed on the NASDAQ are valued at the NASDAQ Official Closing Price, which may not necessarily represent the last sale price. These securities are categorized as Level 1 in the fair value hierarchy.
Restricted securities are subject to statutory or contractual restrictions on their public resale, which may make it more difficult to obtain a valuation and may limit a Fund’s ability to dispose of them. Investments in private placement securities and other securities for which market quotations are not readily available are valued in good faith by using fair value procedures. Such fair value procedures consider factors such as discounts to publicly traded issues, time until conversion date, securities with similar yields, quality, type of issue, coupon, duration and rating. If events occur that affect the value of a Fund’s portfolio securities before the net asset value has been calculated (a “significant event”), the portfolio securities so affected are generally priced using fair value procedures.
An equity security of a publicly traded company acquired in a private placement transaction without registration under the Securities Act of 1933, as amended (the “1933 Act”), is subject to restrictions on resale that can affect the security's liquidity and fair value. If such a security is convertible into publicly traded common shares, the security generally will be valued at the common share market price adjusted by a percentage discount due to the restrictions and categorized as Level 2 in the fair value hierarchy. To the extent that such securities are convertible or otherwise become freely tradable within a time frame that may be reasonably determined, an amortization schedule may be used to determine the discount. If the security has characteristics that are dissimilar to the class of security that trades on the open market, the security will generally be valued and categorized as Level 3 in the fair value hierarchy.
Unobservable inputs are used to measure fair value to the extent that observable inputs are not available, thereby allowing for situations in which there is little, if any, market activity. Unobservable inputs reflect the Funds’ own beliefs about the assumptions that market participants would use in pricing the asset or liability (including assumptions about risk). Unobservable inputs are developed based on the best information available in the circumstances, which might include the Fund’s own data. The Fund’s own data are adjusted if information is reasonably available without undue cost and effort that indicates that market participants would use different assumptions. Due to the inherent uncertainty of valuations of such investments, the fair values may differ significantly from the values that would have been used had an active market existed.
Options (including options on futures contracts) and futures contracts shall be valued using readily available market quotations. Exchange-traded options are valued at the last reported sale price on any exchange on which they trade. If there are no sales reported on any exchange, exchange-traded options shall be valued at the mean between the last highest bid and last lowest asked prices obtained as of the closing of the exchanges on which the option is traded. Exchange-traded domestic futures contracts are valued at the last reported sale price on the Chicago Mercantile Exchange. Exchange-traded foreign futures contracts are valued at the last reported sale price on the primary foreign exchange on which they principally trade. The value of Flexible Exchange Options (FLEX Options) are determined (i) by an evaluated price as determined by a third-party valuation service; or (ii) by using a quotation provided by a broker-dealer.
The Funds generally value debt securities at evaluated prices obtained from an independent third-party valuation service that utilizes a pricing matrix based upon yield data for securities with similar characteristics, or based on a direct written broker-dealer quotation from a dealer who has made a market in the security. Debt securities with 60 days or less to maturity at time of purchase are valued on the basis of amortized cost, which approximates fair value. The securities are categorized as level 2 in the fair value hierarchy.
| 62 | Tortoise |
| 2019 3rd Quarter Report | August 31, 2019 |
| Notes to Financial Statements (unaudited) (continued) |
Interest rate swap contracts are valued by using industry-accepted models, which discount the estimated future cash flows based on a forward rate curve and the stated terms of the interest rate swap agreement by using interest rates currently available in the market, or based on dealer quotations, if available, and are categorized as Level 2 in the fair value hierarchy.
Various inputs are used in determining the fair value of the Funds’ investments and financial instruments. These inputs are summarized in the three broad levels listed below:
| Level 1 — |
quoted prices in active markets for identical investments |
|
| |
| Level 2 — |
other significant observable inputs (including quoted prices for similar investments, market corroborated inputs, etc.) |
|
| |
| Level 3 — |
significant unobservable inputs (including a Fund’s own assumptions in determining the fair value of investments) |
The inputs or methodologies used for valuing securities are not necessarily an indication of the risk associated with investing in those securities.
The following tables provide the fair value measurements of applicable assets and liabilities by level within the fair value hierarchy as of August 31, 2019. These assets and liabilities are measured on a recurring basis.
| TYG: | ||||||||||||
| Description | Level 1 | Level 2 | Level 3 | Total | ||||||||
| Assets | ||||||||||||
| Investments: | ||||||||||||
| Master Limited Partnerships(a) | $ | 1,365,068,140 | $ | — | $ | — | $ | 1,365,068,140 | ||||
| Common Stock(a) | 436,655,033 | — | — | 436,655,033 | ||||||||
| Preferred Stock(a) | 65,565,088 | — | 41,348,441 | 106,913,529 | ||||||||
| Corporate Bonds(a) | — | 18,038,406 | — | 18,038,406 | ||||||||
| Private Investment(a) | — | — | 12,153,147 | 12,153,147 | ||||||||
| Short-Term Investment(b) | 272,117 | — | — | 272,117 | ||||||||
| Total Assets | $ | 1,867,560,378 | $ | 18,038,406 | $ | 53,501,588 | $ | 1,939,100,372 | ||||
| Liabilities | ||||||||||||
| Interest Rate Swap Contracts | $ | — | $ | 206,016 | $ | — | $ | 206,016 | ||||
| Written Call Options | 163,373 | 22,487 | — | 185,860 | ||||||||
| Total Liabilities | $ | 163,373 | $ | 228,503 | $ | — | $ | 391,876 | ||||
| NTG: | ||||||||||||
| Description | Level 1 | Level 2 | Level 3 | Total | ||||||||
| Assets | ||||||||||||
| Investments: | ||||||||||||
| Master Limited Partnerships(a) | $ | 970,285,607 | $ | — | $ | — | $ | 970,285,607 | ||||
| Common Stock(a) | 322,219,129 | — | — | 322,219,129 | ||||||||
| Preferred Stock(a) | 45,067,221 | — | 24,974,552 | 70,041,773 | ||||||||
| Corporate Bonds(a) | — | 11,938,807 | — | 11,938,807 | ||||||||
| Short-Term Investment(b) | 115,929 | — | — | 115,929 | ||||||||
| Total Assets | $ | 1,337,687,886 | $ | 11,938,807 | $ | 24,974,552 | $ | 1,374,601,245 | ||||
| Liabilities | ||||||||||||
| Written Call Options | $ | 250,887 | $ | 32,066 | $ | — | $ | 282,953 | ||||
| TTP: | ||||||||||||
| Description | Level 1 | Level 2 | Level 3 | Total | ||||||||
| Assets | ||||||||||||
| Investments: | ||||||||||||
| Common Stock(a) | $ | 146,969,419 | $ | — | $ | — | $ | 146,969,419 | ||||
| Master Limited Partnerships(a) | 50,723,293 | — | — | 50,723,293 | ||||||||
| Preferred Stock(a) | 3,320,756 | — | 5,435,531 | 8,756,287 | ||||||||
| Short-Term Investment(b) | 158,163 | — | — | 158,163 | ||||||||
| Total Assets | $ | 201,171,631 | $ | — | $ | 5,435,531 | $ | 206,607,162 | ||||
| Liabilities | ||||||||||||
| Written Call Options | $ | 40,667 | $ | 92,524 | $ | — | $ | 133,191 | ||||
| Tortoise | 63 |
| Notes to Financial Statements (unaudited) (continued) |
| NDP: | ||||||||||||
| Description | Level 1 | Level 2 | Level 3 | Total | ||||||||
| Assets | ||||||||||||
| Investments: | ||||||||||||
| Common Stock(a) | $ | 86,772,406 | $ | — | $ | — | $ | 86,772,406 | ||||
| Master Limited Partnerships(a) | 5,464,276 | — | — | 5,464,276 | ||||||||
| Preferred Stock(a) | — | — | 2,413,691 | 2,413,691 | ||||||||
| Short-Term Investment(b) | 252,277 | — | — | 252,277 | ||||||||
| Total Assets | $ | 92,488,959 | $ | — | $ | 2,413,691 | $ | 94,902,650 | ||||
| Liabilities | ||||||||||||
| Written Call Options | $ | 156,410 | $ | 305,400 | $ | — | $ | 461,810 | ||||
| TPZ: | ||||||||||||
| Description | Level 1 | Level 2 | Level 3 | Total | ||||||||
| Assets | ||||||||||||
| Investments: | ||||||||||||
| Corporate Bonds(a) | $ | — | $ | 99,997,612 | $ | — | $ | 99,997,612 | ||||
| Master Limited Partnerships(a) | 44,159,691 | — | — | 44,159,691 | ||||||||
| Common Stock(a) | 35,035,521 | — | — | 35,035,521 | ||||||||
| Preferred Stock(a) | 4,693,900 | — | 4,235,574 | 8,929,474 | ||||||||
| Short-Term Investment(b) | 145,693 | — | — | 145,693 | ||||||||
| Total Investments | $ | 84,034,805 | $ | 99,997,612 | $ | 4,235,574 | $ | 188,267,991 | ||||
| Interest Rate Swap Contracts, net | — | 1,934 | — | 1,934 | ||||||||
| Total Assets | $ | 84,034,805 | $ | 99,999,546 | $ | 4,235,574 | $ | 188,269,925 | ||||
| TEAF: | ||||||||||||
| Description | Level 1 | Level 2 | Level 3 | Total | ||||||||
| Assets | ||||||||||||
| Investments: | ||||||||||||
| Common Stock(a) | $ | 122,026,314 | $ | — | $ | — | $ | 122,026,314 | ||||
| Master Limited Partnerships(a) | 48,685,187 | — | — | 48,685,187 | ||||||||
| Exchange-Traded Funds(a) | 18,611,152 | — | — | 18,611,152 | ||||||||
| Corporate Bonds(a) | — | 35,265,735 | — | 35,265,735 | ||||||||
| Preferred Bonds(a) | — | 12,626,260 | — | 12,626,260 | ||||||||
| Preferred Stock(a) | 4,490,804 | — | 4,075,697 | 8,566,501 | ||||||||
| Municipal Bonds(a) | — | 12,636,759 | — | 12,636,759 | ||||||||
| Private Investment(a) | — | — | 8,098,695 | 8,098,695 | ||||||||
| Construction Note(a) | — | — | 3,525,464 | 3,525,464 | ||||||||
| Short-Term Investment(b) | 3,838,731 | — | — | 3,838,731 | ||||||||
| Total Investments: | 197,652,188 | 60,528,754 | 15,699,856 | 273,880,798 | ||||||||
| Forward Currency Contracts | — | 348,075 | — | 348,075 | ||||||||
| Total Assets | $ | 197,652,188 | $ | 60,876,829 | $ | 15,699,856 | $ | 274,228,873 | ||||
| Liabilities | ||||||||||||
| Written Call Options | $ | — | $ | 442,064 | $ | — | $ | 442,064 | ||||
| (a) |
All other industry classifications are identified in the Schedule of Investments. |
| (b) |
Short-term investment is a sweep investment for cash balances. |
| 64 | Tortoise |
| 2019 3rd Quarter Report | August 31, 2019 |
| Notes to Financial Statements (unaudited) (continued) |
The following tables present each Fund’s assets measured at fair value on a recurring basis using significant unobservable inputs (Level 3) for the period ended August 31, 2019:
| Preferred Stock | TYG | NTG | TTP | NDP | TPZ | TEAF | ||||||||||||||
| Balance — beginning of period | $ | 29,426,431 | $ | 16,777,343 | $ | 4,909,451 | $ | 2,178,123 | $ | 3,761,271 | $ | — | ||||||||
| Purchases | 9,898,524 | 7,077,686 | 525,834 | — | 458,600 | 4,076,217 | ||||||||||||||
| Return of capital | — | — | — | — | — | — | ||||||||||||||
| Sales | — | — | — | — | — | — | ||||||||||||||
| Total realized gain/loss | — | — | — | — | — | — | ||||||||||||||
| Change in unrealized gain/loss | 2,023,486 | 1,119,523 | 246 | 235,568 | 15,703 | (520 | ) | |||||||||||||
| Balance — end of period | $ | 41,348,441 | $ | 24,974,552 | $ | 5,435,531 | $ | 2,413,691 | $ | 4,235,574 | $ | 4,075,697 | ||||||||
| Private Investments | TYG | NTG | TTP | NDP | TPZ | TEAF | ||||||||||||||
| Balance — beginning of period | $ | 36,836,183 | $ | — | $ | — | $ | — | $ | — | $ | — | ||||||||
| Purchases | 4,108,065 | — | — | — | — | 8,098,695 | ||||||||||||||
| Return of capital | (22,821,884 | ) | — | — | — | — | — | |||||||||||||
| Sales | — | — | — | — | — | — | ||||||||||||||
| Total realized gain/loss | 5,876,785 | — | — | — | — | — | ||||||||||||||
| Change in unrealized gain/loss | (11,846,002 | ) | — | — | — | — | — | |||||||||||||
| Balance — end of period | $ | 12,153,147 | $ | — | $ | — | $ | — | $ | — | $ | 8,098,695 | ||||||||
| Construction Note | TYG | NTG | TTP | NDP | TPZ | TEAF | ||||||||||||||
| Balance — beginning of period | $ | — | $ | — | $ | — | $ | — | $ | — | $ | — | ||||||||
| Purchases | — | — | — | — | — | 3,770,669 | ||||||||||||||
| Return of capital | — | — | — | — | — | — | ||||||||||||||
| Sales | — | — | — | — | — | — | ||||||||||||||
| Total realized gain/loss | — | — | — | — | — | — | ||||||||||||||
| Change in unrealized gain/loss | — | — | — | — | — | (245,205 | ) | |||||||||||||
| Balance — end of period | $ | — | $ | — | $ | — | $ | — | $ | — | $ | 3,525,464 | ||||||||
| TYG | NTG | TTP | NDP | TPZ | TEAF | |||||||||||||||
| Change in unrealized gain/loss on investments still held at August 31, 2019 |
$ | (9,822,516 | ) | $ | 1,119,523 | $ | 246 | $ | 235,568 | $ | 15,703 | $ | (245,725 | ) | ||||||
TYG, NTG, TTP, NDP and TPZ own units of preferred stock of Targa Resources Corp. (“TRGP Pfd”) that were issued in a private placement transaction that closed on March 16, 2016. The preferred stock provides the purchaser an option to convert into common stock after 12 years. In addition, the preferred stock can be repurchased by the issuer at a price of $1,100 per share after five years and $1,050 per share after six years.
TYG, NTG, TTP, and TPZ own units of preferred stock of SemGroup Corporation (“SEMG Pfd”) that were issued in a private placement transaction that closed on January 19, 2018. The preferred stock provides the purchaser an option to convert into common stock after 18 months at a price of $33.00 per share. In addition, the issuer can force conversion to common stock after 3 years at a price of $47.85 per share.
TYG, NTG, TTP, TPZ and TEAF own units of preferred stock of Altus Midstream Company (“ALTM Pfd”) that were issued in a private placement transaction that closed on June 12, 2019. The preferred stock carries a conversion option into common stock after the 7th anniversary of issuance (June 12, 2026) with a conversion rate determined as the quotient of Altus’ common unit price divided by a 6% discount to the prior 20-Day Volume Weighted Average Price (“VWAP”). Alternately, Altus can force conversion into common stock at a value determined by a minimum rate of return: before 5 years: greater of 1.3x Multiple on Invested Capital (“MOIC”) or 11.5% Internal Rate of Return (“IRR”), and after 5 years: greater of 1.3x MOIC or 13.75% IRR.
A lattice model is being utilized to determine fair value of the level 3 TRGP Pfd and SEMG Pfd securities. The Funds estimate future volatility of the underlying common stock price and the discount rate to apply to expected future cash flows. Unobservable inputs used to determine the discount rate include an illiquidity spread due to the shares being issued in the private market and a seniority spread due to the purchased private preferred units being lower in the capital structure than the issuer’s public preferred stock. An increase (decrease) in the illiquidity spread or seniority spread would lead to a corresponding decrease (increase) in fair value of the preferred stock. An increase (decrease) in estimated future volatility would lead to a corresponding increase (decrease) in fair value of the preferred stock.
A simple average of unit values determined by three valuation methods is being used to determine fair value of the level 3 ALTM Pfd security. Method 1) Preferred Dividend Discount Valuation: Fair value determined by dividing annual dividends by an estimated discount rate. Method 2) Minimum Rate of Return: fair value based on a discounted cash flow analysis based on predetermined minimum rates of return for ALTM Pfd units. Method 3) Exchange to Common Units: fair valuation determined by 6% Discount of 20-Day VWAP. Unobservable inputs used to determine the discount rate include an illiquidity spread due to the shares being issued in the private market, a seniority spread due to the
| Tortoise | 65 |
| Notes to Financial Statements (unaudited) (continued) |
purchased private preferred units being lower in the capital structure than the issuer’s public preferred stock and a construction risk premium. An increase (decrease) in the illiquidity spread, seniority spread or construction risk premium would lead to a corresponding decrease (increase) in fair value of the preferred stock. An increase (decrease) in estimated future volatility would lead to a corresponding increase (decrease) in fair value of the preferred stock.
A discounted cash flows model is being utilized to determine fair value of the construction note. Unobservable inputs used to determine the discount rate include a risk spread based on similar projects and an illiquidity spread due to the note being issued in the private market. An increase (decrease) in the risk spread or illiquidity spread would lead to a corresponding decrease (increase) in fair value of the note.
The following tables summarize the fair value and significant unobservable inputs that each Fund used to value its portfolio investments categorized as Level 3 as of August 31, 2019:
| Assets at Fair Value | TYG | NTG | TTP | NDP | TPZ | TEAF | ||||||||||||
| Construction Note | $ | — | $ | — | $ | — | $ | — | $ | — | $ | 3,525,464 | ||||||
| Preferred Stock | $ | 41,348,441 | $ | 24,974,552 | $ | 5,435,531 | $ | 2,413,691 | $ | 4,235,574 | $ | 4,075,697 | ||||||
| Private Investment | $ | 12,153,147 | $ | — | $ | — | $ | — | $ | — | $ | 8,098,695 | ||||||
| Assets at Fair Value | Valuation Technique | Unobservable Inputs | Input | ||||
| Preferred Stock (ALTM Pfd) | Discounted cash flows model | Illiquidity spread | 0.9000 | % | |||
| Preferred Stock (ALTM Pfd) | Discounted cash flows model | Construction risk premium | 1.0000 | % | |||
| Preferred Stock (ALTM Pfd) | Discounted cash flows model | Seniority spread | 0.5000 | % | |||
| Preferred Stock (TRGP Pfd) | Lattice model | Illiquidity spread | 1.2500 | % | |||
| Preferred Stock (TRGP Pfd) | Lattice model | Seniority spread | 0.2500 | % | |||
| Preferred Stock (SEMG Pfd) | Lattice model | Illiquidity & seniority spread | 1.8618 | % | |||
| Private Investment (Renewable Holdco, LLC) | Recent transaction | Purchase price | $8,098,695 | ||||
| Private Investment (TK NYS Solar) | Discounted cash flows model | Post-contracted weighted average cost of capital | 8.5000 | % | |||
| Construction Note | Discounted cash flows model | Risk spread | 1.7500 | % | |||
| Construction Note | Discounted cash flows model | Illiquidity spread | 1.7255 | % | |||
C. Securities Transactions and Investment Income
Securities transactions are accounted for on the date the securities are purchased or sold (trade date). Realized gains and losses are reported on an identified cost basis. Interest income is recognized on the accrual basis, including amortization of premiums and accretion of discounts. Dividend income and distributions are recorded on the ex-dividend date. Distributions received from investments generally are comprised of ordinary income and return of capital. The Funds estimate the allocation of distributions between investment income and return of capital at the time such distributions are received based on historical information or regulatory filings. These estimates may subsequently be revised based on actual allocations received from the portfolio companies after their tax reporting periods are concluded, as the actual character of these distributions is not known until after the fiscal year-end of the Funds.
Subsequent to November 30, 2018, the Funds reallocated the amount of return of capital recognized for the period from December 1, 2017 through November 30, 2018 based on the 2018 tax reporting information received. The impact of this adjustment is as follows:
| Estimated | Revised | Increase/(Decrease) | ||||||||
| Return of Capital % | Return of Capital % | In Return of Capital | ||||||||
| TYG | 94% | 93% | $ | (3,266,424 | ) | |||||
| NTG | 95% | 95% | $ | (613,926 | ) | |||||
| TTP | 66% | 69% | $ | 403,245 | ||||||
| NDP | 77% | 80% | $ | 158,988 | ||||||
| TPZ | 89% | 89% | $ | 16,301 | ||||||
In addition, the Funds may be subject to withholding taxes on foreign-sourced income. The Funds accrue such taxes when the related income is earned.
D. Foreign Currency Translation
For foreign currency, investments in foreign securities, and other assets and liabilities denominated in a foreign currency, the Funds translate these amounts into U.S. dollars on the following basis: (i) market value of investment securities, assets and liabilities at the current rate of exchange on the valuation date, and (ii) purchases and sales of investment securities, income and expenses at the relevant rates of exchange on the respective dates of such transactions. The Funds do not isolate the portion of gains and losses on investments that is due to changes in the foreign exchange rates from that which is due to changes in market prices of securities.
E. Federal and State Income Taxation
Each of TYG and NTG, as corporations, are obligated to pay federal and state income tax on its taxable income. Currently, the federal income tax rate for corporations is 21%.
| 66 | Tortoise |
| 2019 3rd Quarter Report | August 31, 2019 |
| Notes to Financial Statements (unaudited) (continued) |
TTP, NDP and TPZ each qualify as a regulated investment company (“RIC”) under the Internal Revenue Code (“IRC”). TEAF intends to be treated and to qualify each year as a RIC under the IRC. As a result, TTP, NDP, TPZ and TEAF generally will not be subject to U.S. federal income tax on income and gains that they distribute each taxable year to stockholders if they meet certain minimum distribution requirements. RICs are required to distribute substantially all of their income, in addition to meeting certain asset diversification requirements, and are subject to a 4% non-deductible U.S. federal excise tax on certain undistributed income unless the fund makes sufficient distributions to satisfy the excise tax avoidance requirement.
The Funds invest in master limited partnerships (“MLPs”), which generally are treated as partnerships for federal income tax purposes. As a limited partner in the MLPs, each Fund reports its allocable share of the MLP's taxable income in computing its own taxable income. The Funds’ tax expense or benefit, if applicable, is included in the Statements of Operations based on the component of income or gains (losses) to which such expense or benefit relates. For TYG and NTG, deferred income taxes reflect the net tax effects of temporary differences between the carrying amounts of assets and liabilities for financial reporting purposes and the amounts used for income tax purposes. A valuation allowance is recognized if, based on the weight of available evidence, it is more likely than not that some portion or all of the deferred income tax asset will not be realized.
The Funds recognize the tax benefits of uncertain tax positions only when the position is “more likely than not” to be sustained upon examination by the tax authorities based on the technical merits of the tax position. The Funds’ policy is to record interest and penalties on uncertain tax positions as part of tax expense. As of August 31, 2019, the Funds had no uncertain tax positions and no penalties or interest was accrued. The Funds do not expect any change in their unrecognized tax positions in the next twelve months. The tax years ended on the following dates remain open to examination by federal and state tax authorities:
TYG — November 30, 2015 through 2018
NTG — November 30, 2012 through 2018
TTP, NDP and TPZ — November 30, 2015 through 2018
F. Distributions to Stockholders
Distributions to common stockholders are recorded on the ex-dividend date. The Funds may not declare or pay distributions to its common stockholders if it does not meet asset coverage ratios required under the 1940 Act or the rating agency guidelines for its debt and preferred stock following such distribution. The amount of any distributions will be determined by the Board of Directors. The character of distributions to common stockholders made during the year may differ from their ultimate characterization for federal income tax purposes.
As RICs, TTP, NDP, TPZ and TEAF each intend to make cash distributions of its investment company taxable income and capital gains to common stockholders. In addition, on an annual basis, TTP, NDP, TPZ and TEAF each may distribute additional capital gains in the last calendar quarter if necessary to meet minimum distribution requirements and thus avoid being subject to excise taxes. Distributions paid to stockholders in excess of investment company taxable income and net realized gains will be treated as return of capital to stockholders.
Distributions to mandatory redeemable preferred (“MRP”) stockholders are accrued daily based on applicable distribution rates for each series and paid periodically according to the terms of the agreements. The Funds may not declare or pay distributions to its preferred stockholders if it does not meet a 200% asset coverage ratio for its debt or the rating agency basic maintenance amount for the debt following such distribution. The character of distributions to preferred stockholders made during the year may differ from their ultimate characterization for federal income tax purposes.
For tax purposes, distributions to stockholders for the year ended November 30, 2018 were characterized as follows:
| TYG | NTG | TTP | NDP | TPZ* | ||||||||||||||||||||||||||||||||||||
| Common | Preferred | Common | Preferred | Common | Preferred | Common | Common | |||||||||||||||||||||||||||||||||
| Qualified dividend income | 84 | % | 100 | % | 47 | % | 100 | % | 3 | % | 100 | % | — | 5 | % | |||||||||||||||||||||||||
| Ordinary dividend income | — | — | — | — | — | — | — | 39 | % | |||||||||||||||||||||||||||||||
| Return of capital | 16 | % | — | 53 | % | — | 97 | % | — | 100 | % | — | ||||||||||||||||||||||||||||
| Long-term capital gain | — | — | — | — | — | — | — | 56 | % | |||||||||||||||||||||||||||||||
| * | For Federal income tax purposes, distributions of short-term capital gains are included in qualified dividend income. |
G. Offering and Debt Issuance Costs
Offering costs related to the issuance of common stock are charged to additional paid-in capital when the stock is issued. Debt issuance costs related to senior notes and MRP Stock are deferred and amortized over the period the debt or MRP Stock is outstanding.
TYG:
Offering costs (excluding underwriter discounts and commissions) of $6,953 related to the issuance of common stock were recorded to additional paid-in capital during the period ended August 31, 2019.
| Tortoise | 67 |
| Notes to Financial Statements (unaudited) (continued) |
NTG:
Offering costs (excluding underwriter discounts and commissions) of $21,176 related to the issuance of common stock were recorded to additional paid-in
capital during the period ended August 31, 2019. Deferred costs (excluding underwriter commissions) were reflected during the period ended August 31, 2019 for Series P Notes ($23,187), Series Q Notes ($17,391), Series R Notes ($15,072) and MRP G Shares
($25,506) that were issued in October 2018.
TTP:
Deferred costs (excluding underwriter commissions) were reflected during the period ended August 31, 2019 for Series H Notes ($49,830) and MRP B Shares
($93,251) that were issued in December 2018.
There were no offering or debt issuance costs recorded during the period ended August 31, 2019, for NDP, TPZ or TEAF.
H. Derivative Financial Instruments
The Funds have established policies and procedures for risk assessment and the approval, reporting and monitoring of
derivative financial instrument activities. The Funds do not hold or issue derivative financial instruments for speculative purposes. All derivative financial instruments are recorded at fair value with changes in fair value during the reporting period,
and amounts accrued under the agreements, included as unrealized gains or losses in the accompanying Statements of Operations. Derivative instruments that are subject to an enforceable master netting arrangement allow a Fund and the counterparty to the
instrument to offset any exposure to the other party with amounts owed to the other party. The fair value of derivative financial instruments in a loss position are offset against the fair value of derivative financial instruments in a gain position,
with the net fair value appropriately reflected as an asset or liability within the accompanying Statements of Assets & Liabilities.
TYG and TPZ use interest rate swap contracts in an attempt to manage interest rate risk. Cash settlements under the terms of the interest rate swap contracts and the termination of such contracts are recorded as realized gains or losses in the accompanying Statements of Operations.
TYG, NTG, TTP, NDP and TEAF seek to provide current income from gains earned through an option strategy that normally consists of writing (selling) call options on selected equity securities held in the portfolio (“covered calls”). The premium received on a written call option is initially recorded as a liability and subsequently adjusted to the then current fair value of the option written. Premiums received from writing call options that expire unexercised are recorded as a realized gain on the expiration date. Premiums received from writing call options that are exercised are added to the proceeds from the sale of the underlying security to calculate the realized gain (loss). If a written call option is repurchased prior to its exercise, the realized gain (loss) is the difference between the premium received and the amount paid to repurchase the option.
TEAF has entered into forward currency contracts, which represent agreements to exchange currencies on specific future dates at predetermined rates. TEAF uses forward currency contracts to manage exposure to changes in exchange rates. On a daily basis, TEAF’s investment adviser values forward currency contracts and records unrealized appreciation or depreciation for open forward currency contracts in the Statements of Assets & Liabilities. Realized gains or losses are recorded at the time the forward currency contracts are closed.
I. Indemnifications
Under each of the Funds’ organizational documents, its officers and directors are indemnified against certain liabilities arising out
of the performance of their duties to the Funds. In addition, in the normal course of business, the Funds may enter into contracts that provide general indemnification to other parties. A Fund’s maximum exposure under these arrangements is unknown,
as this would involve future claims that may be made against the Funds that have not yet occurred, and may not occur. However, the Funds have not had prior claims or losses pursuant to these contracts and expect the risk of loss to be remote.
J. Cash and Cash Equivalents
Cash and cash equivalents include short-term, liquid investments with an original maturity of three months or less and money market
fund accounts.
K. Recent Accounting and Regulatory Updates
In August 2018, the FASB issued ASU No. 2018-13 (“ASU 2018-13”), Fair Value Measurement (Topic 820):
Disclosure Framework which modifies the disclosure requirements on fair value measurements. ASU 2018-13 is effective for fiscal years, and interim periods within those fiscal years, beginning after December 15, 2019, early adoption is permitted.
Management is currently evaluating this guidance to determine the impact on the financial statements.
3. Concentration Risk
TYG, NTG, TTP, NDP and TPZ concentrate their investments in the energy sector. TEAF concentrates its investments in issuers operating in essential asset sectors. Funds that primarily invest in a particular sector may experience greater volatility than companies investing in a broad range of industry sectors. A Fund may, for defensive purposes, temporarily invest all or a significant portion of its assets in investment grade securities, short-term debt securities and cash or cash equivalents. To the extent a Fund uses this strategy, it may not achieve its investment objective.
| 68 | Tortoise |
| 2019 3rd Quarter Report | August 31, 2019 |
| Notes to Financial Statements (unaudited) (continued) |
4. Agreements
The Funds have each entered into an Investment Advisory Agreement with Tortoise Capital Advisors, L.L.C. (the "Adviser"). The Funds each pay the Adviser a fee based on the Fund’s average monthly total assets (including any assets attributable to leverage and excluding any net deferred tax asset) minus accrued liabilities (other than net deferred tax liability, debt entered into for purposes of leverage and the aggregate liquidation preference of outstanding preferred stock) ("Managed Assets"), in exchange for the investment advisory services provided. Average monthly Managed Assets is the sum of the daily Managed Assets for the month divided by the number of days in the month. Accrued liabilities are expenses incurred in the normal course of each Fund’s operations. Waived fees are not subject to recapture by the Adviser. The annual fee rates paid to the Adviser as of August 31, 2019 are as follows:
TYG — 0.95% up to $2,500,000,000, 0.90% between $2,500,000,000 and $3,500,000,000, and 0.85% above $3,500,000,000.
NTG — 0.95%.
TTP — 1.10%.
NDP — 1.10%.
TPZ — 0.95%.
TEAF — 1.35%, less a fee waiver of 0.25% for one year following March 29, 2019.
In addition, the Adviser has contractually agreed to waive all fees due under the Investment Advisory Agreements for TYG and NTG related to the net proceeds received from the issuance of additional common stock under at-the-market equity programs for a six-month period following the date of issuance. NTG has agreed to similarly waive fees related to the proceeds received from a rights offering that occurred during July 2018.
U.S. Bancorp Fund Services, LLC d/b/a U.S. Bank Global Fund Services serves as each Fund’s administrator. Each Fund pays the administrator a monthly fee computed at an annual rate of 0.04% of the first $1,000,000,000 of the Fund’s Managed Assets, 0.01% on the next $500,000,000 of Managed Assets and 0.005% on the balance of the Fund’s Managed Assets.
U.S. Bank, N.A. serves as the Funds’ custodian. Each Fund pays the custodian a monthly fee computed at an annual rate of 0.004% of the Fund’s U.S. Dollar-denominated assets and 0.015% of the Fund’s Canadian Dollar-denominated assets, plus portfolio transaction fees.
5. Income Taxes
TYG and NTG:
Deferred income taxes reflect the net tax effect of temporary differences between the carrying amount of assets and liabilities for financial reporting and tax purposes. Components of TYG’s and NTG’s deferred tax assets and liabilities as of August 31, 2019 are as follows:
| TYG | NTG | |||||
| Deferred tax assets: | ||||||
| Net operating loss carryforwards | $ | — | $ | 5,116,207 | ||
| Capital loss carryforwards | — | 1,579,044 | ||||
| AMT credit | — | 1,413,172 | ||||
| Investment tax credit | — | — | ||||
| Net unrealized loss on investment securities | 7,874,323 | 8,799,554 | ||||
| 7,874,323 | 16,907,977 | |||||
| Deferred tax liabilities: | ||||||
| Basis reduction of investments | 163,792,335 | 73,109,830 | ||||
| Net unrealized gains on investment securities | — | — | ||||
| 163,792,335 | 73,109,830 | |||||
| Total net deferred tax liability | $ | 155,918,012 | $ | 56,201,853 | ||
At August 31, 2019, a valuation allowance on deferred tax assets was not deemed necessary because each of TYG and NTG believe it is more likely than not that there is an ability to realize its deferred tax assets through future taxable income. Any adjustments to TYG’s or NTG’s estimates of future taxable income will be made in the period such determination is made.
During the period ending August 31, 2019, TYG received approximately $5,665,000 in Investment Tax Credits which can be used to offset current federal tax liability, if any. Any unused credits will be carried forward and available to use against a future tax liability.
| Tortoise | 69 |
| Notes to Financial Statements (unaudited) (continued) |
Total income tax expense for each of TYG and NTG differs from the amount computed by applying the federal statutory income tax rate of 21% to net investment loss and net realized and unrealized gains (losses) on investments for the period ended August 31, 2019, as follows:
| TYG | NTG | |||||||
| Application of statutory income tax rate | $ | (17,526,392 | ) | $ | (13,017,542 | ) | ||
| State income taxes, net of federal tax effect | (2,011,361 | ) | (1,276,960 | ) | ||||
| Permanent differences | 1,144,290 | 907,750 | ||||||
| Investment Tax Credit | (5,664,522 | ) | — | |||||
| Total income tax expense | $ | (24,057,985 | ) | $ | (13,386,752 | ) | ||
Total income taxes are being calculated by applying the federal rate plus a blended state income tax rate.
For the period ended August 31, 2019, the components of income tax expense for TYG and NTG include the following:
| TYG | NTG | |||||||
| Current tax expense (benefit) | ||||||||
| Federal | $ | 6,987,725 | $ | (1,413,172 | ) | |||
| State | 2,598,805 | — | ||||||
| 9,586,530 | (1,413,172 | ) | ||||||
| Deferred tax expense (benefit) | ||||||||
| Federal | $ | (30,180,898 | ) | $ | (10,903,954 | ) | ||
| State (net of federal tax effect) | (3,463,617 | ) | (1,069,626 | ) | ||||
| Total deferred tax expense | (33,644,515 | ) | (11,973,580 | ) | ||||
| Total income tax expense, net | $ | (24,057,985 | ) | $ | (13,386,752 | ) | ||
TYG acquired all of the net assets of Tortoise Energy Capital Corporation (“TYY”) and Tortoise North American Energy Corporation (“TYN”) on June 23, 2014 in a tax-free reorganization under Section 368(a)(1)(C) of the IRC. As of November 30, 2018, TYG and NTG had net operating losses for federal income tax purposes of approximately $1,153,000 (from TYN) and $55,487,000, respectively. The net operating losses may be carried forward for 20 years. If not utilized, these net operating losses will expire in the year ending November 30, 2027 for TYG and in the years ending November 30, 2033 through 2037 for NTG. Utilization of TYG’s net operating losses from TYN is further subject to Section 382 limitations of the IRC, which limit tax attributes subsequent to ownership changes.
The amount of deferred tax asset for net operating loss and capital loss carryforward at August 31, 2019 includes amounts for the period December 1, 2018 through August 31, 2019. As of November 30, 2018, NTG had $2,826,344 of AMT credits available, which may be utilized against future tax liabilities. AMT credit carryovers may be eligible for a partial refund in 2018, 2019 or 2020 and any remaining unused credit will be fully refundable in 2021. NTG is estimating an eligible refund in 2018 of approximately $1,400,000.
TTP, NDP, TPZ and TEAF:
It is the intention of TTP, NDP, TPZ and TEAF to qualify as a RIC under Subchapter M of the IRC and distribute all of its taxable income.
Accordingly, no provision for federal income taxes is required in the financial statements.
The amount and character of income and capital gain distributions to be paid, if any, are determined in accordance with federal income tax regulations, which may differ from U.S. generally accepted accounting principles. These differences are primarily due to return of capital distributions from underlying investments, wash sales, straddles, swaps, differences in the timing of recognition of gains or losses on investments and distributions in excess of current earnings. These reclassifications have no impact on net assets or results of operations. Permanent book and tax basis differences, if any, may result in reclassifications of undistributed (accumulated) net investment income (loss), undistributed (accumulated) net realized gain (loss) and additional paid-in capital.
As of November 30, 2018, the components of accumulated earnings (deficit) on a tax basis were as follows:
| TTP | NDP | TPZ | |||||||||||
| Unrealized appreciation (depreciation) | $ | (37,410,381 | ) | $ | (80,367,382 | ) | $ | 8,280,508 | |||||
| Capital loss carryforwards | (4,899,906 | ) | (26,234,383 | ) | — | ||||||||
| Undistributed ordinary income | — | — | 76,300 | ||||||||||
| Other temporary differences | (303,857 | ) | (1) | 2 | (13,629 | ) | |||||||
| Accumulated earnings (deficit) | $ | (42,614,144 | ) | $ | (106,601,763 | ) | $ | 8,343,179 | |||||
| (1) | Primarily related to losses deferred under straddle regulations per IRC Sec. 1092 and dividends payable. |
| 70 | Tortoise |
| 2019 3rd Quarter Report | August 31, 2019 |
| Notes to Financial Statements (unaudited) (continued) |
As of November 30, 2018, TTP and NDP had long-term capital loss carryforwards of approximately $4,900,000 and $26,234,000 respectively, which may be carried forward for an unlimited period under the Regulated Investment Company Modernization Act of 2010. To the extent future net capital gains are realized, those gains will be offset by any unused capital loss carryforwards. Capital loss carryforwards will retain their character as either short-term or long-term capital losses. Thus, such losses must be used first to offset gains of the same character; for example, long-term loss carryforwards will first offset long-term gains, before they can be used to offset short-term gains.
As of August 31, 2019, the aggregate cost of investments, aggregate gross unrealized appreciation and aggregate gross unrealized depreciation on a federal income tax basis were as follows:
| TYG | NTG | TTP | NDP | TPZ | TEAF | |||||||||||||||||||
| Tax cost of investments | $ | 1,292,606,221 | $ | 1,093,996,813 | $ | 224,011,244 | $ | 135,973,714 | $ | 171,768,193 | $ | 296,623,779 | ||||||||||||
| Gross unrealized appreciation | ||||||||||||||||||||||||
| of investments | $ | 760,012,214 | $ | 366,191,362 | $ | 23,059,780 | $ | 1,428,220 | $ | 25,112,989 | $ | 7,215,389 | ||||||||||||
| Gross unrealized depreciation | ||||||||||||||||||||||||
| of investments | (113,697,930 | ) | (85,546,036 | ) | (40,467,178 | ) | (42,438,402 | ) | (8,611,257 | ) | (29,614,073 | ) | ||||||||||||
| Net unrealized appreciation | ||||||||||||||||||||||||
| (depreciation) of investments | $ | 646,314,284 | $ | 280,645,326 | $ | (17,407,398 | ) | $ | (41,010,182 | ) | $ | 16,501,732 | $ | (22,398,684 | ) | |||||||||
6. Restricted Securities
Certain of the Funds’ investments are restricted and are valued as determined in accordance with fair value procedures, as more fully described in Note 2. The following table shows the principal amount or shares, acquisition date(s), acquisition cost, fair value and the percent of net assets which the securities comprise at August 31, 2019.
| TYG: | |||||||||||||||||
| Fair Value | |||||||||||||||||
| as Percent | |||||||||||||||||
| Investment Security | Investment Type | Shares | Acquisition Date(s) | Acquisition Cost | Fair Value | of Net Assets | |||||||||||
| Altus Midstream Company, | |||||||||||||||||
| 7.000% | Preferred Stock | 9,899 | 6/12/19-8/14/19 | $ | 9,898,524 | $ | 9,897,262 | 0.9 | % | ||||||||
| SemGroup Corporation, | |||||||||||||||||
| 7.000% | Preferred Stock | 6,277 | 01/19/18 | 6,277,000 | 5,153,189 | 0.5 | |||||||||||
| Targa Resources Corp., | |||||||||||||||||
| 9.500% | Preferred Stock | 21,758 | 03/16/16 | 19,265,393 | 26,297,990 | 2.4 | |||||||||||
| TK NYS Solar Holdco, LLC | Private Investment | N/A | 08/18/17- 5/31/19 | 55,256,470 | 12,153,147 | 1.1 | |||||||||||
| $ | 90,697,387 | $ | 53,501,588 | 4.9 | % | ||||||||||||
| NTG: | |||||||||||||||||
| Fair Value | |||||||||||||||||
| as Percent | |||||||||||||||||
| Investment Security | Investment Type | Shares | Acquisition Date | Acquisition Cost | Fair Value | of Net Assets | |||||||||||
| Altus Midstream Company, | |||||||||||||||||
| 7.000% | Preferred Stock | 7,078 | 6/12/19-8/14/19 | $ | 7,077,686 | $ | 7,076,783 | 0.9 | % | ||||||||
| SemGroup Corporation, | |||||||||||||||||
| 7.000% | Preferred Stock | 3,763 | 01/19/18 | 3,763,000 | 3,089,286 | 0.4 | |||||||||||
| Targa Resources Corp., | |||||||||||||||||
| 9.500% | Preferred Stock | 12,252 | 03/16/16 | 10,848,405 | 14,808,483 | 1.9 | |||||||||||
| $ | 21,689,091 | $ | 24,974,552 | 3.2 | % | ||||||||||||
| TTP: | |||||||||||||||||
| Fair Value | |||||||||||||||||
| as Percent | |||||||||||||||||
| Investment Security | Investment Type | Shares | Acquisition Date | Acquisition Cost | Fair Value | of Net Assets | |||||||||||
| Altus Midstream Company, | |||||||||||||||||
| 7.000% | Preferred Stock | 526 | 06/12/19 | $ | 525,834 | $ | 525,767 | 0.4 | % | ||||||||
| SemGroup Corporation, | |||||||||||||||||
| 7.000% | Preferred Stock | 2,877 | 01/19/18 | 2,877,000 | 2,361,912 | 1.6 | |||||||||||
| Targa Resources Corp., | |||||||||||||||||
| 9.500% | Preferred Stock | 2,108 | 03/16/16 | 1,866,506 | 2,547,852 | 1.8 | |||||||||||
| $ | 5,269,340 | $ | 5,435,531 | 3.8 | % | ||||||||||||
| NDP: | |||||||||||||||||
| Fair Value | |||||||||||||||||
| as Percent | |||||||||||||||||
| Investment Security | Investment Type | Shares | Acquisition Date | Acquisition Cost | Fair Value | of Net Assets | |||||||||||
| Targa Resources Corp., | |||||||||||||||||
| 9.500% | Preferred Stock | 1,997 | 03/16/16 | $ | 1,768,223 | $ | 2,413,691 | 3.7 | % | ||||||||
| Tortoise | 71 |
| Notes to Financial Statements (unaudited) (continued) |
| TPZ: | ||||||||||||||||||
| Fair Value | ||||||||||||||||||
| Principal | as Percent | |||||||||||||||||
| Investment Security | Investment Type | Amount/Shares | Acquisition Date(s) | Acquisition Cost | Fair Value | of Net Assets | ||||||||||||
| Antero Midstream Partners LP, | ||||||||||||||||||
| 5.750%, 03/01/2027* | Corporate Bond | $ | 2,000,000 | 04/05/19 | $ | 2,040,000 | $ | 1,835,000 | 1.4 | % | ||||||||
| Ascent Resources Utica | ||||||||||||||||||
| Holdings, LLC, | ||||||||||||||||||
| 10.000%, 04/01/2022* | Corporate Bond | $ | 1,302,000 | 08/27/18 | 1,445,220 | 1,305,255 | 1.0 | |||||||||||
| Ascent Resources Utica | ||||||||||||||||||
| Holdings, LLC, | ||||||||||||||||||
| 7.000%, 11/01/2026* | Corporate Bond | $ | 2,000,000 | 09/27/18 | 2,000,278 | 1,651,900 | 1.2 | |||||||||||
| Blue Racer Midstream, LLC, | ||||||||||||||||||
| 6.625%, 07/15/2026* | Corporate Bond | $ | 5,900,000 | 6/18/18-02/05/19 | 5,936,250 | 5,807,842 | 4.4 | |||||||||||
| Duquesne Light, Inc., | ||||||||||||||||||
| 6.400%, 09/15/2020* | Corporate Bond | $ | 3,000,000 | 11/30/11 | 3,180,330 | 3,112,533 | 2.3 | |||||||||||
| Duquesne Light Holdings, Inc., | ||||||||||||||||||
| 5.900%, 12/01/2021* | Corporate Bond | $ | 2,000,000 | 11/18/11-12/05/11 | 2,074,420 | 2,134,228 | 1.6 | |||||||||||
| Florida Gas Transmission Co., LLC, | ||||||||||||||||||
| 5.450%, 07/15/2020* | Corporate Bond | $ | 1,500,000 | 07/08/10-01/04/11 | 1,551,220 | 1,538,797 | 1.1 | |||||||||||
| Hess Corporation, | ||||||||||||||||||
| 5.625%, 02/15/2026* | Corporate Bond | $ | 4,160,000 | 07/19/18-08/06/18 | 4,196,600 | 4,305,600 | 3.3 | |||||||||||
| Midcontinent Express | ||||||||||||||||||
| Pipeline, LLC, | ||||||||||||||||||
| 6.700%, 09/15/2019* | Corporate Bond | $ | 2,000,000 | 09/09/09-03/02/10 | 2,061,010 | 2,001,500 | 1.5 | |||||||||||
| NGPL PipeCo LLC, | ||||||||||||||||||
| 4.875%, 08/15/2027* | Corporate Bond | $ | 2,000,000 | 07/30/18 | 2,030,000 | 2,123,153 | 1.6 | |||||||||||
| Pattern Energy Group Inc., | ||||||||||||||||||
| 5.875%, 02/01/2024* | Corporate Bond | $ | 1,000,000 | 01/20/17-01/23/17 | 1,011,875 | 1,035,000 | 0.8 | |||||||||||
| Rockies Express Pipeline LLC, | ||||||||||||||||||
| 4.950%, 07/15/2029* | Corporate Bond | $ | 3,000,000 | 04/12/19 | 3,002,670 | 3,058,434 | 2.3 | |||||||||||
| Ruby Pipeline, LLC, | ||||||||||||||||||
| 6.000%, 04/01/2022* | Corporate Bond | $ | 1,181,818 | 09/17/12 | 1,273,409 | 1,235,387 | 0.9 | |||||||||||
| Southern Star Central Corp., | ||||||||||||||||||
| 5.125%, 07/15/2022* | Corporate Bond | $ | 3,000,000 | 06/17/14 | 3,041,250 | 3,034,530 | 2.3 | |||||||||||
| Tallgrass Energy LP, | ||||||||||||||||||
| 5.500%, 01/15/2028* | Corporate Bond | $ | 3,250,000 | 09/24/18-02/06/19 | 3,261,250 | 3,059,063 | 2.3 | |||||||||||
| SemGroup Corporation, | ||||||||||||||||||
| 7.000% | Preferred Stock | 2,120 | 01/19/18 | 2,120,000 | 1,740,443 | 1.3 | ||||||||||||
| Altus Midstream Company, | ||||||||||||||||||
| 7.000% | Preferred Stock | 459 | 06/12/19 | 458,600 | 458,541 | 0.4 | ||||||||||||
| Targa Resources Corp., | ||||||||||||||||||
| 9.500% | Preferred Stock | 1,685 | 03/16/16 | 1,424,734 | 2,036,590 | 1.5 | ||||||||||||
| $ | 42,109,116 | $ | 41,473,796 | 31.2 | % | |||||||||||||
| TEAF: | ||||||||||||||||||
| Fair Value | ||||||||||||||||||
| Principal | as Percent | |||||||||||||||||
| Investment Security | Investment Type | Amount/Shares | Acquisition Date | Acquisition Cost | Fair Value | of Net Assets | ||||||||||||
| Grace Commons Property, | ||||||||||||||||||
| 15.000%, 10/31/2023* | Corporate Bond | $ | 1,825,000 | 06/17/19 | $ | 1,825,000 | $ | 1,825,000 | 0.7 | % | ||||||||
| Grace Commons Property, | ||||||||||||||||||
| 8.000%, 10/31/2023* | Corporate Bond | $ | 3,650,000 | 06/17/19 | 3,650,000 | 3,650,000 | 1.5 | |||||||||||
| Blue Racer Midstream, LLC, | ||||||||||||||||||
| 6.625%, 07/15/2026* | Corporate Bond | $ | 3,000,000 | 03/29/19 | 3,075,000 | 2,953,140 | 1.2 | |||||||||||
| Ascent Resources Utica Holdings, LLC, | ||||||||||||||||||
| 7.000%, 11/01/2026* | Corporate Bond | $ | 3,500,000 | 03/29/19 | 3,377,500 | 2,890,825 | 1.2 | |||||||||||
| Saturn Solar Bermuda 1 Ltd. | Construction Note | $ | 3,510,000 | 05/24/19-07/03/19 | 3,252,410 | 3,525,464 | 1.5 | |||||||||||
| Altus Midstream Company, | ||||||||||||||||||
| 7.000% | Preferred Stock | 4,076 | 06/12/19 | 4,076,217 | 4,075,697 | 1.7 | ||||||||||||
| Renewable Holdco, LLC | Private Investment | N/A | 07/01/19-07/30/19 | 8,098,695 | 8,098,695 | 3.3 | ||||||||||||
| $ | 27,354,822 | $ | 27,018,821 | 11.1 | % | |||||||||||||
| * | Security is eligible for resale under Rule 144A under the 1933 Act. |
| 72 | Tortoise |
| 2019 3rd Quarter Report | August 31, 2019 |
| Notes to Financial Statements (unaudited) (continued) |
7. Affiliated Company Transactions
A summary of the transactions in affiliated companies during the period ended August 31, 2019 is as follows:
| TYG: | ||||||||||||||||
| 8/31/19 | Net Change | |||||||||||||||
| 11/30/18 | Gross | Gross | Realized | Distributions | Share | 8/31/19 | in Unrealized | |||||||||
| Investment Security | Share Balance | Additions | Reductions | Gain/(Loss) | Received | Balance | Value | Depreciation | ||||||||
| TK NYS Solar Holdco, LLC | N/A | $4,108,065 | $ — | $ — | $275,000 | N/A | $12,153,147 | $10,663,385 | ||||||||
| TEAF: | ||||||||||||||||
| 8/31/19 | Net Change | |||||||||||||||
| 11/30/18 | Gross | Gross | Realized | Distributions | Share | 8/31/19 | in Unrealized | |||||||||
| Investment Security | Share Balance | Additions | Reductions | Gain/(Loss) | Received | Balance | Value | Appreciation | ||||||||
| Renewable Holdco, LLC | N/A | $8,098,695 | $ — | $ — | $ — | N/A | $8,098,695 | $ — | ||||||||
8. Investment Transactions
For the period ended August 31, 2019, the amount of security transactions (other than U.S. government securities and short-term investments), is as follows:
| TYG | NTG | TTP | NDP | TPZ | TEAF | |||||||||||||
| Purchases | $ | 490,499,665 | $ | 372,464,425 | $ | 42,508,724 | $ | 210,096,654 | $ | 32,449,276 | $ | 352,352,729 | ||||||
| Sales | $ | 464,894,048 | $ | 370,739,890 | $ | 53,750,309 | $ | 249,480,169 | $ | 30,757,483 | $ | 52,689,807 | ||||||
9. Senior Notes
TYG, NTG and TTP each have issued private senior notes (collectively, the “Notes”), which are unsecured obligations and, upon liquidation, dissolution or winding up of a Fund, will rank: (1) senior to all of the Fund’s outstanding preferred shares, if any; (2) senior to all of the Fund’s outstanding common shares; (3) on parity with any unsecured creditors of the Fund and any unsecured senior securities representing indebtedness of the Fund and (4) junior to any secured creditors of the Fund. Holders of the Notes are entitled to receive periodic cash interest payments until maturity. The Notes are not listed on any exchange or automated quotation system.
The Notes are redeemable in certain circumstances at the option of a Fund, subject to payment of any applicable make-whole amounts or early redemption premiums. The Notes for a Fund are also subject to a mandatory redemption if the Fund fails to meet asset coverage ratios required under the 1940 Act or the rating agency guidelines if such failure is not waived or cured. At August 31, 2019, each of TYG, NTG and TTP were in compliance with asset coverage covenants and basic maintenance covenants for its senior notes.
Details of each Fund’s outstanding Notes, including estimated fair value, as of August 31, 2019 are included below. The estimated fair value of each series of fixed-rate Notes was calculated, for disclosure purposes, by discounting future cash flows by a rate equal to the current U.S. Treasury rate with an equivalent maturity date, plus either 1) the spread between the interest rate on recently issued debt and the U.S. Treasury rate with a similar maturity date or 2) if there has not been a recent debt issuance, the spread between the AAA corporate finance debt rate and the U.S. Treasury rate with an equivalent maturity date plus the spread between the fixed rates of the Notes and the AAA corporate finance debt rate. The estimated fair value of floating rate Notes approximates the carrying amount because the interest rate fluctuates with changes in interest rates available in the current market. The estimated fair values in the following tables are Level 2 valuations within the fair value hierarchy.
| TYG: | |||||||||||||
| Notional | Estimated | ||||||||||||
| Series | Maturity Date | Interest Rate | Payment Frequency | Amount | Fair Value | ||||||||
| Series CC | September 27, 2019 | 3.48 | % | Semi-Annual | $ | 15,000,000 | $ | 15,228,138 | |||||
| Series J | December 19, 2019 | 3.30 | % | Semi-Annual | 15,000,000 | 15,120,244 | |||||||
| Series Y | June 14, 2020 | 2.77 | % | Semi-Annual | 12,500,000 | 12,587,341 | |||||||
| Series LL | June 14, 2020 | 3.63 | % (1) | Quarterly | 20,000,000 | 20,000,000 | |||||||
| Series O | September 27, 2020 | 3.78 | % | Semi-Annual | 15,000,000 | 15,436,097 | |||||||
| Series Z | June 14, 2021 | 2.98 | % | Semi-Annual | 12,500,000 | 12,710,192 | |||||||
| Series R | January 22, 2022 | 3.77 | % | Semi-Annual | 25,000,000 | 25,953,995 | |||||||
| Series DD | September 27, 2022 | 4.21 | % | Semi-Annual | 13,000,000 | 13,988,422 | |||||||
| Series II | December 18, 2022 | 3.22 | % | Semi-Annual | 10,000,000 | 10,375,744 | |||||||
| Series K | December 19, 2022 | 3.87 | % | Semi-Annual | 10,000,000 | 10,592,514 | |||||||
| Series S | January 22, 2023 | 3.99 | % | Semi-Annual | 10,000,000 | 10,611,184 | |||||||
| Series P | September 27, 2023 | 4.39 | % | Semi-Annual | 12,000,000 | 13,231,992 | |||||||
| Series FF | November 20, 2023 | 4.16 | % | Semi-Annual | 10,000,000 | 10,892,851 | |||||||
| Series JJ | December 18, 2023 | 3.34 | % | Semi-Annual | 20,000,000 | 21,048,949 | |||||||
| Series T | January 22, 2024 | 4.16 | % | Semi-Annual | 25,000,000 | 27,130,886 | |||||||
| Tortoise | 73 |
| Notes to Financial Statements (unaudited) (continued) |
| TYG: (continued) | |||||||||||||
| Notional | Estimated | ||||||||||||
| Series | Maturity Date | Interest Rate | Payment Frequency | Amount | Fair Value | ||||||||
| Series L | December 19, 2024 | 3.99 | % | Semi-Annual | $ | 20,000,000 | $ | 21,925,509 | |||||
| Series AA | June 14, 2025 | 3.48 | % | Semi-Annual | 10,000,000 | 10,750,858 | |||||||
| Series MM | June 14, 2025 | 3.65 | %(2) | Quarterly | 30,000,000 | 30,000,000 | |||||||
| Series NN | June 14, 2025 | 3.20 | % | Semi-Annual | 30,000,000 | 31,785,870 | |||||||
| Series KK | December 18, 2025 | 3.53 | % | Semi-Annual | 10,000,000 | 10,824,257 | |||||||
| Series OO | April 9, 2026 | 3.27 | % | Semi-Annual | 30,000,000 | 32,257,240 | |||||||
| Series PP | September 25, 2027 | 3.33 | % | Semi-Annual | 25,000,000 | 27,291,972 | |||||||
| $ | 380,000,000 | $ | 399,744,255 | ||||||||||
| (1) | Floating rate resets each quarter based on 3-month LIBOR plus 1.20%. The current rate is effective for the period from June 14, 2019 through September 15, 2019. The weighted-average interest rate for the period from December 1, 2018 through August 31, 2019 was 3.79%. |
| (2) | Floating rate resets each quarter based on 3-month LIBOR plus 1.25%. The current rate is effective for the period from June 14, 2019 through September 15, 2019. The weighted-average interest rate for the period from December 1, 2018 through August 31, 2019 was 3.84%. |
| NTG: | |||||||||||||
| Notional | Estimated | ||||||||||||
| Series | Maturity Date | Interest Rate | Payment Frequency | Amount | Fair Value | ||||||||
| Series K | September 9, 2019 | 3.74 | %(1) | Quarterly | $ | 35,000,000 | $ | 35,000,000 | |||||
| Series D | December 15, 2020 | 4.29 | % | Quarterly | 112,000,000 | 115,552,313 | |||||||
| Series J | April 17, 2021 | 3.72 | % | Semi-Annual | 30,000,000 | 31,043,010 | |||||||
| Series L | April 17, 2021 | 3.75 | %(2) | Quarterly | 20,000,000 | 20,000,000 | |||||||
| Series M | April 17, 2021 | 3.06 | % | Semi-Annual | 10,000,000 | 10,218,170 | |||||||
| Series P | October 16, 2023 | 3.79 | % | Semi-Annual | 20,000,000 | 21,513,696 | |||||||
| Series N | December 13, 2024 | 3.18 | % | Semi-Annual | 32,000,000 | 33,759,619 | |||||||
| Series Q | October 16, 2025 | 3.97 | % | Semi-Annual | 15,000,000 | 16,704,528 | |||||||
| Series R | October 16, 2026 | 4.02 | % | Semi-Annual | 13,000,000 | 14,692,078 | |||||||
| Series O | December 13, 2027 | 3.47 | % | Semi-Annual | 25,000,000 | 27,427,452 | |||||||
| $ | 312,000,000 | $ | 325,910,866 | ||||||||||
| (1) | Floating rate resets each quarter based on 3-month LIBOR plus 1.30%. The current rate is effective for the period from June 10, 2019 through September 9, 2019. The weighted-average rate for the period from December 1, 2018 through August 31, 2019 was 3.90%. |
| (2) | Floating rate resets each quarter based on 3-month LIBOR plus 1.45%. The current rate is effective for the period from July 17, 2019 through October 16, 2019. The weighted-average rate for the period from December 1, 2018 through August 31, 2019 was 4.03%. |
| TTP: | |||||||||||||
| Notional | Estimated | ||||||||||||
| Series | Maturity Date | Interest Rate | Payment Frequency | Amount | Fair Value | ||||||||
| Series F | December 12, 2020 | 3.01 | % | Semi-Annual | $ | 6,000,000 | $ | 6,078,574 | |||||
| Series D | December 15, 2021 | 4.08 | % | Quarterly | 16,000,000 | 16,770,915 | |||||||
| Series G | December 12, 2022 | 3.49 | %(1) | Quarterly | 6,000,000 | 6,000,000 | |||||||
| Series H | December 13, 2024 | 3.97 | % | Semi-Annual | 6,000,000 | 6,574,001 | |||||||
| $ | 34,000,000 | $ | 35,423,490 | ||||||||||
| (1) | Floating rate resets each quarter based on 3-month LIBOR plus 1.05%. The current rate is effective for the period from June 12, 2019 to September 11, 2019. The weighted-average interest rate for the period from December 1, 2018 through August 31, 2019 was 3.65%. |
On December 13, 2018, TTP issued $6,000,000 Series H Senior Notes which carry a fixed interest rate of 3.97% and mature on December 13, 2024.
TTP’s Series C Notes, with a notional amount of $6,000,000 and a fixed rate of 3.49%, matured and were paid in full on December 13, 2018.
10. Mandatory Redeemable Preferred Stock
TYG, NTG and TTP each have issued and outstanding MRP Stock at August 31, 2019. The MRP Stock has rights determined by the Board of Directors. Except as otherwise indicated in the Funds’ Charter or Bylaws, or as otherwise required by law, the holders of MRP Stock have voting rights equal to the holders of common stock (one vote per MRP share) and will vote together with the holders of shares of common stock as a single class except on matters affecting only the holders of preferred stock or the holders of common stock. The 1940 Act requires that the holders of any preferred stock (including MRP Stock), voting separately as a single class, have the right to elect at least two directors at all times.
| 74 | Tortoise |
| 2019 3rd Quarter Report | August 31, 2019 |
| Notes to Financial Statements (unaudited) (continued) |
Under the 1940 Act, a fund may not declare dividends or make other distributions on shares of common stock or purchases of such shares if, at the time of the declaration, distribution or purchase, asset coverage with respect to the outstanding MRP Stock would be less than 200%. The MRP Stock is also subject to a mandatory redemption if a Fund fails to meet an asset coverage ratio of at least 225% as determined in accordance with the 1940 Act or a rating agency basic maintenance amount if such failure is not waived or cured. At August 31, 2019, each of TYG, NTG and TTP were in compliance with asset coverage covenants and basic maintenance covenants for its MRP Stock.
Details of each Fund’s outstanding MRP Stock, including estimated fair value, as of August 31, 2019 is included below. The estimated fair value of each series of TYG, NTG and TTP MRP Stock was calculated for disclosure purposes by discounting future cash flows at a rate equal to the current U.S. Treasury rate with an equivalent maturity date, plus either 1) the spread between the interest rate on recently issued preferred stock and the U.S. Treasury rate with a similar maturity date or 2) if there has not been a recent preferred stock issuance, the spread between the AA corporate finance debt rate and the U.S. Treasury rate with an equivalent maturity date plus the spread between the fixed rates of the MRP Stock and the AA corporate finance debt rate. The estimated fair values of each series of the TYG, NTG and TTP MRP Stock are Level 2 valuations within the fair value hierarchy.
TYG:
TYG has 65,000,000 shares of preferred stock authorized and 16,500,000 shares of MRP Stock outstanding at August 31, 2019. TYG’s MRP Stock has a
liquidation value of $10.00 per share plus any accumulated but unpaid distributions, whether or not declared. Holders of the MRP D Stock and MRP E Stock are entitled to receive cash interest payments semi-annually at a fixed rate until maturity. The TYG
MRP Stock is not listed on any exchange or automated quotation system.
| Aggregate Liquidation | Estimated Fair | |||||||||||||||
| Series | Mandatory Redemption Date | Fixed Rate | Shares Outstanding | Preference | Value | |||||||||||
| Series D | December 17, 2021 | 4.01% | 8,500,000 | $ | 85,000,000 | $ | 87,748,921 | |||||||||
| Series E | December 17, 2024 | 4.34% | 8,000,000 | 80,000,000 | 86,913,641 | |||||||||||
| 16,500,000 | $ | 165,000,000 | $ | 174,662,562 | ||||||||||||
TYG’s MRP Stock is redeemable in certain circumstances at the option of TYG, subject to payment of any applicable make-whole amounts.
NTG:
NTG has 10,000,000 shares of preferred stock authorized and 5,280,000 shares of MRP Stock outstanding at August 31, 2019. NTG’s MRP Stock has a
liquidation value of $25.00 per share plus any accumulated but unpaid distributions, whether or not declared. Holders of NTG MRP Stock are entitled to receive cash interest payments each quarter at a fixed rate until maturity. The NTG MRP Stock is not
listed on any exchange or automated quotation system.
| Aggregate Liquidation | Estimated Fair | |||||||||||||||||
| Series | Mandatory Redemption Date | Fixed Rate | Shares Outstanding | Preference | Value | |||||||||||||
| Series C | December 8, 2020 | 3.73% | 200,000 | $ | 5,000,000 | $ | 5,071,838 | |||||||||||
| Series D | December 8, 2022 | 4.19% | 1,600,000 | 40,000,000 | 41,989,808 | |||||||||||||
| Series G | October 16, 2023 | 4.39% | 880,000 | 22,000,000 | 23,429,063 | |||||||||||||
| Series E | December 13, 2024 | 3.78% | 1,600,000 | 40,000,000 | 42,161,182 | |||||||||||||
| Series F | December 13, 2027 | 4.07% | 1,000,000 | 25,000,000 | 27,370,715 | |||||||||||||
| 5,280,000 | $ | 132,000,000 | $ | 140,022,606 | ||||||||||||||
NTG’s MRP Stock is redeemable in certain circumstances at the option of NTG, subject to payment of any applicable make-whole amounts.
TTP:
TTP has 10,000,000 shares of preferred stock authorized and 640,000 shares of MRP Stock outstanding at August 31, 2019. On December 13, 2018, TTP issued
640,000 Series B Mandatory Redeemable Preferred Shares (aggregate liquidation preference $16,000,000) which carry a fixed interest rate of 4.57% and a mandatory redemption date of December 13, 2024. On December 13, 2018, TTP redeemed 640,000 shares
(aggregate liquidation preference $16,000,000) of MRP A Stock. TTP’s MRP Stock has a liquidation value of $25.00 per share plus any accumulated but unpaid distributions, whether or not declared. Holders of TTP MRP Stock are entitled to receive cash
interest payments each quarter at a fixed rate until maturity. The TTP MRP Stock is not listed on any exchange or automated quotation system.
| Aggregate Liquidation | Estimated Fair | |||||||||
| Series | Mandatory Redemption Date | Fixed Rate | Shares Outstanding | Preference | Value | |||||
| Series B | December 13, 2024 | 4.57% | 640,000 | $ 16,000,000 | $ 17,508,619 |
TTP’s MRP Stock is redeemable in certain circumstances at the option of TTP, subject to payment of any applicable make-whole amounts.
| Tortoise | 75 |
| Notes to Financial Statements (unaudited) (continued) |
11. Credit Facilities
The following table shows key terms, average borrowing activity and interest rates for the period during which the facility was utilized during the period from December 1, 2018 through August 31, 2019 as well as the principal balance and interest rate in effect at August 31, 2019 for each of the Funds’ credit facilities:
| TYG | TYG | NTG | TTP | NDP | TPZ | TEAF | ||||||||
| Lending syndicate | The Bank | Bank of America, | The Bank | The Bank | The Bank | The Bank | ||||||||
| agent | U.S. Bank, N.A. | of Nova Scotia | N.A. | of Nova Scotia | of Nova Scotia | of Nova Scotia | of Nova Scotia | |||||||
| Unsecured, | Unsecured, | Unsecured, | Unsecured, | Secured, | Secured, | |||||||||
| revolving credit | revolving credit | revolving credit | revolving credit | revolving credit | revolving credit | Margin loan | ||||||||
| Type of facility | facility | facility | facility | facility | facility | facility | facility | |||||||
| Borrowing | ||||||||||||||
| capacity | $130,000,000 | $90,000,000 | $120,000,000 | $35,000,000 | $80,000,000 | $60,000,000 | $45,000,000 | |||||||
| 364-day rolling | 179-day rolling | 179-day rolling | ||||||||||||
| Maturity date | June 12, 2020 | June 22, 2020 | June 12, 2020 | evergreen | evergreen | evergreen | N/A | |||||||
| 1-month LIBOR | 1-month LIBOR | 1-month LIBOR | 1-month LIBOR | 1-month LIBOR | 1-month LIBOR | 1-month LIBOR | ||||||||
| Interest rate | plus 1.20% | plus 1.20% | plus 1.20% | plus 1.125% | plus 0.80% | plus 0.80% | plus 0.80% | |||||||
| Non-usage fee | 0.15%-0.25%(1) | 0.15%(2) | 0.15%-0.25%(3) | 0.15% | 0.20%(4) | 0.20%(5) | 0.20%(6) | |||||||
| For the period ended August 31, 2019: | ||||||||||||||
| Average principal | ||||||||||||||
| balance | $65,400,000 | $62,100,000 | $71,600,000 | $12,500,000 | $38,800,000 | $54,400,000(7) | $29,100,000 | |||||||
| Average | ||||||||||||||
| interest rate | 3.58% | 3.62% | 3.59% | 3.54% | 3.22% | 3.20%(7) | 3.16% | |||||||
| As of August 31, 2019: | ||||||||||||||
| Principal balance | ||||||||||||||
| outstanding | $80,900,000 | $63,000,000 | $84,100,000 | $11,500,000 | $28,700,000 | $56,100,000(7) | $31,500,000 | |||||||
| Interest rate | 3.19% | 3.29% | 3.19% | 3.21% | 2.89% | 2.89%(7) | 2.89% | |||||||
| (1) | Non-use fees are equal to a rate of 0.25% when the outstanding balance is below $65,000,000 and 0.15% when the outstanding balance is at least $65,000,000, but below $91,000,000. The outstanding balance will not be subject to the non-use fee when the amount outstanding is at least $91,000,000. |
| (2) | Non-usage fee is waived if the outstanding balance on the facility is at least $63,000,000. |
| (3) | Non-use fees are equal to a rate of 0.25% when the outstanding balance is below $60,000,000 and 0.15% when the outstanding balance is at least $60,000,000, but below $84,000,000. The outstanding balance will not be subject to the non-use fee when the amount outstanding is at least $84,000,000. |
| (4) | Non-usage fee is waived if the outstanding balance on the facility is at least $56,000,000. |
| (5) | Non-usage fee is waived if the outstanding balance on the facility is at least $42,000,000. |
| (6) | Non-usage fee is waived if the outstanding balance on the facility is at least $31,500,000. |
| (7) | TPZ’s credit facility allows for interest rates to be fixed on all or a portion of the outstanding balance. Amounts reflect activity on the credit facility for the period from December 1, 2018 through August 31, 2019 and include $15,000,000 of the outstanding principal balance that has a fixed rate of 3.03% through June 30, 2023 and $15,000,000 of the outstanding principal balance that has a fixed rate of 3.04% through June 30, 2024. |
On June 12, 2019, TYG entered into an amendment to its credit facility with U.S. Bank, N.A. that extends the credit facility through June 12, 2021. The terms of the amendment provide for an unsecured revolving credit facility of $130,000,000. During the extension, outstanding balances generally will accrue interest at a variable rate equal to one-month LIBOR plus 1.10 percent and unused portions of the credit facility will accrue a non-usage fee of 0.25 percent when the outstanding balance is below $65,000,000 and 0.15 percent when the balance is at least $65,000,000, but below $91,000,000. The non-usage fee is waived if the outstanding balance is at least $91,000,000.
On June 12, 2019, NTG entered into an amendment to its credit facility with Bank of America, N.A. that extends the credit facility through June 12, 2021. The terms of the amendment provide for an unsecured revolving credit facility of $120,000,000. During the extension, outstanding balances generally will accrue interest at a variable rate equal to one-month LIBOR plus 1.10 percent and unused portions of the credit facility will accrue a non-usage fee of 0.25 percent when the outstanding balance is below $60,000,000 and 0.15 percent when the balance is at least $60,000,000, but below $84,000,000. The non-usage fee is waived if the outstanding balance is at least $84,000,000.
Under the terms of the credit facilities, the Funds must maintain asset coverage required under the 1940 Act. If a Fund fails to maintain the required coverage, it may be required to repay a portion of an outstanding balance until the coverage requirement has been met. At August 31, 2019, each Fund was in compliance with credit facility terms.
| 76 | Tortoise |
| 2019 3rd Quarter Report | August 31, 2019 |
| Notes to Financial Statements (unaudited) (continued) |
12. Derivative Financial Instruments
The Funds have adopted the disclosure provisions of FASB Accounting Standard Codification 815, Derivatives and Hedging (“ASC 815”). ASC 815 requires enhanced disclosures about the Funds’ use of and accounting for derivative instruments and the effect of derivative instruments on the Funds’ results of operations and financial position. Tabular disclosure regarding derivative fair value and gain/loss by contract type (e.g., interest rate contracts, foreign exchange contracts, credit contracts, etc.) is required and derivatives accounted for as hedging instruments under ASC 815 must be disclosed separately from those that do not qualify for hedge accounting. Even though the Funds may use derivatives in an attempt to achieve an economic hedge, the Funds’ derivatives are not accounted for as hedging instruments under ASC 815 because investment companies account for their derivatives at fair value and record any changes in fair value in current period earnings.
Forward Currency Contracts
TEAF invests in derivative instruments for hedging or risk management purposes, and for short-term purposes such as maintaining
market exposure pending investment of the proceeds of an offering or transitioning its portfolio between different asset classes. The Fund’s use of derivatives could enhance or decrease the cash available to the Fund for payment of distributions or
interest, as the case may be. Derivatives can be illiquid, may disproportionately increase losses and have a potentially large negative impact on the Fund’s performance. Derivative transactions, including options on securities and securities
indices and other transactions in which the Fund may engage (such as forward currency transactions, futures contracts and options thereon and total return swaps), may subject the Fund to increased risk of principal loss due to unexpected movements in
stock prices, changes in stock volatility levels, interest rates and foreign currency exchange rates and imperfect correlations between the Fund’s securities holdings and indices upon which derivative transactions are based. The Fund also will be
subject to credit risk with respect to the counterparties to any OTC derivatives contracts the Fund enters into.
Interest Rate Swap Contracts
TYG and TPZ have each entered into interest rate swap contracts in an attempt to protect it from increasing interest expense
on its leverage resulting from increasing interest rates. A decline in interest rates may result in a decline in the value of the swap contracts, which may result in a decline in the net assets of TYG and TPZ. At the time the interest rate swap contracts
reach their scheduled termination, there is a risk that TYG and TPZ will not be able to obtain a replacement transaction, or that the terms of the replacement would not be as favorable as on the expiring transaction. In addition, if TYG or TPZ is
required to terminate any swap contract early due to a decline in net assets below a threshold amount ($450,000,000 for TYG and $60,000,000 for TPZ) or failing to maintain a required 300% asset coverage of the liquidation value of the outstanding debt,
then TYG or TPZ could be required to make a payment to the extent of any net unrealized depreciation of the terminated swaps, in addition to redeeming all or some of its outstanding debt. TYG and TPZ each segregate a portion of its assets as collateral
for the amount of any net liability of its interest rate swap contracts.
TYG and TPZ are exposed to credit risk on the interest rate swap contracts if the counterparty should fail to perform under the terms of the interest rate swap contracts. The amount of credit risk is limited to the net appreciation of the interest rate swap contracts, if any, as no collateral is pledged by the counterparty. In addition, if the counterparty to the interest rate swap contracts defaults, the Fund would incur a loss in the amount of the receivable and would not receive amounts due from the counterparty to offset the interest payments on the Fund’s leverage.
The average notional amount of all open swap agreements for TYG and TPZ for the period from December 1, 2018 through August 31, 2019 was $10,000,000 and $9,000,000, respectively.
The following table presents TYG’s and TPZ’s interest rate swap contracts, each of which is subject to a netting agreement, on a gross and a net basis at August 31, 2019:
| Gross Amounts Not Offset in the | |||||||||||||||||||||||
| Statement of Assets & Liabilities | |||||||||||||||||||||||
| Gross Amounts | Net Amounts of | ||||||||||||||||||||||
| Gross Amounts | Offset in the | Assets Presented in | |||||||||||||||||||||
| of Recognized | Statements of | the Statements of | Financial | Cash Collateral | |||||||||||||||||||
| Description | Assets | Assets & Liabilities | Assets & Liabilities | Instruments | Received | Net Amount | |||||||||||||||||
| TPZ: Interest Rate Swap Contracts | $ | 12,429 | $ | (10,495 | ) | $ | 1,934 | $ | — | $ | — | $ | 1,934 | ||||||||||
| Gross Amounts Not Offset in the | |||||||||||||||||||||||
| Statement of Assets & Liabilities | |||||||||||||||||||||||
| Gross Amounts | Net Amounts of | ||||||||||||||||||||||
| Gross Amounts | Offset in the | Assets Presented in | |||||||||||||||||||||
| of Recognized | Statements of | the Statements of | Financial | Cash Collateral | |||||||||||||||||||
| Description | Liabilities | Assets & Liabilities | Assets & Liabilities | Instruments | Received | Net Amount | |||||||||||||||||
| TYG: Interest Rate Swap Contracts | $ | 206,016 | $ | — | $ | 206,016 | $ | — | $ | — | $ | 206,016 | |||||||||||
| TPZ: Interest Rate Swap Contracts | $ | 10,495 | $ | (10,495 | ) | $ | — | $ | — | $ | — | $ | — | ||||||||||
| Tortoise | 77 |
| Notes to Financial Statements (unaudited) (continued) |
Written Call Options
Transactions in written option contracts for TYG, NTG, TTP, NDP and TEAF for the period from December 1, 2018 through August 31, 2019
are as follows:
| TYG | NTG | TTP | |||||||||||||||||||
| Number of | Number of | Number of | |||||||||||||||||||
| Contracts | Premium | Contracts | Premium | Contracts | Premium | ||||||||||||||||
| Options outstanding at November 30, 2018 | 39,884 | $ | 493,575 | 28,299 | $ | 350,544 | 5,539 | $ | 512,777 | ||||||||||||
| Options written | 106,799 | 2,281,005 | 112,944 | 2,404,255 | 55,403 | 2,840,503 | |||||||||||||||
| Options closed* | (3,689 | ) | (145,518 | ) | (4,538 | ) | (130,690 | ) | (45,406 | ) | (2,732,772 | ) | |||||||||
| Options exercised | (6,961 | ) | (291,207 | ) | (5,648 | ) | (159,744 | ) | (2,708 | ) | (154,099 | ) | |||||||||
| Options expired | (128,212 | ) | (2,125,846 | ) | (117,551 | ) | (2,140,518 | ) | (7,727 | ) | (336,534 | ) | |||||||||
| Options outstanding at August 31, 2019 | 7,821 | $ | 212,009 | 13,506 | $ | 323,847 | 5,101 | $ | 129,875 | ||||||||||||
| NDP | TEAF | ||||||||||||||||||||
| Number of | Number of | ||||||||||||||||||||
| Contracts | Premium | Contracts | Premium | ||||||||||||||||||
| Options outstanding at November 30, 2018 | 41,406 | $ | 2,406,989 | — | $ | — | |||||||||||||||
| Options written | 537,954 | 14,121,390 | 112,159 | 2,802,174 | |||||||||||||||||
| Options closed* | (390,760 | ) | (11,981,349 | ) | (80,073 | ) | (2,091,275 | ) | |||||||||||||
| Options exercised | (39,668 | ) | (1,558,446 | ) | (6,928 | ) | (94,497 | ) | |||||||||||||
| Options expired | (117,997 | ) | (2,465,892 | ) | (15,273 | ) | (178,116 | ) | |||||||||||||
| Options outstanding at August 31, 2019 | 30,935 | $ | 522,692 | 9,885 | $ | 438,286 | |||||||||||||||
| * | The aggregate cost of closing written option contracts was $10,362 for TYG, $11,270 for NTG, $2,148,637 for TTP, $9,012,462 for NDP, and $367,235 for TEAF, resulting in net realized gain (loss) of $135,157, $119,420, $(584,134), $2,968,887 and $1,724,040 for TYG, NTG, TTP, NDP and TEAF, respectively. |
The following table presents the types and fair value of derivatives by location as presented on the Statements of Assets & Liabilities at August 31, 2019:
| Assets/(Liabilities) | ||||||
| Derivatives not accounted for | ||||||
| as hedging instruments under ASC 815 | Location | Fair Value | ||||
| TYG: Interest rate swap contracts | Interest rate swap contracts | $ | (206,016 | ) | ||
| TYG: Written equity call options | Options written, at fair value | $ | (185,860 | ) | ||
| NTG: Written equity call options | Options written, at fair value | $ | (282,953 | ) | ||
| TTP: Written equity call options | Options written, at fair value | $ | (133,191 | ) | ||
| NDP: Written equity call options | Options written, at fair value | $ | (461,810 | ) | ||
| TPZ: Interest rate swap contracts | Interest rate swap contracts | $ | 1,934 | |||
| TEAF: Forward currency contracts | Forward currency contracts | $ | 348,075 | |||
| TEAF: Written equity call options | Options written, at fair value | $ | (442,064 | ) | ||
The following table presents the effect of derivatives on the Statements of Operations for the period ended August 31, 2019:
| Net Unrealized | |||||||||
| Net Realized | Appreciation | ||||||||
| Derivatives not accounted for | Location of Gains (Losses) | Gain on | (Depreciation) | ||||||
| as hedging instruments under ASC 815 | on Derivatives | Derivatives | of Derivatives | ||||||
| TYG: Interest rate swap contracts | Interest rate swaps | $ | 4,736 | $ | (314,899 | ) | |||
| TYG: Written equity call options | Options | $ | 2,261,003 | $ | 454,416 | ||||
| NTG: Written equity call options | Options | $ | 2,259,938 | $ | 343,812 | ||||
| TTP: Written equity call options | Options | $ | 920,668 | $ | (316,310 | ) | |||
| NDP: Written equity call options | Options | $ | 5,434,779 | $ | (1,511,100 | ) | |||
| TPZ: Interest rate swap contracts | Interest rate swaps | $ | 68,860 | $ | (126,696 | ) | |||
| TEAF: Forward foreign exchange contracts | Forward currency contracts | $ | 246,833 | $ | 348,075 | ||||
| TEAF: Written equity call options | Options | $ | 1,901,830 | $ | (3,778 | ) | |||
| 78 | Tortoise |
| 2019 3rd Quarter Report | August 31, 2019 |
| Notes to Financial Statements (unaudited) (continued) |
13. Basis For Consolidation
As of August 31, 2019, TYG has committed a total of $55,256,470 of equity funding to Tortoise Holdco II, LLC, a wholly-owned investment of TYG. Tortoise Holdco II, LLC wholly owns TK NYS Solar Holdco, LLC, which owns and operates renewable energy assets. TK NYS Solar Holdco, LLC acquired the commercial and industrial solar portfolio between August 2017 and August 2019. Fair value of TK NYS Solar Holdco, LLC is net of tax benefits.
TYG’s consolidated schedule of investments includes the portfolio holdings of the Fund and its subsidiary, Tortoise Holdco II, LLC. All inter-company transactions and balances have been eliminated.
As of August 31, 2019, TEAF has provided $3,770,670 to TEAF Solar Holdco I, LLC, a wholly-owned investment of TEAF. TEAF Solar Holdco I, LLC has committed to $6,667,100 of debt funding to Saturn Solar Bermuda 1, Ltd. through a construction note. Under the terms of the note Tortoise Solar Holdco I, LLC receives cash payments monthly at an annual rate of 6%. As of August 31, 2019, $3,510,000 of the construction note had been funded.
As of August 31, 2019, TEAF has provided $8,098,695 to TEAF Solar Holdco, LLC, a wholly-owned investment of TEAF. TEAF Solar Holdco, LLC wholly owns Renewable Holdco, LLC, which owns and operates renewable energy assets. Renewable Holdco, LLC’s acquisition of the commercial and industrial solar portfolio is ongoing.
TEAF’s consolidated schedule of investments includes the portfolio holdings of the Fund and its subsidiaries, TEAF Solar Holdco I, LLC and TEAF Solar Holdco, LLC. All inter-company transactions and balances have been eliminated.
14. Subsequent Events
TYG:
TYG has performed an evaluation of subsequent events through the date the financial statements were issued and has determined that no items require recognition or disclosure.
NTG:
On September 5, 2019, NTG entered into an amendment to its credit facility. The amendment increased the capacity of the facility from $120,000,000 to
$140,000,000.
NTG has performed an evaluation of subsequent events through the date the financial statements were issued and has determined that no additional items require recognition or disclosure.
TTP:
TTP has performed an evaluation of subsequent events through the date the financial statements were issued and has determined that no items require
recognition or disclosure.
NDP:
NDP has performed an evaluation of subsequent events through the date the financial statements were issued and has determined that no items require
recognition or disclosure.
TPZ:
On September 30, 2019, TPZ paid a distribution in the amount of $0.125 per common share, for a total of $868,917. Of this total, the dividend reinvestment
amounted to $12,088.
TPZ has performed an evaluation of subsequent events through the date the financial statements were issued and has determined that no additional items require recognition or disclosure.
TEAF:
On September 30, 2019, TEAF paid a distribution in the amount of $0.1085 per common share, for a total of $1,463,787. Of this total, the dividend
reinvestment amounted to $97,692.
TEAF has performed an evaluation of subsequent events through the date the financial statements were issued and has determined that no additional items require recognition or disclosure.
| Tortoise | 79 |
| Additional Information (unaudited) |
Director and Officer Compensation
The Funds do not compensate any of its directors who are “interested persons,” as defined in Section 2(a)(19) of
the 1940 Act, nor any of its officers. For the period from December 1, 2018 through August 31, 2019, the aggregate compensation paid by the Funds to the independent directors was as follows:
| TYG | NTG | TTP | NDP | TPZ | TEAF | |||||
| $131,150 | $113,600 | $ 92,000 | $ 89,000 | $ 82,250 | $ 26,000 |
The Funds did not pay any special compensation to any of its directors or officers.
Forward-Looking Statements
This report contains “forward-looking statements” within the meaning of the 1933 Act and the Securities Exchange Act of
1934, as amended. By their nature, all forward-looking statements involve risks and uncertainties, and actual results could differ materially from those contemplated by the forward-looking statements. Several factors that could materially affect each
Fund’s actual results are the performance of the portfolio of investments held by it, the conditions in the U.S. and international financial, petroleum and other markets, the price at which shares of each Fund will trade in the public markets and
other factors discussed in filings with the Securities and Exchange Commission (SEC).
Proxy Voting Policies
A description of the policies and procedures that each Fund uses to determine how to vote proxies relating to portfolio securities owned by
the Fund and information regarding how each Fund voted proxies relating to the portfolio of securities during the 12-month period ended June 30, 2019 are available to stockholders (i) without charge, upon request by calling the Adviser at (913) 981-1020
or toll-free at (866) 362-9331 and on or through the Adviser’s Web site at www.tortoiseadvisors.com; and (ii) on the SEC’s Web site at www.sec.gov.
Form N-Q
Each Fund files its complete schedule of portfolio holdings for the first and third quarters of each fiscal year with the SEC on Form N-Q or Part F of
Form N-PORT (beginning with filings after March 31, 2019). Each Fund’s Form N-Q and Part F of Form N-PORT are available without charge upon request by calling the Adviser at (866) 362-9331 or by visiting the SEC’s Web site at
www.sec.gov.
Each Fund’s Form N-Qs are also available through the Adviser’s Web site at www.tortoiseadvisors.com.
Statement of Additional Information
The Statement of Additional Information (“SAI”) includes additional information about each Fund’s directors
and is available upon request without charge by calling the Adviser at (866) 362-9331 or by visiting the SEC’s Web site at www.sec.gov.
Certifications
Each Fund’s Chief Executive Officer has submitted to the New York Stock Exchange the annual CEO certification as required by Section
303A.12(a) of the NYSE Listed Company Manual.
Each Fund has filed with the SEC, as an exhibit to its most recently filed Form N-CSR, the certification of its Chief Executive Officer and Principal Financial Officer required by Section 302 of the Sarbanes-Oxley Act.
| 80 | Tortoise |
| 2019 3rd Quarter Report | August 31, 2019 |
| Additional Information (unaudited) (continued) |
Privacy Policy
In order to conduct its business, each Fund collects and maintains certain nonpublic personal information about its stockholders of record with
respect to their transactions in shares of each Fund’s securities. This information includes the stockholder’s address, tax identification or Social Security number, share balances, and distribution elections. We do not collect or maintain
personal information about stockholders whose share balances of our securities are held in “street name” by a financial institution such as a bank or broker.
We do not disclose any nonpublic personal information about you, the Funds’ other stockholders or the Funds’ former stockholders to third parties unless necessary to process a transaction, service an account, or as otherwise permitted by law.
To protect your personal information internally, we restrict access to nonpublic personal information about the Funds’ stockholders to those employees who need to know that information to provide services to our stockholders. We also maintain certain other safeguards to protect your nonpublic personal information.
Repurchase Disclosure
Notice is hereby given in accordance with Section 23(c) of the 1940 Act, that each Fund may from time to time purchase shares of its common
stock in the open market.
| Tortoise | 81 |
|
Office of the Company Board of Directors of H. Kevin Birzer, Chairman Rand C. Berney Conrad S. Ciccotello Alexandra Herger Jennifer Paquette |
Administrator Custodian Transfer, Dividend Disbursing Legal Counsel Investor Relations Stock Symbols This report is for stockholder information. This is not a prospectus intended for use in the purchase or sale of fund shares. Past performance is no guarantee of future results and your investment may be worth more or less at the time you sell. |

11550 Ash Street, Suite 300
Leawood, KS 66211
www.tortoiseadvisors.com