Table of Contents
As filed with the Securities and Exchange Commission on April 30, 2012
UNITED STATES
SECURITIES AND EXCHANGE COMMISSION
WASHINGTON, D.C. 20549
FORM 20-F
(Mark One)
| ¨ | REGISTRATION STATEMENT PURSUANT TO SECTION 12(b) OR (g) OF THE SECURITIES EXCHANGE ACT OF 1934 |
OR
| x | ANNUAL REPORT PURSUANT TO SECTION 13 OR 15(d) OF THE SECURITIES EXCHANGE ACT OF 1934 |
For the fiscal year ended December 31, 2011
OR
| ¨ | TRANSITION REPORT PURSUANT TO SECTION 13 OR 15(d) OF THE SECURITIES EXCHANGE ACT OF 1934 |
OR
| ¨ | SHELL COMPANY REPORT PURSUANT TO SECTION 13 OR 15(d) OF THE SECURITIES EXCHANGE ACT OF 1934 |
Date of event requiring this shell company report
For the transition period from to
Commission file number 001-31811
Woori Finance Holdings Co., Ltd.
(Exact name of Registrant as specified in its charter)
Woori Finance Holdings Co., Ltd.
(Translation of Registrant’s name into English)
The Republic of Korea
(Jurisdiction of incorporation or organization)
203 Hoehyon-dong, 1-ga, Chung-gu, Seoul 100-792, Korea
(Address of principal executive offices)
Woo Seok Seong
203 Hoehyon-dong, 1-ga, Chung-gu, Seoul 100-792, Korea
Telephone No.: +82-2-2125-2110
Facsimile No.: +82-2-2125-2293
(Name, telephone, e-mail and/or facsimile number and address of company contact person)
Securities registered or to be registered pursuant to Section 12(b) of the Act.
| Title of each class |
Name of each exchange on which registered | |
| American Depositary Shares, each representing three shares of Common Stock |
New York Stock Exchange | |
| Common Stock, par value (Won)5,000 per share |
New York Stock Exchange* |
Securities registered or to be registered pursuant to Section 12(g) of the Act.
None
Securities for which there is a reporting obligation pursuant to Section 15(d) of the Act.
None
Indicate the number of outstanding shares of each of the issuer’s classes of capital or common stock as of the close of the period covered by the annual report.
806,013,341 shares of Common Stock, par value (Won)5,000 per share
Indicate by check mark if the registrant is a well-known seasoned issuer, as defined in Rule 405 of the Securities Act. x Yes ¨ No
If this report is an annual or transition report, indicate by check mark if the registrant is not required to file reports pursuant to Section 13 or 15 (d) of the Securities Exchange Act of 1934. ¨ Yes x No
Indicate by check mark whether the registrant (1) has filed all reports required to be filed by Section 13 or 15(d) of the Securities Exchange Act of 1934 during the preceding 12 months (or for such shorter period that the registrant was required to file such reports), and (2) has been subject to such filing requirements for the past 90 days. x Yes ¨ No
Indicate by check mark whether the registrant has submitted electronically and posted on its Web site, if any, every Interactive Data File required to be submitted and posted pursuant to Rule 405 of Regulation S-T (§232.405 of this chapter) during the preceding 12 months (or for such shorter period that the registrant was required to submit and post such files). ¨ Yes ¨ No
Indicate by check mark whether the registrant is a large accelerated filer, an accelerated filer, or a non-accelerated filer. See definition of “accelerated filer and large accelerated filer” in Rule 12b-2 of the Exchange Act. (Check one):
| x Large accelerated filer |
¨ Accelerated Filer |
¨ Non-accelerated filer |
Indicate by check mark which basis of accounting the registrant has used to prepare the financial statements included in this filing:
| ¨ U.S. GAAP |
x International Financial
Reporting Standards as issued |
¨ Other |
If “other” has been checked in response to the previous question, indicate by check mark which financial statement item the registrant has elected to follow. ¨ Item 17 ¨ Item 18
If this is an annual report, indicate by check mark whether the registrant is a shell company (as defined in Rule 12b-2 of the Exchange Act). ¨ Yes x No
(APPLICABLE ONLY TO ISSUERS INVOLVED IN BANKRUPTCY PROCEEDINGS DURING THE PAST FIVE YEARS)
Indicate by check mark whether the registrant has filed all documents and reports required to be filed by Sections 12, 13 or 15(d) of the Securities Exchange Act of 1934 subsequent to the distribution of securities under a plan confirmed by a court. ¨ Yes ¨ No
* Not for trading, but only in connection with the registration of the American Depositary Shares.
Table of Contents
| Page | ||||||||
| 1 | ||||||||
| 2 | ||||||||
| Item 1. |
3 | |||||||
| Item 2. |
3 | |||||||
| Item 3. |
3 | |||||||
| Item 3A. |
3 | |||||||
| Item 3B. |
12 | |||||||
| Item 3C. |
12 | |||||||
| Item 3D. |
12 | |||||||
| Item 4. |
37 | |||||||
| Item 4A. |
37 | |||||||
| Item 4B. |
44 | |||||||
| Item 4C. |
131 | |||||||
| Item 4D. |
132 | |||||||
| Item 4.A. |
133 | |||||||
| Item 5. |
133 | |||||||
| Item 5A. |
133 | |||||||
| Item 5B. |
152 | |||||||
| Item 5C. |
159 | |||||||
| Item 5D. |
159 | |||||||
| Item 5E. |
159 | |||||||
| Item 5F. |
159 | |||||||
| Item 6. |
159 | |||||||
| Item 6A. |
159 | |||||||
| Item 6B. |
162 | |||||||
| Item 6C. |
162 | |||||||
| Item 6D. |
165 | |||||||
| Item 6E. |
166 | |||||||
| Item 7. |
166 | |||||||
| Item 7A. |
166 | |||||||
| Item 7B. |
166 | |||||||
| Item 7C. |
167 | |||||||
| Item 8. |
167 | |||||||
| Item 8A. |
167 | |||||||
| Item 8B. |
170 | |||||||
| Item 9. |
170 | |||||||
| Item 9A. |
170 | |||||||
| Item 9B. |
171 | |||||||
| Item 9C. |
171 | |||||||
| Item 9D. |
178 | |||||||
| Item 9E. |
178 | |||||||
| Item 9F. |
178 | |||||||
| Item 10. |
178 | |||||||
| Item 10A. |
178 | |||||||
| Item 10B. |
178 | |||||||
| Item 10C. |
185 | |||||||
| Item 10D. |
185 | |||||||
| Item 10E. |
186 | |||||||
| Item 10F. |
190 | |||||||
| Item 10G. |
191 | |||||||
i
Table of Contents
| Page | ||||||||
| Item 10H. |
191 | |||||||
| Item 10I. |
191 | |||||||
| Item 11. |
191 | |||||||
| Item 12. |
219 | |||||||
| Item 13. |
220 | |||||||
| Item 14. |
Material Modifications to the Rights of Security Holders and Use of Proceeds |
220 | ||||||
| Item 15. |
220 | |||||||
| Item 16. |
221 | |||||||
| Item 16A. |
221 | |||||||
| Item 16B. |
221 | |||||||
| Item 16C. |
221 | |||||||
| Item 16D. |
222 | |||||||
| Item 16E. |
Purchase of Equity Securities by the Issuer and Affiliated Purchasers |
222 | ||||||
| Item 16F. |
222 | |||||||
| Item 16G. |
223 | |||||||
| Item 16H. |
224 | |||||||
| Item 17. |
224 | |||||||
| Item 18. |
224 | |||||||
| Item 19. |
224 | |||||||
ii
Table of Contents
PRESENTATION OF FINANCIAL AND OTHER INFORMATION
The financial statements included in this annual report are prepared in accordance with International Financial Reporting Standards, or IFRS, as issued by the International Accounting Standards Board, or IASB. As such, we make an explicit and unreserved statement of compliance with IFRS as issued by the IASB with respect to our consolidated financial statements as of and for the years ended December 31, 2010 and 2011 included in this annual report. Unless indicated otherwise, the financial information in this annual report (i) as of and for the years ended December 31, 2010 and 2011 has been prepared in accordance with IFRS as issued by the IASB, and (ii) as of and for the years ended December 31, 2007, 2008 and 2009 has been prepared in accordance with generally accepted accounting principles in the United States, or U.S. GAAP, which is not comparable to information prepared in accordance with IFRS. For an explanation of how the transition to IFRS has affected our consolidated financial statements, see Notes 47 and 48 of the notes to our consolidated financial statements.
In accordance with rule amendments adopted by the U.S. Securities and Exchange Commission which became effective on March 4, 2008, we are not required to provide a reconciliation to U.S. GAAP. Furthermore, pursuant to the transitional relief granted by the U.S. Securities and Exchange Commission in respect of the first-time application of IFRS, no audited financial statements and financial information prepared under IFRS as of or for the year ended December 31, 2009 have been included in this annual report.
Unless expressly stated otherwise, all financial data included in this annual report are presented on a consolidated basis.
In April 2008, we acquired a 51.0% interest in LIG Life Insurance, and entered into a joint venture agreement with Aviva International Holdings Limited in connection with this acquisition. LIG Life Insurance was subsequently renamed Woori Aviva Life Insurance and became an equity method investee under U.S. GAAP as of April 2008. Under IFRS, Woori Aviva Life Insurance is accounted for as part of our investments in jointly controlled entities and associates.
In March 2011, we acquired certain assets and assumed certain liabilities of Samhwa Mutual Savings Bank through our wholly-owned consolidated subsidiary, Woori FG Savings Bank Co., Ltd., which was established in connection with such transaction.
In this annual report:
| • | references to “we,” “us” or “Woori Finance Holdings” are to Woori Finance Holdings Co., Ltd. and, unless the context otherwise requires, its subsidiaries; |
| • | references to “Korea” are to the Republic of Korea; |
| • | references to the “government” are to the government of the Republic of Korea; |
| • | references to “Won” or “(Won)” are to the currency of Korea; and |
| • | references to “U.S. dollars,” “$” or “US$” are to United States dollars. |
Discrepancies between totals and the sums of the amounts contained in any table may be a result of rounding.
For your convenience, this annual report contains translations of Won amounts into U.S. dollars at the noon buying rate of the Federal Reserve Bank of New York for Won in effect on December 30, 2011, which was (Won)1,158.5 = US$1.00.
1
Table of Contents
The U.S. Securities and Exchange Commission encourages companies to disclose forward-looking information so that investors can better understand a company’s future prospects and make informed investment decisions. This annual report contains forward-looking statements.
Words and phrases such as “aim,” “anticipate,” “assume,” “believe,” “contemplate,” “continue,” “estimate,” “expect,” “future,” “goal,” “intend,” “may,” “objective,” “plan,” “positioned,” “predict,” “project,” “risk,” “seek to,” “shall,” “should,” “will likely result,” “will pursue,” “plan” and words and terms of similar substance used in connection with any discussion of future operating or financial performance or our expectations, plans, projections or business prospects identify forward-looking statements. In particular, the statements under the headings “Item 3D. Risk Factors,” “Item 4B. Business Overview” and “Item 5. Operating and Financial Review and Prospects” regarding our financial condition and other future events or prospects are forward-looking statements. All forward-looking statements are management’s present expectations of future events and are subject to a number of factors and uncertainties that could cause actual results to differ materially from those described in the forward-looking statements.
In addition to the risks related to our business discussed under “Item 3D. Risk Factors,” other factors could cause actual results to differ materially from those described in the forward-looking statements. These factors include, but are not limited to:
| • | our ability to successfully implement our strategy; |
| • | future levels of non-performing loans; |
| • | our growth and expansion; |
| • | the adequacy of provisions for credit and other losses; |
| • | technological changes; |
| • | interest rates; |
| • | investment income; |
| • | availability of funding and liquidity; |
| • | our exposure to market risks; and |
| • | adverse market and regulatory conditions. |
By their nature, certain disclosures relating to these and other risks are only estimates and could be materially different from what actually occurs in the future. As a result, actual future gains, losses or impact on our income or results of operations could materially differ from those that have been estimated. For example, revenues could decrease, costs could increase, capital costs could increase, capital investment could be delayed and anticipated improvements in performance might not be fully realized.
In addition, other factors that could cause actual results to differ materially from those estimated by the forward-looking statements contained in this annual report could include, but are not limited to:
| • | general economic and political conditions in Korea or other countries that have an impact on our business activities or investments; |
| • | the monetary and interest rate policies of Korea; |
| • | inflation or deflation; |
| • | unanticipated volatility in interest rates; |
| • | foreign exchange rates; |
| • | prices and yields of equity and debt securities; |
2
Table of Contents
| • | the performance of the financial markets in Korea and globally; |
| • | changes in domestic and foreign laws, regulations and taxes; |
| • | changes in competition and the pricing environment in Korea; and |
| • | regional or general changes in asset valuations. |
For further discussion of the factors that could cause actual results to differ, see the discussion under “Item 3D. Risk Factors” contained in this annual report. We caution you not to place undue reliance on the forward-looking statements, which speak only as of the date of this annual report. Except as required by law, we are not under any obligation, and expressly disclaim any obligation, to update or alter any forward-looking statements, whether as a result of new information, future events or otherwise.
All subsequent forward-looking statements attributable to us or any person acting on our behalf are expressly qualified in their entirety by the cautionary statements contained or referred to in this annual report.
| Item 1. | IDENTITY OF DIRECTORS, SENIOR MANAGEMENT AND ADVISERS |
Not Applicable
| Item 2. | OFFER STATISTICS AND EXPECTED TIMETABLE |
Not Applicable
| Item 3. | KEY INFORMATION |
| Item 3A. | Selected Financial Data |
The selected consolidated financial and operating data set forth below as of and for the years ended December 31, 2010 and 2011 have been derived from our audited consolidated financial statements, which have been prepared in accordance with IFRS as issued by the IASB. Our consolidated financial statements as of and for the years ended December 31, 2010 and 2011 have been audited by Deloitte Anjin LLC, an independent registered public accounting firm.
Pursuant to the transitional relief granted by the U.S. Securities and Exchange Commission in respect of the first-time application of IFRS, financial and operating data as of and for the years ended December 31, 2007, 2008 and 2009 derived from our consolidated financial statements prepared in accordance with U.S. GAAP have not been included below.
You should read the following data together with the more detailed information contained in “Item 5. Operating and Financial Review and Prospects” and our consolidated financial statements included elsewhere in this annual report. Historical results do not necessarily predict future results.
3
Table of Contents
Consolidated Statement of Comprehensive Income Data
| Year ended December 31, | ||||||||||||
| 2010 | 2011 | 2011(1) | ||||||||||
| (in billions of Won except per share data) |
(in millions of US$ except per share data) |
|||||||||||
| Interest income |
(Won) | 14,057 | (Won) | 15,045 | US$ | 12,986 | ||||||
| Interest expense |
7,634 | 7,783 | 6,718 | |||||||||
|
|
|
|
|
|
|
|||||||
| Net interest income |
6,423 | 7,262 | 6,268 | |||||||||
| Fees and commissions income |
1,688 | 1,774 | 1,532 | |||||||||
| Fees and commissions expense |
572 | 579 | 500 | |||||||||
|
|
|
|
|
|
|
|||||||
| Net fees and commissions income |
1,116 | 1,195 | 1,032 | |||||||||
| Dividends |
201 | 203 | 175 | |||||||||
| Gain on financial assets at fair value through profit or loss |
39 | 119 | 103 | |||||||||
| Gain on available-for-sale financial assets |
1,073 | 1,073 | 926 | |||||||||
| Gain on held-to-maturity financial assets |
0 | 0 | 0 | |||||||||
| Impairment loss on credit loss |
2,873 | 2,269 | 1,958 | |||||||||
| Other net operating expenses(2) |
(3,910 | ) | (4,423 | ) | (3,818 | ) | ||||||
|
|
|
|
|
|
|
|||||||
| Operating income |
2,069 | 3,160 | 2,728 | |||||||||
| Share of profits of jointly controlled entities and associates |
30 | 17 | 14 | |||||||||
|
|
|
|
|
|
|
|||||||
| Net income before income tax expense |
2,099 | 3,177 | 2,742 | |||||||||
| Income tax expense |
498 | 744 | 642 | |||||||||
|
|
|
|
|
|
|
|||||||
| Net income |
(Won) | 1,601 | (Won) | 2,433 | US$ | 2,100 | ||||||
|
|
|
|
|
|
|
|||||||
| Net income attributable to owners |
1,289 | 2,137 | 1,844 | |||||||||
| Net income attributable to the non-controlling interests |
312 | 296 | 256 | |||||||||
| Other comprehensive income (loss), net of tax |
(236 | ) | (385 | ) | (332 | ) | ||||||
|
|
|
|
|
|
|
|||||||
| Loss on available-for-sale financial assets |
(205 | ) | (375 | ) | (323 | ) | ||||||
| Share of other comprehensive loss of jointly controlled entities and associates |
(21 | ) | (38 | ) | (32 | ) | ||||||
| Gain (loss) on overseas business translation |
(19 | ) | 25 | 21 | ||||||||
| Gain on valuation of cashflow hedge |
9 | 3 | 2 | |||||||||
| Total comprehensive income |
(Won) | 1,365 | (Won) | 2,048 | US$ | 1,768 | ||||||
|
|
|
|
|
|
|
|||||||
| Comprehensive income attributable to owners |
1,052 | 1,730 | 1,493 | |||||||||
| Comprehensive income attributable to non-controlling interests |
313 | 318 | 275 | |||||||||
| Basic and diluted earnings per share |
(Won) | 1,599 | (Won) | 2,649 | US$ | 2.29 | ||||||
|
|
|
|
|
|
|
|||||||
| Per common share data: |
||||||||||||
| Net income (loss) per share—basic |
(Won) | 1,599 | (Won) | 2,649 | US$ | 2.29 | ||||||
| Weighted average common shares outstanding—basic (in thousands) |
806,013 | 806,013 | 806,013 | |||||||||
| Net income (loss) per share—diluted |
(Won) | 1,599 | (Won) | 2,649 | US$ | 2.29 | ||||||
| Weighted average common shares outstanding—diluted (in thousands) |
806,013 | 806,013 | 806,013 | |||||||||
| Cash dividends paid per share |
(Won) | 250 | (Won) | 250 | US$ | 0.22 | ||||||
| (1) | Won amounts are expressed in U.S. dollars at the rate of (Won)1,158.5 to US$1.00, the noon buying rate in effect on December 30, 2011 as quoted by the Federal Reserve Bank of New York in the United States. |
| (2) | For a description of “other net operating expenses,” see Note 39 of the notes to our consolidated financial statements. |
4
Table of Contents
Consolidated Statement of Financial Position Data
| As of December 31, | ||||||||||||
| 2010 | 2011 | 2011(1) | ||||||||||
| (in billions of Won) | (in millions of US$) |
|||||||||||
| Assets |
||||||||||||
| Cash and cash equivalents |
(Won) | 4,871 | (Won) | 6,417 | US$ | 5,539 | ||||||
| Financial assets at fair value through profit or loss |
22,184 | 25,600 | 22,098 | |||||||||
| Available-for-sale financial assets |
21,998 | 19,672 | 16,981 | |||||||||
| Held-to-maturity financial assets |
19,886 | 20,036 | 17,295 | |||||||||
| Loans and receivables |
216,792 | 235,160 | 202,986 | |||||||||
| Investments in jointly controlled entities and associates |
745 | 928 | 801 | |||||||||
| Investment properties |
643 | 499 | 431 | |||||||||
| Premises and equipment |
3,097 | 3,135 | 2,706 | |||||||||
| Intangible assets and goodwill |
295 | 448 | 387 | |||||||||
| Current tax assets |
9 | 57 | 49 | |||||||||
| Deferred tax assets |
59 | 80 | 69 | |||||||||
| Derivative assets |
131 | 327 | 282 | |||||||||
| Assets held for sale |
88 | 56 | 48 | |||||||||
| Other assets(2) |
379 | 377 | 325 | |||||||||
|
|
|
|
|
|
|
|||||||
| Total assets |
(Won) | 291,177 | (Won) | 312,792 | US$ | 269,997 | ||||||
|
|
|
|
|
|
|
|||||||
| Liabilities |
||||||||||||
| Financial liabilities at fair value through profit or loss |
(Won) | 8,838 | (Won) | 9,622 | 8,305 | |||||||
| Deposits due to customers |
185,428 | 195,930 | 169,124 | |||||||||
| Borrowings |
34,266 | 34,667 | 29,924 | |||||||||
| Debentures |
29,111 | 29,266 | 25,262 | |||||||||
| Provisions |
761 | 892 | 770 | |||||||||
| Retirement benefit obligation |
70 | 120 | 103 | |||||||||
| Current tax liabilities |
174 | 274 | 237 | |||||||||
| Deferred tax liabilities |
213 | 260 | 225 | |||||||||
| Derivative liabilities |
5 | 33 | 29 | |||||||||
| Other financial liabilities(3) |
11,648 | 19,084 | 16,473 | |||||||||
| Other liabilities(4) |
399 | 570 | 492 | |||||||||
|
|
|
|
|
|
|
|||||||
| Total liabilities |
(Won) | 270,913 | (Won) | 290,718 | US$ | 250,944 | ||||||
|
|
|
|
|
|
|
|||||||
| Equity |
||||||||||||
| Owners’ Equity |
(Won) | 15,701 | (Won) | 17,525 | 15,126 | |||||||
| Capital stock |
4,030 | 4,030 | 3,479 | |||||||||
| Hybrid securities |
— | 309 | 267 | |||||||||
| Capital surplus |
180 | 176 | 151 | |||||||||
| Other equity(5) |
1,002 | 587 | 506 | |||||||||
| Retained earnings |
10,489 | 12,423 | 10,723 | |||||||||
| Non-controlling interests |
4,563 | 4,549 | 3,927 | |||||||||
|
|
|
|
|
|
|
|||||||
| Total equity |
(Won) | 20,264 | (Won) | 22,074 | US$ | 19,053 | ||||||
|
|
|
|
|
|
|
|||||||
| Total liabilities and equity |
(Won) | 291,177 | (Won) | 312,792 | US$ | 269,997 | ||||||
|
|
|
|
|
|
|
|||||||
| (1) | Won amounts are expressed in U.S. dollars at the rate of (Won)1,158.5 to US$1.00, the noon buying rate in effect on December 30, 2011 as quoted by the Federal Reserve Bank of New York in the United States. |
| (2) | For a description of “other assets,” see Note 18 of the notes to our consolidated financial statements. |
| (3) | For a description of “other financial liabilities,” see Note 24 of the notes to our consolidated financial statements. |
| (4) | For a description of “other liabilities,” see Note 24 of the notes to our consolidated financial statements. |
| (5) | For a description of “other equity,” see Note 29 of the notes to our consolidated financial statements. |
5
Table of Contents
Profitability Ratios and Other Data
| Year ended December 31, | ||||||||
| 2010 | 2011 | |||||||
| (in billions of Won except percentages) | ||||||||
| Return on average assets(1) |
0.44 | % | 0.70 | % | ||||
| Return on average equity(2) |
6.45 | 9.95 | ||||||
| Net interest spread(3) |
2.12 | 2.31 | ||||||
| Net interest margin(4) |
2.29 | 2.50 | ||||||
| Cost-to-income ratio(5) |
47.56 | 47.95 | ||||||
| Average equity as a percentage of average total assets |
6.79 | 7.04 | ||||||
| Total revenue(6) |
(Won) | 17,058 | (Won) | 18,214 | ||||
| Operating expense(7) |
12,116 | 12,785 | ||||||
| Operating margin(8) |
4,942 | 5,429 | ||||||
| Operating margin as a percentage of total revenue |
28.97 | % | 29.81 | % | ||||
| (1) | Represents net income attributable to owners as a percentage of average total assets. Average balances are based on daily balances for Woori Bank, Kyongnam Bank, Kwangju Bank and Woori Investment & Securities and on quarterly balances for all of our other subsidiaries and our special purpose companies. |
| (2) | Represents net income attributable to owners as a percentage of average equity. Average balances are based on daily balances for Woori Bank, Kyongnam Bank, Kwangju Bank and Woori Investment & Securities and on quarterly balances for all of our other subsidiaries and our special purpose companies. |
| (3) | Represents the difference between the yield on average interest-earning assets and cost of average interest-bearing liabilities. |
| (4) | Represents the ratio of net interest income to average interest-earning assets. |
| (5) | Represents the ratio of non-interest expense (excluding impairment loss on credit loss) to the sum of net interest income and non-interest income. |
| (6) | Represents the sum of interest income, dividend income, fees and commissions income, gain on financial assets at fair value through profit or loss, gain on available-for-sale financial assets and gain on held-to-maturity financial assets. |
The following table shows how total revenue is calculated:
| Year ended December 31, | ||||||||
| 2010 | 2011 | |||||||
| (in billions of Won) | ||||||||
| Interest income |
(Won) | 14,057 | (Won) | 15,045 | ||||
| Fees and commissions income |
1,688 | 1,774 | ||||||
| Dividends |
201 | 203 | ||||||
| Gain on financial assets at fair value through profit or loss |
39 | 119 | ||||||
| Gain on available-for-sale financial assets |
1,073 | 1,073 | ||||||
| Gain on held-to-maturity financial assets |
— | — | ||||||
|
|
|
|
|
|||||
| Total revenue |
(Won) | 17,058 | (Won) | 18,214 | ||||
|
|
|
|
|
|||||
| (7) | Represents interest expense, fees and commissions expense and other net operating expense, excluding impairment loss on credit loss of (Won)2,873 billion and (Won)2,269 billion for 2010 and 2011, respectively. |
The following table shows how operating expense is calculated:
| 2010 | 2011 | |||||||
| (in billions of Won) | ||||||||
| Interest expense |
(Won) | 7,634 | (Won) | 7,783 | ||||
| Fees and commissions expense |
572 | 579 | ||||||
| Other net operating expenses |
3,910 | 4,423 | ||||||
|
|
|
|
|
|||||
| Operating expense |
(Won) | 12,116 | (Won) | 12,785 | ||||
|
|
|
|
|
|||||
| (8) | Represents total revenue less operating expense. |
6
Table of Contents
Asset Quality Data
| As of December 31, | ||||||||
| 2010 | 2011 | |||||||
| (in billions of Won) | ||||||||
| Total loans(1) |
(Won) | 201,235 | (Won) | 212,492 | ||||
| Total non-performing loans(2) |
6,550 | 3,780 | ||||||
| Other impaired loans not included in non-performing loans |
475 | 238 | ||||||
| Total non-performing loans and other impaired loans |
7,025 | 4,018 | ||||||
| Total provisions for credit losses |
4,718 | 3,759 | ||||||
| Non-performing loans as a percentage of total loans |
3.25 | % | 1.78 | % | ||||
| Non-performing loans as a percentage of total assets |
2.25 | 1.21 | ||||||
| Total non-performing loans and other impaired loans as a percentage of total loans |
3.49 | 1.89 | ||||||
| Provisions for credit losses as a percentage of total loans |
2.34 | 1.77 | ||||||
| (1) | Not including due from banks and other receivables, and prior to deducting provisions for credit losses (of (Won)4,718 billion and (Won)3,759 billion as of December 31, 2010 and 2011, respectively) and present value discount (of (Won)16 billion and (Won)31 billion as of December 31, 2010 and 2011, respectively) or reflecting deferred origination costs (of (Won)74 billion and (Won)178 billion as of December 31, 2010 and 2011, respectively) |
| (2) | Defined as those loans that are classified as substandard or below based on the Financial Services Commission’s asset classification criteria. See “Item 4B. Business Overview—Assets and Liabilities—Asset Quality of Loans—Loan Classifications.” |
7
Table of Contents
Segment Information
The following table sets forth financial data as of or for the year ended December 31, 2011 for our business segments:
| Woori Bank | Kyongnam Bank |
Kwangju Bank |
Woori Investment & Securities |
Other | Inter-segment transactions(1) |
Total | ||||||||||||||||||||||
| (in billions of Won) | ||||||||||||||||||||||||||||
| Interest income |
(Won) | 11,659 | (Won) | 1,295 | (Won) | 950 | (Won) | 662 | (Won) | 511 | (Won) | (32 | ) | (Won) | 15,045 | |||||||||||||
| Interest expense |
5,934 | 612 | 450 | 330 | 507 | (50 | ) | 7,783 | ||||||||||||||||||||
|
|
|
|
|
|
|
|
|
|
|
|
|
|
|
|||||||||||||||
| Net interest income |
5,725 | 683 | 500 | 332 | 4 | 18 | 7,262 | |||||||||||||||||||||
| Non-interest income |
16,611 | 421 | 166 | 3,218 | 1,332 | (957 | ) | 20,791 | ||||||||||||||||||||
| Non-interest expense |
15,137 | 422 | 158 | 2,760 | 293 | (136 | ) | 18,634 | ||||||||||||||||||||
|
|
|
|
|
|
|
|
|
|
|
|
|
|
|
|||||||||||||||
| Net non-interest income (loss) |
1,474 | (1 | ) | 8 | 458 | 1,039 | (821 | ) | 2,157 | |||||||||||||||||||
| Administrative expenses |
2,553 | 274 | 224 | 570 | 450 | (288 | ) | 3,783 | ||||||||||||||||||||
| Impairment loss on credit loss |
1,963 | 153 | 108 | 7 | 206 | 39 | 2,476 | |||||||||||||||||||||
|
|
|
|
|
|
|
|
|
|
|
|
|
|
|
|||||||||||||||
| Total other expenses |
4,516 | 427 | 332 | 577 | 656 | (249 | ) | 6,259 | ||||||||||||||||||||
|
|
|
|
|
|
|
|
|
|
|
|
|
|
|
|||||||||||||||
| Operating income |
2,683 | 255 | 176 | 213 | 387 | (554 | ) | 3,160 | ||||||||||||||||||||
|
|
|
|
|
|
|
|
|
|
|
|
|
|
|
|||||||||||||||
| Share of profits of jointly controlled entities and associates |
(24 | ) | — | — | 43 | (24 | ) | 22 | 17 | |||||||||||||||||||
| Income tax expense (benefit) |
590 | 59 | 40 | 58 | 24 | (27 | ) | 744 | ||||||||||||||||||||
|
|
|
|
|
|
|
|
|
|
|
|
|
|
|
|||||||||||||||
| Net income |
(Won) | 2,069 | (Won) | 196 | (Won) | 136 | (Won) | 198 | (Won) | 339 | (Won) | (505 | ) | (Won) | 2,433 | |||||||||||||
|
|
|
|
|
|
|
|
|
|
|
|
|
|
|
|||||||||||||||
| Controlling interest |
2,068 | 196 | 136 | 165 | 368 | (796 | ) | 2,137 | ||||||||||||||||||||
| Non-controlling interest |
1 | — | — | 33 | (29 | ) | 291 | 296 | ||||||||||||||||||||
| Segments’ total assets |
(Won) | 242,472 | (Won) | 25,354 | (Won) | 18,030 | (Won) | 21,535 | (Won) | 25,381 | (Won) | (19,980 | ) | (Won) | 312,792 | |||||||||||||
|
|
|
|
|
|
|
|
|
|
|
|
|
|
|
|||||||||||||||
| (1) | Includes eliminations for intersegment transactions and certain differences in classification under the management reporting system. |
8
Table of Contents
Selected Financial Information
Average Balances and Related Interest
The following tables show our average balances and interest rates for 2010 and 2011:
| Year ended December 31, | ||||||||||||||||||||||||
| 2010 | 2011 | |||||||||||||||||||||||
| Average Balance(1) |
Interest Income(2)(3) |
Average Yield |
Average Balance(1) |
Interest Income(2)(3) |
Average Yield |
|||||||||||||||||||
| (in billions of Won except percentages) | ||||||||||||||||||||||||
| Assets |
||||||||||||||||||||||||
| Interest-earning assets |
||||||||||||||||||||||||
| Due from banks |
(Won) | 9,671 | (Won) | 116 | 1.20 | % | (Won) | 10,615 | (Won) | 169 | 1.59 | % | ||||||||||||
|
Loans(4)(5) |
||||||||||||||||||||||||
| Commercial and industrial |
97,487 | 5,765 | 5.91 | 100,205 | 6,165 | 6.15 | ||||||||||||||||||
| Trade financing |
11,997 | 316 | 2.63 | 12,984 | 309 | 2.38 | ||||||||||||||||||
| Lease financing |
1,399 | 146 | 10.44 | 1,956 | 199 | 10.17 | ||||||||||||||||||
| Other commercial |
14,490 | 735 | 5.07 | 15,602 | 765 | 4.90 | ||||||||||||||||||
| General purpose household(6) |
70,132 | 3,554 | 5.07 | 69,954 | 3,735 | 5.34 | ||||||||||||||||||
| Mortgage |
4,748 | 245 | 5.16 | 8,643 | 452 | 5.23 | ||||||||||||||||||
| Credit cards(3) |
4,607 | 1,116 | 24.22 | 4,788 | 1,100 | 22.97 | ||||||||||||||||||
|
|
|
|
|
|
|
|
|
|||||||||||||||||
| Total loans |
204,860 | 11,877 | 5.80 | 214,132 | 12,725 | 5.94 | ||||||||||||||||||
| Securities |
||||||||||||||||||||||||
| Trading |
19,273 | 695 | 3.61 | 18,287 | 660 | 3.61 | ||||||||||||||||||
| Investment(7) |
37,466 | 1,237 | 3.30 | 37,359 | 1,360 | 3.64 | ||||||||||||||||||
|
|
|
|
|
|
|
|
|
|||||||||||||||||
| Total securities |
56,739 | 1,932 | 3.41 | 55,646 | 2,020 | 3.63 | ||||||||||||||||||
|
|
|
|
|
|
|
|
|
|||||||||||||||||
| Other |
8,850 | 132 | 1.49 | 10,378 | 131 | 1.26 | ||||||||||||||||||
|
|
|
|
|
|
|
|
|
|||||||||||||||||
| Total average interest-earning assets |
280,120 | 14,057 | 5.02 | 290,771 | 15,045 | 5.17 | ||||||||||||||||||
|
|
|
|
|
|
|
|
|
|||||||||||||||||
| Total average non-interest-earning assets |
13,979 | — | — | 14,456 | — | — | ||||||||||||||||||
|
|
|
|
|
|
|
|
|
|||||||||||||||||
| Total average assets |
(Won) | 294,099 | (Won) | 14,057 | 4.78 | % | (Won) | 305,227 | (Won) | 15,045 | 4.93 | % | ||||||||||||
|
|
|
|
|
|
|
|
|
|||||||||||||||||
9
Table of Contents
| Year ended December 31, | ||||||||||||||||||||||||
| 2010 | 2011 | |||||||||||||||||||||||
| Average Balance(1) |
Interest Expense |
Average Cost |
Average Balance(1) |
Interest Expense |
Average Cost |
|||||||||||||||||||
| (in billions of Won, except percentages) | ||||||||||||||||||||||||
| Liabilities |
||||||||||||||||||||||||
| Interest-bearing liabilities |
||||||||||||||||||||||||
| Deposits due to customers: |
||||||||||||||||||||||||
| Demand deposits |
(Won) | 7,407 | (Won) | 20 | 0.27 | % | (Won) | 10,728 | (Won) | 28 | 0.26 | % | ||||||||||||
| Time and savings deposits |
150,317 | 4,320 | 2.87 | 160,952 | 4,835 | 3.00 | ||||||||||||||||||
| Certificates of deposit |
8,459 | 364 | 4.30 | 2,746 | 113 | 4.12 | ||||||||||||||||||
| Other deposits(8) |
17,583 | 272 | 1.55 | 18,217 | 322 | 1.77 | ||||||||||||||||||
| Total deposits |
183,766 | 4,976 | 2.71 | 192,643 | 5,298 | 2.75 | ||||||||||||||||||
| Borrowings |
32,311 | 728 | 2.25 | 34,414 | 815 | 2.37 | ||||||||||||||||||
| Debentures |
33,523 | 1,808 | 5.39 | 30,433 | 1,551 | 5.10 | ||||||||||||||||||
| Other |
13,218 | 122 | 0.92 | 14,386 | 119 | 0.83 | ||||||||||||||||||
|
|
|
|
|
|
|
|
|
|||||||||||||||||
| Total average interest-bearing liabilities |
262,818 | 7,634 | 2.90 | 271,876 | 7,783 | 2.86 | ||||||||||||||||||
|
|
|
|
|
|
|
|
|
|||||||||||||||||
| Total average non-interest-bearing liabilities |
11,304 | — | — | 11,869 | — | — | ||||||||||||||||||
|
|
|
|
|
|
|
|
|
|||||||||||||||||
| Total average liabilities |
274,122 | 7,634 | 2.78 | 283,745 | 7,783 | 2.74 | ||||||||||||||||||
|
|
|
|
|
|
|
|
|
|||||||||||||||||
| Total average equity |
19,977 | — | — | 21,482 | — | — | ||||||||||||||||||
|
|
|
|
|
|
|
|
|
|||||||||||||||||
| Total average liabilities and equity |
(Won) | 294,099 | (Won) | 7,634 | 2.60 | % | (Won) | 305,227 | (Won) | 7,783 | 2.55 | % | ||||||||||||
|
|
|
|
|
|
|
|
|
|||||||||||||||||
| (1) | Average balances are based on daily balances for Woori Bank, Kyongnam Bank, Kwangju Bank and Woori Investment & Securities and on quarterly balances for all of our other subsidiaries and our special purpose companies. |
| (2) | Includes cash interest received on non-accrual loans. |
| (3) | Interest income from credit cards is derived from interest on credit card loans and credit card installment purchases, merchant fees and commission on cash advances and credit card installment purchases. |
| (4) | Includes non-accrual loans. |
| (5) | Not including other receivables, and prior to deducting provisions for credit losses and present value discount or reflecting deferred origination costs. |
| (6) | Includes home equity loans. |
| (7) | Includes available-for-sale financial assets and held-to-maturity financial assets. |
| (8) | Includes funds deposited by securities brokerage customers of Woori Investment & Securities and foreign currency-denominated deposits. |
10
Table of Contents
Analysis of Changes in Net Interest Income—Volume and Rate Analysis
The following table provides an analysis of changes in interest income, interest expense and net interest income based on changes in volume and changes in rate for 2010 compared to 2011. Information is provided with respect to: (1) effects attributable to changes in volume (changes in volume multiplied by prior rate) and (2) effects attributable to changes in rate (changes in rate multiplied by prior volume). Changes attributable to the combined impact of changes in rate and volume have been allocated proportionately to the changes due to volume changes and changes due to rate changes.
| 2011 vs.
2010 Increase/(decrease) due to changes in |
||||||||||||
| Volume | Rate | Total | ||||||||||
| (in billions of Won) | ||||||||||||
| Interest-earning assets |
||||||||||||
| Due from banks |
(Won) | 11 | (Won) | 42 | (Won) | 53 | ||||||
|
Loans(1) |
||||||||||||
| Commercial and industrial |
161 | 239 | 400 | |||||||||
| Trade financing |
26 | (33 | ) | (7 | ) | |||||||
| Lease financing |
58 | (5 | ) | 53 | ||||||||
| Other commercial |
56 | (26 | ) | 30 | ||||||||
| General purpose household(2) |
(9 | ) | 190 | 181 | ||||||||
| Mortgage |
201 | 6 | 207 | |||||||||
| Credit cards |
44 | (60 | ) | (16 | ) | |||||||
| Securities |
||||||||||||
| Trading |
(36 | ) | 1 | (35 | ) | |||||||
| Investment |
(4 | ) | 127 | 123 | ||||||||
| Other |
23 | (24 | ) | (1 | ) | |||||||
|
|
|
|
|
|
|
|||||||
| Total interest income |
(Won) | 531 | (Won) | 457 | (Won) | 988 | ||||||
|
|
|
|
|
|
|
|||||||
| Interest-bearing liabilities |
||||||||||||
| Deposits due to customers |
||||||||||||
| Demand deposits |
(Won) | 9 | (Won) | (1 | ) | (Won) | 8 | |||||
| Time and savings deposits |
306 | 209 | 515 | |||||||||
| Certificate of deposit |
(246 | ) | (5 | ) | (251 | ) | ||||||
| Other deposits |
10 | 40 | 50 | |||||||||
| Borrowings |
47 | 40 | 87 | |||||||||
| Debentures |
(167 | ) | (90 | ) | (257 | ) | ||||||
| Other |
11 | (14 | ) | (3 | ) | |||||||
|
|
|
|
|
|
|
|||||||
| Total interest expense |
(Won) | (30 | ) | (Won) | 179 | (Won) | 149 | |||||
|
|
|
|
|
|
|
|||||||
| Net interest income |
(Won) | 561 | (Won) | 278 | (Won) | 839 | ||||||
|
|
|
|
|
|
|
|||||||
| (1) | Not including other receivables, and prior to deducting provisions for credit losses and present value discount or reflecting deferred origination costs. |
| (2) | Includes home equity loans. |
11
Table of Contents
Exchange Rates
The table below sets forth, for the periods and dates indicated, information concerning the noon buying rate for Won, expressed in Won per one U.S. dollar. The “noon buying rate” is the rate in New York City for cable transfers in foreign currencies as certified for customs purposes by the Federal Reserve Bank of New York. Unless otherwise stated, translations of Won amounts into U.S. dollars in this annual report were made at the noon buying rate in effect on December 30, 2011, which was (Won)1,158.5 to US$1.00. We do not intend to imply that the Won or U.S. dollar amounts referred to herein could have been or could be converted into U.S. dollars or Won, as the case may be, at any particular rate, or at all. On April 20, 2012, the noon buying rate was (Won)1,138.1 = US$1.00.
| Won per U.S. dollar (noon buying rate) | ||||||||||||||||
| Low | High | Average(1) | Period-End | |||||||||||||
| 2006 |
913.7 | 1,002.9 | 954.3 | 930.0 | ||||||||||||
| 2007 |
903.2 | 950.2 | 929.0 | 935.8 | ||||||||||||
| 2008 |
935.2 | 1,507.9 | 1,098.7 | 1,262.0 | ||||||||||||
| 2009 |
1,149.0 | 1,570.1 | 1,274.6 | 1,163.7 | ||||||||||||
| 2010 |
1,104.0 | 1,253.2 | 1,155.7 | 1,130.6 | ||||||||||||
| 2011 |
1,049.2 | 1,197.5 | 1,106.9 | 1,158.5 | ||||||||||||
| October |
1,102.5 | 1,197.5 | 1,150.7 | 1,112.1 | ||||||||||||
| November |
1,110.6 | 1,162.0 | 1,133.5 | 1,140.1 | ||||||||||||
| December |
1,124.5 | 1,175.5 | 1,148.1 | 1,158.5 | ||||||||||||
| 2012 (through April 20) |
1,115.7 | 1,160.0 | 1,130.6 | 1,138.1 | ||||||||||||
| January |
1,120.1 | 1,160.0 | 1,140.3 | 1,125.7 | ||||||||||||
| February |
1,115.7 | 1,128.9 | 1,122.7 | 1,117.1 | ||||||||||||
| March |
1,116.0 | 1,139.8 | 1,126.2 | 1,131.4 | ||||||||||||
| April (through April 20) |
1,122.4 | 1,143.4 | 1,134.8 | 1,138.1 | ||||||||||||
| Source: | Federal Reserve Bank of New York. |
| (1) | The average of the daily noon buying rates of the Federal Reserve Bank in effect during the relevant period (or portion thereof). |
| Item 3B. | Capitalization and Indebtedness |
Not Applicable
| Item 3C. | Reasons for the Offer and Use of Proceeds |
Not Applicable
| Item 3D. | Risk Factors |
Risks relating to our corporate credit portfolio
The largest portion of our exposure is to small- and medium-sized enterprises, and financial difficulties experienced by companies in this segment may result in a deterioration of our asset quality and have an adverse impact on us.
Our loans to small- and medium-sized enterprises amounted to (Won)81,618 billion, or 40.6% of our total loans, as of December 31, 2010 and (Won)83,624 billion, or 39.4% of our total loans, as of December 31, 2011. As of December 31, 2011, Won-denominated loans to small- and medium-sized enterprises that were classified as substandard or below were (Won)1,744 billion, representing 2.1% of such loans to those enterprises. See “Item 4B. Business Overview—Corporate Banking—Small and Medium-Sized Enterprise Banking.” We recorded charge-offs of (Won)758 billion in respect of our Won-denominated loans to small- and medium-sized enterprises in 2011, compared to charge-offs of (Won)614 billion in 2010. According to data compiled by the Financial Supervisory Service, the industry-wide delinquency ratios for Won-denominated loans to small- and medium-sized enterprises increased through most of 2010 and further increased in 2011. The delinquency ratio for small- and
12
Table of Contents
medium-sized enterprises is calculated as the ratio of (1) the outstanding balance of such loans in respect of which either principal or interest payments are over due by one month or more to (2) the aggregate outstanding balance of such loans. Our delinquency ratio for such loans denominated in Won was 1.5% as of December 31, 2010 and 1.6% as of December 31, 2011. Our delinquency ratio may increase further in 2012 as a result of, among other things, adverse economic conditions in Korea and globally. See “—Other risks relating to our business—Difficult conditions in the global financial markets could adversely affect our liquidity and performance.” Accordingly, we may be required to take measures to decrease our exposures to these customers.
In light of the deteriorating financial condition and liquidity position of small- and medium-sized enterprises in Korea as a result of the global financial crisis commencing in the second half of 2008, the Korean government introduced measures intended to encourage Korean banks to provide financial support to small- and medium-sized enterprise borrowers. For example, the Korean government requested Korean banks, including Woori Bank, Kyongnam Bank and Kwangju Bank, to establish a “fast track” program to provide liquidity assistance to small- and medium-sized enterprises on an expedited basis. Under the “fast track” programs established by Woori Bank, Kyongnam Bank and Kwangju Bank, which are currently expected to be effective through December 31, 2012, liquidity assistance is provided to small- and medium-sized enterprise borrowers applying for such assistance, in the form of new short term loans or maturity extensions or interest rate adjustments with respect to existing loans, after expedited credit review and approval by such banks. The overall prospects for the Korean economy in 2012 and beyond remain uncertain, and the Korean government may extend existing policies and initiatives or introduce new policies or initiatives to encourage Korean banks to provide financial support to small- and medium-sized enterprises. We believe that, to date, our participation in such government-led initiatives (primarily through the “fast track” program) has not caused us to extend a material amount of credit that we would not have otherwise extended nor materially impacted our results of operations and financial condition in general. The aggregate amount of outstanding small- and medium-sized enterprise loans made by Woori Bank, Kyongnam Bank and Kwangju Bank under the “fast track” program was (Won)311 billion as of December 31, 2011, which represented 0.4% of the total small- and medium-sized enterprise loan portfolio of such banks as of such date. Furthermore, loans made by us under the “fast track” program are partially guaranteed by the Korean government’s public financial institutions, including the Korea Credit Guarantee Fund and the Korea Technology Finance Corporation. However, there can be no assurance that our future participation in such government-led initiatives would not lead us to extend credit to small- and medium-sized enterprise borrowers that we would not otherwise extend, or offer terms for such credit that we would not otherwise offer, in the absence of such initiatives. Furthermore, there is no guarantee that the financial condition and liquidity position of our small- and medium-sized enterprise borrowers benefiting from such initiatives will improve sufficiently for them to service their debt on a timely basis, or at all. Accordingly, increases in our exposure to small- and medium-sized enterprises resulting from such government-led initiatives may have a material adverse effect on our results of operations and financial condition.
Many small- and medium-sized enterprises represent sole proprietorships or very small businesses dependent on a relatively limited number of suppliers or customers and tend to be affected to a greater extent than large corporate borrowers by fluctuations in the Korean and global economy. In addition, small- and medium-sized enterprises often maintain less sophisticated financial records than large corporate borrowers. Therefore, it is generally more difficult for us to judge the level of risk inherent in lending to these enterprises, as compared to large corporations.
In addition, many small- and medium-sized enterprises have close business relationships with large corporations in Korea, primarily as suppliers. Any difficulties encountered by those large corporations would likely hurt the liquidity and financial condition of related small- and medium-sized enterprises, including those to which we have exposure, also resulting in an impairment of their ability to repay loans.
Financial difficulties experienced by small- and medium-sized enterprises as a result of, among other things, adverse economic conditions in Korea and globally, as well as aggressive marketing and intense competition among banks to lend to this segment in recent years, have led to a deterioration in the asset quality of our loans to this segment in the past and such factors may lead to a deterioration of asset quality in the future. Any such
13
Table of Contents
deterioration would result in increased charge-offs and higher provisioning and reduced interest and fee income from this segment, which would have an adverse impact on our financial condition and results of operations.
We have exposure to Korean construction and shipbuilding companies, and financial difficulties of these companies may adversely impact us.
As of December 31, 2011, the total amount of loans provided by us to construction and shipbuilding companies in Korea amounted to (Won)9,734 billion and (Won)1,931 billion, or 4.6% and 0.9% of our total loans, respectively. We also have other exposures to Korean construction and shipbuilding companies, including in the form of guarantees extended for the benefit of such companies and debt and equity securities of such companies held by us. In the case of shipbuilding companies, such exposures include refund guarantees extended by us on behalf of shipbuilding companies to cover their obligation to return a portion of the ship order contract amount to customers in the event of performance delays or defaults under shipbuilding contracts. In the case of construction companies, we also have potential exposures in the form of guarantees provided to us by general contractors with respect to financing extended by us for residential and commercial real estate development projects, as well as commitments to purchase asset-backed securities secured by the assets of companies in the construction industry and other commitments we enter into relating to project financing for such real estate projects which may effectively function as guarantees.
The construction industry in Korea has experienced a downturn in recent years, due to excessive investment in residential property development projects, stagnation of real property prices and reduced demand for residential property, especially in areas outside of Seoul, including as a result of the deterioration of the Korean economy commencing in the second half of 2008. In October 2008, the Korean government implemented a (Won)9 trillion support package for the benefit of the Korean construction industry, including a program to buy unsold housing units and land from construction companies. The shipbuilding industry in Korea has also experienced a severe downturn in recent years due to a significant decrease in ship orders, primarily due to adverse conditions in the global economy and the resulting slowdown in global trade. In response to the deteriorating financial condition and liquidity position of borrowers in the construction and shipbuilding industries, which were disproportionately impacted by adverse economic developments in Korea and globally, the Korean government implemented a program in the first half of 2009 to promote expedited restructuring of such borrowers by their Korean creditor financial institutions, under the supervision of major commercial banks. In accordance with such program, 24 construction companies and five shipbuilding companies became subject to workout in 2009, following review by their creditor financial institutions (including Woori Bank, Kyongnam Bank and Kwangju Bank) and the Korean government. In addition, in June 2010, the Financial Services Commission and the Financial Supervisory Service announced that, following credit risk evaluations conducted by creditor financial institutions (including us) of companies in Korea with outstanding debt of (Won)50 billion or more, 65 companies had been selected by such financial institutions for restructuring in the form of workout, liquidation or court receivership. Of such 65 companies, 16 were construction companies and three were shipbuilding companies. However, there is no assurance that these measures will be successful in stabilizing the Korean construction and shipbuilding industries.
The provisions for credit losses that we have established against our credit exposures to Korean construction and shipbuilding companies may not be sufficient to cover all future losses arising from these and other exposures. If the credit quality of our exposures to Korean construction and shipbuilding companies declines, we may incur substantial additional bad debt expenses, which could adversely impact our results of operations and financial condition. Furthermore, although a portion of our loans to construction and shipbuilding companies are secured by collateral, such collateral may not be sufficient to cover uncollectible amounts in respect of such loans.
We also have construction-related credit exposures under our project financing loans for real estate development projects in Korea. In light of the general deterioration in the asset quality of real estate project financing loans in Korea in recent years, Korean banks, including Woori Bank, Kyongnam Bank and Kwangju Bank, implemented a uniform set of guidelines regarding the evaluation of real estate development projects and asset quality classification of project financing loans for such projects in September 2010. Under these guidelines, which became effective from the third quarter of 2010, Korean banks are generally required to apply
14
Table of Contents
more stringent criteria in evaluating the asset quality of real estate project financing loans. As a result, we may be required to establish additional provisions with respect to our outstanding real estate project financing loans, which could adversely affect our financial condition and results of operations.
We have exposure to the largest Korean commercial conglomerates, known as “chaebols,” and, as a result, financial difficulties of chaebols may have an adverse impact on us.
Of our 20 largest corporate exposures (including loans, debt and equity securities, credit-related commitments and other exposures) as of December 31, 2011, six were to companies that were members of the 30 largest chaebols in Korea. As of that date, the total amount of our exposures to the 30 largest chaebols was (Won)32,734 billion, or 8.6% of our total exposures. If the credit quality of our exposures to chaebols declines, we could incur additional bad debt expenses, which would hurt our results of operations and financial condition. See “Item 4B. Business Overview—Assets and Liabilities—Loan Portfolio—Exposure to Chaebols.”
The provisions we have established against these exposures may not be sufficient to cover all future losses arising from these exposures. In addition, in the case of companies that are in or in the future enter into workout, restructuring, reorganization or liquidation proceedings, our recoveries from those companies may be limited. We may, therefore, experience future losses with respect to these exposures.
A large portion of our exposure is concentrated in a relatively small number of large corporate borrowers, which increases the risk of our corporate credit portfolio.
As of December 31, 2011, our 20 largest exposures to corporate borrowers totaled (Won)45,763 billion, which represented 12.0% of our total exposures. As of that date, our single largest corporate exposure was to the Bank of Korea, to which we had outstanding credits in the form of debt securities of (Won)12,029 billion, representing 3.2% of our total exposures. Aside from exposure to the Korean government and government-related agencies, our next largest exposure was to Samsung Electronics, to which we had outstanding exposure of (Won)1,665 billion representing 0.4% of our total exposures. Any deterioration in the financial condition of our large corporate borrowers may require us to take substantial additional provisions and may have a material adverse impact on our results of operations and financial condition.
We have exposure to companies that are currently or may in the future be put in restructuring, and we may suffer losses as a result of additional bad debt expenses required or the adoption of restructuring plans with which we do not agree.
As of December 31, 2011, our credit exposures to companies that were in workout or corporate restructuring amounted to (Won)3,972 billion or 1.2% of our total credit exposures, of which (Won)2,217 billion or 55.8% was classified as substandard or below and all of which was classified as impaired. As of the same date, our provisions for credit losses on these credit exposures amounted to (Won)1,423 billion, or 35.8% of these exposures. These provisions may not be sufficient to cover all future losses arising from our credit exposure to these companies. Furthermore, we have other exposure to such companies, in the form of debt and equity securities of such companies held by us (including equity securities we acquired as a result of debt-to-equity conversions). Including such securities, our exposures as of December 31, 2011 to companies in workout or restructuring amounted to (Won)4,192 billion, or 1.1% of our total exposures. Our exposures to such companies may also increase in the future, including as a result of adverse conditions in the Korean economy. In addition, in the case of borrowers that are or become subject to workout, we may be forced to restructure our credits pursuant to restructuring plans approved by other creditor financial institutions of the borrower, or to dispose of our credits to other creditors on unfavorable terms, which may adversely affect our results of operations and financial condition.
We have exposure to member companies of the Kumho Asiana Group, and financial difficulties of these companies may adversely impact us.
Several member companies of the Kumho Asiana Group, one of Korea’s largest chaebols, have been experiencing financial difficulties, including as a result of their heavily leveraged acquisition of Daewoo
15
Table of Contents
Engineering & Construction Co., Ltd. in 2006 and the subsequent global financial crisis commencing in the second half of 2008. In January 2010, Kumho Tires Co., Inc. and Kumho Industrial Co., Ltd. agreed with their creditors, including us, to begin an out-of-court debt restructuring program under the Corporate Restructuring Promotion Act. In addition, Kumho Petrochemical Co., Ltd. and Asiana Airlines announced that they would undergo a voluntary restructuring, in return for which their creditors, including us, agreed to a suspension of payments on the two companies’ debt until the end of 2010. These four companies are member companies of the Kumho Asiana Group. As of December 31, 2011, our aggregate credit exposures to Kumho Tires, Kumho Industrial, Kumho Petrochemical and Asiana Airlines, consisting primarily of loans extended to such companies and also including other exposures such as project finance-related exposures, amounted to (Won)1,499 billion, none of which was classified as substandard or below. As of December 31, 2011, our provisions for credit losses with respect to such credit exposures amounted to (Won)94 billion. We also had exposure relating to put options granted to us in connection with our co-investment in Daewoo Engineering & Construction with the Kumho Asiana Group. Moreover, in the first four months of 2012, we extended additional loans to such companies in the aggregate amount of approximately (Won)9 billion. We also converted an aggregate of (Won)115 billion of our loans to such companies into equity interests in such companies in connection with such restructuring programs. Our provisions may not be sufficient to cover all future losses arising from our exposures to these companies. Furthermore, in the event that the financial condition of these companies deteriorates further in the future, we may be required to record bad debt expenses, as well as charge-offs and valuation or impairment losses or losses on disposal, which may have a material adverse effect on our financial condition and results of operations.
Risks relating to our consumer credit portfolio
We may experience increases in delinquencies in our consumer loan and credit card portfolios.
In recent years, consumer debt has increased rapidly in Korea. Our portfolio of consumer loans amounted to (Won)66,758 billion as of December 31, 2010 and (Won)72,914 billion as of December 31, 2011. Our credit card portfolio amounted to (Won)4,357 billion as of December 31, 2010 and (Won)4,592 billion as of December 31, 2011. As of December 31, 2011, our consumer loans and credit card receivables represented 34.3% and 2.2% of our total lending, respectively. See “Item 4B. Business Overview—Consumer Banking—Lending Activities” and “Item 4B. Business Overview—Credit Cards—Products and Services.”
The growth in our consumer loan portfolio in recent years, together with adverse economic conditions in Korea and globally, may lead to increasing delinquencies and a deterioration in asset quality. The amount of our consumer loans classified as substandard or below was (Won)343 billion (or 0.5% of our consumer loan portfolio) as of December 31, 2010 and (Won)396 billion (or 0.5% of our consumer loan portfolio) as of December 31, 2011. We charged off consumer loans amounting to (Won)89 billion in 2011, as compared to (Won)106 billion in 2010, and recorded bad debt expenses in respect of consumer loans of (Won)158 billion in 2011, as compared to (Won)130 billion in 2010. Within our consumer loan portfolio, the outstanding balance of general purpose household loans, which, unlike mortgage or home equity loans, are often unsecured and therefore tend to carry a higher credit risk, amounted to (Won)26,645 billion, or 39.9% of our total outstanding consumer loans, as of December 31, 2010 and (Won)27,940 billion, or 38.3% of our total outstanding consumer loans, as of December 31, 2011.
In our credit card segment, outstanding balances overdue by 30 days or more amounted to (Won)103 billion, or 2.4% of our credit card receivables, as of December 31, 2010 and (Won)92 billion, or 2.0% of our credit card receivables, as of December 31, 2011. In line with industry practice, we have restructured a portion of our delinquent credit card account balances as loans. As of December 31, 2011, these restructured loans amounted to (Won)51 billion, or 1.1% of our credit card balances. Because these restructured loans are not initially recorded as being delinquent, our delinquency ratios do not fully reflect all delinquent amounts relating to our credit card balances. Including all restructured loans, outstanding balances overdue by 30 days or more accounted for 3.1% of our credit card balances as of December 31, 2011. We charged off credit card balances amounting to (Won)142 billion in 2011, as compared to (Won)140 billion in 2010, and recorded bad debt expenses in respect of credit card balances of (Won)115 billion in 2011, as compared to (Won)60 billion in 2010. Delinquencies may increase in the future as a result of, among other things, adverse economic conditions in Korea, difficulties experienced by other credit
16
Table of Contents
card issuers that adversely affect our customers, additional government regulation or the inability of Korean consumers to manage increased household debt.
A deterioration of the asset quality of our consumer loan and credit card portfolios would require us to record increased bad debt expenses and charge-offs and will adversely affect our financial condition and results of operations. In addition, our large exposure to consumer debt means that we are exposed to changes in economic conditions affecting Korean consumers. Accordingly, economic difficulties in Korea that hurt those consumers could result in further deterioration in the credit quality of our consumer loan and credit card portfolios. For example, a rise in unemployment or an increase in interest rates in Korea could adversely affect the ability of consumers to make payments and increase the likelihood of potential defaults.
In light of adverse conditions in the Korean economy affecting consumers, in March 2009, the Financial Services Commission requested Korean banks, including Woori Bank, Kyongnam Bank and Kwangju Bank, to establish a “pre-workout program,” including a credit counseling and recovery service, for retail borrowers with outstanding short-term debt. The pre-workout program has been in operation since April 2009 and, following successive extensions by the Korean government, is expected to continue until April 2013. Under the pre-workout program, maturity extensions and/or interest reductions are provided for retail borrowers with total loans of less than (Won)500 million who are in arrears on their payments for more than 30 days but less than 90 days. The aggregate amount of consumer credit (including credit card receivables) provided by Woori Bank, Kyongnam Bank and Kwangju Bank which became subject to the pre-workout program in 2011 was (Won)29 billion. While we believe that our participation in such pre-workout program has not had a material impact on the overall credit quality of our consumer loan and credit card portfolio or on our results of operations and financial condition to date, our future participation in such government-led initiatives to provide financial support to retail borrowers may lead us to offer credit terms for such borrowers that we would not otherwise offer, in the absence of such initiatives, which may have an adverse effect on our results of operations and financial condition.
A decline in the value of the collateral securing our consumer loans and our inability to realize full collateral value may adversely affect our consumer credit portfolio.
A substantial portion of our consumer loans is secured by real estate, the values of which have fluctuated significantly in recent years. Although it is our general policy to lend up to 60% of the appraised value of collateral (except in areas of high speculation designated by the government where we generally limit our lending to 40% to 60% of the appraised value of collateral) and to periodically re-appraise our collateral, the downturn in the real estate markets in Korea in recent years has resulted in declines in the value of the collateral securing our mortgage and home equity loans. If collateral values decline further in the future, they may not be sufficient to cover uncollectible amounts in respect of our secured loans. Any future declines in the value of the real estate or other collateral securing our consumer loans, or our inability to obtain additional collateral in the event of such declines, could result in a deterioration in our asset quality and may require us to take additional provisions for credit losses.
In Korea, foreclosure on collateral generally requires a written petition to a court. An application, when made, may be subject to delays and administrative requirements that may decrease the value of such collateral. We cannot guarantee that we will be able to realize the full value on our collateral as a result of, among other factors, delays in foreclosure proceedings and defects in the perfection of our security interest in collateral. Our failure to recover the expected value of collateral could expose us to potential losses.
Risks relating to our financial holding company structure and strategy
We may not be successful in taking advantage of our integrated financial holding company structure.
Our success under a financial holding company structure depends on our ability to take advantage of our large existing base of retail and corporate banking customers and to implement a strategy of developing and cross-selling diverse financial products and services to them. As part of this strategy, we continue to standardize and upgrade the risk management operations of our subsidiaries. We are also continuing our efforts to diversify
17
Table of Contents
our product offerings through, among other things, the expansion of our insurance business following the establishment of Woori Aviva Life Insurance in 2008 and increased marketing of insurance products through our bancassurance channels, as well as further expansion of our investment banking and investment trust operations. The implementation of these and other plans that we may pursue to take advantage of our integrated financial holding company structure may require additional investments of capital, infrastructure, human resources and management attention and entails certain risks, including the possibility that:
| • | we may fail to further integrate and upgrade our diverse systems and operations as needed to maximize synergies among our operating subsidiaries; |
| • | we may lack required capital resources; |
| • | we may fail to attract, develop and retain personnel with necessary expertise; |
| • | we may face competition from other financial holding companies and more specialized financial institutions in particular segments; and |
| • | we may fail to leverage our financial holding company structure to continue realizing operational efficiencies and to cross-sell new products and services. |
If we are not successful in implementing our current and future plans, we may incur losses on our investments and our results of operations and financial condition may suffer.
We may fail to realize the anticipated benefits relating to our reorganization and integration plan and any future mergers or acquisitions that we may pursue.
Our success under a financial holding company structure depends on our ability to implement our reorganization and integration plan and to realize the anticipated synergies, growth opportunities and cost savings from coordinating and, in certain cases, combining the businesses of our various subsidiaries. As part of this plan, between December 2001 and February 2002 we merged the commercial banking business of Peace Bank of Korea into Woori Bank, converted Peace Bank of Korea into a credit card subsidiary, Woori Credit Card, and transferred the credit card business of Woori Bank to Woori Credit Card. We also transferred the credit card business of Kwangju Bank to Woori Credit Card in March 2003. In light of the deteriorating business performance of Woori Investment Bank and with the objective of restructuring the group platform, we merged Woori Investment Bank with Woori Bank in August 2003. In March 2004, in response to the liquidity problems of Woori Credit Card stemming from the deteriorating asset quality of its credit card portfolio, we merged Woori Credit Card with Woori Bank. Although we currently intend for our commercial banking subsidiaries to continue to operate as separate legal entities within our financial holding company structure and to maintain separate loan origination and other functions, we have standardized our subsidiaries’ risk management operations (except with respect to operational risk), including with respect to credit risk management following systems upgrades completed in 2007. In October and December 2004, we also acquired a 27.3% voting interest in LGIS, a leading domestic securities firm. In March 2005, we merged Woori Securities into LGIS and renamed the surviving entity Woori Investment & Securities. See “Item 4B. Business Overview—Business—Capital Markets Activities—Securities Brokerage.” In May 2005, we purchased a 90.0% direct ownership interest in LG Investment Trust Management, or LGITM, from LGIS. We subsequently merged Woori Investment Trust Management, our wholly-owned asset management subsidiary, into LGITM and renamed the surviving entity Woori Asset Management, which remains a consolidated subsidiary. In July and September 2005, Woori Asset Management reacquired the remaining 10.0% interest from its minority shareholders. In May 2006, we transferred 30.0% of our interest in Woori Asset Management to Credit Suisse. Following this transfer, we renamed the entity Woori Credit Suisse Asset Management. In October 2009, we reacquired Credit Suisse’s 30.0% interest in Woori Credit Suisse Asset Management and renamed the entity Woori Asset Management. Furthermore, we acquired a 51.4% interest in Hanmi Capital in September 2007, which was subsequently renamed Woori Financial, and acquired a 51.0% interest in LIG Life Insurance in April 2008, which was subsequently renamed Woori Aviva Life Insurance. Woori Financial became a consolidated subsidiary, while we account for Woori Aviva Life Insurance as part of our investments in jointly controlled entities and associates
18
Table of Contents
under IFRS. As part of our business plan, we, through Woori Bank, Kyongnam Bank and Kwangju Bank, have also entered into bancassurance marketing arrangements with third party insurance companies. See “Item 4B. Business Overview—Business—Other Businesses—Bancassurance.”
Separately, in May 2011, the Korean government, through the Public Funds Oversight Committee of the Financial Services Commission, announced its plans to privatize us through a sale of up to the entire 56.97% equity stake (and a minimum of a 30% equity stake) held by the Korean government through the KDIC through a competitive bidding process from May to June 2011, during which period only one bid was submitted by a consortium led by a Korean private equity fund. As a result, the Public Funds Oversight Committee announced the suspension of the sale process in August 2011. On April 30, 2012, the Public Funds Oversight Committee announced a new privatization plan, pursuant to which a preliminary bidding process began on April 30, 2012 and will remain open until July 27, 2012. The latest privatization plan contemplates a sale of up to the entire 56.97% equity stake (and a minimum of a 30% equity stake), similar to the May 2011 plan, but also allows bids that seek to privatize us through a merger with or integration into another financial institution in return for stock and/or cash consideration.
In addition, we purchased certain assets and assumed certain liabilities of Samhwa Mutual Savings Bank through our wholly-owned subsidiary, Woori FG Savings Bank Co., Ltd., which began operating in March 2011. As part of our strategy, we also intend to continue to seek opportunities to expand our overseas operations, including potentially through acquisitions and investments in the U.S., Europe and Asia. The integration of our subsidiaries’ separate businesses and operations, as well as those of any companies we may merge with or acquire in the future, could require a significant amount of time, financial resources and management attention, and may result in increased capital requirements and greater credit and other exposures. Moreover, the integration process could disrupt our operations (including our risk management operations) or information technology systems, reduce employee morale, produce unintended inconsistencies in our standards, controls, procedures or policies, and affect our relationships with customers and our ability to retain key personnel.
The continued implementation of our reorganization and integration plan, as well as any future additional integration plans that we may adopt in connection with our mergers or acquisitions or otherwise, and the realization of the anticipated benefits of our financial holding company structure and any mergers or acquisitions we decide to pursue may be blocked, delayed or reduced as a result of many factors, some of which may be outside our control. These factors include:
| • | difficulties in integrating the diverse activities and operations of our subsidiaries or any companies we may merge with or acquire, including risk management operations and information technology systems, personnel, policies and procedures; |
| • | difficulties in reorganizing or reducing overlapping personnel, branches, networks and administrative functions; |
| • | restrictions under the Financial Holding Company Act, the Financial Investment Services and Capital Markets Act and other regulations on transactions between our company and, or among, our subsidiaries; |
| • | unexpected business disruptions; |
| • | loss of customers; and |
| • | labor unrest. |
Accordingly, we may not be able to realize the anticipated benefits of our current or any future reorganization and integration plan and any future mergers or acquisitions that we pursue or undergo, and our business, results of operations and financial condition may suffer as a result.
We may not generate sufficient additional fees to achieve our revenue diversification strategy.
An important element of our overall strategy is increasing our fee income in order to diversify our revenue base, in anticipation of greater competition and declining lending margins. Historically, our primary source of
19
Table of Contents
revenues has been net interest income from our banking operations. To date, except for credit card, trust management, bancassurance, brokerage and currency transfer fees (including foreign exchange-related commissions) and fees collected in connection with the operation of our investment funds, we have not generated substantial fee income. We intend to develop new sources of fee income as part of our business strategy, including through our investment banking and asset management businesses. Although we, like many other Korean financial institutions, have begun to charge fees to our customers more regularly, customers may prove unwilling to pay additional fees, even in exchange for more attractive value-added services, and their reluctance to do so would adversely affect the implementation of our strategy to increase our fee income. Furthermore, the fees that we charge to customers are subject to regulation by Korean financial regulatory authorities, which may seek to implement regulations or measures that may have an adverse impact on our ability to achieve this aspect of our strategy.
We depend on limited forms of funding to fund our operations at the holding company level.
We are a financial holding company with no significant assets other than the shares of our subsidiaries. Our primary sources of funding and liquidity are dividends from our subsidiaries, direct borrowings and issuances of equity or debt securities at the holding company level. In addition, as a financial holding company, we are required to meet certain minimum financial ratios under Korean law, including with respect to liquidity, leverage and capital adequacy. Our ability to meet our obligations to our direct creditors and employees and our other liquidity needs and regulatory requirements at the holding company level depends on timely and adequate distributions from our subsidiaries and our ability to sell our securities or obtain credit from our lenders.
In the case of dividend distributions, this depends on the financial condition and operating results of our subsidiaries. In the future, our subsidiaries may enter into agreements, such as credit agreements with lenders or indentures relating to high-yield or subordinated debt instruments, that impose restrictions on their ability to make distributions to us, and the terms of future obligations and the operation of Korean law could prevent our subsidiaries from making sufficient distributions to us to allow us to make payments on our outstanding obligations. See “—As a holding company, we depend on receiving dividends from our subsidiaries to pay dividends on our common stock.” Any delay in receipt of or shortfall in payments to us from our subsidiaries could result in our inability to meet our liquidity needs and regulatory requirements, including minimum liquidity and capital adequacy ratios, and may disrupt our operations at the holding company level.
In addition, creditors of our subsidiaries will generally have claims that are prior to any claims of our creditors with respect to their assets. Furthermore, our inability to sell our securities or obtain funds from our lenders on favorable terms, or at all, could also result in our inability to meet our liquidity needs and regulatory requirements and may disrupt our operations at the holding company level.
As a holding company, we depend on receiving dividends from our subsidiaries to pay dividends on our common stock.
Since our principal assets at the holding company level are the shares of our subsidiaries, our ability to pay dividends on our common stock largely depends on dividend payments from those subsidiaries. Those dividend payments are subject to the Korean Commercial Code, the Bank Act and regulatory limitations, generally based on capital levels and retained earnings, imposed by the various regulatory agencies with authority over those entities. The ability of our banking subsidiaries to pay dividends is subject to regulatory restrictions to the extent that paying dividends would impair each of their nonconsolidated profitability, financial condition or other cash flow needs. For example:
| • | under the Korean Commercial Code, dividends may only be paid out of distributable income, an amount which is calculated by subtracting the aggregate amount of a company’s paid-in capital and certain mandatory legal reserves from its net assets, in each case as of the end of the prior fiscal period; |
| • | under the Bank Act, a bank also must credit at least 10% of its net profit to a legal reserve each time it pays dividends on distributable income until that reserve equals the amount of its total paid-in capital; and |
20
Table of Contents
| • | under the Bank Act and the requirements of the Financial Services Commission, if a bank fails to meet its required capital adequacy ratio or otherwise subject to the management improvement measures imposed by the Financial Services Commission, then the Financial Services Commission may restrict the declaration and payment of dividends by that bank. |
Our subsidiaries may not continue to meet the applicable legal and regulatory requirements for the payment of dividends in the future. If they fail to do so, they may stop paying or reduce the amount of the dividends they pay to us, which would have an adverse effect on our ability to pay dividends on our common stock.
In addition, we and our subsidiaries may not be able to pay dividends to the extent that such payments would result in a failure to meet any of the applicable financial targets under our respective memoranda of understanding with the Korea Deposit Insurance Corporation, or the KDIC. See “—Other risks relating to our business—Our failure to meet the financial and other business targets set forth in current terms of the memoranda of understanding among us, our subsidiaries and the KDIC may result in substantial harm to us or our subsidiaries.”
Risks relating to competition
Competition in the Korean financial industry is intense, and we may lose market share and experience declining margins as a result.
Competition in the Korean financial market has been and is likely to remain intense. Some of the financial institutions that we compete with are larger in terms of asset size and customer base and have greater financial resources or more specialized capabilities than our subsidiaries. In addition, in the area of our core banking operations, most Korean banks have been focusing on retail customers and small- and medium-sized enterprises in recent years, although they have begun to generally increase their exposure to large corporate borrowers, and have been focusing on developing fee income businesses, including bancassurance and investment products, as increasingly important sources of revenue. In the area of credit cards, Korean banks and credit card companies have in the past engaged in aggressive marketing activities and made significant investments, contributing to some extent to lower profitability and asset quality problems previously experienced with respect to credit card receivables. The competition and market saturation resulting from this common focus may make it more difficult for us to secure retail and small- and medium-sized customers with the credit quality and on credit terms necessary to maintain or increase our income and profitability.
In addition, we believe that regulatory reforms and the general modernization of business practices in Korea will lead to increased competition among financial institutions in Korea. We also believe that foreign financial institutions, many of which have greater experience and resources than we do, will seek to compete with us in providing financial products and services either by themselves or in partnership with existing Korean financial institutions. Furthermore, a number of significant mergers and acquisitions in the industry have taken place in Korea over the past decade, including the acquisition of Koram Bank by an affiliate of Citibank in 2004, the acquisition of Korea First Bank by Standard Chartered Bank in April 2005, Chohung Bank’s merger with Shinhan Bank in April 2006 and Hana Financial Group’s acquisition of a controlling interest in Korea Exchange Bank in February 2012. We expect that consolidation in the financial industry will continue. In particular, the Korean government has announced that it plans to privatize the Korea Development Bank. Other financial institutions may seek to acquire or merge with such or other entities, and the financial institutions resulting from this consolidation may, by virtue of their increased size and business scope, provide significantly greater competition for us. Increased competition and continuing consolidation may lead to decreased margins, resulting in a material adverse impact on our future profitability. Accordingly, our results of operations and financial condition may suffer as a result of increasing competition in the Korean financial industry.
Competition for customer deposits may increase, resulting in a loss of our deposit customers or an increase in our funding costs.
In recent years, we have faced increasing pricing pressure on deposit products from our competitors. If we do not continue to offer competitive interest rates to our deposit customers, we may lose their business. In
21
Table of Contents
addition, even if we are able to match our competitors’ pricing, doing so may result in an increase in our funding costs, which may have an adverse impact on our results of operations.
Other risks relating to our business
Difficult conditions in the global financial markets could adversely affect our results of operations and financial condition.
During the second and third quarter of 2007, credit markets in the United States started to experience difficult conditions and volatility that in turn affected worldwide financial markets. In particular, in late July and early August 2007, market uncertainty in the U.S. sub-prime mortgage sector increased dramatically and further expanded to other markets such as those for leveraged finance, collateralized debt obligations and other structured products. In September and October 2008, liquidity and credit concerns and volatility in the global financial markets increased significantly with the bankruptcy or acquisition of, and government assistance to, several major U.S. and European financial institutions. These developments resulted in reduced liquidity, greater volatility, widening of credit spreads and a lack of price transparency in the United States and global financial markets. In response to such developments, legislators and financial regulators in the United States and other jurisdictions, including Korea, implemented a number of policy measures designed to add stability to the financial markets, including the provision of direct and indirect assistance to distressed financial institutions. In addition, in line with similar actions taken by monetary authorities in other countries, from the third quarter of 2008 to the first quarter of 2009, the Bank of Korea decreased its policy rate by a total of 325 basis points in order to address financial market instability and to help combat the slowdown of the domestic economy. However, while the rate of deterioration of the global economy has slowed since the second half of 2009, with some signs of stabilization and improvement, the overall prospects for the Korean and global economy in 2012 and beyond remain uncertain. For example, commencing in the second half of 2011, the global financial markets have experienced significant volatility as a result of, among other things, the downgrading by Standard & Poor’s Rating Services of the long-term sovereign credit rating of the United States to “AA+” from “AAA” in August 2011 and the financial difficulties affecting many other governments worldwide, in particular in Greece, Spain, Italy and other countries in Europe. In addition, measures adopted by the international community to sanction Iran for its nuclear weapons program, as well as political instability in various countries in the Middle East and Northern Africa, including in Egypt, Tunisia, Libya, Syria and Yemen, have resulted in volatility and uncertainty in the global energy markets. These or other developments could potentially trigger another financial and economic crisis. Furthermore, while many governments worldwide are implementing “exit strategies,” in the form of reduced government spending or otherwise, with respect to the economic stimulus measures adopted in response to the global financial crisis, such strategies may, for reasons related to timing, magnitude or other factors, have the unintended consequence of prolonging or worsening global economic and financial difficulties. In light of the high level of interdependence of the global economy, any of the foregoing developments could have a material adverse effect on the Korean economy and financial markets, and in turn on our business, financial condition and results of operations.
We are also exposed to adverse changes and volatility in global and Korean financial markets as a result of our liabilities and assets denominated in foreign currencies and our holdings of trading and investment securities, including structured products (although we do not currently have material exposures to Greece, Spain, Italy and other countries in Europe which are facing financial difficulties, in the form of sovereign debt or otherwise). Since the second half of 2008, the value of the Won relative to major foreign currencies in general and the U.S. dollar in particular has fluctuated widely. See “Item 3A. Selected Financial Data—Exchange Rates.” A depreciation of the Won will increase our cost in Won of servicing our foreign currency-denominated debt, while continued exchange rate volatility may also result in foreign exchange losses for us. Furthermore, as a result of adverse global and Korean economic conditions, there has been significant volatility in securities prices, including the stock prices of Korean and foreign companies in which we hold an interest. Such volatility has resulted in and may lead to further trading and valuation losses on our trading and investment securities portfolio as well as impairment losses on our investments in jointly controlled entities and associates.
22
Table of Contents
Our risk management system may not be effective in mitigating risk and loss.
We seek to monitor and manage our risk exposure through a group-wide, standardized risk management system, encompassing a multi-tiered risk management governance structure under our Group Risk Management Committee, standardized credit risk management systems for our banking subsidiaries based on Woori Bank’s centralized credit risk management system called the CREPIA system, reporting and monitoring systems, early warning systems and other risk management infrastructure, using a variety of risk management strategies and techniques. See “Item 11. Quantitative and Qualitative Disclosures About Market Risk.” However, such risk management strategies and techniques employed by us and the judgments that accompany their application cannot anticipate the economic and financial outcome in all market environments, and many of the our risk management strategies and techniques have a basis in historic market behavior that may limit the effectiveness of such strategies and techniques in times of significant market stress or other unforeseen circumstances. Furthermore, our risk management strategies may not be effective in a difficult or less liquid market environment, as other market participants may be attempting to use the same or similar strategies as us to deal with such market conditions. In such circumstances, it may be difficult for us to reduce our risk positions due to the activity of such other market participants.
Our failure to meet the financial and other business targets set forth in current terms of the memoranda of understanding among us, our subsidiaries and the KDIC may result in substantial harm to us or our subsidiaries.
Under the current terms of the memoranda of understanding entered into among us, Woori Bank, Kyongnam Bank, Kwangju Bank and the KDIC, we and our subsidiaries are required to meet certain financial and business targets on a semi-annual and/or quarterly basis until the end of 2012. See “Item 4A. History and Development of the Company—History—Relationship with the Korean Government.” As a result of deteriorating economic and financial market conditions in Korea and globally, both we and Woori Bank failed to meet our respective return on assets targets, expense-to-revenue ratio targets and operating income per employee targets as of December 31, 2008. In September 2009, the KDIC imposed an institutional warning on us and Woori Bank, as well as reprimands and warnings on 11 current and former executive officers of Woori Bank, in connection with our and Woori Bank’s failures to meet such financial targets, including as a result of losses incurred on collateralized debt obligations and other credit derivatives. In February and October 2010 and February 2011, the KDIC imposed institutional warnings on Woori Bank in connection with its failure to meet its financial targets with respect to operating income per employee as of September 30, 2009 and return on assets and non-performing loan ratio as of June 30 and September 30, 2010, respectively. In October 2010, the KDIC imposed an institutional warning on Kyongnam Bank, as well as reprimands and warnings on 10 current and former executive officers of Kyongnam Bank, in connection with certain fraudulent transactions undertaken on behalf of Kyongnam Bank by certain employees and their potential impact on Kyongnam Bank. See “Item 8A. Consolidated Statements and Other Financial Information—Legal Proceedings—Kyongnam Bank.” In April 2011, the KDIC imposed another institutional warning on us and Woori Bank, as well as a warning on the former chief executive officer of Woori Bank, in connection with our and Woori Bank’s failure to meet our financial targets with respect to our non-performing loan ratio and Woori Bank’s return on assets as of December 31, 2010. We, Woori Bank, Kyongnam Bank and Kwangju Bank entered into a new business normalization plan with new restructuring measures and financial targets with the KDIC in March 2012.
If we or our subsidiaries fail to satisfy our obligations under the current or any new memoranda of understanding in the future, the Korean government, through the KDIC, may impose penalties on us or our subsidiaries. These penalties could include the replacement of our senior management, sale of our assets, restructuring of our organization, restrictions on our business, including a suspension or transfer of our business, and elimination or reduction of existing equity. Accordingly, our failure to meet the obligations in the memoranda of understanding may result in harm to our business, financial condition and results of operations.
23
Table of Contents
We have provided certain assets as collateral in connection with our secured borrowings and could be required to make payments and realize losses in the future relating to those assets.
We have provided certain assets as collateral for our secured borrowings in recent years. These secured borrowings often take the form of asset securitization transactions, where we nominally sell our assets to a securitization vehicle that issues securities backed by those assets, although the assets remain on our statements of financial position. These secured borrowings are intended to be fully repaid through recoveries on collateral. Some of these nominal asset sales were with recourse, which means that if delinquencies arise with respect to such assets, we will be required to either repay a proportionate amount of the related secured borrowing (by reversing the nominal sale and repurchasing such assets) or compensate the securitization vehicle for any net shortfalls in its recoveries on such assets. As of December 31, 2011, the aggregate amount of assets we had provided as collateral for our secured borrowings was (Won)11,611 billion. As of that date, we had established provisions of (Won)156 billion in respect of possible losses on those assets. If we are required to make payments on such assets, or to repay our secured borrowings on those assets and are unable to make sufficient recoveries on them, we may realize further losses on these assets to the extent those payments or recovery shortfalls exceed our provisions.
An increase in interest rates would decrease the value of our debt securities portfolio and raise our funding costs while reducing loan demand and the repayment ability of our borrowers, which could adversely affect us.
Interest rates in Korea have been subject to significant fluctuations in recent years. In late 2008 and early 2009, the Bank of Korea reduced its policy rate by a total of 325 basis points to support Korea’s economy amid the global financial crisis, and left the key interest rate unchanged at 2.00% throughout 2009. In an effort to stem inflation amid improved growth prospects, the Bank of Korea increased its policy rate to 2.25% in July 2010, 2.50% in November 2010, 2.75% in January 2011, 3.00% in March 2011 and 3.25% in June 2011. All else being equal, an increase in interest rates leads to a decline in the value of our portfolio of debt securities, which generally pay interest based on a fixed rate. A sustained increase in interest rates will also raise our funding costs, while reducing loan demand, especially among consumers. Rising interest rates may therefore require us to re-balance our asset portfolio and our liabilities in order to minimize the risk of potential mismatches and maintain our profitability. See “Item 11. Quantitative and Qualitative Disclosures About Market Risk.” In addition, rising interest rate levels may adversely affect the Korean economy and the financial condition of our corporate and consumer borrowers, including holders of our credit cards, which in turn may lead to a deterioration in our credit portfolio. In particular, since most of our consumer and corporate loans bear interest at rates that adjust periodically based on prevailing market rates, a sustained increase in interest rate levels will increase the interest costs of our consumer and corporate borrowers and will adversely affect their ability to make payments on their outstanding loans.
Our funding is highly dependent on short-term deposits, which dependence may adversely affect our operations.
Our banking subsidiaries meet a significant amount of their funding requirements through short-term funding sources, which consist primarily of customer deposits. As of December 31, 2011, approximately 98.8% of these deposits had maturities of one year or less or were payable on demand. In the past, a substantial proportion of these customer deposits have been rolled over upon maturity. We cannot guarantee, however, that depositors will continue to roll over their deposits in the future. In the event that a substantial number of these short-term deposit customers withdraw their funds or fail to roll over their deposits as higher-yielding investment opportunities emerge, our liquidity position could be adversely affected. Our banking subsidiaries may also be required to seek more expensive sources of short-term and long-term funding to finance their operations. See “Item 5B. Liquidity and Capital Resources—Financial Condition—Liquidity.”
24
Table of Contents
Labor union unrest may disrupt our operations and hinder our ability to continue to reorganize and integrate our operations.
Most financial institutions in Korea, including our subsidiaries, have experienced periods of labor unrest. As part of our reorganization and integration plan, we have transferred or merged some of the businesses operations of our subsidiaries into one or more entities and implemented other forms of corporate and operational restructuring. We may decide to implement other organizational or operational changes, as well as acquisitions or dispositions, in the future. Such efforts have in the past been met with significant opposition from labor unions in Korea. For example, although we did not experience any major labor disputes in connection with the merger of Woori Credit Card with Woori Bank, our employees at Woori Securities staged a one-month strike to protest the merger of Woori Securities into LGIS in March 2005. Actual or threatened labor disputes may in the future disrupt the reorganization and integration process and our business operations, which in turn may hurt our financial condition and results of operations.
The secondary market for corporate bonds in Korea is not fully developed, and, as a result, we may not be able to realize the full “marked-to-market” value of debt securities we hold when we sell any of those securities.
As of December 31, 2011, our banking subsidiaries held debt securities issued by Korean companies and financial institutions (other than those issued by government-owned or -controlled enterprises or financial institutions, which include the KDIC, the Korea Electric Power Corporation, the Bank of Korea, the Korea Development Bank and the Industrial Bank of Korea, among others) with a total book value of (Won)7,524 billion in our trading and investment securities portfolio. The market value of these securities could decline significantly due to various factors, including future increases in interest rates or a deterioration in the financial and economic condition of any particular issuer or of Korea in general. Any of these factors individually or a combination of these factors would require us to write down the fair value of these debt securities, resulting in impairment losses. Because the secondary market for corporate bonds in Korea is not fully developed, the market value of many of these securities as reflected on our consolidated statements of financial position is determined by references to suggested prices posted by Korean rating agencies, which measure prices based on observable market data. These valuations, however, may differ significantly from the actual value that we could realize in the event we elect to sell these securities. As a result, we may not be able to realize the full “marked-to-market” value at the time of any such sale of these securities and thus may incur additional losses.
We and our commercial banking subsidiaries may be required to raise additional capital to maintain our capital adequacy ratio or for other reasons, which we or they may not be able to do on favorable terms or at all.
Under the capital adequacy requirements of the Financial Services Commission, we, as a bank holding company, are required to maintain a minimum consolidated capital adequacy ratio, which is the ratio of equity capital as a percentage of risk-weighted assets on a consolidated basis, of 8.0%. See “Item 4B. Business Overview—Supervision and Regulation—Principal Regulations Applicable to Financial Holding Companies—Capital Adequacy” and “Item 5B. Liquidity and Capital Resources—Financial Condition—Capital Adequacy.” In addition, each of our commercial banking subsidiaries is required to maintain a minimum combined Tier I and Tier II capital adequacy ratio of 8.0%, on a consolidated basis. In both cases, Tier II capital is included in calculating the combined Tier I and Tier II capital adequacy ratio up to 100% of Tier I capital. In addition, the current terms of the memoranda of understanding among us, our subsidiaries and the KDIC require us and our subsidiaries to meet specified capital adequacy ratio requirements. See “Item 4A. History and Development of the Company—History—Relationship with the Korean Government.” As of December 31, 2011, our capital ratio and the capital adequacy ratios of our subsidiaries exceeded the minimum levels required by both the Financial Services Commission and these memoranda. However, our capital base and capital adequacy ratio or those of our subsidiaries may deteriorate in the future if our or their results of operations or financial condition deteriorates for any reason, or if we or they are not able to deploy their funding into suitably low-risk assets. To the extent that our subsidiaries fail to maintain their capital adequacy ratios in the future, Korean regulatory authorities may impose penalties on them ranging from a warning to suspension or revocation of their licenses.
25
Table of Contents
If our capital adequacy ratio or those of our subsidiaries deteriorate, we or they may be required to obtain additional Tier I or Tier II capital in order to remain in compliance with the applicable capital adequacy requirements. As the financial holding company for our subsidiaries, we may be required to raise additional capital to contribute to our subsidiaries. We or our subsidiaries may not be able to obtain additional capital on favorable terms, or at all. The ability of our company and our subsidiaries to obtain additional capital at any time may be constrained to the extent that banks or other financial institutions in Korea or from other countries are seeking to raise capital at the same time. Depending on whether we or our subsidiaries are obtaining any necessary additional capital, and the terms and amount of any additional capital obtained, holders of our common stock or American depositary shares, or ADSs, may experience a dilution of their interest, or we may experience a dilution of our interest in our subsidiaries.
We may face increased capital requirements under the new Basel Capital Accord.
Beginning in 2008, the Financial Supervisory Service implemented the new Basel Capital Accord, referred to as Basel II, in Korea, which has affected the way risk is measured among Korean financial institutions, including our commercial banking subsidiaries. Building upon the initial Basel Capital Accord of 1988, which focused primarily on capital adequacy and asset soundness as a measure of risk, Basel II expanded this approach to contemplate additional areas of risk such as operational risk. Basel II also instituted new measures that require our commercial banking subsidiaries to take into account individual borrower credit risk and operational risk when calculating risk-weighted assets.
In addition, under Basel II, banks are permitted to follow either a standardized approach or an internal ratings-based approach with respect to calculating capital requirements. Woori Bank has voluntarily chosen to establish and follow an internal ratings-based approach, which is more stringent in terms of calculating risk sensitivity with respect to its capital requirements, and Kyongnam Bank has begun following an internal ratings-based approach from September 2011. Kwangju Bank, which is in the process of establishing an internal ratings-based approach, currently uses a standardized approach. For regulatory reporting purposes, from September 30, 2008, Woori Bank implemented its internal ratings-based approach for credit risk, beginning with its credit risk with respect to retail, small- and medium-size enterprises and large corporate loans and asset-backed securities portfolios, and plans to further implement its internal ratings-based approach to its specialized lending portfolio upon approval by the Financial Supervisory Service. A standardized approach will be used in measuring credit risk for those classes of exposure for which Woori Bank’s internal ratings-based approach has not yet been implemented, as well as for certain classes of exposure (including those to the Korean government, public institutions and other banks) for which the internal ratings-based approach will not be applied. Woori Bank plans to implement an “advanced internal ratings-based approach” for credit risk in the near future. Woori Bank also implemented a standardized approach for operational risk beginning on January 1, 2008, and implemented an “advanced measurement approach” for operational risk in June 2009.
While we believe that Woori Bank’s implementation of an internal ratings-based approach in 2008 increased its capital adequacy ratio and led to a decrease in its credit risk-related capital requirements as compared to those under its previous approach under the initial Basel Capital Accord of 1988, there can be no assurance that such internal ratings-based approach under Basel II will not require an increase in Woori Bank’s credit risk capital requirements in the future, which may require it to either improve its asset quality or raise additional capital.
In December 2009, the Basel Committee on Banking Supervision introduced a new set of measures to supplement Basel II which include, among others, a requirement for higher minimum capital, introduction of a leverage ratio as a supplementary measure to the capital adequacy ratio and flexible capital requirements for different phases of the economic cycle. Additional details regarding such new measures, including an additional capital conservation buffer and countercyclical capital buffer, liquidity coverage ratio and other supplemental measures, were announced by the Group of Governors and Heads of Supervision of the Basel Committee on Banking Supervision in September 2010. After further impact assessment and observation periods, the Basel Committee on Banking Supervision is expected to begin implementing the new set of measures, referred to as Basel III, from 2013. In Korea, Basel III is expected to be implemented in stages from 2013 to 2019. The
26
Table of Contents
implementation of Basel III in Korea may have a significant effect on the capital requirements of Korean financial institutions, including our commercial banking subsidiaries.
See “Item 5B. Liquidity and Capital Resources—Financial Condition—Capital Adequacy.”
We engage in limited activities relating to Iran and may become subject to sanctions under relevant laws and regulations of the United States and other jurisdictions as a result of such activities, which may adversely affect our business and reputation.
The U.S. Department of the Treasury’s Office of Foreign Assets Control, or OFAC, enforces certain laws and regulations that impose restrictions upon U.S. persons with respect to activities or transactions with certain countries, governments, entities and individuals that are the subject of such OFAC sanctions, including Iran. Even though non-U.S. persons are not directly bound by such OFAC sanctions, in recent years OFAC has asserted that such non-U.S. persons can be held liable if they “cause” violations by U.S. persons. The European Union, or E.U., also enforces certain laws and regulations that impose restrictions upon nationals and entities of, and business conducted in, E.U. member states with respect to activities or transactions with certain countries, governments, entities and individuals that are the subject of such E.U. sanctions, including Iran. The United Nations Security Council and other governmental entities also impose similar sanctions.
In addition to the OFAC sanctions described above, the United States maintains programs under the Iran Sanctions Act, the Comprehensive Iran Sanctions, Accountability, and Divestment Act of 2010, or CISADA, Executive Order 13590 and the National Defense Authorization Act for Fiscal Year 2012, or the NDAA, that provide authority for the imposition of U.S. sanctions on foreign parties that conduct certain activities with respect to Iran’s oil and gas industry and Iran’s financial sector. Such programs provide for the possible imposition of sanctions on any person engaged in transactions above a specified dollar threshold in connection with the development or maintenance of the Iranian oil and gas production, refining, or petrochemical industries, the export of refined petroleum products to Iran above a specified threshold or Iran’s acquisition of weapons of mass destruction or advanced conventional weapons. A range of sanctions may be imposed on companies that engage in sanctionable activities, including among other things the blocking of any property subject to U.S. jurisdiction in which the sanctioned company has an interest, which could include a prohibition on transactions or dealings involving securities of the sanctioned company.
Sanctions under the above-described programs also target foreign financial institutions that facilitate significant transactions with designated Iranian financial institutions or knowingly facilitate transactions connected to Iranian weapons of mass destruction or terror activities or for designated parties linked to the Iranian Revolutionary Guard Corps or subject to United Nations sanctions against Iran. Financial institutions engaging in targeted activity could be sanctioned by termination of their ability to maintain correspondent accounts in the United States. These programs were recently extended under the NDAA to cover transactions with the Bank Markazi Jomhouri Islami Iran, also referred to as the Central Bank of Iran or CBI. Foreign financial institutions owned or controlled by a foreign government could lose access to U.S. correspondent accounts if they facilitate transactions for the sale or purchase of petroleum or petroleum products involving the CBI. The imposition of sanctions against foreign entities pursuant to such programs is not automatic (requiring further action by the U.S. administration) and, with respect to the new provisions targeting CBI, is subject to several important potential exceptions, including discretionary determinations by the U.S. government that the price and supply of non-Iranian petroleum products are not sufficient to permit those purchasing Iranian petroleum products to significantly reduce the volume of purchases, that the country with primary jurisdiction over a foreign financial institution has significantly reduced its purchases of Iranian crude oil, or that the “national security interest of the United States” requires a waiver of sanctions. It is our understanding that the Korean government has been and continues to be in discussions with the U.S. government regarding the application of the sanctions and exceptions to Korean companies, and it is unclear how or whether any of the potential sanctions or exceptions would be applied. Iran has also been designated as a “jurisdiction of primary money laundering concern” under Section 311 of the USA PATRIOT Act, potentially subjecting banks dealing with Iranian financial institutions to increased regulatory scrutiny.
27
Table of Contents
Korea has also adopted a sanctions program targeting Iran in accordance with the series of relevant resolutions adopted by the United Nations Security Council. In particular, in September 2010, the Korean government announced broad sanctions implementation guidelines covering financial, trade, transportation and energy-related activities with Iran, which also included a proposal to facilitate legitimate trade between Korea and Iran through Won-denominated settlement accounts to be opened by CBI at certain Korean banks for such purpose. In December 2011, the Korean government announced expanded sanctions against Iran, including the addition of 99 entities and six individuals that are related to Iran’s nuclear program to the Korean government’s sanctioned party list with respect to Iran.
Woori Bank, which we believe would be considered as a foreign financial institution owned or controlled by a foreign government under the NDAA, operates certain accounts for CBI, which were opened pursuant to a service agreement entered into by Woori Bank and CBI in September 2010 to facilitate trade between Korea and Iran. The accounts opened by CBI consist of Won-denominated accounts which are used for the settlement of exports of goods to Iran by Korean exporters and Won, U.S. dollar, euro and Japanese Yen-denominated accounts which are used for the settlement of imports of oil and gas from Iran by Korean importers. By the terms of the service agreement between Woori Bank and CBI, settlement of export and import transaction payments through such accounts opened by CBI are effected by crediting or debiting the relevant amount to or from the applicable accounts while a corresponding payment of funds is made to or from an Iranian bank by CBI, and generally does not involve any actual transfer of the relevant funds from such accounts at Woori Bank to CBI’s accounts in Iran or elsewhere for such settlement. Additionally, by the terms of an amendment to such service agreement between Woori Bank and CBI, CBI may not transfer any funds from its U.S. dollar-denominated account at Woori Bank to bank accounts held by CBI outside of Korea. Our commercial banking subsidiaries, including Woori Bank, also provide limited export-import financing services to Korean exporters and importers in connection with their trade transactions with Iran that are permitted under the relevant Korean sanctions, primarily by discounting, advising on or issuing letters of credit, which are settled through the accounts opened by CBI at Woori Bank. Furthermore, our commercial banking subsidiaries occasionally act as recipient bank on behalf of Korean exporters for international money transfers from Iranian importers and maintain a limited number of deposit accounts in Korea for Iranian financial institutions. In addition, Woori Bank may in the future be requested by the Korean government to participate in the settlement, through the accounts opened by CBI at Woori Bank, of certain past trade transactions involving Iran which were frozen prior to the implementation of Iran-related economic sanctions and export controls by the Korean government in 2010.
The applicable laws and regulations and banking guidelines of Korea require that trade transactions between Korean and Iranian parties be subject to prior certification and clearance by relevant Korean governmental authorities (or organizations designated thereby) to ensure compliance with Korean economic sanctions and export controls against Iran, and the settlement of payments through the accounts opened by CBI at Woori Bank are not permitted without such prior certification and clearance.
There is no guarantee that our activities relating to Iran will not be found to constitute sanctionable activities or that we will not be subjected to liability as a result of such activities. Our business and reputation could be adversely affected if the U.S. government or other governments were to determine that our Iran-related activities (including the operation of the accounts opened by CBI at Woori Bank) involve sanctionable activity under any of the relevant sanctions. Our investors may also be adversely affected if we are found to violate any of the relevant sanctions, or if any sanctions with which the investors are required to comply results in their investment in us being restricted. If we are sanctioned under the Iran Sanctions Act as amended by CISADA, such sanctions could include the blocking of any property in which we have an interest, which would effectively prohibit all U.S. persons from receiving any payments from us or our commercial banking subsidiaries, or otherwise acquiring, holding, withholding, using, transferring, withdrawing, transporting, importing, or exporting any property in which we have any interest. Furthermore, any prohibition or conditions placed on our use of U.S. correspondent accounts could effectively eliminate our access to the U.S. financial system, including U.S. dollar clearing transactions, which would adversely affect our business. If the U.S. government were to challenge the compatibility of the accounts opened by CBI at Woori Bank with the relevant sanctions, while no assurances can be given that any such measures would be successful, we intend to take all necessary measures to the extent
28
Table of Contents
possible to ensure that prohibitions or conditions are not placed on our use of U.S. correspondent accounts, including closing the accounts opened by CBI at Woori Bank if required.
Furthermore, some of our U.S. investors may be required to divest their investments in us under the laws of certain U.S. states or under internal investment policies or may decide for reputational reasons to divest such investments. We are aware of initiatives by U.S. governmental entities and U.S. institutional investors, such as pension funds, to adopt or consider adopting laws, regulations, or policies prohibiting transactions with or investment in, or requiring divestment from, entities doing business with countries identified as state sponsors of terrorism. There can be no assurance that the foregoing will not occur or that such occurrence will not have a material adverse effect on the value of our common stock and ADSs.
Our Internet banking services are subject to security concerns relating to the commercial use of the Internet.
We provide Internet banking services to our retail and corporate customers, which require sensitive customer information, including passwords and account information, to be transferred over a secure connection on the Internet. However, connections on the Internet, although secure, are not free from security breaches. We may experience security breaches in connection with our Internet banking service in the future, which may result in liability to our customers and third parties and materially and adversely affect our business.
We may experience disruptions, delays and other difficulties from our information technology systems.
We rely on our information technology systems for our daily operations including billing, effecting online and offline banking transactions and record keeping. We may experience disruptions, delays or other difficulties from our information technology systems, which may have an adverse effect on our business and adversely impact our customers’ confidence in us.
We are generally subject to Korean corporate governance and disclosure standards, which differ in significant respects from those in other countries.
Companies in Korea, including us, are subject to corporate governance standards applicable to Korean public companies which differ in many respects from standards applicable in other countries, including the United States. As a reporting company registered with the U.S. Securities and Exchange Commission and listed on the New York Stock Exchange, we are subject to certain corporate governance standards as mandated by the Sarbanes-Oxley Act of 2002. However, foreign private issuers, including us, are exempt from certain corporate governance requirements under the Sarbanes-Oxley Act or under the rules of the New York Stock Exchange. There may also be less publicly available information about Korean companies, such as us, than is regularly made available by public or non-public companies in other countries. Such differences in corporate governance standards and less public information could result in less than satisfactory corporate governance practices or disclosure to investors in certain countries.
Risks relating to government control
The KDIC, which is our controlling stockholder, is controlled by the Korean government and could cause us to take actions or pursue policy objectives that may be against your interests.
The Korean government, through the KDIC, currently owns 56.97% of our outstanding common stock. So long as the Korean government remains our controlling stockholder, it will have the ability to cause us to take actions or pursue policy objectives that may conflict with the interests of our other stockholders. For example, in order to further its public policy goals, the Korean government could request that we participate with respect to a takeover of a troubled financial institution or encourage us to provide financial support to particular entities or sectors. Such actions or others that are not consistent with maximizing our profits or the value of our common stock may have an adverse impact on our results of operations and financial condition and may cause the price of our common stock and ADSs to decline.
29
Table of Contents
In addition, pursuant to the terms of our memorandum of understanding with the KDIC, we are required to take any necessary actions (including share buybacks and payment of dividends) to return to the KDIC the funds it injected into us and our subsidiaries, so long as those actions do not cause a material adverse effect on the normalization of our business operations as contemplated by the memorandum of understanding. Any actions that we take as a result of this requirement may favor the KDIC over our other stockholders and may therefore be against your interests.
Risks relating to government regulation and policy
The Korean government may promote lending and financial support by the Korean financial industry to certain types of borrowers as a matter of policy, which financial institutions, including us, may decide to follow.
Through its policy guidelines and recommendations, the Korean government has promoted and, as a matter of policy, may continue to attempt to promote lending by the Korean financial industry to particular types of borrowers. For example, the Korean government has in the past announced policy guidelines requesting financial institutions to participate in remedial programs for troubled corporate borrowers, as well as policies aimed at promoting certain sectors of the economy, including measures such as making low interest funding available to financial institutions that lend to these sectors. The government has in this manner encouraged mortgage lending to low-income individuals and lending to small- and medium-sized enterprises. We expect that all loans or credits made pursuant to these government policies will be reviewed in accordance with our credit approval procedures. However, these or any future government policies may influence us to lend to certain sectors or in a manner in which we otherwise would not in the absence of that policy.
In the past, the Korean government has also announced policies under which financial institutions in Korea are encouraged to provide financial support to particular sectors. For example, in light of the deteriorating financial condition and liquidity position of small- and medium-sized enterprises in Korea as a result of the global financial crisis commencing in the second half of 2008 and adverse conditions in the Korean economy affecting consumers, the Korean government introduced measures intended to encourage Korean banks to provide financial support to small- and medium-sized enterprise borrowers. See “—Risks relating to our corporate credit portfolio—The largest portion of our exposure is to small- and medium-sized enterprises, and financial difficulties experienced by companies in this segment may result in a deterioration of our asset quality and have an adverse impact on us.”
The Korean government may in the future request financial institutions in Korea, including us, to make investments in or provide other forms of financial support to particular sectors of the Korean economy as a matter of policy, which financial institutions, including us, may decide to accept. We may incur costs or losses as a result of providing such financial support.
The Financial Services Commission may impose burdensome measures on us if it deems us or one of our subsidiaries to be financially unsound.
If the Financial Services Commission deems our financial condition or the financial condition of our subsidiaries to be unsound, or if we or our subsidiaries fail to meet applicable regulatory standards, such as minimum capital adequacy and liquidity ratios, the Financial Services Commission may order or recommend, among other things:
| • | capital increases or reductions; |
| • | stock cancellations or consolidations; |
| • | transfers of business; |
| • | sales of assets; |
| • | closures of branch offices; |
| • | mergers with other financial institutions; and |
| • | suspensions of a part or all of our business operations. |
30
Table of Contents
If any of these measures are imposed on us by the Financial Services Commission, they could hurt our business, results of operations and financial condition. In addition, if the Financial Services Commission orders us to partially or completely reduce our capital, you may lose part or all of your investment.
In September 2009, the Financial Services Commission imposed an institutional warning on us and Woori Bank in connection with Woori Bank’s losses on collateralized debt obligations and other credit derivatives in recent years. The Financial Services Commission also required Woori Bank to enter into a memorandum of understanding with the Financial Supervisory Service, which was entered into in December 2009 and required Woori Bank to implement specific measures to improve its risk management systems and internal controls (including with respect to its board practices, investment and credit risk management-related processes, compliance monitoring and internal audit practices). In addition, the Financial Services Commission imposed warnings and reprimands on certain of Woori Bank’s current and former executive officers, including current and former chief executive officers of Woori Bank. In October 2010, the Financial Services Commission suspended Kyongnam Bank from accepting new specified money trust accounts for three months and imposed reprimands and warnings on 22 executive officers and employees of Kyongnam Bank in connection with certain fraudulent transactions ostensibly undertaken on behalf of Kyongnam Bank by certain employees, as well as ordering the dismissal of three employees who were principally involved in the incident. See “—Other risks relating to our business—Difficult conditions in the global financial markets could adversely affect our results of operations and financial condition” and “Item 8A. Consolidated Statements and Other Financial Information—Legal Proceedings—Kyongnam Bank.”
Risks relating to Korea
Unfavorable financial and economic developments in Korea may have an adverse effect on us.
We are incorporated in Korea, and substantially all of our operations are located in Korea. As a result, we are subject to political, economic, legal and regulatory risks specific to Korea. The economic indicators in Korea in recent years have shown mixed signs of growth and uncertainty, and future growth of the economy is subject to many factors beyond our control.
In recent years, adverse conditions and volatility in the worldwide financial markets, fluctuations in oil and commodity prices and the general weakness of the U.S. and global economy have contributed to the uncertainty of global economic prospects in general and have adversely affected, and may continue to adversely affect, the Korean economy. See “Other risks relating to our business — Difficult conditions in the global financial markets could adversely affect our results of operations and financial condition.” Since the second half of 2008, the value of the Won relative to major foreign currencies in general and the U.S. dollar in particular has fluctuated widely. See “Item 3A. Selected Financial Data—Exchange Rates.” A depreciation of the Won increases the cost of imported goods and services and the Won revenue needed by Korean companies to service foreign currency-denominated debt. An appreciation of the Won, on the other hand, causes export products of Korean companies to be less competitive by raising their prices in terms of the relevant foreign currency and reduces the Won value of such export sales. Furthermore, as a result of adverse global and Korean economic conditions, there has been significant volatility in the stock prices of Korean companies. The Korea Composite Stock Price Index (known as the “KOSPI”) declined from 1,897.1 on December 31, 2007 to 938.8 on October 24, 2008. While the KOSPI recovered to a significant extent since 2008, there has been significant volatility in the KOSPI commencing in the second half of 2011, particularly following the downgrading by Standard & Poor’s Rating Services of the long-term sovereign credit rating of the United States to “AA+” from “AAA” in August 2011 and in light of the financial difficulties affecting many other governments worldwide, in particular Greece, Spain, Italy and other countries in Europe. There is no guarantee that the stock prices of Korean companies will not decline again in the future. Future declines in the KOSPI and large amounts of sales of Korean securities by foreign investors and subsequent repatriation of the proceeds of such sales may adversely affect the value of the Won, the foreign currency reserves held by financial institutions in Korea, and the ability of Korean companies to raise capital. Any future deterioration of the Korean or global economy could adversely affect our business, financial condition and results of operations.
31
Table of Contents
Developments that could hurt Korea’s economy in the future include:
| • | difficulties in the housing and financial sectors in the United States and elsewhere and the resulting adverse effects on the global financial markets; |
| • | adverse changes or volatility in foreign currency reserve levels, commodity prices (including oil prices), exchange rates (including fluctuation of the U.S. dollar or Japanese yen exchange rates or revaluation of the Chinese renminbi), interest rates and stock markets; |
| • | adverse conditions in the economies of countries that are important export markets for Korea, such as the United States, Japan and China, or in emerging market economies in Asia or elsewhere; |
| • | substantial decreases in the market prices of Korean real estate; |
| • | increasing delinquencies and credit defaults by small- and medium-sized enterprise and consumer borrowers; |
| • | declines in consumer confidence and a slowdown in consumer spending; |
| • | difficulties in the financial sector in Korea, including the savings bank sector; |
| • | the continued emergence of the Chinese economy, to the extent its benefits (such as increased exports to China) are outweighed by its costs (such as competition in export markets or for foreign investment and the relocation of the manufacturing base from Korea to China); |
| • | social and labor unrest; |
| • | a decrease in tax revenues and a substantial increase in the Korean government’s expenditures for fiscal stimulus measures, unemployment compensation and other economic and social programs that, together, would lead to an increased government budget deficit; |
| • | financial problems or lack of progress in the restructuring of chaebols, other large troubled companies, their suppliers or the financial sector; |
| • | loss of investor confidence arising from corporate accounting irregularities and corporate governance issues at certain chaebols; |
| • | increases in social expenditures to support an aging population in Korea or decreases in economic productivity due to the declining population size in Korea; |
| • | the economic impact of any pending or future free trade agreements; |
| • | geo-political uncertainty and risk of further attacks by terrorist groups around the world; |
| • | natural disasters that have a significant adverse economic or other impact on Korea or its major trading partners, such as the earthquake and tsunami that occurred in the northeast part of Japan in March 2011 and any resulting releases of radiation from damaged nuclear power plants in the area; |
| • | the recurrence of severe acute respiratory syndrome, or SARS, or an outbreak of swine or avian flu or foot-and-mouth disease in Asia and other parts of the world; |
| • | deterioration in economic or diplomatic relations between Korea and its trading partners or allies, including deterioration resulting from trade disputes or disagreements in foreign policy; |
| • | political uncertainty or increasing strife among or within political parties in Korea; |
| • | hostilities or civil unrest involving oil producing countries in the Middle East and Northern Africa and any material disruption in the supply of oil or increase in the price of oil; |
| • | an increase in the level of tensions or an outbreak of hostilities between North Korea and Korea or the United States; and |
| • | changes in financial regulations in Korea. |
32
Table of Contents
Escalations in tensions with North Korea could have an adverse effect on us and the market price of our ADSs.
Relations between Korea and North Korea have been tense throughout Korea’s modern history. The level of tension between the two Koreas has fluctuated and may increase abruptly as a result of current and future events.
In particular, since the death of the North Korean ruler Kim Jong-il in December 2011, there has been increased uncertainty with respect to the future of North Korea’s political leadership and concern regarding its implications for political and economic stability in the region. Before his death, Kim Jong-il designated his third son, Kim Jong-eun, as his successor and named him as the vice chairman of the Central Military Commission and a general of the North Korean army. In April 2012, Kim Jong-eun also became the chairman of the National Defense Commission. However, the eventual outcome of such leadership transition remains uncertain. Furthermore, only limited information is available outside of North Korea about Kim Jong-eun, who is reported to be in his late twenties, and it is unclear which individuals or factions, if any, will share political power with Kim Jong-eun or assume the leadership if the transition is not successful. Accordingly, there is significant uncertainty regarding the policies, actions and initiatives that North Korea might pursue in the future.
In recent years, there have also been heightened security concerns stemming from North Korea’s nuclear weapons and long-range missile programs and increased uncertainty regarding North Korea’s actions and possible responses from the international community. North Korea announced in October 2006 that it had successfully conducted a nuclear test, which increased tensions in the region and elicited strong objections worldwide. In May 2009, North Korea announced that it had successfully conducted a second nuclear test. In response, the United Nations Security Council unanimously passed a resolution that condemned North Korea for the nuclear test and decided to expand and tighten sanctions against North Korea. In March 2010, a Korean warship was destroyed by an underwater explosion, killing many of the crewmen on board. The Korean government formally accused North Korea of causing the sinking, while North Korea denied responsibility and threatened retaliation for any attempt to punish it over the incident. In November 2010, North Korea reportedly fired more than one hundred artillery shells that hit Korea’s Yeonpyeong Island near the maritime border between Korea and North Korea on the west coast of Korea, killing two Korean soldiers and two civilians, wounding many others and causing significant property damage. Korea responded by firing artillery shells back and putting the military on its highest level of alert. The Korean government condemned North Korea for the act and vowed stern retaliation should there be further provocation. In April 2012, North Korea attempted to launch a long-range missile, which it characterized as a satellite launch. In response, the United Nations Security Council unanimously issued a presidential statement that condemned North Korea for the attempted launch and decided to further expand and tighten sanctions against North Korea.
North Korea’s economy also faces severe challenges. For example, in November 2009, the North Korean government redenominated its currency at a ratio of 100 to 1 as part of a currency reform undertaken in an attempt to control inflation and reduce income gaps. In tandem with the currency redenomination, the North Korean government banned the use or possession of foreign currency by its residents and closed down privately run markets, which led to severe inflation and food shortages. Such developments may further aggravate social and political tensions within North Korea.
There can be no assurance that the level of tension on the Korean peninsula will not escalate in the future. Any further increase in tensions, which may occur, for example, if North Korea experiences a leadership crisis, high-level contacts break down or military hostilities occur, could have a material adverse effect on our operations and the market value of our common stock and ADSs.
Labor unrest in Korea may adversely affect our operations.
Economic difficulties in Korea or increases in corporate reorganizations and bankruptcies could result in layoffs and higher unemployment. Such developments could lead to social unrest and substantially increase government expenditures for unemployment compensation and other costs for social programs. According to statistics from the Korea National Statistical Office, the unemployment rate was 3.2% in 2008, increased to 3.7% but decreased to 3.4% in 2011. Future increases in unemployment and any resulting labor unrest in the future
33
Table of Contents
could adversely affect our operations, as well as the operations of many of our customers and their ability to repay their loans, and could adversely affect the financial condition of Korean companies in general, depressing the price of their securities. These developments would likely have an adverse effect on our financial condition and results of operations.
Risks relating to our common stock and ADSs
The market price of our common stock and ADSs could be adversely affected by the ability of the KDIC to sell or otherwise dispose of large blocks of our common stock.
The KDIC currently owns 459,198,609 shares, or 56.97%, of our outstanding common stock. In the future, the KDIC may choose to sell large blocks of our common stock publicly or privately to a strategic or financial investor, including for the purpose of recovering the public funds it injected into our subsidiaries to recapitalize them. For example, in September 2004, the KDIC sold approximately 45 million shares of our common stock, which constituted 5.7% of our outstanding common stock, and in June 2007, the KDIC disposed of approximately 40 million shares of our common stock, which constituted 5.0% of our outstanding common stock. In addition, in November 2009, the KDIC sold approximately 56 million shares of our common stock, which constituted 7.0% of our outstanding common stock. Most recently, in April 2010, the KDIC disposed of approximately 73 million shares of our common stock, which constituted 9.0% of our outstanding common stock.
According to the privatization plans announced by the Korean government, through the Public Funds Oversight Committee of the Financial Services Commission, the KDIC will seek to dispose of up to all of its holdings of our common stock (and a minimum of a 30% equity stake) through a competitive bidding process open to domestic and foreign investors. The preliminary bidding process began on April 30, 2012 and will remain open until July 27, 2012. However, the sale process under such plans may be subject to change depending on market conditions and other factors. Furthermore, if it proceeds, our privatization may result in our merger with, or integration into, another financial institution. We do not know when, how or what percentage of our shares owned by the KDIC will be disposed of, or to whom such shares will be sold, or when, how and with whom we may be merged or integrated. As a result, we cannot predict the impact of any such transactions on us or our stock prices. Any future sales of our common stock or ADSs in the public market or otherwise by the KDIC, or any future merger or integration between us and another financial institution, or the possibility that such transactions may occur, could adversely affect the prevailing market prices of our common stock and ADSs.
Ownership of our common stock is restricted under Korean law.
Under the Financial Holding Company Act, a single stockholder, together with its affiliates, is generally prohibited from owning more than 10.0% of the outstanding shares of voting stock of a bank holding company such as us that controls nationwide banks, with the exception of certain stockholders that are non-financial business group companies, whose applicable limit is 9.0%. The Korean government and the KDIC are exempt from this limit, and investors may also exceed the 10.0% limit upon approval by the Financial Services Commission. To the extent that the total number of shares of our common stock (including those represented by ADSs) that you and your affiliates own together exceeds the applicable limits, you will not be entitled to exercise the voting rights for the excess shares, and the Financial Services Commission may order you to dispose of the excess shares within a period of up to six months. Non-financial business group companies are required to obtain approval from the Financial Services Commission in order to (i) become the largest shareholder of a bank holding company or (ii) acquire 4% or more of the issued and outstanding shares of voting stock of a bank holding company and participate in the management of such company in the manner prescribed in the Enforcement Decree of the Financial Holding Company Act. If non-financial business group companies hold voting stock of a bank holding company in excess of the foregoing limits as a result of unavoidable circumstances, such as sales by other stockholders’ of their shareholding, such non-financial business group companies are required to obtain approval from the Financial Services Commission to hold the portion of shares that exceeds the limit, dispose of such portion or take measures so that they no longer fall under the definition of “non-financial business group companies” under the Financial Holding Company Act. Non-compliance with such requirement will prohibit non-financial business group companies from exercising their voting rights of the shares that exceed the limit and prompt the issuance of
34
Table of Contents
an order by the Financial Services Commission directing such non-financial business group companies to dispose of their shares that exceed the limit. Failure to comply with such an order would result in an administrative fine of up to 0.03% of the book value of such shares per day until the date of disposal. See “Item 4B. Business Overview—Supervision and Regulation—Principal Regulations Applicable to Financial Holding Companies—Restrictions on Ownership of a Financial Holding Company.”
You will not be able to exercise dissent and appraisal rights unless you have withdrawn the underlying shares of our common stock and become our direct stockholder.
In some limited circumstances, including the transfer of the whole or any significant part of our business and the merger or consolidation of us with another company, dissenting stockholders have the right to require us to purchase their shares under Korean law. However, if you hold our ADSs, you will not be able to exercise such dissent and appraisal rights if the depositary refuses to do so on your behalf. Our deposit agreement does not require the depositary to take any action in respect of exercising dissent and appraisal rights. In such a situation, holders of our ADSs must withdraw the underlying common stock from the ADS facility (and incur charges relating to that withdrawal) and become our direct stockholder prior to the record date of the stockholders’ meeting at which the relevant transaction is to be approved, in order to exercise dissent and appraisal rights.
You may be limited in your ability to deposit or withdraw common stock.
Under the terms of our deposit agreement, holders of common stock may deposit such stock with the depositary’s custodian in Korea and obtain ADSs, and holders of ADSs may surrender ADSs to the depositary and receive common stock. However, to the extent that a deposit of common stock exceeds any limit that we may specify from time to time, that common stock will not be accepted for deposit unless our consent with respect to such deposit has been obtained. We currently have not set any such limit; however, we have the right to do so at any time. Under the terms of the deposit agreement, no consent would be required if the shares of common stock were to be obtained through a dividend, free distribution, rights offering or reclassification of such stock. We have consented, under the terms of the deposit agreement, to any deposit unless the deposit would be prohibited by applicable laws or violate our articles of incorporation. If we choose to impose a limit on deposits in the future, however, we might not consent to the deposit of any additional common stock. In that circumstance, if you surrender ADSs and withdraw common stock, you may not be able to deposit the stock again to obtain ADSs. See “Item 9C. Markets—Restrictions Applicable to Shares.”
You will not have preemptive rights in some circumstances.
The Korean Commercial Code of 1962, as amended, and our articles of incorporation require us, with some exceptions, to offer stockholders the right to subscribe for new shares of our common stock in proportion to their existing shareholding ratio whenever new shares are issued. If we offer any rights to subscribe for additional shares of our common stock or any rights of any other nature, the depositary, after consultation with us, may make the rights available to holders of our ADSs or use commercially feasible efforts to dispose of the rights on behalf of such holders, in a riskless principal capacity, and make the net proceeds available to such holders. The depositary will make rights available to holders of our ADSs only if:
| • | we have requested in a timely manner that those rights be made available to such holders; |
| • | the depositary has received the documents that are required to be delivered under the terms of the deposit agreement, which may include confirmation that a registration statement filed by us under the U.S. Securities Act of 1933, as amended, is in effect with respect to those shares or that the offering and sale of those shares is exempt from or is not subject to the registration requirements of the Securities Act; and |
| • | the depositary determines, after consulting with us, that the distribution of rights is lawful and commercially feasible. |
35
Table of Contents
Holders of our common stock located in the United States may not exercise any rights they receive absent registration or an exemption from the registration requirements under the Securities Act.
We are under no obligation to file any registration statement with the U.S. Securities and Exchange Commission or to endeavor to cause such a registration statement to be declared effective. Moreover, we may not be able to establish an exemption from registration under the Securities Act. Accordingly, you may be unable to participate in our rights offerings and may experience dilution in your holdings. If a registration statement is required for you to exercise preemptive rights but is not filed by us or is not declared effective, you will not be able to exercise your preemptive rights for additional ADSs and you will suffer dilution of your equity interest in us. If the depositary is unable to sell rights that are not exercised or not distributed or if the sale is not lawful or feasible, it will allow the rights to lapse, in which case you will receive no value for these rights.
Your dividend payments and the amount you may realize upon a sale of your ADSs will be affected by fluctuations in the exchange rate between the U.S. dollar and the Won.
Our common stock is listed on the KRX KOSPI Market and quoted and traded in Won. Cash dividends, if any, in respect of the shares represented by the ADSs will be paid to the depositary in Won and then converted by the depositary into U.S. dollars, subject to certain conditions. Accordingly, fluctuations in the exchange rate between the Won and the U.S. dollar will affect, among other things, the amounts you will receive from the depositary in respect of dividends, the U.S. dollar value of the proceeds that you would receive upon sale in Korea of the shares of our common stock obtained upon surrender of ADSs and the secondary market price of ADSs. Such fluctuations will also affect the U.S. dollar value of dividends and sales proceeds received by holders of our common stock.
The market value of your investment may fluctuate due to the volatility of, and government intervention in, the Korean securities market.
Our common stock is listed on the KRX KOSPI Market, which has a smaller market capitalization and is more volatile than the securities markets in the United States and many European countries. The market value of ADSs may fluctuate in response to the fluctuation of the trading price of shares of our common stock on the KRX KOSPI Market. The KRX KOSPI Market has experienced substantial fluctuations in the prices and volumes of sales of listed securities and the KRX KOSPI Market has prescribed a fixed range in which share prices are permitted to move on a daily basis. The KOSPI declined from 1,897.1 on December 31, 2007 to 938.8 on October 24, 2008. The KOSPI was 1,974.6 on April 20, 2012. There is no guarantee that the stock prices of Korean companies will not decline again in the future. Like other securities markets, including those in developed markets, the Korean securities market has experienced problems including market manipulation, insider trading and settlement failures. The recurrence of these or similar problems could have a material adverse effect on the market price and liquidity of the securities of Korean companies, including our common stock and ADSs, in both the domestic and the international markets.
The Korean government has the potential ability to exert substantial influence over many aspects of the private sector business community, and in the past has exerted that influence from time to time. For example, the Korean government has induced mergers to reduce what it considers excess capacity in a particular industry and has also induced private companies to publicly offer their securities. Similar actions in the future could have the effect of depressing or boosting the Korean securities market, whether or not intended to do so. Accordingly, actions by the government, or the perception that such actions are taking place, may take place or has ceased, may cause sudden movements in the market prices of the securities of Korean companies in the future, which may affect the market price and liquidity of our common stock and ADSs.
If the Korean government deems that emergency circumstances are likely to occur, it may restrict you and the depositary from converting and remitting dividends and other amounts in U.S. dollars.
If the Korean government deems that certain emergency circumstances, including, but not limited to, severe and sudden changes in domestic or overseas economic circumstances, extreme difficulty in stabilizing the
36
Table of Contents
balance of payments or implementing currency, exchange rate and other macroeconomic policies, have occurred or are likely to occur, it may impose certain restrictions provided for under the Foreign Exchange Transaction Law, including the suspension of payments or requiring prior approval from governmental authorities for any transaction. See “Item 10D. Exchange Controls—General.”
Other Risks
You may not be able to enforce a judgment of a foreign court against us.
We are a corporation with limited liability organized under the laws of Korea. Substantially all of our directors and officers and other persons named in this annual report reside in Korea, and all or a significant portion of the assets of our directors and officers and other persons named in this annual report and substantially all of our assets are located in Korea. As a result, it may not be possible for you to effect service of process within the United States, or to enforce against them or us in the United States judgments obtained in United States courts based on the civil liability provisions of the federal securities laws of the United States. There is doubt as to the enforceability in Korea, either in original actions or in actions for enforcement of judgments of United States courts, of civil liabilities predicated on the United States federal securities laws.
| Item 4. | INFORMATION ON THE COMPANY |
| Item 4A. | History and Development of the Company |
Overview
Woori Finance Holdings was incorporated as Korea’s first financial holding company on March 27, 2001 and commenced commercial operations on April 2, 2001. We were established by the KDIC to consolidate the Korean government’s interests in:
| • | four commercial banks (Hanvit Bank (since renamed Woori Bank), Kyongnam Bank, Kwangju Bank and Peace Bank of Korea (since renamed Woori Credit Card and merged with Woori Bank)), |
| • | one merchant bank (Hanaro Merchant Bank (since renamed Woori Investment Bank and merged with Woori Bank)), and |
| • | a number of other smaller financial institutions. |
We were created pursuant to the Financial Holding Company Act, which was enacted in October 2000 and which, together with associated regulations and a related presidential decree, has enabled banks and other financial institutions, including insurance companies, investment trust companies, credit card companies and securities companies, to be organized and managed under the auspices of a single financial holding company.
Our legal and commercial name is Woori Finance Holdings Co., Ltd. Our registered office and corporate headquarters are located at 203 Hoehyon-dong, 1-ga, Chung-gu, Seoul, Korea. Our telephone number is 822-2125-2000. Our website address is http://www.woorifg.com.
History
Establishment of Woori Finance Holdings
In response to the financial and economic downturn beginning in late 1997, the Korean government announced and implemented a series of comprehensive policy packages to address structural weaknesses in the Korean economy and the financial sector. As part of these measures, on October 1, 1998, the KDIC purchased 95.0% of the outstanding shares of Hanvit Bank (which was at the time named the Commercial Bank of Korea) and 95.6% of the outstanding shares of Hanil Bank (which was subsequently merged into Hanvit Bank). These banks had suffered significant losses in 1997 and 1998. The Korean government took pre-emptive measures to ensure the survival of these and other banks as it believed that bank failures would have a substantial negative impact on the Korean economy.
Despite the measures implemented by the government, however, the predecessor operations of substantially all of our subsidiaries recorded significant losses in 1999 and 2000, primarily as a result of high levels of
37
Table of Contents
non-performing credits and loan loss provisioning. Based on subsequent audits conducted by the Financial Supervisory Service of a number of Korean commercial and merchant banks, the Financial Services Commission announced in April 2000 that certain financial institutions had a high risk of insolvency and that substantial remedial measures were required.
Commercial Banking Operations. The Korean government, through the Financial Services Commission, decided in December 2000 to write down the capital of each of Hanvit Bank (now Woori Bank), Kyongnam Bank, Kwangju Bank and Peace Bank of Korea (which was renamed Woori Credit Card and eventually merged with Woori Bank) to zero. It accomplished this by having the Financial Services Commission issue a capital reduction order with respect to these banks pursuant to its regulatory authority. The Korean government also decided to recapitalize these banks by injecting public funds through the KDIC. In December 2000, the KDIC made initial capital injections to Hanvit Bank ((Won)2,764 billion), Kyongnam Bank ((Won)259 billion), Kwangju Bank ((Won)170 billion) and Peace Bank of Korea ((Won)273 billion), in return for new shares of those banks. The KDIC also agreed to make additional capital contributions, not involving the issuance of new shares, in the future, which were made in September 2001 to Hanvit Bank ((Won)1,877 billion), Kyongnam Bank ((Won)94 billion), Kwangju Bank ((Won)273 billion) and Peace Bank of Korea ((Won)339 billion).
Merchant Banking Operations. On November 3, 2000, the KDIC established Hanaro Merchant Bank (which was renamed Woori Investment Bank) to restructure substantially all of the assets and liabilities of four failed merchant banks (Yeungnam Merchant Banking Corporation, Central Banking Corporation, Korea Merchant Banking Corporation and H&S Investment Bank) that were transferred to it.
Formation of Financial Holding Company. In January 2001, Hanvit Bank, Kyongnam Bank, Kwangju Bank, Peace Bank of Korea and Hanaro Merchant Bank agreed in principle to consolidate and become subsidiaries of a new financial holding company. In July 2001, each entity entered into a memorandum of understanding with us, and we entered into a separate memorandum of understanding with the KDIC. These memoranda of understanding along with those entered with between our subsidiaries and the KDIC, which are described in more detail below, established the basis for the relationships among us, our subsidiaries and the KDIC. These memoranda set forth, among other things, financial targets and restructuring objectives that we and our subsidiaries were expected to satisfy in order to create a fully integrated financial services provider and to enable the KDIC to recover the public funds used to recapitalize our subsidiaries. On March 27, 2001, the KDIC transferred all of its shares in each of Hanvit Bank, Kyongnam Bank, Kwangju Bank, Peace Bank of Korea and Hanaro Merchant Bank to our company in exchange for our newly issued shares. Accordingly, we became the sole owner of those subsidiaries. We subsequently listed our shares on the KRX KOSPI Market on June 24, 2002.
Pursuant to the terms of the Financial Holding Company Act, we are subject to certain limitations on our activities that would not be applicable to most other Korean corporations. For example, we:
| • | may not engage in any business other than managing our subsidiaries; |
| • | must obtain prior approval from, or file a prior report with, the Financial Services Commission before we can acquire control of another company; |
| • | must obtain permission from the Financial Services Commission to liquidate or to merge with another company; |
| • | must inform the Financial Services Commission if there is any change in our officers, directors or largest shareholder; and |
| • | must inform the Financial Services Commission if we cease to control any of our direct or indirect subsidiaries by disposing of shares in those subsidiaries. |
See “Item 4B. Business Overview—Supervision and Regulation—Principal Regulations Applicable to Financial Holding Companies.”
38
Table of Contents
Relationship with the Korean Government
Our relationship with the Korean government is governed by a number of agreements, including in particular the agreements discussed below. In addition, the Korean government, through the KDIC, is our largest shareholder and accordingly has the ability to require us to take a number of actions beyond those specifically covered by these agreements. See “Item 3D. Risk Factors—Risks relating to government control” and “—Risks relating to government regulation and policy.”
Labor-Government Agreement. Under a December 2000 agreement between our subsidiaries’ labor unions and the Korean government, we control the management strategies of our subsidiaries and have the ability to dispose of overlapping business lines. Pursuant to this agreement, any downsizing that may be required in connection with the reorganization of our subsidiaries’ operations should be implemented based on separate agreements concluded between us and our subsidiaries’ labor unions. In July 2002, we reached an agreement with the labor unions of Kyongnam Bank and Kwangju Bank pursuant to which we agreed to maintain the two banks as separate entities, while integrating the operating standards (including risk management operations) and information technology systems of our commercial banking subsidiaries.
Memoranda of Understanding between our Subsidiaries and the KDIC. In December 2000, in connection with the capital contributions made by the KDIC into each of Hanvit Bank, Kyongnam Bank, Kwangju Bank, Peace Bank of Korea and Hanaro Merchant Bank, these subsidiaries entered into separate memoranda of understanding with the KDIC that included business normalization plans. The plans were substantially identical with respect to each bank, other than with respect to specific financial targets, and primarily dealt with each subsidiary’s obligation to implement a two-year business normalization plan covering 2001 and 2002. To the extent that any subsidiary fails to implement its business normalization plan or to meet financial targets, the KDIC has the right to impose sanctions on that subsidiary’s directors or employees, or to require the subsidiary to take certain actions. In addition, each subsidiary is required to take all actions necessary to enable us to return to the KDIC any public funds injected into them, so long as that action does not cause a material adverse effect on the normalization of business operations as contemplated by the memorandum of understanding.
Each subsidiary prepared a two-year business normalization plan that was approved by the KDIC. Each plan included recapitalization goals and deadlines, econometric models, plans to dispose of non-performing loans, cost reduction initiatives, future management and business strategies and other restructuring plans. Each plan also set forth six financial targets for each quarter of 2001 and 2002 that the applicable subsidiary was required to meet.
In addition, the directors of each subsidiary executed a letter of undertaking, pursuant to which they assumed responsibility for the relevant subsidiary’s performance in executing these obligations.
Under each memorandum of understanding, the KDIC could exercise its discretion in determining whether to take punitive measures against any subsidiary that failed to meet any financial targets. The subsidiaries generally met their targets, other than Peace Bank of Korea, which failed to meet five of its six financial targets as of June 30, 2001. We decided to merge Peace Bank of Korea’s commercial banking business into Hanvit Bank and to transform Peace Bank of Korea into our credit card subsidiary, Woori Credit Card. See “—Reorganization and Integration Plan.” In March 2002, Woori Credit Card entered into a memorandum of understanding with the KDIC that included a business normalization plan. This replaced the earlier memorandum of understanding entered into by Peace Bank of Korea and the KDIC in December 2000. The business normalization plan was substantially similar to the business normalization plan agreed to by Peace Bank of Korea.
Woori Investment Bank (formerly known as Hanaro Merchant Bank) also failed to meet three of its six financial targets as of December 31, 2002. In August 2003, we merged Woori Investment Bank with Woori Bank.
The subsidiaries (with the exception of Woori Investment Bank and Woori Credit Card) entered into a new two-year business normalization plan with new restructuring measures and financial targets with the KDIC in January 2003. In May 2003, Woori Credit Card entered into a similar business normalization plan with the KDIC. Woori Credit Card failed to meet three of its five financial targets as of June 30 and September 30, 2003 and failed to meet four of its five financial targets as of December 31, 2003. As a result of these failures, the KDIC imposed penalties on Woori Credit Card, including the termination of certain members of its senior
39
Table of Contents
management and the reduction of the compensation of certain others. In December 2003, our board of directors resolved to merge Woori Credit Card with Woori Bank, which merger was completed in March 2004. Kwangju Bank and Kyongnam Bank also failed to meet their respective return on assets target as of December 31, 2003, although they met such target as of March 31, 2004. Due to its merger with Woori Credit Card, Woori Bank also failed to meet its return on assets target and operating profit per employee target as of June 30, 2004. We negotiated with the KDIC to adjust some of the financial targets applicable to us and our subsidiaries under our memoranda of understanding and, as a result, each of Woori Bank, Kyongnam Bank and Kwangju Bank met its financial targets as of December 31, 2004.
Our subsidiaries entered into a new two-year business normalization plan with new restructuring measures and financial targets with the KDIC on April 2005. In addition to the new restructuring measures and financial targets, the plan primarily dealt with ways to reduce labor cost and increase employees’ productivity and efficiency in our subsidiaries. Each of Woori Bank, Kyongnam Bank and Kwangju Bank met its financial targets under the plan. Each of Woori Bank, Kyongnam Bank and Kwangju Bank entered into a new two-year business normalization plan with the KDIC in April 2007. As a result of deteriorating economic and financial market conditions in Korea and globally, Woori Bank failed to meet its return on assets target, its expense-to-revenue ratio target and its operating income per employee target as of December 31, 2008. In September 2009, the KDIC imposed an institutional warning on Woori Bank, as well as reprimands and warnings on 11 current and former executive officers of Woori Bank (including its current and former chief executive officers), in connection with Woori Bank’s failure to meet such financial targets, including as a result of losses incurred on collateralized debt obligations and other credit derivatives.
Our subsidiaries entered into a new two-year business normalization plan with the KDIC in March 2009. In February and October 2010 and February 2011, the KDIC imposed institutional warnings on Woori Bank in connection with its failure to meet its financial targets with respect to operating income per employee as of September 30, 2009 and return on assets and non-performing loan ratio as of June 30 and September 30, 2010, respectively. In October 2010, KDIC imposed an institutional warning on Kyongnam Bank, as well as reprimands and warnings on 10 current and former executive officers of Kyongnam Bank, in connection with certain fraudulent transactions ostensibly undertaken on behalf of Kyongnam Bank by certain employees and their potential impact on Kyongnam Bank. See “Item 8A. Consolidated Statements and Other Financial Information—Legal Proceedings—Kyongnam Bank.” In April 2011, the KDIC imposed another institutional warning on Woori Bank, as well as a warning on the former chief executive officer of Woori Bank, in connection with Woori Bank’s failure to meet its financial targets with respect to its return on assets and non-performing loan ratio as of December 31, 2010. Each of Woori Bank, Kyongnam Bank and Kwangju Bank entered into a new one-year business normalization plan with new restructuring measures and financial targets with the KDIC in March 2011, and each met all of its financial targets under the plan.
In March 2012, each of Woori Bank, Kyongnam Bank and Kwangju Bank entered into a new one-year business normalization plan with new restructuring measures and financial targets with the KDIC. See “—Recent Developments with the KDIC.”
Memorandum of Understanding with the KDIC. In July 2001, we entered into a memorandum of understanding with the KDIC, which included financial targets and a business plan. Under this memorandum, we are required to take all actions necessary (including making dividend payments and share buybacks and cancellations) to return the public funds injected into us by the KDIC, but only to the extent that these actions would not cause a material adverse effect on the contemplated normalization of our operations. To the extent that we fail to perform our obligations, the KDIC is entitled to impose sanctions on our directors and employees, ranging from warnings and wage reductions to suspension or termination of employment. The KDIC can also order us to take remedial measures against those subsidiaries with whom we have entered into separate memoranda of understanding. See “—Memoranda of Understanding with our Subsidiaries.”
In addition, our directors executed a letter of undertaking, pursuant to which they assumed responsibility for our performance of these obligations.
40
Table of Contents
The business plan included in the memorandum of understanding, which we prepared and which the KDIC approved, set forth the basis on which we were to manage the normalization and integration of our subsidiaries’ operations and to return the public funds that were injected into them. The business plan also set financial targets for our capital ratio, return on total assets, expense-to-revenue ratio, operating income per employee, non-performing loan ratio and holding company expense ratio. We were required to meet these financial targets on a semi-annual basis. The memorandum of understanding will terminate once the KDIC loses its status as our largest shareholder.
We failed to meet three of the financial targets as of June 30, 2004, which were return on total assets, expense to revenue ratio, and operating income per employee. The KDIC notified us that we could not improve fringe benefits for our employees (including salaries), and ordered us to devise and report to the KDIC a plan to meet those three financial targets. We negotiated with the KDIC to adjust some of the financial targets applicable to us and our subsidiaries under our memoranda of understanding and, as a result, we met our financial targets as of December 31, 2004.
Pursuant to the terms of this memorandum of understanding, we entered into a new two-year business normalization plan with new restructuring measures and financial targets with the KDIC in April 2005. In addition to the new restructuring measures and financial targets, the plan primarily dealt with ways to increase labor efficiency and to set up a comprehensive financial network for increased synergy among the group members and strengthening our incentive-based management system. We met all of our financial targets under the plan. We entered into a new two-year business normalization plan with the KDIC in April 2007. As a result of deteriorating economic and financial market conditions in Korea and globally, we failed to meet our return on assets target, our expense-to-revenue ratio target and our operating income per employee target as of December 31, 2008. In September 2009, the KDIC imposed an institutional warning on us in connection with our failure to meet such financial targets. We entered into another business normalization plan with the KDIC in March 2009. In March 2010, three of the financial targets for 2010 under such business normalization plan, which were the expense-to-revenue ratio, operating income per employee and holding company expense ratio, were adjusted by the KDIC. In April 2011, the KDIC imposed another institutional warning on us in connection with our failure to meet our financial targets with respect to our non-performing loan ratio as of December 31, 2010. In March 2011, we entered into a new one-year business normalization plan with new restructuring measures and financial targets with the KDIC, under which we met all of our financial targets. In March 2012, we entered into a new one-year business normalization plan with new restructuring measures and financial targets with the KDIC. See “—Recent Developments with the KDIC.”
Memoranda of Understanding with Our Subsidiaries. In July 2001, we entered into separate memoranda of understanding with each of Hanvit Bank, Kyongnam Bank, Kwangju Bank, Peace Bank of Korea and Hanaro Merchant Bank, each of which included financial targets and a business initiative plan. The plans are substantially identical with respect to each subsidiary, other than with respect to specific financial targets, and each plan is primarily intended to define the respective roles of us and each of our subsidiaries within the context of the financial group as a whole, including our rights and our obligations with respect to each subsidiary. These include each subsidiary’s obligations to implement its business initiative plan and to meet the financial targets set forth in the respective memorandum of understanding on a quarterly basis, and certain other matters that we may require from time to time. Each business initiative plan sets forth initiatives related to each subsidiary’s operational integration. For example, Hanvit Bank’s initial business initiative plan included:
| • | cooperating with us to develop an integrated management and support system for us to oversee the operations of our subsidiaries; |
| • | disposing of redundant branches and certain subsidiaries; and |
| • | cooperating with us to consolidate our risk management operations and information technology systems, establish an information technology subsidiary, consolidate our credit card business, dispose of non-performing assets and establish our asset management subsidiary. |
Subsequent business initiative plans have required Woori Bank to continue these activities and undertake new initiatives.
41
Table of Contents
Under the terms of each memorandum of understanding, our role within the group includes supervising the implementation of overall management policies and strategies, determining business targets for each subsidiary in order to meet our respective business targets, consulting with each subsidiary with respect to its business plans, budgets, dividend policies and capital increases, evaluating the management of each subsidiary and determining management compensation. The role of each subsidiary includes executing the business targets we set, consulting with us with respect to important management decisions, developing a restructuring execution plan and cooperating with respect to paying consulting fees incurred in connection with developing business strategies.
If we determine that a subsidiary has failed to perform its obligations under its memorandum of understanding, we have the right to impose sanctions on its directors or employees, or to take other remedial measures. Each memorandum of understanding also provides that it will terminate if the subsidiary loses its status as our subsidiary under the Financial Holding Company Act. The memorandum of understanding would not, however, terminate simply if the KDIC were to lose its status as our largest shareholder.
The specified financial targets for 2012 that are to be met by Woori Bank, Kyongnam Bank and Kwangju Bank are identical to those imposed by the KDIC on those subsidiaries.
Recent Developments with the KDIC. In March 2012, we and Woori Bank, Kyongnam Bank and Kwangju Bank each entered into a new one-year business normalization plan with the KDIC that included new restructuring measures and financial targets. In addition, the plan primarily dealt with ways to increase labor and cost efficiency, strengthen our risk management system, improve our asset quality, improve our profitability through increased synergy among the group members and strengthen our revenue base. The other terms of the previously agreed memoranda of understanding remain unchanged.
Our one-year business normalization plan sets forth six financial targets for fiscal year 2012 that we are required to meet, with semi-annual targets being set internally by us in accordance with the year-end targets. Our targets for fiscal year 2012 are set forth in the following table:
| As of or for the six months ending June 30, 2012 |
As of or for the year ending December 31, 2012 |
|||||||
| Capital adequacy ratio(1) |
10.0 | % | 10.0 | % | ||||
| Return on total assets(2) |
0.15 | 0.46 | ||||||
| Expense-to-revenue ratio(3) |
57.9 | 48.1 | ||||||
| Operating income per employee (Won millions)(4) |
(Won) | 290 | (Won) | 320 | ||||
| Non-performing loan ratio(5) |
2.0 | % | 1.2 | % | ||||
| Holding company expense ratio(6) |
0.9 | 0.6 | ||||||
| (1) | For a description of how the capital adequacy ratio is calculated, see “Item 4B. Business Overview—Supervision and Regulation—Principal Regulations Applicable to Financial Holding Companies—Capital Adequacy.” |
| (2) | Represents the ratio of net income to total assets. |
| (3) | Represents the ratio of general and administrative expenses to adjusted operating income. “Adjusted operating income” represents operating income (i) before subtracting impairment loss on credit losses and general and administrative expenses and (ii) after subtracting (a) gain (loss) on valuation and disposal of equity investment securities and (b) income from Won-denominated loans with respect to the amount of such loans that exceeds the amount of Won-denominated deposits. |
| (4) | Represents the ratio of adjusted operating income to total number of full-time employees. |
| (5) | Represents the ratio of total credits classified as substandard or below to total credits, in each case, net of provisions. |
| (6) | Represents the ratio of the holding company’s expenses to adjusted operating income of its subsidiaries. |
Each of Woori Bank, Kyongnam Bank and Kwangju Bank also submitted similar one-year business normalization plans that contain annual and quarterly financial targets each subsidiary is required to meet. We expect that we and these subsidiaries will be required to enter into new business normalization plans with the KDIC every year so long as the KDIC remains our largest shareholder.
Reorganization and Integration Plan
Following our establishment and our acquisition of our subsidiaries, we developed a reorganization and integration plan designed to reorganize the corporate structure of some of our subsidiaries and integrate our
42
Table of Contents
operations under a single management structure. As part of this plan, and after receiving approval from the Financial Services Commission for each of these measures:
| • | From December 2001 through February 2002, we restructured Peace Bank of Korea by: |
| • | splitting off its commercial banking operations and merging them into Woori Bank; |
| • | changing the name of Peace Bank of Korea to Woori Credit Card; and |
| • | transferring the credit card operations of Woori Bank to Woori Credit Card. In connection with this transfer, Woori Credit Card acquired all of the existing credit card accounts of Woori Bank but none of the outstanding receivables with respect to such accounts, which remained with Woori Bank. |
| • | In March 2002, we made Woori Investment Trust Management a direct subsidiary by acquiring all of its outstanding capital stock from Woori Bank. |
| • | In July 2002, we made Woori Securities a direct subsidiary by acquiring a majority of its outstanding capital stock from Woori Bank. |
| • | In March 2003, we transferred the credit card operations of Kwangju Bank to Woori Credit Card. |
| • | In August 2003, we merged Woori Investment Bank with Woori Bank by exchanging Woori Investment Bank’s shares with shares of Woori Bank. |
In addition, as part of our integration efforts under the plan:
| • | In 2002, we standardized the logo of certain of our subsidiaries, including Woori Bank, Woori Securities and Woori Investment Trust Management. |
| • | In 2002, Woori Bank streamlined its appropriation procedures for goods and services, and we have implemented these procedures on a group-wide level to reduce costs. |
As part of our overall reorganization and integration plan, we completed our business process re-engineering project in November 2004, aimed at enhancing our marketing capabilities, reducing expenses and improving our warning and monitoring system for our credit portfolio. As a result of our implementation of this project, we have been awarded various patents and other intellectual property rights in connection with the project’s implementation and structure.
Furthermore,
| • | In March 2004, we merged Woori Credit Card with Woori Bank. In connection with this merger, Woori Credit Card spun off and transferred to Kwangju Bank all of the existing credit card accounts (but none of the outstanding receivables with respect to such accounts) that Woori Credit Card had previously acquired from Kwangju Bank. |
| • | In June 2004, we acquired the 39.7% interest in Woori Securities that we did not own, and delisted it from the KRX KOSPI Market in July 2004. |
| • | In October and December 2004, we acquired an aggregate 27.3% voting interest in LGIS. In March 2005, we merged Woori Securities into LGIS and renamed the surviving entity Woori Investment & Securities, which became an equity method investee under U.S. GAAP. Currently, Woori Investment & Securities is accounted for as a consolidated subsidiary under IFRS. |
| • | In May 2005, we acquired a 90.0% interest in LGITM, from Woori Investment & Securities and merged Woori Investment Trust Management into LGITM. We renamed the surviving entity Woori Asset Management, which remains a consolidated subsidiary. In July and September 2005, Woori Asset Management reacquired the remaining 10.0% interest from its minority shareholders. In May 2006, we transferred 30.0% of our interest in Woori Asset Management to Credit Suisse. Following this transfer, we renamed the entity Woori Credit Suisse Asset Management. In October 2009, we reacquired Credit Suisse’s 30.0% ownership interest in Woori Credit Suisse Asset Management and renamed the entity Woori Asset Management. |
43
Table of Contents
| • | In October 2005, we established Woori Private Equity as a consolidated subsidiary. |
| • | In September 2007, we acquired a 51.4% interest in Hanmi Capital, which became a consolidated subsidiary, and renamed the entity Woori Financial. |
| • | In April 2008, we acquired a 51.0% interest in LIG Life Insurance. In connection with this acquisition, we entered into a joint venture agreement with Aviva International Holdings Limited. Aviva International Holdings Limited (through its wholly-owned subsidiary Aviva Asia Holdings Private Limited) and we collectively hold a 98.9% interest in LIG Life Insurance, which was subsequently renamed Woori Aviva Life Insurance. Under IFRS, we account for Woori Aviva Life Insurance as part of our investments in jointly controlled entities and associates. |
| • | In March 2011, we acquired certain assets and assumed certain liabilities of Samhwa Mutual Savings Bank through our wholly-owned consolidated subsidiary, Woori FG Savings Bank Co., Ltd., which was established in connection with such transaction. |
| • | In September 2011, we tentatively announced our plan to spin off the credit card business of Woori Bank, which has not yet been implemented. |
| • | In October 2011, we acquired all of the outstanding common stock of Kwangju Bank and Kyongnam Bank that we did not previously own by exchanging shares of our own common stock for such shares, pursuant to which Kwangju Bank and Kyongnam Bank became our wholly-owned subsidiaries. |
In addition, we have implemented a group-wide, standardized risk management system (except with respect to operational risk), including the standardization of the credit risk management systems of our subsidiaries which was completed in 2007. With respect to credit risk management systems, we completed implementing standardized credit risk management systems based on Woori Bank’s system in all of our banking subsidiaries in 2007. With respect to operational risk management systems, we completed implementation of various aspects of the operational risk management system (not including the business risk management system) at Kyongnam Bank, Kwangju Bank and Woori Finance Information System (which changed its name to Woori FIS in May 2011) in 2006, completed the implementation of such aspects of the operational risk management system at Woori Investment & Securities in 2008, and also implemented an “advanced measurement approach” for operational risk at Woori Bank in June 2009.
| Item 4B. | Business Overview |
Business
We are Korea’s first financial holding company, and our operations include one of the largest commercial banks in Korea, in terms of total assets (including loans). Our subsidiaries collectively engage in a broad range of businesses, including commercial banking, credit cards, capital markets activities, international banking, asset management and bancassurance. We provide a wide range of products and services to our customers, which mainly comprise individuals and small- and medium-sized enterprises, as well as some of Korea’s largest corporations. As of December 31, 2011, we had consolidated total assets of (Won)313 trillion, consolidated total deposits of (Won)196 trillion and consolidated total equity of (Won)22 trillion.
We were established as a financial holding company in March 2001, to consolidate the Korean government’s interest in a number of distressed financial institutions in the wake of the financial crisis in Korea in the late 1990s. Since our establishment, we have succeeded in restructuring our operations by: securing a solid capital base for our banking subsidiaries; improving the quality of our exposure to and our relationships in the large corporate sector; refocusing our lending activities on individual and small- and medium-sized enterprise customers to take advantage of our network of approximately 1,245 branches nationwide; expanding our activities in the areas of credit cards, full service brokerage, asset management and bancassurance for our over 21 million retail customers; modernizing and strengthening our credit risk review and management capabilities; working to integrate and cross-sell our products and services; and striving to create a customer- and service-oriented culture that measures and rewards performance.
44
Table of Contents
The following chart provides an overview of our structure, including our significant subsidiaries and our ownership of such subsidiaries as of the date of this annual report:

| (1) | Woori Aviva Life Insurance, in which we acquired a 51.0% interest in April 2008 and in respect of which we entered into a joint venture agreement with Aviva International Holdings Limited, is accounted for as part of our investments in jointly controlled entities and associates under IFRS. We currently hold a 51.6% interest in Woori Aviva Life Insurance. |
| (2) | In March 2011, we acquired certain assets and assumed certain liabilities of Samhwa Mutual Savings Bank through our wholly owned subsidiary Woori FG Savings Bank, which was established in connection with such transaction. |
As one of the leading financial services groups in Korea, we believe our core competitive strengths include the following:
Financial holding company structure. We believe our financial holding company structure gives us a competitive advantage over commercial banks and unaffiliated financial services providers by:
| • | allowing us to offer a more extensive range of financial products and services; |
| • | enabling us to share customer information, which is not permitted outside a financial holding company structure, thereby enhancing our risk management and cross-selling capabilities; |
| • | enhancing our ability to reduce costs in areas such as back-office processing and procurement; and |
| • | enabling us to raise and manage capital on a centralized basis. |
Strong and long standing relationships with corporate customers. Historically the operations of Woori Bank, our largest subsidiary, concentrated on large corporate customers. As a result, we believe that we have strong relationships with many of Korea’s leading corporate groups, and we are the main creditor bank to 13 of the 34 largest Korean corporate borrowers. Further enhancing our corporate loan portfolio is our ability to lend to small- and medium-sized enterprise customers. As of December 31, 2011, we had approximately 225,800 small- and medium-sized enterprise borrowers.
Large and loyal retail customer base. With respect to our consumer banking operations, we have one of the largest deposit bases of any Korean commercial bank, and over 21 million retail customers, representing about half of the Korean adult population. Of these customers, more than half are active customers, meaning that they have an account with us with a positive balance or have transacted business with us at least once during the last six months.
Extensive distribution and marketing network. We serve our customers primarily through one of the largest banking networks in Korea, comprising approximately 1,245 branches and over 8,900 ATMs and cash dispensers. Through Woori Bank, we also operate 11 dedicated corporate banking centers and approximately 97 general managers for our large corporate customers and approximately 1,544 relationship managers stationed at 730 branches for our small- and medium-sized enterprise customers. In addition, we have Internet and mobile banking platforms to enhance customer convenience, reduce service delivery costs and allow our branch staff to focus on marketing and sales.
Strong capital base. As of December 31, 2011, our consolidated equity totaled (Won)22 trillion, and the combined capital adequacy ratio of our banking subsidiaries was 13.7%. Our management team at the holding
45
Table of Contents
company carefully coordinates the capital and dividend plans of each of our subsidiaries and for the consolidated group to ensure that we optimize our capital position. We believe our strong capital base and coordinated capital management enable us to support growth of our core businesses and to pursue franchise-enhancing initiatives such as selective investments and acquisitions.
Strong and experienced management team. Our management team comprises both experienced managers from our subsidiaries and their predecessor companies as well as leading experienced financial industry professionals who have been recruited from outside our group to complement our team. In June 2008, Pal Seung Lee, a former chief executive officer of Woori Securities, assumed the role of our chairman and chief executive officer, which we believe has enhanced the quality of our management team and our corporate governance. We also believe that the extensive experience of many members of our management team in the financial sector will help us to continue to strengthen our operations.
Strategy
Our goal is to become a dynamic, leading full-service provider of financial services and products to corporate and consumer customers in Korea, and we will measure our success based on our ability to increase our profitability and shareholder value. We intend to capitalize on our strong market and financial position to further strengthen our capabilities, customer penetration, efficiency and profitability. The key elements of our strategy are to:
Further improve our asset quality and strengthen our risk management practices. We were one of the earliest and most aggressive banks in Korea to actively reduce non-performing loans through charge-offs and sales to third parties. Since 2002, we have taken various measures, including entering into joint venture arrangements with several financial institutions, to facilitate the disposal of our substandard or below loans. As a result of these and other initiatives, our ratio of non-performing loans to total loans has decreased significantly over the past decade and was 1.8% as of December 31, 2011.
One of our highest priorities is to maintain our strong asset quality and enhance our risk management practices on an ongoing basis. We created a centralized group-wide risk management organization, installed a comprehensive warning and monitoring system, adopted uniform loan loss provisioning policies across all subsidiaries and implemented an advanced credit evaluation system called “CREPIA” at Woori Bank. Kyongnam Bank and Kwangju Bank currently use standardized credit evaluation systems based on the CREPIA system. In connection with the implementation of Basel II in Korea in January 2008, we completed upgrades to our credit risk management systems in 2007, including credit evaluation models, collateral management systems and non-performing credit management systems, as well as the implementation of a “credit risk measurement engine” to quantify our credit risk exposures. Furthermore, following the global financial crisis, we undertook a group-wide review of our credit risk management procedures with outside consultants in 2009, as well as undertaking further group-wide reviews of our risk management infrastructure and systems in 2009 and 2010, in order to develop and implement various measures to further standardize and improve our risk management procedures and systems.
In addition, we use a value at risk, or “VaR,” monitoring system for managing market risk. We intend to vigorously maintain a manageable risk profile and balance that risk profile with adequate returns. We believe that our continuous focus on upgrading our risk management systems and practices will enable us to maintain our strong asset quality, improve our financial performance and enhance our competitiveness.
Enhance customer profitability through optimization of channel usage, products and services for each customer segment. Our extensive distribution network and wide range of quality products and services has enabled us to serve our customers effectively. However, we intend to further enhance value proposition to our customers by differentiating products and delivery channels based on the distinct needs of different customer segments.
Retail customers. We have segmented our retail customers into four groups: high net worth; mass affluent; middle class; and mass market. We believe we are relatively competitive in our core customer base, which
46
Table of Contents
includes mass affluent and middle class customers, and we serve these customers via our team of financial planners in our branches who sell customized higher margin services and products, such as investment advice, mutual funds, insurance, personal loans and securities brokerage services. For our mass market customers, we offer simple, easy-to-understand and relatively more standardized products such as basic deposit and lending products, including mortgage loans, and we encourage the use of alternative distribution channels such as the Internet, phone banking and ATMs by our mass market customers such that we can serve them in a cost efficient manner. We serve our high net worth individuals via branches and dedicated private banking centers staffed with experienced private bankers who offer sophisticated tailored financial services.
Corporate customers. We continuously and vigorously review our portfolio of large corporate and small- and medium-sized enterprise customers to refine our database of core accounts and industries in terms of profitability potential. We seek to expand our relationship beyond a pure lending relationship by promoting our foreign exchange, factoring, trade finance and investment banking services to our core small- and medium-sized enterprise customers and cross-selling our investment banking services, derivatives and other risk hedging products, as well as employee retirement products to our core large corporate customers.
Diversify our revenue base with a view to reducing our exposure to interest rate cycles and increasing profitability. Currently, in line with the Korean banking industry, we derive a substantial majority of our revenues from our loan and other credit products. To reduce our traditional reliance on lending as a source of revenue and to increase our profitability, we have been seeking to further diversify our earnings base, in particular by focusing on fee-based services, such as foreign exchange, trade finance and derivatives products, investment banking and advisory investment trust services for our corporate customers and asset management and mutual funds, investment trust products and beneficiary certificates, life and non-life insurance products and securities brokerage services for our retail customers.
In addition, we intend to continue to enter into business alliances with other leading financial service providers so that we can offer a full range of “best of class” products and services to our targeted customers. We actively evaluate alliances and joint venture opportunities when they arise in order to diversify our revenue stream and provide our customers with a range of sophisticated and tailored products that will complement our existing products and services. We also intend to carefully consider potential acquisitions or other strategic investments that fit within our overall strategy. When considering acquisitions, we will focus on opportunities that (1) supplement the range of products and services we offer and strengthen our existing customer base; (2) enable us to maintain our standard for asset quality and profitability; and (3) provide us with a reasonable return on our investment.
Enhance operational efficiencies and synergies. We have been seeking to improve our operational efficiency and synergies and reduce our expenses by integrating our businesses, unifying our business procedures, eliminating duplication, centralizing processes and procurement, implementing continuous automation and migrating to low cost distribution channels. We have standardized the risk management operations of Kyongnam Bank and Kwangju Bank with those of Woori Bank, with various upgrades to standardize the credit risk management and operational risk management systems of Kyongnam Bank and Kwangju Bank being completed in 2007. In 2009, we established a centralized information technology center which enables our subsidiaries to access group-wide information technology resources and networks.
We believe that the continuing integration of our accounting, information technology and other back-office systems will allow us to further eliminate redundant functions and equipment and reducing our long-term expense. In addition, we are continuing our efforts to reduce procurement costs by coordinating and combining procurement activities among our subsidiaries. We believe the completion of the above integration, centralization and procurement projects together with our effort to encourage migration of our mass market customers to low-cost alternative channels will reduce our costs and enhance our operating efficiencies. We are also continuing our efforts to maximize synergies among our subsidiaries, including through increased cross-selling and marketing of a broad range of financial products and services through our “financial products department stores” located in Seoul.
47
Table of Contents
Strengthen the performance of our management. We are also taking steps to concentrate the personnel management and performance-monitoring functions with respect to our subsidiaries at the holding company level. We believe such enhanced coordination and management will, in turn, improve our overall long-term operating performance by promoting: (1) more efficient deployment of human resources, based on prioritized strategic and operational objectives of the group as a whole; (2) more effective allocation of capital and management of liquidity at our holding company and subsidiaries; (3) greater flexibility to implement coordinated and timely operational changes in response to new market developments or changes in market conditions; and (4) the development of a uniform corporate culture, founded on the “Woori” corporate identity.
Corporate Banking
We provide commercial banking services to large corporate customers (including government-owned enterprises) and small- and medium-sized enterprises in Korea. Currently, our corporate banking operations consist mainly of lending to and taking deposits from our corporate customers. We also provide ancillary services on a fee basis, such as inter-account transfers, transfers of funds from branches and agencies of a company to its headquarters and transfers of funds from a company’s customer accounts to the company’s main account. We provide our corporate banking services predominantly through Woori Bank, although Kyongnam Bank and Kwangju Bank provide similar services to small- and medium-sized enterprises in their respective geographical regions.
The following table sets forth the balances and percentages of our total lending and total deposits represented by our large corporate and small- and medium-sized enterprise customer loans and deposits, respectively, and the number of such customers as of the dates indicated:
| As of December 31, | ||||||||||||||||
| 2010 | 2011 | |||||||||||||||
| Amount | % of Total |
Amount | % of Total |
|||||||||||||
| (in billions of Won, except percentages) | ||||||||||||||||
|
Loans(1) : |
||||||||||||||||
| Small- and medium-sized enterprise(2) |
(Won) | 81,618 | 40.6 | % | (Won) | 83,624 | 39.4 | % | ||||||||
| Large corporate(3) |
31,073 | 15.4 | 33,672 | 15.8 | ||||||||||||
| Others(4) |
17,430 | 8.7 | 17,690 | 8.3 | ||||||||||||
|
|
|
|
|
|
|
|
|
|||||||||
| Total |
(Won) | 130,121 | 64.7 | % | (Won) | 134,986 | 63.5 | % | ||||||||
|
|
|
|
|
|
|
|
|
|||||||||
| Deposits: |
||||||||||||||||
| Small- and medium-sized enterprise |
(Won) | 27,351 | 14.8 | % | (Won) | 30,977 | 15.8 | % | ||||||||
| Large corporate |
61,598 | 33.2 | 61,561 | 31.4 | ||||||||||||
|
|
|
|
|
|
|
|
|
|||||||||
| Total |
(Won) | 88,949 | 48.0 | % | (Won) | 92,538 | 47.2 | % | ||||||||
|
|
|
|
|
|
|
|
|
|||||||||
| Number of borrowers: |
||||||||||||||||
| Small- and medium-sized enterprise |
257,143 | 225,791 | ||||||||||||||
| Large corporate |
2,603 | 2,739 | ||||||||||||||
| (1) | Not including due from banks, other receivables and outstanding credit card balances, and prior to deducting provisions for credit losses and present value discount or reflecting deferred origination costs. |
| (2) | Loans to “small- and medium-sized enterprises” as defined in the Small and Medium Industry Basic Act of Korea and related regulations (and including project finance loans to such enterprises). See “—Small and Medium-Sized Enterprise Banking.” |
| (3) | Loans to companies that are not “small- and medium-size enterprises” as defined in the Small and Medium Industry Basic Act of Korea and related regulations, and typically including companies that have assets of (Won)10 billion or more and are therefore subject to external audit under the External Audit Act of Korea. See “—Large Corporate Banking.” |
| (4) | Includes loans to governmental agencies, foreign loans and other corporate loans. |
Corporate loans we provide consist principally of the following:
| • | working capital loans, which are loans used for general working capital purposes, typically with a maturity of one year or less, including notes discounted and trade finance; and |
48
Table of Contents
| • | facilities loans, which are loans to finance the purchase of materials, equipment and facilities, typically with a maturity of three years or more. |
On the deposit-taking side, we currently offer our corporate customers several types of corporate deposit products. These products can be divided into two general categories: demand deposits that have no restrictions on deposits or withdrawals, but which offer a relatively low interest rate; and time deposits from which withdrawals are restricted for a period of time, but offer higher interest rates. We also offer installment deposits, certificates of deposit and repurchase instruments. We offer varying interest rates on our deposit products depending upon the rate of return on our income-earning assets, average funding costs and interest rates offered by other nationwide commercial banks.
Small- and Medium-Sized Enterprise Banking
We use the term “small- and medium-sized enterprises” as defined in the Small and Medium Industry Basic Act of Korea and related regulations. Under the Small and Medium Industry Basic Act of Korea and related regulations, in order to qualify as a small- and medium-sized enterprise, (i) the number of regular employees of the enterprise must be less than 1,000, (ii) the enterprise’s total assets at the end of the immediately preceding fiscal year must be less than (Won)500 billion, (iii) the enterprise’s paid-in capital at the end of the immediately preceding fiscal year must be less than (Won)100 billion, (iv) the enterprise’s average sales revenues for the most recent three fiscal years must be less than (Won)150 billion, (v) the enterprise must meet the standards prescribed by the Presidential Decree applicable to the type of its main business and (vi) the enterprise must meet the standards of management independence from ownership as prescribed by the Presidential Decree, including non-membership in a conglomerate as defined in the Monopoly Regulations and Fair Trade Act. Furthermore, non-profit enterprises with a number of regular employees not exceeding 300 and the sales revenue of less than (Won)30 billion that satisfy certain requirements prescribed in the Small and Medium Industry Basic Act may qualify as a small- and medium-sized enterprise. The small- and medium-sized enterprise segment of the corporate banking market has grown significantly in recent years, including as a result of government measures to encourage lending to these enterprises. As of December 31, 2011, 39.4% of our small- and medium-sized enterprise loans were extended to borrowers in the manufacturing industry, 18.0% were extended to borrowers in the retail and wholesale industry and 7.2% were extended to borrowers in the construction industry.
We service our small- and medium-sized enterprise customers primarily through Woori Bank’s network of branches and small- and medium-sized enterprise relationship managers, as well as through the branches and headquarters of Kyongnam Bank and Kwangju Bank. As of December 31, 2011, Woori Bank had stationed one or more relationship managers at 730 branches, of which 370 were located in the Seoul metropolitan area. The relationship managers specialize in servicing the banking needs of small- and medium-sized enterprise customers and concentrate their marketing efforts on developing new customers in this segment. As of December 31, 2011, Woori Bank had a total of 1,544 small- and medium-sized enterprise relationship managers stationed at its branches.
In addition to increasing our dedicated staffing and branches, our strategy for this banking segment is to identify promising industry sectors and to develop and market products and services targeted towards customers in these sectors. We have also developed in-house industry specialists who can help us identify leading small- and medium-sized enterprises in, and develop products and marketing strategies for, these targeted industries. In addition, we operate customer loyalty programs at Woori Bank for our most profitable small- and medium-sized enterprise customers and provide them with benefits and services such as preferential rates, free seminars and workshops and complementary invitations to cultural events.
Lending Activities. We provide both working capital loans and facilities loans to our small- and medium-sized enterprise customers. As of December 31, 2011, working capital loans and facilities loans accounted for 66.6% and 24.7%, respectively, of our total small- and medium-sized enterprise loans. As of December 31, 2011, we had approximately 225,800 small- and medium-sized enterprise borrowers.
As of December 31, 2011, secured loans and loans guaranteed by a third party accounted for 60.7% and 15.8%, respectively, of our small- and medium-sized enterprise loans. As of December 31, 2011, approximately
49
Table of Contents
75.6% of the secured loans were secured by real estate and 4.5% were secured by deposits. Working capital loans generally have a maturity of one year, but may be extended on an annual basis for an aggregate term of three to five years if periodic payments are made. Facilities loans have a maximum maturity of ten years.
When evaluating the extension of working capital loans and facilities loans, we review the creditworthiness and capability to generate cash of the small- and medium-sized enterprise customer. Furthermore, we take corporate guarantees and credit guarantee letters from other financial institutions and use deposits that the borrower has with us or securities pledged to us as collateral. We receive fees in relation to credit evaluation, collateral appraisal and other services provided in connection with a loan extension.
The value of any collateral is defined using a formula that takes into account the appraised value of the property, any prior liens or other claims against the property and an adjustment factor based on a number of considerations including, with respect to property, the value of any nearby property sold in a court-supervised auction during the previous five years. We generally revalue any collateral on a periodic basis (every year for real estate (with apartments being revalued every month, subject to the availability of certain specified market value information), every year for equipment, every month for unlisted stocks and deposits and every week for stocks listed on a major Korean stock exchange) or if a trigger event occurs with respect to the loan in question.
Pricing. We establish the pricing for our small- and medium-sized enterprise loan products based principally on transaction risk, our cost of funding and market considerations. At Woori Bank, lending rates are generally determined using our CREPIA system. Woori Bank uses its CREPIA system to manage its lending activities, and inputs data gathered from loan application forms, credit scores of borrowers and the appraisal value of collateral provided by external valuation experts into the CREPIA system and updates such information periodically to reflect changes in such information. At Kyongnam Bank and Kwangju Bank, we began to determine lending rates using similar credit evaluation systems from January 2008. See “Item 11. Quantitative and Qualitative Disclosures about Market Risk—Credit Risk Management—Credit Evaluation and Approval.” We measure transaction risk using factors such as the credit rating assigned to a particular borrower and the value and type of collateral. Our system also takes into account cost factors such as the current market interest rate, opportunity cost and cost of capital, as well as a spread calculated to achieve a target rate of return. Depending on the price and other terms set by competing banks for similar borrowers, we may reduce the interest rate we charge to compete more effectively with other banks. Loan officers have limited discretion in deciding what interest rates to offer, and significant variations require review at higher levels. As of December 31, 2011, approximately 80.4% of our small- and medium-sized enterprise loans had interest rates that varied with reference to current market interest rates.
Large Corporate Banking
Our large corporate customers consist of companies that are not “small- and medium-size enterprises” as defined in the Small and Medium Industry Basic Act of Korea and related regulations, and typically include companies that have assets of (Won)10 billion or more and are therefore subject to external audit under the External Audit Act of Korea. As a result of our history and development, particularly the history of Woori Bank, we remain the main creditor bank to many of Korea’s largest corporate borrowers.
In terms of our outstanding loan balance, as of December 31, 2011, 50.2% of our large corporate loans were extended to borrowers in the manufacturing industry, 13.5% were extended to borrowers in the finance and insurance industry and 9.5% were extended to borrowers in the construction industry.
We service our large corporate customers primarily through Woori Bank’s network of dedicated corporate banking centers and general managers. Woori Bank operates 11 dedicated corporate banking centers, 10 of which are located in the Seoul metropolitan area. Each center is staffed with several general managers and headed by a senior general manager. Depending on the center, each such manager is responsible for large corporate customers that either are affiliates of a particular chaebol or operate in a particular industry or region. As of December 31, 2011, Woori Bank had a total of 97 general managers who focus on marketing to and managing the accounts of large corporate customers.
50
Table of Contents
Our strategy for the large corporate banking segment is to develop new products and cross-sell our existing products and services to our core base of large corporate customers. In particular, we continue to focus on marketing fee-based products and services such as foreign exchange and trade finance services, derivatives and other risk hedging products, investment banking services and advisory services. We have also been reviewing the credit and risk profiles of our existing customers as well as those of our competitors, with a view to identifying a target group of high-quality customers on whom we can concentrate our marketing efforts. In addition, we are seeking to continue to increase the chaebol-, region- and industry-based specialization of the managers at our dedicated corporate banking centers, including through the operation of a knowledge management database that allows greater sharing of marketing techniques and skills.
Lending Activities. We provide both working capital loans and facilities loans to our large corporate customers. As of December 31, 2011, working capital loans and facilities loans accounted for 35.2% and 22.8%, respectively, of our total large corporate loans.
Loans to large corporate customers may be secured by real estate or deposits or be unsecured. As of December 31, 2011, secured loans and loans guaranteed by a third party accounted for 19.0% and 6.9%, respectively, of our large corporate loans. Since a relatively low percentage of our large corporate loan portfolio is secured by collateral, we may be required to establish larger provisions for credit losses with respect to any such loans that become non-performing or impaired. See “—Assets and Liabilities—Asset Quality of Loans—Loan Loss Provisioning Policy.” As of December 31, 2011, approximately 70.7% of the secured loans were secured by real estate and approximately 6.0% were secured by deposits. Working capital loans generally have a maturity of one year but may be extended on an annual basis for an aggregate term of three to five years. Facilities loans have a maximum maturity of ten years.
We evaluate creditworthiness and collateral for our loans to large corporate customers in essentially the same way as we do for loans to small- and medium-sized enterprise customers. See “—Corporate Banking—Small- and Medium-Sized Enterprise Banking—Lending Activities.”
Pricing. We determine the pricing of our loans to large corporate customers in the same way that we determine the pricing of our loans to small- and medium-sized enterprise customers. See “—Corporate Banking—Small- and Medium-Sized Enterprise Banking—Pricing.” As of December 31, 2011, approximately half of these loans had interest rates that varied with reference to current market interest rates.
Consumer Banking
We provide retail banking services to consumers in Korea. Our consumer banking operations consist mainly of lending to and taking deposits from our retail customers. We also provide ancillary services on a fee basis, such as wire transfers. While we have historically attracted and held large amounts of consumer deposits through our extensive branch network, our substantial consumer lending growth occurred principally in recent years, in line with the increase in the overall level of consumer debt in Korea. We provide our consumer banking services primarily through Woori Bank, although we service a significant portion of our regional retail banking customers through Kyongnam Bank and Kwangju Bank. See “—Branch Network and Other Distribution Channels.”
Woori Bank classifies its consumer banking customers based on their individual net worth and contribution to our consumer banking operations into four groups: high net worth; mass affluent; middle class; and mass market. We differentiate our products, services and service delivery channels with respect to these segments and target our marketing and cross-selling efforts based on this segmentation. With respect to the high net worth and mass affluent segments, we have established private banking operations to better service customers in these segments. See “—Private Banking Operations.” With respect to the middle class segment, we intend to use our branch-level sales staff to maximize the overall volume of products and services we provide. With respect to the mass market segment, we have focused on increasing our operating efficiency by encouraging customers to migrate to low-cost alternative service delivery channels, such as the Internet, call centers, mobile banking and ATMs. Kyongnam Bank and Kwangju Bank have segmented their customers into similar groups.
51
Table of Contents
Kyongnam Bank and Kwangju Bank, both regional banks established in their respective regions in 1970 and 1968, are using region-focused strategies to attract customers, market products and create more intimate customer relationships, thereby differentiating themselves from nationwide banks in the same market. Kyongnam Bank is attempting to increase priority customer transaction volume by actively increasing its customer service and management and differentiating services for these customers. Kwangju Bank operates a customer management system that uses diverse strategies to market differentiated products and services to priority customers.
Lending Activities
We offer a variety of consumer loan products to households and individuals. We differentiate our product offerings based on a number of factors, including the customer’s age group, the purpose for which the loan is used, collateral requirements and maturity. The following table sets forth the balances and percentage of our total lending represented by our consumer loans as of the dates indicated:
| As of December 31, | ||||||||||||||||
| 2010 | 2011 | |||||||||||||||
| Amount(1) | %
of Total Loans(2) |
Amount(1) | %
of Total Loans(2) |
|||||||||||||
| (in billions of Won, except percentage) | ||||||||||||||||
| General purpose household loans |
(Won) | 33,737 | 16.8 | % | (Won) | 32,836 | 15.5 | % | ||||||||
| Mortgage loans |
6,375 | 3.2 | 12,138 | 5.7 | ||||||||||||
| Home equity loans |
26,645 | 13.2 | 27,940 | 13.1 | ||||||||||||
|
|
|
|
|
|
|
|
|
|||||||||
| Total |
(Won) | 66,757 | 33.2 | % | (Won) | 72,914 | 34.3 | % | ||||||||
|
|
|
|
|
|
|
|
|
|||||||||
| (1) | Not including outstanding credit card balances, and prior to deducting provisions for credit losses and present value discount or reflecting deferred origination costs. |
| (2) | Total loans do not include due from banks and other receivables and are before the deduction of provisions for credit losses and present value discount and the reflection of deferred origination costs. |
Our consumer loans consist of:
| • | general purpose household loans, which are loans made to customers for any purpose (other than mortgage and home equity loans), and include overdraft loans, which are loans extended to customers to cover insufficient funds when they withdraw funds from their demand deposit accounts with us in excess of the amount in such accounts up to a limit established by us; and |
| • | mortgage loans, which are loans made to customers to finance home purchases, construction, improvements or rentals, and home equity loans, which are loans made to customers secured by their homes to ensure loan repayment. |
For secured loans, including mortgage and home equity loans, we generally lend up to 60% of the collateral value (except in areas of high speculation designated by the government where we generally limit our lending to 40% to 60% of the appraised value of collateral) minus the value of any lien or other security interest that is prior to our security interest. In calculating the collateral value for real estate for such secured consumer loans (which principally consists of residential properties), we generally use the fair value of the collateral as appraised by Korea Investors Service which is collated in our CREPIA system and similar systems used by Kyongnam Bank and Kwangju Bank to manage lending activities and gather related information. We generally revalue collateral on a periodic basis. As of December 31, 2011, the revaluation period was every year for real estate (with apartments being revalued every month, subject to the availability of certain specified market value information), every year for equipment, every month for deposits and every week for stocks listed on a major Korean stock exchange.
A borrower’s eligibility for general purpose household loans is primarily determined by such borrower’s creditworthiness. In reviewing a potential borrower’s loan application, we also consider the suitability of the borrower’s proposed use of funds, as well as the borrower’s ability to provide a first-priority mortgage. A
52
Table of Contents
borrower’s eligibility for a home equity loan is primarily determined by such borrower’s creditworthiness (including as determined by our internal credit scoring protocols) and the value of the collateral property, as well as any third party guarantees of the borrowed amounts.
We also offer a variety of collective housing loans, including loans to purchase property or finance the construction of housing units, loans to contractors to be used for working capital purposes, and loans to educational institutions and non-profit entities to finance the construction of dormitories. Collective housing loans subject us to the risk that the housing units will not be sold. As a result, we review the probability of the sale of the housing unit when evaluating the extension of a loan. We also review the borrower’s creditworthiness and the suitability of the borrower’s proposed use of funds. Furthermore, we take a lien on the land on which the housing unit is to be constructed as collateral. If the collateral is not sufficient to cover the loan, we also take a guarantee from the Housing Finance Credit Guarantee Fund as security.
General Purpose Household Loans
Our general purpose household loans may be secured by real estate (other than homes), deposits or securities. As of December 31, 2011, approximately (Won)18,963 billion, or 58.0% of our general purpose household loans were unsecured, although some of these loans were guaranteed by a third party. Overdraft loans are primarily unsecured and typically have a maturity between one and three years, and the amount of such loans has been steadily declining. As of December 31, 2011, this amount was approximately (Won)3 billion.
Pricing. The interest rates on our general purpose household loans are either a periodic floating rate (which is based on a base rate determined for three-month, six-month or twelve-month periods derived internally, which reflects our internal cost of funding, further adjusted to account for the borrower’s credit score and our opportunity cost) or a fixed rate that reflects those same costs and expenses, but taking into account interest rate risks. In 2010, we began using the “Cost of Fund Index” (or COFIX) benchmark rate, as announced by the Korea Federation of Banks, as the base rate for our general purpose household loans with periodic floating rates in place of the benchmark certificate of deposit rate that we had traditionally used for such purpose.
Our interest rates also incorporate a margin based on, among other things, the type of collateral (if any), priority with respect to any security, our target loan-to-value ratio and loan duration. We also can adjust the applicable rate based on current or expected profit contribution of the customer. At Woori Bank, lending rates are generally determined by our CREPIA system, and we began to determine lending rates at Kyongnam Bank and Kwangju Bank using similar credit evaluation systems from January 2008. The applicable interest rate is determined at the time of the loan. We also charge a termination fee in the event a borrower repays the loan prior to maturity. As of December 31, 2011, approximately 82.8% of our general purpose household loans had floating interest rates.
Mortgage and Home Equity Lending
We provide customers with a number of mortgage and home equity loan products that have flexible features, including terms, repayment schedules, amounts and eligibility for loans. The maximum term of our mortgage and home equity loans is typically 35 years for Woori Bank and Kwangju Bank and 30 years for Kyongnam Bank. Most of our mortgage and home equity loans have an interest-only payment period of five years or less. With respect to these loans, we determine the eligibility of borrowers based on the borrower’s personal information, transaction history and credit history using Woori Bank’s CREPIA system and similar systems used by Kyongnam Bank and Kwangju Bank. See “Item 11. Quantitative and Qualitative Disclosures about Market Risk—Credit Risk Management—Credit Evaluation and Approval.” The eligibility of a borrower that is participating in a housing lottery will depend on proof that it has paid a deposit or can obtain a guarantee from a Korean government-related housing fund. We receive fee income related to the origination of loans, including fees relating to loan processing and collateral evaluation.
As of December 31, 2011, approximately 93.4% of our mortgage and home equity loans were secured by residential or other property, 5.2% of our mortgage and home equity loans were guaranteed by Korean government-related housing funds and 4.9% of our mortgage and home equity loans, contrary to general
53
Table of Contents
practices in the United States, were unsecured (although the use of proceeds from mortgage and home equity loans is restricted for the purpose of financing home purchases and some of these loans were guaranteed by a third party). One reason that a portion of our mortgage and home equity loans are unsecured is that we, along with other Korean banks, provide advance loans to borrowers for the down payment of new housing (particularly apartments) that is in the process of being built. Once construction is completed, which may take several years, these mortgage and home equity loans become secured by the new housing purchased by these borrowers. As of December 31, 2011, we had issued unsecured construction loans relating to housing where construction was not completed in the amount of (Won)1,972 billion. For the year ended December 31, 2011, the average initial loan-to-value ratio of our mortgage loans and home equity loans was approximately 54.4% and 50.3%, respectively, compared to 53.4% and 50.8% for the year ended December 31, 2010. The average loan-to-value ratio of our mortgage loans and home equity loans as of December 31, 2011 was approximately 49.1% and 48.2%, respectively, compared to 48.0% and 48.4% as of December 31, 2010.
Pricing. The interest rates for our mortgage and home equity loans are determined on essentially the same basis as our general purpose household loans, except that for mortgage and home equity loans we place significantly greater weight on the value of any collateral that is being provided to secure the loan. The base rate we use in determining the interest rate for our mortgage and home equity loans is identical to the base rate we use to determine pricing for our general purpose household loans. As of December 31, 2011, approximately 89.2% of our outstanding mortgage and home equity loans had floating interest rates.
Private Banking Operations
Our private banking operations within Woori Bank, Kyongnam Bank and Kwangju Bank aim to service our high net worth and mass affluent retail customers who individually maintain a deposit balance of at least (Won)50 million with us. As of December 31, 2011, we had over 140,000 customers who qualified for private banking services, representing 0.6% of our total retail customer base. Of our total retail customer deposits of (Won)76,360 billion as of December 31, 2011, high net worth and mass affluent customers accounted for 43.7%.
Through our private bankers, we provide financial and real estate advisory services to our high net worth and mass affluent customers. We also market differentiated investment and banking products and services to these segments, including beneficiary certificates, overseas mutual fund products, specialized bank accounts and credit cards. In addition, we have developed a customer loyalty program for our private banking customers that provides preferential rate and fee benefits and awards. We have also segmented our private banking operations by introducing exclusive private client services for high net worth customers who individually maintain a deposit balance of at least (Won)100 million in the case of Woori Bank and (Won)50 million in the case of Kyongnam Bank and Kwangju Bank. We believe that our private banking operations will allow us to increase our revenues from our existing high net worth and mass affluent customers, as well as attract new customers in these segments.
Woori Bank has 359 branches that offer private banking services. These branches are staffed by 356 private bankers and almost all of the branches are located in metropolitan areas, including Seoul. Kyongnam Bank and Kwangju Bank operate one and two dedicated private banking centers, respectively. Both banks also offer private banking services through a select number of branches. As of December 31, 2011, 66 private bankers were dispersed over 65 Kyongnam Bank branches and 14 private bankers were dispersed over 14 Kwangju Bank branches that provided private banking services.
We operate four “financial products department stores” in Seoul, which function as regular branches and through which we offer and market a variety of financial products and services, including credit cards, foreign currency products, bonds, stocks and insurance policies. These “department stores” employ specialists in the areas of tax, real estate and asset management, and are dedicated to offering comprehensive wealth management consulting services for high net worth customers. In addition, Woori Bank operates an advisory center in Seoul for its private banking clients, which employs 17 specialists advising on matters of law, tax, real estate, risk assessment and investments.
54
Table of Contents
Deposit-Taking Activities
As of December 31, 2011, we were one of the largest deposit holders on a combined basis (not adjusted for overlap) among Korean banks, in large part due to our nation-wide branch network. The balance of our deposits from retail customers was (Won)60,948 billion and (Won)66,285 billion as of December 31, 2010 and 2011, respectively, which constituted 32.9% and 33.8%, respectively, of the balance of our total deposits.
We offer diversified deposit products that target different customers with different needs and characteristics. These deposit products fall into five general categories:
| • | demand deposits, which either do not accrue interest or accrue interest at a lower rate than time, installment or savings deposits. The customer may deposit and withdraw funds at any time and, if the deposits are interest-bearing, they accrue interest at a fixed or variable rate depending on the period and/or amount of deposit; |
| • | time deposits, which generally require a customer to maintain a deposit for a fixed term during which interest accrues at a fixed or floating rate. Early withdrawals require penalty payments. The term for time deposits typically ranges from one month to five years; |
| • | savings deposits, which allow the customer to deposit and withdraw funds at any time and accrue interest at a fixed rate set by us depending upon the period and amount of deposit; |
| • | installment deposits, which generally require the customer to make periodic deposits of a fixed amount over a fixed term during which interest accrues at a fixed rate. Early withdrawals require penalty payment. The term for installment deposits range from six months to six years; and |
| • | certificates of deposit, the maturities of which range from 30 days to five years, with a required minimum deposit of (Won)5 million. Interest rates on certificates of deposit vary with the length of deposit and prevailing market rates. Certificates of deposit may be sold at face value or at a discount with the face amount payable at maturity. |
The following table sets forth the percentage of our total retail and corporate deposits represented by each deposit product category as of December 31, 2011:
| Demand Deposits |
Time Deposits |
Savings Deposits |
Installment Deposits |
Certificates of Deposit | ||||
| 24.9% |
64.2% | 9.9% | 0.1% | 0.9% |
We offer varying interest rates on our deposit products depending on market interest rates as reflected in average funding costs, the rate of return on our interest-earning assets and the interest rates offered by other commercial banks. Generally, the interest payable is the highest on installment deposits and decreases with certificate of deposit accounts and time deposits and savings deposit accounts receiving relatively less interest, and demand deposits accruing little or no interest.
We also offer deposits in foreign currencies and various specialized deposits products, including:
| • | Apartment application time deposits, which are special purpose time deposit accounts providing the holder with a preferential right to subscribe for new private apartment units under the Housing Act. This law sets forth various measures supporting the purchase of houses and the supply of such houses by construction companies. These products accrue interest at a fixed rate for one year, and at an adjustable rate after one year. Deposit amounts per account range from (Won)2 million to (Won)15 million depending on the size and location of the dwelling unit. These deposit products target high and middle income households. |
| • | Apartment application installment savings deposits, which are monthly installment savings programs providing the holder with a preferential right to subscribe for new private apartment units under the Housing Act. These deposits require monthly installments of (Won)50,000 to (Won)500,000, have maturities of between three and five years and accrue interest at fixed or variable rates depending on the term. |
| • | Apartment application savings account deposits, which are monthly installment savings programs providing the holder with a preferential right to subscribe for new national housing units constructed |
55
Table of Contents
| under the Housing Act or mid-sized, privately constructed national housing units. These deposits are available only to heads of household who do not own a home. These deposits require monthly installments of (Won)20,000 to (Won)100,000, terminate when the holder is selected as a subscriber for a housing unit and accrue interest at fixed rates. |
| • | Apartment application comprehensive deposits, which are monthly installment comprehensive savings programs providing the holder with a preferential right to subscribe for new national housing units constructed under the Housing Act or privately constructed housing units. These deposits require monthly installments of (Won)20,000 to (Won)500,000, terminate when the holder is selected as a subscriber for a housing unit and accrue interest at fixed rates depending on the term. These deposit products target all segments of the population. |
The Monetary Policy Committee of the Bank of Korea imposes a reserve requirement on Won currency deposits of commercial banks based generally on the type of deposit instrument. The reserve requirement is currently up to 7%. See “—Supervision and Regulation—Principal Regulations Applicable to Banks—Liquidity.” Ongoing regulatory reforms have removed all controls on lending rates and deposit rates (except for the prohibition on interest payments on current account deposits).
The Depositor Protection Act provides for a deposit insurance system where the KDIC guarantees to depositors the repayment of their eligible bank deposits. The deposit insurance system insures up to a total of (Won)50 million per depositor per bank. See “—Supervision and Regulation—Principal Regulations Applicable to Banks—Deposit Insurance System.” We pay a quarterly premium of 0.02% of our average deposits and a quarterly special contribution of 0.025% of our average deposits, in each case for the relevant quarter. For the year ended December 31, 2011, our banking subsidiaries paid an aggregate of (Won)246 billion of such premiums and contributions.
Branch Network and Other Distribution Channels
Our commercial banking subsidiaries had a total of 1,245 branches in Korea as of December 31, 2011, which on a combined basis was one of the most extensive networks of branches among Korean commercial banks. Recently, demand in Korea for mutual funds and other asset management products as well as bancassurance products has been rising. These products require an extensive sales force and customer interaction to sell, further emphasizing the need for a large branch network. As a result, an extensive branch network is important to attracting and maintaining retail customers, as they generally conduct a significant portion of their financial transactions through bank branches. We believe that our extensive branch network in Korea helps us to maintain our retail customer base, which in turn provides us with a stable and relatively low cost funding source.
The following table presents the geographical distribution of our branch network in Korea as of December 31, 2011:
| Woori Bank | Kyongnam Bank |
Kwangju Bank | Total | |||||||||||||||||||||||||||||
| Number | % of Total |
Number | % of Total |
Number | % of Total |
Number | % of Total |
|||||||||||||||||||||||||
| Area |
||||||||||||||||||||||||||||||||
| Seoul |
454 | 48.2 | % | 3 | 1.9 | % | 6 | 4.1 | % | 463 | 37.2 | % | ||||||||||||||||||||
| Six largest cities (other than Seoul) |
163 | 17.3 | % | 52 | 33.3 | % | 93 | 63.3 | % | 308 | 24.7 | % | ||||||||||||||||||||
| Other |
325 | 34.5 | % | 101 | 64.7 | % | 48 | 32.7 | % | 474 | 38.1 | % | ||||||||||||||||||||
|
|
|
|
|
|
|
|
|
|
|
|
|
|
|
|
|
|||||||||||||||||
| Total |
942 | 100.0 | % | 156 | 100.0 | % | 147 | 100.0 | % | 1,245 | 100.0 | % | ||||||||||||||||||||
|
|
|
|
|
|
|
|
|
|
|
|
|
|
|
|
|
|||||||||||||||||
Our Woori Bank branches are concentrated in the Seoul metropolitan area, while our Kyongnam Bank and Kwangju Bank branches are located mostly in the southeastern and southwestern regions of Korea, respectively, providing extensive overall nationwide coverage.
56
Table of Contents
In order to maximize access to our products and services, we have established an extensive network of ATMs and cash dispensers, which are located in branches as well as unmanned outlets. The following table presents the number of ATMs and cash dispensers we had as of December 31, 2011:
| ATMs | Cash Dispensers |
|||||||
| Woori Bank |
6,570 | 484 | ||||||
| Kyongnam Bank |
423 | 648 | ||||||
| Kwangju Bank |
481 | 335 | ||||||
|
|
|
|
|
|||||
| Total |
7,474 | 1,467 | ||||||
|
|
|
|
|
|||||
We also actively promote the use of alternative service delivery channels in order to provide convenient service to customers. We also benefit from customers’ increasing use of these outlets, as they allow us to maximize the marketing and sales functions at the branch level, reduce employee costs and improve profitability. The following tables set forth information, for the periods indicated, relating to the number of transactions and the fee revenue of our alternative service delivery channels with respect to Woori Bank, Kyongnam Bank and Kwangju Bank.
57
Table of Contents
Woori Bank
| For the year ended December 31, | ||||||||
| 2010 | 2011 | |||||||
|
ATMs(1): |
||||||||
| Number of transactions (millions) |
429 | 433 | ||||||
| Fee income (billions of Won) |
(Won) | 46 | (Won) | 55 | ||||
| Telephone banking: |
||||||||
| Number of users |
6,103,894 | 6,265,585 | ||||||
| Number of transactions (millions) |
166 | 154 | ||||||
| Fee income (billions of Won) |
(Won) | 4 | (Won) | 4 | ||||
| Internet banking: |
||||||||
| Number of users |
9,408,592 | 10,284,922 | ||||||
| Number of transactions (millions) |
3,945 | 4,550 | ||||||
| Fee income (billions of Won) |
(Won) | 107 | (Won) | 117 | ||||
Kyongnam Bank
| For the year ended December 31, | ||||||||
| 2010 | 2011 | |||||||
|
ATMs(1): |
||||||||
| Number of transactions (millions) |
70 | 69 | ||||||
| Fee income (billions of Won) |
(Won) | 8 | (Won) | 8 | ||||
| Telephone banking: |
||||||||
| Number of users |
911,379 | 937,077 | ||||||
| Number of transactions (millions) |
27 | 27 | ||||||
| Fee income (billions of Won) |
(Won) | 1 | (Won) | 1 | ||||
| Internet banking: |
||||||||
| Number of users |
806,635 | 936,224 | ||||||
| Number of transactions (millions) |
137 | 144 | ||||||
| Fee income (billions of Won) |
(Won) | 1 | (Won) | 1 | ||||
Kwangju Bank
| For the year ended December 31, | ||||||||
| 2010 | 2011 | |||||||
|
ATMs(1): |
||||||||
| Number of transactions (millions) |
91 | 89 | ||||||
| Fee income (billions of Won) |
(Won) | 6 | (Won) | 6 | ||||
| Telephone banking: |
||||||||
| Number of users |
683,170 | 715,431 | ||||||
| Number of transactions (millions) |
26 | 30 | ||||||
| Fee income (billions of Won) |
(Won) | 1 | (Won) | 1 | ||||
| Internet banking: |
||||||||
| Number of users |
714,426 | 770,232 | ||||||
| Number of transactions (millions) |
142 | 145 | ||||||
| Fee income (billions of Won) |
(Won) | 1 | (Won) | 1 | ||||
| (1) | Includes cash dispensers. |
Most of our electronic banking transactions do not generate fee income as many of those transactions are free of charge, such as balance enquiries, consultations with customer representatives or transfers of money with our banking subsidiaries. This is particularly true for telephone banking services, where a majority of the transactions are balance inquiries or consultations with customer representatives, although other services such as money transfers are also available.
58
Table of Contents
Our automated telephone banking systems offer a variety of services, including inter-account fund transfers, balance and transaction inquiries and customer service enquiries. We operate three call centers, consisting of one call center operated by each of Woori Bank, Kyongnam Bank and Kwangju Bank, that handle calls from customers, engage in telemarketing and assist in our collection efforts.
Our Internet banking services include balance and transaction inquiries, money transfers, loan applications, bill payment and foreign exchange transactions. We seek to maintain and increase our Internet banking customer base by focusing largely on our younger customers and those that are able to access the Internet easily (such as office workers) as well as by developing additional Internet-based financial services and products. We also develop new products to target different types of customers with respect to our Internet banking services, and have developed a service that enables private banking customers to access their accounts on a website that provides specialized investment advice. We also offer escrow services and identification authentication services, such as electronic “fingerprinting,” for Internet transactions.
We also provide mobile banking services to our customers, which is available to all our Internet-registered users. These services allow our customers to complete selected banking transactions through major Korean telecommunications networks using their cellular phones or other mobile devices. In April 2010, our banking subsidiaries launched new “smart banking” services which enable users of so-called “smart phones” to access a broad range of banking and credit card services through their mobile phones. Our electronic bill presentation and payment system provides our customers with the ability to pay taxes, maintenance fees and other public fees electronically.
We also offer our “Win-CMS” service to corporate customers of Woori Bank, which provides an integrated electronic cash management system and in-house banking platform for such customers.
Credit Cards
We offer credit card products and services to consumers and corporate customers in Korea. In March 2004, we merged our credit card subsidiary, Woori Credit Card, with Woori Bank. As of December 31, 2011, Woori Bank’s market share based on transaction volume was approximately 7.3%, which ranked Woori Bank as the sixth largest credit card issuer in Korea, according to BC Research, which is a quarterly report issued by BC Card.
Our credit card operations benefit from our ownership of a 9.6% equity stake in BC Card. BC Card is co-owned by KT Capital, which is a financial subsidiary of KT Corporation, one of Korea’s largest telecommunications companies, as well as a private equity fund and other Korean financial institutions, and operates the largest merchant payment network in Korea as measured by transaction volume. This ownership stake allows us to outsource production and delivery of new credit cards, the preparation of monthly statements, management of merchants and other ancillary services to BC Card for our Woori Bank credit card and Kyongnam Bank BC Card operations. In October 2011, we sold a 20% equity stake which we previously owned in BC Card to KT Capital for a price of (Won)137 billion.
Products and Services
We currently have the following principal brands of credit cards outstanding:
| • | a “Woori” brand offered by Woori Bank; |
| • | a “BC Card” brand offered by Kyongnam Bank; |
| • | a “BC Card” brand previously offered by Woori Bank; and |
| • | a “Visa” brand offered by Kwangju Bank. |
We issue “Visa” brand cards under a non-exclusive license agreement with Visa International Service Association and also issue “MasterCard” and “JCB” brand cards under a non-exclusive, co-branding agreement with BC Card.
59
Table of Contents
We offer a number of different services to holders of our credit cards. Generally, these services include:
| • | credit purchase services, which allow cardholders to purchase merchandise or services on credit and repay such credit on a lump-sum or installment basis; |
| • | cash advance services from ATMs and bank branches; and |
| • | credit card loans, which are loans that cardholders can obtain based on streamlined application procedures. |
Unlike in the United States and many other countries, where most credit cards are revolving cards that allow outstanding balances to be rolled over from month to month so long as a required minimum percentage is repaid, cardholders in Korea are generally required to pay for their non-installment purchases as well as cash advances within approximately 15 to 58 days of purchase or advance, depending on their payment cycle.
60
Table of Contents
The following tables set forth certain data relating to our credit card operations as of the dates or for the period indicated:
| As of or for the year ended December 31, | ||||||||||||||||||||||||
| 2010 | 2011 | |||||||||||||||||||||||
| Woori Card(1) |
Kyongnam Bank BC Card |
Kwangju Bank Visa Card |
Woori Card(1) |
Kyongnam Bank BC Card |
Kwangju Bank Visa Card |
|||||||||||||||||||
| (in billions of Won, unless indicated otherwise) | ||||||||||||||||||||||||
| Number of credit card holders (at year end) (thousands of holders) |
||||||||||||||||||||||||
| General accounts |
10,707 | 986 | 803 | 11,374 | 1,047 | 845 | ||||||||||||||||||
| Corporate accounts |
342 | 54 | 74 | 393 | 64 | 87 | ||||||||||||||||||
|
|
|
|
|
|
|
|
|
|
|
|
|
|||||||||||||
| Total |
11,049 | 1,040 | 877 | 11,768 | 1,111 | 932 | ||||||||||||||||||
|
|
|
|
|
|
|
|
|
|
|
|
|
|||||||||||||
| Active ratio(2) |
57.00 | % | 46.96 | % | 55.87 | % | 56.97 | % | 46.35 | % | 54.25 | % | ||||||||||||
| Credit card interest and fees |
||||||||||||||||||||||||
| Installment and cash advance interest |
(Won) | 276 | (Won) | 16 | (Won) | 3 | (Won) | 261 | (Won) | 11 | (Won) | 3 | ||||||||||||
| Annual membership fees |
10 | 1 | — | 11 | 1 | — | ||||||||||||||||||
| Merchant fees |
618 | 42 | 44 | 630 | 41 | 45 | ||||||||||||||||||
| Other fees |
117 | 5 | 2 | 129 | 5 | 2 | ||||||||||||||||||
|
|
|
|
|
|
|
|
|
|
|
|
|
|||||||||||||
| Total |
(Won) | 1,021 | (Won) | 64 | (Won) | 49 | (Won) | 1,031 | (Won) | 58 | (Won) | 50 | ||||||||||||
|
|
|
|
|
|
|
|
|
|
|
|
|
|||||||||||||
| Charge volumes |
||||||||||||||||||||||||
| General purchase |
(Won) | 25,697 | (Won) | 1,785 | (Won) | 1,619 | (Won) | 29,429 | (Won) | 2,009 | (Won) | 1,909 | ||||||||||||
| Installment purchase |
4,892 | 435 | 227 | 4,786 | 354 | 243 | ||||||||||||||||||
| Cash advance |
6,084 | 212 | 142 | 5,936 | 198 | 124 | ||||||||||||||||||
| Card loan |
568 | 7 | — | 696 | 12 | 3 | ||||||||||||||||||
|
|
|
|
|
|
|
|
|
|
|
|
|
|||||||||||||
| Total |
(Won) | 37,241 | (Won) | 2,439 | 1,988 | (Won) | 40,847 | (Won) | 2,573 | (Won) | 2,279 | |||||||||||||
|
|
|
|
|
|
|
|
|
|
|
|
|
|||||||||||||
| Outstanding balances (at year end) |
||||||||||||||||||||||||
| General purchase |
(Won) | 1,827 | (Won) | 138 | (Won) | 107 | (Won) | 2,019 | (Won) | 117 | (Won) | 119 | ||||||||||||
| Installment purchase |
969 | 86 | 36 | 1,014 | 72 | 45 | ||||||||||||||||||
| Cash advance |
790 | 28 | 13 | 776 | 27 | 12 | ||||||||||||||||||
| Card loan |
358 | 5 | — | 383 | 6 | 2 | ||||||||||||||||||
|
|
|
|
|
|
|
|
|
|
|
|
|
|||||||||||||
| Total |
(Won) | 3,944 | (Won) | 257 | (Won) | 156 | (Won) | 4,192 | (Won) | 222 | (Won) | 178 | ||||||||||||
|
|
|
|
|
|
|
|
|
|
|
|
|
|||||||||||||
| Average outstanding balances |
||||||||||||||||||||||||
| General purchase |
(Won) | 1,906 | (Won) | 153 | (Won) | 112 | (Won) | 2,091 | (Won) | 145 | (Won) | 129 | ||||||||||||
| Installment purchase |
1,114 | 114 | 48 | 1,062 | 76 | 48 | ||||||||||||||||||
| Cash advance |
827 | 29 | 15 | 805 | 27 | 13 | ||||||||||||||||||
| Card loan |
285 | 5 | — | 385 | 5 | 1 | ||||||||||||||||||
|
|
|
|
|
|
|
|
|
|
|
|
|
|||||||||||||
| Total |
(Won) | 4,132 | (Won) | 301 | (Won) | 175 | (Won) | 4,343 | (Won) | 253 | (Won) | 191 | ||||||||||||
|
|
|
|
|
|
|
|
|
|
|
|
|
|||||||||||||
| Delinquency ratios(3) |
||||||||||||||||||||||||
| Less than 1 month |
2.46 | 0.43 | 0.75 | 3.34 | 0.60 | 0.75 | ||||||||||||||||||
| From 1 month to 3 months |
1.20 | 0.67 | 0.61 | 1.10 | 0.69 | 0.57 | ||||||||||||||||||
| From 3 months to 6 months |
1.14 | 0.59 | 0.29 | 1.05 | 0.79 | 0.28 | ||||||||||||||||||
| Over 6 months |
0.12 | 0.41 | 0.24 | 0.03 | 0.42 | 0.13 | ||||||||||||||||||
|
|
|
|
|
|
|
|
|
|
|
|
|
|||||||||||||
| Total |
4.92 | % | 2.10 | % | 1.89 | % | 5.51 | % | 2.50 | % | 1.72 | % | ||||||||||||
|
|
|
|
|
|
|
|
|
|
|
|
|
|||||||||||||
| Non-performing loan ratio(4) |
1.16 | % | 1.26 | % | 0.95 | % | 1.41 | % | 2.37 | % | 0.65 | % | ||||||||||||
| Charge-offs (gross) |
(Won) | 131 | (Won) | 5 | (Won) | 4 | (Won) | 133 | (Won) | 5 | (Won) | 3 | ||||||||||||
| Recoveries |
61 | 3 | 1 | 31 | 1 | 0 | ||||||||||||||||||
|
|
|
|
|
|
|
|
|
|
|
|
|
|||||||||||||
| Net charge-offs |
(Won) | 70 | (Won) | 2 | (Won) | 3 | (Won) | 102 | (Won) | 4 | (Won) | 3 | ||||||||||||
|
|
|
|
|
|
|
|
|
|
|
|
|
|||||||||||||
| Gross charge-off ratio(5) |
3.17 | % | 1.66 | % | 2.29 | % | 3.07 | % | 2.08 | % | 1.69 | % | ||||||||||||
| Net charge-off ratio(6) |
1.48 | % | 1.00 | % | 0.57 | % | 0.72 | % | 0.59 | % | 0.11 | % | ||||||||||||
61
Table of Contents
| (1) | Consists of credit cards issued by Woori Credit Card, Woori Bank and BC Cards and Visa Cards issued through the BC Card consortium. |
| (2) | Represents the ratio of accounts used at least once within the last 12 months to total accounts as of the end of the relevant year. |
| (3) | Our delinquency ratios may not fully reflect all delinquent amounts relating to our outstanding balances since a certain portion of delinquent credit card balances (defined as balances one day or more past due) were restructured into loans and were not treated as being delinquent at the time of conversion or for a period of time thereafter. Including all restructured loans, outstanding balances overdue by 30 days or more accounted for 3.1% of our credit card receivables as of December 31, 2011. |
| (4) | Represents the ratio of balances that are more than three months overdue to total outstanding balances as of the end of the relevant year. These ratios do not include the following amounts of previously delinquent credit card balances restructured into loans that were classified as normal or precautionary as of December 31, 2010 and 2011: |
| As of December 31, | ||||||||
| 2010 | 2011 | |||||||
| (in billions of Won) | ||||||||
| Restructured loans |
(Won) | 34 | (Won) | 43 | ||||
| (5) | Represents the ratio of gross charge-offs for the year to average outstanding balances for the year. Under IFRS, our charge-off policy is to charge off balances which are more than six months past due (including previously delinquent credit card balances restructured into loans that are more than six months overdue from the point at which the relevant balances were so restructured), except for those balances with a reasonable probability of recovery. |
| (6) | Represents the ratio of net charge-offs for the year to average outstanding balances for the year. |
We offer a diverse range of credit card products within our various brands. Factors that determine which type of card a particular cardholder may receive include net worth, age, location, income level and the particular programs or services that may be associated with a particular card. Targeted products that we offer include:
| • | cards that offer additional benefits, such as frequent flyer miles and award program points that can be redeemed for services, products or cash; |
| • | gold cards, platinum cards and other preferential members’ cards that have higher credit limits and provide additional services; |
| • | corporate and affinity cards that are issued to employees or members of particular companies or organizations; and |
| • | revolving credit cards and cards that offer travel services and insurance. |
In recent years, credit card issuers in Korea have agreed with selected cardholders to restructure their delinquent credit card account balances as loans that have more gradual repayment terms, in order to retain fundamentally sound customers who are experiencing temporary financial difficulties and to increase the likelihood of eventual recovery on those balances. In line with industry practice, we have restructured a portion of our delinquent credit card account balances as loans. The general qualifications to restructure delinquent credit card balances as loans are that the delinquent amount be more than one month overdue and in excess of (Won)1 million. The terms of the restructured loans usually require the payment of approximately 10% to 20% of the outstanding balance as a down payment and that they be guaranteed by a third party and carry higher interest rates than prevailing market rates. These loans are usually required to be repaid by the borrower in installments over terms ranging from three months to 60 months. As of December 31, 2011, the total amount of our restructured loans was (Won)51 billion (which also included revolving loans and installment loans). Because restructured loans are not initially recorded as being delinquent, our delinquency ratios do not fully reflect all delinquent amounts relating to our outstanding credit card balances.
Payments and Charges
Revenues from our credit card operations consist principally of cash advance charges, merchant fees, interest income from credit card loans, interest on late and deferred payments, and annual membership fees paid by cardholders.
Each cardholder is allocated an aggregate credit limit in respect of all cards issued under his or her account and each month. We advise each cardholder of the credit limit relating to the cards in his or her monthly billing statement. Credit limits in respect of card loans are established separately. We conduct ongoing monitoring of all cardholders and accounts, and may reduce the credit limit or cancel an existing cardholder’s card based on
62
Table of Contents
current economic conditions, receipt of new negative credit data from third party sources or the cardholder’s score under the credit risk management systems we use to monitor their behavior, even if the cardholder continues to make timely payments in respect of his or her cards. We consider an account delinquent if the payment due is not received on the first monthly payment date on which such payment was due, and late fees are immediately applied. Late fee charges and computation of the delinquency period are based on each outstanding unpaid transaction or installment, as applicable. See “Item 11. Quantitative and Qualitative Disclosures about Market Risk—Credit Risk Management—Credit Review and Monitoring.”
Payments on amounts outstanding on our credit cards must be made (at the cardholder’s election at the time of purchase) either in full on each monthly payment date, in the case of lump-sum purchases, or in equal monthly installments over a fixed term from two months to 36 months, in the case of installment purchases. Cardholders may prepay installment purchases at any time without penalty. Payment for cash advances must be made on a lump sum basis. Payments for card loans must be made on an equal principal installment basis over a fixed term from three months up to a maximum of 36 months, up to a maximum loan amount of (Won)20 million.
No interest is charged on lump-sum purchases that are paid in full by the monthly payment date. For installment purchases, we charge a fixed rate of interest on the outstanding balance of the transaction amount, based on the installment period selected at the time of purchase. For a new cardholder, we currently apply an interest rate between approximately 9.9% and 19.5% per annum as determined by the cardholder’s application system score. See “Item 11. Quantitative and Qualitative Disclosures about Market Risk—Credit Risk Management—Credit Evaluation and Approval—Credit Card Approval Process” and “—Credit Review and Monitoring—Credit Card Review and Monitoring.”
For cash advances, finance charges start accruing immediately following the cash withdrawal. We currently charge a periodic finance charge on the outstanding balance of cash advance of approximately 6.0% to 28.8% per annum. The periodic finance charge assessed on such balances is calculated by multiplying the daily installment balances for each day during the billing cycle by the applicable periodic finance charge rate, and aggregating the results for each day in the billing period. In addition to finance charges, cardholders using cash advance networks operated by companies that are not financial institutions (such as Hannet and NICE) are charged a minimum commission of (Won)600 and a maximum of (Won)1,200 per withdrawal.
We also generally charge a basic annual membership fee of (Won)1,000 to (Won)15,000 for regular and gold cards and (Won)10,000 to (Won)1,000,000 for platinum cards. The determination of the annual fee is based on various factors including the type of card, and whether affiliation options are selected by the cardholder. For certain cards, such as the Dadungyi Happiness Card and Woori Children Love Card, we will waive membership fees if customers charge above a certain amount.
Commencing in July 2006, we outsourced the management of merchants to BC Card. We charge merchant fees to merchants for processing transactions. Merchant fees vary depending on the type of merchant and the total transaction amounts generated by the merchant. As of December 31, 2011, we charged merchants an average of 2.05% of their respective total transaction amounts, in the case of Woori Bank, and 2.20% and 1.95%, respectively, in the case of Kyongnam Bank and Kwangju Bank. In addition to merchant fees, we receive nominal interchange fees for international card transactions.
Capital Markets Activities
We engage in capital markets activities for our own account and for our customers. Our capital markets activities include securities investment and trading, derivatives trading, asset securitization services, investment banking and securities brokerage.
We currently own a 37.9% voting interest in Woori Investment & Securities, which is a consolidated subsidiary under IFRS and conducts a significant portion of our capital markets activities. As of December 31, 2011, Woori Investment & Securities had consolidated total assets of (Won)21,535 billion, consolidated total liabilities of (Won)17,862 billion and consolidated total owners’ equity of (Won)3,673 billion. For the year ended December 31, 2011, Woori Investment & Securities generated consolidated revenues of (Won)3,911 billion and consolidated net income of (Won)198 billion.
63
Table of Contents
Securities Investment and Trading
Through Woori Bank and Woori Investment & Securities and, to a lesser extent, Kyongnam Bank and Kwangju Bank, we invest in and trade securities for our own account, in order to maintain adequate sources of liquidity and to generate interest and dividend income and capital gains. As of December 31, 2011, our investment portfolio, which consists of held-to-maturity financial assets and available-for-sale financial assets, and our trading portfolio, which consists of financial assets held for trading and financial assets designated at fair value through profit or loss, had a combined total book value of (Won)60,590 billion and represented 19.4% of our total assets.
Our trading and investment portfolios consist primarily of Korean treasury securities and debt securities issued by Korean government agencies, including the KDIC, local governments or government-invested enterprises, and debt securities issued by financial institutions. As of December 31, 2011, we held debt securities with a total book value of (Won)48,114 billion, of which:
| • | held-to-maturity debt securities accounted for (Won)20,036 billion, or 41.6%; |
| • | available-for-sale debt securities accounted for (Won)12,912 billion, or 26.8%; |
| • | debt securities held for trading accounted for (Won)14,756 billion, or 30.7%; and |
| • | debt securities designated at fair value through profit or loss accounted for (Won)410 billion, or 0.9%. |
Of these amounts, as of December 31, 2011, debt securities issued by the Korean government and government agencies amounted to (Won)7,235 billion, or 36.1%, of our held-to-maturity debt securities, (Won)2,787 billion, or 21.6%, of our available-for-sale debt securities, and (Won)1,194 billion, or 8.1%, of our trading debt securities.
From time to time, we also purchase and sell equity securities for our securities portfolios. Our equity securities consist primarily of equities listed on the KRX KOSPI Market or the KRX KOSDAQ Market. As of December 31, 2011:
| • | equity securities in our available-for-sale portfolio had a book value of (Won)2,752 billion, or 14.0%, of our available-for-sale securities portfolio; |
| • | equity securities held for trading accounted for (Won)608 billion, or 3.1% of our held-for-trading securities portfolio; and |
| • | equity securities designated at fair value through profit or loss accounted for (Won)12 billion, or 1.1% of our financial assets designated at fair value through profit or loss portfolio. |
Funds that are not used for lending activities are used for investment and liquidity management purposes, including investment and trading in securities. See “—Assets and Liabilities—Securities Investment Portfolio.”
64
Table of Contents
The following tables show, as of the dates indicated, the gross unrealized gains and losses within our investment portfolio and the amortized cost and fair value of the portfolio by type of investment financial asset:
| As of December 31, 2010 | ||||||||||||||||
| Amortized Cost |
Gross Unrealized Gain |
Gross Unrealized Loss |
Fair Value | |||||||||||||
| (in billions of Won) | ||||||||||||||||
| Available-for-sale financial assets: |
||||||||||||||||
| Debt securities |
||||||||||||||||
| Korean treasury and government agencies |
(Won) | 2,684 | (Won) | 37 | (Won) | (1 | ) | (Won) | 2,720 | |||||||
| Financial institutions |
5,877 | 21 | (1 | ) | 5,897 | |||||||||||
| Corporate |
2,671 | 20 | (1 | ) | 2,690 | |||||||||||
| Asset-backed securities |
737 | 12 | 0 | 749 | ||||||||||||
| Foreign currency bonds |
275 | 10 | (1 | ) | 284 | |||||||||||
|
|
|
|
|
|
|
|
|
|||||||||
| Subtotal |
12,244 | 100 | (4 | ) | 12,340 | |||||||||||
| Equity securities |
2,014 | 1,311 | (89 | ) | 3,236 | |||||||||||
| Beneficiary certificates(1) |
5,073 | 137 | (14 | ) | 5,196 | |||||||||||
| Others |
1,223 | 5 | (2 | ) | 1,226 | |||||||||||
|
|
|
|
|
|
|
|
|
|||||||||
| Total available-for-sale financial assets |
(Won) | 20,554 | (Won) | 1,553 | (Won) | (109 | ) | (Won) | 21,998 | |||||||
|
|
|
|
|
|
|
|
|
|||||||||
| Held-to-maturity financial assets: |
||||||||||||||||
| Debt securities |
||||||||||||||||
| Korean treasury and government agencies |
(Won) | 6,348 | (Won) | 135 | (Won) | (6 | ) | (Won) | 6,477 | |||||||
| Financial institutions |
7,832 | 57 | 0 | 7,889 | ||||||||||||
| Corporate |
5,491 | 79 | (3 | ) | 5,567 | |||||||||||
| Foreign currency bonds |
143 | — | — | 143 | ||||||||||||
| Securities loaned |
71 | 1 | 0 | 72 | ||||||||||||
|
|
|
|
|
|
|
|
|
|||||||||
| Total held-to-maturity financial assets |
(Won) | 19,885 | (Won) | 272 | (Won) | (9 | ) | (Won) | 20,148 | |||||||
|
|
|
|
|
|
|
|
|
|||||||||
| As of December 31, 2011 | ||||||||||||||||
| Amortized Cost |
Gross Unrealized Gain |
Gross Unrealized Loss |
Fair Value | |||||||||||||
| (in billions of Won) | ||||||||||||||||
| Available-for-sale financial assets: |
||||||||||||||||
| Debt securities |
||||||||||||||||
| Korean treasury and government agencies |
(Won) | 2,754 | (Won) | 34 | (Won) | (1 | ) | (Won) | 2,787 | |||||||
| Financial institutions |
5,199 | 12 | (1 | ) | 5,210 | |||||||||||
| Corporate |
4,151 | 33 | (1 | ) | 4,183 | |||||||||||
| Asset-backed securities |
610 | 0 | (11 | ) | 599 | |||||||||||
| Foreign currency bonds |
133 | 0 | 0 | 133 | ||||||||||||
|
|
|
|
|
|
|
|
|
|||||||||
| Subtotal |
12,847 | 79 | (14 | ) | 12,912 | |||||||||||
| Equity securities |
1,860 | 917 | (25 | ) | 2,752 | |||||||||||
| Beneficiary certificates(1) |
3,720 | 74 | (5 | ) | 3,789 | |||||||||||
| Others |
219 | 0 | 0 | 219 | ||||||||||||
|
|
|
|
|
|
|
|
|
|||||||||
| Total available-for-sale financial assets |
(Won) | 18,646 | (Won) | 1,070 | (Won) | (44 | ) | (Won) | 19,672 | |||||||
|
|
|
|
|
|
|
|
|
|||||||||
| Held-to-maturity financial assets: |
||||||||||||||||
| Debt securities |
||||||||||||||||
| Korean treasury and government agencies |
(Won) | 7,235 | (Won) | 198 | (Won) | (1 | ) | (Won) | 7,432 | |||||||
| Financial institutions |
5,859 | 22 | (1 | ) | 5,880 | |||||||||||
| Corporate |
6,828 | 74 | (4 | ) | 6,898 | |||||||||||
| Foreign currency bonds |
103 | — | — | 103 | ||||||||||||
| Securities loaned |
11 | 0 | 0 | 11 | ||||||||||||
|
|
|
|
|
|
|
|
|
|||||||||
| Total held-to-maturity financial assets |
(Won) | 20,036 | (Won) | 294 | (Won) | (6 | ) | (Won) | 20,324 | |||||||
|
|
|
|
|
|
|
|
|
|||||||||
65
Table of Contents
| (1) | Beneficiary certificates are instruments that are issued by and represent an ownership interest in an investment trust. Investment trusts, which operate like mutual funds in the United States, are managed by investment trust management companies and invest in portfolios of securities and/or other financial instruments, such as certificates of deposit. See “—Asset Management—Investment Trust Management.” Beneficiary certificates give the holder beneficial rights to both the relevant investment trust and the trust property in which the investment trust has invested. |
For a discussion of our risk management policies with respect to our securities trading activities, see “Item 11. Quantitative and Qualitative Disclosures about Market Risk—Market Risk Management—Market Risk Management for Trading Activities.”
Derivatives Trading
We offer derivatives products and engage in derivatives trading, mostly for our corporate customers, primarily through Woori Bank. Our trading volume was (Won)287,825 billion in 2010 and (Won)265,381 billion in 2011, respectively. Our aggregate net trading revenue (loss) from derivatives for the years ended December 31, 2010 and 2011 was (Won)82 billion and (Won)(160) billion, respectively.
We provide and trade a number of derivatives products principally through sales or brokerage accounts for our customers, including:
| • | interest rate swaps, options and futures, relating principally to Won interest rate risks; |
| • | index futures and options, relating to stock market fluctuations; |
| • | cross currency swaps, relating to foreign exchange risks, largely for Won against U.S. dollars; |
| • | foreign exchange forwards, swaps, options and futures, relating to foreign exchange risks; |
| • | commodity derivatives, which we provide to customers that wish to hedge their commodities exposure; and |
| • | credit derivatives, which we provide to financial institutions that wish to hedge existing credit exposures or take on credit exposure to generate revenue. |
The derivatives trading activities of our regional banking subsidiaries, Kyongnam Bank and Kwangju Bank, consist primarily of trading of foreign exchange forwards and other currency-related derivatives.
Our derivatives operations focus on addressing the needs of our corporate clients to hedge their risk exposure and on hedging our risk exposure resulting from such client contracts. We also engage in derivatives trading activities to hedge the interest rate and foreign currency risk exposure that arises from our own assets and liability positions. In addition, we engage in proprietary trading of derivatives, such as index options and futures within our regulated open position limits, and arbitrage through Woori Investment & Securities, for the purpose of generating capital gains.
The following shows the estimated fair value of derivatives we held or had issued for trading purposes as of the dates indicated:
| As of December 31, | ||||||||||||||||
| 2010 | 2011 | |||||||||||||||
| Estimated Fair Value of Assets |
Estimated Fair Value of Liabilities |
Estimated Fair Value of Assets |
Estimated Fair Value of Liabilities |
|||||||||||||
| (in billions of Won) | ||||||||||||||||
| Currency derivatives |
(Won) | 2,571 | (Won) | 1,845 | (Won) | 2,206 | (Won) | 1,690 | ||||||||
| Interest rate derivatives |
1,350 | 1,518 | 1,553 | 1,671 | ||||||||||||
| Equity derivatives |
195 | 247 | 96 | 517 | ||||||||||||
| Credit derivatives(1) |
16 | 4 | 18 | 22 | ||||||||||||
| Commodity derivatives |
30 | 36 | 28 | 26 | ||||||||||||
| Other derivatives |
— | — | — | — | ||||||||||||
|
|
|
|
|
|
|
|
|
|||||||||
| Total |
(Won) | 4,162 | (Won) | 3,650 | (Won) | 3,901 | (Won) | 3,926 | ||||||||
|
|
|
|
|
|
|
|
|
|||||||||
66
Table of Contents
| (1) | In connection with our credit derivatives outstanding, we accept credit exposure with respect to foreign currency-denominated corporate debt instruments held by counterparties by guaranteeing payments under such instruments, subject to our overall credit limits with respect to the applicable issuers. |
In August 2006, Woori Bank entered into an agreement with Macquarie Bank, an Australian investment bank, pursuant to which Macquarie Bank provides operational support and cooperation to Woori Bank in the area of commodity derivatives trading, in connection with Woori Bank’s plans to develop its commodities derivatives business. Following a one-year extension, the agreement is effective until August 2012.
For a discussion of our risk management policies with respect to our derivatives trading activities, see “Item 11. Quantitative and Qualitative Disclosures about Market Risk—Market Risk Management—Market Risk Management for Trading Activities.”
Asset Securitization Services
We are active in the Korean asset-backed securities market. Through Woori Bank and Woori Investment & Securities, we participate in asset securitization transactions in Korea by acting as arranger, trustee or liquidity provider. In 2011, we were involved in asset securitization transactions with an initial aggregate issue amount of (Won)4,876 billion and generated total fee income of approximately (Won)64 billion in connection with such transactions. The securities issued in asset securitization transactions are sold mainly to institutional investors buying through Korean securities firms.
Investment Banking
We engage in investment banking activities in Korea through Woori Bank and Woori Investment & Securities. Through Woori Investment & Securities, we underwrite equity and debt securities offerings in the Korean capital markets, either as lead manager or a member of an underwriting syndicate and provide mergers and acquisitions and financial advisory services. In 2011, Woori Investment & Securities generated investment banking revenue of approximately (Won)71 billion, consisting primarily of underwriting fee income from securities offerings. In addition, through Woori Bank, we provide project finance and financial advisory services, in the area of social overhead capital projects such as highway, port, power and water and sewage projects, as well as structured finance, leveraged buy-out financing, equity and venture financing and mergers and acquisitions advisory services. In 2011, Woori Bank generated investment banking revenue of approximately (Won)76 billion from gains on investment in foreign bonds and equity securities and fees from advisory and other services. Through Woori Investment Asia Pte., a wholly-owned subsidiary of Woori Investment & Securities, we also engage in investment banking activities in Southeast Asia.
We believe that significant opportunities exist for us to leverage our existing base of large corporate and small- and medium-sized banking customers to cross-sell investment banking services. We intend to expand our investment banking operations to take advantage of these opportunities, with a view to increasing our fee income and further diversifying our revenue base.
Securities Brokerage
We provide securities brokerage services through Woori Investment & Securities. Our activities include brokerage services relating to stocks, futures, options and debt instruments (such as commercial paper). As of December 31, 2011, Woori Investment & Securities had 118 branches. We also provide securities brokerage services through the Internet and through our home trading system software platforms. In 2011, Woori Investment & Securities generated fee income of approximately (Won)396 billion through its securities brokerage activities.
International Banking
Primarily through Woori Bank, we engage in various international banking activities, including foreign exchange services and dealing, import and export-related services, offshore lending, syndicated loans and foreign
67
Table of Contents
currency securities investment. These services are provided primarily to our domestic customers and overseas subsidiaries and affiliates of Korean corporations. We also raise foreign currency funding through our international banking operations. In addition, we provide commercial banking services to retail and corporate customers in select overseas markets.
The table below sets forth certain information regarding our foreign currency assets and borrowings:
| As of December 31, | ||||||||
| 2010 | 2011 | |||||||
| (in millions of US$) | ||||||||
| Total foreign currency assets |
US$ | 19,618 | US$ | 23,220 | ||||
| Foreign currency borrowings |
||||||||
| Call money |
1,085 | 1,058 | ||||||
| Long-term borrowings |
6,995 | 7,657 | ||||||
| Short-term borrowings |
6,247 | 7,438 | ||||||
|
|
|
|
|
|||||
| Total foreign currency borrowings |
US$ | 14,327 | US$ | 16,063 | ||||
|
|
|
|
|
|||||
The table below sets forth the overseas subsidiaries and branches of Woori Bank in operation as of December 31, 2011.
| Business Unit(1) |
Location | |
| Subsidiaries: |
||
| Woori America Bank |
United States | |
| P.T. Bank Woori Indonesia |
Indonesia | |
| Woori Global Markets Asia Limited |
China (Hong Kong) | |
| Woori Bank (China) Limited |
China | |
| Zao Woori Bank |
Russia | |
| Branches, Agencies and Representative Offices: |
||
| London Branch |
United Kingdom | |
| Tokyo Branch |
Japan | |
| Singapore Branch |
Singapore | |
| Hong Kong Branch |
China (Hong Kong) | |
| Shanghai Branch |
China | |
| Bahrain Branch |
Bahrain | |
| Dhaka Branch |
Bangladesh | |
| Hanoi Branch |
Vietnam | |
| Ho Chi Minh City Branch |
Vietnam | |
| Gaeseong Industrial Complex Branch |
North Korea | |
| New York Agency |
United States | |
| Los Angeles Branch |
United States | |
| New Delhi Representative Office |
India | |
| Kuala Lumpur Representative Office |
Malaysia | |
| Dubai Representative Office |
United Arab Emirates | |
| Sao Paulo Representative Office |
Brazil |
| (1) | Does not include subsidiaries and branches in liquidation or dissolution. |
The principal activities of the overseas branches and subsidiaries of Woori Bank are providing trade financing and local currency funding for Korean companies and Korean nationals operating in overseas markets as well as servicing local customers and providing foreign exchange services in conjunction with our headquarters. On a limited basis, such overseas branches and subsidiaries of Woori Bank also engage in the investment and trading of securities of foreign issuers.
68
Table of Contents
Woori America Bank currently operates 18 branches in New York, New Jersey, Maryland, Virginia, Pennsylvania and California and provides retail and corporate banking services targeted towards the Korean-American community. Woori America Bank had total assets of US$939 million as of December 31, 2011 and net profit of US$2 million in 2011.
In November 2007, Woori Bank established a local subsidiary in China, Woori Bank (China) Limited, which currently has branches (including one sub-branch) in Beijing, Shanghai, Shenzhen, Suzhou, Tianjin, Dalian and Chengdu. Woori Bank also established a local subsidiary in Russia, Zao Woori Bank, in January 2008 and it currently has one branch in St. Petersberg. In addition, we have in recent years entered into various memoranda of understanding and strategic alliances with local banks in overseas markets, including China and the U.S., in order to pursue business cooperation activities in such markets such as joint marketing efforts and information exchange.
Asset Management
Trust Management Services
Money Trusts. Through Woori Bank, Kyongnam Bank and Kwangju Bank, we offer money trust products to our customers and manage the funds they invest in money trusts. The money trusts we manage are generally trusts with a fixed life that allow investors to share in the investment performance of the trust in proportion to the amount of their investment in the trust. We principally offer the following types of money trust products:
| • | retirement trusts, which invest funds received from corporations or organizations and manage these funds until they are withdrawn to pay retirement funds to a corporation’s officers or employees or an organization’s members; |
| • | pension trusts, which invest funds received until pension benefits are due to be disbursed to a pension beneficiary; and |
| • | specified money trusts, which invest cash received as trust property at the direction of the trustors and, once the trust matures, disburse the principal and any gains to the trust beneficiaries. |
We also offer other types of money trusts that have a variety of differing characteristics with respect to, for example, maturities and tax treatment.
Under Korean law, the assets of our money trusts are segregated from our assets and are not available to satisfy the claims of our creditors. We are, however, permitted to maintain deposits of surplus funds generated by trust assets. Except for specified money trusts, we have investment discretion over all money trusts, which are pooled and managed jointly for each type of trust. Specified money trusts are established on behalf of individual customers, typically corporations, which direct our investment of trust assets.
We receive fees for our trust management services that are generally based upon a percentage, ranging between 0.01% and 2.0%, of the net asset value of the assets under management. We also receive penalty payments when customers terminate their trust deposit prior to the original contract maturity. Fees that we received for our trust management services (including those fees related to property trust management services, described below, but excluding those fees relating to guaranteed trusts, which are eliminated in consolidation), net of expenses, amounted to (Won)38 billion in 2010 and (Won)36 billion in 2011.
For some of the money trusts we manage, we have guaranteed the principal amount of an investor’s investment as well as a fixed rate of interest. We no longer offer new money trust products where we guarantee both the principal amount and a fixed rate of interest. We continue to offer pension-type money trusts that provide a guarantee of the principal amount of an investor’s investment.
69
Table of Contents
The following table shows the balances of our money trusts by type as of the dates indicated. Under IFRS, we consolidate trust accounts for which we guarantee both the repayment of the principal amount and a fixed rate of interest, while we do not consolidate performance trusts on which we do not guarantee principal or interest or those trust accounts for which we guarantee only the repayment of the principal amount:
| As of December 31, | ||||||||
| 2010 | 2011 | |||||||
| (in billions of Won) | ||||||||
| Principal and interest guaranteed trusts |
(Won) | 1 | (Won) | 1 | ||||
| Principal guaranteed trusts |
1,750 | 1,400 | ||||||
| Performance trusts |
8,635 | 11,985 | ||||||
|
|
|
|
|
|||||
| Total |
(Won) | 10,386 | (Won) | 13,386 | ||||
|
|
|
|
|
|||||
The trust assets we manage consist principally of investment securities and loans made from the trusts. The investment securities consist of government-related debt securities, corporate debt securities, including bonds and commercial paper, equity securities and other securities. As of December 31, 2011, our money trusts had invested in securities with an aggregate book value of (Won)3,736 billion, which accounted for approximately 27.9% of our money trust assets. Debt securities accounted for (Won)2,479 billion of this amount.
Our money trusts also invest, to a lesser extent, in equity securities, including beneficiary certificates issued by investment trust management companies. As of December 31, 2011, equity securities held by our money trusts amounted to (Won)601 billion, which accounted for approximately 4.5% of our money trust assets. Of this amount, less than (Won)1 billion was from money trusts over which we had investment discretion and the remainder was from specified money trusts.
Loans made by our money trusts are similar in type to the loans made by our banking operations. As of December 31, 2011, our money trusts had made loans in the aggregate principal amount of (Won)210 billion (excluding loans to our banking operations of (Won)2,157 billion), which accounted for approximately 1.6% of our money trust assets.
If the income from a money trust for which we provide a guarantee is less than the amount of the payments we have guaranteed, we will need to pay the amount of the shortfall with funds from special reserves maintained in our trust accounts, followed by basic fees from that money trust and funds from our banking operations. We net any payments we make as a result of these shortfalls against any gains we receive from other money trusts. No material payments of any such shortfall amounts were made in 2011.
Property Trusts. Through Woori Bank, Kyongnam Bank and Kwangju Bank, we also offer property trust management services, where we manage non-cash assets in return for a fee. Non-cash assets include mostly receivables (including those securing asset-backed securities), real property and securities, but can also include movable property such as artwork. Under these arrangements, we render escrow or custodial services for the property in question and collect fees in return.
In 2011, our property trust fees generally ranged from 0.05% to 1.0% of total assets under management, depending on the type of trust account product. As of December 31, 2011, the balance of our property trusts totaled (Won)13,207 billion.
Under IFRS, property trusts are not consolidated within our financial statements.
Investment Trust Management
Through Woori Asset Management, we offer investment trust products to our customers and manage the assets invested by them in investment trusts. The investment trust products we offer generally take the form of beneficiary certificates evidencing an ownership interest in a particular investment trust. We currently offer various different types of investment trust products, including:
| • | equity funds, where equity securities or equity-linked securities consist of 60% or more of their assets; |
| • | fixed income funds, where fixed income securities consist of 60% or more of their assets; |
70
Table of Contents
| • | hybrid funds, the assets of which include both fixed income and equity securities with no minimum requirement to hold either type of security, and which are classified as either fixed income- or equity-type hybrid funds depending on which type of securities constitute the majority of the assets held; |
| • | money market funds, which invest mostly in short-term financial products, such as call loans, commercial paper, certificates of deposit and short-term treasury notes and corporate bonds; and |
| • | alternative investment funds, which invest in derivatives, real estate, commodities, special assets, funds of funds and other assets. |
The investment trusts we manage are generally trusts with no fixed term that allow investors to share in the investment performance of the trust in proportion to the amount of their investment in the trust. We have investment discretion over all investment trusts. Investment trusts calculate the value of their assets each day, and any change in the overall valuation of their assets will be reflected in the price of their beneficiary certificates. To the extent such a trust does have a maturity date, at that time the trust will disburse principal and any return on investment based on the price of their beneficiary certificates. In addition to investment trust products, we provide our institutional clients with various investment advisory and discretionary asset investment services.
The following table shows the balances of our investment trusts by type as of the dates indicated. Under IFRS, we do not consolidate investment trusts due to the fact that the assets invested are not our assets but customer assets:
| As of December 31, | ||||||||
| 2010 | 2011 | |||||||
| (in billions of Won) | ||||||||
| Equity funds |
(Won) | 1,888 | (Won) | 1,907 | ||||
| Bond funds |
2,116 | 1,994 | ||||||
| Hybrid funds |
477 | 320 | ||||||
| Money market funds |
5,355 | 5,802 | ||||||
| Alternative investment funds |
3,484 | 3,147 | ||||||
|
|
|
|
|
|||||
| Total |
(Won) | 13,320 | (Won) | 13,170 | ||||
|
|
|
|
|
|||||
We receive fees for our investment trust management services consisting of management fees in connection with establishing, operating and managing the investment trust, asset management fees and related advisory fees. These fees are calculated by multiplying the daily net asset value of the trust by a percentage provided in the trust documentation. Fees accrue on a daily basis and are paid out as expenses periodically.
Fees from our investment trust management services amounted to (Won)26 billion in 2010 and (Won)22 billion in 2011.
Although our current customer base consists mainly of institutional investors, we have been seeking to market our investment trust products to retail customers through our consumer banking network. We believe that significant opportunities exist for us to leverage our existing base of consumer banking customers to cross-sell our investment trust products. We intend to focus on the development of new products tailored to particular customer segments and the enhancement of sales and distribution capabilities through each of our marketing channels to meet our customers’ needs.
Trustee and Custodian Services Relating to Securities Investment Trusts
Through Woori Bank, we act as a trustee for approximately 1,159 securities investment trusts, mutual funds and other investment funds. We receive a fee for acting as a trustee and generally perform the following functions:
| • | receiving payments made in respect of such securities; |
| • | executing trades in respect of such securities on behalf of the investment fund, based on instructions from the relevant investment fund management company; and |
71
Table of Contents
| • | in certain cases, authenticating beneficiary certificates issued by investment trust management companies and handling settlements in respect of such beneficiary certificates. |
For the year ended December 31, 2011, our fee income from such services was (Won)8 billion.
Other Businesses
Merchant Banking
We engage in merchant banking operations through Woori Bank. The merchant banking services we currently offer include principally the following:
| • | commercial paper discounting, which entails purchasing at a discount notes that are issued, endorsed or guaranteed by companies to supply them with short-term working capital; |
| • | factoring financing, which entails purchasing at a discount trade receivables held by companies to supply them with capital; |
| • | payment guarantees, which entail issuing guarantees in respect of notes in return for fees; and |
| • | cash management account (“CMA”) services, which offer accounts into which the accountholder may freely deposit or withdraw funds and for which returns from an investment portfolio purchased with such deposited funds are distributed as interest. |
In recent years, we have focused our merchant banking operations on providing short-term funds to public institutions and financially sound corporations in order to improve our asset quality and increase our income and profitability.
Management of National Housing Fund
In April 2008, we were selected to be the lead manager of the National Housing Fund. The National Housing Fund provides financial support to low-income households in Korea by providing mortgage financing and construction loans for projects to build small- and medium-sized housing. As of December 31, 2011, outstanding housing loans from the National Housing Fund amounted to approximately (Won)74 trillion, of which we originated approximately (Won)39 trillion. The activities of the National Housing Fund are funded primarily by the issuance of national housing bonds, which must be purchased by persons and legal entities wishing to make real estate-related registrations and filings, and by subscription savings deposits held at the National Housing Fund.
In return for managing the operations of the National Housing Fund we receive a monthly fee. This fee consists of a fund raising fee, a loan origination fee and a management fee. The fund raising fee is based on the number of National Housing Fund subscription savings deposit accounts opened and the level of activity for existing accounts and the number of National Housing Fund bonds issued or redeemed. The loan origination fee is based on the number of new National Housing Fund loans and the number of National Housing Fund mortgage loans to contractors constructing housing units that are assumed by the individual buyers of housing units and the level of activity for existing loans during each month. The management fee is based on the monthly average of the number of outstanding accounts and the monthly average of the number of overdue loans owed to the National Housing Fund. We received total fees of approximately (Won)63 billion for managing the National Housing Fund in 2011.
Bancassurance
The term “bancassurance” refers to the marketing and sale by commercial banks of insurance products manufactured within a group of affiliated companies or by third-party insurance companies. Through Woori Bank, Kyongnam Bank and Kwangju Bank, we market a wide range of bancassurance products. In 2011, we generated fee income of approximately (Won)137 billion through the marketing of bancassurance products. We believe that we will be able to continue to develop an important new source of fee-based revenues by expanding
72
Table of Contents
our offering of these products. Woori Bank has entered into bancassurance marketing arrangements with 23 insurance companies, including Samsung Life Insurance, Samsung Fire and Marine Insurance, Korea Life Insurance, Hyundai Fire and Marine Insurance and American International Assurance, and plans to enter into additional insurance product marketing arrangements with other leading insurance companies whose names and reputation are likely to be familiar to our customer base. Woori Bank has also entered into bancassurance marketing arrangements with Woori Aviva Life Insurance, in which we acquired a 51.0% interest in April 2008 and currently hold a 51.6% interest.
Private Equity
In October 2005, we established Woori Private Equity Co., Ltd. with the aim of strengthening our principal investment operations. Woori Private Equity seeks to make long-term and strategic investments in buyout target companies, as well as actively involving itself in their management. This involves identifying potential investees suffering from inefficient management and effecting financial restructuring and strategic reorientation in those investees so as to enhance their enterprise value. We expect Woori Private Equity’s operations to continue to provide us with greater investment opportunities and a new source of business for other related segments, especially corporate banking. In July 2006, Woori Private Equity established Woori Private Equity Fund, the size of which is approximately (Won)344 billion, as a limited partnership in which Woori Private Equity serves as a general partner. In December 2009, Woori Private Equity established Woori Blackstone Korea Opportunity Private Equity Fund I, the size of which is approximately (Won)606 billion, as a limited partnership in which Woori Private Equity serves as a general partner.
We also engage in private equity fund activities through Woori Asset Management. In February 2012, Woori Asset Management established POSCO Woori EIG Global Fund, the size of which is approximately (Won)560 billion, as a limited partnership in which Woori Asset Management serves as a general partner.
Consumer Finance
We provide consumer finance services through Woori Financial Co., Ltd. We acquired a 51.4% stake in Woori Financial (formerly known as Hanmi Capital Co., Ltd.) in September 2007 and further acquired an additional 2.4% stake in September 2009 following our exercise of certain call options. We currently hold a 52.5% equity interest in Woori Financial. Woori Financial provides leases and loans for various products, including automobiles, heavy machineries and medical equipments, as well as microlending services. We expect Woori Financial to continue to expand our customer base by providing a variety of non-banking financial services to retail customers as well as synergies through coordinated business operations with our other subsidiaries, including Woori Bank.
Life Insurance
We provide life insurance products and services through Woori Aviva Life Insurance. We acquired a 51.0% stake in Woori Aviva Life Insurance (formerly known as LIG Life Insurance) in April 2008. In connection with this acquisition, we entered into a joint venture agreement with Aviva International Holdings Limited. In September 2010, we acquired an additional 0.6% stake in Woori Aviva Life Insurance following our subscription for common shares newly issued by Woori Aviva Life Insurance. Aviva International Holdings Limited (through its wholly-owned subsidiary Aviva Asia Holdings Private Limited) and we collectively hold a 98.9% interest in Woori Aviva Life Insurance, which we account for as part of our investments in jointly controlled entities and associates under IFRS. Woori Aviva Life Insurance provides a variety of individual and group life insurance products, including health insurance, whole life insurance, savings-type insurance and pension insurance. Woori Aviva Life Insurance seeks to become a leading life insurance company in Korea by combining our extensive distribution and marketing network and large customer base with the life insurance industry expertise and experience provided by Aviva plc, and we expect that Woori Aviva Life Insurance will allow us to further our strategy of diversifying our non-banking revenue base to cover a full range of financial services and products as a comprehensive financial services provider.
73
Table of Contents
Competition
We compete with other financial institutions in Korea, including principally nationwide and regional Korean commercial banks and branches of foreign banks operating in Korea. In addition, in particular segments such as credit cards, asset management, securities brokerage and bancassurance, our subsidiaries compete with specialized financial institutions focusing on such segments. Some of these specialized financial institutions are significantly larger in terms of asset size and customer base and have greater financial resources than our subsidiaries.
Competition in the Korean financial market has been and is likely to remain intense. In particular, in the area of our core banking operations, most Korean banks have been focusing on retail customers and small- and medium-sized enterprises in recent years, although they have begun to increase their exposure to large corporate borrowers, and have been focusing on developing fee income businesses, including bancassurance, as increasingly important sources of revenue. In the area of credit cards, Korean banks and credit card companies have in the past engaged in aggressive marketing activities and made significant investments, contributing to some extent to the lower profitability and asset quality problems previously experienced with respect to credit card receivables.
In addition, we believe regulatory reforms and the general modernization of business practices in Korea will lead to increased competition among financial institutions in Korea. We also believe that foreign financial institutions, many of which have greater experience and resources than we do, will seek to compete with us in providing financial products and services either by themselves or in partnership with existing Korean financial institutions. Furthermore, a number of significant mergers and acquisitions in the industry have taken place in Korea over the past decade, including the acquisition of Koram Bank by an affiliate of Citibank in 2004, the acquisition of Korea First Bank by Standard Chartered Bank in April 2005, Chohung Bank’s merger with Shinhan Bank in April 2006 and Hana Financial Group’s acquisition of a controlling interest in Korea Exchange Bank in February 2012. We expect that consolidation in the financial industry will continue. In particular, the Korean government has announced that it plans to privatize the Korea Development Bank. Other financial institutions may seek to acquire or merge with such or other entities, and the financial institutions resulting from this consolidation may, by virtue of their increased size and business scope, provide significantly greater competition for us. See “Item 3D. Risk Factors—Risks relating to competition.”
Assets and Liabilities
The tables below and accompanying discussions provide selected financial highlights regarding our assets and liabilities on a consolidated basis. Except as otherwise indicated, (i) amounts as of and for the years ended December 31, 2010 and 2011 are presented on a consolidated basis under IFRS, and (ii) amounts as of and for the years ended December 31, 2007, 2008 and 2009 are presented on a consolidated basis under U.S. GAAP and are not comparable to information prepared in accordance with IFRS.
Certain information with respect to our loan portfolio and the asset quality of our loans is presented below on a basis consistent with certain requirements of the Financial Services Commission applicable to Korean financial institutions, which differs (as described below where applicable) from the presentation of such information in our financial statements prepared in accordance with IFRS as issued by the IASB, as we believe that such alternative presentation allows us to provide additional details regarding our loan portfolio and the asset quality of our loans which would be helpful to our investors.
Loan Portfolio
As of December 31, 2011, the balance of our total loan portfolio was (Won)212,492 billion, a 5.6% increase from (Won)201,235 billion as of December 31, 2010. As of December 31, 2011, 86.8% of our total loans were Won-denominated loans and 13.2% of our total loans were denominated in other currencies. Of the (Won)27,974 billion of foreign currency-denominated loans as of that date, approximately 30.7% represented “foreign” loans provided by Woori Bank to offshore entities and individuals. Woori Bank makes foreign loans primarily through
74
Table of Contents
its overseas branches to affiliates of large Korean manufacturing companies for trade financing and working capital.
Except where we specify otherwise, all loan amounts stated below do not include amounts due from banks and other receivables and are prior to deducting provisions for credit losses (or, in case of amounts under U.S GAAP, before deduction of allowance for loan losses) and present value discount or reflecting deferred origination costs, and all corporate loan amounts stated below include loans made to the Korean government and government-owned agencies and banks.
Loan Types
The following table presents loans by type as of the dates indicated under IFRS. Total loans reflect our loan portfolio, including past due amounts.
| As of December 31, | ||||||||||||
| 2010 | 2011 | 2011 | ||||||||||
| (in billions of Won) | (%) | |||||||||||
| Domestic: |
||||||||||||
| Corporate(1): |
||||||||||||
| Commercial and industrial |
(Won) | 98,195 | (Won) | 101,738 | 47.9 | % | ||||||
| Lease financing |
653 | 700 | 0.3 | |||||||||
| Trade financing |
11,332 | 13,171 | 6.2 | |||||||||
| Other commercial |
12,558 | 10,927 | 5.1 | |||||||||
|
|
|
|
|
|
|
|||||||
| Total corporate |
122,738 | 126,536 | 59.5 | |||||||||
| Consumer: |
||||||||||||
| General purpose household |
32,992 | 32,709 | 15.4 | |||||||||
| Mortgage |
6,375 | 12,138 | 5.7 | |||||||||
| Home equity |
26,645 | 27,940 | 13.1 | |||||||||
| Total consumer |
66,012 | 72,787 | 34.3 | |||||||||
| Credit cards |
4,357 | 4,592 | 2.2 | |||||||||
|
|
|
|
|
|
|
|||||||
| Total domestic |
193,107 | 203,915 | 96.0 | |||||||||
| Foreign: |
||||||||||||
| Corporate(2): |
||||||||||||
| Commercial and industrial |
(Won) | 7,185 | (Won) | 8,013 | 3.8 | |||||||
| Lease financing |
— | — | — | |||||||||
| Trade financing |
129 | 165 | 0.1 | |||||||||
| Other commercial |
69 | 272 | 0.1 | |||||||||
|
|
|
|
|
|
|
|||||||
| Total corporate |
7,383 | 8,450 | 4.0 | |||||||||
| Consumer |
745 | 127 | 0.1 | |||||||||
|
|
|
|
|
|
|
|||||||
| Total foreign |
8,128 | 8,577 | 4.0 | |||||||||
|
|
|
|
|
|
|
|||||||
| Total gross loans |
201,235 | 212,492 | 100.0 | % | ||||||||
| Total loans |
201,235 | 212,492 | ||||||||||
| Less: present value discount |
(16 | ) | (31 | ) | ||||||||
| Less: deferred origination costs (fees) |
74 | 178 | ||||||||||
| Less: provisions for credit losses |
(4,718 | ) | (3,759 | ) | ||||||||
|
|
|
|
|
|||||||||
| Total loans, net |
(Won) | 196,575 | (Won) | 208,880 | ||||||||
|
|
|
|
|
|||||||||
| (1) | Including loans made to banks and the Korean government and government-owned agencies. |
| (2) | Including loans made to banks. |
| (3) | Not including due from banks and other receivables. |
75
Table of Contents
The following table presents loans by type as of the dates indicated under U.S. GAAP. Total loans reflect our loan portfolio, including past due amounts.
| As of December 31, | ||||||||||||
| 2007 | 2008 | 2009 | ||||||||||
| (in billions of Won) | ||||||||||||
| Domestic: |
||||||||||||
| Corporate: |
||||||||||||
| Commercial and industrial |
(Won) | 76,050 | (Won) | 93,931 | (Won) | 96,484 | ||||||
| Lease financing |
272 | 425 | 578 | |||||||||
| Trade financing |
8,754 | 12,201 | 10,321 | |||||||||
| Other commercial |
6,496 | 8,266 | 6,602 | |||||||||
|
|
|
|
|
|
|
|||||||
| Total corporate |
91,572 | 114,823 | 113,985 | |||||||||
| Consumer: |
||||||||||||
| General purpose household(1) |
56,176 | 56,911 | 58,127 | |||||||||
| Mortgage |
3,248 | 3,275 | 3,807 | |||||||||
| Total consumer |
59,424 | 60,186 | 61,934 | |||||||||
| Credit cards |
3,325 | 4,294 | 4,098 | |||||||||
|
|
|
|
|
|
|
|||||||
| Total domestic |
154,321 | 179,303 | 180,017 | |||||||||
| Foreign: |
||||||||||||
| Corporate: |
||||||||||||
| Commercial and industrial |
(Won) | 5,327 | (Won) | 9,015 | (Won) | 7,393 | ||||||
| Trade financing |
138 | 185 | 92 | |||||||||
|
|
|
|
|
|
|
|||||||
| Total corporate |
5,465 | 9,200 | 7,485 | |||||||||
| Consumer |
99 | 129 | 115 | |||||||||
|
|
|
|
|
|
|
|||||||
| Total foreign |
5,564 | 9,329 | 7,600 | |||||||||
| Total gross loans |
159,885 | 188,632 | 187,617 | |||||||||
| Less: Unearned income |
(17 | ) | (51 | ) | (98 | ) | ||||||
|
|
|
|
|
|
|
|||||||
| Total loans |
(Won) | 159,868 | (Won) | 188,581 | (Won) | 187,519 | ||||||
|
|
|
|
|
|
|
|||||||
| (1) | Includes home equity loans. |
Loan Concentrations
Each of our banking subsidiaries limits its total exposure to any single borrower as required by Korean regulations and pursuant to its internal policies. Woori Bank determines this limit based on the borrower’s credit rating provided by the bank’s CREPIA system, and Kyongnam Bank and Kwangju Bank each determines its respective limit using the borrower’s credit rating under its own standardized credit evaluation system based on the CREPIA system. Each of our banking subsidiaries may adjust its respective limit if such limit would otherwise exceed the limit imposed by Korean regulations. See “—Supervision and Regulation—Principal Regulations Applicable to Banks—Financial Exposure to any Individual Customer and Major Shareholder.”
76
Table of Contents
20 Largest Exposures by Borrower
As of December 31, 2011, our exposures to our 20 largest borrowers or issuers totaled (Won)45,763 billion and accounted for 12.0% of our total exposures. The following table sets forth our total exposures to those borrowers or issuers as of that date:
| Loans | Amounts Classified as substandard or below(2) |
|||||||||||||||||||||||||||||||||||
| Company (Credit Rating)(1) |
Won currency |
Foreign currency |
Equity securities |
Debt securities |
Guarantees and acceptances |
Credit derivatives |
Total exposures |
Collateral | ||||||||||||||||||||||||||||
| (in billions of Won) | ||||||||||||||||||||||||||||||||||||
| The Bank of Korea (AAA) |
(Won) | 290 | — | — | (Won) | 11,739 | — | — | (Won) | 12,029 | — | — | ||||||||||||||||||||||||
| Government(3) |
— | — | — | 10,724 | — | — | 10,724 | — | — | |||||||||||||||||||||||||||
| Korea Finance Corporation (AAA) |
— | — | — | 2,643 | — | — | 2,643 | — | — | |||||||||||||||||||||||||||
| Korea Land Housing Corporation (AA) |
10 | — | — | 2,066 | — | — | 2,076 | — | — | |||||||||||||||||||||||||||
| Korea Deposit Insurance Corporation (AA) |
1,000 | — | — | 953 | — | — | 1,953 | — | — | |||||||||||||||||||||||||||
| Industrial Bank of Korea (AA) |
537 | (Won) | 34 | (Won) | 3 | 1,155 | — | — | 1,729 | — | — | |||||||||||||||||||||||||
| Samsung Electronics (AAA) |
165 | 1,478 | 22 | — | — | — | 1,665 | — | — | |||||||||||||||||||||||||||
| Korea Housing Finance Corporation (AAA) |
— | — | — | 1,603 | — | — | 1,603 | — | — | |||||||||||||||||||||||||||
| Sung-Dong Ship Marin (C) |
454 | — | — | — | (Won) | 985 | — | 1,439 | (Won) | 182 | — | |||||||||||||||||||||||||
| Korea Development Bank (AAA) |
8 | — | — | 1,194 | — | — | 1,202 | — | — | |||||||||||||||||||||||||||
| STX Offshore & Shipbuilding (A-) |
68 | 128 | — | — | 914 | — | 1,110 | 34 | — | |||||||||||||||||||||||||||
| Kookmin Bank (AA) |
452 | — | — | 623 | — | — | 1,075 | 253 | — | |||||||||||||||||||||||||||
| Hyundai Steel (A+) |
410 | 273 | 3 | 254 | 101 | — | 1,041 | — | — | |||||||||||||||||||||||||||
| SH Corporation (AA) |
510 | — | — | 441 | — | — | 951 | — | — | |||||||||||||||||||||||||||
| Daewoo International (A+) |
46 | 472 | — | — | 396 | — | 914 | 9 | — | |||||||||||||||||||||||||||
| Shinhan Bank (AA) |
64 | — | — | 799 | — | — | 863 | — | — | |||||||||||||||||||||||||||
| SK hynix (A+) |
— | 205 | 470 | 62 | 40 | — | 777 | 102 | — | |||||||||||||||||||||||||||
| POSCO (AAA) |
127 | — | 359 | 91 | 109 | — | 686 | — | — | |||||||||||||||||||||||||||
| Small and Medium Business Corporation (AAA) |
— | — | — | 657 | — | — | 657 | — | — | |||||||||||||||||||||||||||
| Korea Securities Finance Corporation (AA) |
300 | — | 106 | 220 | — | — | 626 | — | — | |||||||||||||||||||||||||||
|
|
|
|
|
|
|
|
|
|
|
|
|
|
|
|
|
|
|
|||||||||||||||||||
| Total |
(Won) | 4,441 | (Won) | 2,590 | (Won) | 963 | (Won) | 35,224 | (Won) | 2,545 | (Won) | — | (Won) | 45,763 | (Won) | 580 | (Won) | — | ||||||||||||||||||
|
|
|
|
|
|
|
|
|
|
|
|
|
|
|
|
|
|
|
|||||||||||||||||||
| (1) | Credit ratings from one of the following domestic credit rating agencies in Korea as of December 31, 2011: Korea Information Service Inc., National Information & Credit Evaluation, Inc., or Korea Ratings. |
| (2) | Classification is based on the Financial Services Commission’s asset classification criteria. |
| (3) | Credit ratings unavailable. |
As of December 31, 2011, six of these top 20 borrowers or issuers were companies belonging to the 30 largest chaebols in Korea. See “Item 3D. Risk Factors—Risks relating to our corporate credit portfolio—We have exposure to the largest Korean commercial conglomerates, known as “chaebols,” and, as a result, financial difficulties of chaebols may have an adverse impact on us.”
77
Table of Contents
Exposure to Chaebols
As of December 31, 2011, 8.6% of our total exposure was to the 30 largest chaebols in Korea. The following table shows, as of December 31, 2011, our total exposures to the ten chaebol groups to which we have the largest exposure:
| Loans | ||||||||||||||||||||||||||||||||||||
| Chaebol |
Won currency |
Foreign currency |
Equity securities |
Debt securities |
Guarantees and acceptances |
Credit derivatives |
Total exposures |
Collateral | Amounts Classified as substandard or below(1) |
|||||||||||||||||||||||||||
| (in billions of Won) | ||||||||||||||||||||||||||||||||||||
| POSCO |
(Won) | 507 | (Won) | 561 | (Won) | 359 | (Won) | 141 | (Won) | 2,512 | — | (Won) | 4,080 | (Won) | 8 | — | ||||||||||||||||||||
| Samsung |
718 | 1,778 | 100 | 411 | 531 | (Won) | 68 | 3,606 | 23 | — | ||||||||||||||||||||||||||
| Hyundai Motors |
1,274 | 598 | 57 | 952 | 237 | — | 3,118 | 1,704 | — | |||||||||||||||||||||||||||
| Kumho Asiana |
1,026 | 416 | 73 | 107 | 1,419 | — | 3,041 | 500 | — | |||||||||||||||||||||||||||
| LG |
908 | 603 | 35 | 288 | 6 | — | 1,840 | 24 | — | |||||||||||||||||||||||||||
| Lotte |
229 | 27 | 2 | 144 | 801 | 30 | 1,233 | 7 | — | |||||||||||||||||||||||||||
| STX |
480 | 406 | 1 | 40 | 299 | — | 1,226 | 2,210 | — | |||||||||||||||||||||||||||
| Hansol |
40 | — | — | — | 1,078 | — | 1,118 | 38 | — | |||||||||||||||||||||||||||
| Hyosung |
570 | 326 | 3 | 20 | 41 | — | 960 | 554 | — | |||||||||||||||||||||||||||
| Hyundai Heavy Industries |
257 | 171 | 24 | 220 | 271 | 5 | 948 | — | — | |||||||||||||||||||||||||||
|
|
|
|
|
|
|
|
|
|
|
|
|
|
|
|
|
|
|
|||||||||||||||||||
| Total |
(Won) | 6,009 | (Won) | 4,886 | (Won) | 654 | (Won) | 2,323 | (Won) | 7,195 | (Won) | 103 | (Won) | 21,170 | (Won) | 5,068 | — | |||||||||||||||||||
|
|
|
|
|
|
|
|
|
|
|
|
|
|
|
|
|
|
|
|||||||||||||||||||
| (1) | Classification is based on the Financial Services Commission’s asset classification criteria. |
Loan Concentration by Industry
The following table shows, as of December 31, 2011, the aggregate balance of our domestic and foreign corporate loans by industry concentration and as a percentage of our total corporate lending:
| Aggregate corporate loan balance |
Percentage of total corporate loan balance |
|||||||
| (in billions of Won) | ||||||||
| Industry |
||||||||
| Manufacturing |
(Won) | 52,096 | 38.6 | % | ||||
| Retail and wholesale |
18,830 | 13.9 | ||||||
| Construction |
9,734 | 7.2 | ||||||
| Financial and insurance |
9,051 | 6.7 | ||||||
| Hotel, leisure or transportation |
5,099 | 3.8 | ||||||
| Government and government agencies |
438 | 0.3 | ||||||
| Other |
39,738 | 29.4 | ||||||
|
|
|
|
|
|||||
| Total |
(Won) | 134,986 | 100.0 | % | ||||
|
|
|
|
|
|||||
78
Table of Contents
Maturity Analysis
The following table sets out, as of December 31, 2011, the scheduled maturities (time remaining until maturity) of our loan portfolio. The amounts disclosed are before deduction of provisions for credit losses:
| 1 year or less | Over 1 year but not more than 5 years |
Over 5 years | Total | |||||||||||||
| (in billions of Won) | ||||||||||||||||
| Domestic |
||||||||||||||||
| Corporate(1) |
||||||||||||||||
| Commercial and industrial |
(Won) | 72,081 | (Won) | 21,745 | (Won) | 7,912 | (Won) | 101,738 | ||||||||
| Lease financing |
98 | 602 | — | 700 | ||||||||||||
| Trade financing |
13,169 | 2 | — | 13,171 | ||||||||||||
| Other commercial |
7,592 | 1,998 | 1,337 | 10,927 | ||||||||||||
|
|
|
|
|
|
|
|
|
|||||||||
| Total corporate |
92,940 | 24,347 | 9,249 | 126,536 | ||||||||||||
| Consumer(2) |
||||||||||||||||
| General purpose household |
15,454 | 7,357 | 9,898 | 32,709 | ||||||||||||
| Mortgage |
2,858 | 3,254 | 6,026 | 12,138 | ||||||||||||
| Home equity |
11,131 | 5,839 | 10,970 | 27,940 | ||||||||||||
|
|
|
|
|
|
|
|
|
|||||||||
| Total consumer |
29,443 | 16,450 | 26,894 | 72,787 | ||||||||||||
| Credit cards |
3,366 | 1,213 | 13 | 4,592 | ||||||||||||
|
|
|
|
|
|
|
|
|
|||||||||
| Total domestic |
125,749 | 42,010 | 36,156 | 203,915 | ||||||||||||
| Foreign |
||||||||||||||||
| Corporate |
||||||||||||||||
| Commercial and industrial |
5,428 | 1,426 | 1,159 | 8,013 | ||||||||||||
| Lease financing |
— | — | — | — | ||||||||||||
| Trade financing |
164 | 1 | — | 165 | ||||||||||||
| Other commercial |
157 | 115 | — | 272 | ||||||||||||
|
|
|
|
|
|
|
|
|
|||||||||
| Total corporate |
5,749 | 1,542 | 1,159 | 8,450 | ||||||||||||
| Consumer: |
||||||||||||||||
| Other consumer |
33 | 18 | 76 | 127 | ||||||||||||
|
|
|
|
|
|
|
|
|
|||||||||
| Total foreign |
5,782 | 1,560 | 1,235 | 8,577 | ||||||||||||
|
|
|
|
|
|
|
|
|
|||||||||
| Total loans(3) |
(Won) | 131,531 | (Won) | 43,570 | (Won) | 37,391 | (Won) | 212,492 | ||||||||
|
|
|
|
|
|
|
|
|
|||||||||
| (1) | Including loans made to banks and the Korean government and government-owned agencies. |
| (2) | Including loans made to banks. |
| (3) | Not including due from banks and other receivables, and before the deduction of provisions for credit losses and present value discount and the reflection of deferred origination costs. |
A significant portion of our loans with maturities of one year is renewed annually. We typically roll over our working capital loans and consumer loans (other than those payable in installments) after we conduct our normal loan review in accordance with our loan review procedures. Under our internal guidelines, we may generally extend working capital loans on an annual basis for an aggregate term of five years, in the case of Woori Bank, or ten years, in the case of Kyongnam Bank and Kwangju Bank. Those guidelines also allow us to generally extend consumer loans for another term on an annual basis for an aggregate term of up to five years, in the case of Woori Bank, or ten years, in the case of Kyongnam Bank and Kwangju Bank.
79
Table of Contents
Interest Rates
The following table shows, as of December 31, 2011, the total amount of our loans due after one year, that have fixed interest rates and variable or adjustable interest rates:
| Domestic | Foreign | Total | ||||||||||
| (in billions of Won) | ||||||||||||
| Fixed rate(1) |
(Won) | 17,259 | (Won) | 94 | (Won) | 17,353 | ||||||
| Variable or adjustable rates(2) |
60,907 | 2,701 | 63,608 | |||||||||
|
|
|
|
|
|
|
|||||||
| Total loans |
(Won) | 78,166 | (Won) | 2,795 | (Won) | 80,961 | ||||||
|
|
|
|
|
|
|
|||||||
| (1) | Fixed rate loans are loans for which the interest rate is fixed for the entire term. |
| (2) | Variable or adjustable rate loans are loans for which the interest rate is not fixed for the entire term. |
For additional information regarding our management of interest rate risk, see “Item 11. Quantitative and Qualitative Disclosures about Market Risk—Market Risk Management—Asset and Liability Management.”
Asset Quality of Loans
Except where we specify otherwise, all loan amounts stated below do not include amounts due from banks and other receivables and are prior to deducting provisions for credit losses (or, in case of amounts under U.S GAAP, before deduction of allowance for loan losses) and present value discount or reflecting deferred origination costs, and all corporate loan amounts stated below include loans made to the Korean government and government-owned agencies and banks.
Loan Classifications
The Financial Services Commission generally requires Korean financial institutions to analyze and classify their assets by quality into one of five categories for reporting purposes. In making these classifications, we take into account a number of factors, including the financial position, profitability and transaction history of the borrower, and the value of any collateral or guarantee taken as security for the extension of credit. This classification method, and our related provisioning policy, is intended to fully reflect the borrower’s capacity to repay.
The following is a summary of the asset classification criteria we apply for corporate and consumer loans, based on the asset classification guidelines of the Financial Services Commission. Credit card receivables are subject to classification based on the number of days past due, as required by the Financial Services Commission. We also apply different criteria for other types of credits such as loans to the Korean government or to government-related or controlled entities, certain bills of exchange and certain receivables.
| Asset Classification |
Characteristics | |
| Normal |
Credits extended to customers that, based on our consideration of their business, financial position and future cash flows, do not raise concerns regarding their ability to repay the credits. | |
| Precautionary |
Credits extended to customers that:
• based on our consideration of their business, financial position and future cash flows, show potential risks with respect to their ability to repay the credits, although showing no immediate default risk; or
• are in arrears for one month or more but less than three months. | |
80
Table of Contents
| Asset Classification |
Characteristics | |
| Substandard |
Either:
• credits extended to customers that, based on our consideration of their business, financial position and future cash flows, are judged to have incurred considerable default risks as their ability to repay has deteriorated; or
• the portion that we expect to collect of total loans (1) extended to customers that have been in arrears for three months or more, (2) extended to customers that have incurred serious default risks due to the occurrence of, among other things, final refusal to pay their debt instruments, entry into liquidation or bankruptcy proceedings, or closure of their businesses, or (3) extended to customers who have outstanding loans that are classified as “doubtful” or “estimated loss.” | |
| Doubtful |
Credits exceeding the amount we expect to collect of total credits to customers that:
• based on our consideration of their business, financial position and future cash flows, have incurred serious default risks due to noticeable deterioration in their ability to repay; or
• have been in arrears for three months or more but less than twelve months. | |
| Estimated Loss |
Credits exceeding the amount we expect to collect of total credits to customers that:
• based on our consideration of their business, financial position and future cash flows, are judged to have to be accounted as a loss as the inability to repay became certain due to serious deterioration in their ability to repay;
• have been in arrears for twelve months or more; or
• have incurred serious risks of default in repayment due to the occurrence of, among other things, final refusal to pay their debt instruments, liquidation or bankruptcy proceedings or closure of their business. | |
Loan Loss Provisioning Policy
Under IFRS, we establish provisions for credit losses with respect to loans using either a case-by-case or collective approach. We assess individually significant loans on a case-by-case basis and other loans on a collective basis. In addition, if we determine that no objective evidence of impairment exists for a loan, we include such loan in a group of loans with similar credit risk characteristics and assess them collectively for impairment regardless of whether such loan is significant. If there is objective evidence that an impairment loss has been incurred for individually significant loans, the amount of the loss is measured as the difference between the financial asset’s carrying amount and the present value of the estimated future cash flows discounted at such asset’s original effective interest rate. Future cash flows are estimated through a case-by-case analysis of individually assessed assets, which takes into account the benefit of any guarantee or other collateral held. The value and timing of future cash flow receipts are based on available estimates in conjunction with facts available at the time of review and reassessed on a periodic basis as new information becomes available.
For collectively assessed loans, we base the level of provisions for credit losses on a portfolio basis in light of the homogenous nature of the assets included in each portfolio. The provisions are determined based on a
81
Table of Contents
quantitative review of the relevant portfolio, taking into account such factors as the level of arrears, the value of any security, and historical and projected cash recovery trends over the recovery period. The methodologies we use to estimate collectively assessed provisions reflect the probability that the performing customer will default, our historical loss experience (as adjusted by current economic and credit conditions where appropriate) and the emergence period between an impairment event occurring and a loan being identified and reported as impaired.
If additions or changes to the provisions for credit losses are required, then we record bad debt expenses, which are included in impairment losses on credit loss and treated as charges against current income. Credit exposures that we deem to be uncollectible, including actual loan losses, net of recoveries of previously charged-off amounts, are charged directly against the provisions for credit losses. See “Item 5A. Operating Results—Critical Accounting Policies—Impairment of Loans and Provisions for Credit Losses.”
We also consider the following loans to be impaired loans:
| • | loans that are past due by 90 days or more; |
| • | loans that are subject to legal proceedings related to collection; |
| • | loans to a borrower that has received a warning from the Korea Federation of Banks indicating that such borrower has exhibited difficulties in making timely payments of principal and interest; |
| • | loans to corporate borrowers that are rated “D” according to our internal credit ratings; and |
| • | restructured loans. |
In addition, if our provisions for credit losses are deemed insufficient for regulatory purposes, we compensate for the difference by recording a planned regulatory reserve for credit loss, which is segregated within our retained earnings. The level of planned regulatory reserve for credit loss required to be recorded is equal to the amount by which our provisions for credit losses under IFRS are less than the greater of (x) the amount of expected loss calculated using the internal ratings-based approach under Basel II and as approved by the Financial Supervisory Service and (y) the required amount of credit loss reserve calculated based on guidelines prescribed by the Financial Services Commission. The following table sets forth the Financial Services Commission’s guidelines for the minimum percentages of the outstanding principal amount of the relevant loans or balances that the credit loss reserve must cover:
| Loan classifications |
Corporate |
Consumer |
Credit card |
Credit card loans(2) | ||||
| Normal |
0.85% or above | 1% or above | 1.1% or above | 2.5% or above | ||||
| Precautionary |
7% or above | 10% or above | 40% or above | 50% or above | ||||
| Substandard |
20% or above | 20% or above | 60% or above | 65% or above | ||||
| Doubtful |
50% or above | 55% or above | 75% or above | 75% or above | ||||
| Estimated loss |
100% | 100% | 100% | 100% |
| (1) | Applicable for credit card receivables for general purchases of products or services. |
| (2) | Applicable for cash advances, card loans and revolving loan receivables. |
Under U.S. GAAP, we established our allowance for loan losses for corporate loans based on whether a particular loan was identified as impaired or not, using an incurred loss model (as we used a 12 month finite emergence period corroborated by historical data regarding such corporate loan portfolio). Once we identified a loan as impaired under U.S. GAAP, we generally measured the value of the loan based on the present value of expected future cash flows discounted at the loan’s effective interest rate or, as a practical expedient, at the loan’s observable market price or the fair value of the collateral if the loan was collateral dependent. If the measured value was less than the book value of the loan, we established a specific allowance for the amount deemed uncollectible. Where the entire impaired loan or a portion of the impaired loan was secured by collateral or a guarantee, we considered the fair value of the collateral or the guarantee payment in establishing the level of the allowance. Alternatively, for impaired loans that were considered collateral dependent, we determined the amount of impairment by reference to the fair value of the collateral. In addition, for certain foreign corporate
82
Table of Contents
loans that were considered impaired, we determined the fair value by reference to observable market prices, when available.
Under U.S. GAAP, we also established allowances for losses for corporate loans that had not been individually identified as impaired, consumer loans and credit card balances. These allowances were based on the level of our incurred loss, which reflected default probability and loss severity. We established the incurred loss related to corporate loans that we did not deem to be impaired based on historical loss experience, which depended on the internal credit rating of the borrower, characteristics of the lending product and relevant collateral. We established the incurred loss related to consumer loans and credit card balances based on historical loss experience generally for a period of one year, which depended on delinquency and collateral.
The process to determine the provision for off-balance sheet positions under IFRS is similar to the methodology used for loans. Any loss amounts are recognized as a provision in the consolidated statements of financial position within liabilities and charged to the consolidated statement of income as a component of the impairment loss for credit losses.
The actual amount of credit losses we incur may differ from our loss estimates as a result of changing economic conditions, changes in industry or geographic concentrations, or other factors. We monitor the differences between our estimated and actual incurred credit losses, and we undertake detailed periodic assessments of both individual loans and credit portfolios, the models we use to estimate incurred credit losses in those portfolios and the adequacy of our overall provisions.
Non-Accrual Loans and Past Due Accruing Loans
Although we do not identify or segregate non-accrual loans as a conceptual matter in our financial statements prepared in accordance with IFRS as issued by the IASB, we continue to monitor and manage our non-accrual loans. We generally place loans on non-accrual status when payments of interest and/or principal become past due by 90 days. In addition, the following types of loans are classified as non-accrual loans by us even if such loans are not past due:
| • | Loans to creditors with dishonored notes or checks; |
| • | Loans for which interest payments are reduced or postponed (e.g., through work-out procedures or debt restructurings); and |
| • | Loans to creditors included in the “watch list” maintained by the Korea Federation of Banks. |
We reclassify loans as accruing when interest and principal payments are up-to-date and future payments of principal and interest are reasonably assured. We generally do not recognize interest income on non-accrual loans unless collected. In applying payments on non accrual loans, we first apply payments to the delinquent interest outstanding, then to non-delinquent interest, and then to the outstanding loan balance until the loan is paid in full.
Foregone interest is the interest due on non-accrual loans that we have not accrued in our books. If we had not foregone interest on our non-accrual loans, we would have recorded gross interest income of (Won)178 billion and (Won)104 billion for 2010 and 2011, respectively, on loans accounted for on a non-accrual basis throughout the year, or since origination for loans held for part of the year. The actual amount of interest income on those loans included in our net income for 2010 and 2011 was (Won)103 billion and (Won)87 billion, respectively.
The category “accruing but past due 90 days” includes loans that are still accruing interest but on which principal or interest payments are contractually past due 90 days or more. We continue to accrue interest on loans that are fully secured by deposits or on which there are financial guarantees from the Korean government, the KDIC or certain financial institutions.
83
Table of Contents
The following table shows, as of the dates indicated, the amount of loans that were placed on a non-accrual basis and accruing loans under IFRS which were past due 90 days or more:
| As of December 31, | ||||||||||||||||||||||||
| 2010 | 2011 | |||||||||||||||||||||||
| Domestic | Foreign | Total | Domestic | Foreign | Total | |||||||||||||||||||
| (in billions of Won) | ||||||||||||||||||||||||
| Loans accounted for on a non-accrual basis(1) |
||||||||||||||||||||||||
| Corporate(2) |
(Won) | 4,509 | (Won) | 19 | (Won) | 4,528 | (Won) | 4,177 | (Won) | 132 | (Won) | 4,309 | ||||||||||||
| Consumer(3) |
1,293 | — | 1,293 | 601 | — | 601 | ||||||||||||||||||
|
|
|
|
|
|
|
|
|
|
|
|
|
|||||||||||||
| Sub-total |
5,802 | 19 | 5,821 | 4,778 | 132 | 4,910 | ||||||||||||||||||
| Accruing loans which are contractually past due 90 days or more as to principal or interest(1) |
||||||||||||||||||||||||
| Corporate(2) |
43 | 3 | 46 | 26 | 10 | 36 | ||||||||||||||||||
| Consumer |
19 | — | 19 | 5 | — | 5 | ||||||||||||||||||
|
|
|
|
|
|
|
|
|
|
|
|
|
|||||||||||||
| Sub-total |
62 | 3 | 65 | 31 | 10 | 41 | ||||||||||||||||||
|
|
|
|
|
|
|
|
|
|
|
|
|
|||||||||||||
| Total |
(Won) | 5,864 | (Won) | 22 | (Won) | 5,886 | (Won) | 4,809 | (Won) | 142 | (Won) | 4,951 | ||||||||||||
|
|
|
|
|
|
|
|
|
|
|
|
|
|||||||||||||
| (1) | Not including due from banks and other receivables, and prior to deducting provisions for credit losses and present value discount or reflecting deferred origination costs. |
| (2) | Including loans made to banks and the Korean government and government-owned agencies. |
| (3) | Includes credit card balances of (Won)207 billion and (Won)197 billion as of December 31, 2010 and 2011, respectively. |
Under U.S. GAAP, we generally placed loans on non-accrual status when payments of interest and/or principal became past due by one day. For the year ended December 31, 2009, we would have recorded gross interest income of (Won)254 billion on loans accounted for on a non-accrual basis under U.S. GAAP in accordance with the foregoing throughout the year, or since origination for loans held for part of the year, had we not foregone interest on those loans. Under U.S. GAAP, the amount of interest income on those loans that was included in our net income for the year ended December 31, 2009 was (Won)136 billion.
The following table shows, as of the dates indicated, the amount of loans that were placed on a non-accrual basis and accruing loans under U.S. GAAP which were past due one day or more:
| As of December 31, | ||||||||||||||||||||||||||||||||||||
| 2007 | 2008 | 2009 | ||||||||||||||||||||||||||||||||||
| Domestic | Foreign | Total | Domestic | Foreign | Total | Domestic | Foreign | Total | ||||||||||||||||||||||||||||
| (in billions of Won) | ||||||||||||||||||||||||||||||||||||
| Loans accounted for on a non-accrual basis |
||||||||||||||||||||||||||||||||||||
| Corporate |
(Won) | 1,147 | (Won) | 4 | (Won) | 1,151 | (Won) | 2,011 | (Won) | 1 | (Won) | 2,012 | (Won) | 2,298 | (Won) | 42 | (Won) | 2,340 | ||||||||||||||||||
| Consumer(1) |
1,685 | 1 | 1,686 | 2,166 | — | 2,166 | 1,263 | — | 1,263 | |||||||||||||||||||||||||||
|
|
|
|
|
|
|
|
|
|
|
|
|
|
|
|
|
|
|
|||||||||||||||||||
| Sub-total |
2,832 | 5 | 2,837 | 4,177 | 1 | 4,178 | 3,561 | 42 | 3,603 | |||||||||||||||||||||||||||
| Accruing loans which are contractually past due one day or more as to principal or interest(2) |
||||||||||||||||||||||||||||||||||||
| Corporate |
177 | — | 177 | 28 | — | 28 | 98 | 11 | 109 | |||||||||||||||||||||||||||
| Consumer |
41 | — | 41 | 47 | — | 47 | 26 | — | 26 | |||||||||||||||||||||||||||
|
|
|
|
|
|
|
|
|
|
|
|
|
|
|
|
|
|
|
|||||||||||||||||||
| Sub-total |
218 | — | 218 | 75 | — | 75 | 124 | 11 | 135 | |||||||||||||||||||||||||||
|
|
|
|
|
|
|
|
|
|
|
|
|
|
|
|
|
|
|
|||||||||||||||||||
| Total |
(Won) | 3,050 | (Won) | 5 | (Won) | 3,055 | (Won) | 4,252 | (Won) | 1 | (Won) | 4,253 | (Won) | 3,685 | (Won) | 53 | (Won) | 3,738 | ||||||||||||||||||
|
|
|
|
|
|
|
|
|
|
|
|
|
|
|
|
|
|
|
|||||||||||||||||||
| (1) | Includes credit card balances of (Won)199 billion, (Won)290 billion and (Won)105 billion as of December 31, 2007, 2008 and 2009, respectively. |
| (2) | Includes accruing loans that are contractually past due 90 days or more in the amount of (Won)4 billion, (Won)2 billion and (Won)2 billion, as of December 31, 2007, 2008 and 2009, respectively. |
84
Table of Contents
Loan Aging Schedule
The following table shows our loan aging schedule (excluding accrued interest) as of the dates indicated under IFRS. In line with industry practice, we have restructured a portion of our delinquent credit card balances as loans.
| As of December 31, 2011 | ||||||||||||||||||||||||||||||||||||||||||||||||
| Normal | Past due by 1 month or less |
Past due by 1-3 months |
Past due by 3-6 months |
Past due by more than 6 months |
Total | |||||||||||||||||||||||||||||||||||||||||||
| Amount | % | Amount past due |
% | Amount past due |
% | Amount past due |
% | Amount past due |
% | Amount past due |
% | |||||||||||||||||||||||||||||||||||||
| (in billions of Won, except percentages) | ||||||||||||||||||||||||||||||||||||||||||||||||
| Domestic |
||||||||||||||||||||||||||||||||||||||||||||||||
| Corporate(1) |
||||||||||||||||||||||||||||||||||||||||||||||||
| Commercial and industrial |
(Won) | 100,069 | 47.1 | % | (Won) | 352 | 0.2 | % | (Won) | 426 | 0.2 | % | (Won) | 232 | 0.1 | % | (Won) | 659 | 0.3 | % | (Won) | 101,738 | 47.9 | % | ||||||||||||||||||||||||
| Lease financing |
662 | 0.3 | % | 16 | 0.0 | % | 5 | 0.0 | % | 6 | 0.0 | % | 11 | 0.0 | % | 700 | 0.3 | % | ||||||||||||||||||||||||||||||
| Trade financing |
13,102 | 6.2 | % | 23 | 0.0 | % | 27 | 0.0 | % | 6 | 0.0 | % | 11 | 0.0 | % | 13,171 | 6.2 | % | ||||||||||||||||||||||||||||||
| Other commercial |
9,860 | 4.6 | % | 25 | 0.0 | % | 31 | 0.0 | % | 8 | 0.0 | % | 1,003 | 0.5 | % | 10,927 | 5.1 | % | ||||||||||||||||||||||||||||||
|
|
|
|
|
|
|
|
|
|
|
|
|
|
|
|
|
|
|
|
|
|
|
|
|
|||||||||||||||||||||||||
| Total corporate |
123,693 | 58.2 | % | 416 | 0.2 | % | 489 | 0.2 | % | 254 | 0.1 | % | 1,684 | 0.8 | % | 126,536 | 59.5 | % | ||||||||||||||||||||||||||||||
| Consumer |
||||||||||||||||||||||||||||||||||||||||||||||||
| General purpose household |
32,048 | 15.1 | % | 391 | 0.2 | % | 74 | 0.0 | % | 61 | 0.0 | % | 135 | 0.1 | % | 32,709 | 15.4 | % | ||||||||||||||||||||||||||||||
| Mortgages |
12,016 | 5.7 | % | 93 | 0.0 | % | 8 | 0.0 | % | 7 | 0.0 | % | 14 | 0.0 | % | 12,138 | 5.7 | % | ||||||||||||||||||||||||||||||
| Home equity |
27,399 | 12.9 | % | 346 | 0.2 | % | 54 | 0.0 | % | 42 | 0.0 | % | 99 | 0.0 | % | 27,940 | 13.1 | % | ||||||||||||||||||||||||||||||
|
|
|
|
|
|
|
|
|
|
|
|
|
|
|
|
|
|
|
|
|
|
|
|
|
|||||||||||||||||||||||||
| Total consumer |
71,463 | 33.6 | % | 830 | 0.4 | % | 136 | 0.1 | % | 110 | 0.1 | % | 248 | 0.1 | % | 72,787 | 34.2 | % | ||||||||||||||||||||||||||||||
| Credit cards |
4,329 | 2.0 | % | 146 | 0.1 | % | 48 | 0.0 | % | 47 | 0.0 | % | 2 | 0.0 | % | 4,592 | 2.1 | % | ||||||||||||||||||||||||||||||
|
|
|
|
|
|
|
|
|
|
|
|
|
|
|
|
|
|
|
|
|
|
|
|
|
|||||||||||||||||||||||||
| Total domestic |
199,505 | 93.9 | % | 1,392 | 0.7 | % | 673 | 0.3 | % | 411 | 0.2 | % | 1,934 | 0.9 | % | 203,915 | 96.0 | % | ||||||||||||||||||||||||||||||
| Foreign |
||||||||||||||||||||||||||||||||||||||||||||||||
| Corporate(2) |
||||||||||||||||||||||||||||||||||||||||||||||||
| Commercial and industrial |
7,919 | 3.7 | % | 5 | 0.0 | % | 14 | 0.0 | % | 58 | 0.0 | % | 17 | 0.0 | % | 8.013 | 3.7 | % | ||||||||||||||||||||||||||||||
| Lease financing |
— | 0.0 | % | — | 0.0 | % | — | 0.0 | % | — | 0.0 | % | — | 0.0 | % | — | 0.0 | % | ||||||||||||||||||||||||||||||
| Trade financing |
165 | 0.1 | % | — | 0.0 | % | — | 0.0 | % | — | 0.0 | % | — | 0.0 | % | 165 | 0.1 | % | ||||||||||||||||||||||||||||||
| Other commercial |
272 | 0.1 | % | — | 0.0 | % | — | 0.0 | % | — | 0.0 | % | — | 0.0 | % | 272 | 0.1 | % | ||||||||||||||||||||||||||||||
|
|
|
|
|
|
|
|
|
|
|
|
|
|
|
|
|
|
|
|
|
|
|
|
|
|||||||||||||||||||||||||
| Total corporate |
8,356 | 3.9 | % | 5 | 0.0 | % | 14 | 0.0 | % | 58 | 0.0 | % | 17 | 0.0 | % | 8,450 | 3.9 | % | ||||||||||||||||||||||||||||||
| Consumer |
124 | 0.1 | % | 1 | 0.0 | % | — | 0.0 | % | — | 0.0 | % | 2 | 0.0 | % | 127 | 0.1 | % | ||||||||||||||||||||||||||||||
|
|
|
|
|
|
|
|
|
|
|
|
|
|
|
|
|
|
|
|
|
|
|
|
|
|||||||||||||||||||||||||
| Total foreign |
8,480 | 4.0 | % | 6 | 0.0 | % | 14 | 0.0 | % | 58 | 0.0 | % | 19 | 0.0 | % | 8,577 | 4.0 | % | ||||||||||||||||||||||||||||||
|
|
|
|
|
|
|
|
|
|
|
|
|
|
|
|
|
|
|
|
|
|
|
|
|
|||||||||||||||||||||||||
| Total loans(3) |
(Won) | 207,985 | 97.9 | % | (Won) | 1,398 | 0.7 | % | (Won) | 687 | 0.3 | % | (Won) | 469 | 0.2 | % | (Won) | 1,953 | 0.9 | % | (Won) | 212,492 | 100.0 | % | ||||||||||||||||||||||||
|
|
|
|
|
|
|
|
|
|
|
|
|
|
|
|
|
|
|
|
|
|
|
|
|
|||||||||||||||||||||||||
| (1) | Including loans made to banks and the Korean government and government-owned agencies. |
| (2) | Including loans made to banks. |
| (3) | Not including due from banks and other receivables, and prior to deducting provisions for credit losses and present value discount or reflecting deferred origination costs. |
85
Table of Contents
| As of December 31, 2010 | ||||||||||||||||||||||||||||||||||||||||||||||||
| Normal | Past due
by 1 month or less |
Past due by 1-3 months |
Past due by 3-6 months |
Past due by more than 6 months |
Total | |||||||||||||||||||||||||||||||||||||||||||
| Amount | % | Amount past due |
% | Amount past due |
% | Amount past due |
% | Amount past due |
% | Amount past due |
% | |||||||||||||||||||||||||||||||||||||
| (in billions of Won, except percentages) | ||||||||||||||||||||||||||||||||||||||||||||||||
| Domestic |
||||||||||||||||||||||||||||||||||||||||||||||||
| Corporate(1) |
||||||||||||||||||||||||||||||||||||||||||||||||
| Commercial and industrial |
(Won) | 96,420 | 47.9 | % | (Won) | 333 | 0.2 | % | (Won) | 297 | 0.1 | % | (Won) | 424 | 0.2 | % | (Won) | 721 | 0.4 | % | (Won) | 98,195 | 48.8 | % | ||||||||||||||||||||||||
| Lease financing |
618 | 0.3 | % | 10 | 0.0 | % | 10 | 0.0 | % | 8 | 0.0 | % | 7 | 0.0 | % | 653 | 0.3 | % | ||||||||||||||||||||||||||||||
| Trade financing |
10,922 | 5.4 | % | 35 | 0.0 | % | 43 | 0.0 | % | 305 | 0.2 | % | 27 | 0.0 | % | 11,332 | 5.6 | % | ||||||||||||||||||||||||||||||
| Other commercial |
11,810 | 5.9 | % | 12 | 0.0 | % | 33 | 0.0 | % | 22 | 0.0 | % | 681 | 0.3 | % | 12,558 | 6.2 | % | ||||||||||||||||||||||||||||||
|
|
|
|
|
|
|
|
|
|
|
|
|
|
|
|
|
|
|
|
|
|
|
|
|
|||||||||||||||||||||||||
| Total corporate |
119,770 | 59.5 | % | 390 | 0.2 | % | 383 | 0.2 | % | 759 | 0.4 | % | 1,436 | 0.7 | % | 122,738 | 60.9 | % | ||||||||||||||||||||||||||||||
| Consumer |
||||||||||||||||||||||||||||||||||||||||||||||||
| General purpose household |
32,505 | 16.2 | % | 286 | 0.1 | % | 56 | 0.0 | % | 64 | 0.0 | % | 81 | 0.0 | % | 32,992 | 16.3 | % | ||||||||||||||||||||||||||||||
| Mortgages |
6,310 | 3.1 | % | 46 | 0.0 | % | 7 | 0.0 | % | 6 | 0.0 | % | 6 | 0.0 | % | 6,375 | 3.1 | % | ||||||||||||||||||||||||||||||
| Home equity |
26,266 | 13.1 | % | 248 | 0.1 | % | 31 | 0.0 | % | 42 | 0.0 | % | 58 | 0.0 | % | 26,645 | 13.2 | % | ||||||||||||||||||||||||||||||
|
|
|
|
|
|
|
|
|
|
|
|
|
|
|
|
|
|
|
|
|
|
|
|
|
|||||||||||||||||||||||||
| Total consumer |
65,081 | 32.3 | % | 580 | 0.3 | % | 94 | 0.0 | % | 112 | 0.1 | % | 145 | 0.1 | % | 66,012 | 32.6 | % | ||||||||||||||||||||||||||||||
| Credit cards |
4,151 | 2.1 | % | 103 | 0.1 | % | 50 | 0.0 | % | 47 | 0.0 | % | 6 | 0.0 | % | 4,357 | 2.2 | % | ||||||||||||||||||||||||||||||
|
|
|
|
|
|
|
|
|
|
|
|
|
|
|
|
|
|
|
|
|
|
|
|
|
|||||||||||||||||||||||||
| Total domestic |
189,002 | 93.9 | % | 1,073 | 0.5 | % | 527 | 0.3 | % | 918 | 0.5 | % | 1,587 | 0.8 | % | 193,107 | 96.0 | % | ||||||||||||||||||||||||||||||
| Foreign |
||||||||||||||||||||||||||||||||||||||||||||||||
| Corporate(2) |
||||||||||||||||||||||||||||||||||||||||||||||||
| Commercial and industrial |
7,157 | 3.6 | % | 1 | 0.0 | % | 12 | 0.0 | % | 1 | 0.0 | % | 14 | 0.0 | % | 7,185 | 3.6 | % | ||||||||||||||||||||||||||||||
| Lease financing |
— | 0.0 | % | — | 0.0 | % | — | 0.0 | % | — | 0.0 | % | — | 0.0 | % | — | 0.0 | % | ||||||||||||||||||||||||||||||
| Trade financing |
129 | 0.1 | % | — | 0.0 | % | — | 0.0 | % | — | 0.0 | % | — | 0.0 | % | 129 | 0.1 | % | ||||||||||||||||||||||||||||||
| Other commercial |
69 | 0.0 | % | — | 0.0 | % | — | 0.0 | % | — | 0.0 | % | — | 0.0 | % | 69 | 0.0 | % | ||||||||||||||||||||||||||||||
|
|
|
|
|
|
|
|
|
|
|
|
|
|
|
|
|
|
|
|
|
|
|
|
|
|||||||||||||||||||||||||
| Total corporate |
7,355 | 3.7 | % | 1 | 0.0 | % | 12 | 0.0 | % | 1 | 0.0 | % | 14 | 0.0 | % | 7,383 | 3.7 | % | ||||||||||||||||||||||||||||||
| Consumer |
731 | 0.4 | % | 5 | 0.0 | % | 3 | 0.0 | % | 2 | 0.0 | % | 4 | 0.0 | % | 745 | 0.4 | % | ||||||||||||||||||||||||||||||
|
|
|
|
|
|
|
|
|
|
|
|
|
|
|
|
|
|
|
|
|
|
|
|
|
|||||||||||||||||||||||||
| Total foreign |
8,086 | 4.0 | % | 6 | 0.0 | % | 15 | 0.0 | % | 3 | 0.0 | % | 18 | 0.0 | % | 8,128 | 4.0 | % | ||||||||||||||||||||||||||||||
|
|
|
|
|
|
|
|
|
|
|
|
|
|
|
|
|
|
|
|
|
|
|
|
|
|||||||||||||||||||||||||
| Total loans(3) |
(Won) | 197,088 | 97.9 | % | (Won) | 1,079 | 0.5 | % | (Won) | 542 | 0.3 | % | (Won) | 921 | 0.5 | % | (Won) | 1,605 | 0.8 | % | (Won) | 201,235 | 100.0 | % | ||||||||||||||||||||||||
|
|
|
|
|
|
|
|
|
|
|
|
|
|
|
|
|
|
|
|
|
|
|
|
|
|||||||||||||||||||||||||
| (1) | Including loans made to banks and the Korean government and government-owned agencies. |
| (2) | Including loans made to banks. |
| (3) | Not including due from banks and other receivables, and prior to deducting provisions for credit losses and present value discount or reflecting deferred origination costs. |
The following table shows our loan aging schedule (excluding accrued interest) as of December 31, 2009 under U.S. GAAP.
| Normal | 1-3 months | 3-6 months | More than 6 months | Total | ||||||||||||||||||||||||||||||||||||
| As of December 31, |
Amount | % | Amount past due |
% | Amount past due |
% | Amount past due |
% | Amount | % | ||||||||||||||||||||||||||||||
| (in billions of Won, except percentages) | ||||||||||||||||||||||||||||||||||||||||
| 2009 |
185,250 | 98.8 | % | 1,375 | 0.7 | % | 324 | 0.2 | % | 570 | 0.3 | % | 187,519 | 100.0 | % | |||||||||||||||||||||||||
Credit Exposures to Companies in Workout, Restructuring or Rehabilitation
Workout is a voluntary procedure through which we, together with the borrower and other creditors, restructure a borrower’s credit terms. Previously, workouts were regulated under the Corporate Restructuring Promotion Act, which was enacted in 2007 and expired on December 31, 2010. In April 2011, the National Assembly of Korea adopted a new Corporate Restructuring Promotion Act, or the New Corporate Restructuring Promotion Act, which became effective on May 19, 2011. Workouts that had been initiated under the Corporate Restructuring Promotion Act are also governed by the New Corporate Restructuring Promotion Act effective from May 19, 2011. Under the New Corporate Restructuring Promotion Act, which is similar to the Corporate Restructuring Promotion Act, all creditor financial institutions of a financially troubled borrower are required to participate in a creditors’ committee which is authorized to prohibit such creditor financial institutions from
86
Table of Contents
exercising their rights against the borrower, commencing workout procedures or approving a reorganization plan prepared by the borrower. Any decision of the creditors’ committee requires the approval of creditor financial institutions holding interests as creditor in 75% or more of the total debt outstanding of a borrower. An additional approval of creditor financial institutions holding interests as creditor in 75% or more of the secured debt is required with respect to the borrower’s debt restructuring. Once approved, any decision made by the creditors’ committee is binding on all the creditor financial institutions of the borrower. Creditor financial institutions that voted against commencement of workout, debt restructuring or granting of new credit have the right to request the creditor financial institutions that voted in favor of such matters to purchase their claims at a mutually agreed price. In the event that the parties are not able to agree on the terms of purchase, a coordination committee consisting of experts would determine the terms. The creditor financial institutions that oppose a decision made by the coordination committee may request a court to change such decision. The New Corporate Restructuring Promotion Act is scheduled to expire on December 31, 2013.
Korean law also provides for corporate rehabilitation proceedings, which are court-supervised procedures to rehabilitate an insolvent company. Under these procedures, a restructuring plan is adopted at a meeting of interested parties, including creditors of the company. That restructuring plan is subject to court approval.
A portion of our loans to and debt securities of corporate customers are currently in workout, restructuring or rehabilitation. As of December 31, 2011, (Won)3,316 billion, or 1.3%, of our total loans and debt securities were in workout, restructuring or rehabilitation. This included (Won)1,973 billion of loans to and debt securities of large corporate borrowers in workout, restructuring or rehabilitation and (Won)1,343 billion of loans to and debt securities of small- and medium-sized enterprises in workout, restructuring or rehabilitation, which represented 0.8% and 0.5% of our total loans and debt securities, respectively. Currently, a specialized unit in each of our banking subsidiaries manages their workout, restructured and rehabilitated loans. At Woori Bank, for example, the Corporate Restoration Department manages its workout, restructured and rehabilitated loans. Upon approval of a workout, restructuring or rehabilitation plan, a credit exposure is initially classified as precautionary or lower and thereafter cannot be classified higher than precautionary with limited exceptions. If a corporate borrower is in workout, restructuring or rehabilitation, we take the status of the borrower into account in valuing our loans to and collateral from that borrower for purposes of establishing our provisions for credit losses.
The following table shows, as of December 31, 2011, our ten largest exposures that were in workout, restructuring or rehabilitation:
| Loans | Guarantees and Acceptances |
Amounts Classified as Substandard or Below(3) |
Provisions for Credit Loss |
|||||||||||||||||||||||||||||||||
|
Company |
Won Currency |
Foreign Currency |
Equity Securities |
Debt Securities |
Total Exposures |
Collateral(2) | ||||||||||||||||||||||||||||||
| (in billions of Won) | ||||||||||||||||||||||||||||||||||||
| Kumho Industrial (B+) |
(Won) | 357 | — | (Won) | 48 | (Won) | 79 | (Won) | 79 | (Won) | 563 | (Won) | 341 | — | (Won) | 23 | ||||||||||||||||||||
| Kumho Tire (B+) |
424 | (Won) | 32 | 25 | — | 23 | 504 | 109 | — | 55 | ||||||||||||||||||||||||||
| Poonglim (D) |
379 | — | — | — | 2 | 381 | 119 | (Won) | 379 | 306 | ||||||||||||||||||||||||||
| Shina SB (D) |
16 | — | — | — | 333 | 349 | 335 | 16 | 15 | |||||||||||||||||||||||||||
| Byucksan Construction (D) |
150 | — | — | — | 6 | 156 | 93 | 156 | 107 | |||||||||||||||||||||||||||
| 21st Century Shipbuilding (D) |
49 | 2 | 1 | — | 64 | 116 | 32 | 90 | 78 | |||||||||||||||||||||||||||
| Chinhung (D) |
100 | — | — | — | — | 100 | — | 100 | 86 | |||||||||||||||||||||||||||
| Jeil Construction(B+) |
96 | — | — | — | — | 96 | 66 | — | 4 | |||||||||||||||||||||||||||
| Namkwang Engineering & Construction (D) |
64 | — | — | — | 8 | 72 | 34 | 50 | 48 | |||||||||||||||||||||||||||
| Samho Heavy Industries (C) |
66 | — | — | — | — | 66 | 43 | 66 | 17 | |||||||||||||||||||||||||||
|
|
|
|
|
|
|
|
|
|
|
|
|
|
|
|
|
|
|
|||||||||||||||||||
| Total |
(Won) | 1,701 | (Won) | 34 | (Won) | 74 | (Won) | 79 | (Won) | 515 | (Won) | 2,403 | (Won) | 1,172 | (Won) | 857 | (Won) | 739 | ||||||||||||||||||
|
|
|
|
|
|
|
|
|
|
|
|
|
|
|
|
|
|
|
|||||||||||||||||||
| (1) | Credit rating as of December 31, 2011, from one of the following Korean credit agencies: Korea Information Service Inc., National Information & Credit Evaluation, Inc. or Korea Ratings. |
| (2) | The value of collateral is appraised based on future cash flow and observable market price. |
| (3) | Classification is based on the Financial Services Commission’s asset classification criteria. |
87
Table of Contents
Troubled Debt Restructurings
The following table presents, as of the dates indicated, our loans that are “troubled debt restructurings” for which we for economic or legal reasons relating to the debtor’s financial difficulties grant a concession to the debtor that we would not otherwise consider. These loans consist principally of corporate loans that are accruing interest at rates lower than the original contractual terms as a result of a variation of terms upon restructuring.
| As of December 31, | ||||||||||||||||||||||||||||||||||||||||||||||||||||||||||||
| 2007 | 2008 | 2009 | 2010 | 2011 | ||||||||||||||||||||||||||||||||||||||||||||||||||||||||
| Domestic | Foreign | Total | Domestic | Foreign | Total | Domestic | Foreign | Total | Domestic | Foreign | Total | Domestic | Foreign | Total | ||||||||||||||||||||||||||||||||||||||||||||||
| (in billions of Won) | ||||||||||||||||||||||||||||||||||||||||||||||||||||||||||||
| Loans not included in “non-accrual and past due loans” which are classified as “troubled debt restructurings” |
(Won) | 329 | — | (Won) | 329 | (Won) | 483 | — | (Won) | 483 | (Won) | 1,518 | — | (Won) | 1,518 | (Won) | 2,791 | — | (Won) | 2,791 | (Won) | 3,233 | — | (Won) | 3,233 | |||||||||||||||||||||||||||||||||||
For 2011, interest income that we would have recorded under the original contract terms of restructured loans amounted to (Won)53 billion, of which we reflected (Won)42 billion as interest income for 2011.
Potential Problem Loans
As of December 31, 2011, we had (Won)4,496 billion of corporate loans in respect of which we had serious doubt as to the borrower’s ability to comply with repayment terms in the near future. Potential problem loans are precautionary loans that we determine, through our internal loan review process, require close management due to the borrower’s financial condition, our forecast for the industry in which it operates or as a result of other developments relating to its business.
Other Problematic Interest-Earning Assets
We have in the past received certain other interest-earning assets in connection with troubled debt restructurings that, if they were loans, would be required to be disclosed as part of the non-accrual, past due or restructuring or potential problem loan disclosures provided above. However, as of December 31, 2011, we had no such assets.
Non-Performing Loans
Non-performing loans are defined as those loans that are classified as substandard or below based on the Financial Services Commission’s asset classification criteria. See “—Loan Classifications” above. The following table shows, as of the dates indicated, certain details of our total non-performing loan portfolio under IFRS:
| As of December 31, | ||||||||
| 2010 | 2011 | |||||||
| (in billions of Won, except percentages) | ||||||||
| Total non-performing loans |
(Won) | 6,550 | (1) | (Won) | 3,780 | (2) | ||
| As a percentage of total loans |
3.3 | % | 1.8 | % | ||||
| (1) | Excludes (Won)34 billion of previously delinquent credit card balances restructured into loans that were classified as normal or precautionary. |
| (2) | Excludes (Won)43 billion of previously delinquent credit card balances restructured into loans that were classified as normal or precautionary. |
88
Table of Contents
The following table shows, as of the dates indicated, certain details of our total non-performing loan portfolio under U.S. GAAP:
| As of December 31, | ||||||||||||
| 2007 | 2008 | 2009 | ||||||||||
| (in billions of Won, except percentages) | ||||||||||||
| Total non-performing loans |
(Won) | 1,121 | (1) | (Won) | 2,088 | (2) | (Won) | 2,489 | (3) | |||
| As a percentage of total loans |
0.7 | % | 1.1 | % | 1.3 | % | ||||||
| (1) | Excludes (Won)5 billion of previously delinquent credit card balances restructured into loans that were classified as normal or precautionary. |
| (2) | Excludes (Won)14 billion of previously delinquent credit card balances restructured into loans that were classified as normal or precautionary. |
| (3) | Excludes (Won)20 billion of previously delinquent credit card balances restructured into loans that were classified as normal or precautionary. |
The above amounts do not include loans classified as substandard or below that we or any of our predecessor entities sold to KAMCO, United Asset Management Corp. or to certain special purpose companies. See “—Sales of Non-Performing Loans.”
We have also issued securities backed by non-performing loans and other assets. Some of these transactions involved transfers of loans through securitizations where control of the loans has not been surrendered and, therefore, are not treated as sale transactions. Instead, the assets remain on our balance sheet with the securitization proceeds treated as part of borrowings. These assets are included in the table above.
The following table sets forth, as of the dates indicated, our total non-performing loans by type of loan under IFRS:
| As of December 31, | ||||||||||||||||
| 2010 | 2011 | |||||||||||||||
| Amount | % | Amount | % | |||||||||||||
| (in billions of Won, except percentages) | ||||||||||||||||
| Domestic |
||||||||||||||||
| Corporate |
||||||||||||||||
| Commercial and industrial |
(Won) | 5,317 | 81.2 | % | (Won) | 2,846 | 75.3 | % | ||||||||
| Lease financing |
3 | 0.1 | 6 | 0.1 | ||||||||||||
| Trade financing |
245 | 3.7 | 98 | 2.6 | ||||||||||||
| Other commercial |
526 | 8.0 | 281 | 7.4 | ||||||||||||
|
|
|
|
|
|
|
|
|
|||||||||
| Total corporate |
6,091 | 93.0 | 3,231 | 85.4 | ||||||||||||
| Consumer |
||||||||||||||||
| General purpose household(1) |
294 | 4.4 | 378 | 10.0 | ||||||||||||
| Mortgage |
12 | 0.2 | 18 | 0.5 | ||||||||||||
|
|
|
|
|
|
|
|
|
|||||||||
| Total consumer |
306 | 4.6 | 396 | 10.5 | ||||||||||||
| Credit cards |
51 | 0.8 | 63 | 1.7 | ||||||||||||
|
|
|
|
|
|
|
|
|
|||||||||
| Total domestic |
6,448 | 98.4 | 3,690 | 97.6 | ||||||||||||
| Foreign |
||||||||||||||||
| Corporate |
||||||||||||||||
| Commercial and industrial |
65 | 1.0 | 90 | 2.4 | ||||||||||||
| Lease financing |
— | — | — | — | ||||||||||||
| Trade financing |
— | — | — | — | ||||||||||||
| Other commercial |
— | — | — | — | ||||||||||||
|
|
|
|
|
|
|
|
|
|||||||||
| Total corporate |
65 | 1.0 | 90 | 2.4 | ||||||||||||
| Consumer |
37 | 0.6 | — | 0.0 | ||||||||||||
|
|
|
|
|
|
|
|
|
|||||||||
| Total foreign |
102 | 1.6 | 90 | 2.4 | ||||||||||||
|
|
|
|
|
|
|
|
|
|||||||||
| Total non- performing loans |
(Won) | 6,550 | 100.0 | % | (Won) | 3,780 | 100.0 | % | ||||||||
|
|
|
|
|
|
|
|
|
|||||||||
| (1) | Includes home equity loans. |
89
Table of Contents
The following table sets forth, as of the dates indicated, our total non-performing loans by type of loan under U.S. GAAP:
| As of December 31, | ||||||||||||||||||||||||
| 2007 | 2008 | 2009 | ||||||||||||||||||||||
| Amount | % | Amount | % | Amount | % | |||||||||||||||||||
| (in billions of Won, except percentages) | ||||||||||||||||||||||||
| Domestic |
||||||||||||||||||||||||
| Corporate |
||||||||||||||||||||||||
| Commercial and industrial |
(Won) | 788 | 70.3 | % | (Won) | 1,592 | 76.2 | % | (Won) | 1,819 | 73.1 | % | ||||||||||||
| Lease financing |
4 | 0.4 | 9 | 0.4 | 11 | 0.4 | ||||||||||||||||||
| Trade financing |
45 | 4.0 | 112 | 5.4 | 112 | 4.5 | ||||||||||||||||||
| Other commercial |
4 | 0.4 | 7 | 0.3 | 152 | 6.1 | ||||||||||||||||||
|
|
|
|
|
|
|
|
|
|
|
|
|
|||||||||||||
| Total corporate |
841 | 75.1 | 1,720 | 82.4 | 2,094 | 84.1 | ||||||||||||||||||
| Consumer |
||||||||||||||||||||||||
| General purpose household(1) |
241 | 21.5 | 285 | 13.6 | 257 | 10.3 | ||||||||||||||||||
| Mortgage |
— | — | 12 | 0.6 | 10 | 0.4 | ||||||||||||||||||
|
|
|
|
|
|
|
|
|
|
|
|
|
|||||||||||||
| Total consumer |
241 | 21.5 | 297 | 14.2 | 267 | 10.7 | ||||||||||||||||||
| Credit cards |
36 | 3.2 | 57 | 2.7 | 52 | 2.1 | ||||||||||||||||||
|
|
|
|
|
|
|
|
|
|
|
|
|
|||||||||||||
| Total domestic |
1,118 | 99.7 | 2,074 | 99.3 | 2,413 | 96.9 | ||||||||||||||||||
| Foreign |
||||||||||||||||||||||||
| Corporate |
||||||||||||||||||||||||
| Commercial and industrial |
3 | 0.3 | 14 | 0.7 | 76 | 3.1 | ||||||||||||||||||
| Lease financing |
— | — | — | — | — | — | ||||||||||||||||||
| Trade financing |
— | — | — | — | — | — | ||||||||||||||||||
| Other commercial |
— | — | — | — | — | — | ||||||||||||||||||
|
|
|
|
|
|
|
|
|
|
|
|
|
|||||||||||||
| Total corporate |
3 | 0.3 | 14 | 0.7 | 76 | 3.1 | ||||||||||||||||||
| Consumer |
— | — | — | — | — | — | ||||||||||||||||||
|
|
|
|
|
|
|
|
|
|
|
|
|
|||||||||||||
| Total foreign |
3 | 0.3 | 14 | 0.7 | 76 | 3.1 | ||||||||||||||||||
|
|
|
|
|
|
|
|
|
|
|
|
|
|||||||||||||
| Total non-performing loans |
(Won) | 1,121 | 100.0 | % | (Won) | 2,088 | 100.0 | % | (Won) | 2,489 | 100.0 | % | ||||||||||||
|
|
|
|
|
|
|
|
|
|
|
|
|
|||||||||||||
| (1) | Includes home equity loans. |
The following table presents an analysis of the changes in our non-performing loans under IFRS for 2011:
| 2011 | ||||
| (in billions of Won) | ||||
| Non-performing loans as of January 1, 2011 |
6,550 | |||
| Additions to non-performing loans |
3,682 | |||
| Loans transferred into non-performing loans |
3,682 | |||
| Reductions in non-performing loans |
(6,452 | ) | ||
| Loans transferred to the held-for-sale investment portfolio |
— | |||
| Loans sold |
(1,643 | ) | ||
| Loans modified and returned to performing loans |
(1,229 | ) | ||
| Loans paid down or paid off |
(1,088 | ) | ||
| Loans charged-off |
(2,369 | ) | ||
| Others |
(123 | ) | ||
| Total net additions to non-performing loans |
(2,770 | ) | ||
|
|
|
|||
| Total non-performing loans as of December 31, 2011 |
3,780 | |||
|
|
|
|||
90
Table of Contents
Top 20 Non-Performing Loans. As of December 31, 2011, our 20 largest non-performing loans accounted for 39.5% of our total non-performing loan portfolio. The following table shows, as of that date, certain information regarding those loans:
| Gross principal outstanding |
Provisions for credit losses |
Collateral(1) | Industry | |||||||||||
| (in billions of Won) | ||||||||||||||
| Borrower A |
(Won) | 377 | (Won) | 290 | (Won) | 28 | Construction | |||||||
| Borrower B |
155 | 107 | — | Construction | ||||||||||
| Borrower C |
100 | 86 | — | Construction | ||||||||||
| Borrower D |
90 | 77 | — | Manufacturing | ||||||||||
| Borrower E |
66 | 17 | 43 | Manufacturing | ||||||||||
| Borrower F |
66 | 46 | — | Construction | ||||||||||
| Borrower G |
62 | 32 | — | Construction | ||||||||||
| Borrower H |
61 | 8 | — | Manufacturing | ||||||||||
| Borrower I |
60 | 2 | — | Other | ||||||||||
| Borrower J |
56 | 18 | — | Financial and insurance | ||||||||||
| Borrower K |
51 | 13 | — | Financial and insurance | ||||||||||
| Borrower L |
50 | 48 | — | Construction | ||||||||||
| Borrower M |
47 | 8 | — | Retail and wholesale | ||||||||||
| Borrower N |
46 | 22 | — | Manufacturing | ||||||||||
| Borrower O |
41 | 12 | — | Manufacturing | ||||||||||
| Borrower P |
48 | 31 | — | Construction | ||||||||||
| Borrower Q |
31 | 10 | — | Construction | ||||||||||
| Borrower R |
30 | 7 | — | Other | ||||||||||
| Borrower S |
29 | 19 | — | Manufacturing | ||||||||||
| Borrower T |
28 | 17 | — | Manufacturing | ||||||||||
|
|
|
|
|
|
|
|||||||||
| Total |
(Won) | 1,494 | (Won) | 870 | (Won) | 71 | ||||||||
|
|
|
|
|
|
|
|||||||||
| (1) | The value of collateral is appraised based on future cash flow and observable market price. |
Non-Performing Loan Strategy
One of our goals is to improve our asset quality, in part by reducing our non-performing loans. We have standardized the credit risk management systems of our subsidiaries to reduce our risks relating to future non-performing loans. Our credit rating systems are designed to prevent our subsidiaries from extending new loans to high-risk borrowers as determined by their credit rating. Our credit monitoring systems are designed to bring any sudden increase in a borrower’s credit risk to the attention of our subsidiaries, which then closely monitor such loans. See “Item 11. Quantitative and Qualitative Disclosures about Market Risk—Credit Risk Management.”
Each of our subsidiaries has one or more units that are responsible for managing non-performing loans. At Woori Bank, for example, the Credit Management and Collection Department and the Corporate Restoration Department generally oversee the process for resolving non-performing loans transferred to them by other Woori Bank business units. We believe that by centralizing the management of our non-performing loans within each subsidiary, we can become more effective in dealing with the issues relating to these loans by pooling institutional knowledge and creating a more specialized workforce.
91
Table of Contents
When a loan becomes non-performing, the units at our banking subsidiaries that are responsible for monitoring non-performing loans will begin a due diligence review of the borrower’s assets, send a notice demanding payment or stating that we will take legal action, and prepare for legal action. At the same time, we initiate our non-performing loan management process, which begins with:
| • | identifying loans subject to a proposed sale by assessing the estimated losses from such sale based on the estimated recovery value of collateral, if any, for such non-performing loans; |
| • | identifying loans subject to charge-off based on the estimated recovery value of collateral, if any, for such non-performing loans and the estimated rate of recovery of unsecured loans; and |
| • | on a limited basis, identifying corporate loans subject to normalization efforts based on the cash-flow situation of the borrower. |
Once we have confirmed the details of a non-performing loan, we make efforts to recover amounts owed to us. Methods for resolving non-performing loans include the following:
| • | commencing collection proceedings; |
| • | commencing legal actions to seize collateral; |
| • | writing off these amounts, transferring them to specific subsidiaries in charge of collections and authorizing those subsidiaries to recover what they can with respect to these amounts or to sell these loans to third parties; and |
| • | with respect to large corporations, commencing or participating in voluntary workouts or restructurings mandated by Korean courts. |
In addition to making efforts to collect on our non-performing loans, we also undertake measures to reduce the overall level of our non-performing loans. These measures include:
| • | selling our non-performing loans to special purpose companies established in connection with our joint ventures with several financial institutions; and |
| • | selling our non-performing loans to third parties, including KAMCO and United Asset Management Corp. |
See “—Sales of Non-Performing Loans.” We generally expect to suffer a partial loss on loans that we sell or securitize, to the extent such sales and securitizations are recognized as such under IFRS.
Foreclosure and Collateral. We generally foreclose on mortgages or exercise our security interests in respect of other collateral if a collateralized obligation becomes overdue for more than three months. At that time, we will petition a court to foreclose on collateral and to sell that collateral through a court-supervised auction. Under Korean law, that petition must be filed with a court that has jurisdiction over the mortgaged property, and must be filed together with a copy of the mortgage agreement and an extract of the court registry regarding the subject property. The court will then issue an order to commence the foreclosure auction, which will be registered in the court registry of the subject property. If no bidder bids at least the minimum amount set by the court on the first auction date, the court will set another date for a subsequent auction approximately one month later. Each time a new auction date is set, the minimum auction price will be lowered by approximately 20%. Unlike laws relating to foreclosure in the United States, Korean law does not provide for non-judicial foreclosure. During 2010 and 2011, we foreclosed on collateral we obtained with respect to loan balances representing approximately 0.2% and 0.2% respectively, of our average interest-bearing loan balances in each of those periods.
Korean financial institutions, including us, maintain general policies to assess a potential customer’s eligibility for loans based on that entity’s credit quality, rather than requiring a particular level of collateral, especially in the case of large corporate borrowers. As a result, the ratio of our collateral to non-performing corporate loans is relatively low when compared with our total exposures. For secured consumer loans, however,
92
Table of Contents
we generally impose limits on loan amounts based on the collateral we receive. See “—Consumer Banking—Lending Activities.”
We reflect this collateral level when we estimate the future cash flow for our loans, which we calculate using a discounted cash flow method. With respect to loans to borrowers that we do not believe will be going concerns in the future, the lower collateral ratio has a direct effect on cash flow estimates and results in a higher level of provisions. With respect to loans to borrowers that we expect to be going concerns, the lower collateral ratio has an effect on cash flow estimates but we also consider other factors, including future operating income and future asset disposals and restructuring, in determining provision levels. Accordingly, for these latter borrowers, the effect of lower collateral levels on provisions is mitigated by other characteristics of the borrower, and that lower collateral level will not necessarily result in a higher level of provisions.
Sales of Non-Performing Loans
The overall asset quality of our loan portfolio is affected by sales of non-performing loans. These sales have been made primarily to KAMCO, United Asset Management Corp. and various special purpose companies as further described below.
The following table sets forth information regarding our sales of loans for the periods indicated:
| Year Ended December 31, | ||||||||||||||||||||||||
| 2010 | 2011 | |||||||||||||||||||||||
| Purchaser |
Principal Amount Sold |
Sale Price |
Gain (loss) |
Principal Amount Sold |
Sale Price |
Gain (loss) |
||||||||||||||||||
| (in billions of Won) | ||||||||||||||||||||||||
| KAMCO |
(Won) | 346 | (Won) | 187 | (Won) | (87 | ) | (Won) | 179 | (Won) | 56 | (Won) | (27 | ) | ||||||||||
| Special purpose companies |
763 | 663 | 25 | 281 | 247 | 13 | ||||||||||||||||||
|
UAMCO(1) |
256 | 172 | (19 | ) | 829 | 526 | (105 | ) | ||||||||||||||||
| Others |
— | 4 | 4 | 354 | 132 | (35 | ) | |||||||||||||||||
|
|
|
|
|
|
|
|
|
|
|
|
|
|||||||||||||
| Total |
(Won) | 1,365 | (Won) | 1,026 | (Won) | (77 | ) | (Won) | 1,643 | (Won) | 961 | (Won) | (154 | ) | ||||||||||
|
|
|
|
|
|
|
|
|
|
|
|
|
|||||||||||||
| (1) | For the year ended December 31, 2011, includes sales to the private equity fund for which UAMCO serves as the general partner. See “United Asset Management Corp.” |
Korea Asset Management Corporation. The Korean government has authorized KAMCO to purchase certain assets (primarily loans classified as substandard or below) from Korean financial institutions at discounted prices. In addition, in March 2009, the Korean government announced its plans to provide support to financial institutions and companies in the project finance industry by purchasing, through KAMCO, up to (Won)4.7 trillion of project finance loans designated by the Financial Supervisory Service as “endangered.”
Pursuant to the terms of certain of these sales, KAMCO can require us to repurchase substandard or below loans we have sold to it in the event that:
| • | the underlying documentation of the loan is incomplete; |
| • | there is a flaw in the perfection of any security interest underlying the loan; or |
| • | certain litigation regarding the loan is pending. |
In addition, we may be required to repurchase any loan relating to a borrower that has applied to a court for reorganization or that is the subject of reorganization proceedings at the time the loan was sold to KAMCO if a court rejects the application for reorganization, disapproves the reorganization plan or fails to approve the reorganization plan within two years of the sale. We may also be required to repurchase a loan if a court determines that the borrower cannot meet the terms of the repayment schedule developed in the reorganization proceeding. The ability of KAMCO to exercise its right to require us to repurchase loans sold is without limit. As of December 31, 2011, we did not have any loans subject to these repurchase rights.
93
Table of Contents
Special Purpose Companies. Sales of our non-performing loans to joint venture special purpose companies include sales to (i) special purposes companies in which Woori F&I, our wholly-owned subsidiary, holds an equity interest not exceeding 50% and does not have effective control and (ii) special purpose companies in which we have no involvement (other than as a seller of loans). Woori AMC Co, Ltd., our indirect wholly owned subsidiary, manages the substandard or below loans purchased from us by such special purpose companies and receives asset management fees from such special purpose companies, as well as a performance fee based on a percentage of asset resolutions.
United Asset Management Corp. United Asset Management Corp., or UAMCO, was established in late 2009 in the wake of the global financial crisis by six major commercial banks in Korea, including Woori Bank, to purchase, sell and securitize non-performing loans and to engage in corporate restructuring activities, among other things. Woori Bank has committed to contribute (Won)150 billion of capital to UAMCO, of which (Won)73 billion has been contributed to date, and has also provided a credit line of (Won)74 billion to UAMCO, under which no amounts have been drawn down to date. Woori Bank currently holds a 15% equity interest in UAMCO. The terms of our sale of loans to UAMCO, we are not required to repurchase any such loans, provide post-sale price adjustments or otherwise continue to be involved with such loans subsequent to their sale in any material respect.
Pursuant to a memorandum of understanding among the Financial Supervisory Service and seven banks, including Woori Bank, a private equity fund was established in June 2011 to acquire approximately (Won)1.2 trillion of non-performing bank loans to construction companies in workout, restructuring or rehabilitation. The general partner of the fund is UAMCO and the limited partners consist of the seven banks and other investors. The fund purchases non-performing bank loans at market price and the funds required to purchase such loans are contributed or lent by the same banks that sell such loans to the fund. In June 2011, we agreed to make a capital commitment of (Won)148 billion and provide a (Won)109 billion revolving loan facility to the fund. From June to December 2011, we contributed the entire amount of our capital commitment to the fund in connection with its purchase of (Won)443 billion of non-performing loans from us.
Others. In addition to sales of loans to KAMCO, various special purpose companies and UAMCO, we sell non-performing loans to various private investment companies. Pursuant to the terms of such sales to private investment companies, we are not required to repurchase any such loans, provide post-sale price adjustments or otherwise continue to be involved with such loans subsequent to their sale in any material respect.
94
Table of Contents
Allocation and Analysis of Provisions for Credit Losses under IFRS
The following table presents, as of the dates indicated, the allocation of our provisions for credit losses by loan type under IFRS:
| As of December 31, | ||||||||||||||||
| 2010 | 2011 | |||||||||||||||
| (in billions of Won, except percentages) | ||||||||||||||||
| Domestic |
||||||||||||||||
| Corporate |
||||||||||||||||
| Commercial and industrial |
(Won) | 3,459 | 73.3 | % | (Won) | 2,690 | 74.1 | % | ||||||||
| Lease financing |
5 | 0.1 | 5 | 0.1 | ||||||||||||
| Trade financing |
268 | 5.7 | 187 | 5.2 | ||||||||||||
| Other commercial |
479 | 10.1 | 348 | 9.6 | ||||||||||||
|
|
|
|
|
|
|
|
|
|||||||||
| Total corporate |
4,211 | 89.3 | 3,230 | 89.0 | ||||||||||||
| Consumer |
||||||||||||||||
| General purpose household(1) |
208 | 4.4 | 249 | 6.8 | ||||||||||||
| Mortgage |
5 | 0.1 | 8 | 0.2 | ||||||||||||
|
|
|
|
|
|
|
|
|
|||||||||
| Total consumer |
213 | 4.5 | 257 | 7.1 | ||||||||||||
| Credit cards |
126 | 2.7 | 132 | 3.6 | ||||||||||||
|
|
|
|
|
|
|
|
|
|||||||||
| Total domestic |
4,550 | 96.4 | 3,619 | 96.1 | ||||||||||||
| Foreign |
||||||||||||||||
| Corporate |
||||||||||||||||
| Commercial and industrial |
150 | 3.2 | 139 | 3.8 | ||||||||||||
| Lease financing |
— | — | — | — | ||||||||||||
| Trade financing |
0 | 0.0 | 0 | 0.0 | ||||||||||||
| Other commercial |
0 | 0.0 | 1 | 0.0 | ||||||||||||
|
|
|
|
|
|
|
|
|
|||||||||
| Total corporate |
150 | 3.2 | 140 | 3.9 | ||||||||||||
| Consumer |
18 | 0.4 | 0 | 0 | ||||||||||||
| Total foreign |
(Won) | 168 | 3.6 | (Won) | 140 | 3.9 | ||||||||||
|
|
|
|
|
|
|
|
|
|||||||||
| Total provisions for credit losses |
(Won) | 4,718 | 100.0 | % | (Won) | 3,759 | 100.0 | % | ||||||||
|
|
|
|
|
|
|
|
|
|||||||||
| (1) | Includes home equity loans. |
The following table presents an analysis of the changes in our provisions for credit losses under IFRS for each of the years indicated:
| Year ended December 31, | ||||||||
| 2010 | 2011 | |||||||
| (in billions of Won) | ||||||||
| Balance at the beginning of the period |
(Won) | 3,508 | (Won) | 4,718 | ||||
| Bad debt expenses for the period |
3,025 | 2,085 | ||||||
| Increase on repurchases of non-performing loans |
10 | 4 | ||||||
| Gross charge-offs |
||||||||
| Domestic |
||||||||
| Corporate |
||||||||
| Commercial and industrial |
(1,031 | ) | (1,577 | ) | ||||
| Lease financing |
(5 | ) | (4 | ) | ||||
| Trade financing |
(100 | ) | (238 | ) | ||||
| Other commercial |
(63 | ) | (304 | ) | ||||
|
|
|
|
|
|||||
| Total corporate |
(1,199 | ) | (2,123 | ) | ||||
95
Table of Contents
| Year ended December 31, | ||||||||
| 2010 | 2011 | |||||||
| (in billions of Won) | ||||||||
| Consumer |
||||||||
| General purpose household(1) |
(86 | ) | (75 | ) | ||||
| Mortgage |
(20 | ) | (14 | ) | ||||
|
|
|
|
|
|||||
| Total consumer |
(106 | ) | (89 | ) | ||||
| Credit cards |
(140 | ) | (142 | ) | ||||
| Total domestic |
(1,445 | ) | (2,354 | ) | ||||
| Foreign |
(61 | ) | (15 | ) | ||||
| Provisions relating to loans sold |
(268 | ) | (538 | ) | ||||
|
|
|
|
|
|||||
| Total gross charge-offs |
(1,774 | ) | (2,907 | ) | ||||
| Recoveries: |
||||||||
| Domestic |
||||||||
| Corporate |
||||||||
| Commercial and industrial |
65 | 33 | ||||||
| Lease financing |
1 | 1 | ||||||
| Trade financing |
10 | 10 | ||||||
| Other commercial |
9 | 10 | ||||||
|
|
|
|
|
|||||
| Total corporate |
85 | 54 | ||||||
| Consumer |
||||||||
| General purpose household(1) |
11 | 8 | ||||||
| Mortgage |
1 | 9 | ||||||
|
|
|
|
|
|||||
| Total consumer |
12 | 17 | ||||||
| Credit cards |
65 | 33 | ||||||
|
|
|
|
|
|||||
| Total domestic |
162 | 104 | ||||||
| Foreign |
7 | — | ||||||
|
|
|
|
|
|||||
| Total recoveries |
169 | 104 | ||||||
|
|
|
|
|
|||||
| Net charge-offs |
(1,605 | ) | (2,803 | ) | ||||
| Foreign exchange translation effects |
(2 | ) | 34 | |||||
| Others(2) |
(218 | ) | (279 | ) | ||||
|
|
|
|
|
|||||
| Balance at the end of the period |
(Won) | 4,718 | (Won) | 3,759 | ||||
|
|
|
|
|
|||||
| Ratio of net charge-offs during the period to average loans outstanding during the period |
0.8 | % | 1.3 | % | ||||
| (1) | Includes home equity loans. |
| (2) | Includes unwinding of discount. |
96
Table of Contents
Allocation and Analysis of Allowances for Loan Losses under U.S. GAAP
The following table presents, as of the dates indicated, the allocation of our allowances for loan losses by loan type under U.S. GAAP:
| As of December 31, | ||||||||||||||||||||||||
| 2007 | 2008 | 2009 | ||||||||||||||||||||||
| (in billions of Won, except percentages) | ||||||||||||||||||||||||
| Domestic |
||||||||||||||||||||||||
| Corporate |
||||||||||||||||||||||||
| Commercial and industrial |
(Won) | 1,068 | 61.5 | % | (Won) | 1,936 | 65.8 | % | (Won) | 2,653 | 74.6 | % | ||||||||||||
| Lease financing |
15 | 0.9 | 4 | 0.1 | 11 | 0.3 | ||||||||||||||||||
| Trade financing |
88 | 5.1 | 187 | 6.4 | 279 | 7.8 | ||||||||||||||||||
| Other commercial |
69 | 4.0 | 217 | 7.4 | 166 | 4.7 | ||||||||||||||||||
|
|
|
|
|
|
|
|
|
|
|
|
|
|||||||||||||
| Total corporate |
1,240 | 71.4 | 2,344 | 79.7 | 3,109 | 87.4 | ||||||||||||||||||
| Consumer |
||||||||||||||||||||||||
| General purpose household(1) |
331 | 19.1 | 320 | 10.9 | 182 | 5.1 | ||||||||||||||||||
| Mortgage |
21 | 1.2 | 16 | 0.5 | 11 | 0.3 | ||||||||||||||||||
|
|
|
|
|
|
|
|
|
|
|
|
|
|||||||||||||
| Total consumer |
352 | 20.3 | 336 | 11.4 | 193 | 5.4 | ||||||||||||||||||
| Credit cards |
59 | 3.4 | 97 | 3.3 | 78 | 2.2 | ||||||||||||||||||
|
|
|
|
|
|
|
|
|
|
|
|
|
|||||||||||||
| Total domestic |
1,651 | 95.1 | 2,777 | 94.4 | 3,380 | 95.0 | ||||||||||||||||||
| Foreign |
||||||||||||||||||||||||
| Corporate |
||||||||||||||||||||||||
| Commercial and industrial |
58 | 3.3 | 161 | 5.5 | 175 | 4.9 | ||||||||||||||||||
| Lease financing |
— | — | — | — | — | — | ||||||||||||||||||
| Trade financing |
1 | 0.1 | 3 | 0.1 | 2 | 0.1 | ||||||||||||||||||
| Other commercial |
— | — | — | — | — | — | ||||||||||||||||||
|
|
|
|
|
|
|
|
|
|
|
|
|
|||||||||||||
| Total corporate |
59 | 3.4 | 164 | 5.6 | 177 | 5.0 | ||||||||||||||||||
| Consumer |
26 | 1.5 | — | — | — | — | ||||||||||||||||||
| Total foreign |
(Won) | 85 | 4.9 | (Won) | 164 | 5.6 | (Won) | 177 | 5.0 | |||||||||||||||
|
|
|
|
|
|
|
|
|
|
|
|
|
|||||||||||||
| Total allowance for loan losses |
(Won) | 1,736 | 100.0 | % | (Won) | 2,942 | 100.0 | % | (Won) | 3,557 | 100.0 | % | ||||||||||||
|
|
|
|
|
|
|
|
|
|
|
|
|
|||||||||||||
| (1) | Includes home equity loans. |
The following table presents an analysis of the changes in our allowances for loan losses under U.S. GAAP for each of the years indicated:
| Year ended December 31, | ||||||||||||
| 2007 | 2008 | 2009 | ||||||||||
| (in billions of Won) | ||||||||||||
| Balance at the beginning of the period |
(Won) | 1,855 | (Won) | 1,736 | (Won) | 2,942 | ||||||
| Provision for credit losses |
219 | 1,608 | 2,408 | |||||||||
| Allowance relating to credit-related commitments transferred to loans |
11 | 13 | 47 | |||||||||
| Allowance relating to loans acquired in connection with acquisitions of Woori Securities, Kyongnam Bank, Kwangju Bank and Peace Bank of Korea |
— | — | — | |||||||||
| Gross charge-offs |
||||||||||||
| Domestic |
||||||||||||
| Corporate |
||||||||||||
| Commercial and industrial |
(175 | ) | (186 | ) | (757 | ) | ||||||
| Lease financing |
(2 | ) | (1 | ) | (9 | ) | ||||||
| Trade financing |
(28 | ) | (24 | ) | (81 | ) | ||||||
| Other commercial |
(19 | ) | (16 | ) | (47 | ) | ||||||
|
|
|
|
|
|
|
|||||||
| Total corporate |
(224 | ) | (227 | ) | (894 | ) | ||||||
97
Table of Contents
| Year ended December 31, | ||||||||||||
| 2007 | 2008 | 2009 | ||||||||||
| (in billions of Won) | ||||||||||||
| Consumer |
||||||||||||
| General purpose household(1) |
(176 | ) | (113 | ) | (456 | ) | ||||||
| Mortgage |
(10 | ) | (6 | ) | (30 | ) | ||||||
|
|
|
|
|
|
|
|||||||
| Total consumer |
(186 | ) | (119 | ) | (486 | ) | ||||||
| Credit cards |
(83 | ) | (113 | ) | (203 | ) | ||||||
| Total domestic |
(493 | ) | (459 | ) | (1,583 | ) | ||||||
| Foreign |
(18 | ) | (19 | ) | (60 | ) | ||||||
| Allowance relating to loans sold |
— | (40 | ) | (317 | ) | |||||||
|
|
|
|
|
|
|
|||||||
| Total gross charge-offs |
(511 | ) | (518 | ) | (1,960 | ) | ||||||
| Recoveries: |
||||||||||||
| Domestic |
||||||||||||
| Corporate |
||||||||||||
| Commercial and industrial |
34 | 14 | 44 | |||||||||
| Lease financing |
1 | — | 1 | |||||||||
| Trade financing |
9 | 2 | 5 | |||||||||
| Other commercial |
6 | 1 | 3 | |||||||||
|
|
|
|
|
|
|
|||||||
| Total corporate |
50 | 17 | 53 | |||||||||
| Consumer |
||||||||||||
| General purpose household |
36 | 8 | 27 | |||||||||
| Mortgage and home equity |
3 | 1 | 2 | |||||||||
|
|
|
|
|
|
|
|||||||
| Total consumer |
39 | 9 | 29 | |||||||||
| Credit cards |
66 | 61 | 59 | |||||||||
|
|
|
|
|
|
|
|||||||
| Total domestic |
155 | 87 | 141 | |||||||||
| Foreign |
6 | 1 | 3 | |||||||||
|
|
|
|
|
|
|
|||||||
| Total recoveries |
161 | 88 | 144 | |||||||||
|
|
|
|
|
|
|
|||||||
| Net charge-offs |
(350 | ) | (430 | ) | (1,816 | ) | ||||||
| Foreign exchange translation effects |
1 | 15 | (24 | ) | ||||||||
|
|
|
|
|
|
|
|||||||
| Balance at the end of the period |
(Won) | 1,736 | (Won) | 2,942 | (Won) | 3,557 | ||||||
|
|
|
|
|
|
|
|||||||
| Ratio of net charge-offs during the period to average loans outstanding during the period(2) |
0.24 | % | 0.23 | % | 0.97 | % | ||||||
| (1) | Includes home equity loans. |
| (2) | Includes amounts relating to allowance related to loans transferred to held-for-sale. |
Loan Charge-Offs
Each of our subsidiaries adheres to the credit approval process we have implemented, which includes assessing credit risk before extending loans and monitoring outstanding loans, in order to minimize loans that must be charged off. To the extent charge-offs are required, our subsidiaries follow charge-off policies aimed at maximizing accounting transparency, minimizing any waste of resources in managing loans which have a low probability of being collected and reducing our non-performing loan ratio.
Loans To Be Charged Off. Our subsidiaries charge off loans that are deemed to be uncollectible by virtue of their falling under any of the following categories:
| • | loans for which collection is not foreseeable due to insolvency, bankruptcy, compulsory execution, disorganization, dissolution or the shutting down of the business of the debtor; |
| • | loans for which collection is not foreseeable due to the death or disappearance of the debtor; |
98
Table of Contents
| • | loans for which expenses of collection exceed the collectable amount; |
| • | loans on which collection is not possible through legal or any other means; |
| • | payments in arrears in respect of credit cards that have been overdue for more than four payment cycles and have been classified as expected loss (excluding instances where there has been partial payment of the overdue balance, where a related balance is not overdue or where a charge off is not possible due to Korean regulations), and those that have been overdue for more than six months; |
| • | payments outstanding on corporate and consumer loans (other than credit card receivables) that have been overdue for more than 12 months, and those on unsecured consumer loans that have been overdue for more than six months; or |
| • | the portion of loans classified as “estimated loss,” net of any recovery from collateral, which is deemed to be uncollectible. |
Procedure for Charge-off Approval. In order to charge off corporate loans, in the case of Woori Bank, an application for a charge-off must be submitted by a branch to the Credit Management and Collection Department promptly and, in any event, within one month after the corporate loan is classified as estimated loss. The relevant department or team evaluates and approves the application. Then, Woori Bank must seek an approval from the Financial Supervisory Service for our charge-offs, which is typically granted. At the same time, Woori Bank refers the approval of the charge-off by the Credit Management and Collection Department to its Audit Committee for their review to ensure compliance with our internal procedures for charge-offs, which include consultations with the branch submitting the charge-off application. Once Woori Bank receives approval from the Financial Supervisory Service, Woori Bank must also obtain approval from its senior management to charge off those loans.
With respect to unsecured consumer loans and credit card balances, we follow a different process to determine which unsecured consumer loans and credit card balances should be charged-off, based on the length of time those loans or balances are past due. We charge off unsecured consumer loans which are 12 months overdue and credit card balances which have been overdue for more than four payment cycles and have been classified as expected loss (excluding instances where there has been partial payment of the overdue balance, where a related balance is not overdue or where a charge off is not possible due to Korean regulations).
Treatment of Loans Charged Off. Once loans are charged off, we classify them as charged-off loans. In the case of Woori Bank, these loans are then transferred to a wholly-owned subsidiary, Woori Credit Information, that is in charge of collections. It will attempt to recover amounts owed or to sell these loans to third parties.
In the case of collateralized loans, our general policy is to petition a court to foreclose and sell the collateral through a court-supervised auction if a collateralized loan becomes overdue for more than three months. If a debtor still fails to repay and the court grants its approval for foreclosure, we will sell the collateral, net of expenses incurred from the auction.
Credit Rehabilitation Programs for Delinquent Consumer Borrowers
In light of the rapid increase in delinquencies in credit card and other consumer credit in recent years, and concerns regarding potential social issues posed by the growing number of individuals with bad credit, the Korean government has implemented a number of measures intended to support the rehabilitation of the credit of delinquent consumer borrowers. These measures may affect the amount and timing of our collections and recoveries on our delinquent consumer credits.
In 2002, the Financial Services Commission established the Credit Counseling and Recovery Service based upon an agreement among approximately 160 financial institutions in Korea. Upon application to the Credit Counseling and Recovery Service and approval by creditor financial institutions representing a majority of the outstanding unsecured debt and two-thirds of the outstanding secured debt, a qualified “credit delinquent person” with outstanding debts to two or more financial institutions in an aggregate amount not exceeding (Won)500 million may participate in an individual work-out program designed to restructure such person’s debt and rehabilitate
99
Table of Contents
such person’s credit. The aggregate amount of loans (including credit card receivables) of Woori Bank, Kwangju Bank and Kyongnam Bank which became subject to such individual work-out programs in 2011 was (Won)71 billion. In 2011, Woori Bank, Kwangju Bank and Kyongnam Bank recovered (Won)9 billion in the aggregate with respect to their loans subject to such individual work-out programs.
On April 1, 2006, the Korean Debtor Recovery and Bankruptcy Law took effect and replaced the Individual Debtor Rehabilitation Law. Under the Korean Debtor Recovery and Bankruptcy Law, a qualified individual debtor with outstanding debts in an aggregate amount not exceeding threshold amounts of (Won)500 million of unsecured debt and/or (Won)1 billion of secured debt may restructure his or her debts through a court-supervised debt restructuring that is binding on creditors. The aggregate amount of loans (including credit card receivables) of Woori Bank, Kwangju Bank and Kyongnam Bank which became subject to such court-supervised debt restructuring in 2011 was (Won)250 billion. In 2011, Woori Bank, Kwangju Bank and Kyongnam Bank recovered (Won)29 billion in the aggregate with respect to their loans subject to such court-supervised debt restructuring.
On September 2, 2008, to support consumer borrowers with low credit scores, the Financial Services Commission established the Credit Rehabilitation Fund to purchase from creditors the loans of such borrowers that are in default and to provide guarantees so that such loans may be refinanced at lower rates. The Credit Rehabilitation Fund provides support to (i) individuals with low credit scores who are in default on loans not exceeding (Won)50 million in principal amount in the aggregate (which requirement will be waived for individuals who are “basic living welfare recipients”) for a period of three months or more and (ii) individuals with low credit scores ranging from category 6 to 10 who are in default on loans not exceeding (Won)30 million in principal amount in the aggregate (which requirement will be waived for individuals who are basic living welfare recipients) and the interest rate of which is 30% or more.
In March 2009, the Financial Services Commission requested Korean banks, including Woori Bank, Kyongnam Bank and Kwangju Bank, to establish a “pre-workout program,” including a credit counseling and recovery service, for retail borrowers with outstanding short-term debt. The pre-workout program has been in operation since April 2009 and, following successive extensions by the Korean government, is expected to continue until April 2013. Under the pre-workout program, maturity extensions and/or interest rate adjustments are provided for retail borrowers with total loans of less than (Won)500 million who are in arrears on their payments for more than 30 days but less than 90 days. The aggregate amount of loans (including credit card receivables) made by Woori Bank, Kyongnam Bank and Kwangju Bank which became subject to the pre-workout program in 2011 was (Won)29 billion. See “Item 3D. Risk Factors—Risks relating to our consumer credit portfolio—We may experience increases in delinquencies in our consumer loan and credit card portfolios.”
Securities Investment Portfolio
Investment Policy
Our subsidiaries invest in and trade Won-denominated securities and, to a lesser extent, foreign currency-denominated securities for their own account to:
| • | maintain asset stability and diversification; |
| • | maintain adequate sources of back-up liquidity to match funding requirements; and |
| • | supplement income from core lending activities. |
Team managers of the treasury and investment banking departments of our subsidiaries supervise the respective subsidiary’s investment and trading activities. In making securities investments, our subsidiaries take into account a number of factors, including external broker analyses and internal assessments of macroeconomic trends, industry analysis, credit evaluation and trading history in determining whether to make particular investments in securities.
Our investments in debt securities include primarily bonds issued by government-related entities, as well as corporate bonds that have been guaranteed by banks (other than merchant banks), government-related funds or privately capitalized funds that we consider to have a low credit risk.
100
Table of Contents
Our securities investments are subject to various guidelines, including limitations prescribed under the Financial Holding Company Act and the Bank Act. Under these regulations, a bank holding company may not own (i) more than 5% of the total issued and outstanding shares of another finance-related company, (ii) any shares of its affiliates, other than its direct or indirect subsidiaries or (iii) any shares of a non-finance-related company. In addition, each of our subsidiaries must limit its investments in equity securities and bonds with a maturity in excess of three years (other than monetary stabilization bonds issued by the Bank of Korea and Korean government bonds) to 60% of the sum of its total Tier I and Tier II capital amount (less any capital deductions). Each of our subsidiaries is also generally prohibited from purchasing or retaining permanent ownership interests in equity securities of other banking institutions or acquiring more than 15% of the shares with voting rights issued by any other corporation. Each of our banking subsidiaries and its respective trust accounts are prohibited from acquiring the shares of any of our “major shareholders,” as defined in “—Supervision and Regulation—Principal Regulations Applicable to Banks—Financial Exposure to Any Individual Customer and Major Shareholder,” in excess of an amount determined by enforcement decree within a maximum limit of 1% of the sum of our Tier I and Tier II capital (less any capital deductions). Further information on the regulatory environment governing our investment activities is set out in “—Supervision and Regulation—Principal Regulations Applicable to Banks—Liquidity” and “—Restrictions on Shareholdings in Other Companies.”
Our and our subsidiaries’ investments in foreign currencies are subject to certain limits and restrictions specified in our and our subsidiaries’ internal guidelines relating to country exposure, a single issuer and type of security exposure, and total investments by individual business units.
The following tables sets out the classifications and accounting treatment of the five primary categories based on which we generally manage our holdings of securities under IFRS:
| Category |
Classification |
Accounting Treatment | ||
| Financial assets held for trading |
Financial assets that are acquired principally for sale in the near term; form part of a portfolio of financial instruments that are managed together and for which there is evidence of short-term profits; or are derivatives without a qualifying hedge relationship. |
Recognized at fair value with transaction costs being recognized in net income and subsequently measured at fair value. Gains and losses are recognized in net income as they arise. | ||
| Financial assets designated as at fair value through profit and loss |
Financial assets for which such designation eliminates or significantly reduces a measurement or recognition inconsistency; applies to a group of financial assets, financial liabilities or both, which are managed and the performance of which is evaluated on a fair value basis; or financial assets related to a contract containing one or more embedded derivatives that would be required to be separated from the host contract. |
Recognized at fair value with transaction costs being recognized in net income and subsequently measured at fair value. Gains and losses are recognized in net income as they arise. | ||
101
Table of Contents
| Category |
Classification |
Accounting Treatment | ||
| Available-for-sale financial assets |
Non-derivative financial assets that are not classified as held-to-maturity, held-for-trading, designated as at fair value through profit and loss or loans and receivables. Unquoted equity investments whose fair value cannot be measured reliably are carried at cost and classified as available-for-sale financial assets. |
Initially recognized at fair value plus directly related transaction costs and subsequently measured at fair value. Impairment losses in monetary and non-monetary available-for-sale financial assets and dividends on non-monetary financial assets are recognized in net income. Interest revenue on monetary financial assets is calculated using the effective interest method. Other changes in the fair value of available-for-sale financial assets and any related tax are reported in a separate component of owners’ equity until disposal, when the cumulative gain or loss is recognized in net income. | ||
| Held-to-maturity financial assets |
Non-derivative financial assets with fixed or determinable payments and fixed maturity dates that we have the positive intent and ability to hold to maturity. |
Initially recognized at fair value plus directly related transaction costs and subsequently measured at amortized cost using the effective interest method less any impairment losses. | ||
| Investments in jointly controlled entities and associates |
Investments in jointly controlled entities refer to equity investments in entities with respect to which we have contractual arrangements with other parties to undertake economic activities subject to joint control.
Investments in associates refer to equity investments in entities over which we have significant influence but do not have direct or indirect control. |
Valued using the equity method, except when the investment is classified as held for sale, in which case it is accounted for in accordance with IFRS 5 Non-current Assets Held for Sale and Discontinued Operations.
Any excess of the cost of acquisition over our share of the net fair value of the identifiable assets, liabilities and contingent liabilities of a jointly controlled entity or associate recognized at the date of acquisition is recognized as goodwill, which is included within the carrying amount of the investment. Any excess of our share of the net fair value of the identifiable assets, liabilities and contingent liabilities over the acquisition cost is recognized immediately in net income. | ||
See “Item 5A. Operating Results—Critical Accounting Policies—Valuation of Financial Assets and Liabilities.”
102
Table of Contents
The following table sets out the definitions of the primary categories of securities we held under U.S. GAAP:
| Category |
Classification |
Accounting Treatment | ||
| Trading securities |
Securities held in anticipation of short-term market movements, which have been acquired for the purpose of short-term capital gains. | Marked-to-market and reported at fair value. We record unrealized gains and losses in income. Trading securities held by our overseas branches are stated at market value unless otherwise required by regulatory authorities in countries where the overseas branches are located. | ||
| Available-for-sale securities |
Securities not classified as held to maturity or trading or other investments. Securities are classified as available-for-sale when we intend to hold them for an indefinite period of time or when the securities may be utilized for tactical asset/liability purposes and sold from time to time to effectively manage interest rate exposure and resultant prepayment risk and liquidity needs. |
Marked-to-market and reported at fair value, with unrealized gains and losses being recorded in other comprehensive income as unrealized gain or loss on valuation of investment securities. If the fair value of available-for-sale securities declines below their cost and the decline is deemed other-than-temporary, the difference in value is recorded as a realized loss on our income statement. For impaired available-for-sale debt securities that we do not intend to sell and we believe that it is more-likely-than-not that we will not be required to sell before recovery of the amortized cost basis, we consider both qualitative and quantitative valuation factors to evaluate whether we expect to recover the entire amortized cost basis of such securities and the amount of the other-than-temporary impairment (or OTTI) is separated into an amount representing the credit loss, which is recognized in earnings, and the amount related to all other factors, which is recognized in other comprehensive income. For marketable equity securities, OTTI evaluations focus on whether evidence supporting recovery of the unrealized loss within a timeframe consistent with temporary impairment exists. Unrealized losses for OTTI on equity securities are recognized in current period earnings. | ||
103
Table of Contents
| Category |
Classification |
Accounting Treatment | ||
| Held-to-maturity securities |
Debt securities are classified as held-to-maturity securities when we have the positive ability and intent to hold until maturity. |
Valued at acquisition cost, adjusted for accretion or amortization of discounts and premiums. However, if the fair value of these securities declines below their cost and the decline is deemed other-than-temporary, the difference in value is recorded as a realized loss on our income statement. | ||
| Other investments |
Equity securities where we exercise significant influence over the operating and financial policies of an investee. | Valued pursuant to the equity method of accounting, based on net asset value. We reflect our share in net income or net loss of these entities in our income statement. Changes in retained earnings, capital surplus or other capital accounts of these entities are accounted for as adjustments to our retain earnings or capital adjustments, consistent with the manner reflected in these entities’ financial statements. | ||
| Equity investment securities that do not have a readily determinable fair value. | Valued at acquisition cost. However, if the fair value of these securities declines below their cost and the decline is deemed other-than-temporary, the difference in value is recorded as a realized loss on our income statement. | |||
Book Value and Fair Value
The following table sets out the book value and fair value of securities in our portfolio as of the dates indicated under IFRS:
| As of December 31, | ||||||||||||||||
| 2010 | 2011 | |||||||||||||||
| Book Value | Fair Value | Book Value | Fair Value | |||||||||||||
| (in billions of Won) | ||||||||||||||||
| Financial assets at fair value through profit and loss |
||||||||||||||||
| Financial assets held for trading |
||||||||||||||||
| Equity securities |
(Won) | 672 | (Won) | 672 | (Won) | 608 | (Won) | 608 | ||||||||
| Beneficiary certificates |
229 | 229 | 325 | 325 | ||||||||||||
| CMA securities |
1,619 | 1,619 | 2,466 | 2,466 | ||||||||||||
| Others |
656 | 656 | 1,651 | 1,651 | ||||||||||||
| Debt securities |
||||||||||||||||
| Korean treasury and government agencies |
3,495 | 3,495 | 1,194 | 1,194 | ||||||||||||
| Financial institutions |
3,622 | 3,622 | 5,194 | 5,194 | ||||||||||||
| Corporate |
2,813 | 2,813 | 5,395 | 5,395 | ||||||||||||
| Commercial paper |
3,395 | 3,395 | 2,973 | 2,973 | ||||||||||||
|
|
|
|
|
|
|
|
|
|||||||||
| Total—Financial assets held for trading |
16,501 | 16,501 | 19,806 | 19,806 | ||||||||||||
|
|
|
|
|
|
|
|
|
|||||||||
104
Table of Contents
| As of December 31, | ||||||||||||||||
| 2010 | 2011 | |||||||||||||||
| Book Value | Fair Value | Book Value | Fair Value | |||||||||||||
| (in billions of Won) | ||||||||||||||||
| Financial assets designated at fair value through profit or loss |
||||||||||||||||
| Equity-linked securities |
302 | 302 | 654 | 654 | ||||||||||||
| Asset backed securities |
400 | 400 | 410 | 410 | ||||||||||||
| Equity securities |
10 | 10 | 12 | 12 | ||||||||||||
|
|
|
|
|
|
|
|
|
|||||||||
| Total—Financial assets at designated fair value through profit or loss |
712 | 712 | 1,076 | 1,076 | ||||||||||||
| Available-for-sale financial assets |
||||||||||||||||
| Equity securities |
3,236 | 3,236 | 2,752 | 2,752 | ||||||||||||
| Beneficiary certificates |
5,196 | 5,196 | 3,789 | 3,789 | ||||||||||||
| Others(1) |
1,226 | 1,226 | 219 | 219 | ||||||||||||
| Debt securities |
||||||||||||||||
| Korean treasury and government agencies |
2,720 | 2,720 | 2,787 | 2,787 | ||||||||||||
| Financial institutions |
5,897 | 5,897 | 5,210 | 5,210 | ||||||||||||
| Corporate |
2,690 | 2,690 | 4,183 | 4,183 | ||||||||||||
| Asset backed securities |
749 | 749 | 599 | 599 | ||||||||||||
| Foreign currency bonds |
284 | 284 | 133 | 133 | ||||||||||||
|
|
|
|
|
|
|
|
|
|||||||||
| Total—Available-for-sale |
21,998 | 21,998 | 19,672 | 19,672 | ||||||||||||
| Held-to-maturity financial assets |
||||||||||||||||
| Debt securities |
||||||||||||||||
| Korean treasury and government agencies |
6,348 | 6,477 | 7,235 | 7,432 | ||||||||||||
| Financial institutions |
7,832 | 7,889 | 5,859 | 5,880 | ||||||||||||
| Corporate |
5,491 | 5,567 | 6,828 | 6,898 | ||||||||||||
| Foreign currency bonds |
143 | 143 | 103 | 103 | ||||||||||||
| Securities loaned |
71 | 72 | 11 | 11 | ||||||||||||
|
|
|
|
|
|
|
|
|
|||||||||
| Total—Held-to-maturity |
19,885 | 20,148 | 20,036 | 20,324 | ||||||||||||
|
|
|
|
|
|
|
|
|
|||||||||
| Total securities |
(Won) | 59,096 | (Won) | 59,359 | (Won) | 60,590 | (Won) | 60,878 | ||||||||
|
|
|
|
|
|
|
|
|
|||||||||
| (1) | Include CMA securities. |
The following table sets out the book value and fair value of securities in our securities portfolio as of December 31, 2009 under U.S. GAAP:
| As of December 31, | ||||||||
| 2009 | ||||||||
| Book Value | Fair Value | |||||||
| (in billions of Won) | ||||||||
| Trading securities |
||||||||
| Equity securities |
(Won) | 379 | (Won) | 379 | ||||
| Beneficiary certificates |
45 | 45 | ||||||
| Debt securities |
||||||||
| Korean treasury securities and government agency securities |
3,380 | 3,380 | ||||||
| Debt securities issued by financial institutions |
890 | 890 | ||||||
| Corporate debt securities |
4,667 | 4,667 | ||||||
| Asset backed securities |
728 | 728 | ||||||
|
|
|
|
|
|||||
| Total—Trading |
10,089 | 10,089 | ||||||
| Available-for-sale securities |
||||||||
| Equity securities |
368 | 368 | ||||||
| Beneficiary certificates |
1,206 | 1,206 | ||||||
105
Table of Contents
| As of December 31, | ||||||||
| 2009 | ||||||||
| Book Value | Fair Value | |||||||
| (in billions of Won) | ||||||||
| Debt securities |
||||||||
| Korean treasury securities and government agency securities |
4,348 | 4,348 | ||||||
| Debt securities issued by financial institutions |
2,265 | 2,265 | ||||||
| Corporate debt securities |
6,960 | 6,960 | ||||||
| Asset backed securities |
838 | 838 | ||||||
| Debt securities issued by foreign governments |
74 | 74 | ||||||
| Total—Available-for-sale |
16,059 | 16,059 | ||||||
| Held-to-maturity securities |
||||||||
| Debt securities |
||||||||
| Korean treasury securities and government agency securities |
11,502 | 11,520 | ||||||
| Debt securities issued by financial institutions |
2,503 | 2,515 | ||||||
| Corporate debt securities |
1,358 | 1,369 | ||||||
| Asset backed securities |
491 | 497 | ||||||
| Debt securities issued by foreign governments |
120 | 120 | ||||||
|
|
|
|
|
|||||
| Total—Held-to-maturity |
15,974 | 16,021 | ||||||
|
|
|
|
|
|||||
| Total securities |
(Won) | 42,122 | (Won) | 42,169 | ||||
|
|
|
|
|
|||||
106
Table of Contents
Maturity Analysis
The following table categorizes our securities by maturity and weighted average yield as of December 31, 2011:
| As of December 31, 2011 | ||||||||||||||||||||||||||||||||||||||||
| Within 1 year | Over 1 but Within 5 years |
Over 5 but Within 10 years |
Over 10 years | Total | ||||||||||||||||||||||||||||||||||||
| (in billions of Won) | ||||||||||||||||||||||||||||||||||||||||
| Amount | Weighted Average Yield(1) |
Amount | Weighted Average Yield(1) |
Amount | Weighted Average Yield(1) |
Amount | Weighted Average Yield(1) |
Amount | Weighted Average Yield(1) |
|||||||||||||||||||||||||||||||
| Financial assets at fair value through profit or loss: |
||||||||||||||||||||||||||||||||||||||||
| Financial assets held for trading |
||||||||||||||||||||||||||||||||||||||||
| Korean treasury and government agencies |
(Won) | 151 | 3.41 | % | (Won) | 726 | 3.47 | % | (Won) | 317 | 4.39 | % | (Won) | 0 | 4.84 | % | 1,194 | 3.71 | % | |||||||||||||||||||||
| Financial institutions |
2,609 | 3.59 | % | 2,584 | 3.81 | % | — | 1 | 4.49 | % | 5,194 | 3.70 | % | |||||||||||||||||||||||||||
| Corporate |
2,849 | 4.19 | % | 2,174 | 4.35 | % | 360 | 3.84 | % | 12 | 4.85 | % | 5,395 | 4.23 | % | |||||||||||||||||||||||||
| Commercial paper |
2,973 | 3.91 | % | — | — | — | — | — | 2,973 | 3.91 | % | |||||||||||||||||||||||||||||
|
|
|
|
|
|
|
|
|
|
|
|||||||||||||||||||||||||||||||
| Total |
8,582 | 3.90 | % | 5,484 | 3.98 | % | 677 | 4.10 | % | 13 | 4.81 | % | 14,756 | 3.94 | % | |||||||||||||||||||||||||
|
|
|
|
|
|
|
|
|
|
|
|||||||||||||||||||||||||||||||
| Financial assets designated at fair value through profit or loss |
||||||||||||||||||||||||||||||||||||||||
| Asset backed securities |
51 | 6.10 | % | 49 | 1.84 | % | — | — | 310 | 5.29 | % | 410 | 4.98 | % | ||||||||||||||||||||||||||
| Available-for-sale financial assets |
||||||||||||||||||||||||||||||||||||||||
| Korean treasury and government agencies |
449 | 4.17 | % | 2,222 | 4.37 | % | 103 | 4.69 | % | 13 | 3.95 | % | 2,787 | 4.34 | % | |||||||||||||||||||||||||
| Financial institutions |
3,054 | 3.66 | % | 2,156 | 4.01 | % | — | — | — | — | 5,210 | 3.81 | % | |||||||||||||||||||||||||||
| Corporate |
1,516 | 4.18 | % | 2,505 | 4.20 | % | 162 | 3.62 | % | — | — | 4,183 | 4.17 | % | ||||||||||||||||||||||||||
| Asset backed securities |
79 | 7.65 | % | 520 | 3.07 | % | — | — | — | — | 599 | 3.68 | % | |||||||||||||||||||||||||||
| Foreign currency bonds |
81 | 2.40 | % | 46 | 1.61 | % | 2 | 2.48 | % | 4 | 2.93 | % | 133 | 2.14 | % | |||||||||||||||||||||||||
|
|
|
|
|
|
|
|
|
|
|
|||||||||||||||||||||||||||||||
| Total |
5,179 | 3.90 | % | 7,449 | 4.10 | % | 267 | 4.02 | % | 17 | 3.71 | % | 12,912 | 4.02 | % | |||||||||||||||||||||||||
|
|
|
|
|
|
|
|
|
|
|
|||||||||||||||||||||||||||||||
| Held-to-maturity financial assets |
||||||||||||||||||||||||||||||||||||||||
| Korean treasury and government agencies |
1,409 | 3.78 | % | 5,789 | 4.53 | % | 37 | 5.15 | % | — | — | 7,235 | 4.39 | % | ||||||||||||||||||||||||||
| Financial institutions |
5,009 | 3.83 | % | 795 | 4.53 | % | 20 | 6.35 | % | 35 | 7.33 | % | 5,859 | 3.96 | % | |||||||||||||||||||||||||
| Corporate |
1,549 | 4.56 | % | 4,319 | 4.42 | % | 70 | 4.49 | % | 890 | 5.32 | % | 6,828 | 4.57 | % | |||||||||||||||||||||||||
| Foreign currency bonds |
62 | 2.50 | % | 39 | 10.77 | % | — | — | 2 | 5.91 | % | 103 | 5.71 | % | ||||||||||||||||||||||||||
| Securities loaned |
— | — | 11 | 4.29 | % | — | — | — | — | 11 | 4.29 | % | ||||||||||||||||||||||||||||
|
|
|
|
|
|
|
|
|
|
|
|||||||||||||||||||||||||||||||
| Total |
8,029 | 3.95 | % | 10,953 | 4.51 | % | 127 | 4.97 | % | 927 | 5.40 | % | 20,036 | 4.33 | % | |||||||||||||||||||||||||
|
|
|
|
|
|
|
|
|
|
|
|||||||||||||||||||||||||||||||
| (1) | The weighted average yield for the portfolio represents the yield to maturity for each individual security, weighted using its book value (which is the amortized cost in the case of held-to-maturity financial assets and the fair value in the case of available-for-sale financial assets and financial assets at fair value through profit or loss). |
Risk Concentrations
As of December 31, 2011, we held the following securities of individual issuers where the aggregate book value of those securities exceeded 10% of our owners’ equity at such date. As of December 31, 2011, our owners’ equity was (Won)22,073 billion.
| As of December 31, 2011 | ||||||||
| Book Value | Market Value | |||||||
| (in billions of Won) | ||||||||
| Name of issuer: |
||||||||
| Korean government |
(Won) | 10,724 | (Won) | 10,827 | ||||
| The Bank of Korea |
11,739 | 11,742 | ||||||
|
|
|
|
|
|||||
| Total |
(Won) | 22,463 | (Won) | 22,569 | ||||
|
|
|
|
|
|||||
The Bank of Korea is a Korean government entity.
107
Table of Contents
Funding
We fund our lending and other activities using various sources, both domestic and foreign. Our primary funding strategy is to maintain stable and low-cost funding. We have in the past achieved this in part by increasing the average balances of low-cost customer deposits, in particular demand deposits and savings deposits.
Customer deposits are our principal funding source. Customer deposits accounted for 73.0% of our total funding as of December 31, 2010 and 73.7% of our total funding as of December 31, 2011, in each case under IFRS. As of December 31, 2009, customer deposits accounted for 73.5% of our total funding under U.S. GAAP.
We also acquire funding through the following sources:
| • | long-term debt, including the issuance of senior and subordinated debentures and borrowings from government-affiliated funds and entities and other financial institutions; |
| • | short-term borrowings, including borrowings from the trust accounts of our subsidiaries and from the Bank of Korea, and call money; and |
| • | the issuance of hybrid securities, including bond-type hybrid securities. |
As of December 31, 2011, approximately 88.5% of our total funding was denominated in Won.
Deposits
Although the majority of our deposits are short-term, it has been our experience that the majority of our depositors generally roll over their deposits at maturity, providing us with a stable source of funding. See “Item 3D. Risk Factors—Other risks relating to our business—Our funding is highly dependent on short-term deposits, which dependence may adversely affect our operations.” The following table shows the average balances of our deposits and the average rates paid on our deposits under IFRS for the periods indicated:
| For the year ended December 31, | ||||||||||||||||
| 2010 | 2011 | |||||||||||||||
| Average Balance(1) |
Average Rate Paid |
Average Balance(1) |
Average Rate Paid |
|||||||||||||
| (in billions of Won, except percentages) | ||||||||||||||||
| Demand deposits |
7,407 | 0.28 | % | 10,728 | 0.26 | % | ||||||||||
| Time deposits and savings deposits |
150,317 | 2.87 | 160,952 | 3.00 | ||||||||||||
| Certificates of deposit |
8,458 | 4.31 | 2,746 | 4.10 | ||||||||||||
| Other deposits(2) |
17,583 | 1.54 | 18,217 | 1.77 | ||||||||||||
|
|
|
|
|
|
|
|
|
|||||||||
| Average total deposits |
(Won) | 183,765 | 2.71 | % | (Won) | 192,643 | 2.75 | % | ||||||||
|
|
|
|
|
|
|
|
|
|||||||||
| (1) | Average balances are based on daily balances for Woori Bank, Kyongnam Bank, Kwangju Bank and Woori Investment & Securities, and on quarterly balances for all of our other subsidiaries and our special purpose companies. |
| (2) | Includes mutual installment deposits and funds deposited by securities brokerage customers of Woori Investment & Securities. Mutual installment deposits are interest-bearing deposits offered by us, which enable customers to become eligible to apply for loans secured by such deposits while they maintain an account with us. In order to qualify to apply for such a loan, a customer must make required periodic deposits to the mutual installment account for a contracted term of less than five years. Any such loan will be secured in an amount up to the holder’s mutual installment deposit and will be subject to the same loan underwriting policy we apply for other secured loans. For the portion of the loan, if any, that is not secured, we apply the same loan underwriting policy as we would for other unsecured loans. |
108
Table of Contents
The following table shows the average balances of our deposits and the average rates paid on our deposits under U.S. GAAP for 2009:
| For the year ended December 31, 2009 | ||||||||
| Average Balance(1) | Average Rate Paid | |||||||
| (in billions of Won, except percentages) | ||||||||
| Demand deposits: |
||||||||
| Non-interest-bearing |
(Won) | 4,579 | — | |||||
| Interest-bearing |
27,652 | 0.28 | % | |||||
| Time deposits |
||||||||
| Certificates |
15,070 | 5.14 | ||||||
| Other time deposits |
111,828 | 3.77 | ||||||
| Savings deposits |
21,423 | 1.88 | ||||||
| Mutual installment deposits |
257 | 3.32 | ||||||
|
|
|
|||||||
| Average total deposits |
(Won) | 180,809 | 3.11 | % | ||||
|
|
|
|||||||
| (1) | Average balances are based on daily balances for Woori Bank, Kyongnam Bank and Kwangju Bank, and on quarterly balances for all of our other subsidiaries and our special purpose companies. |
For a description of our retail deposit products, see “—Business—Consumer Banking—Lending Activities—Mortgage and Home Equity Lending” and “—Business—Consumer Banking—Deposit-Taking Activities.”
Maturities of Certificates of Deposit and Other Time Deposits
The following table presents, as of December 31, 2011, the remaining maturities of our time deposits, certificates of deposit and mutual installment deposits which had fixed maturities in excess of (Won)100 million:
| As of December 31, 2011 | ||||||||||||||||
| Certificates of Deposit |
Other Time Deposits |
Mutual Installment Deposits |
Total | |||||||||||||
| (in billions of Won) | ||||||||||||||||
| Maturing within three months |
(Won) | 436 | (Won) | 39,343 | (Won) | 3 | (Won) | 39,782 | ||||||||
| After three but within six months |
403 | 15,221 | 1 | 15,625 | ||||||||||||
| After six but within 12 months |
553 | 43,852 | 1 | 44,406 | ||||||||||||
| After 12 months |
2,663 | 2,454 | 4 | 5,121 | ||||||||||||
|
|
|
|
|
|
|
|
|
|||||||||
| Total |
(Won) | 4,055 | (Won) | 100,870 | (Won) | 9 | (Won) | 104,934 | ||||||||
|
|
|
|
|
|
|
|
|
|||||||||
Long-Term Debt
The aggregate amount of contractual maturities of all long-term debt, which consist of debentures and borrowings with maturities exceeding one year, as of December 31, 2011 was as follows:
| Amount | ||||
| (in billions of Won) | ||||
| Due in 2012 |
(Won) | 12,604 | ||
| Due in 2013 |
7,935 | |||
| Due in 2014 |
6,052 | |||
| Due in 2015 |
5,240 | |||
| Due in 2016 |
2,442 | |||
| Thereafter |
5,605 | |||
|
|
|
|||
| Gross long-term debt |
39,878 | |||
| Less: discount |
48 | |||
|
|
|
|||
| Total long-term debt, net |
(Won) | 39,830 | ||
|
|
|
|||
109
Table of Contents
Short-Term Borrowings
The following table presents, for the periods indicated, information regarding our short-term borrowings, with an original maturity of one year or less, under IFRS:
|
As of and for the year ended December 31, |
||||||||
| 2010 | 2011 | |||||||
| (in billions of Won, except percentages) | ||||||||
| Call money |
||||||||
| Year-end balance |
(Won) | 6,073 | (Won) | 4,393 | ||||
| Average balance(1) |
4,908 | 4,825 | ||||||
| Maximum balance |
7,869 | 5,815 | ||||||
| Average interest rate(2) |
2.60 | % | 2.50 | % | ||||
| Year-end interest rate |
0.07~6.20 | % | 0.05~6.20 | % | ||||
| Borrowings from the Bank of Korea(3) |
||||||||
| Year-end balance |
(Won) | 1,223 | (Won) | 1,089 | ||||
| Average balance(1) |
1,407 | 1,151 | ||||||
| Maximum balance |
1,706 | 1,286 | ||||||
| Average interest rate(2) |
1.30 | % | 1.50 | % | ||||
| Year-end interest rate |
1.25 | % | 1.50 | % | ||||
| Other short-term borrowings(4) |
||||||||
| Year-end balance |
(Won) | 12,160 | (Won) | 14,282 | ||||
| Average balance(1) |
12,506 | 14,433 | ||||||
| Maximum balance |
14,368 | 15,664 | ||||||
| Average interest rate(2) |
1.69 | % | 1.12 | % | ||||
| Year-end interest rate |
0.51~6.80 | % | 0.10~13.5 | % | ||||
| (1) | Average balances are based on daily balances for Woori Bank, Kyongnam Bank, Kwangju Bank and Woori Investment & Securities and on quarterly balances for all of our other subsidiaries and our special purpose companies. |
| (2) | Average interest rates for the year are calculated by dividing the total interest expense by the average amount borrowed. |
| (3) | Borrowings from the Bank of Korea generally mature within one month for borrowings in Won and six months for borrowings in foreign currencies. |
| (4) | Other short-term borrowings include borrowings from trust accounts, bills sold, borrowings in domestic and foreign currency, short-term secured borrowings and foreign currency debentures. Other short-term borrowings have maturities of 30 days to one year and are unsecured. |
110
Table of Contents
The following table presents, for the period indicated, information regarding our short-term borrowings, with an original maturity of one year or less, under U.S. GAAP:
| As of and for the Year Ended December 31, 2009 | ||||
| (in billions of Won, except percentages) | ||||
| Call money |
||||
| Year-end balance |
(Won) | 5,687 | ||
| Average balance(1) |
4,576 | |||
| Maximum balance |
8,244 | |||
| Average interest rate(2) |
1.90 | % | ||
| Year-end interest rate |
0.68%~3.64 | % | ||
| Borrowings from the Bank of Korea(3) |
||||
| Year-end balance |
(Won) | 1,560 | ||
| Average balance(1) |
1,376 | |||
| Maximum balance |
1,803 | |||
| Average interest rate(2) |
1.36 | % | ||
| Year-end interest rate |
1.25 | % | ||
| Other short-term borrowings(4) |
||||
| Year-end balance |
(Won) | 11,275 | ||
| Average balance(1) |
14,002 | |||
| Maximum balance |
24,693 | |||
| Average interest rate(2) |
3.21 | % | ||
| Year-end interest rate |
1.27%~10.50 | % | ||
| (1) | Average balances are based on daily balances for Woori Bank, Kyongnam Bank and Kwangju Bank, and on quarterly balances for all of our other subsidiaries and our special purpose companies. |
| (2) | Average interest rates for the year are calculated by dividing the total interest expense by the average amount borrowed. |
| (3) | Borrowings from the Bank of Korea generally mature within one month for borrowings in Won and six months for borrowings in foreign currencies. |
| (4) | Other short-term borrowings include borrowings from trust accounts, bills sold, borrowings in domestic and foreign currency, short-term secured borrowings and foreign currency debentures. Other short-term borrowings have maturities of 30 days to one year and are unsecured. |
Supervision and Regulation
Principal Regulations Applicable to Financial Holding Companies
General
The Financial Holding Company Act (Law No. 6274, October 23, 2000), last amended on June 8, 2010, regulates Korean financial holding companies and their subsidiaries. The entities that regulate and supervise Korean financial holding companies and their subsidiaries are the Financial Services Commission and the Financial Supervisory Service.
The Financial Services Commission exerts direct control over financial holding companies pursuant to the Financial Holding Company Act. Among other things, the Financial Services Commission:
| • | approves the establishment of financial holding companies; |
| • | issues regulations on the capital adequacy of financial holding companies and their subsidiaries; and |
| • | drafts regulations relating to the supervision of financial holding companies. |
Following the instructions and directives of the Financial Services Commission, the Financial Supervisory Service supervises and examines financial holding companies and their subsidiaries. In particular, the Financial Supervisory Service sets requirements relating to Korean financial holding companies’ liquidity and capital adequacy ratios and establishes reporting requirements within the authority delegated under the Financial Services Commission regulations. Financial holding companies must submit quarterly reports to the Financial Supervisory Service discussing business performance, financial status and other matters identified in the Enforcement Decree of the Financial Holding Company Act.
111
Table of Contents
Under the Financial Holding Company Act, a financial holding company must primarily engage in controlling its subsidiaries by holding equity stakes in them equal in aggregate to at least 50% of the financial holding company’s aggregate assets based on its latest balance sheet. A financial holding company may engage only in the following activities:
| • | controlling the management of its subsidiaries; |
| • | financially supporting its direct and indirect subsidiaries; |
| • | raising capital necessary for investment in its subsidiaries or providing financial support to its direct and indirect subsidiaries; |
| • | supporting the business of its direct and indirect subsidiaries for the joint development and marketing of new products; |
| • | supporting the operations of its direct and indirect subsidiaries by providing access to data processing, legal and accounting resources; and |
| • | any other businesses exempted from authorization, permission or approval under the applicable laws and regulations. |
The Financial Holding Company Act requires every financial holding company (other than a financial holding company that is controlled by another financial holding company) and its subsidiaries to obtain prior approval from, or file a prior report with, the Financial Services Commission before acquiring control of another company. In addition, the Financial Services Commission must grant permission to liquidate or to merge with any other company before the liquidation or merger. A financial holding company must report to the Financial Services Commission when its officers or largest shareholder changes, and when it ceases to control any of its direct and indirect subsidiaries by disposing of their shares.
Capital Adequacy
The Financial Holding Company Act does not provide for a minimum paid-in capital requirement related to financial holding companies. However, all financial holding companies are required to maintain a specified level of solvency. In addition, with respect to the allocation of net profit earned in a fiscal term, a financial holding company must set aside in its legal reserve an amount equal to at least 10% of its net income after tax each time it pays dividends on its net profits earned until its legal reserve reaches at least the aggregate amount of its paid-in capital.
Beginning on January 1, 2007, under the new capital adequacy requirements of the Financial Services Commission applicable from such date, we, as a bank holding company, are required to maintain a minimum consolidated capital adequacy ratio of 8.0%. “Consolidated capital adequacy ratio” is defined as the ratio of equity capital as a percentage of risk-weighted assets on a consolidated basis, determined in accordance with Financial Services Commission requirements that have been formulated based on Bank of International Settlements (“BIS”) standards. “Equity capital,” as applicable to bank holding companies, is defined as the sum of Tier I capital, Tier II capital and Tier III capital less any deductible items, each as defined under the Regulation on the Supervision of Financial Holding Companies. “Risk-weighted assets” is defined as the sum of credit risk-weighted assets and market risk-weighted assets.
Liquidity
All financial holding companies are required to match the maturities of their assets and liabilities on a non-consolidated basis in accordance with the Financial Holding Company Act in order to ensure liquidity. Financial holding companies must:
| • | maintain a Won liquidity ratio (defined as Won assets due within one month, including marketable securities, divided by Won liabilities due within one month) of not less than 100% on a non-consolidated basis; |
112
Table of Contents
| • | maintain a foreign currency liquidity ratio (defined as foreign currency liquid assets due within three months divided by foreign currency liabilities due within three months) of not less than 80% on a non-consolidated basis (except that such requirement is not applicable to a financial holding company whose foreign currency liabilities constitute less than 1% of its total assets); |
| • | maintain a ratio of foreign currency liquid assets due within seven days less foreign currency liabilities due within seven days as a percentage of total foreign currency assets of not less than 0% on a non-consolidated basis (except that such requirement is not applicable to a financial holding company whose foreign currency liabilities constitute less than 1% of its total assets); |
| • | maintain a ratio of foreign currency liquid assets due within a month less foreign currency liabilities due within a month as a percentage of total foreign currency assets of not less than negative 10% on a non-consolidated basis (except that such requirement is not applicable to a financial holding company whose foreign currency liabilities constitute less than 1% of its total assets); and |
| • | make quarterly reports regarding their Won liquidity and foreign currency liquidity to the Financial Supervisory Service. |
Financial Exposure to Any Individual Customer and Major Shareholder
Subject to certain exceptions, the aggregate credit (as defined in the Financial Holding Company Act, the Bank Act, the Financial Investment Services and Capital Markets Act, the Insurance Business Act, the Mutual Savings Bank Act and the Specialized Credit Financial Business Act, respectively) of a financial holding company and its direct and indirect subsidiaries that are banks, merchant banks, financial investment companies, insurance companies, saving banks or specialized credit financial business companies (which we refer to as “Financial Holding Company Total Credit”) to a single group of companies that belong to the same conglomerate as defined in the Monopoly Regulations and Fair Trade Act will not be permitted to exceed 25% of net aggregate equity capital (as defined below).
“Net aggregate equity capital” is defined as the sum of:
(1) in case of a financial holding company, the capital amount as defined in Article 24-3(7), Item 2 of the Enforcement Decree of the Financial Holding Company Act;
(2) in case of a bank, the capital amount as defined in Article 2(1), Item 5 of the Bank Act;
(3) in case of a merchant bank, the capital amount as defined in Article 342(1) of the Financial Investment Services and Capital Markets Act;
(4) in case of a financial investment company, the capital amount as defined in Article 37(3) of the Enforcement Decree of the Financial Investment Services and Capital Markets Act;
(5) in case of an insurance company, the capital amount as defined in Article 2, Item 15 of the Insurance Business Act;
(6) in case of a savings bank, the capital amount as defined in Article 2, Item 4 of the Mutual Savings Bank Act; and
(7) in case of a specialized credit financial business company, the capital amount as defined in Article 2, Item 19 of the Specialized Credit Financial Business Act;
less the sum of:
(1) the amount of shares of direct and indirect subsidiaries held by the financial holding company;
(2) the amount of shares that are cross-held by each direct and indirect subsidiary that is a bank, merchant bank, financial investment company, insurance company, savings bank or specialized credit financial business company; and
(3) the amount of shares of a financial holding company held by such direct and indirect subsidiaries that are banks, merchant banks or financial investment companies, insurance companies, savings banks or specialized credit financial business companies.
113
Table of Contents
The Financial Holding Company Total Credit to a single individual or judicial person may not exceed 20% of the net aggregate equity capital. In addition, the Financial Holding Company Total Credit to a shareholder holding (together with the persons who have a “special relationship” with the shareholder, as defined in the Enforcement Decree of the Financial Holding Company Act) in aggregate more than 10% of the total issued and outstanding voting shares of a financial holding company generally may not exceed the lesser of (x) 25% of the net aggregate equity capital and (y) the amount of the equity capital of the financial holding company multiplied by the shareholding ratio of such shareholder (together with the persons who have a special relationship with such shareholder).
Further, the total sum of credits (as defined in the Financial Holding Company Act, the Bank Act, the Financial Investment Services and Capital Markets Act, the Insurance Business Act, the Mutual Savings Bank Act and the Specialized Credit Financial Business Act, respectively) of a bank holding company and its direct and indirect subsidiaries that are banks, merchant banks, financial investment companies, insurance companies, savings banks or specialized credit financial business companies, as applicable (“Bank Holding Company Total Credit”) extended to a “major shareholder” (as defined below) (together with the persons who have a special relationship with that major shareholder) will not be permitted to exceed the lesser of (x) 25% of the net aggregate equity capital and (y) the amount of the equity capital of the bank holding company multiplied by the shareholding ratio of the major shareholder, except for certain cases.
“Major shareholder” is defined as:
| • | a shareholder holding (together with persons who have a special relationship with that shareholder), in excess of 10% (or in the case of a bank holding company controlling regional banks only, 15%) in the aggregate of the bank holding company’s total issued voting shares; or |
| • | a shareholder holding (together with persons who have a special relationship with that shareholder), more than 4% in the aggregate of the total issued voting shares of the bank holding company controlling nationwide banks (excluding shares subject to the shareholding restrictions on non-financial business group companies as described below), where the shareholder is the largest shareholder or has actual control over the major business affairs of the bank holding company through, for example, appointment and dismissal of the officers pursuant to the Enforcement Decree of the Financial Holding Company Act. |
In addition, the total sum of the Bank Holding Company Total Credit granted to all of a bank holding company’s major shareholders must not exceed 25% of the bank holding company’s net aggregate equity capital. Furthermore, any bank holding company that, together with its direct and indirect subsidiaries, intends to extend credit to the bank holding company’s major shareholder in an amount equal to or exceeding the lesser of (x) the amount equivalent to 0.1% of the net aggregate equity capital and (y) (Won)5 billion, in any single transaction, must obtain prior unanimous board resolutions and then, immediately after providing the credit, must file a report to the Financial Services Commission and publicly disclose the filing of the report.
Restrictions on Transactions Among Direct and Indirect Subsidiaries and Financial Holding Company
Generally, a direct or indirect subsidiary of a financial holding company may not extend credits (excluding the amount of corporate credit card payments issued by a direct or indirect subsidiary of a financial holding company that is engaged in the banking business) to that financial holding company. In addition, a direct or indirect subsidiary of a financial holding company may not extend credits (excluding the amount of corporate credit card payments issued by a direct or indirect subsidiary of a financial holding company that is engaged in the banking business) to other direct or indirect subsidiaries of the financial holding company in excess of 10% of its capital amount on an individual basis or to those subsidiaries in excess of 20% of its capital amount on an aggregate basis. The subsidiary extending the credit must also obtain adequate collateral from the other subsidiaries unless the credit is otherwise approved by the Financial Services Commission.
Subject to certain exceptions, a direct or indirect subsidiary of a financial holding company is prohibited from owning the shares of any other direct or indirect subsidiaries (other than those directly controlled by that
114
Table of Contents
direct or indirect subsidiary) under the common control of the financial holding company. Subject to certain exceptions, a direct or indirect subsidiary of a financial holding company is also prohibited from owning the shares of the financial holding company controlling that direct or indirect subsidiary. The transfer of certain loans or credits classified as precautionary or below between a financial holding company and its direct or indirect subsidiary or between the direct and indirect subsidiaries of a financial holding company is prohibited except for:
(1) transfers to a special purpose company, or entrustment with a trust company, for an asset-backed securitization transaction;
(2) transfers to a mortgage-backed securities issuance company for a mortgage securitization transaction;
(3) transfers or in-kind contributions to a corporate restructuring vehicle under the Corporate Restructuring Investment Companies Act; and
(4) transfers to a corporate restructuring company under the Industry Promotion Act.
Disclosure of Management Performance
For the purpose of protecting the depositors and investors in the subsidiaries of financial holding companies, the Financial Services Commission requires financial holding companies to disclose certain material matters including:
(1) financial condition and profit and loss of the financial holding company and its direct and indirect subsidiaries;
(2) fund raising by the financial holding company and its direct and indirect subsidiaries and the appropriation of such funds;
(3) any sanctions levied on the financial holding company and its direct and indirect subsidiaries under the Financial Holding Company Act or any corrective measures or sanctions under the Law on Improvement of Structure of Financial Industry; and
(4) occurrence of any non-performing assets or financial incident that may have a material adverse effect, or any other event as prescribed in the applicable regulations.
Restrictions on Shareholdings in Other Companies
Generally, a financial holding company may not own (i) more than 5% of the total issued and outstanding shares of another finance-related company, (ii) any shares of its affiliates, other than its direct or indirect subsidiaries or (iii) any shares of a non-finance-related company.
Restrictions on Shareholdings by Direct and Indirect Subsidiaries
A direct subsidiary of a financial holding company may not control any other company other than, as an indirect subsidiary of the financial holding company:
| • | financial institutions established in foreign jurisdictions; |
| • | certain financial institutions which are engaged in any business that the direct subsidiary may conduct without any licenses or permits; |
| • | certain financial institutions whose business is related to the business of the direct subsidiary as described by the Enforcement Decree of the Financial Holding Company Act (for example, a bank subsidiary may control only credit information companies, credit card companies and financial investment companies with a dealing, brokerage, collective investment, investment advice, discretionary investment management and/or trust license); |
| • | certain financial institutions whose business is related to the financial business as prescribed by the regulations of the Ministry of Strategy and Finance; and |
115
Table of Contents
| • | certain companies which are not financial institutions but whose business is related to the financial business of the financial holding company as prescribed by the Enforcement Decree of the Financial Holding Company Act (for example, a finance-related research company or a finance-related information technology company). |
Acquisition of such indirect subsidiaries by direct subsidiaries of a financial holding company requires prior permission from the Financial Services Commission or the submission of a report to the Financial Services Commission, depending on the types of the indirect subsidiaries and the amount of total assets of the indirect subsidiaries.
Subject to certain exceptions, an indirect subsidiary of a financial holding company may not control any other company. If an indirect subsidiary of a financial holding company had control over another company at the time it became such an indirect subsidiary, the indirect subsidiary is required to dispose of its interest in the company within two years from such time.
Restrictions on Transactions between a Bank Holding Company and its Major Shareholder
A bank holding company and its direct and indirect subsidiaries may not acquire (including through their respective trust accounts) shares issued by the bank holding company’s major shareholder in excess of 1% of the net aggregate equity capital (as defined above). In addition, if those entities intend to acquire shares issued by that major shareholder in any single transaction equal to or in excess of the lesser of (x) the amount equivalent to 0.1% of the net aggregate equity capital and (y) (Won)5 billion, that entity must obtain prior unanimous board resolutions and then, immediately after the acquisition, file a report to the Financial Services Commission and publicly disclose the filing of the report.
Restriction on Ownership of a Financial Holding Company
Under the Financial Holding Company Act, a financial institution generally may not control a financial holding company. In addition, any single shareholder and persons who have a special relationship with that shareholder may acquire beneficial ownership of no more than 10% of the total issued and outstanding shares with voting rights of a bank holding company that controls nationwide banks or 15% of the total issued and outstanding shares with voting rights of a bank holding company that controls only regional banks. The Korean government and the KDIC are not subject to this limit. “Non-financial business group companies” (as defined below), however, may not acquire the beneficial ownership of shares of a bank holding company controlling nationwide banks in excess of 9% of that bank holding company’s outstanding voting shares unless they obtain the approval of the Financial Services Commission and agree not to exercise voting rights in respect of shares in excess of the 9% limit, in which case they may acquire beneficial ownership of up to 10%. Any other person (whether a Korean national or a foreign investor) may acquire no more than 10% of total voting shares issued and outstanding of a bank holding company controlling nationwide banks unless they obtain approval from the Financial Services Commission in each instance where the total holding will exceed 10% (or 15% in the case of a bank holding company controlling only regional banks), 25% or 33% of the total voting shares issued and outstanding of that bank holding company controlling nationwide banks.
Non-financial business group companies are required to obtain approval from the Financial Services Commission in order to (i) become the largest shareholder of a bank holding company or (ii) acquire 4% or more of the issued and outstanding shares of voting stock of a bank holding company and participate in the management of such company in the manner prescribed in the Enforcement Decree of the Financial Holding Company Act. If non-financial business group companies hold voting stock of a bank holding company in excess of the foregoing limits as a result of unavoidable circumstances, such as sales by other stockholders’ of their shareholding, such non-financial business group companies are required to obtain approval from the Financial Services Commission to hold the portion of shares that exceeds the limit, dispose of such portion or take measures so that they no longer fall under the definition of “non-financial business group companies” under the Financial Holding Company Act. Non-compliance with such requirement will prohibit non-financial business group companies from exercising their voting rights of the shares that exceed the limit and prompt the issuance of an order by the Financial Services Commission directing such non-financial business group companies to dispose of their shares that exceed the limit.
116
Table of Contents
Furthermore, in the case where a person (including Korean and foreign investors, but excluding certain persons prescribed under the Enforcement Decree of the Financial Holding Company Act) (i) acquires in excess of 4% of the total issued and outstanding voting shares of any financial holding company (other than a financial holding company controlling only regional banks), (ii) becomes the largest shareholder of such financial holding company in which such person has acquired in excess of 4% of the total issued and outstanding voting shares, or (iii) changes its shareholding in such financial holding company, in which it has acquired in excess of 4% of the total issued and outstanding voting shares, by 1% or more of the total issued and outstanding voting shares of such financial holding company, such person must file a report on such change with the Financial Services Commission within five days thereafter.
“Non-financial business group companies” as defined under the Financial Holding Company Act include:
(1) any same shareholder group where the aggregate net assets of all non-financial business companies belonging to that group equals or exceeds 25% of the aggregate net assets of all members of that group;
(2) any same shareholder group where the aggregate assets of all non-financial business companies belonging to that group equals or exceeds (Won)2 trillion; or
(3) any mutual fund where a same shareholder group identified in (1) or (2) above owns more than 9% of the total issued and outstanding shares of that mutual fund.
Sharing of Customer Information among Financial Holding Company and its Subsidiaries
Under the Act on Use and Protection of Credit Information, any individual customer’s credit information must be disclosed or otherwise used by financial institutions only to determine, establish or maintain existing commercial transactions with them and only after obtaining written consent to use that information. Under the Financial Holding Company Act, a financial holding company and its direct and indirect subsidiaries, however, may share certain credit information of individual customers among themselves for business purposes without the customers’ written consent. In addition, a subsidiary financial investment company with a dealing and/or brokerage license of a financial holding company may provide that financial holding company and its other direct and indirect subsidiaries information relating to the aggregate amount of cash or securities that a customer of the financial investment company with a dealing and/or brokerage license has deposited for business purposes.
Principal Regulations Applicable to Banks
Capital Adequacy
The Bank Act requires nationwide banks, such as Woori Bank, to maintain a minimum paid-in capital of (Won)100 billion and regional banks, such as Kyongnam Bank and Kwangju Bank, to maintain a minimum paid-in capital of (Won)25 billion. All banks, including foreign bank branches in Korea, are also required to maintain a prescribed solvency position. A bank must also set aside in its legal reserve an amount equal to at least 10% of the net income after tax each time it pays dividends on net profits earned until its legal reserve reaches at least the aggregate amount of its paid-in capital.
Under the Bank Act, the capital of a bank is divided into two categories, Tier I and Tier II capital. Tier I capital (core capital) consists of, among others, owners’ equity, capital surplus, retained earnings, hybrid Tier I capital instruments, and gains or losses on foreign exchange as a part of accumulated other comprehensive gains and losses. Tier II capital (supplementary capital) consists of, among others, revaluation reserves, gains on valuation of investment securities (up to certain limits), provisions for credit losses set aside for loans classified as normal or precautionary (up to certain limits), perpetual subordinated debt, cumulative preferred shares (with redemption rights after the fifth anniversary of their date of issuance) and certain other subordinated debt.
All banks must meet minimum ratios of Tier I and Tier II capital (less any capital deductions) to risk-weighted assets, determined in accordance with Financial Services Commission requirements that have been formulated based on BIS standards. These standards were adopted and became effective in 1996, and were amended effective January 1, 2008 upon the implementation by the Financial Supervisory Service of Basel II. All domestic banks and foreign bank branches must meet a minimum ratio of Tier I and Tier II capital (less any capital deductions) to risk-weighted assets of 8%.
117
Table of Contents
In November 2002, the Financial Services Commission amended the Enforcement Detailed Rules on the Supervision of the Banking Business to include a more conservative risk-weighting system for certain newly extended home mortgage loans, which set the risk-weighted ratios of Korean banks in respect of home mortgage loans between 50% and 70% depending on the borrower’s debt ratio and whether the home mortgage loans are overdue. On June 28, 2007, the Financial Services Commission further amended the Enforcement Detailed Rules on the Supervision of the Banking Business and, as a result, the following risk-weight ratios must be applied by Korean banks in respect of home mortgage loans from January 1, 2008:
(1) for those banks which adopted a standardized approach for calculating credit risk capital requirements, a risk-weight ratio of 35%; and
(2) for those banks which adopted an internal ratings-based approach for calculating credit risk capital requirements, a risk-weight ratio calculated with reference to the probability of default, loss given default and exposure at default, each as defined under the Enforcement Detailed Rules on the Supervision of the Banking Business.
Liquidity
All banks are required to ensure adequate liquidity by matching the maturities of their assets and liabilities in accordance with the Bank Act. Banks may not invest an amount exceeding 60% of their Tier I and Tier II capital (less any capital deductions) in stocks and other securities with a maturity of over three years. This stipulation does not apply to Korean government bonds or to Monetary Stabilization Bonds issued by the Bank of Korea. The Financial Services Commission also requires each Korean bank to:
| • | maintain a Won liquidity ratio (defined as Won assets due within one month, including marketable securities, divided by Won liabilities due within one month) of not less than 100% and to make monthly reports to the Financial Supervisory Service; |
| • | maintain a foreign currency liquidity ratio (defined as foreign currency liquid assets due within three months divided by foreign currency liabilities due within three months) of not less than 85%; |
| • | maintain a ratio of foreign currency liquid assets due within seven days less foreign currency liabilities due within seven days, divided by total foreign currency assets, of not less than negative 3%; |
| • | maintain a ratio of foreign currency liquid assets due within a month less foreign currency liabilities due within a month, divided by total foreign currency assets, of not less than negative 10%; and |
| • | submit monthly reports with respect to the maintenance of these ratios. |
The Monetary Policy Committee of the Bank of Korea is empowered to fix and alter minimum reserve requirements that banks must maintain against their deposit liabilities. The current minimum reserve ratio is:
| • | 7% of average balances for Won currency demand deposits outstanding; |
| • | 0% of average balances for Won currency employee asset establishment savings deposits, employee long-term savings deposits, employee house purchase savings deposits, long-term house purchase savings deposits, household long-term savings deposits and employee preferential savings deposits outstanding; and |
| • | 2% of average balances for Won currency time and savings deposits, mutual installments, housing installments and certificates of deposit outstanding. |
For foreign currency deposit liabilities, a 2% minimum reserve ratio is applied to time deposits with a maturity of one month or longer, certificates of deposit with a maturity of 30 days or longer and savings deposits with a maturity of six months or longer and a 7% minimum reserve ratio is applied to demand deposits and other deposits. A 1% minimum reserve ratio applies to offshore accounts, immigrant accounts and resident accounts opened by foreign exchange banks.
118
Table of Contents
Furthermore, pursuant to the Regulation on Supervision of Banking Business, foreign exchange agencies, including our subsidiary banks, will be required to hold “foreign currency safe assets” in an aggregate amount that is not less than the lower of (i) the product of (x) its total foreign currency-denominated debt maturing in one year or less multiplied by 2/12 and (y) an amount equal to one minus the “lowest rollover ratio” and (ii) 2% of its total foreign currency-denominated assets as shown in the balance sheet for the immediately preceding quarter. The “lowest rollover ratio” of a foreign exchange agency means the ratio of (A) its total debt with a maturity of one year or less (excluding overnight money) incurred in a particular month to (B) its total debt with maturity of one year or less (excluding overnight money) payable in that particular month, and is calculated by taking the lowest three month average from a period to be designated by the governor of the Financial Supervisory Service. Under the new regulation, foreign currency debt includes financial bonds, borrowings, call monies and repurchase selling denominated in foreign currencies and such other similar debt instruments denominated in a foreign currency as designated by the governor of the Financial Supervisory Service. “Foreign currency safe assets” are defined as cash denominated in foreign currency, deposits denominated in foreign currency with a central bank or financial institutions rated A or above, bonds issued or guaranteed by a government or central bank rated A or above or corporate bonds issued or guaranteed by corporations rated A or above. Accordingly, we may be required to acquire further foreign currency safe assets. In addition, the new regulation also has increased the minimum “mid- to long-term foreign exchange funding ratio” applicable to foreign exchange agencies, including us, from 80% to 100%. “Mid-to long term foreign exchange funding ratio” refers to the ratio of (1) the total outstanding amount of foreign exchange borrowing with a maturity of more than one year to (2) the total outstanding amount of foreign exchange lending with a maturity of one year or more.
Financial Exposure to Any Individual Customer and Major Shareholder
Under the Bank Act, the sum of large exposures by a bank—in other words, the total sum of its credits to single individuals, juridical persons or business groups that exceed 10% of the sum of Tier I and Tier II capital (less any capital deductions)—generally must not exceed five times the sum of Tier I and Tier II capital (less any capital deductions). In addition, banks generally may not extend credit (including loans, guarantees, purchases of securities (only in the nature of a credit) and any other transactions that directly or indirectly create credit risk) in excess of 20% of the sum of Tier I and Tier II capital (less any capital deductions) to a single individual or juridical person, or grant credit in excess of 25% of the sum of Tier I and Tier II capital (less any capital deductions) to a single group of companies as defined in the Monopoly Regulations and Fair Trade Act.
The Bank Act also provides for certain restrictions on extending credits to a major shareholder. A “major shareholder” is defined as:
| • | a shareholder holding (together with persons who have a special relationship with that shareholder) in excess of 10% (or 15% in the case of regional banks) in the aggregate of the bank’s total issued voting shares; or |
| • | a shareholder holding (together with persons who have a special relationship with that shareholder) in excess of 4% in the aggregate of the bank’s (excluding regional banks) total issued voting shares (excluding shares subject to the shareholding restrictions on “non-financial business group companies” as described below), where the shareholder is the largest shareholder or has actual control over the major business affairs of the bank through, for example, appointment and dismissal of the officers pursuant to the Enforcement Decree of the Bank Act. Non-financial business group companies primarily consist of: (i) any single shareholding group whose non-financial company assets comprise no less than 25% of its aggregate net assets; (ii) any single shareholding group whose non-financial company assets comprise no less than (Won)2 trillion in aggregate; or (iii) any mutual fund of which any single shareholding group identified in (i) or (ii) above, owns more than 9% of the total issued and outstanding shares. |
Under these restrictions, banks may not extend credits to a major shareholder (together with persons who have a special relationship with that shareholder) in an amount greater than the lesser of (x) 25% of the sum of the bank’s Tier I and Tier II capital (less any capital deductions) and (y) the relevant major shareholder’s shareholding ratio multiplied by the sum of the bank’s Tier I and Tier II capital (less any capital deductions). In addition, the total sum of credits granted to all major shareholders must not exceed 25% of the bank’s Tier I and Tier II capital (less any capital deductions).
119
Table of Contents
Interest Rates
Korean banks generally depend on deposits as their primary funding source. Under the Act on Registration of Credit Business and Protection of Finance Users, interest rates on loans made by registered banks in Korea may not exceed 39% per annum. Historically, interest rates on deposits and lending rates were regulated by the Monetary Policy Committee of the Bank of Korea. Controls on deposit interest rates in Korea have been gradually reduced and, in February 2004, the Korean government removed restrictions on all interest rates, except for the prohibition on interest payments on current account deposits. This deregulation process has increased competition for deposits based on interest rates offered and, therefore, may increase a bank’s interest expense.
Lending to Small- and Medium-Sized Enterprises
In order to obtain funding from the Bank of Korea at concessionary rates for their small- and medium-sized enterprise loans, banks are required to allocate a certain minimum percentage of any quarterly increase in their Won currency lending to small- and medium-sized enterprises. Currently, this minimum percentage is 45% in the case of nationwide banks and 60% in the case of regional banks. If a bank does not comply with this requirement, the Bank of Korea may:
| • | require the bank to prepay all or a portion of funds provided to that bank in support of loans to small- and medium-sized enterprises; or |
| • | lower the bank’s credit limit. |
Disclosure of Management Performance
For the purpose of protecting depositors and investors in commercial banks, the Financial Services Commission requires commercial banks to publicly disclose certain material matters, including:
| • | financial condition and profit and loss of the bank and its direct and indirect subsidiaries; |
| • | fund raising by the bank and the appropriation of such funds; |
| • | any sanctions levied on the bank under the Bank Act or any corrective measures or sanctions under the Law on Improvement of Structure of Financial Industry; and |
| • | except as may otherwise have been disclosed by a bank or its financial holding company listed on the KRX KOSPI Market in accordance with the Financial Investment Services and Capital Markets Act, occurrence of any of the following events listed below or any other event as prescribed by the applicable regulations: |
| (i) | loans bearing no profit made to a single business group in an amount exceeding 10% of the sum of the bank’s Tier I and Tier II capital (less any capital deductions) as of the end of the previous month (where the loan exposure to that borrower is calculated as the sum of substandard credits, doubtful credits and estimated loss credits), unless the loan exposure to that group is not more than (Won)4 billion; |
| (ii) | the occurrence of any financial incident involving embezzlement, malfeasance or misappropriation of funds in an amount exceeding 1% of the sum of the bank’s Tier I and Tier II capital (less any capital deductions), unless the bank has lost or expects to lose not more than (Won)1 billion as a result of that financial incident, or the governor of the Financial Supervisory Service has made a public announcement regarding the incident; and |
| (iii) | any loss due to court judgments or similar decisions in civil proceedings in an amount exceeding 1% of the sum of the bank’s Tier I and Tier II capital (less any capital deductions) as of the end of the previous month, unless the loss is not more than (Won)1 billion. |
120
Table of Contents
Restrictions on Lending
Pursuant to the Bank Act, commercial banks may not provide:
| • | loans directly or indirectly secured by a pledge of a bank’s own shares; |
| • | loans directly or indirectly to enable a natural or juridical person to buy the bank’s own shares; |
| • | loans to any of the bank’s officers or employees, other than petty loans of up to (Won)20 million in the case of a general loan, (Won)50 million in the case of a general loan plus a housing loan or (Won)60 million in the aggregate for general loans, housing loans and loans to pay damages arising from wrongful acts of employees in financial transactions; |
| • | credit (including loans) secured by a pledge of shares of a subsidiary corporation of the bank or to enable a natural or juridical person to buy shares of a subsidiary corporation of the bank; or |
| • | loans to any officers or employees of a subsidiary corporation of the bank, other than general loans of up to (Won)20 million or general and housing loans of up to (Won)50 million in the aggregate. |
Recent Regulations Relating to Retail Household Loans
The Financial Services Commission implemented a number of changes in recent years to the mechanisms by which a bank evaluates and reports its retail household loan balances and has proposed implementing further changes. Due to a rapid increase in the number of loans secured by homes and other forms of housing, the Financial Services Commission and the Financial Supervisory Service have implemented regulations designed to curtail extension of new or refinanced loans secured by housing, including the following:
| • | as to loans secured by collateral of housing located nationwide, the loan-to-value ratio (the aggregate principal amount of loans secured by such collateral over the appraised value of the collateral) should not exceed 60%; |
| • | as to loans secured by collateral of housing located in areas of excessive investment as designated by the Korean government, (i) the loan-to-value ratio for loans with a maturity of not more than three years should not exceed 50% and (ii) the loan-to-value ratio for loans with a maturity of more than three years should not exceed 60%; |
| • | as to loans secured by collateral of housing located outside of Seoul, Incheon and Gyeong-gi province, which housing was offered for sale on or before June 10, 2008 and with respect to which a sale contract is executed and earnest money deposit paid during the period between June 11, 2008 and June 30, 2009, the loan-to-value ratio should not exceed 70%; |
| • | as to loans secured by apartments located in areas of high speculation as designated by the Korean government, |
| (i) | the loan-to-value ratio for loans with a maturity of not more than ten years should not exceed 40%; and |
| (ii) | the loan-to-value ratio for loans with a maturity of more than ten years should not exceed (a) 40%, if the price of such apartment is over (Won)600 million, and (b) 60%, if the price of such apartment is (Won)600 million or lower; |
| • | as to loans secured by apartments with appraisal value of more than (Won)600 million in areas of high speculation as designated by the Korean government or certain metropolitan areas designated as areas of excessive investment by the Korean government, the borrower’s debt-to-income ratio (calculated as (i) the aggregate annual total payment amount of (x) the principal of and interest on loans secured by such apartment(s) and (y) the interest on other debts of the borrower over (ii) the borrower’s annual income) should not exceed 40%; |
| • | as to apartments located in areas of high speculation as designated by the Korean government, a borrower is permitted to have only one new loan secured by such apartment; |
121
Table of Contents
| • | where a borrower has two or more loans secured by apartments located in areas of high speculation as designated by the Korean government, the loan with the earliest maturity date must be repaid first and the number of loans must be eventually reduced to one; and |
| • | in the case of a borrower (i) whose spouse already has a loan secured by housing or (ii) who is single and under 30 years old, the debt-to-income ratio of the borrower in respect of loans secured by apartment(s) located in areas of high speculation as designated by the Korean government should not exceed 40%. |
See “Item 3D. Risk Factors—Risks relating to our consumer credit portfolio—Government regulation of consumer lending, particularly mortgage and home equity lending, has recently become more stringent, which may hurt our consumer banking operations.”
Restrictions on Investments in Property
A bank may not invest in securities set forth below in excess of 60% of the sum of the bank’s Tier I and Tier II capital (less any capital deductions):
| • | debt securities (within the meaning of paragraph (3) of Article 4 of the Financial Investment Services and Capital Markets Act) the maturity of which exceeds three years, but excluding government bonds, monetary stabilization bonds issued by the Bank of Korea and bonds within the meaning of item 2, paragraph (6) of Article 11 of the Law on the Improvement of the Structure of the Financial Industry; |
| • | equity securities, but excluding securities within the meaning of item 1, paragraph (6) of Article 11 of the Law on the Improvement of the Structure of the Financial Industry; |
| • | derivatives linked securities (within the meaning of paragraph (7) of Article 4 of the Financial Investment Services and Capital Markets Act) the maturity of which exceeds three years; and |
| • | beneficiary certificates, investment contracts and depositary receipts (within the meaning of paragraph (2) of Article 4 of the Financial Investment Services and Capital Markets Act) the maturity of which exceeds three years. |
A bank may possess real estate property only to the extent necessary for the conduct of its business, unless the aggregate value of that property does not exceed 60% of the sum of the bank’s Tier I and Tier II capital (less any capital deductions). Any property that a bank acquires by exercising its rights as a secured party, or which a bank is prohibited from acquiring under the Bank Act, must be disposed of within one year.
Restrictions on Shareholdings in Other Companies
Under the Bank Act, a bank may not own more than 15% of shares outstanding with voting rights of another corporation, except where, among other reasons:
| • | that corporation engages in a category of financial businesses set forth by the Financial Services Commission; or |
| • | the acquisition is necessary for the corporate restructuring of the corporation and is approved by the Financial Services Commission. |
In the above exceptional cases, the total investment in corporations in which the bank owns more than 15% of the outstanding shares with voting rights may not exceed 15% of the sum of Tier I and Tier II capital (less any capital deductions), or 30% of the sum of Tier I and Tier II capital (less any capital deductions) if the bank meets certain management conditions as set forth in the applicable rules adopted by the Financial Services Commission.
The Bank Act provides that a bank using its bank accounts and its trust accounts may not acquire the shares of another corporation that is a major shareholder of the bank in excess of an amount equal to 1% of the sum of Tier I and Tier II capital (less any capital deductions).
122
Table of Contents
Restrictions on Bank Ownership
Under the Bank Act, a single shareholder and persons who have a special relationship with that shareholder generally may acquire beneficial ownership of no more than 10% of a nationwide bank’s total issued and outstanding shares with voting rights and no more than 15% of a regional bank’s total issued and outstanding shares with voting rights. The Korean government, the KDIC and bank holding companies qualifying under the Financial Holding Company Act are not subject to this limit. However, non-financial business group companies may not acquire beneficial ownership of shares of a nationwide bank in excess of 9% of that bank’s outstanding voting shares, unless they obtain the approval of the Financial Services Commission and agree not to exercise voting rights in respect of shares in excess of the 9% limit, in which case they may acquire beneficial ownership of up to 10% of a nationwide bank’s outstanding voting shares. Non-financial business group companies are required to obtain approval from the Financial Services Commission in order to (i) become the largest shareholder of a bank or (ii) acquire 4% or more of the issued and outstanding shares of voting stock of a bank and participate in the management of a bank in the manner prescribed in the Enforcement Decree of the Bank Act. If non-financial business group companies hold voting stock of a bank in excess of the foregoing limits as a result of unavoidable circumstances, such as sales by other stockholders’ of their shareholding, such non-financial business group companies are required to obtain approval from the Financial Services Commission to hold the portion of shares of the bank that exceeds the limit, dispose of such portion or take measures so that they no longer fall under the definition of “non-financial business group companies” under the Bank Act. Non-compliance with such requirement will prohibit non-financial business group companies from exercising their voting rights of the shares that exceed the limit and prompt the issuance of an order by the Financial Services Commission directing such non-financial business group companies to dispose of their shares that exceed the limit. In addition, if a foreign investor, as defined in the Foreign Investment Promotion Act, owns in excess of 4% of a nationwide bank’s outstanding voting shares, non-financial business group companies may acquire beneficial ownership of up to 10% of that bank’s outstanding voting shares, and in excess of 10%, 25% or 33% of that bank’s outstanding voting shares with the approval of the Financial Services Commission in each instance, up to the number of shares owned by the foreign investor. Any other person (whether a Korean national or a foreign investor), with the exception of non-financial business group companies described above, may acquire no more than 10% of a nationwide bank’s total voting shares issued and outstanding, unless they obtain approval from the Financial Services Commission in each instance where the total holding will exceed 10% (or 15% in the case of regional banks), 25% or 33% of the bank’s total voting shares issued and outstanding provided that, in addition to the foregoing threshold shareholding ratios, the Financial Services Commission may, at its discretion, designate a separate and additional threshold shareholding ratio.
Deposit Insurance System
The Depositor Protection Act provides insurance for certain deposits of banks in Korea through a deposit insurance system. Under the Depositor Protection Act, all banks governed by the Bank Act are required to pay an insurance premium to the KDIC on a quarterly basis. The rate is determined under the Enforcement Decree to the Depositor Protection Act, and may not exceed 0.5% of the bank’s insurable deposits in any given year. The current insurance premium is 0.02% of insurable deposits for each quarter. If the KDIC makes a payment on an insured amount, it will acquire the depositors’ claims with respect to that payment amount. The KDIC insures a maximum of (Won)50 million for deposits and interest, regardless of when the deposits were made and the size of the deposits. Certain banks governed by the Bank Act, including our commercial banking subsidiaries, are also required by the Deposit Insurance Act to pay a special contribution of 0.025% of average deposits for each quarter as repayment of the governmental funding provided to such banks in the wake of the financial crisis in Korea in the late 1990s. The Depositor Protection Act requires such special contribution to be paid until 2027.
Laws and Regulations Governing Other Business Activities
A bank must register with the Ministry of Strategy and Finance to enter the foreign exchange business, which is governed by the Foreign Exchange Transaction Law. A bank must obtain the permission of the Financial Services Commission to enter the securities business, which is governed by regulations under the
123
Table of Contents
Financial Investment Services and Capital Markets Act. Under these laws, a bank may engage in the foreign exchange business, securities repurchase business, governmental/public bond underwriting business and governmental bond dealing business.
Trust Business
A bank must obtain approval from the Financial Services Commission to engage in trust businesses. The Trust Act and the Financial Investment Services and Capital Markets Act govern the trust activities of banks, and they are subject to various legal and accounting procedures and requirements, including the following:
| • | under the Trust Act, assets accepted in trust by a bank in Korea must be segregated from other assets in the accounts of that bank; and |
| • | depositors and other general creditors cannot obtain the assets comprising the trust accounts if the bank is liquidated or wound-up. |
The bank must make a special reserve of 25% or more of fees and commissions from each unspecified money trust account for which a bank guarantees the principal amount and a minimum yield until the total reserve for that account equals 5% of the trust amount. Since January 1999, the Korean government has prohibited Korean banks from offering new guaranteed fixed rate trust account products whose principal and interest are guaranteed.
Under the Financial Investment Services and Capital Markets Act, which became effective in February 2009, a bank with a trust business license is permitted to offer both specified money trust account products and unspecified money trust account products. Previously, banks were not permitted to offer unspecified money trust account products pursuant to the Indirect Investment Asset Management Act, which is no longer in effect following the effectiveness of the Financial Investment Services and Capital Markets Act.
Credit Card Business
General
In order to enter the credit card business, a bank must register with the Financial Services Commission. Credit card businesses are governed by the Specialized Credit Financial Business Act, enacted on August 28, 1997 and last amended on October 8, 2011, which sets forth specific requirements with respect to the credit card business as well as generally prohibiting unsound business practices relating to the credit card business which may infringe on the rights of credit card holders or negatively affect the soundness of the credit card industry. A registered bank engaging in the credit card business is regulated by the Financial Services Commission and the Financial Supervisory Service.
Disclosure and Reports
Pursuant to the Specialized Credit Financial Business Act, a registered bank engaging in the credit card business must submit its business reports and reports with respect to its results of operations to the Governor of the Financial Supervisory Service within one month from the end of each quarter and each fiscal year.
Lending Ratio in Ancillary Business
Pursuant to the Enforcement Decree to the Specialized Credit Financial Business Act, a registered bank engaging in the credit card business must maintain an aggregate quarterly average outstanding lending balance to credit cardholders (including cash advances and credit card loans, but excluding restructured loans) no greater than the sum of (i) its aggregate quarterly average outstanding credit card balance arising from the purchase of goods and services and (ii) the aggregate quarterly debit card transaction volume.
Risk of Loss Due to Lost, Stolen, Forged or Altered Credit Cards
Under the Specialized Credit Financial Business Act, a registered bank engaging in the credit card business is liable for any losses arising from the unauthorized use of credit cards or debit cards after it has received notice
124
Table of Contents
from the cardholder of the loss or theft of the card, and is also liable for any unauthorized use during the period beginning 60 days before the registered bank engaging in the credit card business receives notice of the loss or theft from the cardholder.
However, if the registered bank engaging in the credit card business has entered into agreements which allow it to transfer all or part of its burden of liability for loss or theft of credit cards to holders of the credit cards, then the registered bank engaging in the credit card business may transfer the liability to those holders of the credit cards in accordance with the terms and conditions of the agreements. Even in such case, the risk of liability cannot be transferred to the holders of the credit cards if there was no willful misconduct or negligence attributable to the holders of the credit cards, such as in the case where the cardholder’s password was disclosed under irresistible force or threat to the cardholder’s or his/her relative’s life or health.
A registered bank engaging in the credit card business is also liable for any loss arising from the use of forged or altered credit cards, debit cards or pre-paid cards. However, if the registered bank engaging in the credit card business has entered into an agreement allowing it to transfer all or part of its burden of liability for loss or theft of the credit card, debit card, or pre-paid card to the holder of the credit card, debit card, or pre-paid card, and it has proved willful misconduct or gross negligence of the holder of the credit card, debit card, or pre-paid card, then the registered bank engaging in the credit card business may transfer the liability to such holder of the credit card, debit card, or pre-paid card in accordance with the terms and conditions of the agreement. For these purposes, willful misconduct or gross negligence means either disclosure of the cardholder’s password, or the transfer of the credit card or debit card, or providing such credit card or debit card as security, all through willful misconduct or gross negligence.
Any agreement between a registered bank engaging in the credit card business and a cardholder allowing the transfer of burden of liability for the loss, theft, forgery or alteration of credit cards, debit cards, or pre-paid cards, as applicable, will be effective only if it is in writing, and an act of gross negligence by the cardholder will be acknowledged as such only if it is expressly provided as falling under such act in the agreement.
Each registered bank engaging in the credit card business must institute appropriate measures to fulfill these obligations, such as establishing provisions, purchasing insurance or joining a cooperative association.
Pursuant to the Specialized Credit Financial Business Act, the Financial Services Commission may either restrict the limit or take other necessary measures against the registered bank engaging in the credit card business with respect to such matters as the maximum limits on the amount per credit card, details of credit card terms and conditions, management of credit card merchants and collection of claims, including the following:
| • | maximum limits for cash advances on credit cards; |
| • | use restrictions on debit cards with respect to per day or per transaction usage; |
| • | aggregate issuance limits and maximum limits on the amount per card on pre-paid cards; and |
| • | other matters prescribed by the Specialized Credit Financial Business Act and the Enforcement Decree thereto. |
Issuance of New Cards and Solicitation of New Card Holders
The Enforcement Decree to the Specialized Credit Financial Business Act establishes the conditions under which a registered bank engaging in the credit card business may issue new cards and solicit new members. New credit cards may be issued only to the following persons:
| • | persons who are at least 18 years old when they apply for a credit card; |
| • | persons whose capability to pay bills as they come due has been verified using standards established by the registered bank engaging in the credit card business; and |
| • | in the case of minors who are at least 18 years and younger than 20 years, persons who submit a guardian’s consent along with documents evidencing income, such as an employment certificate or a tax certificate. |
125
Table of Contents
| • | In addition, a registered bank engaging in the credit card business may not solicit credit card members by: |
| • | providing economic benefits or promising to provide economic benefits in excess of 10% of the annual credit card fee (in the case of credit cards with annual fees that are less than the average of the annual fees charged by the major credit cards in Korea, the annual fee will be deemed to be equal to such average annual fee) in connection with issuing a credit card; |
| • | soliciting applicants on roads, public places or along corridors used by the general public; |
| • | soliciting applicants through visits, except those visits made upon prior consent and visits to a business area; |
| • | soliciting applicants through the Internet without verifying whether the applicant is who he or she purports to be, by means of a certified digital signature under the Digital Signature Act; and |
| • | soliciting applicants through pyramid sales methods. |
Compliance Rules on Collection of Receivable Claims
Pursuant to Supervisory Regulation on the Specialized Credit Financial Business, a registered bank engaging in the credit card business may not:
| • | exert violence or threaten violence; |
| • | inform a related party (a guarantor of the debtor, blood relative or fiancée of the debtor, a person living in the same household as the debtor or a person working in the same workplace as the debtor) of the debtor’s obligations without just cause; |
| • | provide false information relating to the debtor’s obligation to the debtor or his or her related parties; |
| • | threaten to sue or sue the debtor for fraud despite lack of affirmative evidence to establish that the debtor has submitted forged or false documentation with respect to his/her capacity to make payment; |
| • | visit or telephone the debtor during late evening hours (between the hours of 9:00 p.m. and 8:00 a.m.); and |
| • | utilize other uncustomary methods to collect the receivables that interfere with the privacy or the peace in the workplace of the debtor or his or her related parties. |
Regulations on Class Actions Regarding Securities
The Law on Class Actions Regarding Securities was enacted as of January 20, 2004 and last amended on March 31, 2010. The Law on Class Actions Regarding Securities governs class actions suits instituted by one or more representative plaintiff(s) on behalf of 50 or more persons who claim to have been damaged in a capital markets transaction involving securities issued by a listed company in Korea.
Applicable causes of action with respect to such suits include:
| • | claims for damages caused by misleading information contained in a securities statement; |
| • | claims for damages caused by the filing of a misleading business report, semi-annual report, or quarterly report; |
| • | claims for damages caused by insider trading or market manipulation; and |
| • | claims instituted against auditors for damages caused by accounting irregularities. |
Any such class action may be instituted upon approval from the presiding court and the outcome of such class action will have a binding effect on all potential plaintiffs who have not joined the action, with the exception of those who have filed an opt out notice with such court.
126
Table of Contents
Principal Regulations Applicable to Financial Investment Companies with a Dealing and/or Brokerage License
General
Beginning in February 2009, the Financial Investment Services and Capital Markets Act regulates and governs the financial investment business, including the brokerage business. The entities that regulate and supervise financial investment companies with a dealing and/or brokerage license are the Financial Services Commission, the Financial Supervisory Service and the Securities and Futures Commission.
Under the Financial Investment Services and Capital Markets Act, a company must obtain a license from the Financial Services Commission to commence a financial investment business such as a brokerage business, a dealing business or an underwriting business. A financial investment company with a dealing and/or brokerage license may also engage in certain businesses ancillary to that business without obtaining any separate license and certain other businesses if it obtains separate licenses from the Financial Services Commission. A financial investment company must also obtain approval from the Financial Services Commission to merge with any other entity or transfer all or a part of its business.
If the Financial Services Commission deems a financial investment company’s financial condition to be unsound or if a financial investment company fails to meet the applicable “net operating equity ratio” (as defined below), the Financial Services Commission may order the financial investment company to:
| • | increase or reduce its capital; |
| • | cancel or consolidate its stock: |
| • | transfer all or part of its business; |
| • | close branch offices; |
| • | merge with another financial institution; |
| • | suspend a part or all of its business operations; or |
| • | assign contractual rights and obligations relating to its financial transactions. |
Regulations on Financial Soundness
The Financial Services Commission regulations require that the financial soundness of a financial investment company be assessed in accordance with its net operating equity ratio, which is calculated as follows and expressed as a percentage:
Net operating equity ratio = (net operating equity/total risk) x 100
The terms “net operating equity” and “total risk” for the purpose of the above formula are defined in the Financial Services Commission’s regulations. Generally, the net operating equity and the total risk are calculated according to the following formulas:
Net operating equity = net assets (total assets – total liabilities) – total deductible items + total creditable items
Total risk = market risk + credit risk + operational risk
The regulations require that financial investment companies maintain their net operating equity ratio at a level equal to or higher than 150%.
Other Provisions on Financial Soundness
The Financial Investment Services and Capital Markets Act, the Enforcement Decree of the Financial Investment Services and Capital Markets Act and Financial Services Commission regulations also include provisions designed to regulate certain types of activities relating to the management of the assets of a financial investment company. These provisions include:
| • | restrictions on the holdings by a financial investment company with a dealing and/or brokerage license of securities issued by another company which is the largest shareholder or the major shareholder (each |
127
Table of Contents
| as defined under the Financial Investment Services and Capital Markets Act) of that financial investment company; |
| • | restrictions on providing money or credit to the largest shareholder, major shareholder, officers and related persons of the financial investment company; and |
| • | special provisions concerning payment guarantees by a financial investment company with a dealing and/or brokerage license. For instance, a financial investment company with a dealing and/or brokerage license may not provide payment guarantees for major shareholders (as defined in the Financial Investment Services and Capital Markets Act) other than its overseas subsidiaries or provide new guarantees for corporate bonds, other than, subject to certain restrictions, roll-over guarantees in connection with the repayment of bonds previously guaranteed by it. |
Business Conduct Rules
Pursuant to the Financial Investment Services and Capital Markets Act, financial investment companies are required to comply with certain “business conduct rules.” These rules impose greater responsibilities on financial investment companies, strictly banning certain unfair practices and ensuring that the potential investors solicited by financial investment companies are suitable.
Disclosure and Reports
Pursuant to the Financial Investment Services and Capital Markets Act, a financial investment company with a dealing and/or brokerage license is required to disclose certain material matters, including:
| • | its financial condition, including profit and loss; |
| • | any sanctions levied on it under the Financial Investment Services and Capital Markets Act or any corrective measures or sanctions under the Law on Improvement of Structure of Financial Industry; and |
| • | the occurrence of any matters which may have a material adverse effect on its operation or management. |
A financial investment company must submit a report on its financial results to the Financial Services Commission within 45 days from the end of each quarter.
Financial Investment Services and Capital Markets Act
General
In July 2007, the National Assembly of Korea passed the Financial Investment Services and Capital Markets Act, a new law intended to enhance the integration of the Korean capital markets and financial investment products industry. The Financial Investment Services and Capital Markets Act became effective as of February 4, 2009
Consolidation of Capital Markets-Related Laws
Prior to the effectiveness of the Financial Investment Services and Capital Markets Act, different laws regulated different types of financial institutions. By applying a uniform set of rules to the same financial business having the same economic function, the Financial Investment Services and Capital Markets Act aims to address the issues caused by the previous regulatory system under which the same economic function relating to capital markets-related businesses was governed by multiple regulations. The Financial Investment Services and Capital Markets Act categorizes financial investment businesses into six different functions:
| • | dealing, trading and underwriting of “financial investment products” (as defined below); |
| • | brokerage of financial investment products; |
| • | establishment of collective investment schemes and the management thereof; |
| • | investment advice; |
128
Table of Contents
| • | discretionary investment management; and |
| • | trusts (together with the five businesses set forth above, the “Financial Investment Businesses”). |
Accordingly, all financial businesses relating to financial investment products have been reclassified as one or more of the financial investment businesses listed above, and financial institutions are subject to the regulations applicable to their relevant financial investment businesses, regardless of the type of the financial institution it may be. For example, under the Financial Investment Services and Capital Markets Act, derivative businesses conducted by former securities companies and future companies will be subject to the same regulations.
Banking and insurance businesses are not subject to the Financial Investment Services and Capital Markets Act and will continue to be regulated under separate laws. However, they may become subject to the Financial Investment Services and Capital Markets Act if their activities involve any financial investment businesses requiring a license pursuant to the Financial Investment Services and Capital Markets Act.
Comprehensive Definition of Financial Investment Products
In an effort to encompass the various types of securities and derivative products available in the capital markets, the Financial Investment Services and Capital Markets Act sets forth a comprehensive term “financial investment products,” defined to mean all financial products carrying a risk of loss of the invested amount. Financial investment products are classified into two major categories: (i) “securities” (financial investment products in which the risk of loss is limited to the invested amount) and (ii) “derivatives” (financial investment products in which the risk of loss may exceed the invested amount). As a result of the general and broad definition of financial investment products, a variety of financial products may be defined as a financial investment product, which would enable Financial Investment Companies (defined below) to handle a broader range of financial products. Under the Financial Investment Services and Capital Markets Act, entities formerly licensed as securities companies, asset management companies, future companies and other entities engaging in any Financial Investment Business are classified as “Financial Investment Companies.”
New License System and the Conversion of Existing Licenses
Under the Financial Investment Services and Capital Markets Act, Financial Investment Companies are able to choose the type of Financial Investment Business in which to engage (through a “check the box” method set forth in the relevant license application), by specifying the desired (i) financial investment business, (ii) financial investment product and (iii) target customers to which financial investment products may be sold or distributed (that is, general investors or professional investors). Licenses will be issued under the specific business sub-categories described in the foregoing sentence. For example, it would be possible for a Financial Investment Company to obtain a license to engage in the financial investment business of (i) dealing (ii) over the counter derivatives products or (iii) only with sophisticated investors.
Financial institution that engage in business activities constituting a financial investment business are required to take certain steps, such as renewal of their license or registration, in order to continue engaging in such business activities. Financial institutions that are not licensed Financial Investment Companies are not permitted to engage in any Financial Investment Business, subject to the following exceptions: (i) banks and insurance companies are permitted to engage in certain categories of Financial Investment Businesses for a period not exceeding six months commencing on the effective date of the Financial Investment Services and Capital Markets Act; and (ii) other financial institutions that engaged in any Financial Investment Business prior to the effective date of the Financial Investment Services and Capital Markets Act (whether in the form of a concurrent business or an incidental business) are permitted to continue such Financial Investment Business for a period not exceeding six months commencing on the effective date of the Financial Investment Services and Capital Markets Act.
Expanded Business Scope of Financial Investment Companies
Under the previous regulatory regime in Korea, it was difficult for a financial institution to explore a new line of business or expand upon its existing line of business. For example, previously a financial institution
129
Table of Contents
licensed as a securities company generally was not permitted to engage in the asset management business. In contrast, under the Financial Investment Services and Capital Markets Act, pursuant to the integration of its current businesses involving financial investment products into a single Financial Investment Business, a licensed Financial Investment Company is permitted to engage in all types of Financial Investment Businesses, subject to satisfying relevant regulations (for example, maintaining an adequate “Chinese Wall,” to the extent required). As to incidental businesses (that is, a financial related business which is not a Financial Investment Business), the Financial Investment Services and Capital Markets Act generally allows a Financial Investment Company to freely engage in such incidental businesses by shifting away from the previous positive-list system towards a more comprehensive system. In addition, a Financial Investment Company is permitted to (i) outsource marketing activities by contracting “introducing brokers” that are individuals but not employees of the Financial Investment Company, (ii) engage in foreign exchange business related to their Financial Investment Business and (iii) participate in the settlement network, pursuant to an agreement among the settlement network participants.
Improvement in Investor Protection Mechanism
While the Financial Investment Services and Capital Markets Act widens the scope of financial businesses in which financial institutions are permitted to engage, a more rigorous investor-protection mechanism is also imposed upon Financial Investment Companies dealing in financial investment products. The Financial Investment Services and Capital Markets Act distinguishes general investors from sophisticated investors and provides new or enhanced protections to general investors. For instance, the Financial Investment Services and Capital Markets Act expressly provides for a strict know-your-customer rule for general investors and imposes an obligation that Financial Investment Companies should market financial investment products suitable to each general investor, using written explanatory materials. Under the Financial Investment Services and Capital Markets Act, a Financial Investment Company could be liable if a general investor proves (i) damage or losses relating to such general investor’s investment in financial investment products solicited by such Financial Investment Company and (ii) absence of the requisite written explanatory materials, without having to prove fault or causation. With respect to any conflicts of interest between Financial Investment Companies and investors, the Financial Investment Services and Capital Markets Act expressly requires (i) disclosure of any conflict of interest to investors and (ii) mitigation of conflicts of interest to a comfortable level or abstention from the relevant transaction.
Other Changes to Securities / Fund Regulations
The Financial Investment Services and Capital Markets Act changed various securities regulations including those relating to public disclosure, insider trading and proxy contests, which were previously governed by the Securities and Exchange Act. For example, the 5% and 10% reporting obligations under the Securities and Exchange Act have become more stringent. The Indirect Investment and Asset Management Business Act strictly limited the kind of vehicles that could be utilized under a collective investment scheme, restricting the range of vehicles to trusts and corporations, and the type of funds that can be used for investments. However, under the Financial Investment Services and Capital Markets Act, these restrictions have been significantly liberalized, permitting all vehicles that may be created under Korean law, such as limited liability companies or partnerships, to be used for the purpose of collective investments and investment funds to be more flexible as to their investments.
130
Table of Contents
| Item 4C. | Organizational Structure |
The following chart provides an overview of our structure, including our significant subsidiaries and our ownership of such subsidiaries as of the date of this annual report:
| (1) | Woori Aviva Life Insurance, in which we acquired a 51.0% interest in April 2008 and in respect of which we entered into a joint venture agreement with Aviva International Holdings Limited, is accounted for as part of our investments in jointly controlled entities and associates under IFRS. We currently hold a 51.6% interest in Woori Aviva Life Insurance. |
| (2) | In March 2011, we acquired certain assets and assumed certain liabilities of Samhwa Mutual Savings Bank through our wholly owned subsidiary Woori FG Savings Bank, which was established in connection with such transaction. |
Our largest subsidiary is Woori Bank, the assets of which represented approximately 72.9% of our total assets as of December 31, 2011. The following table identifies each of our major subsidiaries and their contributions to our total assets and net income as of and for the year ended December 31, 2011 (after allocating eliminations for consolidation, inter-segment transactions and certain differences in classification under our management reporting system for assets and net income in proportion to total assets and absolute net income, respectively):
| As of or for the year
ended December 31, 2011 |
||||||||||||
| Total Assets (1) | Net Income(2) | |||||||||||
| Amount | % of Total | |||||||||||
| (in billions of Won, except percentages) | ||||||||||||
| Subsidiary |
||||||||||||
| Woori Bank |
(Won) | 227,914 | 72.9 | % | (Won) | 1,713 | ||||||
| Kyongnam Bank |
23,832 | 7.6 | 162 | |||||||||
| Kwangju Bank |
16,947 | 5.4 | 113 | |||||||||
| Others |
44,099 | 14.1 | 445 | |||||||||
|
|
|
|
|
|
|
|||||||
| Total |
(Won) | 312,792 | 100.0 | % | (Won) | 2,433 | ||||||
|
|
|
|
|
|
|
|||||||
| (1) | After allocating eliminations of (Won)19,980 billion representing consolidation, inter-segment transactions and certain differences in classification under our management reporting system. This amount has been allocated in proportion to the ratio of segment assets before eliminations to total assets before eliminations. See Note 5 of the notes to our consolidated financial statements. |
| (2) | After allocating a loss of (Won)505 billion representing inter-segment transactions and certain differences in classification under our management reporting system. This amount has been allocated in proportion to the ratio of absolute segment net income to the sum of the absolute net income of all segments. |
The following is a summary of the activities of our principal subsidiaries:
Woori Bank
Established in December 1998, Woori Bank (formerly known as Hanvit Bank) was formed as a result of the merger of two nationwide commercial banks, the Commercial Bank of Korea (established in 1899) and Hanil Bank (established in 1932). Woori Bank provides a wide range of banking and other financial services to large corporations, small- and medium-sized enterprises and individuals in Korea. As of December 31, 2011, Woori Bank was the second-largest commercial bank in Korea based upon total assets (including loans) and deposits. As of December 31, 2011, Woori Bank had approximately 17 million customers, with 942 branches nationwide.
131
Table of Contents
Kyongnam Bank
Established in April 1970, Kyongnam Bank is a regional commercial bank that provides financial services in Changwon and Ulsan and other parts of the South Kyongsang province in southeastern Korea. Kyongnam Bank concentrates on consumer banking, as well as corporate banking for small- and medium-sized enterprises and, to a lesser extent, large corporate customers. As of December 31, 2011, Kyongnam Bank had approximately two million customers, with 156 branches throughout southeastern Korea and Seoul.
Kwangju Bank
Established in September 1968, Kwangju Bank is a regional commercial bank that provides financial services in Kwangju and southwestern Korea. Kwangju Bank concentrates on the consumer and small- and medium-sized enterprise banking sectors, offering various deposit and loan products to customers in those sectors and, to a lesser extent, large corporate customers. As of December 31, 2011, Kwangju Bank had approximately two million customers, with 147 branches throughout southwestern Korea and Seoul.
Other Subsidiaries
The following table provides summary information regarding our other significant consolidated subsidiaries (other than special purpose companies) as of or for the year ended December 31, 2011:
| Subsidiary |
Percentage of Ownership(1) |
Total Assets | Stockholders’ Equity |
Operating Revenue |
Net Income |
|||||||||||||||
| (in millions of Won) | ||||||||||||||||||||
| Woori Asset Management Co., Ltd. |
100.0 | % | 80,020 | 62,846 | 32,111 | 1,462 | ||||||||||||||
| Woori Private Equity Co., Ltd. |
100.0 | % | 1,575,969 | 70,333 | 382,597 | (28,019 | ) | |||||||||||||
| Woori F&I Co., Ltd. |
100.0 | % | 1,371,031 | 256,688 | 172,100 | 43,145 | ||||||||||||||
| Woori FG Savings Bank |
100.0 | % | 603,400 | 77,365 | 55,320 | (32,352 | ) | |||||||||||||
| Woori FIS Co., Ltd |
100.0 | % | 264,215 | 25,822 | 287,856 | (3,480 | ) | |||||||||||||
| Woori Financial Co., Ltd. |
52.5 | % | 3,161,794 | 272,054 | 334,453 | 51,702 | ||||||||||||||
| Woori Investment & Securities Co., Ltd. |
37.9 | % | 21,535,058 | 3,672,607 | 3,910,525 | 197,781 | ||||||||||||||
| (1) | Including both direct and indirect ownership. |
In March 2011, we acquired certain assets and assumed certain liabilities of Samhwa Mutual Savings Bank through our wholly owned subsidiary Woori FG Savings Bank, which was established in connection with such transaction.
| Item 4D. | Property, Plants and Equipment |
Our registered office and corporate headquarters, with a total area of approximately 97,222 square meters, are located at 203, 1-ga, Hoehyon-dong, Chung-Gu, Seoul, Korea. Information regarding certain of our properties in Korea is presented in the following table:
| Type of Facility/Building |
Location |
Area | ||||
| (square meters) | ||||||
| Woori Finance Holdings and Woori Bank registered office and corporate headquarters |
203 Hoehyon-dong, 1-ga, Chung-gu, Seoul, Korea 100-792 |
|
97,222 |
| ||
| Kyongnam Bank registered office and corporate headquarters |
246-1 Seockcheon-dong, MasanHoiwon-gu, Changwon City, Kyongnam Province, Korea 630-010 |
|
29,457 |
| ||
| Kwangju Bank registered office and corporate headquarters |
7-12 Daein-dong, Dong-gu, Kwangju, Korea 501-030 |
|
47,007 |
| ||
| Woori Investment & Securities registered office and corporate headquarters |
23-4 Yeouido-dong, Yeongdeungpo-gu, Seoul, Korea 150-725 |
|
45,499 |
| ||
| Woori FIS registered office and corporate headquarters |
1585 Sangam-dong, Mapo-gu, Seoul, Korea 121-835 |
|
40,737 |
| ||
132
Table of Contents
As of December 31, 2011, we had a network of 1,245 banking branches in Korea. With respect to Woori Bank, approximately 258 of its branches are housed in buildings owned by us, while the remaining branches are leased properties. Lease terms are generally from two to three years and seldom exceed five years. We also have subsidiaries in the United States, China, Hong Kong, Russia and Indonesia and branches, agencies and representative offices in Asia, the United States and Europe. We do not own any material properties outside of Korea.
The net book value of all the properties owned by us as of December 31, 2011 was (Won)3,134 billion.
| Item 4.A. | UNRESOLVED STAFF COMMENTS |
We do not have any unresolved comments from the Securities and Exchange Commission staff regarding our periodic reports under the Securities Exchange Act of 1934.
| Item 5. | OPERATING AND FINANCIAL REVIEW AND PROSPECTS |
| Item 5A. | Operating Results |
Overview
The following discussion is based on our consolidated financial statements, which have been prepared in accordance with IFRS as issued by the IASB. The consolidated financial statements include the accounts of subsidiaries over which substantive control is exercised through either majority ownership of voting stock and/or other means. Investments in jointly controlled entities and associates (companies over which we have the ability to exercise significant influence) are accounted for by the equity method of accounting and are reported in other investment assets.
Trends in the Korean Economy
Our financial position and results of operations have been and will continue to be significantly affected by financial and economic conditions in Korea. Substantial growth in lending in Korea to small- and medium-sized enterprises in recent years, and financial difficulties experienced by such enterprises as a result of, among other things, adverse economic conditions in Korea and globally from the second half of 2008, have generally led to increasing delinquencies and a deterioration in overall asset quality in the credit exposures of Korean banks to small- and medium-sized enterprises. In 2011, we recorded charge-offs of (Won)758 billion in respect of our Won-denominated loans to small- and medium-sized enterprises, compared to charge-offs of (Won)614 billion in 2010. In light of the difficult financial condition and liquidity position of small- and medium-sized enterprises in Korea since the second half of 2008, the Korean government introduced measures intended to encourage Korean banks to provide financial support to small- and medium-sized enterprise borrowers. See “Item 3D. Risk Factors—Risks relating to our corporate credit portfolio—The largest portion of our exposure is to small- and medium-sized enterprises, and financial difficulties experienced by companies in this segment may result in a deterioration of our asset quality and have an adverse impact on us.”
In recent years, commercial banks, consumer finance companies and other financial institutions in Korea have also made significant investments and engaged in aggressive marketing in consumer lending (including mortgage and home equity loans), leading to substantially increased competition in this segment. The rapid growth in consumer loans, together with adverse economic conditions since the second half of 2008, have generally led to increasing delinquencies and a deterioration in asset quality. In 2011, we recorded charge-offs of (Won)89 billion and bad debt expenses of (Won)158 billion in respect of our consumer loan portfolio, compared to charge-offs of (Won)106 billion and bad debt expenses of (Won)130 billion in 2010. In June 2011, the Korean government announced a set of policy objectives to curtail the rapid growth of consumer lending by commercial banks, consumer finance companies and other financial institutions, as well as measures to encourage the increased use of fixed interest rates in consumer lending and to strengthen the protection of retail borrowers. See “Item 3D. Risk Factors—Risks relating to our consumer credit portfolio.”
133
Table of Contents
The Korean economy is closely tied to, and is affected by developments in, the global economy. During the second and third quarter of 2007, credit markets in the United States started to experience difficult conditions and volatility that in turn affected worldwide financial markets. In particular, in late July and early August 2007, market uncertainty in the U.S. sub-prime mortgage sector increased dramatically and further expanded to other markets such as those for leveraged finance, collateralized debt obligations and other structured products. In September and October 2008, liquidity and credit concerns and volatility in the global financial markets increased significantly with the bankruptcy or acquisition of, and government assistance to, several major U.S. and European financial institutions. These developments resulted in reduced liquidity, greater volatility, widening of credit spreads and a lack of price transparency in the United States and global financial markets. In response to such developments, legislators and financial regulators in the United States and other jurisdictions, including Korea, implemented a number of policy measures designed to add stability to the financial markets, including the provision of direct and indirect assistance to distressed financial institutions. In addition, in line with similar actions taken by monetary authorities in other countries, from the third quarter of 2008 to the first quarter of 2009, the Bank of Korea decreased its policy rate by a total of 325 basis points in order to address financial market instability and to help combat the slowdown of the domestic economy. However, while the rate of deterioration of the global economy has slowed since the second half of 2009, with some signs of stabilization and improvement, the overall prospects for the Korean and global economy in 2012 and beyond remain uncertain. For example, commencing in the second half of 2011, the global financial markets have experienced significant volatility as a result of, among other things, the downgrading by Standard & Poor’s Rating Services of the long-term sovereign credit rating of the United States to “AA+” from “AAA” in August 2011 and the financial difficulties affecting many other governments worldwide, in particular in Greece, Spain, Italy and other countries in Europe. In addition, measures adopted by the international community to sanction Iran for its nuclear weapons program, as well as political instability in various countries in the Middle East and Northern Africa, including in Egypt, Tunisia, Libya, Syria and Yemen, have resulted in volatility and uncertainty in the global energy markets. These or other developments could potentially trigger another financial and economic crisis. Furthermore, while many governments worldwide are implementing “exit strategies,” in the form of reduced government spending or otherwise, with respect to the economic stimulus measures adopted in response to the global financial crisis, such strategies may, for reasons related to timing, magnitude or other factors, have the unintended consequence of prolonging or worsening global economic and financial difficulties. In light of the high level of interdependence of the global economy, any of the foregoing developments could have a material adverse effect on the Korean economy and financial markets, and in turn on our business, financial condition and results of operations.
We are also exposed to adverse changes and volatility in global and Korean financial markets as a result of our liabilities and assets denominated in foreign currencies and our holdings of trading and investment securities, including structured products (although we do not currently have material exposures to Greece, Spain, Italy and other countries in Europe which are facing financial difficulties, in the form of sovereign debt or otherwise). Since the second half of 2008, the value of the Won relative to major foreign currencies in general and the U.S. dollar in particular has fluctuated widely. See “Item 3A. Selected Financial Data—Exchange Rates.” A depreciation of the Won will increase our cost in Won of servicing our foreign currency-denominated debt, while continued exchange rate volatility may also result in foreign exchange losses for us. Furthermore, as a result of adverse global and Korean economic conditions, there has been significant volatility in securities prices, including the stock prices of Korean and foreign companies in which we hold an interest. Such volatility has resulted in and may lead to further trading and valuation losses on our trading and investment securities portfolio as well as impairment losses on our investments in jointly controlled entities and associates.
As a result of volatile conditions and weakness in the Korean and global economies, as well as factors such as the uncertainty surrounding the global financial markets, fluctuations in oil and commodity prices, interest and exchange rate fluctuations, higher unemployment, lower consumer confidence, increases in inflation rates, potential tightening of fiscal and monetary policies and continued tensions with North Korea, the economic outlook for the financial services sector in Korea in 2012 and for the foreseeable future remains uncertain.
134
Table of Contents
Acquisitions
In March 2011, we acquired certain assets and assumed certain liabilities of Samhwa Mutual Savings Bank through our wholly owned subsidiary Woori FG Savings Bank, which was established in connection with such transaction, and injected (Won)110 billion of new capital into Woori FG Savings Bank.
New Basel Capital Accord
Beginning in 2008, the Financial Supervisory Service implemented Basel II in Korea, substantially affecting the way risk is measured among Korean financial institutions, including us. Building upon the initial Basel Capital Accord of 1988, which focused primarily on capital adequacy and asset soundness as a measure of risk, Basel II expanded this approach to contemplate additional areas of risk such as operational risk. Basel II also instituted new measures that require our commercial banking subsidiaries to take into account individual borrower credit risk and operational risk when calculating risk-weighted assets.
In addition, under Basel II, banks are permitted to follow either a standardized approach or an internal ratings-based approach with respect to calculating capital requirements. Woori Bank has voluntarily chosen to establish and follow an internal ratings-based approach, which is more stringent in terms of calculating risk sensitivity with respect to its capital requirements. Kyongnam Bank has also begun following an internal ratings-based approach from September 2011, while Kwangju bank plans to do the same in the near future. See “Item 5B. Liquidity and Capital Resources—Financial Condition—Capital Adequacy.”
In December 2009, the Basel Committee on Banking Supervision introduced a new set of measures to supplement Basel II which include, among others, a requirement for higher minimum capital, introduction of a leverage ratio as a supplementary measure to the capital adequacy ratio and flexible capital requirements for different phases of the economic cycle. Additional details regarding such new measures, including an additional capital conservation buffer and countercyclical capital buffer, liquidity coverage ratio and other supplemental measures, were announced by the Group of Governors and Heads of Supervision of the Basel Committee on Banking Supervision in September 2010. After further impact assessment and observation periods, the Basel Committee on Banking Supervision is expected to begin implementing the new set of measures, referred to as Basel III, from 2013. In Korea, Basel III is expected to be implemented in stages from 2013 to 2019. The implementation of Basel III in Korea may have a significant effect on the capital requirements of Korean financial institutions, including our commercial banking subsidiaries.
Changes in Securities Values, Exchange Rates and Interest Rates
Fluctuations of exchange rates, interest rates and stock prices affect, among other things, the demand for our products and services, the value of and rate of return on our assets, the availability and cost of funding and the financial condition of our customers. The following table shows, for the dates indicated, the stock price index of all equities listed on the KRX KOSPI Market as published in the KOSPI, the Won to U.S. dollar exchange rates and benchmark Won borrowing interest rates.
| June 30, 2007 |
Dec. 31, 2007 |
June 30, 2008 |
Dec. 31, 2008 |
June 30, 2009 |
Dec. 31, 2009 |
June 30, 2010 |
Dec. 31, 2010 |
June 30, 2011 |
Dec. 31, 2011 |
|||||||||||||||||||||||||||||||
| KOSPI |
1,743.60 | 1,897.13 | 1,674.92 | 1,124.47 | 1,390.07 | 1,682.77 | 1,698.29 | 2,051.0 | 2,100.69 | 1,825.12 | ||||||||||||||||||||||||||||||
| (Won)/US$ exchange rates(1) |
(Won) | 922.6 | (Won) | 935.8 | (Won) | 1,046.8 | (Won) | 1,262.00 | (Won) | 1,273.5 | (Won) | 1,163.7 | (Won) | 1,273.5 | (Won) | 1,163.7 | (Won) | 1,066.3 | (Won) | 1,158.5 | ||||||||||||||||||||
| Corporate bond rates(2) |
5.6 | % | 6.9 | % | 6.9 | % | 8.1 | % | 5.6 | % | 5.7 | % | 5.0 | % | 4.3 | % | 3.8 | % | 3.3 | % | ||||||||||||||||||||
| Treasury bond rates(3) |
5.3 | % | 5.7 | % | 5.8 | % | 3.4 | % | 4.2 | % | 4.4 | % | 3.9 | % | 3.4 | % | 3.4 | % | 4.2 | % | ||||||||||||||||||||
| (1) | Represents the noon buying rate on the dates indicated. |
| (2) | Measured by the yield on three-year Korean corporate bonds rated as A+ by the Korean credit rating agencies. |
| (3) | Measured by the yield on three-year treasury bonds issued by the Ministry of Strategy and Finance of Korea. |
135
Table of Contents
Critical Accounting Policies
The notes to our consolidated financial statements contain a summary of our significant accounting policies, including a discussion of recently issued accounting pronouncements. Certain of these policies are critical to the portrayal of our financial condition, since they require management to make difficult, complex or subjective judgments, some of which may relate to matters that are inherently uncertain. We discuss these critical accounting policies below.
Impairment of Loans and Provisions for Credit Losses
We evaluate our loans and receivables portfolio for impairment on an ongoing basis. We have established provisions for credit losses, which are available to absorb probable losses that have been incurred in our loans and receivables portfolio as of the date of the statement of financial position. If we believe that additions or changes to the provisions for credit losses are required, we record bad debt expenses (as part of our impairment loss for credit loss), which are treated as charges against current income. Loan exposures that we deem to be uncollectible, including actual loan losses, net of recoveries of previously written-off amounts, are charged directly against the provisions for credit losses.
Our accounting policies for losses arising from the impairment of loans and receivables and provisions for credit loss are described in Notes 2-(9)-6) and 3-(4) of the notes to our consolidated financial statements. We base the level of our provisions for credit losses on an evaluation of the risk characteristics of our loan portfolio. The evaluation considers factors such as historical loss experience, the financial condition of our borrowers and current economic conditions.
Provisions for credit losses represent our management’s best estimate of losses incurred in the loans and receivables portfolio as of the date of the statement of financial position. Our management is required to exercise judgment in making assumptions and estimates when calculating the provisions for credit losses on both individually and collectively assessed loans and advances.
The determination of the provisions required for loans and receivables that are deemed to be individually significant often requires the use of considerable management judgment concerning such matters as economic conditions, the financial performance of the counterparty and the value of any collateral held for which there may not be a readily accessible market. Once we have identified loans and receivables as impaired, we generally value them based on the present value of expected future cash flows discounted at the original effective interest rate of the applicable loan or receivable and compare such present value against the carrying amount of such loan or receivable, which amount is subject to various estimates by our management such as the operating cash flow of the borrower, net realizable value of any collateral held and the timing of anticipated receipts. The actual amount of the future cash flows and their timing may differ from the estimates used by our management and consequently may cause actual losses to differ from the reported allowances.
The allowance for portfolios of smaller-balance homogenous loans and receivables, such as those to individuals and small business customers, and for those loans which are individually significant but for which no objective evidence of impairment exists, is determined on a collective basis. The collective allowance is calculated on a portfolio basis using statistical methodology based on our historical loss experience, which incorporates numerous estimates and judgments. We perform a regular review of the models and underlying data and assumptions.
Our consolidated financial statements for the year ended December 31, 2011 included a total provision for credit losses of (Won)3,759 billion as of that date. Our total loan charge-offs, net of recoveries, amounted to (Won)2,264 billion and we recorded bad debt expenses of (Won)2,085 billion in 2011.
We believe that the accounting estimates related to impairment of loans and receivables and provisions for credit losses are a “critical accounting policy” because: (1) they are highly susceptible to change from period to period because they require us to make assumptions about future default rates and losses relating to our loan portfolio; and (2) any significant difference between our estimated losses on loans and receivables (as reflected in our provisions for credit losses) and actual losses on loans and receivables could require us to take additional bad
136
Table of Contents
debt expenses which, if significant, could have a material impact on our profit. Our assumptions about estimated losses require significant judgment because actual losses have fluctuated in the past and are expected to continue to do so, based on a variety of factors.
Valuation of Financial Assets and Liabilities
Our accounting policy for determining the fair value of financial assets and liabilities is described in Notes 2-(9)-5), 3-(3) and 11 of the notes to our consolidated financial statements.
The best evidence of fair value is a quoted price in an actively traded market. In the event that the market for a financial asset or liability is not active, a valuation technique is used. The majority of valuation techniques employ only observable market data and, as such, the reliability of the fair value measurement is high. However, certain financial instruments are valued on the basis of valuation techniques that feature one or more significant market inputs that are unobservable. Valuation techniques that rely to a greater extent on unobservable inputs require a higher level of management judgment to calculate a fair value than those based wholly on observable inputs.
Valuation techniques used to calculate fair values are discussed in Notes 2-(9)-5) and 11 of the notes to our consolidated financial statements. The main assumptions and estimates which our management considers when applying a model with valuation techniques are:
| • | The likelihood and expected timing of future cash flows on the instrument. These cash flows are usually governed by the terms of the instrument, although judgment may be required when the ability of the counterparty to service the instrument in accordance with the contractual terms is in doubt. Future cash flows may be sensitive to changes in market rates. |
| • | Selecting an appropriate discount rate for the instrument. The determination of this rate is based on an assessment of what a market participant would regard as the appropriate spread of the rate for the instrument over the appropriate risk-free rate. |
| • | Judgment to determine what model to use to calculate fair value in areas where the choice of valuation model is particularly subjective (for example, valuation of complex derivative products). |
The financial instruments carried at fair value have been categorized under the three levels of the IFRS fair value hierarchy as follows:
| • | Level 1: Quoted prices in active markets for identical assets or liabilities. |
| • | Level 2: Observable inputs other than Level 1 prices, such as quoted prices for similar assets or liabilities. |
| • | Level 3: Unobservable inputs that are supported by little or no market activity and that are significant to the fair value of the assets or liabilities. |
The fair value hierarchy requires an entity to maximize the use of observable inputs and minimize the use of unobservable inputs when measuring fair value. Fair value is a market-based measure considered from the perspective of a market participant. As such, even when market assumptions are not readily available, our own assumptions are intended to reflect those that market participants would use in pricing the asset or liability at the measurement date.
Our consolidated financial statements for the year ended December 31, 2011 included financial assets measured at fair value using a valuation technique of (Won)40,147 billion, representing 89.8% of total financial assets measured at fair value, and financial liabilities measured at fair value using a valuation technique of (Won)9,041 billion, representing 93.6% of total financial liabilities measured at fair value. As used herein, the fair value using a valuation technique means the fair value at Level 2 and Level 3 in the fair value hierarchy.
We believe that the accounting estimates related to the determination of the fair value of financial instruments are a “critical accounting policy” because: (1) they may be highly susceptible to change from period
137
Table of Contents
to period based on factors beyond our control; and (2) any significant difference between our estimate of the fair value of these financial instruments on any particular date and either their estimated fair value on a different date or the actual proceeds that we receive upon sale of these financial instruments could result in valuation losses or losses on disposal which may have a material impact on our profit. Our assumptions about the fair value of financial instruments we hold require significant judgment because actual valuations have fluctuated in the past and are expected to continue to do so, based on a variety of factors.
Deferred Tax Assets
Our accounting policy for the recognition of deferred tax assets is described in Notes 2-(22) and 3-(2) of the notes to our consolidated financial statements.
The recognition of deferred tax assets relies on an assessment of the probability and sufficiency of future taxable profits, future reversals of existing taxable temporary differences and ongoing tax planning strategies.
We recognize deferred tax assets and liabilities for the future tax consequences attributable to temporary differences between the financial statement carrying amounts of existing assets and liabilities and their respective tax bases, unused tax losses and unused tax credits. Deferred tax assets are recognized only to the extent it is probable that sufficient taxable profit will be available against which those deductible temporary differences, unused tax losses or unused tax credits can be utilized. This assessment requires significant management judgment and assumptions. In determining the amount of deferred tax assets, we use forecasted operating results, which are based on historical financial performance, approved business plans, including a review of the eligible carry-forward periods, available tax planning opportunities and other relevant considerations.
Our consolidated financial statements for the year ended December 31, 2011 included deferred tax assets and liabilities of (Won)80 billion and (Won)260 billion, respectively, as of that date.
We believe that the estimates related to our recognition and measurement of deferred tax assets are a “critical accounting policy” because: (1) they may be highly susceptible to change from period to period based on our assumptions regarding our future profitability; and (2) any significant difference between our estimates of future profits on any particular date and estimates of such future profits on a different date could result in an income tax expense or benefit which may have a material impact on our net income from period to period. Our assumptions about our future profitability require significant judgment and are inherently subjective.
Goodwill
Our accounting policy for goodwill is described in Notes 2-(13), 3-(1) and 15-(3) of the notes to our consolidated financial statements.
Goodwill is recognized as the excess of (i) the sum of the consideration transferred and the amount of any non-controlling interest in the acquiree over (ii) the net of the acquisition-date fair value of the identifiable assets acquired and the liabilities assumed. If the net amount of the acquisition-date fair value of the identifiable assets acquired and the liabilities assumed exceeds the sum of the consideration transferred and the amount of any non-controlling interest in the acquiree, such excess is recognized as a gain as of the acquisition date.
Goodwill is not depreciated and is stated at cost less accumulated impairment losses. However, goodwill that forms part of the carrying amount of an investment in an associate or a jointly controlled entity is not separately recognized and an impairment loss recognized is not allocated to any asset, including goodwill, that forms part of the carrying amount of the investment in the associate or the jointly controlled entity.
The review of goodwill impairment reflects our management’s best estimate of the certain factors. For example:
| • | The future cash flows of the cash generating units, or CGUs, are sensitive to the cash flows projected for the periods for which detailed forecasts are available and to assumptions regarding the long-term pattern of sustainable cash flows thereafter. Forecasts are compared with actual performance and verifiable economic data, but they necessarily and appropriately reflect our management’s view of future business prospects at the time of the assessment. See Note 15 of the notes to our consolidated financial statements for a list of our CGUs for impairment testing. |
138
Table of Contents
| • | The rates used to discount future expected cash flows are based on the costs of capital assigned to individual CGUs and can have a significant effect on their valuation. The cost of capital percentage is generally derived from a Capital Asset Pricing Model, which incorporates inputs reflecting a number of financial and economic variables, including the risk-free interest rate in the country concerned and a premium for the inherent risk of the business being evaluated. These variables are subject to fluctuations in external market rates and economic conditions beyond our control and therefore require the exercise of significant judgment and are consequently subject to uncertainty. |
A decline in a CGU’s expected cash flows or an increase in its cost of capital reduces the CGU’s estimated recoverable amount. If this is lower than the carrying value of the CGU, a charge for impairment of goodwill is recognized in the statement of comprehensive income for the year.
The accuracy of forecast cash flows is subject to a high degree of uncertainty in volatile market conditions. In such market conditions, our management retests goodwill for impairment more frequently than once a year to ensure that the assumptions on which the cash flow forecasts are based continue to reflect current market conditions and management’s best estimate of future business prospects.
Our consolidated financial statements for the year ended December 31, 2011 included the value of goodwill of (Won)108 billion as of that date, including the value of goodwill of (Won)63 billion, (Won)39 billion and (Won)6 billion, related to Woori Financial, Woori FG Savings Bank and others, respectively. Also, during 2011, (Won)9 billion of impairment of goodwill, primarily relating to Kumho Investment Bank, was identified.
We believe that the accounting estimates related to the fair values of our acquired goodwill are a “critical accounting policy” because: (1) they may be highly susceptible to change from period to period since they require assumptions about future cash flows, run-off rates and profitability; and (2) any significant changes in our estimates from period to period could result in the recognition of impairment losses which may have a material impact on our net income. Our assumptions about estimated future cash flows, run-off rates and profitability require significant judgment and the fair values of the goodwill could fluctuate in the future, based on a variety of factors.
Results of Operations
Comparison of 2011 to 2010
Net Interest Income
The following table shows, for the periods indicated, the principal components of our interest income:
| Year ended December 31, | Percentage change |
|||||||||||
| 2010 | 2011 | |||||||||||
| (in billions of Won) | (%) | |||||||||||
| Interest income |
||||||||||||
| Due from banks |
(Won) | 116 | (Won) | 169 | 45.7 | % | ||||||
| Loans |
11,877 | 12,725 | 7.1 | |||||||||
| Financial assets at fair value through profit or loss |
695 | 660 | (5.0 | ) | ||||||||
| Investment financial assets(1) |
1,237 | 1,360 | 9.9 | |||||||||
| Other assets |
132 | 131 | (0.8 | ) | ||||||||
|
|
|
|
|
|||||||||
| Total interest income |
14,057 | 15,045 | 7.0 | |||||||||
|
|
|
|
|
|||||||||
| Interest expense |
||||||||||||
| Deposits |
4,976 | 5,298 | 6.5 | |||||||||
| Borrowings |
728 | 815 | 12.0 | |||||||||
| Debentures |
1,808 | 1,551 | (14.2 | ) | ||||||||
| Others |
122 | 119 | (2.5 | ) | ||||||||
|
|
|
|
|
|||||||||
| Total interest expense |
7,634 | 7,783 | 2.0 | |||||||||
|
|
|
|
|
|||||||||
| Net interest income |
6,423 | 7,262 | 13.1 | |||||||||
|
|
|
|
|
|||||||||
| Net interest margin(2) |
2.29 | % | 2.50 | % | ||||||||
139
Table of Contents
Notes:
| (1) | Includes available-for-sale financial assets and held-to-maturity financial assets. |
| (2) | The ratio of net interest income to average interest-earning assets. |
Interest income. Interest income increased 7.0% from (Won)14,057 billion in 2010 to (Won)15,045 billion in 2011, primarily as a result of a 7.1% increase in interest on loans and a 9.9% increase in interest on investment financial assets. The average balance of our interest-earning assets increased 3.8% from (Won)280,120 billion in 2010 to (Won)290,771 billion in 2011, principally due to the growth in our loan portfolio. This increase was enhanced by a 15 basis point increase in average yields on our interest-earning assets from 5.02% in 2010 to 5.17% in 2011, which reflected an increase in the general level of interest rates in Korea in 2011.
The 7.1% increase in interest on loans from (Won)11,877 billion in 2010 to (Won)12,725 billion in 2011 was primarily due to:
| • | a 24 basis point increase in average yields on commercial and industrial loans from 5.91% in 2010 to 6.15% in 2011, which was enhanced by a 2.8% increase in the average volume of such loans from (Won)97,487 billion in 2010 to (Won)100,205 billion in 2011; |
| • | an 82.0% increase in the average volume of mortgage loans from (Won)4,748 billion in 2010 to (Won)8,643 billion in 2011, which was enhanced by an 8 basis point increase in average yields on such loans from 5.16% in 2010 to 5.23% in 2011; and |
| • | a 27 basis point increase in average yields on general purpose household loans (including home equity loans) from 5.07% in 2010 to 5.34% in 2011, which was partially offset by a 0.3% decrease in the average volume of such loans from (Won)70,132 billion in 2010 to (Won)69,954 billion in 2011. |
The average yields for commercial and industrial loans, mortgage loans and general purpose household loans (including home equity loans) increased mainly as a result of the increase in the general level of interest rates in Korea applicable to such loans from 2010 to 2011. The increase in the average volume of commercial and industrial loans was primarily due to an increase in demand for facility loans, reflecting increased capital expenditures by Korean businesses in 2011. The increase in the average volume of mortgage loans reflected increased demand for such loans from customers, including to finance home rentals in light of a significant increase in rent levels (particularly key money deposit levels under the “jeonsae” system) in the Korean housing market in 2011. The decrease in the average volume of general purpose household loans (including home equity loans) mainly reflected decreased demand for foreign currency general purpose household loans by Korean consumers in the face of greater foreign exchange volatility in 2011.
Overall, the average volume of our loans increased 4.5% from (Won)204,860 billion in 2010 to (Won)214,132 billion in 2011, and the average yields on our loans also increased 14 basis points, from 5.80% in 2010 to 5.94% in 2011.
Our financial assets portfolio consists primarily of investment financial assets, of which a majority was debt securities issued by government-owned or -controlled enterprises or financial institutions (including the Bank of Korea, the Korea Development Bank and the KDIC), as well as financial assets at fair value through profit or loss.
The 9.9% increase in interest on investment financial assets from (Won)1,237 billion in 2010 to (Won)1,360 billion in 2011 was mainly the result of a 34 basis point increase in average yields on such assets from 3.30% in 2010 to 3.64% in 2011, as the average balance of such assets remained relatively steady at (Won)37,359 billion in 2011 compared to (Won)37,466 billion in 2010. The increase in average yields on investment financial assets was primarily due to an increase in the proportion of corporate bonds we held as held-to-maturity financial assets, which typically feature relatively higher yields compared to other types of held-to-maturity financial assets held by us, in our investment financial assets portfolio.
Interest Expense. Interest expense increased 2.0% from (Won)7,634 billion in 2010 to (Won)7,783 billion in 2011, primarily due to a 6.5% increase in interest expense on deposits. Such increase was offset in part by a 14.2% decrease in interest expense on debentures. The average balance of interest-bearing liabilities increased 3.4%
140
Table of Contents
from (Won)262,818 billion in 2010 to (Won)271,876 billion in 2011, principally due to an increase in the average balance of deposits. The effect of this increase was partially offset by a decrease of 4 basis points in the average cost of interest-bearing liabilities from 2.90% in 2010 to 2.86% in 2011, which was driven mainly by a decrease in the average cost of debentures.
The 6.5% increase in interest expense on deposits from (Won)4,976 billion in 2010 to (Won)5,298 in 2011 was primarily due to an 11.9% increase in interest expense on time and savings deposits from (Won)4,320 billion in 2010 to (Won)4,835 billion in 2011, the effect of which was partially offset by a 69.0% decrease in interest expense on certificates of deposit from (Won)364 billion in 2010 to (Won)113 billion in 2011.
The increase in interest expense on time and savings deposits resulted from a 7.1% increase in the average balance of such deposits from (Won)150,317 billion in 2010 to (Won)160,952 billion in 2011 as well as a 13 basis point increase in the average cost of such deposits from 2.87% in 2010 to 3.00% in 2011. The increase in the average balance of time and savings deposits was attributable mainly to customers’ continuing preference for low-risk financial products and institutions in Korea in light of the volatility in financial markets. The increase in the average cost of time and savings deposits was due to the increase in the general level of interest rates in Korea in 2011.
The decrease in interest expense on certificates of deposit resulted from a 67.5% decrease in the average balance of such deposits from (Won)8,459 billion in 2010 to (Won)2,746 billion in 2011, the effect of which was enhanced by an 18 basis point decrease in the average cost of such deposits from 4.30% in 2010 to 4.12% in 2011. The decrease in the average balance of certificates of deposits was principally due to our continuing efforts to convert our certificates of deposit into other deposits in order to comply with new loan-to-deposit ratio requirements set by the Financial Supervisory Service, which exclude certificates of deposit from the calculation of total deposits for purposes of determining compliance with such ratio requirements. The decrease in the average cost of certificates of deposit was mainly due to an increase in the relative proportion of short-term certificates of deposit, which have lower interest rates compared to longer-tem certificates of deposit, reflecting customer’s preference for such short-term products in light of the volatility in financial markets.
Overall, the average volume of our deposits increased by 4.8% from (Won)183,766 billion in 2010 to (Won)192,643 billion in 2011, and the average cost of our deposits increased by 4 basis points from 2.71% in 2010 to 2.75% in 2011.
The 14.2% decrease in interest expense on debentures from (Won)1,808 billion in 2010 to (Won)1,551 billion in 2011 mainly resulted from an 9.2% decrease in the average balance of debentures from (Won)33,523 billion in 2010 to (Won)30,433 billion in 2011. The effect of such decrease was enhanced by a 29 basis point decrease in the average cost of debentures from 5.39% in 2010 to 5.10% in 2011. The decrease in the average volume of debentures mainly reflected a decrease in debentures in local currency due to the maturity in 2011 of a large amount of such previously issued debentures, while the decrease in the average cost of debentures was primarily attributable to the maturity and repayment of higher interest rate debentures previously issued by us.
Net interest margin. Net interest margin represents the ratio of net interest income to average interest-earning assets. Our overall net interest margin increased from 2.29% in 2010 to 2.50% in 2011, as a 13.1% increase in our net interest income from (Won)6,423 billion in 2010 to (Won)7,262 billion in 2011 outpaced a 3.8% increase in the average balance of our interest-earning assets from (Won)280,120 billion in 2010 to (Won)290,771 billion in 2011. The growth in average interest-earning assets outpaced a 3.4% increase in average interest-bearing liabilities from (Won)262,818 billion in 2010 to (Won)271,876 billion in 2011, while the increase in interest income more than offset the increase in interest expense, resulting in an increase in net interest income. The magnitude of this increase was enhanced by an increase in our net interest spread, which represents the difference between the average yield on our interest-earning assets and the average cost of our interest-bearing liabilities, from 2.11% in 2010 to 2.31% in 2011. The increase in our net interest spread reflected an increase in the average yield of our interest-earning assets coupled with a decrease in the average cost of our interest-bearing liabilities from 2010 to 2011.
141
Table of Contents
Impairment Loss on Credit Loss
Impairment loss on credit loss includes bad debt expenses, provision for guarantees and provision for unused commitments, in each case net of reversal of provisions. Our impairment loss on credit loss decreased by 21.0% from (Won)2,873 billion in 2010 to (Won)2,269 billion in 2011, primarily due to a decrease in bad debt expenses. Our bad debt expenses, net of reversal of provisions for credit losses, decreased 24.6% from (Won)2,869 billion in 2010 to (Won)2,162 billion in 2011, as higher bad debt expenses resulting from increased loan loss provisioning by us in connection with the restructuring (in the form of workout, liquidation or court receivership) in 2010 of 65 companies selected by various Korean financial institutions, including us, were not repeated in 2011. See “Item 3D. Risk Factors—Risks relating to our corporate credit portfolio—We have exposure to Korean construction and shipbuilding companies, and financial difficulties of these companies may adversely impact us.” Under IFRS, if our provisions for credit losses are deemed insufficient for regulatory purposes, we compensate for the difference by recording a planned regulatory reserve for credit loss, which is segregated within retained earnings. See “Item 4B. Business Overview—Assets and Liabilities—Asset Quality of Loans—Loan Loss Provisioning Policy” and Notes 31 of the notes to our consolidated financial statements included elsewhere in this annual report. Our combined net bad debt expenses and planned regulatory provision for credit loss decreased by 13.5% from (Won)3,422 billion in 2010 to (Won)2,961 billion in 2011.
Our loan charge-offs, net of recoveries, increased 69.3% from (Won)1,338 billion in 2010 to (Won)2,264 billion in 2011, primarily due to greater charge-offs of loans to small- and medium- enterprise borrowers.
Our provisions for guarantees, net of reversal of such provisions, increased 258.1% from (Won)39 billion in 2010 to (Won)140 billion in 2011, due primarily to an 89.9% decrease in reversal of such provisions from (Won)168 billion in 2010 to (Won)17 billion in 2011, mainly as a result of significantly increased reclassifications in 2010 of our provisions for guarantees to bad debt expenses, including in connection with the restructuring (in the form of workout, liquidation or court receivership) in 2010 of 65 companies selected by us and various other Korean financial institutions, which were not repeated in 2011.
Provisions for Credit Losses
For information on provisions for credit losses, see “—Critical Accounting Policies—Impairment of Loans and Provisions for Credit Losses” and “Item 4B. Business Overview—Assets and Liabilities—Loan Portfolio—Allocation and Analysis of Provisions for Credit Losses under IFRS.”
Corporate Loans. We establish individual provisions for credit losses for corporate loans based on whether a particular loan is impaired or not. In addition, we establish provisions for credit losses for corporate loans that are not deemed to be impaired using an incurred loss methodology based primarily on our historical loss experience, which takes into account the default probability and the potential severity of any resulting loss. See “Item 4B. Business Overview—Assets and Liabilities—Asset Quality of Loans—Loan Loss Provisioning Policy.” The following table shows, for the periods indicated, certain information regarding our impaired corporate loans:
| As of December 31, | ||||||||
| 2010 | 2011 | |||||||
| Impaired corporate loans as a percentage of total corporate loans |
5.4 | % | 3.3 | % | ||||
| Provisions for credit losses for corporate loans as a percentage of total corporate loans |
3.4 | 2.5 | ||||||
| Provisions for credit losses for corporate loans as a percentage of impaired corporate loans |
61.9 | 76.0 | ||||||
| Net charge-offs as a percentage of total corporate loans |
0.9 | 1.5 | ||||||
During 2011, impaired corporate loans and provisions for credit losses for corporate loans, each as a percentage of total corporate loans, decreased due to an improvement in the overall credit quality of our corporate loans through increased sales and charge-offs of impaired loans. However, provisions for credit losses for corporate loans as a percentage of impaired corporate loans increased during 2011 as the decrease in impaired corporate loans, reflecting such improvement in the overall credit quality of our corporate loans in 2011, outpaced the decrease in the level of our provisions for credit losses.
142
Table of Contents
Consumer Loans and Credit Card Balances. Similar to our practice for corporate loans, we establish individual provisions for credit losses for consumer loans and outstanding credit card balances based on whether a particular loan is impaired or not. In addition, we establish provisions for credit losses for consumer loans and credit card balances that are not deemed to be impaired using an incurred loss methodology based primarily on our historical loss experience, which takes into account the default probability and the potential severity of any resulting loss. See “Item 4B. Business Overview—Assets and Liabilities—Asset Quality of Loans—Loan Loss Provisioning Policy.” For additional information with respect to the asset quality of our consumer credit portfolio, see “Item 3D. Risk Factors—Risks relating to our consumer credit portfolio.”
The following table shows, for the periods indicated, certain information regarding our impaired loans to the consumer sector, excluding credit card balances:
| As of December 31, | ||||||||
| 2010 | 2011 | |||||||
| Impaired consumer loans as a percentage of total consumer loans |
0.4 | % | 0.6 | % | ||||
| Provisions for credit losses for consumer loans as a percentage of total consumer loans |
0.3 | 0.4 | ||||||
| Provisions for credit losses for consumer loans as a percentage of impaired consumer loans |
79.0 | 63.2 | ||||||
| Net charge-offs of consumer loans as a percentage of total consumer loans |
0.1 | 0.1 | ||||||
During 2011, impaired consumer loans and provisions for credit losses for consumer loans, each as a percentage of total consumer loans increased during 2011 as a result of an overall deterioration in the asset quality of our consumer loans. However, provisions for credit losses for consumer loans as a percentage of impaired consumer loans decreased, as the increase in our provisioning for consumer loans in 2011 was outpaced by the increase in our impaired consumer loans (particularly general purpose household loans).
The following table shows, for the periods indicated, certain information regarding our impaired credit card balances:
| As of December 31, | ||||||||
| 2010 | 2011 | |||||||
| Impaired credit card balances as a percentage of total credit card balances(1) |
1.3 | % | 1.6 | % | ||||
| Provisions for credit losses for credit card balances as a percentage of total credit card balances(1) |
2.9 | 2.9 | ||||||
| Provisions for credit losses for credit card balances as a percentage of impaired credit card balances(1) |
217.2 | 178.4 | ||||||
| Net charge-offs as a percentage of total credit card balances(1) |
1.7 | 2.4 | ||||||
| (1) | Includes corporate credit card balances. |
During 2011, impaired credit card balances as a percentage of total credit card balances increased due to an overall deterioration in the asset quality of our credit card portfolio. However, the level of provisions for credit losses for credit card balances as a percentage of impaired credit card balances decreased, as the effect of growth in the amount of our impaired credit card balances, reflecting such deterioration in the asset quality of our credit card portfolio as well as the growth of our overall credit card balances, outpaced the increase in the amount of our provisioning for credit card balances.
Net Fees and Commissions Income
The following table shows, for the periods indicated, the components of our net fees and commissions income:
| Year ended December 31, | Percentage change |
|||||||||||
| 2010 | 2011 | |||||||||||
| (in billions of Won) | (%) | |||||||||||
| Fees and commissions income |
(Won) | 1,688 | (Won) | 1,774 | 5.1 | % | ||||||
| Fees and commissions expense |
572 | 579 | 1.2 | |||||||||
|
|
|
|
|
|||||||||
| Total fees and commissions income, net |
(Won) | 1,116 | (Won) | 1,195 | 7.1 | |||||||
|
|
|
|
|
|||||||||
143
Table of Contents
Our net fees and commissions income increased 7.1% from (Won)1,116 billion in 2010 to (Won)1,195 billion in 2011, as a 5.1% increase in fees and commissions income from (Won)1,688 billion in 2010 to (Won)1,774 billion in 2011 outpaced a 1.2% increase in fees and commissions expense from (Won)572 billion in 2010 to (Won)579 billion in 2011. The 5.1% increase in fees and commissions income was mainly the result of an 8.7% increase in banking fees from (Won)750 billion in 2010 to (Won)815 billion in 2011, which reflected increased fees we received in local currency, particularly agency commissions from our bancassurance activities. The 1.2% increase in fees and commissions expense was primarily due to a 4.6% increase in credit card commissions paid from (Won)368 billion in 2010 to (Won)385 billion in 2011, which mainly reflected an increase in credit card issuances, as well as a 13.1% increase in fees paid from (Won)107 billion in 2010 to (Won)121 billion in 2011, which was mainly attributable to an increase in fees paid to legal, accounting and other advisory service providers. The effect of such increases was partially offset by a 32.2% decrease in brokerage commissions paid from (Won)90 billion in 2010 to (Won)61 billion in 2011, reflecting a temporary waiver of such commissions by the Korea Securities Depositary and the Korea Financial Investment Association in 2011.
Net Gain on Financial Assets
The following table shows, for the periods indicated, the components of our net gain on financial assets:
| Year ended December 31, | Percentage change |
|||||||||||
| 2010 | 2011 | |||||||||||
| (in billions of Won) | (%) | |||||||||||
| Gain (loss) on financial assets at fair value through profit or loss, net |
(Won) | 39 | (Won) | 119 | 205.1 | % | ||||||
| Gain (loss) on available-for-sale financial assets, net(2) |
1,073 | 1,073 | — | % | ||||||||
| Gain (loss) on held-to-maturity financial assets, net |
0 | 0 | N/M | (1) | ||||||||
|
|
|
|
|
|||||||||
| Total net gain (loss) on financial assets |
(Won) | 1,112 | (Won) | 1,192 | 7.2 | |||||||
|
|
|
|
|
|||||||||
| (1) | N/M = not meaningful. |
| (2) | Includes impairment losses on available-for-sale financial assets of (Won)38 billion in 2010 and (Won)266 billion in 2011. |
Our net gain on financial assets increased 7.2% from (Won)1,112 billion in 2010 to (Won)1,192 billion in 2011, primarily as a result of a 205.1% increase in net gain on financial assets at fair value through profit or loss from (Won)39 billion in 2010 to (Won)119 billion in 2011. Such increase was principally due to a change in net gain (loss) on financial assets designated at fair value through profit or loss, from a net loss of (Won)402 billion in 2010 to a net gain of (Won)235 billion in 2011, which was offset in part by a change in net gain (loss) on financial assets held for trading from a net gain of (Won)441 billion in 2010 to a net loss of (Won)115 billion in 2011. The change in net gain (loss) on financial assets designated at fair value through profit or loss resulted mainly from a change in net gain (loss) on valuation of other financial assets designated at fair value through profit or loss from a net loss of (Won)183 billion in 2010 to a net gain of (Won)409 billion in 2011, as well as a decrease in net loss on transaction of such other financial assets from (Won)337 billion in 2010 to (Won)118 billion in 2011. The change in net gain (loss) on financial assets held for trading was primarily due to a change in net gain (loss) on valuation of derivatives held for trading from a net gain of (Won)99 billion in 2010 to a net loss of (Won)152 billion in 2011, driven mainly by a change in net gain (loss) on valuation of stock equity derivatives from a net gain of (Won)118 billion in 2010 to a net loss of (Won)223 billion in 2011, and a decrease in net gain on valuation and disposal of securities held for trading from (Won)314 billion in 2010 to (Won)26 billion in 2011, driven mainly by a change in net gain (loss) on transaction of such securities from a net gain of (Won)245 billion in 2010 to a net loss of (Won)28 billion in 2011. For further information regarding our net gain (loss) on financial assets at fair value through profit or loss, see Note 36 of the notes to our consolidated financial statements included elsewhere in this annual report.
Net gain (loss) on available-for-sale financial assets remained relatively constant at (Won)1,073 billion in 2010 and 2011, as an increase in net gain on transaction of available-for-sale securities from (Won)1,103 billion in 2010 to (Won)1,339 billion in 2011 was substantially offset by an increase in impairment losses on such securities from (Won)38 billion in 2010 to (Won)266 billion in 2011. Such increase in impairment losses was attributable mainly to impairment losses recognized on our holdings of equity securities (including common stock of POSCO) in 2011 in light of continuing market volatility.
144
Table of Contents
Unrealized gains and losses (other than impairment losses) on available-for-sale financial assets are recorded in our statement of financial position as part of accumulated other comprehensive income, under other equity. In 2011, we recognized a net loss on valuation of available-for-sale financial assets of (Won)375 billion as part of other comprehensive income (loss) net of tax, principally as a result of decreases in valuation gains on equity securities of Hyundai Engineering & Construction, which reflected our disposal of such securities in 2011.
Net Other Operating Expenses
The following table shows, for the periods indicated, the components of our net other operating expenses:
| Year ended December 31, | Percentage change |
|||||||||||
| 2010 | 2011 | |||||||||||
| (in billions of Won) | (%) | |||||||||||
| Other operating income |
(Won) | 8,106 | (Won) | 8,855 | 9.2 | % | ||||||
| Other operating expenses |
(12,016 | ) | (13,278 | ) | 10.5 | |||||||
|
|
|
|
|
|||||||||
| Total net other operating expenses |
(Won) | (3,910 | ) | (Won) | (4,423 | ) | 13.1 | |||||
|
|
|
|
|
|||||||||
Our net other operating expenses increased 13.1% from (Won)3,910 billion in 2010 to (Won)4,423 billion in 2011, as the effect of a 10.5% increase in other operating expenses from (Won)12,016 billion in 2010 to (Won)13,278 billion in the 2011 was partially offset by a 9.2% increase in other operating income from (Won)8,106 billion in 2010 to (Won)8,855 billion in 2011.
Other operating income includes principally gain on transaction of foreign exchange, gain on valuation of derivatives, gain on disposal of premises and equipment and other assets, gain on transactions of loans and receivables, gain on disposal of investment in jointly controlled entities and associates, gain on translation of foreign exchange and other income. The 9.2% increase in other operating income was attributable mainly to a 9.3% increase in gain on transaction of foreign exchange from (Won)7,585 billion in 2010 to (Won)8,293 billion in 2011. This increase, which was principally due to higher exchange rate volatility, was more than offset by a corresponding increase in loss on transaction of foreign exchange, which is recorded as part of other operating expenses. On a net basis, our net gain on transaction of foreign exchange decreased 59.1% from (Won)264 billion in 2010 to (Won)108 billion in 2011.
Other operating expenses include principally loss on transaction of foreign exchange, administrative expenses (which in turn mainly include short term employee benefits, fringe benefits, rent and depreciation and amortization, among others), contributions to miscellaneous funds, deposit insurance premiums, loss on transactions of loans and receivables and other expenses. The 10.5% increase in other operating expenses was primarily the result of an 11.8% increase in loss on transaction of foreign exchange from (Won)7,321 billion in 2010 to (Won)8,185 billion in 2011, which reflected higher exchange rate volatility. This increase was partially offset by a corresponding increase in gain on transaction of foreign exchange, which is recorded as part of other operating income as discussed above. The increase was enhanced by an 13.8% increase in administrative expenses from (Won)3,322 billion in 2010 to (Won)3,782 billion in 2011, which was attributable mainly to a 16.3% increase in short term employee benefits from (Won)1,394 billion in 2010 to (Won)1,621 billion in 2011, principally reflecting increased salaries and other short term compensation paid to our employees.
Income Tax Expense
Our income tax expense is calculated by adding or subtracting changes in deferred income tax liabilities and assets to income tax amounts payable for the period. Deferred tax assets are recognized for deductible temporary differences, including operating losses and tax credit carry-forwards, while deferred tax liabilities are recognized for taxable temporary differences. Temporary differences are those between the carrying values of assets and liabilities for financial reporting purposes and their tax bases. Deferred tax assets, including the carry-forwards of unused tax losses, are recognized to the extent it is probable that the deferred tax assets will be realized.
Income tax expense increased 49.4% from (Won)498 billion in 2010 to (Won)744 billion in 2011, mainly as a result of an increase in our net income before income tax expense. The statutory tax rate was 24.2% in 2010 and 2011. Our effective tax rate was 23.7% in 2010 and 23.4% in 2011. See Note 40 of the notes to our consolidated financial statements included elsewhere in this annual report.
145
Table of Contents
Net Income
Due to the factors described above, our net income in 2011 was (Won)2,433 billion, compared to (Won)1,601 billion in 2010.
Results by Principal Business Segment
We compile and analyze financial information for our business segments based upon segment information used by our management for the purposes of resource allocation and performance evaluation. Under IFRS as issued by the IASB, we have five operational business segments: Woori Bank, Kyongnam Bank, Kwangju Bank, Woori Investment & Securities and other operations. Segment information appearing below for each of Woori Bank, Kyongnam Bank and Kwangju Bank includes their respective credit card operations.
The following table shows, for the periods indicated, our results of operations by segment:
| Net
income(1) Year ended December 31, |
Total operating
income(2) Year ended December 31, |
|||||||||||||||
| 2010 | 2011 | 2010 | 2011 | |||||||||||||
| (in billions of Won) | ||||||||||||||||
| Woori Bank |
(Won) | 1,262 | (Won) | 2,069 | (Won) | 1,498 | (Won) | 2,683 | ||||||||
| Kyongnam Bank |
183 | 196 | 241 | 255 | ||||||||||||
| Kwangju Bank |
124 | 136 | 166 | 176 | ||||||||||||
| Woori Investment & Securities |
238 | 198 | 315 | 213 | ||||||||||||
| Other |
244 | 339 | 260 | 387 | ||||||||||||
|
|
|
|
|
|
|
|
|
|||||||||
|
Total(3) |
(Won) | 2,051 | (Won) | 2,938 | (Won) | 2,479 | (Won) | 3,714 | ||||||||
|
|
|
|
|
|
|
|
|
|||||||||
| (1) | After reflecting the share of profits of jointly controlled entities and associates and income tax expense. |
| (2) | Comprises net interest income, net non-interest income, administrative expenses and impairment loss on credit losses. |
| (3) | Before adjustments for consolidation, inter-segment transactions and certain differences in classification under our management reporting system. |
Comparison of 2011 to 2010
Woori Bank
Woori Bank provides a wide range of banking and other financial services to large corporations, small- and medium-sized enterprises and individuals in Korea.
| Year ended December 31, | Percentage Change |
|||||||||||
| 2010 | 2011 | |||||||||||
| (in billions of Won) | (%) | |||||||||||
| Income statement data |
||||||||||||
| Interest income |
(Won) | 10,981 | (Won) | 11,659 | 6.2 | % | ||||||
| Interest expense |
5,954 | 5,934 | (0.3 | ) | ||||||||
|
|
|
|
|
|||||||||
| Net interest income |
5,027 | 5,725 | 13.9 | |||||||||
| Non-interest income |
16,248 | 16,611 | 2.2 | |||||||||
| Non-interest expense |
14,954 | 15,137 | 1.2 | |||||||||
|
|
|
|
|
|||||||||
| Net non-interest income |
1,294 | 1,474 | 13.9 | |||||||||
| Administrative expenses |
2,263 | 2,553 | 12.8 | |||||||||
| Impairment loss on credit loss |
2,560 | 1,963 | (23.3 | ) | ||||||||
|
|
|
|
|
|||||||||
| Total other expenses |
4,823 | 4,516 | (6.4 | ) | ||||||||
|
|
|
|
|
|||||||||
| Operating Income |
1,498 | 2,683 | 79.1 | |||||||||
|
|
|
|
|
|||||||||
| Share of profits of jointly controlled entities and associates |
39 | (24 | ) | (161.5 | )(1) | |||||||
| Net income before tax |
1,537 | 2,659 | 73.0 | |||||||||
|
|
|
|
|
|||||||||
| Income tax expense (benefit) |
275 | 590 | 114.6 | |||||||||
|
|
|
|
|
|||||||||
| Net income |
(Won) | 1,262 | (Won) | 2,069 | 64.0 | |||||||
|
|
|
|
|
|||||||||
| Controlling interest |
1,261 | 2,068 | 64.0 | |||||||||
| Noncontrolling interest |
1 | 1 | — | |||||||||
| (1) | N/M = not meaningful. |
146
Table of Contents
Our net income before tax for this segment increased 73.0% from (Won)1,537 billion in 2010 to (Won)2,659 billion in 2011. Net income after tax also increased 64.0% from (Won)1,262 billion in 2011 to (Won)2,069 billion in 2011.
Interest income from our Woori Bank operations increased 6.2% from (Won)10,981 billion in 2010 to (Won)11,659 billion in 2011, primarily due to an increase in average yields on interest-earning assets, which was enhanced by an overall increase in the average balance of interest-earning assets. The increase in average yields on interest-earning assets was attributable mainly to the higher interest rate environment in Korea. The average volume of Woori Bank’s loans on a consolidated basis increased 2.6% from (Won)172,530 billion in 2010 to (Won)177,102 billion in 2011, primarily as a result of an increase in Woori Bank’s lending to consumers and large corporate borrowers.
Interest expense decreased 0.3% from (Won)5,954 billion in 2010 to (Won)5,934 billion in 2011. The decrease in interest expense was primarily due to a decrease in the average cost of interest-bearing liabilities, resulting mainly from the maturity and repayment of higher interest rate debentures previously issued by Woori Bank. This decrease was partially offset by a 2.3% increase in the average volume of interest-bearing liabilities from (Won)209,873 billion in 2010 to (Won)214,668 billion in 2011, which was mainly attributable to an increase in the average volume of time and savings deposits, reflecting customers’ continuing preference for low-risk financial products and institutions in light of the volatility in financial markets in 2011.
Impairment loss on credit loss decreased 23.3% from (Won)2,560 billion in 2010 to (Won)1,963 billion in 2011. The decrease was primarily due to higher bad debt expenses resulting from increased loan loss provisioning by Woori Bank in connection with the restructuring (in the form of workout, liquidation or court receivership) in 2010 of 65 companies selected by it and various other Korean financial institutions, which were not repeated in 2011.
Non-interest income increased 2.2% from (Won)16,248 billion in 2010 to (Won)16,611 billion in 2011, primarily due to an increase in gains on transaction of foreign exchange, which mainly reflected increased volatility.
Non-interest expense increased 1.2% from (Won)14,954 billion in 2010 to (Won)15,137 billion in 2011, primarily as a result of an increase in losses on transaction of foreign exchange, which mainly reflected increased volatility.
Administrative expenses increased 12.8% from (Won)2,263 billion in 2010 to (Won)2,553 billion in 2011, primarily due to an increase in short term employee benefits.
147
Table of Contents
Kyongnam Bank
Kyongnam Bank is a regional commercial bank that provides financial services in Changwon and Ulsan and other parts of the South Kyongsang province in southeastern Korea. Kyongnam Bank concentrates on consumer banking, as well as corporate banking for small- and medium-sized enterprises.
| Year ended December 31, | Percentage Change |
|||||||||||
| 2010 | 2011 | |||||||||||
| (in billions of Won) | (%) | |||||||||||
| Income statement data |
||||||||||||
| Interest income |
(Won) | 1,168 | (Won) | 1,295 | 10.9 | % | ||||||
| Interest expense |
541 | 612 | 13.1 | |||||||||
|
|
|
|
|
|||||||||
| Net interest income |
627 | 683 | 8.9 | |||||||||
| Non-interest income |
519 | 421 | (18.9 | ) | ||||||||
| Non-interest expense |
465 | 422 | (9.3 | ) | ||||||||
|
|
|
|
|
|||||||||
| Net non-interest income |
54 | (1 | ) | N/M | (1) | |||||||
| Administrative expenses |
236 | 274 | 16.1 | |||||||||
| Impairment loss on credit loss |
204 | 153 | (25.0 | ) | ||||||||
|
|
|
|
|
|||||||||
| Total other expenses |
440 | 427 | 3.0 | |||||||||
|
|
|
|
|
|||||||||
| Operating Income |
241 | 255 | 5.8 | |||||||||
|
|
|
|
|
|||||||||
| Share of profits of jointly controlled entities and associates |
— | — | — | |||||||||
| Net income before tax |
241 | 255 | 5.8 | |||||||||
|
|
|
|
|
|||||||||
| Income tax expense (benefit) |
58 | 59 | 1.7 | |||||||||
|
|
|
|
|
|||||||||
| Net income |
(Won) | 183 | (Won) | 196 | 7.1 | |||||||
|
|
|
|
|
|||||||||
| Controlling interest |
183 | 196 | 7.1 | |||||||||
| Noncontrolling interest |
— | — | — | |||||||||
| (1) | N/M = not meaningful. |
Our net income before tax for this segment increased 5.8% from (Won)241 billion in 2010 to (Won)255 billion in 2011. Net income after tax also increased 7.1% from (Won)183 billion in 2010 to (Won)196 billion in 2011.
Interest income from our Kyongnam Bank operations increased 10.9% from (Won)1,168 billion in 2010 to (Won)1,295 billion in 2011, primarily due to an increase in average lending volumes, which was enhanced by an overall increase in average yields on interest-earning assets, resulting from the general increase in market interest rates. The average volume of Kyongnam Bank’s loans increased 11.5% from (Won)16,061 billion in 2010 to (Won)17,912 billion in 2011, primarily due to an increase in the average volume of mortgage loans, which reflected a rising real estate market in certain parts of South Kyongsang province, and loans to small- and medium-sized enterprises, reflecting increased demand for such loans in the southeastern part of Korea.
Interest expense increased 13.1% from (Won)541 billion in 2010 to (Won)612 billion in 2011. The increase in interest expense resulted principally from a 12.8% increase in the average volume of deposits from (Won)14,611 billion in 2010 to (Won)16,486 billion in 2011, primarily as a result of increased demand for deposit products as well as Kyongnam Bank’s focus on the marketing of its deposit products. This increase was enhanced by an increase in the average cost of interest-bearing liabilities due to the higher interest rate environment.
Impairment loss on credit loss decreased 25.0% from (Won)204 billion in 2010 to (Won)153 billion in 2011 as higher bad debt expenses resulting from increased loan loss provisioning by Kyongnam Bank in connection with the restructuring (in the form of workout, liquidation or court receivership) in 2010 of 65 companies selected by it and various other Korean financial institutions were not repeated in 2011.
Non-interest income decreased 18.9% from (Won)519 billion in 2010 to (Won)421 billion in 2011, primarily due to a decrease in gains on transaction of foreign exchange.
148
Table of Contents
Non-interest expense decreased 9.3% from (Won)465 billion in 2010 to (Won)423 billion in 2011, primarily due to a decrease in other provisions (particularly provisions for litigation) in 2011 compared 2010.
Administrative expenses increased 16.1% from (Won)236 billion in 2010 to (Won)274 billion in 2011, primarily due to an increase in short term employee benefits.
Kwangju Bank
Kwangju Bank is a regional bank that provides financial services in Kwangju and southwestern Korea. Kwangju Bank concentrates on the consumer and small- and medium-sized enterprise banking sectors, offering deposit and loan products to customers in those sectors and, to a lesser extent, large corporate customers.
| Year ended December 31, | Percentage change |
|||||||||||
| 2010 | 2011 | |||||||||||
| (in billions of Won) | (%) | |||||||||||
| Income statement data |
||||||||||||
| Interest income |
(Won) | 907 | (Won) | 950 | 4.7 | % | ||||||
| Interest expense |
439 | 450 | 2.5 | |||||||||
|
|
|
|
|
|||||||||
| Net interest income |
468 | 500 | 6.8 | |||||||||
| Non-interest income |
254 | 166 | (34.6 | ) | ||||||||
| Non-interest expense |
234 | 158 | (32.5 | ) | ||||||||
|
|
|
|
|
|||||||||
| Net non-interest income |
20 | 8 | 60.0 | |||||||||
| Administrative expenses |
195 | 224 | 14.9 | |||||||||
| Impairment loss on credit loss |
128 | 108 | (15.6 | ) | ||||||||
|
|
|
|
|
|||||||||
| Total other expenses |
323 | 332 | 2.8 | |||||||||
|
|
|
|
|
|||||||||
| Operating Income |
165 | 176 | 6.7 | |||||||||
|
|
|
|
|
|||||||||
| Share of profits of jointly controlled entities and associates |
— | — | — | |||||||||
| Net income before taxes |
165 | 176 | 6.7 | |||||||||
|
|
|
|
|
|||||||||
| Income tax expense (benefit) |
41 | 40 | (2.4 | ) | ||||||||
|
|
|
|
|
|||||||||
| Net income |
(Won) | 124 | (Won) | 136 | 9.7 | |||||||
|
|
|
|
|
|||||||||
| Controlling interest |
124 | 136 | 9.7 | |||||||||
| Noncontrolling interest |
— | — | — | |||||||||
Our net income before tax for this segment increased 6.7% from (Won)165 billion in 2010 to (Won)176 billion in 2011. Net income after tax also increased 9.7% from (Won)124 billion in 2010 to (Won)136 billion in 2011.
Interest income from our Kwangju Bank operations increased 4.7% from (Won)907 billion in 2010 to (Won)950 billion in 2011, primarily due to an increase in average lending volumes. The average volume of Kwangju Bank’s loans increased 5.0% from (Won)11,180 billion in 2010 to (Won)11,740 billion in 2011, primarily due to an increase in the average volume of loans to small- and medium-sized enterprises, reflecting increased demand for such loans.
Interest expense increased 2.5% from (Won)439 billion in 2010 to (Won)450 billion in 2011. The increase in interest expense resulted principally from a 3.3% increase in the average volume of deposits from (Won)11,392 billion in 2010 to (Won)11,773 billion in 2011, primarily as a result of increased demand for deposit products as well as Kwangju Bank’s continuing marketing efforts for such products. This increase was partially offset by a decrease in the average cost of interest-bearing liabilities, mainly due to the combined effect of an increase in the proportion of relatively lower-cost borrowings and a decrease in the proportion of relatively higher-cost certificates of deposit and debentures in Kwangju Bank’s portfolio of interest-bearing liabilities.
Impairment loss on credit loss decreased 15.6% from (Won)128 billion in 2010 to (Won)108 billion in 2011 as higher bad debt expenses resulting from increased loan loss provisioning by Kwangju Bank in connection with the restructuring (in the form of workout, liquidation or court receivership) in 2010 of 65 companies selected by it and various other Korean financial institutions were not repeated in 2011.
149
Table of Contents
Non-interest income decreased 34.6% from (Won)254 billion in 2010 to (Won)166 billion in 2011, primarily due to a decrease in gains on transaction of foreign exchange.
Non-interest expense decreased 32.5% from (Won)234 billion in 2010 to (Won)158 billion in 2011, primarily due to a decrease in losses on transaction and valuation of derivatives.
Administrative expenses increased 14.9% from (Won)195 billion in 2010 to (Won)224 billion in 2011, primarily due to an increase in short term employee benefits.
Woori Investment & Securities
Woori Investment & Securities is engaged in securities brokerage, investment banking, securities investment and trading and other capital markets activities. We currently hold a 37.9% voting interest in Woori Investment & Securities. Woori Investment & Securities is accounted for as a consolidated subsidiary under IFRS as issued by the IASB.
| Year ended December 31, | Percentage change |
|||||||||||
| 2010 | 2011 | |||||||||||
| (in billions of Won) | (%) | |||||||||||
| Income statement data |
||||||||||||
| Interest income |
(Won) | 620 | (Won) | 662 | 6.8 | % | ||||||
| Interest expense |
270 | 330 | 22.2 | |||||||||
|
|
|
|
|
|||||||||
| Net interest income |
350 | 332 | (5.1 | ) | ||||||||
| Non-interest income |
3,165 | 3,218 | 1.7 | |||||||||
| Non-interest expense |
2,673 | 2,760 | 3.3 | |||||||||
|
|
|
|
|
|||||||||
| Net non-interest income |
492 | 458 | (6.9 | ) | ||||||||
| Administrative expenses |
530 | 570 | 7.5 | |||||||||
| Impairment loss on credit loss |
(3 | ) | 7 | N/M | (1) | |||||||
|
|
|
|
|
|||||||||
| Total other expenses |
527 | 577 | 9.5 | |||||||||
|
|
|
|
|
|||||||||
| Operating Income |
315 | 213 | (32.4 | ) | ||||||||
|
|
|
|
|
|||||||||
| Share of profits of jointly controlled entities and associates |
(10 | ) | 43 | N/M | (1) | |||||||
| Net income before taxes |
305 | 256 | (16.1 | ) | ||||||||
|
|
|
|
|
|||||||||
| Income tax expense (benefit) |
67 | 58 | (13.4 | ) | ||||||||
|
|
|
|
|
|||||||||
| Net income |
(Won) | 238 | (Won) | 198 | (16.8 | ) | ||||||
|
|
|
|
|
|||||||||
| Controlling interest |
250 | 165 | (34.0 | ) | ||||||||
| Noncontrolling interest |
(12 | ) | 33 | N/M | (1) | |||||||
| (1) | N/M = not meaningful. |
Our net income before tax for this segment decreased 16.1% from (Won)305 billion in 2010 to (Won)256 billion in 2011. Net income after tax also decreased 16.8% from (Won)238 billion in 2010 to (Won)198 billion in 2011.
Interest income for this segment increased 6.8% from (Won)620 billion in 2010 to (Won)662 billion in 2011, principally as a result of an increase in interest income from brokerage transactions on credit and an increase in the average volume of securities purchased under resale agreements.
Interest expense increased 22.2% from (Won)270 billion in 2010 to (Won)330 billion in 2011, primarily as a result of an increase in the average volume of borrowings in local currency to fund brokerage transactions on credit.
Impairment loss on credit loss for this segment was (Won)7 billion in 2011 compared to a net reversal of (Won)3 billion in 2010, primarily as a result of an increase in write-offs of Woori Investment & Securities’ holdings of debt securities in 2011.
Non-interest income, which includes commission income from Woori Investment & Securities’ brokerage operations, increased 1.7% from (Won)3,165 billion in 2010 to (Won)3,218 billion in 2011, mainly due to an increase in gain on valuation of derivatives, which reflected increased interest rate volatility in 2011.
150
Table of Contents
Non-interest expense increased 3.3% from (Won)2,673 billion in 2010 to (Won)2,760 billion in 2011, primarily as a result of an increase in loss on transaction and valuation of derivatives, which mainly reflected increased foreign exchange and interest rate volatility.
Administrative expenses increased 7.5% from (Won)530 billion in 2010 to (Won)570 billion in 2011, primarily due to an increase in fees paid to various outside service providers.
Other Operations
Other operations include the operations of Woori Finance Holdings and all of our subsidiaries that were consolidated under IFRS as issued by the IASB as of December 31, 2011 except Woori Bank, Kyongnam Bank and Kwangju Bank and Woori Investment & Securities, including principally Woori FIS, Woori F&I, Woori Asset Management, Woori Private Equity, Woori Financial, Woori FG Savings Bank (which was established in March 2011 to acquire certain assets and assume certain liabilities of Samhwa Mutual Savings Bank), and a number of other smaller subsidiaries, none of which constituted a separate reportable segment.
| Year ended December 31, | Percentage change |
|||||||||||
| 2010 | 2011 | |||||||||||
| (in billions of Won) | (%) | |||||||||||
| Income statement data |
||||||||||||
| Interest income |
(Won) | 418 | (Won) | 511 | 22.2 | % | ||||||
| Interest expense |
499 | 507 | 1.6 | |||||||||
|
|
|
|
|
|||||||||
| Net interest income |
(81 | ) | 5 | N/M | (1) | |||||||
| Non-interest income |
1,027 | 1,332 | 29.7 | |||||||||
| Non-interest expense |
182 | 293 | 61.0 | |||||||||
|
|
|
|
|
|||||||||
| Net non-interest income |
845 | 1,039 | 23.0 | |||||||||
| Administrative expenses |
379 | 450 | 18.7 | |||||||||
| Impairment loss on credit loss |
125 | 206 | 64.8 | |||||||||
|
|
|
|
|
|||||||||
| Total other expenses |
504 | 656 | 30.2 | |||||||||
|
|
|
|
|
|||||||||
| Operating Income |
260 | 387 | 48.8 | |||||||||
|
|
|
|
|
|||||||||
| Share of profits of jointly controlled entities and associates |
2 | (24 | ) | N/M | ||||||||
| Net income before taxes |
262 | 363 | 38.5 | |||||||||
|
|
|
|
|
|||||||||
| Income tax expense (benefit) |
18 | 24 | 33.3 | |||||||||
|
|
|
|
|
|||||||||
| Net income |
(Won) | 244 | (Won) | 339 | 38.9 | |||||||
|
|
|
|
|
|||||||||
| Controlling interest |
265 | 368 | 38.9 | |||||||||
| Noncontrolling interest |
(21 | ) | (29 | ) | N/M | (1) | ||||||
| (1) | N/M = not meaningful. |
Our net income before tax for this segment increased 38.5% from (Won)262 billion in 2010 to (Won)363 billion in 2011. Net income after tax also increased 38.9% from (Won)244 billion in 2010 to (Won)339 billion in 2011.
Interest income for this segment increased 22.2% from (Won)418 billion in 2010 to (Won)511 billion in 2011, principally due to the addition of Woori FG Savings Bank as our consolidated subsidiary in March 2011 and an increase in the average volume of loans by Woori Financial, which were partially offset by a decrease in average yields on corporate loans by Woori Financial resulting from a deterioration in the asset quality of Woori Financial’s loan portfolio.
Interest expense increased 1.6% from (Won)499 billion in 2010 to (Won)507 billion in 2011, primarily due to the addition of Woori FG Savings Bank as our consolidated subsidiary in March 2011 and an increase in the average volume of debentures issued by Woori Financial, which were partially offset by a decrease in the average cost of such debentures.
151
Table of Contents
Impairment loss on credit loss increased 64.8% from (Won)125 billion in 2010 to (Won)206 billion in 2011. This increase was primarily as a result of the addition of Woori FG Savings Bank as our consolidated subsidiary in March 2011.
Non-interest income increased 29.7% from (Won)1,027 billion in 2010 to (Won)1,332 billion in 2011, mainly due to an increase in gain on transaction of derivatives by Woori Private Equity and dividends we received from our consolidated subsidiaries, which dividends are eliminated in our consolidated statement of comprehensive income.
Non-interest expense increased 61.0% from (Won)182 billion in 2010 to (Won)293 billion in 2011, primarily as a result of an increase in loss on transaction of derivatives by Woori Private Equity.
Administrative expenses increased 18.7% from (Won)379 billion in 2010 to (Won)450 billion in 2011, primarily due to an increase in short term employee benefits.
| Item 5B. | Liquidity and Capital Resources |
Financial Condition
Assets
The following table sets forth, as of the dates indicated, the principal components of our assets:
| As of December 31, | Percentage change |
|||||||||||
| 2010 | 2011 | |||||||||||
| (in billions of Won) | (%) | |||||||||||
| Cash and cash equivalents |
(Won) | 4,871 | (Won) | 6,417 | 31.7 | % | ||||||
| Financial assets at fair value through profit or loss |
22,184 | 25,600 | 15.4 | |||||||||
| Available-for-sale financial assets |
21,998 | 19,672 | (10.6 | ) | ||||||||
| Held-to-maturity financial assets |
19,886 | 20,036 | 0.8 | |||||||||
| Loans and receivables: |
||||||||||||
| Due from banks |
11,894 | 15,348 | 29.0 | |||||||||
| Loans in local currency |
160,380 | 171,590 | 7.0 | |||||||||
| Loans in foreign currencies |
13,459 | 13,244 | (1.6 | ) | ||||||||
| Domestic banker’s letter of credit |
4,339 | 5,423 | 25.0 | |||||||||
| Credit card accounts |
4,357 | 4,592 | 5.4 | |||||||||
| Bills bought in local currency |
424 | 661 | 55.9 | |||||||||
| Bills bought in foreign currencies |
5,148 | 5,672 | 10.2 | |||||||||
| Factoring receivables |
114 | 276 | 142.1 | |||||||||
| Advances for customers on guarantees |
306 | 42 | (86.3 | ) | ||||||||
| Privately placed bonds |
2,621 | 1,738 | (33.7 | ) | ||||||||
| Loans to be converted to equity securities |
2 | 2 | — | |||||||||
| Finance leases |
632 | 662 | 4.7 | |||||||||
| Loans for installment |
1,130 | 1,535 | 35.8 | |||||||||
| Securitized loans |
1,230 | 1,614 | 31.2 | |||||||||
| Loans secured by securities |
1,207 | 1,181 | (2.2 | ) | ||||||||
| Call loans |
3,717 | 3,432 | (7.7 | ) | ||||||||
| Bonds purchased under resale agreements |
2,005 | 749 | (62.6 | ) | ||||||||
| Other loans |
221 | 226 | 2.3 | |||||||||
| Other receivables |
8,523 | 11,211 | 31.5 | |||||||||
|
|
|
|
|
|||||||||
| 221,709 | 239,198 | 7.9 | ||||||||||
| Less: |
||||||||||||
| Provision for credit losses |
4,917 | 4,038 | (17.9 | ) | ||||||||
|
|
|
|
|
|||||||||
| Total loans and receivables, net |
216,792 | 235,160 | 8.5 | |||||||||
| Premises and equipment, net |
3,097 | 3,135 | 1.2 | |||||||||
| Other assets(1) |
2,349 | 2,772 | 18.0 | |||||||||
|
|
|
|
|
|||||||||
| Total assets |
(Won) | 291,177 | (Won) | 312,792 | 7.4 | % | ||||||
|
|
|
|
|
|||||||||
| (1) | Includes investments in jointly controlled entities and associates, investment properties, intangible assets and goodwill, current tax assets, deferred tax assets, derivative assets, assets held for sale and other assets. |
For further information on our assets, see “Item 4B. Business Overview—Assets and Liabilities.”
152
Table of Contents
Comparison of 2011 to 2010
Our total assets increased 7.4% from (Won)291,177 billion as of December 31, 2010 to (Won)312,792 billion as of December 31, 2011, principally due to a 7.0% increase in loans in local currency from (Won)160,380 billion as of December 31, 2010 to (Won)171,590 billion as of December 31, 2011, a 29.0% increase in due from banks from (Won)11,894 billion as of December 31, 2010 to (Won)15,348 billion as of December 31, 2011 and a 15.4% increase in financial assets at fair value through profit and loss from (Won)22,184 billion as of December 31, 2010 to (Won)25,600 billion as of December 31, 2011. The effect of these increases was partially offset by a 10.6% decrease in available-for-sale financial assets from (Won)21,998 billion as of December 31, 2010 to (Won)19,672 billion as of December 31, 2011 and a 62.6% decrease in bonds purchased under resale agreements from (Won)2,005 billion as of December 31, 2010 to (Won)749 billion as of December 31, 2011.
Liabilities and Equity
The following table sets forth, as of the dates indicated, the principal components of our liabilities and our equity:
| As of December 31, | Percentage change |
|||||||||||
| 2010 | 2011 | |||||||||||
| (in billions of Won) | (%) | |||||||||||
| Liabilities: |
||||||||||||
| Financial liabilities at fair value through profit or loss |
(Won) | 8,838 | (Won) | 9,622 | 8.9 | % | ||||||
| Deposits due to customers |
185,428 | 195,930 | 5.7 | |||||||||
| Borrowings |
34,266 | 34,667 | 1.2 | |||||||||
| Debentures |
29,111 | 29,266 | 0.5 | |||||||||
| Provisions |
761 | 892 | 17.2 | |||||||||
| Other financial liabilities |
11,648 | 19,084 | 63.8 | |||||||||
| Other liabilities(1) |
861 | 1,257 | 46.0 | |||||||||
|
|
|
|
|
|||||||||
| Total liabilities |
270,913 | 290,718 | 7.3 | |||||||||
|
|
|
|
|
|||||||||
| Equity: |
||||||||||||
| Capital stock |
4,030 | 4,030 | — | |||||||||
| Hybrid securities |
— | 309 | N/M | (2) | ||||||||
| Capital surplus |
180 | 176 | (2.2 | ) | ||||||||
| Other equity |
1,002 | 587 | (41.4 | ) | ||||||||
| Retained earnings |
10,489 | 12,423 | 18.4 | |||||||||
|
|
|
|
|
|||||||||
| Controlling interests |
15,701 | 17,525 | (11.6 | ) | ||||||||
|
|
|
|
|
|||||||||
| Non-controlling interests |
4,563 | 4,549 | (0.3 | ) | ||||||||
|
|
|
|
|
|||||||||
| Total equity |
20,264 | 22,074 | 8.9 | |||||||||
|
|
|
|
|
|||||||||
| Total liabilities and equity |
(Won) | 291,177 | (Won) | 312,792 | 7.4 | % | ||||||
|
|
|
|
|
|||||||||
| (1) | Includes retirement benefit obligations, current tax liabilities, deferred tax liabilities, derivative liabilities and other liabilities. |
| (2) | N/M = not meaningful. |
For further information on our liabilities, see “Item 4B. Business Overview—Assets and Liabilities.”
Comparison of 2011 to 2010
Our total liabilities increased 7.3% from (Won)270,913 billion as of December 31, 2010 to (Won)290,718 billion as of December 31, 2011. The increase was primarily due to increases in deposits due to customers and other financial liabilities. Our deposits due to customers increased 5.7% from (Won)185,428 billion as of December 31, 2010 to (Won)195,930 billion as of December 31, 2011, mainly as a result of an increase in time deposits in local currency. Our other financial liabilities increased 63.8% from (Won)11,648 billion as of December 31, 2010 to (Won)19,084 billion as of December 31, 2011, principally due to a 105.5% increase in accounts payable from (Won)3,616 billion as of December 31, 2010 to (Won)7,431 billion as of December 31.
Our total owners’ equity increased by 8.9% from (Won)20,264 billion as of December 31, 2010 to (Won)22,074 billion as of December 31, 2011. This increase resulted principally from an increase in our retained earnings, which was attributable to the net income we generated in 2011.
153
Table of Contents
Liquidity
Our primary source of funding has historically been and continues to be customer deposits, particularly lower-cost retail deposits. Deposits amounted to (Won)185,428 billion as of December 31, 2010 and (Won)195,930 billion as of December 31, 2011, which represented approximately 73.0% and 73.7% of our total funding, respectively. We have been able to use increases in customer deposits in recent years to finance our operations generally, including meeting a portion of our liquidity requirements. Although the majority of deposits are short-term, it has been our experience that the majority of our depositors generally roll over their deposits at maturity, thus providing us with a stable source of funding. However, in the event that a substantial number of our depositors do not roll over their deposits or otherwise decide to withdraw their deposited funds, we would need to place increased reliance on alternative sources of funding, some of which may be more expensive than customer deposits, in order to finance our operations. See “Item 3D. Risk Factors—Other risks relating to our business—Our funding is highly dependent on short-term deposits, which dependence may adversely affect our operations.” In particular, we may increase our utilization of alternative funding sources such as short-term borrowings and cash and cash equivalents (including funds from maturing loans), as well as liquidating our positions in trading and investment securities and using the proceeds to fund parts of our operations, as necessary.
We also obtain funding through borrowings and debentures to meet our liquidity needs. Borrowings represented 14.9% and 15.1% of our total funding as of December 31, 2010 and 2011, respectively. Debentures represented 12.1% and 11.1% of our total funding as of December 31, 2010 and 2011, respectively. For further information on our sources of funding, see “Item 4B. Business Overview—Assets and Liabilities—Funding.
Our liquidity risks arise from withdrawals of deposits and maturities of our borrowings and debentures, as well as our need to fund our lending, trading and investment activities and to manage our trading positions. Our goal in managing our liquidity is to be able, even under adverse conditions, to meet all of our liability repayments on time and to fund all investment opportunities. For a discussion of how we manage our liquidity risk, see “Item 11. Quantitative and Qualitative Disclosures about Market Risk—Liquidity Risk Management.”
The Financial Services Commission requires each Korean bank to maintain specific Won and foreign currency liquidity ratios. These ratios require each of our banking subsidiaries to keep its ratio of liquid assets to liquid liabilities above certain minimum levels. For a description of these requirements, see “Item 4B. Business Overview—Supervision and Regulation—Principal Regulations Applicable to Banks—Liquidity.”
We are a financial holding company, and substantially all of our operations are in our subsidiaries. Accordingly, we rely on distributions from our subsidiaries, direct borrowings and issuances of debt and equity securities to fund our liquidity obligations at the holding company level. We received aggregate dividends from our subsidiaries of (Won)407 billion for 2010 and (Won)516 billion for 2011. See “Item 3D. Risk Factors—Risks relating to our financial holding company structure and strategy.”
Contractual Obligations and Off-Balance Sheet Arrangements
The following table sets forth our contractual obligations as of December 31, 2011:
| Payments due by period | ||||||||||||||||||||
| Total | Less than 1 year |
1-3 years | 3-5 years | More than 5 years |
||||||||||||||||
| (in billions of Won) | ||||||||||||||||||||
| Contractual obligations |
||||||||||||||||||||
| Borrowing obligations(1) |
(Won) | 43,285 | (Won) | 30,471 | (Won) | 3,338 | (Won) | 1,555 | (Won) | 7,921 | ||||||||||
| Debenture obligations(1) |
32,621 | 10,523 | 12,959 | 6,557 | 2,581 | |||||||||||||||
| Deposits(2)(3) |
124,079 | 116,871 | 4,460 | 817 | 1,932 | |||||||||||||||
| Capital (finance) lease obligations |
83 | 34 | 34 | 15 | — | |||||||||||||||
| Operating lease obligations |
26 | 7 | 11 | 5 | 3 | |||||||||||||||
| Purchase obligations |
282 | 53 | 92 | 91 | 46 | |||||||||||||||
| Employee severance plan obligations |
2,247 | 2 | 4 | 41 | 2,200 | |||||||||||||||
|
|
|
|
|
|
|
|
|
|
|
|||||||||||
| Total |
(Won) | 202,623 | (Won) | 157,961 | (Won) | 20,898 | (Won) | 9,081 | (Won) | 14,683 | ||||||||||
|
|
|
|
|
|
|
|
|
|
|
|||||||||||
154
Table of Contents
| (1) | Includes estimated future interest payments, which have been estimated using contractual interest rates and scheduled contractual maturities of the outstanding borrowings and debentures as of December 31, 2011. In order to calculate future interest payments on debts with floating rates, we used contractual interest rates as of December 31, 2011. |
| (2) | Comprising certificates of deposit, other time deposits and installment deposits. |
| (3) | Includes estimated future interest payments, which have been estimated using weighted average interest rates paid for 2011 for each deposit product category and their scheduled contractual maturities. |
We utilize credit-related financial instruments with off-balance sheet risk in our normal course of business. The primary purpose of those instruments is to generate fee income for us, in return for making credit support and funds available to our customers as required. Such instruments consist primarily of guarantees, commercial letters of credit and unused lines of credit. Guarantees include guarantees for loans, debentures, trade financing arrangements and guarantees for other financings. Contingent liabilities for which guaranteed amounts are not finalized appear as off-balance sheet items in the notes to the financial statements. Such contingent liabilities include, among others, contingent liabilities relating to trade financings and derivatives contracts with respect to foreign exchange rates and interest rates.
We also enter into transactions with certain special purpose entities and variable interest entities, including through the purchase of their subordinated debt and the provision of credit facilities to them.
The following table sets forth our off-balance sheet commitments as of the dates indicated:
| As of December 31, | ||||||||
| 2010 | 2011 | |||||||
| (in billions of Won) | ||||||||
| Confirmed guarantees |
(Won) | 10,246 | (Won) | 11,571 | ||||
| Debenture issuance |
42 | 0 | ||||||
| Loans |
177 | 291 | ||||||
| Acceptances |
771 | 840 | ||||||
| Acceptances of imported goods |
133 | 142 | ||||||
| Others |
9,123 | 10,298 | ||||||
| Unconfirmed guarantees |
10,146 | 8,973 | ||||||
| Local letters of credit |
963 | 1,003 | ||||||
| Import letters of credit |
5,505 | 4,837 | ||||||
| Others |
3,679 | 3,133 | ||||||
| Commercial paper purchase commitments and others |
4,617 | 6,158 | ||||||
| Loan commitments and others |
93,248 | 97,556 | ||||||
| Loans |
82,941 | 88,401 | ||||||
| Others |
10,307 | 9,155 | ||||||
We analyze our off-balance sheet legally binding credit-related commitments for possible losses associated with such commitments. We review the ability of the counterparties of the underlying credit-related commitments to perform their obligations under the commitments and, if we determine that a loss is probable and estimable, we establish provisions for possible losses in a manner similar to provisions that we would establish with respect to a loan granted under the terms of the applicable commitment. These provisions are reflected as provisions in our statement of financial position. As of December 31, 2011, we had established provisions for possible losses of (Won)599 billion with respect to our credit-related commitments.
Capital Adequacy
Our subsidiaries Woori Bank, Kyongnam Bank and Kwangju Bank are subject to the capital adequacy requirements of the Financial Services Commission. The requirements applicable commencing in 2008 were formulated based on, and are consistent in all material respects with, the “International Convergence of Capital Measurement and Capital Standards, a Revised Framework,” also known as Basel II, first published by the Basel Committee on Banking Supervision, Bank for International Settlements in 2004. These subsidiaries are required to maintain a minimum ratio of total capital (Tier I and Tier II capital, less any capital deductions) to risk-weighted assets, as determined by a specified formula, of 8.0%. See “Item 4B. Business Overview—Supervision and Regulation—Principal Regulations Applicable to Banks—Capital Adequacy and Allowances.”
155
Table of Contents
Tier I capital is core capital, which consists of paid-in capital, capital surplus, retained earnings, noncontrolling interests in consolidated subsidiaries and unpaid share dividends minus deductions. Tier II capital is supplemental capital, which includes allowances for certain loan losses up to 1.25% of total risk-weighted assets, subordinated debts with an initial maturity of at least five years and revaluation surplus. Risk-weighted assets are calculated as the sum of credit risk-weighted assets, market risk-weighted assets and operational risk-weighted assets, in each case as provided in the Financial Services Commission’s guidelines.
The following tables set forth a summary of the capital and capital adequacy ratios of Woori Bank, our principal banking subsidiary, and the capital adequacy ratios of Kyongnam Bank and Kwangju Bank, as of December 31, 2011 based on IFRS as issued by the IASB and regulatory reporting standards:
| As of December 31, 2011 |
||||
| (in billions of Won) | ||||
| Woori Bank |
||||
| Tier I capital |
||||
| Paid-in capital |
(Won) | 3,830 | ||
| Hybrid |
1,682 | |||
| Capital reserves |
812 | |||
| Retained earnings |
9,403 | |||
| Minority interests in consolidated subsidiaries |
8 | |||
| Consolidated adjustment credit/debit |
— | |||
| Others |
(673 | ) | ||
|
|
|
|||
| Total Tier I capital |
15,062 | |||
| Tier II capital |
||||
| Revaluation reserves |
550 | |||
| Provisions for credit loss(1) |
1,139 | |||
| Subordinated debt(2) |
2,432 | |||
| Valuation gain on investment financial assets |
161 | |||
| Others |
(14 | ) | ||
| Total Tier II capital |
4,268 | |||
|
|
|
|||
| Investment in jointly controlled entities and associates and other deduction items(3) |
— | |||
|
|
|
|||
| Total core and supplementary capital |
(Won) | 19,330 | ||
| Risk-weighted assets |
||||
| Credit risk-weighted assets |
(Won) | 130,992 | ||
| Market risk-weighted assets |
1,374 | |||
| Operational risk-weighted assets |
7,924 | |||
|
|
|
|||
| Total risk-weighted assets |
140,290 | |||
| Risk-weighted assets for required capital adjustment(4) |
— | |||
|
|
|
|||
| Total adjusted risk-weighted assets |
(Won) | 140,290 | ||
| Tier I capital ratio |
10.74 | % | ||
| Tier II capital ratio |
3.04 | % | ||
| Capital adequacy ratio |
13.78 | % | ||
| (1) | Provisions for credit losses in respect of credits classified as normal or precautionary are used to calculate Tier II capital only to the extent such allowances represent up to 1.25% of risk-weighted assets. |
| (2) | Subordinated debt representing up to 50% of Tier I capital is used in the calculation of Tier II capital. |
| (3) | Equity method investees engaged in banking and financial activities of which Woori Bank owned more than 15% are deducted from Tier I and Tier II capital pursuant to the guidelines of the Financial Services Commission. |
| (4) | Represents adjustments to total risk-weighted assets pursuant to Financial Supervisory Service guidelines that require banks that apply an internal ratings-based approach or advanced measurement approach in calculating capital requirements to adjust their total risk-weighted assets when calculating capital ratios in certain circumstances. |
156
Table of Contents
| Kyongnam Bank | Kwangju Bank | |||||||
| As of December 31, 2011 |
||||||||
| Tier I capital ratio |
9.17 | % | 8.68 | % | ||||
| Tier II capital ratio |
4.10 | 5.12 | ||||||
| Capital adequacy ratio |
13.28 | 13.80 | ||||||
The following tables set forth a summary of the capital and capital adequacy ratios of Woori Bank and the capital adequacy ratios of Kyongnam Bank and Kwangju Bank, as of December 31, 2010 based on generally accepted accounting principles in Korea and regulatory reporting standards:
| As of December
31, 2010 |
||||
| (in billions of Won) | ||||
| Woori Bank |
||||
| Tier I capital |
||||
| Paid-in capital |
(Won) | 3,830 | ||
| Hybrid |
2,394 | |||
| Capital reserves |
812 | |||
| Retained earnings |
8,713 | |||
| Minority interests in consolidated subsidiaries |
7 | |||
| Consolidated adjustment credit/debit |
— | |||
| Others |
(705 | ) | ||
|
|
|
|||
| Total Tier I capital |
15,051 | |||
| Tier II capital |
||||
| Revaluation reserves |
||||
| Provisions for credit loss(1) |
820 | |||
| Subordinated debt(2) |
3,241 | |||
| Valuation gain on investment financial assets |
324 | |||
| Others |
(98 | ) | ||
| Total Tier II capital |
4,287 | |||
|
|
|
|||
| Investment in jointly controlled entities and associates and other deduction items(3) |
— | |||
|
|
|
|||
| Total core and supplementary capital |
(Won) | 19,338 | ||
| Risk-weighted assets |
||||
| Credit risk-weighted assets |
(Won) | 123,370 | ||
| Market risk-weighted assets |
1,257 | |||
| Operational risk-weighted assets |
7,371 | |||
|
|
|
|||
| Total risk-weighted assets |
131,998 | |||
| Risk-weighted assets for required capital adjustment(4) |
— | |||
|
|
|
|||
| Total adjusted risk-weighted assets |
— | |||
| (Won) | 131,998 | |||
| Tier I capital ratio |
11.40 | % | ||
| Tier II capital ratio |
3.25 | % | ||
| Capital adequacy ratio |
14.65 | % | ||
| (1) | Provisions for credit losses in respect of credits classified as normal or precautionary are used to calculate Tier II capital only to the extent such allowances represent up to 1.25% of risk-weighted assets. |
| (2) | Subordinated debt representing up to 50% of Tier I capital is used in the calculation of Tier II capital. |
| (3) | Equity method investees engaged in banking and financial activities of which Woori Bank owned more than 15% are deducted from Tier I and Tier II capital pursuant to the guidelines of the Financial Services Commission. |
| (4) | Represents adjustments to total risk-weighted assets pursuant to Financial Supervisory Service guidelines that require banks that apply an internal ratings-based approach or advanced measurement approach in calculating capital requirements to adjust their total risk-weighted assets when calculating capital ratios in certain circumstances. |
157
Table of Contents
| Kyongnam Bank | Kwangju Bank | |||||||
| As of December 31, 2010 |
||||||||
| Tier I capital ratio |
9.73 | % | 9.03 | % | ||||
| Tier II capital ratio |
4.36 | 4.19 | ||||||
| Capital adequacy ratio |
14.09 | 13.22 | ||||||
Basel II, which builds upon the initial Basel Capital Accord of 1988, focuses its attention on risk assessment and credit risk in particular. Basel II instituted new measures that require our commercial banking subsidiaries to:
| • | take into account individual borrower credit when calculating their risk-weighted assets, unlike in the past; and |
| • | quantify their operational risk to include explicit capital requirements in their financial statements. |
In addition, under Basel II, banks are permitted to follow either a standardized approach or an internal ratings-based approach with respect to calculating capital requirements. Woori Bank has voluntarily chosen to establish and follow an internal ratings-based approach, which is more stringent in terms of calculating risk sensitivity with respect to its capital requirements. Kyongnam Bank has also begun following an internal ratings-based approach from September 2011, while Kwangju Bank plans to do the same in the near future. For regulatory reporting purposes, from September 30, 2008, Woori Bank has implemented its internal ratings-based approach for credit risk, beginning with its credit risk with respect to retail, small- and medium-size enterprises and large corporate loans and asset-backed securities portfolios, and plans to further implement its internal ratings-based approach to its specialized lending portfolio upon approval by the Financial Supervisory Service. A standardized approach will be used in measuring credit risk for those classes of exposure for which Woori Bank’s internal ratings-based approach has not yet been implemented, as well as for certain classes of exposure (including those to the Korean government, public institutions and other banks) for which the internal ratings-based approach will not be applied. Woori Bank plans to implement an “advanced internal ratings-based approach” for credit risk in the near future. Woori Bank also implemented a standardized approach for operational risk beginning on January 1, 2008, and implemented an “advanced measurement approach” for operational risk in June 2009. While we believe that Woori Bank’s implementation of an internal ratings-based approach in 2008 has increased its capital adequacy ratio and led to a decrease in its credit risk-related capital requirements as compared to those under its previous approach under the initial Basel Capital Accord of 1988, there can be no assurance that such internal ratings-based approach under Basel II will not require an increase in Woori Bank’s credit risk capital requirements in the future, which may require it to either improve its asset quality or raise additional capital.
In December 2009, the Basel Committee on Banking Supervision introduced a new set of measures to supplement Basel II which include, among others, a requirement for higher minimum capital, introduction of a leverage ratio as a supplementary measure to the capital adequacy ratio and flexible capital requirements for different phases of the economic cycle. Additional details regarding such new measures, including an additional capital conservation buffer and countercyclical capital buffer, liquidity coverage ratio and other supplemental measures, were announced by the Group of Governors and Heads of Supervision of the Basel Committee on Banking Supervision in September 2010. After further impact assessment and observation periods, the Basel Committee on Banking Supervision is expected to begin implementing the new set of measures, referred to as Basel III, from 2013. In Korea, Basel III is expected to be implemented in stages from 2013 to 2019. The implementation of Basel III in Korea may have a significant effect on the capital requirements of Korean financial institutions, including our commercial banking subsidiaries.
Beginning in 2007, under the new capital adequacy requirements of the Financial Services Commission applicable from such year, we, as a bank holding company, are required to maintain a minimum consolidated capital adequacy ratio of 8.0%. “Consolidated capital adequacy ratio” is defined as the ratio of equity capital as a percentage of risk-weighted assets on a consolidated basis, determined in accordance with Financial Services Commission requirements that have been formulated based on Bank of International Settlements standards. “Equity capital,” as applicable to bank holding companies, is defined as the sum of Tier I capital, Tier II capital
158
Table of Contents
and Tier III capital less any deductible items, each as defined under the Regulation on the Supervision of Financial Holding Companies). “Risk-weighted assets” is defined as the sum of credit risk-weighted assets and market risk-weighted assets.
The following table sets forth a summary of our consolidated capital adequacy ratio as of December 31, 2011, based on applicable IFRS and regulatory reporting standards:
| As of December 31, 2011 | ||||
| (in billions of Won) | ||||
| Risk-weighted assets |
(Won) | 208,069 | ||
| Equity capital |
25,669 | |||
| Consolidated risk-based capital adequacy ratio |
12.34 | % | ||
Recent Accounting Pronouncements
See Note 2 of the notes to our consolidated financial statements for a description of recent accounting pronouncements under IFRS as issued by the IASB that have been issued but are not yet effective.
| Item 5C. | Research and Development, Patents and Licenses, etc. |
Not Applicable
| Item 5D. | Trend Information |
These matters are discussed under Item 5A and Item 5B above where relevant.
| Item 5E. | Off-Balance Sheet Arrangements |
See “Item 5B. Liquidity and Capital Resources—Financial Condition—Contractual Obligations and Off-Balance Sheet Arrangements.”
| Item 5F. | Tabular Disclosure of Contractual Obligations |
See “Item 5B. Liquidity and Capital Resources—Financial Condition—Contractual Obligations and Off-Balance Sheet Arrangements.”
| Item 6. | DIRECTORS, SENIOR MANAGEMENT AND EMPLOYEES |
| Item 6A. | Directors and Senior Management |
Board of Directors
Our board of directors has the ultimate responsibility for managing our affairs. The board currently comprises one standing director and seven outside directors. Standing directors are directors who are full-time executive officers of Woori Finance Holdings, while outside directors are directors who are not full-time executive officers.
Our articles of incorporation provide that the board can have no more than 15 directors. Standing directors must comprise less than 50% of the total number of directors and there must be at least three outside directors. Each standing director may be elected for a term of office not exceeding three years, as determined at the general meeting of shareholders, and may be re-elected. Each outside director may be elected for a term of office not exceeding two years, and may be re-elected for successive one-year terms, provided that the outside director may not serve in such office for more than five consecutive years. In addition, with respect to both standing and outside directors, such term of office is extended until or reduced to, as the case may be, the close of the annual general meeting of stockholders convened in respect of the last fiscal year of the director’s term of office. These terms are subject to the Korean Commercial Code, the Financial Holding Company Act and related regulations. Each director may be re-elected, subject to these laws and regulations.
159
Table of Contents
Our board of directors meets regularly on a quarterly basis to discuss and resolve various corporate matters. The board may also convene for additional extraordinary meetings at the request of any of the directors.
The names and positions of our directors are set forth below. The business address of all of the directors is our registered office at 203 Hoehyon-dong, 1-ga, Chung-gu, Seoul, Korea.
Standing Director
Our standing director is as follows:
| Name |
Age | Position | Director Since | |||||||
| Pal Seung Lee |
68 | Chairman and Chief Executive Officer | June 27, 2008 | |||||||
Our standing director is not involved in any significant business activities outside Woori Finance Holdings and our subsidiaries.
Pal Seung Lee was elected executive director in June 2008. Prior to that, he was the representative director of the Seoul Philharmonic Orchestra, chief executive officer of Woori Securities and executive managing director of Hanil Bank. Mr. Lee holds a Bachelor of Law from Korea University.
Outside Directors
Our outside directors are selected based on their experience and knowledge in diverse areas, which include law, finance, economics, management and accounting. We currently have seven outside directors. All were nominated by the Outside Director Candidate Recommendation Committee and approved by our shareholders.
Our outside directors are as follows:
| Name |
Age | Position | Director Since | Year
Term Ends(1) |
||||||||||||
| Hyung-Goo Lee |
49 | Outside Director | March 30, 2012 | 2014 | ||||||||||||
| Yong-Man Rhee |
78 | Outside Director | March 25, 2011 | 2013 | ||||||||||||
| John Ji Whan Park |
44 | Outside Director | March 25, 2011 | 2013 | ||||||||||||
| Doo-Hee Lee |
55 | Outside Director | March 27, 2009 | 2013 | ||||||||||||
| Hun Lee |
50 | Outside Director | March 27, 2009 | 2013 | ||||||||||||
| Min-Joon Bang |
61 | Outside Director | March 28, 2008 | 2013 | ||||||||||||
| Hi-Taek Shin |
59 | Outside Director | March 28, 2008 | 2013 | ||||||||||||
| (1) | The date on which each term will end will be the date of the general stockholders’ meeting in the relevant year. |
Hyung-Goo Lee was elected an outside director in March 2012. He is currently the director of the savings bank support department at the KDIC. He received a Bachelor of Law from Daegu University.
Yong-Man Rhee was elected as an outside director in March 2011. He is currently a member of the National Elders Committee of Korea, and was formerly the governor of the Bank Supervisory Service and the Minister of Finance of Korea. He received a Bachelor of Public Administration from Korea University and a Master of Public Administration from Seoul National University.
John Ji Whan Park was elected an outside director in March 2011. He is currently the representative director of Asia Evolution. He received a Bachelor of Arts in Economics from Brown University and a Master of Business Administration from Harvard University.
Doo-Hee Lee was elected an outside director in March 2009. He is currently the president of Asia-Pacific Association for International Education and a professor at the College of Business Administration, Korea University. He received a Bachelor of Business Administration from Korea University and a Master of and Ph.D. in Business Administration from Michigan State University.
Hun Lee was elected an outside director in March 2009. He is currently the co-head of The Lawyers for Citizens, and was formerly a lawyer at Barun Law. He received a Bachelor of Law from Chung-Ang University.
160
Table of Contents
Min-Joon Bang was elected an outside director in March 2008. He is currently an executive vice president of New Daily, and was formerly the Arbitration Commissioner of the Press Arbitration Commission and the head of the editorial desk at Korea Times. He received a Bachelor of Arts degree in Korean Language and Literature from Seoul National University.
Hi-Taek Shin was elected an outside director in March 2008. He is currently a professor at the College of Law at Seoul National University. He was formerly associated with Kim & Chang. He received a Bachelor and Master of Law from Seoul National University and a J.S.D. from Yale Law School.
If any director wishes to enter into a transaction with us in his or her personal capacity, he or she must obtain the prior approval of our board of directors. The director having an interest in the transaction may not vote at the meeting during which the board approves the transaction.
Executive Officers
In addition to the standing director who is also our executive officer, we currently have the following eight executive officers.
| Name |
Age | Position | ||||
| Hyun Jin Jung |
61 | Senior Managing Director | ||||
| Yang Jin Kim |
57 | Senior Managing Director | ||||
| Byoung Yoon Jeon |
58 | Senior Managing Director | ||||
| Rok Hwang |
57 | Senior Managing Director | ||||
| Joon Ho Kim |
59 | Senior Managing Director | ||||
| Hong Dall Kim |
53 | Managing Director | ||||
| Seong Kook Jo |
59 | Managing Director | ||||
| Chang Young Choi |
55 | Managing Director | ||||
Hyun Jin Jung serves as a senior managing director in charge of management planning, financial planning, financial accounting, audit and management inspection, strategic planning and global business. Prior to that, he was an executive vice president of Woori Bank. He holds a Bachelor of Business Administration from Seoul National University.
Yang Jin Kim serves as a senior managing director in charge of synergy promotion. He also serves as a deputy president of Woori Bank. Prior to that, he was an executive vice president of Woori Bank. He holds a Bachelor of Arts in Agricultural Economics from Seoul National University.
Byoung Yoon Jeon serves as a senior managing director in charge of management support. Prior to that, he was the head of operations of Seoul Philharmonic Ochestra. He holds a Bachelor of Arts in English Literature from Sogang University.
Rok Hwang serves as a senior managing director in charge of future strategy. Prior to that, he was an executive vice president of Woori Bank. He holds a Bachelor of Business Administration from Korea University.
Joon Ho Kim serves as a senior managing director in charge of risk management. Prior to that, he was an internal auditor of the Industrial Bank of Korea. He holds a Bachelor of Business Administration from Korea University and a Master of Business Administration from Georgia State University.
Hong Dall Kim serves as a managing director in charge of management research. Prior to that, he was a general manager of Woori Finance Holdings. He holds a Bachelor of Business Administration from Sogang University and a Master of Arts in Economics from Tsukuba University, Japan.
Seong Kook Jo serves as a managing director in charge of audit and management inspection. Prior to that, he was a senior general manager of Woori Bank. He holds a Bachelor of Science in Agricultural Chemistry from Korea University.
Chang Young Choi serves as a managing director in charge of compliance. Prior to that, he was a regional sales center head of Woori Bank. He holds a Bachelor of Law from Yonsei University.
161
Table of Contents
None of the executive officers is involved in any significant business activities outside Woori Finance Holdings and our subsidiaries.
| Item 6B. | Compensation |
The aggregate remuneration and benefits-in-kind we paid in 2011 to our chairman and chief executive officer, our outside directors and our other executive officers was (Won)3,197 million. In 2011, we recorded additional provisions of (Won)419 million for allowances for severance and retirement benefits for those directors and officers. We do not have service contracts with any of these directors or officers that provide for benefits if employment with us is terminated.
In 2011, we did not grant any stock options and, accordingly, did not recognize any compensation expense for stock options granted under our stock option plan. As of the date of this annual report, we do not have any stock options outstanding.
| Item 6C. | Board Practices |
See “Item 6A. Directors and Senior Management—Board of Directors” and “Item 6B. Compensation” for information concerning the terms of office and contractual employment arrangements with our directors and executive officers.
Committees of the Board of Directors
We currently have nine committees that serve under the board:
| • | the Management Committee; |
| • | the Business Development and Compensation Committee; |
| • | the Risk Management Committee; |
| • | the Audit Committee; |
| • | the Standing Directors Committee; |
| • | the Ethics Committee; |
| • | the Outside Directors Recommendation Committee; |
| • | the MOU Evaluation Committee; and |
| • | the Audit Committee Member Candidate Recommendation Committee. |
The board appoints each member of these committees except for members of the Audit Committee, who are elected by our stockholders at the annual general meeting.
Management Committee
This committee consists of one standing director and four outside directors: Pal Seung Lee, Yong-Man Rhee, Doo-Hee Lee, Min Joon Bang and Hi Taek Shin. The chairman is Pal Seung Lee. This committee, which functions as a steering committee, enables broad management oversight of our operations. It is responsible for the following:
| • | setting rules and procedures for operations of our board and its various committees; |
| • | resolving issues relating to critical management-related matters like restructuring; |
| • | formulating management strategies and policies; and |
| • | determining policies to enhance our corporate governance structure. |
This committee holds regular meetings every six months.
162
Table of Contents
Business Development and Compensation Committee
This committee consists of four outside directors: Yong-Man Rhee, Min-Joon Bang, Doo-Hee Lee and John Ji Whan Park. The chairman is Yong-Man Rhee. It is responsible for all matters relating to the following:
| • | management’s performance in developing our business; |
| • | setting goals and targets with respect to and evaluating executive performance; and |
| • | fixing executive compensation, including incentives and bonuses. |
This committee holds regular meetings every six months.
Risk Management Committee
This committee consists of one standing director, one financial officer and four outside directors: Pal Seung Lee, Hyung-Goo Lee, Min-Joon Bang, Hun Lee and John Ji Whan Park. The chairman is Pal Seung Lee. It oversees and makes determinations on all issues relating to our group-wide, standardized risk management system. It implements policies regarding, monitors and has ultimate responsibility for managing credit, market and liquidity risk and asset and liability management. The major roles of the Group Risk Management Committee include:
| • | determining and amending risk management policies, guidelines and limits in conformity with the strategy established by the board of directors; |
| • | determining the appropriate level of risks that we should be willing to undertake; |
| • | allocating risk capital to each subsidiary and setting our subsidiaries’ risk limits; |
| • | reviewing our group-wide risk profile, including the level of risks we are exposed to and the status of our risk management operations; and |
| • | monitoring our subsidiaries’ compliance with our risk policies. |
The Group Risk Management Committee regularly receives reports from the Group Risk Management Council as well as the Group Risk Management Department, which in turn receives reports from the subsidiary level risk management committees and units. See “Item 11. Quantitative and Qualitative Disclosures about Market Risk.” The committee holds regular meetings every three months.
Audit Committee
This committee consists of five outside directors: Yong-Man Rhee, Hyung-Goo Lee, Hun Lee, Hi-Taek Shin and Doo-Hee Lee. The chairman is Hi-Taek Shin. It reviews all audit and compliance-related matters and makes recommendations to our board. This committee also is responsible for the following:
| • | formulating, executing, evaluating and managing internal audit plans (including the financial and operational audits); |
| • | approving the appointment and dismissal of the head of the audit team; |
| • | approving the appointment of external auditors and evaluating the activities carried out by external auditors; |
| • | formulating appropriate measures to correct problems identified from internal audits; |
| • | overseeing the reporting systems within our holding company structure and all disclosure rules and requirements to ensure compliance with applicable regulations; and |
| • | examining internal procedures or making decisions on material matters that are related to audits as determined by the regulatory authorities, our board or other committees. |
163
Table of Contents
This committee also makes recommendations on regulatory issues to the Financial Supervisory Service, if and when deemed necessary. In addition, in connection with general meetings of stockholders, the committee examines the agenda for, and financial statements and other reports to be submitted by, the board of directors to each general meeting of stockholders. The internal and external auditors report directly to the Audit Committee chairman. Our external auditor is invited to attend meetings of this committee when needed or when matters pertaining to the audit are discussed. The subsidiary-level Audit Committees, which review subsidiary-level internal practices, report to the Audit Council that in turn reports to this committee.
The committee holds regular meetings every three months.
Standing Directors Committee
This committee currently consists of our standing director, Pal Seung Lee, who is the chairman. This committee is an operational committee that oversees decisions with respect to our operational and management matters. The committee holds meetings whenever it is deemed necessary.
Ethics Committee
This committee consists of one standing director and four outside directors: Pal Seung Lee, Min-Joon Bang, Hyung-Goo Lee, Hun Lee and John Ji Whan Park. The chairman is Min-Joon Bang. It is responsible for the following:
| • | implementing our code of ethics and amending it when necessary; |
| • | managing our ethics policies, including developing procedures and standards of conduct to ensure compliance; and |
| • | evaluating our performance under our code of ethics. |
This committee holds regular meetings every year.
Outside Directors Recommendation Committee
This committee consists of one standing director and five outside directors: Pal Seung Lee, Hyung-Goo Lee, John Ji Whan Park, Doo-Hee Lee, Hi-Taek Shin and Hun Lee. The chairman is Doo-Hee Lee. It is responsible for the following:
| • | searching for potential outside director candidates; and |
| • | reviewing and nominating outside director candidates. |
This committee holds meetings when an outside director needs to be appointed.
MOU Evaluation Committee
This committee consists of the entire board of directors: Pal Seung Lee, Yong-Man Rhee, Hyung-Goo Lee, John Ji Whan Park, Doo-Hee Lee, Hun-Lee, Min-Joon Bang and Hi-Taek Shin. The chairman is Pal Seung Lee. It is responsible for the following:
| • | evaluating MOU target attainment performances of us and our subsidiaries; and |
| • | overseeing and managing the MOU steering committee. |
This committee holds regular meetings every three months.
Audit Committee Member Candidate Recommendation Committee
This committee, which was first formed in January 2008, consists of seven outside directors: Yong-Man Rhee, Hyung-Goo Lee, John Ji Whan Park, Doo-Hee Lee, Hun Lee, Min-Joon Bang and Hi-Taek Shin. The chairman is Doo-Hee Lee. This committee holds meetings when an audit committee member needs to be appointed.
164
Table of Contents
| Item 6D. | Employees |
As of December 31, 2011, we had a total of 171 full-time employees, including nine officers, at our financial holding company. The following table sets forth information regarding our employees at both our financial holding company and our subsidiaries as of the dates indicated:
| As of December 31, | ||||||||||||
| 2009 | 2010 | 2011 | ||||||||||
| Full-time employees |
21,108 | 21,483 | 22,163 | |||||||||
| Contractual employees |
4,133 | 4,255 | 4,983 | |||||||||
|
|
|
|
|
|
|
|||||||
| Total |
25,241 | 25,738 | 27,146 | |||||||||
|
|
|
|
|
|
|
|||||||
At the holding company level, our employees do not currently have a union and none of such employees are members of an outside labor union. At each of our subsidiaries, our employees have a labor union, and approximately 63.0% of the employees of our subsidiaries are members of the Korea Financial Industry Union or other labor unions. Since we were established in April 2001, neither we nor any of our subsidiaries has had any significant labor disputes, although we have made certain concessions to our labor unions. See “Item 3D. Risk Factors—Other risks relating to our business—Labor union unrest may disrupt our operations and hinder our ability to continue to reorganize and integrate our operations.” We have placed a high priority on our relationship with our employees and on maintaining an atmosphere of trust and cooperation between our labor and management.
At the holding company level, our salary system with respect to our employees is based on a combination of the agreed-upon base salary and bonuses reflecting the work productivity of each employee. We believe that the salaries we pay to our employees and management are similar to those of other large financial institutions in Korea. We evaluate employees twice a year (usually in January and July), based on our business performance and evaluations provided by co-workers and superiors. With respect to our compensation program, we do not provide housing leases or loans to our employees.
We have introduced a “wage peak” system as a result of an agreement reached with our employees in 2005. Under the system, an employee’s wages reach a certain peak and then are gradually reduced as the employee reaches retirement age. This will allow the retirement age to be extended by two years to age 60 under the new system, while our employees’ wages would be cut incrementally from age 55. We believe that this system is beneficial both for us and our employees as it will encourage early retirements and reduce costs, while allowing employees to defer their retirement by two years. We are also planning to extend a performance-based pay system to all of our employees, as it currently applies only to those who are in the position of vice chief of a department or higher as well as certain departments (such as the Investment Finance department).
We have an employee stock ownership association, which purchases our shares at the request of our employees using their own funds. We do not provide any compensation benefits to employees through such purchases, although the association is entitled to certain pre-emptive rights. See “Item 10B. Memorandum and Articles of Association Pre-emptive Rights and Issuances of Additional Shares.”
At our subsidiaries, employee compensation is based on a combination of the agreed-upon base salary and bonuses. The bonus system is based on individual performance and business unit performance. We believe that our compensation package for our subsidiaries is similar to those institutions in the same industries. We provide a wide range of benefits to our employees, including medical insurance, employment insurance, workers compensation, life insurance, financial aid for children’s tuition, low-interest housing loans and pension plans.
In accordance with our internal policy and the Korean Labor Standard Law, employees with one year or more of service are entitled, upon termination of their employment, to receive a lump sum severance payment based upon the length of their service and the rate of pay at the time of termination. Such employees are entitled to receive a lump-sum equivalent to the average of 30 days’ pay for each year of service. We measure such accrued severance benefits using the projected unit method, which takes into account projected increases in earnings based on actuarial assumptions to provide an estimate of the future cash flows that will arise under the
165
Table of Contents
plan liabilities. As of December 31, 2011, accrued severance benefits were (Won)366 billion, which represented 100% of the amount required under Financial Services Commission guidelines. As of December 31, 2011, approximately 67.2% of accrued severance benefits were deposited with insurance companies and other banks. Under Korean law, we may not terminate full time employees except under certain circumstances.
In 2010 and 2011 we paid (Won)14 billion and (Won)35 billion, respectively, for the training of our employees in specialist areas by local and foreign training institutes.
| Item 6E. | Share Ownership |
Common Stock
As of April 20, 2012, the persons who are currently our directors or executive officers, as a group, held an aggregate of 68,500 shares of our common stock. None of these persons individually held more than 1% of our outstanding common stock as of such date. The following table presents information regarding our directors and executive officers who beneficially owned our shares as of April 20, 2012.
| Name of Executive Officer or Director |
Number of Shares of Common Stock |
|||
| Pal Seung Lee |
68,500 | |||
|
|
|
|||
| Total |
68,500 | |||
|
|
|
|||
Stock Options
As of December 31, 2011, our directors and executive officers did not hold any stock options. As of the date of this annual report, we do not have any stock options outstanding.
| Item 7. | MAJOR STOCKHOLDERS AND RELATED PARTY TRANSACTIONS |
| Item 7A. | Major Stockholders |
The following table presents information regarding the beneficial ownership of our shares at April 20, 2012 by each person or entity known to us to own beneficially more than 5% of our outstanding shares:
Except as otherwise indicated, each stockholder identified by name has:
| • | sole voting and investment power with respect to its shares; and |
| • | record and beneficial ownership with respect to its shares. |
| Beneficial Owner |
Number of Shares of Common Stock |
Percentage of Total Shares of Common Stock |
Percentage of Total Shares on a Fully Diluted Basis |
|||||||||
| KDIC |
459,198,609 | 56.97 | 56.97 | |||||||||
As of April 20, 2012, our chairman and chief executive officer owned 68,500 shares of our common stock. None of our executive officers (excluding our chairman and chief executive officer) and our outside directors owned any shares of our common stock.
Other than as set forth above, no other person or entity known by us to be acting in concert, directly or indirectly, jointly or separately, owned 5.0% or more of the outstanding shares of our common stock or exercised control or could exercise control over us as of April 20, 2012.
| Item 7B. | Related Party Transactions |
We regularly engage in transactions with entities affiliated with the government, which as of April 20, 2012 owned 56.97% of our shares through the KDIC. Generally, these transactions include the extension of loans, the purchase of debt securities and other ordinary course activities relating to our banking business. For a description of such transactions, see “Item 4B. Business Overview—Assets and Liabilities.”
166
Table of Contents
We and our subsidiaries have entered into memoranda of understanding with the KDIC, under which we and our subsidiaries must meet business normalization targets or specific financial targets, or the KDIC has the right to impose sanctions on our directors or employees or to require us or our subsidiaries to take certain actions. See “Item 4A. History and Development of the Company—History—Relationship with the Korean Government.” In addition, as of December 31, 2011, we owned (Won)953 billion of debentures issued by the KDIC, representing 1.6% of our investment securities.
In 2008, we entered into three loan agreements with Woori Financial, our subsidiary, to lend an aggregate of (Won)170 billion. As of April 2, 2012, (Won)1 billion of such loans remained outstanding to Woori Financial.
As of December 31, 2011, we had loans outstanding to our executive officers and directors in the aggregate amount of (Won)1,186 million.
All of these loans were made in the ordinary course of business, on substantially the same terms, including interest rates and collateral, as those prevailing at the time for comparable transactions with other persons and did not involve more than the normal risk of collectibility or present other unfavorable features.
None of our directors or officers have or had any interest in any transactions effected by us that are or were unusual in their nature or conditions or significant to our business which were effected during the current or immediately preceding year or were effected during an earlier year and remain in any respect outstanding or unperformed.
| Item 7C. | Interest of Experts and Counsel |
Not Applicable
| Item 8. | FINANCIAL INFORMATION |
| Item 8A. | Consolidated Statements and Other Financial Information |
See “Item 18. Financial Statements” and pages F-1 through F-122.
Legal Proceedings
As a financial institution with diverse operations, we are subject to legal proceedings and regulatory actions in the ordinary course of our business.
Woori Bank
Commencing in 2005, Woori Bank marketed and sold investment fund products known as the “Woori Power Income Funds,” created and managed by Woori Asset Management, to customers in Korea. The funds have experienced significant declines in value, principally as a result of investments made in securities and derivative instruments of troubled financial institutions in the U.S. and elsewhere. In November 2008, in response to complaints filed by customers who suffered losses as a result of their investment in these products, the Financial Supervisory Service ruled that Woori Bank should compensate such customers for 30% to 50% of the investment losses they suffered due to its failure to adequately disclose the risks associated with an investment in the products. However, certain customers who invested in these products through Woori Bank have opted to instead file lawsuits against Woori Bank based on its alleged failure to adequately disclose such risks, in order to obtain higher levels of compensation. As of April 2, 2012, nine such lawsuits were pending and the aggregate amount claimed against Woori Bank in such lawsuits was approximately (Won)7 billion. In two of such lawsuits, which were both pending before the appellate courts in Korea following appeals by both the plaintiffs and Woori Bank, the trial courts ruled that Woori Bank was liable for damages equal to approximately 20% to 40% of the losses suffered by the plaintiffs. As of the same date, three of such lawsuits were pending before the Supreme Court of Korea, two of which were appealed by the plaintiffs after the appellate courts held that the defendants (including Woori Bank) were jointly liable for damages equal to approximately 10% to 40% of the losses suffered by the plaintiffs, while one was appealed by the defendants after the appellate court held that the
167
Table of Contents
defendants (including Woori Bank) were liable for damages equal to approximately 70% of the losses suffered by the plaintiffs. Through April 2, 2012, the aggregate amount of compensation payments made to customers by Woori Bank in relation to such products, including payments made in accordance with the Financial Supervisory Service’s ruling as well as lawsuits filed by customers, was (Won)22 billion. In addition, certain of Woori Bank’s customers have filed lawsuits against it in connection with certain other investment fund products created and managed by Woori Asset Management and sold by Woori Bank to customers in Korea, including those which had invested in certain equity-linked securities issued by Lehman Brothers and incurred significant losses following the Lehman Brothers bankruptcy. See “—Woori Asset Management”. As of April 2, 2012, five such lawsuits were pending and the aggregate amount claimed against Woori Bank in such lawsuits was approximately (Won)17 billion. The trial court ruled for Woori Bank in one such lawsuit, which was appealed by the plaintiffs, while four lawsuits are still pending in the trial court. In 2011, the appellate court also ruled in favor of Woori Bank in the case appealed by the plaintiffs. Additional lawsuits may be filed against Woori Bank with respect to its sales of such products, and the final outcome of such litigation remains uncertain.
In 2008, certain of Woori Bank’s customers filed lawsuits against it in connection with its sales of foreign currency derivatives products known as “KIKO” (which stands for “knock-in knock-out”), which are intended to operate as hedging instruments against fluctuations in the exchange rate between the Won and the U.S. dollar. Due to the significant depreciation of the Won against the U.S. dollar in 2008 and 2009, customers who purchased KIKO products from Woori Bank were required to make large payments to it. Seven companies have filed lawsuits against Woori Bank alleging that the contracts under which the relevant KIKO products were sold by Woori Bank should be nullified and that Woori Bank should return payments received thereunder. As of April 2, 2012, one such lawsuit was pending at the trial court, three were pending in the appellate court following appeals by the plaintiffs after trial court decisions in favor of Woori Bank, and one was pending at the Supreme Court of Korea following appeal by the plaintiffs after both the trial court and the appellate court ruled in favor of Woori Bank. The aggregate amount of such claims, as of April 2, 2012, was approximately (Won)48 billion, and such amount may increase as the lawsuits progress or in the event of further depreciation of the Won against the U.S. dollar. Additional lawsuits may be filed against Woori Bank with respect to KIKO products, and the final outcome of such litigation remains uncertain.
Kwangju Bank
On October 24, 2001, The Export-Import Bank of Korea filed a lawsuit in Seoul District Court against Kwangju Bank with respect to its obligations relating to a certificate of guarantee to be issued on behalf of Daewoo Corporation in favor of The Export-Import Bank of Korea in the amount of US$100 million, of which Kwangju Bank’s exposure amounts to US$41 million. In December 2003, the Seoul District Court ruled against Kwangju Bank and required it to issue a certificate of guarantee on behalf of Daewoo Corporation in favor of The Export-Import Bank of Korea. Kwangju Bank appealed this decision to the Seoul High Court, which dismissed the appeal in December 2005. Kwangju Bank appealed the decision of the appellate court to the Supreme Court of Korea in January 2006, and the Supreme Court dismissed such appeal in July 2006. Subsequently, The Export-Import Bank of Korea filed an additional lawsuit in the Seoul District Court in December 2006 requesting monetary damages in satisfaction of Kwangju Bank’s obligations relating to the certificate of guarantee. Following a decision by the trial court in August 2008 ordering Kwangju Bank to pay US$41 million of monetary damages to The Export-Import Bank of Korea and Kwangju Bank’s subsequent appeal of the trial court decision, the appellate court ruled in favor of The Export-Import Bank of Korea in December 2009 but reduced the amount of monetary damages payable by Kwangju Bank to US$35 million. Such appellate court decision was appealed by both The Export-Import Bank of Korea and Kwangju Bank to the Supreme Court of Korea in January 2010, where the case is currently pending.
Kyongnam Bank
From December 2008 to April 2010, certain employees of Kyongnam Bank colluded with several other parties to engage in various fraudulent transactions ostensibly on behalf of Kyongnam Bank, including providing to certain banks and companies commitments to purchase loans, guarantees for trusts and other payment
168
Table of Contents
guarantees. Based on our investigation, we believe that our total potential exposure under such fraudulent transactions is approximately (Won)325 billion. A number of the counterparties to such fraudulent transactions have demanded that Kyongnam Bank fulfill its alleged obligations under such transactions but Kyongnam Bank has refused to accede to such demands. As of April 2, 2012, 20 counterparties had filed lawsuits against Kyongnam Bank with respect to such transactions. The aggregate amount claimed in such lawsuits was (Won)353 billion. Additional lawsuits may be filed against Kyongnam Bank with respect to such transactions, and the final outcome of such litigation remains uncertain. In addition, in October 2010, as a result of such fraudulent transactions and their potential impact on Kyongnam Bank, the KDIC imposed an institutional warning on Kyongnam Bank, as well as reprimands and warnings on ten former and current executive officers of Kyongnam Bank. Furthermore, in October 2010, the Financial Services Commission suspended Kyongnam Bank from accepting new specified money trust accounts for three months and imposed reprimands and warnings on 22 executive officers and employees of Kyongnam Bank in connection with the same incident, as well as ordering the dismissal of three employees who were principally involved in the incident. See “Item 3D. Risk Factors—Other risks relating to our business—Our failure to meet the financial and other business targets set forth in current terms of the memoranda of understanding among us, our subsidiaries and the KDIC may result in substantial harm to us or our subsidiaries” and “Item 3D. Risk Factors—Risks relating to government regulation and policy—The Financial Services Commission may impose burdensome measures on us if it deems us or one of our subsidiaries to be financially unsound.”
Woori Asset Management
Commencing in 2008, certain of Woori Asset Management’s customers have filed lawsuits against it in connection with certain investment fund products created and managed by Woori Asset Management and sold to customers in Korea, including those which had invested in certain equity-linked securities issued by Lehman Brothers and incurred significant losses following the Lehman Brothers bankruptcy. Woori Bank, which sold some of such products, was also named as a defendant in certain of those lawsuits. See “—Woori Bank”. In 2011, the appellate court ruled in the favor of Woori Asset Management in one of such lawsuits, which was not appealed by the plaintiffs. As of April 2, 2012, there were nine such lawsuits pending. The trial courts ruled in favor of the plaintiffs in two of the nine pending suits, one of which remains pending before the appellate court while the other has been appealed to the Supreme Court by Woori Asset Management after a ruling in favor of the plaintiffs by the appellate court. Another lawsuit is currently pending in the appellate court following the trial court’s decision in the favor of Woori Asset Management, and six other lawsuits are currently pending before the trial courts. The aggregate amount of such claims, as of April 2, 2012 was (Won)37 billion. Additional lawsuits may be filed against Woori Asset Management with respect to its management of such products, and the final outcome of such litigation remains uncertain.
In addition, in connection with the “Woori Power Income Funds” investment fund products created and managed by Woori Asset Management and marketed and sold by Woori Bank and other financial institutions to customers in Korea, certain such customers have filed lawsuits against Woori Asset Management and, in certain of those cases, against Woori Bank as well. See “—Woori Bank.” As of April 2, 2012, 15 such lawsuits were pending against Woori Asset Management, and the aggregate amount claimed against Woori Asset Management in such lawsuits was approximately (Won)9 billion. Three of such lawsuits were pending before the Supreme Court, two of which were appealed by the plaintiffs after the appellate courts held that the defendants (including Woori Asset Management) were jointly liable for damages equal to 10% to 40% of the losses suffered by the plaintiffs, while one was appealed by the defendants after the appellate court held that the defendants (including Woori Asset Management) were liable for damages equal to 70% of the losses suffered by the plaintiffs. As of the same date, six additional suits were pending before appellate courts, four of which were as a result of the Supreme Court remanding the case to appellate courts, while the other two cases were appealed by the plaintiffs after the trial courts held that the defendants (including Woori Asset Management) were jointly liable for damages equal to 20% to 40% of the losses suffered by the plaintiffs. In addition, there were six other lawsuits pending before trial courts. Additional lawsuits may be filed against Woori Asset Management with respect to its management of such products, and the final outcome of such litigation remains uncertain.
169
Table of Contents
Other than the legal proceedings discussed above, we and our subsidiaries are not a party to any legal or administrative proceedings and no proceedings are known by us to be contemplated by governmental authorities or third parties, which, if adversely determined, may have a material adverse effect on our financial condition or results of operations.
Dividends
We declare our dividend annually at the annual general meeting of stockholders. We generally hold this meeting within three months after the end of each fiscal year. We must pay the annual dividend to the stockholders of record as of the end of the preceding fiscal year within one month after that meeting. We can distribute the annual dividend either in cash or in stock. Cash dividends may be paid out of retained earnings that have not been appropriated to statutory reserves. See “Item 4B. Business Overview—Supervision and Regulation—Principal Regulations Applicable to Financial Holding Companies—Capital Adequacy.”
The table below sets forth the dividend per share of common stock and the total amount of dividends declared by us in respect of the years ended December 31, 2010 and 2011. The dividends set forth below with respect to each year were declared, paid and recorded in the following year.
| Fiscal year |
Dividends Per Common Share |
Dividends Per Preferred Share |
Total Amount Of Cash Dividends Paid |
|||||||||
| (in Won) | (in millions of Won) | |||||||||||
| 2010 |
250 | — | 201,503 | |||||||||
| 2011 |
250 | — | 201,503 | |||||||||
Future dividends will depend upon our revenues, cash flow, financial condition and other factors. As an owner of ADSs, you will be entitled to receive dividends payable in respect of the shares of common stock represented by such ADSs.
For a description of the tax consequences of dividends paid to our shareholders, see “Item 10E. Taxation—United States Taxation—Dividends” and “—Korean Taxation—Taxation Dividends.”
| Item 8B. | Significant Changes |
Not Applicable
| Item 9. | THE OFFER AND LISTING |
| Item 9A. | Offering and Listing Details |
Market Price Information
The principal trading market for our common stock is the KRX KOSPI Market. Our common stock, which is in registered form and has a par value of (Won)5,000 per share of common stock, has been listed on the KRX KOSPI Market since June 24, 2002 under the identifying code 053000. As of the date of this annual report, we have 806,013,341 shares of common stock outstanding. Our ADSs have been listed on the New York Stock Exchange and are identified by the symbol “WF” since September 29, 2003 under the CUSIP number 981063100.
170
Table of Contents
The table below sets forth, for the periods indicated, the high and low closing prices and the average daily volume of trading activity on the KRX KOSPI Market for our common stock, and their high and low closing prices and the average daily volume of trading activity on the New York Stock Exchange for our ADSs.
| KRX KOSPI Market | New York Stock Exchange(1) | |||||||||||||||||||||||
| Closing Price Per Common Stock |
Average Daily Trading Volume |
Closing Price Per ADS |
Average Daily Trading Volume |
|||||||||||||||||||||
| High | Low | High | Low | |||||||||||||||||||||
| (in thousands of shares) | (in shares) | |||||||||||||||||||||||
| 2007 |
25,800 | 16,500 | 3,320 | 83.79 | 51.71 | 11,033 | ||||||||||||||||||
| 2008 |
20,950 | 5,050 | 5,368 | 62.04 | 8.72 | 12,759 | ||||||||||||||||||
| 2009 |
||||||||||||||||||||||||
| First Quarter |
8,770 | 5,770 | 10,051 | 19.29 | 10.56 | 14,764 | ||||||||||||||||||
| Second Quarter |
12,850 | 7,160 | 11,311 | 29.90 | 16.75 | 18,437 | ||||||||||||||||||
| Third Quarter |
16,950 | 10,700 | 5,708 | 43.29 | 25.10 | 7,702 | ||||||||||||||||||
| Fourth Quarter |
16,900 | 13,300 | 4,561 | 43.78 | 35.00 | 10,589 | ||||||||||||||||||
| 2010 |
||||||||||||||||||||||||
| First Quarter |
16,800 | 12,950 | 3,680 | 44.10 | 33.05 | 9,320 | ||||||||||||||||||
| Second Quarter |
18,300 | 14,600 | 6,719 | 49.68 | 35.02 | 6,327 | ||||||||||||||||||
| Third Quarter |
15,400 | 13,150 | 3,938 | 38.79 | 33.19 | 4,872 | ||||||||||||||||||
| Fourth Quarter |
15,700 | 13,300 | 4,716 | 42.50 | 34.34 | 18,390 | ||||||||||||||||||
| 2011 |
||||||||||||||||||||||||
| First Quarter |
15,900 | 13,450 | 4,498 | 42.9 | 36.3 | 17,911 | ||||||||||||||||||
| Second Quarter |
15,400 | 12,400 | 3,800 | 42.4 | 34.4 | 19,227 | ||||||||||||||||||
| Third Quarter |
14,500 | 8,500 | 3,450 | 41.1 | 22.2 | 10,252 | ||||||||||||||||||
| Fourth Quarter |
11,200 | 9,100 | 2,927 | 30.5 | 23.0 | 12,492 | ||||||||||||||||||
| 2012 (through April 20) |
||||||||||||||||||||||||
| January |
11,100 | 9,210 | 2,392 | 29.8 | 23.9 | 11,945 | ||||||||||||||||||
| February |
12,550 | 10,900 | 3,360 | 33.8 | 29.5 | 7,540 | ||||||||||||||||||
| March |
13,750 | 11,500 | 2,418 | 36.1 | 30.8 | 28,173 | ||||||||||||||||||
| April (through April 20) |
13,600 | 12,000 | 2,156 | 36.18 | 31.83 | 14,520 | ||||||||||||||||||
Source: KRX KOSPI Market; New York Stock Exchange.
| (1) | Each ADS represents the right to receive three shares of our common stock. Trading of our ADSs on the New York Stock Exchange commenced on September 29, 2003. |
| Item 9B. | Plan of Distribution |
Not Applicable
| Item 9C. | Markets |
The KRX KOSPI Market, formerly known as the Stock Market Division of the Korea Exchange, began its operations in 1956. Currently it is the only stock exchange in Korea. It has a single trading floor located in Seoul. The KRX KOSPI Market is a membership organization consisting of most of the Korean securities companies and some Korean branches of foreign securities companies.
As of December 31, 2011, the aggregate market value of equity securities listed on the KRX KOSPI Market was approximately (Won)1,042 trillion. The average daily trading volume of equity securities for 2011 was approximately 354 million shares with an average transaction value of (Won)6,863 billion.
The KRX KOSPI Market has the power in some circumstances to suspend trading in the shares of a given company or to de-list a security pursuant to the Listing Regulation of the KRX KOSPI Market. The KRX KOSPI Market also restricts share price movements. All listed companies are required to file accounting reports annually, semiannually and quarterly and to release immediately all information that may affect trading in a security.
171
Table of Contents
The KRX KOSPI Market publishes the KOSPI, which is an index of all equity securities listed on the KRX KOSPI Market, every ten seconds. On January 1, 1983, the method of computing KOSPI was changed from the Dow Jones method to the aggregate value method. In the new method, the market capitalizations of all listed companies are aggregated, subject to certain adjustments, and this aggregate is expressed as a percentage of the aggregate market capitalization of all listed companies as of the base date, January 4, 1980.
The following table sets out movements in KOSPI:
| Opening | High | Low | Closing | |||||||||||||
| 1982 |
123.60 | 134.48 | 105.99 | 128.99 | ||||||||||||
| 1983 |
122.52 | 134.46 | 115.59 | 121.21 | ||||||||||||
| 1984 |
115.25 | 142.46 | 115.25 | 142.46 | ||||||||||||
| 1985 |
139.53 | 163.37 | 131.40 | 163.37 | ||||||||||||
| 1986 |
161.40 | 279.67 | 153.85 | 272.61 | ||||||||||||
| 1987 |
264.82 | 525.11 | 264.82 | 525.11 | ||||||||||||
| 1988 |
532.04 | 922.56 | 527.89 | 907.20 | ||||||||||||
| 1989 |
919.61 | 1,007.77 | 844.75 | 909.72 | ||||||||||||
| 1990 |
908.59 | 928.82 | 566.27 | 696.11 | ||||||||||||
| 1991 |
679.75 | 763.10 | 586.51 | 610.92 | ||||||||||||
| 1992 |
624.23 | 691.48 | 459.07 | 678.44 | ||||||||||||
| 1993 |
697.41 | 874.10 | 605.93 | 866.18 | ||||||||||||
| 1994 |
879.32 | 1,138.75 | 855.37 | 1,027.37 | ||||||||||||
| 1995 |
1,013.57 | 1,016.77 | 847.09 | 882.94 | ||||||||||||
| 1996 |
888.85 | 986.84 | 651.22 | 651.22 | ||||||||||||
| 1997 |
653.79 | 792.29 | 350.68 | 376.31 | ||||||||||||
| 1998 |
385.49 | 579.86 | 280.00 | 562.46 | ||||||||||||
| 1999 |
587.57 | 1,028.07 | 498.42 | 1,028.07 | ||||||||||||
| 2000 |
1,059.04 | 1,059.04 | 500.60 | 504.62 | ||||||||||||
| 2001 |
520.95 | 704.50 | 468.76 | 693.70 | ||||||||||||
| 2002 |
724.95 | 937.61 | 584.04 | 627.55 | ||||||||||||
| 2003 |
635.17 | 822.16 | 515.24 | 810.71 | ||||||||||||
| 2004 |
821.26 | 936.06 | 719.59 | 895.92 | ||||||||||||
| 2005 |
893.71 | 1,379.37 | 870.84 | 1,379.37 | ||||||||||||
| 2006 |
1,389.27 | 1,464.70 | 1,203.86 | 1,434.46 | ||||||||||||
| 2007 |
1,435.26 | 2,064.85 | 1,355.79 | 1,897.13 | ||||||||||||
| 2008 |
1,853.45 | 1,888.88 | 938.75 | 1,124.47 | ||||||||||||
| 2009 |
1,132.87 | 1,723.17 | 992.69 | 1,682.77 | ||||||||||||
| 2010 |
1,681.71 | 2,052.97 | 1,548.78 | 2,051.00 | ||||||||||||
| 2011 |
2,063.69 | 2,231.74 | 1,644.11 | 1,825.74 | ||||||||||||
| 2012 (through April 20) |
1,831.69 | 2,049.28 | 1,826.37 | 1.974.65 | ||||||||||||
Source: The KRX KOSPI Market
Shares are quoted “ex-dividend” on the first trading day of the relevant company’s accounting period. Since the calendar year is the accounting period for the majority of listed companies, this may account for the drop in KOSPI between its closing level at the end of one calendar year and its opening level at the beginning of the following calendar year.
172
Table of Contents
With certain exceptions, principally to take account of a share being quoted “ex-dividend” and “ex-rights,” permitted upward and downward movements in share prices of any category of shares on any day are limited under the rules of the KRX KOSPI Market to 15% of the previous day’s closing price of the shares, rounded down as set out below:
| Previous Day’s Closing Price (Won) |
Rounded Down To Won |
|||
| Less than 5,000 |
5 | |||
| 5,000 to less than 10,000 |
10 | |||
| 10,000 to less than 50,000 |
50 | |||
| 50,000 to less than 100,000 |
100 | |||
| 100,000 to less than 500,000 |
500 | |||
| 500,000 or more |
1,000 | |||
As a consequence, if a particular closing price is the same as the price set by the fluctuation limit, the closing price may not reflect the price at which persons would have been prepared, or would be prepared to continue, if so permitted, to buy and sell shares. Orders are executed on an auction system with priority rules to deal with competing bids and offers.
Due to deregulation of restrictions on brokerage commission rates, the brokerage commission rate on equity securities transactions may be determined by the parties, subject to commission schedules being filed with the KRX KOSPI Market by financial investment companies with a dealing and/or brokerage license. In addition, a securities transaction tax of 0.15% of the sales price will generally be imposed on the transfer of shares or certain securities representing rights to subscribe for shares. See “Item 3D. Risk Factors—Risks relating to our common stock and ADSs.” An agriculture and fishery special surtax of 0.15% of the sales prices will also be imposed on transfer of these shares and securities on the KRX KOSPI Market. See “Item 10E. Taxation—Korean Taxation.”
The number of companies listed on the KRX KOSPI Market, the corresponding total market capitalization at the end of the periods indicated and the average daily trading volume for those periods are set forth in the following table:
| Market Capitalization on the Last Day of Each Period |
Average Daily Trading Volume, Value | |||||||||||||||||||||||
| Year |
Number of Listed Companies |
(billions of (Won)) |
(millions of US$)(1) |
(thousands of Shares) |
(millions of (Won)) |
(thousands
of US$)(1) |
||||||||||||||||||
| 1982 |
334 | (Won) | 3,001 | US$ | 4,279 | 9,704 | (Won) | 6,667 | US$ | 9,507 | ||||||||||||||
| 1983 |
328 | 3,490 | 4,666 | 9,325 | 5,941 | 7,944 | ||||||||||||||||||
| 1984 |
336 | 5,149 | 6,434 | 14,847 | 10,642 | 13,301 | ||||||||||||||||||
| 1985 |
342 | 6,570 | 7,921 | 18,925 | 12,315 | 14,846 | ||||||||||||||||||
| 1986 |
355 | 11,994 | 13,439 | 31,755 | 32,870 | 36,830 | ||||||||||||||||||
| 1987 |
389 | 26,172 | 30,250 | 20,353 | 70,185 | 81,120 | ||||||||||||||||||
| 1988 |
502 | 64,544 | 81,177 | 10,367 | 198,364 | 249,483 | ||||||||||||||||||
| 1989 |
626 | 95,477 | 138,997 | 11,757 | 280,967 | 409,037 | ||||||||||||||||||
| 1990 |
669 | 79,020 | 115,610 | 10,866 | 183,692 | 268,753 | ||||||||||||||||||
| 1991 |
686 | 73,118 | 101,623 | 14,022 | 214,263 | 297,795 | ||||||||||||||||||
| 1992 |
688 | 84,712 | 110,691 | 24,028 | 308,246 | 402,779 | ||||||||||||||||||
| 1993 |
693 | 112,665 | 142,668 | 35,130 | 574,048 | 726,919 | ||||||||||||||||||
| 1994 |
699 | 151,217 | 185,657 | 36,862 | 776,257 | 953,047 | ||||||||||||||||||
| 1995 |
721 | 141,151 | 178,266 | 26,130 | 487,762 | 616,016 | ||||||||||||||||||
| 1996 |
760 | 117,370 | 151,289 | 26,571 | 486,834 | 627,525 | ||||||||||||||||||
| 1997 |
776 | 70,989 | 82,786 | 41,525 | 555,759 | 648,115 | ||||||||||||||||||
| 1998 |
748 | 137,799 | 81,297 | 97,716 | 660,429 | 389,634 | ||||||||||||||||||
| 1999 |
725 | 349,504 | 294,319 | 278,551 | 3,481,620 | 2,931,891 | ||||||||||||||||||
| 2000 |
704 | 188,042 | 166,703 | 306,163 | 2,602,211 | 2,306,925 | ||||||||||||||||||
| 2001 |
689 | 255,850 | 200,039 | 473,241 | 1,997,420 | 1,561,705 | ||||||||||||||||||
173
Table of Contents
| Market Capitalization on
the Last Day of Each Period |
Average Daily Trading Volume, Value | |||||||||||||||||||||||
| Year |
Number of Listed Companies |
(billions of (Won)) |
(millions of US$)(1) |
(thousands of Shares) |
(millions of (Won)) |
(thousands
of US$)(1) |
||||||||||||||||||
| 2002 |
683 | 258,681 | 217,379 | 857,245 | 3,041,598 | 2,308,789 | ||||||||||||||||||
| 2003 |
684 | 355,363 | 298,123 | 542,010 | 2,216,636 | 1,859,594 | ||||||||||||||||||
| 2004 |
683 | 412,588 | 398,597 | 372,895 | 2,232,108 | 2,156,418 | ||||||||||||||||||
| 2005 |
702 | 655,075 | 648,589 | 467,629 | 3,157,662 | 3,126,398 | ||||||||||||||||||
| 2006 |
731 | 704,588 | 757,621 | 279,096 | 3,435,180 | 3,693,742 | ||||||||||||||||||
| 2007 |
745 | 951,900 | 1,017,205 | 363,741 | 5,539,653 | 5,919,698 | ||||||||||||||||||
| 2008 |
763 | 576,888 | 457,122 | 355,205 | 5,189,644 | 4,112,238 | ||||||||||||||||||
| 2009 |
770 | 887,935 | 763,027 | 485,657 | 5,795,426 | 4,980,172 | ||||||||||||||||||
| 2010 |
777 | 1,141,885 | 981,254 | 380,859 | 5,619,768 | 4,829,224 | ||||||||||||||||||
| 2011 |
791 | 1,041,999 | 899,438 | 353,759 | 6,863.146 | 5,924,166 | ||||||||||||||||||
| 2012 (through April 20) |
789 | 1,135,853 | 998,026 | 513,848 | 5,702,784 | 5,010,793 | ||||||||||||||||||
| Source: | The KRX KOSPI Market |
| (1) | Converted at the noon buying rate of the Federal Reserve Bank of New York on the last business day of the period indicated. |
The Korean securities markets are principally regulated by the Financial Services Commission and the Financial Investment Services and Capital Markets Act, which replaced the Korean Securities and Exchange Act in February 2009. The Financial Investment Services and Capital Markets Act imposes restrictions on insider trading, price manipulation and deceptive action (including unfair trading), requires specified information to be made available by listed companies to investors and establishes rules regarding margin trading, proxy solicitation, takeover bids, acquisition of treasury shares and reporting requirements for stockholders holding substantial interests.
Protection of Customer’s Interest in Case of Insolvency of Financial Investment Companies with a Brokerage License
Under Korean law, the relationship between a customer and a financial investment company with a brokerage license in connection with a securities sell or buy order is deemed to be consignment and the securities acquired by a consignment agent (i.e., the financial investment company with a brokerage license) through such sell or buy order are regarded as belonging to the customer in so far as the customer and the consignment agent’s creditors are concerned. Therefore, in the event of a bankruptcy or reorganization procedure involving a financial investment company with a brokerage license, the customer of such financial investment company is entitled to the proceeds of the securities sold by such financial investment company.
When a customer places a sell order with a financial investment company with a brokerage license which is not a member of the KRX KOSPI Market, and such financial investment company places a sell order with another financial investment company with a brokerage license, which is a member of the KRX KOSPI Market, the customer is still entitled to the proceeds of the securities sold and received by the non-member company from the member company regardless of the bankruptcy or reorganization of the non-member company.
Under the Financial Investment Services and Capital Markets Act, the KRX KOSPI Market is obliged to indemnify any loss or damage incurred by a counterparty as a result of a breach by its members. If a financial investment company with a brokerage license that is a member of the KRX KOSPI Market breaches its obligation in connection with a buy order, the KRX KOSPI Market is obliged to pay the purchase price on behalf of the breaching member. Therefore, the customer can acquire the securities that have been ordered to be purchased by the breaching member.
When a customer places a buy order with a non-member company and the non-member company places a buy order with a member company, the customer has the legal right to the securities received by the non-member company from the member company because the purchased securities are regarded as belonging to the customer in so far as the customer and the non-member company’s creditors are concerned.
As the cash deposited with a financial investment company with a brokerage license is regarded as belonging to such financial investment company, which is liable to return the same at the request of its customer,
174
Table of Contents
the customer cannot take back deposited cash from such financial investment company if a bankruptcy or reorganization procedure is instituted against such financial investment company and, therefore, can suffer from loss or damage as a result. However, the Depositor Protection Act provides that the Korea Deposit Insurance Corporation will, upon the request of the investors, pay investors an amount equal to the full amount of cash deposited with a securities company prior to August 1, 1998 in case of the securities company’s bankruptcy, liquidation, cancellation of securities business license or other insolvency events. However, this indemnification was available only until the end of 2000. From 2001, the maximum amount to be paid to each customer is limited to (Won)50 million. Pursuant to the Financial Investment Services and Capital Markets Act, as amended, financial investment companies with a dealing and/or brokerage license are required to deposit the cash received from its customers to the extent the amount is not covered by the insurance with the Korea Securities Finance Corporation, a special entity established pursuant to the Financial Investment Services and Capital Markets Act. Set-off or attachment of cash deposits by such financial investment companies is prohibited. The premiums related to this insurance are paid by such financial investment companies.
Reporting Requirements for Holders of Substantial Interests
Any person who directly or beneficially owns shares of our common stock that have voting rights, whether in the form of shares, ADSs, certificates representing the rights to subscribe for shares or equity-related debt securities (including convertible bonds and bonds with warrants) (which we refer to collectively as “Equity Securities”) that, when taken together with the Equity Securities beneficially owned by specified related persons or by any person acting in concert with that person, account for 5% or more of our total issued and outstanding shares (plus the Equity Securities other than the shares held by such persons) must report that holding to the Financial Services Commission and the KRX KOSPI Market no more than five business days after reaching 5%. That person must also report any subsequent change in the ownership interest of 1% or more of our total outstanding shares (plus the Equity Securities other than the shares held by such persons) to the same entities no more than five business days after the change.
Anyone violating these reporting requirements may suffer criminal sanctions, including fines, imprisonment and/or a loss of voting rights with respect to the ownership of Equity Securities exceeding 5% of the total issued and outstanding Equity Securities with respect to which the reporting requirements were violated. Furthermore, the Financial Services Commission may order that person to dispose of the unreported Equity Securities.
In addition to the reporting requirements described above, any person whose direct or beneficial ownership of our stock accounts for 10% or more of the total issued and outstanding stock (which we refer to as a “major stockholder”) must report the status of its shareholding to the Korea Securities Futures Commission and the KRX KOSPI Market within five days after it becomes a major stockholder. In addition, the major stockholder must report any subsequent change in its ownership interest to those same entities within the 5th day of the occurrence of the change. A major stockholder that violates these reporting requirements may suffer criminal sanctions, including fines or imprisonment.
Pursuant to the Financial Holding Company Act, any single stockholder (together with any person considered to be a related party to that stockholder) that acquires more than 10% of the voting stock of a Korean financial holding company will be subject to approval requirements. See “Item 4B. Business Overview—Supervision and Regulation—Principal Regulations Applicable to Financial Holding Companies—Restriction on Ownership of a Financial Holding Company.”
Restrictions Applicable to ADSs
An investor does not need Korean governmental approval to sell or purchase our ADSs in the secondary market outside Korea or to withdraw shares of our common stock from our ADS deposit facility or deliver those withdrawn shares in Korea. However, a foreign investor who intends to acquire shares must obtain an investment registration card from the Financial Supervisory Service as described below. Either the foreign investor or its standing proxy in Korea must immediately report its acquisition of the shares to the governor of the Financial Supervisory Service.
175
Table of Contents
Persons who acquire shares of our common stock by withdrawing those shares from our ADS deposit facility may exercise their preemptive rights for new shares, participate in free distributions and receive dividends on shares without any further Korean governmental approval.
Restriction Applicable to Shares
As a result of amendments to the Foreign Exchange Transaction Laws and Financial Services Commission regulations (which we refer to collectively as the “Investment Rules”) adopted since January 1992 in connection with the opening and operation of Korea’s stock market, foreign investors may generally invest, with limited exceptions and subject to procedural requirements, in all shares of Korean companies, whether listed on the KRX KOSPI Market or registered on the KRX KOSDAQ Market. Foreign investors may trade shares listed on the KRX KOSPI Market or registered on the KRX KOSDAQ Market only through the KRX KOSPI Market or the KRX KOSDAQ Market, except in limited circumstances. These circumstances include:
| • | odd-lot share trading; |
| • | acquiring shares (which we refer to as “Converted Shares”) by exercising warrants, conversion rights or exchange rights under bonds with warrants, convertible bonds or exchangeable bonds or withdrawal rights under depositary receipts issued outside of Korea by a Korean company; |
| • | acquiring shares through inheritance, donation, bequest or exercise of stockholders’ rights, including pre-emptive rights or rights to participate in free distributions and receive dividends; |
| • | subject to certain exceptions, over-the-counter transactions between foreign investors of a class of shares for which the limit on aggregate acquisition by foreign investors, as explained below, has been reached or exceeded; and |
| • | sale and purchase of shares at fair value between foreigners who are part of an investor group comprised of foreign companies investing under the control of a common investment manager pursuant to applicable laws or contract. |
For over-the-counter transactions between foreign investors outside the KRX KOSPI Market or the KRX KOSDAQ Market involving a class of shares for which the limit on aggregate acquisition by foreign investors has been reached or exceeded, a financial investment company with a brokerage license in Korea must act as an intermediary. Odd-lot trading of shares outside the KRX KOSPI Market or the KRX KOSDAQ Market must involve a financial investment company with a dealing license in Korea as the other party. Foreign investors may not engage in margin transactions by borrowing shares from financial investment companies with a dealing and/or brokerage license with respect to shares that are subject to a foreign ownership limit.
The Investment Rules require a foreign investor who wishes to invest in shares on the KRX KOSPI Market or the KRX KOSDAQ Market (including Converted Shares and shares being issued for initial listing on the KRX KOSPI Market or registration on the KRX KOSDAQ Market) to register with the Financial Supervisory Service before making an investment. This registration requirement does not apply to foreign investors who acquire Converted Shares with the intention of selling the Converted Shares within three months from the acquisition date. The Financial Supervisory Service will issue an investment registration card to each registering foreign investor. This card must be presented each time the foreign investor opens a brokerage account with a financial investment company with a brokerage license. Foreign investors eligible to obtain an investment registration card include:
| • | foreign nationals who have not been residing in Korea for a consecutive period of six months or more; |
| • | foreign governments; |
| • | foreign municipal authorities; |
| • | foreign public institutions; |
| • | international financial institutions or similar international organizations; |
| • | corporations incorporated under foreign laws; and |
176
Table of Contents
| • | any person in any additional category designated by decree of the Ministry of Strategy and Finance under the Financial Investment Services and Capital Markets Act. |
All Korean offices of a foreign corporation (as a group) are treated as a separate foreign investor from the offices of the corporation outside Korea for these purposes. However, a foreign corporation or depositary issuing depositary receipts may obtain one or more investment registration cards in its name in certain circumstances identified in the relevant regulations.
When a foreign investor purchases shares through the KRX KOSPI Market or the KRX KOSDAQ Market, it need not make a separate report because the investment registration card system is designed to control and oversee foreign investment through a computer system. If, however, a foreign investor acquires or sells shares outside the KRX KOSPI Market or the KRX KOSDAQ Market, that investor or its standing proxy must report that transaction to the governor of the Financial Supervisory Service at that time. In addition, if a foreign investor acquires or sells its shares in connection with a tender offer, odd-lot trading of shares or trades of a class of shares for which the aggregate foreign ownership limit has been reached or exceeded, that investor or its standing proxy must ensure that the financial investment company engaged to facilitate the transaction reports the transaction to the governor of the Financial Supervisory Service. Also, sale and purchase of shares at fair value between foreigners who are part of an investor group comprised of foreign companies investing under the common control of a common investment manager pursuant to applicable laws or contract are required to be reported to the governor of the Financial Supervisory Service. A foreign investor may appoint a standing proxy to exercise stockholders’ rights or perform any matters related to the foregoing activities if that investor does not perform these activities itself. A foreign investor may be exempted from complying with the standing proxy rules with the approval of the governor of the Financial Supervisory Service in cases deemed unavoidable by reason of conflict between laws of Korea and the home country of the foreign investor.
Certificates evidencing shares of Korean companies must be kept in the custody of an eligible custodian in Korea. The same entities eligible to act as a standing proxy are eligible to act as a custodian of shares for a non-resident or foreign investor. A foreign investor must ensure that its custodian deposits its shares with the Korea Securities Depository. A foreign investor may be exempted from complying with this deposit requirement with the approval of the governor of the Financial Supervisory Service in circumstances where compliance with that requirement is made impracticable, including cases where compliance would contravene the laws of the foreign investors’ home country.
Under the Investment Rules, with certain limitations, foreign investors may acquire shares of a Korean company without being subject to any foreign investment limit. Under one of these limitations, foreign investors may acquire no more than 40% of the outstanding share capital of designated public corporations. Designated public corporations may set a limit on the acquisition of shares by a single person in their articles of incorporation. Currently, the Korea Electric Power Corporation is the only designated public corporation that has set this limit. If a foreign investor acquires 10% or more of the outstanding shares with voting rights of a Korean company, that investment constitutes a “foreign direct investment” under the Foreign Investment Promotion Act of Korea. Generally, a foreign direct investment must be reported to a foreign exchange bank or the Korea Trade Investment Promotion Agency. The acquisition of a Korean company’s shares by a foreign investor may be subject to certain foreign or other shareholding restrictions in the event that the restrictions are prescribed in a specific law that regulates the business of the Korean company. For a description of the restrictions applicable to Korean financial holding companies, see “Item 4B. Business Overview—Supervision and Regulation—Principal Regulations Applicable to Financial Holding Companies.”
Under the Foreign Exchange Transaction Laws, a foreign investor who intends to acquire shares must designate a foreign exchange bank at which he must open a foreign currency account and a Won account exclusively for stock investments. Approval is not required for remittance into Korea and deposit of foreign currency funds in the foreign currency account. Foreign currency funds may be transferred from the foreign currency account at the time required to place a deposit for, or settle the purchase price of, a stock purchase transaction to a Won account opened at a financial investment company with a dealing and/or brokerage license. Funds in the foreign currency account may be remitted abroad without any Korean governmental approval.
177
Table of Contents
Dividends on shares of Korean companies are paid in Won. Korean governmental approval is not required for foreign investors to receive dividends on, or the Won proceeds from the sale of, any shares to be paid, received and retained in Korea. Dividends paid on, and the Won proceeds of the sale of, any shares held by a non-resident of Korea must be deposited either in a Won account with the investor’s financial investment company with a dealing and/or brokerage license or in its own Won account. Funds in a foreign investor’s Won account may be transferred to its foreign currency account or withdrawn for local living expenses up to certain limits. These funds may also be used to make future investments in shares or to pay the subscription price of new shares obtained through the exercise of pre-emptive rights.
Financial investment companies with a dealing or brokerage license may open foreign currency accounts with foreign exchange banks exclusively to accommodate foreign investors’ stock investments in Korea. Through these accounts, financial investment companies with a dealing or brokerage license may enter into limited foreign exchange transactions, such as converting foreign currency funds and Won funds, either as a counterparty to or on behalf of foreign investors, without the investors having to open their own accounts with foreign exchange banks.
| Item 9D. | Selling Shareholders |
Not Applicable
| Item 9E. | Dilution |
Not Applicable
| Item 9F. | Expenses of the Issuer |
Not Applicable
| Item 10. | ADDITIONAL INFORMATION |
| Item 10A. | Share Capital |
Not Applicable
| Item 10B. | Memorandum and Articles of Association |
Description of Capital Stock
We have set forth below information relating to our capital stock, including brief summaries of some of the provisions of our articles of incorporation, the Korean Commercial Code, Financial Investment Services and Capital Markets Act, and other related laws of Korea. These summaries do not purport to be complete and are subject to our articles of incorporation, and the applicable provisions of the Financial Investment Services and Capital Markets Act, the Korean Commercial Code and those related laws.
Our authorized share capital is 2,400,000,000 shares. Our articles of incorporation authorize us to issue:
| • | shares of common stock, par value (Won)5,000 per share; |
| • | “class shares”, par value (Won)5,000 per share. |
Subject to applicable laws and regulations, our articles of incorporation authorize us to issue a number of “class shares” equal to as much as one-half of all of the issued and outstanding shares.
As of the date of this annual report, 806,015,340 shares of common stock were issued and 806,013,341 shares of common stock were outstanding. Pursuant to our articles of incorporation, which was last amended on March 30, 2012, we are authorized to issue various types of “class shares”, which include shares of voting and non-voting preferred stock, convertible stock, redeemable preferred stock and hybrid securities comprising one or more elements of the foregoing types of shares. There are no class shares currently outstanding. All of the
178
Table of Contents
issued and outstanding shares are fully paid and non-assessable and are in registered form. As of the date of this annual report, our authorized but unissued share capital was 1,593,984,660 shares. We may issue the unissued shares without further stockholder approval, but these issuances are subject to a board resolution as provided in the articles of incorporation. See “—Pre-emptive Rights and Issuances of Additional Shares” and “—Dividends and Other Distributions—Distribution of Free Shares.” For a discussion of the history of our share capital, see Note 27 of the notes to our consolidated financial statements and “Item 4A. History and Development of the Company—History—Establishment of Woori Finance Holdings.”
Our articles of incorporation allow our stockholders, by special resolution, to grant to our officers, directors and employees stock options exercisable for up to 15% of the total number of our issued and outstanding shares. Our board of directors may also grant stock options exercisable for up to 1% of our issued and outstanding shares. However, any grant by our board of directors must be approved by our stockholders at their next general meeting convened immediately after the grant date. As of December 31, 2011, our officers, directors and employees did not hold any options to purchase shares of common stock. See “Item 6E. Share Ownership.”
We issue share certificates in denominations of one, five, ten, 50, 100, 500, 1,000 and 10,000 shares.
Organization and Register
We are a financial holding company established under the Financial Holding Company Act. We were incorporated under the laws of Korea on March 27, 2001 and commenced operations on April 2, 2001. We are registered with the commercial registry office of Seoul District Court. We maintain the register of our stockholders at our principal office in Seoul, Korea. We register transfers of shares on the register of stockholders upon presentation of the share certificates.
Interests of Directors
Our articles of incorporation provide that any director who has a material interest in the subject matter of a resolution to be taken by the board of directors cannot vote on such resolution. Our articles of incorporation also provide that the remuneration of our directors is to be determined by the resolution of the general meeting of shareholders.
Our articles of incorporation do not contain any special provisions with respect to the borrowing powers exercisable by directors, their retirement age or a requirement to hold any shares of our capital stock.
See “Item 6A. Board Practices” for more information on our directors.
Limitation on Liability of Directors
Our articles of incorporation provide that we may, upon the resolution of the general meeting of shareholders, limit the liability of our directors (in their capacity as such) to an amount not less than six times (or three times in case of outside directors) the aggregate amount of the remuneration we paid to such directors during the most recent one-year period, provided that such limitation shall not apply with regard to any liability arising from such directors’ gross negligence, willful misconduct or violation of their duties regarding self-dealing or corporate opportunity.
Dividends and Other Distributions
Dividends. We distribute dividends to stockholders in proportion to the number of shares of the relevant class of capital stock they own. Subject to the requirements of the Korean Commercial Code and other applicable laws and regulations, we expect to pay full annual dividends on newly issued stock for the year in which it is issued.
We declare our dividend annually at the annual general meeting of stockholders. We generally hold this meeting within three months after the end of each fiscal year. We must pay the annual dividend to the stockholders of record as of the end of the preceding fiscal year within one month after that meeting. We can
179
Table of Contents
distribute the annual dividend in (i) cash, (ii) shares, provided that such shares must be distributed at par value and, if the market price of the shares is less than their par value, dividends in shares may not exceed one-half of the total annual dividend (including dividends in shares) or (iii) other forms of consideration. In addition, we may declare, and distribute in cash, interim dividends once a year pursuant to a board resolution.
Under the Korean Commercial Code and our articles of incorporation, we do not have an obligation to pay any annual or interim dividend unclaimed for five years from the payment date.
The Financial Holding Company Act and related regulations require that each time a Korean financial holding company pays an annual dividend, it must set aside in its legal reserve to stated capital an amount equal to at least one-tenth of its net income after tax until the amount set aside reaches at least the aggregate amount of its stated capital. Unless it sets aside this amount, a Korean financial holding company may not pay an annual dividend. We intend to set aside provisions for credit losses and reserves for severance pay in addition to this legal reserve.
For information regarding taxation of dividends, see “Item 10E. Taxation—United States Taxation—Dividends” and “—Korean Taxation—Taxation of Dividends.”
Distribution of Free Shares. The Korean Commercial Code permits us to pay dividends in the form of shares out of retained or current earnings. It also permits us to distribute to our stockholders, in the form of free shares, an amount transferred from the capital surplus or legal reserve. We would be required to distribute those free shares pro rata to all stockholders.
Pre-emptive Rights and Issuances of Additional Shares
We may issue authorized but unissued shares as our board of directors may determine, unless otherwise provided in the Korean Commercial Code. We must, however, offer any new shares on uniform terms to all stockholders who have preemptive rights and are listed on our stockholders’ register as of the applicable record date. Those stockholders are entitled to subscribe for any newly issued shares in proportion to their existing shareholdings. Our articles of incorporation provide, however, that we may issue new shares to persons other than existing stockholders if those shares are:
| • | publicly offered pursuant to Article 165-6 of the Financial Investment Services and Capital Markets Act (where the number of shares so offered may not exceed 50% of our total number of issued shares); |
| • | issued to directors or employees as a result of the exercise of stock options we granted to them pursuant to Article 542-3 of the Korean Commercial Code; |
| • | issued to the members of our employee stock ownership association pursuant to Article 165-7 of the Financial Investment Services and Capital Markets Act; |
| • | issued to specified foreign investors or foreign or domestic financial institutions for managerial needs, strategic technology alliances, emergency financing or debt-to-equity swaps by those financial institutions (where the number of shares so offered may not exceed 50% of our total number of issued shares); or |
| • | issued to a depositary for the purpose of issuing depositary receipts pursuant to Financial Investment Services and Capital Markets Act (where the number of shares so offered may not exceed 50% of our total number of issued shares). |
We must give public notice of pre-emptive rights for new shares and their transferability not less than two weeks before the record date (excluding the period during which the stockholders’ register is closed). We will notify the stockholders who are entitled to subscribe for newly issued shares of the deadline for subscription at least two weeks prior to the deadline. If a stockholder fails to subscribe on or before the deadline, its pre-emptive rights will lapse. Our board of directors may determine how to distribute shares in respect of which preemptive rights have not been exercised or where fractions of shares occur.
180
Table of Contents
Under the Financial Investment Services and Capital Markets Act, each member of our employee stock ownership association, whether or not they are stockholders, has a preemptive right, subject to certain exceptions, to subscribe for up to 20% of any shares we publicly offer. This right is exercisable only so long as the total number of shares so acquired and held by the member does not exceed 20% of the total number of shares then outstanding. As of December 31, 2011, none of our employees owned any shares of our common stock through the employee stock ownership association.
In addition, our articles of incorporation permit us to issue convertible bonds or bonds with warrants, each up to an aggregate principal amount of (Won)2 trillion, to persons other than existing stockholders. Under the Korean Commercial Code, we are permitted to distribute convertible bonds or bonds with warrants to persons other than existing stockholders only when we deem that this distribution is necessary for managerial purposes, such as obtaining new technology or improving our financial condition. In the event we issue new shares, the foregoing provision would be applicable notwithstanding any provision in the articles of incorporation allowing issuance of new shares to persons other than existing stockholders. As of December 31, 2011, we had no convertible bonds or bonds with warrants outstanding.
Voting Rights
Each outstanding share of our common stock is entitled to one vote. However, voting rights may not be exercised for shares that we hold or shares that a corporate stockholder holds, if we directly or indirectly own more than one-tenth of the outstanding capital stock of that stockholder. Our articles of incorporation do not prohibit cumulative voting. Accordingly, the Korean Commercial Code permits holders of an aggregate of 1% or more of our outstanding shares with voting rights to request cumulative voting when electing two or more directors.
The Korean Commercial Code and our articles of incorporation provide that an ordinary resolution may be adopted if the holders of at least a majority of those shares of common stock present or represented at a meeting approve the resolution and the majority also represents at least one-fourth of the total of our issued and outstanding shares of common stock. Holders of non-voting shares (other than enfranchised non-voting shares) are not entitled to vote on any resolution or to receive notice of any general meeting of stockholders, unless the meeting agenda includes considering a resolution on which they are entitled to vote. If our annual general meeting resolves not to pay to holders of any class shares the annual dividend determined by the board of directors when we issued those shares, those holders will be entitled to exercise voting rights from the general meeting following the meeting adopting that resolution until the end of a meeting where a resolution is passed declaring payment of a dividend on such class shares. Holders of the enfranchised class shares will have the same rights as holders of common stock to request, receive notice of, attend and vote at a general meeting of stockholders.
The Korean Commercial Code provides that the holders of at least two-thirds of those shares present or represented at a meeting must approve the adoption of a special resolution, and the special majority must represent at least one-third of the total issued and outstanding shares with voting rights of the company. Special resolutions are required to:
| • | amend the articles of incorporation; |
| • | change the authorized share capital of the company; |
| • | remove a director; |
| • | dissolve, merge or consolidate us; |
| • | transfer of the whole or a significant part of our business; |
| • | acquire all of the business of another company; |
| • | acquire a part of the business of another company that has a material effect on our business of the company; and |
| • | issue new shares at a price lower than their par value. |
181
Table of Contents
In addition, the holders of each outstanding class of our class shares must adopt a separate resolution in connection with an amendment to our articles of incorporation, any merger or consolidation or in certain other cases where their rights or interests are adversely affected. With respect to each class, holders of at least two-thirds of the class shares present or represented at a meeting must approve the adoption of that resolution, and those holders must hold class shares representing at least one-third of our total issued and outstanding class shares of the same class.
A stockholder may exercise its voting rights by proxy given to another person. The proxy must present the power of attorney before the start of the meeting.
Liquidation Rights
If we are liquidated, the assets remaining after the payment of all our debts, liquidation expenses and taxes will be distributed to stockholders in proportion to the number of shares they hold. Holders of class shares have no preferences in liquidation.
General Meetings of Stockholders
There are two types of general meetings of stockholders: annual general meetings and extraordinary general meetings. We are required to convene our annual general meeting within three months after the end of each fiscal year. Subject to a board resolution or court approval, an extraordinary general meeting of stockholders may be held:
| • | when we deem one necessary; |
| • | at the request of the holders of an aggregate of 3% or more of our outstanding shares; |
| • | at the request of the holders of an aggregate of 0.75% or more of our outstanding shares with voting rights who have held those shares for at least six months; or |
| • | at the request of our audit committee. |
Holders of non-voting shares are entitled to request a general meeting only if their non-voting shares have become enfranchised. Meeting agendas will be determined by our board of directors or proposed by holders of an aggregate of 3% or more of our outstanding shares with voting rights or by holders of an aggregate of 0.25% or more of those shares who have held those shares for at least six months by way of a written proposal to our board of directors at least six weeks before the meeting. We must give stockholders written notices or e-mail notices stating the date, place and agenda of the meeting at least two weeks before the date of the meeting. However, we may give notice to holders of 1% or less of the total number of issued and outstanding shares that are entitled to vote by placing at least two public notices at least two weeks in advance of the meeting in at least two daily newspapers. Stockholders who are not on the stockholders’ register as of the record date will not be entitled to receive notice of the general meeting of stockholders or to attend or vote at the meeting. Unless their non-voting shares have been enfranchised, holders of non-voting shares are not entitled to receive notice of or vote at general meetings of stockholders. Holders of enfranchised non-voting shares who are on the stockholders’ register as of the record date will be entitled to receive notice of the general meeting of stockholders and to attend and vote at the meeting.
We will generally hold our general meeting of stockholders at our head office, which is our registered head office. If necessary, we may hold the meeting anywhere in the vicinity of our head office.
Rights of Dissenting Stockholders
Pursuant to the Financial Investment Services and Capital Markets Act and the Law on the Improvement of the Structure of the Financial Industry, in certain limited circumstances dissenting holders of shares of our common stock and our class shares will have the right to require us to purchase their shares. These circumstances include:
| • | if we transfer all or any significant part of our business; |
182
Table of Contents
| • | if we acquire a part of the business of any other company and the acquisition has a material effect on our business; or |
| • | if we merge or consolidate with another company. |
To exercise this right, stockholders must submit to us a written notice of their intention to dissent prior to the general meeting of stockholders called to approve the transaction in question. Within 20 days (or ten days, in the case of a merger or consolidation under the Law on Improvement of the Structure of the Financial Industry) after the date on which stockholders pass the relevant resolution at the general meeting, the dissenting stockholders must request in writing that we purchase their shares. We must purchase those shares within one month after the end of the request period (within two months after the receipt of the request in the case of a merger or consolidation under the Law on Improvement of the Structure of Financial Industry) at a negotiated price. If we cannot agree with the stockholder on a purchase price through negotiations, the price will be the arithmetic mean of the weighted average of the daily stock prices on the KRX KOSPI Market for:
| • | the two-month period prior to the date the relevant board of directors’ resolution was adopted; |
| • | the one-month period prior to the date the relevant board of directors’ resolution was adopted; and |
| • | the one-week period prior to the date the relevant board of directors’ resolution was adopted. |
Pursuant to the Financial Investment Services and Capital Markets Act, if we or the dissenting stockholders do not accept the purchase price, either party may bring a claim in court.
In the case of a merger or consolidation pursuant to the Law on the Improvement of the Structure of Financial Industry where the Korean government or the KDIC provides financial support, procedures different from those in the case of a merger or consolidation pursuant to the Financial Investment Services and Capital Markets Act will apply. For example, if the relevant parties cannot agree on a purchase price, the price will be determined by an accounting expert and not by the Financial Services Commission. However, a court may adjust this price if we or holders of at least 30% of the shares we must purchase do not accept the purchase price determined by the accounting expert and request an adjustment no later than 30 days from the date of the determination of the purchase price.
Required Disclosure of Ownership
Under Korean and U.S. law, stockholders who beneficially hold more than a certain percentage of our common stock, or who are related to or are acting in concert with other holders of certain percentages of our common stock or our other equity securities, must report their holdings to various governmental authorities. For a description of the required disclosure of ownership, see “Item 9C. Markets—Reporting Requirements for Holders of Substantial Interests” and “Item 4B. Business Overview—Supervision and Regulation—Principal Regulations Applicable to Financial Holding Companies—Restriction on Ownership of a Financial Holding Company.”
Other Provisions
Record Date. The record date for annual dividends is December 31. For the purpose of determining the holders of shares entitled to annual dividends, we may close the register of our stockholders for the period from January 1 until January 31. Further, the Korean Commercial Code and our articles of incorporation permit us, upon at least two weeks’ public notice, to set a record date and/or close the register of stockholders for not more than three months for the purpose of determining the stockholders entitled to certain rights pertaining to the shares. The trading of shares and the related delivery of share certificates may continue while the register of stockholders is closed.
Annual and Interim Reports. At least one week before the annual general meeting of stockholders, we must make our annual report and audited financial statements available for inspection at our head office and at all of our branch offices. We must make copies of our annual reports, our audited financial statements and any resolutions adopted at the general meeting of stockholders available to our stockholders.
183
Table of Contents
Under the Financial Investment Services and Capital Markets Act, we must file with the Financial Services Commission and the KRX KOSPI Market:
| • | an annual report within 90 days after the end of each fiscal year; |
| • | a half-year report within 45 days after the end of the first six months of each fiscal year; and |
| • | quarterly reports within 45 days after the end of the first three months and nine months of each fiscal year. |
Copies of these reports will be available for public inspection at the Financial Services Commission and the KRX KOSPI Market.
Transfer of Shares. Under the Korean Commercial Code, share transfers are effected by the delivery of share certificates. The Financial Investment Services and Capital Markets Act provides, however, that in case of a company listed on the KRX KOSPI Market (like us), share transfers can be effected using a book-entry system. The transferee must have its name and address registered on our register of stockholders in order to assert its stockholder’s rights. For this purpose, stockholders must file their name, address and seal with us. Non-resident stockholders must tell us the name of their proxy in Korea to which we can send notices. Under current Korean regulations, the following entities may act as agents and provide related services for foreign stockholders:
| • | the Korea Securities Depository; |
| • | internationally recognized foreign custodians; |
| • | financial investment companies with a dealing license (including domestic branches of foreign financial investment companies with such license); |
| • | financial investment companies with a brokerage license (including domestic branches of foreign financial investment companies with such license); |
| • | foreign exchange banks (including domestic branches of foreign banks); and |
| • | financial investment companies with a collective investment license (including domestic branches of foreign financial investment companies with such license). |
Foreign stockholders may appoint a standing proxy from the foregoing and generally may not allow any person other than the standing proxy to exercise rights to the acquired shares or perform any tasks related thereto on their behalf.
Foreign exchange controls and securities regulations apply to the transfer of shares by non-residents or non-Koreans. See “Item 9C. Markets.”
Except as provided in the Financial Holding Company Act, the maximum aggregate shareholdings of a single stockholder or a person in a “special relationship” with any stockholder is 10% of our issued and outstanding voting shares. See “Item 4B. Business Overview—Supervision and Regulation—Principal Regulations Applicable to Financial Holding Companies—Restriction on Ownership of a Financial Holding Company.”
Our Acquisition of Our Shares. Under the Korean Commercial Code, we may acquire shares of our own capital stock under our name and for our own account upon a resolution of the general meeting of stockholders by either (i) purchasing such shares on the applicable stock exchange with respect to marketable securities traded on such stock exchange or (ii) purchasing shares, other than any redeemable shares as defined in Article 345, Paragraph (1) of the Korean Commercial Code, from each shareholder in proportion to their existing shareholding ratio through the methods set forth in the Presidential Decree under Article 345, Paragraph (1) of the Korean Commercial Code, provided that the total purchase price may not exceed the amount of our profit that may be distributed as dividends for the immediately preceding fiscal year.
In addition, pursuant to the Financial Investment Services and Capital Markets Act and after submission of certain reports to the Financial Services Commission, we may purchase our own capital stock on the KRX
184
Table of Contents
KOSPI Market or through a tender offer. We may also acquire interests in our capital stock through agreements with trust companies, securities investment companies or investment trust management companies. The aggregate purchase price of our capital stock may not exceed the total amount available for distribution of dividends at the end of the preceding fiscal year.
In general, subsidiaries of which we own 50% or more are not permitted to acquire our capital stock.
| Item 10C. | Material Contracts |
In connection with the receipt of public funds by us and our subsidiaries, we entered into memoranda of understanding with the KDIC. Under the current terms of the memoranda of understanding entered into among us, Woori Bank, Kyongnam Bank, Kwangju Bank and the KDIC, we and our subsidiaries are required to meet financial and business targets and recapitalization goals on a semi-annual and/or quarterly basis until the end of 2012. See “Item 4A. History and Development of the Company—History—Relationship with the Korean Government.”
| Item 10D. | Exchange Controls |
General
The Foreign Exchange Transaction Act of Korea and the Presidential Decree and regulations under that Act and Decree regulate investment in Korean securities by non-residents and issuance of securities outside Korea by Korean companies. We collectively refer to these laws and regulations as the “Foreign Exchange Transaction Laws.” Non-residents may invest in Korean securities only to the extent specifically allowed by the Foreign Exchange Transaction Laws or otherwise permitted by the Ministry of Strategy and Finance. The Financial Services Commission has also adopted regulations that restrict foreign investment in Korean securities and regulate the issuance of securities outside Korea by Korean companies, pursuant to its authority under the Financial Investment Services and Capital Markets Act.
Under the Foreign Exchange Transaction Laws, if the Korean government deems that:
| • | the need to do so is inevitable due to the outbreak of natural calamities, wars, conflict of arms or grave and sudden changes in domestic or foreign economic circumstances or other similar situations, the Ministry of Strategy and Finance may temporarily suspend payment, receipt or the whole or part of transactions to which the Foreign Exchange Transaction Laws apply, or impose an obligation to safe-keep, deposit or sell means of payment in or to certain Korean governmental agencies or financial institutions; and |
| • | international balance of payments and international finance are confronted or are likely to be confronted with serious difficulty or the movement of capital between Korea and abroad brings or is likely to bring about serious obstacles in carrying out its currency policies, exchange rate policies and other macroeconomic policies, the Ministry of Strategy and Finance may take measures to require any person who intends to perform capital transactions to obtain permission or to require any person who performs capital transactions to deposit part of the payments received in these transactions at certain Korean governmental agencies or financial institutions. |
Both of these actions are subject to limitations specified by the Foreign Exchange Transaction Laws.
Restrictions Applicable to Shares
Under the Foreign Exchange Transaction Laws, a foreign investor who intends to acquire shares must designate a foreign exchange bank at which he must open a foreign currency account and a Won account exclusively for stock investments. Approval is not required for remittance into Korea and deposit of foreign currency funds in the foreign currency account. Foreign currency funds may be transferred from the foreign currency account at the time required to place a deposit for, or settle the purchase price of, a stock purchase transaction to a Won account opened at a financial investment company with a dealing and/or brokerage license. Funds in the foreign currency account may be remitted abroad without any Korean governmental approval.
185
Table of Contents
Dividends on shares of Korean companies are paid in Won. Korean governmental approval is not required for foreign investors to receive dividends on, or the Won proceeds from the sale of, any shares to be paid, received and retained in Korea. Dividends paid on, and the Won proceeds of the sale of, any shares held by a non-resident of Korea must be deposited either in a Won account with the investor’s financial investment company with a dealing and/or brokerage license or in its own Won account. Funds in a foreign investor’s Won account may be transferred to its foreign currency account or withdrawn for local living expenses up to certain limits. These funds may also be used to make future investments in shares or to pay the subscription price of new shares obtained through the exercise of pre-emptive rights.
Financial investment companies with a dealing and/or brokerage license may open foreign currency accounts with foreign exchange banks exclusively to accommodate foreign investors’ stock investments in Korea. Through these accounts, such financial investment companies may enter into limited foreign exchange transactions, such as converting foreign currency funds and Won funds, either as a counterparty to or on behalf of foreign investors, without the investors having to open their own accounts with foreign exchange banks.
| Item 10E. | Taxation |
United States Taxation
This summary describes certain material U.S. federal income tax consequences for a U.S. holder (as defined below) of acquiring, owning, and disposing of common shares or ADSs. This summary applies to you only if you hold the common shares or ADSs as capital assets for tax purposes. This summary does not apply to you if you are a member of a class of holders subject to special rules, such as:
| • | a dealer in securities or currencies; |
| • | a trader in securities that elects to use a mark-to-market method of accounting for securities holdings; |
| • | a bank; |
| • | a life insurance company; |
| • | a tax-exempt organization; |
| • | a person that holds common shares or ADSs that are a hedge or that are hedged against interest rate or currency risks; |
| • | a person that holds common shares or ADSs as part of a straddle or conversion transaction for tax purposes; |
| • | a person whose functional currency for tax purposes is not the U.S. dollar; or |
| • | a person that owns or is deemed to own 10% or more of any class of our stock. |
This summary is based on the Internal Revenue Code of 1986, as amended, its legislative history, existing and proposed regulations promulgated thereunder, and published rulings and court decisions, all as currently in effect. These laws are subject to change, possibly on a retroactive basis.
Please consult your own tax advisers concerning the U.S. federal, state, local, and other tax consequences of purchasing, owning, and disposing of common shares or ADSs in your particular circumstances.
For purposes of this summary, you are a “U.S. holder” if you are the beneficial owner of a common share or an ADS and are:
| • | a citizen or resident of the United States; |
| • | a U.S. domestic corporation; or |
| • | otherwise subject to U.S. federal income tax on a net income basis with respect to income from the common share or ADS. |
186
Table of Contents
In general, if you are the beneficial owner of ADSs, you will be treated as the beneficial owner of the common shares represented by those ADSs for U.S. federal income tax purposes, and no gain or loss will be recognized if you exchange an ADS for the common share represented by that ADS.
Dividends
The gross amount of cash dividends that you receive (prior to deduction of Korean taxes) generally will be subject to U.S. federal income taxation as foreign source dividend income and will not be eligible for the dividends received deduction. Dividends paid in Won will be included in your income in a U.S. dollar amount calculated by reference to the exchange rate in effect on the date that you receive the dividend (or the depositary receives the dividend, in the case of ADSs), regardless of whether the payment is in fact converted into U.S. dollars. If such a dividend is converted into U.S. dollars on the date of receipt, you generally should not be required to recognize foreign currency gain or loss in respect of the dividend income.
Subject to certain exceptions for short-term and hedged positions, the U.S. dollar amount of dividends received by an individual prior to January 1, 2013 with respect to the ADSs will be subject to taxation at a maximum rate of 15% if the dividends are “qualified dividends.” Dividends paid on the ADSs will be treated as qualified dividends if (i) the ADSs are readily tradable on an established securities market in the United States and (ii) we were not, in the year prior to the year in which the dividend was paid, and are not, in the year in which the dividend is paid, a passive foreign investment company as defined for U.S. federal income tax purposes (“PFIC”). The ADSs are listed on the New York Stock Exchange, and will qualify as readily tradable on an established securities market in the United States so long as they are so listed. Based on our audited financial statements, we believe that we were not a PFIC in our 2010 or 2011 taxable year. In addition, based on our audited financial statements and current expectations regarding our income, assets and activities, we do not anticipate becoming a PFIC for our 2012 taxable year.
Distributions of additional shares in respect of common shares or ADSs that are made as part of a pro-rata distribution to all of our stockholders generally will not be subject to U.S. federal income tax.
Sale or Other Disposition
For U.S. federal income tax purposes, gain or loss you realize on a sale or other disposition of common shares or ADSs generally will be treated as U.S. source capital gain or loss, and will be long-term capital gain or loss if the common shares or ADSs were held for more than one year. Your ability to offset capital losses against ordinary income is limited. Long-term capital gain recognized by an individual U.S. holder generally is subject to taxation at reduced rates.
Foreign Tax Credit Considerations
You should consult your own tax advisers to determine whether you are subject to any special rules that limit your ability to make effective use of foreign tax credits. If no such rules apply, you may claim a credit against your U.S. federal income tax liability for Korean taxes withheld from dividends on the common shares or ADSs at the rate provided for under the income tax treaty between the United States and Korea, so long as you have owned the common shares or ADSs (and not entered into specified kinds of hedging transactions) for at least a 16-day period that includes the ex-dividend date. Instead of claiming a credit, you may, if you so elect, deduct such Korean taxes in computing your taxable income, subject to generally applicable limitations under U.S. tax law. Korean taxes withheld from a distribution of additional shares that is not subject to U.S. tax may be treated for U.S. federal income tax purposes as imposed on “general category” income. Such treatment could affect your ability to utilize any available foreign tax credit in respect of such taxes.
Any Korean securities transaction tax or agriculture and fishery special surtax that you pay will not be creditable for foreign tax credit purposes.
Foreign tax credits will not be allowed for withholding taxes imposed in respect of certain short-term or hedged positions in securities and may not be allowed in respect of arrangements in which a U.S. holder’s expected economic profit is insubstantial.
187
Table of Contents
The calculation of foreign tax credits and, in the case of a U.S. holder that elects to deduct foreign taxes, the availability of deductions involve the application of complex rules that depend on a U.S. holder’s particular circumstances. You should consult your own tax advisers regarding the creditability or deductibility of such taxes.
U.S. Information Reporting and Backup Withholding Rules
Payments of dividends and sales proceeds that are made within the United States or through certain U.S.-related financial intermediaries are subject to information reporting and may be subject to backup withholding unless the holder (i) is a corporation or other exempt recipient and demonstrates this when required or (ii) provides a taxpayer identification number and certifies that no loss of exemption from backup withholding has occurred. Holders that are not U.S. persons generally are not subject to information reporting or backup withholding. However, such a holder may be required to provide a certification of its non-U.S. status in connection with payments received within the United States or through a U.S.-related financial intermediary.
Korean Taxation
The following summary of Korean tax considerations applies to you so long as you are not:
| • | a resident of Korea; |
| • | a corporation with its head office, principal place of business or place of effective management in Korea; or |
| • | engaged in a trade or business in Korea through a permanent establishment or a fixed base to which the relevant income is attributable or with which the relevant income is effectively connected. |
Taxation of Dividends on Common Shares or ADSs
We will deduct Korean withholding tax from dividends paid to you (whether payable in cash or in shares) at a rate of 22.0% (inclusive of local income surtax). If you are a beneficial owner of the dividends in a country that has entered into a tax treaty with Korea, you may qualify for a reduced rate of Korean withholding tax. See “—Tax Treaties” below for a discussion on treaty benefits. If we distribute to you shares representing a transfer of earning surplus or certain capital reserves into paid-in capital, that distribution may be subject to Korean withholding tax.
In order to obtain a reduced rate of withholding tax pursuant to an applicable tax treaty, you must submit to us, prior to the dividend payment date, such evidence of tax residence as the Korean tax authorities may require in order to establish your entitlement to the benefits of the applicable tax treaty (which will include a certificate of your tax residency issued by a competent authority of your country of tax residence).
If you hold ADSs, evidence of tax residence may be submitted to us through the depositary.
Taxation of Capital Gains From Transfer of Common Shares or ADSs
As a general rule, capital gains earned by non-residents upon transfer of our common shares or ADSs are subject to Korean withholding tax at the lower of (1) 11% (inclusive of local income surtax) of the gross proceeds realized or (2) subject to the production of satisfactory evidence of acquisition costs and certain direct transaction costs of the common shares or ADSs, 22.0% (inclusive of local income surtax) of the net realized gain, unless exempt from Korean income taxation under the applicable Korean tax treaty with the non-resident’s country of tax residence. See “—Tax Treaties” below for a discussion on treaty benefits. Even if you do not qualify for an exemption under a tax treaty, you will not be subject to the foregoing withholding tax on capital gains if you qualify under the relevant Korean domestic tax law exemptions discussed in the following paragraphs.
188
Table of Contents
In regard to the transfer of our common shares through the Korea Exchange, you will not be subject to the withholding tax on capital gains (as described in the preceding paragraph) if you (1) have no permanent establishment in Korea and (2) did not own or have not owned (together with any shares owned by any entity with which you have a certain special relationship) 25% or more of our total issued and outstanding shares, which may include the common shares represented by the ADSs, at any time during the calendar year in which the sale occurs and during the five calendar years prior to the calendar year in which the sale occurs.
Under Korean tax law, ADSs are viewed as shares of common stock for capital gains tax purposes. Accordingly, capital gains from the sale or disposition of ADSs are taxed (if such sale or disposition constitutes a taxable event) as if such gains are from the sale or disposition of the underlying common shares. Capital gains that you earn (regardless of whether you have a permanent establishment in Korea) from a transfer of ADSs outside of Korea will generally be exempt from Korean income taxation by virtue of the Special Tax Treatment Control Law of Korea, or the STTCL, provided that the issuance of the ADSs is deemed to be an overseas issuance under the STTCL. However, if you transfer ADSs after having converted the underlying common shares, such exemption under the STTCL will not apply and you will be required to file a corporate income tax return and pay tax in Korea with respect to any capital gains derived from such transfer unless the purchaser or a financial investment company with a brokerage license, as applicable, withholds and pays such tax.
If you are subject to tax on capital gains with respect to the sale of ADSs, or of common shares you acquired as a result of a withdrawal, the purchaser or, in the case of the sale of common shares on the Korea Exchange or through a financial investment company with a brokerage license in Korea, the financial investment company, is required to withhold Korean tax from the sales price in an amount equal to the lower of (1) 11% (inclusive of local income surtax) of the gross realization proceeds or (2) subject to the production of satisfactory evidence of acquisition costs and certain direct transaction costs of the common shares or ADSs, 22.0% (inclusive of local income surtax) of the net realized gain, and to make payment of these amounts to the Korean tax authority, unless you establish your entitlement to an exemption under an applicable tax treaty or domestic tax law. To obtain the benefit of an exemption from tax pursuant to an applicable tax treaty, you must submit to the purchaser or the financial investment company, or through the ADR depositary, as the case may be, prior to or at the time of payment, such evidence of your tax residence as the Korean tax authorities may require in support of your claim for treaty benefits. See the discussion under “—Tax Treaties” below for an additional explanation on claiming treaty benefits.
Tax Treaties
Korea has entered into a number of income tax treaties with other countries (including the United States), which would reduce or exempt Korean withholding tax on dividends on, and capital gains on transfer of, the common shares or ADSs. For example, under the Korea-United States income tax treaty, reduced rates of Korean withholding tax of 16.5% or 11.0% (depending on your shareholding ratio and inclusive of local income surtax) on dividends and an exemption from Korean withholding tax on capital gains are available to residents of the United States that are beneficial owners of the relevant dividend income or capital gains, subject to certain exceptions. However, under Article 17 (Investment or Holding Companies) of the Korea-United States income tax treaty, such reduced rates and exemption do not apply if (i) you are a United States corporation, (ii) by reason of any special measures, the tax imposed on you by the United States with respect to such dividend income or capital gains is substantially less than the tax generally imposed by the United States on corporate profits and (iii) 25% or more of your capital is held of record or is otherwise determined, after consultation between competent authorities of the United States and Korea, to be owned directly or indirectly by one or more persons who are not individual residents of the United States. Also, under Article 16 (Capital Gains) of the Korea-United States income tax treaty, the exemption on capital gains does not apply if you are an individual and (a) you maintain a fixed base in Korea for an aggregate of 183 days or more during a given taxable year and your ADSs or common shares giving rise to capital gains are effectively connected with such fixed base or (b) you are present in Korea for an aggregate of 183 days or more during a given taxable year.
You should inquire for yourself whether you are entitled to the benefit of a tax treaty between Korea and the country where you are a resident. It is the responsibility of the party claiming the benefits of an income tax treaty
189
Table of Contents
in respect of dividend payments or capital gains to submit to us, the purchaser or the financial investment company, as applicable, a certificate as to his tax residence. In the absence of sufficient proof, we, the purchaser or the financial investment company, as applicable, must withhold tax at the normal rates. Furthermore, in order for you to obtain the benefit of a tax exemption on certain Korean source income (such as dividends or capital gains) under an applicable tax treaty, Korean tax law requires you (or your agent) to submit an application for tax exemption along with a certificate of your tax residency issued by a competent authority of your country of tax residence, subject to certain exceptions. Such application should be submitted to the relevant district tax office by the ninth day of the month following the date of the first payment of such income.
Inheritance Tax and Gift Tax
If you die while holding an ADS or donate an ADS, it is unclear whether, for Korean inheritance and gift tax purposes, you will be treated as the owner of the common shares underlying the ADSs. If the tax authority interprets depositary receipts as the underlying share certificates, you may be treated as the owner of the common shares and your heir or the donee (or in certain circumstances, you as the donor) will be subject to Korean inheritance or gift tax presently at the rate of 10% to 50%, provided that the value of the ADSs or common shares is greater than a specified amount.
If you die while holding a common share or donate a common share, your heir or donee (or in certain circumstances, you as the donor) will be subject to Korean inheritance or gift tax at the same rate as indicated above.
At present, Korea has not entered into any tax treaty relating to inheritance or gift taxes.
Securities Transaction Tax
If you transfer our common shares on the Korea Exchange, you will be subject to securities transaction tax at the rate of 0.3% (including an agriculture and fishery special surtax) of the sale price of the common shares. If your transfer of the common shares is not made on the Korea Exchange, subject to certain exceptions, you will be subject to securities transaction tax at the rate of 0.5% and will not be subject to an agriculture and fishery special surtax.
Under the Securities Transaction Tax Law of Korea, depositary receipts (such as American depositary receipts evidencing the ADSs) constitute share certificates subject to the securities transaction tax. However, the transfer of depositary receipts listed on the New York Stock Exchange, the Nasdaq Global Market, or other qualified foreign exchanges is exempt from the securities transaction tax.
In principle, the securities transaction tax, if applicable, must be paid by the transferor of the common shares or ADSs. When the transfer is effected through a securities settlement company, such settlement company is generally required to withhold and pay the tax to the tax authorities. When such transfer is made through a financial investment company only, such financial investment company is required to withhold and pay the tax. Where the transfer is effected by a non-resident without a permanent establishment in Korea, other than through a securities settlement company or a financial investment company, the transferee is required to withhold the securities transaction tax.
Non-reporting or under-reporting of securities transaction tax will generally result in penalties equal to 20% to 40% of the non-reported tax amount or 10% to 40% of under-reported tax amount. Also, a failure to timely pay securities transaction tax due will result in penalties of 10.95% per annum of the due but unpaid tax amount. The penalties are imposed on the party responsible for paying the securities transaction tax or, if such tax is required to be withheld, on the party that has the obligation to withhold.
| Item 10F. | Dividends and Paying Agents |
Not Applicable
190
Table of Contents
| Item 10G. | Statements by Experts |
Not Applicable
| Item 10H. | Documents on Display |
We are subject to the information requirements of the U.S. Securities Exchange Act of 1934, as amended, and, in accordance therewith, are required to file reports, including annual reports on Form 20-F, and other information with the U.S. Securities and Exchange Commission. These materials, including this annual report and the exhibits thereto, may be inspected and copied at the Commission’s public reference rooms in Washington, D.C., New York, New York and Chicago, Illinois. Please call the Commission at 1-800-SEC-0330 for further information on the public reference rooms. As a foreign private issuer, we are also required to make filings with the Commission by electronic means. Any filings we make electronically will be available to the public over the Internet at the Commission’s web site at http://www.sec.gov.
| Item 10I. | Subsidiary Information |
Not Applicable
| Item 11. | QUANTITATIVE AND QUALITATIVE DISCLOSURES ABOUT MARKET RISK |
Overview
Our lending and trading businesses, our deposit taking activities and our operating environment expose us to various risks. Our risk management goal is to understand, measure and monitor these risks and to ensure that our employees strictly adhere to the policies and procedures that we establish. We seek to take a conservative approach to risk management in order to better insulate our operations from adverse events. Risks we face include:
| • | credit risk; |
| • | market risk (primarily interest rate risk, equity risk, foreign exchange risk and commodity risk); |
| • | liquidity risk; and |
| • | operational and business risk (including legal risk). |
In 2004, we completed the implementation of a group-wide, standardized risk management system (except with respect to credit risk management and operational and business risk management). This system has enhanced our risk management capabilities by enabling us to exchange information among our and our subsidiaries’ risk management operations. With respect to credit risk management systems, we have completed implementing standardized credit risk management systems based on Woori Bank’s system in all of our banking subsidiaries in 2007. With respect to operational risk management systems, we completed implementation of various aspects of the operational risk management system (not including the business risk management system) at Kyongnam Bank, Kwangju Bank and Woori Finance Information System (which changed its name to Woori FIS in May 2011) in 2006, and also completed the implementation of such aspects of the operational risk management system at Woori Investment & Securities by the end of 2008. Furthermore, following the global financial crisis, we undertook a group-wide review of our credit risk management procedures with outside consultants in 2009, as well as undertaking further group-wide reviews of our risk management infrastructure and systems in 2009 and 2010, in order to develop and implement various measures to further standardize and improve our risk management procedures and systems. We recently undertook additional steps to further strengthen our risk management systems, including (i) using Tier I capital as “available capital” for purposes of our risk capital allocation beginning in 2012 in anticipation of Basel III requirements, and (ii) including “stressed VaR” to our market risk capital calculations beginning in 2012 in accordance with the guidance of the Financial Supervisory Service. We use our risk management systems to manage our risks within acceptable limits and to otherwise ensure the soundness of our assets and the stability of our operations.
191
Table of Contents
Standardization Strategy
We began the process of implementing a group-wide, standardized risk management system in connection with the establishment of our financial holding company structure in 2001. At that time, with the assistance of a third-party consultant, we established a task force to review and evaluate the risk management systems that our subsidiaries were using. Following this review, we determined our basic structure of risk management governance and established basic risk management policies and guidelines for our group. This required us to establish a new risk management system, including a centralized risk control system, in order to better measure and address the risks we face and to anticipate potential risks more precisely. In 2007, we completed the implementation of a group-wide, standardized risk management system (except with respect to operational risk), which we further refined and updated through our group-wide review of risk management procedures, infrastructure and systems undertaken in 2009 and 2010 in the wake of the global financial crisis.
We allocate our total risk capital in accordance with the guidelines set by our Group Risk Management Committee. As described in more detail below, the committee allocates:
| • | risk capital with respect to credit risk, market risk, interest rate risk and operational and business risk with respect to each of our banking subsidiaries; |
| • | risk capital with respect to credit risk, market risk, operational and business risk with respect to Woori Investment & Securities; |
| • | risk capital with respect to insurance risk with respect to Woori Aviva Life Insurance; and |
| • | operational and business risk with respect to our asset management subsidiaries. |
Through our group-wide, standardized risk management system we allocate our risk capital:
| • | with respect to credit risk on the basis of our banking subsidiaries’ standardized credit risk management systems, which are based on Woori Bank’s CREPIA system as well as other portfolio credit models developed by third party vendors; |
| • | with respect to our market risk based on a market value at risk, or “VaR,” system and, beginning in 2012, including “stressed VaR”; and |
| • | with respect to our interest rate risk based on a historical simulation method, which simulates the current portfolio’s net present value at a 99.9% confidence level for a one-year holding period. |
We allocate our risk capital with respect to operational risk through a standardized approach in accordance with Basel II. We also apply business risk when allocating such risk capital which is based on “earnings at risk” (a measurement of the relativity of our total earnings).
192
Table of Contents
Our risk capital allocation as a percentage of available capital, on a non-consolidated basis, with respect to 2012 is as follows:
| Available capital(1) |
Risk capital |
Risk appetite |
Credit | Market | Interest rate |
Operational | Insurance | Business | Correlation Effect |
Buffer | ||||||||||||||||||||||||||||||||||
| (in billions of Won, except percentages) | ||||||||||||||||||||||||||||||||||||||||||||
| Woori Finance Holdings |
(Won) | 18,530 | (Won) | 15,986 | 86.3 | % | 65.1 | % | 14.8 | % | 3.7 | % | 6.5 | % | — | 3.6 | % | 7.4 | % | 13.7 | % | |||||||||||||||||||||||
| Woori Bank |
15,062 | 12,035 | 79.9 | 66.4 | 8.1 | 3.4 | 5.5 | — | 2.2 | 5.7 | 20.1 | |||||||||||||||||||||||||||||||||
| Kwangju Bank |
1,091 | 980 | 89.8 | 78.8 | 2.7 | 1.8 | 7.8 | — | 4.6 | 5.9 | 10.2 | |||||||||||||||||||||||||||||||||
| Kyongnam Bank |
1,566 | 1,311 | 83.7 | 67.1 | 9.8 | 6.4 | 7.3 | — | 0.6 | 7.5 | 16.3 | |||||||||||||||||||||||||||||||||
| Woori Investment & Securities |
3,509 | 2,564 | 73.1 | 23.0 | 44.9 | 1.1 | 3.6 | — | 6.4 | 5.9 | 26.9 | |||||||||||||||||||||||||||||||||
| Woori Asset Management |
63 | 43 | 68.3 | 11.1 | — | — | 8.0 | — | 52.5 | 3.5 | 31.9 | |||||||||||||||||||||||||||||||||
| Woori Financial |
272 | 253 | 93.0 | 87.1 | — | 2.6 | 11.0 | — | — | 7.7 | 7.0 | |||||||||||||||||||||||||||||||||
| Woori Aviva Life Insurance |
181 | 169 | 93.4 | 67.8 | — | 28.7 | 1.1 | 10.5 | — | 14.9 | 6.8 | |||||||||||||||||||||||||||||||||
| Woori FG Savings Bank |
59 | 50 | 84.7 | 72.9 | — | 10.2 | 8.5 | — | — | 7.4 | 15.8 | |||||||||||||||||||||||||||||||||
| (1) | Based on Tier I capital. |
Organization
We have a multi-tiered risk management governance structure. Our Group Risk Management Committee is ultimately responsible for group-wide risk management, and directs the various subordinate risk management entities. The Group Risk Management Council answers directly to the Group Risk Management Committee and coordinates the execution of these directives with the risk management units of our subsidiaries. Each Subsidiary Risk Management Committee, based on the Group Risk Management Committee’s directives, determines risk management strategies and implements risk management policies and guidelines for the relevant subsidiary, sets the subsidiary’s operational and business risk management policies and guidelines and directs the subsidiary’s risk management units with support from the applicable Subsidiary Risk Management Council, but must keep within the group’s risk guidelines. The Subsidiary Risk Management Committees generally receive input from their respective Subsidiary Risk Management Councils and subsidiary risk management units, which also report directly to the Group Risk Management Council.
193
Table of Contents
The following chart sets out our risk management governance structure as of the date of this annual report:
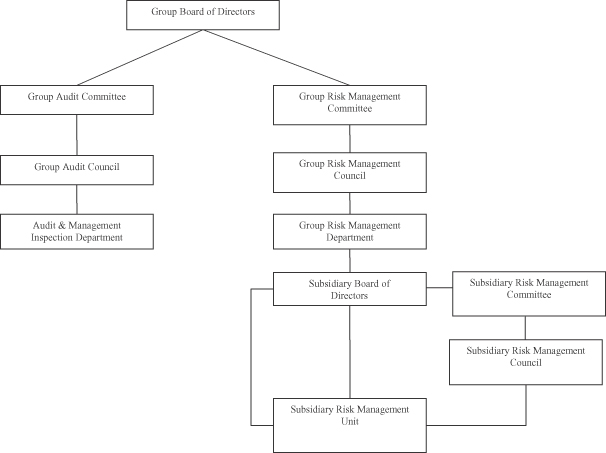
From July 2004, we instituted a “double report” system with respect to our risk management procedures. Each of our subsidiary risk management units is required to submit risk management reports directly to the Group Risk Management Department. Through this internal reporting system, we are able to better ascertain and strengthen the monitoring of our subsidiaries’ risk management and are able to quickly address any deviation from our group-wide risk policies. From March 2010, following a group-wide review of our enterprise risk management procedures with outside consultants in 2009, we further supplemented our double report system by strengthening the role and independence of chief risk officers in our subsidiaries (including the appointment of dedicated chief risk officers in all of our subsidiaries) and expanding the role of subsidiary risk management units. Each subsidiary risk management unit is required to report directly to such subsidiary’s chief risk officer on all material risk management issues as well as following the procedures under the double report system.
The Group Risk Management Committee, the Group Risk Management Council, the Subsidiary Risk Management Committees and the Subsidiary Risk Management Councils are responsible for managing risks relating to credit, markets, asset and liability management and liquidity. A number of other entities are responsible for managing our operational risks, including the following:
| • | the Audit Council, which reports to our board-level Audit Committee, coordinates the execution of our operational and business risk management policy, particularly with regard to internal subsidiary practices; |
| • | the Legal and Compliance Department monitors compliance risk and makes suggestions regarding regulatory issues to the Financial Supervisory Service; and |
| • | each Subsidiary Risk Management Committee manages operational risks at the relevant subsidiary. |
194
Table of Contents
Group Risk Management Committee
The Group Risk Management Committee is our highest decision-making body with respect to our risk management operations. Our board of directors has delegated to it the authority and responsibility for ensuring effective executive-level management of the risks we face. The committee’s major activities include:
| • | determining and amending risk management strategies, policies, guidelines and limits in conformity with the strategy established by our board of directors; |
| • | determining the appropriate level of risks that we should be willing to undertake; |
| • | allocating risk capital to each subsidiary and approving our subsidiaries’ risk limit requests; |
| • | reviewing our group-wide risk profile, including the level of risks we are exposed to and the status of our risk management operations; and |
| • | monitoring our subsidiaries’ compliance with our risk policies. |
The Group Risk Management Committee is comprised of our chief executive officer and four outside directors. It operates independently from all business units and individual board members, and reports directly to our board of directors. In addition, since our chief executive officer is a member of the committee, he is kept aware of risk-related issues. Our Group Risk Management Committee convenes at least quarterly, and makes decisions by majority vote of the attending members. At least a majority of the committee members must attend to constitute a quorum.
Group Risk Management Council
Our Group Risk Management Council is responsible for coordinating with the risk management units of our subsidiaries to ensure that they execute the policies, guidelines and limits established by the Group Risk Management Committee. The council’s major activities include:
| • | analyzing our risk status using information provided by our subsidiary-level risk management units; |
| • | adjusting the integrated risk-adjusted capital allocation plan and risk limits for each of our subsidiaries; |
| • | reviewing the key decisions of each Subsidiary Risk Management Committee, and discussing and resolving any risk management issues raised by those committees; |
| • | coordinating issues relating to the integration of our risk management functions; and |
| • | performing any other duties delegated by the Group Risk Management Committee. |
The Group Risk Management Council is comprised of our chief risk management officer and the head of our risk management department and the managing directors of the risk management units of all of our operating subsidiaries. It operates independently from all business units, and reports directly to the Group Risk Management Committee. Our Group Risk Management Council convenes on a monthly basis.
Our subsidiaries, in most cases through their respective risk management units, provide a variety of information to the Group Risk Management Council, including:
| • | reports regarding the status of overall risk management, the status of limit compliance, and analysis and results of quarterly credit reviews, stress testing and back testing; and |
| • | reports regarding asset and liability management matters, including changes in risk-weighted assets and the status of our credit portfolio on a periodic basis. |
Subsidiary Risk Management Committees
Each of our subsidiaries has delegated risk management authority to its Subsidiary Risk Management Committee. Each Subsidiary Risk Management Committee measures and monitors the various risks faced by the relevant subsidiary and reports to that subsidiary’s board of directors regarding decisions that it makes on risk management issues. It also makes strategic decisions regarding the operations of the relevant subsidiary, such as
195
Table of Contents
allocating credit risk limits, setting total exposure limits and market risk-related limits and determining which market risk derivatives instruments the subsidiary can trade. The major activities of each Subsidiary Risk Management Committee include:
| • | determining and monitoring risk policies, guidelines, limits and tolerance levels and the level of subsidiary risk in accordance with group policy; |
| • | reviewing and analyzing the subsidiary’s risk profile; |
| • | setting limits for and adjusting the risk-adjusted capital allocation plan and risk levels for each business unit within the subsidiary; and |
| • | monitoring compliance with our group-wide risk management policies and practices at the business unit and subsidiary level. |
Each Subsidiary Risk Management Committee is comprised of the subsidiary’s chief executive officer, the non-standing members of its board of directors and the director of its risk management unit.
Subsidiary Risk Management Council
Our subsidiaries generally have a Subsidiary Risk Management Council, which is responsible for supporting the relevant Subsidiary Risk Management Committee in the implementation of its risk management policies and guidelines for such subsidiary, including by reviewing and reporting on agenda items to be discussed at meetings of the relevant Subsidiary Risk Management Committee, reviewing reports from the relevant subsidiary risk management units and performing any other duties delegated by the relevant Subsidiary Risk Management Committee.
Each Subsidiary Risk Management Council is generally comprised of the subsidiary’s chief risk management officer, the head of its risk management unit and other executive officers responsible for such subsidiary’s risk management-related functions. It operates independently from all business units, and reports directly to the Subsidiary Risk Management Committee.
Woori Bank, Kyongnam Bank and Kwangju Bank have each established a similar multi-tiered risk management governance structure for its own operations. For example, Woori Bank’s Subsidiary Risk Management Committee is ultimately responsible for risk management for that subsidiary. It provides subsidiary board-level direction regarding risk management strategies and policies to the risk management bodies that are subordinate to it. Woori Bank’s Executive Risk Management Committee, which reports directly to Woori Bank’s Subsidiary Risk Management Committee and chief executive officer, implements the execution of these strategies and policies. The Executive Risk Management Committee works with various Woori Bank business units, including its risk management unit and its individual business units. The risk management unit directly implements and ensures compliance with Woori Bank’s risk policies and guidelines at an operational level. It monitors market risk and liquidity risk on a daily basis and credit risk and interest rate repricing gap risk on a monthly basis and makes quarterly reports to the Subsidiary Risk Management Committee and to the Group Risk Management Council.
Our non-banking subsidiaries generally have more simplified risk management governance structures.
Credit Risk Management
Our credit risk management policy objectives are to improve our asset quality, reduce our non-performing loans and minimize our concentration risk through a diversified, balanced and risk-weighted loan portfolio. Through our subsidiaries, we manage credit risk and continually monitor and improve our credit risk-related policies and guidelines to reflect changing risks in our business and the industries and sectors in which our customers operate.
We believe that an essential part of achieving our credit risk management objectives is utilizing a group-wide, standardized risk management system so that we can identify and manage the risks generated by our businesses using a standardized system. Each of Woori Bank, Kyongnam Bank and Kwangju Bank is currently
196
Table of Contents
using a standardized credit risk management system based on Woori Bank’s centralized credit risk management system called the CREPIA system. Woori Bank, together with several external consultants, completed the development and implementation of the CREPIA system in September 2004. CREPIA is a credit risk management system which combines credit risk management and the credit approval process on a transactional level with respect to individual borrowers and approval with respect to each individual loan or credit. Following upgrades to the CREPIA system completed in 2007, including the implementation of a “credit risk measurement engine,” the system quantifies credit risk with respect to corporate borrowers using a “mark-to-market” methodology, which reflects both the likelihood of a default by a borrower as well as the likelihood of a change in such borrower’s credit rating, and quantifies credit risk with respect to retail borrowers using a “default mode” methodology, which reflects the likelihood of a default by a borrower. We believe that CREPIA is a systematic and efficient credit evaluation system and that our banking subsidiaries have expedited their loan review process and improved their ability to monitor and evaluate its overall risk profile by using this system. The main characteristics of CREPIA are as follows:
| • | automation of credit risk management system, which allows us to centralize and automate many tasks relating to our credit risk management system; |
| • | automatic recognition and processing of different forms of credit, which allows us to process and approve different types of credit, such as new applicants, renewing applicants and changes in the condition of the loan or credit approved; |
| • | incorporation of credit risk management prior to approval of credit, which allows us to consider individualized characteristics of a borrower and enables us to calculate a more accurate price with respect to the loan or credit approved; |
| • | automatic credit risk monitoring after approval of credit, which allows us to evaluate and re-rate the loan or credit on a real-time basis as a result of any change in the characteristics of the borrower (including the condition of the underlying collateral, change in borrowing limit and early warning characteristics); and |
| • | automatic verification of internal procedures and regulations with respect to approval of credit, which reduces our operational risk and ensures that there are no material deviations from our loan and credit policies. |
From 2004, we also established a credit risk limit for each of our banking subsidiaries with respect to “large exposures.” We aim to avoid concentrations of exposure with respect to any single corporate borrower or affiliated group of corporate borrowers. Accordingly, we have established aggregate exposure limits based on each of our banking subsidiaries’ capital adequacy levels and, with respect to individual corporate borrowers, established limits by dividing the “expected loss” with respect to companies affiliated with such corporate borrower with the “unexpected loss” (a measurement of credit risk) of such borrower and converting that into an exposure amount. We use this as the basis for our “large exposure” limits with respect to such corporate borrower. In early 2012, we established similar “large exposure” limits for Woori FG Savings Bank.
From 2005, we also established a similar credit risk limit for each of our banking subsidiaries, Woori Investment & Securities and Woori Private Equity with respect to investment in private equity funds. Much like “large exposure” limits with respect to corporate borrowers, we aim to avoid concentrations of exposure with respect to any single private equity fund or affiliated group of funds. Accordingly, we have established aggregate investment limits based on the capital adequacy levels of each of our banking subsidiaries, Woori Investment & Securities and Woori Private Equity and, with respect to limits on each opportunity to invest, established limits depending on whether the target fund is an affiliate, or our participation or the participation by our subsidiaries is as a limited or general partner. In 2006, we also established a “principal investment” limit for investment activities that any of our banking subsidiaries, Woori Investment & Securities, Woori F&I and Woori Private Equity undertakes as a principal (as opposed to as an agent). Such principal investment limit was also established for Woori Aviva Life Insurance in 2009 and for Woori FG Savings Bank at the end of 2011. The principal investment limit for each subsidiary is set as a certain percentage of the capitalization of such subsidiary.
197
Table of Contents
We use our credit risk management systems to measure and control credit risk, to evaluate and approve new credit and to review and monitor outstanding credit. We conduct various quantitative and qualitative analyses to establish acceptable risk levels that provide what we believe are appropriate levels of return on investments. The credit risk management systems that we use to do this integrate various data, including customers’ financial and economic condition, limits on loans and guarantee amounts, cash flow evaluations, collateral levels, our desired profit margin and the likelihood of unexpected loan losses.
Each subsidiary monitors its level of risk, determines how that level compares to our target optimized level of risk on a monthly basis and produces risk analysis reports and optimization reports on a monthly basis and stress test reports on an ad hoc basis. These reports, which are sent monthly to the respective Subsidiary Risk Management Committees and quarterly to the Group Risk Management Committee, provide a basis to set risk limits for, and allocate capital to, a subsidiary’s business units.
Credit Evaluation and Approval
Our subsidiaries evaluate the credit of every loan applicant and guarantor before approving any loans, except for:
| • | loans guaranteed by letters of guarantee issued by the Korea Credit Guarantee Fund, the Korea Technology Credit Guarantee Fund or certain other specified Korean government-controlled funds; |
| • | loans guaranteed by highly rated banks; |
| • | loans fully secured by deposits with us; and |
| • | loans against commercial promissory notes issued by creditworthy companies at a discount to the face value of the note determined by the issuer’s creditworthiness. |
The evaluation and approval process differs depending on whether the loan is a corporate loan, a general household consumer loan, or a mortgage or home equity loan, and there is a separate process for credit card applications. Although each of our commercial banking subsidiaries currently uses slightly different credit scoring and approval systems in determining whether to approve a loan, we have in recent years implemented a group-wide standardized “expected loss” and “unexpected loss” credit risk system which we believe enables us to better allocate risk capital on a group-wide basis by evaluating “unexpected loss” (a measurement of credit risk), “VaR” (a measurement of market risk) and “earnings at risk” (a measurement of whether our assets and liabilities are mismatched). We intend to also standardize our risk-adjusted performance measurement system and implement that system on a group-wide basis.
Our subsidiaries have undertaken a number of initiatives to develop credit evaluation and loan approval procedures that are more systematic and efficient. We prefer to use credit rating systems in our credit evaluation and loan approval process because they:
| • | yield a uniform result regardless of the user; |
| • | can be used effectively by employees who do not have extensive experience in credit evaluation; |
| • | can be easily updated to reflect changing market conditions by changing how factors are weighted; |
| • | significantly limit the scope of employee discretion in the loan assessment and approval process; and |
| • | improve loan processing times while generally resulting in declines in delinquencies among new borrowers. |
For example, in September 2004 Woori Bank introduced its CREPIA credit evaluation system for corporate loans (including small- and medium-sized enterprise loans) and a consumer credit evaluation system for consumer loans. Following the introduction of its consumer credit evaluation system, Woori Bank substantially reduced the authority of branch managers and loan officers to approve consumer loans based solely on their own judgment. Woori Bank’s consumer loan approval process historically took as long as three days, but now generally takes less than 24 hours even when applications are reviewed by headquarters personnel. Kyongnam Bank and Kwangju Bank have a similar evaluation and approval process, and are currently using standardized credit evaluation systems based on the CREPIA system following the completion of upgrades to standardize such systems in 2007.
198
Table of Contents
Customers apply for loans by submitting a loan application through one of our subsidiaries’ branches. These applications are initially reviewed using the appropriate credit evaluation system and, in the case of applications for a small amount or involving applicants with little or no credit risk, are approved by the branch manager or a relationship manager acting in concert with a credit officer based on the credit risk rating they receive under that system. Applications for larger loans and loans which are determined to involve greater credit risk are approved by bodies with greater authority, depending on where those loans fall in a matrix of size, collateral and credit risk. These loan applications will be referred to a credit officer committee at a bank office located near the customer, which may or may not be at the subsidiary’s headquarters. Every credit officer committee is made up of credit officers from headquarters and has the same level of authority. Applications that cannot be approved by a credit officer committee are referred to a senior credit officer committee or the Loan Committee of the relevant subsidiary, depending on loan size, collateral and credit risk. The following table sets forth as an example the various Woori Bank committees and personnel involved in its credit evaluation and loan approval process:
| Committee |
Members |
Approval Process | ||
| Headquarters Approval |
||||
| Loan Committee |
Head of the credit support unit, head of the risk management unit and other members selected by the bank chief executive officer (no more than seven persons, with at least a majority of them being risk management personnel) | 2/3 required for approval; 2/3 required to participate | ||
| Headquarters/Regional Approval |
||||
| Senior Credit Officer Committee |
One head senior credit officer and four to six other senior credit officers (five to seven persons) |
2/3 required for approval; 2/3 required to participate | ||
| Credit Officer Committee |
At least one senior credit officer and two other credit officers (at least three persons) | 2/3 required for approval; 2/3 required to participate | ||
| Individual Approval |
||||
| Senior Relationship Manager |
Individual | Approval of the individual | ||
| Relationship Manager |
Individual | Approval of the individual | ||
| Branch Manager |
Individual | Approval of the individual | ||
Different individuals or committees review and approve loan applications depending on various factors, including:
| • | the size and type of the loan; |
| • | the level of credit risk established by the credit rating system; |
| • | whether the loan is secured by collateral; and |
| • | if the loan is secured, an assessment of the collateral. |
Loan applications are generally reviewed only by the highest-level committee required to approve the loan, although multiple reviews, including separate reviews at the branch, regional and headquarters level, may occur depending on the size and terms of any particular loan or a borrower’s credit risk.
Corporate Loan Approval Process
Each of our banking subsidiaries’ branches reviews corporate loan applications using a credit evaluation system for corporate borrowers. Although these systems historically differed among our subsidiaries, our banking subsidiaries currently use standardized credit evaluation systems (including standardized credit risk measurement engines) following the completion of upgrades in 2007 to standardize these systems as part of our
199
Table of Contents
group-wide, standardized risk management system. Each corporate credit evaluation system measures various quantitative and qualitative factors. The model used by the credit evaluation system to review an application depends, however, on certain characteristics of the potential borrower. For example, Woori Bank’s credit risk management department, together with its large corporate loan department and small- and medium-sized enterprise loan department, has developed separate credit evaluation models for large corporate borrowers that are subject to external audit under the External Audit Act of Korea, large corporate borrowers that are not subject to external audit, medium-sized enterprises and SOHO borrowers that either have outstanding loans, or are applying for a loan, in excess of (Won)1 billion. In general, each model uses scores from both a computerized evaluation of quantitative financial factors, such as cash flow and income, and more qualitative factors which are scored using judgments by the credit officer or officers reviewing the application to produce an overall credit risk rating. These credit evaluation systems provide our subsidiaries with tools to make consistent credit decisions and assist them in making risk-based pricing decisions. For example, Woori Bank’s CREPIA system, depending on whether the borrower is audited by independent auditors and its size, produces two separate scores based on one of 14 rating models: one for quantitative current financial factors, which is weighted 60% in determining the CREPIA credit risk rating, and another for the more qualitative factors that the judgment of our credit officers plays a more significant part in determining, which is weighted 40%. The CREPIA credit risk rating estimates the probability that Woori Bank will recover extended credits and the likelihood that borrowers will default. Qualitative factors included in CREPIA include:
| • | a customer’s future financial condition; |
| • | its competitive position in the industry; |
| • | its industry situation; |
| • | the quality of its management; |
| • | its technological merits; |
| • | its operations; |
| • | the nature and the location of any collateral; and |
| • | our level of priority in that collateral to estimate non-recovery risks. |
These qualitative factors are input into the CREPIA system by the credit officer, and are scored based on his or her historical experience and that of the bank.
The CREPIA system produces separate credit risk ratings for each borrower and for each loan requested by that borrower. Woori Bank’s credit analysis and approval center evaluates and approves corporate loan applications based on these credit risk ratings. The CREPIA system assigns each borrower and facility one of the following fourteen credit risk rating grades from AAA to D, which are classified as follows: AAA (extremely strong), AA (very strong), A+ (strong), A– (good), BBB+ (more adequate), BBB (adequate), BBB– (less adequate), BB+ (less susceptible), BB (susceptible), BB– (more susceptible), B+ (slightly weak), B– (weak), C (very weak) and D (default). Certain loans are subject to review by the Loan Committee depending on the size of the loan and the determined credit risk rating. Examples of this include loan applications for secured loans in excess of (Won)60 billion regardless of the borrower’s or facility’s credit risk rating, and, at the other extreme for unsecured loans, loan applications in excess of (Won)4 billion for a borrower or facility with a credit risk rating of BB– to C. Applications from borrowers with loans on a subsidiary’s watch list (see “—Credit Review and Monitoring” below) are also automatically reviewed by its Loan Committee.
Our subsidiaries use the same systems to evaluate and approve applications from small- and medium-sized enterprises that they use to evaluate other corporate borrowers, but use different credit evaluation models. For example, Woori Bank implemented its current credit evaluation models for small- and medium-sized enterprise customers in September 2004. These models, which are incorporated into the CREPIA system, use the same quantitative and qualitative factors that Woori Bank uses to evaluate other corporate customers. However, the small- and medium-sized enterprise models apply a 50% weighting to the score derived from quantitative factors and a 50% weighting to the score derived from the more flexible qualitative factors in determining the credit risk
200
Table of Contents
rating. In September 2004, Woori Bank introduced a separate credit evaluation model to evaluate newly opening small- and medium-sized enterprises that relies solely on qualitative factors. Woori Bank has also adopted a separate credit evaluation system for SOHOs (such as pharmacies, clinics and restaurants) which either have outstanding loans, or are applying for a loan, of (Won)1 billion or less that uses simpler credit evaluation models and resembles our application scoring system for new retail customers. In December 2006, Woori Bank implemented a new credit evaluation model, which reflects Woori Bank’s new capital adequacy requirements and apply to consumer and corporate loans (including loans to small- and medium-sized enterprises). Woori Bank also introduced a new corporate rating model dedicated to evaluating large corporate borrowers in July 2008.
With respect to the evaluation of any collateral to which a commercial loan application relates (which principally consists of land, buildings and equipment), the fair value of such underlying collateral for commercial loans is appraised by external valuation experts and such appraisals are collated in Woori Bank’s CREPIA system. Woori Bank uses its CREPIA system to manage its lending activities, and inputs data gathered from loan application forms, credit scores of borrowers and the appraisal value of collateral provided by external valuation experts into the CREPIA system and updates such information periodically to reflect changes in such information (such as any changes in credit scores of borrowers or the appraisal value of collateral). In addition, to validate the appropriateness of the appraisal values provided by such external valuation experts, we review the qualification of the external valuation experts (including a review of whether such experts are legitimately registered with the Korea Association of Property Appraisers) and evaluate the assumptions and valuation model used by such experts as well as the appropriateness of variables by reference to market data and comparisons to actual transaction prices in similar regions.
Woori Bank supplements the CREPIA evaluation by testing potential exposures with another separate model that is an element of its portfolio management system. This model analyzes information based primarily on current factors, such as a potential borrower’s stock price. This model provides a check on potential lending, including potential deterioration of outstanding credits, in cases where there have been significant changes in a borrower’s status that may not be fully reflected in its most recently available quantitative or qualitative data.
We have set credit limits for our corporate customers. Some of these limits, particularly those imposed by Korean banking regulations, apply to all of our subsidiaries, and are aimed at preventing loan concentrations relating to any single customer. See “Item 4B. Business Overview—Supervision and Regulation—Principal Regulations Applicable to Banks—Financial Exposure to Any Individual Customer and Major Shareholder.” In certain cases, our subsidiaries have introduced even stricter exposure limits than required by regulation, including additional limitations on providing credit to certain borrowers. For example, Woori Bank has introduced and implemented internally developed large exposure limits that are stricter than the applicable Financial Services Commission requirements.
In evaluating applications, credit officers or the Loan Committee will often, in addition to reviewing ratings from these credit evaluation models, also refer to corporate information gathered or ratings assigned by external credit rating agencies, such as the Korea Federation of Banks, Korea Information Service, Korean government-released information on bankruptcy rates, National Information & Credit Evaluation Inc. and Korea Management Consulting & Credit Rating Corporation. They review the information we obtain from these sources and compare it to the information we have developed internally with respect to our customers to improve the accuracy of our internal credit ratings.
Consumer Loan Approval Process
The consumer loan department of each of our banking subsidiaries evaluates and approves consumer loan applications using dedicated consumer credit evaluation systems. Although these systems historically differed among our subsidiaries, our banking subsidiaries currently use standardized credit evaluation systems (including standardized credit risk measurement engines) following the completion of upgrades in 2007 to standardize these systems as part of our group-wide, standardized risk management system. Each of the consumer credit evaluation systems currently in use uses a standardized credit scoring system to evaluate and approve consumer loan applications and determine the appropriate pricing for the loan. Each consumer credit evaluation system measures various quantitative factors to produce a credit score for each application. As similarly situated
201
Table of Contents
consumer loan customers generally have similar performance profiles when evaluated collectively, these systems enable us to better evaluate individual customers using group characteristics.
Woori Bank, for example, began using its consumer credit evaluation system to review consumer loan applications in September 2004. That system assigns a credit score to each application based on its evaluation of various factors. These factors include any loan and guarantee limits we have set for particular borrowers or groups of borrowers and our evaluation of their cash flows and credit profiles. The system gives each customer’s loan application a score from one to ten. From March 2006, Woori Bank also added another scoring system based on the external ratings provided by the Korea Credit Bureau. Applications are classified as “automatically approved,” “automatically rejected” and “subject to further evaluation” based on a combination of the scores of these two systems. For example, applications scoring between one to six under Woori Bank’s internal system that also score between one to eight in the external ratings provided by the Korea Credit Bureau are automatically accepted, while applications scoring ten under Woori Bank’s internal system and nine or above in the external ratings provided by the Korea Credit Bureau are automatically rejected. Woori Bank uses this system to evaluate all new consumer loan applications, except for loans fully secured by deposits with Woori Bank.
Woori Bank augments its consumer credit evaluation system with a behavioral scoring system. The behavioral scoring system enhances the consumer credit evaluation system by enabling the consideration of factors not previously evaluated, including the customer’s spending history and credit behavior. By the nature of the information it analyzes, however, the behavioral scoring system can only be used for applications of persons who are existing borrowers, generally consisting of roll-overs of outstanding amounts or increases to existing credit limits.
We also evaluate any collateral to which a consumer loan application relates (which principally consists of residential properties) using the fair value of the underlying collateral appraised by Korea Investors Service as part of our loan approval process. Such appraisals are collated in the CREPIA system used by Woori Bank and similar systems used by Kyongnam Bank and Kwangu Bank, and such information is updated periodically to reflect changes (such as any changes in credit scores of borrowers or the appraisal value of collateral). For example, Woori Bank automatically obtains re-evaluations for the underlying collateral for secured consumer loans and mortgages every month with respect to apartments. If the value of the collateral declines, we may have the ability to require that the borrower provide more collateral or to change the payment terms of the relevant loan.
Credit Card Approval Process
We have worked to ensure that risk management and credit extension policies with respect to our credit card operations reflect our group-wide risk management policies and guidelines. Although Woori Credit Card merged with Woori Bank in March 2004, we maintain those credit card operations as a separate business unit within Woori Bank, and that business unit maintains separate credit risk management policies and procedures.
Woori Bank’s credit card business unit reviews each new card application for completeness, accuracy and creditworthiness. It bases this review on various factors that assess the applicant’s ability to repay borrowed amounts. The review process involves three stages:
| • | Initial Application Process. The credit card business unit verifies basic information by requesting certain documents from the applicant, generally contacts the applicant directly (usually by telephone, although there are personal visits to some applicants) and statistically analyzes the applicant’s personal credit history together with financial and default information gathered from third-party sources and its internal database. The analysis considers various factors including employment, default status and historical relationships with Woori Bank and any delinquency history with other credit card companies. The credit card business unit also reviews information about an applicant obtained from external databases maintained by the Korea Federation of Banks, Korea Information Service Inc., Korea Credit Bureau Inc. and a consortium of seven Korean credit card providers. |
| • | Application Scoring System Process. The application scoring system at the credit card business unit is a standardized evaluation tool used to determine the probability of a credit card applicant defaulting during the one-year period following issuance. The application scoring system, using a statistical model, assigns |
202
Table of Contents
| risks to factors that indicate a probability of non-payment. The model analyzes credit history, occupation and income data to develop a combined risk score. The applicant’s eligibility to receive a credit card and credit limit is determined by its anticipated delinquency ratio over 90 days within one year. |
| • | Credit Assessment. If the application is approved, then the application scoring system assessment is used to determine the applicant’s credit limit. The aggregate credit limit for a new applicant who is an individual rarely exceeds (Won)20 million. There is a separate but similar system for determining the credit limit available to corporate card applicants, which will generally be higher than limits available to individual applicants but will not provide for the ability to obtain cash advances. |
The initial application process is handled at Woori Bank’s branch level. Final credit approval is subject to the application scoring system review conducted at Woori Bank’s headquarters. The entire approval process generally takes two to three days and the applicant receives the new card within one week after making an application. The credit card business unit evaluates and updates the application scoring system on a monthly basis (or more frequently as required) to incorporate new data or adjust the importance placed on existing data or market conditions.
Kyongnam Bank and Kwangju Bank currently operate a similar application process, although in the case of Kyongnam Bank, the approval process itself takes place within BC Card.
Credit Review and Monitoring
Our credit review and monitoring procedures are designed to reduce the risks of deterioration in our asset quality and to maintain acceptable levels of portfolio risk. These procedures include:
| • | confirming a borrower’s credit rating or score; |
| • | ensuring the accuracy of the credit analysis done by our credit officers; and |
| • | ensuring compliance with internal policies relating to loan approval. |
We believe that these procedures enable us to identify potential non-performing loans as soon as possible and minimize the possibility of approving in advance loans that will become non-performing. These procedures also enable us to manage credit risk more effectively and set interest rates to more accurately reach our targeted level of return.
Loan Review and Monitoring
Each of our banking subsidiaries monitors credit risk with respect to its borrowers using its own loan review system. Each banking subsidiary has a loan review department that oversees its review and monitoring efforts. After a loan has been approved, the relevant materials or the results generated by the subsidiary’s relevant credit evaluation system, together with any supporting data, are reviewed by an officer in that department. There are three types of reviews that our subsidiary loan review units undertake:
| • | Desk review. Desk reviews are the most common and are generally done within five days after a loan has been approved. Although the process is similar, different loans are automatically reviewed by our subsidiaries based on the size of the loan. At Woori Bank, for example, the loan review department will initiate a desk review of loans approved by a credit officer committee or the Loan Committee of the subsidiary, for any corporate loan that exceeded (Won)5 billion, any consumer loan that exceeded (Won)1 billion, any loan to a housing applicant group that exceeded (Won)5 billion or any loan where the loan terms were adjusted. For loans originating from a branch, the loan review department will initiate a desk review for new domestic loans or credit limit increases that exceed (Won)300 million. For new overseas loans, desk reviews are conducted for amounts that exceed US$300,000. |
| • | Periodic review. Periodic reviews are done on a quarterly, semi-annual or annual basis with respect to loans that are current and exceed (Won)10 billion or with respect to borrowers who are on a “watch list” with respect to possible insolvency. Quarterly periodic reviews are done for certain corporate borrowers, depending on their size and the borrower’s industry. |
203
Table of Contents
| • | Ad hoc review. Ad hoc reviews can be done at any time. The head of the subsidiary risk management department or the chief executive officer or chief financial officer of the respective subsidiary can initiate ad hoc reviews. Loan review officers who are responsible for desk and periodic reviews also conduct ad hoc reviews. |
Following a review, the subsidiary’s sales office may hold additional meetings with the borrower and adjust the loan amount or the borrower’s credit rating. The loan review department may also direct sales office personnel to institute early collections or to adjust a borrower’s credit rating, total exposure and asset portfolio without consulting the borrower. The loan review officer may request that the credit officer adjust a borrower’s credit ratings based on various factors, including asset quality, credit limits, applied interest rates and our credit policies. We also continually review other factors, such as industries in which borrowers operate and their domestic and overseas assets and operations, to ensure that our ratings are appropriate.
Woori Bank monitors and manages its exposures to and credit limits for corporations and chaebols on a daily basis. Woori Bank uses its Total Exposure Management System to make real-time inquiries regarding its exposures, either by company or by chaebol, and to manage the credit limits for all kinds of business transactions. Woori Bank monitors and analyzes these exposures on a monthly basis. Corporate borrowers on Woori Bank’s “watch list” are monitored more closely and with respect to additional aspects of their relationships with us. Woori Bank places borrowers on its watch list when it believes that any impediment on a borrower’s ability to meet its financial obligations exists or is pending. Woori Bank may also monitor newly extended credits or any additional credits extended to a previous borrower more frequently if it believes additional monitoring is necessary after reviewing the loan approval process. Credits outstanding to a particular industry or region that Woori Bank believes are higher risk are monitored even more frequently. Based on the results of such monitoring, the loan review department of each of our subsidiary banks provides monthly reports to its chief executive officer and its Subsidiary Risk Management Committee. Kyongnam Bank and Kwangju Bank also monitor their exposures to corporate borrowers but only on a monthly basis and using less advanced systems.
The consumer loan department of each of our banking subsidiaries has the ability to conduct daily surveillance on the status of its retail borrowers through an on-line system established by the Korea Federation of Banks. This system, which tracks consumer loans at all major Korean banks and non-banking institutions, permits us to track all loan defaults by any borrower. We evaluate the need to monitor consumer loans by using our consumer credit evaluation system, including, in the case of Woori Bank, its behavioral scoring system, and make adjustments to the credit scoring formula based on the results of that process.
Each subsidiary’s loan review department in its risk management unit is required to submit monthly loan review reports and quarterly deficiency reports to the chief executive officer and the head of the risk management unit of that subsidiary. The chief executive officer then provides feedback to the relevant sales offices of the banking subsidiary’s branches through that subsidiary’s auditing team or relevant business unit. Based on these reports, we or our subsidiaries may, for example, stop lending to particular borrowers, change credit limits or modify our loan approval procedures. We do not monitor loans to certain borrowers, such as loans to government entities such as the KDIC or to companies in workout proceedings.
Credit Card Review and Monitoring
Woori Bank’s credit card business unit monitors its risk exposure to individual accounts on a regular basis. It monitors each customer’s card usage trends and negative credit data such as delinquency information through both its own credit risk management system (which was developed with the assistance of an outside consultant) and BC Card’s similar system (which BC Card maintains for its member banks). These systems monitor the behavior of users of credit cards issued by Woori Bank, using both internally generated information and information from external sources. The credit card business unit statistically analyzes this information to estimate each customer’s creditworthiness on a monthly basis. The credit risk management system is an integral part of the credit practices at the credit card business unit and is used to determine increases or decreases in credit limits, reset interest rates, set fee levels, authorize special transactions and approve card loans using criteria such as:
| • | how much credit each customer has incurred in the past (i.e., frequency and amount of payments); |
204
Table of Contents
| • | whether a customer uses his card to make credit card purchases or to get cash advances; |
| • | internal credit scores; and |
| • | whether the customer has been delinquent in making payments. |
After assigning appropriate weightings to each factor, the system computes a behavior score and uses that score to classify each cardholder. Each customer’s credit limit is subject to adjustment in accordance with the monthly updated score. The credit card business unit uses these results and the results of its application scoring system to evaluate its credit risk management system and make adjustments to its credit scoring formula based on the results of that process.
The credit card business unit’s credit risk management system has also been able to run various simulations in connection with monitoring its operations, including:
| • | new product simulations, which predict a customer’s likely spending pattern when using a new credit card product and analyzes that pattern to predict the new product’s costs, delinquencies and profitability; and |
| • | credit use limit simulations, which test whether a customer’s credit limit has been properly set by simulating an increase or decrease of that limit. |
The credit card business unit’s credit administration team manages customer credit risk for users of credit cards issued by Woori Bank. It reviews and updates its underwriting, credit evaluation, collection, servicing and write-off procedures, and the terms and conditions of card agreements, from time to time in accordance with its business practices, applicable law and guidelines issued by regulatory authorities. Kyongnam Bank currently operates customer credit risk with respect to its credit card business using the BC Card system.
Early Warning Systems
Each of our banking subsidiaries and Woori Bank’s credit card business unit have developed separate early warning systems that monitor the status of both commercial and retail borrowers and evaluate all of a customer’s outstanding credits. These systems monitor various factors, including the financial status, financial transaction status, industry rating and management status of borrowers. They enable our subsidiaries to find defaults and signs of potential delinquency in advance, monitor these problematic credits properly before any default or delayed payment occurs and keep track of information on the credit status of borrowers. Updated information is input as it becomes available, either automatically from internal and external sources or manually. This information includes data relating to:
| • | credit evaluation and monitoring system results, which determine if a borrower should be put on a watch list; |
| • | loan transactions, such as a borrower’s remaining line of credit and whether it has any dishonored notes, overdue loans or setoffs with respect to collateral deposits which have not matured; |
| • | deposit transactions, such as any decrease in a borrower’s average deposit balance, requests for large volumes of promissory notes or checks, or the inability to pay immediately available funds owed when due; |
| • | foreign exchange transactions, such as unpaid amounts of a borrower’s purchased export bills that have exceeded the maturity date; and |
| • | other information, such as a borrower’s management and employees, business operations, production operations, financial affairs and accounting operations and bank transactions. |
We also monitor borrowers’ credits through on-line credit reports that are provided by Korea Information Service and National Information & Credit Evaluation, Inc., which are Korean credit reporting agencies.
205
Table of Contents
After gathering this information, for example at Woori Bank, the CREPIA system reviews such information to monitor any changes that could affect the credit rating of the borrower, approval conditions with respect to the loan or credit, underlying collateral or assigned credit limit of the borrower. Depending on the likelihood of the change, the system automatically sends a signal to the responsible credit officer. The officer then evaluates the information and formulates an action plan, which could result in an adjustment in the borrower’s credit rating or loan pricing, a re-evaluation of the loan or the taking of other preventative measures.
Credit Remediation
We believe that by centralizing the management of our non-performing credits within each subsidiary, we can implement uniform policies for non-performing credit resolution, pool institutional knowledge and create a more specialized (and therefore more efficient) work force. Each of our subsidiaries has one or more units that are responsible for managing non-performing loans. At Woori Bank, for example, the Credit Management and Collection Department and the Corporate Restructuring Department generally oversee the process for resolving non-performing loans transferred to them by other Woori Bank business units. When a loan becomes non-performing, the units at our banking subsidiaries that are responsible for monitoring non-performing loans will begin a due diligence review of the borrower’s assets, send a notice demanding payment or stating that the unit will take legal action, and prepare for legal action. At the same time, we initiate our non-performing loan management process. Once we have confirmed the details of a non-performing loan, we make efforts to recover amounts owed to us. Methods for resolving non-performing loans include commencing collection proceedings or legal actions and writing off such loans, transferring them to subsidiaries in charge of collection and authorizing those subsidiaries to recover what they can. We have also disposed of a number of non-performing credits to KAMCO, UAMCO and various special purpose companies. See “Item 4B. Business Overview—Assets and Liabilities—Asset Quality of Loans—Non-Performing Loan Strategy.”
Market Risk Management
The principal market risks to which we are exposed are interest rate risk, equity risk and, to a lesser extent, foreign exchange risk and commodity risk. We divide market risk into risks arising from trading activities and risks relating to management of our assets and liabilities. The financial instruments that expose us to market risks are primarily trading and available-for-sale securities and financial derivatives and, with respect to commodity risk, commodity derivatives.
Our Group Risk Management Committee establishes our risk capital allocation and risk limits for our trading activities. The Group Risk Management Committee has delegated the responsibility for coordinating market risk management for trading activities to the Group Risk Management Council. The risk management units of each of our subsidiaries coordinates with the Group Risk Management Council. These units review on a daily basis reports that include trading profits and losses, position reports, stress test results and “value at risk” results for our trading activities. Any violations of such risk limits are reported to the Group Risk Management Department.
Market Risk Management for Trading Activities
We measure market risk from trading activities to monitor and control the risk of our business groups and teams that perform those activities. Our trading activities consist of:
| • | trading activities for our own account to realize short-term trading profits in debt (primarily Won-denominated), equity and foreign exchange markets based on our forecasts of changes in market situation and customer demand; and |
| • | trading activities involving derivatives transactions, including interest rate and foreign exchange swaps, forwards, futures and options and, to a lesser extent, commodity derivatives, primarily to sell derivatives products to our customers and to hedge our own market risk. |
206
Table of Contents
Market risk arising from our trading activities can be subdivided into interest rate risk, equity risk, foreign exchange risk and commodity risk:
| • | Interest rate risk is a significant risk to which our trading activities are exposed. This risk arises primarily from our debt securities (which are primarily held by Woori Bank). We set different risk limits for our interest rate risk for our trading and non-trading debt portfolios. |
| • | Equity risk arises from price and volatility fluctuations in equity securities and derivatives. |
| • | Foreign exchange risk arises from foreign currency-denominated assets and liabilities in both our trading and non-trading accounts and financial derivatives involving foreign currencies, which are not controlled separately on a trading and asset/liability management basis. |
| • | Commodity risk arises from price and volatility fluctuations in commodity derivatives. |
The Group Risk Management Committee monitors market risk both for the group and for each subsidiary individually. See “—Standardization Strategy.” The Group Risk Management Committee has established a maximum “market risk appetite” for each subsidiary, which is defined as the risk capital of a particular subsidiary divided by its available capital. “Risk capital” is a benchmark figure that determines the VaR limits, accumulated loss limits (for trading portfolios) and present value of a basis point (or PVBP) limits (for non-trading available-for-sale assets) for each subsidiary. Available capital generally consists of stockholder’s equity. Using this benchmark, as of December 31, 2011, we have established market risk limits with respect to our subsidiaries as shown in the following table:
| Trading Portfolio | Non-Trading Portfolio |
|||||||||||||||
| VaR Limit | Accumulated Loss Limit | |||||||||||||||
| Quarter | Annual | PVBP Limit | ||||||||||||||
| (in billions of Won) | ||||||||||||||||
| Woori Bank |
(Won) | 20.0 | (Won) | 100.4 | (Won) | 200.8 | (Won) | 1.981 | ||||||||
| Kyongnam Bank |
1.8 | 8.4 | 16.7 | 0.337 | ||||||||||||
| Kwangju Bank |
0.7 | 2.4 | 4.8 | 0.217 | ||||||||||||
Each of our subsidiaries generally manages its market risk at the portfolio level, rather than on a credit-by-credit basis. To control its exposure, each of our subsidiaries takes into consideration the VaR limits, accumulated loss limits and PVBP limits set by the Group Risk Management Committee in determining its internal allocation of risk among its various portfolios. Each subsidiary also sets its own stop loss limits with respect to particular types of transactions. Each subsidiary uses an integrated market risk management system to manage market risks for its debt and equity trading operations. This system enables each subsidiary to generate consistent VaR numbers for all of its trading activities.
In addition, we have implemented internal processes which include a number of key controls designed to ensure that fair value is measured appropriately, particularly where a fair value model is internally developed and used to price a significant product. See “Item 5A. Operating Results—Critical Accounting Estimates—Valuation of Financial Assets and Liabilities” and Notes 2-(9)-5), 3-(3) and 11 of the notes to our consolidated financial statements. For example, Woori Bank’s Risk Management Department reviews the existing pricing and valuation models on a regular basis, with a focus on their underlying modeling assumptions and restrictions, to assess the appropriateness of their continued use. In consultation with Woori Bank’s Trading Department, the Risk Management Department recommends potential valuation models to Woori Bank’s Fair Value Evaluation Committee. Upon approval by Woori Bank’s Fair Value Evaluation Committee, the selected valuation models are reported to its Risk Management Committee.
Value at Risk analysis. We use daily VaR to measure market risk. Our daily VaR is a statistically estimated maximum amount of loss that can occur for a day. We use a 99% confidence level to measure our daily VaR, which means the actual amount of loss may exceed the VaR, on average, once out of 100 business days. We use the “variance-covariance method” which takes into account the diversification effects among different risk factors. This method is based on two assumptions: first, that the distribution of risk factors is normal; and, second, that profit and loss is a quadratic function of the returns. Different VaR methodologies and distributional assumption could produce a materially different VaR.
207
Table of Contents
Although VaR is a commonly used market risk management technique, it has some inadequacies. Since it is a statistical approach, VaR estimates possible losses over a certain period at a particular confidence level using past market movement data. Past market movements, however, are not necessarily a good indicator of future events. Another problem with VaR is that the time periods used for the model, generally one or ten days, are assumed to be a sufficient holding period before liquidating the relevant underlying positions. If these holding periods are not sufficient, or too long, VaR may understate or overstate the potential loss. VaR is most appropriate as a risk measure for trading positions in liquid financial markets and will understate the risk associated with severe events, such as a period of extreme liquidity.
The following table shows our daily VaR for each of Woori Bank, Kyongnam Bank and Kwangju Bank as of December 31, 2010 and 2011 at a 99% confidence level for a one-day holding period, for interest rate risk, equity risk, foreign exchange risk and commodity risk relating to our trading activities.
| Interest Rate Risk |
Equity Risk |
Foreign Exchange Risk |
Commodity Risk |
Less: Diversification |
VaR for Overall Trading Activities |
|||||||||||||||||||
| (in millions of Won) | ||||||||||||||||||||||||
| As of December 31, 2010 |
||||||||||||||||||||||||
| Woori Bank |
3,770 | 2,005 | 4,042 | 13 | 5,452 | 4,377 | ||||||||||||||||||
| Kyongnam Bank |
70 | 298 | 27 | — | 76 | 319 | ||||||||||||||||||
| Kwangju Bank |
86 | 2 | 7 | — | 8 | 88 | ||||||||||||||||||
| As of December 31, 2011 |
||||||||||||||||||||||||
| Woori Bank |
5,066 | 2,978 | 2,745 | 3 | 6,391 | 4,402 | ||||||||||||||||||
| Kyongnam Bank |
78 | 160 | 32 | — | 93 | 177 | ||||||||||||||||||
| Kwangju Bank |
11 | 1 | 12 | — | 8 | 16 | ||||||||||||||||||
In 2011, the average, high, low and ending amounts of daily VaR for each of Woori Bank, Kyongnam Bank and Kwangju Bank relating to its trading activities (at a 99% confidence level for a one-day holding period) were as follows:
| Trading activities VaR for 2011 | ||||||||||||||||
| Average | Minimum | Maximum | As of December 31, 2011 |
|||||||||||||
| (in millions of Won) | ||||||||||||||||
| Woori Bank |
||||||||||||||||
| Interest risk |
(Won) | 5,113 | (Won) | 2,878 | (Won) | 7,471 | (Won) | 5,066 | ||||||||
| Equity risk |
3,947 | 1,666 | 5,608 | 2,978 | ||||||||||||
| Foreign exchange risk |
3,332 | 1,307 | 6,378 | 2,745 | ||||||||||||
| Commodity risk |
134 | 2 | 773 | 3 | ||||||||||||
|
|
|
|
|
|
|
|
|
|||||||||
| Total risk |
(Won) | 5,724 | (Won) | 3,331 | (Won) | 9,304 | (Won) | 4,402 | ||||||||
|
|
|
|
|
|
|
|
|
|||||||||
| Kyongnam Bank |
||||||||||||||||
| Interest risk |
(Won) | 90 | (Won) | 15 | (Won) | 244 | (Won) | 78 | ||||||||
| Equity risk |
577 | 160 | 934 | 160 | ||||||||||||
| Foreign exchange risk |
25 | 6 | 70 | 32 | ||||||||||||
| Commodity risk |
— | — | — | — | ||||||||||||
|
|
|
|
|
|
|
|
|
|||||||||
| Total risk |
(Won) | 580 | (Won) | 177 | (Won) | 942 | (Won) | 177 | ||||||||
|
|
|
|
|
|
|
|
|
|||||||||
| Kwangju Bank |
||||||||||||||||
| Interest risk |
(Won) | 25 | (Won) | 1 | (Won) | 183 | (Won) | 11 | ||||||||
| Equity risk |
8 | — | 80 | 1 | ||||||||||||
| Foreign exchange risk |
6 | 1 | 24 | 12 | ||||||||||||
| Commodity risk |
— | — | — | — | ||||||||||||
|
|
|
|
|
|
|
|
|
|||||||||
| Total risk |
(Won) | 29 | (Won) | 4 | (Won) | 180 | (Won) | 16 | ||||||||
|
|
|
|
|
|
|
|
|
|||||||||
208
Table of Contents
Stress test. In addition to VaR, we perform stress testing to measure market risk. As VaR assumes normal market situations, we assess our market risk exposure to abnormal market fluctuations through stress testing. Stress testing is an important way of supporting VaR since VaR is a statistical expression of possible loss under a given confidence level and holding period. It does not cover potential loss if the market moves in a manner that is outside our normal expectations. Stress testing projects the anticipated change in value of holding positions under certain scenarios assuming that we take no action during a stress event to change the risk profile of a portfolio. The following table shows, for each identified subsidiary, the loss that would have occurred in its trading portfolio as of December 31, 2011 for assumed short-term extreme changes of a +/-20% change in the equity market and a +/-60 basis point change from interest rates prevailing in the market on that date, under an abnormal stress environment.
| (in billions of Won, except percentages) | ||||||||||||||||||||||||
| Equity Market Chart Market fluctuation amount |
(20 | )% | (10 | )% | (5 | )% | 5 | % | 10 | % | 20 | % | ||||||||||||
| Woori Bank |
(Won) | 5.4 | (Won) | (3.5 | ) | (Won) | (2.6 | ) | (Won) | 2.2 | (Won) | 4.6 | (Won) | 13.8 | ||||||||||
| Kyongnam Bank |
(0.9 | ) | (0.4 | ) | (0.2 | ) | 0.2 | 0.4 | 0.9 | |||||||||||||||
| Kwangju Bank |
— | — | — | — | — | — | ||||||||||||||||||
| (in billions of Won, except basis points) | ||||||||||||||||||||||||
| Interest Rate Chart Basis point fluctuation amount |
|
(60) basis |
|
|
(40) basis points |
|
|
(20) basis points |
|
|
20 basis points |
|
|
40 basis points |
|
|
60 basis points |
| ||||||
| Woori Bank |
(Won) | 14.4 | (Won) | 9.5 | (Won) | 4.8 | (Won) | (4.8 | ) | (Won) | (9.7 | ) | (Won) | (14.7 | ) | |||||||||
| Kyongnam Bank |
0.7 | 0.5 | 0.2 | (0.2 | ) | (0.4 | ) | (0.7 | ) | |||||||||||||||
| Kwangju Bank |
0.0 | 0.0 | 0.0 | 0.0 | 0.0 | 0.0 | ||||||||||||||||||
Stop loss limits. Our Subsidiary Risk Management Committees also approves total accumulated loss limits, and the heads of the relevant trading departments in each of our subsidiaries sets its own stop loss limits with respect to particular types of transactions. For example, Woori Bank has stop loss limits for various trading activities, including:
| • | for trading equity securities in Won, within 25% of the purchase price of such securities; |
| • | for trading fixed income securities in Won, within a specified range of increase in market interest rates (from 30 basis points to 250 basis points, depending on the time remaining until maturity of the relevant fixed income securities); |
| • | for available-for-sale equity securities in Won, within 35% of the book value of such securities; |
| • | for available-for-sale fixed income securities in Won, within 10% of the book value of such securities; |
| • | for trading equity or fixed income securities in foreign currencies, within 5% of the purchase price of such securities; and |
| • | for available-for-sale equity or fixed income securities in foreign currencies, within 15% of the purchase price of such securities. |
Interest Rate Risk
Interest rate risk from trading activities arises mainly from our trading of Won-denominated debt securities. Our trading strategy is to benefit from short-term movements in the prices of debt securities arising from changes in interest rates. As our subsidiaries’ trading accounts are marked-to-market daily, each of our subsidiaries manages its interest rate risk related to our trading accounts using market value-based tools such as VaR. See “—Asset and Liability Management—Interest Rate Risk.”
Equity Risk
Equity price risk and equity volatility risk result from our subsidiaries’ equity portfolios, which consist mainly of futures contracts and options and Won-denominated equity securities, as a result of the strict limits we
209
Table of Contents
have imposed with respect to VaR and accumulated loss imposed by our Subsidiary Risk Management Committees within the overall limits imposed by the Group Risk Management Committee, stop loss limits set by the heads of the relevant trading departments of our subsidiaries, and stress test limits. Equity risk arises in the context of trading activities for our own accounts to realize short-term trading profits with respect to equity and trading activities involving certain derivatives transactions.
Foreign Exchange Risk
Foreign exchange risk arises because we have assets, liabilities and off-balance sheet items such as foreign exchange forwards and currency swaps that are denominated in non-Won currencies. The difference between each of our subsidiaries’ foreign currency assets and liabilities is offset against forward foreign exchange positions to obtain its net foreign currency open position. We then net the positions of our subsidiaries against each other to derive our net exposure. Each of our subsidiaries determines its maximum foreign exchange exposure for both trading and asset and liability management purposes by establishing a limit for this net foreign currency open position. Each Subsidiary Risk Management Committee also establishes VaR limits for the foreign exchange business of its respective subsidiary and exposure limits for the business units of that subsidiary.
Assets and liabilities denominated in U.S. dollars account for the majority of our foreign currency assets and liabilities. Those denominated in Japanese yen and the euro account for most of the remainder, the majority of which have been swapped into U.S. dollars.
Each of our subsidiaries monitors changes in, and matches of, foreign-currency assets and liabilities in order to reduce exposure to currency fluctuations. Most of our foreign exchange risk arises in connection with the operations of Woori Bank. Our subsidiaries also manage risks relating to exchange rate fluctuations through foreign exchange dealing, including by their overseas branches. However, we conduct foreign exchange dealings primarily on behalf of our customers. Counterparties are restricted to domestic and foreign financial institutions and banks with respect to which our subsidiaries have established a foreign exchange dealing limit. Our subsidiaries deal primarily in the Won/U.S. dollar market and their dealings are subject to what we believe are conservative daily maximum and closing limits and stop loss limits. By way of illustration, the following table sets forth information concerning Woori Bank’s limits on proprietary foreign exchange dealings as of December 31, 2011:
| Won/U.S. Dollar Dealing | Dealings in other currencies | |||||||||||||||||||||||
| Headquarters | Headquarters | Overseas Branches | ||||||||||||||||||||||
| Total | Individual | Total | Individual | Total | Individual | |||||||||||||||||||
| (in millions of US$) | ||||||||||||||||||||||||
| Open position |
||||||||||||||||||||||||
| Daily maximum limit |
US$ | 1,000 | US$ | 200 | US$ | 200 | US$ | 50 | US$ | 60 | US$ | 15 | ||||||||||||
| Daily closing limit |
200 | 50 | 100 | 20 | 30 | 6 | ||||||||||||||||||
| Stop loss: |
||||||||||||||||||||||||
| Daily |
2.00 | 0.50 | 0.80 | 0.15 | 0.24 | 0.05 | ||||||||||||||||||
| Monthly |
3.00 | 0.80 | 2.00 | 0.50 | 0.60 | 0.15 | ||||||||||||||||||
210
Table of Contents
The following table shows the non-consolidated net open positions of Woori Bank, Kyongnam Bank and Kwangju Bank at the end of 2010 and 2011. Positive amounts represent long exposures and negative amounts represent short exposures.
| As of December 31, | ||||||||||||||||||||||||
| 2010 | 2011 | |||||||||||||||||||||||
| Woori Bank |
Kyongnam Bank |
Kwangju Bank |
Woori Bank |
Kyongnam Bank |
Kwangju Bank |
|||||||||||||||||||
| (in millions of US$) | ||||||||||||||||||||||||
| Currency |
||||||||||||||||||||||||
| U.S. dollar |
US$ | (102.0 | ) | US$ | (3.0 | ) | US$ | 0.0 | US$ | (64.4 | ) | US$ | (3.7 | ) | US$ | 0.6 | ||||||||
| Japanese yen |
(3.8 | ) | 0.3 | 0.2 | 7.6 | 0.7 | 0.0 | |||||||||||||||||
| Euro |
35.0 | 0.1 | (0.6 | ) | (13.4 | ) | — | 0.0 | ||||||||||||||||
| Others |
16.3 | 2.1 | 0.7 | (25.3 | ) | 1.9 | 0.1 | |||||||||||||||||
|
|
|
|
|
|
|
|
|
|
|
|
|
|||||||||||||
| Total |
US$ | (54.5 | ) | US$ | (0.5 | ) | US$ | 0.3 | US$ | (95.5 | ) | US$ | (1.1 | ) | US$ | 0.7 | ||||||||
|
|
|
|
|
|
|
|
|
|
|
|
|
|||||||||||||
Commodity Risk
Commodity risk represents exposures to instruments traded in the metals, petroleum, natural gas and other commodities markets, and arises principally from Woori Bank’s trading of U.S. dollar-denominated commodity derivatives. Under applicable Korean laws, Woori Bank may only engage in commodity derivative transactions on behalf of its corporate customers for hedging purposes. Woori Bank manages its commodity risk using VaR, accumulated loss and stress test limits.
Derivatives-Related Market Risk
The Foreign Exchange Transaction Regulations of Korea provide that a foreign exchange bank (such as Woori Bank) may generally enter into derivatives transactions without restriction so long as those transactions are not linked with credit risks of a party to the transaction or any third party. If they are, the bank must report the transaction to the Bank of Korea.
Most of the derivatives products that our subsidiaries trade are on behalf of their customers or to hedge their own positions. Our derivatives activities include interest rate and cross-currency swaps, foreign exchange forwards, stock index and interest rate futures, forward rate agreements and currency and over-the-counter equity options.
Asset and Liability Management
Our principal market risk with respect to managing our assets and liabilities is interest rate risk. Interest rate risk arises due to mismatches in the maturities or re-pricing periods of rate-sensitive assets and liabilities, such as loans and deposits. Any imbalance of the maturity of our interest rate-sensitive assets and liabilities and the gap resulting from that imbalance may cause net interest income to be affected by changes in the prevailing level of interest rates. Our principal asset and liability management objectives are to generate stable net interest revenues and protect our asset value against interest rate fluctuations.
Each of our commercial banking subsidiaries uses a standardized asset and liability management system for its Won- and foreign currency-denominated assets and liabilities. In addition, Woori Bank’s system also allows it to manage the assets and liabilities in its trust accounts. Prior to 2009, this system used roll-over modeling to mitigate the difficulty of predicting maturity with respect to customers’ purchases and cash advances and to calculate actual cash flow of customers based on pre-payment, extension of payments, delinquencies, bankruptcies and recoveries at each of our commercial banking subsidiaries. In January 2009, this system was integrated among our commercial banking subsidiaries and upgraded to include a new statistical analysis system to calculate statistically estimated maximum amount of loss, as well as an integrated user-interface operated by Woori FIS. As a part of this upgrade, we also changed our methodology to determine interest rate VaR from the Hull-White model using Monte-Carlo simulation to the historical scenario method. In 2011, in anticipation of
211
Table of Contents
Basel III requirements, we further upgraded our standard asset and liability management system by developing modules to calculate and monitor our net coverage ratio and net stable funding ratio.
Interest Rate Risk
We manage interest rate risk based on rational interest rate forecasts, using gap analysis to measure the difference between interest-sensitive assets and interest-sensitive liabilities, using simulations to calculate the effect of changing interest rates on income. Since Korea does not currently have a well-established derivatives market, we principally manage this risk by managing maturity and duration gaps between our interest-earning assets and interest-bearing liabilities.
We measure interest rate risk for Won and foreign currency assets and liabilities in our bank accounts (including derivatives) and, in the case of Woori Bank, assets and liabilities in our principal guaranteed trust accounts. Most of our interest-earning assets and interest-bearing liabilities are denominated in Won and our foreign currency-denominated assets and liabilities are mostly denominated in U.S. dollars. We believe, however, that our interest rate sensitivity is limited with respect to our Won-denominated assets. Deposits in Won generally bear fixed rates of interest for fixed time periods (other than deposits payable on demand which constituted approximately 34.6% of our total deposits in Won as of December 31, 2011). We generally adjust the interest rates on these deposits when they are rolled over. In addition, as of December 31, 2011, 95.1% of those deposits had current maturities of one year or less. As of December 31, 2011, approximately 76.8% of our Won-denominated loans bore floating rates of interest, and 59.5% of those loans had current maturities of one year or less.
Interest rate gap analysis measures expected changes in net interest revenues by calculating the difference in the amounts of interest-earning assets and interest-bearing liabilities at each maturity and interest resetting date. Woori Bank, Kyongnam Bank and Kwangju Bank each performs interest rate gap analysis for Won and foreign currency-denominated assets (and, in the case of Woori Bank, trust assets), on a monthly basis. Our subsidiaries report these results to the Group Risk Management Committee on a quarterly basis.
Interest Rate Gap Analysis. For interest rate gap analysis we use or assume the following maturities for different assets and liabilities:
| • | With respect to maturities of assets, for prime rate-linked loans, we apply the actual maturities of each loan; furthermore, we assume the reserves with the Bank of Korea and loans and securities classified as substandard or below to have maximum remaining maturities. |
| • | With respect to maturities of liabilities, for demand deposits with no fixed maturities held by the banks, a portion of the demand deposits are recognized to have maturities of less than three months as calculated in accordance with Financial Services Commission guidelines. |
From July 2004, our Group Risk Management Committee established the interest rate risk limit for each of our subsidiaries by directing that the earnings at risk for each subsidiary should be within 5% of the estimated net interest income of such subsidiary for a one-year period. We calculate VaR through our group-wide, standardized asset and liability management system, which uses the historical scenario method to simulate the current portfolio’s net asset value for a one-year holding period at a 99.9% confidence level.
212
Table of Contents
The following tables show, for each of Woori Bank, Kyongnam Bank and Kwangju Bank on a non-consolidated basis pursuant to the guidelines of the Financial Supervisory Service, the interest rate gap for Won-denominated accounts and foreign currency-denominated accounts as of December 31, 2011:
Woori Bank
| As of December 31, 2011 | ||||||||||||||||||||||||
| 0-3 Months | 3-6 Months | 6-12 Months | 1-3 Years | Over 3 Years | Total | |||||||||||||||||||
| (in billions of Won) | ||||||||||||||||||||||||
| Won-denominated accounts: |
||||||||||||||||||||||||
| Interest rate-sensitive assets |
||||||||||||||||||||||||
| Free interest rate |
(Won) | 3,845 | (Won) | 2,569 | (Won) | 4,225 | (Won) | 3,461 | (Won) | 3,789 | (Won) | 17,889 | ||||||||||||
| Market interest rate |
120,251 | 19,536 | 7,954 | 10,619 | 8,060 | 166,421 | ||||||||||||||||||
| Interest rate pegged to customer deposit |
120 | 52 | 80 | 12 | 3 | 265 | ||||||||||||||||||
|
|
|
|
|
|
|
|
|
|
|
|
|
|||||||||||||
| Total |
(Won) | 124,216 | (Won) | 22,156 | (Won) | 12,258 | (Won) | 14,092 | (Won) | 11,852 | (Won) | 184,575 | ||||||||||||
|
|
|
|
|
|
|
|
|
|
|
|
|
|||||||||||||
| Interest rate-sensitive liabilities |
||||||||||||||||||||||||
| Free interest rate |
(Won) | 11,577 | (Won) | 3,398 | (Won) | 5,014 | (Won) | 7,537 | (Won) | 6,822 | (Won) | 34,348 | ||||||||||||
| Market interest rate |
72,703 | 13,864 | 25,032 | 2,464 | 18,607 | 132,670 | ||||||||||||||||||
|
|
|
|
|
|
|
|
|
|
|
|
|
|||||||||||||
| Total |
(Won) | 84,281 | (Won) | 17,262 | (Won) | 30,046 | (Won) | 0,001 | (Won) | 25,428 | (Won) | 167,018 | ||||||||||||
|
|
|
|
|
|
|
|
|
|
|
|
|
|||||||||||||
| Sensitivity gap |
39,936 | 4,894 | (17,788 | ) | 4,092 | (13,576 | ) | 17,557 | ||||||||||||||||
| Cumulative gap |
39,936 | 44,830 | 27,042 | 31,133 | 17,557 | 17,557 | ||||||||||||||||||
| % of total assets(1) |
19.25 | % | 21.61 | % | 13.04 | % | 15.01 | % | 8.47 | % | 8.47 | % | ||||||||||||
| Total assets in Won |
(Won) | 207,424 | ||||||||||||||||||||||
| As of December 31, 2011 | ||||||||||||||||||||||||
| 0-3 Months | 3-6 Months | 6-12 Months | 1-3 Years | Over 3 Years | Total | |||||||||||||||||||
| (in millions of US$) | ||||||||||||||||||||||||
| Foreign currency-denominated accounts: |
||||||||||||||||||||||||
| Interest rate-sensitive assets |
||||||||||||||||||||||||
| Free interest rate |
US$ | 0 | US$ | 0 | US$ | 0 | US$ | 0 | US$ | 0 | US$ | 0 | ||||||||||||
| Market interest rate |
14,387 | 1,821 | 229 | 26 | 95 | 16,559 | ||||||||||||||||||
| Interest rate pegged to customer deposit |
0 | 0 | 0 | 0 | 0 | 0 | ||||||||||||||||||
|
|
|
|
|
|
|
|
|
|
|
|
|
|||||||||||||
| Total |
US$ | 14,387 | US$ | 1,821 | US$ | 229 | US$ | 26 | US$ | 95 | US$ | 16,559 | ||||||||||||
|
|
|
|
|
|
|
|
|
|
|
|
|
|||||||||||||
| Interest rate-sensitive liabilities |
||||||||||||||||||||||||
| Free interest rate |
US$ | 0 | US$ | 0 | US$ | 0 | US$ | 0 | US$ | 0 | US$ | 0 | ||||||||||||
| Market interest rate |
8,008 | 983 | 1,424 | 924 | 4,113 | 15,453 | ||||||||||||||||||
|
|
|
|
|
|
|
|
|
|
|
|
|
|||||||||||||
| Total |
US$ | 8,008 | US$ | 983 | US$ | 1,424 | US$ | 924 | US$ | 4,113 | US$ | 15,453 | ||||||||||||
|
|
|
|
|
|
|
|
|
|
|
|
|
|||||||||||||
| Sensitivity gap |
6,379 | 838 | (1,195 | ) | (897 | ) | (4,018 | ) | 1,106 | |||||||||||||||
| Cumulative gap |
6,379 | 7,217 | 6,022 | 5,124 | 1,106 | 1,106 | ||||||||||||||||||
| % of total assets(1) |
24.07 | % | 27.23 | % | 22.72 | % | 19.33 | % | 4.17 | % | 4.17 | % | ||||||||||||
| Total assets in US$ |
US$ | 26,505 | ||||||||||||||||||||||
213
Table of Contents
| Kyongnam Bank |
||||||||||||||||||||||||
| As of December 31, 2011 | ||||||||||||||||||||||||
| 0-3 Months | 3-6 Months | 6-12 Months | 1-3 Years | Over 3 Years | Total | |||||||||||||||||||
| (in billions of Won) | ||||||||||||||||||||||||
| Won-denominated accounts: |
||||||||||||||||||||||||
| Interest rate-sensitive assets |
||||||||||||||||||||||||
| Free interest rate |
(Won) | 469 | (Won) | 383 | (Won) | 666 | (Won) | 651 | (Won) | 1,222 | (Won) | 3,391 | ||||||||||||
| Market interest rate |
11,005 | 876 | 1,111 | 2,488 | 2,869 | 18,350 | ||||||||||||||||||
| Interest rate pegged to customer deposit |
36 | 15 | 17 | 4 | 1 | 73 | ||||||||||||||||||
|
|
|
|
|
|
|
|
|
|
|
|
|
|||||||||||||
| Total |
(Won) | 11,510 | (Won) | 1,274 | (Won) | 1,794 | (Won) | 3,143 | (Won) | 4,093 | (Won) | 21,814 | ||||||||||||
|
|
|
|
|
|
|
|
|
|
|
|
|
|||||||||||||
| Interest rate-sensitive liabilities |
||||||||||||||||||||||||
| Free interest rate |
(Won) | 5,771 | (Won) | 2,899 | (Won) | 4,160 | (Won) | 1,126 | (Won) | 2,600 | (Won) | 16,556 | ||||||||||||
| Market interest rate |
936 | 278 | 130 | 552 | 1,389 | 3,286 | ||||||||||||||||||
|
|
|
|
|
|
|
|
|
|
|
|
|
|||||||||||||
| Total |
(Won) | 6,707 | (Won) | 3,176 | (Won) | 4,291 | (Won) | 1,678 | (Won) | 3,989 | (Won) | 19,842 | ||||||||||||
|
|
|
|
|
|
|
|
|
|
|
|
|
|||||||||||||
| Sensitivity gap |
4,803 | (1,902 | ) | (2,497 | ) | 1,465 | 104 | 1,972 | ||||||||||||||||
| Cumulative gap |
(Won) | 4,803 | (Won) | 2,900 | (Won) | 403 | (Won) | 1,869 | (Won) | 1,972 | (Won) | 1,972 | ||||||||||||
| % of total assets(1) |
20.18 | % | 12.19 | % | 1.70 | % | 7.85 | % | 8.29 | % | 8.29 | % | ||||||||||||
| Total assets in Won |
(Won) | 23,800 | ||||||||||||||||||||||
| As of December 31, 2011 | ||||||||||||||||||||||||
| 0-3 Months | 3-6 Months | 6-12 Months | 1-3 Years | Over 3 Years | Total | |||||||||||||||||||
| (in millions of US$) | ||||||||||||||||||||||||
| Foreign currency-accounts: |
||||||||||||||||||||||||
| Interest rate-sensitive assets |
||||||||||||||||||||||||
| Free interest rate |
US$ | 831 | US$ | 83 | US$ | 8 | US$ | 0 | US$ | 4 | US$ | 925 | ||||||||||||
| Market interest rate |
118 | 2 | 0 | 0 | 0 | 119 | ||||||||||||||||||
| Interest rate pegged to customer deposit |
0 | 0 | 0 | 0 | 0 | 0 | ||||||||||||||||||
|
|
|
|
|
|
|
|
|
|
|
|
|
|||||||||||||
| Total |
US$ | 949 | US$ | 85 | US$ | 8 | US$ | 0 | US$ | 4 | US$ | 1,045 | ||||||||||||
|
|
|
|
|
|
|
|
|
|
|
|
|
|||||||||||||
| Interest rate-sensitive liabilities |
||||||||||||||||||||||||
| Free interest rate |
US$ | 742 | US$ | 128 | US$ | 79 | US$ | 0 | US$ | 0 | US$ | 949 | ||||||||||||
| Market interest rate |
5 | 0 | 0 | 0 | 0 | 5 | ||||||||||||||||||
|
|
|
|
|
|
|
|
|
|
|
|
|
|||||||||||||
| Total |
US$ | 747 | US$ | 128 | US$ | 79 | US$ | 0 | US$ | 0 | US$ | 954 | ||||||||||||
|
|
|
|
|
|
|
|
|
|
|
|
|
|||||||||||||
| Sensitivity gap |
202 | (44 | ) | (71 | ) | 0 | 4 | 91 | ||||||||||||||||
| Cumulative gap |
202 | 158 | 87 | 87 | 91 | 91 | ||||||||||||||||||
| % of total assets(1) |
17.26 | % | 13.54 | % | 7.45 | % | 7.45 | % | 7.76 | % | 7.76 | % | ||||||||||||
| Total assets in US$ |
US$ | 1,170 | ||||||||||||||||||||||
214
Table of Contents
Kwangju Bank
| As of December 31, 2011 | ||||||||||||||||||||||||
| 0-3 Months | 3-6 Months | 6-12 Months | 1-3 Years | Over 3 Years | Total | |||||||||||||||||||
| (in billions of Won) | ||||||||||||||||||||||||
| Won-denominated accounts: |
||||||||||||||||||||||||
| Interest rate-sensitive assets |
||||||||||||||||||||||||
| Free interest rate |
(Won) | 609 | (Won) | 225 | (Won) | 372 | (Won) | 445 | (Won) | 591 | (Won) | 2,243 | ||||||||||||
| Market interest rate |
8,029 | 1,323 | 1,043 | 1,268 | 1,250 | 12,913 | ||||||||||||||||||
| Interest rate pegged to customer deposit |
89 | 29 | 47 | 5 | 1 | 172 | ||||||||||||||||||
|
|
|
|
|
|
|
|
|
|
|
|
|
|||||||||||||
| Total |
(Won) | 8,727 | (Won) | 1,578 | (Won) | 1,463 | (Won) | 1,718 | (Won) | 1,842 | (Won) | 15,328 | ||||||||||||
|
|
|
|
|
|
|
|
|
|
|
|
|
|||||||||||||
| Interest rate-sensitive liabilities |
||||||||||||||||||||||||
| Free interest rate |
(Won) | 3,963 | (Won) | 1,714 | (Won) | 2,346 | (Won) | 552 | (Won) | 1,703 | (Won) | 10,277 | ||||||||||||
| Market interest rate |
1,411 | 242 | 430 | 352 | 535 | 2,970 | ||||||||||||||||||
|
|
|
|
|
|
|
|
|
|
|
|
|
|||||||||||||
| Total |
(Won) | 5,374 | (Won) | 1,956 | (Won) | 2,775 | (Won) | 904 | (Won) | 2,238 | (Won) | 13,247 | ||||||||||||
|
|
|
|
|
|
|
|
|
|
|
|
|
|||||||||||||
| Sensitivity gap |
3,353 | (378 | ) | (1,312 | ) | 814 | (396 | ) | 2,081 | |||||||||||||||
| Cumulative gap |
3,353 | 2,975 | 1,663 | 2,477 | 2,081 | 2,081 | ||||||||||||||||||
| % of total assets(1) |
20.32 | % | 18.03 | % | 10.08 | % | 15.01 | % | 12.61 | % | 12.61 | % | ||||||||||||
| Total assets in Won |
(Won) | 16,500 | ||||||||||||||||||||||
| As of December 31, 2011 | ||||||||||||||||||||||||
| 0-3 Months | 3-6 Months | 6-12 Months | 1-3 Years | Over 3 Years | Total | |||||||||||||||||||
| (in millions of US$) | ||||||||||||||||||||||||
| Foreign currency-accounts: |
||||||||||||||||||||||||
| Interest rate-sensitive assets |
||||||||||||||||||||||||
| Free interest rate |
US$ | 0 | US$ | 0 | US$ | 0 | US$ | 0 | US$ | 6 | US$ | 6 | ||||||||||||
| Market interest rate |
764 | 19 | 0 | 0 | 0 | 783 | ||||||||||||||||||
| Interest rate pegged to customer deposit |
0 | 0 | 0 | 0 | 0 | 0 | ||||||||||||||||||
|
|
|
|
|
|
|
|
|
|
|
|
|
|||||||||||||
| Total |
US$ | 764 | US$ | 19 | US$ | 0 | US$ | 0 | US$ | 6 | US$ | 789 | ||||||||||||
|
|
|
|
|
|
|
|
|
|
|
|
|
|||||||||||||
| Interest sensitive liabilities |
||||||||||||||||||||||||
| Free interest rate |
US$ | 6 | US$ | 2 | US$ | 2 | US$ | 2 | US$ | 5 | US$ | 18 | ||||||||||||
| Market interest rate |
173 | 78 | 383 | 192 | 19 | 845 | ||||||||||||||||||
|
|
|
|
|
|
|
|
|
|
|
|
|
|||||||||||||
| Total |
US$ | 179 | US$ | 80 | US$ | 385 | US$ | 194 | US$ | 25 | US$ | 863 | ||||||||||||
|
|
|
|
|
|
|
|
|
|
|
|
|
|||||||||||||
| Sensitivity gap |
585 | (62 | ) | (385 | ) | (194 | ) | (19 | ) | (74 | ) | |||||||||||||
| Cumulative gap |
585 | 524 | 138 | (55 | ) | (74 | ) | (74 | ) | |||||||||||||||
| % of total assets(1) |
53.67 | % | 48.02 | % | 12.70 | % | (5.05 | )% | (6.76 | )% | (6.76 | )% | ||||||||||||
| Total assets in US$ |
US$ | 1,090 | ||||||||||||||||||||||
| (1) | Represents the cumulative gap as a percentage of total assets. |
Duration Gap Analysis. Each of Woori Bank, Kyongnam Bank and Kwangju Bank also performs a duration gap analysis to measure and manage its interest rate risk. Duration gap analysis is a more long-term risk indicator than interest rate gap analysis, as interest rate gap analysis focuses only on accounting income and not on the market value of the assets and liabilities. We emphasize duration gap analysis because, in the long run, our principal concern with respect to interest rate fluctuations is the net asset value rather than net interest revenue changes.
For duration gap analysis, we use or assume the same maturities for different assets and liabilities that we use or assume for our interest rate gap analysis.
215
Table of Contents
The following table shows, for Woori Bank, Kyongnam Bank and Kwangju Bank on a combined basis, with respect to Won-denominated assets and liabilities, duration gaps and net asset value changes when interest rate increases by one percentage point as of the specified dates:
| Date |
Interest- earning asset duration |
Interest-bearing liability duration |
Total asset/liability duration gap |
Net asset value change | ||||||||||||
| (in years) | (in years) | (in years) | (in billions of Won) | |||||||||||||
| June 30, 2010 |
0.51 | 0.80 | (0.25 | ) | 604 | |||||||||||
| December 31, 2010 |
0.54 | 0.75 | (0.18 | ) | 459 | |||||||||||
| June 30, 2011 |
0.53 | 0.74 | (0.14 | ) | 389 | |||||||||||
| December 31, 2011 |
0.69 | 0.72 | 0.02 | 2 | ||||||||||||
We set interest rate risk limits using the historical simulation method, which uses actual historical price, volatility and yield changes in comparison with the current position to generate hypothetical portfolios and calculate a distribution of position and portfolio market value changes. The following table shows our interest rate VaR with respect to our Won-denominated assets and liabilities for each of the quarters since the fourth quarter of 2010:
| Fourth Quarter 2010 |
First Quarter 2011 |
Second Quarter 2011 |
Third Quarter 2011 |
Fourth Quarter 2011 |
||||||||||||||||
| (in billions of Won, except percentages) | ||||||||||||||||||||
| Woori Finance Holdings |
(Won) | 387.1 | (Won) | 588.3 | (Won) | 471.2 | (Won) | 435.6 | (Won) | 462.5 | ||||||||||
| Woori Bank |
327.9 | 546.4 | 407.3 | 309.2 | 255.1 | |||||||||||||||
| Kyongnam Bank |
12.8 | 47.3 | 53.3 | 44.6 | 49.0 | |||||||||||||||
| Kwangju Bank |
27.1 | 6.1 | 7.3 | 9.9 | 8.8 | |||||||||||||||
| Volatility |
— | — | — | — | — | |||||||||||||||
| Mean reversion |
— | — | — | — | — | |||||||||||||||
The Group Risk Management Committee reviews gap analysis reports, duration gap analysis reports and interest rate limit compliance reports prepared by our subsidiary risk management units on a quarterly basis.
Foreign Exchange Risk
We manage foreign exchange rate risk arising in connection with the management of our assets and liabilities together with such risks arising from our trading operations. See “—Market Risk Management for Trading Activities—Foreign Exchange Risk” above.
Liquidity Risk Management
Liquidity risk is the risk of insolvency or loss due to disparity between inflow and outflow of funds such as maturity mismatch, including having to obtain funds at a high price or to dispose of securities at an unfavorable price due to lack of available funds. We manage our liquidity in order to meet our financial liabilities from withdrawals of deposits, redemption of matured debentures and repayments at maturity of borrowed funds. We also require sufficient liquidity to fund loans and extend other forms of credits, as well as to make investments in securities. Each of our Subsidiary Risk Management Committees establishes liquidity policies for its respective subsidiary and monitors liquidity on an on-going basis. Our subsidiaries make constant adjustment to take into account variables affecting their liquidity levels. Our subsidiary risk management units review the uses and sources of funds on a daily basis, taking into consideration the various goals of their respective business units.
Our liquidity management goal is to be able, even under adverse conditions, to meet all our liability repayments on time and fund all investment opportunities. Since the formation of the holding company structure, neither we nor our subsidiaries have experienced significant liquidity risk.
We maintain diverse sources of liquidity to facilitate flexibility in meeting our funding requirements. We fund our operations principally by accepting deposits from retail and corporate depositors, accessing the call loan market (a short-term market for loans with maturities of less than one month), issuing debentures and borrowing
216
Table of Contents
from the Bank of Korea. We use the majority of funds raised by us to extend loans or purchase securities. Generally, deposits are of shorter average maturity than loans or investments.
In managing liquidity risk, each of our subsidiaries currently determines gap limits, implements those limits and monitors maturity gaps using its asset and liability management system. We also establish group-wide gap limits for liquidity management purposes. Each subsidiary has set a total limit in order to manage liquidity risk. For example, Woori Bank’s three-month accumulated gap limits for banking and trust accounts are between (10)% and 10%. In the foreign currency account, the limit for a one-week gap has been set as (3)% or higher and as (10)% or higher for a one-month gap.
Liquidity is maintained by holding sufficient quantities of assets that can be liquidated to meet actual or potential demands for funds from depositors and others. Liquidity is also managed by ensuring that the excess of maturing liabilities over maturing assets in any period is kept to manageable levels relative to the amount of funds we believe we can raise by issuing securities when required. We seek to minimize our liquidity costs by managing our liquidity position on a daily basis and by limiting the amount of cash at any time that is not invested in interest-earning assets or securities.
The Financial Services Commission requires each Korean bank to maintain a Won liquidity ratio of not less than 100% (deemed an “advisory ratio”) and to make monthly reports to the Financial Services Commission. The Financial Services Commission defines the Won liquidity ratio as Won-denominated liquid assets (including marketable securities) due within one month divided by Won-denominated liabilities due within one month.
The following table shows the liquidity status and limits for Won accounts of each of our banking subsidiaries on a non-consolidated basis and for Woori Finance Holdings on a combined basis as of December 31, 2011 in accordance with Financial Services Commission regulations:
| 1 month or less | ||||||||||||||||
| Woori Finance Holdings |
Woori Bank | Kyongnam Bank | Kwangju Bank | |||||||||||||
| (in billions of Won) | ||||||||||||||||
| Assets (A) |
(Won) | 72,139 | (Won) | 61,722 | (Won) | 6,345 | (Won) | 4,072 | ||||||||
| Liabilities (B) |
57,176 | 50,756 | 3,713 | 2,707 | ||||||||||||
| Liquidity gap |
14,963 | 10,966 | 2,632 | 1,365 | ||||||||||||
| Liquidity ratio (A/B) |
126.2 | % | 121.6 | % | 170.9 | % | 150.4 | % | ||||||||
| Limit |
100 | % | 100 | % | 100 | % | 100 | % | ||||||||
The following table shows the liquidity status on a cumulative basis and limits for foreign currency accounts of each of our banking subsidiaries on a non-consolidated basis and for Woori Finance Holdings on a combined basis as of December 31, 2011 in accordance with the Bank of Korea’s regulations:
| 7 days or less | 7 days-1 month | 1-3 months | ||||||||||||||||||||||||||||||||||||||||||||||
| Woori Finance Holdings |
Woori Bank |
Kyongnam Bank |
Kwangju Bank |
Woori Finance Holdings |
Woori Bank |
Kyongnam Bank |
Kwangju Bank |
Woori Finance Holdings |
Woori Bank |
Kyongnam Bank |
Kwangju Bank |
|||||||||||||||||||||||||||||||||||||
| (in millions of US$) | ||||||||||||||||||||||||||||||||||||||||||||||||
| Foreign currency accounts: |
||||||||||||||||||||||||||||||||||||||||||||||||
| Foreign currency assets |
US$ | 12,760 | US$ | 12,224 | US$ | 355 | US$ | 181 | US$ | 7,928 | US$ | 7,697 | US$ | 231 | US$ | 157 | US$ | 10,544 | US$ | 10,215 | US$ | 329 | US$ | 308 | ||||||||||||||||||||||||
| Foreign currency liabilities |
11,420 | 11,005 | 266 | 149 | 9,038 | 8,886 | 152 | 94 | 9,155 | 8,743 | 412 | 184 | ||||||||||||||||||||||||||||||||||||
| Maturity gap |
1,340 | 1,219 | 89 | 32 | (1,110 | ) | (1,189 | ) | 79 | 63 | 1,389 | 1,471 | (82 | ) | 124 | |||||||||||||||||||||||||||||||||
| Cumulative gap (A) |
1,340 | 1,219 | 89 | 32 | 198 | 30 | 168 | 95 | 1,587 | 1,501 | 86 | 219 | ||||||||||||||||||||||||||||||||||||
| Total assets (B) |
62,829 | 59,851 | 1,928 | 1,050 | 62,829 | 59,851 | 1,928 | 1,050 | 62,829 | 59,851 | 1,928 | 1,050 | ||||||||||||||||||||||||||||||||||||
| Liquidity gap ratio (A/B) |
2.13 | % | 2.04 | % | 4.62 | % | 3.05 | % | 0.32 | % | 0.05 | % | 8.71 | % | 9.05 | % | 105.47 | %(1) | 105.24 | %(1) | 110.31 | %(1) | 151.27 | %(1) | ||||||||||||||||||||||||
| Limits |
(3 | )% | (3 | )% | (3 | )% | (3 | )% | (10 | )% | (10 | )% | (10 | )% | (10 | )% | 85 | % | 85 | % | 85 | % | 85 | % | ||||||||||||||||||||||||
| (1) | Liquidity ratio, calculated as a ratio of foreign currency assets as percentage of foreign currency liabilities. |
Our Subsidiary Risk Management Committees receive reports from our subsidiaries regarding their respective liquidity ratios and liquidity gap ratios on a monthly basis. Based on those reports, each subsidiary’s
217
Table of Contents
risk management department reports these results to the Group Risk Management Committee on a quarterly basis.
Operational and Business Risk Management
Operational risk is difficult to quantify and subject to different definitions. We define our operational risk as the risk related to the overall management of the group other than credit risk, market risk, interest rate risk and liquidity risk. These include risks arising from system failure, human error or non-adherence to systems and procedures, or from fraud or inadequate internal controls and procedures, resulting in financial loss. Woori Bank successfully established its operational risk management system in 2005. In 2006, we completed implementation of various aspects of the operational risk management system (not including the business risk management system) at Kyongnam Bank, Kwangju Bank and Woori FIS, and also completed the implementation of such aspects of the operational risk management system at Woori Investment & Securities by the end of 2008.
To monitor and control operational risks, we maintain a system of comprehensive policies and have put in place a control framework designed to provide a stable and well-managed operational environment throughout our organization. Several bodies are responsible for managing our operational risk, including our Audit Council (which reports to our group-level Audit Committee), our group-level legal and compliance department and the Subsidiary Risk Management Committees and their respective risk management units. In particular, our group-level Audit Committee monitors our subsidiaries’ compliance with our internal policies and guidelines relating to the issuance of credit and ongoing review of a borrower’s ability to meet its obligations. We have established group-wide internal guidelines with respect to our subsidiaries’ audit reporting requirements. Our subsidiaries review their operations and their level of compliance with our risk management policies and guidelines on an annual basis. As part of this process, they report any problems discovered and any remedial actions taken to our group-level Audit Committee. Based on the results of these reports, or on an ad hoc basis in response to any problem or potential problem that it identifies, the Audit Committee may direct a subsidiary to conduct an audit of its operations or, if it chooses to do so, conduct its own audit of those operations. The Audit Committee and the Audit Council interact on a regular basis with our legal and compliance department and our risk management department.
We consider legal and business risk as a part of our operational risk. The uncertainty of the enforceability of the obligations of our customers and counterparties, including foreclosure on collateral, creates legal risk. Business risk includes the risk of changes in laws and regulations, which could also adversely affect us. Legal and business risk is higher in new areas of business where the law is often untested in the courts although such risk can also increase in our traditional business to the extent that the legal and regulatory landscape in Korea is changing and many new laws and regulations governing the banking industry remain untested. Our subsidiaries’ legal departments seek to minimize legal and business risk by using stringent legal documentation, employing procedures designed to ensure that transactions are properly authorized and consulting legal advisers. Each of our subsidiaries’ internal auditors also review loan documentation to ensure that these are correctly drawn up to withstand scrutiny in court should such scrutiny occur.
In connection with our disaster recovery capabilities, we are in the process of meeting the guidelines suggested by the Financial Services Commission. These generally require that our disaster and recovery capabilities enable us to recover data and resume operations within three hours with respect to our banking and securities subsidiaries.
The majority of our information technology systems are operated by our subsidiary, Woori FIS. We currently have a “mirror site” in operation with respect to Woori Bank, Kyongnam Bank, Kwangju Bank and Woori Investment & Securities, which backs up transaction information on a real-time basis. We also have a “back-up site” in operation with respect to these subsidiaries, which backs up transaction information on a daily basis. In September 2008, Woori Bank completed its implementation of a business continuity plan to prepare for emergency situations and disasters. See “Item 3D. Risk Factors—Other risks relating to our business—We may experience disruptions, delays and other difficulties from our information technology systems.”
218
Table of Contents
| Item 12. | DESCRIPTION OF SECURITIES OTHER THAN EQUITY SECURITIES |
Fees and Charges
Under the terms of the deposit agreement, as a holder of our ADSs, you are required to pay the following service fees to the depositary:
| Services |
Fees | |
| Issuance of ADSs |
Up to $0.05 per ADS issued | |
| Cancellation of ADSs |
Up to $0.05 per ADS canceled | |
| Distribution of cash dividends or ADSs pursuant to stock dividends |
Up to $0.02 per ADS held | |
| Distribution of cash proceeds or free shares in the form of ADSs |
Up to $0.02 per ADS held | |
| Distribution of securities other than ADSs or rights to purchase additional ADSs |
Up to $0.05 per securities distributed | |
| Depositary Services |
Up to $0.02 per ADS held as of the last day of each calendar year, except to the extent any cash dividend fee is charged (as described above) during the applicable calendar year | |
| Distribution of ADSs pursuant to exercise of rights to purchase additional ADSs |
Up to $0.02 per ADS held | |
As a holder of our ADSs, you are also responsible for paying certain fees and expenses incurred by the depositary and certain taxes and governmental charges such as:
| • | Fees for the transfer and registration of shares charged by the registrar and transfer agent for the shares in Korea (i.e., upon deposit and withdrawal of shares). |
| • | Expenses incurred for converting foreign currency into U.S. dollars. |
| • | Expenses for cable, telex and fax transmissions and for delivery of securities. |
| • | Taxes and duties upon the transfer of securities (i.e., when shares are deposited or withdrawn from deposit). |
| • | Fees and expenses incurred in connection with the delivery or servicing of shares on deposit. |
Depositary fees payable upon the issuance and cancellation of ADSs are typically paid to the depositary by the brokers (on behalf of their clients) receiving the newly issued ADSs from the depositary and by the brokers (on behalf of their clients) delivering the ADSs to the depositary for cancellation. The brokers in turn charge these fees to their clients. Depositary fees payable in connection with distributions of cash or securities to ADS holders and the depositary services fee are charged by the depositary to the holders of record of ADSs as of the applicable ADS record date.
The depositary fees payable for cash distributions are generally deducted from the cash being distributed. In the case of distributions other than cash (i.e., stock dividend, rights), the depositary charges the applicable fee to the ADS record date holders concurrent with the distribution. In the case of ADSs registered in the name of the investor (whether certificated or uncertificated in direct registration), the depositary sends invoices to the applicable record date ADS holders. In the case of ADSs held in brokerage and custodian accounts (via the Depository Trust Company, or DTC), the depositary generally collects its fees through the systems provided by DTC (whose nominee is the registered holder of the ADSs held in DTC) from the brokers and custodians holding ADSs in their DTC accounts. The brokers and custodians who hold their clients’ ADSs in DTC accounts in turn charge their clients’ accounts the amount of the fees paid to the depositary.
219
Table of Contents
In the event of refusal to pay the depositary fees, the depositary may, under the terms of the deposit agreement, refuse the requested service until payment is received or may set off the amount of the depositary fees from any distribution to be made to such holder of ADSs.
Note that the fees and charges you may be required to pay may vary over time and may be changed by us and by the depositary. You will receive prior notice of such changes.
Fees and Payments from the Depositary to Us
In 2011, we received payments from the depositary of approximately $18,499 (net of applicable taxes) in the aggregate in connection with proxy process expenses (including printing, postage and distribution expenses), contributions towards investor relations efforts (including investor relations agency fees) and other standard out-of-pocket maintenance costs relating to our American Depositary Receipt, or ADR, facility for which the depositary has agreed to reimburse us.
In addition, as part of its service to us, the depositary waives its fees for the standard costs and operating expenses associated with the administration of the ADR facility.
| Item 13. | DEFAULTS, DIVIDEND ARREARAGES AND DELINQUENCIES |
Not Applicable
| Item 14. | MATERIAL MODIFICATIONS TO THE RIGHTS OF SECURITY HOLDERS AND USE OF PROCEEDS |
Not Applicable
| Item 15. | CONTROLS AND PROCEDURES |
Disclosure Controls and Procedures
We have evaluated, with the participation of our chief executive officer and principal financial officer, the effectiveness of our disclosure controls and procedures, as such term is defined in Rules 13a-15(e) and 15d-15(e) under the Securities Exchange Act of 1934, as amended, as of December 31, 2011. There are inherent limitations to the effectiveness of any system of disclosure controls and procedures, including the possibility of human error and the circumvention or overriding of the controls and procedures. Accordingly, even effective disclosure controls and procedures can only provide reasonable assurance of achieving their control objectives. Based upon our evaluation, our chief executive officer and principal financial officer concluded that our disclosure controls and procedures as of December 31, 2011 were effective to provide reasonable assurance that information required to be disclosed by us in the reports that we file or submit under the Securities Exchange Act of 1934, as amended, is recorded, processed, summarized and reported, within the time periods specified in the applicable rules and forms, and that it is accumulated and communicated to our management, including our chief executive officer and principal financial officer, as appropriate to allow timely decisions regarding required disclosure.
Management’s Annual Report on Internal Control Over Financial Reporting
Our management is responsible for establishing and maintaining adequate internal control over financial reporting. Our internal control system was designed to provide reasonable assurance to our management and Board of Directors regarding the reliability of financial reporting and the preparation and fair presentation of published financial statements in accordance with IFRS as issued by the IASB. All internal control systems, no matter how well designed, have inherent limitations. Therefore, even those systems determined to be effective can provide only reasonable assurance with respect to financial statement preparation and presentation and may not prevent or detect misstatements. Also, projections of any evaluation of effectiveness to future periods are subject to the risk that controls may become inadequate because of changes in conditions, or that the degree of compliance with the policies or procedures may deteriorate.
Our management maintains a comprehensive system of controls intended to ensure that transactions are executed in accordance with management’s authorization, assets are safeguarded, and financial records are
220
Table of Contents
reliable. Our management also takes steps to ensure that information and communication flows are effective and to monitor performance, including performance of internal control procedures.
Our management assessed the effectiveness of our internal control over financial reporting as of December 31, 2011 based on the criteria established in the Internal Control-Integrated Framework issued by the Committee of Sponsoring Organizations of the Treadway Commission.
Based on this assessment, management believes that, as of December 31, 2011, our internal control over financial reporting is effective.
The effectiveness of our internal control over financial reporting as of December 31, 2011 has been audited by Deloitte Anjin LLC, an independent registered public accounting firm, as stated in its report included herein which expressed an unqualified opinion on the effectiveness of our internal control over financial reporting as of December 31, 2011.
Changes in Internal Control Over Financial Reporting
There has been no change in our internal control over financial reporting during 2011 that has materially affected, or is reasonably likely to materially affect, our internal control over financial reporting.
| Item 16. | RESERVED |
| Item 16A. | Audit Committee Financial Expert |
Our board of directors has determined that we do not have an “audit committee financial expert” serving on our Audit Committee as defined by the U.S. Securities and Exchange Commission, as none of our Audit Committee members have the familiarity with IFRS required by the U.S. Securities and Exchange Commission, which are the accounting standards of the financial statements included in this annual report. Our board believes that the interests of our stockholders can be adequately served for the time being by the current members but intends to add such an expert to the board once a suitable candidate can be identified and recruited.
| Item 16B. | Code of Ethics |
We have adopted a code of ethics, as defined in Item 16B of Form 20-F under the Securities Exchange Act of 1934, as amended. Our code of ethics applies to our chief executive officer, principal financial officer and persons performing similar functions as well as to our outside directors and other officers and employees. Our code of ethics is available on our website at http://www.woorifg.com. If we amend the provisions of our code of ethics that apply to our chief executive officer and principal financial officer and persons performing similar functions, or if we grant any waiver of such provisions, we will disclose such amendment or waiver on our website at the same address.
| Item 16C. | Principal Accountant Fees and Services |
The following table sets forth the fees billed to us by our independent registered public accountants, Deloitte Anjin LLC, the member firms of Deloitte Touche Tohmatsu, and their respective affiliates (collectively, “Deloitte”), during the fiscal years ended December 31, 2010 and 2011:
| Year ended December 31, | ||||||||
| 2010 | 2011 | |||||||
| (in millions of Won) | ||||||||
| Audit fees |
(Won) | 7,847 | (Won) | 5,422 | ||||
| Audit-related fees |
263 | 253 | ||||||
| Tax fees |
285 | 323 | ||||||
| All other fees |
— | 795 | ||||||
|
|
|
|
|
|||||
| Total fees |
(Won) | 8,395 | (Won) | 6,793 | ||||
|
|
|
|
|
|||||
221
Table of Contents
Audit fees in the above table are the aggregate fees billed or expected to be billed by Deloitte in connection with the audit of our annual financial statements, the review of our interim financial statements, the review of filings with the U.S. Securities and Exchange Commission and audit of the effectiveness of our internal control over financial reporting.
Audit-related fees in the above table are the aggregate fees billed or expected to be billed by Deloitte for agreed upon procedures related to the issuance of comfort letters in connection with the issuance of debt securities.
Tax fees in the above table are fees billed or expected to be billed by Deloitte for assistance in the preparation of certain tax returns and other tax advice.
Audit Committee Pre-Approval Policies and Procedures
Our audit committee pre-approves the engagement of our independent auditors for audit services with respect to our financial statements prepared in accordance with IFRS as issued by the IASB. Our audit committee has implemented a policy regarding pre-approval of certain other services provided by our independent auditors that the audit committee has deemed as not affecting their independence. Under this policy, our audit committee may grant pre-approvals for the following services: (i) services related to the audit of our financial statements prepared in accordance with IFRS as adopted by Korea and our internal controls under Korean laws and regulations; (ii) general tax advisory services; and (iii) service contracts required to be entered into with us under applicable laws and regulations or pursuant to requests from relevant governmental agencies.
Any other audit or permitted non-audit service must be pre-approved by the audit committee on a case-by-case basis. In the event that immediate approval is necessitated by the circumstances, the chairman of our audit committee or a member of the audit committee designated by such chairman may pre-approve the relevant service, subject to a subsequent report of such pre-approval being made to the audit committee.
Our audit committee did not pre-approve any non-audit services under the de minimis exception of Rule 2-01(c)(7)(i)(C) of Regulation S-X as promulgated by the Securities and Exchange Commission.
| Item 16D. | Exemptions from the Listing Standards for Audit Committees |
Under the listed company audit committee rules of the New York Stock Exchange and the U.S. Securities and Exchange Commission, we must comply with Rule 10A-3 under the Exchange Act, which requires that we establish an audit committee composed of members of the board of directors that meets specified requirements. In reliance on the exemption in Rule 10A-3(b)(iv)(E), we have designated one member to our audit committee, Hyung-Goo Lee, who is an employee of the KDIC. The KDIC, which is controlled by the Korean government, is our controlling shareholder and, therefore, one of our affiliates. In our assessment, Mr. Lee acts independently in performing the responsibilities of an audit committee member under the Sarbanes-Oxley Act and satisfies the other requirements of Rule 10A-3 under the Exchange Act.
| Item 16E. | Purchase of Equity Securities by the Issuer and Affiliated Purchasers |
Neither we nor any “affiliated purchaser,” as defined in Rule 10b-18(a)(3) of the Exchange Act, purchased any of our equity securities during the period covered by this annual report.
| Item 16F. | Change in Registrant’s Certifying Accountant |
Not Applicable
222
Table of Contents
| Item 16G. | Corporate Governance |
Differences in Corporate Governance Practices
Pursuant to the rules of the New York Stock Exchange applicable to foreign private issuers like us that are listed on the New York Stock Exchange, we are required to disclose significant differences between the New York Stock Exchange’s corporate governance standards and those that we follow under Korean law. The following is a summary of such significant differences.
| NYSE Corporate Governance Standards |
Woori Finance Holdings | |
| Director independence |
||
| Listed companies must have a majority of independent directors. | The majority of our board of directors is independent (as defined in accordance with the New York Stock Exchange’s standards), as seven of our eight directors are outside directors. | |
| Executive Session |
||
| Listed companies must hold meetings solely attended by non-management directors to more effectively check and balance management directors. | Our outside directors hold quarterly meetings, which coincide with the quarterly audit committee meetings, to discuss matters relating to management issues. The audit committee is comprised of five outside directors. | |
| Nomination/Corporate Governance Committee |
||
| Listed companies must have a nomination/corporate governance committee composed entirely of independent directors. | We have established a separate outside directors recommendation committee. | |
| Compensation Committee |
||
| Listed companies must have a compensation committee composed entirely of independent directors. | We maintain a business development and compensation committee composed of four outside directors. | |
| Audit Committee |
||
| Listed companies must have an audit committee that satisfies the requirements of Rule 10A-3 under the Exchange Act. | We maintain an audit committee comprised of five outside directors. Accordingly, we are in compliance with Rule 10A-3 under the Exchange Act. | |
| Audit Committee Additional Requirements |
||
| Listed companies must have an audit committee that is composed of more than three directors. | Our audit committee has five members, as described above. | |
| Shareholder Approval of Equity Compensation Plan |
||
| Listed companies must allow its shareholders to exercise their voting rights with respect to any material revision to the company’s equity compensation plan. | We currently have one equity compensation plan, providing for the grant of stock options to officers and directors. | |
| All material matters related to the granting of stock options are provided in our Articles of Incorporation, and any amendments to the Articles of Incorporation are subject to shareholders’ approval. | ||
| Corporate Governance Guidelines |
||
| Listed companies must adopt and disclose corporate governance guidelines. | We have adopted a corporate governance charter, a Korean-language copy of which is available on our website. | |
223
Table of Contents
| Code of Business Conduct and Ethics |
||
| Listed companies must adopt and disclose a code of business conduct and ethics for directors, officers and employees, and promptly disclose any waivers of the code for directors or executive officers. | We have adopted a Code of Ethics and Business Conduct for Employees, a copy of which is available on our website. | |
| Item 16H. | Mine Safety Disclosure |
Not Applicable
| Item 17. | FINANCIAL STATEMENTS |
Not Applicable
| Item 18. | FINANCIAL STATEMENTS |
Reference is made to Item 19(a) for a list of all financial statements filed as part of this annual report.
| Item 19. | EXHIBITS |
(a) List of financial statements:
| Page | ||||
| Audited consolidated financial statements of Woori Finance Holdings and subsidiaries prepared in accordance with IFRS as issued by the IASB |
||||
| F-1 | ||||
| F-3 | ||||
| Consolidated statements of comprehensive income for the years ended December 31, 2010 and 2011 |
F-4 | |||
| Consolidated statements of changes in equity for the years ended December 31, 2010 and 2011 |
F-5 | |||
| Consolidated statements of cash flows for the years ended December 31, 2010 and 2011 |
F-7 | |||
| F-9 | ||||
224
Table of Contents
(b) Exhibits
Pursuant to the rules and regulations of the U.S. Securities and Exchange Commission, Woori Finance Holdings has filed certain agreements as exhibits to this Annual Report on Form 20-F. These agreements may contain representations and warranties made by the parties. These representations and warranties have been made solely for the benefit of the other party or parties to such agreements and (i) may be intended not as statements of fact, but rather as a way of allocating the risk to one of the parties to such agreements if those statements turn out to be inaccurate, (ii) may have been qualified by disclosures that were made to such other party or parties and that either have been reflected in the company’s filings or are not required to be disclosed in those filings, (iii) may apply materiality standards different from what may be viewed as material to investors and (iv) were made only as of the date of such agreements or such other date(s) as may be specified in such agreements and are subject to more recent developments. Accordingly, these representations and warranties may not describe Woori Finance Holdings’ actual state of affairs at the date of this annual report.
| Number |
Description | |
| 1.1 | Articles of Incorporation of Woori Finance Holdings (translation in English). | |
| 2.1* | Form of Stock Certificate of Woori Finance Holdings’ common stock, par value (Won)5,000 per share (translation in English). | |
| 2.2** | Form of Deposit Agreement among Woori Finance Holdings, Citibank, N.A., as depositary, and all holders and beneficial owners of American depositary shares evidenced by American depositary receipts, including the form of American depositary receipt. | |
| 4.1* | Memorandum of understanding between the KDIC and Woori Finance Holdings dated July 2, 2001, as amended. | |
| 4.2* | Memorandum of understanding between the KDIC and Hanvit Bank (since renamed Woori Bank) dated December 30, 2000, as amended. | |
| 4.3* | Memorandum of understanding between the KDIC and Kyongnam Bank dated December 30, 2000, as amended. | |
| 4.4* | Memorandum of understanding between the KDIC and Kwangju Bank dated December 30, 2000, as amended. | |
| 4.5* | Memorandum of understanding between Woori Finance Holdings and Hanvit Bank (since renamed Woori Bank) dated July 12, 2001, as amended. | |
| 4.6* | Memorandum of understanding between Woori Finance Holdings and Kyongnam Bank dated July 31, 2001, as amended. | |
| 4.7* | Memorandum of understanding between Woori Finance Holdings and Kwangju Bank dated July 31, 2001, as amended. | |
| 8.1**** | List of subsidiaries of Woori Finance Holdings. | |
| 11.1*** | Code of Ethics. | |
| 12.1 | Section 302 certifications. | |
| 13.1 | Section 906 certifications. | |
| * | Incorporated by reference to the exhibits to the Registration Statement on Form 20-F (File No. 001-31811), filed on September 25, 2003 |
| ** | Incorporated by reference to exhibit (a) to the Registration Statement on Form F-6 (File No. 333-109106), filed on September 25, 2003. |
| *** | Incorporated by reference to exhibits to the Annual Report on Form 20-F (File No. 001-31811), filed on June 30, 2004. |
| **** | Incorporated by reference to Note 1 of the notes to the consolidated financial statements of the registrant included in this Annual Report. |
225
Table of Contents
SIGNATURES
The registrant hereby certifies that it meets all of the requirements for filing on Form 20-F and that it has duly caused and authorized the undersigned to sign this annual report on its behalf.
| WOORI FINANCE HOLDINGS CO., LTD. (Registrant) |
| /s/ Pal Seung Lee |
| (Signature) |
| Pal Seung Lee |
| Chairman and Chief Executive Officer |
| (Name/Title) |
Date: April 30, 2012
Table of Contents
REPORT OF INDEPENDENT REGISTERED PUBLIC ACCOUNTING FIRM
To the Board of Directors and Stockholders of
Woori Finance Holdings Co., Ltd.:
We have audited the internal control over financial reporting of Woori Finance Holdings Co., Ltd. and subsidiaries (collectively referred to as the “Company”) as of December 31, 2011, based on criteria established in Internal Control—Integrated Framework issued by the Committee of Sponsoring Organizations of the Treadway Commission. The Company’s management is responsible for maintaining effective internal control over financial reporting and for its assessment of the effectiveness of internal control over financial reporting, included in the accompanying Management’s Annual Report on Internal Control over Financial Reporting. Our responsibility is to express an opinion on the Company’s internal control over financial reporting based on our audit.
We conducted our audit in accordance with the standards of the Public Company Accounting Oversight Board (United States). Those standards require that we plan and perform the audit to obtain reasonable assurance about whether effective internal control over financial reporting was maintained in all material respects. Our audit included obtaining an understanding of internal control over financial reporting, assessing the risk that a material weakness exists, testing and evaluating the design and operating effectiveness of internal control based on the assessed risk, and performing such other procedures as we considered necessary in the circumstances. We believe that our audit provides a reasonable basis for our opinion.
A company’s internal control over financial reporting is a process designed by, or under the supervision of, the company’s principal executive and principal financial officers, or persons performing similar functions, and effected by the company’s board of directors, management and other personnel to provide reasonable assurance regarding the reliability of financial reporting and the preparation of financial statements for external purposes in accordance with generally accepted accounting principles. A company’s internal control over financial reporting includes those policies and procedures that (1) pertain to the maintenance of records that, in reasonable detail, accurately and fairly reflect the transactions and dispositions of the assets of the company; (2) provide reasonable assurance that transactions are recorded as necessary to permit preparation of financial statements in accordance with generally accepted accounting principles, and that receipts and expenditures of the company are being made only in accordance with authorizations of management and directors of the company; and (3) provide reasonable assurance regarding prevention or timely detection of unauthorized acquisition, use or disposition of the company’s assets that could have a material effect on the financial statements.
Because of the inherent limitations of internal control over financial reporting, including the possibility of collusion or improper management override of controls, material misstatements due to error or fraud may not be prevented or detected on a timely basis. Also, projections of any evaluation of the effectiveness of the internal control over financial reporting to future periods are subject to the risk that the controls may become inadequate because of changes in conditions, or that the degree of compliance with the policies or procedures may deteriorate.
In our opinion, the Company maintained, in all material respects, effective internal control over financial reporting as of December 31, 2011, based on the criteria established in Internal Control—Integrated Framework issued by the Committee of Sponsoring Organizations of the Treadway Commission.
We have also audited, in accordance with the standards of the Public Company Accounting Oversight Board (United States), the consolidated financial statements as of and for the year ended December 31, 2011 of the Company and our report dated March 21, 2012 expressed an unqualified opinion on those consolidated financial statements and included explanatory paragraph related to the translation of financial statement amounts into United States dollars for the convenience of readers in the United States of America.
/s/ DELOITTE ANJIN LLC
23 Yoido-dong, Youngdeungpo-gu
Seoul, Korea
March 21, 2012
F-1
Table of Contents
REPORT OF INDEPENDENT REGISTERED PUBLIC ACCOUNTING FIRM
To the Board of Directors and Stockholders of
Woori Finance Holdings Co., Ltd.:
We have audited the accompanying consolidated statements of financial position of Woori Finance Holdings Co., Ltd. and subsidiaries (the “Company”) as of January 1, 2010, December 31, 2010 and December 31, 2011 and the consolidated statements of comprehensive income, changes in equity, and cash flows for each of the two years in the period ended December 31, 2011. These financial statements are the responsibility of the Company’s management. Our responsibility is to express an opinion on these financial statements based on our audits.
We conducted our audits in accordance with the standards of the Public Company Accounting Oversight Board (United States). Those standards require that we plan and perform the audit to obtain reasonable assurance about whether the financial statements are free of material misstatement. An audit includes examining, on a test basis, evidence supporting the amounts and disclosures in the financial statements. An audit also includes assessing the accounting principles used and significant estimates made by management, as well as evaluating the overall financial statement presentation. We believe that our audits provide a reasonable basis for our opinion.
In our opinion, such consolidated financial statements present fairly, in all material respects, the financial position of the Company as of January 1, 2010, December 31, 2010 and December 31, 2011 and the results of their operations and their cash flows for each of the two years in the period ended December 31, 2011, in conformity with the International Financial Reporting Standards (“IFRS”) as issued by the International Accounting Standards Board (“IASB”).
Our audits also comprehended the translation of Korean Won amounts into United States dollar amounts and, in our opinion, such translation has been made in conformity with the basis in Note 2. Such U.S. dollar amounts are presented solely for the convenience of readers in the United States of America.
We have also audited, in accordance with the standards of the Public Company Accounting Oversight Board (United States), the Company’s internal control over financial reporting as of December 31, 2011, based on the criteria established in Internal Control—Integrated Framework issued by the Committee of Sponsoring Organizations of the Treadway Commission and our report dated March 21, 2012, expressed an unqualified opinion on the Company’s internal control over financial reporting.
/s/ DELOITTE ANJIN LLC
23 Yoido-dong, Youngdeungpo-gu
Seoul, Korea
March 21, 2012
F-2
Table of Contents
WOORI FINANCE HOLDINGS CO., LTD. AND SUBSIDIARIES
CONSOLIDATED STATEMENTS OF FINANCIAL POSITION
AS OF JANUARY 1, 2010, DECEMBER 31, 2010 AND DECEMBER 31, 2011
| Korean Won | U.S. Dollars | |||||||||||||||
| January 1, 2010 |
December 31, 2010 |
December 31, 2011 |
December 31, 2011 |
|||||||||||||
| (in millions) | (in thousands) (Note 2) |
|||||||||||||||
| ASSETS | ||||||||||||||||
| Cash and cash equivalents |
5,805,996 | 4,871,109 | 6,417,123 | 5,539,165 | ||||||||||||
| Financial assets at fair value through profit or loss |
25,151,525 | 22,183,761 | 25,600,231 | 22,097,739 | ||||||||||||
| Available-for-sale financial assets (Notes 8, 11, 17 and 44) |
21,337,500 | 21,997,884 | 19,671,924 | 16,980,513 | ||||||||||||
| Held-to-maturity financial assets (Notes 9 and 11) |
15,953,709 | 19,885,559 | 20,036,128 | 17,294,888 | ||||||||||||
| Loans and receivables (Notes 6, 10, 11, 17, 31, 43 and 44) |
211,057,174 | 216,791,805 | 235,159,956 | 202,986,583 | ||||||||||||
| Investments in jointly controlled entities and associates (Note 12) |
655,721 | 744,844 | 928,233 | 801,237 | ||||||||||||
| Investment properties (Notes 13 and 16) |
746,126 | 643,271 | 498,999 | 430,729 | ||||||||||||
| Premises and equipment (Notes 14, 16 and 17) |
3,095,029 | 3,097,378 | 3,134,472 | 2,705,630 | ||||||||||||
| Intangible assets and goodwill (Notes 15 and 45) |
315,187 | 295,136 | 447,891 | 386,613 | ||||||||||||
| Current tax assets (Note 40) |
28,203 | 9,568 | 56,570 | 48,829 | ||||||||||||
| Deferred tax assets (Note 40) |
74,101 | 58,705 | 79,980 | 69,038 | ||||||||||||
| Derivative assets (Notes 11 and 25) |
107,490 | 131,511 | 326,840 | 282,123 | ||||||||||||
| Assets held for sale (Note 16) |
28,423 | 87,926 | 56,243 | 48,548 | ||||||||||||
| Other assets (Notes 16, 18 and 44) |
484,822 | 378,861 | 377,059 | 325,472 | ||||||||||||
|
|
|
|
|
|
|
|
|
|||||||||
| Total assets |
284,841,006 | 291,177,318 | 312,791,649 | 269,997,107 | ||||||||||||
|
|
|
|
|
|
|
|
|
|||||||||
| LIABILITIES | ||||||||||||||||
| Financial liabilities at fair value through profit or loss |
10,415,070 | 8,838,281 | 9,621,546 | 8,305,176 | ||||||||||||
| Deposits due to customers (Notes 11, 20 and 44) |
176,926,868 | 185,427,625 | 195,930,482 | 169,124,283 | ||||||||||||
| Borrowings (Notes 11 and 21) |
32,455,007 | 34,265,662 | 34,666,709 | 29,923,789 | ||||||||||||
| Debentures (Notes 11 and 21) |
32,573,979 | 29,110,640 | 29,265,833 | 25,261,833 | ||||||||||||
| Provisions (Note 22) |
693,521 | 761,055 | 892,308 | 770,227 | ||||||||||||
| Retirement benefit obligation (Note 23) |
123,011 | 69,949 | 119,704 | 103,327 | ||||||||||||
| Current tax liabilities (Note 40) |
127,871 | 173,960 | 274,257 | 236,735 | ||||||||||||
| Deferred tax liabilities (Note 40) |
241,796 | 212,534 | 260,431 | 224,798 | ||||||||||||
| Derivative liabilities (Notes 11 and 25) |
41,236 | 5,339 | 33,493 | 28,911 | ||||||||||||
| Other financial liabilities (Notes 11, 24, 43 and 44) |
11,226,749 | 11,648,328 | 19,083,709 | 16,472,774 | ||||||||||||
| Other liabilities (Notes 24 and 44) |
804,494 | 399,191 | 569,783 | 491,828 | ||||||||||||
|
|
|
|
|
|
|
|
|
|||||||||
| Total liabilities |
265,629,602 | 270,912,564 | 290,718,255 | 250,943,681 | ||||||||||||
|
|
|
|
|
|
|
|
|
|||||||||
| EQUITY | ||||||||||||||||
| Owners’ equity: |
14,734,993 | 15,701,540 | 17,523,998 | 15,126,455 | ||||||||||||
| Capital stock (Note 27) |
4,030,077 | 4,030,077 | 4,030,077 | 3,478,703 | ||||||||||||
| Hybrid securities (Note 28) |
— | — | 309,010 | 266,733 | ||||||||||||
| Capital surplus (Note 27) |
180,473 | 180,105 | 175,768 | 151,720 | ||||||||||||
| Other equity (Note 29) |
1,244,096 | 1,002,019 | 586,421 | 506,190 | ||||||||||||
| Retained earnings (Note 30) |
9,280,347 | 10,489,339 | 12,422,722 | 10,723,109 | ||||||||||||
| Non-controlling interests |
4,476,411 | 4,563,214 | 4,549,396 | 3,926,971 | ||||||||||||
|
|
|
|
|
|
|
|
|
|||||||||
| Total equity |
19,211,404 | 20,264,754 | 22,073,394 | 19,053,426 | ||||||||||||
|
|
|
|
|
|
|
|
|
|||||||||
| Total liabilities and equity |
284,841,006 | 291,177,318 | 312,791,649 | 269,997,107 | ||||||||||||
|
|
|
|
|
|
|
|
|
|||||||||
See accompanying notes to consolidated financial statements.
F-3
Table of Contents
WOORI FINANCE HOLDINGS CO., LTD. AND SUBSIDIARIES
CONSOLIDATED STATEMENTS OF COMPREHENSIVE INCOME
FOR THE YEARS ENDED DECEMBER 31, 2010 AND 2011
| Korean won | U.S. Dollars | |||||||||||
| 2010 | 2011 | 2011 | ||||||||||
| (In millions, except per share data) | (in thousands, except per share data) (Note 2) |
|||||||||||
| Net interest income (Notes 33 and 44) |
6,423,145 | 7,262,045 | 6,268,490 | |||||||||
| Interest income |
14,057,227 | 15,044,846 | 12,986,488 | |||||||||
| Interest expense |
7,634,082 | 7,782,801 | 6,717,998 | |||||||||
| Net fees and commissions income (Notes 34 and 44) |
1,115,774 | 1,195,492 | 1,031,931 | |||||||||
| Fees and commissions income |
1,688,039 | 1,774,434 | 1,531,665 | |||||||||
| Fees and commissions expense |
572,265 | 578,942 | 499,734 | |||||||||
| Dividends (Note 35) |
200,780 | 203,005 | 175,231 | |||||||||
| Gain on financial assets at FVTPL (Note 36) |
39,074 | 119,403 | 103,067 | |||||||||
| Gain on available-for-sale financial assets (Note 37) |
1,073,469 | 1,072,877 | 926,091 | |||||||||
| Gain on held-to-maturity financial assets |
21 | 82 | 71 | |||||||||
| Impairment loss on credit loss (Note 38) |
2,872,943 | 2,268,927 | 1,958,504 | |||||||||
| Other net operating expenses (Notes 39 and 44) |
(3,910,451 | ) | (4,423,304 | ) | (3,818,131 | ) | ||||||
|
|
|
|
|
|
|
|||||||
| Operating income (Note 46) |
2,068,869 | 3,160,673 | 2,728,246 | |||||||||
| Share of profits of jointly controlled entities and associates (Note 12) |
29,926 | 16,700 | 14,415 | |||||||||
|
|
|
|
|
|
|
|||||||
| Net income before income tax expense |
2,098,795 | 3,177,373 | 2,742,661 | |||||||||
| Income tax expense (Note 40) |
498,121 | 744,093 | 642,290 | |||||||||
|
|
|
|
|
|
|
|||||||
| Net income |
1,600,674 | 2,433,280 | 2,100,371 | |||||||||
|
|
|
|
|
|
|
|||||||
| Net income attributable to owners |
1,288,856 | 2,136,828 | 1,844,478 | |||||||||
| Net income attributable to non-controlling interests |
311,818 | 296,452 | 255,893 | |||||||||
| Other comprehensive income (loss), net of tax |
(235,991 | ) | (385,374 | ) | (332,649 | ) | ||||||
|
|
|
|
|
|
|
|||||||
| Loss on available-for-sale financial assets |
(205,332 | ) | (374,877 | ) | (323,589 | ) | ||||||
| Share of other comprehensive loss of jointly controlled entities and associates |
(20,546 | ) | (37,602 | ) | (32,457 | ) | ||||||
| Gain (loss) on overseas business translation |
(18,826 | ) | 24,591 | 21,227 | ||||||||
| Gain on valuation of cashflow hedge |
8,713 | 2,514 | 2,170 | |||||||||
|
|
|
|
|
|
|
|||||||
| Total comprehensive income |
1,364,683 | 2,047,906 | 1,767,722 | |||||||||
|
|
|
|
|
|
|
|||||||
| Comprehensive income attributable to owners |
1,051,725 | 1,729,658 | 1,493,015 | |||||||||
| Comprehensive income attributable to non-controlling interests |
312,958 | 318,248 | 274,707 | |||||||||
|
|
|
|
|
|
|
|||||||
| Basic and diluted earnings per share (Note 41) |
1,599 | 2,649 | 2.29 | |||||||||
|
|
|
|
|
|
|
|||||||
See accompanying notes to consolidated financial statements.
F-4
Table of Contents
WOORI FINANCE HOLDINGS CO., LTD. AND SUBSIDIARIES
CONSOLIDATED STATEMENTS OF CHANGES IN EQUITY
FOR THE YEARS ENDED DECEMBER 31, 2010 AND 2011
| Capital stock |
Hybrid securities |
Capital surplus |
Other equity |
Retained earnings |
Controlling interests |
Non-controlling interests |
Total equity |
|||||||||||||||||||||||||
| Korean Won (in millions) | ||||||||||||||||||||||||||||||||
| January 1, 2010 |
4,030,077 | — | 180,473 | 1,244,096 | 9,280,347 | 14,734,993 | 4,476,411 | 19,211,404 | ||||||||||||||||||||||||
| Net income |
— | — | — | — | 1,288,856 | 1,288,856 | 311,818 | 1,600,674 | ||||||||||||||||||||||||
| Dividends |
— | — | — | — | (80,601 | ) | (80,601 | ) | (41,339 | ) | (121,940 | ) | ||||||||||||||||||||
| Changes in investment in consolidated subsidiaries |
— | — | (368 | ) | — | — | (368 | ) | 397 | 29 | ||||||||||||||||||||||
| Variation of available-for-sale financial assets |
— | — | — | (206,476 | ) | — | (206,476 | ) | 1,144 | (205,332 | ) | |||||||||||||||||||||
| Changes in equity of jointly controlled entities and associates |
— | — | — | (21,111 | ) | — | (21,111 | ) | 565 | (20,546 | ) | |||||||||||||||||||||
| Cash flow hedge |
— | — | — | (15,843 | ) | — | (15,843 | ) | (2,983 | ) | (18,826 | ) | ||||||||||||||||||||
| Foreign currency translation |
— | — | — | 6,299 | — | 6,299 | 2,414 | 8,713 | ||||||||||||||||||||||||
| Changes in other equity |
— | — | — | (4,946 | ) | — | (4,946 | ) | (983 | ) | (5,929 | ) | ||||||||||||||||||||
| Changes in equity of non-controlling interests |
— | — | — | — | — | — | (14,585 | ) | (14,585 | ) | ||||||||||||||||||||||
| Dividends to hybrid securities |
— | — | — | — | — | — | (169,645 | ) | (169,645 | ) | ||||||||||||||||||||||
| Others |
— | — | — | — | 737 | 737 | — | 737 | ||||||||||||||||||||||||
|
|
|
|
|
|
|
|
|
|
|
|
|
|
|
|
|
|||||||||||||||||
| December 31, 2010 |
4,030,077 | — | 180,105 | 1,002,019 | 10,489,339 | 15,701,540 | 4,563,214 | 20,264,754 | ||||||||||||||||||||||||
|
|
|
|
|
|
|
|
|
|
|
|
|
|
|
|
|
|||||||||||||||||
| January 1, 2011 |
4,030,077 | — | 180,105 | 1,002,019 | 10,489,339 | 15,701,540 | 4,563,214 | 20,264,754 | ||||||||||||||||||||||||
| Net income |
— | — | — | — | 2,136,828 | 2,136,828 | 296,452 | 2,433,280 | ||||||||||||||||||||||||
| Dividends |
— | — | — | — | (201,503 | ) | (201,503 | ) | (36,687 | ) | (238,190 | ) | ||||||||||||||||||||
| Changes in investment in consolidated subsidiaries |
— | — | 295 | — | — | 295 | (217 | ) | 78 | |||||||||||||||||||||||
| Changes in other capital surplus |
— | — | (4,632 | ) | — | — | (4,632 | ) | 355,418 | 350,786 | ||||||||||||||||||||||
| Variation of available-for-sale financial assets |
— | — | — | (403,737 | ) | — | (403,737 | ) | 28,860 | (374,877 | ) | |||||||||||||||||||||
| Changes in equity of jointly controlled entities and associates |
— | — | — | (20,030 | ) | — | (20,030 | ) | (17,572 | ) | (37,602 | ) | ||||||||||||||||||||
| Cash flow hedge |
— | — | — | 13,449 | — | 13,449 | 11,142 | 24,591 | ||||||||||||||||||||||||
| Foreign currency translation |
— | — | — | 3,149 | — | 3,149 | (635 | ) | 2,514 | |||||||||||||||||||||||
| Changes in other equity |
— | — | — | (8,428 | ) | — | (8,428 | ) | (16,340 | ) | (24,768 | ) | ||||||||||||||||||||
| Changes in equity of non-controlling interests |
— | — | — | — | — | — | 22,292 | 22,292 | ||||||||||||||||||||||||
| Dividends to hybrid securities |
— | — | — | — | (1,942 | ) | (1,942 | ) | (156,532 | ) | (158,474 | ) | ||||||||||||||||||||
| Issue of hybrid securities |
— | 309,010 | — | — | — | 309,010 | — | 309,010 | ||||||||||||||||||||||||
| Repayment of hybrid securities |
— | — | — | (1 | ) | — | (1 | ) | (499,999 | ) | (500,000 | ) | ||||||||||||||||||||
|
|
|
|
|
|
|
|
|
|
|
|
|
|
|
|
|
|||||||||||||||||
| December 31, 2011 |
4,030,077 | 309,010 | 175,768 | 586,421 | 12,422,722 | 17,523,998 | 4,549,396 | 22,073,394 | ||||||||||||||||||||||||
|
|
|
|
|
|
|
|
|
|
|
|
|
|
|
|
|
|||||||||||||||||
(Continued)
F-5
Table of Contents
WOORI FINANCE HOLDINGS CO., LTD. AND SUBSIDIARIES
CONSOLIDATED STATEMENTS OF CHANGES IN EQUITY—(CONTINUED)
FOR THE YEARS ENDED DECEMBER 31, 2010 AND 2011
| Capital stock |
Hybrid securities |
Capital surplus |
Other equity |
Retained earnings |
Controlling interests |
Non- controlling interests |
Total equity |
|||||||||||||||||||||||||
| U.S. Dollars (in thousands) (Note 2) | ||||||||||||||||||||||||||||||||
| January 1, 2011 |
3,478,703 | — | 155,464 | 864,928 | 9,054,242 | 13,553,337 | 3,938,898 | 17,492,235 | ||||||||||||||||||||||||
| Net income |
— | — | — | — | 1,844,478 | 1,844,478 | 255,893 | 2,100,371 | ||||||||||||||||||||||||
| Dividends |
— | — | — | — | (173,934 | ) | (173,934 | ) | (31,668 | ) | (205,602 | ) | ||||||||||||||||||||
| Changes in investment in consolidated subsidiaries |
— | — | 255 | — | — | 255 | (187 | ) | 68 | |||||||||||||||||||||||
| Changes in other capital surplus |
— | — | (3,999 | ) | — | — | (3,999 | ) | 306,791 | 302,792 | ||||||||||||||||||||||
| Variation of available-for-sale financial assets |
— | — | — | (348,501 | ) | — | (348,501 | ) | 24,912 | (323,589 | ) | |||||||||||||||||||||
| Changes in equity of jointly controlled entities and associates |
— | — | — | (17,289 | ) | — | (17,289 | ) | (15,168 | ) | (32,457 | ) | ||||||||||||||||||||
| Cash flow hedge |
— | — | — | 11,609 | — | 11,609 | 9,618 | 21,227 | ||||||||||||||||||||||||
| Foreign currency translation |
— | — | — | 2,718 | — | 2,718 | (548 | ) | 2,170 | |||||||||||||||||||||||
| Changes in other equity |
— | — | — | (7,274 | ) | — | (7,274 | ) | (14,104 | ) | (21,378 | ) | ||||||||||||||||||||
| Changes in equity of non-controlling interests |
— | — | — | — | — | — | 19,242 | 19,242 | ||||||||||||||||||||||||
| Dividends to hybrid securities |
— | — | — | — | (1,677 | ) | (1,677 | ) | (135,116 | ) | (136,793 | ) | ||||||||||||||||||||
| Issue of hybrid securities |
— | 266,733 | — | — | — | 266,733 | — | 266,733 | ||||||||||||||||||||||||
| Repayment of hybrid securities |
— | — | — | (1 | ) | — | (1 | ) | (431,592 | ) | (431,593 | ) | ||||||||||||||||||||
|
|
|
|
|
|
|
|
|
|
|
|
|
|
|
|
|
|||||||||||||||||
| December 31, 2011 |
3,478,703 | 266,733 | 151,720 | 506,190 | 10,723,109 | 15,126,455 | 3,926,971 | 19,053,426 | ||||||||||||||||||||||||
|
|
|
|
|
|
|
|
|
|
|
|
|
|
|
|
|
|||||||||||||||||
See accompanying notes to consolidated financial statements.
F-6
Table of Contents
WOORI FINANCE HOLDINGS CO., LTD. AND SUBSIDIARIES
CONSOLIDATED STATEMENTS OF CASH FLOWS
FOR THE YEARS ENDED DECEMBER 31, 2010 AND 2011
| Korean Won | U.S. Dollars | |||||||||||
| 2010 | 2011 | 2011 | ||||||||||
| (in millions) | (in thousands) (Note 2) |
|||||||||||
| Cash flows from operating activities: |
||||||||||||
| Net income |
1,600,674 | 2,433,280 | 2,100,371 | |||||||||
| Adjustments: |
||||||||||||
| Income tax expense |
498,121 | 744,093 | 642,290 | |||||||||
| Interest income |
(14,057,227 | ) | (15,044,846 | ) | (12,986,488 | ) | ||||||
| Interest expense |
7,634,082 | 7,782,801 | 6,717,998 | |||||||||
| Dividend income |
(200,780 | ) | (203,005 | ) | (175,231 | ) | ||||||
| Impairment loss on credit loss |
2,872,943 | 2,268,927 | 1,958,504 | |||||||||
| Loss on disposal of investments in jointly controlled entities and associates |
69 | 40 | 35 | |||||||||
| Depreciation and amortization |
267,124 | 273,607 | 236,174 | |||||||||
| Loss on disposal of premises and equipment and other assets |
8,055 | 6,247 | 5,392 | |||||||||
| Impairment loss of premises and equipment and other assets |
15,331 | 18,875 | 16,293 | |||||||||
| Loss on transaction of derivatives |
27,525 | 5,641 | 4,869 | |||||||||
| Loss on valuation of derivatives |
24,670 | 8,378 | 7,232 | |||||||||
| Loss on fair value hedged items |
158,256 | 195,837 | 169,044 | |||||||||
| Provisions |
117,531 | 59,260 | 51,152 | |||||||||
| Retirement benefits |
125,235 | 153,167 | 132,211 | |||||||||
| Loss on valuation of investments in jointly controlled entities and associates |
35,852 | 39,738 | 34,301 | |||||||||
| Loss on foreign exchange translation |
63,830 | 35,226 | 30,407 | |||||||||
| Gain on disposal of available-for-sale financial assets |
(1,073,469 | ) | (1,072,877 | ) | (926,091 | ) | ||||||
| Gain on disposal of held-to-maturity financial assets |
(21 | ) | (82 | ) | (71 | ) | ||||||
| Gain on disposal of investments in jointly controlled entities and associates |
(175 | ) | (61,071 | ) | (52,716 | ) | ||||||
| Gain on disposal of premises and equipment and other assets |
(12,145 | ) | (74,140 | ) | (63,997 | ) | ||||||
| Reversal of impairment loss of premises and equipment and other assets |
(3,146 | ) | (791 | ) | (683 | ) | ||||||
| Gain on transaction of derivatives |
(7,684 | ) | (233 | ) | (201 | ) | ||||||
| Gain on valuation of derivatives |
(121,434 | ) | (187,038 | ) | (161,448 | ) | ||||||
| Gain on fair value hedged items |
(36,691 | ) | (3,876 | ) | (3,346 | ) | ||||||
| Reversal of provisions |
(30,185 | ) | (8,350 | ) | (7,208 | ) | ||||||
| Gain on valuation of investments in jointly controlled entities and associates |
(65,778 | ) | (56,438 | ) | (48,716 | ) | ||||||
| Gain on foreign exchange translation |
(41,073 | ) | (46,882 | ) | (40,468 | ) | ||||||
| Changes in operating assets and liabilities: |
||||||||||||
| Decrease (increase) in financial assets at fair value through profit or loss |
1,174,406 | (2,633,195 | ) | (2,272,935 | ) | |||||||
| Increase in loans and receivables |
(6,722,951 | ) | (17,933,322 | ) | (15,479,777 | ) | ||||||
| Increase in other assets |
(1,662,368 | ) | (2,529,458 | ) | (2,183,391 | ) | ||||||
| Net increase in deposits due to customers |
8,499,933 | 10,455,304 | 9,024,863 | |||||||||
(Continued)
F-7
Table of Contents
WOORI FINANCE HOLDINGS CO., LTD. AND SUBSIDIARIES
CONSOLIDATED STATEMENTS OF CASH FLOWS—(CONTINUED)
FOR THE YEARS ENDED DECEMBER 31, 2010 AND 2011
| Korean Won | U.S. Dollars | |||||||||||
| 2010 | 2011 | 2011 | ||||||||||
| (in millions) | (in thousands) (Note 2) |
|||||||||||
| Increase (decrease) in provisions for guarantee and loan commitment |
(24,218 | ) | 12,921 | 11,153 | ||||||||
| Decrease in retirement benefit obligation |
(178,297 | ) | (142,289 | ) | (122,822 | ) | ||||||
| Increase in other financial liabilities |
421,689 | 6,826,674 | 5,892,685 | |||||||||
| Increase (decrease) in other liabilities |
(421,826 | ) | 174,424 | 150,560 | ||||||||
| Cash received (paid) from operating activities: |
||||||||||||
| Interest revenue received |
13,920,782 | 14,948,932 | 12,903,696 | |||||||||
| Interest expense paid |
(7,632,921 | ) | (7,170,272 | ) | (6,189,272 | ) | ||||||
| Dividend received |
200,780 | 203,005 | 175,231 | |||||||||
| Income tax paid |
(380,380 | ) | (549,333 | ) | (474,176 | ) | ||||||
|
|
|
|
|
|
|
|||||||
| Net cash provided by (used in) operating activities |
4,994,119 | (1,071,121 | ) | (924,576 | ) | |||||||
|
|
|
|
|
|
|
|||||||
| Cash flows from investing activities: |
||||||||||||
| Disposal of available-for-sale financial assets |
12,451,649 | 11,319,306 | 9,770,657 | |||||||||
| Disposal of held-to-maturity financial assets |
7,963,819 | 6,595,952 | 5,693,528 | |||||||||
| Disposal of investments in jointly controlled entities and associates |
101,182 | 167,701 | 144,757 | |||||||||
| Disposal of investment properties |
8,909 | 130,501 | 112,647 | |||||||||
| Disposal of premises and equipment |
57,582 | 31,962 | 27,589 | |||||||||
| Disposal of intangible assets |
6,261 | 3,270 | 2,823 | |||||||||
| Disposal of assets held for sale |
4,962 | 109,168 | 94,232 | |||||||||
| Acquisition of available-for-sale financial assets |
(11,912,309 | ) | (8,360,550 | ) | (7,216,704 | ) | ||||||
| Acquisition of held-to-maturity financial assets |
(12,072,500 | ) | (6,826,232 | ) | (5,892,302 | ) | ||||||
| Acquisition of investment in jointly controlled entities and associates |
(191,913 | ) | (311,805 | ) | (269,145 | ) | ||||||
| Acquisition of investment properties |
— | (1,356 | ) | (1,170 | ) | |||||||
| Acquisition of premises and equipment |
(194,910 | ) | (232,456 | ) | (200,653 | ) | ||||||
| Acquisition of intangible asset |
(59,918 | ) | (211,778 | ) | (182,804 | ) | ||||||
|
|
|
|
|
|
|
|||||||
| Net cash provided by (used in) investing activities |
(3,837,186 | ) | 2,413,683 | 2,083,455 | ||||||||
|
|
|
|
|
|
|
|||||||
| Cash flows from financing activities: |
||||||||||||
| Issue of borrowings |
7,414,534 | 5,477,457 | 4,728,060 | |||||||||
| Issue of debentures |
9,094,550 | 6,942,404 | 5,992,580 | |||||||||
| Issue of hybrid securities |
— | 309,010 | 266,733 | |||||||||
| Increase in hedging derivatives |
25,080 | 10,113 | 8,729 | |||||||||
| Net increase in non-controlling interests |
— | 189,728 | 163,770 | |||||||||
| Repayment of borrowings |
(5,607,712 | ) | (5,076,336 | ) | (4,381,818 | ) | ||||||
| Repayment of debentures |
(12,683,638 | ) | (6,975,522 | ) | (6,021,167 | ) | ||||||
| Dividends paid |
(80,601 | ) | (201,503 | ) | (173,934 | ) | ||||||
| Repayment of hybrid securities of subsidiaries |
— | (500,000 | ) | (431,593 | ) | |||||||
| Net decrease in non-controlling interests |
225,014 | — | — | |||||||||
|
|
|
|
|
|
|
|||||||
| Net cash provided by (used in) financing activities |
(2,062,801 | ) | 175,351 | 151,360 | ||||||||
|
|
|
|
|
|
|
|||||||
| Net increase (decrease) in cash and cash equivalents |
(905,868 | ) | 1,517,913 | 1,310,239 | ||||||||
|
|
|
|
|
|
|
|||||||
| Cash and cash equivalents, beginning of the year |
5,805,996 | 4,871,109 | 4,204,670 | |||||||||
| Effects of exchange rate changes on cash and cash equivalents |
(29,019 | ) | 28,101 | 24,256 | ||||||||
|
|
|
|
|
|
|
|||||||
| Cash and cash equivalents, end of the year |
4,871,109 | 6,417,123 | 5,539,165 | |||||||||
|
|
|
|
|
|
|
|||||||
See accompanying notes to consolidated financial statements.
F-8
Table of Contents
WOORI FINANCE HOLDINGS CO., LTD. AND SUBSIDIARIES
NOTES TO CONSOLIDATED FINANCIAL STATEMENTS
FOR THE YEARS ENDED DECEMBER 31, 2010 AND 2011
1. General
| (1) | Woori Finance Holdings Co., Ltd. |
Woori Finance Holdings Co., Ltd. (hereinafter referred to “Woori Finance Holdings” or “Parent” or the “Company”) was incorporated under the laws of the Republic of Korea on March 27, 2001, to manage the following five financial institutions: Woori Bank, Kyongnam Bank, Kwangju Bank, Woori Credit Card Co., Ltd. (formerly known as Peace Bank of Korea which merged into Woori Bank on March 31, 2004) and Woori Investment Bank (which merged into Woori Bank on July 31, 2003), whose shares were contributed to the Company by the Korea Deposit Insurance Corporation (the “KDIC”) in accordance with the provisions of the Financial Holding Company Act. As of December 31, 2011, the Company controls the following entities: three commercial banks, which include Woori Bank (formerly known as Hanvit Bank), Kyongnam Bank and Kwangju Bank (collectively referred to as the “Bank Subsidiaries”); Woori FIS Co., Ltd. (formerly known as Woori Finance Information System Co., Ltd., “Woori FIS”); Woori F&I Co., Ltd. (“Woori F&I”) ; Woori Investment & Securities Co., Ltd. (“Woori Investment & Securities”); Woori Asset Management Co., Ltd. (“Woori Asset Management”, formerly known as Woori Credit Suisse Asset Management Co., Ltd.); Woori Private Equity Co., Ltd. (“Woori PE”); Woori Financial Co., Ltd. (“Woori Financial”, formerly known as Hanmi Capital Co., Ltd.) and Woori FG Savings Bank; all collectively referred to as “Woori Subsidiaries.” Several of the Woori Subsidiaries also have other subsidiaries of which the Company is now the ultimate financial holding company. As a result of its functional restructuring, as of December 31, 2011, the Company consolidates Woori Bank, nine other subsidiaries, and 133 2nd-tier subsidiaries including Woori Credit Information Co., Ltd.
Upon incorporation, the Company’s stock amounted to 3,637,293 million Won, consisting of 727,458,609 common shares (5,000 Won per share). As a result of several capital increases, exercise of warrants and conversion rights since incorporation, as of December 31, 2011, the Company’s stock amounted to 4,030,077 million Won, consisting of 806,015,340 common shares issued and outstanding of which KDIC owns 459,198,609 shares (56.97% ownership).
On June 24, 2002, the Company listed its common shares on the Korea Exchange. On September 29, 2003, the Company registered with the Securities and Exchange Commission in the United States of America and listed its American Depositary Shares on the New York Stock Exchange.
F-9
Table of Contents
| (2) | The financial statements for the Company and its subsidiaries (the “Group”) includes the following subsidiaries (Unit: Korean Won in millions, USD in thousands, EUR in thousands, VND in millions, IDR in millions, RUB in millions): |
| January 1, 2010 |
December 31, 2010 |
December 31, 2011 |
||||||||||||||||||||||||||||
| Subsidiaries |
Capital | Main business |
Number of shares owned |
Percentage of owner- ship (%) |
Number of shares owned |
Percentage of owner- ship (%) |
Number of shares owned |
Percentage of owner- ship (%) |
||||||||||||||||||||||
| Woori Finance Holdings: |
||||||||||||||||||||||||||||||
| Woori Bank |
3,829,800 | Banking | 765,956,580 | 100.0 | 765,956,580 | 100.0 | 765,956,580 | 100.0 | ||||||||||||||||||||||
| Kyongnam Bank(*9) |
290,300 | ” | 58,049,994 | 99.9 | 58,049,994 | 99.9 | 58,050,037 | 100.0 | ||||||||||||||||||||||
| Kwangju Bank(*9) |
247,100 | ” | 49,413,333 | 99.9 | 49,413,333 | 99.9 | 49,413,851 | 100.0 | ||||||||||||||||||||||
| Woori FIS(*1) |
4,500 | System software development& maintenance |
900,000 | 100.0 | 900,000 | 100.0 | 900,000 | 100.0 | ||||||||||||||||||||||
| Woori F&I(*8) |
70,000 | Financial business |
6,000,000 | 100.0 | 6,000,000 | 100.0 | 14,000,000 | 100.0 | ||||||||||||||||||||||
| Woori Investment & Securities(*2)(*8) |
1,120,500 | Securities investment |
46,324,981 | 35.0 | 46,324,981 | 35.0 | 75,426,214 | 37.9 | ||||||||||||||||||||||
| Woori Asset Management |
33,300 | Financial business |
6,662,000 | 100.0 | 6,662,000 | 100.0 | 6,662,000 | 100.0 | ||||||||||||||||||||||
| Woori PE(*8) |
30,000 | ” | 4,000,000 | 100.0 | 4,000,000 | 100.0 | 6,000,000 | 100.0 | ||||||||||||||||||||||
| Woori Financial |
84,800 | ” | 8,909,439 | 52.5 | 8,909,439 | 52.5 | 8,909,439 | 52.5 | ||||||||||||||||||||||
| Woori FG Savings Bank(*3) |
31,600 | ” | — | — | — | — | 6,320,000 | 100.0 | ||||||||||||||||||||||
| Woori Bank: |
||||||||||||||||||||||||||||||
| Woori Credit Information Co., Ltd. |
5,000 | Financial business |
1,008,000 | 100.0 | 1,008,000 | 100.0 | 1,008,000 | 100.0 | ||||||||||||||||||||||
| Woori America Bank(*8)(*14) |
USD122,500 | Banking | 10,500,000 | 100.0 | 10,500,000 | 100.0 | 24,500,000 | 100.0 | ||||||||||||||||||||||
| Woori Global Market Asia Limited(*14) |
USD 50,000 | ” | 39,000,000 | 100.0 | 39,000,000 | 100.0 | 39,000,000 | 100.0 | ||||||||||||||||||||||
| Woori Bank (China) Limited(*14) |
USD 308,810 | ” | — | 100.0 | — | 100.0 | — | 100.0 | ||||||||||||||||||||||
| ZAO Woori Bank(*14) |
RUB 500 | ” | 19,999,999 | 100.0 | 19,999,999 | 100.0 | 19,999,999 | 100.0 | ||||||||||||||||||||||
| PT. Bank Woori Indonesia(*14) |
IDR 170,000 | Banking | 1,618 | 95.2 | 1,618 | 95.2 | 1,618 | 95.2 | ||||||||||||||||||||||
| Korea BTL Infrastructure Fund(*8) |
467,000 | Financial business |
55,152,422 | 100.0 | 66,958,321 | 100.0 | 93,393,568 | 100.0 | ||||||||||||||||||||||
| Woori Fund Service Co., Ltd.(*4) |
3,000 | ” | — | — | — | — | 600,000 | 100.0 | ||||||||||||||||||||||
| Kumho Trust 1st Co., Ltd.(*5) |
50 | Asset securitization |
— | 0.0 | — | 0.0 | — | 0.0 | ||||||||||||||||||||||
| Asiana Saigon Inc.(*5) |
10 | ” | — | 0.0 | — | 0.0 | — | 0.0 | ||||||||||||||||||||||
| An-Dong Raja 1st Co., Ltd.(*5) |
50 | ” | — | 0.0 | — | 0.0 | — | 0.0 | ||||||||||||||||||||||
| Consus 8th Co., LLC(*5) |
10 | ” | — | 0.0 | — | 0.0 | — | 0.0 | ||||||||||||||||||||||
| Woori Ship Mortgage Second-2 Asset Securitization Specialty Co., Ltd. |
10 | ” | — | 0.1 | — | — | — | — | ||||||||||||||||||||||
| Woori Frontier Co. Ltd. |
10 | ” | — | 0.0 | — | — | — | — | ||||||||||||||||||||||
| KAMCO Value Recreation 1st Securitization Specialty Co., Ltd.(*5) |
10 | ” | 150 | 15.0 | 150 | 15.0 | 150 | 15.0 | ||||||||||||||||||||||
| Woori More Conduit Co., Ltd.(M)(*12) |
50 | ” | — | 0.0 | — | 0.0 | — | — | ||||||||||||||||||||||
| Woori More Conduit Co., Ltd. Series C(*12) |
50 | ” | — | 0.0 | — | 0.0 | — | — | ||||||||||||||||||||||
| Woori IB Global Bond Co., Ltd.(*5) |
50 | ” | — | 0.0 | — | 0.0 | — | 0.0 | ||||||||||||||||||||||
| Blue Woori First Securitization Specialty LLC |
10 | ” | — | 0.0 | — | — | — | — | ||||||||||||||||||||||
| Hyundae Glory No.1 Inc.(*6) |
10 | ” | — | 0.0 | — | 0.0 | — | — | ||||||||||||||||||||||
F-10
Table of Contents
|
January 1, 2010 |
December 31, 2010 |
December 31, 2011 |
||||||||||||||||||||||||||||
| Subsidiaries |
Capital | Main business |
Number of shares owned |
Percentage of owner- ship (%) |
Number of shares owned |
Percentage of owner- ship (%) |
Number of shares owned |
Percentage of owner- ship (%) |
||||||||||||||||||||||
| KDB Capital First ABCP Co., Ltd.(*6) |
50 | ” | — | 0.0 | — | 0.0 | — | — | ||||||||||||||||||||||
| Vivaldi HL First ABCP Co., Ltd.(*6) |
50 | ” | — | 0.0 | — | 0.0 | — | — | ||||||||||||||||||||||
| Changeup Co., Ltd. _Series B |
10 | ” | — | 0.0 | — | — | — | — | ||||||||||||||||||||||
| IB Global 1st Inc.(*5) |
10 | ” | — | 0.0 | — | 0.0 | — | 0.0 | ||||||||||||||||||||||
| Real DW Second Co., Ltd.(*5) |
10 | ” | — | 0.0 | — | 0.0 | — | 0.0 | ||||||||||||||||||||||
| Hermes STX Co., Ltd.(*5) |
10 | ” | — | 0.0 | — | 0.0 | — | 0.0 | ||||||||||||||||||||||
| BWL First Co., LLC(*5) |
10 | ” | — | 0.0 | — | 0.0 | — | 0.0 | ||||||||||||||||||||||
| Swan SF Co., Ltd.(*6) |
50 | ” | — | 0.0 | — | 0.0 | — | — | ||||||||||||||||||||||
| Woori Poongsan Co., Ltd.(*5) |
10 | ” | — | — | — | — | — | 0.0 | ||||||||||||||||||||||
| Ocean Sand Co., Ltd.(*5) |
10 | ” | — | — | — | — | — | 0.0 | ||||||||||||||||||||||
| Kyongnam Bank: |
||||||||||||||||||||||||||||||
| Consus 6th Co., LLC(*5) |
10 | ” | — | 0.0 | — | 0.0 | — | 0.0 | ||||||||||||||||||||||
| Kwangju Bank: |
||||||||||||||||||||||||||||||
| Euro Quanto Second Inc.(*5) |
10 | ” | — | 0.0 | — | 0.0 | — | 0.0 | ||||||||||||||||||||||
| Hybrid 1st Specialty Inc.(*5) |
10 | ” | — | 0.0 | — | 0.0 | — | 0.0 | ||||||||||||||||||||||
| KAMCO Value Recreation 2nd Securitization Specialty Co., Ltd.(*5) |
10 | ” | 150 | 15.0 | 150 | 15.0 | 150 | 15.0 | ||||||||||||||||||||||
| Woori F&I: |
||||||||||||||||||||||||||||||
| Woori AMC Co., Ltd. |
4,000 | Other financial business |
800,000 | 100.0 | 800,000 | 100.0 | 800,000 | 100.0 | ||||||||||||||||||||||
| Woori F&I Fifth Asset Securitization Specialty(*6) |
2,400 | Asset securitization |
92,500 | 100.0 | 48,500 | 100.0 | — | — | ||||||||||||||||||||||
| Woori F&I Sixth Asset Securitization Specialty(*6) |
4,900 | Asset securitization |
98,780 | 100.0 | 98,780 | 100.0 | — | — | ||||||||||||||||||||||
| Woori F&I Seventh Asset Securitization Specialty |
5,300 | ” | 105,300 | 100.0 | 105,300 | 100.0 | 105,300 | 100.0 | ||||||||||||||||||||||
| Woori F&I Eighth Asset Securitization Specialty |
100 | ” | 140,000 | 100.0 | 19,600 | 100.0 | 19,600 | 100.0 | ||||||||||||||||||||||
| Woori F&I Ninth Asset Securitization Specialty |
200 | ” | 34,260 | 100.0 | — | — | — | — | ||||||||||||||||||||||
| Woori F&I Tenth Asset Securitization Specialty |
4,100 | ” | 478,020 | 100.0 | 98,020 | 100.0 | 98,020 | 100.0 | ||||||||||||||||||||||
| Woori F&I Eleventh Asset Securitization Specialty(*10) |
4,900 | ” | 181,060 | 100.0 | 181,060 | 100.0 | 111,060 | 100.0 | ||||||||||||||||||||||
| Woori F&I Thirteenth Asset Securitization Specialty(*10) |
9,100 | ” | 1,044,860 | 94.6 | 477,443 | 94.6 | 288,304 | 94.6 | ||||||||||||||||||||||
| Woori SB Tenth Asset Securitization Specialty |
25,200 | ” | 410,711 |
|
50.0+ 1share |
|
410,711 |
|
50.0+ 1share |
|
410,711 |
|
50.0+ 1share |
| ||||||||||||||||
| Woori F&I Sixteenth Asset Securitization Specialty |
5,200 | ” | — | — | 103,620 | 100.0 | 103,620 | 100.0 | ||||||||||||||||||||||
| Woori EA Third Asset Securitization Specialty |
16,300 | ” | — | — | 227,808 | 70.0 | 227,808 | 70.0 | ||||||||||||||||||||||
| Woori EA Fourth Asset Securitization Specialty |
1,300 | ” | — | — | 185,920 | 70.0 | 185,920 | 70.0 | ||||||||||||||||||||||
| Woori EA Fifth Asset Securitization Specialty |
800 | ” | — | — | 112,000 | 70.0 | 112,000 | 70.0 | ||||||||||||||||||||||
| Woori F&I Seventeenth Asset Securitization Specialty |
900 | ” | — | — | 17,500 | 100.0 | 17,500 | 100.0 | ||||||||||||||||||||||
| WR Loan Inc. |
10 | ” | — | — | 2,000 | 100.0 | 2,000 | 100.0 | ||||||||||||||||||||||
| Woori EA Eighth Asset Securitization Specialty |
1,800 | ” | — | — | 18,105 | 51.0 | 18,105 | 51.0 | ||||||||||||||||||||||
| WR Investment America, LLC(*14) |
291,200 | Administration of NPL |
— | — | 25,000,000 | 100.0 | 25,000,000 | 100.0 | ||||||||||||||||||||||
| Woori F&I Eighteenth Asset Securitization Specialty |
30 | Asset securitization |
— | — | 5,600 | 100.0 | 5,600 | 100.0 | ||||||||||||||||||||||
| Woori EA Tenth Asset Securitization Specialty(*7) |
60 | ” | — | — | — | — | 5,610 | 51.0 | ||||||||||||||||||||||
F-11
Table of Contents
| January 1, 2010 |
December 31, 2010 |
December 31, 2011 |
||||||||||||||||||||||||||||
| Subsidiaries |
Capital |
Main business |
Number of shares owned |
Percentage of owner- ship (%) |
Number of shares owned |
Percentage of owner- ship (%) |
Number of shares owned |
Percentage of owner- ship (%) |
||||||||||||||||||||||
| Woori F&I Nineteenth Asset Securitization Specialty(*7) |
20 | ” | — | — | — | — | 3,600 | 100.0 | ||||||||||||||||||||||
| Woori F&I Twentieth Asset Securitization Specialty(*7) |
60 | ” | — | — | — | — | 7,200 | 60.0 | ||||||||||||||||||||||
| Woori F&I 21st Asset Securitization Specialty(*7) |
30 | ” | — | — | — | — | 6,400 | 100.0 | ||||||||||||||||||||||
| Woori F&I 22nd Asset Securitization Specialty(*7) |
20 | ” | — | — | — | — | 4,200 | 60.0 | ||||||||||||||||||||||
| Woori F&I 23rd Asset Securitization Specialty(*7) |
4,000 | ” | — | — | — | — | 12,800 | 100.0 | ||||||||||||||||||||||
| Woori F&I 24th Asset Securitization Specialty(*7) |
4,000 | ” | — | — | — | — | 3,998 | 100.0 | ||||||||||||||||||||||
| Woori EA Twelfth Asset Securitization Specialty(*7) |
10 | ” | — | — | — | — | 26,600 | 70.0 | ||||||||||||||||||||||
| Woori EA Thirteenth Asset Securitization Specialty(*7) |
4,000 | ” | — | — | — | — | 24,500 | 70.0 | ||||||||||||||||||||||
| Woori EA Fourteenth Asset Securitization Specialty(*7) |
4,000 | ” | — | — | — | — | 16,800 | 70.0 | ||||||||||||||||||||||
| Hiking-Woori Capital |
|
500 |
|
Other financial business |
245,000 | 49.0 | — | — | — | — | ||||||||||||||||||||
| Woori Investment & Securities: |
||||||||||||||||||||||||||||||
| Woori Futures Co., Ltd. |
|
25,000 |
|
Futures trading |
5,000,000 | 100.0 | 5,000,000 | 100.0 | 5,000,000 | 100.0 | ||||||||||||||||||||
| Woori Investment Asia PTE. Ltd.(*14) |
USD 50,000 | Securities investments |
50,000,000 | 100.0 | 50,000,000 | 100.0 | 50,000,000 | 100.0 | ||||||||||||||||||||||
| Woori Absolute Asia Global Opportunity Fund(*14) |
USD 1 | Securities investments |
44,700 | 100.0 | 44,700 | 100.0 | 44,700 | 100.0 | ||||||||||||||||||||||
| LG Investments Holding B.V. (Amsterdam) GG(*14) |
EUR 16,424 | ” | 1,642,398,242 | 100.0 | 1,642,398,242 | 100.0 | 1,642,398,242 | 100.0 | ||||||||||||||||||||||
| Woori Investment Securities (H.K.) Ltd.(*14) |
USD 22,500 | Securities business |
22,500,000 | 100.0 | 22,500,000 | 100.0 | 22,500,000 | 100.0 | ||||||||||||||||||||||
| Connacht Capital Market Investment(*14) |
USD 150 | Securities investments |
15,000,000 | 100.0 | 15,000,000 | 100.0 | 15,000,000 | 100.0 | ||||||||||||||||||||||
| Woori Investment Securities Int’l Ltd.(*14) |
USD 5,788 | ” | 5,788,000 | 100.0 | 5,788,000 | 100.0 | 5,788,000 | 100.0 | ||||||||||||||||||||||
| Woori Investment Securities America, Inc.(*14) |
USD 0.003 | ” | 300 | 100.0 | 300 | 100.0 | 300 | 100.0 | ||||||||||||||||||||||
| Woori CBV Securities Corporation(*2)(*14) |
VND135,000 | Securities business |
6,615,000 | 49.0 | 6,615,000 | 49.0 | 6,615,000 | 49.0 | ||||||||||||||||||||||
| MARS First Private Equity Fund |
|
34,000 |
|
Other financial business |
18,000,000 | 52.9 | 18,000,000 | 52.9 | 18,000,000 | 52.9 | ||||||||||||||||||||
| MARS Second Private Equity Fund(*2) |
282,000 | ” | 25,066,666,670 | 8.9 | 25,066,666,670 | 8.9 | 25,066,666,670 | 8.9 | ||||||||||||||||||||||
| Woori Absolute Partners PTE Ltd.(*14) |
USD 5,000 | Securities investments |
5,000,000 | 100.0 | 5,000,000 | 100.0 | 5,000,000 | 100.0 | ||||||||||||||||||||||
F-12
Table of Contents
| January 1, 2010 | December 31, 2010 | December 31, 2011 | ||||||||||||||||||||||||||||||
| Subsidiaries |
Capital |
Main business |
Number of shares owned |
Percentage of owner- ship (%) |
Number of shares owned |
Percentage of owner- ship (%) |
Number of shares owned |
Percentage of owner- ship (%) |
||||||||||||||||||||||||
| Woori Korindo Securities Indonesia(*8)(*14) |
|
IDR 105,020 |
|
” | 114,000,000 | 60.0 | 114,000,000 | 60.0 | 150,000,000 | 60.0 | ||||||||||||||||||||||
| Woori Absolute Return Investment Strategies Fund(*14) |
|
USD 0.3 |
|
” | 30,000 | 100.0 | 30,000 | 100.0 | 30,000 | 100.0 | ||||||||||||||||||||||
| KoFC Woori Growth Champ Private Equity Fund(*11) |
|
12,600 |
|
|
Other financial business |
|
— | — | — | — | 15,351 | 27.3 | ||||||||||||||||||||
| Woori Investment advisory Co., Ltd.(Beijing)(*11)(*14) |
|
USD 3,050 |
|
|
Securities investments |
|
— | — | — | — | — | 100.0 | ||||||||||||||||||||
| KAMCO Value Recreation 9th Securitization Specialty Co., Ltd.(*5) |
10 |
|
Asset securitization |
|
150 | 15.0 | 150 | 15.0 | 150 | 15.0 | ||||||||||||||||||||||
| Woori Giant First Co., Ltd.(*11) |
30,000 | ” | — | — | — | — | 1,000 | 100.0 | ||||||||||||||||||||||||
| Woori Financial: |
||||||||||||||||||||||||||||||||
| Woori Auto 2nd Securitization Specialty Co., Ltd. |
10 | ” | 9 | 0.9 | — | — | — | — | ||||||||||||||||||||||||
| Woori PE: |
||||||||||||||||||||||||||||||||
| Woori Private Equity Fund(*10) |
231,600 | |
Other financial business |
|
141,372 | 61.0 | 141,372 | 61.0 | 136,112 | 61.0 | ||||||||||||||||||||||
| Woori EL Co., Ltd. |
10 | ” | 1,010 | 100.0 | 1,010 | 100.0 | 1,010 | 100.0 | ||||||||||||||||||||||||
| MARS First: |
||||||||||||||||||||||||||||||||
| MARS INS First, Ltd. |
20 | ” | 12,500 | 100.0 | 4,000 | 100.0 | 4,000 | 100.0 | ||||||||||||||||||||||||
| Woori Private Equity Fund: |
||||||||||||||||||||||||||||||||
| Kumho Investment Bank(*2) |
90,000 | |
Other financial business |
|
74,550,000 | 41.4 | 74,550,000 | 41.4 | 74,550,000 | 41.4 | ||||||||||||||||||||||
| Kumho Investment Bank: |
||||||||||||||||||||||||||||||||
| KIB Invest LLC(*12) |
10 |
|
Asset securitization |
|
— | 0.0 | — | 0.0 | — | — | ||||||||||||||||||||||
| HUB 1st Co., Ltd.(*5) |
50 | ” | — | 0.0 | — | 0.0 | — | 0.0 | ||||||||||||||||||||||||
| HUB 2nd Co., Ltd.(*5) |
10 | ” | — | 0.0 | — | 0.0 | — | 0.0 | ||||||||||||||||||||||||
| HUB 3rd Co., Ltd.(*5) |
10 | ” | — | 0.0 | — | 0.0 | — | 0.0 | ||||||||||||||||||||||||
| Two Eagles KIB |
|
100 |
|
|
Other service business |
|
— | 100.0 | — | 100.0 | 100.0 | |||||||||||||||||||||
| Woori Bank, Kyongnam Bank and Kwangju Bank: |
||||||||||||||||||||||||||||||||
| TY Second Asset |
50 |
|
Asset securitization |
|
— | 0.0 | — | 0.0 | — | 0.0 | ||||||||||||||||||||||
| Woori PE and Two Eagles KIB LLC: |
||||||||||||||||||||||||||||||||
| Two Eagles LLC(*14) |
200 |
|
Asset securitization |
|
— | 55.0 | — | 55.0 | — | 55.0 | ||||||||||||||||||||||
| Woori Private Equity Fund and My Asset Manhattan Private REIT 1st: |
||||||||||||||||||||||||||||||||
| Sahn Eagles LLC(*14) |
|
USD 80,000 |
|
|
Other financial business |
|
52,523,601 | 65.6 | 52,523,601 | 65.6 | 52,523,601 | 65.6 | ||||||||||||||||||||
| Woori Bank, Kyongnam Bank, Kwangju Bank, Woori Investment & Securities and Kumho Investment Bank: |
||||||||||||||||||||||||||||||||
| Woori Partner Plus Private Equity Securities 4th and 50 beneficiary certificates for the rest |
— | |
Beneficiary certificates |
|
— | — | — | — | — | — | ||||||||||||||||||||||
| (*1) | Woori Finance Information System Co., Ltd. changed its name to Woori FIS Co., Ltd. as of May 1, 2011. |
| (*2) | As the Group has controlling power over the entity so as to obtain benefits, the entity is included in the consolidation. |
F-13
Table of Contents
| (*3) | During the year ended December 31, 2011, entity was established through a 100% investment; the entity’s assets and liabilities transferred from former Samhwa Savings Bank Co., Ltd. (Note 45). |
| (*4) | During the year ended December 31, 2011, Woori Fund Service Co., Ltd. was founded by 100% investment of Woori Bank. |
| (*5) | Classified as a special purpose entity (“SPE”) and included in consolidation scope under Standing Interpretations Committee (“SIC”) -12 Consolidation—Special Purpose Entities, considering the activities of the SPE, decision-making powers, benefits and risks. In addition, principal and interest guaranteed trusts of Woori Bank, Kyongnam Bank, and Kwangju Bank are included in consolidation under SIC-12 Consolidation—Special Purpose Entities. |
| (*6) | Entity is excluded from consolidation due to liquidation during the year ended December 31, 2011. |
| (*7) | During the year ended December 31, 2011, Woori F&I acquired each 51%, 100%, 60%, 100%, 60%, 100%, 100%, 70%, 70% and 70% ownership interest of Woori EA 10th Asset Securitization Specialty, Woori F&I 19th Asset Securitization Specialty, Woori F&I 20th Asset Securitization Specialty, Woori F&I 21st Asset Securitization Specialty, Woori F&I 22nd Asset Securitization Specialty, Woori F&I 23rd Asset Securitization Specialty, Woori F&I 24th Asset Securitization Specialty, Woori EA 12th Asset Securitization Specialty, Woori EA 13th Asset Securitization Specialty and Woori EA 14th Asset Securitization Specialty, respectively. |
| (*8) | The number of holding shares increased due to the paid-in capital increase during the year ended December 31, 2011. |
| (*9) | The banks became a 100% subsidiary due to the additional acquisition during the year ended December 31, 2011. |
| (*10) | The number of holding shares decreased due to the paid-in capital decrease during the year ended December 31, 2011. |
| (*11) | During the year ended December 31, 2011, Woori Investment & Securities, a subsidiary, acquired the shares of KoFC Woori Growth Champ Private Equity Fund, Woori Investment Advisory Co. Ltd. (Beijing) and Woori Giant First Co., Ltd., for 27.3%, 100% and 100% ownership, respectively. KoFC Woori Growth Champ Private Equity Fund was included in the scope of consolidation as Woori Investment & Securities has controlling power as the a general partner of the fund. |
| (*12) | Excluded from consolidation because related risk and benefit have become extinct as a consequence of the company’s activity ended in substance. |
| (*13) | Consolidated financial information based on the financial statements as of September 30 because the year-end of Two Eagles KIB LLC is September 30 and there is no significant effect due to transactions and events from September 30 to December 31. |
| (*14) | All subsidiaries are located in Korea except for the following subsidiaries; 1) Woori America Bank, WR Investment America, LLC, Woori Investment Securities America, Inc., Two Eagles KIB LLC, Two Eagles LLC and Sahn Eagles LLC in America; 2) Woori Global Market Asia Limited, Woori Investment Securities (H.K.) Ltd. in Hong Kong; 3) Woori Bank (China) Limited, Woori Investment advisory Co. Ltd. (Beijing) in China; 4) ZAO Woori Bank in Russia; 5) PT. Bank Woori Indonesia, Woori Korindo Securities Indonesia in Indonesia; 6) Woori Investment Asia PTE. Ltd., Woori Absolute Partners PTE Ltd. in Singapore; 7) Woori Absolute Asia Global Opportunity Fund, Woori Absolute Return Investment Strategies Fund in Cayman Island; 8) LG Investments Holding B.V. (Amsterdam) GG in Netherland; 9) Connacht Capital Market Investment in Malaysia; 10) Woori Investment Securities Int’l Ltd. in United kingdom; and 11) Woori CBV Securities Corporation in Vietnam. |
F-14
Table of Contents
| (3) | Summarized financial information before elimination of intercompany accounts of subsidiaries whose financial information prepared under IFRS for the Group’s consolidated financial statements are as follows (Unit: Korean Won in millions): |
| January 1, 2010 | ||||||||
| Assets | Liabilities | |||||||
| Woori Bank |
226,927,341 | 210,006,974 | ||||||
| Kyongnam Bank |
20,445,024 | 18,911,610 | ||||||
| Kwangju Bank |
16,195,427 | 15,169,242 | ||||||
| Woori FIS |
222,577 | 213,691 | ||||||
| Woori F&I |
556,289 | 386,647 | ||||||
| Woori Investment & Securities |
17,028,007 | 14,375,052 | ||||||
| Woori Asset Management |
89,863 | 22,467 | ||||||
| Woori PE |
1,976,137 | 1,833,535 | ||||||
| Woori Financial |
2,189,258 | 1,979,624 | ||||||
| December 31, 2010 | ||||||||||||||||
| Assets | Liabilities | Operating revenue | Net income attributable to shareholders |
|||||||||||||
| Woori Bank |
228,554,863 | 211,067,932 | 27,774,406 | 1,261,283 | ||||||||||||
| Kyongnam Bank |
21,803,888 | 20,148,379 | 1,717,881 | 183,456 | ||||||||||||
| Kwangju Bank |
16,841,006 | 15,713,606 | 1,197,919 | 124,437 | ||||||||||||
| Woori FIS |
242,574 | 208,487 | 283,642 | 25,200 | ||||||||||||
| Woori F&I |
1,168,266 | 975,980 | 134,038 | 37,861 | ||||||||||||
| Woori Investment & Securities |
18,646,143 | 15,814,476 | 3,800,989 | 249,955 | ||||||||||||
| Woori Asset Management |
84,417 | 21,361 | 35,578 | 4,987 | ||||||||||||
| Woori PE |
2,090,984 | 1,977,879 | 255,990 | 2,274 | ||||||||||||
| Woori Financial |
2,770,293 | 2,540,295 | 294,710 | 28,424 | ||||||||||||
| December 31, 2011 | ||||||||||||||||
| Assets | Liabilities | Operating revenue | Net income attributable to shareholders |
|||||||||||||
| Woori Bank |
242,472,162 | 224,346,022 | 28,455,535 | 2,068,544 | ||||||||||||
| Kyongnam Bank |
25,353,427 | 23,555,666 | 1,719,453 | 195,647 | ||||||||||||
| Kwangju Bank |
18,030,369 | 16,813,501 | 1,137,243 | 136,328 | ||||||||||||
| Woori FIS Co., Ltd. |
264,215 | 238,393 | 287,856 | (3,480 | ) | |||||||||||
| Woori F&I |
1,371,031 | 1,114,343 | 172,100 | 43,145 | ||||||||||||
| Woori Investment & Securities |
21,535,058 | 17,862,450 | 3,910,525 | 164,621 | ||||||||||||
| Woori Asset Management |
80,020 | 17,174 | 32,111 | 1,462 | ||||||||||||
| Woori PE |
1,575,969 | 1,505,636 | 382,597 | 651 | ||||||||||||
| Woori Financial |
3,161,794 | 2,889,741 | 334,453 | 51,702 | ||||||||||||
| Woori FG Savings Bank |
603,400 | 526,035 | 55,320 | (32,352 | ) | |||||||||||
2. Significant Basis of Preparation and Accounting Policies
(1) Basis of presentation
The Group has adopted International Financial Reporting Standards (“IFRS”) as issued by the International Accounting Standards Board (“IASB”) for the annual periods beginning on January 1, 2011. In accordance with IFRS 1 First-time adoption of International Financial Reporting Standards, the transition date to IFRS is January 1, 2010. An explanation of how the transition to IFRS has affected the consolidated statements of financial position as of January 1, 2010 (date of transition) and December 31, 2010, and the consolidated statements of comprehensive income for the year ended December 31, 2010 of the Group are provided in Note 47 “Transition to IFRSs.”
F-15
Table of Contents
The Group operates primarily in Korea and its official accounting records are maintained in Korean Won. The United States dollar (“U.S. dollar” or “US$” or “USD”) amounts are provided herein as supplementary information solely for the convenience of readers outside Korea. Korean Won amounts are expressed in U.S. Dollars at the rate of 1,158.5 Korean Won to US$1.00, the noon buying exchange rate in effect on December 30, 2011, as quoted by the Federal Reserve Bank of New York in the United States. Such convenience translation into U.S. Dollars should not be construed as representations that Korean Won amounts have been, could have been, or could in the future be, converted at this or any other rate of exchange.
The Group’s consolidated financial statements have been prepared based on the historical cost method except for specific non-current assets and certain financial assets or liabilities reported at fair value.
(2) Basis of consolidated financial statement presentation
The consolidated financial statements incorporate the financial statements of Woori Finance Holdings and its subsidiaries which the Group is generally controlling through a majority voting right. The consolidated financial statements also include the account of special purpose entities (“SPE”s) where the Group has the power to govern the financial and operating policies of the SPEs so as to obtain benefits from its activities.
When necessary, adjustments are made to the financial statements of subsidiaries to bring their accounting policies in line with those adopted by the Group.
All intra-group transactions, related assets and liabilities, income and expenses are eliminated in full on consolidation.
Income and expenses of subsidiaries acquired or disposed of during the year are included in the consolidated statements of comprehensive income from the effective date of acquisition or up to the effective date of disposal, respectively, as appropriate. The carrying amount of non-controlling interests is adjusted to reflect their proportional share of changes in equity subsequent to the initial recognition. Total comprehensive income of subsidiaries is attributed to the owners of the Group and the non-controlling interests even if this results in the non-controlling interests have a deficit balance.
Changes in the Group’s ownership interests in subsidiaries, without a loss of control, are accounted for as equity transactions. The carrying amounts of the owners’ interests and the non-controlling interests are adjusted to reflect the changes in their relative interests in the subsidiaries. Any difference between the amount by which the non-controlling interests are adjusted and the fair value of the consideration paid or received is recognized directly in equity and attributed to owners of the Group.
When the Group loses control of a subsidiary, the profit or loss on disposal is calculated as the difference between (i) the aggregate of the fair value of the consideration received and the fair value of any retained interest and (ii) the previous carrying amount of the assets (including goodwill), and liabilities of the subsidiary and any non-controlling interests. When assets of the subsidiary are carried at revalued amounts or fair values and the related cumulative gain or loss has been recognized in other comprehensive income and accumulated in equity, the amounts previously recognized in other comprehensive income and accumulated in equity are accounted for as if the Group had directly disposed of the relevant assets (i.e. reclassified to profit or loss or transferred directly to retained earnings). The fair value of any investment retained in the former subsidiary at the date when control is lost is recognized as the fair value on initial recognition for subsequent accounting under International Accounting Standards (“IAS”) 39 Financial Instruments: Recognition and Measurement or, when applicable, the cost on initial recognition of an investment in an associate or a jointly controlled entity.
An entity may be created to accomplish a narrow and well-defined objective (i.e. a securitization of financial assets, project financing and fund investments). A SPE may take the form of a corporation, trust, partnership or unincorporated entity. SPEs are often created with legal arrangements that impose strict and
F-16
Table of Contents
sometimes permanent limits on the decision-making powers of their governing board, trustee or management over the operations of the SPEs. Frequently, the provisions on the legal arrangements specify that the policy guiding the ongoing activities of the SPEs cannot be modified, other than perhaps by its creator or sponsor (i.e. they operate on so-called “autopilot”).
An SPE shall be consolidated when the substance of the relationship between the Group and the SPE indicates that the Group controls the SPE. The relationship exists where the activities of the SPE are being conducted on behalf of the Group according to its specific business needs so that the Group obtains benefits from the SPE’s operation; the Group has the decision-making powers to obtain the majority of the benefits of the activities of the SPE or, by setting up an ‘autopilot’ mechanism, the Group has delegated these decision-making powers; the Group has rights to obtain the majority of the benefits of the SPE and therefore may be exposed to risks incident to the activities of the SPE; or the Group retains the majority of the residual or ownership risks related to the SPE or its assets in order to obtain benefits from its activities.
A beneficial interest in an SPE may, for example, take the form of a debt instrument, an equity instrument, a participation right, a residual interest or a purchase commitment. Some beneficial interests may simply provide the holder with a fixed or stated rate of return, while others give the holder rights or access to other future economic benefits of the SPE’s activities. The Group may retain a significant beneficial interest in the SPE’s activities, even though it may own little or none of the SPE’s equity.
For example, the Group is liable to compensate trust account holders for losses incurred in certain trust accounts subject to minimum rate of return and principal or principal guarantees. These accounts are considered SPEs and are consolidated in the accompanying consolidated financial statements.
(3) Business Combinations
Acquisitions of subsidiaries and businesses are accounted for using the acquisition method. The consideration transferred in a business combination is measured at fair value, which is calculated as the sum of the acquisition-date fair values of the assets transferred by the Group, liabilities assumed by the Group to the former owners of the acquiree and the equity interests issued by the Group in exchange for control of the acquiree. Acquisition-related costs are generally recognized in net income as incurred.
At the acquisition date, the acquiree’s identifiable assets, liabilities and contingent liabilities that meet the condition for recognition under IFRS 3 are recognized at their fair value, except that:
| • | deferred tax assets or liabilities and liabilities or assets related to employee benefit arrangements are recognized and measured in accordance with IAS 12 Income Taxes and IAS 19 Employee Benefits respectively; |
| • | liabilities or equity instruments related to share-based payment arrangements of the acquiree or share-based payment arrangements of the Group entered into to replace share-based payment arrangements of the acquiree are measured in accordance with IFRS 2 Share-based Payment at the acquisition date; and |
| • | assets (or disposal groups) classified as held for sale are measured at the lower of their previous carrying amount are fair value less costs to sell. |
Any excess of the sum of the consideration transferred, the amount of any non-controlling interest in the acquiree and the fair value of the Group’s previously held equity interest (if any) in the acquiree over the net of identifiable assets and liabilities assumed of the acquiree at the acquisition date is recognized as goodwill which is included in intangible assets.
If, after reassessment, the Group’s interest in the fair value of the acquiree’s identifiable net assets exceeds the sum of the consideration transferred, the amount of any non-controlling interest in the acquire and the fair value of the acquirer’s previously held equity interest in the acquire (if any), the excess is recognized immediately in net income as a bargain purchase gain.
F-17
Table of Contents
When a business combination is achieved in stages, the Group’s previously held equity interest in the acquiree is remeasured to fair value at the acquisition date (i.e. the date when the Group obtains control) and the resulting gain or loss, if any, is recognized in net income. Amounts arising from changes in value of interests in the acquiree prior to the acquisition date that have previously been recognized in other comprehensive income are reclassified to net income where such treatment would be appropriate if that interest were disposed of.
According to IFRS 1 First-time Adoption of International Financial Reporting Standards, the Group has elected not to apply IFRS 3 Business Combinations retrospectively to past business combinations that occurred before January 1, 2010, the date of transition to IFRSs. Therefore, the past business combinations has not been restated.
(4) Investments in associates
An associate is an entity over which the Group has significant influence and that is neither a subsidiary nor an interest in a joint venture. Significant influence is the power to participate in the financial and operating policy decisions of the investee but is not control or joint control over those policies. Significant influence is generally presumed to exist when the Group holds 20% or more, but less than 50%, of the voting rights.
The net income of current period and the financial results of associates are incorporated in these consolidated financial statements using the equity method of accounting, except when the investment is classified as held for sale, in which case it is accounted for in accordance with IFRS 5 Non-current Assets Held for Sale and Discontinued Operations. Under the equity method, an investment in an associate is initially recognized in the consolidated statements of financial position at cost and adjusted thereafter to recognize the Group’s share of the net assets of the associate and any impairment. When the Group’s share of losses of an associate exceeds the Group’s interest in that associate, the Group discontinues recognizing its share of further losses. Additional losses are recognized only to the extent that the Group has incurred legal or constructive obligations or made payments on behalf of the associate.
Any excess of the cost of acquisition over the Group’s share of the net fair value of the identifiable assets, liabilities and contingent liabilities of an associate recognized at the date of acquisition is recognized as goodwill, which is included within the carrying amount of the investment. Any excess of the Group’s share of the net fair value of the identifiable assets, liabilities and contingent liabilities over the cost of acquisition, recognized immediately in net income.
The requirements of IAS 39 Financial Instruments: Recognition and Measurement to determine whether there has been a loss event are applied to identify whether it is necessary to recognize any impairment loss with respect to the Group’s investment in an associate. When necessary, the entire carrying amount of the investment (including goodwill) is tested for impairment in accordance with IAS 36 Impairment of Assets as a single asset by comparing its recoverable amount (higher of value in use and fair value less costs to sell) with its carrying amount. Any impairment loss recognized is not allocated to any asset (including goodwill), which forms part of the carrying amount of the investment. Any reversal of that impairment loss is recognized in accordance with IAS 36 to the extent that the recoverable amount of the investment subsequently increases.
When the Group transacts with its associates, unrealized profits and losses resulting from the transactions with the associates are eliminated to the extent of interests in the associate.
(5) Interests in jointly controlled entities
A joint venture is a contractual arrangement whereby the Group and other parties undertake an economic activity that is subject to joint control (i.e. when the strategic financial and operating policy decisions relating to the activities of the joint venture require the unanimous consent of the parties sharing control).
F-18
Table of Contents
The Group accounts for its interests in jointly controlled entities using the equity method, except when the investment is classified as held for sale, in which case it is accounted for in accordance with IFRS 5 Non-current Assets Held for Sale and Discontinued Operations.
Any excess of the cost of acquisition over the Group’s share of the net fair value of the identifiable assets, liabilities and contingent liabilities of an associate recognized at the date of acquisition is recognized as goodwill, which is included within the carrying amount of the investment. Any excess of the Group’s share of the net fair value of the identifiable assets, liabilities and contingent liabilities over the cost of acquisition, recognized immediately in net income.
(6) Revenue recognition
Interest income is recognized when earned. Interest income on financial assets that are classified as loans and receivables, available-for-sale or held-to-maturity is determined using the effective interest method.
The effective interest method is a method of calculating the amortized cost of a financial asset (or group of financial assets) and of allocating the interest income over the expected life of the asset. The effective interest rate is the rate that exactly discounts estimated future cash flows to the instrument’s initial carrying amount. Calculation of the effective interest rate takes into account fees payable or receivable that are an integral part of the instrument’s yield, premiums or discounts on acquisition or issue, early redemption fees and transaction costs. All contractual terms of a financial instrument are considered when estimating future cash flows.
The commission fees earned on loans, which is part of the effective interest rate of loans, is accounted for deferred origination fees. Incremental cost related to the acquisition or disposal is accounted for deferred origination costs, and it is amortized on the effective interest method and included in interest revenues on loans.
Fees and commissions income, including investment management fees, credit card fees, guarantee commissions, placement and syndication fees, import/export letters of credit, commissions received on remittance and ATM service fees are recognized when the related services are performed.
Commitment and utilization fees are determined as a percentage of the outstanding facility. If it is unlikely that a specific lending arrangement will be entered into, such fees are taken to net income over the life of the facility otherwise they are deferred and included in the effective interest rate on the advance.
Fees in respect of services are recognized as the right to consideration accrues through the provision of the service to the customer. The arrangements are generally contractual and the cost of providing the service is incurred as the service is rendered. The price is usually fixed and determinable.
Credit card fees include commission received from retailers for processing credit card transaction and annual fees received from credit card holders. Revenue from the commission is accrued to net income when the service performed and annual fee is deferred and recognized as income over the period of the service provided.
The Group receives fees for its management of unconsolidated trust assets, which are recognized on an accrual basis when the management services are provided and earned. The Group also is entitled to receive performance-based fees for certain trust accounts. These performance-based fees are recognized at the end of the performance period. In addition, a certain trust account which the Group guarantees to repay the principles and minimum interests of the trust account to its beneficiaries shall be included in the consolidated financial statements. The Group recognizes incomes when earned and expenses when interests paid to beneficiaries are accrued.
F-19
Table of Contents
(7) Accounting for foreign currencies
The Group’s consolidated financial statements are presented in Korean Won, which is the functional currency of the Company. At the end of each reporting period, monetary assets and liabilities denominated in foreign currencies are translated at the rates prevailing at that date. Foreign exchange differences on monetary items that qualify as hedging instruments in a cash flow hedge or that form part of net investment in foreign operations are recognized in equity.
A monetary available-for-sale (“AFS”) financial asset is treated as if it were carried at amortized cost in the foreign currency. Accordingly, for such financial assets, exchange differences resulting from retranslating amortized cost are recognized in net income.
Non-monetary items denominated in foreign currencies that are stated at fair value are translated into Korean Won at foreign exchange rates at the dates the values were determined. Translation differences arising on non-monetary items measured at fair value are recognized in net income except for differences arising on non-monetary AFS financial assets, for example equity shares, which are included in the AFS reserve in equity unless the asset is the hedged item in a fair value hedge.
The Group identifies the most appropriate functional currency for each foreign operation based on the foreign operation’s activities. If Korean Won is not the foreign operation’s functional currency, its assets and liabilities, including goodwill and fair value adjustments arising on acquisition, are translated into Korean Won at foreign exchange rates at the end of each reporting date while the revenues and expenses are translated into Korean Won at average exchange rates for the period unless these do not approximate to the foreign exchange rates at the dates of the transactions. Foreign exchange differences arising on the translation of a foreign operation are recognized directly in equity and included in net income on its disposal.
However, as the Group has determined to use the exemption of cumulative translation differences that existed at the date of transition to IFRSs in accordance with IFRS 1 First-time adoption of IFRS, the cumulative translation differences for all foreign operations were reset to be zero at the date of transition to IFRSs and the gain or loss on a subsequent disposal of any foreign operation exclude translation differences that arose before the date of transition to IFRSs and include later translation differences.
(8) Cash and cash equivalents
Cash and cash equivalents consist of cash on hand, demand deposits, interest-earning deposits with original maturities of up to 90 days of acquisition date and highly liquid investment assets that are readily convertible to known amounts of cash and subject to an insignificant risk of changes in value.
(9) Financial assets and financial liabilities
1) Financial assets
On initial recognition, financial assets are classified into held-for-trading, designated as at fair value through profit or loss (“FVTPL”), AFS financial assets, held-to-maturity (“HTM”) investments and loans and receivables.
Held-for-trading:
A financial asset is classified as held-for-trading if it is acquired principally for sale in the near term, or forms part of a portfolio of financial instruments that are managed together and for which there is evidence of short-term profit taking, or it is a derivative (not in a qualifying hedge relationship). Held-for-trading financial assets are recognized at fair value with transaction costs being recognized in net income. Subsequently they are measured at fair value. Gains and losses on held-for-trading financial assets are recognized in net income as they arise.
F-20
Table of Contents
Designated as at FVTPL:
Financial assets may be designated as at FVTPL only if such designation (a) eliminates or significantly reduces a measurement or recognition inconsistency; or (b) applies to a group of financial assets, financial liabilities or both, which is managed and performance is evaluated on a fair value basis; or (c) is related to a contract containing one or more embedded derivative that would be required to be separated from the host contract. Financial assets designated by the Group on initial recognition as at FVTPL are recognized at fair value, with transaction costs recognized in net income, and are subsequently measured at fair value. Gains and losses on financial assets that are designated as at FVTPL are recognized in net income as they arise.
AFS financial assets:
Financial assets that are not classified as HTM; held-for-trading; designated as at FVTPL; or loans and receivables, are classified as AFS. Financial assets can be designated as AFS on initial recognition. AFS financial assets are initially recognized at fair value plus directly related transaction costs. They are subsequently measured at fair value. Unquoted equity investments whose fair value cannot be measured reliably are carried at cost and classified as AFS financial assets. Impairment losses in monetary and non-monetary AFS financial assets and dividends on non-monetary financial assets are recognized in net income. Interest revenue on monetary financial assets is calculated using the effective interest method. Other changes in the fair value of AFS financial assets and any related tax are reported in a separate component of shareholders’ equity until disposal, when the cumulative gain or loss is recognized in net income.
HTM investments:
A financial asset may be classified as a HTM investment only if it has fixed or determinable payments and a fixed maturity and the Group has the positive intention and ability to hold to maturity. HTM investments are initially recognized at fair value plus directly related transaction costs. They are subsequently measured at amortized cost using the effective interest method less any impairment losses.
Loans and receivables:
Non-derivative financial assets with fixed or determinable repayments that are not quoted in an active market are classified as loans and receivables, except those that are classified as AFS or as held-for-trading, or designated as at FVTPL. Loans and receivables are initially recognized at fair value plus directly related transaction costs. They are subsequently measured at amortized cost using the effective interest method less any impairment losses.
Regular way purchases of financial assets classified as loans and receivables are recognized on settlement date; issues of equity or financial liabilities measured at amortized cost are recognized on settlement date; all other regular way transactions in financial instruments are recognized on trade date.
However, in accordance with the exemption of IFRS 1 First-time adoption of International Financial Reporting Standards, some financial assets existing at the date of transition to IFRSs were designated as AFS financial assets and some financial assets existing at that date, which met the required criteria in IAS 39 Financial instruments: Recognition and Measurement, were also designated as financial assets at FVTPL.
2) Financial liabilities
On initial recognition financial liabilities are classified into held-for-trading; designated as at FVTPL; or amortized cost.
F-21
Table of Contents
Held-for-trading:
A financial liability is classified as held-for-trading if it is incurred principally for repurchase in the near term, or forms part of a portfolio of financial instruments that are managed together and for which there is evidence of short-term profit taking, or it is a derivative (not in a qualifying hedge relationship). Held-for-trading financial liabilities are recognized at fair value with transaction costs being recognized in net income. Subsequently, they are measured at fair value. Gains and losses are recognized in net income as they arise.
Designated as at FVTPL:
Financial liabilities may be designated as at FVTPL only if such designation (a) eliminates or significantly reduces a measurement or recognition inconsistency; or (b) applies to a group of financial liabilities or both that the Group manages and evaluates on a fair value basis; or (c) relates to an instrument that contains an embedded derivative which is not evidently closely related to the host contract. Financial liabilities that the Group designates on initial recognition as being at FVTPL are recognized at fair value, with transaction costs being recognized in net income, and are subsequently measured at fair value. Gains and losses on financial liabilities that are designated as at FVTPL are recognized in net income as they arise.
Amortized cost:
All other financial liabilities are measured at amortized cost using the effective interest method.
However, in accordance with the exemption of IFRS 1 First-time adoption of International Financial Reporting Standards, some financial liabilities existing at that date, which met the required criteria in IAS 39 Financial instruments: Recognition and Measurement, were also designated as financial liabilities at FVTPL.
3) Reclassifications
Held-for-trading and AFS financial assets that meet the definition of loans and receivables (non-derivative financial assets with fixed or determinable payments that are not quoted in an active market) may be reclassified to loans and receivables if the Group has the intention and ability to hold the financial asset for the foreseeable future or until maturity. The Group typically regards the foreseeable future as twelve months from the date of reclassification. Reclassifications are made at fair value. This fair value becomes the asset’s new cost or amortized cost as appropriate. Gains and losses recognized up to the date of reclassification are not reversed.
4) Derecognition of financial assets and liabilities
The Group derecognizes a financial asset when the contractual right to the cash flows from the asset is expired, or when it transfers the financial asset and substantially all the risks and rewards of ownership of the asset to another company. If the Group neither transfers nor retains substantially all the risks and rewards of ownership and continues to control the transferred asset, the Group recognizes its retained interest in the asset and an associated liability for amounts it may have to pay. The Group derecognizes financial liabilities when, and only when, the Group’s obligations are discharged, cancelled or they expire.
However, in accordance with the exception to the retrospective application in IFRS 1 First-time adoption of International Financial Reporting Standards, the Group has applied the derecognition requirements in IAS 39 Financial instruments: Recognition and Measurement prospectively for transactions occurring on or after the date of transition to IFRSs. Therefore, the non-derivative financial assets or non-derivative financial liabilities derecognized in accordance with K-GAAP as a result of a transaction that occurred before the date of transition to IFRSs were not recognized in accordance with IFRSs.
F-22
Table of Contents
5) Fair value of financial assets and liabilities
Financial instruments classified as held-for-trading or designated as at FVTPL and financial assets classified as AFS are recognized in the financial statements at fair value. All derivatives are measured at fair value.
Debt securities (held-for-trading, designated as at FVTPL and AFS) include those issued by governments, municipal bodies and financial institutions as well as corporate bonds and debentures.
Equity securities (held-for-trading, designated as at FVTPL and AFS) comprise equity shares of companies or corporations both listed and unlisted.
Derivatives include swaps (currency swaps, interest rate swaps, credit default swaps, total return swaps and equity and equity index swaps), forward foreign exchange contracts, forward rate agreements, futures (currency, interest rate and equity) and options (exchange-traded options on currencies, interest rates and equities and equity indices and over-the-counter (“OTC”) currency and equity options, interest rate caps and floors and swaptions).
Fair value is the amount for which an asset could be exchanged, or a liability settled, between knowledgeable, willing parties in an arm’s length transaction. Fair values are determined from quoted prices in active markets for identical financial assets or financial liabilities where these are available. The Group characterizes active markets as those where transaction volumes are sufficient to provide objective pricing information, with reasonably narrow bid/ask spreads.
Where a financial instrument is not in active market characterized by low transaction volumes, price quotations which vary substantially among market participants, or in which minimal information is released publicly, fair values are established using valuation techniques rely on alternative market data or internally developed models using significant inputs that are generally readily observable from objective sources. Market data includes prices of financial instruments with similar maturities and characteristics, duration, interest rate yield curves, and measures of volatility. The amount determined to be fair value may incorporate the management of the Group’s own assumptions (including assumptions that the Group believes market participants would use in valuing the financial instruments and assumptions relating to appropriate risk adjustments for nonperformance and lack of marketability).
The valuation techniques used to estimate the fair value of the financial instruments include market approach and income approach, each of which involves a significant degree of judgment. Under the market approach, fair value is determined by reference to a recent transaction involving the financial instruments or by reference to observable valuation measures for comparable companies or assets. Under the income approach, fair value is determined by converting future amounts (e.g., cash flows or earnings) to a single present amount (discounted) using current market expectations about the future amounts. In determining value under this approach, the Group makes assumptions regarding, among other things, revenues, operating income, depreciation and amortization, capital expenditures, income taxes, working capital needs, and terminal value of the financial investments. These valuation techniques involve a degree of estimation, the extent of which depends on the instrument’s complexity and the availability of market-based data.
The following are descriptions of valuation methodologies used by the Group to measure various financial instruments at fair value.
Financial assets at FVTPL and AFS financial assets:
The fair value of the securities included in financial assets at FVTPL and AFS financial assets are recognized in the consolidated statements of financial position based on quoted market prices, where available. For debt securities traded in the OTC market, the Group generally determines fair value based on prices obtained from independent pricing services. Specifically, with respect to independent pricing services, the Group obtains three prices per instrument from reputable independent pricing services in Korea, such as Korea Asset Pricing
F-23
Table of Contents
(an affiliate of Fitch Ratings), KIS Pricing (an affiliate of Moody’s Investors Service) and NICE Pricing Service, and generally uses the lowest of the prices obtained from such services without further adjustment. For non-marketable equity securities, the Group obtains prices from Korea Asset Pricing. The Group validates prices received from such independent pricing services using a variety of means, including verification of the qualification of the independent pricing services, corroboration of the pricing by comparing the prices among the independent pricing services and by reference to other available market data, and review of the pricing model and assumptions used by the independent pricing services by the Group’s personnel who are familiar with market-related conditions.
Derivative assets and liabilities:
Quoted market prices are used for the Group’s exchange-traded derivatives, such as certain interest rate futures and option contracts. All of the Group’s derivatives are traded in OTC markets where quoted market prices are not readily available are valued using internal valuation techniques. Valuation techniques and inputs to internally developed models depend on the type of derivative and nature of the underlying rate, price or index upon which the derivative’s value is based. If the model inputs for certain derivatives are not observable in a liquid market, significant judgments on the level of inputs used for valuation techniques are required.
Valuation Adjustments:
By using derivatives, the Group is exposed to credit risk if counterparties to the derivative contracts do not perform as expected. If counterparty fails to perform, counterparty credit risk is equal to the amount reported as a derivative asset in the consolidated statements of financial position. The amounts reported as a derivative asset are derivative contracts in a gain position. Few of the Group’s derivatives are listed on an exchange. The majority of derivative positions are valued using internally developed models that use as their basis observable market inputs. Therefore, an adjustment is necessary to reflect the credit quality of each counterparty to arrive at fair value. Counterparty credit risk adjustments are applied to derivative assets, such as OTC derivative instruments, when the market inputs used in valuation models may not be indicative of the creditworthiness of the counterparty. Adjustments are also made when valuing financial liabilities to reflect the Group’s own credit standing.
The adjustment is based on probability of default of a counterparty and loss given default. The adjustment also takes into account contractual factors designed to reduce the Group’s credit exposure to each counterparty. To the extent derivative assets (liabilities) are subject to master netting arrangements, the exposure used to calculate the credit risk adjustment is net of derivatives in a loss (gain) position with the same counterparty and cash collateral received (paid).
6) Impairment of the financial assets
The Group assesses at the end of each reporting date whether there is any objective evidence that a financial asset or group of financial assets classified as AFS, HTM or loans and receivables is impaired. A financial asset or portfolio of financial assets is impaired and an impairment loss incurred if there is objective evidence of impairment as result of one or more events that occurred after the initial recognition asset and that event (or events) has an impact on the estimated future cash flows of the financial asset.
Financial assets carried at amortized cost:
If there is objective evidence that an impairment loss on a financial asset or group of financial assets classified as HTM investments or as loans and receivables has been incurred, the Group measures the amount of the loss as the difference between the carrying amount of the asset or group of assets and the present value of estimated future cash flows from the asset or group of assets discounted at the effective interest rate of the instrument at initial recognition. For collateralized loans and receivables, estimated future cash flows include cash flows that may result from foreclosure less the costs of obtaining and selling the collateral.
F-24
Table of Contents
Impairment losses are assessed individually for financial assets that are individually significant and assessed either individually or collectively for assets that are not individually significant. In making collective assessment of impairment, financial assets are grouped into portfolios on the basis of similar risk characteristics. Future cash flows from these portfolios are estimated on the basis of the contractual cash flows and historical loss experience for assets with similar credit risk characteristics. Historical loss experience is adjusted, on the basis of observable data, to reflect current conditions not affecting the period of historical experience.
Impairment losses are recognized in net income and the carrying amount of the financial asset or group of financial assets reduced by establishing a provision for impairment losses. If, in a subsequent period, the amount of the impairment loss reduces and the reduction can be ascribed to an event after the impairment was recognized, the previously recognized loss is reversed by adjusting the provision. Once an impairment loss has been recognized on a financial asset or group of financial assets, interest income is recognized on the carrying amount using the rate of interest at which estimated future cash flows were discounted in measuring impairment.
Impaired loans and receivables are written off (i.e. the impairment provision is applied in writing down the loan’s carrying value in full) when the Group concludes that there is no longer any realistic prospect of recovery of part or the entire loan. It is not the Group’s usual practice to write-off the asset at the time an impairment loss is recognized; it may however, take place in rare circumstances. Amounts recovered after a loan has been written off are reflected to the provision for the period in which they are received.
Financial assets carried at fair value:
When a decline in the fair value of a financial asset classified as AFS has been recognized directly in other comprehensive income and there is objective evidence that the asset is impaired, the cumulative loss is removed from other comprehensive income and recognized in net income. The loss is measured as the difference between the amortized cost of the financial asset and its current fair value. Impairment losses on AFS equity instruments are not reversed through net income, but those on AFS debt instruments are reversed, if there is a decrease in the cumulative impairment loss that is objectively related to a subsequent event.
(10) Offsetting financial instruments
Financial assets and liabilities are presented net in the consolidated statements of financial position when the Group has an enforceable legal right to set off and an intention to settle on a net basis or to realize an asset and settle the liability simultaneously.
(11) Investment properties
The Group classifies a property held to earn rentals and/or for capital appreciation as an investment property. Investment properties are measured initially at cost, including transaction costs, less subsequent depreciation and impairment.
While land is not depreciated, all other investment properties are depreciated based on the respective assets’ estimated useful lives using the straight-line method. The estimated useful lives, residual values and depreciation method are reviewed at the end of each reporting period, with the effect of any change in estimate accounted for on a prospective basis.
(12) Premises and equipment
Premises and equipment are stated at cost less subsequent accumulated depreciation and accumulated impairment losses. The cost of an item of premises and equipment is directly attributable to their purchase or construction, which includes any costs directly attributable to bringing the asset to the location and condition necessary for it to be capable of operating in the manner intended by management. It also includes the initial
F-25
Table of Contents
estimate of the costs of dismantling and removing the item and restoring the site on which it is located. However, under IFRS 1 First-time adoption of International Financial Reporting Standard, certain premises and equipment such as land and buildings were re-evaluated at fair value, which is regarded as deemed cost, at the date of transition to IFRS.
Subsequent costs to replace part of the premises and equipment are recognized in carrying amount of an asset or as an asset if it is probable that the future economic benefits associated with the assets will flow into the Group and the cost of an asset can be measured reliably. Routine maintenance and repairs are expensed as incurred.
Depreciation is charged to net income on a straight-line basis on the estimated economic useful lives as follows:
| Useful life | ||
| Buildings used for business purpose |
35 to 57 years | |
| Structures in leased office |
4 to 5 years | |
| Properties for business purpose |
4 to 5 years | |
| Leased assets |
Useful lives of the same kind or similar other promises and equipment |
The Group assesses the depreciation method, the estimated useful lives and residual values of premises and equipment at the end of each reporting period. If expectations differ from previous estimates, the changes are accounted for as a change in an accounting estimate. When the carrying amount of a fixed asset exceeds the estimated recoverable amount, the carrying amount of such asset is reduced to the recoverable amount.
(13) Intangible assets and goodwill
Intangible assets are stated at the manufacturing cost or acquisition cost plus additional incidental expenses less accumulated amortization and accumulated impairment losses. The Group’s software and industrial property right (trademark) are amortized over five years using the straight-line method. The estimated useful life and amortization method are reviewed at the end of each reporting period. If expectations differ from previous estimates, the changes are accounted for as a change in an accounting estimate.
| Useful life | ||
| Patents |
10 years | |
| Development costs |
5 years | |
| Software and others |
4 to 5 years |
For the purpose of impairment testing, goodwill is allocated to each of the Group’s cash-generating units (“CGU”) expected to benefit from the synergies of the combination. A CGU to which goodwill has been allocated is tested for impairment annually, or more frequently when there is indication that the CGU may be impaired. If the recoverable amount of the CGU is less than its carrying amount, the impairment loss is allocated first to reduce the carrying amount of any goodwill allocated to the CGU and then to the other assets of the CGU on a pro-rata basis based on the carrying amount of each asset in the CGU. Any impairment loss for goodwill is recognized directly in net income in the consolidated statements of comprehensive income. An impairment loss recognized for goodwill is not reversed in subsequent periods.
(14) Impairment of non-monetary assets
Intangible assets with indefinite useful lives or intangible assets that are not yet available for use are tested for impairment annually, regardless of whether or not there is any indication of impairment. All other assets are tested for impairment when there is an objective indication that the carrying amount may not be recoverable, and
F-26
Table of Contents
if the indication exists. The Group estimates the recoverable amount. Recoverable amount is the higher of value in use and net fair value less costs to sell. If the recoverable amount of an asset is estimated to be less than its carrying amount, the carrying amount of the asset is reduced to its recoverable amount and such impairment loss is recognized immediately in net income.
(15) Leases
Leases are classified as finance leases whenever the terms of the lease transfer substantially all the risks and rewards of ownership to the lessee. All other leases are classified as operating leases.
1) As a lessor
Amounts due from lessees under finance leases are recognized as receivables at the amount of the Group’s net investment in the leases being the minimum lease payments and any unguaranteed residual value discount interest rate implicit in the lease. Finance lease income is allocated to accounting periods so as to reflect a constant periodic rate of return on the Group’s net investment outstanding in respect of the leases.
Rental income from operating leases is recognized on a straight-line basis over the term of the relevant lease. Initial direct costs incurred in negotiating and arranging an operating lease are added to the carrying amount of the leased asset and recognized on a straight-line basis over the lease term. Operating lease assets are included within premise and equipment and depreciated over their useful lives.
2) As a lessee
Assets held under finance leases are initially recognized as assets of the Group at their fair value at the inception of the lease or, if lower, at the present value of the minimum lease payments. The corresponding liability to the lessor is included in the consolidated statements of financial position as a finance lease obligation. Lease payments are apportioned between finance expenses and reduction of the lease obligation so as to achieve a constant rate of interest on the remaining balance of the liability. Contingent rentals arising under finance leases are recognized as expenses in the periods in which they are incurred.
Operating lease payments are recognized as an expense on a straight-line basis over the lease term, except where another systematic basis is more representative of the time pattern in which economic benefits from the leased asset are consumed. Contingent rentals arising under operating leases are recognized as expenses in the period in which they are incurred.
(16) Derivative instruments
Derivative instruments are classified as forward, futures, option, and swap, depending on the types of transactions and are classified as either trading or hedging if they are qualified for hedge accounting. Derivatives are initially recognized at fair value at the date the derivative contract is entered into and are subsequently measured to their fair value at the end of each reporting period. The resulting gain or loss is recognized in net income immediately unless the derivative is designated and effective as a hedging instrument.
A derivative embedded in a contract is accounted for as a stand-alone derivative if its economic characteristics are not closely related to the economic characteristics of the host contract; unless the entire contract is measured at fair value with changes in fair value recognized in net income.
The Group designates certain hedging instruments to (a) hedge of the exposure to changes in fair value of a recognized asset or liability or an unrecognized firm commitment (fair value hedge); (b) hedge of the exposure to variability in cash flows that is attributable to a particular risk associated with a recognized asset or liability or a highly probable forecasted transaction (cash flow hedge); and (c) hedge of a net investment in a foreign operation.
F-27
Table of Contents
At the inception of the hedge relationship, the Group documents the relationship between the hedging instrument and the hedged item, along with its risk management objectives and its strategy for undertaking various hedge transactions. Furthermore, at the inception of the hedge and on an ongoing basis, the Group documents whether the hedging instrument is highly effective in offsetting changes in fair values or cash flows of the hedged item.
Changes in the fair value of derivatives that are designated and qualified as fair value hedges are recognized in net income immediately, together with any changes in the fair value of the hedged asset or liability that are attributable to the hedged risk. Hedge accounting is discontinued when the Company revokes the hedging relationship or when the hedging instrument is no longer qualified for hedge accounting. The fair value adjustment to the carrying amount of the hedged item is amortized to net income from that date to maturity using the effective interest method.
The effective portion of changes in the fair value of derivatives that are designated and qualified as cash flow hedges is recognized in other comprehensive income. The gain or loss relating to the ineffective portion is recognized immediately in net income. Amounts previously recognized in other comprehensive income and accumulated in equity are reclassified to net income when the hedged item is recognized in net income.
Hedge accounting is discontinued when the hedging instrument is expired or sold, or it is no longer qualified for hedge accounting, and any cumulative gain or loss in other comprehensive income remains in equity until the forecast transaction is ultimately recognized in net income. When a forecasted transaction is no longer expected to occur, the gain or loss accumulated in equity is recognized immediately in net income.
Hedges of net investments in foreign operations are accounted for similarly to cash flow hedges. The effective portion of changes in the fair value of the hedging instrument is recognized in equity while the ineffective portion is recognized immediately in net income. The cumulated gain and loss in other comprehensive income is reclassified from equity to profit or loss on the disposal or partial disposal of the foreign operations.
(17) Assets held for sale
Non-current assets and disposal groups are classified as held for sale if their carrying amount will be recovered principally through a sale transaction rather than through continuing use. This condition is regarded as met only when the sale is highly probable and the non-current asset (or disposal group) is available for immediate sale in its present condition. Management must be committed to the sale, which should be expected to qualify for recognition as a completed sale within one year from the date of classification.
When the Group is committed to a sale plan involving loss of control of a subsidiary, all of the assets and liabilities of that subsidiary are classified as held for sale when the criteria described above are met, regardless of whether the Group will retain a non-controlling interest in its former subsidiary after the sale.
Non-current assets (and disposal groups) classified as held for sale are measured at the lower of their previous carrying amount and fair value less costs to sell.
(18) Provisions
The Group recognizes provision if it has a present or contractual obligations as a result of the past event, it is probable that an outflow of resources will be required to settle the obligation, and the amount of the obligation is reliably estimated. Provision is not recognized for the future operating losses.
The Group recognizes provision related to the unused portion of point rewards earned by credit card customers, payment guarantees, loan commitment and litigations. Where the Group is required to restore a leased property that is used as a branch, to an agreed condition after the contractual term expires, the present value of expected amounts to be used to dispose, decommission or repair the facilities is recognized as an asset retirement obligation.
F-28
Table of Contents
Where there are a number of similar obligations, the probability that an outflow will be required in settlement is determined by considering the obligations as a whole. Although the likelihood of outflow for any one item may be small, if it is probable that some outflow of resources will be needed to settle the obligations as a whole, a provision is recognized.
(19) Capital and compound financial instruments
The Group classifies a financial instrument that it issues as a financial liability or an equity instrument in accordance with the substance of the contractual arrangement. An instrument is classified as a liability if it is a contractual obligation to deliver cash or another financial asset, or to exchange financial assets or financial liabilities on potentially unfavorable terms. An instrument is classified as equity if it evidences a residual interest in the assets of the Group after the deduction of liabilities. The components of a compound financial instrument issued by the Group are classified and accounted for separately as financial liabilities or equity as appropriate.
The Group recognizes common stock as equity and redeemable preferred stocks as a liability. Direct expenses related to the issuance of new shares or options are recognized as a deduction from equity, net of any tax effects. If the Group reacquires its own equity instruments, those instruments (“treasury shares”) are presented as a deduction from total equity. The gain or loss on the purchase, sale, issue, or cancellation of treasury shares is not recognized in net income but recognized directly in equity.
(20) Financial guarantee contracts
Under a financial guarantee contract, the Group, in return for a fee, undertakes to meet a customer’s obligations under the terms of a debt instrument if the customer fails to do so. A financial guarantee is recognized as a liability; initially at fair value and, if not designated as at FVTPL, subsequently at the higher of its initial value less cumulative amortization and any provision under the contract measured in accordance with provision policy. Amortization is calculated so as to recognize fees receivable in net income over the period of the guarantee.
(21) Employee benefits and pensions
The Group recognizes the undiscounted amount of short-term employee benefits expecting payment in exchange for the services, when employee renders services. Also, the Group recognizes expenses and liabilities in the case of accumulating compensated absences, when the employees render service that they are entitled to future compensated absences. Though the Group may have no legal obligation to pay a bonus, considering some cases, the Group has a practice of paying bonuses. In such cases, the Group has a constructive obligation, and thus the Group recognizes expenses and liabilities when employees render service.
The Group provides post-retirement benefit in the form of pensions, both defined contribution plans and defined benefit plans, to all eligible employees. Under defined contribution plans, the Group recognizes contribution payable to a defined contribution plan when eligible employees have rendered service. Under defined benefit plan, the Group measures its obligation to a defined benefit plan on an actuarial basis using the projected unit credit method and discounted at a rate that reflects the current rate of return on a high quality corporate bond of equivalent term and currency to the plan liabilities. The plan assets are measured at their fair value. Any surplus or deficit of plan assets over liabilities is recognized in the consolidated statements of financial position as an asset (surplus) or liability (deficit). The current service cost, curtailments and any past service costs together with the expected return on plan assets less the unwinding of the discount on the plan liabilities is charged to operating expenses. Actuarial gains and losses are recognized in full in profit or loss when they occur.
Retirement benefit obligation on the consolidated statements of financial position is recognized as the present value of defined benefit obligation which applied to unrecognized past service cost, less the fair value of
F-29
Table of Contents
plan assets. If the plan assets exceeds the present value of defined benefit obligation, the excess amount shall be recognized as an asset to the extent of the refundable amount from the unrecognized past service cost and the present value of decreased amount of future contribution on unrecognized past service cost.
(22) Income taxes
Income tax consists of current and deferred income tax. Current income tax expense approximates taxes to be paid or refunded for the current period and deferred income tax expense is provided on an asset and liability method whereby deferred tax assets are recognized for deductible temporary differences, including operating losses and tax credit carryforwards, and deferred tax liabilities are recognized for taxable temporary differences. Temporary differences are the differences between the carrying values of assets and liabilities for financial reporting purposes and their tax bases. Deferred income tax benefit or expense is then recognized for the change in deferred tax assets or liabilities between periods. Deferred tax assets and liabilities are adjusted for the effect of changes in tax laws and rates on the date of enactment or substantive enactment. Deferred tax assets, including the carryforwards of unused tax losses, are recognized to the extent it is probable that the deferred tax assets will be realized.
Deferred income tax assets and liabilities are offset when there is a legally enforceable right to offset current tax assets against current tax liabilities and when the deferred income tax assets and liabilities relate to income taxes levied by the same taxation authority on either the taxable entity or different taxable entities where there is an intention either to settle the balances on a net basis or to realize the asset and settle the liability simultaneously.
The carrying amount of deferred tax assets is reviewed at each balance sheet date and reduced to the extent that it is no longer probable that sufficient taxable profits will be available to allow all or part of the asset to be recovered. Deferred liabilities are not recognized of the temporary difference arises from the initial recognition of goodwill. Deferred tax assets or liabilities are not recognized if they arise from the initial recognition (other than in a business combination) of other assets and liabilities in a transaction that affects neither the taxable profit nor the accounting profit.
Income tax is charged or credited to the income statement, except when it relates to items charged or credited in other comprehensive income or directly to equity, in which case the income tax is also dealt with accordingly.
In accordance with the Korean Corporate Tax Act, the Company and its wholly owned domestic subsidiaries prepare a consolidated tax return which includes Woori Bank, Woori FIS, Woori F&I, Woori Asset Management, Woori PE, Woori Credit Information, Woori AMC, WR Loan, Woori FG Savings Bank and Woori Fund Service along with the Company as of December 31, 2011.
For all other subsidiaries of the Company, income tax is calculated on an individual entity basis and losses incurred by these other subsidiaries cannot be offset against profits earned by any other profitable entity.
(23) Earnings per share (“EPS”)
Basic EPS is calculated by earnings subtracting the dividends paid to holders of preferred stock and hybrid securities from the net income attributable to ordinary shareholders from the statements of comprehensive income and dividing by the weighted average number of common shares outstanding. Diluted EPS is calculated by adjusting the earnings and number of shares for the effects of all dilutive potential common shares.
F-30
Table of Contents
(24) Accounting developments
The Group has not applied the following new and revised IFRSs that have been issued but are not yet effective :
Amendments to IFRS 7 Disclosures—Transfers of Financial Assets
The amendments to IFRS 7 increase the disclosure requirements for transactions involving transfers of financial assets. These amendments are intended to provide greater transparency around risk exposures when a financial asset is transferred but the transferor retains some level of continuing exposure in the asset. The amendments also require disclosures where transfers of financial assets are not evenly distributed throughout the period.
The management does not anticipate that these amendments to IFRS 7 will have a significant effect on the Group’s disclosures regarding transfers of trade receivables previously affected. However, if the Group enters into other types of transfers of financial assets in the future, disclosures regarding those transfers may be affected. It will be applied for annual periods beginning on or after July 1, 2011.
Amendments to IFRS 13 Fair Value Measurement
IFRS 13 establishes a single source of guidance for fair value measurements and disclosures about fair value measurements. The Standard defines fair value, establishes a framework for measuring fair value, and requires disclosures about fair value measurements. The scope of IFRS 13 is broad; it applies to both financial instrument items and non-financial instrument items for which other IFRSs require or permit fair value measurements and disclosures about fair value measurements, except in specified circumstances. In general, the disclosure requirements in IFRS 13 are more extensive than those required in the current standards. For example, quantitative and qualitative disclosures based on the three-level fair value hierarchy currently required for financial instruments only under IFRS 7 Financial Instruments : Disclosures will be extended by IFRS 13 to cover all assets and liabilities within its scope.
IFRS 13 is effective for annual periods beginning on or after January 1, 2013, with earlier application permitted.
The management anticipates that IFRS 13 will be adopted in the Group’s consolidated financial statements for the annual period beginning January 1, 2013 and that the application of the new Standard may affect the amounts reported in the financial statements and result in more extensive disclosures in the financial statements.
Amendments to IAS 12 Deferred Tax—Recovery of Underlying Assets
The amendments to IAS 12 provide an exception to the general principles in IAS 12 that the measurement of deferred tax assets and deferred tax liabilities should reflect the tax consequences that would follow from the manner in which the entity expects to recover the carrying amount of an asset. Specifically, under the amendments, investment properties that are measured using the fair value model in accordance with IAS 40 Investment Property are presumed to be recovered through sale for the purposes of measuring deferred taxes, unless the presumption is rebutted in certain circumstances.
The amendments to IAS 12 are effective for annual periods beginning on or after January 1, 2012. Management anticipates that the application of the amendments to IAS 12 in future accounting periods may result in adjustments to the amount of deferred tax liabilities recognized in prior years regarding the Group’s investment properties for which the carrying amounts are presumed to be recovered through use. However, the management has not yet performed a detailed analysis of the impact of the application of the amendments and hence has not yet quantified the extent of the impact. It will be applied for annual periods beginning on or after January 1, 2012.
F-31
Table of Contents
Amendments to IAS 19—Employee Benefits
The amendments to IAS 19 change the accounting for defined benefit plans and termination benefits. The most significant change relates to the accounting for changes in defined benefit obligations and plan assets when they occur, and hence eliminate the ‘corridor approach’ permitted under the previous version of IAS 19 and accelerate the recognition of past service costs. The amendments require all actuarial gains and losses to be recognized immediately through other comprehensive income in order for the net pension asset or liability recognized in the consolidated statements of financial position to reflect the full value of the plan deficit or surplus.
The amendments to IAS 19 are effective for annual periods beginning on or after January 1, 2013 and require retrospective application with certain exceptions. The management anticipates that the amendments to IAS 19 will be adopted in the Group’s consolidated financial statements for the annual period beginning January 1, 2013 and that the application of the amendments to IAS 19 may have impact on amounts reported in respect of the Group’s defined benefit plans. However, the management has not yet performed a detailed analysis of the impact of the application of the amendments and hence has not yet quantified the extent of the impact.
3. Significant Accounting Estimates and Assumptions
The significant accounting estimates and assumptions are continually evaluated based on historical experience and various factors including expectations of future events that are considered to be reasonable. Actual results can differ from those estimates based on such definitions. The following are the accounting estimates and assumptions that have a significant risk of causing changes to the carrying amounts of assets and liabilities within the next accounting period.
| (1) | Impairment of goodwill |
The Group performs impairment test of goodwill annually or more frequently when there is indication that a CGU may be impaired. To determine whether goodwill is impaired; the Group estimates the value of the CGUs to which goodwill has been allocated. The value in use is calculated based on the management’s estimation on the future cash flows expected to arise from the CGU and a suitable discount rate in order to calculate present value.
(2) Income Taxes
The Group is subject to income taxes in numerous jurisdictions, which requires significant judgment in determining realization of deferred tax. Actual tax payment may be different from the provision estimate and such difference may affect the income tax expense. There are various transactions and calculations for which the ultimate tax determination is uncertain. Deferred tax assets relating to tax losses carried forward and deductible temporary differences are recognized, only to the extent that it is probable that future taxable profit will be available against which the tax losses carried forward and the deductible temporary differences can be utilized. This assessment requires significant management estimates and judgments. Future taxable profit is estimated based on, among other relevant factors, forecasted operating results, which are based on historical financial performance. In the event the group was to determine that the Group would be able to realize its deferred income tax assets in the future at an amount different than their net recorded amount, the Group would make an adjustment to the provision for income taxes at such time.
(3) Fair value of financial instruments
Financial instruments classified as held-for trading or designated as at FVTPL and financial instruments classified as AFS are recognized in the financial statements at fair value. All derivatives are measured at fair value. Financial instruments, which are not traded in active market will have less objective fair value and require
F-32
Table of Contents
broad judgment in liquidity, concentration, uncertainty in market factors and assumption in price determination and other risks. The fair value of those assets is established by using valuation techniques.
As described in the significant accounting policies in Note 2-(9)-5), ‘ Fair value of financial assets and liabilities’, a variety of valuation techniques, which include market approach and income approach and internally developed models that incorporate various types of assumptions and variables, are used to determine the fair value of financial instruments.
(4) Provision for credit losses
The Group’s loan impairment provisions are established to recognize incurred impairment losses in its portfolio of loans classified as loans and receivables and carried at amortized cost. A loan is impaired when there is objective evidence that events since the loan was granted have affected expected cash flows from the loan. Such objective evidence, indicative that a borrower’s financial condition has deteriorated, can include for loans that are individually assessed: delinquent loans; debt in restructuring; probable bankruptcy or liquidation; significant reduction in the value of any security; breach of limits or covenants; and deterioration in trading performance and, for loans that are collectively assessed: borrowers’ payment status and observable data about relevant macroeconomic measures.
The Group first assesses whether objective evidence of impairment exists individually for financial assets that are individually significant (individual evaluation of impairment), and individually or collectively for financial assets that are not individually significant. If the Group determines that no objective evidence of impairment exists for an individually assessed financial asset, it includes the asset in a group of financial assets with similar credit risk characteristics and collectively assesses them for impairment (collective evaluation of impairment).
There are two components to the Group’s loan impairment provisions (individual and collective).
Individual assessment of impairment losses are calculated by discounting the expected future cash flows of a loan at its original effective interest rate and comparing the resultant present value with the loan’s carrying amount. This process normally encompasses management’s best estimate, such as operating cash flow of borrower and net realizable value of any collateral held and the timing of anticipated receipts.
Collective assessment of impairment losses are established on a portfolio basis using the methodology based on historical loss experience. The methodology based on historical loss experience is used to estimate inherent incurred loss on groups of assets for collective evaluation of impairment. Such methodology incorporates factors such as type of product and borrowers, credit rating, portfolio size, loss emergence period and recovery period and applies probability of default on each assets (or pool of assets) and loss given default by type of collateral. Also, consistent assumptions are applied to form a formula-based model in estimating inherent loss and to determine factors on the basis of historical loss experience and current condition. The methodology and assumptions used for estimating future cash flows are reviewed regularly to reduce any differences between loss estimates and actual loss experience.
4. Risk Management
The Group’s operating activity is exposed to various financial risks; hence, the Group is required to analyze and assess the level of complex risks, determine the permissible level of risks and manage such risks.
The Group’s risk management procedures have been established to improve the quality of assets for holding or investment purposes by making decisions as to how to avoid or mitigate risks through the identification of the source of the potential risks and their impact.
F-33
Table of Contents
The Group has established an approach to manage the acceptable level of risks and reduce the excessive risks in financial instruments in order to maximize the profit given the risks present, for which the Group has implemented processes for risk identification, assessment, control, and monitoring and reporting. The risk is managed by the risk management department in accordance with the Group’s risk management policy. The Risk Management Committee makes decisions on the risk strategies such as avoidance of concentration on capital at risk and establishment of acceptable level of risk limit.
(1) Credit risk
Credit risk represents the possibility of financial losses incurred when the counterparty fails to fulfill its contractual obligations. The goal of credit risk management is to maintain the Group’s credit risk exposure to a permissible degree and to optimize its rate of return considering such credit risk.
1) Credit risk management
The Group considers the probability of failure in performing the obligation of its counterparties, credit exposure to the counterparty and the related default risk and the rate of default loss. The Group uses the credit rating model to assess the possibility of counterparty’s default risk; and when assessing the obligor’s credit grade, the Group utilizes credit grades derived using statistical methods.
In order to manage credit risk limit, the Group establishes the appropriate credit line per obligor, company or industry and monitors obligors’ credit line, total exposures and loan portfolios when approving the loan.
The Group mitigates credit risk resulting from the obligor’s credit condition by using financial and physical collateral, guarantees, netting agreements and credit derivatives. The Group has adopted the entrapment method acknowledged by BASEL II standards to mitigate its credit risk. Credit risk mitigation is reflected in qualifying financial collateral, trade receivables, guarantees, residential and commercial real estate and other collaterals. The Group regularly performs a revaluation of collateral reflecting such credit risk mitigation.
2) Maximum exposure to credit risk
The Group’s maximum exposure to credit risk refers to net book value of financial assets net of allowances, which shows the uncertainties of maximum changes of net value of financial assets attributable to a particular risk without considering collateral and other credit enhancements obtained. However, the maximum exposure is the fair value amount (recorded on the books) for derivatives, maximum contractual obligation for payment guarantees and loan commitment for loan contracts.
F-34
Table of Contents
The maximum exposure to credit risk is as follows (Unit: Korean Won in millions):
| January 1, 2010 |
December 31, 2010 |
December 31, 2011 |
||||||||||
| Loans and receivables: |
||||||||||||
| Korean treasury and government agencies |
7,227,488 | 9,788,926 | 13,761,594 | |||||||||
| Banks |
10,482,364 | 10,276,950 | 12,921,330 | |||||||||
| Corporates |
106,349,277 | 107,099,880 | 110,204,743 | |||||||||
| Consumers |
86,998,045 | 89,626,049 | 98,272,289 | |||||||||
|
|
|
|
|
|
|
|||||||
| Sub-total |
211,057,174 | 216,791,805 | 235,159,956 | |||||||||
|
|
|
|
|
|
|
|||||||
| Financial assets at FVTPL: |
||||||||||||
| Debt securities held for trading |
17,536,590 | 15,602,259 | 18,873,159 | |||||||||
| Designated at FVTPL |
474,355 | 400,319 | 409,804 | |||||||||
| Derivative for trading |
4,739,646 | 4,162,619 | 3,899,897 | |||||||||
|
|
|
|
|
|
|
|||||||
| Sub-total |
22,750,591 | 20,165,197 | 23,182,860 | |||||||||
|
|
|
|
|
|
|
|||||||
| AFS debt securities |
10,487,061 | 13,474,734 | 13,086,849 | |||||||||
| HTM securities |
15,953,709 | 19,885,559 | 20,036,128 | |||||||||
| Derivative assets (hedging) |
107,490 | 131,511 | 326,840 | |||||||||
| Off-balance sheet items: |
||||||||||||
| Guarantees |
26,134,163 | 25,008,780 | 26,702,154 | |||||||||
| Loan commitments |
77,333,904 | 82,941,133 | 88,400,600 | |||||||||
|
|
|
|
|
|
|
|||||||
| Sub-total |
103,468,067 | 107,949,913 | 115,102,754 | |||||||||
|
|
|
|
|
|
|
|||||||
| Total |
363,824,092 | 378,398,719 | 406,895,387 | |||||||||
|
|
|
|
|
|
|
|||||||
a) Credit risk exposure by geographical areas
The following tables analyze credit risk exposure by geographical areas (Unit: Korean Won in millions):
| January 1, 2010 | ||||||||||||||||||||||||||||
| Korea | USA | UK | Japan | China | Others | Total | ||||||||||||||||||||||
| Loans and receivables |
202,416,412 | 2,212,861 | 844,278 | 526,490 | 1,535,010 | 3,522,123 | 211,057,174 | |||||||||||||||||||||
| Financial assets at FVTPL |
22,697,378 | 34,702 | 18,511 | — | — | — | 22,750,591 | |||||||||||||||||||||
| AFS debt securities |
10,355,680 | 128,368 | — | — | — | 3,013 | 10,487,061 | |||||||||||||||||||||
| HTM securities |
15,832,339 | 2,808 | — | — | — | 118,562 | 15,953,709 | |||||||||||||||||||||
| Derivative assets (hedging) |
107,490 | — | — | — | — | — | 107,490 | |||||||||||||||||||||
| Off-balance sheet items |
102,041,541 | 116,727 | 67,104 | 96,706 | 509,805 | 636,184 | 103,468,067 | |||||||||||||||||||||
|
|
|
|
|
|
|
|
|
|
|
|
|
|
|
|||||||||||||||
| Total |
353,450,840 | 2,495,466 | 929,893 | 623,196 | 2,044,815 | 4,279,882 | 363,824,092 | |||||||||||||||||||||
|
|
|
|
|
|
|
|
|
|
|
|
|
|
|
|||||||||||||||
F-35
Table of Contents
| December 31, 2010 | ||||||||||||||||||||||||||||
| Korea | USA | UK | Japan | China | Others | Total | ||||||||||||||||||||||
| Loans and receivables |
207,708,457 | 2,068,858 | 709,628 | 568,867 | 1,988,423 | 3,747,572 | 216,791,805 | |||||||||||||||||||||
| Financial assets at FVTPL |
20,078,173 | 25,366 | 61,272 | — | 32 | 354 | 20,165,197 | |||||||||||||||||||||
| AFS debt securities |
13,324,102 | 123,364 | — | — | 15,503 | 11,765 | 13,474,734 | |||||||||||||||||||||
| HTM securities |
19,765,444 | 2,262 | — | — | — | 117,853 | 19,885,559 | |||||||||||||||||||||
| Derivative assets (hedging) |
131,511 | — | — | — | — | — | 131,511 | |||||||||||||||||||||
| Off-balance sheet items |
106,467,780 | 171,620 | 68,634 | 49,651 | 563,899 | 628,329 | 107,949,913 | |||||||||||||||||||||
|
|
|
|
|
|
|
|
|
|
|
|
|
|
|
|||||||||||||||
| Total |
367,475,467 | 2,391,470 | 839,534 | 618,518 | 2,567,857 | 4,505,873 | 378,398,719 | |||||||||||||||||||||
|
|
|
|
|
|
|
|
|
|
|
|
|
|
|
|||||||||||||||
| December 31, 2011 | ||||||||||||||||||||||||||||
| Korea | USA | UK | Japan | China | Others | Total | ||||||||||||||||||||||
| Loans and receivables |
225,621,567 | 1,748,898 | 814,148 | 535,055 | 2,282,712 | 4,157,576 | 235,159,956 | |||||||||||||||||||||
| Financial assets at FVTPL |
23,069,879 | — | 1,366 | — | 9,893 | 101,722 | 23,182,860 | |||||||||||||||||||||
| AFS debt securities |
12,955,152 | 81,030 | — | — | 34,035 | 16,632 | 13,086,849 | |||||||||||||||||||||
| HTM securities |
19,933,161 | 1,967 | — | — | 1,817 | 99,183 | 20,036,128 | |||||||||||||||||||||
| Derivative assets (hedging) |
326,840 | — | — | — | — | — | 326,840 | |||||||||||||||||||||
| Off-balance sheet items |
112,451,295 | 215,942 | 108,222 | 71,230 | 632,189 | 1,623,876 | 115,102,754 | |||||||||||||||||||||
|
|
|
|
|
|
|
|
|
|
|
|
|
|
|
|||||||||||||||
| Total |
394,357,894 | 2,047,837 | 923,736 | 606,285 | 2,960,646 | 5,998,989 | 406,895,387 | |||||||||||||||||||||
|
|
|
|
|
|
|
|
|
|
|
|
|
|
|
|||||||||||||||
Others are including deposits, call loans and loans due from banks in Vietnam, Panama and European countries.
b) Credit risk exposure by industries
The following tables analyze credit risk exposure by industries, which are service industry, manufacturing industry and others (including retail), in accordance with the Korea standard industrial classification code (Unit: Korean Won in millions):
| January 1, 2010 | ||||||||||||||||
| Service | Manufacturing | Others | Total | |||||||||||||
| Loans and receivables |
74,189,800 | 40,337,948 | 96,529,426 | 211,057,174 | ||||||||||||
| Financial assets at FVTPL |
11,941,615 | 504,303 | 10,304,673 | 22,750,591 | ||||||||||||
| AFS debt securities |
4,311,273 | 230,707 | 5,945,081 | 10,487,061 | ||||||||||||
| HTM securities |
12,423,719 | 15,824 | 3,514,166 | 15,953,709 | ||||||||||||
| Derivative assets (hedging) |
— | — | 107,490 | 107,490 | ||||||||||||
| Off-balance sheet items |
23,140,997 | 42,932,383 | 37,394,687 | 103,468,067 | ||||||||||||
|
|
|
|
|
|
|
|
|
|||||||||
| Total |
126,007,404 | 84,021,165 | 153,795,523 | 363,824,092 | ||||||||||||
|
|
|
|
|
|
|
|
|
|||||||||
F-36
Table of Contents
| December 31, 2010 | ||||||||||||||||
| Service | Manufacturing | Others | Total | |||||||||||||
| Loans and receivables |
77,616,182 | 41,945,784 | 97,229,839 | 216,791,805 | ||||||||||||
| Financial assets at FVTPL |
12,040,253 | 639,863 | 7,485,081 | 20,165,197 | ||||||||||||
| AFS debt securities |
7,343,957 | 133,643 | 5,997,134 | 13,474,734 | ||||||||||||
| HTM securities |
12,054,296 | 70,563 | 7,760,700 | 19,885,559 | ||||||||||||
| Derivative assets (hedging) |
— | — | 131,511 | 131,511 | ||||||||||||
| Off-balance sheet items |
24,788,809 | 42,885,636 | 40,275,468 | 107,949,913 | ||||||||||||
|
|
|
|
|
|
|
|
|
|||||||||
| Total |
133,843,497 | 85,675,489 | 158,879,733 | 378,398,719 | ||||||||||||
|
|
|
|
|
|
|
|
|
|||||||||
| December 31, 2011 | ||||||||||||||||
| Service | Manufacturing | Others | Total | |||||||||||||
| Loans and receivables |
80,079,276 | 47,437,073 | 107,643,607 | 235,159,956 | ||||||||||||
| Financial assets at FVTPL |
12,323,082 | 1,143,206 | 9,716,572 | 23,182,860 | ||||||||||||
| AFS debt securities |
6,772,177 | 245,531 | 6,069,141 | 13,086,849 | ||||||||||||
| HTM securities |
10,589,496 | 80,317 | 9,366,315 | 20,036,128 | ||||||||||||
| Derivative assets (hedging) |
— | — | 326,840 | 326,840 | ||||||||||||
| Off-balance sheet items |
29,579,013 | 44,057,257 | 41,466,484 | 115,102,754 | ||||||||||||
|
|
|
|
|
|
|
|
|
|||||||||
| Total |
139,343,044 | 92,963,384 | 174,588,959 | 406,895,387 | ||||||||||||
|
|
|
|
|
|
|
|
|
|||||||||
3) Credit risk of loans and receivables
The credit exposure of loans and receivables by customer and loan condition are as follows (Unit: Korean Won in millions):
| January 1, 2010 | ||||||||||||||||||||
| Korean treasury and government agencies |
Banks | Corporates | Consumers | Total | ||||||||||||||||
| Loans neither overdue nor impaired |
7,267,401 | 10,545,119 | 105,464,755 | 85,484,256 | 208,761,531 | |||||||||||||||
| Loans overdue but not impaired |
312 | 1,779 | 501,421 | 1,350,863 | 1,854,375 | |||||||||||||||
| Impaired loans |
— | — | 3,699,477 | 604,451 | 4,303,928 | |||||||||||||||
|
|
|
|
|
|
|
|
|
|
|
|||||||||||
| Gross loans |
7,267,713 | 10,546,898 | 109,665,653 | 87,439,570 | 214,919,834 | |||||||||||||||
|
|
|
|
|
|
|
|
|
|
|
|||||||||||
| Provision for credit losses |
40,225 | 64,534 | 3,316,376 | 441,525 | 3,862,660 | |||||||||||||||
|
|
|
|
|
|
|
|
|
|
|
|||||||||||
| Total, net |
7,227,488 | 10,482,364 | 106,349,277 | 86,998,045 | 211,057,174 | |||||||||||||||
|
|
|
|
|
|
|
|
|
|
|
|||||||||||
| December 31, 2010 | ||||||||||||||||||||
| Korean treasury and government agencies |
Banks | Corporates | Consumers | Total | ||||||||||||||||
| Loans neither overdue nor impaired |
9,793,460 | 10,301,676 | 103,930,572 | 88,355,058 | 212,380,766 | |||||||||||||||
| Loans overdue but not impaired |
832 | 855 | 384,882 | 1,025,497 | 1,412,066 | |||||||||||||||
| Impaired loans |
89 | 1,083 | 7,206,665 | 708,550 | 7,916,387 | |||||||||||||||
|
|
|
|
|
|
|
|
|
|
|
|||||||||||
| Gross loans |
9,794,381 | 10,303,614 | 111,522,119 | 90,089,105 | 221,709,219 | |||||||||||||||
|
|
|
|
|
|
|
|
|
|
|
|||||||||||
| Provision for credit losses |
5,455 | 26,664 | 4,422,239 | 463,056 | 4,917,414 | |||||||||||||||
|
|
|
|
|
|
|
|
|
|
|
|||||||||||
| Total, net |
9,788,926 | 10,276,950 | 107,099,880 | 89,626,049 | 216,791,805 | |||||||||||||||
|
|
|
|
|
|
|
|
|
|
|
|||||||||||
F-37
Table of Contents
| December 31, 2011 | ||||||||||||||||||||
| Korean treasury and government agencies |
Banks | Corporates | Consumers | Total | ||||||||||||||||
| Loans neither overdue nor impaired |
13,765,038 | 12,934,452 | 108,973,068 | 96,548,782 | 232,221,340 | |||||||||||||||
| Loans overdue but not impaired |
325 | 3,493 | 200,488 | 1,273,662 | 1,477,968 | |||||||||||||||
| Impaired loans |
1 | 1,494 | 4,538,896 | 958,255 | 5,498,646 | |||||||||||||||
|
|
|
|
|
|
|
|
|
|
|
|||||||||||
| Gross loans |
13,765,364 | 12,939,439 | 113,712,452 | 98,780,699 | 239,197,954 | |||||||||||||||
|
|
|
|
|
|
|
|
|
|
|
|||||||||||
| Provision for credit losses |
3,770 | 18,109 | 3,507,709 | 508,410 | 4,037,998 | |||||||||||||||
|
|
|
|
|
|
|
|
|
|
|
|||||||||||
| Total, net |
13,761,594 | 12,921,330 | 110,204,743 | 98,272,289 | 235,159,956 | |||||||||||||||
|
|
|
|
|
|
|
|
|
|
|
|||||||||||
a) Credit quality of loans and receivables
The Group manages its loans and receivables, net of allowance that are not overdue nor impaired through an internal rating system. Segregation of credit quality is as follows (Unit: Korean Won in millions):
The amounts included below are net of the allowance which pertains to the loans included in this category.
| January 1, 2010 | ||||||||||||||||||||||||||||||||
| Corporates | ||||||||||||||||||||||||||||||||
| Korean treasury and government agencies |
Banks | General business |
Small medium sized enterprise |
Project financing |
Sub-total | Consumers | Total | |||||||||||||||||||||||||
| Investment grade |
7,226,841 | 10,479,962 | 37,093,410 | 5,432,474 | 3,871,344 | 46,397,228 | 77,484,038 | 141,588,069 | ||||||||||||||||||||||||
| Non-investment grade (*) |
336 | 693 | 25,528,950 | 22,589,537 | 9,275,553 | 57,394,040 | 8,020,048 | 65,415,117 | ||||||||||||||||||||||||
|
|
|
|
|
|
|
|
|
|
|
|
|
|
|
|
|
|||||||||||||||||
| Total |
7,227,177 | 10,480,655 | 62,622,360 | 28,022,011 | 13,146,897 | 103,791,268 | 85,504,086 | 207,003,186 | ||||||||||||||||||||||||
|
|
|
|
|
|
|
|
|
|
|
|
|
|
|
|
|
|||||||||||||||||
| Value of collateral |
36,500 | 273,989 | 24,535,698 | 22,889,309 | 3,259,232 | 50,684,239 | 66,398,675 | 117,393,403 | ||||||||||||||||||||||||
|
|
|
|
|
|
|
|
|
|
|
|
|
|
|
|
|
|||||||||||||||||
| December 31, 2010 | ||||||||||||||||||||||||||||||||
| Corporates | ||||||||||||||||||||||||||||||||
| Korean treasury and government agencies |
Banks | General business |
Small medium sized enterprise |
Project financing |
Sub-total | Consumers | Total | |||||||||||||||||||||||||
| Investment grade |
9,777,778 | 10,260,817 | 38,901,101 | 6,586,526 | 3,884,867 | 49,372,494 | 79,802,507 | 149,213,596 | ||||||||||||||||||||||||
| Non-investment grade (*) |
10,311 | 14,279 | 24,752,220 | 23,123,896 | 5,300,523 | 53,176,639 | 8,381,166 | 61,582,395 | ||||||||||||||||||||||||
|
|
|
|
|
|
|
|
|
|
|
|
|
|
|
|
|
|||||||||||||||||
| Total |
9,788,089 | 10,275,096 | 63,653,321 | 29,710,422 | 9,185,390 | 102,549,133 | 88,183,673 | 210,795,991 | ||||||||||||||||||||||||
|
|
|
|
|
|
|
|
|
|
|
|
|
|
|
|
|
|||||||||||||||||
| Value of collateral |
125 | 371,473 | 24,713,800 | 24,327,161 | 2,599,336 | 51,640,297 | 70,977,289 | 122,989,184 | ||||||||||||||||||||||||
|
|
|
|
|
|
|
|
|
|
|
|
|
|
|
|
|
|||||||||||||||||
F-38
Table of Contents
| December 31, 2011 | ||||||||||||||||||||||||||||||||
| Korean treasury and government agencies |
Banks | Corporates | Consumers | Total | ||||||||||||||||||||||||||||
| General business |
Small medium sized enterprise |
Project financing |
Sub-total | |||||||||||||||||||||||||||||
| Investment grade |
13,753,815 | 12,892,460 | 43,334,956 | 8,442,771 | 4,592,920 | 56,370,647 | 85,841,335 | 168,858,257 | ||||||||||||||||||||||||
| Non-investment grade (*) |
7,454 | 25,076 | 23,602,749 | 23,512,750 | 3,978,401 | 51,093,900 | 10,507,991 | 61,634,421 | ||||||||||||||||||||||||
|
|
|
|
|
|
|
|
|
|
|
|
|
|
|
|
|
|||||||||||||||||
| Total |
13,761,269 | 12,917,536 | 66,937,705 | 31,955,521 | 8,571,321 | 107,464,547 | 96,349,326 | 230,492,678 | ||||||||||||||||||||||||
|
|
|
|
|
|
|
|
|
|
|
|
|
|
|
|
|
|||||||||||||||||
| Value of collateral |
6,374 | 540,337 | 28,160,494 | 25,789,912 | 2,800,729 | 56,751,135 | 79,859,626 | 137,157,472 | ||||||||||||||||||||||||
|
|
|
|
|
|
|
|
|
|
|
|
|
|
|
|
|
|||||||||||||||||
| (*) | Below BBB- by internal credit rating |
b) Aging analysis of loans and receivables
Aging analysis of loans and receivables, net of provision overdue but not impaired is as follows (Unit: Korean Won in millions):
The amounts included below are net of the allowance which pertains to the loans included in this category.
| January 1, 2010 | ||||||||||||||||||||||||||||||||
| Past due |
Korean treasury and government agencies |
Banks | Corporates | Consumers | Total | |||||||||||||||||||||||||||
| General business |
Small medium sized enterprise |
Project financing |
Sub-total | |||||||||||||||||||||||||||||
| Less than 30 days |
311 | 1,709 | 152,859 | 80,514 | 25,679 | 259,052 | 953,268 | 1,214,340 | ||||||||||||||||||||||||
| 30 to 60 days |
— | — | 41,978 | 18,052 | — | 60,030 | 77,477 | 137,507 | ||||||||||||||||||||||||
| 60 to 90 days |
— | — | 21,640 | 8,724 | — | 30,364 | 52,610 | 82,974 | ||||||||||||||||||||||||
|
|
|
|
|
|
|
|
|
|
|
|
|
|
|
|
|
|||||||||||||||||
| Total |
311 | 1,709 | 216,477 | 107,290 | 25,679 | 349,446 | 1,083,355 | 1,434,821 | ||||||||||||||||||||||||
|
|
|
|
|
|
|
|
|
|
|
|
|
|
|
|
|
|||||||||||||||||
| Value of collateral (*) |
— | — | 49,433 | 82,577 | 27,190 | 159,200 | 734,027 | 893,227 | ||||||||||||||||||||||||
|
|
|
|
|
|
|
|
|
|
|
|
|
|
|
|
|
|||||||||||||||||
| December 31, 2010 | ||||||||||||||||||||||||||||||||
| Past due |
Korean treasury and government agencies |
Banks | Corporates | Consumers | Total | |||||||||||||||||||||||||||
| General business |
Small medium sized enterprise |
Project financing |
Sub-total | |||||||||||||||||||||||||||||
| Less than 30 days |
832 | 854 | 108,860 | 83,762 | 8,326 | 200,948 | 849,385 | 1,052,019 | ||||||||||||||||||||||||
| 30 to 60 days |
— | — | 61,583 | 33,742 | — | 95,325 | 77,660 | 172,985 | ||||||||||||||||||||||||
| 60 to 90 days |
— | — | 72,699 | 3,183 | — | 75,882 | 40,830 | 116,712 | ||||||||||||||||||||||||
|
|
|
|
|
|
|
|
|
|
|
|
|
|
|
|
|
|||||||||||||||||
| Total |
832 | 854 | 243,142 | 120,687 | 8,326 | 372,155 | 967,875 | 1,341,716 | ||||||||||||||||||||||||
|
|
|
|
|
|
|
|
|
|
|
|
|
|
|
|
|
|||||||||||||||||
| Value of collateral (*) |
— | — | 84,018 | 99,675 | — | 183,693 | 687,248 | 870,941 | ||||||||||||||||||||||||
|
|
|
|
|
|
|
|
|
|
|
|
|
|
|
|
|
|||||||||||||||||
F-39
Table of Contents
| December 31, 2011 | ||||||||||||||||||||||||||||||||
| Past due |
Korean treasury and government agencies |
Banks | Corporates | Consumers | Total | |||||||||||||||||||||||||||
| General business |
Small medium sized enterprise |
Project financing |
Sub-total | |||||||||||||||||||||||||||||
| Less than 30 days |
325 | 3,491 | 54,278 | 93,190 | 7,708 | 155,176 | 1,007,040 | 1,166,032 | ||||||||||||||||||||||||
| 30 to 60 days |
— | — | 4,964 | 21,707 | — | 26,671 | 115,415 | 142,086 | ||||||||||||||||||||||||
| 60 to 90 days |
— | — | 1,796 | 8,724 | — | 10,520 | 69,098 | 79,618 | ||||||||||||||||||||||||
|
|
|
|
|
|
|
|
|
|
|
|
|
|
|
|
|
|||||||||||||||||
| Total |
325 | 3,491 | 61,038 | 123,621 | 7,708 | 192,367 | 1,191,553 | 1,387,736 | ||||||||||||||||||||||||
|
|
|
|
|
|
|
|
|
|
|
|
|
|
|
|
|
|||||||||||||||||
| Value of collateral (*) |
— | — | 15,112 | 100,549 | — | 115,661 | 894,850 | 1,010,511 | ||||||||||||||||||||||||
|
|
|
|
|
|
|
|
|
|
|
|
|
|
|
|
|
|||||||||||||||||
| (*) | The value of collateral held is recoverable amounts used when calculating the respective provision for credit losses. |
c) Impaired loans and receivables
Impaired loans and receivables, net of provision is as follows (Unit: Korean Won in millions):
| January 1, 2010 | ||||||||||||||||||||||||||||||||
| Korean treasury and government agencies |
Banks | Corporates | Consumers | Total | ||||||||||||||||||||||||||||
| General business |
Small & medium sized enterprise |
Project financing |
Sub-total | |||||||||||||||||||||||||||||
| Impaired loans |
— | — | 1,662,848 | 377,700 | 168,015 | 2,208,563 | 410,604 | 2,619,167 | ||||||||||||||||||||||||
| Value of collateral (*) |
— | — | 760,569 | 422,917 | 35,103 | 1,218,589 | 208,375 | 1,426,964 | ||||||||||||||||||||||||
| December 31, 2010 | ||||||||||||||||||||||||||||||||
| Korean treasury and government agencies |
Banks | Corporates | Consumers | Total | ||||||||||||||||||||||||||||
| General business |
Small & medium sized enterprise |
Project financing |
Sub-total | |||||||||||||||||||||||||||||
| Impaired loans |
5 | 1,000 | 2,631,502 | 380,858 | 1,166,232 | 4,178,592 | 474,501 | 4,654,098 | ||||||||||||||||||||||||
| Value of collateral (*) |
— | 1,083 | 1,545,413 | 423,380 | 344,129 | 2,312,922 | 222,398 | 2,536,403 | ||||||||||||||||||||||||
| December 31, 2011 | ||||||||||||||||||||||||||||||||
| Korean treasury and government agencies |
Banks | Corporates | Consumers | Total | ||||||||||||||||||||||||||||
| General business |
Small & medium sized enterprise |
Project financing |
Sub-total | |||||||||||||||||||||||||||||
| Impaired loans |
— | 303 | 1,890,402 | 424,609 | 232,818 | 2,547,829 | 731,410 | 3,279,542 | ||||||||||||||||||||||||
| Value of collateral (*) |
— | — | 1,000,962 | 538,796 | 184,976 | 1,724,734 | 387,943 | 2,112,677 | ||||||||||||||||||||||||
| (*) | The collateral value held is recoverable amount used when calculating provision for credit losses. |
The collateral values are evaluated based on the appraisal value of external valuation experts, as adjusted for significant inputs related to the foreclosure proceeding for such collateral. Such adjustments mainly take into account (i) a collateral recognition factor, which reflects the average historical auction clearance rate for such type of collateral in the same region in Korea for the past year and adjustments based on changes that the Company anticipates to the value of the collateral as well as the anticipated costs with regard to foreclosure proceedings, (ii) a present value discount factor, to account for the time required to complete the foreclosure proceedings and (iii) the value of any liens and other security interests which are senior to those of the Company.
F-40
Table of Contents
The above-described adjustments to the appraisal value of collateral as determined by external valuation experts are made on a quarterly basis.
In addition, to validate the appropriateness of the appraisal values provided by external valuation experts, the Company reviews the qualification of the external valuation experts (including a review of whether such experts are legitimately registered with the Korea Association of Property Appraisers) and evaluates the assumptions and valuation model used by such experts as well as the appropriateness of variables by reference to market data and comparisons to actual transaction prices in similar regions.
4) Credit risk of debt securities
The Group manages debt securities based on the external credit rating. Credit soundness of debt securities on the basis of External Credit Assessment Institution (ECAI)’s rating is as follows (Unit: Korean Won in millions):
| January 1, 2010 | ||||||||||||||||||||
| Debt securities held for trading |
Designated at FVTPL |
AFS debt securities |
HTM securities |
Total | ||||||||||||||||
| AAA |
8,172,088 | — | 6,345,117 | 13,682,599 | 28,199,804 | |||||||||||||||
| AA- ~ AA+ |
7,450,873 | — | 776,489 | 1,286,298 | 9,513,660 | |||||||||||||||
| BBB- ~ A+ |
1,865,906 | 444,200 | 3,361,537 | 984,812 | 6,656,455 | |||||||||||||||
| Below BBB- |
47,723 | 30,155 | 2,050 | — | 79,928 | |||||||||||||||
| Default grade |
— | — | 1,868 | — | 1,868 | |||||||||||||||
|
|
|
|
|
|
|
|
|
|
|
|||||||||||
| Total |
17,536,590 | 474,355 | 10,487,061 | 15,953,709 | 44,451,715 | |||||||||||||||
|
|
|
|
|
|
|
|
|
|
|
|||||||||||
| December 31, 2010 | ||||||||||||||||||||
| Debt securities held for trading |
Designated at FVTPL |
AFS debt securities |
HTM securities |
Total | ||||||||||||||||
| AAA |
6,935,788 | — | 9,747,263 | 17,361,007 | 34,044,058 | |||||||||||||||
| AA- ~ AA+ |
6,675,258 | — | 833,402 | 940,913 | 8,449,573 | |||||||||||||||
| BBB- ~ A+ |
1,875,250 | 400,319 | 2,846,573 | 1,583,634 | 6,705,776 | |||||||||||||||
| Below BBB- |
86,688 | — | 45,674 | — | 132,362 | |||||||||||||||
| Default grade |
29,275 | — | 1,822 | 5 | 31,102 | |||||||||||||||
|
|
|
|
|
|
|
|
|
|
|
|||||||||||
| Total |
15,602,259 | 400,319 | 13,474,734 | 19,885,559 | 49,362,871 | |||||||||||||||
|
|
|
|
|
|
|
|
|
|
|
|||||||||||
| December 31, 2011 | ||||||||||||||||||||
| Debt securities held for trading |
Designated at FVTPL |
AFS debt securities |
HTM securities |
Total | ||||||||||||||||
| AAA |
11,631,283 | — | 10,105,669 | 17,910,287 | 39,647,239 | |||||||||||||||
| AA- ~ AA+ |
6,428,995 | — | 1,102,943 | 1,223,193 | 8,755,131 | |||||||||||||||
| BBB- ~ A+ |
748,023 | 408,810 | 1,723,995 | 902,648 | 3,783,476 | |||||||||||||||
| Below BBB- |
64,858 | 994 | 152,397 | — | 218,249 | |||||||||||||||
| Default grade |
— | — | 1,845 | — | 1,845 | |||||||||||||||
|
|
|
|
|
|
|
|
|
|
|
|||||||||||
| Total |
18,873,159 | 409,804 | 13,086,849 | 20,036,128 | 52,405,940 | |||||||||||||||
|
|
|
|
|
|
|
|
|
|
|
|||||||||||
(2) Market risk
Market risk is the possible risk of loss arising from trading activities in the volatility of market factors such as interest rates, stock prices and foreign exchange rates.
F-41
Table of Contents
Market risk occurs as a result of changes in the interest rates and foreign exchange rates for financial instruments that are not yet settled, and all contracts are exposed to a certain level of volatility according to changes in the interest rates, credit spreads, foreign exchange rates and the price of equity securities.
1) Market risk management
For trading activities, the Group avoids, bears or mitigates risks by identifying the underlying source of the risks, measuring parameters and evaluating their appropriateness.
At the beginning of each year, the Risk Management Committee establishes the VaR limit, loss limit and risk capital limit by subsidiaries for its management purposes. Limit by investment desk/dealer is independently managed to the extent of the limit given to subsidiaries and the limit by investment and loss cut is managed by risk management personnel with department.
The Group uses both a standard-based and an internal model-based approach to measure market risk. The standard-based approach is used to calculate individual market risk of owned capital while the internal model-based approach is used to calculate general capital market risk and it is used to measure internal risk management measure. The Risk Management department measures the Value at Risk (“VaR”, maximum losses) limit by department and risk factor and loss limit on a daily basis and reports regularly to the Risk Management Committee.
2) Sensitivity analysis of market risk
The Group performs the sensitivity analyses for both trading and non-trading activities. For the trading activities, the Group uses a VaR model which uses certain assumptions of possible fluctuations in market conditions and, by conducting simulations of gains and losses, estimates the maximum losses that may occur. A VaR model predicts based on statistics of possible losses on the portfolio at a certain period currently or in the future. It indicates the maximum expected loss with at least 99% credibility. In short, there exists a one percent possibility that the actual loss might exceed the predicted loss generated from the VaR’s calculation. The actual results are periodically monitored to examine the validity of the assumptions and variables and factors that are used in VaR’s calculations. However, this approach cannot prevent the loss when the market fluctuation exceeds expectation.
For the non-trading activities, interest rate Earning at Risk (“EaR”) and interest rate VaR, which is based on the simulations of the Net Interest Income (“NII”) and Net Present Value (“NPV”), are calculated for the Group’s bank subsidiaries such as Woori Bank, Kyongnam Bank and Kwangju Bank, and the risks for all other subsidiaries are measured and managed by the interest rate EaR and the interest rate VaR calculations based on a ‘Gap’ in interest rate per Bank for International Settlements (“BIS”) Framework. NII is a profit based indicator for displaying profit changes in short term due to the short term interest change. It will be estimated as subtracting interest expenses of liabilities from the interest income of assets. NPV is an indicator for displaying risks in economical view according to unfavorable changes related to interest rate. It will be estimated as subtracting the present value of liabilities from the present value of asset. EaR shows the maximum profit-loss amount, which indicates the maximum deduction amount caused by the unfavorable changes related to interest rate of a certain period of time. Interest rate VaR shows the potential maximum loss generated by the unfavorable changes during a certain period of time in the present or future.
F-42
Table of Contents
a) Trading activities
The minimum, maximum and average VaR for the years ended December 31, 2010 and 2011, respectively, and the VaR as of December 31, 2010 and 2011, respectively, are as follows (Unit: Korean Won in millions):
| As of December 31, 2010 |
For the year ended December 31, 2010 |
As of December 31, 2011 |
For the year ended December 31, 2011 |
|||||||||||||||||||||||||||||
| Average | Maximum | Minimum | Average | Maximum | Minimum | |||||||||||||||||||||||||||
| Interest rate |
(6,271 | ) | (15,563 | ) | (30,387 | ) | (5,284 | ) | (8,495 | ) | (8,733 | ) | (11,117 | ) | (5,967 | ) | ||||||||||||||||
| Stock price |
(4,793 | ) | (5,801 | ) | (17,913 | ) | (2,223 | ) | (6,329 | ) | (7,653 | ) | (11,486 | ) | (4,974 | ) | ||||||||||||||||
| Foreign currencies |
(2,541 | ) | (9,245 | ) | (26,912 | ) | (2,280 | ) | (3,227 | ) | (3,573 | ) | (7,151 | ) | (1,639 | ) | ||||||||||||||||
| Commodity price |
(81 | ) | (847 | ) | (2,760 | ) | (11 | ) | (3 | ) | (333 | ) | (3,070 | ) | (2 | ) | ||||||||||||||||
|
|
|
|
|
|
|
|
|
|
|
|
|
|
|
|
|
|||||||||||||||||
| Total |
(7,358 | ) | (11,050 | ) | (28,057 | ) | (5,498 | ) | (10,682 | ) | (11,330 | ) | (14,675 | ) | (8,053 | ) | ||||||||||||||||
|
|
|
|
|
|
|
|
|
|
|
|
|
|
|
|
|
|||||||||||||||||
b) Non-trading activities
The NII and NPV calculated, respectively, by using the simulation method for Woori Bank, Kyongnam Bank and Kwangju Bank and the scenario responding to interest rate (“IR”) changes are as follows (Unit: Korean Won in millions):
| January 1, 2010 | December 31, 2010 | December 31, 2011 | ||||||||||||||||||||||
| NII | NPV | NII | NPV | NII | NPV | |||||||||||||||||||
| Base case |
5,676,827 | 11,101,946 | 5,743,961 | 16,313,595 | 5,943,993 | 13,262,235 | ||||||||||||||||||
| Base case (Prepay) |
5,683,689 | 11,153,933 | 5,742,015 | 16,365,853 | 5,949,816 | 13,148,172 | ||||||||||||||||||
| IR 100bp up |
6,045,429 | 11,853,466 | 6,046,107 | 16,893,648 | 6,230,290 | 13,375,487 | ||||||||||||||||||
| IR 100bp down |
5,295,204 | 10,293,927 | 5,410,688 | 15,684,312 | 5,614,039 | 13,172,038 | ||||||||||||||||||
| IR 200bp up |
6,415,204 | 12,557,878 | 6,348,345 | 17,433,773 | 6,516,351 | 13,507,906 | ||||||||||||||||||
| IR 200bp down |
4,805,768 | 9,419,893 | 4,979,079 | 14,994,678 | 5,193,395 | 13,109,481 | ||||||||||||||||||
| IR 300bp up |
6,784,635 | 13,221,647 | 6,650,581 | 17,940,734 | 6,802,411 | 13,655,892 | ||||||||||||||||||
| IR 300bp down |
4,037,279 | 8,454,812 | 4,312,328 | 14,230,650 | 4,671,343 | 13,082,383 | ||||||||||||||||||
The EaR and VaR calculated, respectively, based on the BIS Framework of the Company and subsidiaries excluding Woori Bank, Kyongnam Bank, and Kwangju Bank are as follows (Unit: Korean Won in millions):
| January 1, 2010 |
December 31, 2010 | December 31, 2011 | ||||||||||||||||||
| EaR |
VaR | EaR | VaR | EaR | VaR | |||||||||||||||
| (68,191) |
(66,909 | ) | (111,686 | ) | (66,633 | ) | (39,458 | ) | (66,885 | ) | ||||||||||
F-43
Table of Contents
3) Other market risk
a) Interest rate risk
The Group estimates and manages risks related to changes in interest rate due to the difference in the sensitivity of interest-yielding assets and the sensitivity of liabilities. Cash flows of principal amounts and interests from interest bearing assets and liabilities by maturity date are as follows (Unit: Korean Won in millions):
| January 1, 2010 | ||||||||||||||||||||||||||||
| Total | Within 3months | 3 to 6months | 6 to 9months | 9 to 12months | 1 to 5years | 5years~ | ||||||||||||||||||||||
| Asset: |
||||||||||||||||||||||||||||
| Loans and receivables |
212,485,283 | 176,646,429 | 14,048,916 | 4,441,001 | 3,917,459 | 10,944,892 | 2,486,586 | |||||||||||||||||||||
| AFS financial assets |
10,558,099 | 1,178,340 | 1,207,069 | 953,246 | 1,256,213 | 5,457,173 | 506,058 | |||||||||||||||||||||
| HTM financial assets |
16,492,824 | 3,508,333 | 1,579,159 | 964,158 | 2,557,534 | 7,766,716 | 116,924 | |||||||||||||||||||||
|
|
|
|
|
|
|
|
|
|
|
|
|
|
|
|||||||||||||||
| Total |
239,536,206 | 181,333,102 | 16,835,144 | 6,358,405 | 7,731,206 | 24,168,781 | 3,109,568 | |||||||||||||||||||||
|
|
|
|
|
|
|
|
|
|
|
|
|
|
|
|||||||||||||||
| Liability: |
||||||||||||||||||||||||||||
| Deposits due to customers |
178,170,747 | 103,365,116 | 19,578,709 | 16,859,122 | 17,307,906 | 20,749,385 | 310,509 | |||||||||||||||||||||
| Borrowings |
31,948,998 | 20,709,406 | 2,928,297 | 896,962 | 1,191,002 | 5,097,944 | 1,125,387 | |||||||||||||||||||||
| Debentures |
34,900,494 | 4,272,523 | 3,738,108 | 3,436,751 | 4,108,063 | 16,567,802 | 2,777,247 | |||||||||||||||||||||
|
|
|
|
|
|
|
|
|
|
|
|
|
|
|
|||||||||||||||
| Total |
245,020,239 | 128,347,045 | 26,245,114 | 21,192,835 | 22,606,971 | 42,415,131 | 4,213,143 | |||||||||||||||||||||
|
|
|
|
|
|
|
|
|
|
|
|
|
|
|
|||||||||||||||
| December 31, 2010 | ||||||||||||||||||||||||||||
| Total | Within 3months | 3 to 6months | 6 to 9months | 9 to 12months | 1 to 5years | 5years~ | ||||||||||||||||||||||
| Asset: |
||||||||||||||||||||||||||||
| Loans and receivables |
204,945,763 | 165,888,703 | 19,418,027 | 3,979,820 | 4,427,612 | 9,930,547 | 1,301,054 | |||||||||||||||||||||
| AFS financial assets |
14,271,003 | 1,764,151 | 2,504,690 | 910,212 | 3,048,539 | 5,532,238 | 511,173 | |||||||||||||||||||||
| HTM financial assets |
20,678,032 | 3,996,469 | 416,337 | 1,131,782 | 2,254,476 | 12,756,208 | 122,760 | |||||||||||||||||||||
|
|
|
|
|
|
|
|
|
|
|
|
|
|
|
|||||||||||||||
| Total |
239,894,798 | 171,649,323 | 22,339,054 | 6,021,814 | 9,730,627 | 28,218,993 | 1,934,987 | |||||||||||||||||||||
|
|
|
|
|
|
|
|
|
|
|
|
|
|
|
|||||||||||||||
| Liability: |
||||||||||||||||||||||||||||
| Deposits due to customers |
187,050,714 | 102,544,787 | 23,532,257 | 20,187,179 | 17,483,099 | 23,035,383 | 268,009 | |||||||||||||||||||||
| Borrowings |
33,030,083 | 20,651,805 | 4,234,846 | 899,601 | 1,618,625 | 4,517,763 | 1,107,443 | |||||||||||||||||||||
| Debentures |
32,850,399 | 7,512,408 | 1,537,338 | 1,265,103 | 2,185,883 | 16,508,223 | 3,841,444 | |||||||||||||||||||||
|
|
|
|
|
|
|
|
|
|
|
|
|
|
|
|||||||||||||||
| Total |
252,931,196 | 130,709,000 | 29,304,441 | 22,351,883 | 21,287,607 | 44,061,369 | 5,216,896 | |||||||||||||||||||||
|
|
|
|
|
|
|
|
|
|
|
|
|
|
|
|||||||||||||||
F-44
Table of Contents
| December 31, 2011 | ||||||||||||||||||||||||||||
| Total | Within 3months | 3 to 6months | 6 to 9months | 9 to 12months | 1 to 5years | 5years~ | ||||||||||||||||||||||
| Asset: |
||||||||||||||||||||||||||||
| Loans and receivables |
221,489,544 | 162,935,497 | 28,109,587 | 5,347,251 | 6,011,847 | 12,292,132 | 6,793,230 | |||||||||||||||||||||
| AFS financial assets |
16,997,594 | 2,687,482 | 1,715,632 | 2,253,811 | 3,153,123 | 6,703,353 | 484,193 | |||||||||||||||||||||
| HTM financial assets |
21,548,196 | 4,079,416 | 2,843,038 | 1,346,271 | 1,308,890 | 11,815,271 | 155,310 | |||||||||||||||||||||
|
|
|
|
|
|
|
|
|
|
|
|
|
|
|
|||||||||||||||
| Total |
260,035,334 | 169,702,395 | 32,668,257 | 8,947,333 | 10,473,860 | 30,810,756 | 7,432,733 | |||||||||||||||||||||
|
|
|
|
|
|
|
|
|
|
|
|
|
|
|
|||||||||||||||
| Liability: |
||||||||||||||||||||||||||||
| Deposits due to customers |
198,793,984 | 106,191,712 | 26,938,477 | 20,810,689 | 19,487,233 | 25,088,248 | 277,625 | |||||||||||||||||||||
| Borrowings |
34,941,240 | 22,496,224 | 3,744,346 | 955,878 | 2,702,381 | 3,889,306 | 1,153,105 | |||||||||||||||||||||
| Debentures |
30,960,193 | 5,406,008 | 1,888,020 | 1,532,052 | 2,601,066 | 17,650,244 | 1,882,803 | |||||||||||||||||||||
|
|
|
|
|
|
|
|
|
|
|
|
|
|
|
|||||||||||||||
| Total |
264,695,417 | 134,093,944 | 32,570,843 | 23,298,619 | 24,790,680 | 46,627,798 | 3,313,533 | |||||||||||||||||||||
|
|
|
|
|
|
|
|
|
|
|
|
|
|
|
|||||||||||||||
b) Currency risk
Currency risk arises from monetary financial instruments denominated in foreign currencies other than the functional currency. Therefore, no currency risk arises from non-monetary items or financial instruments denominated in the functional currency.
Financial instruments in foreign currencies exposed to currency risk are as follows (Unit: USD in millions, JPY in millions, CNY in millions, EUR in millions, and Korean Won in millions):
| January 1, 2010 | ||||||||||||||||||||||||||||||||||||||||
| USD | JPY | CNY | EUR | Others | Total | |||||||||||||||||||||||||||||||||||
| Foreign currency |
Won equivalent |
Foreign currency |
Won equivalent |
Foreign currency equivalent |
Won equivalent |
Foreign currency |
Won equivalent |
Won equivalent |
Won equivalent |
|||||||||||||||||||||||||||||||
| Asset: |
||||||||||||||||||||||||||||||||||||||||
| Loans and |
||||||||||||||||||||||||||||||||||||||||
| receivables |
20,831 | 20,018,975 | 348,456 | 4,400,377 | 77 | 13,239 | 896 | 1,500,264 | 2,381,909 | 28,314,764 | ||||||||||||||||||||||||||||||
| Financial assets at FVTPL |
411 | 480,383 | 303 | 3,820 | — | — | 1 | 1,810 | — | 486,013 | ||||||||||||||||||||||||||||||
| AFS financial assets |
545 | 635,849 | 4,690 | 59,225 | — | — | 58 | 97,648 | 41,620 | 834,342 | ||||||||||||||||||||||||||||||
| HTM financial assets |
66 | 77,455 | — | — | — | — | — | — | 120,224 | 197,679 | ||||||||||||||||||||||||||||||
|
|
|
|
|
|
|
|
|
|
|
|
|
|
|
|
|
|
|
|
|
|||||||||||||||||||||
| Total |
21,853 | 21,212,662 | 353,449 | 4,463,422 | 77 | 13,239 | 955 | 1,599,722 | 2,543,753 | 29,832,798 | ||||||||||||||||||||||||||||||
|
|
|
|
|
|
|
|
|
|
|
|
|
|
|
|
|
|
|
|
|
|||||||||||||||||||||
| Liability: |
||||||||||||||||||||||||||||||||||||||||
| Financial liabilities at FVTPL |
1,928 | 2,251,292 | 1,249 | 15,775 | — | — | 2 | 3,870 | — | 2,270,937 | ||||||||||||||||||||||||||||||
| Deposits due to customer |
6,493 | 7,581,261 | 56,318 | 711,189 | 2 | 339 | 357 | 597,229 | 1,215,965 | 10,105,983 | ||||||||||||||||||||||||||||||
| Borrowings |
8,117 | 9,476,958 | 92,487 | 1,167,940 | — | — | 206 | 344,256 | 276,376 | 11,265,530 | ||||||||||||||||||||||||||||||
| Debentures |
3,038 | 3,547,047 | 10,000 | 126,282 | — | — | 300 | 502,284 | 180,628 | 4,356,241 | ||||||||||||||||||||||||||||||
| Other financial liabilities |
903 | 1,054,872 | 4,198 | 53,015 | — | — | 76 | 126,926 | 69,873 | 1,304,686 | ||||||||||||||||||||||||||||||
|
|
|
|
|
|
|
|
|
|
|
|
|
|
|
|
|
|
|
|
|
|||||||||||||||||||||
| Total |
20,479 | 23,911,430 | 164,252 | 2,074,201 | 2 | 339 | 941 | 1,574,565 | 1,742,842 | 29,303,377 | ||||||||||||||||||||||||||||||
|
|
|
|
|
|
|
|
|
|
|
|
|
|
|
|
|
|
|
|
|
|||||||||||||||||||||
| Off-balance sheet items |
11,951 | 13,953,830 | 45,612 | 575,999 | — | — | 843 | 1,411,532 | 623,994 | 16,565,355 | ||||||||||||||||||||||||||||||
|
|
|
|
|
|
|
|
|
|
|
|
|
|
|
|
|
|
|
|
|
|||||||||||||||||||||
F-45
Table of Contents
| December 31, 2010 | ||||||||||||||||||||||||||||||||||||||||
| USD | JPY | CNY | EUR | Others | Total | |||||||||||||||||||||||||||||||||||
| Foreign currency |
Won equivalent |
Foreign currency |
Won equivalent |
Foreign currency |
Won equivalent |
Foreign currency |
Won equivalent |
Won equivalent |
Won equivalent |
|||||||||||||||||||||||||||||||
| Asset: |
||||||||||||||||||||||||||||||||||||||||
| Loans and receivables |
16,617 | 18,924,779 | 339,844 | 4,747,892 | 9,563 | 1,649,546 | 958 | 1,450,281 | 1,792,380 | 28,564,878 | ||||||||||||||||||||||||||||||
| Financial assets at FVTPL |
780 | 887,785 | 403 | 5,629 | 295 | 50,832 | — | 322 | 2,016 | 946,584 | ||||||||||||||||||||||||||||||
| AFS financial assets |
302 | 353,280 | 2,030 | 22,456 | 90 | 15,551 | 13 | 22,059 | 49,172 | 462,518 | ||||||||||||||||||||||||||||||
| HTM financial assets |
26 | 29,612 | — | — | — | — | — | — | 113,925 | 143,537 | ||||||||||||||||||||||||||||||
|
|
|
|
|
|
|
|
|
|
|
|
|
|
|
|
|
|
|
|
|
|||||||||||||||||||||
| Total |
17,725 | 20,195,456 | 342,277 | 4,775,977 | 9,948 | 1,715,929 | 971 | 1,472,662 | 1,957,493 | 30,117,517 | ||||||||||||||||||||||||||||||
|
|
|
|
|
|
|
|
|
|
|
|
|
|
|
|
|
|
|
|
|
|||||||||||||||||||||
| Liability: |
||||||||||||||||||||||||||||||||||||||||
| Financial liabilities at FVTPL |
1,518 | 1,726,729 | 1,732 | 24,195 | — | — | 1 | 1,024 | — | 1,751,948 | ||||||||||||||||||||||||||||||
| Deposits due to customer |
5,449 | 6,205,524 | 46,070 | 643,630 | 7,203 | 1,242,431 | 162 | 244,678 | 461,449 | 8,797,712 | ||||||||||||||||||||||||||||||
| Borrowings |
6,814 | 7,759,779 | 184,671 | 2,580,000 | 972 | 167,680 | 723 | 1,094,644 | 403,342 | 12,005,445 | ||||||||||||||||||||||||||||||
| Debentures |
3,556 | 4,050,173 | 10,000 | 139,708 | — | — | — | — | 258,545 | 4,448,426 | ||||||||||||||||||||||||||||||
| Other financial liabilities |
908 | 1,033,649 | 11,418 | 159,521 | 122 | 21,066 | 29 | 43,868 | 38,779 | 1,296,883 | ||||||||||||||||||||||||||||||
|
|
|
|
|
|
|
|
|
|
|
|
|
|
|
|
|
|
|
|
|
|||||||||||||||||||||
| Total |
18,245 | 20,775,854 | 253,891 | 3,547,054 | 8,297 | 1,431,177 | 915 | 1,384,214 | 1,162,115 | 28,300,414 | ||||||||||||||||||||||||||||||
|
|
|
|
|
|
|
|
|
|
|
|
|
|
|
|
|
|
|
|
|
|||||||||||||||||||||
| Off-balance sheet items |
11,823 | 13,465,290 | 37,580 | 525,025 | 506 | 87,291 | 730 | 1,105,112 | 564,621 | 15,747,339 | ||||||||||||||||||||||||||||||
|
|
|
|
|
|
|
|
|
|
|
|
|
|
|
|
|
|
|
|
|
|||||||||||||||||||||
| December 31, 2011 | ||||||||||||||||||||||||||||||||||||||||
| USD | JPY | CNY | EUR | Others | Total | |||||||||||||||||||||||||||||||||||
| Foreign currency |
Won equivalent |
Foreign currency |
Won equivalent |
Foreign currency |
Won equivalent |
Foreign currency |
Won equivalent |
Won equivalent |
Won equivalent |
|||||||||||||||||||||||||||||||
| Asset: |
||||||||||||||||||||||||||||||||||||||||
| Loans and receivables |
21,140 | 24,380,962 | 340,442 | 5,056,106 | 9,809 | 1,790,168 | 883 | 1,319,120 | 2,202,903 | 34,749,259 | ||||||||||||||||||||||||||||||
| Financial assets at FVTPL |
694 | 800,019 | 1,238 | 18,389 | 208 | 37,871 | 1 | 1,375 | 568 | 858,222 | ||||||||||||||||||||||||||||||
| AFS financial assets |
177 | 204,029 | 1,102 | 16,362 | 186 | 33,937 | 15 | 22,050 | 36,148 | 312,526 | ||||||||||||||||||||||||||||||
| HTM financial assets |
21 | 23,867 | — | — | 10 | 1,812 | — | — | 77,283 | 102,962 | ||||||||||||||||||||||||||||||
|
|
|
|
|
|
|
|
|
|
|
|
|
|
|
|
|
|
|
|
|
|||||||||||||||||||||
| Total |
22,032 | 25,408,877 | 342,782 | 5,090,857 | 10,213 | 1,863,788 | 899 | 1,342,545 | 2,316,902 | 36,022,969 | ||||||||||||||||||||||||||||||
|
|
|
|
|
|
|
|
|
|
|
|
|
|
|
|
|
|
|
|
|
|||||||||||||||||||||
| Liability: |
||||||||||||||||||||||||||||||||||||||||
| Financial liabilities at FVTPL |
425 | 489,613 | 1,766 | 26,225 | — | — | 2 | 2,667 | — | 518,505 | ||||||||||||||||||||||||||||||
| Deposits due to customer |
6,341 | 7,315,781 | 63,427 | 942,003 | 8,790 | 1,604,293 | 230 | 344,227 | 508,233 | 10,714,537 | ||||||||||||||||||||||||||||||
| Borrowings |
8,452 | 9,748,919 | 199,649 | 2,965,102 | 4 | 766 | 859 | 1,283,618 | 344,566 | 14,342,971 | ||||||||||||||||||||||||||||||
| Debentures |
3,809 | 4,392,959 | 50,019 | 742,856 | — | — | — | — | 274,503 | 5,410,318 | ||||||||||||||||||||||||||||||
| Other financial liabilities |
2,553 | 2,944,212 | 25,010 | 371,451 | 128 | 23,428 | 372 | 555,366 | 200,691 | 4,095,148 | ||||||||||||||||||||||||||||||
|
|
|
|
|
|
|
|
|
|
|
|
|
|
|
|
|
|
|
|
|
|||||||||||||||||||||
| Total |
21,580 | 24,891,484 | 339,871 | 5,047,637 | 8,922 | 1,628,487 | 1,463 | 2,185,878 | 1,327,993 | 35,081,479 | ||||||||||||||||||||||||||||||
|
|
|
|
|
|
|
|
|
|
|
|
|
|
|
|
|
|
|
|
|
|||||||||||||||||||||
| Off-balance sheet items |
12,345 | 14,237,934 | 35,466 | 526,720 | 123 | 22,451 | 703 | 1,050,120 | 601,735 | 16,438,960 | ||||||||||||||||||||||||||||||
|
|
|
|
|
|
|
|
|
|
|
|
|
|
|
|
|
|
|
|
|
|||||||||||||||||||||
F-46
Table of Contents
| (3) | Liquidity risk |
Liquidity risk refers to the risk that the Group may encounter difficulties in meeting obligations from its financial liabilities.
1) Liquidity risk management
Liquidity risk management is to prevent potential cash shortage as a result of mismatching the use of funds (assets) and sources of funds (liabilities) or unexpected cash outflows. Of the financial liabilities on the consolidated statements of financial position, financial liabilities in relation to liquidity risk become the objects of liquidity risk management. Derivatives are excluded from those financial liabilities as they reflect expected cash flows for a pre-determined period.
Assets and liabilities are grouped by account under Asset Liability Management (“ALM”) in accordance with the characteristics of the account. The Group manages liquidity risk by identifying the maturity gap and such gap ratio through various cash flows analysis (i.e. based on remaining maturity and contract period, etc.); while maintaining the gap ratio at or below the target limit.
2) Maturity analysis of non-derivative financial liabilities
| a) | The Group’s maturity analysis of non-derivative financial liabilities, cash flows of principals and interests, by remaining contractual maturities are as follows (Unit: Korean Won in millions): |
| January 1, 2010 | ||||||||||||||||||||||||||||
| Total | Within 3months | 3 to 6 months | 6 to 9 months | 9 to 12 months | 1 to 5years | 5years~ | ||||||||||||||||||||||
| Financial liabilities at FVTPL |
6,133,108 | 776,089 | 173,002 | 276,484 | 538,655 | 2,572,404 | 1,796,474 | |||||||||||||||||||||
| Deposits due to customers |
180,760,608 | 96,548,595 | 16,469,752 | 17,138,033 | 42,233,441 | 6,739,218 | 1,631,569 | |||||||||||||||||||||
| Borrowings |
32,583,374 | 18,539,630 | 3,786,135 | 1,530,669 | 1,486,384 | 6,121,679 | 1,118,877 | |||||||||||||||||||||
| Debentures |
34,027,928 | 2,656,131 | 3,906,549 | 3,390,199 | 4,670,466 | 16,798,487 | 2,606,096 | |||||||||||||||||||||
| Other financial liabilities |
8,989,724 | 5,224,524 | 1,600 | 58,880 | 131,931 | 20,833 | 3,551,956 | |||||||||||||||||||||
|
|
|
|
|
|
|
|
|
|
|
|
|
|
|
|||||||||||||||
| Total |
262,494,742 | 123,744,969 | 24,337,038 | 22,394,265 | 49,060,877 | 32,252,621 | 10,704,972 | |||||||||||||||||||||
|
|
|
|
|
|
|
|
|
|
|
|
|
|
|
|||||||||||||||
| December 31, 2010 | ||||||||||||||||||||||||||||
| Total | Within 3 months | 3 to 6 months | 6 to 9 months | 9 to 12 months | 1 to 5 Years | 5 years~ | ||||||||||||||||||||||
| Financial liabilities at FVTPL |
5,601,771 | 1,012,285 | 153,065 | 179,205 | 475,435 | 2,375,678 | 1,406,103 | |||||||||||||||||||||
| Deposits due to customers |
189,373,350 | 105,659,685 | 19,538,361 | 18,293,470 | 37,080,839 | 7,085,608 | 1,715,387 | |||||||||||||||||||||
| Borrowings |
33,732,584 | 18,683,626 | 5,065,748 | 1,243,096 | 2,244,996 | 5,359,782 | 1,135,336 | |||||||||||||||||||||
| Debentures |
37,147,015 | 1,312,953 | 2,068,180 | 2,359,493 | 3,011,895 | 21,230,118 | 7,164,376 | |||||||||||||||||||||
| Other financial liabilities |
9,414,530 | 5,979,160 | 28,803 | 9,210 | 117,514 | 97,222 | 3,182,621 | |||||||||||||||||||||
|
|
|
|
|
|
|
|
|
|
|
|
|
|
|
|||||||||||||||
| Total |
275,269,250 | 132,647,709 | 26,854,157 | 22,084,474 | 42,930,679 | 36,148,408 | 14,603,823 | |||||||||||||||||||||
|
|
|
|
|
|
|
|
|
|
|
|
|
|
|
|||||||||||||||
F-47
Table of Contents
| December 31, 2011 | ||||||||||||||||||||||||||||
| Total | Within 3 months | 3 to 6 months | 6 to 9 months | 9 to 12 months | 1 to 5 years | 5 years~ | ||||||||||||||||||||||
| Financial liabilities at FVTPL |
5,780,042 | 1,057,626 | 184,647 | 260,209 | 362,821 | 3,670,422 | 244,317 | |||||||||||||||||||||
| Deposits due to customers |
202,643,808 | 115,656,618 | 22,510,097 | 18,361,302 | 38,515,144 | 5,976,081 | 1,624,566 | |||||||||||||||||||||
| Borrowings |
35,831,760 | 20,687,439 | 4,406,057 | 1,655,742 | 3,169,074 | 4,763,273 | 1,150,175 | |||||||||||||||||||||
| Debentures |
33,791,328 | 4,106,984 | 2,119,383 | 1,696,919 | 3,001,881 | 20,353,520 | 2,512,641 | |||||||||||||||||||||
| Other financial liabilities |
17,363,140 | 12,324,772 | 36,849 | 9,660 | 152,196 | 218,050 | 4,621,613 | |||||||||||||||||||||
|
|
|
|
|
|
|
|
|
|
|
|
|
|
|
|||||||||||||||
| Total |
295,410,078 | 153,833,439 | 29,257,033 | 21,983,832 | 45,201,116 | 34,981,346 | 10,153,312 | |||||||||||||||||||||
|
|
|
|
|
|
|
|
|
|
|
|
|
|
|
|||||||||||||||
| b) | Cash flows of principals and interests by expected maturities of non-derivative financial liabilities are as follows (Unit: Korean Won in millions): |
| January 1, 2010 | ||||||||||||||||||||||||||||
| Total | Within 3 months | 3 to 6 months | 6 to 9 months | 9 to 12 months | 1 to 5 years | 5 years~ | ||||||||||||||||||||||
| Financial liabilities at FVTPL |
6,133,108 | 776,089 | 173,002 | 276,484 | 538,655 | 2,572,404 | 1,796,474 | |||||||||||||||||||||
| Deposits due to customers |
179,961,542 | 118,835,371 | 21,916,044 | 15,347,620 | 17,738,778 | 4,836,354 | 1,287,375 | |||||||||||||||||||||
| Borrowings |
32,413,389 | 18,525,160 | 3,773,559 | 1,458,429 | 1,471,362 | 6,066,001 | 1,118,878 | |||||||||||||||||||||
| Debentures |
34,027,928 | 2,656,131 | 3,906,549 | 3,390,199 | 4,670,466 | 16,798,487 | 2,606,096 | |||||||||||||||||||||
| Other financial liabilities |
8,989,724 | 5,224,524 | 1,600 | 58,880 | 131,931 | 20,833 | 3,551,956 | |||||||||||||||||||||
|
|
|
|
|
|
|
|
|
|
|
|
|
|
|
|||||||||||||||
| Total |
261,525,691 | 146,017,275 | 29,770,754 | 20,531,612 | 24,551,192 | 30,294,079 | 10,360,779 | |||||||||||||||||||||
|
|
|
|
|
|
|
|
|
|
|
|
|
|
|
|||||||||||||||
| December 31, 2010 | ||||||||||||||||||||||||||||
| Total | Within 3 months | 3 to 6 months | 6 to 9 months | 9 to 12 months | 1 to 5 years | 5 years~ | ||||||||||||||||||||||
| Financial liabilities at FVTPL |
5,601,771 | 1,012,285 | 153,065 | 179,205 | 475,435 | 2,375,678 | 1,406,103 | |||||||||||||||||||||
| Deposits due to customers |
188,587,551 | 125,842,026 | 24,530,668 | 16,050,694 | 15,648,629 | 5,234,593 | 1,280,941 | |||||||||||||||||||||
| Borrowings |
33,584,733 | 18,671,541 | 5,053,562 | 1,164,226 | 2,235,945 | 5,324,123 | 1,135,336 | |||||||||||||||||||||
| Debentures |
37,147,015 | 1,312,953 | 2,068,180 | 2,359,493 | 3,011,895 | 21,230,118 | 7,164,376 | |||||||||||||||||||||
| Other financial liabilities |
9,414,530 | 5,979,160 | 28,803 | 9,210 | 117,514 | 97,222 | 3,182,621 | |||||||||||||||||||||
|
|
|
|
|
|
|
|
|
|
|
|
|
|
|
|||||||||||||||
| Total |
274,335,600 | 152,817,965 | 31,834,278 | 19,762,828 | 21,489,418 | 34,261,734 | 14,169,377 | |||||||||||||||||||||
|
|
|
|
|
|
|
|
|
|
|
|
|
|
|
|||||||||||||||
| December 31, 2011 | ||||||||||||||||||||||||||||
| Total | Within 3 months | 3 to 6 months | 6 to 9 months | 9 to 12 months | 1 to 5 years | 5 years~ | ||||||||||||||||||||||
| Financial liabilities at FVTPL |
5,764,297 | 1,031,980 | 185,473 | 261,487 | 363,446 | 3,670,422 | 251,489 | |||||||||||||||||||||
| Deposits due to customers |
201,858,224 | 127,915,964 | 27,364,643 | 18,757,322 | 21,595,623 | 5,034,209 | 1,190,463 | |||||||||||||||||||||
| Borrowings |
35,638,296 | 20,675,874 | 4,383,826 | 1,554,955 | 3,158,728 | 4,714,738 | 1,150,175 | |||||||||||||||||||||
| Debentures |
33,791,328 | 4,106,984 | 2,119,383 | 1,696,919 | 3,001,881 | 20,353,520 | 2,512,641 | |||||||||||||||||||||
| Other financial liabilities |
17,362,282 | 12,323,913 | 36,849 | 9,660 | 152,195 | 218,050 | 4,621,615 | |||||||||||||||||||||
|
|
|
|
|
|
|
|
|
|
|
|
|
|
|
|||||||||||||||
| Total |
294,414,427 | 166,054,715 | 34,090,174 | 22,280,343 | 28,271,873 | 33,990,939 | 9,726,383 | |||||||||||||||||||||
|
|
|
|
|
|
|
|
|
|
|
|
|
|
|
|||||||||||||||
F-48
Table of Contents
3) Maturity analysis of derivative financial liabilities is as follows (Unit: Korean Won in millions):
| Total due | Within 3 months | 3 to 6 months | 6 to 9 months | 9 to 12 months | 1 to 5 years | 5 years~ | ||||||||||||||||||||||
| January 1, 2010 |
5,099,007 | 4,292,579 | 56,124 | 68,567 | 26,778 | 596,882 | 58,077 | |||||||||||||||||||||
| December 31, 2010 |
3,913,629 | 3,432,048 | 35,127 | 43,438 | 19,032 | 341,830 | 42,154 | |||||||||||||||||||||
| December 31, 2011 |
4,142,140 | 3,353,984 | 37,133 | 28,800 | 43,648 | 645,063 | 33,512 | |||||||||||||||||||||
4) Maturity analysis of off-balance accounts are as follows (Unit: Korean Won in millions):
The Group gives guarantees on behalf of customers. A financial guarantee represents an irrevocable undertaking that the Group will meet a customer’s obligations to third parties if the customer fails to do so. Under a loan commitment the Group agrees to make funds available to a customer in the future. Loan commitments which are usually for a specified term may be unconditionally cancellable or may persist, provided all conditions in the loan facility are satisfied or waived. Commitments to lend include commercial standby facilities and credit lines, liquidity facilities to commercial paper conduits and utilized overdraft facilities. Guarantees and loan commitments have expiration dates. However, under the term of the guarantees and loan commitments, amounts are funded upon demand by the counterparty. Details of off-balance accounts are as follows (Unit: Korea Won in millions):
| January 1, 2010 | December 31, 2010 | December 31, 2011 | ||||||||||
| Guarantees |
26,134,163 | 25,008,780 | 26,702,154 | |||||||||
| Loan commitments |
77,333,904 | 82,941,133 | 88,400,600 | |||||||||
The maturity of guarantees or loan commitments disclosed in the maturity analysis of off-balance accounts would be drawn down within 3 months which is the earliest date loan commitments can be drawn down or guarantees would be called.
| (4) | Capital management |
In accordance with financial holding company regulations, the Group is required to maintain a minimum 8% of the capital adequacy ratio with high capital risk. The capital adequacy ratio must correspond to the standard of own capital regulation of BIS and is calculated by dividing own capital by asset (weighted with a risk premium—risk weighted assets) based on the financial statements of a holding company which owns bank as its subsidiary (the “bank holding company”) and its subsidiaries.
The own capital consists of basic capital and supplement capital. Goodwill and others which have only few characteristics as capital under the purposes of capital management are deducted from basic capital or own capital. The basic capital consists of capital, capital surplus, and retained earnings; while the supplement capital includes liabilities which meet regulatory requirements.
The risk weighted assets consist of credit risk weighted and market risk weighted assets. The credit risk weighted assets are calculated by multiplying risk weighted value which is given by credit level of other party on transaction, maturity of bond, collateral and the existence of guarantee by relevant assets. The market risk weighted assets are calculated by multiplying required capital on market risk (e.g. interest rate, stock and foreign currencies) by 12.5. The Group calculates its capital adequacy ratio under Basel I, according to the financial holding company regulations.
F-49
Table of Contents
The capital adequacy with figures as of January 1, 2010 and December 31, 2010 based on K-GAAP and as of December 31, 2011 based on IFRS (Unit: Korea Won in millions):
| January 1, 2010 | December 31, 2010 | December 31, 2011 | ||||||||||
| Tier 1 Capital |
16,674,089 | 17,784,766 | 18,530,442 | |||||||||
| Tier 2 Capital(*) |
8,150,005 | 7,054,778 | 7,138,106 | |||||||||
|
|
|
|
|
|
|
|||||||
| Total risk-adjusted capital |
24,824,094 | 24,839,544 | 25,668,548 | |||||||||
|
|
|
|
|
|
|
|||||||
| Risk-weighted assets for credit risk |
193,868,586 | 192,359,587 | 203,412,508 | |||||||||
| Risk-weighted assets for market risk |
7,086,190 | 5,891,357 | 4,656,713 | |||||||||
|
|
|
|
|
|
|
|||||||
| Total risk-weighted assets |
200,954,776 | 198,250,944 | 208,069,221 | |||||||||
|
|
|
|
|
|
|
|||||||
| Tier 1 capital ratio |
8.30 | % | 8.97 | % | 8.91 | % | ||||||
| Tier 2 capital ratio |
4.05 | % | 3.56 | % | 3.43 | % | ||||||
| Total risk-based capital ratio |
12.35 | % | 12.53 | % | 12.34 | % | ||||||
| (*) | Investment in non-consolidated equity investees engaged in banking and financial activities are directly deducted from Tier 2 pursuant to the guidelines of the Financial Supervisory Service. |
5. Operating Segments
The Group’s Chief Operation Decision Maker (CODM) is the Chief Financial Officer. In evaluating the results of the Group and allocating resources, the CODM utilizes two different sets of financial information. The primary one is the information prepared on the bases of type of customer and the secondary one is by legal entity. Both sets of financial information are equally monitored by the Board of Directors and each of the segments herein described are independently monitored.
| (1) | Segment by type of customers |
The CODM monitors its businesses primarily by type of customers. The reportable segments are:
| • | Consumer banking: consumer banking divisions of subsidiaries, Woori Bank, Kyongnam Bank, Kwangju Bank and Woori Investment & Securities; |
| • | Corporate banking: corporate banking divisions of subsidiaries, Woori Bank, Kyongnam Bank, Kwangju Bank and Woori Investment & Securities; |
| • | Investment banking: investment banking divisions of subsidiaries, Woori Bank and Woori Investment & Securities; |
| • | Capital market: capital market (representing securities trading and asset and liability management) divisions of subsidiaries, Woori Bank, Kyongnam Bank, Kwangju Bank and Woori Investment & Securities; and |
| • | Others: the Company and administration centers of subsidiaries, Woori Bank, Kyongnam Bank, Kwangju Bank and Woori Investment & Securities and other consolidated subsidiaries. |
F-50
Table of Contents
(Unit: Korean Won in millions)
| January 1, 2010 | ||||||||||||||||||||||||||||||||
| Consumer banking |
Corporate banking |
Investment banking |
Capital market |
Others | Sub-total | Inter- segment transaction |
Total | |||||||||||||||||||||||||
| Assets |
72,441,726 | 108,655,250 | 9,060,213 | 41,815,156 | 74,728,107 | 306,700,452 | (21,859,446 | ) | 284,841,006 | |||||||||||||||||||||||
| Liabilities |
72,479,328 | 111,402,942 | 445,246 | 32,517,999 | 53,682,372 | 270,527,887 | (4,898,285 | ) | 265,629,602 | |||||||||||||||||||||||
| December 31, 2010 | ||||||||||||||||||||||||||||||||
| Consumer banking |
Corporate banking |
Investment banking |
Capital market |
Others | Sub-total | Inter- segment transaction |
Total | |||||||||||||||||||||||||
| Assets |
75,086,716 | 105,469,496 | 8,445,014 | 43,268,037 | 78,455,130 | 310,724,393 | (19,547,075 | ) | 291,177,318 | |||||||||||||||||||||||
| Liabilities |
80,169,868 | 111,315,741 | 292,545 | 31,208,006 | 49,565,350 | 272,551,510 | (1,679,946 | ) | 270,871,564 | |||||||||||||||||||||||
| December 31, 2011 | ||||||||||||||||||||||||||||||||
| Consumer banking |
Corporate banking |
Investment banking |
Capital market |
Others | Sub-total | Inter- segment transaction |
Total | |||||||||||||||||||||||||
| Assets |
78,613,580 | 112,923,658 | 8,451,890 | 46,780,998 | 89,391,620 | 336,161,746 | (23,370,097 | ) | 312,791,649 | |||||||||||||||||||||||
| Liabilities |
81,570,032 | 117,413,072 | 95,663 | 32,320,238 | 62,149,647 | 293,548,652 | (2,830,397 | ) | 290,718,255 | |||||||||||||||||||||||
| For the year ended December 31, 2010 | ||||||||||||||||||||||||||||||||
| Consumer banking |
Corporate banking |
Investment banking |
Capital market |
Others | Sub-total | Inter- segment transaction |
Total | |||||||||||||||||||||||||
| Interest income, net |
2,731,248 | 3,418,776 | 42,363 | 200,548 | (554,936 | ) | 5,837,999 | 585,146 | 6,423,145 | |||||||||||||||||||||||
| Interest income |
4,456,860 | 6,133,192 | 367,577 | 1,191,928 | 2,021,141 | 14,170,698 | (113,471 | ) | 14,057,227 | |||||||||||||||||||||||
| Interest expense |
2,139,309 | 3,427,521 | 13,864 | 501,028 | 2,238,168 | 8,319,890 | (685,808 | ) | 7,634,082 | |||||||||||||||||||||||
| Inter-segment |
413,697 | 713,105 | (311,350 | ) | (490,352 | ) | (337,909 | ) | (12,809 | ) | 12,809 | — | ||||||||||||||||||||
| Non-interest income, net |
745,540 | 495,972 | 195,920 | 227,585 | 1,530,033 | 3,195,050 | (1,237,987 | ) | 1,957,063 | |||||||||||||||||||||||
| Non-interest income |
1,892,870 | 2,465,323 | 754,565 | 9,364,889 | 6,386,234 | 20,863,881 | (511,251 | ) | 20,352,630 | |||||||||||||||||||||||
| Non-interest expense |
1,179,113 | 2,010,751 | 509,298 | 9,185,624 | 4,783,842 | 17,668,628 | 726,939 | 18,395,567 | ||||||||||||||||||||||||
| Inter-segment |
31,783 | 41,400 | (49,347 | ) | 48,320 | (72,359 | ) | (203 | ) | 203 | — | |||||||||||||||||||||
| Other expense |
2,387,368 | 2,377,562 | 219,965 | 195,642 | 1,358,144 | 6,538,681 | (227,342 | ) | 6,311,339 | |||||||||||||||||||||||
| Administrative expense |
2,209,005 | 836,300 | 53,581 | 96,548 | 440,234 | 3,635,668 | (313,878 | ) | 3,321,790 | |||||||||||||||||||||||
| Impairment loss on credit loss |
178,363 | 1,541,262 | 166,384 | 99,094 | 917,910 | 2,903,013 | 86,536 | 2,989,549 | ||||||||||||||||||||||||
| Operating income |
1,089,420 | 1,537,186 | 18,318 | 232,491 | (383,047 | ) | 2,494,368 | (425,499 | ) | 2,068,869 | ||||||||||||||||||||||
| For the year ended December 31, 2011 | ||||||||||||||||||||||||||||||||
| Consumer banking |
Corporate banking |
Investment banking |
Capital market |
Others | Sub-total | Inter- segment transaction |
Total | |||||||||||||||||||||||||
| Interest income, net |
2,868,758 | 3,408,982 | 25,545 | 236,676 | 114,698 | 6,654,659 | 607,386 | 7,262,045 | ||||||||||||||||||||||||
| Interest income |
4,785,678 | 6,373,874 | 352,064 | 1,418,775 | 2,174,109 | 15,104,500 | (59,654 | ) | 15,044,846 | |||||||||||||||||||||||
| Interest expense |
2,154,519 | 3,632,781 | 11,136 | 657,356 | 2,006,099 | 8,461,891 | (679,090 | ) | 7,782,801 | |||||||||||||||||||||||
| Inter-segment |
237,599 | 667,889 | (315,383 | ) | (524,743 | ) | (53,312 | ) | 12,050 | (12,050 | ) | — | ||||||||||||||||||||
| Non-interest income, net |
721,160 | 524,131 | 52,306 | 63,381 | 1,804,670 | 3,165,648 | (1,009,071 | ) | 2,156,577 | |||||||||||||||||||||||
| Non-interest income |
2,205,513 | 3,109,898 | 576,312 | 8,156,083 | 7,859,378 | 21,907,184 | (1,116,557 | ) | 20,790,627 | |||||||||||||||||||||||
| Non-interest expense |
1,506,473 | 2,622,631 | 489,158 | 8,125,085 | 5,998,477 | 18,741,824 | (107,774 | ) | 18,634,050 | |||||||||||||||||||||||
| Inter-segment |
22,120 | 36,864 | (34,848 | ) | 32,383 | (56,231 | ) | 288 | (288 | ) | — | |||||||||||||||||||||
| Other expense |
2,495,830 | 1,776,698 | 428,386 | 151,384 | 1,442,221 | 6,294,519 | (36,570 | ) | 6,257,949 | |||||||||||||||||||||||
| Administrative expense |
2,317,456 | 961,288 | 61,407 | 104,866 | 572,147 | 4,017,164 | (234,725 | ) | 3,782,439 | |||||||||||||||||||||||
| Impairment loss on credit loss |
178,374 | 815,410 | 366,979 | 46,518 | 870,074 | 2,277,355 | 198,155 | 2,475,510 | ||||||||||||||||||||||||
| Operating income |
1,094,088 | 2,156,415 | (350,535 | ) | 148,673 | 477,147 | 3,525,788 | (365,115 | ) | 3,160,673 | ||||||||||||||||||||||
F-51
Table of Contents
| (2) | Segment by legal entity |
The CODM also monitors the result of the Group by independent legal entities: Woori Bank, Kyongnam Bank, Kwangju Bank, Woori Investment & Securities and others.
| • | Woori Bank: Woori Bank and its consolidated subsidiaries |
| • | Kyongnam Bank: Kyongnam Bank and its consolidated subsidiaries |
| • | Kwangju Bank: Kwangju Bank and its consolidated subsidiaries |
| • | Woori Investment & Securities: Woori Investment & Securities and its consolidated subsidiaries |
| • | Others: the Company and its other consolidated subsidiaries |
(Unit: Korean Won in millions)
| January 1, 2010 | ||||||||||||||||||||||||||||||||
| Woori Bank |
Kyongnam Bank |
Kwangju Bank |
Woori Investment & Securities |
Others | Sub-total | Inter-segment transaction |
Total | |||||||||||||||||||||||||
| Assets |
226,927,341 | 20,445,024 | 16,195,427 | 17,028,007 | 22,790,692 | 303,386,491 | (18,545,485 | ) | 284,841,006 | |||||||||||||||||||||||
| Liabilities |
210,006,974 | 18,911,610 | 15,169,242 | 14,375,052 | 8,494,460 | 266,957,338 | (1,327,736 | ) | 265,629,602 | |||||||||||||||||||||||
| December 31, 2010 | ||||||||||||||||||||||||||||||||
| Woori Bank |
Kyongnam Bank |
Kwangju Bank |
Woori Investment & Securities |
Others | Sub-total | Inter-segment transaction |
Total | |||||||||||||||||||||||||
| Assets |
228,554,863 | 21,803,888 | 16,841,006 | 18,646,143 | 24,176,527 | 310,022,427 | (18,845,109 | ) | 291,177,318 | |||||||||||||||||||||||
| Liabilities |
211,067,932 | 20,148,379 | 15,672,611 | 15,713,606 | 9,760,634 | 272,505,027 | (1,592,463 | ) | 270,912,564 | |||||||||||||||||||||||
| December 31, 2011 | ||||||||||||||||||||||||||||||||
| Woori Bank |
Kyongnam Bank |
Kwangju Bank |
Woori Investment & Securities |
Others | Sub-total | Inter-segment transaction |
Total | |||||||||||||||||||||||||
| Assets |
242,472,162 | 25,353,427 | 18,030,369 | 21,535,058 | 25,380,943 | 332,771,959 | (19,980,310 | ) | 312,791,649 | |||||||||||||||||||||||
| Liabilities |
224,346,022 | 23,555,666 | 16,813,501 | 17,862,450 | 10,406,221 | 292,983,860 | (2,265,605 | ) | 290,718,255 | |||||||||||||||||||||||
| For the year ended December 31, 2010 | ||||||||||||||||||||||||||||||||
| Woori Bank |
Kyongnam Bank |
Kwangju Bank |
Woori Investment & Securities |
Others | Sub-total | Inter-segment transaction |
Total | |||||||||||||||||||||||||
| Interest income, net |
5,026,762 | 626,962 | 468,085 | 350,095 | (80,759 | ) | 6,391,145 | 32,000 | 6,423,145 | |||||||||||||||||||||||
| Interest income |
10,981,048 | 1,168,487 | 906,899 | 619,638 | 418,214 | 14,094,286 | (37,059 | ) | 14,057,227 | |||||||||||||||||||||||
| Interest expense |
5,954,286 | 541,525 | 438,814 | 269,543 | 498,973 | 7,703,141 | (69,059 | ) | 7,634,082 | |||||||||||||||||||||||
| Non-interest income, net |
1,294,357 | 54,310 | 20,314 | 492,651 | 845,162 | 2,706,794 | (749,731 | ) | 1,957,063 | |||||||||||||||||||||||
| Non-interest income |
16,248,505 | 519,166 | 254,794 | 3,165,475 | 1,027,481 | 21,215,421 | (862,791 | ) | 20,352,630 | |||||||||||||||||||||||
| Non-interest expense |
14,954,148 | 464,856 | 234,480 | 2,672,824 | 182,319 | 18,508,627 | (113,060 | ) | 18,395,567 | |||||||||||||||||||||||
| Other expense |
4,823,491 | 440,038 | 322,781 | 527,956 | 504,198 | 6,618,464 | (307,125 | ) | 6,311,339 | |||||||||||||||||||||||
| Administrative expense |
2,263,506 | 235,928 | 195,225 | 530,439 | 379,004 | 3,604,102 | (282,312 | ) | 3,321,790 | |||||||||||||||||||||||
| Impairment loss on credit loss |
2,559,985 | 204,110 | 127,556 | (2,483 | ) | 125,194 | 3,014,362 | (24,813 | ) | 2,989,549 | ||||||||||||||||||||||
| Operating income |
1,497,628 | 241,234 | 165,618 | 314,790 | 260,205 | 2,479,475 | (410,606 | ) | 2,068,869 | |||||||||||||||||||||||
F-52
Table of Contents
| For the year ended December 31, 2011 | ||||||||||||||||||||||||||||||||
| Woori Bank |
Kyongnam Bank |
Kwangju Bank |
Woori Investment & Securities |
Others | Sub-total | Inter-segment transaction |
Total | |||||||||||||||||||||||||
| Interest income, net |
5,725,596 | 682,771 | 500,133 | 332,033 | 4,600 | 7,245,133 | 16,912 | 7,262,045 | ||||||||||||||||||||||||
| Interest income |
11,659,258 | 1,294,919 | 949,858 | 661,563 | 511,498 | 15,077,096 | (32,250 | ) | 15,044,846 | |||||||||||||||||||||||
| Interest expense |
5,933,662 | 612,148 | 449,725 | 329,530 | 506,898 | 7,831,963 | (49,162 | ) | 7,782,801 | |||||||||||||||||||||||
| Non-interest income, net |
1,473,791 | (1,148 | ) | 8,193 | 458,010 | 1,038,988 | 2,977,834 | (821,257 | ) | 2,156,577 | ||||||||||||||||||||||
| Non-interest income |
16,610,966 | 421,454 | 165,890 | 3,218,195 | 1,332,344 | 21,748,849 | (958,222 | ) | 20,790,627 | |||||||||||||||||||||||
| Non-interest expense |
15,137,175 | 422,602 | 157,697 | 2,760,185 | 293,356 | 18,771,015 | (136,965 | ) | 18,634,050 | |||||||||||||||||||||||
| Other expense |
4,516,303 | 426,901 | 331,966 | 577,255 | 656,537 | 6,508,962 | (251,013 | ) | 6,257,949 | |||||||||||||||||||||||
| Administrative expense |
2,552,793 | 273,820 | 224,393 | 570,378 | 449,848 | 4,071,232 | (288,793 | ) | 3,782,439 | |||||||||||||||||||||||
| Impairment loss on credit loss |
1,963,510 | 153,081 | 107,573 | 6,877 | 206,689 | 2,437,730 | 37,780 | 2,475,510 | ||||||||||||||||||||||||
| Operating income |
2,683,084 | 254,722 | 176,360 | 212,788 | 387,051 | 3,714,005 | (553,332 | ) | 3,160,673 | |||||||||||||||||||||||
(3) Information on financial products and services
The financial products of the Group are classified as interest-bearing products such as loans, deposits and debt securities and non-interest bearing products such as loan commitment, credit commitment, equity securities, and credit card service. This classification of products has been reflected in the segment information presenting interest income and non-interest income.
(4) Information on geographical areas
Of the Group’s revenue (interest income and non-interest income) from external services, revenue from the domestic customers for the years ended December 31, 2010 and 2011 amounted to 33,162,850 million Won and 34,953,477 million Won, respectively, and revenue from the foreign customers amounted to 1,207,458 million Won and 868,273 million Won, respectively. Of the Groups’ non-current assets (investments in jointly controlled entities and associates, investment properties, premises and equipment and intangible assets), non-current assets attributed to domestic subsidiaries as of January 1, 2010, December 31, 2010 and December 31, 2011 are 4,779,453 million Won, 4,746,873 million Won and 4,974,603 million Won, respectively, and foreign subsidiaries are 32,610 million Won, 33,756 million Won and 34,991 million Won, respectively.
F-53
Table of Contents
6. Restricted Deposits
Details of restricted deposits are as follows (Unit: Korean Won in millions):
| January 1, 2010 |
December 31, 2010 |
December 31, 2011 |
||||||||||||
| Financial assets at FVTPL: |
||||||||||||||
| Korea Finance Security Co., Ltd. |
870,083 | 805,675 | 818,252 | Regulation on supervision of securities business | ||||||||||
| Loans and receivables: |
||||||||||||||
| Due from banks in local currency |
||||||||||||||
| The Bank of Korea |
4,483,754 | 8,088,129 | 11,304,073 | Reserve deposits | ||||||||||
| Korea Exchange |
251 | 376 | 751 | Deposits for required allotted charges | ||||||||||
| Korea Finance Security Co., Ltd. |
558,911 | 201,265 | 309,681 | Regulation on supervision of securities business | ||||||||||
| Samsung Security, etc. |
11,497 | 79,224 | 46,121 | Margins | ||||||||||
| Shinhan Bank, etc. |
25 | 1,799 | 68 | Deposits for opening account, etc. | ||||||||||
| Others |
205,140 | 378,928 | 658,628 | Borrowings on collateral, etc. | ||||||||||
| Due from banks in foreign currencies |
||||||||||||||
| The Bank of Korea |
305,517 | 309,508 | 350,951 | Reserve deposits | ||||||||||
| Bank of Japan, etc. |
205,334 | 134,113 | 519,139 | Reserve deposits | ||||||||||
| Bank of Tokyo Mitsubishi, etc. |
57,870 | 38,616 | 59,024 | Installation deposits of financial institution, etc. | ||||||||||
| JP Morgan Chase Bank, etc. |
197,457 | 146,811 | 110,369 | Derivative transaction collateral provider, etc. | ||||||||||
|
|
|
|
|
|
|
|||||||||
| Sub-total |
6,025,756 | 9,378,769 | 13,358,805 | |||||||||||
|
|
|
|
|
|
|
|||||||||
| Total |
6,895,839 | 10,184,444 | 14,177,057 | |||||||||||
|
|
|
|
|
|
|
|||||||||
F-54
Table of Contents
7. Financial Assets at FVTPL
(1) Financial assets held for trading are as follows (Unit: Korean Won in millions):
| January 1, 2010 |
December 31, 2010 |
December 31, 2011 |
||||||||||
| Deposits: |
||||||||||||
| Reserve for claims of customers deposits |
870,083 | 805,675 | 818,252 | |||||||||
|
|
|
|
|
|
|
|||||||
| Securities: |
||||||||||||
| Debt securities |
||||||||||||
| Korean treasury and government agencies |
3,955,764 | 3,495,375 | 1,194,168 | |||||||||
| Financial institutions |
4,609,400 | 3,622,232 | 5,194,371 | |||||||||
| Corporates |
3,261,568 | 2,813,452 | 5,394,733 | |||||||||
| CP |
3,812,899 | 3,395,435 | 2,972,865 | |||||||||
| Equity securities |
606,214 | 672,164 | 608,310 | |||||||||
| Beneficiary certificates(*) |
358,808 | 228,513 | 324,843 | |||||||||
| CMA securities |
1,638,294 | 1,619,270 | 2,466,325 | |||||||||
| Others |
258,665 | 656,495 | 1,650,696 | |||||||||
|
|
|
|
|
|
|
|||||||
| Sub-total |
18,501,612 | 16,502,936 | 19,806,311 | |||||||||
|
|
|
|
|
|
|
|||||||
| Derivatives instruments assets: |
||||||||||||
| Interest rate derivatives |
1,309,598 | 1,350,353 | 1,552,875 | |||||||||
| Currency derivatives |
3,220,471 | 2,571,193 | 2,205,831 | |||||||||
| Equity derivatives |
138,470 | 195,260 | 95,533 | |||||||||
| Credit derivatives |
29,237 | 15,980 | 17,878 | |||||||||
| Commodity derivatives |
41,870 | 29,833 | 27,780 | |||||||||
|
|
|
|
|
|
|
|||||||
| Sub-total |
4,739,646 | 4,162,619 | 3,899,897 | |||||||||
|
|
|
|
|
|
|
|||||||
| Total |
24,111,341 | 21,471,230 | 24,524,460 | |||||||||
|
|
|
|
|
|
|
|||||||
| (*) | Beneficiary certificates are securities which state beneficiary’s right to receive profit from operation of trusts or funds. |
(2) Financial assets designated at FVTPL as follows (Unit: Korean Won in millions):
| January 1, 2010 |
December 31, 2010 |
December 31, 2011 |
||||||||||
| Corporate bonds |
125,126 | — | — | |||||||||
| Equity-linked securities |
549,891 | 301,867 | 654,124 | |||||||||
| Asset backed securities |
349,229 | 400,319 | 409,804 | |||||||||
| Equity securities |
15,938 | 10,345 | 11,843 | |||||||||
|
|
|
|
|
|
|
|||||||
| Total |
1,040,184 | 712,531 | 1,075,771 | |||||||||
|
|
|
|
|
|
|
|||||||
F-55
Table of Contents
8. AFS Financial Assets
AFS financial assets are as follows (Unit: Korean Won in millions):
| January 1, 2010 | ||||||||||||||||
| Amortized cost (or cost) |
Gross unrealized gain |
Gross unrealized loss |
Fair value | |||||||||||||
| Debt securities |
||||||||||||||||
| Korean treasury and government agencies |
2,633,301 | 5,613 | (15,528 | ) | 2,623,386 | |||||||||||
| Financial institutions |
3,924,156 | 17,277 | (4,483 | ) | 3,936,950 | |||||||||||
| Corporates |
1,217,465 | 8,250 | (1,673 | ) | 1,224,042 | |||||||||||
| Asset-backed securities |
1,078,868 | 2,492 | (863 | ) | 1,080,497 | |||||||||||
| Foreign currency bonds |
651,149 | 6,247 | (12,185 | ) | 645,211 | |||||||||||
|
|
|
|
|
|
|
|
|
|||||||||
| Sub-Total |
9,504,939 | 39,879 | (34,732 | ) | 9,510,086 | |||||||||||
|
|
|
|
|
|
|
|
|
|||||||||
| Equity securities |
1,705,625 | 1,715,666 | (72,353 | ) | 3,348,938 | |||||||||||
| Beneficiary certificates |
7,392,567 | 90,953 | (13,044 | ) | 7,470,476 | |||||||||||
| Others |
1,007,957 | 49 | (6 | ) | 1,008,000 | |||||||||||
|
|
|
|
|
|
|
|
|
|||||||||
| Total |
19,611,088 | 1,846,547 | (120,135 | ) | 21,337,500 | |||||||||||
|
|
|
|
|
|
|
|
|
|||||||||
| December 31, 2010 | ||||||||||||||||
| Amortized cost (or cost) |
Gross unrealized gain |
Gross unrealized loss |
Fair value | |||||||||||||
| Debt securities |
||||||||||||||||
| Korean treasury and government agencies |
2,684,061 | 36,803 | (952 | ) | 2,719,912 | |||||||||||
| Financial institutions |
5,877,280 | 20,522 | (987 | ) | 5,896,815 | |||||||||||
| Corporates |
2,670,913 | 19,443 | (399 | ) | 2,689,957 | |||||||||||
| Asset-backed securities |
736,791 | 12,589 | (131 | ) | 749,249 | |||||||||||
| Foreign currency bonds |
274,479 | 10,379 | (1,100 | ) | 283,758 | |||||||||||
|
|
|
|
|
|
|
|
|
|||||||||
| Sub-Total |
12,243,524 | 99,736 | (3,569 | ) | 12,339,691 | |||||||||||
|
|
|
|
|
|
|
|
|
|||||||||
| Equity securities |
2,013,441 | 1,311,114 | (88,929 | ) | 3,235,626 | |||||||||||
| Beneficiary certificates |
5,072,861 | 137,439 | (13,880 | ) | 5,196,420 | |||||||||||
| Others |
1,222,791 | 5,353 | (1,997 | ) | 1,226,147 | |||||||||||
|
|
|
|
|
|
|
|
|
|||||||||
| Total |
20,552,617 | 1,553,642 | (108,375 | ) | 21,997,884 | |||||||||||
|
|
|
|
|
|
|
|
|
|||||||||
| December 31, 2011 | ||||||||||||||||
| Amortized cost (or cost) |
Gross unrealized gain |
Gross unrealized loss |
Fair value | |||||||||||||
| Debt securities |
||||||||||||||||
| Korean treasury and government agencies |
2,753,363 | 34,315 | (957 | ) | 2,786,721 | |||||||||||
| Financial institutions |
5,199,072 | 12,632 | (1,279 | ) | 5,210,425 | |||||||||||
| Corporates |
4,151,705 | 32,802 | (1,130 | ) | 4,183,377 | |||||||||||
| Asset-backed securities |
610,168 | 103 | (10,950 | ) | 599,321 | |||||||||||
| Foreign currency bonds |
132,739 | 315 | (148 | ) | 132,906 | |||||||||||
|
|
|
|
|
|
|
|
|
|||||||||
| Sub-Total |
12,847,047 | 80,167 | (14,464 | ) | 12,912,750 | |||||||||||
|
|
|
|
|
|
|
|
|
|||||||||
| Equity securities |
1,859,844 | 917,015 | (25,398 | ) | 2,751,461 | |||||||||||
| Beneficiary certificates |
3,719,718 | 73,986 | (5,274 | ) | 3,788,430 | |||||||||||
| Others |
219,278 | 248 | (243 | ) | 219,283 | |||||||||||
|
|
|
|
|
|
|
|
|
|||||||||
| Total |
18,645,887 | 1,071,416 | (45,379 | ) | 19,671,924 | |||||||||||
|
|
|
|
|
|
|
|
|
|||||||||
F-56
Table of Contents
9. HTM Financial Assets
HTM financial assets are as follows (Unit: Korean Won in millions):
| January 1, 2010 | ||||||||||||||||
| Amortized cost |
Gross unrealized gain |
Gross unrealized loss |
Fair value | |||||||||||||
| Korean treasury and government agencies |
2,549,331 | 36,248 | (13,725 | ) | 2,571,854 | |||||||||||
| Financial institutions |
11,430,996 | 56,877 | (19,605 | ) | 11,468,268 | |||||||||||
| Corporates |
1,763,207 | 18,577 | (1,492 | ) | 1,780,292 | |||||||||||
| Foreign governments |
197,678 | — | — | 197,678 | ||||||||||||
| Securities loaned |
12,497 | — | — | 12,497 | ||||||||||||
|
|
|
|
|
|
|
|
|
|||||||||
| Total |
15,953,709 | 111,702 | (34,822 | ) | 16,030,589 | |||||||||||
|
|
|
|
|
|
|
|
|
|||||||||
| December 31, 2010 | ||||||||||||||||
| Amortized cost |
Gross unrealized gain |
Gross unrealized loss |
Fair value | |||||||||||||
| Korean treasury and government agencies |
6,347,443 | 135,141 | (5,744 | ) | 6,476,840 | |||||||||||
| Financial institutions |
7,832,371 | 57,710 | (763 | ) | 7,889,318 | |||||||||||
| Corporates |
5,491,011 | 78,612 | (2,810 | ) | 5,566,813 | |||||||||||
| Foreign governments |
143,537 | — | — | 143,537 | ||||||||||||
| Securities loaned |
71,197 | 604 | (34 | ) | 71,767 | |||||||||||
|
|
|
|
|
|
|
|
|
|||||||||
| Total |
19,885,559 | 272,067 | (9,351 | ) | 20,148,275 | |||||||||||
|
|
|
|
|
|
|
|
|
|||||||||
| December 31, 2011 | ||||||||||||||||
| Amortized cost |
Gross unrealized gain |
Gross unrealized loss |
Fair value | |||||||||||||
| Korean treasury and government agencies |
7,234,926 | 198,456 | (1,382 | ) | 7,432,000 | |||||||||||
| Financial institutions |
5,858,741 | 21,595 | (518 | ) | 5,879,818 | |||||||||||
| Corporates |
6,828,617 | 73,437 | (4,300 | ) | 6,897,754 | |||||||||||
| Foreign governments |
102,967 | — | — | 102,967 | ||||||||||||
| Securities loaned |
10,877 | 177 | — | 11,054 | ||||||||||||
|
|
|
|
|
|
|
|
|
|||||||||
| Total |
20,036,128 | 293,665 | (6,200 | ) | 20,323,593 | |||||||||||
|
|
|
|
|
|
|
|
|
|||||||||
10. Loans and Receivables
(1) Loans and receivables are as follows (Unit: Korean Won in millions):
| January 1, 2010 |
December 31, 2010 |
December 31, 2011 |
||||||||||
| Due from banks |
7,296,356 | 11,893,745 | 15,347,524 | |||||||||
| Provision for credit losses |
(17,111 | ) | (11,399 | ) | (7,175 | ) | ||||||
| Loans |
200,857,538 | 201,292,346 | 212,639,337 | |||||||||
| Provision for credit losses |
(3,507,787 | ) | (4,717,682 | ) | (3,759,304 | ) | ||||||
| Other receivables |
6,765,940 | 8,523,128 | 11,211,093 | |||||||||
| Provision for credit losses |
(337,762 | ) | (188,333 | ) | (271,519 | ) | ||||||
|
|
|
|
|
|
|
|||||||
| Total |
211,057,174 | 216,791,805 | 235,159,956 | |||||||||
|
|
|
|
|
|
|
|||||||
F-57
Table of Contents
(2) Due from banks are as follows (Unit: Korean Won in millions):
| January 1, 2010 |
December 31, 2010 |
December 31, 2011 |
||||||||||
| Due from banks in local currency |
||||||||||||
| Due from the Bank of Korea |
4,483,754 | 8,088,129 | 11,304,073 | |||||||||
| Due from depository banks |
1,242,764 | 1,756,184 | 1,641,349 | |||||||||
| Due from non-depository |
71,850 | 264,694 | 137,037 | |||||||||
| Due from the Korea Exchange |
402,452 | 223,743 | 249,248 | |||||||||
| Others |
145,560 | 111,460 | 25,919 | |||||||||
|
|
|
|
|
|
|
|||||||
| Provision for credit losses |
(7,142 | ) | (4,007 | ) | (4,887 | ) | ||||||
|
|
|
|
|
|
|
|||||||
| Sub-total |
6,339,238 | 10,440,203 | 13,352,739 | |||||||||
|
|
|
|
|
|
|
|||||||
| Due from banks in foreign currencies |
||||||||||||
| Due from banks on demand |
476,044 | 776,844 | 649,068 | |||||||||
| Due from banks on time |
102,936 | 283,886 | 471,600 | |||||||||
| Others |
370,996 | 388,805 | 869,230 | |||||||||
|
|
|
|
|
|
|
|||||||
| Provision for credit losses |
(9,969 | ) | (7,392 | ) | (2,288 | ) | ||||||
|
|
|
|
|
|
|
|||||||
| Sub-total |
940,007 | 1,442,143 | 1,987,610 | |||||||||
|
|
|
|
|
|
|
|||||||
| Total |
7,279,245 | 11,882,346 | 15,340,349 | |||||||||
|
|
|
|
|
|
|
|||||||
(3) Loans are as follows (Unit: Korean Won in millions):
| January 1, 2010 |
December 31, 2010 |
December 31, 2011 |
||||||||||
| Loans in local currency |
160,741,987 | 160,379,652 | 171,589,808 | |||||||||
| Loans in foreign currencies |
13,610,103 | 13,458,732 | 13,243,422 | |||||||||
| Domestic banker’s letter of credit |
3,871,611 | 4,338,818 | 5,423,078 | |||||||||
| Credit card accounts |
4,099,358 | 4,356,653 | 4,592,095 | |||||||||
| Bills bought in foreign currencies |
4,780,942 | 5,148,175 | 5,672,021 | |||||||||
| Bills bought in local currency |
639,809 | 424,683 | 661,151 | |||||||||
| Factoring receivables |
95,659 | 113,722 | 275,732 | |||||||||
| Advances for customers on guarantees |
59,081 | 306,167 | 41,870 | |||||||||
| Privately placed bonds |
3,528,753 | 2,621,376 | 1,738,138 | |||||||||
| Loans to be converted to equity securities |
4,944 | 1,723 | 1,723 | |||||||||
| Finance leases |
479,653 | 631,871 | 661,764 | |||||||||
| Loans for installment |
666,943 | 1,130,159 | 1,535,405 | |||||||||
| Securitized loans |
788,456 | 1,230,096 | 1,614,240 | |||||||||
| Loans secured by securities |
718,380 | 1,206,752 | 1,181,402 | |||||||||
| Call loans |
4,714,348 | 3,716,967 | 3,431,638 | |||||||||
| Bonds purchased under resale agreements |
1,870,470 | 2,005,105 | 749,490 | |||||||||
| Others |
187,041 | 221,695 | 226,360 | |||||||||
|
|
|
|
|
|
|
|||||||
| Gross loans |
200,857,538 | 201,292,346 | 212,639,337 | |||||||||
|
|
|
|
|
|
|
|||||||
| Provision for credit losses |
(3,507,787 | ) | (4,717,682 | ) | (3,759,304 | ) | ||||||
|
|
|
|
|
|
|
|||||||
| Total |
197,349,751 | 196,574,664 | 208,880,033 | |||||||||
|
|
|
|
|
|
|
|||||||
F-58
Table of Contents
(4) Other receivables are as follows (Unit: Korean Won in millions):
| January 1, 2010 |
December 31, 2010 |
December 31, 2011 |
||||||||||
| CMA accounts |
302,650 | 1,059,112 | 167,847 | |||||||||
| Receivables |
3,644,612 | 3,944,979 | 7,378,434 | |||||||||
| Accrued income |
1,046,920 | 1,188,172 | 1,452,733 | |||||||||
| Telex and telephone subscription rights and refundable deposits |
1,230,972 | 1,221,155 | 1,253,525 | |||||||||
| Other debtors |
540,786 | 1,109,710 | 958,554 | |||||||||
| Provision for credit losses |
(337,762 | ) | (188,333 | ) | (271,519 | ) | ||||||
|
|
|
|
|
|
|
|||||||
| Total |
6,428,178 | 8,334,795 | 10,939,574 | |||||||||
|
|
|
|
|
|
|
|||||||
(5) Changes in provision for credit losses on loans and receivables are as follows (Unit: Korean Won in millions):
| For the years ended December 31 | ||||||||
| 2010 | 2011 | |||||||
| Beginning balance |
3,862,660 | 4,917,414 | ||||||
| Bad debt expenses for the period |
2,868,540 | 2,162,625 | ||||||
| Increase on repurchase of NPL |
10,314 | 3,525 | ||||||
| Recoveries of written-off loans |
168,599 | 104,487 | ||||||
| Charge-off |
(1,506,248 | ) | (2,368,803 | ) | ||||
| Foreign exchange translation adjustment |
(1,720 | ) | 37,376 | |||||
| Sales of loans and receivables |
(267,895 | ) | (537,615 | ) | ||||
| Unwind of discount |
(76,664 | ) | (156,097 | ) | ||||
| Others |
(140,172 | ) | (124,914 | ) | ||||
|
|
|
|
|
|||||
| Ending balance |
4,917,414 | 4,037,998 | ||||||
|
|
|
|
|
|||||
11. The Fair Value of Financial Assets and Liabilities
(1) The fair value hierarchy
The fair value hierarchy prioritizes and ranks the levels of market price observability used in the financial assets and liabilities at fair value. Market price observability is impacted by a number of factors, including the types of and the characteristics specific to the financial assets and liabilities and the state of the marketplace (including the existence and transparency of transactions between market participants). Fair value with readily-available actively quoted prices or measured from actively-quoted prices in an orderly market will generally have a higher degree of market price observability and a lesser degree of judgment used in measuring fair value. The fair value hierarchy requires the Group to maximize the use of observable inputs and minimize the use of unobservable inputs when measuring fair value. Fair value is a market-based measure considered from the perspective of a market participant. As such, even when market assumptions are not readily available, the Group’s own assumptions reflect those that market participants would use in pricing the assets or liabilities at the measurement date.
The fair value measurement is described in the one of the following three levels used to classify fair value measurements:
| • | Level 1—fair value measurements are those derived from quoted prices (unadjusted) in active markets for identical assets or liabilities. The types of financial assets or liabilities generally included in Level 1 are publicly traded equity securities and derivatives. |
F-59
Table of Contents
| • | Level 2—fair value measurements are those derived from inputs other than quoted prices included within Level 1 that are observable for the asset or liability, either directly (i.e. prices) or indirectly (i.e. derived from prices). The types of financial assets or liabilities generally included in Level 2 are debt securities not traded in active markets and derivatives traded in OTC but not required significant judgment. |
| • | Level 3—fair value measurements are those derived from valuation technique that include inputs for the asset or liability that are not based on observable market data (unobservable inputs). The types of financial assets or liabilities generally included in Level 3 are non-public securities and derivatives and debt securities of which valuation techniques require significant judgments and subjectivity. |
The inputs used to measure fair value may fall into different levels of the fair value hierarchy. In such cases, the level within the fair value hierarchy is based on the lowest level of input that is significant to the fair value measurement. The Group’s assessment of the significance of a particular input to a fair value measurement in its entirety requires judgment and consideration of factors specific to the asset or liability. See Note 2 (9) 5), Fair value of financial assets and liabilities for further discussion relating to the Group’s fair value measurement.
F-60
Table of Contents
| (2) | Fair value hierarchy of financial assets and liabilities measured at fair value are as follows (Unit: Korean Won in millions): |
| January 1, 2010 | ||||||||||||||||
| Level 1 | Level 2 | Level 3 | Total | |||||||||||||
| Financial assets: |
||||||||||||||||
| Financial assets held for trading |
||||||||||||||||
| Debt securities |
||||||||||||||||
| Korean treasury and government agencies |
2,843,705 | 1,112,059 | — | 3,955,764 | ||||||||||||
| Financial institutions |
— | 4,609,400 | — | 4,609,400 | ||||||||||||
| Corporates |
— | 3,261,568 | — | 3,261,568 | ||||||||||||
| CP |
— | 3,812,899 | — | 3,812,899 | ||||||||||||
| Equity securities |
606,214 | — | — | 606,214 | ||||||||||||
| Beneficiary certificates |
— | 358,808 | — | 358,808 | ||||||||||||
| CMA securities |
— | 1,638,294 | — | 1,638,294 | ||||||||||||
| Others |
24,821 | 233,844 | — | 258,665 | ||||||||||||
| Derivatives instruments assets: |
||||||||||||||||
| Interest rate derivatives |
— | 1,309,154 | 444 | 1,309,598 | ||||||||||||
| Currency derivatives |
— | 3,220,456 | 15 | 3,220,471 | ||||||||||||
| Equity derivatives |
6,093 | 64,438 | 67,939 | 138,470 | ||||||||||||
| Credit derivatives |
— | 23,115 | 6,122 | 29,237 | ||||||||||||
| Commodity derivatives |
338 | 41,308 | 224 | 41,870 | ||||||||||||
| Financial assets designed at FVTPL |
||||||||||||||||
| Corporates |
— | 43,908 | 81,218 | 125,126 | ||||||||||||
| Equity linked securities |
— | 75,973 | 473,918 | 549,891 | ||||||||||||
| Asset-backed securities |
— | 301,326 | 47,903 | 349,229 | ||||||||||||
| Equity securities |
— | — | 15,938 | 15,938 | ||||||||||||
| AFS financial assets |
||||||||||||||||
| Debt securities |
||||||||||||||||
| Korean treasury and government agencies |
2,524,958 | 98,428 | — | 2,623,386 | ||||||||||||
| Financial institutions |
— | 3,928,150 | 8,800 | 3,936,950 | ||||||||||||
| Corporates |
— | 1,120,973 | 103,069 | 1,224,042 | ||||||||||||
| Asset-backed securities |
— | 1,080,497 | — | 1,080,497 | ||||||||||||
| Foreign governments |
— | 595,276 | 49,935 | 645,211 | ||||||||||||
| Equity securities |
287,434 | — | 3,061,504 | 3,348,938 | ||||||||||||
| Beneficiary certificates |
— | 7,424,521 | 45,955 | 7,470,476 | ||||||||||||
| Others |
— | 953,750 | 54,250 | 1,008,000 | ||||||||||||
| Derivative assets |
— | 107,490 | — | 107,490 | ||||||||||||
| Financial liabilities: |
||||||||||||||||
| Financial liabilities held for trading |
||||||||||||||||
| Borrowings |
||||||||||||||||
| Warrants in short position |
— | 23,275 | — | 23,275 | ||||||||||||
| Securities in short position |
567,277 | — | — | 567,277 | ||||||||||||
| Derivative liabilities |
||||||||||||||||
| Interest rate derivatives |
— | 1,450,136 | 1,203 | 1,451,339 | ||||||||||||
| Currency derivatives |
43 | 2,498,589 | — | 2,498,632 | ||||||||||||
| Stock derivatives |
19,253 | 195,892 | 483,494 | 698,639 | ||||||||||||
| Credit derivatives |
— | 3,440 | 205,129 | 208,569 | ||||||||||||
| Commodity derivatives |
— | 44,381 | — | 44,381 | ||||||||||||
| Others |
462 | — | — | 462 | ||||||||||||
| Financial liabilities designated at FVTPL |
||||||||||||||||
| Borrowings |
— | 1,234,604 | 2,003,850 | 3,238,454 | ||||||||||||
| Debentures |
— | 1,684,042 | — | 1,684,042 | ||||||||||||
| Derivative liabilities |
— | 41,236 | — | 41,236 | ||||||||||||
F-61
Table of Contents
| December 31, 2010 | ||||||||||||||||
| Level 1 | Level 2 | Level 3 | Total | |||||||||||||
| Financial assets: |
||||||||||||||||
| Financial assets held for trading |
||||||||||||||||
| Debt securities |
||||||||||||||||
| Korean treasury and government agencies |
1,345,468 | 2,149,907 | — | 3,495,375 | ||||||||||||
| Financial institutions |
— | 3,622,232 | — | 3,622,232 | ||||||||||||
| Corporates |
— | 2,813,452 | — | 2,813,452 | ||||||||||||
| CP |
3,395,435 | — | 3,395,435 | |||||||||||||
| Equity securities |
672,164 | — | — | 672,164 | ||||||||||||
| Beneficiary certificates |
20,059 | 208,454 | — | 228,513 | ||||||||||||
| CMA securities |
— | 1,619,270 | — | 1,619,270 | ||||||||||||
| Others |
409,622 | 246,873 | — | 656,495 | ||||||||||||
| Derivatives instruments assets: |
||||||||||||||||
| Interest rate derivatives |
— | 1,336,626 | 13,727 | 1,350,353 | ||||||||||||
| Currency derivatives |
— | 2,569,593 | 1,600 | 2,571,193 | ||||||||||||
| Equity derivatives |
18,638 | 113,699 | 62,923 | 195,260 | ||||||||||||
| Credit derivatives |
— | 12,107 | 3,873 | 15,980 | ||||||||||||
| Commodity derivatives |
13 | 25,701 | 4,119 | 29,833 | ||||||||||||
| Financial assets designed at FVTPL |
||||||||||||||||
| Equity linked securities |
505 | 48,044 | 253,318 | 301,867 | ||||||||||||
| Asset-backed securities |
— | 346,813 | 53,506 | 400,319 | ||||||||||||
| Equity securities |
— | — | 10,345 | 10,345 | ||||||||||||
| AFS financial assets |
||||||||||||||||
| Debt securities |
||||||||||||||||
| Korean treasury and government agencies |
2,330,356 | 389,556 | — | 2,719,912 | ||||||||||||
| Financial institutions |
— | 5,888,015 | 8,800 | 5,896,815 | ||||||||||||
| Corporates |
— | 2,611,075 | 78,882 | 2,689,957 | ||||||||||||
| Asset-backed securities |
— | 749,249 | — | 749,249 | ||||||||||||
| Foreign governments |
9,926 | 239,382 | 34,450 | 283,758 | ||||||||||||
| Equity securities |
559,025 | — | 2,676,601 | 3,235,626 | ||||||||||||
| Beneficiary certificates |
— | 5,148,303 | 48,117 | 5,196,420 | ||||||||||||
| Others |
788,598 | 407,855 | 29,694 | 1,226,147 | ||||||||||||
| Derivative assets |
— | 131,511 | — | 131,511 | ||||||||||||
| Financial liabilities: |
||||||||||||||||
| Financial liabilities held for trading |
||||||||||||||||
| Borrowings |
||||||||||||||||
| Warrants in short position |
— | 58,745 | — | 58,745 | ||||||||||||
| Securities in short position |
798,353 | — | — | 798,353 | ||||||||||||
| Derivative liabilities |
||||||||||||||||
| Interest rate derivatives |
— | 1,508,383 | 9,785 | 1,518,168 | ||||||||||||
| Currency derivatives |
— | 1,844,894 | — | 1,844,894 | ||||||||||||
| Stock derivatives |
31,077 | 55,454 | 160,040 | 246,571 | ||||||||||||
| Credit derivatives |
— | 244 | 3,421 | 3,665 | ||||||||||||
| Commodity derivatives |
— | 25,830 | 10,547 | 36,377 | ||||||||||||
| Others |
— | — | — | — | ||||||||||||
| Financial liabilities designated at FVTPL |
||||||||||||||||
| Borrowings |
— | 1,056,015 | 1,766,213 | 2,822,228 | ||||||||||||
| Debentures |
— | 1,509,280 | — | 1,509,280 | ||||||||||||
| Derivative liabilities |
— | 5,339 | — | 5,339 | ||||||||||||
F-62
Table of Contents
| December 31, 2011 | ||||||||||||||||
| Level 1 | Level 2 | Level 3 | Total | |||||||||||||
| Financial assets: |
||||||||||||||||
| Financial assets held for trading |
||||||||||||||||
| Debt securities |
||||||||||||||||
| Korean treasury and government agencies |
787,071 | 407,097 | — | 1,194,168 | ||||||||||||
| Financial institutions |
— | 5,194,371 | — | 5,194,371 | ||||||||||||
| Corporates |
— | 5,394,733 | — | 5,394,733 | ||||||||||||
| CP |
— | 2,972,865 | — | 2,972,865 | ||||||||||||
| Equity securities |
608,310 | — | — | 608,310 | ||||||||||||
| Beneficiary certificates |
— | 324,843 | — | 324,843 | ||||||||||||
| CMA securities |
— | 2,466,325 | — | 2,466,325 | ||||||||||||
| Others |
19,876 | 1,630,820 | — | 1,650,696 | ||||||||||||
| Derivatives instruments assets: |
||||||||||||||||
| Interest rate derivatives |
— | 1,539,099 | 13,776 | 1,552,875 | ||||||||||||
| Currency derivatives |
— | 2,204,356 | 1,475 | 2,205,831 | ||||||||||||
| Equity derivatives |
3,186 | 37,991 | 54,356 | 95,533 | ||||||||||||
| Credit derivatives |
— | 3,337 | 14,541 | 17,878 | ||||||||||||
| Commodity derivatives |
— | 20,296 | 7,484 | 27,780 | ||||||||||||
| Financial assets designed at FVTPL |
||||||||||||||||
| Equity linked securities |
994 | 204,339 | 448,791 | 654,124 | ||||||||||||
| Asset-backed securities |
— | 360,442 | 49,362 | 409,804 | ||||||||||||
| Equity securities |
623 | — | 11,220 | 11,843 | ||||||||||||
| AFS financial assets |
||||||||||||||||
| Debt securities |
||||||||||||||||
| Korean treasury and government agencies |
2,632,569 | 154,152 | — | 2,786,721 | ||||||||||||
| Financial institutions |
— | 5,201,625 | 8,800 | 5,210,425 | ||||||||||||
| Corporates |
— | 4,118,069 | 65,308 | 4,183,377 | ||||||||||||
| Asset-backed securities |
— | 599,321 | — | 599,321 | ||||||||||||
| Foreign governments |
9,116 | 121,945 | 1,845 | 132,906 | ||||||||||||
| Equity securities |
481,919 | — | 2,269,542 | 2,751,461 | ||||||||||||
| Beneficiary certificates |
— | 3,772,221 | 16,209 | 3,788,430 | ||||||||||||
| Others |
90.209 | 35,434 | 93,640 | 219,283 | ||||||||||||
| Derivative assets |
— | 326,840 | — | 326,840 | ||||||||||||
| Financial liabilities: |
||||||||||||||||
| Financial liabilities held for trading |
||||||||||||||||
| Borrowings |
||||||||||||||||
| Warrants in short position |
— | 10,309 | — | 10,309 | ||||||||||||
| Securities in short position |
606,723 | 20,156 | — | 626,879 | ||||||||||||
| Derivative liabilities |
||||||||||||||||
| Interest rate derivatives |
— | 1,658,036 | 12,809 | 1,670,845 | ||||||||||||
| Currency derivatives |
14 | 1,689,830 | — | 1,689,844 | ||||||||||||
| Stock derivatives |
7,676 | 106,219 | 402,939 | 516,834 | ||||||||||||
| Credit derivatives |
— | 7,308 | 14,251 | 21,559 | ||||||||||||
| Commodity derivatives |
— | 19,536 | 6,217 | 25,753 | ||||||||||||
| Others |
109 | — | — | 109 | ||||||||||||
| Financial liabilities designated at FVTPL |
||||||||||||||||
| Borrowings |
— | 1,839,656 | 2,897,551 | 4,737,207 | ||||||||||||
| Debentures |
— | 322,207 | — | 322,207 | ||||||||||||
| Derivative liabilities |
— | 33,493 | — | 33,493 | ||||||||||||
Derivatives classified as FVTPL are included in derivatives assets and liabilities.
F-63
Table of Contents
| (3) | Changes in financial assets and liabilities classified into Level 3 are as follows (Unit: Korean Won in millions): |
| For the year ended December 31, 2010 | ||||||||||||||||||||||||
| January 1, 2010 |
Net income |
Other comprehensive income |
Purchases/ Issuances |
Disposals/ Settlements |
December 31, 2010 |
|||||||||||||||||||
| Financial assets: |
||||||||||||||||||||||||
| Financial assets held for trading |
||||||||||||||||||||||||
| Derivatives instruments assets: |
||||||||||||||||||||||||
| Interest rate derivatives |
444 | 13,585 | — | 385 | (687 | ) | 13,727 | |||||||||||||||||
| Currency derivatives |
15 | 93 | — | 1,505 | (13 | ) | 1,600 | |||||||||||||||||
| Equity derivatives |
67,939 | 87,847 | — | 2,936 | (95,799 | ) | 62,923 | |||||||||||||||||
| Credit derivatives |
6,122 | (2,220 | ) | — | — | (29 | ) | 3,873 | ||||||||||||||||
| Commodity derivatives |
224 | (1,914 | ) | — | 5,935 | (126 | ) | 4,119 | ||||||||||||||||
| Financial assets designed at FVTPL |
||||||||||||||||||||||||
| Corporates |
81,218 | — | — | — | (81,218 | ) | — | |||||||||||||||||
| Equity linked securities |
473,918 | 52,042 | — | 444,503 | (717,145 | ) | 253,318 | |||||||||||||||||
| Asset-backed securities |
47,903 | 5,603 | — | — | — | 53,506 | ||||||||||||||||||
| Equity securities |
15,938 | (1,267 | ) | — | 683 | (5,009 | ) | 10,345 | ||||||||||||||||
| AFS Financial Assets |
||||||||||||||||||||||||
| Debt securities |
||||||||||||||||||||||||
| Financial institutions |
8,800 | — | — | — | — | 8,800 | ||||||||||||||||||
| Corporates |
103,069 | — | 189 | 40,000 | (64,376 | ) | 78,882 | |||||||||||||||||
| Foreign governments |
49,935 | (46 | ) | — | — | (15,439 | ) | 34,450 | ||||||||||||||||
| Equity securities |
3,061,504 | (78,863 | ) | 82,296 | 407,344 | (795,680 | ) | 2,676,601 | ||||||||||||||||
| Beneficiary certificates |
45,955 | 2,162 | — | — | — | 48,117 | ||||||||||||||||||
| Others |
54,250 | — | (1,978 | ) | 3,369 | (25,947 | ) | 29,694 | ||||||||||||||||
| Financial liabilities: |
||||||||||||||||||||||||
| Financial liabilities held for trading |
||||||||||||||||||||||||
| Derivative liabilities |
||||||||||||||||||||||||
| Interest rate derivatives |
1,203 | 8,136 | — | 626 | (180 | ) | 9,785 | |||||||||||||||||
| Currency derivatives |
— | — | — | — | — | — | ||||||||||||||||||
| Stock derivatives |
483,494 | (54,103 | ) | — | 203,284 | (472,635 | ) | 160,040 | ||||||||||||||||
| Credit derivatives |
205,129 | (3,844 | ) | — | 516 | (198,380 | ) | 3,421 | ||||||||||||||||
| Commodity derivatives |
— | 4,044 | — | 6,679 | (176 | ) | 10,547 | |||||||||||||||||
| Financial liabilities designated at FVTPL |
||||||||||||||||||||||||
| Borrowings |
2,003,850 | 246,637 | — | 2,523,899 | (3,008,173 | ) | 1,766,213 | |||||||||||||||||
F-64
Table of Contents
| For the year ended December 31, 2011 | ||||||||||||||||||||||||
| January 1, 2011 |
Net income |
Other comprehensive income |
Purchases/ Issuances |
Disposals/ Settlements |
December 31, 2011 |
|||||||||||||||||||
| Financial assets: |
||||||||||||||||||||||||
| Financial assets held for trading |
||||||||||||||||||||||||
| Derivatives instruments assets: |
||||||||||||||||||||||||
| Interest rate derivatives |
13,727 | 1,470 | — | — | (1,421 | ) | 13,776 | |||||||||||||||||
| Currency derivatives |
1,600 | (68 | ) | — | — | (57 | ) | 1,475 | ||||||||||||||||
| Equity derivatives |
62,923 | (21,039 | ) | — | 35,604 | (23,132 | ) | 54,356 | ||||||||||||||||
| Credit derivatives |
3,873 | 10,798 | — | — | (130 | ) | 14,541 | |||||||||||||||||
| Commodity derivatives |
4,119 | (949 | ) | — | 7,091 | (2,777 | ) | 7,484 | ||||||||||||||||
| Financial assets designed at FVTPL |
||||||||||||||||||||||||
| Corporates |
— | — | — | — | — | — | ||||||||||||||||||
| Equity linked securities |
253,318 | (87,676 | ) | — | 433,589 | (150,440 | ) | 448,791 | ||||||||||||||||
| Asset-backed securities |
53,506 | 1,534 | — | — | (5,678 | ) | 49,362 | |||||||||||||||||
| Equity securities |
10,345 | 1,199 | — | 440 | (764 | ) | 11,220 | |||||||||||||||||
| AFS Financial Assets |
||||||||||||||||||||||||
| Debt securities |
||||||||||||||||||||||||
| Financial institutions |
8,800 | — | — | — | — | 8,800 | ||||||||||||||||||
| Corporates |
78,882 | 2,993 | 153 | 40,000 | (56,720 | ) | 65,308 | |||||||||||||||||
| Foreign governments |
34,450 | 23 | — | — | (32,628 | ) | 1,845 | |||||||||||||||||
| Equity securities |
2,676,601 | (118,025 | ) | 115,824 | 390,970 | (795,828 | ) | 2,269,542 | ||||||||||||||||
| Beneficiary certificates |
48,117 | — | (20 | ) | 100 | (31,988 | ) | 16,209 | ||||||||||||||||
| Others |
29,694 | 1,278 | — | 65,478 | (2,810 | ) | 93,640 | |||||||||||||||||
| Financial liabilities: |
||||||||||||||||||||||||
| Financial liabilities held for trading |
||||||||||||||||||||||||
| Derivative liabilities |
||||||||||||||||||||||||
| Interest rate derivatives |
9,785 | 3,206 | — | — | (182 | ) | 12,809 | |||||||||||||||||
| Currency derivatives |
— | (10 | ) | — | 10 | — | — | |||||||||||||||||
| Stock derivatives |
160,040 | 188,261 | — | 204,829 | (150,191 | ) | 402,939 | |||||||||||||||||
| Credit derivatives |
3,421 | 11,884 | — | 1,047 | (2,101 | ) | 14,251 | |||||||||||||||||
| Commodity derivatives |
10,547 | 2,204 | — | 2,833 | (9,367 | ) | 6,217 | |||||||||||||||||
| Financial liabilities designated at FVTPL |
||||||||||||||||||||||||
| Borrowings |
1,766,213 | (369,611 | ) | — | 2,120,144 | (619,195 | ) | 2,897,551 | ||||||||||||||||
All recognized gains and losses on current period are related to the holding assets of current and previous period-end. Gain and loss on the fair value of derivatives and AFS securities are included in gain and loss on financial assets at FVTPL and AFS financial assets, respectively.
F-65
Table of Contents
| (4) | Fair value and carrying amount of financial assets and liabilities that are recorded at amortized cost are as follows (Unit: Korean Won in millions): |
| January 1, 2010 | December 31, 2010 | December 31, 2011 | ||||||||||||||||||||||
| Fair value | Book value | Fair value | Book value | Fair value | Book value | |||||||||||||||||||
| Financial assets: |
||||||||||||||||||||||||
| HTM financial assets |
16,030,589 | 15,953,709 | 20,148,275 | 19,885,559 | 20,323,593 | 20,036,128 | ||||||||||||||||||
| Loans and receivables |
212,635,296 | 211,057,174 | 217,673,351 | 216,791,805 | 236,723,318 | 235,159,956 | ||||||||||||||||||
| Financial liabilities: |
||||||||||||||||||||||||
| Deposits due to customers |
176,843,676 | 176,926,868 | 185,471,836 | 185,427,625 | 195,908,985 | 195,930,482 | ||||||||||||||||||
| Borrowings |
32,602,144 | 32,455,007 | 34,213,148 | 34,265,662 | 34,491,299 | 34,666,709 | ||||||||||||||||||
| Debentures |
32,974,720 | 32,573,979 | 29,705,810 | 29,110,640 | 30,857,257 | 29,265,833 | ||||||||||||||||||
| Other financial liabilities |
11,214,715 | 11,226,749 | 11,651,871 | 11,648,328 | 19,071,984 | 19,083,709 | ||||||||||||||||||
12. Investments in Jointly Controlled Entities and Associates
| (1) | Investments in jointly controlled entities and associates accounted for using the equity method are as follows (Unit: Korean Won in millions): |
| January 1, 2010 | December 31, 2010 | December 31, 2011 | ||||||||||||||||||||||||||||
| Subsidiaries |
Capital | Main business |
Number of shares owned |
Percentage of owner- ship (%) |
Number of shares owned |
Percentage of owner- ship (%) |
Number of shares owned |
Percentage of owner- ship (%) |
||||||||||||||||||||||
| Woori Finance Holdings: |
||||||||||||||||||||||||||||||
| Woori Aviva Life Insurance Co., Ltd.(*1) |
73,700 | Life insurance | 3,060,000 | 51.0 | 7,601,091 | 51.6 | 7,601,091 | 51.6 | ||||||||||||||||||||||
| Woori Bank, Kyongnam Bank, Kwangju Bank, Woori Financial, Woori Investment & Securities and Woori Private Equity Fund: |
||||||||||||||||||||||||||||||
| Woori Blackstone Korea Opportunity Private Equity Fund I(*2) |
351,500 | Financial business |
2,700mil. | 44.6 | 2,700mil. | 44.6 | 156,600mil. | 44.6 | ||||||||||||||||||||||
| Woori Bank, Kyongnam Bank and Kwangju Bank: |
||||||||||||||||||||||||||||||
| Korea Credit Bureau Co., Ltd.(*3) |
10,000 | Credit information |
180,000 | 9.0 | 180,000 | 9.0 | 180,000 | 9.0 | ||||||||||||||||||||||
| Woori Bank and Kyongnam Bank: |
||||||||||||||||||||||||||||||
| BC Card Co., Ltd.(*4) |
44,000 | Credit card service |
1,303,920 | 29.6 | 1,303,920 | 29.6 | — | — | ||||||||||||||||||||||
| Woori Bank: |
||||||||||||||||||||||||||||||
| Korea Finance Security Co., Ltd.(*3) |
6,000 | Security service |
183,870 | 15.3 | 183,870 | 15.3 | 183,870 | 15.3 | ||||||||||||||||||||||
| Woori Service Networks Co., Ltd.(*3) |
500 | Freight & staffing services |
4,704 | 4.9 | 4,704 | 4.9 | 4,704 | 4.9 | ||||||||||||||||||||||
| Kumho Tire Co., Inc.(*5) |
482,800 | Manufacturing | — | — | 22,514,800 | 24.2 | 22,514,800 | 23.3 | ||||||||||||||||||||||
| United PF 1st Corporate Financial Stability(*6) |
605,000 | Financial business |
— | — | — | — | 148,000 | 18.5 | ||||||||||||||||||||||
| LIG E&C Co., Ltd.(*10) |
16,300 | Construction | — | — | — | — | 775,946 | 23.2 | ||||||||||||||||||||||
| Hyunjin Co., Ltd.(*10) |
38,400 | ” | — | — | — | — | 1,667,600 | 21.7 | ||||||||||||||||||||||
F-66
Table of Contents
| January 1, 2010 | December 31, 2010 | December 31, 2011 | ||||||||||||||||||||||||||||
| Subsidiaries |
Capital | Main business |
Number of shares owned |
Percentage of owner- ship (%) |
Number of shares owned |
Percentage of owner- ship (%) |
Number of shares owned |
Percentage of owner- ship (%) |
||||||||||||||||||||||
| Woori F&I: |
||||||||||||||||||||||||||||||
| Woori SB Fifth Asset Securitization Specialty |
2,900 | Other financial business |
171,456 | 30.0 | 171,456 | 30.0 | 171,456 | 30.0 | ||||||||||||||||||||||
| Woori SB Sixth Asset Securitization Specialty |
2,900 | ” | 200,742 | 30.0 | — | — | — | — | ||||||||||||||||||||||
| Woori SB Seventh Asset Securitization Specialty |
2,900 | ” | 165,760 | 30.0 | — | — | — | — | ||||||||||||||||||||||
| Woori SB Eighth Asset Securitization Specialty(*8) |
1,900 | ” | 149,336 | 40.0 | 149,336 | 40.0 | — | — | ||||||||||||||||||||||
| Woori SB Ninth Asset Securitization Specialty(*8) |
400 | ” | 119,142 | 45.0 | 38,142 | 45.0 | — | — | ||||||||||||||||||||||
| Woori SB Eleventh Asset Securitization Specialty(*7) |
1,200 | ” | 157,527 | 45.0 | 103,527 | 45.0 | 40,527 | 45.0 | ||||||||||||||||||||||
| Woori SB Twelfth Asset Securitization Specialty(*7) |
1,400 | ” | 157,544 | 40.0 | 109,544 | 40.0 | 101,544 | 40.0 | ||||||||||||||||||||||
| Woori BC Pegasus Asset Securitization Specialty |
9,700 | ” | 581,580 | 30.0 | 581,580 | 30.0 | 581,580 | 30.0 | ||||||||||||||||||||||
| Woori Stream Second Asset Securitization Specialty(*8) |
1,500 | ” | 155,088 | 40.0 | 143,088 | 40.0 | — | — | ||||||||||||||||||||||
| Woori Stream Third Asset Securitization Specialty(*7) |
1,500 | ” | 152,472 | 40.0 | 132,472 | 40.0 | 120,472 | 40.0 | ||||||||||||||||||||||
| Woori Stream Fourth Asset Securitization Specialty(*7) |
1,600 | ” | 193,808 | 40.0 | 129,808 | 40.0 | 125,808 | 40.0 | ||||||||||||||||||||||
| Woori HB First Asset Securitization Specialty |
50 | ” | 3,712 | 40.0 | 3,712 | 40.0 | 3,712 | 40.0 | ||||||||||||||||||||||
| Woori HB Second Asset Securitization Specialty(*8) |
50 | ” | 8,888 | 40.0 | 8,888 | 40.0 | — | — | ||||||||||||||||||||||
| Woori Piastone Bridge Asset Securitization Specialty(*7) |
300 | ” | 54,336 | 40.0 | 54,336 | 40.0 | 22,336 | 40.0 | ||||||||||||||||||||||
| Woori EA First Asset Securitization Specialty |
100 | ” | 8,000 | 40.0 | 8,000 | 40.0 | 8,000 | 40.0 | ||||||||||||||||||||||
| Woori EA Second Asset Securitization Specialty |
100 | ” | 8,000 | 40.0 | 8,000 | 40.0 | 8,000 | 40.0 | ||||||||||||||||||||||
| Woori EA Sixth Asset Securitization Specialty |
100 | ” | 8,000 | 40.0 | 8,000 | 40.0 | 8,000 | 40.0 | ||||||||||||||||||||||
| Woori EA Seventh Asset Securitization Specialty |
60 | ” | 5,652 | 45.0 | 5,652 | 45.0 | 5,652 | 45.0 | ||||||||||||||||||||||
| Woori EA Ninth Asset Securitization Specialty |
100 | ” | 8,000 | 40.0 | 8,000 | 40.0 | 8,000 | 40.0 | ||||||||||||||||||||||
| Woori EA Eleventh Asset Securitization Specialty(*9) |
2,600 | ” | — | — | — | — | 68,905 | 45.0 | ||||||||||||||||||||||
| CW Two Partners Co., Ltd. |
100 | ” | 12,999 |
|
50.0 -1share |
|
12,999 |
|
50.0 -1share |
|
12,999 |
|
50.0 -1share |
| ||||||||||||||||
| Woori F&I Fifteenth Asset Securitization Specialty(*8) |
10 | ” | 120 | 40.0 | 120 | 40.0 | — | — | ||||||||||||||||||||||
| KAMCO Fifth Asset Securitization Specialty |
25,700 | ” | 87,013 | 24.0 | 87,013 | 24.0 | 87,013 | 24.0 | ||||||||||||||||||||||
| KAMCO Sixth Asset Securitization Specialty |
2,400 | ” | 212,553 | 45.0 | 212,553 | 45.0 | 212,553 | 45.0 | ||||||||||||||||||||||
| KAMCO Seventh Asset Securitization Specialty |
600 | ” | 51,417 | 45.0 | 51,417 | 45.0 | 51,417 | 45.0 | ||||||||||||||||||||||
| Woori Tomato Second Asset Securitization Specialty(*8) |
10 | ” | 135 | 45.0 | 135 | 45.0 | — | — | ||||||||||||||||||||||
| Woori Fine First Asset Securitization Specialty |
1,500 | ” | 135,900 | 45.0 | 135,900 | 45.0 | 135,900 | 45.0 | ||||||||||||||||||||||
| Hiking-Woori Capital(*8) |
500 | ” | 245,000 | 49.0 | 245,000 | 49.0 | — | — | ||||||||||||||||||||||
| Woori-Consus Capital(*8) |
500 | ” | 220,000 | 44.0 | 220,000 | 44.0 | — | — | ||||||||||||||||||||||
F-67
Table of Contents
| January 1, 2010 | December 31, 2010 | December 31, 2011 | ||||||||||||||||||||||||||||
| Subsidiaries |
Capital | Main business |
Number of shares owned |
Percentage of owner- ship (%) |
Number of shares owned |
Percentage of owner- ship (%) |
Number of shares owned |
Percentage of owner- ship (%) |
||||||||||||||||||||||
| Chungdo Woori Century Security Corp., Ltd.(*11) |
16,500 | ” | 49,987,530 | 49.5 | 49,987,530 | 49.5 | 49,987,530 | 49.5 | ||||||||||||||||||||||
| Woori Private Equity Fund: |
||||||||||||||||||||||||||||||
| Phoenix Digital Tech Co., Ltd. |
5,500 | Semiconductor equipment |
500,000 | 50.0 | 500,000 | 50.0 | 500,000 | 50.0 | ||||||||||||||||||||||
| Woori Renaissance Holdings(*1) |
200 | Other financial business |
1,260 | 51.6 | 1,260 | 51.6 | 1,260 | 51.6 | ||||||||||||||||||||||
| Bonghwang Semiconductor Yuhan Gongsa(*11)(*12) |
31,000 | Semiconductor packaging |
— | 30.0 | — | 30.0 | — | 30.0 | ||||||||||||||||||||||
| BK LCD Co., Ltd. |
5,400 | ” | 2,644,426 | 24.5 | — | — | — | — | ||||||||||||||||||||||
| MARS First: |
||||||||||||||||||||||||||||||
| Sempio Foods Co., Ltd.(*11) |
4,400 | Food & beverages manufacturing |
1,465,446 | 33.0 | 1,465,446 | 33.0 | 1,465,446 | 33.0 | ||||||||||||||||||||||
| MARS Second: |
||||||||||||||||||||||||||||||
| Seoul Lakeside Co., Ltd. |
1,600 | Hotel | 76,000 | 47.5 | 76,000 | 47.5 | 76,000 | 47.5 | ||||||||||||||||||||||
| (*1) | Woori Aviva Life Insurance Co. Ltd. is accounted for using the equity method as the investee is subject to joint control in accordance with the joint agreement with Aviva Group, which outlines that the decision making on operating, investment and financing activities are made by the board members. Woori and Aviva, each can have rights to appoint half of the board of directors, respectively. |
| Woori Renaissance Holdings is accounted for using the equity method as the investee subject to joint control in accordance with the joint agreement between Woori Private Equity Fund and Woori Renaissance Private Equity Fund, by contractual commitment, respectively. |
| (*2) | The number of shares increased due to the additional investment during the year ended December 31, 2011. |
| (*3) | Woori Bank, a subsidiary, can exercise the significant influence over Korea Credit Bureau and Korea Finance Security. Important transactions of Woori Service Network are mainly arranged with Woori Bank. |
| (*4) | Woori Bank, a subsidiary, sold its 20% ownership interest out of 29.6% of total equity of BC Card Co., Ltd. as therefore the remaining investments is reclassified to assets held for sale and excluded from equity method accounting. |
| (*5) | The Company’s ownership interest changed due to a disproportionate increase in paid-in capital of investee during the year ended December 31, 2011. |
| (*6) | Woori Bank, a subsidiary, acquired 18.5% ownership interest of United PF 1st Corporate financial stability (“United PF”) during the year ended December 31, 2011. The Woori Bank has significant influence by participating as limited partnership of United PF on the decision making of board of investment deliberation which is a major operating decision making organization. In addition, there exists a significant transaction relationship between United PF and Woori Bank. |
| (*7) | The investees decreased their capital, resulting in a decrease in number of shares owned. |
| (*8) | Investee is liquidated during the year ended December 31, 2011. |
| (*9) | Woori F&I, a subsidiary, acquired 45% shares of Woori EA Eleventh Asset Securitization Specialty during the year ended December 31, 2011. |
| (*10) | The Group is holding 755,946 shares (holding ratio : 23.2%) of LIG E&C Co., Ltd and 1,667,600 shares (holding ratio : 21.7%) of Hyunjin Co., Ltd besides investments in associates above due to the conversion of investment on written-off loans for the year ended 2011, and the book value of the investments is zero as of the conversion date and December 31, 2011. |
| (*11) | The fiscal year end of all subsidiaries is as of December 31 except Bonghwang Semiconductor Yuhan Gongsa and Sempio Foods Co., Ltd. which are as of September 30. |
| (*12) | All investments in jointly controlled entities and associates are located in Korea except for Chungdo Woori Century Security Corp., Ltd and Bonghwang Semiconductor Yuhan Gongsa in China. |
F-68
Table of Contents
| (2) | Changes in carrying value of investments in jointly controlled entities and associates accounted for using the equity method are as follows (Unit: Korean Won in millions): |
| For the year ended December 31, 2010 | ||||||||||||||||||||||||||||||||||||
| Acquisition cost |
January 1, 2010 |
Equity in net earnings or losses |
Acquisi- tion |
Disposi- tion |
Dividends | Capital | Other change |
December 31, 2010 |
||||||||||||||||||||||||||||
| Woori Aviva Life Insurance Co., Ltd |
74,310 | 74,310 | (6,538 | ) | 33,150 | — | — | 3,236 | — | 104,158 | ||||||||||||||||||||||||||
| Woori Blackstone Korea Opportunity First |
2,700 | — | (2,650 | ) | 2,700 | — | — | — | — | 50 | ||||||||||||||||||||||||||
| Korea Credit Bureau |
4,500 | 3,115 | 339 | — | — | — | — | — | 3,454 | |||||||||||||||||||||||||||
| BC Card Co., Ltd. |
11,668 | 196,065 | 46,624 | — | — | (65,725 | ) | (29,400 | ) | — | 147,564 | |||||||||||||||||||||||||
| Korea Finance Security Co., Ltd. |
758 | 3,337 | 154 | — | — | (55 | ) | — | — | 3,436 | ||||||||||||||||||||||||||
| Woori Service Networks Co., Ltd. |
24 | 108 | (2 | ) | — | — | (2 | ) | — | — | 104 | |||||||||||||||||||||||||
| Kumho Tire Co., Inc.(*1) |
113,204 | — | — | 113,204 | — | — | — | — | 113,204 | |||||||||||||||||||||||||||
| Woori SME First ABS Specialty Co. Ltd. |
415 | 406 | (1 | ) | — | (405 | ) | — | 6 | (6 | ) | — | ||||||||||||||||||||||||
| Woori SB Fifth Asset Securitization Specialty |
3,773 | 1,081 | (73 | ) | — | — | — | — | — | 1,008 | ||||||||||||||||||||||||||
| Woori SB Eighth Asset Securitization Specialty |
2,787 | 1,575 | (357 | ) | — | — | — | — | — | 1,218 | ||||||||||||||||||||||||||
| Woori SB Ninth Asset Securitization Specialty |
1,907 | 5,166 | 605 | — | — | (1 | ) | (4,047 | ) | — | 1,723 | |||||||||||||||||||||||||
| Woori SB Eleventh Asset Securitization Specialty |
5,176 | 7,554 | 258 | — | — | (568 | ) | (2,699 | ) | — | 4,545 | |||||||||||||||||||||||||
| Woori SB Twelfth Asset Securitization Specialty |
5,477 | 9,220 | 1,183 | — | — | (2,989 | ) | (2,398 | ) | — | 5,016 | |||||||||||||||||||||||||
| Woori BC Pegasus Asset Securitization Specialty |
2,908 | — | (1,828 | ) | — | — | — | — | 1,828 | — | ||||||||||||||||||||||||||
| Woori Stream Third Asset Securitization Specialty |
2,664 | 2,400 | (45 | ) | — | — | — | (1,001 | ) | — | 1,354 | |||||||||||||||||||||||||
| Woori Stream Fourth Asset Securitization Specialty |
3,650 | 3,698 | 219 | — | — | — | (3,201 | ) | — | 716 | ||||||||||||||||||||||||||
| Woori HB First Asset Securitization Specialty |
186 | 852 | 1,138 | — | — | (1,623 | ) | — | — | 367 | ||||||||||||||||||||||||||
| Woori Piastone Bridge Asset Securitization Specialty |
2,717 | 2,414 | 2,728 | — | — | (1,544 | ) | — | — | 3,598 | ||||||||||||||||||||||||||
| Woori EA First Asset Securitization Specialty |
400 | 335 | (1,951 | ) | — | — | — | — | 1,616 | — | ||||||||||||||||||||||||||
| Woori EA Second Asset Securitization Specialty |
400 | — | 500 | 400 | — | — | (1 | ) | — | 899 | ||||||||||||||||||||||||||
| Woori EA Sixth Asset Securitization Specialty |
400 | — | (523 | ) | 400 | — | — | (1 | ) | 124 | — | |||||||||||||||||||||||||
| Woori EA Seventh Asset Securitization Specialty |
1,611 | — | 356 | 1,611 | — | — | (1 | ) | — | 1,966 | ||||||||||||||||||||||||||
| Woori EA Ninth Asset Securitization Specialty |
400 | — | (15 | ) | 400 | — | — | (1 | ) | — | 384 | |||||||||||||||||||||||||
| CW Two Partners Co., Ltd. |
605 | — | (469 | ) | 605 | — | — | (2 | ) | — | 134 | |||||||||||||||||||||||||
| Woori F&I Fifteenth Asset Securitization Specialty |
1 | — | 565 | 10 | — | — | (9 | ) | — | 566 | ||||||||||||||||||||||||||
| KAMCO Fifth Asset Securitization Specialty |
8,736 | — | 2,030 | 8,736 | — | — | (2 | ) | — | 10,764 | ||||||||||||||||||||||||||
| KAMCO Sixth Asset Securitization Specialty |
5,314 | — | 1,268 | 5,314 | — | — | (16 | ) | — | 6,566 | ||||||||||||||||||||||||||
F-69
Table of Contents
| For the year ended December 31, 2010 | ||||||||||||||||||||||||||||||||||||
| Acquisition cost |
January 1, 2010 |
Equity in net earnings or losses |
Acquisi- tion |
Disposi- tion |
Dividends | Capital | Other change |
December 31, 2010 |
||||||||||||||||||||||||||||
| KAMCO Seventh Asset Securitization Specialty |
1,285 | — | (71 | ) | 1,285 | — | — | (4 | ) | — | 1,210 | |||||||||||||||||||||||||
| Woori Tomato Second Asset Securitization Specialty |
1 | — | (1,332 | ) | 1 | — | — | — | 1,331 | — | ||||||||||||||||||||||||||
| Woori Fine First Asset Securitization Specialty |
15,697 | — | (40 | ) | 15,697 | — | — | (10 | ) | — | 15,647 | |||||||||||||||||||||||||
| Woori SB Sixth Asset Securitization Specialty |
5,477 | 1,441 | 3 | — | (1,441 | ) | — | 22 | (25 | ) | — | |||||||||||||||||||||||||
| Woori SB Seventh Asset Securitization Specialty |
3,585 | 2,417 | 5 | — | (2,417 | ) | — | 12 | (17 | ) | — | |||||||||||||||||||||||||
| Woori Tomato First Asset Securitization Specialty |
1 | 1,353 | 1,772 | — | (1,727 | ) | (1,725 | ) | — | 327 | — | |||||||||||||||||||||||||
| Woori Marine Third Asset Securitization Specialty |
5,952 | 1,370 | (3 | ) | — | — | — | (1,358 | ) | (9 | ) | — | ||||||||||||||||||||||||
| Woori Stream Second Asset Securitization Specialty |
2,554 | 803 | 117 | — | (207 | ) | — | (585 | ) | (128 | ) | — | ||||||||||||||||||||||||
| Woori HB Second Asset Securitization Specialty |
444 | 292 | 574 | — | (437 | ) | — | 1 | (430 | ) | — | |||||||||||||||||||||||||
| Woori F&I Ninth Asset Securitization Specialty |
1,713 | — | 1,241 | — | — | (1,653 | ) | — | 412 | — | ||||||||||||||||||||||||||
| Woori F&I Twelfth Asset Securitization Specialty |
9,053 | 33 | 2,727 | — | — | — | — | (2,760 | ) | — | ||||||||||||||||||||||||||
| Woori F&I Fourteenth Asset Securitization Specialty |
1,508 | — | (1,279 | ) | — | — | — | — | 1,279 | — | ||||||||||||||||||||||||||
| Hiking-Woori Capital |
230 | — | (57 | ) | 213 | — | — | 53 | — | 209 | ||||||||||||||||||||||||||
| Woori-Consus Capital |
203 | — | (2,262 | ) | — | — | — | 90 | 2,172 | — | ||||||||||||||||||||||||||
| Chungdo Woori Century Security Corp. |
8,187 | — | 21 | 8,187 | — | — | 436 | — | 8,644 | |||||||||||||||||||||||||||
| Phoenix Digital Tech Co., Ltd. |
10,459 | 10,458 | (1,729 | ) | — | — | — | — | 104 | 8,833 | ||||||||||||||||||||||||||
| Woori Renaissance Holdings |
63,000 | 58,542 | (3,500 | ) | — | — | — | 110 | 763 | 55,915 | ||||||||||||||||||||||||||
| Bonghwang Semiconductor Yuhan Gongsa |
11,905 | 27,770 | 115 | — | — | — | — | (15,707 | ) | 12,178 | ||||||||||||||||||||||||||
| Sempio Foods Company (*2) |
26,578 | 36,053 | 1,350 | — | — | (333 | ) | 693 | 4 | 37,767 | ||||||||||||||||||||||||||
| Seoul Lakeside Co., Ltd. |
270,000 | 203,553 | (11,241 | ) | — | — | — | — | (665 | ) | 191,647 | |||||||||||||||||||||||||
|
|
|
|
|
|
|
|
|
|
|
|
|
|
|
|
|
|
|
|||||||||||||||||||
| Total |
694,523 | 655,721 | 29,926 | 191,913 | (6,634 | ) | (76,218 | ) | (40,077 | ) | (9,787 | ) | 744,844 | |||||||||||||||||||||||
|
|
|
|
|
|
|
|
|
|
|
|
|
|
|
|
|
|
|
|||||||||||||||||||
| For the year ended December 31, 2011 | ||||||||||||||||||||||||||||||||||||
| Acquisition cost |
January 1, 2011 |
Equity in net earnings or losses |
Acquisi- tion |
Disposi- tion |
Dividends | Capital | Other change |
December 31, 2011 |
||||||||||||||||||||||||||||
| Woori Aviva Life Insurance Co., Ltd. |
110,098 | 104,158 | 2,744 | — | — | — | 3,857 | 4,099 | 114,858 | |||||||||||||||||||||||||||
| Woori Blackstone Korea Opportunity First |
156,600 | 50 | 5,681 | 153,900 | — | — | — | — | 159,631 | |||||||||||||||||||||||||||
| Korea Credit Bureau |
4,500 | 3,454 | 458 | — | — | — | — | — | 3,912 | |||||||||||||||||||||||||||
| BC Card Co., Ltd. |
11,668 | 147,564 | — | — | (11,294 | ) | — | (24,788 | ) | (111,482 | ) | — | ||||||||||||||||||||||||
| Korea Finance Security Co., Ltd. |
758 | 3,436 | 87 | — | — | (55 | ) | — | — | 3,468 | ||||||||||||||||||||||||||
| Woori Service Networks Co., Ltd. |
24 | 104 | 6 | — | — | (12 | ) | — | — | 98 | ||||||||||||||||||||||||||
| Kumho Tire Co., Inc. (*1) |
113,204 | 113,204 | (12,952 | ) | — | — | — | (3,560 | ) | 14,665 | 111,357 | |||||||||||||||||||||||||
| United PF 1st Corporate financial stability |
148,000 | — | 1,099 | 148,000 | — | — | — | — | 149,099 | |||||||||||||||||||||||||||
F-70
Table of Contents
| For the year ended December 31, 2011 | ||||||||||||||||||||||||||||||||||||
| Acquisition cost |
January 1, 2011 |
Equity in net earnings or losses |
Acquisi- tion |
Disposi- tion |
Dividends | Capital | Other change |
December 31, 2011 |
||||||||||||||||||||||||||||
| Woori SB Fifth Asset Securitization Specialty |
3,773 | 1,008 | (27 | ) | — | — | — | — | — | 981 | ||||||||||||||||||||||||||
| Woori SB Eighth Asset Securitization Specialty |
2,787 | 1,218 | 76 | — | (1,294 | ) | — | — | — | — | ||||||||||||||||||||||||||
| Woori SB Ninth Asset Securitization Specialty |
1,907 | 1,723 | 13 | — | (161 | ) | — | (1,575 | ) | — | — | |||||||||||||||||||||||||
| Woori SB Eleventh Asset Securitization Specialty |
5,176 | 4,545 | (89 | ) | — | — | (495 | ) | (3,150 | ) | — | 811 | ||||||||||||||||||||||||
| Woori SB Twelfth Asset Securitization Specialty |
5,477 | 5,016 | 47 | — | — | (709 | ) | (400 | ) | — | 3,954 | |||||||||||||||||||||||||
| Woori BC Pegasus Asset Securitization Specialty |
2,908 | — | (2,462 | ) | — | — | — | — | 2,462 | — | ||||||||||||||||||||||||||
| Woori Stream Third Asset Securitization Specialty |
2,664 | 1,354 | 195 | — | — | — | (600 | ) | — | 949 | ||||||||||||||||||||||||||
| Woori Stream Fourth Asset Securitization Specialty |
3,650 | 716 | (11 | ) | — | — | — | (200 | ) | — | 505 | |||||||||||||||||||||||||
| Woori HB First Asset Securitization Specialty |
186 | 367 | 1,288 | — | — | (716 | ) | — | — | 939 | ||||||||||||||||||||||||||
| Woori Piastone Bridge Asset Securitization Specialty |
2,717 | 3,598 | 290 | — | — | (1,152 | ) | (1,600 | ) | — | 1,136 | |||||||||||||||||||||||||
| Woori EA First Asset Securitization Specialty |
400 | — | (840 | ) | — | — | (355 | ) | — | 1,195 | — | |||||||||||||||||||||||||
| Woori EA Second Asset Securitization Specialty |
400 | 899 | 20 | — | — | (1,205 | ) | — | 286 | — | ||||||||||||||||||||||||||
| Woori EA Sixth Asset Securitization Specialty |
400 | — | (53 | ) | — | — | (110 | ) | — | 163 | — | |||||||||||||||||||||||||
| Woori EA Seventh Asset Securitization Specialty |
1,611 | 1,966 | 532 | — | — | (271 | ) | — | — | 2,227 | ||||||||||||||||||||||||||
| Woori EA Ninth Asset Securitization Specialty |
400 | 384 | 4,226 | — | — | (950 | ) | — | — | 3,660 | ||||||||||||||||||||||||||
| Woori EA Eleventh Asset Securitization Specialty |
9,905 | — | 1,000 | 9,905 | — | — | (4 | ) | — | 10,901 | ||||||||||||||||||||||||||
| CW Two Partners Co., Ltd. |
605 | 134 | (128 | ) | — | — | — | — | — | 6 | ||||||||||||||||||||||||||
| Woori F&I Fifteenth Asset Securitization Specialty |
1 | 566 | 3,110 | — | — | (4,281 | ) | — | 605 | — | ||||||||||||||||||||||||||
| KAMCO Fifth Asset Securitization Specialty |
8,736 | 10,764 | (960 | ) | — | — | — | — | 3,854 | 13,658 | ||||||||||||||||||||||||||
| KAMCO Sixth Asset Securitization Specialty |
5,314 | 6,566 | 1,741 | — | — | (1,124 | ) | — | — | 7,183 | ||||||||||||||||||||||||||
| KAMCO Seventh Asset Securitization Specialty |
1,285 | 1,210 | 352 | — | — | (473 | ) | — | — | 1,089 | ||||||||||||||||||||||||||
| Woori Tomato Second Asset Securitization Specialty |
1 | — | 3,201 | — | — | (1,912 | ) | — | (1,289 | ) | — | |||||||||||||||||||||||||
| Woori Fine First Asset Securitization Specialty |
15,697 | 15,647 | 2,394 | — | — | (556 | ) | — | — | 17,485 | ||||||||||||||||||||||||||
| Hiking-Woori Capital |
230 | 209 | (8 | ) | — | (189 | ) | — | (12 | ) | — | — | ||||||||||||||||||||||||
| Woori-Consus Capital |
203 | — | (371 | ) | — | — | — | (63 | ) | 434 | — | |||||||||||||||||||||||||
| Chungdo Woori Century Security Corp. |
8,187 | 8,644 | 256 | — | — | — | 518 | — | 9,418 | |||||||||||||||||||||||||||
| Phoenix Digital Tech Co., Ltd. |
10,459 | 8,833 | (14,236 | ) | — | — | — | 5,403 | — | — | ||||||||||||||||||||||||||
| Woori Renaissance Holdings |
63,000 | 55,915 | (23,399 | ) | — | — | — | — | — | 32,516 | ||||||||||||||||||||||||||
F-71
Table of Contents
| For the year ended December 31, 2011 | ||||||||||||||||||||||||||||||||||||
| Acquisition cost |
January 1, 2011 |
Equity in net earnings or losses |
Acquisi- tion |
Disposi- tion |
Dividends | Capital | Other change |
December 31, 2011 |
||||||||||||||||||||||||||||
| Bonghwang Semiconductor Yuhan Gongsa |
11,905 | 12,178 | 105 | — | — | — | (282 | ) | — | 12,001 | ||||||||||||||||||||||||||
| Sempio Foods Company(*2) |
26,578 | 37,767 | 17,248 | — | — | (333 | ) | (428 | ) | 6 | 54,260 | |||||||||||||||||||||||||
| Seoul Lakeside Co., Ltd. |
270,000 | 191,647 | 26,067 | — | — | (5,700 | ) | — | 117 | 212,131 | ||||||||||||||||||||||||||
|
|
|
|
|
|
|
|
|
|
|
|
|
|
|
|
|
|
|
|||||||||||||||||||
| 1,011,414 | 744,844 | 16,700 | 311,805 | (12,938 | ) | (20,409 | ) | (26,884 | ) | (84,885 | ) | 928,233 | ||||||||||||||||||||||||
|
|
|
|
|
|
|
|
|
|
|
|
|
|
|
|
|
|
|
|||||||||||||||||||
| (*1) | The market value of the proportionate of the Woori Bank ownership interest in Kumho Tire Co. Inc. are 312 billion Won and 234 billion Won as of December 31, 2010 and December 31, 2011, respectively. |
| (*2) | The market value of the proportionate of the Woori Investment & Securities ownership interest in Sempio Foods are 26 billion Won and 25 billion Won as of December 31, 2010 and December 31, 2011, respectively. |
If the Group’s share of losses of an investee equals or exceeds its interest in the investee, the Group discontinues recognizing its share of further loss. However, there is no such case during 2010 and 2011.
| (3) | Financial information of investments in jointly controlled entities and associates accounted for using the equity method are as follows (Unit: Korean Won in millions): |
| December 31, 2010 | ||||||||||||||||
| Assets | Liabilities | Operating revenue |
Net income |
|||||||||||||
| Woori Aviva Life Insurance Co., Ltd. |
2,372,448 | 2,232,440 | 1,187,446 | (10,820 | ) | |||||||||||
| Woori Blackstone Korea Opportunity First |
1,679,433 | 1,567,462 | 61,163 | (5,949 | ) | |||||||||||
| Korea Credit Bureau |
44,983 | 9,507 | 33,055 | 4,428 | ||||||||||||
| BC Card Co., Ltd. |
1,913,096 | 1,380,225 | 3,125,476 | 29,899 | ||||||||||||
| Korea Finance Security Co., Ltd. |
24,493 | 2,068 | 41,283 | 1,847 | ||||||||||||
| Woori Service Networks Co., Ltd. |
3,067 | 977 | 11,007 | 883 | ||||||||||||
| Kumho Tire Co., Inc. |
2,516,861 | 2,016,356 | 2,701,990 | 8,901 | ||||||||||||
| Woori SME First ABS Specialty Co. Ltd. |
8,116 | 18 | — | (12 | ) | |||||||||||
| Woori SB Fifth Asset Securitization Specialty |
3,612 | 254 | 13 | (244 | ) | |||||||||||
| Woori SB Eighth Asset Securitization Specialty |
4,020 | 974 | 105 | (892 | ) | |||||||||||
| Woori SB Ninth Asset Securitization Specialty |
3,857 | 28 | 478 | 1,345 | ||||||||||||
| Woori SB Eleventh Asset Securitization Specialty |
10,126 | 25 | 1,917 | 574 | ||||||||||||
| Woori SB Twelfth Asset Securitization Specialty |
12,564 | 25 | 4,732 | 2,957 | ||||||||||||
| Woori BC Pegasus Asset Securitization Specialty |
31,282 | 37,559 | 32 | (6,092 | ) | |||||||||||
| Woori Stream Third Asset Securitization Specialty |
3,401 | 15 | 517 | (112 | ) | |||||||||||
| Woori Stream Fourth Asset Securitization Specialty |
1,800 | 12 | 934 | 547 | ||||||||||||
| Woori HB First Asset Securitization Specialty |
920 | 3 | 3,264 | 2,845 | ||||||||||||
| Woori Piastone Bridge Asset Securitization Specialty |
9,347 | 351 | 9,134 | 6,821 | ||||||||||||
| Woori EA First Asset Securitization Specialty |
113,443 | 117,483 | 14,226 | (4,877 | ) | |||||||||||
| Woori EA Second Asset Securitization Specialty |
34,791 | 32,544 | 6,703 | 1,250 | ||||||||||||
| Woori EA Sixth Asset Securitization Specialty |
115,016 | 115,325 | 8,426 | (1,307 | ) | |||||||||||
| Woori EA Seventh Asset Securitization Specialty |
34,077 | 29,707 | 1,670 | 791 | ||||||||||||
| Woori EA Ninth Asset Securitization Specialty |
139,272 | 138,311 | — | (37 | ) | |||||||||||
| CW Two Partners Co., Ltd. |
5,002 | 4,734 | 1 | (939 | ) | |||||||||||
| Woori F&I Fifteenth Asset Securitization Specialty |
60,658 | 59,236 | 7,812 | 1,412 | ||||||||||||
| KAMCO Fifth Asset Securitization Specialty |
70,330 | 36,175 | 19,043 | 8,457 | ||||||||||||
| KAMCO Sixth Asset Securitization Specialty |
44,232 | 29,631 | 4,865 | 2,818 | ||||||||||||
F-72
Table of Contents
| December 31, 2010 | ||||||||||||||||
| Assets | Liabilities | Operating revenue |
Net income |
|||||||||||||
| KAMCO Seventh Asset Securitization Specialty |
10,362 | 7,662 | 234 | (158 | ) | |||||||||||
| Woori Tomato Second Asset Securitization Specialty |
70,214 | 73,172 | 2,135 | (2,968 | ) | |||||||||||
| Woori Fine First Asset Securitization Specialty |
61,996 | 27,215 | — | (88 | ) | |||||||||||
| Woori Stream Second Asset Securitization Specialty |
806 | 7 | 308 | 293 | ||||||||||||
| Woori HB Second Asset Securitization Specialty |
2,172 | 2 | 1,791 | 1,439 | ||||||||||||
| Hiking-Woori Capital |
608 | 181 | 527 | (115 | ) | |||||||||||
| Woori-Consus Capital |
1,733 | 11,905 | 211 | (5,142 | ) | |||||||||||
| Chungdo Woori Century Security Corp. |
17,966 | 507 | 1,021 | 43 | ||||||||||||
| Phoenix Digital Tech Co., Ltd. |
92,669 | 93,799 | 25,873 | (2,402 | ) | |||||||||||
| Woori Renaissance Holdings |
141,520 | 33,240 | — | (6,778 | ) | |||||||||||
| Bonghwang Semiconductor Yuhan Gongsa |
466,146 | 256,820 | 126,105 | 385 | ||||||||||||
| Sempio Foods Company |
194,710 | 57,190 | 59,131 | 1,893 | ||||||||||||
| Seoul Lakeside Co., Ltd. |
225,069 | 113,125 | 54,564 | 22,171 | ||||||||||||
| December 31, 2011 | ||||||||||||||||
| Assets | Liabilities | Operating revenue |
Net income |
|||||||||||||
| Woori Aviva Life Insurance Co., Ltd. |
3,162,593 | 3,007,653 | 11,829 | 7,460 | ||||||||||||
| Woori Blackstone Korea Opportunity First |
358,946 | 750 | 17,971 | 12,608 | ||||||||||||
| Korea Credit Bureau |
51,484 | 9,650 | 41,409 | 6,380 | ||||||||||||
| Korea Finance Security Co., Ltd. |
24,446 | 1,812 | 42,790 | 1,069 | ||||||||||||
| Woori Service Networks Co., Ltd. |
3,541 | 1,552 | 11,492 | 697 | ||||||||||||
| Kumho Tire Co., Inc. |
4,634,196 | 4,112,068 | 3,946,765 | (39,354 | ) | |||||||||||
| United PF 1st Corporate Financial Stability |
836,104 | 30,162 | 48,117 | 5,942 | ||||||||||||
| Woori SB Fifth Asset Securitization Specialty |
3,616 | 347 | 11 | (89 | ) | |||||||||||
| Woori SB Eleventh Asset Securitization Specialty |
1,824 | 20 | 126 | (198 | ) | |||||||||||
| Woori SB Twelfth Asset Securitization Specialty |
9,902 | 18 | 231 | 117 | ||||||||||||
| Woori BC Pegasus Asset Securitization Specialty |
25,050 | 39,534 | 119 | (8,208 | ) | |||||||||||
| Woori Stream Third Asset Securitization Specialty |
2,399 | 24 | 675 | 488 | ||||||||||||
| Woori Stream Fourth Asset Securitization Specialty |
1,519 | 258 | 86 | (27 | ) | |||||||||||
| Woori HB First Asset Securitization Specialty |
2,351 | 5 | 3,478 | 3,220 | ||||||||||||
| Woori Piastone Bridge Asset Securitization Specialty |
3,984 | 1,142 | 1,000 | 725 | ||||||||||||
| Woori EA First Asset Securitization Specialty |
80,666 | 87,692 | 6,048 | (3,934 | ) | |||||||||||
| Woori EA Second Asset Securitization Specialty |
13,029 | 13,745 | 3,337 | 50 | ||||||||||||
| Woori EA Sixth Asset Securitization Specialty |
42,287 | 43,004 | 15,068 | (133 | ) | |||||||||||
| Woori EA Seventh Asset Securitization Specialty |
10,119 | 5,170 | 5,114 | 1,182 | ||||||||||||
| Woori EA Ninth Asset Securitization Specialty |
39,541 | 30,391 | 22,338 | 10,564 | ||||||||||||
| Woori EA Eleventh Asset Securitization Specialty |
125,608 | 101,386 | 16,154 | 2,222 | ||||||||||||
| CW Two Partners Co., Ltd. |
190 | 177 | 488 | (255 | ) | |||||||||||
| KAMCO Fifth Asset Securitization Specialty |
66,794 | 38,913 | 1,489 | (6,274 | ) | |||||||||||
| KAMCO Sixth Asset Securitization Specialty |
20,240 | 4,268 | 7,027 | 3,869 | ||||||||||||
| KAMCO Seventh Asset Securitization Specialty |
2,437 | 7 | 1,186 | 781 | ||||||||||||
| Woori Fine First Asset Securitization Specialty |
40,120 | 1,257 | 6,808 | 5,319 | ||||||||||||
| Chungdo Woori Century Security Corp. |
20,843 | 1,822 | 2,796 | 516 | ||||||||||||
| Phoenix Digital Tech Co., Ltd. |
51,016 | 55,852 | (700 | ) | (13,823 | ) | ||||||||||
| Woori Renaissance Holdings |
99,240 | 33,842 | (38,772 | ) | (41,338 | ) | ||||||||||
| Bonghwang Semiconductor Yuhan Gongsa |
531,387 | 320,920 | 700 | 842 | ||||||||||||
| Sempio Foods Company |
238,938 | 74,573 | 173,443 | 28,915 | ||||||||||||
| Seoul Lakeside Co., Ltd. |
231,361 | 111,558 | 48,170 | 7,859 | ||||||||||||
F-73
Table of Contents
| (4) | Excluded entity from associates although it’s percentage of ownership is higher than 20% as of December 31, 2011, is as follows (Unit: Korean Won in millions): |
| Number of shares owned | Ownership (%) | |||||||
| Vogo II-2 Investment Holdings Co., Ltd.(*) |
24,064,739,877 | 34.6 | % | |||||
| (*) | The Group invests in the investee as a limited partner and has no participations in decision making process and therefore no significant influence over the investee. |
13. Investment Properties
| (1) | Investment properties are as follows (Unit: Korean Won in millions): |
| January 1, 2010 |
December 31, 2010 |
December 31, 2011 |
||||||||||
| Acquisition cost |
751,210 | 657,240 | 514,819 | |||||||||
| Accumulated depreciation |
(5,084 | ) | (13,969 | ) | (15,820 | ) | ||||||
|
|
|
|
|
|
|
|||||||
| Net carrying value |
746,126 | 643,271 | 498,999 | |||||||||
|
|
|
|
|
|
|
|||||||
| (2) | Changes in investment properties are as follows (Unit: Korean Won in millions): |
| For the year ended December 31 | ||||||||
| 2010 | 2011 | |||||||
| Beginning balance |
746,126 | 643,271 | ||||||
| Acquisition |
— | 1,356 | ||||||
| Disposition |
(985 | ) | (144,097 | ) | ||||
| Depreciation |
(9,576 | ) | (6,462 | ) | ||||
| Impairment loss |
(3,911 | ) | (2,212 | ) | ||||
| Reclassified to assets held for sale |
(42,239 | ) | — | |||||
| Transfer to properties for business use |
(38,193 | ) | (6,464 | ) | ||||
| Foreign currencies translation adjustments |
(25 | ) | 11 | |||||
| Others |
(7,926 | ) | 13,596 | |||||
|
|
|
|
|
|||||
| Ending balance |
643,271 | 498,999 | ||||||
|
|
|
|
|
|||||
| (3) | Fair value of investment properties is 554,722 million Won as of December 31, 2011. |
| (4) | Rental fees earned from investment properties are 13,598 million Won and 13,508 million Won as of December 31, 2010 and December 31, 2011, respectively. |
F-74
Table of Contents
14. Premises and Equipment
| (1) | Premises and equipment are as follows (Unit: Korean Won in millions): |
| January 1, 2010 | ||||||||||||||||||||||||||||
| Land | Building | Properties for business use |
Structures in leased office |
Construction in progress |
Structures | Total | ||||||||||||||||||||||
| Acquisition cost |
1,794,266 | 931,667 | 1,315,258 | 287,414 | 21,293 | 20 | 4,349,918 | |||||||||||||||||||||
| Accumulated depreciation |
— | (4,302 | ) | (1,022,520 | ) | (228,054 | ) | — | (13 | ) | (1,254,889 | ) | ||||||||||||||||
|
|
|
|
|
|
|
|
|
|
|
|
|
|
|
|||||||||||||||
| Net carrying value |
1,794,266 | 927,365 | 292,738 | 59,360 | 21,293 | 7 | 3,095,029 | |||||||||||||||||||||
|
|
|
|
|
|
|
|
|
|
|
|
|
|
|
|||||||||||||||
| December 31, 2010 | ||||||||||||||||||||||||||||
| Land | Building | Properties for business use |
Structures in leased office |
Construction in progress |
Structures | Total | ||||||||||||||||||||||
| Acquisition cost |
1,815,070 | 962,847 | 1,362,004 | 305,447 | 2,404 | 20 | 4,447,792 | |||||||||||||||||||||
| Accumulated depreciation |
— | (31,428 | ) | (1,063,318 | ) | (255,655 | ) | — | (13 | ) | (1,350,414 | ) | ||||||||||||||||
|
|
|
|
|
|
|
|
|
|
|
|
|
|
|
|||||||||||||||
| Net carrying value |
1,815,070 | 931,419 | 298,686 | 49,792 | 2,404 | 7 | 3,097,378 | |||||||||||||||||||||
|
|
|
|
|
|
|
|
|
|
|
|
|
|
|
|||||||||||||||
| December 31, 2011 | ||||||||||||||||||||||||||||
| Land | Building | Properties for business use |
Structures in leased office |
Construction in progress |
Structures | Total | ||||||||||||||||||||||
| Acquisition cost |
1,828,009 | 990,772 | 1,392,065 | 331,517 | 4,433 | 20 | 4,546,816 | |||||||||||||||||||||
| Accumulated depreciation |
— | (60,434 | ) | (1,075,775 | ) | (276,122 | ) | — | (13 | ) | (1,412,344 | ) | ||||||||||||||||
|
|
|
|
|
|
|
|
|
|
|
|
|
|
|
|||||||||||||||
| Net carrying value |
1,828,009 | 930,338 | 316,290 | 55,395 | 4,433 | 7 | 3,134,472 | |||||||||||||||||||||
|
|
|
|
|
|
|
|
|
|
|
|
|
|
|
|||||||||||||||
| (2) | Changes in premises and equipment are as follows (Unit: Korean Won in millions): |
| For the year ended December 31, 2010 | ||||||||||||||||||||||||||||
| Land | Building | Properties for business use |
Structures in leased office |
Construction in progress |
Structures | Total | ||||||||||||||||||||||
| Beginning balance |
1,794,266 | 927,365 | 292,738 | 59,360 | 21,293 | 7 | 3,095,029 | |||||||||||||||||||||
| Acquisition |
38,234 | 36,890 | 117,534 | 21,141 | 5,840 | — | 219,639 | |||||||||||||||||||||
| Disposition (transfer) |
(37,341 | ) | (14,409 | ) | (7,432 | ) | (724 | ) | (24,729 | ) | — | (84,635 | ) | |||||||||||||||
| Depreciation |
— | (27,695 | ) | (110,280 | ) | (30,339 | ) | — | — | (168,314 | ) | |||||||||||||||||
| Impairment loss |
(113 | ) | (289 | ) | — | (323 | ) | — | — | (725 | ) | |||||||||||||||||
| Classified from assets held for sale |
586 | 1,688 | — | — | — | — | 2,274 | |||||||||||||||||||||
| Foreign currencies translation adjustment |
(28 | ) | 2 | (259 | ) | (1,138 | ) | — | — | (1,423 | ) | |||||||||||||||||
| Others |
19,466 | 7,867 | 6,385 | 1,815 | — | — | 35,533 | |||||||||||||||||||||
|
|
|
|
|
|
|
|
|
|
|
|
|
|
|
|||||||||||||||
| Ending balance |
1,815,070 | 931,419 | 298,686 | 49,792 | 2,404 | 7 | 3,097,378 | |||||||||||||||||||||
|
|
|
|
|
|
|
|
|
|
|
|
|
|
|
|||||||||||||||
F-75
Table of Contents
| For the year ended December 31, 2011 | ||||||||||||||||||||||||||||
| Land | Building | Properties for business use |
Structures in leased office |
Construction in progress |
Structures | Total | ||||||||||||||||||||||
| Beginning balance |
1,815,070 | 931,419 | 298,686 | 49,792 | 2,404 | 7 | 3,097,378 | |||||||||||||||||||||
| Acquisition |
7,261 | 33,575 | 159,367 | 30,224 | 20,958 | — | 251,385 | |||||||||||||||||||||
| Disposition (transfer) |
(21,491 | ) | (6,284 | ) | (5,861 | ) | (791 | ) | (18,929 | ) | — | (53,356 | ) | |||||||||||||||
| Depreciation |
— | (29,141 | ) | (119,017 | ) | (23,813 | ) | — | — | (171,971 | ) | |||||||||||||||||
| Impairment loss |
— | (59 | ) | — | — | — | — | (59 | ) | |||||||||||||||||||
| Classified to assets held for sale |
(1,482 | ) | (1,123 | ) | — | — | — | — | (2,605 | ) | ||||||||||||||||||
| Foreign currencies translation adjustment |
15 | (81 | ) | 336 | 178 | — | — | 448 | ||||||||||||||||||||
| Others |
28,636 | 2,032 | (17,221 | ) | (195 | ) | — | — | 13,252 | |||||||||||||||||||
|
|
|
|
|
|
|
|
|
|
|
|
|
|
|
|||||||||||||||
| Ending balance |
1,828,009 | 930,338 | 316,290 | 55,395 | 4,433 | 7 | 3,134,472 | |||||||||||||||||||||
|
|
|
|
|
|
|
|
|
|
|
|
|
|
|
|||||||||||||||
15. Intangible Assets and Goodwill
| (1) | Intangible assets are as follows (Unit: Korean Won in millions): |
| January 1, 2010 | ||||||||||||||||||||||||||||||||
| Goodwill | Core deposit | Software | Industrial rights |
Development cost |
Others | Membership deposit |
Total | |||||||||||||||||||||||||
| Acquisition cost |
120,790 | 3,437 | 97,333 | 222 | 145,224 | 227,114 | 54,693 | 648,813 | ||||||||||||||||||||||||
| Accumulated depreciation |
— | (2,148 | ) | (68,373 | ) | (119 | ) | (76,649 | ) | (143,612 | ) | — | (290,901 | ) | ||||||||||||||||||
| Accumulated impairment losses |
(42,725 | ) | — | — | — | — | — | — | (42,725 | ) | ||||||||||||||||||||||
|
|
|
|
|
|
|
|
|
|
|
|
|
|
|
|
|
|||||||||||||||||
| Net carrying value |
78,065 | 1,289 | 28,960 | 103 | 68,575 | 83,502 | 54,693 | 315,187 | ||||||||||||||||||||||||
|
|
|
|
|
|
|
|
|
|
|
|
|
|
|
|
|
|||||||||||||||||
| December 31, 2010 | ||||||||||||||||||||||||||||||||
| Goodwill | Core deposit | Software | Industrial rights |
Development cost |
Others | Membership deposit |
Total | |||||||||||||||||||||||||
| Acquisition cost |
120,785 | 3,353 | 104,621 | 302 | 164,799 | 226,302 | 68,458 | 688,620 | ||||||||||||||||||||||||
| Accumulated depreciation |
— | (2,431 | ) | (75,918 | ) | (152 | ) | (95,048 | ) | (177,008 | ) | — | (350,557 | ) | ||||||||||||||||||
| Accumulated impairment losses |
(42,725 | ) | — | — | — | — | — | (202 | ) | (42,927 | ) | |||||||||||||||||||||
|
|
|
|
|
|
|
|
|
|
|
|
|
|
|
|
|
|||||||||||||||||
| Net carrying value |
78,060 | 922 | 28,703 | 150 | 69,751 | 49,294 | 68,256 | 295,136 | ||||||||||||||||||||||||
|
|
|
|
|
|
|
|
|
|
|
|
|
|
|
|
|
|||||||||||||||||
| December 31, 2011 | ||||||||||||||||||||||||||||||||
| Goodwill | Core deposit | Software | Industrial rights |
Development cost |
Others | Membership deposit |
Total | |||||||||||||||||||||||||
| Acquisition cost |
151,138 | 14,310 | 124,917 | 350 | 183,492 | 387,420 | 70,111 | 931,738 | ||||||||||||||||||||||||
| Accumulated depreciation |
— | (3,763 | ) | (87,198 | ) | (185 | ) | (117,911 | ) | (231,863 | ) | — | (440,920 | ) | ||||||||||||||||||
| Accumulated impairment losses |
(42,725 | ) | — | — | — | — | — | (202 | ) | (42,927 | ) | |||||||||||||||||||||
|
|
|
|
|
|
|
|
|
|
|
|
|
|
|
|
|
|||||||||||||||||
| Net carrying value |
108,413 | 10,547 | 37,719 | 165 | 65,581 | 155,557 | 69,909 | 447,891 | ||||||||||||||||||||||||
|
|
|
|
|
|
|
|
|
|
|
|
|
|
|
|
|
|||||||||||||||||
F-76
Table of Contents
| (2) | Changes in intangible assets are as follows (Unit: Korean Won in millions): |
| For the year ended December 31, 2010 | ||||||||||||||||||||||||||||||||
| Goodwill | Core deposit |
Software | Industrial rights |
Development cost |
Others | Membership deposit |
Total | |||||||||||||||||||||||||
| Beginning balance |
78,065 | 1,289 | 28,960 | 103 | 68,575 | 83,502 | 54,693 | 315,187 | ||||||||||||||||||||||||
| Acquisition |
— | — | 10,105 | 80 | 19,800 | 16,806 | 13,127 | 59,918 | ||||||||||||||||||||||||
| Disposition |
— | — | (622 | ) | — | (1,899 | ) | (3,193 | ) | (1,328 | ) | (7,042 | ) | |||||||||||||||||||
| Amortization |
— | (340 | ) | (9,813 | ) | (25 | ) | (18,828 | ) | (45,519 | ) | — | (74,525 | ) | ||||||||||||||||||
| Impairment loss |
— | — | — | — | — | — | (202 | ) | (202 | ) | ||||||||||||||||||||||
| Foreign currencies translation adjustment |
(5 | ) | (27 | ) | 38 | — | 11 | (54 | ) | 1,494 | 1,457 | |||||||||||||||||||||
| Others |
— | — | 35 | (8 | ) | 2,092 | (2,248 | ) | 472 | 343 | ||||||||||||||||||||||
|
|
|
|
|
|
|
|
|
|
|
|
|
|
|
|
|
|||||||||||||||||
| Ending balance |
78,060 | 922 | 28,703 | 150 | 69,751 | 49,294 | 68,256 | 295,136 | ||||||||||||||||||||||||
|
|
|
|
|
|
|
|
|
|
|
|
|
|
|
|
|
|||||||||||||||||
| For the year ended December 31, 2011 | ||||||||||||||||||||||||||||||||
| Goodwill | Core deposit |
Software | Industrial rights |
Development cost |
Others | Membership deposit |
Total | |||||||||||||||||||||||||
| Beginning balance |
78,060 | 922 | 28,703 | 150 | 69,751 | 49,294 | 68,256 | 295,136 | ||||||||||||||||||||||||
| Acquisition |
39,284 | 10,915 | 21,507 | 49 | 19,342 | 164,999 | 5,881 | 261,977 | ||||||||||||||||||||||||
| Disposition |
— | — | — | — | (18 | ) | (865 | ) | (2,607 | ) | (3,490 | ) | ||||||||||||||||||||
| Amortization |
— | (1,288 | ) | (12,111 | ) | (34 | ) | (22,991 | ) | (56,215 | ) | — | (92,639 | ) | ||||||||||||||||||
| Impairment loss |
(8,925 | ) | — | — | — | — | (3,176 | ) | (438 | ) | (12,539 | ) | ||||||||||||||||||||
| Foreign currencies translation adjustment |
(6 | ) | (2 | ) | (2 | ) | — | 2 | 35 | (116 | ) | (89 | ) | |||||||||||||||||||
| Others |
— | — | (378 | ) | — | (505 | ) | 1,485 | (1,067 | ) | (465 | ) | ||||||||||||||||||||
|
|
|
|
|
|
|
|
|
|
|
|
|
|
|
|
|
|||||||||||||||||
| Ending balance |
108,413 | 10,547 | 37,719 | 165 | 65,581 | 155,557 | 69,909 | 447,891 | ||||||||||||||||||||||||
|
|
|
|
|
|
|
|
|
|
|
|
|
|
|
|
|
|||||||||||||||||
| (3) | Goodwill is as follows (Unit: Korean Won in millions): |
| Woori Financial |
Kumho Investment bank |
Woori FG Savings Bank |
Others | Total | ||||||||||||||||
| January 1, 2010 |
62,958 | 8,722 | — | 6,385 | 78,065 | |||||||||||||||
|
|
|
|
|
|
|
|
|
|
|
|||||||||||
| Foreign exchange translation adjustment |
— | — | — | (5 | ) | (5 | ) | |||||||||||||
|
|
|
|
|
|
|
|
|
|
|
|||||||||||
| December 31, 2010 |
62,958 | 8,722 | — | 6,380 | 78,060 | |||||||||||||||
|
|
|
|
|
|
|
|
|
|
|
|||||||||||
| Acquisition |
— | — | 39,284 | — | 39,284 | |||||||||||||||
| Goodwill impaired |
— | (8,722 | ) | — | (203 | ) | (8,925 | ) | ||||||||||||
| Foreign exchange translation adjustment |
— | — | — | (6 | ) | (6 | ) | |||||||||||||
|
|
|
|
|
|
|
|
|
|
|
|||||||||||
| December 31, 2011 |
62,958 | — | 39,284 | 6,171 | 108,413 | |||||||||||||||
|
|
|
|
|
|
|
|
|
|
|
|||||||||||
The goodwill recorded is subject to impairment test at least annually or more frequently, whenever there are indications of impairment, and is allocated according to the operating segments (Note 5).
Main assumptions used in the impairment test of the goodwill are as follows:
Goodwill is allocated to reporting units and tested for impairment. The Group determined its reporting units to be Goodwill is allocated to the Group’s cash generating units (“CGU”) and tested for impairment. The Group determined its CGUs to be the same level or one level below as its operating segments. This determination was based on how the Group’s operating segments are managed and how they reflect the manner in which the Group’s chief operating decision maker assesses the Group’s performance and allocate resources.
F-77
Table of Contents
For the impairment tests, the value in use of CGUs was calculated using a discounted cash flow analysis, a form of the income approach, using each CGU’s internal five year forecast and a terminal value calculated using a growth rate reflecting the nominal growth rate of the economy as whole and appropriate discount rates for the respective CGUs. The Group’s discounted cash flow analysis required management to make judgments regarding future revenue growth, credit losses and funding rates. In addition, the Group used the discount rates to reflect the risk and uncertainty related to the current business environment.
To assess the reasonableness of the valuations derived from the discounted cash flow models, the Group also analyzed market-based trading and transaction multiples, where available. These trading and transaction comparables are used to assess the reasonableness of the estimated fair values, as observable market information is generally not available.
| Woori Financial | Woori FG Savings Bank | Others | ||||||||||
| Basis of valuation |
DCF Model | DCF Model | DCF Model | |||||||||
| Period of the projections of cash flows(*1) |
5 years | 5 years | 5 years | |||||||||
| Growth rate |
2 | % | 3 | % | 0 | % | ||||||
| Discount rate(*2) |
12.41 | % | 11.95 | % | 20 | % | ||||||
| (*1) | The cashflow projections are prepared using internal budget and growth plans of the management, based on historical data, market expectations and conditions such as industry growth, interest rate and inflation. |
| (*2) | The discount rate is calculated based on the capital asset pricing model (CAPM). |
16. Assets Held for Sale
Assets held for sale are as follows (Unit: Korean Won in millions):
| January 1, 2010 | December 31, 2010 | December 31, 2011 | ||||||||||
| Investment properties |
20,814 | 81,308 | 53,985 | |||||||||
| Premises and equipment |
7,609 | 5,185 | 2,258 | |||||||||
| Others |
— | 1,433 | — | |||||||||
|
|
|
|
|
|
|
|||||||
| Total |
28,423 | 87,926 | 56,243 | |||||||||
|
|
|
|
|
|
|
|||||||
17. Assets Subjected to Lien and Assets Acquired through Foreclosures
| (1) | Assets subjected to lien are as follows (Unit: Korean Won in millions): |
| Collateral given to |
January 1, 2010 |
December 31, 2010 |
December 31, 2011 |
Reason for | ||||||||||||
| Deposits |
Credit-agricole Bank and others |
438,901 | 322,924 | 218,496 | Security on borrowings and others | |||||||||||
| Securities |
Korea Securities Depository and others |
17,180,241 | 17,123,372 | 18,427,862 | Collateral repurchase agreement and others | |||||||||||
| Land and building |
Shinhan Card and others |
128,169 | 122,683 | 93,220 | Leasehold rights and others | |||||||||||
|
|
|
|
|
|
|
|||||||||||
| Total |
17,747,311 | 17,568,979 | 18,739,578 | |||||||||||||
|
|
|
|
|
|
|
|||||||||||
| (2) | Assets acquired through foreclosures are as follows (Unit: Korean Won in millions): |
| January 1, 2010 | December 31, 2010 | December 31, 2011 | ||||||||||
| Land (assets held for sale) |
521 | 508 | — | |||||||||
| Building |
2,973 | 2,853 | 555 | |||||||||
|
|
|
|
|
|
|
|||||||
| Total |
3,494 | 3,361 | 555 | |||||||||
|
|
|
|
|
|
|
|||||||
F-78
Table of Contents
18. Other Assets
Other assets are as follows (Unit: Korean Won in millions):
| January 1, 2010 | December 31, 2010 | December 31, 2011 | ||||||||||
| Prepaid expenses |
234,423 | 196,302 | 249,702 | |||||||||
| Advance payments |
57,344 | 60,745 | 16,513 | |||||||||
| Leased assets |
57,642 | 16,492 | 3,403 | |||||||||
| Non-operative assets |
2,973 | 2,853 | 555 | |||||||||
| Others |
132,440 | 102,469 | 106,886 | |||||||||
|
|
|
|
|
|
|
|||||||
| Total |
484,822 | 378,861 | 377,059 | |||||||||
|
|
|
|
|
|
|
|||||||
19. Financial Liability at FVTPL
Financial liabilities at FVTPL consist of financial liabilities held for trading and financial liabilities designated at FVTPL.
| (1) | Financial liabilities held for trading are as follows (Unit: Korean Won in millions): |
| January 1, 2010 | December 31, 2010 | December 31, 2011 | ||||||||||
| Borrowings: |
||||||||||||
| Warrants in short position |
23,275 | 58,745 | 10,309 | |||||||||
| Securities in short position |
567,277 | 798,353 | 626,879 | |||||||||
|
|
|
|
|
|
|
|||||||
| Sub-total |
590,552 | 857,098 | 637,188 | |||||||||
|
|
|
|
|
|
|
|||||||
| Derivative liabilities: |
||||||||||||
| Interest rate derivatives |
1,451,339 | 1,518,168 | 1,670,845 | |||||||||
| Currency derivatives |
2,498,632 | 1,844,894 | 1,689,844 | |||||||||
| Stock derivatives |
698,639 | 246,571 | 516,834 | |||||||||
| Credit derivatives |
208,569 | 3,665 | 21,559 | |||||||||
| Commodity derivatives |
44,381 | 36,377 | 25,753 | |||||||||
| Others |
462 | — | 109 | |||||||||
|
|
|
|
|
|
|
|||||||
| Sub-total |
4,902,022 | 3,649,675 | 3,924,944 | |||||||||
|
|
|
|
|
|
|
|||||||
| Total |
5,492,574 | 4,506,773 | 4,562,132 | |||||||||
|
|
|
|
|
|
|
|||||||
| (2) | Financial liabilities designated at FVTPL are as follows (Unit: Korean Won in millions): |
| January 1, 2010 | December 31, 2010 | December 31, 2011 | ||||||||||
| Borrowings: |
||||||||||||
| Equity linked securities in short position |
3,139,490 | 2,693,659 | 4,634,724 | |||||||||
| Equity linked securities index in short position |
98,964 | 128,569 | 102,483 | |||||||||
|
|
|
|
|
|
|
|||||||
| Sub-total |
3,238,454 | 2,822,228 | 4,737,207 | |||||||||
|
|
|
|
|
|
|
|||||||
| Debentures: |
||||||||||||
| Debentures in local currency |
271,338 | 238,736 | 226,432 | |||||||||
| Debentures in foreign currencies |
1,415,655 | 1,273,039 | 95,775 | |||||||||
| Discount |
(2,951 | ) | (2,495 | ) | — | |||||||
|
|
|
|
|
|
|
|||||||
| Sub-total |
1,684,042 | 1,509,280 | 322,207 | |||||||||
|
|
|
|
|
|
|
|||||||
| Total |
4,922,496 | 4,331,508 | 5,059,414 | |||||||||
|
|
|
|
|
|
|
|||||||
F-79
Table of Contents
| (3) | Credit risk adjustments to financial liabilities designated at FVTPL are as follows (Unit: Korean Won in millions): |
| January 1, 2010 | December 31, 2010 | December 31, 2011 | ||||||||||
| Financial liabilities designated at FVTPL subject to credit risk adjustments |
4,922,496 | 4,331,508 | 5,059,414 | |||||||||
| Credit risk adjustments |
— | 8,713 | 31,735 | |||||||||
| Accumulated changes in credit risk adjustments |
(5,566 | ) | 3,147 | 34,882 | ||||||||
Credit risk adjustments are applied to reflect the Group’s own credit risk when measuring derivative liabilities at fair value. The methodology to determine the adjustment incorporates the Group’s credit spread as observed through credit rating.
| (4) | Financial liabilities at FVTPL’s carrying value and face amounts at maturity are as follows (Unit: Korean Won in millions): |
| January 1, 2010 | December 31, 2010 | December 31, 2011 | ||||||||||
| Carrying value |
4,922,496 | 4,331,508 | 5,059,414 | |||||||||
| Face amounts at maturity |
5,658,714 | 4,202,877 | 5,346,184 | |||||||||
|
|
|
|
|
|
|
|||||||
| (736,218 | ) | 128,631 | (286,770 | ) | ||||||||
|
|
|
|
|
|
|
|||||||
20. Deposits due to Customers
| (1) | Deposits sorted by interest type are as follows (Unit: Korean Won in millions): |
| January 1, 2010 | December 31, 2010 | December 31, 2011 | ||||||||||
| Deposits in local currency |
||||||||||||
| Demand deposits |
9,783,563 | 9,870,652 | 13,704,296 | |||||||||
| Time deposits |
136,689,505 | 155,049,753 | 163,162,643 | |||||||||
| Mutual installments |
222,559 | 154,168 | 104,402 | |||||||||
| Deposits on notes payables |
3,902,258 | 4,402,142 | 3,135,424 | |||||||||
| Deposits on CMA |
1,834,938 | 2,501,204 | 2,136,820 | |||||||||
| Certificate of deposits |
13,313,403 | 3,499,707 | 1,850,221 | |||||||||
| Other deposits |
1,451,612 | 1,233,871 | 1,235,462 | |||||||||
|
|
|
|
|
|
|
|||||||
| Sub-total |
167,197,838 | 176,711,497 | 185,329,268 | |||||||||
|
|
|
|
|
|
|
|||||||
| Deposits in foreign currencies |
10,052,980 | 8,788,042 | 10,638,470 | |||||||||
| Present value discount |
(323,950 | ) | (71,914 | ) | (37,256 | ) | ||||||
|
|
|
|
|
|
|
|||||||
| Total |
176,926,868 | 185,427,625 | 195,930,482 | |||||||||
|
|
|
|
|
|
|
|||||||
F-80
Table of Contents
| (2) | Deposits by customers are as follows (Unit: Korean Won in millions): |
| January 1, 2010 | December 31, 2010 | December 31, 2011 | ||||||||||
| Individual |
55,937,076 | 60,948,053 | 66,285,132 | |||||||||
| Corporation |
54,644,115 | 56,422,330 | 55,802,501 | |||||||||
| Banks |
21,791,838 | 21,981,851 | 24,481,309 | |||||||||
| Government agencies |
13,480,352 | 13,563,531 | 13,602,836 | |||||||||
| Other financial institutions |
7,438,917 | 8,607,010 | 9,796,912 | |||||||||
| Government |
10,225,679 | 9,207,218 | 9,931,364 | |||||||||
| Non-profit corporation |
4,917,775 | 5,817,711 | 6,461,592 | |||||||||
| Educational organization |
2,909,826 | 3,251,245 | 3,276,295 | |||||||||
| Foreign corporations |
440,813 | 791,402 | 1,340,651 | |||||||||
| Others |
5,464,427 | 4,909,188 | 4,989,146 | |||||||||
| Present value discount |
(323,950 | ) | (71,914 | ) | (37,256 | ) | ||||||
|
|
|
|
|
|
|
|||||||
| Total |
176,926,868 | 185,427,625 | 195,930,482 | |||||||||
|
|
|
|
|
|
|
|||||||
21. Borrowings and Debentures
| (1) | Borrowings are as follows (Unit: Korean Won in millions): |
| January 1, 2010 |
||||||||||
| Lenders |
Average annual interest rate (%) |
Amount | ||||||||
| Borrowings in local currency |
||||||||||
| Borrowings of the Bank of Korea |
The Bank of Korea | 1.3 | 1,560,378 | |||||||
| Borrowings from government funds |
Korea Environment Management Corporation | 2.7 | 2,141,520 | |||||||
| Others |
Korea International Trade Association and others | 3.4 | 6,491,965 | |||||||
|
|
|
|||||||||
| Sub-total |
10,193,863 | |||||||||
|
|
|
|||||||||
| Borrowings in foreign currencies |
||||||||||
| Borrowings in foreign currencies |
Zuercher Kantonal Bank and others | 3.8 | 9,854,587 | |||||||
| Offshore borrowings in foreign currencies |
5,838 | |||||||||
|
|
|
|||||||||
| Sub-total |
9,860,425 | |||||||||
|
|
|
|||||||||
| Bills sold |
1.7 | 129,237 | ||||||||
| Call money |
Banks | 1.1 | 5,957,183 | |||||||
| Bonds sold under repurchase agreements |
6,321,275 | |||||||||
| Present value discount |
(6,976 | ) | ||||||||
|
|
|
|||||||||
| Total |
32,455,007 | |||||||||
|
|
|
|||||||||
F-81
Table of Contents
| December 31, 2010 |
||||||||||
| Lenders |
Average annual interest rate (%) |
Amount | ||||||||
| Borrowings in local currency |
||||||||||
| Borrowings of the Bank of Korea |
The Bank of Korea | 1.3 | 1,222,739 | |||||||
| Borrowings from government funds |
Korea Environment Management Corporation and others |
2.5 | 2,120,411 | |||||||
| Others |
Korea Finance Corporation and others | 3.1 | 6,561,817 | |||||||
|
|
|
|||||||||
| Sub-total |
9,904,967 | |||||||||
|
|
|
|||||||||
| Borrowings in foreign currencies |
||||||||||
| Borrowings in foreign currencies |
Wachovia Bank and others | 3.3 | 10,062,277 | |||||||
| Offshore borrowings in foreign currencies |
5,695 | |||||||||
|
|
|
|||||||||
| Sub-total |
10,067,972 | |||||||||
|
|
|
|||||||||
| Bills sold |
1.5 | 146,606 | ||||||||
| Call money |
Banks | 2.6 | 6,072,523 | |||||||
| Bonds sold under repurchase agreements |
8,076,737 | |||||||||
| Present value discount |
(3,143 | ) | ||||||||
|
|
|
|||||||||
| Total |
34,265,662 | |||||||||
|
|
|
|||||||||
| December 31, 2011 |
||||||||||
| Lenders |
Average annual interest rate (%) |
Amount | ||||||||
| Borrowings in local currency |
||||||||||
| Borrowings of the Bank of Korea |
The Bank of Korea | 1.5 | 1,089,170 | |||||||
| Borrowings from government funds |
Korea Environment Management Corporation and others |
1.9 | 2,119,147 | |||||||
| Others |
Korea Finance Corporation and others | 2.3 | 6,842,681 | |||||||
|
|
|
|||||||||
| Sub-total |
10,050,998 | |||||||||
|
|
|
|||||||||
| Borrowings in foreign currencies |
||||||||||
| Borrowings in foreign currencies |
Wilshire State Bank and others | 2.6 | 12,140,368 | |||||||
| Offshore borrowings in foreign currencies |
5,767 | |||||||||
|
|
|
|||||||||
| Sub-total |
12,146,135 | |||||||||
|
|
|
|||||||||
| Bills sold |
1.9 | 181,102 | ||||||||
| Call money |
Banks | 2.5 | 4,393,138 | |||||||
| Bonds sold under repurchase agreements |
7,898,553 | |||||||||
| Present value discount |
(3,217 | ) | ||||||||
|
|
|
|||||||||
| Total |
34,666,709 | |||||||||
|
|
|
|||||||||
F-82
Table of Contents
| (2) | Debentures are as follows (Unit: Korean Won in millions): |
| January 1, 2010 | December 31, 2010 | December 31, 2011 | ||||||||||||||||||||||
| Interest rate (%) |
Amount | Interest rate (%) |
Amount | Interest rate (%) |
Amount | |||||||||||||||||||
| Face value of bond |
||||||||||||||||||||||||
| Ordinary bonds |
0.5 ~ 10.5 | 26,497,762 | 0.6 ~ 10.5 | 24,006,420 | 0.5 ~ 10.5 | 21,757,317 | ||||||||||||||||||
| Subordinated bonds |
5.0 ~ 10.3 | 5,818,969 | 5.1 ~ 10.3 | 4,938,106 | 4.5 ~ 10.3 | 7,316,553 | ||||||||||||||||||
| Other bonds |
— | 312,501 | — | 215,137 | — | 244,892 | ||||||||||||||||||
|
|
|
|
|
|
|
|||||||||||||||||||
| Sub-total |
32,629,232 | 29,159,663 | 29,318,762 | |||||||||||||||||||||
|
|
|
|
|
|
|
|||||||||||||||||||
| Discounts on bond |
(55,253 | ) | (49,023 | ) | (52,929 | ) | ||||||||||||||||||
|
|
|
|
|
|
|
|||||||||||||||||||
| Total |
32,573,979 | 29,110,640 | 29,265,833 | |||||||||||||||||||||
|
|
|
|
|
|
|
|||||||||||||||||||
| (3) | Borrowings from financial institutions are as follows (Unit: Korean Won in millions): |
| January 1, 2010 | ||||||||||||
| Banks | Non-banks | Total | ||||||||||
| Borrowings in local currency |
1,966,965 | 8,226,898 | 10,193,863 | |||||||||
| Borrowings in foreign currencies |
6,093,560 | 3,766,865 | 9,860,425 | |||||||||
| Call money |
5,957,183 | — | 5,957,183 | |||||||||
| Bonds sold under repurchase agreements |
232,100 | 6,089,175 | 6,321,275 | |||||||||
|
|
|
|
|
|
|
|||||||
| Total |
14,249,808 | 18,082,938 | 32,332,746 | |||||||||
|
|
|
|
|
|
|
|||||||
| December 31, 2010 | ||||||||||||
| Banks | Non-banks | Total | ||||||||||
| Borrowings in local currency |
1,945,741 | 7,959,226 | 9,904,967 | |||||||||
| Borrowings in foreign currencies |
5,608,604 | 4,459,368 | 10,067,972 | |||||||||
| Call money |
6,072,523 | — | 6,072,523 | |||||||||
| Bonds sold under repurchase agreements |
139,200 | 7,937,537 | 8,076,737 | |||||||||
|
|
|
|
|
|
|
|||||||
| Total |
13,766,068 | 20,356,131 | 34,122,199 | |||||||||
|
|
|
|
|
|
|
|||||||
| December 31, 2011 | ||||||||||||
| Banks | Non-banks | Total | ||||||||||
| Borrowings in local currency |
1,758,453 | 8,292,545 | 10,050,998 | |||||||||
| Borrowings in foreign currencies |
6,694,915 | 5,451,220 | 12,146,135 | |||||||||
| Call money |
4,393,138 | — | 4,393,138 | |||||||||
| Bonds sold under repurchase agreements |
110,000 | 7,788,553 | 7,898,553 | |||||||||
|
|
|
|
|
|
|
|||||||
| Total |
12,956,506 | 21,532,318 | 34,488,824 | |||||||||
|
|
|
|
|
|
|
|||||||
Borrowings from the Bank of Korea are 1,560,378 million Won, 1,222,739 million Won and 1,089,170 million Won as of January 1, 2010, December 31, 2010 and December 31, 2011, respectively.
F-83
Table of Contents
22. Provisions
| (1) | Provisions recognized are as follows (Unit: Korean Won in millions): |
| January 1, 2010 | December 31, 2010 | December 31, 2011 | ||||||||||
| Asset retirement obligation |
23,728 | 25,958 | 20,662 | |||||||||
| Provisions for guarantee(*1) |
293,321 | 309,721 | 464,687 | |||||||||
| Provisions for loan commitment |
202,980 | 168,239 | 134,530 | |||||||||
| Provisions for credit card points |
11,664 | 11,421 | 1,387 | |||||||||
| Other provisions(*2) |
161,828 | 245,716 | 271,042 | |||||||||
|
|
|
|
|
|
|
|||||||
| Total |
693,521 | 761,055 | 892,308 | |||||||||
|
|
|
|
|
|
|
|||||||
| (*1) | Provisions for guarantee includes provisions for financial guarantee of 207,188 million Won, 90,325 million Won and 200,246 million Won as of January 1, 2010, December 31, 2010 and December 31, 2011, respectively. |
| (*2) | Other provisions include provision for litigation. |
| (2) | Changes in provisions except for asset retirement obligation are as follows (Unit: Korean Won in millions): |
| For the year ended December 31, 2010 | ||||||||||||||||||||
| Provisions for guarantee |
Provisions for loan commitment |
Provisions for credit card points |
Other provisions |
Total | ||||||||||||||||
| Beginning balance |
293,321 | 202,980 | 11,664 | 161,828 | 669,793 | |||||||||||||||
| Provisions provided |
207,059 | 4,240 | 22,601 | 93,224 | 327,124 | |||||||||||||||
| Provisions used |
(22,704 | ) | (40 | ) | (22,844 | ) | 20,819 | (24,769 | ) | |||||||||||
| Reversal of unused amount |
(167,955 | ) | (38,941 | ) | — | (30,155 | ) | (237,051 | ) | |||||||||||
|
|
|
|
|
|
|
|
|
|
|
|||||||||||
| Ending balance |
309,721 | 168,239 | 11,421 | 245,716 | 735,097 | |||||||||||||||
|
|
|
|
|
|
|
|
|
|
|
|||||||||||
| For the year ended December 31, 2011 | ||||||||||||||||||||
| Provisions for guarantee |
Provisions for loan commitment |
Provisions for credit card points |
Other provisions |
Total | ||||||||||||||||
| Beginning balance |
309,721 | 168,239 | 11,421 | 245,716 | 735,097 | |||||||||||||||
| Provisions provided |
156,749 | 5,317 | 9,342 | 47,583 | 218,991 | |||||||||||||||
| Provisions used |
14,932 | 23 | (19,360 | ) | (14,099 | ) | (18,504 | ) | ||||||||||||
| Reversal of unused amount |
(16,715 | ) | (39,049 | ) | (16 | ) | (8,158 | ) | (63,938 | ) | ||||||||||
|
|
|
|
|
|
|
|
|
|
|
|||||||||||
| Ending balance |
464,687 | 134,530 | 1,387 | 271,042 | 871,646 | |||||||||||||||
|
|
|
|
|
|
|
|
|
|
|
|||||||||||
| (3) | Changes in details of asset retirement obligation are as follows (Unit: Korean Won in millions): |
| For the years ended December 31 | ||||||||
| 2010 | 2011 | |||||||
| Beginning balance |
23,728 | 25,958 | ||||||
| Provisions provided |
1,706 | 2,335 | ||||||
| Provisions used |
(457 | ) | (488 | ) | ||||
| Depreciation |
1,010 | 449 | ||||||
| Reversal of unused amount |
(29 | ) | (176 | ) | ||||
| Decrease in restoration costs |
— | (7,416 | ) | |||||
|
|
|
|
|
|||||
| Ending balance |
25,958 | 20,662 | ||||||
|
|
|
|
|
|||||
F-84
Table of Contents
23. Retirement Benefit Obligation
Employees and directors with one or more years of service are entitled to receive a payment upon termination of their employment, based on their length of service and rate of pay at the time of termination. The assets of the plans are measured at their fair value at the end of reporting date. Plan liabilities are measured using the projected unit method, which takes account of projected earnings increases, using actuarial assumptions that give the best estimate of the future cash flows that will arise under the plan liabilities.
| (1) | Retirement benefit obligation are as follows (Unit: Korean Won in millions): |
| January 1, 2010 | December 31, 2010 | December 31, 2011 | ||||||||||
| Projected retirement benefit obligation |
336,651 | 227,729 | 365,714 | |||||||||
| Fair value of plan assets |
(213,640 | ) | (157,780 | ) | (246,010 | ) | ||||||
|
|
|
|
|
|
|
|||||||
| Liability recognized |
123,011 | 69,949 | 119,704 | |||||||||
|
|
|
|
|
|
|
|||||||
| (2) | Changes in carrying value of retirement benefit obligation are as follows (Unit: Korean Won in millions): |
| For the years ended December 31 | ||||||||
| 2010 | 2011 | |||||||
| Beginning balance |
336,651 | 227,729 | ||||||
| Service cost |
123,426 | 126,281 | ||||||
| Interest cost |
10,364 | 11,604 | ||||||
| Actuarial loss |
1,228 | 21,756 | ||||||
| Foreign currencies translation adjustments |
3 | 103 | ||||||
| Retirement benefit paid |
(132,668 | ) | (20,476 | ) | ||||
| Curtailment or settlement |
(116,387 | ) | (1,565 | ) | ||||
| Others |
5,112 | 282 | ||||||
|
|
|
|
|
|||||
| Ending balance |
227,729 | 365,714 | ||||||
|
|
|
|
|
|||||
| (3) | Changes in plan assets are as follows (Unit: Korean Won in millions): |
| For the years ended December 31 |
||||||||
| 2010 | 2011 | |||||||
| Beginning balance |
213,640 | 157,780 | ||||||
| Expected return plan assets |
7,948 | 8,211 | ||||||
| Actuarial loss |
(1,127 | ) | (2,037 | ) | ||||
| Employer’s contributions |
78,440 | 89,125 | ||||||
| Retirement benefit paid |
(27,143 | ) | (7,736 | ) | ||||
| Curtailment or settlement |
(113,425 | ) | (1,265 | ) | ||||
| Others |
(553 | ) | 1,932 | |||||
|
|
|
|
|
|||||
| Ending balance |
157,780 | 246,010 | ||||||
|
|
|
|
|
|||||
| (4) | Plan assets consist of mainly deposits which accounts for 34.71%, 67.78% and 68.89% of plan asset as of January 1, 2010, December 31, 2010 and December 31, 2011, respectively. Among plan asset, realized return on plan assets are 6,821 million Won and 6,174 million Won of plan asset for the years ended December 31, 2010 and December 31, 2011, respectively. |
F-85
Table of Contents
| (5) | Past service cost, interest cost, expected return on plan asset, actuarial loss and loss on curtailment or settlement recognized in the consolidated statements of comprehensive income are as follows (Unit: Korean Won in millions): |
| For the years ended December 31 | ||||||||
| 2010 | 2011 | |||||||
| Service cost |
123,426 | 126,281 | ||||||
| Interest expense |
10,364 | 11,604 | ||||||
| Expected return on plan assets |
(7,948 | ) | (8,211 | ) | ||||
| Actuarial loss |
2,355 | 23,793 | ||||||
| Loss on the curtailment or settlement |
(2,962 | ) | (300 | ) | ||||
|
|
|
|
|
|||||
| Total |
125,235 | 153,167 | ||||||
|
|
|
|
|
|||||
| (6) | Actuarial assumptions used in retirement benefit obligation assessment are as follows: |
| January 1, 2010 | December 31, 2010 | December 31, 2011 | ||||
| Discount rate |
5.31% | 5.65% | 4.76% | |||
| Inflation rate |
3.20% | 3.20% | 2.30% | |||
| Expected rate of return on plan assets |
5.85% | 4.24% | 4.49% | |||
| Future wage growth rate |
5.85% | 5.74% | 5.31% | |||
| Mortality rate |
Issued by Korea Insurance Development Institute |
Issued by Korea Insurance Development Institute |
Issued by Korea Insurance Development Institute |
24. Other Financial Liabilities and Other Liabilities
Other financial liabilities and other liabilities are as follows (Unit: Korean Won in millions):
| January 1, 2010 | December 31, 2010 | December 31, 2011 | ||||||||||
| Other financial liabilities: |
||||||||||||
| Payables |
3,318,017 | 3,615,878 | 7,431,428 | |||||||||
| Accrued expenses |
2,464,068 | 2,765,446 | 3,374,174 | |||||||||
| Borrowings from trust accounts |
2,815,956 | 2,089,772 | 2,485,088 | |||||||||
| Refundable lease deposits |
126,297 | 165,701 | 184,886 | |||||||||
| Agency business revenue |
268,598 | 295,472 | 211,227 | |||||||||
| Foreign exchange payables |
376,713 | 581,934 | 696,505 | |||||||||
| Domestic exchange payables |
462,782 | 174,374 | 3,109,576 | |||||||||
| Miscellaneous liabilities |
1,394,318 | 1,959,751 | 1,590,825 | |||||||||
|
|
|
|
|
|
|
|||||||
| Sub-total |
11,226,749 | 11,648,328 | 19,083,709 | |||||||||
|
|
|
|
|
|
|
|||||||
| Other liabilities: |
||||||||||||
| Income in advance |
249,638 | 253,311 | 264,121 | |||||||||
| Other miscellaneous liabilities |
554,856 | 145,880 | 305,662 | |||||||||
|
|
|
|
|
|
|
|||||||
| Sub-total |
804,494 | 399,191 | 569,783 | |||||||||
|
|
|
|
|
|
|
|||||||
| Total |
12,031,243 | 12,047,519 | 19,653,492 | |||||||||
|
|
|
|
|
|
|
|||||||
F-86
Table of Contents
25. Derivatives
| (1) | Derivative assets and derivative liabilities are as follows (Unit: Korean Won in millions): |
| January 1, 2010 | ||||||||||||||||||||||||||||
| Notional amount |
Assets | Liabilities | ||||||||||||||||||||||||||
| Fair value hedge |
Cash flow hedge |
For trading | Fair value hedge |
Cash flow hedge |
For trading | |||||||||||||||||||||||
| Interest rate: |
||||||||||||||||||||||||||||
| Interest rate swaps |
139,037,226 | 107,490 | — | 1,233,085 | 28,908 | 12,328 | 1,390,733 | |||||||||||||||||||||
| Interest rate futures |
29,327 | — | — | — | — | — | — | |||||||||||||||||||||
| Long interest rate options |
6,013,380 | — | — | 76,513 | — | — | — | |||||||||||||||||||||
| Short interest rate options |
6,164,964 | — | — | — | — | — | 60,606 | |||||||||||||||||||||
| Currency: |
||||||||||||||||||||||||||||
| Currency forwards |
40,721,112 | — | — | 1,519,032 | — | — | 669,167 | |||||||||||||||||||||
| Currency swaps |
20,229,949 | — | — | 1,098,740 | — | — | 1,715,106 | |||||||||||||||||||||
| Currency futures |
796,711 | — | — | — | — | — | — | |||||||||||||||||||||
| Long currency options |
3,072,315 | — | — | 602,699 | — | — | — | |||||||||||||||||||||
| Short currency options |
3,220,937 | — | — | — | — | — | 114,359 | |||||||||||||||||||||
| Stock Index: |
||||||||||||||||||||||||||||
| Stock index futures |
185,930 | — | — | — | — | — | — | |||||||||||||||||||||
| Long stock index options |
567,895 | — | — | 71,319 | — | — | — | |||||||||||||||||||||
| Short stock index options |
2,173,771 | — | — | — | — | — | 461,698 | |||||||||||||||||||||
| Stock index swaps |
2,142,525 | — | — | 67,151 | — | — | 236,941 | |||||||||||||||||||||
| Others: |
||||||||||||||||||||||||||||
| Long option |
304,145 | — | — | 20,485 | — | — | — | |||||||||||||||||||||
| Short option |
366,697 | — | — | — | — | — | 23,006 | |||||||||||||||||||||
| Other forwards |
82,213 | — | — | 1,660 | — | — | 1,246 | |||||||||||||||||||||
| Other swaps |
875,694 | — | — | 48,624 | — | — | 228,698 | |||||||||||||||||||||
| Other futures |
5,753 | — | — | 338 | — | — | 462 | |||||||||||||||||||||
|
|
|
|
|
|
|
|
|
|
|
|
|
|
|
|||||||||||||||
| Total |
225,990,544 | 107,490 | — | 4,739,646 | 28,908 | 12,328 | 4,902,022 | |||||||||||||||||||||
|
|
|
|
|
|
|
|
|
|
|
|
|
|
|
|||||||||||||||
F-87
Table of Contents
| December 31, 2010 | ||||||||||||||||||||||||||||
| Notional amount |
Assets | Liabilities | ||||||||||||||||||||||||||
| Fair value hedge |
Cash flow hedge |
For trading | Fair value Hedge |
Cash flow hedge |
For trading | |||||||||||||||||||||||
| Interest rate: |
||||||||||||||||||||||||||||
| Interest rate swap forwards |
206 | — | — | 7 | — | — | 4 | |||||||||||||||||||||
| Interest rate swap |
206,565,312 | 131,511 | — | 1,288,788 | 3,743 | 1,596 | 1,474,766 | |||||||||||||||||||||
| Interest rate futures |
31,020 | — | — | — | — | — | — | |||||||||||||||||||||
| Long interest options |
4,225,000 | — | — | 61,558 | — | — | — | |||||||||||||||||||||
| Short interest options |
5,076,534 | — | — | — | — | — | 43,398 | |||||||||||||||||||||
| Currency: |
||||||||||||||||||||||||||||
| Currency forwards |
32,425,079 | — | — | 957,306 | — | — | 416,464 | |||||||||||||||||||||
| Currency swaps |
25,437,435 | — | — | 1,191,928 | — | — | 1,370,882 | |||||||||||||||||||||
| Currency futures |
917,157 | — | — | — | — | — | — | |||||||||||||||||||||
| Long option |
2,360,647 | — | — | 421,959 | — | — | — | |||||||||||||||||||||
| Short option |
2,295,334 | — | — | — | — | — | 57,548 | |||||||||||||||||||||
| Stock Index: |
||||||||||||||||||||||||||||
| Stock index futures |
54,063 | — | — | — | — | — | — | |||||||||||||||||||||
| Long stock |
609,802 | — | — | 130,509 | — | — | — | |||||||||||||||||||||
| Short stock |
1,412,681 | — | — | — | — | — | 238,912 | |||||||||||||||||||||
| Stock index swaps |
2,274,040 | 64,751 | 7,659 | |||||||||||||||||||||||||
| Others: |
||||||||||||||||||||||||||||
| Long option |
87,081 | — | — | 15,940 | — | — | — | |||||||||||||||||||||
| Short option |
104,176 | — | — | — | — | — | 12,267 | |||||||||||||||||||||
| Other forwards |
198,172 | — | — | 6,065 | — | — | 5,496 | |||||||||||||||||||||
| Other swaps |
312,150 | — | — | 23,795 | — | — | 22,279 | |||||||||||||||||||||
| Other futures |
298 | — | — | 13 | — | — | — | |||||||||||||||||||||
|
|
|
|
|
|
|
|
|
|
|
|
|
|
|
|||||||||||||||
| Total |
284,386,187 | 131,511 | — | 4,162,619 | 3,743 | 1,596 | 3,649,675 | |||||||||||||||||||||
|
|
|
|
|
|
|
|
|
|
|
|
|
|
|
|||||||||||||||
F-88
Table of Contents
| December 31, 2011 | ||||||||||||||||||||||||||||||||||||
| Assets | Liabilities | |||||||||||||||||||||||||||||||||||
| Nominal Amount |
Fair value hedge |
Cash flow hedge |
Foreign hedge |
For trading |
Fair value hedge |
Cash flow hedge |
Foreign hedge |
For trading |
||||||||||||||||||||||||||||
| Interest rate: |
||||||||||||||||||||||||||||||||||||
| Interest rate swap |
176,582,515 | 326,005 | — | — | 1,516,621 | 348 | 23,978 | — | 1,639,921 | |||||||||||||||||||||||||||
| Interest rate futures |
298,253 | — | — | — | — | — | — | — | — | |||||||||||||||||||||||||||
| Long interest options |
2,445,000 | — | — | — | 36,254 | — | — | — | — | |||||||||||||||||||||||||||
| Short interest options |
2,771,136 | — | — | — | — | — | — | — | 30,924 | |||||||||||||||||||||||||||
| Currency: |
||||||||||||||||||||||||||||||||||||
| Currency forwards |
40,801,384 | — | — | 835 | 836,348 | — | — | 9,167 | 347,213 | |||||||||||||||||||||||||||
| Currency swaps |
27,763,127 | — | — | — | 973,215 | — | — | — | 1,315,693 | |||||||||||||||||||||||||||
| Currency futures |
1,086,199 | — | — | — | — | — | — | — | — | |||||||||||||||||||||||||||
| Long option |
1,957,680 | — | — | — | 396,268 | — | — | — | — | |||||||||||||||||||||||||||
| Short option |
1,890,912 | — | — | — | — | — | — | — | 26,938 | |||||||||||||||||||||||||||
| Stock Index: |
||||||||||||||||||||||||||||||||||||
| Stock index futures |
18,946 | — | — | — | — | — | — | — | — | |||||||||||||||||||||||||||
| Long stock |
740,808 | — | — | — | 59,092 | — | — | — | — | |||||||||||||||||||||||||||
| Short stock |
1,281,750 | — | — | — | — | — | — | — | 262,981 | |||||||||||||||||||||||||||
| Stock index swaps |
2,396,314 | — | — | — | 36,441 | — | — | — | 253,853 | |||||||||||||||||||||||||||
| Others: |
||||||||||||||||||||||||||||||||||||
| Long option |
234,408 | — | — | — | 17,771 | — | — | — | ||||||||||||||||||||||||||||
| Short option |
239,000 | — | — | — | — | — | — | — | 11,911 | |||||||||||||||||||||||||||
| Other forwards |
10,516 | — | — | — | 239 | — | — | — | 253 | |||||||||||||||||||||||||||
| Other swaps |
157,937 | — | — | — | 27,648 | — | — | — | 35,148 | |||||||||||||||||||||||||||
| Other futures |
299 | — | — | — | — | — | — | — | 109 | |||||||||||||||||||||||||||
|
|
|
|
|
|
|
|
|
|
|
|
|
|
|
|
|
|
|
|||||||||||||||||||
| Total |
260,676,184 | 326,005 | — | 835 | 3,899,897 | 348 | 23,978 | 9,167 | 3,924,944 | |||||||||||||||||||||||||||
|
|
|
|
|
|
|
|
|
|
|
|
|
|
|
|
|
|
|
|||||||||||||||||||
Derivatives held for trading purpose are classified into financial assets on liabilities at FVTPL and derivatives for hedging are stated as a separate line item in the consolidated statements of financial position (see Notes 7 and 19).
| (2) | Gains or losses on valuation of derivatives are as follows (Unit: Korean Won in millions): |
| For the years ended December 31 | ||||||||
| 2010 | 2011 | |||||||
| Gains or losses from hedged items |
(121,565 | ) | (191,961 | ) | ||||
| Gains or losses from hedging instruments |
76,923 | 173,252 | ||||||
| Ineffective gains and losses of foreign hedging activities |
804 | 705 | ||||||
F-89
Table of Contents
26. Day 1 Profit and Loss
Changes in details of deferred day 1 profits and losses are as follows (Unit: Korean Won in millions):
| For the years ended December 31 | ||||||||
| 2010 | 2011 | |||||||
| Beginning balance |
30,869 | |||||||
| New transactions |
||||||||
| Financial assets at FVTPL |
(38,388 | ) | 2,618 | |||||
| Financial liabilities at FVTPL |
75,802 | 54,687 | ||||||
|
|
|
|
|
|||||
| Sub-total |
37,414 | 57,305 | ||||||
|
|
|
|
|
|||||
| Amounts Recognized in profits and losses |
||||||||
| Financial assets at FVTPL |
4,717 | 7,797 | ||||||
| Financial liabilities at FVTPL |
(11,262 | ) | (41,239 | ) | ||||
|
|
|
|
|
|||||
| Sub-total |
(6,545 | ) | (33,442 | ) | ||||
|
|
|
|
|
|||||
| Ending balance |
30,869 | 54,732 | ||||||
|
|
|
|
|
|||||
Although no observable elements were available in market transaction to fair value the financial instruments, valuation techniques were utilized to fair value such instruments. These financial instruments are recorded at their fair values at the time of purchase even though there were differences noted on the transaction price and fair value obtained from valuation techniques. The table above shows the differences yet to be recognized in profits and losses and the details.
27. Capital Stock and Capital Surplus
| (1) | The number of authorized shares is as follows: |
| January 1, 2010 |
December 31, 2010 | December 31, 2011 | ||||
| Authorized shares of common stock |
2,400,000,000 shares | 2,400,000,000 shares | 2,400,000,000 shares | |||
| Par value |
5,000 Won | 5,000 Won | 5,000 Won | |||
| Issued shares of common stock |
806,015,340 shares | 806,015,340 shares | 806,015,340 shares |
As of January 1, 2010, December 31, 2010 and December 31, 2011, the Group holds 2,560 shares (18 million Won), 2,561 shares (18 million Won), 1,999 shares (14 million Won) of its treasury stock, respectively, acquired as a buyback of odd-lot share when exchanging the stock of Woori Investment & Securities.
| (2) | Capital surplus are as follows (Unit: Korean Won in millions): |
| January 1, 2010 | December 31, 2010 | December 31, 2011 | ||||||||||
| Capital in excess of par value |
109,025 | 109,025 | 109,025 | |||||||||
| Other capital surplus |
71,448 | 71,080 | 66,743 | |||||||||
|
|
|
|
|
|
|
|||||||
| Total |
180,473 | 180,105 | 175,768 | |||||||||
|
|
|
|
|
|
|
|||||||
F-90
Table of Contents
28. Hybrid Securities
The bond-type hybrid securities classified as shareholder’s equity are as follows (Unit: Korean Won in millions):
| Issuance date | Maturity | Annual interest rate (%) | Amount | |||||||||||||
| The 1st bond-type hybrid securities |
November 22, 2011 | November 22, 2041 | 5.91 | 310,000 | ||||||||||||
| Expense of issuance |
(990 | ) | ||||||||||||||
|
|
|
|||||||||||||||
| 309,010 | ||||||||||||||||
|
|
|
|||||||||||||||
Although these instruments have a contractual maturity date, November 22, 2041 and stipulated contractual interest payments, the contractual agreements allow Group to indefinitely extend the maturity date and defer the payment of interest without a modification of the other terms of the instrument such as interest rate, etc. In addition, the Group has the ability to not pay dividends on ordinary stock and there are no other agreements that would require the Group to pay interest on the hybrid securities.
29. Other Equity
| (1) | Other equity is as follows (Unit: Korean Won in millions): |
| January 1, 2010 | December 31, 2010 | December 31, 2011 | ||||||||||
| Other comprehensive income: |
||||||||||||
| Gain on valuation of AFS financial assets |
1,257,695 | 1,051,219 | 647,482 | |||||||||
| Gain on equity of jointly controlled entities and associates |
46,081 | 24,970 | 4,940 | |||||||||
| Loss on FX translation on overseas operations |
(378 | ) | (16,221 | ) | (2,772 | ) | ||||||
| Gain (loss) on cash flow hedges |
(5,112 | ) | 1,187 | 4,336 | ||||||||
|
|
|
|
|
|
|
|||||||
| Sub-total |
1,298,286 | 1,061,155 | 653,986 | |||||||||
|
|
|
|
|
|
|
|||||||
| Treasury shares |
(18 | ) | (18 | ) | (14 | ) | ||||||
| Other capital adjustments |
(54,172 | ) | (59,118 | ) | (67,551 | ) | ||||||
|
|
|
|
|
|
|
|||||||
| Total |
1,244,096 | 1,002,019 | 586,421 | |||||||||
|
|
|
|
|
|
|
|||||||
| (2) | Changes in accumulated other comprehensive income are as follows (Unit: Korean Won in millions): |
| For the year ended December 31, 2010 | ||||||||||||||||||||
| Beginning balance |
Others | Reclassification | Income tax effect |
Ending balance |
||||||||||||||||
| Gain on valuation of AFS financial assets |
1,257,695 | 257,794 | (534,883 | ) | 70,613 | 1,051,219 | ||||||||||||||
| Gain on equity of jointly controlled entities and associates |
46,081 | (27,189 | ) | — | 6,078 | 24,970 | ||||||||||||||
| Loss on FX translation on overseas operations |
(378 | ) | (15,995 | ) | — | 152 | (16,221 | ) | ||||||||||||
| Gain (loss) on cash flow hedges |
(5,112 | ) | 11,899 | (3,994 | ) | (1,606 | ) | 1,187 | ||||||||||||
|
|
|
|
|
|
|
|
|
|
|
|||||||||||
| Total |
1,298,286 | 226,509 | (538,877 | ) | 75,237 | 1,061,155 | ||||||||||||||
|
|
|
|
|
|
|
|
|
|
|
|||||||||||
F-91
Table of Contents
| For the year ended December 31, 2011 | ||||||||||||||||||||
| Beginning balance |
Others | Reclassification | Income tax effect |
Ending balance |
||||||||||||||||
| Gain on valuation of AFS financial assets |
1,051,219 | 100,201 | (576,844 | ) | 72,906 | 647,482 | ||||||||||||||
| Gain on equity of jointly controlled entities and associates |
24,970 | (1,555 | ) | (24,787 | ) | 6,312 | 4,940 | |||||||||||||
| Loss on FX translation on overseas operations |
(16,221 | ) | 15,244 | — | (1,795 | ) | (2,772 | ) | ||||||||||||
| Gain on cash flow hedges |
1,187 | 1,552 | (749 | ) | 2,346 | 4,336 | ||||||||||||||
|
|
|
|
|
|
|
|
|
|
|
|||||||||||
| Total |
1,061,155 | 115,442 | (602,380 | ) | 79,769 | 653,986 | ||||||||||||||
|
|
|
|
|
|
|
|
|
|
|
|||||||||||
30. Retained Earnings
| (1) | Retained earnings are as follows (Unit: Korean Won in millions): |
| January 1, 2010 | December 31, 2010 | December 31, 2011 | ||||||||||
| Legal reserves |
783,301 | 885,903 | 1,005,401 | |||||||||
| Voluntary reserves |
6,539,000 | 7,379,000 | 8,256,000 | |||||||||
| Retained earnings carried forward |
1,958,046 | 2,224,436 | 3,161,321 | |||||||||
|
|
|
|
|
|
|
|||||||
| 9,280,347 | 10,489,339 | 12,422,722 | ||||||||||
|
|
|
|
|
|
|
|||||||
Pursuant to Article 53 of the Financial Holding Company Act, legal reserves are appropriated at no less than 10% of net income until reaching an amount equal to the Company’s capital.
| (2) | Changes in retained earnings are as follows (Unit: Korean Won in millions): |
| For the years ended December 31 | ||||||||
| 2010 | 2011 | |||||||
| Beginning balance |
9,280,347 | 10,489,339 | ||||||
| Net income |
1,288,856 | 2,136,828 | ||||||
| Dividends on common stock |
(80,601 | ) | (201,503 | ) | ||||
| Dividends on hybrid securities |
— | (1,942 | ) | |||||
| Others |
737 | — | ||||||
|
|
|
|
|
|||||
| Ending balance |
10,489,339 | 12,422,722 | ||||||
|
|
|
|
|
|||||
31. Planned Regulatory Reserve for Credit Loss
In accordance with the Regulations for Supervision of Financial Holding Companies (“RSFHC”), if the estimated provision for credit loss determined in accordance with IAS 39 Financial instruments: Recognition and Measurement is lower than those in accordance with the RSFHC, the Group shall disclose the difference as the regulatory reserve for credit loss.
| (1) | Balances of the planned regulatory reserve for credit loss are 553,010 million Won and 1,351,766 million Won as of December 31, 2010 and 2011, respectively. |
| (2) | Reserve, net income attributable to shareholders and earning per share after the reserve provided are as follows (Unit: Korean Won in millions, except for earning per share): |
| For the years ended December 31 | ||||||||
| 2010 | 2011 | |||||||
| Planned regulatory reserve for credit loss |
(553,010 | ) | (798,756 | ) | ||||
| Net income after the planned reserve provided |
735,846 | 1,338,072 | ||||||
|
|
|
|
|
|||||
| Earnings per share after the planned reserve provided(*) |
913 | 1,658 | ||||||
|
|
|
|
|
|||||
| (*) | Earnings per share after the planned reserve provided is calculated by deducting dividends on hybrid securities from net income after the planned reserve provided. |
F-92
Table of Contents
32. Dividends
The Group paid 201,503 million Won (250 Won per share) and is about to pay 201,503 million Won (250 Won per share) for the years ended December 31, 2010 and 2011, respectively.
33. Net Interest Income
| (1) | Interest income recognized are as follows (Unit: Korean Won in millions): |
| For the years ended December 31 | ||||||||
| 2010 | 2011 | |||||||
| Financial assets at FVTPL: |
||||||||
| Debt securities |
||||||||
| Korean treasury and government agencies |
222,403 | 143,280 | ||||||
| Financial institutions |
154,922 | 160,856 | ||||||
| Corporates |
130,150 | 128,533 | ||||||
| CP |
80,447 | 111,114 | ||||||
| Beneficiary certificates |
5,950 | 11,242 | ||||||
| Interest of other FVTPL financial assets |
100,915 | 104,520 | ||||||
|
|
|
|
|
|||||
| Sub-total |
694,787 | 659,545 | ||||||
|
|
|
|
|
|||||
| AFS financial assets: |
||||||||
| Debt securities |
||||||||
| Korean treasury and government agencies |
140,849 | 158,953 | ||||||
| Financial institutions |
195,542 | 212,053 | ||||||
| Corporates |
72,906 | 95,408 | ||||||
| Asset-backed securities |
9,550 | 1,826 | ||||||
| Foreign governments |
10,924 | 5,817 | ||||||
| Beneficiary certificates |
1,799 | 1,067 | ||||||
| Interest of other AFS financial assets |
4,695 | 4,644 | ||||||
|
|
|
|
|
|||||
| Sub-total |
436,265 | 479,768 | ||||||
|
|
|
|
|
|||||
| HTM financial assets: |
||||||||
| Debt securities |
||||||||
| Korean treasury and government agencies |
208,842 | 326,630 | ||||||
| Financial institutions |
416,257 | 261,841 | ||||||
| Corporates |
165,090 | 282,268 | ||||||
| Asset-backed securities |
— | 709 | ||||||
| Foreign governments |
10,568 | 8,306 | ||||||
|
|
|
|
|
|||||
| Sub-total |
800,757 | 879,754 | ||||||
|
|
|
|
|
|||||
| Loans and receivables: |
||||||||
| Interest on deposits |
116,059 | 169,268 | ||||||
| Interest on loans |
11,876,850 | 12,725,160 | ||||||
| Interest of other receivables |
132,509 | 131,351 | ||||||
|
|
|
|
|
|||||
| Sub-total |
12,125,418 | 13,025,779 | ||||||
|
|
|
|
|
|||||
| Total |
14,057,227 | 15,044,846 | ||||||
|
|
|
|
|
|||||
F-93
Table of Contents
| (2) | Interest expense recognized are as follows (Unit: Korean Won in millions): |
| For the years ended December 31 | ||||||||
| 2010 | 2011 | |||||||
| Interest on deposits due to customers |
4,976,121 | 5,298,071 | ||||||
| Interest on borrowings |
728,077 | 815,043 | ||||||
| Interest on debentures |
1,807,874 | 1,551,286 | ||||||
| Other interest expense |
122,010 | 118,401 | ||||||
|
|
|
|
|
|||||
| Total |
7,634,082 | 7,782,801 | ||||||
|
|
|
|
|
|||||
34. Net Fees and Commissions Income
| (1) | Fees and commissions income recognized are as follows (Unit: Korean Won in millions): |
| For the years ended December 31 | ||||||||
| 2010 | 2011 | |||||||
| Banking fees |
||||||||
| Banking fees(*) |
750,066 | 814,677 | ||||||
| Guarantee fees |
111,132 | 104,327 | ||||||
| Fees from project financing |
21,004 | 27,080 | ||||||
|
|
|
|
|
|||||
| Sub-total |
882,202 | 946,084 | ||||||
|
|
|
|
|
|||||
| Other fees |
||||||||
| Credit card fees |
16,624 | 39,656 | ||||||
| CMA management fees |
6,131 | 5,553 | ||||||
| Lease |
25,626 | 12,854 | ||||||
| Brokerage fees |
630,540 | 650,155 | ||||||
| Others |
126,916 | 120,132 | ||||||
|
|
|
|
|
|||||
| Sub-total |
805,837 | 828,350 | ||||||
|
|
|
|
|
|||||
| Total |
1,688,039 | 1,774,434 | ||||||
|
|
|
|
|
|||||
| (*) | Banking fees are including agency commission, fees income from electronic finance, fees income related to loan, fees for import letter of credit dealing, commission received on foreign exchange and others. |
| (2) | Fees and commissions expense incurred are as follows (Unit: Korean Won in millions): |
| For the years ended December 31 | ||||||||
| 2010 | 2011 | |||||||
| Fees paid |
106,894 | 121,029 | ||||||
| Credit card commission |
368,042 | 384,503 | ||||||
| Brokerage commission |
89,778 | 60,821 | ||||||
| Others |
7,551 | 12,589 | ||||||
|
|
|
|
|
|||||
| Total |
572,265 | 578,942 | ||||||
|
|
|
|
|
|||||
F-94
Table of Contents
35. Dividend Income
Dividend income recognized are as follows (Unit: Korean Won in millions):
| For the years ended December 31 | ||||||||
| 2010 | 2011 | |||||||
| Dividend of financial assets at FVTPL |
38,770 | 46,036 | ||||||
| Dividend of AFS financial assets |
162,010 | 156,969 | ||||||
|
|
|
|
|
|||||
| Total |
200,780 | 203,005 | ||||||
|
|
|
|
|
|||||
36. Gain (Loss) on Financial Assets at FVTPL
| (1) | Gain (loss) on financial assets held for trading are as follows (Unit: Korean Won in millions): |
| For the years ended December 31 | ||||||||
| 2010 | 2011 | |||||||
| Gain (loss) on valuation and disposal of securities: |
||||||||
| Gain (loss) on redemption of securities |
(24,347 | ) | 12,212 | |||||
| Gain (loss) on transaction of securities |
245,315 | (27,878 | ) | |||||
| Gain on valuation of securities |
93,172 | 41,780 | ||||||
|
|
|
|
|
|||||
| Sub-total |
314,140 | 26,114 | ||||||
|
|
|
|
|
|||||
| Gain (loss) on derivatives: |
||||||||
| Gain (loss) on transaction of derivatives |
||||||||
| Interest rate derivatives |
(128,998 | ) | (84,074 | ) | ||||
| Currency derivatives |
(41,969 | ) | 83,215 | |||||
| Stock equity derivatives |
178,493 | 5,163 | ||||||
| Other derivatives |
20,077 | 6,681 | ||||||
|
|
|
|
|
|||||
| Sub-total |
27,603 | 10,985 | ||||||
|
|
|
|
|
|||||
| Gain (loss) on valuation of derivatives |
||||||||
| Interest rate derivatives |
(143,946 | ) | 50,563 | |||||
| Currency derivatives |
137,499 | 37,539 | ||||||
| Stock equity derivatives |
118,135 | (223,142 | ) | |||||
| Other derivatives |
(12,507 | ) | (17,451 | ) | ||||
|
|
|
|
|
|||||
| Sub-total |
99,181 | (152,491 | ) | |||||
|
|
|
|
|
|||||
| Total |
440,924 | (115,392 | ) | |||||
|
|
|
|
|
|||||
| (2) | Gain (loss) on valuation of financial assets designated at FVTPL are as follows (Unit: Korean Won in millions): |
| For the years ended December 31 | ||||||||
| 2010 | 2011 | |||||||
| Gain (loss) on redemption of securities |
114,249 | 17,743 | ||||||
| Gain (loss) on transaction of securities |
1,130 | (593 | ) | |||||
| Gain (loss) on valuation of securities |
(3,192 | ) | (73,778 | ) | ||||
| Gain (loss) on transaction of other financial assets designated at FVTPL |
(337,346 | ) | (117,616 | ) | ||||
| Gain (loss) on valuation of other financial assets designated at FVTPL |
(183,075 | ) | 409,039 | |||||
|
|
|
|
|
|||||
| Total |
(401,850 | ) | 234,795 | |||||
|
|
|
|
|
|||||
F-95
Table of Contents
37. Gain (Loss) on Available for Sale Financial Assets
Gain (loss) on AFS financial assets recognized in statements of comprehensive income are as follows (Unit: Korean Won in millions):
| For the years ended December 31 | ||||||||
| 2010 | 2011 | |||||||
| Gain (loss) on redemption of securities |
8,715 | (267 | ) | |||||
| Gain on transaction of securities |
1,102,871 | 1,338,821 | ||||||
| Impairment loss or reversal of impairment on securities |
(38,117 | ) | (265,677 | ) | ||||
|
|
|
|
|
|||||
| Total |
1,073,469 | 1,072,877 | ||||||
|
|
|
|
|
|||||
38. Impairment Loss on Credit Loss
Impairment loss on credit loss recognized is as follows (Unit: Korean Won in millions):
| For the years ended December 31 | ||||||||
| 2010 | 2011 | |||||||
| Bad debt expenses |
3,007,446 | 2,240,657 | ||||||
| Reversal of provision for credit losses |
(138,906 | ) | (78,032 | ) | ||||
|
|
|
|
|
|||||
| Sub-Total |
2,868,540 | 2,162,625 | ||||||
|
|
|
|
|
|||||
| Provision for guarantee |
207,059 | 156,749 | ||||||
| Reversal of provision for guarantee |
(167,955 | ) | (16,715 | ) | ||||
|
|
|
|
|
|||||
| Sub-Total |
39,104 | 140,034 | ||||||
|
|
|
|
|
|||||
| Provision for loan commitment |
4,240 | 5,317 | ||||||
| Reversal of provision for loan commitment |
(38,941 | ) | (39,049 | ) | ||||
|
|
|
|
|
|||||
| Sub-Total |
(34,701 | ) | (33,732 | ) | ||||
|
|
|
|
|
|||||
| Total |
2,872,943 | 2,268,927 | ||||||
|
|
|
|
|
|||||
39. Other Net Operating Income (Expense)
| (1) | Other operating incomes recognized are as follows (Unit: Korean Won in millions): |
| For the years ended December 31 | ||||||||
| 2010 | 2011 | |||||||
| Gain on transaction of FX |
7,585,168 | 8,292,591 | ||||||
| Gain on translation of FX |
41,073 | 46,882 | ||||||
| Rental fee income |
18,511 | 16,520 | ||||||
| Gain on transactions of loans and receivables |
173,231 | 62,157 | ||||||
| Gain on disposal of investment in jointly controlled entities and associates |
175 | 61,071 | ||||||
| Gain on disposal of premises and equipment and other assets |
12,145 | 74,140 | ||||||
| Reversal of impairment loss of premises and equipment and other assets |
3,146 | 791 | ||||||
| Gain on transactions of derivatives |
7,684 | 233 | ||||||
| Gain on valuations of derivatives |
121,434 | 187,038 | ||||||
| Gain on fair value hedged items |
36,691 | 3,876 | ||||||
| Reversal of other provisions |
30,185 | 8,350 | ||||||
| Others |
75,646 | 101,343 | ||||||
|
|
|
|
|
|||||
| Total |
8,105,089 | 8,854,992 | ||||||
|
|
|
|
|
|||||
F-96
Table of Contents
| (2) | Other operating expenses recognized are as follows (Unit: Korean Won in millions): |
| For the years ended December 31 | ||||||||
| 2010 | 2011 | |||||||
| Administrative expenses |
3,321,790 | 3,782,439 | ||||||
| Loss on transaction of FX |
7,321,097 | 8,185,494 | ||||||
| Loss on translation of FX |
63,830 | 35,226 | ||||||
| Contribution to miscellaneous funds |
338,568 | 357,801 | ||||||
| KDIC deposit insurance fees |
211,583 | 247,596 | ||||||
| Donation |
80,862 | 61,553 | ||||||
| Loss on transactions of loans and receivables |
205,677 | 231,116 | ||||||
| Loss on disposal of joint controlling entity and associates |
69 | 40 | ||||||
| Loss on disposal of premises and equipment and other assets |
8,055 | 6,247 | ||||||
| Impairment loss of premises and equipment and other assets |
15,331 | 18,875 | ||||||
| Loss on transactions of derivatives |
27,525 | 5,641 | ||||||
| Loss on valuations of derivatives |
24,670 | 8,378 | ||||||
| Loss on fair value hedged items |
158,256 | 195,837 | ||||||
| Other provision |
117,531 | 59,260 | ||||||
| Others |
120,696 | 82,793 | ||||||
|
|
|
|
|
|||||
| Total |
12,015,540 | 13,278,296 | ||||||
|
|
|
|
|
|||||
| (3) | Administrative expenses recognized are as follows (Unit: Korean Won in millions): |
| For the years ended December 31 | ||||||||
| 2010 | 2011 | |||||||
| Short term employee benefits |
1,394,473 | 1,621,347 | ||||||
| Retirement benefit service costs |
125,862 | 158,188 | ||||||
| Fringe benefits |
349,771 | 389,055 | ||||||
| Depreciation and amortization |
267,124 | 273,607 | ||||||
| Rent |
225,457 | 232,733 | ||||||
| Taxes and dues |
148,785 | 165,468 | ||||||
| Service charges |
176,647 | 200,503 | ||||||
| IT expenses |
102,901 | 112,742 | ||||||
| Telephone and communication expenses |
65,960 | 69,501 | ||||||
| Operating promotion expenses |
57,583 | 67,517 | ||||||
| Advertising |
110,556 | 118,627 | ||||||
| Printing |
16,856 | 16,612 | ||||||
| Traveling expenses |
14,777 | 16,589 | ||||||
| Supplies |
10,716 | 11,469 | ||||||
| Insurance premium |
8,481 | 7,740 | ||||||
| Others |
245,841 | 320,741 | ||||||
|
|
|
|
|
|||||
| Total |
3,321,790 | 3,782,439 | ||||||
|
|
|
|
|
|||||
F-97
Table of Contents
40. Income Tax Expense
| (1) | Income tax expenses are as follows (Unit: Korean Won in millions): |
| For the years ended December 31 | ||||||||
| 2010 | 2011 | |||||||
| Current tax expense |
||||||||
| Current tax expense in respect of the current year |
493,046 | 632,342 | ||||||
| Adjustments recognized in the current period in relation to the current tax of prior periods |
(56,296 | ) | 5,360 | |||||
|
|
|
|
|
|||||
| Sub-total |
436,750 | 637,702 | ||||||
|
|
|
|
|
|||||
| Deferred tax expense |
||||||||
| Deferred tax expense (income) relating to the origination and reversal of temporary differences |
(13,866 | ) | 26,622 | |||||
| Deferred tax reclassified from other comprehensive income to net income |
75,237 | 79,769 | ||||||
|
|
|
|
|
|||||
| Sub-total |
61,371 | 106,391 | ||||||
|
|
|
|
|
|||||
| Income tax expense |
498,121 | 744,093 | ||||||
|
|
|
|
|
|||||
| (2) | Income tax expense can be reconciled to net income as follows (Unit: Korean Won in millions): |
| For the years ended December 31 | ||||||||
| 2010 | 2011 | |||||||
| Net income before income tax expense |
2,098,795 | 3,177,373 | ||||||
| Tax calculated at statutory tax rate (24.2%) |
507,882 | 768,898 | ||||||
| Adjustments |
||||||||
| Effect of income that is exempt from taxation |
(56,917 | ) | (102,971 | ) | ||||
| Effect of expenses that are not deductible in determining taxable profit |
102,922 | 87,922 | ||||||
| Effect on deferred tax balance due to the change in income tax rate |
(10,471 | ) | (12,856 | ) | ||||
| Adjustments recognized in the current period in relation to the current tax of prior periods |
(56,296 | ) | 5,360 | |||||
| Others |
11,001 | (2,260 | ) | |||||
|
|
|
|
|
|||||
| Sub-total |
(9,761 | ) | (24,805 | ) | ||||
|
|
|
|
|
|||||
| Income tax expense |
498,121 | 744,093 | ||||||
|
|
|
|
|
|||||
| Effective tax rate |
23.73 | % | 23.42 | % | ||||
F-98
Table of Contents
| (3) | Deferred tax assets and liabilities are as follows (Unit: Korean Won in millions): |
| January 1, 2010 | Recognized in net income |
Recognized in other comprehensive income |
December 31, 2010 | |||||||||||||
| Deferred tax assets (liabilities) in relation to : |
||||||||||||||||
| Securities |
189,840 | (67,152 | ) | — | 122,688 | |||||||||||
| Gain (loss) on valuation using the equity method of accounting |
31,491 | (33,595 | ) | 6,078 | 3,974 | |||||||||||
| Gain (loss) on valuation of derivatives |
(67,245 | ) | (34,405 | ) | (1,606 | ) | (103,256 | ) | ||||||||
| Accrued income |
(27,666 | ) | (55,489 | ) | — | (83,155 | ) | |||||||||
| Provision for credit losses |
(149,995 | ) | 231,155 | — | 81,160 | |||||||||||
| Loans and receivables written off |
67,157 | (12,835 | ) | — | 54,322 | |||||||||||
| Loan origination costs and fees |
(30,372 | ) | (2,976 | ) | — | (33,348 | ) | |||||||||
| Deposits with employee retirement insurance trust |
(44,257 | ) | 16,376 | — | (27,881 | ) | ||||||||||
| Provision for guarantee |
83,998 | (35,263 | ) | — | 48,735 | |||||||||||
| Other provision |
94,282 | (4,417 | ) | — | 89,865 | |||||||||||
| Gain on valuation of AFS financial assets |
(388,531 | ) | — | 70,613 | (317,918 | ) | ||||||||||
| Others |
73,603 | (62,770 | ) | 152 | 10,985 | |||||||||||
|
|
|
|
|
|
|
|
|
|||||||||
| (167,695 | ) | (61,371 | ) | 75,237 | (153,829 | ) | ||||||||||
|
|
|
|
|
|
|
|
|
|||||||||
| Tax losses |
— | — | — | — | ||||||||||||
|
|
|
|
|
|
|
|
|
|||||||||
| Net deferred tax assets (liabilities) |
(167,695 | ) | (61,371 | ) | 75,237 | (153,829 | ) | |||||||||
|
|
|
|
|
|
|
|
|
|||||||||
| January 1, 2011 | Recognized in net income |
Recognized in other comprehensive income |
December 31, 2011 | |||||||||||||
| Deferred tax assets (liabilities) in relation to : |
||||||||||||||||
| Securities |
122,688 | 85,090 | — | 207,778 | ||||||||||||
| Gain (loss) on valuation using the equity method of accounting |
3,974 | 26,673 | 6,312 | 36,959 | ||||||||||||
| Gain (loss) on valuation of derivatives |
(103,256 | ) | (44,585 | ) | 2,346 | (145,495 | ) | |||||||||
| Accrued income |
(83,155 | ) | (26,001 | ) | — | (109,156 | ) | |||||||||
| Provision for credit losses |
81,160 | (72,734 | ) | — | 8,426 | |||||||||||
| Loans and receivables written off |
54,322 | (46,567 | ) | — | 7,755 | |||||||||||
| Loan origination costs and fees |
(33,348 | ) | (10,619 | ) | — | (43,967 | ) | |||||||||
| Deposits with employee retirement insurance trust |
(27,881 | ) | (16,648 | ) | — | (44,529 | ) | |||||||||
| Provision for guarantee |
48,735 | 7,599 | — | 56,334 | ||||||||||||
| Other provision |
89,865 | (6,065 | ) | — | 83,800 | |||||||||||
| Gain on valuation of AFS financial assets |
(317,918 | ) | — | 72,906 | (245,012 | ) | ||||||||||
| Others |
10,985 | (2,534 | ) | (1,795 | ) | 6,656 | ||||||||||
|
|
|
|
|
|
|
|
|
|||||||||
| (153,829 | ) | (106,391 | ) | 79,769 | (180,451 | ) | ||||||||||
|
|
|
|
|
|
|
|
|
|||||||||
| Tax losses |
— | — | — | — | ||||||||||||
|
|
|
|
|
|
|
|
|
|||||||||
| Net deferred tax assets (liabilities) |
(153,829 | ) | (106,391 | ) | 79,769 | (180,451 | ) | |||||||||
|
|
|
|
|
|
|
|
|
|||||||||
F-99
Table of Contents
| (4) | Deductible temporary differences and unused tax losses where deferred tax assets are not recognized are as follows (Unit: Korean Won in millions): |
| January 1, 2010 | December 31, 2010 | December 31, 2011 | ||||||||||
| Provision for credit losses |
5,613 | 6,017 | 41,741 | |||||||||
| Unused tax losses |
508,146 | 241,730 | 235,404 | |||||||||
|
|
|
|
|
|
|
|||||||
| Total |
513,759 | 247,747 | 277,145 | |||||||||
|
|
|
|
|
|
|
|||||||
The unused tax losses of 12,562 million Won, 172,203 million Won and 50,639 million Won will be expired at the end of the year of 2013, 2019 and 2020, respectively.
| (5) | Taxable temporary differences associated with investments and interests where deferred tax liabilities are not recognized are 12,258,292 million Won, 13,058,904 million Won and 13,901,404 million Won as of January 1, 2010, December 31, 2010 and December 31, 2011, respectively. |
| (6) | Current tax assets and liabilities are as follows (Unit: Korean Won in millions): |
| January 1, 2010 | December 31, 2010 | December 31, 2011 | ||||||||||
| Current tax assets |
28,203 | 9,568 | 56,570 | |||||||||
| Current tax liabilities |
127,871 | 173,960 | 274,257 | |||||||||
| (7) | Deferred tax assets and liabilities are as follows (Unit: Korean Won in millions): |
| January 1, 2010 | December 31, 2010 | December 31, 2011 | ||||||||||
| Deferred tax assets |
74,101 | 58,705 | 79,980 | |||||||||
| Deferred tax liabilities |
241,796 | 212,534 | 260,431 | |||||||||
|
|
|
|
|
|
|
|||||||
| Net deferred tax liabilities |
(167,695 | ) | (153,829 | ) | (180,451 | ) | ||||||
|
|
|
|
|
|
|
|||||||
41. Earnings Per Share (“EPS”)
Basic EPS is calculated by dividing net income by weighted average number of common shares outstanding (Unit: Korean Won in millions except for EPS):
| For the years ended December 31 | ||||||||
| 2010 | 2011 | |||||||
| Net income attributable to common shareholders |
1,288,856 | 2,136,828 | ||||||
| Dividends to hybrid securities |
— | (1,942 | ) | |||||
| Net income attributable to common shareholders |
1,288,856 | 2,134,886 | ||||||
| Weighted average number of common shares outstanding |
806,012,779 shares | 806,012,901 shares | ||||||
| Basic EPS |
1,599 | 2,649 | ||||||
Diluted EPS is equal to basic EPS because there is no dilution effect for the years ended December 31, 2010 and 2011, respectively.
F-100
Table of Contents
42. Contingent Liabilities and Commitments
| (1) | Guarantees (Unit: Korean Won in millions): |
| January 1, 2010 | December 31, 2010 | December 31, 2011 | ||||||||||
| Confirmed guarantees |
||||||||||||
| Guarantee for debenture issuances |
46,762 | 41,594 | 135 | |||||||||
| Guarantee for loans |
170,774 | 177,276 | 290,799 | |||||||||
| Acceptances |
844,035 | 771,313 | 840,437 | |||||||||
| Guarantee in acceptances imported goods |
122,032 | 132,667 | 142,073 | |||||||||
| Other confirmed guarantees |
9,593,100 | 9,122,841 | 10,297,667 | |||||||||
|
|
|
|
|
|
|
|||||||
| Sub-total |
10,776,703 | 10,245,691 | 11,571,111 | |||||||||
|
|
|
|
|
|
|
|||||||
| Unconfirmed guarantees |
||||||||||||
| Local letter of credit |
828,703 | 962,904 | 1,003,258 | |||||||||
| Letter of credit |
5,622,149 | 5,504,962 | 4,837,106 | |||||||||
| Other unconfirmed guarantees |
4,709,636 | 3,678,567 | 3,133,110 | |||||||||
|
|
|
|
|
|
|
|||||||
| Sub-total |
11,160,488 | 10,146,433 | 8,973,474 | |||||||||
|
|
|
|
|
|
|
|||||||
| CP purchase commitments and others |
4,196,972 | 4,616,656 | 6,157,569 | |||||||||
|
|
|
|
|
|
|
|||||||
| Total |
26,134,163 | 25,008,780 | 26,702,154 | |||||||||
|
|
|
|
|
|
|
|||||||
| (2) | Loan commitments and others (Unit: Korean Won in millions): |
| January 1, 2010 | December 31, 2010 | December 31, 2011 | ||||||||||
| Loan commitments |
77,333,904 | 82,941,133 | 88,400,600 | |||||||||
| Other commitments |
9,806,877 | 10,306,693 | 9,154,660 | |||||||||
| (3) | Litigation case |
The Group had filed lawsuits as follows (Unit: Korean Won in millions):
| January 1, 2010 | December 31, 2010 | December 31, 2011 | ||||||||||||||||||||||
| As plaintiff | As dependent | As plaintiff | As dependent | As plaintiff | As dependent | |||||||||||||||||||
| Number of cases |
1,220 cases | 274 cases | 978 cases | 241 cases | 804 cases | 292 cases | ||||||||||||||||||
| Amount of litigation |
867,198 | 274,190 | 924,197 | 426,551 | 1,144,087 | 788,852 | ||||||||||||||||||
| Allowances for litigations |
— | 63,154 | — | 221,149 | — | 261,508 | ||||||||||||||||||
As of December 31, 2011, major lawsuits which the Group is facing, are due to division of structured finance’s financial incident of 2010 Gongpyung 1st Co., Ltd. amounting to 65,000 million Won (Kyongnam Bank), payment of seized deposit of Seocho District Tax Office amounting to 45,000 million Won (Woori Bank), and reimbursement of advances of Hanley Shipping INC amounting to 37,000 million Won (Woori Bank).
Sues from the electronic reminder (payment orders for unpaid credit card receivables to individuals) are not included on the litigations as of January 1, 2010, December 31, 2010 and December 31, 2011, and about that, there are no significant effects on the financial statements as of January 1, 2010, December 31, 2010 and December 31, 2011.
F-101
Table of Contents
43. Lease
| (1) | Operating lease |
Minimum lease payments’ collection under the operating lease agreement are as follows (Unit: Korean Won in millions):
| January 1, 2010 | December 31, 2010 | December 31, 2011 | ||||||||||||||||||||||
| Local currencies |
Foreign currencies |
Local currencies |
Foreign currencies |
Local currencies |
Foreign currencies |
|||||||||||||||||||
| 1 year |
15,817 | 2,289 | 1,619 | 2,330 | 155 | 1,844 | ||||||||||||||||||
| 2 years |
1,546 | 2,389 | 186 | 1,821 | 66 | — | ||||||||||||||||||
| 3 years |
21 | 1,867 | 89 | — | — | — | ||||||||||||||||||
|
|
|
|
|
|
|
|
|
|
|
|
|
|||||||||||||
| Total |
17,384 | 6,545 | 1,894 | 4,151 | 221 | 1,844 | ||||||||||||||||||
|
|
|
|
|
|
|
|
|
|
|
|
|
|||||||||||||
| (2) | Finance lease receivables |
Present value of gross investment and minimum lease payments are as follows (Unit: Korean Won in millions):
| January 1, 2010 | December 31, 2010 | December 31, 2011 | ||||||||||
| 1 year |
213,356 | 279,276 | 301,025 | |||||||||
| 2 years |
173,755 | 221,595 | 242,867 | |||||||||
| 3 years |
111,186 | 155,550 | 152,402 | |||||||||
| 4 years |
17,453 | 31,933 | 23,000 | |||||||||
| 5 years |
4,246 | 10,692 | 3,715 | |||||||||
|
|
|
|
|
|
|
|||||||
| Gross investment in lease |
519,996 | 699,046 | 723,009 | |||||||||
| Unrealized interest revenue |
(49,132 | ) | (81,307 | ) | (78,463 | ) | ||||||
|
|
|
|
|
|
|
|||||||
| Net investment in lease |
470,864 | 617,739 | 644,546 | |||||||||
| Receivables of cancellable lease |
1,454 | 444 | 673 | |||||||||
| Costs of finance lease |
7,335 | 13,688 | 16,545 | |||||||||
|
|
|
|
|
|
|
|||||||
| Receivables of finance lease |
479,653 | 631,871 | 661,764 | |||||||||
| Provision for credit losses |
(4,565 | ) | (4,240 | ) | (3,831 | ) | ||||||
|
|
|
|
|
|
|
|||||||
| Total |
475,088 | 627,631 | 657,933 | |||||||||
|
|
|
|
|
|
|
|||||||
| (3) | Finance lease liabilities |
Present value of minimum lease payments under the finance lease agreement are as follows (Unit: Korean Won in millions):
| January 1, 2010 | December 31, 2010 | December 31, 2011 | ||||||||||
| Within 1 year |
46,986 | 37,546 | 34,151 | |||||||||
| From 1 to 5 years |
55,678 | 35,658 | 48,535 | |||||||||
| Sub - total |
102,664 | 73,204 | 82,686 | |||||||||
| Present value discount |
(6,447 | ) | (4,223 | ) | (5,767 | ) | ||||||
|
|
|
|
|
|
|
|||||||
| Present value |
96,217 | 68,981 | 76,919 | |||||||||
|
|
|
|
|
|
|
|||||||
F-102
Table of Contents
44. Related Party Transactions
Related parties of the Group and major transactions with related parties during the current and prior period are as follows:
| (1) | Related parties |
| Government related entity: |
KDIC | |
| Jointly controlled entities: |
Woori Aviva Life Insurance Co., Ltd., Woori Blackstone Korea Opportunity First and Woori Renaissance Holdings | |
| Associates: |
Korea Credit Bureau Co., Ltd., Woori Service Networks Co., Ltd, Korea Finance Security, Kumho Tires Co., Inc, LIG E&C Co., Ltd., Hyunjin Co., Ltd., Chungdo Woori Century Security Corp, Ltd., Phoenix Digital Tech Co., Ltd., Bonghwang Semiconductor Yuhan Gongsa, Sempio Foods Co., Ltd, Seoul Lakeside Co., Ltd, United PF 1st Corporate Financial Stability, Woori SB Fifth Asset Securitization Specialty and 18 SPCs for the rest. | |
| (2) | Assets and liabilities from transactions with related parties are as follows (Unit: Korean Won in millions): |
| January 1, 2010 | December 31, 2010 | December 31, 2011 | ||||||||||
| Government related entity (KDIC) |
||||||||||||
| Other financial assets |
271,419 | 676,102 | 862,919 | |||||||||
| Deposits liabilities |
124,582 | 95,000 | 115,000 | |||||||||
| Other financial liabilities |
42 | 441 | 208 | |||||||||
| Other liabilities |
1,110 | 840 | 690 | |||||||||
| Jointly controlled entities |
||||||||||||
| AFS financial assets |
10 | 514 | 34,704 | |||||||||
| Loans and receivables |
1,391 | 8,341 | 8,428 | |||||||||
| Other assets |
87 | 94 | 83 | |||||||||
| Deposits liabilities |
520 | 8,616 | 4,217 | |||||||||
| Other financial liabilities |
803 | 792 | 691 | |||||||||
| Other liabilities |
569 | 234 | 234 | |||||||||
| Associates |
||||||||||||
| AFS financial assets |
402 | 16,606 | 25,557 | |||||||||
| Loans and receivables |
29,923 | 382,212 | 415,334 | |||||||||
| Other assets |
402 | — | — | |||||||||
| Deposits liabilities |
7,403 | 13,274 | 75,070 | |||||||||
| Provision |
— | 1,629 | 1,907 | |||||||||
| Other financial liabilities |
32 | 352 | 371 | |||||||||
| Other liabilities |
3 | 8 | 288 | |||||||||
F-103
Table of Contents
| (3) | Gain or loss from transactions with related parties are as follows (Unit: Korean Won in millions): |
| For the years ended December 31 | ||||||||
| 2010 | 2011 | |||||||
| Government related entity |
||||||||
| Interest income |
5,865 | 6,562 | ||||||
| Interest expense |
2,711 | 2,264 | ||||||
| Other operating loss |
1,970 | 1,455 | ||||||
| Jointly controlled entities |
||||||||
| Fee income |
14,729 | 17,569 | ||||||
| Other operating income |
3,283 | 4,911 | ||||||
| Interest expense |
165 | 27 | ||||||
| Fees and commissions expense |
28 | 25 | ||||||
| Other operating loss |
212 | 167 | ||||||
| Associates |
||||||||
| Interest income |
14,222 | 17,047 | ||||||
| Fee income |
5,835 | 7,744 | ||||||
| Other operating gain |
11,924 | 15,075 | ||||||
| Interest expense |
620 | 1,569 | ||||||
| Fees and commissions expense |
— | 10 | ||||||
| Other operating loss |
126 | 193 | ||||||
| (4) | Guarantees provided to the related parties are as follows (Unit: Korean Won in millions): |
| January 1, 2010 | December 31, 2010 | December 31, 2011 | ||||||||||||
| Kumho Tires Co., Inc. |
8,851 | 4,844 | 4,844 | Unconfirmed guarantees | ||||||||||
| ” |
663 | 819 | 660 | Endorsed notes | ||||||||||
| ” |
— | 17,146 | 17,303 | Commitments on loss sharing | ||||||||||
| ” |
2,054 | 15,889 | 18,091 | Letter of credit | ||||||||||
| Sempio Foods Co., Ltd. |
744 | 1,802 | 575 | Letter of credit | ||||||||||
| Hyunjin Co., Ltd. |
— | — | 287 | Confirmed guarantees | ||||||||||
| (5) | Management compensation is as follows (Unit: Korean Won in millions): |
| For the years ended December 31 | ||||||||
| 2010 | 2011 | |||||||
| Short term benefits |
24,570 | 26,298 | ||||||
| Severance payments |
1,345 | 1,372 | ||||||
F-104
Table of Contents
45. Business Combination
The Company established Woori FG Savings Bank Co., Ltd. by funding 110 billion Won of capital at March 2, 2011. On March 11, 2011, the Company entered into an agreement with KDIC to acquire assets and liabilities from Samhwa Saving Bank Co., Ltd. Subsequently, on March 16, 2011, Samhwa Saving Bank Co., Ltd. transferred its assets and liabilities to Woori FG Saving Bank Co., Ltd. in accordance with the agreement.
| Acquiree |
Samhwa Savings Bank Co., Ltd. | |
| Date of acquisition |
March 16, 2011 | |
| The method of obtaining control over the transferred assets and liabilities |
Acquisition of assets and liabilities of the acquiree after establishing Woori FG Savings Bank | |
| Expected effects from the acquisition |
a. Acquiring a savings bank license | |
| b. Operating synergy by acquiring another financial institution which is capable of absorbing various levels of customers | ||
| c. Acquiring a premium over other regions where the acquiree had operated | ||
| (1) | Net assets acquired and goodwill recorded from the business combination above are as follows (Unit: Korean Won in millions): |
| Amount | ||||
| Financial assets at FVTPL |
3,168 | |||
| AFS financial assets |
10,255 | |||
| HTM financial assets |
376 | |||
| Loans and receivables |
634,929 | |||
| Intangible assets(*) |
10,915 | |||
| Other assets |
175 | |||
|
|
|
|||
| Total assets |
659,818 | |||
|
|
|
|||
| Deposits due to customers |
745,580 | |||
| Other financial liabilities |
33,287 | |||
| Other liabilities |
235 | |||
|
|
|
|||
| Total liabilities |
779,102 | |||
|
|
|
|||
| Net liabilities acquired |
119,284 | |||
| KDIC payment |
(80,000 | ) | ||
| Consideration |
— | |||
|
|
|
|||
| Goodwill recorded |
39,284 | |||
|
|
|
|||
| (*) | 10,915 million Won of the customer-related intangible asset (core deposit) was recognized in intangible assets. |
F-105
Table of Contents
46. Operating Income (Expense)
The items reclassified from non-operating income or expense under Korean Generally Accepted Accounting Principles (“K-GAAP”) to operating income or expense under IFRS are as follows (Unit: Korean Won in millions):
| For the years ended December 31 | ||||||||
| 2010 | 2011 | |||||||
| Gain (loss) on disposal of premises and equipment and other assets |
(3,170 | ) | 65,520 | |||||
| Rent |
13,598 | 13,508 | ||||||
| Donations |
80,862 | 61,553 | ||||||
| Other non-operating income |
34,114 | 76,930 | ||||||
47. Transition to International Financial Reporting Standards (“IFRS”)
The Group’s financial statements are prepared in accordance with the requirements of IFRS on or after January 1, 2010, the date of transition. The consolidated statements of financial position as of December 31, 2010 and the consolidated statements of comprehensive income for the year ended December 31, 2010, which are comparatively presented, were prepared in accordance with previous GAAP(“K-GAAP”) but were restated in accordance with IFRS 1, First-time adoption of International Financial Reporting Standard.
In connection with the opening IFRS statements of financial position, the effects on the Group’s financial position, management performance and cash flows due to the adoption of IFRS are as follows:
For the opening IFRS statement of financial position, the Group has applied the following exemptions from the requirements of IFRS and exceptions to the retrospective application of some aspects of IFRS as permitted by IFRS 1, First-time adoption of International Financial Reporting Standard.
| (1) | Exemptions from IFRS |
Business combinations
The Group has elected not to apply IFRS 3, Business Combinations retrospectively to past business combinations that occurred before January 1 2010, the date of transition to IFRS.
The Group has recorded the value of goodwill at transition date of IFRS at its carrying value of K GAAP after any impairment on goodwill. No intangible asset was identified that might have been embedded in the goodwill.
Fair value or revaluation as deemed cost
The Group has elected to measure its lands and buildings at their fair value at the date of transition to IFRS and use that fair value as their deemed cost at that date.
Leases
The Group has determined whether the arrangements existing at the date of transition to IFRS contain a lease on the basis of facts and circumstances existing at that date.
Cumulative translation differences
The Group has reset the cumulative currency translation adjustments for all foreign operations to zero as of the date of transition to IFRS.
F-106
Table of Contents
Designation of previously recognized financial instruments
The Group has designated some financial assets existing at the date of transition to IFRS as financial assets measured at fair value through other comprehensive income and also some financial assets and liabilities existing at that date, which met the required criteria in IAS 39, Financial instruments: Recognition and Measurement, as measured at FVTPL.
| (2) | Exceptions to the retrospective application of IFRS |
Derecognition of financial assets and financial liabilities
The Group has applied the derecognition requirements in IAS 39, Financial instruments: Recognition and Measurement prospectively for transactions occurring on or after the date of transition to IFRS. Therefore, the non-derivative financial assets or non-derivative financial liabilities derecognized in accordance with K-GAAP as a result of a transaction that occurred before the date of transition to IFRS were not recognized in accordance with IFRS.
| (3) | Significant differences between IFRS and K-GAAP in accounting policies |
| Korean GAAP |
IFRS | |
| (a) Scope change in consolidation | ||
| The definition of control is similar to those in IFRS. However, some of the scope of consolidation is restricted by the Act on External Audit of Stock Companies as below.
- An entity that another entity owns more than 30% of shares as the largest shareholder is included in consolidation.
- A subsidiary with less than 10 billion Won in its total assets as of the previous fiscal year end is excluded from consolidation.
- An unincorporated entity such as a partnership is excluded from consolidation. |
Control is the power to govern the financial and operating policies of an entity so as to obtain benefits from its activities. All entities controlled by the Group are consolidated together with certain SPEs. SPEs include entities specializing in liquidation of assets, partnerships, and trusts with profit guarantees etc. The Group has consolidated such SPEs when the substance of the relationship between the Group and such SPEs indicates that such SPEs are controlled by the Group. As a result, there is much of the increase in the number of subsidiaries consolidated as compared with those of K-GAAP. | |
| (b) Classification of financial instruments |
||
| Financial assets are comprised of cash and due from banks, receivables, derivative assets and securities consist of trading, AFS and HTM securities. Financial liabilities are classified into mainly deposits due to customers, borrowings and debentures. | Under IAS 39, Financial Instruments: Recognition and Measurement, financial assets are classified into financial assets at FVTPL, AFS financial assets, HTM securities and loans and receivables and financial liabilities consist of financial liabilities at FVTPL and other liabilities. | |
| Reserve deposits to the Bank of Korea and Money Market Funds (“MMFs”) are classified as cash and deposit due from bank. |
MMFs which are subject to a significant risk of changes in value are classified as AFS financial assets. Reserve deposits which consist mainly of deposits with the Bank of Korea (“BOK”), which is the central bank in the Republic of Korea are classified as loans and receivables. | |
F-107
Table of Contents
| Korean GAAP |
IFRS | |
| Derivative assets or liabilities consist of trading derivatives and hedging derivatives |
The Group includes only hedging derivatives qualified for the designated and effective hedging instruments in derivative assets or liabilities and reclassifies other derivatives including trading derivatives as financial assets or liabilities at FVTPL. | |
| (c) Adoption of fair value option | ||
| K-GAAP does not allow the designation of fair value option for any financial instruments. | In accordance with the related exemption in IFRS 1, First-time Adoption of International Financial Reporting Standards, the Group has designated some part of AFS financial assets and debentures as financial assets and liabilities at FVTPL at the transition date, respectively. Instruments classified as FVTPL (AFS instruments under K-GAAP) under IFRS are carried at amortized cost under K-GAAP. | |
| (d) Reversal of impairment losses on equity instruments | ||
| Under K-GAAP, reversal of impairment losses for AFS equity instruments is permitted up to their acquisition costs and is recorded in net income. | Impairment losses for equity instruments not be reversed and impairment losses recognized in net income for investments in equity instruments classified as AFS should not be reversed through net income. | |
| (e) Provision for credit losses | ||
| Provision for doubtful accounts to cover estimated losses on loans based on rational and unbiased criteria should be recorded. It is higher of the amount applying the percentage of loan loss allowance established by the Financial Supervisory or the amount based on loan loss experience ratio. | Provision for credit losses should be recorded when any objective evidence of impairment exists as a result of one or more events that occurred after initial recognition of the loans.
The Group first assesses whether objective evidence of impairment exists individually for loans that are individually significant, and individually or collectively for loans that are not individually significant.
If the Group determines that no objective evidence of impairment exists for an individually assessed loans, whether significant or not, it includes the loans in a group of loans with similar credit risk characteristics and collectively assesses them for impairment. Loans that are individually assessed for impairment and for which an impairment loss is or continues to be recognized are not included in a collective assessment of impairment. | |
| (f) Provision for guarantee and loan commitment | ||
| Consideration is received at the inception of contracts of guarantee with third parties. The Group recognizes considerations received as unearned income. | The main differences in provisions arise from loan commitments and financial guarantee contracts. | |
F-108
Table of Contents
| Korean GAAP |
IFRS | |
| Provision for financial guarantee and loan commitment is measured by applying the percentage of allowance for possible losses established by the Financial Supervisory Service. | [Provision for loan commitments] Provision for loan commitments are measured based on the Group’s own experience loss. Where it is not Group’s intention to trade but hold the loan, a provision on the loan commitment is only recorded where it is probable that Group will incur a loss. This may occur, for example, where a loss of principal is probable or the interest rate charged on the loan is lower than the cost of funding
[Financial guarantee contracts] Guarantee are contracts that requires the issuer to make specified payments to reimburse the holder for a loss it incurs because a specified debtor fails to make payment when due to the holder in accordance with the original or modified terms of a debt instrument. Financial guarantee contracts are recognized initially at fair value of considering receivable during the contractual period as financial guarantee contract liability as well as considerations received. After initial recognition, the Group measures it at the higher of amortized cost of financial guarantee contract liabilities and provision amount in accordance with IAS 37 Provisions, Contingent Liabilities and Contingent Assets. | |
| (g) Investment property | ||
| Under K-GAAP, the Group uses the cost model in the measurement after initial recognition.
The properties owned to earn rentals or for capital appreciation or both are classified and accounted for as property, plant and equipment under K-GAAP. |
The Group adopted the cost model for the measurement after initial recognition of investment property. However, the Group revaluated its investment properties and used revaluations as deemed cost at transition date, January 1, 2010 to IFRS.
The properties owned to earn rentals or for capital appreciation or both is classified and accounted for as investment property in accordance with IAS 40, Investment Property. | |
| (h) Revaluation of premises and equipment | ||
| Under K-GAAP, the Group uses the cost model in the measurement after initial recognition.
The depreciation method is required to be applied consistently at each period and cannot be changed unless there are justified reasons. For a newly acquired asset, the same depreciation methods applied to the existing, similar assets are applied consistently. |
The Group revaluated its lands and buildings in property, plant and equipment as at January 1, 2010 and used their fair values as deemed cost in the opening IFRS statement of financial position.
For the measurement after initial recognition, IAS 16, Property, Plant and Equipment allows for an entity to choose either the cost model or the revaluation model by the class of property, plant and equipment and the Group has chosen the cost model.
The residual value, the useful life and the depreciation method of property, plant and equipment are required to be reviewed at least at each financial year-end and, if expectations differ from previous estimates, the changes should be accounted for as a change in an accounting estimate in accordance with IAS 8, Accounting Policies, Changes in Accounting Estimates and Errors. | |
F-109
Table of Contents
| Korean GAAP |
IFRS | |
| (i) Intangible assets (including goodwill) | ||
| Goodwill is amortized over a period of up to 20 years.
Membership deposits are classified into long-term deposits in other non-current assets. |
Under IFRS, goodwill is not amortized. Impairment test should be performed at the reporting date.
Membership deposits are classified as intangible assets with indefinite useful lives. | |
| (j) Employee benefits | ||
| Allowances for retirement benefits accrued equal to the amounts to be paid at the end of reporting period, assuming that the all entitled employees with a service year more than a year would retire at once. Retirement benefit expenses incur at the point when the payment obligation is fixed. The Group recognized allowances for short-term compensated absences at the point when the payment obligation is fixed. | The Group has both the defined benefit and defined contribution plans and the amounts of defined benefit obligation are measured based on actuarial assumptions. The Group recognizes the expected cost of short-term compensated absences when the employees render service that increases their entitlement to future compensated absences. | |
| (k) Reclassification of hybrid securities from liability to equity | ||
| Under K-GAAP, hybrid securities are classified as financial liabilities as K-GAAP requires the classification of equity instruments in accordance with their legal form. | Hybrid securities are classified as equity instruments in accordance with the substance of the contractual arrangement, as the Group has the ability to avoid any future payments in the hybrid securities.
The Group reclassified hybrid securities from debentures to non-controlling interest in the consolidated statement of financial position and also adjusted the related interest expenses in its consolidated statements of comprehensive income accordingly. | |
| (l) Offsetting financial assets and financial liabilities |
||
| Receivables and payables are not offset except for the exceptional cases under K-GAAP but the Group offset receivables and payables occurring from consignment securities sales in accordance with the guide from Korean Financial Supervisory Services. | Financial assets and financial liabilities are offset and the net amount reported in the statements of financial position when there is a legally enforceable right to offset the recognized amounts and there is an intention to settle on a net basis, or realize the asset and settle the liability simultaneously. | |
F-110
Table of Contents
| (4) | Reconciliations to IFRS from Korean GAAP |
| 1) | Reconciliations of equity at January 1, 2010 (date of transition to IFRS) (Unit: Korean Won in billions): |
| Assets | Liabilities | Equity | ||||||||||
| K-GAAP |
284,904 | 268,917 | 15,987 | |||||||||
| Adjustments: |
||||||||||||
| Scope change in consolidation(*1) |
(1,955 | ) | (1,689 | ) | (266 | ) | ||||||
| Classification of financial instruments and adoption of fair value option |
(55 | ) | (1 | ) | (54 | ) | ||||||
| Hedge accounting |
— | (13 | ) | 13 | ||||||||
| Reversal of impairment losses on equity instruments |
(42 | ) | — | (42 | ) | |||||||
| Provision for credit losses |
352 | — | 352 | |||||||||
| Provision for guarantee and loan commitment |
62 | (28 | ) | 90 | ||||||||
| Revaluation of premises and equipments |
811 | — | 811 | |||||||||
| Employee benefits |
— | 87 | (87 | ) | ||||||||
| Reclassification of hybrid securities from liability to equity |
— | (2,654 | ) | 2,654 | ||||||||
| Deferred tax accounts(*2) |
(110 | ) | 136 | (246 | ) | |||||||
| Offsetting financial assets and liabilities |
826 | 826 | — | |||||||||
| Other adjustments |
48 | 49 | (1 | ) | ||||||||
|
|
|
|
|
|
|
|||||||
| Total |
(63 | ) | (3,287 | ) | 3,224 | |||||||
|
|
|
|
|
|
|
|||||||
| IFRS |
284,841 | 265,630 | 19,211 | |||||||||
|
|
|
|
|
|
|
|||||||
| (*1) | Scope change of consolidation includes deconsolidation of Woori Aviva Life Insurance Co. Ltd. (“Woori Aviva”), a joint venture of the Company and consolidation of various SPEs where the Company has controls. Deconsolidation of Woori Aviva effects mainly decrease of 587 billion Won of HTM financial assets, 447 billion Won of AFS financial assets, 265 billion Won of other assets and 1,389 billion Won of actuarial liabilities as of January 1, 2010. Consolidation of SPEs effects increase of 1,797 billion Won of AFS financial assets, 1,231billion Won of loan and receivables, 1,793 billion Won of borrowings, and 526 billion Won of debentures as of January 1, 2010. |
| (*2) | Including the income tax effect on above GAAP differences |
| 2) | Reconciliations of equity at December 31, 2010 (Unit: Korean Won in billions): |
| Assets | Liabilities | Equity | ||||||||||
| K-GAAP |
291,428 | 274,509 | 16,919 | |||||||||
| Adjustments: |
||||||||||||
| Scope change in consolidation(*1) |
(2,211 | ) | (2,056 | ) | (155 | ) | ||||||
| Classification of financial instruments and adoption of fair value option |
(121 | ) | 50 | (171 | ) | |||||||
| Hedge accounting |
1 | (6 | ) | 7 | ||||||||
| Reversal of impairment losses on equity instruments |
(23 | ) | — | (23 | ) | |||||||
| Provision for credit losses |
233 | — | 233 | |||||||||
| Provision for guarantee and loan commitment |
62 | (172 | ) | 234 | ||||||||
| Revaluation of premises and equipments |
804 | — | 804 | |||||||||
| Employee benefits |
— | 7 | (7 | ) | ||||||||
| Reclassification of hybrid securities from liability to equity |
— | (2,624 | ) | 2,624 | ||||||||
| Deferred tax accounts (*2) |
(135 | ) | 156 | (291 | ) | |||||||
| Offsetting financial assets and liabilities |
1,071 | 1,071 | — | |||||||||
| Other adjustments |
68 | (22 | ) | 90 | ||||||||
|
|
|
|
|
|
|
|||||||
| Total |
(251 | ) | (3,596 | ) | 3,345 | |||||||
|
|
|
|
|
|
|
|||||||
| IFRS |
291,177 | 270,913 | 20,264 | |||||||||
|
|
|
|
|
|
|
|||||||
F-111
Table of Contents
| (*1) | Scope change of consolidation includes deconsolidation of Woori Aviva Life Insurance Co. Ltd. (“Woori Aviva”), a joint venture of the Company and consolidation of various SPEs where the Company has controls. Deconsolidation of Woori Aviva effects mainly decrease of 810 billion Won of HTM financial assets, 849 billion Won of AFS financial assets, 228 billion Won of other assets and 2,181 billion Won of actuarial liabilities as of December 31, 2010. Consolidation of SPEs effects increase of 2,198 billion Won of AFS financial assets, 1,931 billion Won of loan and receivables, 1,557 billion Won of borrowings, and 810 billion Won of debentures as of December 31, 2010. |
| (*2) | Including the income tax effect on above GAAP differences |
| 3) | Reconciliation of total comprehensive income for the year ended December 31, 2010 (Unit: Korean Won in billions): |
| Total comprehensive income |
||||
| K-GAAP |
1,033 | |||
| Adjustments: |
||||
| Scope change in consolidation |
192 | |||
| Classification of financial instruments and adoption of fair value option |
(120 | ) | ||
| Hedge accounting |
(5 | ) | ||
| Reversal of impairment losses on equity instruments |
19 | |||
| Provision for credit losses |
(124 | ) | ||
| Provision for guarantee and loan commitment |
143 | |||
| Depreciation on premises and equipments revalued at transition date |
(8 | ) | ||
| Employee benefits |
80 | |||
| Reclassification of hybrid securities from liability to equity |
140 | |||
| Deferred tax accounts(*1) |
(34 | ) | ||
| Other adjustments |
49 | |||
|
|
|
|||
| Total |
332 | |||
|
|
|
|||
| IFRS |
1,365 | |||
|
|
|
|||
| (*1) | Including the income tax effect on above GAAP differences |
| (5) | Details of cash flow adjustments |
In accordance with IFRS, the Group adjusted cash flows of relevant revenue (expense) and assets (liabilities) to separately present interest receivables, interest payment, dividend income, and current tax that were not presented separately under K-GAAP. There is no other significant difference between the statements of cash flows presented under the provisions of IFRS and K-GAAP.
F-112
Table of Contents
48. Significant Differences between IFRS and US GAAP
The Group’s financial statements are prepared in accordance with the requirements of IFRS which differ in certain significant aspect from US GAAP. The following is a summary of significant differences between two GAAPs.
| (1) | Significant differences between IFRS and US GAAP in accounting policies |
| IFRS |
US GAAP | |
| (a) Scope change in consolidation | ||
| Consolidation under IFRS is based on the concept of control, which is defined in IAS 27.4 as “the power to govern the financial and operating policies of an entity so as to obtain benefits from its activities.” Furthermore, IAS 27.13 states that in addition to voting control, an entity is deemed to have control over a subsidiary even if the Company owns 50% or less of the voting power of an entity, when there is an agreement with other investors, other contractual or statutory means, and de factor control.
For SPEs, the Group considers the general control guidance in SIC-12. The control existence is evaluated in terms of the activities of SPE’s operation, the decision-making powers, benefits, and risks.
The Group consolidated a subsidiary, Woori Investment & Securities by de facto control. The Group holds 35% ownership of a subsidiary and the remaining shares are held by thousand of shareholders, none individually holding more than 5%. In addition, there is no related party among the remaining shareholders. The Group effectively has been controlled the subsidiary’s financial and operational policies through the nomination of directors, shareholder meetings, and sharing the group strategies. |
Under US GAAP, there are two different models used to determine whether consolidation is appropriate: the voting interest model and the variable interest model.
The primary beneficiary of a variable interest entity (“VIE”) is required to consolidate the VIE. The primary beneficiary of a VIE is the entity which has the power to direct the activities of the VIE that most significantly impact the VIE’s economic performance and the obligation to absorb losses of the VIE that could potentially be significant to the VIE or the right to receive benefits from the VIE that could potentially be significant to the VIE.
If an entity is not a VIE, the voting interest model should be used. Under the voting interest model, the usual condition for consolidation is evidence of a majority voting interest (i.e., ownership of, directly or indirectly, more than 50 percent of the outstanding voting shares of another entity).
The Group accounted Woori Investment & Securities using equity method accounting. | |
| (b) Securities designated at FVTPL or classification of financial assets as loan and receivables or AFS | ||
| Adoption of fair value option : Under IFRS, the Group elects fair value option for some financial assets and liabilities. A financial asset or a financial liability may upon initial recognition be designated as at FVTPL only if it meets one of following conditions.
a) it eliminates accounting mismatch b) a group of financial assets or liabilities is managed and its performance is evaluated on fair value basis c) in the case of hybrid contract one or more embedded derivatives
Debt securities : Certain non-derivative financial assets in the form of a debt security with fixed or determinable repayments that are not quoted in an active market are classified as loans and receivables. |
The Group does not elect fair value option for financial assets and liabilities under US GAAP.
Under US GAAP, only debt and equity securities can be classified as AFS. (Such securities are measured at fair value with unrealized gains and losses reported in other comprehensive income). | |
F-113
Table of Contents
| IFRS |
US GAAP | |
| (c) Non-marketable equity investment classified to AFS financial assets | ||
| IAS 39 applies to all investments in equity instruments, irrespective of whether they are in security form or whether the equity instrument has a readily determinable fair value. Non marketable equity investments were valued at cost under US GAAP but are valued at fair value under IFRS where prices are reliably measured using valuation model. | Investments in equity securities without readily determinable fair values are accounted for under the cost method. | |
| (d) Foreign exchange gains and losses on monetary AFS financial assets | ||
| For the purposes of recognizing foreign exchange gains and losses, monetary AFS financial assets (for example, a debt security) resulting from retranslating monetary financial assets are recognized in net income. | Under US GAAP, such foreign exchange differences are included with other unrealized gains and losses and reported in other comprehensive income. | |
| (e) Criteria to apply hedge accounting | ||
| IFRS requires the assessment and measurement of effectiveness irrespective of whether all critical terms match between the derivative and the hedged item and it does not allow for the short cut method. | Under US GAAP, the Group applied hedge accounting without a quantitative assessment and where the criteria met, used the shortcut method to assess and measure hedge effectiveness.
The shortcut method is allowed for hedging relationships involving an interest rate swap and an interest-bearing financial instrument that meet specific requirements with a basis exist for concluding on an ongoing basis that the hedging relationship is expected to be highly effective in achieving offsetting changes in fair values or cash flows. | |
| (f) FX spot exchange | ||
| A regular way purchase or sale of FX spot exchange gives rise to a fixed price commitment between trade date and settlement date which meets the definition of a derivative financial instrument. However, as a practical expedient, these are not accounted for as derivatives if the commitment has a short duration accepted by market convention. When FX transaction is made at day T, it is normally settled at day T+2. | A regular way purchase or sale of FX spot exchange gives rise to a fixed price commitment between trade date and settlement date which procedure meets the definition of a derivative financial instrument. | |
| (g) Loan origination costs | ||
| Only costs that are incremental and directly attributable to the origination of a loan are deferred over the period of the related loan or facility. | Certain direct (but not necessarily incremental) costs are deferred and recognized over the period of the related loan or facility. | |
F-114
Table of Contents
| IFRS |
US GAAP | |
| (h) Provision for guarantee and loan commitment | ||
| One of the conditions for recognizing a provision (as a liability) is that it is probable that an outflow of resources will be required to settle the obligation. “Probable” is defined as more likely than not.
If no amount in the range is more likely than any other amount in the range, the midpoint of the range is used to measure the liability. |
One of the conditions for loss accrual is that it is probable that an asset has been impaired or a liability incurred. “Probable” is defined as likely, which is a higher threshold than “more likely than not.”
If no amount in the range is more likely than any other amount in the range, the minimum of the range is used to measure the amount to be accrued for a loss contingency. | |
| (i) Property revaluation and reclassification | ||
| As permitted in IFRS 1, the Group has elected to measure its lands and buildings at their fair value at the date of transition to IFRS using the “deemed cost” election.
Under IFRS, the properties held to earn rentals, or for capital appreciation or both are classified as investment properties. |
Property revaluation is not permitted under US GAAP and the Group applied historical cost basis less depreciation.
Properties are classified as premises and equipment. | |
| (j) Goodwill | ||
| In accordance with IFRS 1, exception from IFRS, at transition date, the carrying value of goodwill under IFRS is same amount under K-GAAP, where goodwill was amortized over a period of up to 20 years. After transition date, under IFRS, impairment test on goodwill is performed annually. | Subsequent to the acquisition of goodwill, impairment test should be performed at the end of reporting date. | |
| (k) Reclassification of hybrid securities from liability to equity | ||
| Hybrid securities are classified as equity instruments in accordance with the substance of the contractual arrangement, as the Group has the ability through the instruments’ contractual terms to avoid any future payments in the hybrid securities.
The Group reclassified hybrid equity securities from debentures to non-controlling interest in the consolidated statement of financial position and also adjusted the related interest expenses in its consolidated statements of comprehensive income accordingly. |
An instrument is classified as liability or equity under US GAAP primarily depending on its legal form. However, a mandatorily redeemable financial instrument in the form of a share shall be classified as a liability unless the redemption is required to occur only upon the liquidation or termination of the reporting entity.
Hybrid securities is issued in the legal form of debt and therefore under US GAAP it is presented as a liability. | |
| (l) Derecognition of financial assets and financial liabilities | ||
| The Group has applied the derecognition requirements in IAS 39 Financial instruments: Recognition and Measurement prospectively for transactions occurring on or after the date of transition to IFRS. Therefore, the non-derivative financial assets or non-derivative financial liabilities derecognized in accordance with K-GAAP as a result of a transaction that occurred before the date of transition to IFRS were not recognized in accordance with IFRS. |
Under ASC 860-40 criteria for a sale of financial assets a transfer of financial assets (or all or a portion of a financial asset) in which the transferor surrenders control over those financial assets shall be accounted for as a sale to the extent that consideration other than beneficial interests in the transferred assets is received in exchange. | |
| (m) Guarantee acceptance | ||
| The notional amounts of guarantee acceptances are presented on Note 42. | In accordance with SEC Regulation, guarantee acceptance is presented on the face of the balance sheets. | |
F-115
Table of Contents
| (2) | Reconciliations to IFRS from US GAAP |
| 1) | Reconciliations of shareholders’ equity under to IFRS from US GAAP as of January 1, 2010 (Unit: Korean Won in billions): |
| Assets | Liabilities | Equity | ||||||||||
| US GAAP |
267,023 | 253,801 | 13,222 | |||||||||
| Adjustments: |
||||||||||||
| Scope change in consolidation(*1) |
13,059 | 12,947 | 112 | |||||||||
| Securities designated at FVTPL or classification of financial assets as loan and receivables or AFS |
94 | 88 | 6 | |||||||||
| Non-marketable equity investments classified to AFS financial assets |
1,435 | — | 1,435 | |||||||||
| Criteria to apply hedge accounting |
1 | 55 | (54 | ) | ||||||||
| Loan origination costs |
(83 | ) | — | (83 | ) | |||||||
| Provision for credit loss(*3) |
213 | — | 213 | |||||||||
| Provision for guarantee and loan commitment |
(12 | ) | 119 | (131 | ) | |||||||
| Revaluation of properties |
1,439 | — | 1,439 | |||||||||
| Goodwill |
(33 | ) | — | (33 | ) | |||||||
| Reclassification of hybrid securities from liability to equity |
— | (2,654 | ) | 2,654 | ||||||||
| Deferred tax accounts(*2) |
396 | 148 | 248 | |||||||||
| Undo of reversal of true sale—derecognition of financial assets and liabilities |
173 | — | 173 | |||||||||
| FX spot exchange |
1,867 | 1,867 | — | |||||||||
| Due from customers on acceptances/outstanding acceptance |
(791 | ) | (791 | ) | — | |||||||
| Other adjustments |
60 | 50 | 10 | |||||||||
|
|
|
|
|
|
|
|||||||
| Total |
17,818 | 11,829 | 5,989 | |||||||||
|
|
|
|
|
|
|
|||||||
| IFRS |
284,841 | 265,630 | 19,211 | |||||||||
|
|
|
|
|
|
|
|||||||
| (*1) | Consolidation of Woori Investment & Securities effects mainly increase of 11,943 billion Won of FVTPL financial assets, 1,098 billion Won of loans, 4,580 billion Won of FVTPL financial liabilities, 5,937 billion Won of borrowing, and 1,098 billion Won of debentures issued as of January 1, 2010. Also scope change in consolidation includes elimination of intercompany transactions. |
| (*2) | Including the income tax effect on above GAAP differences |
| (*3) | Reconciliation of gross loan and allowances for loan losses to IFRS from US GAAP as of January 1, 2010 are as follows (Unit: Korean Won in billions): |
| Gross loan | Allowances | Net | ||||||||||
| US GAAP |
187,615 | (3,557 | ) | 184,058 | ||||||||
| Consolidation of Woori Investment & Securities (A) |
1,190 | (164 | ) | 1,026 | ||||||||
| Reclassification (B) |
12,122 | (223 | ) | 11,899 | ||||||||
| Loan origination costs (C) |
(70 | ) | (70 | ) | ||||||||
| Subsequent events adjustments (D) |
— | 20 | 20 | |||||||||
| Refinements in the allowances (E) |
— | 416 | 416 | |||||||||
|
|
|
|
|
|
|
|||||||
| 13,242 | 49 | 13,291 | ||||||||||
|
|
|
|
|
|
|
|||||||
| IFRS |
200,857 | (3,508 | ) | 197,349 | ||||||||
|
|
|
|
|
|
|
|||||||
(A) Consolidation of Woori Investment & Securities
Woori Investment & Securities has been consolidated on the basis of de facto control under IFRS, while Woori Investment & Securities was not consolidated under US GAAP.
F-116
Table of Contents
(B) Reclassifications
Under IFRS, call loans and bonds purchased under resale agreements are presented as gross loans. Under US GAAP, call loans and bonds purchased under resale agreements are presented as “call loans and securities purchased under resale agreement.” In addition, debt securities in the amount of 5.6 trillion won which are not traded in an active market were reclassified from available-for-sale debt securities under US GAAP to loans and receivables under IFRS as such debt securities meet the definition of “loans and receivables” in IAS 39 paragraph 9.
(C) Loan origination costs
Under IFRS, loan origination costs (amounting to 0.02 trillion won) are included in gross loans while under US GAAP, loan origination costs (amounting to 0.09 trillion won) are not included in gross loans.
(D) Subsequent event adjustments
Under IFRS, the Company did not record any additional provision for loans and receivables as of January 1, 2010 in relation to “type 1” subsequent events which occurred after March 4, 2010 (the date of the Company’s financial statements for 2009 under K-GAAP) in accordance with the transition requirements under IFRS 1, which provide that estimates made in accordance with IFRS as of the date of transition to IFRS (i.e., January 1, 2010) must be consistent with estimates made in accordance with K-GAAP as of such date. In contrast, for the Company’s financial statements for 2009 prepared in accordance with US GAAP (the audit report for which was dated June 21, 2010), the Company recognized additional allowance for loan and lease losses for type 1 subsequent events that occurred during the period from March 4, 2010 to June 21, 2011 which provided additional evidence about conditions that existed at the balance sheet date (specifically, the deteriorating financial condition of certain borrowers ultimately leading to the bankruptcy of such borrowers).
(E) Refinements in the allowance methodology
The Company believes that there is no significant conceptual difference in loan loss methodology between IFRS and US GAAP with respect to establishing allowances for loan losses. For loans which are individually identified as impaired, both IFRS and US GAAP require evaluating the allowance for loan losses based on the present value of future cash flows discounted at the loan’s effective interest rate based on the individual loans. Accordingly, allowances for loan losses that are individually measured are the same under US GAAP and IFRS. Also, for allowances for loan losses that are collectively measured, both IFRS and US GAAP measure such allowance by the probability of default and the loss given default reflecting incurred losses at the balance sheet date.
Upon the transition to IFRS, the Company refined its methodologies to estimate incurred losses in its loan portfolio that are measured on a collective basis. Such methodology refinements are in line with the banking industry practice in Korea, and the key component of the difference arising from such methodology refinements was a change in the threshold for loans for which it is required to measure allowances for loan losses individually. Lower thresholds were applied for IFRS purposes as compared to US GAAP, resulting in a smaller number of loans measured collectively under IFRS than under US GAAP. The remaining difference was due to refinements in the groupings of loans by types of collateral and product.
F-117
Table of Contents
| 2) | Reconciliations of shareholders’ equity under to IFRS from US GAAP as of December 31, 2010 (Unit: Korean Won in billions): |
| Assets | Liabilities | Equity | ||||||||||
| US GAAP |
272,937 | 258,684 | 14,253 | |||||||||
| Adjustments: |
||||||||||||
| Scope change in consolidation (*1) |
13,660 | 13,320 | 340 | |||||||||
| Securities designated at FVTPL or classification of financial assets as loan and receivables or AFS |
8 | 67 | (59 | ) | ||||||||
| Non-marketable equity investments classified to AFS financial assets |
1,136 | — | 1,136 | |||||||||
| Criteria to apply hedge accounting |
1 | 156 | (155 | ) | ||||||||
| Loan origination costs |
(71 | ) | — | (71 | ) | |||||||
| Provision for credit loss (*3) |
279 | — | 279 | |||||||||
| Provision for guarantee and loan commitment |
(15 | ) | (50 | ) | 35 | |||||||
| Revaluation of premises |
1,443 | — | 1,443 | |||||||||
| Reclassification of hybrid securities from liability to equity |
— | (2,625 | ) | 2,625 | ||||||||
| Deferred tax accounts (*2) |
399 | 164 | 235 | |||||||||
| Undo of reversal of true sale—derecognition of financial assets and liabilities |
60 | — | 60 | |||||||||
| FX spot exchange |
1,873 | 1,873 | — | |||||||||
| Due from customers on acceptances/outstanding acceptance |
(667 | ) | (667 | ) | — | |||||||
| Other adjustments |
134 | (9 | ) | 143 | ||||||||
|
|
|
|
|
|
|
|||||||
| Total |
18,240 | 12,229 | 6,011 | |||||||||
|
|
|
|
|
|
|
|||||||
| IFRS |
291,177 | 270,913 | 20,264 | |||||||||
|
|
|
|
|
|
|
|||||||
| (*1) | Consolidation of Woori Investment & Securities effects mainly increase of 10,256 billion Won of FVTPL financial assets, 1,464 billion Won of loans, 4,120 billion Won of FVTPL financial liabilities, 8,092 billion Won of borrowing, and 777 billion Won of debentures issued as of January 1, 201. Also scope change in consolidation includes elimination of intercompany transactions. |
| (*2) | Including the income tax effect on above GAAP differences |
| (*3) | Reconciliation of gross loan and allowances for loan losses to IFRS from US GAAP as of December 31, 2010 are as follows (Unit: Korean Won in billions): |
| Gross loan | Allowances | Net | ||||||||||
| US GAAP |
191,200 | (4,874 | ) | 186,326 | ||||||||
| Consolidation of Woori Investment & Securities (A) |
2,775 | (123 | ) | 2,652 | ||||||||
| Reclassification (B) |
7,391 | (141 | ) | 7,250 | ||||||||
| Loan origination costs (C) |
(73 | ) | — | (73 | ) | |||||||
| Subsequent events adjustments (D) |
— | 174 | 174 | |||||||||
| Refinements in the allowances (E) |
— | 246 | 246 | |||||||||
|
|
|
|
|
|
|
|||||||
| 10,093 | 156 | 10,249 | ||||||||||
|
|
|
|
|
|
|
|||||||
| IFRS |
201,293 | (4,718 | ) | 196,575 | ||||||||
|
|
|
|
|
|
|
|||||||
(A) Consolidation of Woori Investment & Securities
(B) Reclassifications
Under IFRS, call loans and bonds purchased under resale agreements are presented as gross loans. Under US GAAP, call loans and bonds purchased under resale agreements are presented as “call loans and securities purchased under resale agreement.” In addition, debt securities in the amount of 3.0 trillion won which are not
F-118
Table of Contents
traded in an active market were reclassified from available-for-sale debt securities under US GAAP to loans and receivables under IFRS as such debt securities meet the definition of “loans and receivables” in IAS 39 paragraph 9.
(C) Loan origination costs
Under IFRS, loan origination costs (amounting to 0.1 trillion won) are included in gross loans while under US GAAP, loan origination costs (amounting to 0.2 trillion won) are not included in gross loans.
(D) Subsequent event adjustments
Under IFRS, the Company did not record any additional allowance for loans and receivables as of December 31, 2010 in relation to “type 1” subsequent events which occurred after March 3, 2011 (the date of the Company’s financial statements for 2010 under Korean GAAP) in accordance with the transition requirements under IFRS 1 paragraphs 14 and 17, which provide that estimates made in accordance with IFRS as of the date of transition to IFRS (i.e., December 31, 2010, as the end of the comparative year is included in such date of transition) must be consistent with estimates made in accordance with Korean GAAP as of such date. In contrast, for the Company’s financial statements for 2010 prepared in accordance with US GAAP (the audit report for which was dated June 20, 2011), the Company recognized additional allowance for loan and lease losses for type 1 subsequent events that occurred during the period from March 3, 2011 to June 20, 2011 which provided additional evidence about conditions that existed at the balance sheet date (specifically, the deteriorating financial condition of certain borrowers ultimately leading to the bankruptcy of such borrowers).
(E) Refinements in the allowance methodology
The Company believes that there is no significant conceptual difference in loan loss methodology between IFRS and US GAAP with respect to establishing allowances for loan losses. For loans which are individually identified as impaired, both IFRS and US GAAP require evaluating the allowance for loan losses based on the present value of future cash flows discounted at the loan’s effective interest rate based on the individual loans. Accordingly, allowances for loan losses that are individually measured are the same under US GAAP and IFRS. Also, for allowances for loan losses that are collectively measured, both IFRS and US GAAP measure such allowance by the probability of default and the loss given default reflecting incurred losses at the balance sheet date.
Upon the transition to IFRS, the Company refined its methodologies to estimate incurred losses in its loan portfolio that are measured on a collective basis. Such methodology refinements are in line with the banking industry practice in Korea, and the key component of the difference arising from such methodology refinements was a change in the threshold for loans for which it is required to measure allowances for loan losses individually. Lower thresholds were applied for IFRS purposes as compared to US GAAP, resulting in a smaller number of loans measured collectively under IFRS than under US GAAP. The remaining difference was due to refinements in the groupings of loans by types of collateral and product.
F-119
Table of Contents
| 3) | Reconciliations of total comprehensive income to IFRS from US GAAP for the year ended December 31, 2010 (Unit: Korean Won in billions): |
| Total comprehensive income |
||||
| US GAAP |
1,266 | |||
| Adjustments: |
||||
| Scope change in consolidation |
55 | |||
| Securities designated at FVTPL or classification of financial assets as loan and receivables or AFS |
(147 | ) | ||
| Non-marketable equity investments classified to AFS financial assets |
(328 | ) | ||
| Criteria to apply hedge accounting |
(100 | ) | ||
| Loan origination cost |
10 | |||
| Provision for credit loss |
110 | |||
| Provision for guarantee and loan commitment |
228 | |||
| Depreciation on premises and equipments revalued at transition date |
25 | |||
| Impairment of goodwill |
25 | |||
| Interest expense on hybrid equity reclassified from liability to equity |
140 | |||
| Deferred tax accounts |
7 | |||
| Undo of reversal of true sale—derecognition of financial assets and liabilities |
(113 | ) | ||
| Other adjustments |
187 | |||
|
|
|
|||
| Total |
99 | |||
|
|
|
|||
| IFRS |
1,365 | |||
|
|
|
|||
49. Agreement on the Implementation of a Management Plan
(1) Since December 30, 2000, the Company’s three subsidiaries, Woori Bank, Kyongnam Bank and Kwangju Bank, and KDIC have entered into agreements to implement management plans. Under the agreements, the three subsidiaries are obligated to improve their respective financial ratios, such as BIS capital ratio, Return on Assets (ROA), General and administrative ratio, Non-performing loan rate and adjusted operating income (AOI) per person. If the three subsidiaries fail to make improvements, the KDIC can enforce the three subsidiaries to increase or decrease their capital, pursue mergers, transfer of loans and deposits, or close or sell parts of their business operations.
(2) Since July 2, 2001, the Company and KDIC have entered into an agreement whereby the Company would integrate the aforementioned subsidiaries, Woori Bank, Kyongnam Bank and Kwangju Bank, and improve their performances. The agreement stipulates that the Company should build a governance and management structure plan, implement a short-term business improvement strategy, enhance subsidiaries’ competitiveness, expedite privatization, meet the financial ratio targets, and dispose of business units in case the plan fails.
(3) In addition, on July 2, 2001, in order to implement the aforementioned agreements, the Company and its three subsidiaries entered management implementation agreements. Pursuant to the agreements, the three subsidiaries should meet management goals given by the Company, consult with the Company about material business decisions before execution, and prepare and implement a detailed business plan in conformity with the Company’s business strategies. If the three subsidiaries fail to implement the management plan, the Company may order the three subsidiaries to limit sales of the specific financial products, investments in premises and equipment, promotion of new business or new equity investment, or to close or merge their branch operations and subsidiaries.
F-120
Table of Contents
50. Parent Company
Condensed financial information of the parent company is as follows (Unit: Korean Won in millions):
| (1) | Condensed statements of financial position |
| January 1, 2010 |
December 31, 2010 |
December 31, 2011 |
||||||||||
| (Korean Won in millions) | ||||||||||||
| Assets |
||||||||||||
| Cash and cash equivalents: |
||||||||||||
| Bank subsidiaries |
23,267 | 65,346 | 33,538 | |||||||||
| Investments in subsidiaries and associates: |
||||||||||||
| Bank subsidiaries |
16,041,769 | 16,041,769 | 16,041,776 | |||||||||
| Non-bank subsidiaries |
1,308,309 | 1,341,459 | 1,783,427 | |||||||||
| Other assets |
171,904 | 160,334 | 244,264 | |||||||||
|
|
|
|
|
|
|
|||||||
| Total assets |
17,545,249 | 17,608,908 | 18,103,005 | |||||||||
|
|
|
|
|
|
|
|||||||
| Liabilities |
||||||||||||
| Borrowings & debentures |
3,804,156 | 3,654,843 | 3,653,968 | |||||||||
| Other liabilities |
20,331 | 149,894 | 234,816 | |||||||||
|
|
|
|
|
|
|
|||||||
| Total liabilities |
3,824,487 | 3,804,737 | 3,888,784 | |||||||||
|
|
|
|
|
|
|
|||||||
| Equity |
13,720,762 | 13,804,171 | 14,214,221 | |||||||||
|
|
|
|
|
|
|
|||||||
| Total liabilities and equity |
17,545,249 | 17,608,908 | 18,103,005 | |||||||||
|
|
|
|
|
|
|
|||||||
| (2) | Condensed statements of comprehensive income |
| For the years ended December 31 | ||||||||
| 2010 | 2011 | |||||||
| (Korean Won in millions, except per share data) |
||||||||
| Interest and dividend income |
||||||||
| Interest income |
||||||||
| Bank subsidiaries |
4,139 | 7,978 | ||||||
| Non-bank subsidiaries |
4,860 | 50 | ||||||
| Dividends |
||||||||
| Bank subsidiaries |
362,778 | 475,140 | ||||||
| Non-bank subsidiaries |
44,352 | 40,868 | ||||||
| Others |
(253,247 | ) | (220,586 | ) | ||||
|
|
|
|
|
|||||
| Operating income |
162,882 | 303,450 | ||||||
| Net income before income tax expense |
162,882 | 303,450 | ||||||
| Income tax expense (income) |
(1,128 | ) | (1,030 | ) | ||||
|
|
|
|
|
|||||
| Net income |
164,010 | 304,480 | ||||||
|
|
|
|
|
|||||
| Other comprehensive income, net of tax |
— | — | ||||||
|
|
|
|
|
|||||
| Total comprehensive income |
164,010 | 304,480 | ||||||
|
|
|
|
|
|||||
| Basic and diluted earnings per share |
203 | 375 | ||||||
|
|
|
|
|
|||||
F-121
Table of Contents
| (3) | Condensed statements of changes in equity |
| Capital stock |
Hybrid securities |
Capital surplus |
Other equity |
Retained earnings |
Total equity |
|||||||||||||||||||
| (Korean Won in millions) | ||||||||||||||||||||||||
| January 1, 2010 |
4,030,077 | — | 109,025 | (18 | ) | 9,581,678 | 13,720,762 | |||||||||||||||||
| Net income |
— | — | — | — | 164,010 | 164,010 | ||||||||||||||||||
| Dividends |
— | — | — | — | (80,601 | ) | (80,601 | ) | ||||||||||||||||
| December 31, 2010 |
4,030,077 | — | 109,025 | (18 | ) | 9,665,087 | 13,804,171 | |||||||||||||||||
|
|
|
|
|
|
|
|
|
|
|
|
|
|||||||||||||
| January 1, 2011 |
4,030,077 | — | 109,025 | (18 | ) | 9,665,087 | 13,804,171 | |||||||||||||||||
|
|
|
|
|
|
|
|
|
|
|
|
|
|||||||||||||
| Net income |
— | — | — | — | 304,480 | 304,480 | ||||||||||||||||||
| Dividends |
— | — | — | — | (201,503 | ) | (201,503 | ) | ||||||||||||||||
| Dividends to hybrid securities |
— | — | — | — | (1,942 | ) | (1,942 | ) | ||||||||||||||||
| Issue of hybrid securities |
— | 309,010 | — | — | — | 309,010 | ||||||||||||||||||
| Disposal of treasury stock |
— | — | 1 | 4 | — | 5 | ||||||||||||||||||
|
|
|
|
|
|
|
|
|
|
|
|
|
|||||||||||||
| December 31, 2011 |
4,030,077 | 309,010 | 109,026 | (14 | ) | 9,766,122 | 14,214,221 | |||||||||||||||||
|
|
|
|
|
|
|
|
|
|
|
|
|
|||||||||||||
| (4) | Condensed statements of cash flows |
| For the years ended December 31 | ||||||||
| 2010 | 2011 | |||||||
| (Korean Won in millions) | ||||||||
| Cash flows from operating activities: |
||||||||
| Net income |
164,010 | 304,480 | ||||||
| Adjustments: |
||||||||
| Interest income |
||||||||
| Bank subsidiaries |
4,139 | 7,978 | ||||||
| Non-bank subsidiaries |
4,860 | 50 | ||||||
| Dividend income |
||||||||
| Bank subsidiaries |
362,778 | 475,140 | ||||||
| Non-bank subsidiaries |
44,352 | 40,868 | ||||||
| Others |
(271,784 | ) | (521,925 | ) | ||||
|
|
|
|
|
|||||
| Net cash provided by operating activities |
308,355 | 306,591 | ||||||
|
|
|
|
|
|||||
| Cash flows from investing activities: |
||||||||
| Acquisition of investments in subsidiaries and associates |
||||||||
| Bank subsidiaries |
— | — | ||||||
| Non-bank subsidiaries |
33,150 | 441,970 | ||||||
| Others |
191 | 216 | ||||||
|
|
|
|
|
|||||
| Net cash used in investing activities |
(33,341 | ) | (442,186 | ) | ||||
|
|
|
|
|
|||||
| Cash flows from financing activities: |
||||||||
| Increase in borrowings and debentures |
897,666 | 1,196,280 | ||||||
| Issue of hybrid securities |
— | 309,010 | ||||||
| Repayment of borrowings and debentures |
(1,050,000 | ) | (1,200,000 | ) | ||||
| Dividends paid |
(80,601 | ) | (201,503 | ) | ||||
|
|
|
|
|
|||||
| Net cash provided by (used in) financing activities |
(232,935 | ) | 103,787 | |||||
|
|
|
|
|
|||||
| Net increase (decrease) in cash and cash equivalents |
42,079 | (31,808 | ) | |||||
| Cash and cash equivalents, beginning of the year |
23,267 | 65,346 | ||||||
|
|
|
|
|
|||||
| Cash and cash equivalents, end of the year |
65,346 | 33,538 | ||||||
|
|
|
|
|
|||||
F-122