00012434292020FYFALSEDecember 31December 31, 2020P1YtwononoP3YP3YP3YP1YP5YP3YP2YP5YP3YP2YP3YP3YP3YP3YP3YP3Y1.571400012434292020-01-012020-12-31iso4217:USD00012434292019-01-012019-12-3100012434292018-01-012018-12-31iso4217:USDxbrli:sharesxbrli:shares00012434292020-12-3100012434292019-12-310001243429ifrs-full:IssuedCapitalMember2017-12-310001243429ifrs-full:TreasurySharesMember2017-12-310001243429ifrs-full:ReserveOfEquityComponentOfConvertibleInstrumentsMember2017-12-310001243429ifrs-full:AdditionalPaidinCapitalMember2017-12-310001243429ifrs-full:RetainedEarningsMember2017-12-310001243429ifrs-full:ReserveOfExchangeDifferencesOnTranslationMember2017-12-310001243429mt:ReserveOfUnrealizedGainsLossesOnDerivativeFinancialInstrumentsMember2017-12-310001243429ifrs-full:ReserveOfGainsAndLossesOnFinancialAssetsMeasuredAtFairValueThroughOtherComprehensiveIncomeMember2017-12-310001243429ifrs-full:ReserveOfRemeasurementsOfDefinedBenefitPlansMember2017-12-310001243429ifrs-full:EquityAttributableToOwnersOfParentMember2017-12-310001243429ifrs-full:NoncontrollingInterestsMember2017-12-3100012434292017-12-310001243429ifrs-full:RetainedEarningsMember2018-01-012018-12-310001243429ifrs-full:EquityAttributableToOwnersOfParentMember2018-01-012018-12-310001243429ifrs-full:NoncontrollingInterestsMember2018-01-012018-12-310001243429ifrs-full:ReserveOfExchangeDifferencesOnTranslationMember2018-01-012018-12-310001243429mt:ReserveOfUnrealizedGainsLossesOnDerivativeFinancialInstrumentsMember2018-01-012018-12-310001243429ifrs-full:ReserveOfGainsAndLossesOnFinancialAssetsMeasuredAtFairValueThroughOtherComprehensiveIncomeMember2018-01-012018-12-310001243429ifrs-full:ReserveOfRemeasurementsOfDefinedBenefitPlansMember2018-01-012018-12-310001243429ifrs-full:TreasurySharesMember2018-01-012018-12-310001243429ifrs-full:AdditionalPaidinCapitalMember2018-01-012018-12-310001243429ifrs-full:IssuedCapitalMember2018-01-012018-12-310001243429ifrs-full:IssuedCapitalMember2018-12-310001243429ifrs-full:TreasurySharesMember2018-12-310001243429ifrs-full:ReserveOfEquityComponentOfConvertibleInstrumentsMember2018-12-310001243429ifrs-full:AdditionalPaidinCapitalMember2018-12-310001243429ifrs-full:RetainedEarningsMember2018-12-310001243429ifrs-full:ReserveOfExchangeDifferencesOnTranslationMember2018-12-310001243429mt:ReserveOfUnrealizedGainsLossesOnDerivativeFinancialInstrumentsMember2018-12-310001243429ifrs-full:ReserveOfGainsAndLossesOnFinancialAssetsMeasuredAtFairValueThroughOtherComprehensiveIncomeMember2018-12-310001243429ifrs-full:ReserveOfRemeasurementsOfDefinedBenefitPlansMember2018-12-310001243429ifrs-full:EquityAttributableToOwnersOfParentMember2018-12-310001243429ifrs-full:NoncontrollingInterestsMember2018-12-3100012434292018-12-310001243429ifrs-full:RetainedEarningsMember2019-01-012019-12-310001243429ifrs-full:EquityAttributableToOwnersOfParentMember2019-01-012019-12-310001243429ifrs-full:NoncontrollingInterestsMember2019-01-012019-12-310001243429ifrs-full:ReserveOfExchangeDifferencesOnTranslationMember2019-01-012019-12-310001243429mt:ReserveOfUnrealizedGainsLossesOnDerivativeFinancialInstrumentsMember2019-01-012019-12-310001243429ifrs-full:ReserveOfGainsAndLossesOnFinancialAssetsMeasuredAtFairValueThroughOtherComprehensiveIncomeMember2019-01-012019-12-310001243429ifrs-full:ReserveOfRemeasurementsOfDefinedBenefitPlansMember2019-01-012019-12-310001243429ifrs-full:IssuedCapitalMember2019-01-012019-12-310001243429ifrs-full:TreasurySharesMember2019-01-012019-12-310001243429ifrs-full:AdditionalPaidinCapitalMember2019-01-012019-12-310001243429ifrs-full:IssuedCapitalMember2019-12-310001243429ifrs-full:TreasurySharesMember2019-12-310001243429ifrs-full:ReserveOfEquityComponentOfConvertibleInstrumentsMember2019-12-310001243429ifrs-full:AdditionalPaidinCapitalMember2019-12-310001243429ifrs-full:RetainedEarningsMember2019-12-310001243429ifrs-full:ReserveOfExchangeDifferencesOnTranslationMember2019-12-310001243429mt:ReserveOfUnrealizedGainsLossesOnDerivativeFinancialInstrumentsMember2019-12-310001243429ifrs-full:ReserveOfGainsAndLossesOnFinancialAssetsMeasuredAtFairValueThroughOtherComprehensiveIncomeMember2019-12-310001243429ifrs-full:ReserveOfRemeasurementsOfDefinedBenefitPlansMember2019-12-310001243429ifrs-full:EquityAttributableToOwnersOfParentMember2019-12-310001243429ifrs-full:NoncontrollingInterestsMember2019-12-310001243429ifrs-full:RetainedEarningsMember2020-01-012020-12-310001243429ifrs-full:EquityAttributableToOwnersOfParentMember2020-01-012020-12-310001243429ifrs-full:NoncontrollingInterestsMember2020-01-012020-12-310001243429ifrs-full:ReserveOfExchangeDifferencesOnTranslationMember2020-01-012020-12-310001243429mt:ReserveOfUnrealizedGainsLossesOnDerivativeFinancialInstrumentsMember2020-01-012020-12-310001243429ifrs-full:ReserveOfGainsAndLossesOnFinancialAssetsMeasuredAtFairValueThroughOtherComprehensiveIncomeMember2020-01-012020-12-310001243429ifrs-full:ReserveOfRemeasurementsOfDefinedBenefitPlansMember2020-01-012020-12-310001243429ifrs-full:IssuedCapitalMember2020-01-012020-12-310001243429ifrs-full:AdditionalPaidinCapitalMember2020-01-012020-12-310001243429ifrs-full:TreasurySharesMember2020-01-012020-12-310001243429ifrs-full:ReserveOfEquityComponentOfConvertibleInstrumentsMember2020-01-012020-12-310001243429ifrs-full:IssuedCapitalMember2020-12-310001243429ifrs-full:TreasurySharesMember2020-12-310001243429ifrs-full:ReserveOfEquityComponentOfConvertibleInstrumentsMember2020-12-310001243429ifrs-full:AdditionalPaidinCapitalMember2020-12-310001243429ifrs-full:RetainedEarningsMember2020-12-310001243429ifrs-full:ReserveOfExchangeDifferencesOnTranslationMember2020-12-310001243429mt:ReserveOfUnrealizedGainsLossesOnDerivativeFinancialInstrumentsMember2020-12-310001243429ifrs-full:ReserveOfGainsAndLossesOnFinancialAssetsMeasuredAtFairValueThroughOtherComprehensiveIncomeMember2020-12-310001243429ifrs-full:ReserveOfRemeasurementsOfDefinedBenefitPlansMember2020-12-310001243429ifrs-full:EquityAttributableToOwnersOfParentMember2020-12-310001243429ifrs-full:NoncontrollingInterestsMember2020-12-310001243429mt:MandatorilyConvertibleUnsecuredUnsubordinatedBondsMember2011-09-27xbrli:pure0001243429mt:NAFTAMembermt:ArcelorMittalDofascoG.P.Member2020-01-012020-12-310001243429mt:ArcelorMittalMexicoS.A.deC.V.Membermt:NAFTAMember2020-01-012020-12-310001243429mt:NAFTAMembermt:ArcelorMittalLongProductsCanadaG.P.Member2020-01-012020-12-310001243429mt:ArcelorMittalBrasilS.A.Membermt:BrazilSegmentMember2020-01-012020-12-310001243429mt:AcindarIndustriaArgentinadeAcerosS.A.Membermt:BrazilSegmentMember2020-01-012020-12-310001243429mt:ArcelorMittalFranceS.A.S.Membermt:EuropeSegmentMember2020-01-012020-12-310001243429mt:EuropeSegmentMembermt:ArcelorMittalBelgiumN.V.Member2020-01-012020-12-310001243429mt:ArcelorMittalEspaaS.A.Membermt:EuropeSegmentMember2020-01-012020-12-310001243429mt:EuropeSegmentMembermt:ArcelorMittalFlatCarbonEuropeS.A.Member2020-01-012020-12-310001243429mt:ArcelorMittalPolandS.A.Membermt:EuropeSegmentMember2020-01-012020-12-310001243429mt:ArcelorMittalEisenhttenstadtGmbHMembermt:EuropeSegmentMember2020-01-012020-12-310001243429mt:EuropeSegmentMembermt:ArcelorMittalBremenGmbHMember2020-01-012020-12-310001243429mt:ArcelorMittalMediterraneS.A.S.Membermt:EuropeSegmentMember2020-01-012020-12-310001243429mt:EuropeSegmentMembermt:ArcelorMittalBelvalDifferdangeS.A.Member2020-01-012020-12-310001243429mt:ArcelorMittalHamburgGmbHMembermt:EuropeSegmentMember2020-01-012020-12-310001243429mt:EuropeSegmentMembermt:ArcelorMittalDuisburgGmbHMember2020-01-012020-12-310001243429mt:ArcelorMittalInternationalLuxembourgS.A.Membermt:EuropeSegmentMember2020-01-012020-12-310001243429mt:EuropeSegmentMembermt:ArcelorMittalItaliaS.p.AMember2020-01-012020-12-310001243429mt:ArcelorMittalSouthAfricaLtd.Membermt:ACISMember2020-01-012020-12-310001243429mt:JSCArcelorMittalTemirtauMembermt:ACISMember2020-01-012020-12-310001243429mt:PJSCArcelorMittalKryvyiRihMembermt:ACISMember2020-01-012020-12-310001243429mt:MiningMembermt:ArcelorMittalMiningCanadaG.P.andArcelorMittalInfrastructureG.P.Member2020-01-012020-12-310001243429mt:MiningMembermt:ArcelorMittalLiberiaLtdMember2020-01-012020-12-310001243429mt:AcindarIndustriaArgentinadeAcerosS.A.Member2020-12-310001243429mt:AcindarIndustriaArgentinadeAcerosS.A.Member2019-12-310001243429mt:AcindarIndustriaArgentinadeAcerosS.A.Member2020-01-012020-12-310001243429mt:AcindarIndustriaArgentinadeAcerosS.A.Member2019-01-012019-12-310001243429mt:IndustriasUniconCAMember2020-12-310001243429mt:IndustriasUniconCAMember2019-12-310001243429mt:IndustriasUniconCAMember2018-12-310001243429mt:AMInvestcoItalyS.p.A.Member2018-11-012018-11-010001243429mt:AMInvestcoItalyS.p.A.Membermt:ArcelorMittalItaliaS.p.AMember2018-11-092018-11-09iso4217:EUR0001243429mt:ArcelorMittalItaliaS.p.AMember2018-11-01mt:worker0001243429mt:ArcelorMittalItaliaS.p.AMember2018-09-012018-09-300001243429mt:ArcelorMittalItaliaS.p.AMember2018-11-012018-11-010001243429mt:ArcelorMittalItaliaS.p.AMember2018-11-012018-12-310001243429mt:EmissionRightsMembermt:ArcelorMittalItaliaS.p.AMember2018-11-010001243429mt:ArcelorMittalItaliaS.p.AMember2018-01-012018-12-310001243429mt:BargainPurchaseGainMembermt:ArcelorMittalItaliaS.p.AMember2019-10-012019-12-310001243429mt:OtherLiabilitiesMembermt:ArcelorMittalItaliaS.p.AMember2019-10-012019-12-310001243429mt:DeferredTaxLiabilitiesMembermt:ArcelorMittalItaliaS.p.AMember2019-10-012019-12-310001243429mt:PropertyPlantAndEquipment1Membermt:ArcelorMittalItaliaS.p.AMember2019-10-012019-12-310001243429mt:SitrelMember2018-04-012018-04-010001243429mt:ArcelorMittalSulFluminenseMember2018-04-012018-04-010001243429mt:ArcelorMittalSulFluminenseMember2018-04-010001243429mt:ArcelorMittalSulFluminenseMembermt:OtherLiabilitiesMember2019-01-012019-06-300001243429mt:SitrelMembermt:ArcelorMittalSulFluminenseMember2018-04-010001243429mt:ArcelorMittalSulFluminenseMember2018-04-012018-12-310001243429mt:ArcelorMittalItaliaS.p.AAndArcelorMittalSulFluminenseMember2018-01-012018-12-310001243429mt:MunkerMetallprofileGmBHMember2019-06-040001243429mt:MunkerMetallprofileGmBHMember2019-06-042019-06-040001243429mt:MunkerMetallprofileGmBHMemberifrs-full:GoodwillMember2019-06-040001243429mt:MunkerMetallprofileGmBHMembermt:CurrentAssetsMember2019-06-040001243429mt:MunkerMetallprofileGmBHMember2019-06-042019-12-310001243429mt:MunkerMetallprofileGmBHMember2019-01-012019-12-310001243429mt:ArcelorMittalSulFluminenseMember2019-04-010001243429mt:AMUSADivestmentBusinessMembermt:DisposalGroupDisposedofbySaleNotDiscontinuedOperationsMember2020-12-092020-12-090001243429ifrs-full:OrdinarySharesMembermt:ClevelandCliffsIncMembermt:AMUSADivestmentBusinessMember2020-12-090001243429ifrs-full:PreferenceSharesMembermt:ClevelandCliffsIncMembermt:AMUSADivestmentBusinessMember2020-12-090001243429mt:AMUSADivestmentBusinessMembermt:DisposalGroupDisposedofbySaleNotDiscontinuedOperationsMember2020-12-31mt:divestment_package0001243429mt:ArcelorMittalItaliaRemediesMembermt:DisposalGroupDisposedofbySaleNotDiscontinuedOperationsMember2018-05-070001243429mt:ArcelorMittalItaliaRemediesMembermt:DisposalGroupDisposedofbySaleNotDiscontinuedOperationsMember2019-06-300001243429mt:ArcelorMittalItaliaRemediesMembermt:DisposalGroupDisposedofbySaleNotDiscontinuedOperationsMember2019-06-302019-06-300001243429mt:ArcelorMittalItaliaRemediesMembermt:DisposalGroupDisposedofbySaleNotDiscontinuedOperationsMember2019-06-282019-06-280001243429mt:ArcelorMittalItaliaRemediesMembermt:DisposalGroupDisposedofbySaleNotDiscontinuedOperationsMember2019-01-012019-06-300001243429mt:ArcelorMittalItaliaRemediesMembermt:DisposalGroupDisposedofbySaleNotDiscontinuedOperationsMember2019-01-012019-12-310001243429mt:GlobalCharteringLimitedMembermt:DisposalGroupDisposedofbySaleNotDiscontinuedOperationsMember2019-12-312019-12-310001243429mt:GlobalCharteringLimitedMembermt:DisposalGroupDisposedofbySaleNotDiscontinuedOperationsMember2019-01-012019-12-310001243429mt:GlobalCharteringLimitedMember2019-12-312019-12-310001243429mt:GlobalCharteringLimitedMemberifrs-full:MiscellaneousOtherProvisionsMember2019-01-012019-12-310001243429mt:FrydekMistekMembermt:DisposalGroupDisposedofbySaleNotDiscontinuedOperationsMember2018-02-282018-02-28mt:employer00012434292018-05-012018-05-310001243429mt:VotorantimremediesMembermt:DisposalGroupDisposedofbySaleNotDiscontinuedOperationsMember2018-02-072018-02-070001243429mt:AMUSADivestmentBusinessMembermt:DisposalGroupDisposedofbySaleNotDiscontinuedOperationsMember2020-12-090001243429mt:GlobalCharteringLimitedMembermt:DisposalGroupDisposedofbySaleNotDiscontinuedOperationsMember2019-12-310001243429mt:FrydekMistekMembermt:DisposalGroupDisposedofbySaleNotDiscontinuedOperationsMember2018-02-280001243429mt:VotorantimremediesMembermt:DisposalGroupDisposedofbySaleNotDiscontinuedOperationsMember2018-02-070001243429ifrs-full:DisposalGroupsClassifiedAsHeldForSaleMember2020-03-040001243429mt:ArcelorMittalItaliaS.p.AMember2020-12-14mt:capital_increase0001243429ifrs-full:DisposalGroupsClassifiedAsHeldForSaleMembermt:AMInvestcoItalyS.p.A.Member2021-01-012021-03-310001243429ifrs-full:DisposalGroupsClassifiedAsHeldForSaleMemberifrs-full:DisposalOfMajorSubsidiaryMembermt:AMInvestcoItalyS.p.A.Member2021-01-012021-03-310001243429ifrs-full:DisposalGroupsClassifiedAsHeldForSaleMembermt:AMInvestcoItalyS.p.A.Member2021-01-012022-05-310001243429ifrs-full:DisposalGroupsClassifiedAsHeldForSaleMemberifrs-full:TopOfRangeMembermt:AMInvestcoItalyS.p.A.Member2021-01-012022-05-310001243429mt:EuropeSegmentMemberifrs-full:GoodwillMember2020-01-012020-12-310001243429mt:CostofSalesMember2020-12-312020-12-310001243429ifrs-full:DisposalGroupsClassifiedAsHeldForSaleMembermt:ArcelorMittalItaliaRemediesMember2020-12-310001243429mt:ArcelorMittalNipponSteelIndiaLimitedMember2020-01-012020-12-310001243429mt:CalvertMember2020-01-012020-12-310001243429mt:ValinArcelorMittalAutomotiveSteelMember2020-01-012020-12-310001243429mt:TamehMember2020-01-012020-12-310001243429mt:BorcelikCelikSanayiiTicaretAnonimSirketiMember2020-01-012020-12-310001243429mt:ArcelorMittalNipponSteelIndiaLimitedMember2020-12-310001243429mt:CalvertMember2020-12-310001243429mt:ValinArcelorMittalAutomotiveSteelMember2020-12-310001243429mt:TamehMember2020-12-310001243429mt:BorcelikCelikSanayiiTicaretAnonimSirketiMember2020-12-310001243429ifrs-full:JointVenturesMember2020-12-310001243429ifrs-full:JointVenturesMember2020-01-012020-12-310001243429mt:ArcelorMittalNipponSteelIndiaLimitedMember2019-01-012019-12-310001243429mt:CalvertMember2019-01-012019-12-310001243429mt:ValinArcelorMittalAutomotiveSteelMember2019-01-012019-12-310001243429mt:TamehMember2019-01-012019-12-310001243429mt:BorcelikCelikSanayiiTicaretAnonimSirketiMember2019-01-012019-12-310001243429mt:ArcelorMittalNipponSteelIndiaLimitedMember2019-12-310001243429mt:CalvertMember2019-12-310001243429mt:ValinArcelorMittalAutomotiveSteelMember2019-12-310001243429mt:TamehMember2019-12-310001243429mt:BorcelikCelikSanayiiTicaretAnonimSirketiMember2019-12-310001243429ifrs-full:JointVenturesMember2019-12-310001243429ifrs-full:JointVenturesMember2019-01-012019-12-310001243429mt:CalvertMember2018-01-012018-12-310001243429mt:ValinArcelorMittalAutomotiveSteelMember2018-01-012018-12-310001243429mt:TamehMember2018-01-012018-12-310001243429mt:BorcelikCelikSanayiiTicaretAnonimSirketiMember2018-01-012018-12-310001243429mt:CalvertMember2018-12-310001243429mt:ValinArcelorMittalAutomotiveSteelMember2018-12-310001243429mt:TamehMember2018-12-310001243429mt:BorcelikCelikSanayiiTicaretAnonimSirketiMember2018-12-310001243429ifrs-full:JointVenturesMember2018-12-310001243429ifrs-full:JointVenturesMember2018-01-012018-12-310001243429mt:ArcelorMittalNipponSteelIndiaLimitedMember2019-12-082019-12-080001243429mt:NipponSteelCorporationMembermt:ArcelorMittalNipponSteelIndiaLimitedMember2019-12-082019-12-080001243429mt:ArcelorMittalNipponSteelIndiaLimitedMember2019-12-162019-12-160001243429mt:ArcelorMittalNipponSteelIndiaLimitedMember2019-12-160001243429mt:NipponSteelCorporationMembermt:ArcelorMittalNipponSteelIndiaLimitedMember2019-12-160001243429mt:ArcelorMittalNipponSteelIndiaLimitedMember2019-01-012019-12-310001243429mt:NipponSteelCorporationMembermt:ArcelorMittalNipponSteelIndiaLimitedMember2019-01-012019-12-310001243429mt:NipponSteelCorporationMembermt:ArcelorMittalNipponSteelIndiaLimitedMember2019-12-162019-12-160001243429mt:NipponSteelCorporationMemberifrs-full:RetainedEarningsMembermt:ArcelorMittalNipponSteelIndiaLimitedMember2019-01-012019-12-310001243429mt:ArcelorMittalAndNipponSteelCorporationMembermt:ArcelorMittalNipponSteelIndiaLimitedMember2019-12-160001243429mt:ArcelorMittalNipponSteelIndiaLimitedMembermt:SevenBillionTermFacilityDue2020Member2019-12-162019-12-160001243429mt:SevenBillionTermFacilityDue2020Member2018-11-200001243429ifrs-full:JointVenturesWhereEntityIsVenturerMembermt:NipponSteelCorporationMembermt:ArcelorMittalNipponSteelIndiaLimitedMember2019-12-162019-12-16mt:plantmt:service_centermt:plant_system0001243429mt:ArcelorMittalNipponSteelIndiaLimitedMember2018-10-262018-10-260001243429mt:ArcelorMittalNipponSteelIndiaLimitedMember2018-10-26mt:stage0001243429mt:ArcelorMittalNipponSteelIndiaLimitedMembermt:UttamGalvaMember2019-12-160001243429mt:NipponSteelCorporationMembermt:ArcelorMittalNipponSteelIndiaLimitedMembermt:UttamGalvaMember2019-12-160001243429mt:ArcelorMittalAndNipponSteelCorporationMembermt:ArcelorMittalNipponSteelIndiaLimitedMembermt:UttamGalvaMember2019-12-160001243429mt:ArcelorMittalNipponSteelIndiaLimitedMembermt:SevenBillionTermFacilityDue2020Membermt:UttamGalvaMember2019-12-162019-12-160001243429ifrs-full:JointVenturesWhereEntityIsVenturerMembermt:ArcelorMittalNipponSteelIndiaLimitedMembermt:UttamGalvaMember2019-12-162019-12-160001243429mt:ArcelorMittalNipponSteelIndiaLimitedMember2019-12-312019-12-310001243429mt:ArcelorMittalNipponSteelIndiaLimitedMember2020-02-130001243429mt:ArcelorMittalNipponSteelIndiaLimitedMembermt:SevenBillionTermFacilityDue2020Member2020-02-132020-02-130001243429ifrs-full:JointVenturesWhereEntityIsVenturerMembermt:NipponSteelCorporationMembermt:ArcelorMittalNipponSteelIndiaLimitedMember2020-02-132020-02-130001243429mt:FivePointOneFourSixBillionTermLoanDue2030Member2020-03-160001243429mt:FivePointOneFourSixBillionTermLoanDue2030Member2020-03-162020-03-160001243429mt:SevenBillionBridgeTermFacilitiesMember2020-03-270001243429mt:OdishaSlurryPipelineInfrastructureLimitedMember2020-07-072020-07-07mt:tonne0001243429mt:ThakuraniIronOreMineMembermt:ArcelorMittalNipponSteelIndiaLimitedMember2020-07-230001243429mt:MacsteelMembermt:DisposalGroupDisposedofbySaleNotDiscontinuedOperationsMember2018-05-282018-05-28utr:t0001243429mt:CalvertMember2020-12-092020-12-09mt:facility0001243429mt:ChinaOrientalGroupCompanyLimitedMember2020-01-012020-12-310001243429mt:DHSGroupDomain2020-01-012020-12-310001243429mt:GonvarriSteelIndustriesMember2020-01-012020-12-310001243429mt:BaffinlandMember2020-01-012020-12-310001243429mt:ChinaOrientalGroupCompanyLimitedMember2020-12-310001243429mt:DHSGroupDomain2020-12-310001243429mt:GonvarriSteelIndustriesMember2020-12-310001243429mt:BaffinlandMember2020-12-310001243429ifrs-full:AssociatesMember2020-12-310001243429ifrs-full:AssociatesMember2020-01-012020-12-310001243429mt:BaffinlandMember2020-09-012020-09-300001243429mt:ChinaOrientalGroupCompanyLimitedMember2019-01-012019-12-310001243429mt:DHSGroupDomain2019-01-012019-12-310001243429mt:GonvarriSteelIndustriesMember2019-01-012019-12-310001243429mt:BaffinlandMember2019-01-012019-12-310001243429mt:ChinaOrientalGroupCompanyLimitedMember2019-12-310001243429mt:DHSGroupDomain2019-12-310001243429mt:GonvarriSteelIndustriesMember2019-12-310001243429mt:BaffinlandMember2019-12-310001243429ifrs-full:AssociatesMember2019-12-310001243429ifrs-full:AssociatesMember2019-01-012019-12-310001243429mt:ChinaOrientalGroupCompanyLimitedMember2018-01-012018-12-310001243429mt:DHSGroupDomain2018-01-012018-12-310001243429mt:GonvarriSteelIndustriesMember2018-01-012018-12-310001243429mt:BaffinlandMember2018-01-012018-12-310001243429mt:ChinaOrientalGroupCompanyLimitedMember2018-12-310001243429mt:DHSGroupDomain2018-12-310001243429mt:GonvarriSteelIndustriesMember2018-12-310001243429mt:BaffinlandMember2018-12-310001243429ifrs-full:AssociatesMember2018-12-310001243429ifrs-full:AssociatesMember2018-01-012018-12-310001243429mt:ChinaOrientalGroupCompanyLimitedMember2017-01-272017-01-270001243429mt:ChinaOrientalGroupCompanyLimitedMember2017-01-262017-01-260001243429mt:ChinaOrientalGroupCompanyLimitedMember2018-01-012018-01-310001243429mt:DHSGroupDomain2020-12-312020-12-310001243429mt:BaffinlandMember2017-01-012017-12-310001243429ifrs-full:AggregatedIndividuallyImmaterialAssociatesMember2020-12-310001243429ifrs-full:AggregatedIndividuallyImmaterialJointVenturesMember2020-12-310001243429ifrs-full:AggregatedIndividuallyImmaterialAssociatesMemberifrs-full:AggregatedIndividuallyImmaterialJointVenturesMember2020-12-310001243429ifrs-full:AggregatedIndividuallyImmaterialAssociatesMember2019-12-310001243429ifrs-full:AggregatedIndividuallyImmaterialJointVenturesMember2019-12-310001243429ifrs-full:AggregatedIndividuallyImmaterialAssociatesMemberifrs-full:AggregatedIndividuallyImmaterialJointVenturesMember2019-12-310001243429ifrs-full:AggregatedIndividuallyImmaterialAssociatesMember2020-01-012020-12-310001243429ifrs-full:AggregatedIndividuallyImmaterialJointVenturesMember2020-01-012020-12-310001243429ifrs-full:AggregatedIndividuallyImmaterialAssociatesMemberifrs-full:AggregatedIndividuallyImmaterialJointVenturesMember2020-01-012020-12-310001243429ifrs-full:AggregatedIndividuallyImmaterialAssociatesMember2019-01-012019-12-310001243429ifrs-full:AggregatedIndividuallyImmaterialJointVenturesMember2019-01-012019-12-310001243429ifrs-full:AggregatedIndividuallyImmaterialAssociatesMemberifrs-full:AggregatedIndividuallyImmaterialJointVenturesMember2019-01-012019-12-310001243429ifrs-full:JointVenturesWhereEntityIsVenturerMembermt:ArcelorMittalTubularProductsAlJubailMember2019-01-012019-12-310001243429mt:ArcelorMittalTubularProductsAlJubailMember2019-01-012019-12-310001243429mt:ArcelorMittalTubularProductsAlJubailMember2018-12-310001243429mt:ArcelorMittalTubularProductsAlJubailMember2019-12-310001243429ifrs-full:JointVenturesWhereEntityIsVenturerMembermt:ArcelorMittalTubularProductsAlJubailMember2020-12-310001243429mt:PeaColoradaMember2019-01-012019-12-310001243429mt:PeaColoradaMember2020-01-012020-12-310001243429mt:HibbingTaconiteMinesMember2019-01-012019-12-310001243429mt:HibbingTaconiteMinesMember2020-01-012020-12-310001243429mt:INTekMember2020-01-012020-12-310001243429mt:INTekMember2019-01-012019-12-310001243429mt:DoubleGCoatingMember2020-01-012020-12-310001243429mt:DoubleGCoatingMember2019-01-012019-12-310001243429mt:OtherInvestments1Membermt:ClevelandCliffsIncMember2020-12-310001243429mt:OtherInvestments1Membermt:ClevelandCliffsIncMember2019-12-310001243429mt:OtherInvestments1Membermt:EregliDemirveCelikFabrikalariT.A.S.Member2020-12-310001243429mt:OtherInvestments1Membermt:EregliDemirveCelikFabrikalariT.A.S.Member2019-12-310001243429mt:OtherInvestments1Membermt:StalproduktSAMember2020-12-310001243429mt:OtherInvestments1Membermt:StalproduktSAMember2019-12-310001243429mt:OtherInvestments1Membermt:PowercellSwedenMember2020-12-310001243429mt:OtherInvestments1Membermt:PowercellSwedenMember2019-12-310001243429mt:OtherInvestments1Membermt:OtherInvestmentIssuersMember2020-12-310001243429mt:OtherInvestments1Membermt:OtherInvestmentIssuersMember2019-12-310001243429mt:OtherInvestments1Member2020-12-310001243429mt:OtherInvestments1Member2019-12-310001243429ifrs-full:OrdinarySharesMembermt:ClevelandCliffsIncMember2020-12-090001243429ifrs-full:PreferenceSharesMembermt:ClevelandCliffsIncMember2020-12-090001243429ifrs-full:OrdinarySharesMembermt:ClevelandCliffsIncMember2020-01-012020-12-310001243429ifrs-full:PreferenceSharesMembermt:ClevelandCliffsIncMember2020-01-012020-12-310001243429mt:OtherInvestments1Membermt:ClevelandCliffsIncMemberifrs-full:OtherDisposalsOfAssetsMember2021-02-092021-02-090001243429mt:OtherInvestments1Membermt:ClevelandCliffsIncMemberifrs-full:OtherDisposalsOfAssetsMember2021-02-090001243429mt:OtherInvestments1Membermt:ClevelandCliffsIncMemberifrs-full:OtherDisposalsOfAssetsMember2021-02-012021-02-280001243429mt:OtherInvestments1Membermt:EregliDemirveCelikFabrikalariT.A.S.Member2020-01-012020-12-310001243429mt:OtherInvestments1Membermt:EregliDemirveCelikFabrikalariT.A.S.Member2019-01-012019-12-310001243429mt:OtherInvestments1Membermt:StalproduktSAMember2020-01-012020-12-310001243429mt:OtherInvestments1Membermt:StalproduktSAMember2019-01-012019-12-310001243429mt:OtherInvestments1Membermt:PowercellSwedenMember2019-01-012019-12-310001243429mt:OtherInvestments1Membermt:PowercellSwedenMember2020-01-012020-12-310001243429mt:OtherInvestments1Membermt:GerdauMember2018-12-310001243429mt:OtherInvestments1Membermt:GerdauMember2019-07-162019-07-16mt:vessel0001243429mt:MacsteelMembermt:DisposalGroupDisposedofbySaleNotDiscontinuedOperationsMember2018-01-012018-12-310001243429mt:MacsteelMember2018-01-012018-12-310001243429mt:ChinaOrientalGroupCompanyLimitedMember2017-01-012017-12-310001243429mt:EmpireIronMiningPartnershipMember2017-01-012017-12-310001243429mt:EmpireIronMiningPartnershipMember2019-01-012019-12-310001243429mt:EmpireIronMiningPartnershipMember2018-01-012018-12-31mt:segment0001243429ifrs-full:OperatingSegmentsMembermt:NAFTAMember2020-01-012020-12-310001243429ifrs-full:OperatingSegmentsMembermt:BrazilSegmentMember2020-01-012020-12-310001243429ifrs-full:OperatingSegmentsMembermt:EuropeSegmentMember2020-01-012020-12-310001243429ifrs-full:OperatingSegmentsMembermt:ACISMember2020-01-012020-12-310001243429ifrs-full:OperatingSegmentsMembermt:MiningMember2020-01-012020-12-310001243429ifrs-full:OperatingSegmentsMemberifrs-full:AllOtherSegmentsMember2020-01-012020-12-310001243429mt:NAFTAMemberifrs-full:EliminationOfIntersegmentAmountsMember2020-01-012020-12-310001243429mt:BrazilSegmentMemberifrs-full:EliminationOfIntersegmentAmountsMember2020-01-012020-12-310001243429mt:EuropeSegmentMemberifrs-full:EliminationOfIntersegmentAmountsMember2020-01-012020-12-310001243429ifrs-full:EliminationOfIntersegmentAmountsMembermt:ACISMember2020-01-012020-12-310001243429mt:MiningMemberifrs-full:EliminationOfIntersegmentAmountsMember2020-01-012020-12-310001243429ifrs-full:AllOtherSegmentsMemberifrs-full:EliminationOfIntersegmentAmountsMember2020-01-012020-12-310001243429ifrs-full:EliminationOfIntersegmentAmountsMember2020-01-012020-12-310001243429ifrs-full:OperatingSegmentsMembermt:NAFTAMember2019-01-012019-12-310001243429ifrs-full:OperatingSegmentsMembermt:BrazilSegmentMember2019-01-012019-12-310001243429ifrs-full:OperatingSegmentsMembermt:EuropeSegmentMember2019-01-012019-12-310001243429ifrs-full:OperatingSegmentsMembermt:ACISMember2019-01-012019-12-310001243429ifrs-full:OperatingSegmentsMembermt:MiningMember2019-01-012019-12-310001243429ifrs-full:OperatingSegmentsMemberifrs-full:AllOtherSegmentsMember2019-01-012019-12-310001243429mt:NAFTAMemberifrs-full:EliminationOfIntersegmentAmountsMember2019-01-012019-12-310001243429mt:BrazilSegmentMemberifrs-full:EliminationOfIntersegmentAmountsMember2019-01-012019-12-310001243429mt:EuropeSegmentMemberifrs-full:EliminationOfIntersegmentAmountsMember2019-01-012019-12-310001243429ifrs-full:EliminationOfIntersegmentAmountsMembermt:ACISMember2019-01-012019-12-310001243429mt:MiningMemberifrs-full:EliminationOfIntersegmentAmountsMember2019-01-012019-12-310001243429ifrs-full:AllOtherSegmentsMemberifrs-full:EliminationOfIntersegmentAmountsMember2019-01-012019-12-310001243429ifrs-full:EliminationOfIntersegmentAmountsMember2019-01-012019-12-310001243429ifrs-full:OperatingSegmentsMembermt:NAFTAMember2018-01-012018-12-310001243429ifrs-full:OperatingSegmentsMembermt:BrazilSegmentMember2018-01-012018-12-310001243429ifrs-full:OperatingSegmentsMembermt:EuropeSegmentMember2018-01-012018-12-310001243429ifrs-full:OperatingSegmentsMembermt:ACISMember2018-01-012018-12-310001243429ifrs-full:OperatingSegmentsMembermt:MiningMember2018-01-012018-12-310001243429ifrs-full:OperatingSegmentsMemberifrs-full:AllOtherSegmentsMember2018-01-012018-12-310001243429mt:NAFTAMemberifrs-full:EliminationOfIntersegmentAmountsMember2018-01-012018-12-310001243429mt:BrazilSegmentMemberifrs-full:EliminationOfIntersegmentAmountsMember2018-01-012018-12-310001243429mt:EuropeSegmentMemberifrs-full:EliminationOfIntersegmentAmountsMember2018-01-012018-12-310001243429ifrs-full:EliminationOfIntersegmentAmountsMembermt:ACISMember2018-01-012018-12-310001243429mt:MiningMemberifrs-full:EliminationOfIntersegmentAmountsMember2018-01-012018-12-310001243429ifrs-full:AllOtherSegmentsMemberifrs-full:EliminationOfIntersegmentAmountsMember2018-01-012018-12-310001243429ifrs-full:EliminationOfIntersegmentAmountsMember2018-01-012018-12-310001243429country:US2020-01-012020-12-310001243429country:US2019-01-012019-12-310001243429country:US2018-01-012018-12-310001243429country:BR2020-01-012020-12-310001243429country:BR2019-01-012019-12-310001243429country:BR2018-01-012018-12-310001243429country:CA2020-01-012020-12-310001243429country:CA2019-01-012019-12-310001243429country:CA2018-01-012018-12-310001243429country:MX2020-01-012020-12-310001243429country:MX2019-01-012019-12-310001243429country:MX2018-01-012018-12-310001243429country:AR2020-01-012020-12-310001243429country:AR2019-01-012019-12-310001243429country:AR2018-01-012018-12-310001243429mt:OtherAmericasMember2020-01-012020-12-310001243429mt:OtherAmericasMember2019-01-012019-12-310001243429mt:OtherAmericasMember2018-01-012018-12-310001243429srt:AmericasMember2020-01-012020-12-310001243429srt:AmericasMember2019-01-012019-12-310001243429srt:AmericasMember2018-01-012018-12-310001243429country:DE2020-01-012020-12-310001243429country:DE2019-01-012019-12-310001243429country:DE2018-01-012018-12-310001243429country:PL2020-01-012020-12-310001243429country:PL2019-01-012019-12-310001243429country:PL2018-01-012018-12-310001243429country:FR2020-01-012020-12-310001243429country:FR2019-01-012019-12-310001243429country:FR2018-01-012018-12-310001243429country:ES2020-01-012020-12-310001243429country:ES2019-01-012019-12-310001243429country:ES2018-01-012018-12-310001243429country:IT2020-01-012020-12-310001243429country:IT2019-01-012019-12-310001243429country:IT2018-01-012018-12-310001243429country:CZ2020-01-012020-12-310001243429country:CZ2019-01-012019-12-310001243429country:CZ2018-01-012018-12-310001243429country:TR2020-01-012020-12-310001243429country:TR2019-01-012019-12-310001243429country:TR2018-01-012018-12-310001243429country:GB2020-01-012020-12-310001243429country:GB2019-01-012019-12-310001243429country:GB2018-01-012018-12-310001243429country:BE2020-01-012020-12-310001243429country:BE2019-01-012019-12-310001243429country:BE2018-01-012018-12-310001243429country:NL2020-01-012020-12-310001243429country:NL2019-01-012019-12-310001243429country:NL2018-01-012018-12-310001243429country:RU2020-01-012020-12-310001243429country:RU2019-01-012019-12-310001243429country:RU2018-01-012018-12-310001243429country:RO2020-01-012020-12-310001243429country:RO2019-01-012019-12-310001243429country:RO2018-01-012018-12-310001243429country:UA2020-01-012020-12-310001243429country:UA2019-01-012019-12-310001243429country:UA2018-01-012018-12-310001243429mt:OtherEuropeMember2020-01-012020-12-310001243429mt:OtherEuropeMember2019-01-012019-12-310001243429mt:OtherEuropeMember2018-01-012018-12-310001243429srt:EuropeMember2020-01-012020-12-310001243429srt:EuropeMember2019-01-012019-12-310001243429srt:EuropeMember2018-01-012018-12-310001243429country:ZA2020-01-012020-12-310001243429country:ZA2019-01-012019-12-310001243429country:ZA2018-01-012018-12-310001243429country:MA2020-01-012020-12-310001243429country:MA2019-01-012019-12-310001243429country:MA2018-01-012018-12-310001243429country:EG2020-01-012020-12-310001243429country:EG2019-01-012019-12-310001243429country:EG2018-01-012018-12-310001243429mt:RestofAfricaMember2020-01-012020-12-310001243429mt:RestofAfricaMember2019-01-012019-12-310001243429mt:RestofAfricaMember2018-01-012018-12-310001243429country:CN2020-01-012020-12-310001243429country:CN2019-01-012019-12-310001243429country:CN2018-01-012018-12-310001243429country:KZ2020-01-012020-12-310001243429country:KZ2019-01-012019-12-310001243429country:KZ2018-01-012018-12-310001243429country:KR2020-01-012020-12-310001243429country:KR2019-01-012019-12-310001243429country:KR2018-01-012018-12-310001243429country:IN2020-01-012020-12-310001243429country:IN2019-01-012019-12-310001243429country:IN2018-01-012018-12-310001243429mt:RestofAsiaMember2020-01-012020-12-310001243429mt:RestofAsiaMember2019-01-012019-12-310001243429mt:RestofAsiaMember2018-01-012018-12-310001243429mt:AsiaandAfricaMember2020-01-012020-12-310001243429mt:AsiaandAfricaMember2019-01-012019-12-310001243429mt:AsiaandAfricaMember2018-01-012018-12-310001243429country:LU2020-01-012020-12-310001243429country:LU2019-01-012019-12-310001243429country:LU2018-01-012018-12-310001243429country:CA2020-12-310001243429country:CA2019-12-310001243429country:BR2020-12-310001243429country:BR2019-12-310001243429country:US2020-12-310001243429country:US2019-12-310001243429country:MX2020-12-310001243429country:MX2019-12-310001243429country:AR2020-12-310001243429country:AR2019-12-310001243429country:VE2020-12-310001243429country:VE2019-12-310001243429mt:OtherAmericasMember2020-12-310001243429mt:OtherAmericasMember2019-12-310001243429srt:AmericasMember2020-12-310001243429srt:AmericasMember2019-12-310001243429country:FR2020-12-310001243429country:FR2019-12-310001243429country:DE2020-12-310001243429country:DE2019-12-310001243429country:BE2020-12-310001243429country:BE2019-12-310001243429country:PL2020-12-310001243429country:PL2019-12-310001243429country:UA2020-12-310001243429country:UA2019-12-310001243429country:ES2020-12-310001243429country:ES2019-12-310001243429country:IT2020-12-310001243429country:IT2019-12-310001243429country:LU2020-12-310001243429country:LU2019-12-310001243429country:BA2020-12-310001243429country:BA2019-12-310001243429country:RO2020-12-310001243429country:RO2019-12-310001243429country:CZ2020-12-310001243429country:CZ2019-12-310001243429mt:OtherEuropeMember2020-12-310001243429mt:OtherEuropeMember2019-12-310001243429srt:EuropeMember2020-12-310001243429srt:EuropeMember2019-12-310001243429country:KZ2020-12-310001243429country:KZ2019-12-310001243429country:ZA2020-12-310001243429country:ZA2019-12-310001243429country:LR2020-12-310001243429country:LR2019-12-310001243429country:MA2020-12-310001243429country:MA2019-12-310001243429mt:OtherAsiaandAfricaMember2020-12-310001243429mt:OtherAsiaandAfricaMember2019-12-310001243429mt:AsiaandAfricaMember2020-12-310001243429mt:AsiaandAfricaMember2019-12-310001243429mt:FlatproductsMember2020-01-012020-12-310001243429mt:FlatproductsMember2019-01-012019-12-310001243429mt:FlatproductsMember2018-01-012018-12-310001243429mt:LongproductsMember2020-01-012020-12-310001243429mt:LongproductsMember2019-01-012019-12-310001243429mt:LongproductsMember2018-01-012018-12-310001243429mt:TubularproductsMember2020-01-012020-12-310001243429mt:TubularproductsMember2019-01-012019-12-310001243429mt:TubularproductsMember2018-01-012018-12-310001243429mt:MiningproductsMember2020-01-012020-12-310001243429mt:MiningproductsMember2019-01-012019-12-310001243429mt:MiningproductsMember2018-01-012018-12-310001243429mt:OtherproductsMember2020-01-012020-12-310001243429mt:OtherproductsMember2019-01-012019-12-310001243429mt:OtherproductsMember2018-01-012018-12-310001243429mt:SteelSalesMemberifrs-full:OperatingSegmentsMembermt:NAFTAMember2020-01-012020-12-310001243429mt:SteelSalesMemberifrs-full:OperatingSegmentsMembermt:BrazilSegmentMember2020-01-012020-12-310001243429mt:SteelSalesMemberifrs-full:OperatingSegmentsMembermt:EuropeSegmentMember2020-01-012020-12-310001243429mt:SteelSalesMemberifrs-full:OperatingSegmentsMembermt:ACISMember2020-01-012020-12-310001243429mt:SteelSalesMemberifrs-full:OperatingSegmentsMembermt:MiningMember2020-01-012020-12-310001243429mt:SteelSalesMemberifrs-full:UnallocatedAmountsMember2020-01-012020-12-310001243429mt:SteelSalesMember2020-01-012020-12-310001243429ifrs-full:OperatingSegmentsMembermt:NAFTAMembermt:NonSteelSalesMember2020-01-012020-12-310001243429ifrs-full:OperatingSegmentsMembermt:BrazilSegmentMembermt:NonSteelSalesMember2020-01-012020-12-310001243429ifrs-full:OperatingSegmentsMembermt:EuropeSegmentMembermt:NonSteelSalesMember2020-01-012020-12-310001243429ifrs-full:OperatingSegmentsMembermt:NonSteelSalesMembermt:ACISMember2020-01-012020-12-310001243429ifrs-full:OperatingSegmentsMembermt:MiningMembermt:NonSteelSalesMember2020-01-012020-12-310001243429ifrs-full:UnallocatedAmountsMembermt:NonSteelSalesMember2020-01-012020-12-310001243429mt:NonSteelSalesMember2020-01-012020-12-310001243429ifrs-full:OperatingSegmentsMembermt:NAFTAMembermt:ByProductSalesMember2020-01-012020-12-310001243429ifrs-full:OperatingSegmentsMembermt:ByProductSalesMembermt:BrazilSegmentMember2020-01-012020-12-310001243429ifrs-full:OperatingSegmentsMembermt:ByProductSalesMembermt:EuropeSegmentMember2020-01-012020-12-310001243429ifrs-full:OperatingSegmentsMembermt:ByProductSalesMembermt:ACISMember2020-01-012020-12-310001243429ifrs-full:OperatingSegmentsMembermt:ByProductSalesMembermt:MiningMember2020-01-012020-12-310001243429ifrs-full:UnallocatedAmountsMembermt:ByProductSalesMember2020-01-012020-12-310001243429mt:ByProductSalesMember2020-01-012020-12-310001243429ifrs-full:OperatingSegmentsMembermt:NAFTAMembermt:OtherSalesMember2020-01-012020-12-310001243429ifrs-full:OperatingSegmentsMembermt:BrazilSegmentMembermt:OtherSalesMember2020-01-012020-12-310001243429ifrs-full:OperatingSegmentsMembermt:OtherSalesMembermt:EuropeSegmentMember2020-01-012020-12-310001243429ifrs-full:OperatingSegmentsMembermt:OtherSalesMembermt:ACISMember2020-01-012020-12-310001243429ifrs-full:OperatingSegmentsMembermt:MiningMembermt:OtherSalesMember2020-01-012020-12-310001243429ifrs-full:UnallocatedAmountsMembermt:OtherSalesMember2020-01-012020-12-310001243429mt:OtherSalesMember2020-01-012020-12-310001243429ifrs-full:UnallocatedAmountsMember2020-01-012020-12-310001243429mt:SteelSalesMemberifrs-full:OperatingSegmentsMembermt:NAFTAMember2019-01-012019-12-310001243429mt:SteelSalesMemberifrs-full:OperatingSegmentsMembermt:BrazilSegmentMember2019-01-012019-12-310001243429mt:SteelSalesMemberifrs-full:OperatingSegmentsMembermt:EuropeSegmentMember2019-01-012019-12-310001243429mt:SteelSalesMemberifrs-full:OperatingSegmentsMembermt:ACISMember2019-01-012019-12-310001243429mt:SteelSalesMemberifrs-full:OperatingSegmentsMembermt:MiningMember2019-01-012019-12-310001243429mt:SteelSalesMemberifrs-full:UnallocatedAmountsMember2019-01-012019-12-310001243429mt:SteelSalesMember2019-01-012019-12-310001243429ifrs-full:OperatingSegmentsMembermt:NAFTAMembermt:NonSteelSalesMember2019-01-012019-12-310001243429ifrs-full:OperatingSegmentsMembermt:BrazilSegmentMembermt:NonSteelSalesMember2019-01-012019-12-310001243429ifrs-full:OperatingSegmentsMembermt:EuropeSegmentMembermt:NonSteelSalesMember2019-01-012019-12-310001243429ifrs-full:OperatingSegmentsMembermt:NonSteelSalesMembermt:ACISMember2019-01-012019-12-310001243429ifrs-full:OperatingSegmentsMembermt:MiningMembermt:NonSteelSalesMember2019-01-012019-12-310001243429ifrs-full:UnallocatedAmountsMembermt:NonSteelSalesMember2019-01-012019-12-310001243429mt:NonSteelSalesMember2019-01-012019-12-310001243429ifrs-full:OperatingSegmentsMembermt:NAFTAMembermt:ByProductSalesMember2019-01-012019-12-310001243429ifrs-full:OperatingSegmentsMembermt:ByProductSalesMembermt:BrazilSegmentMember2019-01-012019-12-310001243429ifrs-full:OperatingSegmentsMembermt:ByProductSalesMembermt:EuropeSegmentMember2019-01-012019-12-310001243429ifrs-full:OperatingSegmentsMembermt:ByProductSalesMembermt:ACISMember2019-01-012019-12-310001243429ifrs-full:OperatingSegmentsMembermt:ByProductSalesMembermt:MiningMember2019-01-012019-12-310001243429ifrs-full:UnallocatedAmountsMembermt:ByProductSalesMember2019-01-012019-12-310001243429mt:ByProductSalesMember2019-01-012019-12-310001243429ifrs-full:OperatingSegmentsMembermt:NAFTAMembermt:OtherSalesMember2019-01-012019-12-310001243429ifrs-full:OperatingSegmentsMembermt:BrazilSegmentMembermt:OtherSalesMember2019-01-012019-12-310001243429ifrs-full:OperatingSegmentsMembermt:OtherSalesMembermt:EuropeSegmentMember2019-01-012019-12-310001243429ifrs-full:OperatingSegmentsMembermt:OtherSalesMembermt:ACISMember2019-01-012019-12-310001243429ifrs-full:OperatingSegmentsMembermt:MiningMembermt:OtherSalesMember2019-01-012019-12-310001243429ifrs-full:UnallocatedAmountsMembermt:OtherSalesMember2019-01-012019-12-310001243429mt:OtherSalesMember2019-01-012019-12-310001243429ifrs-full:UnallocatedAmountsMember2019-01-012019-12-310001243429mt:SteelSalesMemberifrs-full:OperatingSegmentsMembermt:NAFTAMember2018-01-012018-12-310001243429mt:SteelSalesMemberifrs-full:OperatingSegmentsMembermt:BrazilSegmentMember2018-01-012018-12-310001243429mt:SteelSalesMemberifrs-full:OperatingSegmentsMembermt:EuropeSegmentMember2018-01-012018-12-310001243429mt:SteelSalesMemberifrs-full:OperatingSegmentsMembermt:ACISMember2018-01-012018-12-310001243429mt:SteelSalesMemberifrs-full:OperatingSegmentsMembermt:MiningMember2018-01-012018-12-310001243429mt:SteelSalesMemberifrs-full:UnallocatedAmountsMember2018-01-012018-12-310001243429mt:SteelSalesMember2018-01-012018-12-310001243429ifrs-full:OperatingSegmentsMembermt:NAFTAMembermt:NonSteelSalesMember2018-01-012018-12-310001243429ifrs-full:OperatingSegmentsMembermt:BrazilSegmentMembermt:NonSteelSalesMember2018-01-012018-12-310001243429ifrs-full:OperatingSegmentsMembermt:EuropeSegmentMembermt:NonSteelSalesMember2018-01-012018-12-310001243429ifrs-full:OperatingSegmentsMembermt:NonSteelSalesMembermt:ACISMember2018-01-012018-12-310001243429ifrs-full:OperatingSegmentsMembermt:MiningMembermt:NonSteelSalesMember2018-01-012018-12-310001243429ifrs-full:UnallocatedAmountsMembermt:NonSteelSalesMember2018-01-012018-12-310001243429mt:NonSteelSalesMember2018-01-012018-12-310001243429ifrs-full:OperatingSegmentsMembermt:NAFTAMembermt:ByProductSalesMember2018-01-012018-12-310001243429ifrs-full:OperatingSegmentsMembermt:ByProductSalesMembermt:BrazilSegmentMember2018-01-012018-12-310001243429ifrs-full:OperatingSegmentsMembermt:ByProductSalesMembermt:EuropeSegmentMember2018-01-012018-12-310001243429ifrs-full:OperatingSegmentsMembermt:ByProductSalesMembermt:ACISMember2018-01-012018-12-310001243429ifrs-full:OperatingSegmentsMembermt:ByProductSalesMembermt:MiningMember2018-01-012018-12-310001243429ifrs-full:UnallocatedAmountsMembermt:ByProductSalesMember2018-01-012018-12-310001243429mt:ByProductSalesMember2018-01-012018-12-310001243429ifrs-full:OperatingSegmentsMembermt:NAFTAMembermt:OtherSalesMember2018-01-012018-12-310001243429ifrs-full:OperatingSegmentsMembermt:BrazilSegmentMembermt:OtherSalesMember2018-01-012018-12-310001243429ifrs-full:OperatingSegmentsMembermt:OtherSalesMembermt:EuropeSegmentMember2018-01-012018-12-310001243429ifrs-full:OperatingSegmentsMembermt:OtherSalesMembermt:ACISMember2018-01-012018-12-310001243429ifrs-full:OperatingSegmentsMembermt:MiningMembermt:OtherSalesMember2018-01-012018-12-310001243429ifrs-full:UnallocatedAmountsMembermt:OtherSalesMember2018-01-012018-12-310001243429mt:OtherSalesMember2018-01-012018-12-310001243429ifrs-full:UnallocatedAmountsMember2018-01-012018-12-310001243429ifrs-full:NotLaterThanOneYearMember2020-12-310001243429mt:AMUSADivestmentBusinessMember2020-01-012020-12-310001243429ifrs-full:LaterThanSixMonthsMemberifrs-full:FinancialAssetsIndividuallyAssessedForCreditLossesMember2020-01-012020-12-310001243429mt:LessThanSixMonthsMemberifrs-full:FinancialAssetsIndividuallyAssessedForCreditLossesMember2020-01-012020-12-310001243429mt:LaterThanOneMonthMemberifrs-full:FinancialAssetsIndividuallyAssessedForCreditLossesMember2020-01-012020-12-310001243429ifrs-full:GrossCarryingAmountMemberifrs-full:TradeReceivablesMember2020-12-310001243429ifrs-full:GrossCarryingAmountMemberifrs-full:TradeReceivablesMember2019-12-310001243429ifrs-full:TradeReceivablesMemberifrs-full:AccumulatedImpairmentMember2020-12-310001243429ifrs-full:TradeReceivablesMemberifrs-full:AccumulatedImpairmentMember2019-12-310001243429ifrs-full:TradeReceivablesMember2020-12-310001243429ifrs-full:TradeReceivablesMember2019-12-310001243429mt:NAFTAMemberifrs-full:TradeReceivablesMember2020-12-310001243429mt:NAFTAMemberifrs-full:TradeReceivablesMember2019-12-310001243429mt:BrazilSegmentMemberifrs-full:TradeReceivablesMember2020-12-310001243429mt:BrazilSegmentMemberifrs-full:TradeReceivablesMember2019-12-310001243429mt:EuropeSegmentMemberifrs-full:TradeReceivablesMember2020-12-310001243429mt:EuropeSegmentMemberifrs-full:TradeReceivablesMember2019-12-310001243429ifrs-full:TradeReceivablesMembermt:ACISMember2020-12-310001243429ifrs-full:TradeReceivablesMembermt:ACISMember2019-12-310001243429mt:MiningMemberifrs-full:TradeReceivablesMember2020-12-310001243429mt:MiningMemberifrs-full:TradeReceivablesMember2019-12-310001243429ifrs-full:GrossCarryingAmountMemberifrs-full:TradeReceivablesMemberifrs-full:CurrentMember2020-12-310001243429ifrs-full:TradeReceivablesMemberifrs-full:CurrentMemberifrs-full:AccumulatedImpairmentMember2020-12-310001243429ifrs-full:TradeReceivablesMemberifrs-full:CurrentMember2020-12-310001243429ifrs-full:GrossCarryingAmountMemberifrs-full:TradeReceivablesMemberifrs-full:CurrentMember2019-12-310001243429ifrs-full:TradeReceivablesMemberifrs-full:CurrentMemberifrs-full:AccumulatedImpairmentMember2019-12-310001243429ifrs-full:TradeReceivablesMemberifrs-full:CurrentMember2019-12-310001243429ifrs-full:GrossCarryingAmountMemberifrs-full:NotLaterThanOneMonthMemberifrs-full:TradeReceivablesMember2020-12-310001243429ifrs-full:NotLaterThanOneMonthMemberifrs-full:TradeReceivablesMemberifrs-full:AccumulatedImpairmentMember2020-12-310001243429ifrs-full:NotLaterThanOneMonthMemberifrs-full:TradeReceivablesMember2020-12-310001243429ifrs-full:GrossCarryingAmountMemberifrs-full:NotLaterThanOneMonthMemberifrs-full:TradeReceivablesMember2019-12-310001243429ifrs-full:NotLaterThanOneMonthMemberifrs-full:TradeReceivablesMemberifrs-full:AccumulatedImpairmentMember2019-12-310001243429ifrs-full:NotLaterThanOneMonthMemberifrs-full:TradeReceivablesMember2019-12-310001243429ifrs-full:GrossCarryingAmountMemberifrs-full:TradeReceivablesMemberifrs-full:LaterThanOneMonthAndNotLaterThanTwoMonthsMember2020-12-310001243429ifrs-full:TradeReceivablesMemberifrs-full:AccumulatedImpairmentMemberifrs-full:LaterThanOneMonthAndNotLaterThanTwoMonthsMember2020-12-310001243429ifrs-full:TradeReceivablesMemberifrs-full:LaterThanOneMonthAndNotLaterThanTwoMonthsMember2020-12-310001243429ifrs-full:GrossCarryingAmountMemberifrs-full:TradeReceivablesMemberifrs-full:LaterThanOneMonthAndNotLaterThanTwoMonthsMember2019-12-310001243429ifrs-full:TradeReceivablesMemberifrs-full:AccumulatedImpairmentMemberifrs-full:LaterThanOneMonthAndNotLaterThanTwoMonthsMember2019-12-310001243429ifrs-full:TradeReceivablesMemberifrs-full:LaterThanOneMonthAndNotLaterThanTwoMonthsMember2019-12-310001243429ifrs-full:LaterThanTwoMonthsAndNotLaterThanThreeMonthsMemberifrs-full:GrossCarryingAmountMemberifrs-full:TradeReceivablesMember2020-12-310001243429ifrs-full:LaterThanTwoMonthsAndNotLaterThanThreeMonthsMemberifrs-full:TradeReceivablesMemberifrs-full:AccumulatedImpairmentMember2020-12-310001243429ifrs-full:LaterThanTwoMonthsAndNotLaterThanThreeMonthsMemberifrs-full:TradeReceivablesMember2020-12-310001243429ifrs-full:LaterThanTwoMonthsAndNotLaterThanThreeMonthsMemberifrs-full:GrossCarryingAmountMemberifrs-full:TradeReceivablesMember2019-12-310001243429ifrs-full:LaterThanTwoMonthsAndNotLaterThanThreeMonthsMemberifrs-full:TradeReceivablesMemberifrs-full:AccumulatedImpairmentMember2019-12-310001243429ifrs-full:LaterThanTwoMonthsAndNotLaterThanThreeMonthsMemberifrs-full:TradeReceivablesMember2019-12-310001243429ifrs-full:GrossCarryingAmountMemberifrs-full:TradeReceivablesMemberifrs-full:LaterThanThreeMonthsAndNotLaterThanSixMonthsMember2020-12-310001243429ifrs-full:TradeReceivablesMemberifrs-full:AccumulatedImpairmentMemberifrs-full:LaterThanThreeMonthsAndNotLaterThanSixMonthsMember2020-12-310001243429ifrs-full:TradeReceivablesMemberifrs-full:LaterThanThreeMonthsAndNotLaterThanSixMonthsMember2020-12-310001243429ifrs-full:GrossCarryingAmountMemberifrs-full:TradeReceivablesMemberifrs-full:LaterThanThreeMonthsAndNotLaterThanSixMonthsMember2019-12-310001243429ifrs-full:TradeReceivablesMemberifrs-full:AccumulatedImpairmentMemberifrs-full:LaterThanThreeMonthsAndNotLaterThanSixMonthsMember2019-12-310001243429ifrs-full:TradeReceivablesMemberifrs-full:LaterThanThreeMonthsAndNotLaterThanSixMonthsMember2019-12-310001243429ifrs-full:LaterThanSixMonthsMemberifrs-full:GrossCarryingAmountMemberifrs-full:TradeReceivablesMember2020-12-310001243429ifrs-full:LaterThanSixMonthsMemberifrs-full:TradeReceivablesMemberifrs-full:AccumulatedImpairmentMember2020-12-310001243429ifrs-full:LaterThanSixMonthsMemberifrs-full:TradeReceivablesMember2020-12-310001243429ifrs-full:LaterThanSixMonthsMemberifrs-full:GrossCarryingAmountMemberifrs-full:TradeReceivablesMember2019-12-310001243429ifrs-full:LaterThanSixMonthsMemberifrs-full:TradeReceivablesMemberifrs-full:AccumulatedImpairmentMember2019-12-310001243429ifrs-full:LaterThanSixMonthsMemberifrs-full:TradeReceivablesMember2019-12-310001243429ifrs-full:TradeReceivablesMember2018-12-310001243429ifrs-full:TradeReceivablesMember2017-12-310001243429ifrs-full:TradeReceivablesMember2020-01-012020-12-310001243429ifrs-full:TradeReceivablesMember2019-01-012019-12-310001243429ifrs-full:TradeReceivablesMember2018-01-012018-12-310001243429ifrs-full:BottomOfRangeMember2020-01-012020-12-310001243429ifrs-full:TopOfRangeMember2020-01-012020-12-310001243429ifrs-full:WrittenPutOptionsMember2019-12-310001243429ifrs-full:GoodwillMember2020-12-310001243429ifrs-full:GoodwillMember2019-12-310001243429mt:ConcessionsPatentsAndLicensesMember2020-12-310001243429mt:ConcessionsPatentsAndLicensesMember2019-12-310001243429ifrs-full:CustomerrelatedIntangibleAssetsMember2020-12-310001243429ifrs-full:CustomerrelatedIntangibleAssetsMember2019-12-310001243429ifrs-full:OtherIntangibleAssetsMember2020-12-310001243429ifrs-full:OtherIntangibleAssetsMember2019-12-310001243429mt:NAFTAMemberifrs-full:GoodwillMember2019-12-310001243429mt:NAFTAMemberifrs-full:GoodwillMember2020-01-012020-12-310001243429mt:NAFTAMemberifrs-full:GoodwillMember2020-12-310001243429mt:BrazilSegmentMemberifrs-full:GoodwillMember2019-12-310001243429mt:BrazilSegmentMemberifrs-full:GoodwillMember2020-01-012020-12-310001243429mt:BrazilSegmentMemberifrs-full:GoodwillMember2020-12-310001243429mt:EuropeSegmentMemberifrs-full:GoodwillMember2019-12-310001243429mt:EuropeSegmentMemberifrs-full:GoodwillMember2020-12-310001243429ifrs-full:GoodwillMembermt:ACISMember2019-12-310001243429ifrs-full:GoodwillMembermt:ACISMember2020-01-012020-12-310001243429ifrs-full:GoodwillMembermt:ACISMember2020-12-310001243429ifrs-full:GoodwillMember2020-01-012020-12-310001243429mt:NAFTAMemberifrs-full:GoodwillMember2018-12-310001243429mt:NAFTAMemberifrs-full:GoodwillMember2019-01-012019-12-310001243429mt:BrazilSegmentMemberifrs-full:GoodwillMember2018-12-310001243429mt:BrazilSegmentMemberifrs-full:GoodwillMember2019-01-012019-12-310001243429mt:EuropeSegmentMemberifrs-full:GoodwillMember2018-12-310001243429mt:EuropeSegmentMemberifrs-full:GoodwillMember2019-01-012019-12-310001243429ifrs-full:GoodwillMembermt:ACISMember2018-12-310001243429ifrs-full:GoodwillMembermt:ACISMember2019-01-012019-12-310001243429ifrs-full:GoodwillMember2018-12-310001243429ifrs-full:GoodwillMember2019-01-012019-12-310001243429mt:MunkerMetallprofileGmBHMemberifrs-full:GoodwillMember2020-01-012020-12-310001243429mt:BrazilSegmentMembermt:ArcelorMittalSulFluminenseMemberifrs-full:GoodwillMember2020-01-012020-12-310001243429ifrs-full:GrossCarryingAmountMembermt:ConcessionsPatentsAndLicensesMember2018-12-310001243429ifrs-full:CustomerrelatedIntangibleAssetsMemberifrs-full:GrossCarryingAmountMember2018-12-310001243429ifrs-full:GrossCarryingAmountMemberifrs-full:OtherIntangibleAssetsMember2018-12-310001243429ifrs-full:GrossCarryingAmountMember2018-12-310001243429ifrs-full:GrossCarryingAmountMembermt:ConcessionsPatentsAndLicensesMember2019-01-012019-12-310001243429ifrs-full:CustomerrelatedIntangibleAssetsMemberifrs-full:GrossCarryingAmountMember2019-01-012019-12-310001243429ifrs-full:GrossCarryingAmountMemberifrs-full:OtherIntangibleAssetsMember2019-01-012019-12-310001243429ifrs-full:GrossCarryingAmountMember2019-01-012019-12-310001243429ifrs-full:GrossCarryingAmountMembermt:ConcessionsPatentsAndLicensesMember2019-12-310001243429ifrs-full:CustomerrelatedIntangibleAssetsMemberifrs-full:GrossCarryingAmountMember2019-12-310001243429ifrs-full:GrossCarryingAmountMemberifrs-full:OtherIntangibleAssetsMember2019-12-310001243429ifrs-full:GrossCarryingAmountMember2019-12-310001243429ifrs-full:GrossCarryingAmountMembermt:ConcessionsPatentsAndLicensesMember2020-01-012020-12-310001243429ifrs-full:CustomerrelatedIntangibleAssetsMemberifrs-full:GrossCarryingAmountMember2020-01-012020-12-310001243429ifrs-full:GrossCarryingAmountMemberifrs-full:OtherIntangibleAssetsMember2020-01-012020-12-310001243429ifrs-full:GrossCarryingAmountMember2020-01-012020-12-310001243429ifrs-full:GrossCarryingAmountMembermt:ConcessionsPatentsAndLicensesMember2020-12-310001243429ifrs-full:CustomerrelatedIntangibleAssetsMemberifrs-full:GrossCarryingAmountMember2020-12-310001243429ifrs-full:GrossCarryingAmountMemberifrs-full:OtherIntangibleAssetsMember2020-12-310001243429ifrs-full:GrossCarryingAmountMember2020-12-310001243429ifrs-full:AccumulatedDepreciationAmortisationAndImpairmentMembermt:ConcessionsPatentsAndLicensesMember2018-12-310001243429ifrs-full:CustomerrelatedIntangibleAssetsMemberifrs-full:AccumulatedDepreciationAmortisationAndImpairmentMember2018-12-310001243429ifrs-full:AccumulatedDepreciationAmortisationAndImpairmentMemberifrs-full:OtherIntangibleAssetsMember2018-12-310001243429ifrs-full:AccumulatedDepreciationAmortisationAndImpairmentMember2018-12-310001243429ifrs-full:AccumulatedDepreciationAmortisationAndImpairmentMembermt:ConcessionsPatentsAndLicensesMember2019-01-012019-12-310001243429ifrs-full:CustomerrelatedIntangibleAssetsMemberifrs-full:AccumulatedDepreciationAmortisationAndImpairmentMember2019-01-012019-12-310001243429ifrs-full:AccumulatedDepreciationAmortisationAndImpairmentMemberifrs-full:OtherIntangibleAssetsMember2019-01-012019-12-310001243429ifrs-full:AccumulatedDepreciationAmortisationAndImpairmentMember2019-01-012019-12-310001243429ifrs-full:AccumulatedDepreciationAmortisationAndImpairmentMembermt:ConcessionsPatentsAndLicensesMember2019-12-310001243429ifrs-full:CustomerrelatedIntangibleAssetsMemberifrs-full:AccumulatedDepreciationAmortisationAndImpairmentMember2019-12-310001243429ifrs-full:AccumulatedDepreciationAmortisationAndImpairmentMemberifrs-full:OtherIntangibleAssetsMember2019-12-310001243429ifrs-full:AccumulatedDepreciationAmortisationAndImpairmentMember2019-12-310001243429ifrs-full:AccumulatedDepreciationAmortisationAndImpairmentMembermt:ConcessionsPatentsAndLicensesMember2020-01-012020-12-310001243429ifrs-full:CustomerrelatedIntangibleAssetsMemberifrs-full:AccumulatedDepreciationAmortisationAndImpairmentMember2020-01-012020-12-310001243429ifrs-full:AccumulatedDepreciationAmortisationAndImpairmentMemberifrs-full:OtherIntangibleAssetsMember2020-01-012020-12-310001243429ifrs-full:AccumulatedDepreciationAmortisationAndImpairmentMember2020-01-012020-12-310001243429ifrs-full:AccumulatedDepreciationAmortisationAndImpairmentMembermt:ConcessionsPatentsAndLicensesMember2020-12-310001243429ifrs-full:CustomerrelatedIntangibleAssetsMemberifrs-full:AccumulatedDepreciationAmortisationAndImpairmentMember2020-12-310001243429ifrs-full:AccumulatedDepreciationAmortisationAndImpairmentMemberifrs-full:OtherIntangibleAssetsMember2020-12-310001243429ifrs-full:AccumulatedDepreciationAmortisationAndImpairmentMember2020-12-310001243429mt:EmissionRightsMember2020-01-012020-12-310001243429ifrs-full:BuildingsMemberifrs-full:BottomOfRangeMember2020-01-012020-12-310001243429ifrs-full:BuildingsMemberifrs-full:TopOfRangeMember2020-01-012020-12-310001243429ifrs-full:OtherPropertyPlantAndEquipmentMemberifrs-full:BottomOfRangeMember2020-01-012020-12-310001243429ifrs-full:OtherPropertyPlantAndEquipmentMemberifrs-full:TopOfRangeMember2020-01-012020-12-310001243429mt:AuxiliaryFacilitiesMemberifrs-full:BottomOfRangeMember2020-01-012020-12-310001243429ifrs-full:TopOfRangeMembermt:AuxiliaryFacilitiesMember2020-01-012020-12-310001243429mt:OtherFacilitiesMemberifrs-full:BottomOfRangeMember2020-01-012020-12-310001243429mt:OtherFacilitiesMemberifrs-full:TopOfRangeMember2020-01-012020-12-310001243429ifrs-full:GrossCarryingAmountMemberifrs-full:LandAndBuildingsMember2018-12-310001243429ifrs-full:GrossCarryingAmountMembermt:MachineryEquipmentAndOtherMember2018-12-310001243429ifrs-full:ConstructionInProgressMemberifrs-full:GrossCarryingAmountMember2018-12-310001243429ifrs-full:RightofuseAssetsMemberifrs-full:GrossCarryingAmountMember2018-12-310001243429ifrs-full:GrossCarryingAmountMemberifrs-full:MiningAssetsMember2018-12-310001243429ifrs-full:GrossCarryingAmountMemberifrs-full:LandAndBuildingsMember2019-01-010001243429ifrs-full:GrossCarryingAmountMembermt:MachineryEquipmentAndOtherMember2019-01-010001243429ifrs-full:ConstructionInProgressMemberifrs-full:GrossCarryingAmountMember2019-01-010001243429ifrs-full:RightofuseAssetsMemberifrs-full:GrossCarryingAmountMember2019-01-010001243429ifrs-full:GrossCarryingAmountMemberifrs-full:MiningAssetsMember2019-01-010001243429ifrs-full:GrossCarryingAmountMember2019-01-010001243429ifrs-full:GrossCarryingAmountMemberifrs-full:LandAndBuildingsMember2019-01-012019-12-310001243429ifrs-full:GrossCarryingAmountMembermt:MachineryEquipmentAndOtherMember2019-01-012019-12-310001243429ifrs-full:ConstructionInProgressMemberifrs-full:GrossCarryingAmountMember2019-01-012019-12-310001243429ifrs-full:RightofuseAssetsMemberifrs-full:GrossCarryingAmountMember2019-01-012019-12-310001243429ifrs-full:GrossCarryingAmountMemberifrs-full:MiningAssetsMember2019-01-012019-12-310001243429ifrs-full:GrossCarryingAmountMemberifrs-full:LandAndBuildingsMember2019-12-310001243429ifrs-full:GrossCarryingAmountMembermt:MachineryEquipmentAndOtherMember2019-12-310001243429ifrs-full:ConstructionInProgressMemberifrs-full:GrossCarryingAmountMember2019-12-310001243429ifrs-full:RightofuseAssetsMemberifrs-full:GrossCarryingAmountMember2019-12-310001243429ifrs-full:GrossCarryingAmountMemberifrs-full:MiningAssetsMember2019-12-310001243429ifrs-full:GrossCarryingAmountMemberifrs-full:LandAndBuildingsMember2020-01-012020-12-310001243429ifrs-full:GrossCarryingAmountMembermt:MachineryEquipmentAndOtherMember2020-01-012020-12-310001243429ifrs-full:ConstructionInProgressMemberifrs-full:GrossCarryingAmountMember2020-01-012020-12-310001243429ifrs-full:RightofuseAssetsMemberifrs-full:GrossCarryingAmountMember2020-01-012020-12-310001243429ifrs-full:GrossCarryingAmountMemberifrs-full:MiningAssetsMember2020-01-012020-12-310001243429ifrs-full:GrossCarryingAmountMemberifrs-full:LandAndBuildingsMember2020-12-310001243429ifrs-full:GrossCarryingAmountMembermt:MachineryEquipmentAndOtherMember2020-12-310001243429ifrs-full:ConstructionInProgressMemberifrs-full:GrossCarryingAmountMember2020-12-310001243429ifrs-full:RightofuseAssetsMemberifrs-full:GrossCarryingAmountMember2020-12-310001243429ifrs-full:GrossCarryingAmountMemberifrs-full:MiningAssetsMember2020-12-310001243429ifrs-full:AccumulatedDepreciationAmortisationAndImpairmentMemberifrs-full:LandAndBuildingsMember2018-12-310001243429ifrs-full:AccumulatedDepreciationAmortisationAndImpairmentMembermt:MachineryEquipmentAndOtherMember2018-12-310001243429ifrs-full:ConstructionInProgressMemberifrs-full:AccumulatedDepreciationAmortisationAndImpairmentMember2018-12-310001243429ifrs-full:RightofuseAssetsMemberifrs-full:AccumulatedDepreciationAmortisationAndImpairmentMember2018-12-310001243429ifrs-full:AccumulatedDepreciationAmortisationAndImpairmentMemberifrs-full:MiningAssetsMember2018-12-310001243429ifrs-full:AccumulatedDepreciationAmortisationAndImpairmentMemberifrs-full:LandAndBuildingsMember2019-01-010001243429ifrs-full:AccumulatedDepreciationAmortisationAndImpairmentMembermt:MachineryEquipmentAndOtherMember2019-01-010001243429ifrs-full:ConstructionInProgressMemberifrs-full:AccumulatedDepreciationAmortisationAndImpairmentMember2019-01-010001243429ifrs-full:RightofuseAssetsMemberifrs-full:AccumulatedDepreciationAmortisationAndImpairmentMember2019-01-010001243429ifrs-full:AccumulatedDepreciationAmortisationAndImpairmentMemberifrs-full:MiningAssetsMember2019-01-010001243429ifrs-full:AccumulatedDepreciationAmortisationAndImpairmentMember2019-01-010001243429ifrs-full:AccumulatedDepreciationAmortisationAndImpairmentMemberifrs-full:LandAndBuildingsMember2019-01-012019-12-310001243429ifrs-full:AccumulatedDepreciationAmortisationAndImpairmentMembermt:MachineryEquipmentAndOtherMember2019-01-012019-12-310001243429ifrs-full:ConstructionInProgressMemberifrs-full:AccumulatedDepreciationAmortisationAndImpairmentMember2019-01-012019-12-310001243429ifrs-full:RightofuseAssetsMemberifrs-full:AccumulatedDepreciationAmortisationAndImpairmentMember2019-01-012019-12-310001243429ifrs-full:AccumulatedDepreciationAmortisationAndImpairmentMemberifrs-full:MiningAssetsMember2019-01-012019-12-310001243429ifrs-full:AccumulatedDepreciationAmortisationAndImpairmentMemberifrs-full:LandAndBuildingsMember2019-12-310001243429ifrs-full:AccumulatedDepreciationAmortisationAndImpairmentMembermt:MachineryEquipmentAndOtherMember2019-12-310001243429ifrs-full:ConstructionInProgressMemberifrs-full:AccumulatedDepreciationAmortisationAndImpairmentMember2019-12-310001243429ifrs-full:RightofuseAssetsMemberifrs-full:AccumulatedDepreciationAmortisationAndImpairmentMember2019-12-310001243429ifrs-full:AccumulatedDepreciationAmortisationAndImpairmentMemberifrs-full:MiningAssetsMember2019-12-310001243429ifrs-full:AccumulatedDepreciationAmortisationAndImpairmentMemberifrs-full:LandAndBuildingsMember2020-01-012020-12-310001243429ifrs-full:AccumulatedDepreciationAmortisationAndImpairmentMembermt:MachineryEquipmentAndOtherMember2020-01-012020-12-310001243429ifrs-full:ConstructionInProgressMemberifrs-full:AccumulatedDepreciationAmortisationAndImpairmentMember2020-01-012020-12-310001243429ifrs-full:RightofuseAssetsMemberifrs-full:AccumulatedDepreciationAmortisationAndImpairmentMember2020-01-012020-12-310001243429ifrs-full:AccumulatedDepreciationAmortisationAndImpairmentMemberifrs-full:MiningAssetsMember2020-01-012020-12-310001243429ifrs-full:AccumulatedDepreciationAmortisationAndImpairmentMemberifrs-full:LandAndBuildingsMember2020-12-310001243429ifrs-full:AccumulatedDepreciationAmortisationAndImpairmentMembermt:MachineryEquipmentAndOtherMember2020-12-310001243429ifrs-full:ConstructionInProgressMemberifrs-full:AccumulatedDepreciationAmortisationAndImpairmentMember2020-12-310001243429ifrs-full:RightofuseAssetsMemberifrs-full:AccumulatedDepreciationAmortisationAndImpairmentMember2020-12-310001243429ifrs-full:AccumulatedDepreciationAmortisationAndImpairmentMemberifrs-full:MiningAssetsMember2020-12-310001243429ifrs-full:LandAndBuildingsMember2019-12-310001243429mt:MachineryEquipmentAndOtherMember2019-12-310001243429ifrs-full:ConstructionInProgressMember2019-12-310001243429ifrs-full:RightofuseAssetsMember2019-12-310001243429ifrs-full:MiningAssetsMember2019-12-310001243429ifrs-full:LandAndBuildingsMember2020-12-310001243429mt:MachineryEquipmentAndOtherMember2020-12-310001243429ifrs-full:ConstructionInProgressMember2020-12-310001243429ifrs-full:RightofuseAssetsMember2020-12-310001243429ifrs-full:MiningAssetsMember2020-12-310001243429mt:PropertyPlantAndEquipment1Membermt:ArcelorMittalItaliaS.p.AMember2019-01-012019-12-310001243429mt:IFRS16Member2019-01-010001243429mt:BrazilSegmentMember2020-12-310001243429mt:BrazilSegmentMember2019-12-310001243429mt:NAFTAMember2020-12-310001243429mt:NAFTAMember2019-12-310001243429mt:EuropeSegmentMember2020-12-310001243429mt:EuropeSegmentMember2019-12-310001243429mt:ACISMember2020-12-310001243429mt:ACISMember2019-12-310001243429ifrs-full:GoodwillMember2020-01-012020-12-310001243429ifrs-full:GoodwillMember2019-01-012019-12-310001243429ifrs-full:GoodwillMember2018-01-012018-12-310001243429mt:TangibleAssetsMember2020-01-012020-12-310001243429mt:TangibleAssetsMember2019-01-012019-12-310001243429mt:TangibleAssetsMember2018-01-012018-12-31mt:uSDPerTonne0001243429ifrs-full:IndividualAssetsOrCashgeneratingUnitsWithSignificantAmountOfGoodwillOrIntangibleAssetsWithIndefiniteUsefulLivesMemberifrs-full:BottomOfRangeMember2020-12-310001243429ifrs-full:IndividualAssetsOrCashgeneratingUnitsWithSignificantAmountOfGoodwillOrIntangibleAssetsWithIndefiniteUsefulLivesMemberifrs-full:TopOfRangeMember2020-12-310001243429ifrs-full:IndividualAssetsOrCashgeneratingUnitsWithSignificantAmountOfGoodwillOrIntangibleAssetsWithIndefiniteUsefulLivesMember2020-12-310001243429mt:NAFTAMemberifrs-full:IndividualAssetsOrCashgeneratingUnitsWithSignificantAmountOfGoodwillOrIntangibleAssetsWithIndefiniteUsefulLivesMember2020-12-310001243429ifrs-full:IndividualAssetsOrCashgeneratingUnitsWithSignificantAmountOfGoodwillOrIntangibleAssetsWithIndefiniteUsefulLivesMembermt:BrazilSegmentMember2020-12-310001243429ifrs-full:IndividualAssetsOrCashgeneratingUnitsWithSignificantAmountOfGoodwillOrIntangibleAssetsWithIndefiniteUsefulLivesMembermt:EuropeSegmentMember2020-12-310001243429ifrs-full:IndividualAssetsOrCashgeneratingUnitsWithSignificantAmountOfGoodwillOrIntangibleAssetsWithIndefiniteUsefulLivesMembermt:ACISMember2020-12-310001243429mt:NAFTAMemberifrs-full:IndividualAssetsOrCashgeneratingUnitsWithSignificantAmountOfGoodwillOrIntangibleAssetsWithIndefiniteUsefulLivesMember2019-12-310001243429ifrs-full:IndividualAssetsOrCashgeneratingUnitsWithSignificantAmountOfGoodwillOrIntangibleAssetsWithIndefiniteUsefulLivesMembermt:BrazilSegmentMember2019-12-310001243429ifrs-full:IndividualAssetsOrCashgeneratingUnitsWithSignificantAmountOfGoodwillOrIntangibleAssetsWithIndefiniteUsefulLivesMembermt:EuropeSegmentMember2019-12-310001243429ifrs-full:IndividualAssetsOrCashgeneratingUnitsWithSignificantAmountOfGoodwillOrIntangibleAssetsWithIndefiniteUsefulLivesMembermt:ACISMember2019-12-310001243429ifrs-full:IndividualAssetsOrCashgeneratingUnitsWithSignificantAmountOfGoodwillOrIntangibleAssetsWithIndefiniteUsefulLivesMember2020-10-012020-10-010001243429ifrs-full:IndividualAssetsOrCashgeneratingUnitsWithSignificantAmountOfGoodwillOrIntangibleAssetsWithIndefiniteUsefulLivesMember2019-10-012019-10-010001243429mt:VotorantimremediesMembermt:DisposalGroupDisposedofbySaleNotDiscontinuedOperationsMember2018-01-012018-12-310001243429ifrs-full:DisposalGroupsClassifiedAsHeldForSaleMembermt:ArcelorMittalItaliaRemediesMember2018-01-012018-12-31mt:cash_generating_unit0001243429mt:FlorangeMember2020-01-012020-12-310001243429mt:KrakowMember2020-01-012020-12-310001243429mt:Europe1Member2020-01-012020-12-310001243429mt:NAFTAMembermt:ArcelorMittalUSALLCMember2020-07-012020-09-300001243429mt:ArcelorMittalUSALLCMembermt:NAFTAMember2019-01-012019-12-310001243429mt:ArcelorMittalSouthAfricaLtd.Membermt:ACISMember2019-01-012019-12-310001243429mt:ArcelorMittalItaliaRemediesMembermt:Europe1Member2019-01-012019-12-310001243429mt:ArcelorMittalItaliaRemediesMember2019-01-012019-12-310001243429mt:ArcelorMittalUSALLCMembermt:NAFTAMembercountry:US2019-01-012019-06-300001243429mt:ArcelorMittalUSALLCMembermt:NAFTAMembercountry:US2019-06-300001243429mt:ArcelorMittalUSALLCMembermt:NAFTAMembercountry:US2018-06-300001243429mt:ArcelorMittalUSALLCMembermt:NAFTAMembercountry:US2019-07-012019-12-310001243429mt:ArcelorMittalUSALLCMembermt:NAFTAMembercountry:US2019-12-310001243429mt:ArcelorMittalUSALLCMembermt:NAFTAMembercountry:US2018-12-310001243429mt:LongSteelProductsMembercountry:ZAmt:ACISMember2019-01-012019-12-310001243429mt:LongSteelProductsMembercountry:ZAmt:ACISMember2019-12-310001243429mt:LongSteelProductsMembercountry:ZAmt:ACISMember2018-12-310001243429mt:ArcelorMittalSouthAfricaLtd.Member2019-01-012019-12-310001243429mt:SaldanhaMember2019-01-012019-12-310001243429mt:ArcelorMittalItaliaRemediesMember2018-01-012018-12-310001243429mt:NonFinancialAssetsMember2020-12-310001243429ifrs-full:FinancialAssetsAtAmortisedCostCategoryMembermt:FinancialAssets1Member2020-12-310001243429ifrs-full:FinancialAssetsAtFairValueThroughProfitOrLossCategoryMembermt:FinancialAssets1Member2020-12-310001243429ifrs-full:FinancialAssetsAtFairValueThroughOtherComprehensiveIncomeCategoryMembermt:FinancialAssets1Member2020-12-310001243429mt:FinancialAssets1Member2020-12-310001243429mt:DerivativesCategoryMembermt:FinancialAssets1Member2020-12-310001243429mt:NonFinancialLiabilitiesMember2020-12-310001243429ifrs-full:FinancialLiabilitiesAtAmortisedCostCategoryMembermt:FinancialLiabilities1Member2020-12-310001243429ifrs-full:FinancialLiabilitiesAtFairValueThroughProfitOrLossCategoryMembermt:FinancialLiabilities1Member2020-12-310001243429mt:DerivativesCategoryMembermt:FinancialLiabilities1Member2020-12-310001243429mt:NonFinancialAssetsMember2019-12-310001243429ifrs-full:FinancialAssetsAtAmortisedCostCategoryMembermt:FinancialAssets1Member2019-12-310001243429ifrs-full:FinancialAssetsAtFairValueThroughProfitOrLossCategoryMembermt:FinancialAssets1Member2019-12-310001243429ifrs-full:FinancialAssetsAtFairValueThroughOtherComprehensiveIncomeCategoryMembermt:FinancialAssets1Member2019-12-310001243429mt:DerivativesCategoryMembermt:FinancialAssets1Member2019-12-310001243429mt:NonFinancialLiabilitiesMember2019-12-310001243429ifrs-full:FinancialLiabilitiesAtAmortisedCostCategoryMembermt:FinancialLiabilities1Member2019-12-310001243429ifrs-full:FinancialLiabilitiesAtFairValueThroughProfitOrLossCategoryMembermt:FinancialLiabilities1Member2019-12-310001243429mt:DerivativesCategoryMembermt:FinancialLiabilities1Member2019-12-310001243429mt:InvestmentsInEquityInstrumentsDesignatedAtFairValueThroughOtherComprehensiveIncome1Memberifrs-full:RecurringFairValueMeasurementMemberifrs-full:Level1OfFairValueHierarchyMember2020-12-310001243429mt:InvestmentsInEquityInstrumentsDesignatedAtFairValueThroughOtherComprehensiveIncome1Memberifrs-full:Level2OfFairValueHierarchyMemberifrs-full:RecurringFairValueMeasurementMember2020-12-310001243429mt:InvestmentsInEquityInstrumentsDesignatedAtFairValueThroughOtherComprehensiveIncome1Memberifrs-full:RecurringFairValueMeasurementMemberifrs-full:Level3OfFairValueHierarchyMember2020-12-310001243429mt:InvestmentsInEquityInstrumentsDesignatedAtFairValueThroughOtherComprehensiveIncome1Memberifrs-full:RecurringFairValueMeasurementMember2020-12-310001243429ifrs-full:RecurringFairValueMeasurementMemberifrs-full:Level1OfFairValueHierarchyMembermt:TradeAndOtherCurrentReceivablesSubjectToTSRProgramsMember2020-12-310001243429ifrs-full:Level2OfFairValueHierarchyMemberifrs-full:RecurringFairValueMeasurementMembermt:TradeAndOtherCurrentReceivablesSubjectToTSRProgramsMember2020-12-310001243429ifrs-full:RecurringFairValueMeasurementMemberifrs-full:Level3OfFairValueHierarchyMembermt:TradeAndOtherCurrentReceivablesSubjectToTSRProgramsMember2020-12-310001243429ifrs-full:RecurringFairValueMeasurementMembermt:TradeAndOtherCurrentReceivablesSubjectToTSRProgramsMember2020-12-310001243429mt:DerivativeFinancialAssetsCurrentMemberifrs-full:RecurringFairValueMeasurementMemberifrs-full:Level1OfFairValueHierarchyMember2020-12-310001243429mt:DerivativeFinancialAssetsCurrentMemberifrs-full:Level2OfFairValueHierarchyMemberifrs-full:RecurringFairValueMeasurementMember2020-12-310001243429mt:DerivativeFinancialAssetsCurrentMemberifrs-full:RecurringFairValueMeasurementMemberifrs-full:Level3OfFairValueHierarchyMember2020-12-310001243429mt:DerivativeFinancialAssetsCurrentMemberifrs-full:RecurringFairValueMeasurementMember2020-12-310001243429mt:DerivativeFinancialAssetsNoncurrentMemberifrs-full:RecurringFairValueMeasurementMemberifrs-full:Level1OfFairValueHierarchyMember2020-12-310001243429mt:DerivativeFinancialAssetsNoncurrentMemberifrs-full:Level2OfFairValueHierarchyMemberifrs-full:RecurringFairValueMeasurementMember2020-12-310001243429mt:DerivativeFinancialAssetsNoncurrentMemberifrs-full:RecurringFairValueMeasurementMemberifrs-full:Level3OfFairValueHierarchyMember2020-12-310001243429mt:DerivativeFinancialAssetsNoncurrentMemberifrs-full:RecurringFairValueMeasurementMember2020-12-310001243429ifrs-full:Level1OfFairValueHierarchyMemberifrs-full:RecurringFairValueMeasurementMember2020-12-310001243429ifrs-full:Level2OfFairValueHierarchyMemberifrs-full:RecurringFairValueMeasurementMember2020-12-310001243429ifrs-full:RecurringFairValueMeasurementMemberifrs-full:Level3OfFairValueHierarchyMember2020-12-310001243429ifrs-full:RecurringFairValueMeasurementMember2020-12-310001243429mt:DerivativefinancialliabilitiescurrentMemberifrs-full:RecurringFairValueMeasurementMemberifrs-full:Level1OfFairValueHierarchyMember2020-12-310001243429mt:DerivativefinancialliabilitiescurrentMemberifrs-full:Level2OfFairValueHierarchyMemberifrs-full:RecurringFairValueMeasurementMember2020-12-310001243429mt:DerivativefinancialliabilitiescurrentMemberifrs-full:RecurringFairValueMeasurementMemberifrs-full:Level3OfFairValueHierarchyMember2020-12-310001243429mt:DerivativefinancialliabilitiescurrentMemberifrs-full:RecurringFairValueMeasurementMember2020-12-310001243429mt:DerivativefinancialliabilitiesnoncurrentMemberifrs-full:RecurringFairValueMeasurementMemberifrs-full:Level1OfFairValueHierarchyMember2020-12-310001243429mt:DerivativefinancialliabilitiesnoncurrentMemberifrs-full:Level2OfFairValueHierarchyMemberifrs-full:RecurringFairValueMeasurementMember2020-12-310001243429mt:DerivativefinancialliabilitiesnoncurrentMemberifrs-full:RecurringFairValueMeasurementMemberifrs-full:Level3OfFairValueHierarchyMember2020-12-310001243429mt:DerivativefinancialliabilitiesnoncurrentMemberifrs-full:RecurringFairValueMeasurementMember2020-12-310001243429mt:InvestmentsInEquityInstrumentsDesignatedAtFairValueThroughOtherComprehensiveIncome1Memberifrs-full:RecurringFairValueMeasurementMemberifrs-full:Level1OfFairValueHierarchyMember2019-12-310001243429mt:InvestmentsInEquityInstrumentsDesignatedAtFairValueThroughOtherComprehensiveIncome1Memberifrs-full:Level2OfFairValueHierarchyMemberifrs-full:RecurringFairValueMeasurementMember2019-12-310001243429mt:InvestmentsInEquityInstrumentsDesignatedAtFairValueThroughOtherComprehensiveIncome1Memberifrs-full:RecurringFairValueMeasurementMemberifrs-full:Level3OfFairValueHierarchyMember2019-12-310001243429mt:InvestmentsInEquityInstrumentsDesignatedAtFairValueThroughOtherComprehensiveIncome1Memberifrs-full:RecurringFairValueMeasurementMember2019-12-310001243429ifrs-full:RecurringFairValueMeasurementMemberifrs-full:Level1OfFairValueHierarchyMembermt:TradeAndOtherCurrentReceivablesSubjectToTSRProgramsMember2019-12-310001243429ifrs-full:Level2OfFairValueHierarchyMemberifrs-full:RecurringFairValueMeasurementMembermt:TradeAndOtherCurrentReceivablesSubjectToTSRProgramsMember2019-12-310001243429ifrs-full:RecurringFairValueMeasurementMemberifrs-full:Level3OfFairValueHierarchyMembermt:TradeAndOtherCurrentReceivablesSubjectToTSRProgramsMember2019-12-310001243429ifrs-full:RecurringFairValueMeasurementMembermt:TradeAndOtherCurrentReceivablesSubjectToTSRProgramsMember2019-12-310001243429mt:DerivativeFinancialAssetsCurrentMemberifrs-full:RecurringFairValueMeasurementMemberifrs-full:Level1OfFairValueHierarchyMember2019-12-310001243429mt:DerivativeFinancialAssetsCurrentMemberifrs-full:Level2OfFairValueHierarchyMemberifrs-full:RecurringFairValueMeasurementMember2019-12-310001243429mt:DerivativeFinancialAssetsCurrentMemberifrs-full:RecurringFairValueMeasurementMemberifrs-full:Level3OfFairValueHierarchyMember2019-12-310001243429mt:DerivativeFinancialAssetsCurrentMemberifrs-full:RecurringFairValueMeasurementMember2019-12-310001243429mt:DerivativeFinancialAssetsNoncurrentMemberifrs-full:RecurringFairValueMeasurementMemberifrs-full:Level1OfFairValueHierarchyMember2019-12-310001243429mt:DerivativeFinancialAssetsNoncurrentMemberifrs-full:Level2OfFairValueHierarchyMemberifrs-full:RecurringFairValueMeasurementMember2019-12-310001243429mt:DerivativeFinancialAssetsNoncurrentMemberifrs-full:RecurringFairValueMeasurementMemberifrs-full:Level3OfFairValueHierarchyMember2019-12-310001243429mt:DerivativeFinancialAssetsNoncurrentMemberifrs-full:RecurringFairValueMeasurementMember2019-12-310001243429ifrs-full:Level1OfFairValueHierarchyMemberifrs-full:RecurringFairValueMeasurementMember2019-12-310001243429ifrs-full:Level2OfFairValueHierarchyMemberifrs-full:RecurringFairValueMeasurementMember2019-12-310001243429ifrs-full:RecurringFairValueMeasurementMemberifrs-full:Level3OfFairValueHierarchyMember2019-12-310001243429ifrs-full:RecurringFairValueMeasurementMember2019-12-310001243429mt:DerivativefinancialliabilitiescurrentMemberifrs-full:RecurringFairValueMeasurementMemberifrs-full:Level1OfFairValueHierarchyMember2019-12-310001243429mt:DerivativefinancialliabilitiescurrentMemberifrs-full:Level2OfFairValueHierarchyMemberifrs-full:RecurringFairValueMeasurementMember2019-12-310001243429mt:DerivativefinancialliabilitiescurrentMemberifrs-full:RecurringFairValueMeasurementMemberifrs-full:Level3OfFairValueHierarchyMember2019-12-310001243429mt:DerivativefinancialliabilitiescurrentMemberifrs-full:RecurringFairValueMeasurementMember2019-12-310001243429mt:DerivativefinancialliabilitiesnoncurrentMemberifrs-full:RecurringFairValueMeasurementMemberifrs-full:Level1OfFairValueHierarchyMember2019-12-310001243429mt:DerivativefinancialliabilitiesnoncurrentMemberifrs-full:Level2OfFairValueHierarchyMemberifrs-full:RecurringFairValueMeasurementMember2019-12-310001243429mt:DerivativefinancialliabilitiesnoncurrentMemberifrs-full:RecurringFairValueMeasurementMemberifrs-full:Level3OfFairValueHierarchyMember2019-12-310001243429mt:DerivativefinancialliabilitiesnoncurrentMemberifrs-full:RecurringFairValueMeasurementMember2019-12-310001243429ifrs-full:WeightedAverageMember2020-01-012020-12-310001243429ifrs-full:WeightedAverageMember2019-01-012019-12-310001243429mt:ZeroPointSevenBillionUSDShortTermTermFacilityDue2021Member2020-05-050001243429mt:TwoPointOneBillionShortTermTermFacilityDue2021Member2020-05-050001243429mt:TermFacilityMember2020-05-052020-05-0500012434292020-05-202020-05-200001243429mt:MandatorilyConvertibleSubordinatedNotesMember2020-05-050001243429mt:ZeroTwoBillionShortTermTermFacilityDue2021Member2020-05-200001243429mt:ZeroPointSevenBillionEURShortTermTermFacilityDue2021Member2020-05-200001243429mt:ThreeHundredMillionEURTermLoanDue2021Member2020-04-080001243429mt:ShortTermBilateralCreditFacilitiesMember2020-12-310001243429mt:CommercialPaper1Member2020-12-310001243429mt:CommercialPaper1Member2019-12-310001243429mt:FivePointFiveBillionRevolvingCreditFacilityDue20232024Member2020-12-310001243429mt:FivePointFiveBillionRevolvingCreditFacilityDue20232024Member2019-12-31iso4217:CHF0001243429mt:TwoHundredTwentyFiveMillionCHFUnsecuredNotesDue2020Member2019-12-310001243429ifrs-full:FixedInterestRateMembermt:TwoHundredTwentyFiveMillionCHFUnsecuredNotesDue2020Member2019-12-310001243429mt:TwoHundredTwentyFiveMillionCHFUnsecuredNotesDue2020Member2020-12-310001243429mt:SixHundredMillionEURUnsecuredNotesDue2020Member2019-12-310001243429ifrs-full:FixedInterestRateMembermt:SixHundredMillionEURUnsecuredNotesDue2020Member2019-12-310001243429mt:SixHundredMillionEURUnsecuredNotesDue2020Member2020-12-310001243429mt:FiveHundredMillionEURUnsecuredNotesDue2021Member2020-12-310001243429mt:FiveHundredMillionEURUnsecuredNotesDue2021Memberifrs-full:FixedInterestRateMember2020-12-310001243429mt:FiveHundredMillionEURUnsecuredNotesDue2021Member2019-12-310001243429mt:SevenHundredFiftyMillionEURUnsecuredNotesDue2022Member2020-12-310001243429mt:SevenHundredFiftyMillionEURUnsecuredNotesDue2022Memberifrs-full:FixedInterestRateMember2020-12-310001243429mt:SevenHundredFiftyMillionEURUnsecuredNotesDue2022Member2019-12-310001243429mt:OnePointOneBillionUnsecuredNotesDue2022Member2020-12-310001243429mt:OnePointOneBillionUnsecuredNotesDue2022Memberifrs-full:FixedInterestRateMember2020-12-310001243429mt:OnePointOneBillionUnsecuredNotesDue2022Member2019-12-310001243429mt:FiveHundredMillionEURUnsecuredNotesDue2025Member2020-12-310001243429mt:FiveHundredMillionEURUnsecuredNotesDue2025Memberifrs-full:FixedInterestRateMember2020-12-310001243429mt:FiveHundredMillionEURUnsecuredNotesDue2025Member2019-12-310001243429mt:SevenHundredFiftyMillionEURUnsecuredNotesDue2023Member2020-12-310001243429ifrs-full:FixedInterestRateMembermt:SevenHundredFiftyMillionEURUnsecuredNotesDue2023Member2020-12-310001243429mt:SevenHundredFiftyMillionEURUnsecuredNotesDue2023Member2019-12-310001243429mt:OneBillionEURUnsecuredNotesDue2024Member2020-12-310001243429mt:OneBillionEURUnsecuredNotesDue2024Memberifrs-full:FixedInterestRateMember2020-12-310001243429mt:OneBillionEURUnsecuredNotesDue2024Member2019-12-310001243429mt:SevenHundredFiftyMillionUnsecuredNotesDue2024Member2020-12-310001243429ifrs-full:FixedInterestRateMembermt:SevenHundredFiftyMillionUnsecuredNotesDue2024Member2020-12-310001243429mt:SevenHundredFiftyMillionUnsecuredNotesDue2024Member2019-12-310001243429mt:FiveHundredMillionUnsecuredNotesDue2025Member2020-12-310001243429mt:FiveHundredMillionUnsecuredNotesDue2025Memberifrs-full:FixedInterestRateMember2020-12-310001243429mt:FiveHundredMillionUnsecuredNotesDue2025Member2019-12-310001243429mt:SevenHundredFiftyMillionEURUnsecuredNotesDue2025Member2020-12-310001243429mt:SevenHundredFiftyMillionEURUnsecuredNotesDue2025Memberifrs-full:FixedInterestRateMember2020-12-310001243429mt:SevenHundredFiftyMillionEURUnsecuredNotesDue2025Member2019-12-310001243429mt:SevenHundredFiftyMillionUnsecuredNotesDue2026Member2020-12-310001243429ifrs-full:FixedInterestRateMembermt:SevenHundredFiftyMillionUnsecuredNotesDue2026Member2020-12-310001243429mt:SevenHundredFiftyMillionUnsecuredNotesDue2026Member2019-12-310001243429mt:FiveHundredMillionUnsecuredNotesDue2029Member2020-12-310001243429ifrs-full:FixedInterestRateMembermt:FiveHundredMillionUnsecuredNotesDue2029Member2020-12-310001243429mt:FiveHundredMillionUnsecuredNotesDue2029Member2019-12-310001243429mt:OnePointFiveBillionUnsecuredBondsDue2039Member2020-12-310001243429mt:OnePointFiveBillionUnsecuredBondsDue2039Memberifrs-full:FixedInterestRateMember2020-12-310001243429mt:OnePointFiveBillionUnsecuredBondsDue2039Member2019-12-310001243429mt:OneBillionUnsecuredNotesDue2041Member2020-12-310001243429ifrs-full:FixedInterestRateMembermt:OneBillionUnsecuredNotesDue2041Member2020-12-310001243429mt:OneBillionUnsecuredNotesDue2041Member2019-12-310001243429mt:OtherLoansDue2021To2022Memberifrs-full:FixedInterestRateMemberifrs-full:BottomOfRangeMember2020-12-310001243429mt:OtherLoansDue2021To2022Memberifrs-full:FixedInterestRateMemberifrs-full:TopOfRangeMember2020-12-310001243429mt:OtherLoansDue2021To2022Member2020-12-310001243429mt:OtherLoansDue2021To2022Member2019-12-310001243429mt:EIBLoanDue2025Memberifrs-full:FixedInterestRateMember2020-12-310001243429mt:EIBLoanDue2025Member2020-12-310001243429mt:EIBLoanDue2025Member2019-12-310001243429ifrs-full:FloatingInterestRateMembermt:OtherLoansDue20212035Memberifrs-full:BottomOfRangeMember2020-12-310001243429ifrs-full:FloatingInterestRateMembermt:OtherLoansDue20212035Memberifrs-full:TopOfRangeMember2020-12-310001243429mt:OtherLoansDue20212035Member2020-12-310001243429mt:OtherLoansDue20212035Member2019-12-310001243429mt:CorporateBorrowingsMember2020-12-310001243429mt:CorporateBorrowingsMember2019-12-310001243429mt:FixedFloatingInterestRatesMembersrt:AmericasMembermt:OtherLoansFixedFloatingDue20202030Memberifrs-full:BottomOfRangeMember2020-12-310001243429mt:FixedFloatingInterestRatesMembersrt:AmericasMemberifrs-full:TopOfRangeMembermt:OtherLoansFixedFloatingDue20202030Member2020-12-310001243429srt:AmericasMembermt:OtherLoansFixedFloatingDue20202030Member2020-12-310001243429srt:AmericasMembermt:OtherLoansFixedFloatingDue20202030Member2019-12-310001243429ifrs-full:FloatingInterestRateMembermt:EuropeAsiaAndAfricaMembermt:EBRDFacilityFloatingDueIn2024Memberifrs-full:BottomOfRangeMember2020-12-310001243429ifrs-full:FloatingInterestRateMemberifrs-full:TopOfRangeMembermt:EuropeAsiaAndAfricaMembermt:EBRDFacilityFloatingDueIn2024Member2020-12-310001243429mt:EuropeAsiaAndAfricaMembermt:EBRDFacilityFloatingDueIn2024Member2020-12-310001243429mt:EuropeAsiaAndAfricaMembermt:EBRDFacilityFloatingDueIn2024Member2019-12-310001243429mt:OtherLoansFixedFloatingDue20202029Membermt:FixedFloatingInterestRatesMembermt:EuropeAsiaAndAfricaMemberifrs-full:BottomOfRangeMember2020-12-310001243429mt:OtherLoansFixedFloatingDue20202029Membermt:FixedFloatingInterestRatesMemberifrs-full:TopOfRangeMembermt:EuropeAsiaAndAfricaMember2020-12-310001243429mt:OtherLoansFixedFloatingDue20202029Membermt:EuropeAsiaAndAfricaMember2020-12-310001243429mt:OtherLoansFixedFloatingDue20202029Membermt:EuropeAsiaAndAfricaMember2019-12-310001243429mt:EuropeAsiaAndAfricaMember2020-12-310001243429mt:EuropeAsiaAndAfricaMember2019-12-310001243429mt:LongTermBorrowingsIncludingCurrentPortionMember2020-12-310001243429mt:LongTermBorrowingsIncludingCurrentPortionMember2019-12-310001243429mt:LongTermDebtExcludingLeaseObligationMember2020-12-310001243429mt:LongTermDebtExcludingLeaseObligationMember2019-12-310001243429ifrs-full:LeaseLiabilitiesMember2020-12-310001243429ifrs-full:LeaseLiabilitiesMember2019-12-310001243429mt:FivePointFourBillionRevolvingCreditFacilityDue2024Member2020-11-262020-11-260001243429mt:FivePointFiveBillionRevolvingCreditFacilityDue2023Member2019-11-270001243429mt:FivePointFourBillionRevolvingCreditFacilityDue2024Member2019-11-270001243429mt:FivePointFiveBillionRevolvingCreditFacilityDue20232024Member2018-12-31mt:extension_option0001243429mt:FivePointFiveBillionRevolvingCreditFacilityDue20232024Member2018-12-192018-12-190001243429mt:FivePointFourBillionRevolvingCreditFacilityDue2024Member2020-12-310001243429mt:ZeroPointOneBillionRevolvingCreditFacilityDue2023Member2019-12-310001243429mt:TwoThousandAndTenRevolvingMulticurrencyLetterOfCreditFacilityMember2010-09-300001243429mt:TwoThousandAndTenRevolvingMulticurrencyLetterOfCreditFacilityMember2012-10-260001243429mt:TwoThousandAndTenRevolvingMulticurrencyLetterOfCreditFacilityMember2014-09-300001243429mt:RevolvingMulticurrencyLetterOfCreditFacilityDueIn2022Member2019-07-310001243429mt:TwoThousandAndTenRevolvingMulticurrencyLetterOfCreditFacilityMember2020-11-250001243429mt:OnePointOneBillionUnsecuredNotesDue2022Member2020-03-092020-03-090001243429mt:OnePointOneBillionUnsecuredNotesDue2022Member2020-03-090001243429mt:TwoHundredTwentyFiveMillionCHFUnsecuredNotesDue2020Member2020-07-032020-07-030001243429mt:SixHundredMillionEURUnsecuredNotesDue2020Member2020-07-062020-07-060001243429mt:SixHundredMillionEURUnsecuredNotesDue2020Member2020-07-060001243429mt:SevenHundredFiftyMillionEURUnsecuredNotesDue2022Member2020-10-152020-10-150001243429mt:SevenHundredFiftyMillionEURUnsecuredNotesDue2022Member2020-10-150001243429mt:FiveHundredMillionEURUnsecuredNotesDue2025Member2020-10-152020-10-150001243429mt:FiveHundredMillionEURUnsecuredNotesDue2025Member2020-10-150001243429mt:FiveHundredMillionUnsecuredNotesDue2025Member2020-10-152020-10-150001243429mt:FiveHundredMillionUnsecuredNotesDue2025Member2020-10-150001243429mt:FiveHundredMillionUnsecuredNotesDue2025Member2020-10-162020-10-160001243429mt:FiveHundredMillionEURUnsecuredNotesDue2021Member2015-04-090001243429mt:SevenHundredFiftyMillionEURUnsecuredNotesDue2022Member2015-01-140001243429mt:FiveHundredMillionEURUnsecuredNotesDue2023Member2020-12-310001243429mt:FiveHundredMillionEURUnsecuredNotesDue2023Member2017-12-040001243429mt:SevenHundredFiftyMillionEURUnsecuredNotesDue2023Member2019-11-190001243429mt:TwoHundredFiftyMillionEURUnsecuredNotesDue2024Member2020-12-310001243429ifrs-full:FixedInterestRateMembermt:TwoHundredFiftyMillionEURUnsecuredNotesDue2024Member2020-12-310001243429mt:TwoHundredFiftyMillionEURUnsecuredNotesDue2024Member2019-07-040001243429mt:SevenHundredFiftyMillionEURUnsecuredNotesDue2024Member2020-12-310001243429ifrs-full:FixedInterestRateMembermt:SevenHundredFiftyMillionEURUnsecuredNotesDue2024Member2020-12-310001243429mt:SevenHundredFiftyMillionEURUnsecuredNotesDue2024Member2019-01-170001243429mt:SevenHundredFiftyMillionUnsecuredNotesDue2024Member2019-07-160001243429mt:FiveHundredMillionUnsecuredNotesDue2025Member2015-06-010001243429mt:SevenHundredFiftyMillionEURUnsecuredNotesDue2025Member2019-11-190001243429mt:SevenHundredFiftyMillionUnsecuredNotesDue2026Member2019-03-110001243429mt:FiveHundredMillionUnsecuredNotesDue2029Member2019-07-160001243429mt:OneBillionUnsecuredBondsDue2039Member2020-12-310001243429mt:OneBillionUnsecuredBondsDue2039Memberifrs-full:FixedInterestRateMember2020-12-310001243429mt:OneBillionUnsecuredBondsDue2039Member2009-10-080001243429mt:FiveHundredMillionUnsecuredBondsDue2039Member2020-12-310001243429mt:FiveHundredMillionUnsecuredBondsDue2039Memberifrs-full:FixedInterestRateMember2020-12-310001243429mt:FiveHundredMillionUnsecuredBondsDue2039Member2010-08-050001243429mt:OneBillionUnsecuredNotesDue2041Member2011-03-070001243429mt:EIBLoanDue2025Member2016-12-160001243429mt:SevenBillionTermFacilityDue2020Member2018-11-202018-11-200001243429mt:SevenBillionTermFacilityDue2020Member2018-11-292018-11-290001243429mt:SevenBillionTermFacilityDue2020Member2019-03-012019-03-310001243429mt:SevenBillionTermFacilityDue2020Member2019-06-122019-06-120001243429mt:SevenBillionTermFacilityDue2020Member2019-12-092019-12-090001243429mt:SevenBillionTermFacilityDue2020Member2020-02-102020-02-100001243429mt:SevenBillionTermFacilityDue2020Member2020-02-100001243429mt:SevenBillionTermFacilityDue2020Member2020-03-272020-03-270001243429mt:TwoHundredThirtyFiveMillionEURFacilityAgreementMember2018-12-210001243429mt:TwoHundredThirtyFiveMillionEURFacilityAgreementMember2018-12-182018-12-180001243429mt:TwoHundredThirtyFiveMillionEURFacilityAgreementMember2020-12-310001243429mt:OneHundredTwentyFiveMillionEURBilateralTermLoanDue2022Member2020-07-312020-07-310001243429mt:OneHundredTwentyFiveMillionEURBilateralTermLoanDue2022Member2020-12-310001243429mt:OneHundredMillionEURBilateralTermLoanDue2023Member2019-12-200001243429mt:OneHundredMillionEURBilateralTermLoanDue2023Member2019-12-202019-12-20iso4217:CAD0001243429mt:OneHundredSeventyFourMillionCADFinancingAgreementDue20212022Member2020-07-020001243429mt:PJSCArcelorMittalKryvyiRihMembermt:EBRDFacilityFloatingDueIn2024Member2017-12-210001243429mt:PJSCArcelorMittalKryvyiRihMembermt:EBRDFacilityFloatingDueIn2024Member2020-12-31iso4217:ZAR0001243429mt:ArcelorMittalSouthAfricaLtd.Membermt:FourPointFiveBillionSouthAfricaRandRevolvingBorrowingBaseFinanceFacilityDueIn2022Member2017-05-250001243429mt:ArcelorMittalSouthAfricaLtd.Membermt:FourPointFiveBillionSouthAfricaRandRevolvingBorrowingBaseFinanceFacilityDueIn2022Member2020-12-310001243429ifrs-full:HedgesOfNetInvestmentInForeignOperationsMember2020-12-310001243429ifrs-full:HedgesOfNetInvestmentInForeignOperationsMember2020-01-012020-12-310001243429ifrs-full:LaterThanOneYearAndNotLaterThanTwoYearsMember2020-12-310001243429ifrs-full:LaterThanTwoYearsAndNotLaterThanThreeYearsMember2020-12-310001243429ifrs-full:LaterThanThreeYearsAndNotLaterThanFourYearsMember2020-12-310001243429ifrs-full:LaterThanFourYearsAndNotLaterThanFiveYearsMember2020-12-310001243429ifrs-full:LaterThanFiveYearsMember2020-12-310001243429mt:LongTermBorrowingsIncludingCurrentPortionMemberifrs-full:FixedInterestRateMember2020-12-310001243429mt:LongTermBorrowingsIncludingCurrentPortionMemberifrs-full:FixedInterestRateMemberifrs-full:Level1OfFairValueHierarchyMember2020-12-310001243429mt:LongTermBorrowingsIncludingCurrentPortionMemberifrs-full:FixedInterestRateMemberifrs-full:Level2OfFairValueHierarchyMember2020-12-310001243429mt:LongTermBorrowingsIncludingCurrentPortionMemberifrs-full:FixedInterestRateMemberifrs-full:Level3OfFairValueHierarchyMember2020-12-310001243429ifrs-full:FloatingInterestRateMembermt:LongTermBorrowingsIncludingCurrentPortionMember2020-12-310001243429ifrs-full:FloatingInterestRateMembermt:LongTermBorrowingsIncludingCurrentPortionMemberifrs-full:Level1OfFairValueHierarchyMember2020-12-310001243429ifrs-full:FloatingInterestRateMembermt:LongTermBorrowingsIncludingCurrentPortionMemberifrs-full:Level2OfFairValueHierarchyMember2020-12-310001243429ifrs-full:FloatingInterestRateMembermt:LongTermBorrowingsIncludingCurrentPortionMemberifrs-full:Level3OfFairValueHierarchyMember2020-12-310001243429mt:LongTermBorrowingsIncludingCurrentPortionMember2020-12-310001243429mt:LongTermBorrowingsIncludingCurrentPortionMemberifrs-full:Level1OfFairValueHierarchyMember2020-12-310001243429mt:LongTermBorrowingsIncludingCurrentPortionMemberifrs-full:Level2OfFairValueHierarchyMember2020-12-310001243429mt:LongTermBorrowingsIncludingCurrentPortionMemberifrs-full:Level3OfFairValueHierarchyMember2020-12-310001243429mt:CurrentBorrowingsMember2020-12-310001243429mt:CurrentBorrowingsMemberifrs-full:Level1OfFairValueHierarchyMember2020-12-310001243429mt:CurrentBorrowingsMemberifrs-full:Level2OfFairValueHierarchyMember2020-12-310001243429mt:CurrentBorrowingsMemberifrs-full:Level3OfFairValueHierarchyMember2020-12-310001243429mt:LongTermBorrowingsIncludingCurrentPortionMemberifrs-full:FixedInterestRateMember2019-12-310001243429mt:LongTermBorrowingsIncludingCurrentPortionMemberifrs-full:FixedInterestRateMemberifrs-full:Level1OfFairValueHierarchyMember2019-12-310001243429mt:LongTermBorrowingsIncludingCurrentPortionMemberifrs-full:FixedInterestRateMemberifrs-full:Level2OfFairValueHierarchyMember2019-12-310001243429mt:LongTermBorrowingsIncludingCurrentPortionMemberifrs-full:FixedInterestRateMemberifrs-full:Level3OfFairValueHierarchyMember2019-12-310001243429ifrs-full:FloatingInterestRateMembermt:LongTermBorrowingsIncludingCurrentPortionMember2019-12-310001243429ifrs-full:FloatingInterestRateMembermt:LongTermBorrowingsIncludingCurrentPortionMemberifrs-full:Level1OfFairValueHierarchyMember2019-12-310001243429ifrs-full:FloatingInterestRateMembermt:LongTermBorrowingsIncludingCurrentPortionMemberifrs-full:Level2OfFairValueHierarchyMember2019-12-310001243429ifrs-full:FloatingInterestRateMembermt:LongTermBorrowingsIncludingCurrentPortionMemberifrs-full:Level3OfFairValueHierarchyMember2019-12-310001243429mt:LongTermBorrowingsIncludingCurrentPortionMember2019-12-310001243429mt:LongTermBorrowingsIncludingCurrentPortionMemberifrs-full:Level1OfFairValueHierarchyMember2019-12-310001243429mt:LongTermBorrowingsIncludingCurrentPortionMemberifrs-full:Level2OfFairValueHierarchyMember2019-12-310001243429mt:LongTermBorrowingsIncludingCurrentPortionMemberifrs-full:Level3OfFairValueHierarchyMember2019-12-310001243429mt:CurrentBorrowingsMember2019-12-310001243429mt:CurrentBorrowingsMemberifrs-full:Level1OfFairValueHierarchyMember2019-12-310001243429mt:CurrentBorrowingsMemberifrs-full:Level2OfFairValueHierarchyMember2019-12-310001243429mt:CurrentBorrowingsMemberifrs-full:Level3OfFairValueHierarchyMember2019-12-310001243429mt:ArcelorMittalSouthAfricaLtd.Member2020-12-310001243429mt:ArcelorMittalUSALLCMember2020-12-310001243429mt:ArcelorMittalSouthAfricaLtd.Member2019-12-310001243429ifrs-full:LongtermBorrowingsMember2018-12-310001243429ifrs-full:ShorttermBorrowingsMember2018-12-310001243429ifrs-full:LongtermBorrowingsMember2019-01-012019-01-010001243429ifrs-full:ShorttermBorrowingsMember2019-01-012019-01-010001243429ifrs-full:LongtermBorrowingsMember2019-01-010001243429ifrs-full:ShorttermBorrowingsMember2019-01-010001243429ifrs-full:LongtermBorrowingsMember2019-01-012019-12-310001243429ifrs-full:ShorttermBorrowingsMember2019-01-012019-12-310001243429ifrs-full:LongtermBorrowingsMember2019-12-310001243429ifrs-full:ShorttermBorrowingsMember2019-12-310001243429ifrs-full:LongtermBorrowingsMember2020-01-012020-12-310001243429ifrs-full:ShorttermBorrowingsMember2020-01-012020-12-310001243429ifrs-full:LongtermBorrowingsMember2020-12-310001243429ifrs-full:ShorttermBorrowingsMember2020-12-310001243429currency:EUR2020-12-310001243429currency:USD2020-12-310001243429currency:CAD2020-12-310001243429currency:PLN2020-12-310001243429currency:UAH2020-12-310001243429mt:OtherCurrenciesMember2020-12-310001243429currency:EUR2019-12-310001243429currency:USD2019-12-310001243429currency:CHF2019-12-310001243429currency:PLN2019-12-310001243429currency:CAD2019-12-310001243429mt:OtherCurrenciesMember2019-12-310001243429mt:OtherInterestRateInstrumentsMemberifrs-full:Level2OfFairValueHierarchyMember2020-12-310001243429mt:TotalInterestRateInstrumentsMemberifrs-full:Level2OfFairValueHierarchyMember2020-12-310001243429mt:ForwardPurchaseContractMemberifrs-full:Level2OfFairValueHierarchyMember2020-12-310001243429mt:ForwardSalesContractMemberifrs-full:Level2OfFairValueHierarchyMember2020-12-310001243429mt:CurrencySwapSalesMemberifrs-full:Level2OfFairValueHierarchyMember2020-12-310001243429ifrs-full:Level2OfFairValueHierarchyMembermt:ExchangeOptionPurchasesMember2020-12-310001243429mt:ExchangeOptionSalesMemberifrs-full:Level2OfFairValueHierarchyMember2020-12-310001243429ifrs-full:Level2OfFairValueHierarchyMembermt:ForeignExchangeRateInstrumentsMember2020-12-310001243429mt:TermContractsSalesMemberifrs-full:Level2OfFairValueHierarchyMember2020-12-310001243429ifrs-full:Level2OfFairValueHierarchyMembermt:TermContractsPurchasesMember2020-12-310001243429mt:OptionsSalesPurchasesMemberifrs-full:Level2OfFairValueHierarchyMember2020-12-310001243429mt:RawMaterialsFreightEnergyEmissionRightsMemberifrs-full:Level2OfFairValueHierarchyMember2020-12-310001243429ifrs-full:Level2OfFairValueHierarchyMember2020-12-310001243429mt:ForwardPurchaseContractMemberifrs-full:Level2OfFairValueHierarchyMember2019-12-310001243429mt:ForwardSalesContractMemberifrs-full:Level2OfFairValueHierarchyMember2019-12-310001243429mt:CurrencySwapSalesMemberifrs-full:Level2OfFairValueHierarchyMember2019-12-310001243429ifrs-full:Level2OfFairValueHierarchyMembermt:ExchangeOptionPurchasesMember2019-12-310001243429mt:ExchangeOptionSalesMemberifrs-full:Level2OfFairValueHierarchyMember2019-12-310001243429ifrs-full:Level2OfFairValueHierarchyMembermt:ForeignExchangeRateInstrumentsMember2019-12-310001243429mt:TermContractsSalesMemberifrs-full:Level2OfFairValueHierarchyMember2019-12-310001243429ifrs-full:Level2OfFairValueHierarchyMembermt:TermContractsPurchasesMember2019-12-310001243429mt:OptionsSalesPurchasesMemberifrs-full:Level2OfFairValueHierarchyMember2019-12-310001243429mt:RawMaterialsFreightEnergyEmissionRightsMemberifrs-full:Level2OfFairValueHierarchyMember2019-12-310001243429ifrs-full:Level2OfFairValueHierarchyMember2019-12-310001243429mt:MandatorilyConvertibleUnsecuredUnsubordinatedBondsMember2020-12-310001243429mt:CallOption1Memberifrs-full:Level3OfFairValueHierarchyMember2020-01-012020-12-310001243429mt:CallOption1Memberifrs-full:MatrixPricingMemberifrs-full:Level3OfFairValueHierarchyMember2020-12-310001243429mt:IntesaSanPaoloS.p.A.Member2018-11-010001243429ifrs-full:WrittenPutOptionsMemberifrs-full:Level3OfFairValueHierarchyMember2018-12-310001243429mt:CallOption1Memberifrs-full:Level3OfFairValueHierarchyMember2018-12-310001243429ifrs-full:Level3OfFairValueHierarchyMembermt:SpecialPaymentInPelletPurchasesAndSaleAgreementMember2018-12-310001243429ifrs-full:Level3OfFairValueHierarchyMember2018-12-310001243429ifrs-full:WrittenPutOptionsMemberifrs-full:Level3OfFairValueHierarchyMember2019-01-012019-12-310001243429mt:CallOption1Memberifrs-full:Level3OfFairValueHierarchyMember2019-01-012019-12-310001243429ifrs-full:Level3OfFairValueHierarchyMembermt:SpecialPaymentInPelletPurchasesAndSaleAgreementMember2019-01-012019-12-310001243429ifrs-full:Level3OfFairValueHierarchyMember2019-01-012019-12-310001243429ifrs-full:WrittenPutOptionsMemberifrs-full:Level3OfFairValueHierarchyMember2019-12-310001243429mt:CallOption1Memberifrs-full:Level3OfFairValueHierarchyMember2019-12-310001243429ifrs-full:Level3OfFairValueHierarchyMembermt:SpecialPaymentInPelletPurchasesAndSaleAgreementMember2019-12-310001243429ifrs-full:Level3OfFairValueHierarchyMember2019-12-310001243429ifrs-full:WrittenPutOptionsMemberifrs-full:Level3OfFairValueHierarchyMember2020-01-012020-12-310001243429ifrs-full:Level3OfFairValueHierarchyMembermt:SpecialPaymentInPelletPurchasesAndSaleAgreementMember2020-01-012020-12-310001243429ifrs-full:Level3OfFairValueHierarchyMember2020-01-012020-12-310001243429ifrs-full:WrittenPutOptionsMemberifrs-full:Level3OfFairValueHierarchyMember2020-12-090001243429mt:CallOption1Memberifrs-full:Level3OfFairValueHierarchyMember2020-12-090001243429ifrs-full:Level3OfFairValueHierarchyMembermt:SpecialPaymentInPelletPurchasesAndSaleAgreementMember2020-12-090001243429ifrs-full:Level3OfFairValueHierarchyMember2020-12-090001243429ifrs-full:WrittenPutOptionsMemberifrs-full:Level3OfFairValueHierarchyMember2020-12-310001243429mt:CallOption1Memberifrs-full:Level3OfFairValueHierarchyMember2020-12-310001243429ifrs-full:Level3OfFairValueHierarchyMembermt:SpecialPaymentInPelletPurchasesAndSaleAgreementMember2020-12-310001243429ifrs-full:Level3OfFairValueHierarchyMember2020-12-310001243429ifrs-full:FixedInterestRateMemberifrs-full:InterestRateRiskMember2020-12-310001243429ifrs-full:FloatingInterestRateMemberifrs-full:InterestRateRiskMember2020-12-310001243429ifrs-full:TradeReceivablesMembercurrency:USDifrs-full:CurrencyRiskMember2020-12-310001243429currency:USDifrs-full:CurrencyRiskMembermt:TradePayablesMember2020-12-310001243429ifrs-full:TradeReceivablesMemberifrs-full:CurrencyRiskMembercurrency:EUR2020-12-310001243429ifrs-full:CurrencyRiskMembercurrency:EURmt:TradePayablesMember2020-12-310001243429ifrs-full:TradeReceivablesMemberifrs-full:CurrencyRiskMembercurrency:BRL2020-12-310001243429ifrs-full:CurrencyRiskMembercurrency:BRLmt:TradePayablesMember2020-12-310001243429ifrs-full:TradeReceivablesMemberifrs-full:CurrencyRiskMembercurrency:CAD2020-12-310001243429ifrs-full:CurrencyRiskMembercurrency:CADmt:TradePayablesMember2020-12-310001243429ifrs-full:TradeReceivablesMembercurrency:KZTifrs-full:CurrencyRiskMember2020-12-310001243429currency:KZTifrs-full:CurrencyRiskMembermt:TradePayablesMember2020-12-310001243429ifrs-full:TradeReceivablesMemberifrs-full:CurrencyRiskMembercurrency:ZAR2020-12-310001243429ifrs-full:CurrencyRiskMembercurrency:ZARmt:TradePayablesMember2020-12-310001243429currency:MXNifrs-full:TradeReceivablesMemberifrs-full:CurrencyRiskMember2020-12-310001243429currency:MXNifrs-full:CurrencyRiskMembermt:TradePayablesMember2020-12-310001243429ifrs-full:TradeReceivablesMemberifrs-full:CurrencyRiskMembercurrency:UAH2020-12-310001243429ifrs-full:CurrencyRiskMembercurrency:UAHmt:TradePayablesMember2020-12-310001243429ifrs-full:TradeReceivablesMemberifrs-full:CurrencyRiskMembercurrency:PLN2020-12-310001243429ifrs-full:CurrencyRiskMembermt:TradePayablesMembercurrency:PLN2020-12-310001243429ifrs-full:TradeReceivablesMemberifrs-full:CurrencyRiskMembercurrency:ARS2020-12-310001243429ifrs-full:CurrencyRiskMembermt:TradePayablesMembercurrency:ARS2020-12-310001243429ifrs-full:TradeReceivablesMemberifrs-full:CurrencyRiskMembermt:OtherCurrenciesMember2020-12-310001243429ifrs-full:CurrencyRiskMembermt:OtherCurrenciesMembermt:TradePayablesMember2020-12-310001243429ifrs-full:TradeReceivablesMemberifrs-full:CurrencyRiskMember2020-12-310001243429ifrs-full:CurrencyRiskMembermt:TradePayablesMember2020-12-310001243429ifrs-full:CurrencyRiskMembercurrency:EUR2020-12-310001243429ifrs-full:CurrencyRiskMembercurrency:BRL2020-12-310001243429ifrs-full:CurrencyRiskMembercurrency:CAD2020-12-310001243429ifrs-full:CurrencyRiskMembercurrency:KZT2020-12-310001243429ifrs-full:CurrencyRiskMembercurrency:ZAR2020-12-310001243429currency:MXNifrs-full:CurrencyRiskMember2020-12-310001243429ifrs-full:CurrencyRiskMembercurrency:UAH2020-12-310001243429ifrs-full:CurrencyRiskMembercurrency:PLN2020-12-310001243429ifrs-full:CurrencyRiskMembercurrency:ARS2020-12-310001243429ifrs-full:LiquidityRiskMember2020-12-310001243429ifrs-full:NotLaterThanOneYearMemberifrs-full:LiquidityRiskMember2020-12-310001243429ifrs-full:LiquidityRiskMemberifrs-full:LaterThanOneYearAndNotLaterThanTwoYearsMember2020-12-310001243429ifrs-full:LiquidityRiskMemberifrs-full:LaterThanTwoYearsAndNotLaterThanFiveYearsMember2020-12-310001243429ifrs-full:LaterThanFiveYearsMemberifrs-full:LiquidityRiskMember2020-12-310001243429ifrs-full:LiquidityRiskMembermt:ForeignExchangeContract1Member2020-12-310001243429ifrs-full:NotLaterThanOneYearMemberifrs-full:LiquidityRiskMembermt:ForeignExchangeContract1Member2020-12-310001243429ifrs-full:LiquidityRiskMemberifrs-full:LaterThanOneYearAndNotLaterThanTwoYearsMembermt:ForeignExchangeContract1Member2020-12-310001243429ifrs-full:LiquidityRiskMemberifrs-full:LaterThanTwoYearsAndNotLaterThanFiveYearsMembermt:ForeignExchangeContract1Member2020-12-310001243429ifrs-full:LaterThanFiveYearsMemberifrs-full:LiquidityRiskMembermt:ForeignExchangeContract1Member2020-12-310001243429ifrs-full:LiquidityRiskMembermt:CommodityContract1Member2020-12-310001243429ifrs-full:NotLaterThanOneYearMemberifrs-full:LiquidityRiskMembermt:CommodityContract1Member2020-12-310001243429ifrs-full:LiquidityRiskMembermt:CommodityContract1Memberifrs-full:LaterThanOneYearAndNotLaterThanTwoYearsMember2020-12-310001243429ifrs-full:LiquidityRiskMembermt:CommodityContract1Memberifrs-full:LaterThanTwoYearsAndNotLaterThanFiveYearsMember2020-12-310001243429ifrs-full:LaterThanFiveYearsMemberifrs-full:LiquidityRiskMembermt:CommodityContract1Member2020-12-310001243429ifrs-full:LiquidityRiskMember2019-12-310001243429ifrs-full:NotLaterThanOneYearMemberifrs-full:LiquidityRiskMember2019-12-310001243429ifrs-full:LiquidityRiskMemberifrs-full:LaterThanOneYearAndNotLaterThanTwoYearsMember2019-12-310001243429ifrs-full:LiquidityRiskMemberifrs-full:LaterThanTwoYearsAndNotLaterThanFiveYearsMember2019-12-310001243429ifrs-full:LaterThanFiveYearsMemberifrs-full:LiquidityRiskMember2019-12-310001243429ifrs-full:LiquidityRiskMembermt:EquityContract1Member2019-12-310001243429ifrs-full:NotLaterThanOneYearMemberifrs-full:LiquidityRiskMembermt:EquityContract1Member2019-12-310001243429ifrs-full:LiquidityRiskMemberifrs-full:LaterThanOneYearAndNotLaterThanTwoYearsMembermt:EquityContract1Member2019-12-310001243429ifrs-full:LiquidityRiskMemberifrs-full:LaterThanTwoYearsAndNotLaterThanFiveYearsMembermt:EquityContract1Member2019-12-310001243429ifrs-full:LaterThanFiveYearsMemberifrs-full:LiquidityRiskMembermt:EquityContract1Member2019-12-310001243429ifrs-full:LiquidityRiskMembermt:ForeignExchangeContract1Member2019-12-310001243429ifrs-full:NotLaterThanOneYearMemberifrs-full:LiquidityRiskMembermt:ForeignExchangeContract1Member2019-12-310001243429ifrs-full:LiquidityRiskMemberifrs-full:LaterThanOneYearAndNotLaterThanTwoYearsMembermt:ForeignExchangeContract1Member2019-12-310001243429ifrs-full:LiquidityRiskMemberifrs-full:LaterThanTwoYearsAndNotLaterThanFiveYearsMembermt:ForeignExchangeContract1Member2019-12-310001243429ifrs-full:LaterThanFiveYearsMemberifrs-full:LiquidityRiskMembermt:ForeignExchangeContract1Member2019-12-310001243429ifrs-full:LiquidityRiskMembermt:CommodityContract1Member2019-12-310001243429ifrs-full:NotLaterThanOneYearMemberifrs-full:LiquidityRiskMembermt:CommodityContract1Member2019-12-310001243429ifrs-full:LiquidityRiskMembermt:CommodityContract1Memberifrs-full:LaterThanOneYearAndNotLaterThanTwoYearsMember2019-12-310001243429ifrs-full:LiquidityRiskMembermt:CommodityContract1Memberifrs-full:LaterThanTwoYearsAndNotLaterThanFiveYearsMember2019-12-310001243429ifrs-full:LaterThanFiveYearsMemberifrs-full:LiquidityRiskMembermt:CommodityContract1Member2019-12-310001243429ifrs-full:CashFlowHedgesMembermt:ForeignExchangeContract1Member2020-12-310001243429ifrs-full:CashFlowHedgesMembermt:ForeignExchangeContract1Memberifrs-full:NotLaterThanThreeMonthsMember2020-12-310001243429ifrs-full:LaterThanThreeMonthsAndNotLaterThanSixMonthsMemberifrs-full:CashFlowHedgesMembermt:ForeignExchangeContract1Member2020-12-310001243429ifrs-full:LaterThanSixMonthsAndNotLaterThanOneYearMemberifrs-full:CashFlowHedgesMembermt:ForeignExchangeContract1Member2020-12-310001243429ifrs-full:CashFlowHedgesMembermt:ForeignExchangeContract1Memberifrs-full:LaterThanOneYearAndNotLaterThanTwoYearsMember2020-12-310001243429ifrs-full:CashFlowHedgesMembermt:LaterThanTwoYearsMembermt:ForeignExchangeContract1Member2020-12-310001243429mt:CommodityContract1Memberifrs-full:CashFlowHedgesMember2020-12-310001243429mt:CommodityContract1Memberifrs-full:CashFlowHedgesMemberifrs-full:NotLaterThanThreeMonthsMember2020-12-310001243429ifrs-full:LaterThanThreeMonthsAndNotLaterThanSixMonthsMembermt:CommodityContract1Memberifrs-full:CashFlowHedgesMember2020-12-310001243429ifrs-full:LaterThanSixMonthsAndNotLaterThanOneYearMembermt:CommodityContract1Memberifrs-full:CashFlowHedgesMember2020-12-310001243429mt:CommodityContract1Memberifrs-full:CashFlowHedgesMemberifrs-full:LaterThanOneYearAndNotLaterThanTwoYearsMember2020-12-310001243429mt:CommodityContract1Memberifrs-full:CashFlowHedgesMembermt:LaterThanTwoYearsMember2020-12-310001243429mt:EmissionRightsMemberifrs-full:CashFlowHedgesMember2020-12-310001243429mt:EmissionRightsMemberifrs-full:CashFlowHedgesMemberifrs-full:NotLaterThanThreeMonthsMember2020-12-310001243429mt:EmissionRightsMemberifrs-full:LaterThanThreeMonthsAndNotLaterThanSixMonthsMemberifrs-full:CashFlowHedgesMember2020-12-310001243429ifrs-full:LaterThanSixMonthsAndNotLaterThanOneYearMembermt:EmissionRightsMemberifrs-full:CashFlowHedgesMember2020-12-310001243429mt:EmissionRightsMemberifrs-full:CashFlowHedgesMemberifrs-full:LaterThanOneYearAndNotLaterThanTwoYearsMember2020-12-310001243429mt:EmissionRightsMemberifrs-full:CashFlowHedgesMembermt:LaterThanTwoYearsMember2020-12-310001243429ifrs-full:CashFlowHedgesMember2020-12-310001243429ifrs-full:CashFlowHedgesMemberifrs-full:NotLaterThanThreeMonthsMember2020-12-310001243429ifrs-full:LaterThanThreeMonthsAndNotLaterThanSixMonthsMemberifrs-full:CashFlowHedgesMember2020-12-310001243429ifrs-full:LaterThanSixMonthsAndNotLaterThanOneYearMemberifrs-full:CashFlowHedgesMember2020-12-310001243429ifrs-full:CashFlowHedgesMemberifrs-full:LaterThanOneYearAndNotLaterThanTwoYearsMember2020-12-310001243429ifrs-full:CashFlowHedgesMembermt:LaterThanTwoYearsMember2020-12-310001243429ifrs-full:CashFlowHedgesMembermt:ForeignExchangeContract1Member2019-12-310001243429ifrs-full:CashFlowHedgesMembermt:ForeignExchangeContract1Memberifrs-full:NotLaterThanThreeMonthsMember2019-12-310001243429ifrs-full:LaterThanThreeMonthsAndNotLaterThanSixMonthsMemberifrs-full:CashFlowHedgesMembermt:ForeignExchangeContract1Member2019-12-310001243429ifrs-full:LaterThanSixMonthsAndNotLaterThanOneYearMemberifrs-full:CashFlowHedgesMembermt:ForeignExchangeContract1Member2019-12-310001243429ifrs-full:CashFlowHedgesMembermt:ForeignExchangeContract1Memberifrs-full:LaterThanOneYearAndNotLaterThanTwoYearsMember2019-12-310001243429ifrs-full:CashFlowHedgesMembermt:LaterThanTwoYearsMembermt:ForeignExchangeContract1Member2019-12-310001243429mt:CommodityContract1Memberifrs-full:CashFlowHedgesMember2019-12-310001243429mt:CommodityContract1Memberifrs-full:CashFlowHedgesMemberifrs-full:NotLaterThanThreeMonthsMember2019-12-310001243429ifrs-full:LaterThanThreeMonthsAndNotLaterThanSixMonthsMembermt:CommodityContract1Memberifrs-full:CashFlowHedgesMember2019-12-310001243429ifrs-full:LaterThanSixMonthsAndNotLaterThanOneYearMembermt:CommodityContract1Memberifrs-full:CashFlowHedgesMember2019-12-310001243429mt:CommodityContract1Memberifrs-full:CashFlowHedgesMemberifrs-full:LaterThanOneYearAndNotLaterThanTwoYearsMember2019-12-310001243429mt:CommodityContract1Memberifrs-full:CashFlowHedgesMembermt:LaterThanTwoYearsMember2019-12-310001243429mt:EmissionRightsMemberifrs-full:CashFlowHedgesMember2019-12-310001243429mt:EmissionRightsMemberifrs-full:CashFlowHedgesMemberifrs-full:NotLaterThanThreeMonthsMember2019-12-310001243429mt:EmissionRightsMemberifrs-full:LaterThanThreeMonthsAndNotLaterThanSixMonthsMemberifrs-full:CashFlowHedgesMember2019-12-310001243429ifrs-full:LaterThanSixMonthsAndNotLaterThanOneYearMembermt:EmissionRightsMemberifrs-full:CashFlowHedgesMember2019-12-310001243429mt:EmissionRightsMemberifrs-full:CashFlowHedgesMemberifrs-full:LaterThanOneYearAndNotLaterThanTwoYearsMember2019-12-310001243429mt:EmissionRightsMemberifrs-full:CashFlowHedgesMembermt:LaterThanTwoYearsMember2019-12-310001243429ifrs-full:CashFlowHedgesMember2019-12-310001243429ifrs-full:CashFlowHedgesMemberifrs-full:NotLaterThanThreeMonthsMember2019-12-310001243429ifrs-full:LaterThanThreeMonthsAndNotLaterThanSixMonthsMemberifrs-full:CashFlowHedgesMember2019-12-310001243429ifrs-full:LaterThanSixMonthsAndNotLaterThanOneYearMemberifrs-full:CashFlowHedgesMember2019-12-310001243429ifrs-full:CashFlowHedgesMemberifrs-full:LaterThanOneYearAndNotLaterThanTwoYearsMember2019-12-310001243429ifrs-full:CashFlowHedgesMembermt:LaterThanTwoYearsMember2019-12-310001243429mt:CommodityContract1Memberifrs-full:CashFlowHedgesMembermt:PelletPurchaseAgreementMember2019-12-310001243429ifrs-full:CashFlowHedgesMembermt:DerivativeContractEquityMethodInvestmentsMember2020-12-310001243429ifrs-full:CashFlowHedgesMembermt:DerivativeContractEquityMethodInvestmentsMember2019-12-310001243429mt:CurrentPrepaymentsAndOtherCurrentAssetsAndAccruedExpensesAndOtherLiabilitiesMemberifrs-full:CurrencyRiskMemberifrs-full:CashFlowHedgesMembermt:ForeignExchangeContract1Member2020-12-310001243429ifrs-full:CurrencyRiskMemberifrs-full:CashFlowHedgesMembermt:OtherAssetsAndOtherLongTermObligationsMembermt:ForeignExchangeContract1Member2020-12-310001243429mt:CurrentPrepaymentsAndOtherCurrentAssetsAndAccruedExpensesAndOtherLiabilitiesMembermt:CommodityContract1Memberifrs-full:CashFlowHedgesMemberifrs-full:CommodityPriceRiskMember2020-12-310001243429mt:CommodityContract1Memberifrs-full:CashFlowHedgesMembermt:OtherAssetsAndOtherLongTermObligationsMemberifrs-full:CommodityPriceRiskMember2020-12-310001243429mt:CurrentPrepaymentsAndOtherCurrentAssetsAndAccruedExpensesAndOtherLiabilitiesMembermt:EmissionRightsMemberifrs-full:CashFlowHedgesMemberifrs-full:CommodityPriceRiskMember2020-12-310001243429mt:EmissionRightsMemberifrs-full:CashFlowHedgesMembermt:OtherAssetsAndOtherLongTermObligationsMemberifrs-full:CommodityPriceRiskMember2020-12-310001243429ifrs-full:CurrencyRiskMemberifrs-full:CashFlowHedgesMembermt:ForeignExchangeContract1Member2019-12-310001243429ifrs-full:CurrencyRiskMemberifrs-full:CashFlowHedgesMembermt:ForeignExchangeContract1Member2020-01-012020-12-310001243429ifrs-full:CurrencyRiskMemberifrs-full:CashFlowHedgesMembermt:ForeignExchangeContract1Member2020-12-310001243429mt:CommodityContract1Memberifrs-full:CashFlowHedgesMemberifrs-full:CommodityPriceRiskMember2019-12-310001243429mt:CommodityContract1Memberifrs-full:CashFlowHedgesMemberifrs-full:CommodityPriceRiskMember2020-01-012020-12-310001243429mt:CommodityContract1Memberifrs-full:CashFlowHedgesMemberifrs-full:CommodityPriceRiskMember2020-12-310001243429mt:EmissionRightsMemberifrs-full:CashFlowHedgesMemberifrs-full:CommodityPriceRiskMember2019-12-310001243429mt:EmissionRightsMemberifrs-full:CashFlowHedgesMemberifrs-full:CommodityPriceRiskMember2020-01-012020-12-310001243429mt:EmissionRightsMemberifrs-full:CashFlowHedgesMemberifrs-full:CommodityPriceRiskMember2020-12-310001243429ifrs-full:CashFlowHedgesMember2020-01-012020-12-310001243429ifrs-full:CurrencyRiskMembermt:CurrentPrepaymentsAndOtherCurrentAssetsMemberifrs-full:CashFlowHedgesMembermt:ForeignExchangeContract1Member2019-12-310001243429mt:CommodityContract1Memberifrs-full:CashFlowHedgesMemberifrs-full:CommodityPriceRiskMembermt:AccruedExpensesAndOtherLiabilitiesMember2019-12-310001243429mt:CommodityContract1Membermt:OtherLongTermObligationsMemberifrs-full:CashFlowHedgesMemberifrs-full:CommodityPriceRiskMember2019-12-310001243429mt:EmissionRightsMembermt:CurrentPrepaymentsAndOtherCurrentAssetsMemberifrs-full:CashFlowHedgesMemberifrs-full:CommodityPriceRiskMember2019-12-310001243429mt:CommodityContract1Memberifrs-full:CashFlowHedgesMembermt:PelletPurchaseAgreementMemberifrs-full:CommodityPriceRiskMembermt:AccruedExpensesAndOtherLiabilitiesMember2019-12-310001243429mt:CommodityContract1Membermt:OtherLongTermObligationsMemberifrs-full:CashFlowHedgesMembermt:PelletPurchaseAgreementMemberifrs-full:CommodityPriceRiskMember2019-12-310001243429ifrs-full:CurrencyRiskMemberifrs-full:CashFlowHedgesMembermt:ForeignExchangeContract1Member2018-12-310001243429ifrs-full:CurrencyRiskMemberifrs-full:CashFlowHedgesMembermt:ForeignExchangeContract1Member2019-01-012019-12-310001243429mt:CommodityContract1Memberifrs-full:CashFlowHedgesMemberifrs-full:CommodityPriceRiskMember2018-12-310001243429mt:CommodityContract1Memberifrs-full:CashFlowHedgesMemberifrs-full:CommodityPriceRiskMember2019-01-012019-12-310001243429mt:EmissionRightsMemberifrs-full:CashFlowHedgesMemberifrs-full:CommodityPriceRiskMember2018-12-310001243429mt:EmissionRightsMemberifrs-full:CashFlowHedgesMemberifrs-full:CommodityPriceRiskMember2019-01-012019-12-310001243429ifrs-full:CashFlowHedgesMember2018-12-310001243429ifrs-full:CashFlowHedgesMember2019-01-012019-12-310001243429ifrs-full:HedgesOfNetInvestmentInForeignOperationsMembermt:CrossCurrencySwap375NotionalAmountMaturityJanuary2016Member2020-12-310001243429ifrs-full:HedgesOfNetInvestmentInForeignOperationsMembermt:CrossCurrencySwap375NotionalAmountMaturityJanuary2016Member2020-12-312020-12-310001243429mt:CrossCurrencySwap500NotionalAmountMaturityMarch2020Memberifrs-full:HedgesOfNetInvestmentInForeignOperationsMember2020-12-310001243429mt:CrossCurrencySwap500NotionalAmountMaturityMarch2020Memberifrs-full:HedgesOfNetInvestmentInForeignOperationsMember2020-12-312020-12-310001243429ifrs-full:HedgesOfNetInvestmentInForeignOperationsMembermt:CrossCurrencySwap500NotionalAmountMaturityJuly2019Member2020-12-310001243429ifrs-full:HedgesOfNetInvestmentInForeignOperationsMembermt:CrossCurrencySwap500NotionalAmountMaturityJuly2019Member2020-12-312020-12-310001243429ifrs-full:HedgesOfNetInvestmentInForeignOperationsMembermt:CrossCurrencySwap100NotionalAmountMaturityJune2018Member2020-12-310001243429ifrs-full:HedgesOfNetInvestmentInForeignOperationsMembermt:CrossCurrencySwap100NotionalAmountMaturityJune2018Member2020-12-312020-12-310001243429ifrs-full:HedgesOfNetInvestmentInForeignOperationsMembermt:CrossCurrencySwap200NotionalAmountMaturityNovember2019Member2020-12-310001243429ifrs-full:HedgesOfNetInvestmentInForeignOperationsMembermt:CrossCurrencySwap200NotionalAmountMaturityNovember2019Member2020-12-312020-12-310001243429ifrs-full:HedgesOfNetInvestmentInForeignOperationsMember2020-12-312020-12-310001243429ifrs-full:HedgesOfNetInvestmentInForeignOperationsMembermt:CrossCurrencySwap500NotionalAmountMember2020-03-250001243429ifrs-full:HedgesOfNetInvestmentInForeignOperationsMembermt:CrossCurrencySwap500NotionalAmountMember2020-03-260001243429ifrs-full:HedgesOfNetInvestmentInForeignOperationsMembermt:CrossCurrencySwap500NotionalAmountMember2015-05-270001243429ifrs-full:HedgesOfNetInvestmentInForeignOperationsMembermt:CrossCurrencySwap500NotionalAmountMember2020-01-012020-12-310001243429ifrs-full:HedgesOfNetInvestmentInForeignOperationsMembermt:CrossCurrencySwap375NotionalAmountMaturityJanuary2016Member2019-12-310001243429ifrs-full:HedgesOfNetInvestmentInForeignOperationsMembermt:CrossCurrencySwap375NotionalAmountMaturityJanuary2016Member2019-12-312019-12-310001243429mt:CrossCurrencySwap500NotionalAmountMaturityMarch2020Memberifrs-full:HedgesOfNetInvestmentInForeignOperationsMember2019-12-310001243429mt:CrossCurrencySwap500NotionalAmountMaturityMarch2020Memberifrs-full:HedgesOfNetInvestmentInForeignOperationsMember2019-12-312019-12-310001243429ifrs-full:HedgesOfNetInvestmentInForeignOperationsMembermt:CrossCurrencySwap500NotionalAmountMaturityJuly2019Member2019-12-310001243429ifrs-full:HedgesOfNetInvestmentInForeignOperationsMembermt:CrossCurrencySwap500NotionalAmountMaturityJuly2019Member2019-12-312019-12-310001243429ifrs-full:HedgesOfNetInvestmentInForeignOperationsMembermt:CrossCurrencySwap100NotionalAmountMaturityJune2018Member2019-12-310001243429ifrs-full:HedgesOfNetInvestmentInForeignOperationsMembermt:CrossCurrencySwap100NotionalAmountMaturityJune2018Member2019-12-312019-12-310001243429ifrs-full:HedgesOfNetInvestmentInForeignOperationsMembermt:CrossCurrencySwap200NotionalAmountMaturityNovember2019Member2019-12-310001243429ifrs-full:HedgesOfNetInvestmentInForeignOperationsMembermt:CrossCurrencySwap200NotionalAmountMaturityNovember2019Member2019-12-312019-12-310001243429ifrs-full:HedgesOfNetInvestmentInForeignOperationsMember2019-12-312019-12-310001243429ifrs-full:CurrencyRiskMembermt:CrossCurrencySwapMemberifrs-full:HedgesOfNetInvestmentInForeignOperationsMember2020-12-310001243429ifrs-full:CurrencyRiskMembermt:CrossCurrencySwapMemberifrs-full:HedgesOfNetInvestmentInForeignOperationsMember2020-01-012020-12-310001243429ifrs-full:CurrencyRiskMemberifrs-full:HedgesOfNetInvestmentInForeignOperationsMembermt:EURDebtMember2020-12-310001243429ifrs-full:CurrencyRiskMemberifrs-full:HedgesOfNetInvestmentInForeignOperationsMembermt:EURDebtMember2020-01-012020-12-310001243429mt:CrossCurrencySwap300NotionalAmountMemberifrs-full:HedgesOfNetInvestmentInForeignOperationsMember2020-01-012020-12-310001243429mt:CrossCurrencySwap300NotionalAmountMemberifrs-full:HedgesOfNetInvestmentInForeignOperationsMember2019-12-310001243429mt:CrossCurrencySwap300NotionalAmountMemberifrs-full:HedgesOfNetInvestmentInForeignOperationsMember2018-12-310001243429mt:CrossCurrencySwap300NotionalAmountMemberifrs-full:HedgesOfNetInvestmentInForeignOperationsMember2019-01-012019-12-310001243429ifrs-full:HedgesOfNetInvestmentInForeignOperationsMembermt:CrossCurrencySwap160NotionalAmountMember2020-01-012020-12-310001243429ifrs-full:HedgesOfNetInvestmentInForeignOperationsMembermt:CrossCurrencySwap160NotionalAmountMember2019-12-310001243429ifrs-full:HedgesOfNetInvestmentInForeignOperationsMembermt:CrossCurrencySwap160NotionalAmountMember2018-12-310001243429ifrs-full:HedgesOfNetInvestmentInForeignOperationsMembermt:CrossCurrencySwap160NotionalAmountMember2019-01-012019-12-310001243429ifrs-full:HedgesOfNetInvestmentInForeignOperationsMembermt:CrossCurrencySwap40NotionalAmountMember2020-01-012020-12-310001243429ifrs-full:HedgesOfNetInvestmentInForeignOperationsMembermt:CrossCurrencySwap40NotionalAmountMember2019-12-310001243429ifrs-full:HedgesOfNetInvestmentInForeignOperationsMembermt:CrossCurrencySwap40NotionalAmountMember2018-12-310001243429ifrs-full:HedgesOfNetInvestmentInForeignOperationsMembermt:CrossCurrencySwap40NotionalAmountMember2019-01-012019-12-310001243429ifrs-full:HedgesOfNetInvestmentInForeignOperationsMembermt:CrossCurrencySwap2018TotalMember2019-12-310001243429ifrs-full:HedgesOfNetInvestmentInForeignOperationsMembermt:CrossCurrencySwap2018TotalMember2018-12-310001243429ifrs-full:HedgesOfNetInvestmentInForeignOperationsMembermt:CrossCurrencySwap2018TotalMember2019-01-012019-12-310001243429ifrs-full:CurrencyRiskMemberifrs-full:HedgesOfNetInvestmentInForeignOperationsMembermt:CrossCurrencySwap2018TotalMember2019-12-310001243429ifrs-full:CurrencyRiskMemberifrs-full:HedgesOfNetInvestmentInForeignOperationsMembermt:CrossCurrencySwap2018TotalMember2019-01-012019-12-310001243429ifrs-full:CurrencyRiskMemberifrs-full:HedgesOfNetInvestmentInForeignOperationsMembermt:EURDebtMember2019-12-310001243429ifrs-full:CurrencyRiskMemberifrs-full:HedgesOfNetInvestmentInForeignOperationsMembermt:EURDebtMember2019-01-012019-12-310001243429ifrs-full:HedgesOfNetInvestmentInForeignOperationsMember2019-12-310001243429ifrs-full:HedgesOfNetInvestmentInForeignOperationsMember2019-01-012019-12-310001243429mt:BaseMetalsMemberifrs-full:Level2OfFairValueHierarchyMember2020-12-310001243429mt:BaseMetalsMemberifrs-full:Level2OfFairValueHierarchyMember2019-12-310001243429ifrs-full:Level2OfFairValueHierarchyMembermt:FreightMember2020-12-310001243429ifrs-full:Level2OfFairValueHierarchyMembermt:FreightMember2019-12-310001243429ifrs-full:Level2OfFairValueHierarchyMembermt:EnergyOilGasElectricityMember2020-12-310001243429ifrs-full:Level2OfFairValueHierarchyMembermt:EnergyOilGasElectricityMember2019-12-310001243429mt:EmissionRightsMemberifrs-full:Level2OfFairValueHierarchyMember2020-12-310001243429mt:EmissionRightsMemberifrs-full:Level2OfFairValueHierarchyMember2019-12-310001243429mt:EmissionRightsMember2020-12-310001243429mt:EmissionRightsMember2019-12-310001243429ifrs-full:CurrencyRiskMember2020-01-012020-12-310001243429ifrs-full:CurrencyRiskMember2019-01-012019-12-310001243429ifrs-full:FloatingInterestRateMemberifrs-full:InterestRateRiskMember2020-01-012020-12-310001243429ifrs-full:FloatingInterestRateMemberifrs-full:InterestRateRiskMember2019-01-012019-12-310001243429ifrs-full:InterestRateRiskMember2020-01-012020-12-310001243429ifrs-full:CommodityPriceRiskMember2020-01-012020-12-310001243429mt:BaseMetalsMemberifrs-full:CommodityPriceRiskMember2020-01-012020-12-310001243429mt:IronOreMemberifrs-full:CommodityPriceRiskMember2020-01-012020-12-310001243429mt:FreightMemberifrs-full:CommodityPriceRiskMember2020-01-012020-12-310001243429mt:EmissionRightsMemberifrs-full:CommodityPriceRiskMember2020-01-012020-12-310001243429mt:EnergyMemberifrs-full:CommodityPriceRiskMember2020-01-012020-12-310001243429ifrs-full:CommodityPriceRiskMember2019-01-012019-12-310001243429mt:BaseMetalsMemberifrs-full:CommodityPriceRiskMember2019-01-012019-12-310001243429mt:IronOreMemberifrs-full:CommodityPriceRiskMember2019-01-012019-12-310001243429mt:FreightMemberifrs-full:CommodityPriceRiskMember2019-01-012019-12-310001243429mt:EmissionRightsMemberifrs-full:CommodityPriceRiskMember2019-01-012019-12-310001243429mt:EnergyMemberifrs-full:CommodityPriceRiskMember2019-01-012019-12-310001243429mt:IFRS16Member2019-01-012019-01-0100012434292019-01-010001243429mt:IFRS16Memberifrs-full:RetainedEarningsMember2019-01-010001243429ifrs-full:LandAndBuildingsMember2020-12-310001243429ifrs-full:LandAndBuildingsMember2019-12-310001243429mt:MachineryEquipmentAndOtherMember2020-12-310001243429mt:MachineryEquipmentAndOtherMember2019-12-310001243429ifrs-full:LandAndBuildingsMember2020-01-012020-12-310001243429ifrs-full:LandAndBuildingsMember2019-01-012019-12-310001243429mt:MachineryEquipmentAndOtherMember2020-01-012020-12-310001243429mt:MachineryEquipmentAndOtherMember2019-01-012019-12-310001243429mt:ArcelorMittalUSALLCMember2020-01-012020-12-310001243429ifrs-full:LaterThanOneYearAndNotLaterThanThreeYearsMember2020-12-310001243429ifrs-full:LaterThanThreeYearsAndNotLaterThanFiveYearsMember2020-12-310001243429ifrs-full:NotLaterThanOneYearMember2019-12-310001243429ifrs-full:LaterThanOneYearAndNotLaterThanThreeYearsMember2019-12-310001243429ifrs-full:LaterThanThreeYearsAndNotLaterThanFiveYearsMember2019-12-310001243429ifrs-full:LaterThanFiveYearsMember2019-12-310001243429ifrs-full:NotLaterThanOneYearMember2020-01-012020-12-310001243429ifrs-full:LaterThanOneYearAndNotLaterThanThreeYearsMember2020-01-012020-12-310001243429ifrs-full:LaterThanThreeYearsAndNotLaterThanFiveYearsMember2020-01-012020-12-310001243429ifrs-full:LaterThanFiveYearsMember2020-01-012020-12-310001243429ifrs-full:NotLaterThanOneYearMember2019-01-012019-12-310001243429ifrs-full:LaterThanOneYearAndNotLaterThanThreeYearsMember2019-01-012019-12-310001243429ifrs-full:LaterThanThreeYearsAndNotLaterThanFiveYearsMember2019-01-012019-12-310001243429ifrs-full:LaterThanFiveYearsMember2019-01-012019-12-31mt:employee0001243429ifrs-full:PensionDefinedBenefitPlansMember2020-12-310001243429ifrs-full:PensionDefinedBenefitPlansMember2019-12-310001243429mt:OtherPostEmploymentBenefitPlanMember2020-12-310001243429mt:OtherPostEmploymentBenefitPlanMember2019-12-310001243429mt:TerminationBenefitsMember2020-12-310001243429mt:TerminationBenefitsMember2019-12-310001243429mt:PensionPlanOtherPostemploymentAndTerminationBenefitPlansMember2020-12-310001243429mt:PensionPlanOtherPostemploymentAndTerminationBenefitPlansMember2019-12-310001243429mt:SocialPlanProvisionMember2020-12-310001243429mt:SocialPlanProvisionMember2019-12-310001243429mt:ArcelorMittalUSALLCMembermt:OtherPostEmploymentBenefitPlanMember2020-12-092020-12-090001243429mt:CollectiveLaborAgreementMembercountry:CA2014-07-012014-09-300001243429mt:CollectiveLaborAgreementMembercountry:CA2020-07-012020-09-300001243429country:CAmt:FullyFundedPensionPlansMember2020-12-310001243429ifrs-full:PresentValueOfDefinedBenefitObligationMemberifrs-full:PensionDefinedBenefitPlansMembercountry:BR2019-01-012019-12-310001243429ifrs-full:PensionDefinedBenefitPlansMembercountry:BRifrs-full:PlanAssetsMember2019-01-012019-12-310001243429ifrs-full:PensionDefinedBenefitPlansMembercountry:BR2019-01-012019-12-310001243429country:BE2015-12-012015-12-310001243429country:BE2016-01-012020-12-310001243429ifrs-full:PresentValueOfDefinedBenefitObligationMemberifrs-full:PensionDefinedBenefitPlansMember2019-12-310001243429ifrs-full:PresentValueOfDefinedBenefitObligationMemberifrs-full:PensionDefinedBenefitPlansMembercountry:US2019-12-310001243429country:CAifrs-full:PresentValueOfDefinedBenefitObligationMemberifrs-full:PensionDefinedBenefitPlansMember2019-12-310001243429ifrs-full:PresentValueOfDefinedBenefitObligationMemberifrs-full:PensionDefinedBenefitPlansMembercountry:BR2019-12-310001243429ifrs-full:PresentValueOfDefinedBenefitObligationMemberifrs-full:PensionDefinedBenefitPlansMembermt:Europe1Member2019-12-310001243429ifrs-full:PresentValueOfDefinedBenefitObligationMemberifrs-full:PensionDefinedBenefitPlansMembermt:OtherRegionsMember2019-12-310001243429ifrs-full:PresentValueOfDefinedBenefitObligationMemberifrs-full:PensionDefinedBenefitPlansMember2020-01-012020-12-310001243429ifrs-full:PresentValueOfDefinedBenefitObligationMemberifrs-full:PensionDefinedBenefitPlansMembercountry:US2020-01-012020-12-310001243429country:CAifrs-full:PresentValueOfDefinedBenefitObligationMemberifrs-full:PensionDefinedBenefitPlansMember2020-01-012020-12-310001243429ifrs-full:PresentValueOfDefinedBenefitObligationMemberifrs-full:PensionDefinedBenefitPlansMembercountry:BR2020-01-012020-12-310001243429ifrs-full:PresentValueOfDefinedBenefitObligationMemberifrs-full:PensionDefinedBenefitPlansMembermt:Europe1Member2020-01-012020-12-310001243429ifrs-full:PresentValueOfDefinedBenefitObligationMemberifrs-full:PensionDefinedBenefitPlansMembermt:OtherRegionsMember2020-01-012020-12-310001243429ifrs-full:PresentValueOfDefinedBenefitObligationMemberifrs-full:PensionDefinedBenefitPlansMember2020-12-310001243429ifrs-full:PresentValueOfDefinedBenefitObligationMemberifrs-full:PensionDefinedBenefitPlansMembercountry:US2020-12-310001243429country:CAifrs-full:PresentValueOfDefinedBenefitObligationMemberifrs-full:PensionDefinedBenefitPlansMember2020-12-310001243429ifrs-full:PresentValueOfDefinedBenefitObligationMemberifrs-full:PensionDefinedBenefitPlansMembercountry:BR2020-12-310001243429ifrs-full:PresentValueOfDefinedBenefitObligationMemberifrs-full:PensionDefinedBenefitPlansMembermt:Europe1Member2020-12-310001243429ifrs-full:PresentValueOfDefinedBenefitObligationMemberifrs-full:PensionDefinedBenefitPlansMembermt:OtherRegionsMember2020-12-310001243429ifrs-full:PensionDefinedBenefitPlansMemberifrs-full:PlanAssetsMember2019-12-310001243429ifrs-full:PensionDefinedBenefitPlansMembercountry:USifrs-full:PlanAssetsMember2019-12-310001243429country:CAifrs-full:PensionDefinedBenefitPlansMemberifrs-full:PlanAssetsMember2019-12-310001243429ifrs-full:PensionDefinedBenefitPlansMembercountry:BRifrs-full:PlanAssetsMember2019-12-310001243429ifrs-full:PensionDefinedBenefitPlansMembermt:Europe1Memberifrs-full:PlanAssetsMember2019-12-310001243429ifrs-full:PensionDefinedBenefitPlansMembermt:OtherRegionsMemberifrs-full:PlanAssetsMember2019-12-310001243429ifrs-full:PensionDefinedBenefitPlansMemberifrs-full:PlanAssetsMember2020-01-012020-12-310001243429ifrs-full:PensionDefinedBenefitPlansMembercountry:USifrs-full:PlanAssetsMember2020-01-012020-12-310001243429country:CAifrs-full:PensionDefinedBenefitPlansMemberifrs-full:PlanAssetsMember2020-01-012020-12-310001243429ifrs-full:PensionDefinedBenefitPlansMembercountry:BRifrs-full:PlanAssetsMember2020-01-012020-12-310001243429ifrs-full:PensionDefinedBenefitPlansMembermt:Europe1Memberifrs-full:PlanAssetsMember2020-01-012020-12-310001243429ifrs-full:PensionDefinedBenefitPlansMembermt:OtherRegionsMemberifrs-full:PlanAssetsMember2020-01-012020-12-310001243429ifrs-full:PensionDefinedBenefitPlansMemberifrs-full:PlanAssetsMember2020-12-310001243429ifrs-full:PensionDefinedBenefitPlansMembercountry:USifrs-full:PlanAssetsMember2020-12-310001243429country:CAifrs-full:PensionDefinedBenefitPlansMemberifrs-full:PlanAssetsMember2020-12-310001243429ifrs-full:PensionDefinedBenefitPlansMembercountry:BRifrs-full:PlanAssetsMember2020-12-310001243429ifrs-full:PensionDefinedBenefitPlansMembermt:Europe1Memberifrs-full:PlanAssetsMember2020-12-310001243429ifrs-full:PensionDefinedBenefitPlansMembermt:OtherRegionsMemberifrs-full:PlanAssetsMember2020-12-310001243429ifrs-full:PensionDefinedBenefitPlansMembercountry:US2020-12-310001243429country:CAifrs-full:PensionDefinedBenefitPlansMember2020-12-310001243429ifrs-full:PensionDefinedBenefitPlansMembercountry:BR2020-12-310001243429ifrs-full:PensionDefinedBenefitPlansMembermt:Europe1Member2020-12-310001243429ifrs-full:PensionDefinedBenefitPlansMembermt:OtherRegionsMember2020-12-310001243429ifrs-full:PensionDefinedBenefitPlansMembercountry:US2019-12-310001243429country:CAifrs-full:PensionDefinedBenefitPlansMember2019-12-310001243429ifrs-full:PensionDefinedBenefitPlansMembercountry:BR2019-12-310001243429ifrs-full:PensionDefinedBenefitPlansMembermt:Europe1Member2019-12-310001243429ifrs-full:PensionDefinedBenefitPlansMembermt:OtherRegionsMember2019-12-310001243429ifrs-full:PensionDefinedBenefitPlansMember2020-01-012020-12-310001243429ifrs-full:PensionDefinedBenefitPlansMembercountry:US2020-01-012020-12-310001243429country:CAifrs-full:PensionDefinedBenefitPlansMember2020-01-012020-12-310001243429ifrs-full:PensionDefinedBenefitPlansMembercountry:BR2020-01-012020-12-310001243429ifrs-full:PensionDefinedBenefitPlansMembermt:Europe1Member2020-01-012020-12-310001243429ifrs-full:PensionDefinedBenefitPlansMembermt:OtherRegionsMember2020-01-012020-12-310001243429ifrs-full:PresentValueOfDefinedBenefitObligationMemberifrs-full:PensionDefinedBenefitPlansMember2018-12-310001243429ifrs-full:PresentValueOfDefinedBenefitObligationMemberifrs-full:PensionDefinedBenefitPlansMembercountry:US2018-12-310001243429country:CAifrs-full:PresentValueOfDefinedBenefitObligationMemberifrs-full:PensionDefinedBenefitPlansMember2018-12-310001243429ifrs-full:PresentValueOfDefinedBenefitObligationMemberifrs-full:PensionDefinedBenefitPlansMembercountry:BR2018-12-310001243429ifrs-full:PresentValueOfDefinedBenefitObligationMemberifrs-full:PensionDefinedBenefitPlansMembermt:Europe1Member2018-12-310001243429ifrs-full:PresentValueOfDefinedBenefitObligationMemberifrs-full:PensionDefinedBenefitPlansMembermt:OtherRegionsMember2018-12-310001243429ifrs-full:PresentValueOfDefinedBenefitObligationMemberifrs-full:PensionDefinedBenefitPlansMember2019-01-012019-12-310001243429ifrs-full:PresentValueOfDefinedBenefitObligationMemberifrs-full:PensionDefinedBenefitPlansMembercountry:US2019-01-012019-12-310001243429country:CAifrs-full:PresentValueOfDefinedBenefitObligationMemberifrs-full:PensionDefinedBenefitPlansMember2019-01-012019-12-310001243429ifrs-full:PresentValueOfDefinedBenefitObligationMemberifrs-full:PensionDefinedBenefitPlansMembermt:Europe1Member2019-01-012019-12-310001243429ifrs-full:PresentValueOfDefinedBenefitObligationMemberifrs-full:PensionDefinedBenefitPlansMembermt:OtherRegionsMember2019-01-012019-12-310001243429ifrs-full:PensionDefinedBenefitPlansMemberifrs-full:PlanAssetsMember2018-12-310001243429ifrs-full:PensionDefinedBenefitPlansMembercountry:USifrs-full:PlanAssetsMember2018-12-310001243429country:CAifrs-full:PensionDefinedBenefitPlansMemberifrs-full:PlanAssetsMember2018-12-310001243429ifrs-full:PensionDefinedBenefitPlansMembercountry:BRifrs-full:PlanAssetsMember2018-12-310001243429ifrs-full:PensionDefinedBenefitPlansMembermt:Europe1Memberifrs-full:PlanAssetsMember2018-12-310001243429ifrs-full:PensionDefinedBenefitPlansMembermt:OtherRegionsMemberifrs-full:PlanAssetsMember2018-12-310001243429ifrs-full:PensionDefinedBenefitPlansMemberifrs-full:PlanAssetsMember2019-01-012019-12-310001243429ifrs-full:PensionDefinedBenefitPlansMembercountry:USifrs-full:PlanAssetsMember2019-01-012019-12-310001243429country:CAifrs-full:PensionDefinedBenefitPlansMemberifrs-full:PlanAssetsMember2019-01-012019-12-310001243429ifrs-full:PensionDefinedBenefitPlansMembermt:Europe1Memberifrs-full:PlanAssetsMember2019-01-012019-12-310001243429ifrs-full:PensionDefinedBenefitPlansMembermt:OtherRegionsMemberifrs-full:PlanAssetsMember2019-01-012019-12-310001243429ifrs-full:PensionDefinedBenefitPlansMember2018-12-310001243429ifrs-full:PensionDefinedBenefitPlansMembercountry:US2018-12-310001243429country:CAifrs-full:PensionDefinedBenefitPlansMember2018-12-310001243429ifrs-full:PensionDefinedBenefitPlansMembercountry:BR2018-12-310001243429ifrs-full:PensionDefinedBenefitPlansMembermt:Europe1Member2018-12-310001243429ifrs-full:PensionDefinedBenefitPlansMembermt:OtherRegionsMember2018-12-310001243429ifrs-full:PensionDefinedBenefitPlansMember2019-01-012019-12-310001243429ifrs-full:PensionDefinedBenefitPlansMembercountry:US2019-01-012019-12-310001243429country:CAifrs-full:PensionDefinedBenefitPlansMember2019-01-012019-12-310001243429ifrs-full:PensionDefinedBenefitPlansMembermt:Europe1Member2019-01-012019-12-310001243429ifrs-full:PensionDefinedBenefitPlansMembermt:OtherRegionsMember2019-01-012019-12-310001243429ifrs-full:PensionDefinedBenefitPlansMember2018-01-012018-12-310001243429ifrs-full:PensionDefinedBenefitPlansMembercountry:US2018-01-012018-12-310001243429country:CAifrs-full:PensionDefinedBenefitPlansMember2018-01-012018-12-310001243429ifrs-full:PensionDefinedBenefitPlansMembercountry:BR2018-01-012018-12-310001243429ifrs-full:PensionDefinedBenefitPlansMembermt:Europe1Member2018-01-012018-12-310001243429ifrs-full:PensionDefinedBenefitPlansMembermt:OtherRegionsMember2018-01-012018-12-310001243429ifrs-full:PresentValueOfDefinedBenefitObligationMembermt:OtherPostEmploymentBenefitPlanMember2019-12-310001243429ifrs-full:PresentValueOfDefinedBenefitObligationMembercountry:USmt:OtherPostEmploymentBenefitPlanMember2019-12-310001243429country:CAifrs-full:PresentValueOfDefinedBenefitObligationMembermt:OtherPostEmploymentBenefitPlanMember2019-12-310001243429ifrs-full:PresentValueOfDefinedBenefitObligationMembermt:Europe1Membermt:OtherPostEmploymentBenefitPlanMember2019-12-310001243429ifrs-full:PresentValueOfDefinedBenefitObligationMembermt:OtherRegionsMembermt:OtherPostEmploymentBenefitPlanMember2019-12-310001243429ifrs-full:PresentValueOfDefinedBenefitObligationMembermt:OtherPostEmploymentBenefitPlanMember2020-01-012020-12-310001243429ifrs-full:PresentValueOfDefinedBenefitObligationMembercountry:USmt:OtherPostEmploymentBenefitPlanMember2020-01-012020-12-310001243429country:CAifrs-full:PresentValueOfDefinedBenefitObligationMembermt:OtherPostEmploymentBenefitPlanMember2020-01-012020-12-310001243429ifrs-full:PresentValueOfDefinedBenefitObligationMembermt:Europe1Membermt:OtherPostEmploymentBenefitPlanMember2020-01-012020-12-310001243429ifrs-full:PresentValueOfDefinedBenefitObligationMembermt:OtherRegionsMembermt:OtherPostEmploymentBenefitPlanMember2020-01-012020-12-310001243429ifrs-full:PresentValueOfDefinedBenefitObligationMembermt:OtherPostEmploymentBenefitPlanMember2020-12-310001243429ifrs-full:PresentValueOfDefinedBenefitObligationMembercountry:USmt:OtherPostEmploymentBenefitPlanMember2020-12-310001243429country:CAifrs-full:PresentValueOfDefinedBenefitObligationMembermt:OtherPostEmploymentBenefitPlanMember2020-12-310001243429ifrs-full:PresentValueOfDefinedBenefitObligationMembermt:Europe1Membermt:OtherPostEmploymentBenefitPlanMember2020-12-310001243429ifrs-full:PresentValueOfDefinedBenefitObligationMembermt:OtherRegionsMembermt:OtherPostEmploymentBenefitPlanMember2020-12-310001243429mt:OtherPostEmploymentBenefitPlanMemberifrs-full:PlanAssetsMember2019-12-310001243429country:USmt:OtherPostEmploymentBenefitPlanMemberifrs-full:PlanAssetsMember2019-12-310001243429country:CAmt:OtherPostEmploymentBenefitPlanMemberifrs-full:PlanAssetsMember2019-12-310001243429mt:Europe1Membermt:OtherPostEmploymentBenefitPlanMemberifrs-full:PlanAssetsMember2019-12-310001243429mt:OtherRegionsMembermt:OtherPostEmploymentBenefitPlanMemberifrs-full:PlanAssetsMember2019-12-310001243429mt:OtherPostEmploymentBenefitPlanMemberifrs-full:PlanAssetsMember2020-01-012020-12-310001243429country:USmt:OtherPostEmploymentBenefitPlanMemberifrs-full:PlanAssetsMember2020-01-012020-12-310001243429country:CAmt:OtherPostEmploymentBenefitPlanMemberifrs-full:PlanAssetsMember2020-01-012020-12-310001243429mt:Europe1Membermt:OtherPostEmploymentBenefitPlanMemberifrs-full:PlanAssetsMember2020-01-012020-12-310001243429mt:OtherRegionsMembermt:OtherPostEmploymentBenefitPlanMemberifrs-full:PlanAssetsMember2020-01-012020-12-310001243429mt:OtherPostEmploymentBenefitPlanMemberifrs-full:PlanAssetsMember2020-12-310001243429country:USmt:OtherPostEmploymentBenefitPlanMemberifrs-full:PlanAssetsMember2020-12-310001243429country:CAmt:OtherPostEmploymentBenefitPlanMemberifrs-full:PlanAssetsMember2020-12-310001243429mt:Europe1Membermt:OtherPostEmploymentBenefitPlanMemberifrs-full:PlanAssetsMember2020-12-310001243429mt:OtherRegionsMembermt:OtherPostEmploymentBenefitPlanMemberifrs-full:PlanAssetsMember2020-12-310001243429country:USmt:OtherPostEmploymentBenefitPlanMember2020-12-310001243429country:CAmt:OtherPostEmploymentBenefitPlanMember2020-12-310001243429mt:Europe1Membermt:OtherPostEmploymentBenefitPlanMember2020-12-310001243429mt:OtherRegionsMembermt:OtherPostEmploymentBenefitPlanMember2020-12-310001243429ifrs-full:PresentValueOfDefinedBenefitObligationMembermt:OtherPostEmploymentBenefitPlanMember2018-12-310001243429ifrs-full:PresentValueOfDefinedBenefitObligationMembercountry:USmt:OtherPostEmploymentBenefitPlanMember2018-12-310001243429country:CAifrs-full:PresentValueOfDefinedBenefitObligationMembermt:OtherPostEmploymentBenefitPlanMember2018-12-310001243429ifrs-full:PresentValueOfDefinedBenefitObligationMembermt:Europe1Membermt:OtherPostEmploymentBenefitPlanMember2018-12-310001243429ifrs-full:PresentValueOfDefinedBenefitObligationMembermt:OtherRegionsMembermt:OtherPostEmploymentBenefitPlanMember2018-12-310001243429ifrs-full:PresentValueOfDefinedBenefitObligationMembermt:OtherPostEmploymentBenefitPlanMember2019-01-012019-12-310001243429ifrs-full:PresentValueOfDefinedBenefitObligationMembercountry:USmt:OtherPostEmploymentBenefitPlanMember2019-01-012019-12-310001243429country:CAifrs-full:PresentValueOfDefinedBenefitObligationMembermt:OtherPostEmploymentBenefitPlanMember2019-01-012019-12-310001243429ifrs-full:PresentValueOfDefinedBenefitObligationMembermt:Europe1Membermt:OtherPostEmploymentBenefitPlanMember2019-01-012019-12-310001243429ifrs-full:PresentValueOfDefinedBenefitObligationMembermt:OtherRegionsMembermt:OtherPostEmploymentBenefitPlanMember2019-01-012019-12-310001243429mt:OtherPostEmploymentBenefitPlanMemberifrs-full:PlanAssetsMember2018-12-310001243429country:USmt:OtherPostEmploymentBenefitPlanMemberifrs-full:PlanAssetsMember2018-12-310001243429country:CAmt:OtherPostEmploymentBenefitPlanMemberifrs-full:PlanAssetsMember2018-12-310001243429mt:Europe1Membermt:OtherPostEmploymentBenefitPlanMemberifrs-full:PlanAssetsMember2018-12-310001243429mt:OtherRegionsMembermt:OtherPostEmploymentBenefitPlanMemberifrs-full:PlanAssetsMember2018-12-310001243429mt:OtherPostEmploymentBenefitPlanMemberifrs-full:PlanAssetsMember2019-01-012019-12-310001243429country:USmt:OtherPostEmploymentBenefitPlanMemberifrs-full:PlanAssetsMember2019-01-012019-12-310001243429country:CAmt:OtherPostEmploymentBenefitPlanMemberifrs-full:PlanAssetsMember2019-01-012019-12-310001243429mt:Europe1Membermt:OtherPostEmploymentBenefitPlanMemberifrs-full:PlanAssetsMember2019-01-012019-12-310001243429mt:OtherRegionsMembermt:OtherPostEmploymentBenefitPlanMemberifrs-full:PlanAssetsMember2019-01-012019-12-310001243429country:USmt:OtherPostEmploymentBenefitPlanMember2019-12-310001243429country:CAmt:OtherPostEmploymentBenefitPlanMember2019-12-310001243429mt:Europe1Membermt:OtherPostEmploymentBenefitPlanMember2019-12-310001243429mt:OtherRegionsMembermt:OtherPostEmploymentBenefitPlanMember2019-12-310001243429mt:OtherPostEmploymentBenefitPlanMember2020-01-012020-12-310001243429country:USmt:OtherPostEmploymentBenefitPlanMember2020-01-012020-12-310001243429country:CAmt:OtherPostEmploymentBenefitPlanMember2020-01-012020-12-310001243429mt:Europe1Membermt:OtherPostEmploymentBenefitPlanMember2020-01-012020-12-310001243429mt:OtherRegionsMembermt:OtherPostEmploymentBenefitPlanMember2020-01-012020-12-310001243429mt:OtherPostEmploymentBenefitPlanMember2019-01-012019-12-310001243429country:USmt:OtherPostEmploymentBenefitPlanMember2019-01-012019-12-310001243429country:CAmt:OtherPostEmploymentBenefitPlanMember2019-01-012019-12-310001243429mt:Europe1Membermt:OtherPostEmploymentBenefitPlanMember2019-01-012019-12-310001243429mt:OtherRegionsMembermt:OtherPostEmploymentBenefitPlanMember2019-01-012019-12-310001243429mt:OtherPostEmploymentBenefitPlanMember2018-01-012018-12-310001243429country:USmt:OtherPostEmploymentBenefitPlanMember2018-01-012018-12-310001243429country:CAmt:OtherPostEmploymentBenefitPlanMember2018-01-012018-12-310001243429mt:Europe1Membermt:OtherPostEmploymentBenefitPlanMember2018-01-012018-12-310001243429mt:OtherRegionsMembermt:OtherPostEmploymentBenefitPlanMember2018-01-012018-12-310001243429mt:CostofSalesMember2020-01-012020-12-310001243429mt:CostofSalesMember2019-01-012019-12-310001243429mt:CostofSalesMember2018-01-012018-12-310001243429mt:SellingGeneralandAdministrativeExpenseMember2020-01-012020-12-310001243429mt:SellingGeneralandAdministrativeExpenseMember2019-01-012019-12-310001243429mt:SellingGeneralandAdministrativeExpenseMember2018-01-012018-12-310001243429mt:FinancingCostsMember2020-01-012020-12-310001243429mt:FinancingCostsMember2019-01-012019-12-310001243429mt:FinancingCostsMember2018-01-012018-12-310001243429mt:Europe1Member2020-12-310001243429country:CAifrs-full:Level1OfFairValueHierarchyMember2020-12-310001243429ifrs-full:Level1OfFairValueHierarchyMembercountry:BR2020-12-310001243429mt:Europe1Memberifrs-full:Level1OfFairValueHierarchyMember2020-12-310001243429country:CAifrs-full:Level2And3OfFairValueHierarchyMember2020-12-310001243429ifrs-full:Level2And3OfFairValueHierarchyMembercountry:BR2020-12-310001243429mt:Europe1Memberifrs-full:Level2And3OfFairValueHierarchyMember2020-12-310001243429mt:Europe1Member2019-12-310001243429ifrs-full:Level1OfFairValueHierarchyMembercountry:US2019-12-310001243429country:CAifrs-full:Level1OfFairValueHierarchyMember2019-12-310001243429ifrs-full:Level1OfFairValueHierarchyMembercountry:BR2019-12-310001243429mt:Europe1Memberifrs-full:Level1OfFairValueHierarchyMember2019-12-310001243429ifrs-full:Level2And3OfFairValueHierarchyMembercountry:US2019-12-310001243429country:CAifrs-full:Level2And3OfFairValueHierarchyMember2019-12-310001243429ifrs-full:Level2And3OfFairValueHierarchyMembercountry:BR2019-12-310001243429mt:Europe1Memberifrs-full:Level2And3OfFairValueHierarchyMember2019-12-310001243429ifrs-full:PensionDefinedBenefitPlansMemberifrs-full:BottomOfRangeMember2020-12-310001243429ifrs-full:PensionDefinedBenefitPlansMemberifrs-full:TopOfRangeMember2020-12-310001243429ifrs-full:PensionDefinedBenefitPlansMemberifrs-full:BottomOfRangeMember2019-12-310001243429ifrs-full:PensionDefinedBenefitPlansMemberifrs-full:TopOfRangeMember2019-12-310001243429ifrs-full:PensionDefinedBenefitPlansMemberifrs-full:BottomOfRangeMember2018-12-310001243429ifrs-full:PensionDefinedBenefitPlansMemberifrs-full:TopOfRangeMember2018-12-310001243429ifrs-full:BottomOfRangeMembermt:OtherPostEmploymentBenefitPlanMember2020-12-310001243429ifrs-full:TopOfRangeMembermt:OtherPostEmploymentBenefitPlanMember2020-12-310001243429ifrs-full:BottomOfRangeMembermt:OtherPostEmploymentBenefitPlanMember2019-12-310001243429ifrs-full:TopOfRangeMembermt:OtherPostEmploymentBenefitPlanMember2019-12-310001243429ifrs-full:BottomOfRangeMembermt:OtherPostEmploymentBenefitPlanMember2018-12-310001243429ifrs-full:TopOfRangeMembermt:OtherPostEmploymentBenefitPlanMember2018-12-310001243429ifrs-full:PensionDefinedBenefitPlansMemberifrs-full:WeightedAverageMember2020-12-310001243429ifrs-full:PensionDefinedBenefitPlansMemberifrs-full:WeightedAverageMember2019-12-310001243429ifrs-full:PensionDefinedBenefitPlansMemberifrs-full:WeightedAverageMember2018-12-310001243429ifrs-full:WeightedAverageMembermt:OtherPostEmploymentBenefitPlanMember2020-12-310001243429ifrs-full:WeightedAverageMembermt:OtherPostEmploymentBenefitPlanMember2019-12-310001243429ifrs-full:WeightedAverageMembermt:OtherPostEmploymentBenefitPlanMember2018-12-310001243429ifrs-full:PensionDefinedBenefitPlansMemberifrs-full:ActuarialAssumptionOfDiscountRatesMember2020-12-310001243429ifrs-full:PensionDefinedBenefitPlansMemberifrs-full:ActuarialAssumptionOfDiscountRatesMember2020-01-012020-12-310001243429ifrs-full:PensionDefinedBenefitPlansMemberifrs-full:ActuarialAssumptionOfExpectedRatesOfSalaryIncreasesMember2020-12-310001243429ifrs-full:PensionDefinedBenefitPlansMemberifrs-full:ActuarialAssumptionOfExpectedRatesOfSalaryIncreasesMember2020-01-012020-12-310001243429ifrs-full:PensionDefinedBenefitPlansMemberifrs-full:ActuarialAssumptionOfMortalityRatesMember2020-01-012020-12-310001243429ifrs-full:PensionDefinedBenefitPlansMemberifrs-full:ActuarialAssumptionOfMortalityRatesMember2020-12-310001243429ifrs-full:ActuarialAssumptionOfDiscountRatesMembermt:OtherPostEmploymentBenefitPlanMember2020-12-310001243429ifrs-full:ActuarialAssumptionOfDiscountRatesMembermt:OtherPostEmploymentBenefitPlanMember2019-01-012019-12-310001243429ifrs-full:ActuarialAssumptionOfDiscountRatesMembermt:OtherPostEmploymentBenefitPlanMember2019-12-310001243429ifrs-full:ActuarialAssumptionOfMedicalCostTrendRatesMembermt:OtherPostEmploymentBenefitPlanMember2020-12-310001243429ifrs-full:ActuarialAssumptionOfMedicalCostTrendRatesMembermt:OtherPostEmploymentBenefitPlanMember2019-01-012019-12-310001243429ifrs-full:ActuarialAssumptionOfMedicalCostTrendRatesMembermt:OtherPostEmploymentBenefitPlanMember2019-12-310001243429ifrs-full:ActuarialAssumptionOfMortalityRatesMembermt:OtherPostEmploymentBenefitPlanMember2020-01-012020-12-310001243429ifrs-full:ActuarialAssumptionOfMortalityRatesMembermt:OtherPostEmploymentBenefitPlanMember2019-01-012019-12-310001243429ifrs-full:ActuarialAssumptionOfMortalityRatesMembermt:OtherPostEmploymentBenefitPlanMember2019-12-310001243429mt:ArcelorMittalGlobalStockOption20092018Membermt:ProForma1Member2020-12-310001243429mt:ArcelorMittalGlobalStockOption20092018Memberifrs-full:TopOfRangeMembermt:EmployeeStockOption1Member2020-01-012020-12-3100012434292010-08-012010-08-310001243429ifrs-full:BottomOfRangeMember2017-12-310001243429ifrs-full:TopOfRangeMember2017-12-310001243429ifrs-full:BottomOfRangeMember2018-01-012018-12-310001243429ifrs-full:TopOfRangeMember2018-01-012018-12-310001243429ifrs-full:BottomOfRangeMember2018-12-310001243429ifrs-full:TopOfRangeMember2018-12-310001243429ifrs-full:BottomOfRangeMember2019-01-012019-12-310001243429ifrs-full:TopOfRangeMember2019-01-012019-12-310001243429mt:CEOOfficePlanMemberifrs-full:TopOfRangeMembermt:PerformanceShareUnitsPSUMember2018-05-090001243429mt:CEOOfficePlanMemberifrs-full:TopOfRangeMembermt:PerformanceShareUnitsPSUMember2019-05-070001243429mt:RestrictedShareUnitsRSUAndPerformanceShareUnitsPSUMembermt:CEOOfficePlanMemberifrs-full:TopOfRangeMember2020-06-130001243429mt:ArcelorMittalEquityIncentivePlanMembermt:RestrictedShareUnitsRSUMember2020-01-012020-12-310001243429mt:ArcelorMittalEquityIncentivePlanMembermt:SpecialGrantMembermt:RestrictedShareUnitsRSUMember2020-01-012020-12-310001243429mt:ArcelorMittalEquityIncentivePlanMembermt:PerformanceShareUnitsPSUMember2020-01-012020-12-310001243429mt:CEOOfficePlanMembermt:PerformanceShareUnitsPSUMember2020-01-012020-12-310001243429mt:PerformanceShareUnitsPSUMembermt:ExecutiveOfficersPlanMember2020-01-012020-12-310001243429mt:CEOOfficePlanMembermt:ChiefExecutiveOfficer1Membermt:PerformanceShareUnitsPSUMember2020-01-012020-12-310001243429mt:CEOOfficePlanMembermt:ChiefFinancialOfficer1Membermt:PerformanceShareUnitsPSUMember2020-01-012020-12-310001243429mt:CEOOfficePlanMembermt:VestingBasedonEPSComparedToPeerGroupThresholdLevelMembermt:PerformanceShareUnitsPSUMember2020-01-012020-12-310001243429mt:CEOOfficePlanMembermt:PerformanceShareUnitsPSUMembermt:VestingBasedonEPSComparedToPeerGroupTargetLevelMember2020-01-012020-12-310001243429mt:VestingBasedOnPerformanceOfROCEAndGapToCompetitionTargetLevelMembermt:PerformanceShareUnitsPSUMembermt:ExecutiveOfficersPlanMember2020-01-012020-12-310001243429mt:CEOOfficePlanMembermt:VestingBasedonTSRComparedToPerformanceIndexTargetLevelMembermt:PerformanceShareUnitsPSUMember2020-01-012020-12-310001243429mt:VestingBasedonGapToCompetitionTargetLevelMembermt:PerformanceShareUnitsPSUMembermt:ExecutiveOfficersPlanMember2020-01-012020-12-310001243429mt:CEOOfficePlanMembermt:VestingBasedonTSRComparedToPerformanceIndexThresholdLevelMembermt:PerformanceShareUnitsPSUMember2020-01-012020-12-310001243429mt:VestingBasedOnVestingPeriodPeriodOneMembermt:RestrictedShareUnitsRSUMembermt:ExecutiveOfficersPlanMember2020-01-012020-12-310001243429mt:VestingBasedOnVestingPeriodPeriodTwoMembermt:RestrictedShareUnitsRSUMembermt:ExecutiveOfficersPlanMember2020-01-012020-12-310001243429mt:CEOOfficePlanMembermt:PerformanceShareUnitsPSUMember2016-01-012016-12-310001243429mt:CEOOfficePlanMembermt:VestingBasedOnVestingPeriodPeriodOneMember2016-01-012016-12-310001243429mt:CEOOfficePlanMembermt:VestingBasedOnVestingPeriodPeriodOneMembermt:PerformanceShareUnitsPSUMember2016-01-012016-12-310001243429mt:CEOOfficePlanMembermt:VestingBasedOnVestingPeriodPeriodTwoMember2016-01-012016-12-310001243429mt:CEOOfficePlanMembermt:VestingBasedOnVestingPeriodPeriodTwoMembermt:PerformanceShareUnitsPSUMember2016-01-012016-12-310001243429mt:PerformanceShareUnitsPSUMembermt:ExecutiveOfficersPlanMember2016-01-012016-12-310001243429mt:VestingBasedOnVestingPeriodPeriodOneMembermt:ExecutiveOfficersPlanMember2016-01-012016-12-310001243429mt:VestingBasedOnVestingPeriodPeriodOneMembermt:PerformanceShareUnitsPSUMembermt:ExecutiveOfficersPlanMember2016-01-012016-12-310001243429mt:VestingBasedOnVestingPeriodPeriodTwoMembermt:ExecutiveOfficersPlanMember2016-01-012016-12-310001243429mt:VestingBasedOnVestingPeriodPeriodTwoMembermt:PerformanceShareUnitsPSUMembermt:ExecutiveOfficersPlanMember2016-01-012016-12-310001243429mt:PerformanceBasedOnTSRComparedToPeerGroupMembermt:CEOOfficePlanMembermt:PerformanceShareUnitsPSUMember2016-01-012016-12-310001243429mt:CEOOfficePlanMembermt:PerformanceBasedOnESRComparedToPeerGroupMembermt:PerformanceShareUnitsPSUMember2016-01-012016-12-310001243429mt:VestingBasedOnPerformanceOfROCEAndGapToCompetitionThresholdLevelMembermt:PerformanceShareUnitsPSUMembermt:ExecutiveOfficersPlanMember2016-01-012016-12-310001243429mt:CEOOfficePlanMembermt:ChiefExecutiveOfficer1Membermt:PerformanceShareUnitsPSUMember2016-01-012016-12-310001243429mt:VestingBasedOnPerformanceOfROCEAndGapToCompetitionTargetLevelMembermt:PerformanceShareUnitsPSUMembermt:ExecutiveOfficersPlanMember2016-01-012016-12-310001243429mt:CEOOfficePlanMembermt:VestingBasedonEPSComparedToPeerGroupThresholdLevelMembermt:PerformanceShareUnitsPSUMember2016-01-012016-12-310001243429mt:CEOOfficePlanMembermt:PerformanceShareUnitsPSUMembermt:VestingBasedonEPSComparedToPeerGroupTargetLevelMember2016-01-012016-12-310001243429mt:PerformanceShareUnitsPSUMembermt:VestingBasedonEPSComparedToPeerGroupTargetLevelMembermt:ExecutiveOfficersPlanMember2016-01-012016-12-310001243429mt:CEOOfficePlanMembermt:VestingBasedonTSRComparedToPerformanceIndexTargetLevelMembermt:PerformanceShareUnitsPSUMember2017-01-012017-12-310001243429mt:VestingBasedOnPerformanceOfROCEAndGapToCompetitionThresholdLevelMembermt:PerformanceShareUnitsPSUMembermt:ExecutiveOfficersPlanMember2017-01-012017-12-310001243429mt:VestingBasedOnPerformanceOfROCEAndGapToCompetitionTargetLevelMembermt:PerformanceShareUnitsPSUMembermt:ExecutiveOfficersPlanMember2017-01-012017-12-310001243429mt:CEOOfficePlanMembermt:VestingBasedonTSRComparedToPerformanceIndexThresholdLevelMembermt:PerformanceShareUnitsPSUMember2017-01-012017-12-310001243429mt:CEOOfficePlanMembermt:VestingBasedonTSRComparedToPerformanceIndexTargetLevelMembermt:PerformanceShareUnitsPSUMember2016-01-012016-12-310001243429mt:CEOOfficePlanMembermt:PerformanceShareUnitsPSUMember2017-01-012017-12-310001243429mt:PerformanceShareUnitsPSUMembermt:ExecutiveOfficersPlanMember2017-01-012017-12-310001243429mt:PerformanceBasedOnTSRComparedToPeerGroupMembermt:CEOOfficePlanMembermt:PerformanceShareUnitsPSUMember2017-01-012017-12-310001243429mt:CEOOfficePlanMembermt:PerformanceBasedOnESRComparedToPeerGroupMembermt:PerformanceShareUnitsPSUMember2017-01-012017-12-310001243429mt:CEOOfficePlanMembermt:ChiefFinancialOfficer1Membermt:PerformanceShareUnitsPSUMember2017-01-012017-12-310001243429mt:CEOOfficePlanMembermt:ChiefExecutiveOfficer1Membermt:PerformanceShareUnitsPSUMember2017-01-012017-12-310001243429mt:CEOOfficePlanMembermt:VestingBasedonEPSComparedToPeerGroupThresholdLevelMembermt:PerformanceShareUnitsPSUMember2017-01-012017-12-310001243429mt:CEOOfficePlanMembermt:PerformanceShareUnitsPSUMembermt:VestingBasedonEPSComparedToPeerGroupTargetLevelMember2017-01-012017-12-310001243429mt:VestingBasedonTSRComparedToPeerGroupThresholdLevelMembermt:PerformanceShareUnitsPSUMembermt:ExecutiveOfficersPlanMember2017-01-012017-12-310001243429mt:PerformanceShareUnitsPSUMembermt:VestingBasedonTSRComparedToPeerGroupTargetLevelMembermt:ExecutiveOfficersPlanMember2017-01-012017-12-310001243429mt:VestingBasedonGapToCompetitionTargetLevelMembermt:PerformanceShareUnitsPSUMembermt:ExecutiveOfficersPlanMember2017-01-012017-12-310001243429mt:CEOOfficePlanMembermt:PerformanceShareUnitsPSUMember2018-01-012018-12-310001243429mt:PerformanceShareUnitsPSUMembermt:ExecutiveOfficersPlanMember2018-01-012018-12-310001243429mt:CEOOfficePlanMembermt:ChiefFinancialOfficer1Membermt:PerformanceShareUnitsPSUMember2018-01-012018-12-310001243429mt:CEOOfficePlanMembermt:ChiefExecutiveOfficer1Membermt:PerformanceShareUnitsPSUMember2018-01-012018-12-310001243429mt:CEOOfficePlanMembermt:VestingBasedonEPSComparedToPeerGroupThresholdLevelMembermt:PerformanceShareUnitsPSUMember2018-01-012018-12-310001243429mt:CEOOfficePlanMembermt:PerformanceShareUnitsPSUMembermt:VestingBasedonEPSComparedToPeerGroupTargetLevelMember2018-01-012018-12-310001243429mt:VestingBasedOnPerformanceOfROCEAndGapToCompetitionTargetLevelMembermt:PerformanceShareUnitsPSUMembermt:ExecutiveOfficersPlanMember2018-01-012018-12-310001243429mt:CEOOfficePlanMembermt:VestingBasedonTSRComparedToPerformanceIndexTargetLevelMembermt:PerformanceShareUnitsPSUMember2018-01-012018-12-310001243429mt:VestingBasedonGapToCompetitionTargetLevelMembermt:PerformanceShareUnitsPSUMembermt:ExecutiveOfficersPlanMember2018-01-012018-12-310001243429mt:CEOOfficePlanMembermt:VestingBasedonTSRComparedToPerformanceIndexThresholdLevelMembermt:PerformanceShareUnitsPSUMember2018-01-012018-12-310001243429mt:CEOOfficePlanMembermt:PerformanceShareUnitsPSUMember2019-01-012019-12-310001243429mt:PerformanceShareUnitsPSUMembermt:ExecutiveOfficersPlanMember2019-01-012019-12-310001243429mt:CEOOfficePlanMembermt:ChiefFinancialOfficer1Membermt:PerformanceShareUnitsPSUMember2019-01-012019-12-310001243429mt:CEOOfficePlanMembermt:ChiefExecutiveOfficer1Membermt:PerformanceShareUnitsPSUMember2019-01-012019-12-310001243429mt:CEOOfficePlanMembermt:VestingBasedonEPSComparedToPeerGroupThresholdLevelMembermt:PerformanceShareUnitsPSUMember2019-01-012019-12-310001243429mt:CEOOfficePlanMembermt:PerformanceShareUnitsPSUMembermt:VestingBasedonEPSComparedToPeerGroupTargetLevelMember2019-01-012019-12-310001243429mt:VestingBasedOnPerformanceOfROCEAndGapToCompetitionTargetLevelMembermt:PerformanceShareUnitsPSUMembermt:ExecutiveOfficersPlanMember2019-01-012019-12-310001243429mt:CEOOfficePlanMembermt:VestingBasedonTSRComparedToPerformanceIndexTargetLevelMembermt:PerformanceShareUnitsPSUMember2019-01-012019-12-310001243429mt:VestingBasedonGapToCompetitionTargetLevelMembermt:PerformanceShareUnitsPSUMembermt:ExecutiveOfficersPlanMember2019-01-012019-12-310001243429mt:CEOOfficePlanMembermt:VestingBasedonTSRComparedToPerformanceIndexThresholdLevelMembermt:PerformanceShareUnitsPSUMember2019-01-012019-12-310001243429mt:RestrictedShareUnitsRSUMembermt:GrantDateDecember142020MaturityDueDecember2023Member2020-12-142020-12-14mt:beneficiary0001243429mt:RestrictedShareUnitsRSUMembermt:GrantDateDecember142020MaturityDueDecember2023Member2020-12-310001243429mt:RestrictedShareUnitsRSUMembermt:GrantDateDecember142020MaturityDueDecember2023Member2020-12-312020-12-310001243429mt:RestrictedShareUnitsRSUMembermt:GrantDateDecember142020MaturityDueDecember2021Member2020-12-142020-12-140001243429mt:RestrictedShareUnitsRSUMembermt:GrantDateDecember142020MaturityDueDecember2021Member2020-12-310001243429mt:RestrictedShareUnitsRSUMembermt:GrantDateDecember142020MaturityDueDecember2021Member2020-12-312020-12-310001243429mt:GrantDateDecember142020MaturityDueJanuary12024Membermt:PerformanceShareUnitsPSUMember2020-12-142020-12-140001243429mt:GrantDateDecember142020MaturityDueJanuary12024Membermt:PerformanceShareUnitsPSUMember2020-12-310001243429mt:GrantDateDecember142020MaturityDueJanuary12024Membermt:PerformanceShareUnitsPSUMember2020-12-312020-12-310001243429mt:GrantDateDecember142020MaturityDueJanuary12024Membermt:CEOOfficePlanMember2020-12-142020-12-140001243429mt:GrantDateDecember142020MaturityDueJanuary12024Membermt:CEOOfficePlanMember2020-12-310001243429mt:GrantDateDecember142020MaturityDueJanuary12024Membermt:CEOOfficePlanMember2020-12-312020-12-310001243429mt:GrantdateDecember162019MaturitydueJanuary12023Membermt:PerformanceShareUnitsPSUMember2019-12-162019-12-160001243429mt:GrantdateDecember162019MaturitydueJanuary12023Membermt:PerformanceShareUnitsPSUMember2020-12-310001243429mt:GrantdateDecember162019MaturitydueJanuary12023Membermt:PerformanceShareUnitsPSUMember2020-12-312020-12-310001243429mt:GrantdateDecember162019MaturitydueJanuary12023Membermt:CEOOfficePlanMember2019-12-162019-12-160001243429mt:GrantdateDecember162019MaturitydueJanuary12023Membermt:CEOOfficePlanMember2020-12-310001243429mt:GrantdateDecember162019MaturitydueJanuary12023Membermt:CEOOfficePlanMember2020-12-312020-12-310001243429mt:GrantdateDecember202018MaturitydueJanuary12022Membermt:PerformanceShareUnitsPSUMember2018-12-202018-12-200001243429mt:GrantdateDecember202018MaturitydueJanuary12022Membermt:PerformanceShareUnitsPSUMember2020-12-310001243429mt:GrantdateDecember202018MaturitydueJanuary12022Membermt:PerformanceShareUnitsPSUMember2020-12-312020-12-310001243429mt:CEOOfficePlanMembermt:GrantdateDecember202018MaturitydueJanuary12022Member2018-12-202018-12-200001243429mt:CEOOfficePlanMembermt:GrantdateDecember202018MaturitydueJanuary12022Member2020-12-310001243429mt:CEOOfficePlanMembermt:GrantdateDecember202018MaturitydueJanuary12022Member2020-12-312020-12-310001243429mt:GrantdateDecember202017MaturitydueJanuary12021Membermt:PerformanceShareUnitsPSUMember2017-12-202017-12-200001243429mt:GrantdateDecember202017MaturitydueJanuary12021Membermt:PerformanceShareUnitsPSUMember2020-12-310001243429mt:GrantdateDecember202017MaturitydueJanuary12021Membermt:PerformanceShareUnitsPSUMember2020-12-312020-12-310001243429mt:GrantdateDecember202017MaturitydueJanuary12021Membermt:CEOOfficePlanMember2017-12-202017-12-200001243429mt:GrantdateDecember202017MaturitydueJanuary12021Membermt:CEOOfficePlanMember2020-12-310001243429mt:GrantdateDecember202017MaturitydueJanuary12021Membermt:CEOOfficePlanMember2020-12-312020-12-310001243429mt:GrantdateJune302016MaturitydueJanuary12021Membermt:PerformanceShareUnitsPSUMember2016-06-302016-06-300001243429mt:GrantdateJune302016MaturitydueJanuary12021Membermt:PerformanceShareUnitsPSUMember2020-12-310001243429mt:GrantdateJune302016MaturitydueJanuary12021Membermt:PerformanceShareUnitsPSUMember2020-12-312020-12-310001243429mt:GrantdateJune302016MaturitydueJanuary12022Membermt:PerformanceShareUnitsPSUMember2016-06-302016-06-300001243429mt:GrantdateJune302016MaturitydueJanuary12022Membermt:PerformanceShareUnitsPSUMember2020-12-310001243429mt:GrantdateJune302016MaturitydueJanuary12022Membermt:PerformanceShareUnitsPSUMember2020-12-312020-12-3100012434292016-07-012020-12-310001243429ifrs-full:BottomOfRangeMember2016-07-012020-12-310001243429ifrs-full:TopOfRangeMember2016-07-012020-12-3100012434292020-12-312020-12-310001243429mt:PerformanceShareUnitsPSUMember2020-01-012020-12-310001243429mt:PerformanceShareUnitsPSUMember2019-01-012019-12-310001243429mt:PerformanceShareUnitsPSUMember2018-01-012018-12-310001243429mt:RestrictedShareUnitsRSUMember2017-12-310001243429mt:PerformanceShareUnitsPSUMember2017-12-310001243429mt:RestrictedShareUnitsRSUMember2018-01-012018-12-310001243429mt:RestrictedShareUnitsRSUMember2018-12-310001243429mt:PerformanceShareUnitsPSUMember2018-12-310001243429mt:RestrictedShareUnitsRSUMember2019-01-012019-12-310001243429mt:RestrictedShareUnitsRSUMember2019-12-310001243429mt:PerformanceShareUnitsPSUMember2019-12-310001243429mt:RestrictedShareUnitsRSUMember2020-01-012020-12-310001243429mt:RestrictedShareUnitsRSUMember2020-12-310001243429mt:PerformanceShareUnitsPSUMember2020-12-310001243429mt:PerformanceShareUnitsPSUMembermt:GrantDateSeptember172014Member2018-01-012018-12-310001243429mt:GrantDateJune302015Membermt:PerformanceShareUnitsPSUMember2018-01-012018-12-310001243429mt:GrantDateDecember182015Membermt:PerformanceShareUnitsPSUMember2019-01-012019-12-310001243429ifrs-full:OtherEnvironmentRelatedProvisionMember2019-12-310001243429ifrs-full:OtherEnvironmentRelatedProvisionMember2020-01-012020-12-310001243429ifrs-full:OtherEnvironmentRelatedProvisionMember2020-12-310001243429mt:EmissionRightsMember2019-12-310001243429mt:EmissionRightsMember2020-01-012020-12-310001243429mt:EmissionRightsMember2020-12-310001243429mt:AssetRetirementObligationsMember2019-12-310001243429mt:AssetRetirementObligationsMember2020-01-012020-12-310001243429mt:AssetRetirementObligationsMember2020-12-310001243429ifrs-full:ProvisionForDecommissioningRestorationAndRehabilitationCostsMember2019-12-310001243429ifrs-full:ProvisionForDecommissioningRestorationAndRehabilitationCostsMember2020-01-012020-12-310001243429ifrs-full:ProvisionForDecommissioningRestorationAndRehabilitationCostsMember2020-12-310001243429mt:StaffRelatedObligationsMember2019-12-310001243429mt:StaffRelatedObligationsMember2020-01-012020-12-310001243429mt:StaffRelatedObligationsMember2020-12-310001243429mt:VoluntarySeparationPlansMember2019-12-310001243429mt:VoluntarySeparationPlansMember2020-01-012020-12-310001243429mt:VoluntarySeparationPlansMember2020-12-310001243429ifrs-full:LegalProceedingsProvisionMember2019-12-310001243429ifrs-full:LegalProceedingsProvisionMember2020-01-012020-12-310001243429ifrs-full:LegalProceedingsProvisionMember2020-12-310001243429ifrs-full:ProvisionForTaxesOtherThanIncomeTaxMember2019-12-310001243429ifrs-full:ProvisionForTaxesOtherThanIncomeTaxMember2020-01-012020-12-310001243429ifrs-full:ProvisionForTaxesOtherThanIncomeTaxMember2020-12-310001243429mt:OtherLegalClaimsMember2019-12-310001243429mt:OtherLegalClaimsMember2020-01-012020-12-310001243429mt:OtherLegalClaimsMember2020-12-310001243429ifrs-full:OnerousContractsProvisionMember2019-12-310001243429ifrs-full:OnerousContractsProvisionMember2020-01-012020-12-310001243429ifrs-full:OnerousContractsProvisionMember2020-12-310001243429ifrs-full:MiscellaneousOtherProvisionsMember2019-12-310001243429ifrs-full:MiscellaneousOtherProvisionsMember2020-01-012020-12-310001243429ifrs-full:MiscellaneousOtherProvisionsMember2020-12-310001243429ifrs-full:OtherEnvironmentRelatedProvisionMember2018-12-310001243429ifrs-full:OtherEnvironmentRelatedProvisionMember2019-01-012019-12-310001243429mt:EmissionRightsMember2018-12-310001243429mt:EmissionRightsMember2019-01-012019-12-310001243429mt:AssetRetirementObligationsMember2018-12-310001243429mt:AssetRetirementObligationsMember2019-01-012019-12-310001243429ifrs-full:ProvisionForDecommissioningRestorationAndRehabilitationCostsMember2018-12-310001243429ifrs-full:ProvisionForDecommissioningRestorationAndRehabilitationCostsMember2019-01-012019-12-310001243429mt:StaffRelatedObligationsMember2018-12-310001243429mt:StaffRelatedObligationsMember2019-01-012019-12-310001243429mt:VoluntarySeparationPlansMember2018-12-310001243429mt:VoluntarySeparationPlansMember2019-01-012019-12-310001243429ifrs-full:LegalProceedingsProvisionMember2018-12-310001243429ifrs-full:LegalProceedingsProvisionMember2019-01-012019-12-310001243429ifrs-full:ProvisionForTaxesOtherThanIncomeTaxMember2018-12-310001243429ifrs-full:ProvisionForTaxesOtherThanIncomeTaxMember2019-01-012019-12-310001243429mt:OtherLegalClaimsMember2018-12-310001243429mt:OtherLegalClaimsMember2019-01-012019-12-310001243429ifrs-full:OnerousContractsProvisionMember2018-12-310001243429ifrs-full:OnerousContractsProvisionMember2019-01-012019-12-310001243429ifrs-full:MiscellaneousOtherProvisionsMember2018-12-310001243429ifrs-full:MiscellaneousOtherProvisionsMember2019-01-012019-12-310001243429ifrs-full:ProvisionForDecommissioningRestorationAndRehabilitationCostsMembercountry:FR2018-01-012018-12-310001243429ifrs-full:ProvisionForDecommissioningRestorationAndRehabilitationCostsMembercountry:FR2020-12-310001243429ifrs-full:ProvisionForDecommissioningRestorationAndRehabilitationCostsMembercountry:FR2019-12-310001243429ifrs-full:ProvisionForDecommissioningRestorationAndRehabilitationCostsMembercountry:PL2020-12-310001243429ifrs-full:ProvisionForDecommissioningRestorationAndRehabilitationCostsMembermt:FlorangeMember2020-12-310001243429mt:GlobalCharteringLimitedMemberifrs-full:MiscellaneousOtherProvisionsMember2020-01-012020-12-310001243429mt:SpecialPaymentInPelletPurchasesAndSaleAgreementMember2019-12-310001243429mt:ArcelorMittalItaliaS.p.AMember2019-12-310001243429mt:ArcelorMittalSulFluminenseMember2020-12-310001243429mt:ArcelorMittalSulFluminenseMember2019-12-310001243429mt:Europe1Memberifrs-full:OtherEnvironmentRelatedProvisionMember2020-12-310001243429ifrs-full:OtherEnvironmentRelatedProvisionMembercountry:ZA2020-12-310001243429country:CAifrs-full:OtherEnvironmentRelatedProvisionMember2020-12-310001243429country:BEifrs-full:OtherEnvironmentRelatedProvisionMember2020-12-310001243429ifrs-full:OtherEnvironmentRelatedProvisionMembercountry:FR2020-12-310001243429country:PLifrs-full:OtherEnvironmentRelatedProvisionMember2020-12-310001243429country:LUifrs-full:OtherEnvironmentRelatedProvisionMember2020-12-310001243429country:DEifrs-full:OtherEnvironmentRelatedProvisionMember2020-12-310001243429ifrs-full:OtherEnvironmentRelatedProvisionMembercountry:ES2020-12-310001243429country:PLifrs-full:OtherEnvironmentRelatedProvisionMember2020-01-012020-12-310001243429country:PLmt:ReclaimOfLandfillAndDisposalOfResiduesMember2020-01-012020-12-31utr:ha0001243429country:LUifrs-full:OtherEnvironmentRelatedProvisionMember2007-01-012007-12-31utr:m30001243429mt:EhlerangeSiteMembercountry:LUifrs-full:OtherEnvironmentRelatedProvisionMember2020-12-310001243429mt:DifferdangeSiteMembercountry:LUifrs-full:OtherEnvironmentRelatedProvisionMember2020-12-310001243429country:LUmt:WaterPondAndProductionSiteCleanUpMember2020-12-310001243429country:LUmt:HistoricalLandfillCleanupMember2020-12-310001243429ifrs-full:OtherEnvironmentRelatedProvisionMembercountry:ES2020-01-012020-12-310001243429ifrs-full:OtherEnvironmentRelatedProvisionMembercountry:IT2020-12-310001243429ifrs-full:OtherEnvironmentRelatedProvisionMembermt:TarantoSiteMember2020-12-310001243429mt:ImplementationOfPreventativeSafetyAndCleanUpMeasuresMembercountry:IT2020-12-310001243429ifrs-full:OtherEnvironmentRelatedProvisionMembercountry:ZA2020-01-012020-12-310001243429mt:PretoriaWorksSiteMemberifrs-full:ProvisionForDecommissioningRestorationAndRehabilitationCostsMembercountry:ZA2020-12-310001243429ifrs-full:ProvisionForDecommissioningRestorationAndRehabilitationCostsMembermt:VanderbijlparkWorksSiteMembercountry:ZA2020-12-310001243429ifrs-full:ProvisionForDecommissioningRestorationAndRehabilitationCostsMembercountry:ZAmt:NewcastleWorksSiteMember2020-12-310001243429ifrs-full:ProvisionForDecommissioningRestorationAndRehabilitationCostsMembermt:ThabazimbiMineMembercountry:ZA2020-12-310001243429ifrs-full:ProvisionForDecommissioningRestorationAndRehabilitationCostsMembermt:ThabazimbiMineMembercountry:ZA2018-11-010001243429ifrs-full:ProvisionForDecommissioningRestorationAndRehabilitationCostsMembermt:VereenigingSiteMembercountry:ZA2020-12-310001243429country:CAmt:RemediatingToxicSedimentMember2020-12-310001243429country:CAmt:AssetRetirementObligationsMember2020-12-310001243429mt:AssetRetirementObligationsMembercountry:MX2020-12-310001243429mt:AssetRetirementObligationsMembercountry:UA2020-12-310001243429mt:AssetRetirementObligationsMembercountry:DE2020-12-310001243429mt:AssetRetirementObligationsMembercountry:LR2020-12-310001243429mt:AssetRetirementObligationsMembercountry:ZA2020-12-310001243429country:BEmt:AssetRetirementObligationsMember2020-12-310001243429country:KZmt:AssetRetirementObligationsMember2020-12-310001243429mt:AssetRetirementObligationsMembercountry:BR2020-12-310001243429mt:AssetRetirementObligationsMembermt:BosniaAndHerzegivinaMember2020-12-310001243429mt:ArcelorMittalBrasilS.A.Membermt:DeductionsforSUDENECertificatesMember2007-12-012007-12-310001243429mt:ArcelorMittalBrasilS.A.Membermt:DeductionsforSUDENECertificatesMember2012-08-082012-08-080001243429mt:ArcelorMittalBrasilS.A.Membermt:DeductionsforSUDENECertificatesMember2018-12-312018-12-310001243429mt:ArcelorMittalBrasilS.A.Membermt:DeductionsforSUDENECertificatesMember2011-10-31mt:claim0001243429mt:SOLCoqueriaTubaroS.A.Membermt:ValueAddedTaxMember2011-01-012011-12-310001243429mt:SOLCoqueriaTubaroS.A.Membermt:ValueAddedTaxMember2018-01-012018-12-310001243429mt:SOLCoqueriaTubaroS.A.Membermt:ValueAddedTaxMember2018-03-012018-03-310001243429mt:SOLCoqueriaTubaroS.A.Membermt:ValueAddedTaxMember2019-12-012019-12-310001243429mt:ArcelorMittalBrasilS.A.Membermt:CorporateIncomeTaxandIncorrectDeductionsofInterestandCertainPaymentsMember2011-01-012011-12-310001243429mt:ArcelorMittalBrasilS.A.Membermt:CorporateIncomeTaxandIncorrectDeductionsofInterestandCertainPaymentsMember2014-01-012014-01-310001243429mt:ArcelorMittalBrasilS.A.Membermt:CorporateIncomeTaxandIncorrectDeductionsofInterestandCertainPaymentsMember2013-01-012013-12-310001243429mt:TaxAssessmentsRelatedToAmortizationOfGoodwillMembermt:ArcelorMittalBrasilS.A.Member2016-04-012016-04-300001243429mt:TaxAssessmentsRelatedToAmortizationOfGoodwillMembermt:ArcelorMittalBrasilS.A.Member2018-12-012018-12-310001243429mt:TaxAssessmentsRelatedToAmortizationOfGoodwillMembermt:ArcelorMittalBrasilS.A.Member2020-12-012020-12-310001243429mt:LawsuitAgainstFederalRevenueRelatedToTaxForAdditionalFreightForRenewalOfBrazilianMerchantNavyMembermt:ArcelorMittalBrasilS.A.Member2013-01-012013-12-310001243429mt:TaxAssessmentsRelatedToAmortizationOfGoodwillMembermt:ArcelorMittalBrasilS.A.Member2018-11-012018-11-300001243429mt:LawsuitAgainstFederalRevenueRelatedToTaxForAdditionalFreightForRenewalOfBrazilianMerchantNavyMembermt:ArcelorMittalBrasilS.A.Member2018-09-012018-09-300001243429mt:ArcelorMittalBrasilS.A.Membermt:ValueAddedTaxMember2020-01-012020-12-310001243429mt:ArcelorMittalBrasilS.A.Membermt:ValueAddedTaxMember2014-01-012018-12-310001243429mt:CreditsforSocialSecurityTaxesMembermt:ArcelorMittalBrasilS.A.Member2014-01-012018-12-310001243429mt:ArcelorMittalBrasilS.A.Membermt:ValueAddedTaxMember2020-08-012020-08-310001243429mt:CreditsforSocialSecurityTaxesMembermt:ArcelorMittalBrasilS.A.Member2020-08-012020-08-310001243429mt:ArcelorMittalComercializadoradeEnergiaMembermt:TaxCreditsonInterstateSalesofElectricityMember2015-05-012015-07-310001243429mt:ArcelorMittalComercializadoradeEnergiaMembermt:TaxCreditsonInterstateSalesofElectricityMember2016-04-012016-04-300001243429mt:RetroactiveApplicationofNewLawMembermt:ArcelorMittalComercializadoradeEnergiaMember2017-11-012017-11-300001243429mt:RetroactiveApplicationofNewLawMembermt:ArcelorMittalComercializadoradeEnergiaMember2019-02-012019-02-280001243429mt:ArcelorMittalBrasilS.A.Membermt:ValueAddedTaxMember2015-05-012015-07-310001243429mt:ArcelorMittalBrasilS.A.Membermt:ValueAddedTaxMember2016-05-172016-05-170001243429mt:TaxYear2008Membermt:CorporateIncomeTaxandIncorrectDeductionsofInterestandCertainPaymentsMembermt:ArcelorMittalMexicoS.A.deC.V.Member2015-01-012015-12-310001243429mt:TaxYear2007Membermt:CorporateIncomeTaxandIncorrectDeductionsofInterestandCertainPaymentsMembermt:ArcelorMittalMexicoS.A.deC.V.Member2016-01-012016-12-310001243429mt:CorporateIncomeTaxandIncorrectDeductionsofInterestandCertainPaymentsMembermt:TaxYear2009Membermt:ArcelorMittalMexicoS.A.deC.V.Member2016-01-012016-12-310001243429mt:ArcelorMittalLasTruchasMemberifrs-full:ProvisionForTaxesOtherThanIncomeTaxMember2013-01-012013-12-310001243429mt:ArcelorMittalLasTruchasMemberifrs-full:ProvisionForTaxesOtherThanIncomeTaxMember2018-10-012018-10-310001243429mt:ArcelorMittalKryvyiRihMembermt:UkrainianTaxAuditMember2019-10-012019-10-310001243429mt:ArcelorMittalKryvyiRihMembermt:UkrainianTaxAuditMember2020-01-012020-01-310001243429mt:ArcelorMittalKryvyiRihMembermt:UkrainianTaxAuditMember2020-10-012020-10-31mt:organization0001243429mt:CompetitionandAntitrustClaimsMember2000-09-012000-09-30mt:steel_producer0001243429mt:CaseFiledByTradeOrganizationsMembermt:CompetitionandAntitrustClaimsMembermt:ArcelorMittalBrasilS.A.Member2005-09-012005-09-300001243429mt:CompetitionandAntitrustClaimsMembermt:ArcelorMittalBrasilS.A.Membermt:CaseFiledByFederalPublicProsecutorOfTheStateOfMinasGeraisMember2020-01-012020-12-31mt:plaintiff0001243429mt:CompetitionandAntitrustClaimsMembermt:ArcelorMittalBrasilS.A.Member2011-02-012011-02-280001243429mt:ArcelorMittalSpainHoldingAndItsSubsidiariesMembermt:CompetitionandAntitrustClaimsMembermt:CaseBySpanishCompetitionAuthorityComisionNacionalDeLosMercadosYLaCompetenciaMember2020-01-012020-12-310001243429mt:VariousOtherLegalClaimsMember2020-12-310001243429mt:AcindarIndustriaArgentinadeAcerosS.A.Membermt:OtherLegalClaimsMember2002-01-012014-12-310001243429mt:AcindarIndustriaArgentinadeAcerosS.A.Membermt:OtherLegalClaimsMember2021-01-012021-01-310001243429mt:ArcelorMittalBrasilS.A.Membermt:OtherLegalClaimsMembermt:SINDIMETALCaseMember2020-01-012020-12-310001243429mt:ShareholderOfSiderurgicaTresLagoasMembermt:OtherLegalClaimsMember2017-04-012017-04-300001243429country:CAmt:OtherLegalClaimsMember2012-01-012012-12-310001243429country:CAmt:OtherLegalClaimsMember2019-06-012019-06-300001243429country:ITmt:OtherLegalClaimsMembermt:MemorandumOfAgreementMember2010-01-310001243429country:ITmt:OtherLegalClaimsMemberifrs-full:BottomOfRangeMembermt:MemorandumOfAgreementMember2009-01-012009-12-310001243429ifrs-full:TopOfRangeMembercountry:ITmt:OtherLegalClaimsMembermt:MemorandumOfAgreementMember2009-01-012009-12-310001243429country:ITmt:OtherLegalClaimsMemberifrs-full:BottomOfRangeMembermt:MemorandumOfAgreementMember2013-05-012013-05-310001243429ifrs-full:TopOfRangeMembercountry:ITmt:OtherLegalClaimsMembermt:MemorandumOfAgreementMember2013-05-012013-05-310001243429country:ITmt:OtherLegalClaimsMembermt:MemorandumOfAgreementMember2014-12-180001243429country:LUmt:OtherLegalClaimsMember2012-06-012012-06-300001243429country:LUmt:OtherLegalClaimsMember2013-04-012013-04-300001243429country:LUmt:OtherLegalClaimsMember2013-11-012013-11-300001243429country:FRmt:OtherLegalClaimsMembermt:WrongfulTerminationofContractMember2010-01-012010-12-310001243429country:FRmt:WrongfulTerminationofContractMember2006-01-012006-12-310001243429country:FRmt:OtherLegalClaimsMembermt:WrongfulTerminationofContractMember2019-11-012019-11-300001243429country:FRmt:OtherLegalClaimsMember2020-01-012020-12-310001243429country:FRmt:OtherLegalClaimsMember2019-01-012019-12-310001243429country:FRmt:OtherLegalClaimsMemberifrs-full:BottomOfRangeMember2020-01-012020-12-310001243429ifrs-full:TopOfRangeMembercountry:FRmt:OtherLegalClaimsMember2020-01-012020-12-310001243429country:LUmt:SignificantShareholderMember2008-01-082008-01-080001243429country:LUmt:SignificantShareholderMember2017-02-152017-02-150001243429mt:AssociationActionnairesdArcelorMembercountry:FR2012-05-152012-05-15mt:plaintiffs0001243429mt:AssociationActionnairesdArcelorMembercountry:FR2020-03-062020-03-0600012434292006-06-012006-06-300001243429mt:ArcelorMittalUSALLCMember2019-12-310001243429mt:KryvyiRihIndustrialGasMember2020-12-220001243429mt:EnerfosMember2020-12-310001243429mt:EnerfosMember2019-12-310001243429ifrs-full:JointVenturesMember2020-01-012020-12-310001243429ifrs-full:JointVenturesMember2019-01-012019-12-310001243429ifrs-full:JointVenturesMembermt:CalvertMember2020-01-012020-12-310001243429ifrs-full:JointVenturesMembermt:CalvertMember2019-01-012019-12-310001243429ifrs-full:JointVenturesMembermt:ArcelorMittalTubularProductsAlJubailMember2020-01-012020-12-310001243429ifrs-full:JointVenturesMembermt:ArcelorMittalTubularProductsAlJubailMember2019-01-012019-12-310001243429mt:GlobalCharteringLimitedMember2020-12-310001243429mt:GlobalCharteringLimitedMember2019-12-310001243429mt:PrimeShippingInvestmentsLimitedMembermt:GlobalCharteringLimitedMember2020-01-012020-12-310001243429ifrs-full:JointVenturesMembermt:ArcelorMittalNipponSteelIndiaLimitedMember2020-01-012020-12-310001243429mt:FivePointOneFourSixBillionTermLoanDue2030Member2020-01-012020-12-310001243429mt:FivePointOneFourSixBillionTermLoanDue2030Member2020-03-170001243429mt:FivePointOneFourSixBillionTermLoanDue2030Member2020-03-172020-03-170001243429ifrs-full:JointVenturesMembermt:ArcelorMittalNipponSteelIndiaLimitedMember2019-01-012019-12-310001243429mt:SevenBillionBridgeTermFacilitiesMember2019-12-310001243429mt:AssetBasedRevolvingCreditFacilityMembercountry:ZAmt:OperatingSubsidiariesMember2020-12-310001243429ifrs-full:AssociatesMember2020-12-310001243429ifrs-full:AssociatesMember2019-12-310001243429ifrs-full:JointVenturesMember2020-12-310001243429ifrs-full:JointVenturesMember2019-12-310001243429mt:CACIBMember2020-12-310001243429mt:ArcelorMittalMexicoS.A.deC.V.Member2020-12-310001243429mt:ArcelorMittalMexicoS.A.deC.V.Member2019-12-310001243429mt:ArcelorMittalBrasilS.A.Member2020-12-310001243429mt:ArcelorMittalBrasilS.A.Member2020-01-012020-12-310001243429mt:ArcelorMittalBrasilS.A.Member2019-01-012019-12-310001243429mt:ArcelorMittalItaliaS.p.AMember2020-12-310001243429mt:ArcelorMittalItaliaS.p.AMember2020-01-012020-12-310001243429mt:ArcelorMittalUSALLCMember2020-01-012020-12-310001243429ifrs-full:FinancialAssetsAvailableforsaleCategoryMember2020-01-012020-12-310001243429ifrs-full:FinancialAssetsAvailableforsaleCategoryMember2019-01-012019-12-310001243429ifrs-full:FinancialAssetsAvailableforsaleCategoryMember2018-01-012018-12-310001243429ifrs-full:ReserveOfGainsAndLossesOnHedgingInstrumentsThatHedgeInvestmentsInEquityInstrumentsMember2020-01-012020-12-310001243429ifrs-full:ReserveOfGainsAndLossesOnHedgingInstrumentsThatHedgeInvestmentsInEquityInstrumentsMember2019-01-012019-12-310001243429ifrs-full:ReserveOfGainsAndLossesOnHedgingInstrumentsThatHedgeInvestmentsInEquityInstrumentsMember2018-01-012018-12-310001243429mt:IntangibleAssetsRelatedTemporaryDifferencesMembermt:BeforeOffsetAmountMember2020-12-310001243429mt:IntangibleAssetsRelatedTemporaryDifferencesMembermt:BeforeOffsetAmountMember2019-12-310001243429mt:IntangibleAssetsRelatedTemporaryDifferencesMember2020-12-310001243429mt:IntangibleAssetsRelatedTemporaryDifferencesMember2019-12-310001243429mt:PropertyPlantandEquipmentRelatedTemporaryDifferencesMembermt:BeforeOffsetAmountMember2020-12-310001243429mt:PropertyPlantandEquipmentRelatedTemporaryDifferencesMembermt:BeforeOffsetAmountMember2019-12-310001243429mt:PropertyPlantandEquipmentRelatedTemporaryDifferencesMember2020-12-310001243429mt:PropertyPlantandEquipmentRelatedTemporaryDifferencesMember2019-12-310001243429mt:InventoriesRelatedTemporaryDifferencesMembermt:BeforeOffsetAmountMember2020-12-310001243429mt:InventoriesRelatedTemporaryDifferencesMembermt:BeforeOffsetAmountMember2019-12-310001243429mt:InventoriesRelatedTemporaryDifferencesMember2020-12-310001243429mt:InventoriesRelatedTemporaryDifferencesMember2019-12-310001243429mt:FinancialInstrumentsRelatedTemporaryDifferencesMembermt:BeforeOffsetAmountMember2020-12-310001243429mt:FinancialInstrumentsRelatedTemporaryDifferencesMembermt:BeforeOffsetAmountMember2019-12-310001243429mt:FinancialInstrumentsRelatedTemporaryDifferencesMember2020-12-310001243429mt:FinancialInstrumentsRelatedTemporaryDifferencesMember2019-12-310001243429mt:OtherAssetsRelatedTemporaryDifferencesMembermt:BeforeOffsetAmountMember2020-12-310001243429mt:OtherAssetsRelatedTemporaryDifferencesMembermt:BeforeOffsetAmountMember2019-12-310001243429mt:OtherAssetsRelatedTemporaryDifferencesMember2020-12-310001243429mt:OtherAssetsRelatedTemporaryDifferencesMember2019-12-310001243429mt:ProvisionsRelatedTemporaryDifferencesMembermt:BeforeOffsetAmountMember2020-12-310001243429mt:ProvisionsRelatedTemporaryDifferencesMembermt:BeforeOffsetAmountMember2019-12-310001243429mt:ProvisionsRelatedTemporaryDifferencesMember2020-12-310001243429mt:ProvisionsRelatedTemporaryDifferencesMember2019-12-310001243429mt:OtherLiabilityRelatedTemporaryDifferencesMembermt:BeforeOffsetAmountMember2020-12-310001243429mt:OtherLiabilityRelatedTemporaryDifferencesMembermt:BeforeOffsetAmountMember2019-12-310001243429mt:OtherLiabilityRelatedTemporaryDifferencesMember2020-12-310001243429mt:OtherLiabilityRelatedTemporaryDifferencesMember2019-12-310001243429ifrs-full:UnusedTaxLossesMembermt:BeforeOffsetAmountMember2020-12-310001243429ifrs-full:UnusedTaxLossesMembermt:BeforeOffsetAmountMember2019-12-310001243429ifrs-full:UnusedTaxLossesMember2020-12-310001243429ifrs-full:UnusedTaxLossesMember2019-12-310001243429ifrs-full:UnusedTaxCreditsMembermt:BeforeOffsetAmountMember2020-12-310001243429ifrs-full:UnusedTaxCreditsMembermt:BeforeOffsetAmountMember2019-12-310001243429ifrs-full:UnusedTaxCreditsMember2020-12-310001243429ifrs-full:UnusedTaxCreditsMember2019-12-310001243429mt:UntaxedReservesRelatedTemporaryDifferencesMembermt:BeforeOffsetAmountMember2020-12-310001243429mt:UntaxedReservesRelatedTemporaryDifferencesMembermt:BeforeOffsetAmountMember2019-12-310001243429mt:UntaxedReservesRelatedTemporaryDifferencesMember2020-12-310001243429mt:UntaxedReservesRelatedTemporaryDifferencesMember2019-12-310001243429mt:BeforeOffsetAmountMember2020-12-310001243429mt:BeforeOffsetAmountMember2019-12-310001243429ifrs-full:OtherTemporaryDifferencesMember2020-12-310001243429ifrs-full:OtherTemporaryDifferencesMembermt:BeforeOffsetAmountMember2020-12-310001243429ifrs-full:OtherTemporaryDifferencesMember2019-12-310001243429ifrs-full:OtherTemporaryDifferencesMembermt:BeforeOffsetAmountMember2019-12-310001243429country:LU2017-12-310001243429mt:TemporaryDifferencesRelatedToInvestmentsInSubsidiariesAssociatesAndJointVenturesMember2020-12-310001243429mt:TemporaryDifferencesRelatedToInvestmentsInSubsidiariesAssociatesAndJointVenturesMember2019-12-310001243429mt:BasqueCountryinSpainLiberiaLuxembourgSwitzerlandandtheUnitedStatesMember2020-12-310001243429mt:TaxYear2021Membermt:BasqueCountryinSpainLiberiaLuxembourgSwitzerlandandtheUnitedStatesMember2020-12-310001243429mt:BasqueCountryinSpainLiberiaLuxembourgSwitzerlandandtheUnitedStatesMembermt:TaxYear2022Member2020-12-310001243429mt:TaxYear2023Membermt:BasqueCountryinSpainLiberiaLuxembourgSwitzerlandandtheUnitedStatesMember2020-12-310001243429mt:BasqueCountryinSpainLiberiaLuxembourgSwitzerlandandtheUnitedStatesMembermt:TaxYear2024Member2020-12-310001243429mt:BasqueCountryinSpainLiberiaLuxembourgSwitzerlandandtheUnitedStatesMembermt:TaxYear2025Member2020-12-310001243429mt:BasqueCountryinSpainLiberiaLuxembourgSwitzerlandandtheUnitedStatesMembermt:TaxYear2026Through2039Member2020-12-310001243429mt:UnlimitedTaxPeriodMembermt:BrazilFranceGermanyLuxembourgandSpainMember2020-12-310001243429mt:BasqueCountryInSpainMember2020-12-310001243429mt:TaxYear2021Membermt:BasqueCountryInSpainMember2020-12-310001243429mt:BasqueCountryInSpainMembermt:TaxYear2022Member2020-12-310001243429mt:TaxYear2023Membermt:BasqueCountryInSpainMember2020-12-310001243429mt:BasqueCountryInSpainMembermt:TaxYear2024Member2020-12-310001243429mt:BasqueCountryInSpainMembermt:TaxYear2025Member2020-12-310001243429mt:BasqueCountryInSpainMembermt:TaxYear2026Through2039Member2020-12-310001243429mt:UnlimitedTaxPeriodMembermt:BrazilSpainAndTheUnitedStatesMember2020-12-3100012434292020-05-142020-05-1400012434292020-05-140001243429mt:MittalFamilyTrustMembermt:MandatorilyConvertibleUnsecuredUnsubordinatedBondsMember2020-05-182020-05-1800012434292018-05-1600012434292020-06-1300012434292018-03-262018-03-26iso4217:EURxbrli:shares00012434292019-02-152019-02-1500012434292020-09-282020-10-300001243429mt:MandatorilyConvertibleUnsecuredUnsubordinatedBondsMember2020-12-152020-12-150001243429mt:MandatorilyConvertibleUnsecuredUnsubordinatedBondsMember2009-12-28mt:business_day0001243429mt:MandatorilyConvertibleUnsecuredUnsubordinatedBondsMember2020-12-220001243429mt:MandatorilyConvertibleUnsecuredUnsubordinatedBondsMember2020-12-222020-12-220001243429ifrs-full:NoncontrollingInterestsMembermt:MandatorilyConvertibleUnsecuredUnsubordinatedBondsMember2020-12-222020-12-220001243429mt:MandatorilyConvertibleUnsecuredUnsubordinatedBondsMember2020-05-180001243429mt:MandatorilyConvertibleUnsecuredUnsubordinatedBondsMember2020-05-182020-05-180001243429mt:MandatorilyConvertibleUnsecuredUnsubordinatedBondsMember2020-12-150001243429mt:ShareUnitAwardsMember2020-01-012020-12-310001243429mt:ShareUnitAwardsMember2019-01-012019-12-310001243429mt:EmployeeStockOption1Member2019-01-012019-12-310001243429mt:EmployeeStockOption1Member2018-01-012018-12-3100012434292018-05-092018-05-0900012434292018-05-0900012434292019-05-072019-05-0700012434292019-05-0700012434292020-06-132020-06-1300012434292021-02-112021-02-1100012434292021-02-1100012434292021-02-1500012434292021-02-152021-03-030001243429mt:SignificantShareholderMember2021-02-152021-03-0300012434292021-03-042021-03-040001243429mt:ArcelorMittalSouthAfricaLtd.Member2020-01-012020-12-310001243429mt:ArcelorMittalSouthAfricaLtd.Member2019-01-012019-12-310001243429mt:ArcelorMittalSouthAfricaLtd.Member2020-12-310001243429mt:ArcelorMittalSouthAfricaLtd.Member2019-12-310001243429mt:ArcelorMittalSouthAfricaLtd.Member2018-01-012018-12-310001243429mt:SonasidMember2020-01-012020-12-310001243429mt:SonasidMember2019-01-012019-12-310001243429mt:SonasidMember2020-12-310001243429mt:SonasidMember2019-12-310001243429mt:SonasidMember2018-01-012018-12-310001243429mt:PJSCArcelorMittalKryvyiRihMember2020-01-012020-12-310001243429mt:PJSCArcelorMittalKryvyiRihMember2019-01-012019-12-310001243429mt:PJSCArcelorMittalKryvyiRihMember2020-12-310001243429mt:PJSCArcelorMittalKryvyiRihMember2019-12-310001243429mt:PJSCArcelorMittalKryvyiRihMember2018-01-012018-12-310001243429mt:BelgoBekaertAramesBBAMember2020-01-012020-12-310001243429mt:BelgoBekaertAramesBBAMember2019-01-012019-12-310001243429mt:BelgoBekaertAramesBBAMember2020-12-310001243429mt:BelgoBekaertAramesBBAMember2019-12-310001243429mt:BelgoBekaertAramesBBAMember2018-01-012018-12-310001243429mt:HeraErmacMember2020-01-012020-12-310001243429mt:HeraErmacMember2019-01-012019-12-310001243429mt:HeraErmacMember2020-12-310001243429mt:HeraErmacMember2019-12-310001243429mt:HeraErmacMember2018-01-012018-12-310001243429mt:ArcelorMittalMiningCanadaG.P.andArcelorMittalInfrastructureG.P.Member2020-01-012020-12-310001243429mt:ArcelorMittalMiningCanadaG.P.andArcelorMittalInfrastructureG.P.Member2019-01-012019-12-310001243429mt:ArcelorMittalMiningCanadaG.P.andArcelorMittalInfrastructureG.P.Member2020-12-310001243429mt:ArcelorMittalMiningCanadaG.P.andArcelorMittalInfrastructureG.P.Member2019-12-310001243429mt:ArcelorMittalMiningCanadaG.P.andArcelorMittalInfrastructureG.P.Member2018-01-012018-12-310001243429mt:ArceoMember2020-01-012020-12-310001243429mt:ArceoMember2019-01-012019-12-310001243429mt:ArceoMember2020-12-310001243429mt:ArceoMember2019-12-310001243429mt:ArceoMember2018-01-012018-12-310001243429mt:ArcelorMittalLiberiaLtdMember2020-01-012020-12-310001243429mt:ArcelorMittalLiberiaLtdMember2019-01-012019-12-310001243429mt:ArcelorMittalLiberiaLtdMember2020-12-310001243429mt:ArcelorMittalLiberiaLtdMember2019-12-310001243429mt:ArcelorMittalLiberiaLtdMember2018-01-012018-12-310001243429mt:OtherSubsidiariesWithMaterialNoncontrollingInterestsMember2020-01-012020-12-310001243429mt:OtherSubsidiariesWithMaterialNoncontrollingInterestsMember2020-12-310001243429mt:OtherSubsidiariesWithMaterialNoncontrollingInterestsMember2019-01-012019-12-310001243429mt:OtherSubsidiariesWithMaterialNoncontrollingInterestsMember2019-12-310001243429mt:OtherSubsidiariesWithMaterialNoncontrollingInterestsMember2018-01-012018-12-310001243429ifrs-full:SubsidiariesWithMaterialNoncontrollingInterestsMember2020-01-012020-12-310001243429ifrs-full:SubsidiariesWithMaterialNoncontrollingInterestsMember2020-12-310001243429ifrs-full:SubsidiariesWithMaterialNoncontrollingInterestsMember2019-01-012019-12-310001243429ifrs-full:SubsidiariesWithMaterialNoncontrollingInterestsMember2019-12-310001243429ifrs-full:SubsidiariesWithMaterialNoncontrollingInterestsMember2018-01-012018-12-310001243429mt:NouvellesSidrurgiesIndustriellesMember2020-01-012020-12-310001243429mt:SonasidMembermt:NouvellesSidrurgiesIndustriellesMember2020-01-012020-12-310001243429mt:ArcelorMittalSouthAfricaLtd.Member2018-12-310001243429mt:SonasidMember2018-12-310001243429mt:PJSCArcelorMittalKryvyiRihMember2018-12-310001243429mt:BelgoBekaertAramesBBAMember2018-12-310001243429mt:HeraErmacMember2018-12-310001243429mt:ArcelorMittalMiningCanadaG.P.andArcelorMittalInfrastructureG.P.Member2018-12-310001243429mt:ArceoMember2018-12-310001243429mt:ArcelorMittalLiberiaLtdMember2018-12-310001243429mt:ArcelorMittalSouthAfricaLtd.Member2017-12-310001243429mt:SonasidMember2017-12-310001243429mt:PJSCArcelorMittalKryvyiRihMember2017-12-310001243429mt:BelgoBekaertAramesBBAMember2017-12-310001243429mt:HeraErmacMember2017-12-310001243429mt:ArcelorMittalMiningCanadaG.P.andArcelorMittalInfrastructureG.P.Member2017-12-310001243429mt:ArceoMember2017-12-310001243429mt:ArcelorMittalLiberiaLtdMember2017-12-310001243429mt:SignificantShareholderMember2020-01-012020-12-310001243429ifrs-full:JointVenturesWhereEntityIsVenturerMembermt:CalvertMember2020-01-012020-12-310001243429ifrs-full:JointVenturesWhereEntityIsVenturerMembermt:CalvertMember2019-01-012019-12-310001243429ifrs-full:JointVenturesWhereEntityIsVenturerMembermt:CalvertMember2018-01-012018-12-310001243429ifrs-full:JointVenturesWhereEntityIsVenturerMembermt:CalvertMember2020-12-310001243429ifrs-full:JointVenturesWhereEntityIsVenturerMembermt:CalvertMember2019-12-310001243429ifrs-full:AssociatesMembermt:GonvarriSteelIndustriesMember2020-01-012020-12-310001243429ifrs-full:AssociatesMembermt:GonvarriSteelIndustriesMember2019-01-012019-12-310001243429ifrs-full:AssociatesMembermt:GonvarriSteelIndustriesMember2018-01-012018-12-310001243429ifrs-full:AssociatesMembermt:GonvarriSteelIndustriesMember2020-12-310001243429ifrs-full:AssociatesMembermt:GonvarriSteelIndustriesMember2019-12-310001243429ifrs-full:JointVenturesWhereEntityIsVenturerMembermt:BorcelikCelikSanayiiTicaretAnonimSirketiMember2020-01-012020-12-310001243429ifrs-full:JointVenturesWhereEntityIsVenturerMembermt:BorcelikCelikSanayiiTicaretAnonimSirketiMember2019-01-012019-12-310001243429ifrs-full:JointVenturesWhereEntityIsVenturerMembermt:BorcelikCelikSanayiiTicaretAnonimSirketiMember2018-01-012018-12-310001243429ifrs-full:JointVenturesWhereEntityIsVenturerMembermt:BorcelikCelikSanayiiTicaretAnonimSirketiMember2020-12-310001243429ifrs-full:JointVenturesWhereEntityIsVenturerMembermt:BorcelikCelikSanayiiTicaretAnonimSirketiMember2019-12-310001243429ifrs-full:JointVenturesWhereEntityIsVenturerMembermt:ArcelorMittalCLNDistribuzioneItaliaS.r.l.Member2020-01-012020-12-310001243429ifrs-full:JointVenturesWhereEntityIsVenturerMembermt:ArcelorMittalCLNDistribuzioneItaliaS.r.l.Member2019-01-012019-12-310001243429ifrs-full:JointVenturesWhereEntityIsVenturerMembermt:ArcelorMittalCLNDistribuzioneItaliaS.r.l.Member2018-01-012018-12-310001243429ifrs-full:JointVenturesWhereEntityIsVenturerMembermt:ArcelorMittalCLNDistribuzioneItaliaS.r.l.Member2020-12-310001243429ifrs-full:JointVenturesWhereEntityIsVenturerMembermt:ArcelorMittalCLNDistribuzioneItaliaS.r.l.Member2019-12-310001243429ifrs-full:AssociatesMembermt:BamesaMember2020-01-012020-12-310001243429ifrs-full:AssociatesMembermt:BamesaMember2019-01-012019-12-310001243429ifrs-full:AssociatesMembermt:BamesaMember2018-01-012018-12-310001243429ifrs-full:AssociatesMembermt:BamesaMember2020-12-310001243429ifrs-full:AssociatesMembermt:BamesaMember2019-12-310001243429mt:INKoteL.P.Memberifrs-full:OtherRelatedPartiesMember2020-01-012020-12-310001243429mt:INKoteL.P.Memberifrs-full:OtherRelatedPartiesMember2019-01-012019-12-310001243429mt:INKoteL.P.Memberifrs-full:OtherRelatedPartiesMember2018-01-012018-12-310001243429mt:INKoteL.P.Memberifrs-full:OtherRelatedPartiesMember2020-12-310001243429mt:INKoteL.P.Memberifrs-full:OtherRelatedPartiesMember2019-12-310001243429ifrs-full:JointVenturesWhereEntityIsVenturerMembermt:ArcelorMittalRZKCelikServisMerkeziSanayiveTicaretAnonimSirketiMember2020-01-012020-12-310001243429ifrs-full:JointVenturesWhereEntityIsVenturerMembermt:ArcelorMittalRZKCelikServisMerkeziSanayiveTicaretAnonimSirketiMember2019-01-012019-12-310001243429ifrs-full:JointVenturesWhereEntityIsVenturerMembermt:ArcelorMittalRZKCelikServisMerkeziSanayiveTicaretAnonimSirketiMember2018-01-012018-12-310001243429ifrs-full:JointVenturesWhereEntityIsVenturerMembermt:ArcelorMittalRZKCelikServisMerkeziSanayiveTicaretAnonimSirketiMember2020-12-310001243429ifrs-full:JointVenturesWhereEntityIsVenturerMembermt:ArcelorMittalRZKCelikServisMerkeziSanayiveTicaretAnonimSirketiMember2019-12-310001243429mt:AperamSocitAnonymeMemberifrs-full:OtherRelatedPartiesMember2020-01-012020-12-310001243429mt:AperamSocitAnonymeMemberifrs-full:OtherRelatedPartiesMember2019-01-012019-12-310001243429mt:AperamSocitAnonymeMemberifrs-full:OtherRelatedPartiesMember2018-01-012018-12-310001243429mt:AperamSocitAnonymeMemberifrs-full:OtherRelatedPartiesMember2020-12-310001243429mt:AperamSocitAnonymeMemberifrs-full:OtherRelatedPartiesMember2019-12-310001243429ifrs-full:AssociatesMembermt:C.L.N.CoilsLamiereNastriS.p.A.Member2020-01-012020-12-310001243429ifrs-full:AssociatesMembermt:C.L.N.CoilsLamiereNastriS.p.A.Member2019-01-012019-12-310001243429ifrs-full:AssociatesMembermt:C.L.N.CoilsLamiereNastriS.p.A.Member2018-01-012018-12-310001243429ifrs-full:AssociatesMembermt:C.L.N.CoilsLamiereNastriS.p.A.Member2020-12-310001243429ifrs-full:AssociatesMembermt:C.L.N.CoilsLamiereNastriS.p.A.Member2019-12-310001243429ifrs-full:JointVenturesWhereEntityIsVenturerMembermt:TuperS.A.Member2020-01-012020-12-310001243429ifrs-full:JointVenturesWhereEntityIsVenturerMembermt:TuperS.A.Member2019-01-012019-12-310001243429ifrs-full:JointVenturesWhereEntityIsVenturerMembermt:TuperS.A.Member2018-01-012018-12-310001243429ifrs-full:JointVenturesWhereEntityIsVenturerMembermt:TuperS.A.Member2020-12-310001243429ifrs-full:JointVenturesWhereEntityIsVenturerMembermt:TuperS.A.Member2019-12-310001243429ifrs-full:AssociatesMembermt:WDIMember2020-01-012020-12-310001243429ifrs-full:AssociatesMembermt:WDIMember2019-01-012019-12-310001243429ifrs-full:AssociatesMembermt:WDIMember2018-01-012018-12-310001243429ifrs-full:AssociatesMembermt:WDIMember2020-12-310001243429ifrs-full:AssociatesMembermt:WDIMember2019-12-310001243429ifrs-full:JointVenturesWhereEntityIsVenturerMembermt:TamehMember2020-01-012020-12-310001243429ifrs-full:JointVenturesWhereEntityIsVenturerMembermt:TamehMember2019-01-012019-12-310001243429ifrs-full:JointVenturesWhereEntityIsVenturerMembermt:TamehMember2018-01-012018-12-310001243429ifrs-full:JointVenturesWhereEntityIsVenturerMembermt:TamehMember2020-12-310001243429ifrs-full:JointVenturesWhereEntityIsVenturerMembermt:TamehMember2019-12-310001243429ifrs-full:AssociatesMembermt:SSCTangerMember2020-01-012020-12-310001243429ifrs-full:AssociatesMembermt:SSCTangerMember2019-01-012019-12-310001243429ifrs-full:AssociatesMembermt:SSCTangerMember2018-01-012018-12-310001243429ifrs-full:AssociatesMembermt:SSCTangerMember2020-12-310001243429ifrs-full:AssociatesMembermt:SSCTangerMember2019-12-310001243429ifrs-full:JointVenturesWhereEntityIsVenturerMembermt:AlJubailMember2020-01-012020-12-310001243429ifrs-full:JointVenturesWhereEntityIsVenturerMembermt:AlJubailMember2019-01-012019-12-310001243429ifrs-full:JointVenturesWhereEntityIsVenturerMembermt:AlJubailMember2018-01-012018-12-310001243429ifrs-full:JointVenturesWhereEntityIsVenturerMembermt:AlJubailMember2020-12-310001243429ifrs-full:JointVenturesWhereEntityIsVenturerMembermt:AlJubailMember2019-12-310001243429mt:MacsteelMemberifrs-full:OtherRelatedPartiesMember2020-01-012020-12-310001243429mt:MacsteelMemberifrs-full:OtherRelatedPartiesMember2019-01-012019-12-310001243429mt:MacsteelMemberifrs-full:OtherRelatedPartiesMember2018-01-012018-12-310001243429mt:MacsteelMemberifrs-full:OtherRelatedPartiesMember2020-12-310001243429mt:MacsteelMemberifrs-full:OtherRelatedPartiesMember2019-12-310001243429mt:OtherCounterpartiesMember2020-01-012020-12-310001243429mt:OtherCounterpartiesMember2019-01-012019-12-310001243429mt:OtherCounterpartiesMember2018-01-012018-12-310001243429mt:OtherCounterpartiesMember2020-12-310001243429mt:OtherCounterpartiesMember2019-12-310001243429ifrs-full:JointVenturesWhereEntityIsVenturerMembermt:GlobalCharteringLimitedMember2020-01-012020-12-310001243429ifrs-full:JointVenturesWhereEntityIsVenturerMembermt:GlobalCharteringLimitedMember2019-01-012019-12-310001243429ifrs-full:JointVenturesWhereEntityIsVenturerMembermt:GlobalCharteringLimitedMember2018-01-012018-12-310001243429ifrs-full:JointVenturesWhereEntityIsVenturerMembermt:GlobalCharteringLimitedMember2020-12-310001243429ifrs-full:JointVenturesWhereEntityIsVenturerMembermt:GlobalCharteringLimitedMember2019-12-310001243429ifrs-full:AssociatesMembermt:BaffinlandMember2020-01-012020-12-310001243429ifrs-full:AssociatesMembermt:BaffinlandMember2019-01-012019-12-310001243429ifrs-full:AssociatesMembermt:BaffinlandMember2018-01-012018-12-310001243429ifrs-full:AssociatesMembermt:BaffinlandMember2020-12-310001243429ifrs-full:AssociatesMembermt:BaffinlandMember2019-12-310001243429mt:CFLCargoS.A.Memberifrs-full:AssociatesMember2020-01-012020-12-310001243429mt:CFLCargoS.A.Memberifrs-full:AssociatesMember2019-01-012019-12-310001243429mt:CFLCargoS.A.Memberifrs-full:AssociatesMember2018-01-012018-12-310001243429mt:CFLCargoS.A.Memberifrs-full:AssociatesMember2020-12-310001243429mt:CFLCargoS.A.Memberifrs-full:AssociatesMember2019-12-310001243429ifrs-full:AssociatesMembermt:ExeltiumS.A.S.Member2020-01-012020-12-310001243429ifrs-full:AssociatesMembermt:ExeltiumS.A.S.Member2019-01-012019-12-310001243429ifrs-full:AssociatesMembermt:ExeltiumS.A.S.Member2018-01-012018-12-310001243429ifrs-full:AssociatesMembermt:ExeltiumS.A.S.Member2020-12-310001243429ifrs-full:AssociatesMembermt:ExeltiumS.A.S.Member2019-12-310001243429ifrs-full:JointVenturesWhereEntityIsVenturerMembermt:BaycoatLimitedPartnershipMember2020-01-012020-12-310001243429ifrs-full:JointVenturesWhereEntityIsVenturerMembermt:BaycoatLimitedPartnershipMember2019-01-012019-12-310001243429ifrs-full:JointVenturesWhereEntityIsVenturerMembermt:BaycoatLimitedPartnershipMember2018-01-012018-12-310001243429ifrs-full:JointVenturesWhereEntityIsVenturerMembermt:BaycoatLimitedPartnershipMember2020-12-310001243429ifrs-full:JointVenturesWhereEntityIsVenturerMembermt:BaycoatLimitedPartnershipMember2019-12-310001243429ifrs-full:JointVenturesWhereEntityIsVenturerMembermt:SitrelMember2020-01-012020-12-310001243429ifrs-full:JointVenturesWhereEntityIsVenturerMembermt:SitrelMember2019-01-012019-12-310001243429ifrs-full:JointVenturesWhereEntityIsVenturerMembermt:SitrelMember2018-01-012018-12-310001243429ifrs-full:JointVenturesWhereEntityIsVenturerMembermt:SitrelMember2020-12-310001243429ifrs-full:JointVenturesWhereEntityIsVenturerMembermt:SitrelMember2019-12-310001243429mt:OtherCounterpartiesMemberifrs-full:OtherRelatedPartiesMember2020-01-012020-12-310001243429mt:OtherCounterpartiesMemberifrs-full:OtherRelatedPartiesMember2019-01-012019-12-310001243429mt:OtherCounterpartiesMemberifrs-full:OtherRelatedPartiesMember2018-01-012018-12-310001243429mt:OtherCounterpartiesMemberifrs-full:OtherRelatedPartiesMember2020-12-310001243429mt:OtherCounterpartiesMemberifrs-full:OtherRelatedPartiesMember2019-12-310001243429ifrs-full:JointVenturesWhereEntityIsVenturerMembermt:FreightContractMembermt:GlobalCharteringLimitedMember2019-12-312019-12-310001243429ifrs-full:JointVenturesWhereEntityIsVenturerMembermt:CalvertMembermt:ArcelorMittalCalvertLLCMember2020-12-310001243429ifrs-full:JointVenturesWhereEntityIsVenturerMembermt:CalvertMembermt:ArcelorMittalCalvertLLCMemberifrs-full:BottomOfRangeMember2014-12-030001243429ifrs-full:JointVenturesWhereEntityIsVenturerMembermt:CalvertMemberifrs-full:TopOfRangeMembermt:ArcelorMittalCalvertLLCMember2014-12-030001243429ifrs-full:JointVenturesWhereEntityIsVenturerMembermt:CalvertMembermt:ArcelorMittalCalvertLLCMemberifrs-full:BottomOfRangeMember2014-12-032014-12-030001243429ifrs-full:JointVenturesWhereEntityIsVenturerMembermt:CalvertMemberifrs-full:TopOfRangeMembermt:ArcelorMittalCalvertLLCMember2014-12-032014-12-030001243429ifrs-full:JointVenturesWhereEntityIsVenturerMembermt:MarketingAgreementMembermt:BaffinlandMember2019-11-080001243429mt:KSSPetronMembermt:ArcelorMittalNipponSteelIndiaLimitedMember2020-12-31
UNITED STATES
SECURITIES AND EXCHANGE COMMISSION
Washington, D.C. 20549
FORM 6-K
| | |
REPORT OF FOREIGN PRIVATE ISSUER PURSUANT TO RULE 13a-16 OR 15d-16 UNDER THE SECURITIES EXCHANGE ACT OF 1934
|
|
Dated July 30, 2021
Commission File Number 001-35788
ARCELORMITTAL
(Translation of Registrant’s name into English)
24-26, boulevard d’Avranches,
L-1160 Luxembourg,
Grand Duchy of Luxembourg
(Address of principal executive office)
Indicate by check mark whether the registrant files or will file annual reports under cover of Form 20-F or Form 40-F.
Form 20-F ☒ Form 40-F ☐
Indicate by check mark if the registrant is submitting the Form 6-K in paper as permitted by Regulation S-T Rule 101(b)(1): ☐
Indicate by check mark if the registrant is submitting the Form 6-K in paper as permitted by Regulation S-T Rule 101(b)(7): ☐
| | |
|
| THIS REPORT ON FORM 6-K SHALL BE DEEMED TO BE INCORPORATED BY REFERENCE IN THE REGISTRATION STATEMENT ON FORM F-3 (NO. 333-256031) OF ARCELORMITTAL AND THE PROSPECTUSES INCORPORATED THEREIN. |
As from April 1, 2021, ArcelorMittal implemented changes to its organizational structure whereby primary responsibility for captive mining operations whose output is mainly consumed by their respective steel segments has been transferred to such segments. The Mining segment will retain primary responsibility for the operation of the seaborne oriented operations at ArcelorMittal Mining Canada G.P. and ArcelorMittal Infrastructure G.P. ("AMMC") and ArcelorMittal Liberia Ltd, and will continue to provide technical support to all mining operations within the Company. Accordingly, the Company modified the structure of its segment information in order to reflect changes in its approach to managing its operations and segment disclosures have been recast to reflect this new segmentation in conformity with IFRS. Only the seaborne-oriented operations of AMMC and ArcelorMittal Liberia Ltd are reported within the Mining segment. The results of all other mines are henceforth accounted for within the steel segment that it primarily supplies.
ArcelorMittal's operating segments include the attributable goodwill, intangible assets, property, plant and equipment, and certain equity method investments. They do not include cash and short-term deposits, short-term investments, tax assets and other current financial assets. Attributable liabilities are also those resulting from the normal activities of the segment, excluding tax liabilities and indebtedness but including post retirement obligations where directly attributable to the segment. The treasury function is managed centrally for the Company and is not directly attributable to individual operating segments or geographical areas.
ArcelorMittal’s segments are structured as follows:
•NAFTA represents the flat, long and tubular facilities of the Company located in Canada, Mexico and the United States (on December 9, 2020, the Company divested ArcelorMittal USA see note 2.3.1). NAFTA produces flat products such as slabs, hot-rolled coil, cold-rolled coil, coated steel and plate. These products are sold primarily to customers in the following sectors: automotive, energy, construction, packaging and appliances and via distributors or processors. NAFTA also produces long products such as wire rod, sections, rebar, billets, blooms and wire drawing, and tubular products.The raw material supply of the NAFTA operations includes sourcing from iron ore captive mines in Mexico and iron ore and coal captive mines the United States (until disposal of ArcelorMittal USA on December 9, 2020 as mentioned above) to supply the steel facilities.
•Brazil includes the flat operations of Brazil, the long and tubular operations of Brazil and neighboring countries including Argentina, Costa Rica and Venezuela. Flat products include slabs, hot-rolled coil, cold-rolled coil and coated steel. Long products consist of wire rod, sections, bar and rebar, billets, blooms and wire drawing. The raw material supply of the Brazil operations includes sourcing from iron ore captive mines in Brazil.
•Europe is the largest flat steel producer in Europe, with operations that range from Spain in the west to Romania in the east, and covering the flat carbon steel product portfolio in all major countries and markets. Europe produces hot-rolled coil, cold-rolled coil, coated products, tinplate, plate and slab. These products are sold primarily to customers in the automotive, general and packaging sectors. Europe also produces long products consisting of sections, wire rod, rebar, billets, blooms and wire drawing, and tubular products. In addition, it includes Downstream Solutions, primarily an in-house trading and distribution arm of ArcelorMittal. Downstream Solutions also provides value-added and customized steel solutions through further steel processing to meet specific customer requirements. The raw material supply of Europe operations includes sourcing from iron ore captive mines in Bosnia & Herzegovina.
•ACIS produces a combination of flat, long and tubular products. Its steel facilities are located in South Africa, Ukraine and Kazakhstan. The raw material supply of the ACIS operations includes sourcing from iron ore captive mines in Kazakhstan and Ukraine and coal captive mines in Kazakhstan.
•The Mining segment comprises the mines owned by ArcelorMittal in Canada and Africa (Liberia). It provides the Company's steel operations with high quality and low-cost iron ore reserves and also sells mineral products to third parties.
The Company is filing the Form 6-K to reflect the retrospective application of the above mentioned changes in its segment information for all periods presented in the Company’s annual report on Form 20-F for the year ended December 31, 2020, filed with the Securities and Exchange Commission on March 8, 2021 (the “2020 Form 20-F”). The Company has not adjusted for any other matters between the date of the initial filing and July 30, 2021, the date that the consolidated financial statements were re-issued.
This report contains the information required by Item 4 “Information on the Company” of the Annual Report on Form 20-F for the three years ended December 31, 2020, Item 5 “Operating and Financial Review and Prospects” of the Annual Report on Form 20-F for the three years ended December 31, 2020, Item 6 “Directors, Senior Management and Employees” of the Annual Report on Form 20-F for the three years ended December 31, 2020, retrospectively adjusted for the above mentioned changes in the composition of reportable segments and Item 18, the ArcelorMittal Consolidated Financial Statements for the three years ended December 31, 2020 retrospectively adjusted for the above mentioned changes in the composition of reportable segments in conformity with IFRS.
Capitalized terms used in this report on Form 6-K have the respective meanings ascribed to them in ArcelorMittal’s annual report on Form 20-F filed with the Securities and Exchange Commission on March 8, 2021.
Form 20-F Cross Reference Guide (Only Items 4, 5, 6 and 18 are included in this report on Form 6-K)
| | | | | | | | | | | |
| Item | Form 20-F Caption | Reference in current report | Page |
| | | |
| Glossary - definitions, terminology and principal subsidiaries | |
Cautionary statement regarding forward-looking statements | Cautionary statement regarding forward-looking statements | |
Part I | | | |
| | | |
| | | |
| | | |
| | | |
| | | |
| | | |
| | | |
Item 4. | Information on the Company | | |
| | History and development of the Company, Key transactions and events in 2020 | |
| | Business strategy, Competitive strengths, Sustainable development, Products, Sales and marketing, Insurance, Intellectual property, Government regulations and Market information | |
| | Organizational structure | |
| | Property, plant and equipment, Capital expenditures, Reserves (iron ore and coal) | |
| | | |
| | | |
| | Economic conditions, Operating results | |
| | Liquidity and capital resources and Contractual obligations | |
C. | Research and development, patents and licenses | Competitive strengths, Research and development | |
| | Outlook | |
E. | Off-balance sheet arrangements | Contractual obligations | |
| | Contractual obligations | |
G. | Safe harbor | Forward-looking statements | |
| | | |
| | Directors and senior management | |
| | Compensation | |
| | Corporate governance | |
| | Employees | |
| | Management share ownership | |
| | | |
| | | |
| | | |
| | | |
| | | |
| | | |
| | | |
| | | |
| | | |
| | | |
| | | |
| | | |
| | | |
| | | |
| | | |
| | | |
| | | |
| | | |
| | | |
| | | |
| | | |
| | | |
| | | |
| | | |
| | | |
| | | |
| | | |
| | | |
| | | |
| | | |
| | | |
| | | |
| | | |
| | | |
| | | |
| | | |
| | | |
| | | |
| | | |
| | | |
| | | |
| | | |
| | | |
| | | |
Item 18. | Financial statements | Consolidated financial statements | |
| | | |
Table of contents
| | | | | |
| Page |
| |
| Management report | |
| |
| Introduction | |
| Company overview | |
| History and development of the Company | |
| Cautionary Statement regarding forward-looking statements | |
| Key transactions and events in 2020 | |
| |
| |
| Business overview | |
| Business strategy | |
| Research and development | |
| Sustainable development | |
| Products | |
| Sales and marketing | |
| Insurance | |
| Intellectual property | |
| Government regulations | |
| Organizational structure | |
| |
| Properties and capital expenditures | |
| Property, plant and equipment | |
| Capital expenditures | |
| Reserves (iron ore and coal) | |
| |
| Operating and financial review | |
| Economic conditions | |
| Operating results | |
| Liquidity and capital resources | |
| |
| Contractual obligations | |
| Outlook | |
| |
| Management and employees | |
| Directors and senior management | |
| Compensation | |
| Corporate governance | |
| Employees | |
| |
| |
| |
| |
| Management share ownership | |
| |
| |
| |
| |
| |
| |
| |
| | | | | |
| |
| Page |
| |
| |
| |
| |
| |
| |
| |
| |
| |
| |
| |
| |
| |
| |
| Glossary - definitions, terminology and principal subsidiaries | |
| |
| Exhibits | |
| Signatures | |
| | |
| Report of Independent Registered Public Accounting Firm | |
| |
| Consolidated financial statements | |
| Consolidated statements of operations | |
| Consolidated statements of other comprehensive income | |
| Consolidated statements of financial position | |
| Consolidated statements of changes in equity | |
| Consolidated statements of cash flows | |
| Notes to the consolidated financial statements | |
| |
Introduction
Company overview
ArcelorMittal is one of the world’s leading integrated steel and mining companies. ArcelorMittal is the largest steel producer in the Americas and Europe, second largest in Africa and the sixth largest steel producer in the CIS region and has a smaller but growing presence in Asia.
The Company's key metrics above include the U.S. operations prior to its sale (see "—Key transactions and events in 2020"):
| | | | | | | | | | | |
U.S. operations
(in million tonnes) | Crude steel | Iron ore | Coal |
| Production | 9.93 | 5.83 | 1.39 |
| Shipments | 9.14 | 5.53 | 1.47 |
ArcelorMittal has steel-making operations in 17 countries on four continents, including 38 integrated and mini-mill steel-making facilities following the sale of ArcelorMittal USA. As of December 31, 2020, ArcelorMittal had approximately 168,000 employees.
ArcelorMittal produces a broad range of high-quality finished and semi-finished steel products ("semis"). Specifically, ArcelorMittal produces flat products, including sheet and plate, and long products, including bars, rods and structural shapes. It also produces pipes and tubes for various applications. ArcelorMittal sells its products primarily in local markets and to a diverse range of customers in approximately 160 countries, including the automotive, appliance, engineering, construction and machinery industries. ArcelorMittal’s mining operations produce various types of mining products including iron ore lump, fines, concentrate and sinter feed, as well as coking, PCI and thermal coal for consumption at its steel-making facilities
some of which are also for sale commercially outside of the Group.
As a global steel producer, the Company is able to meet the needs of different markets. Steel consumption and product requirements clearly differ between developed markets and developing markets. Steel consumption in developed economies is weighted towards flat products and a higher value-added mix, while developing markets utilize a higher proportion of long products and commodity grades. To meet these diverse needs, the Company maintains a high degree of product diversification and seeks opportunities to increase the proportion of higher value-added products in its product mix.
History and development of the Company
ArcelorMittal results from the merger in 2007 of its predecessor companies Mittal Steel Company N.V. and Arcelor, each of which had grown through acquisitions over many years. Since its creation ArcelorMittal has experienced periods of external growth as well consolidation and deleveraging (including through divestment).
ArcelorMittal's success is built on its core values of sustainability, quality and leadership and the entrepreneurial boldness that has empowered its emergence as the first truly global steel and mining company. Acknowledging that a combination of structural issues and macroeconomic conditions will continue to challenge returns in its sector, the Company has adapted its footprint to the new demand realities, redoubled its efforts to control costs and repositioned its operations with a view toward outperforming its competitors. ArcelorMittal’s research and development capability is strong and includes several major research centers as well as strong academic partnerships with universities and other scientific bodies.
Against this backdrop, ArcelorMittal's strategy is to leverage four distinctive attributes that will enable it to capture leading positions in the most attractive areas of the steel industry’s value chain, from mining at one end to distribution and first-stage processing at the other: global scale and scope; superior technical capabilities; a diverse portfolio of steel and related businesses, one of which is mining; and financial capabilities. The Company’s strategy is further detailed under “Business overview—Business strategy”.
ArcelorMittal’s steel-making operations have a high degree of geographic diversification. Approximately 38% of its crude steel was produced in the Americas, approximately 47% was produced in Europe and approximately 15% was produced in other countries, such as Kazakhstan, South Africa and Ukraine
in 2020. In addition, ArcelorMittal’s sales of steel products are spread over both developed and developing markets, which have different consumption characteristics. ArcelorMittal’s mining operations, present in South America, Africa, Europe and the CIS region, are integrated with its global steel-making facilities and are important producers of iron ore and coal in their own right.
Competitive strengths
As shown by the following graph, ArcelorMittal has a diversified portfolio of steel and mining products to meet a wide range of customer needs across many steel-consuming sectors, including automotive, appliance, engineering, construction, energy and machinery and via distributors.
* Other steel sales mainly represent metal processing, machinery, electrical equipment and domestic appliances
**Other sales mainly represent mining, chemicals & water, slag, waste, sale of energy and shipping
The Company believes that the following factors contribute to ArcelorMittal’s success in the global steel and mining industry:
Market leader in steel. ArcelorMittal had annual achievable production capacity of approximately 108 million tonnes of crude steel (92 million tonnes of crude steel after the sale of ArcelorMittal USA as described in Key transactions and events in 2020) for the year ended December 31, 2020. Steel shipments for the year ended December 31, 2020 totaled 69.1 million tonnes. ArcelorMittal has significant operations in many countries which are described in "Properties and capital expenditures". In addition, many of ArcelorMittal’s operating units have access to developing markets that are expected to experience, over time, above-average growth in steel consumption (such as Central and Eastern Europe, South America, India, Africa, CIS and Southeast Asia).
The Company sells its products in local markets and through a centralized marketing organization to customers in approximately 160 countries. ArcelorMittal’s diversified product offering, together with its distribution network and research and development (“R&D”) programs, enable it to build strong relationships with customers, which include many of the world’s major automobile and appliance manufacturers. The Company is a strategic partner to several of the major original equipment manufacturers (“OEMs”) and has the capability to build long-term contractual relationships with them based on early vendor involvement, contributions to global OEM platforms and common value-creation programs.
A world-class mining business. ArcelorMittal has a global portfolio of 10 operating units with mines in operation and development and is among the largest iron ore producers in the world. In 2020, ArcelorMittal sourced a large portion of its raw materials from its own mines and facilities including finance leases. The table below reflects ArcelorMittal's self-sufficiency through its mining operations in 2020, 2019 and 2018.
| | | | | | | | | | | | | | | | | | | | | | | | | | | | | | | | | | | | | | |
| 2020 | 2019 | 2018 |
| Millions of metric tonnes | Consumption | Sourced from own mines/facilities2 | Other sources | Self-sufficiency % | Consumption | Sourced from own mines/facilities2 | Other sources | Self-sufficiency % | Consumption | Sourced from own mines/facilities2 | Other sources | Self-sufficiency % |
| Iron ore | 89.9 | 58.1 | 31.8 | 65% | 115.2 | 59.3 | 55.9 | 52% | 118.3 | 58.3 | 60.0 | 49% |
PCI & coal1 | 36.4 | 5.1 | 31.3 | 14% | 46.5 | 5.7 | 40.8 | 12% | 47.9 | 5.8 | 42.1 | 12% |
| Coke | 22.0 | 20.9 | 1.1 | 95% | 27.8 | 26.3 | 1.5 | 95% | 28.2 | 25.7 | 2.5 | 91% |
| Scrap & DRI | 28.6 | 15.6 | 13.0 | 55% | 34.4 | 18.6 | 15.8 | 54% | 36.3 | 19.3 | 17.0 | 53% |
1.Includes coal only for the steelmaking process and excludes a small proportion of weak metallurgical coals for boiler power generation. ArcelorMittal's consumption of PCI and coal was 6.75 million tonnes and 29.6 million tonnes, 9.6 million tonnes and 36.9 million tonnes and 9.8 million tonnes and 38.1 million tonnes for the years ended December 31, 2020, 2019 and 2018, respectively.
2.Assumes 100% consumption of ArcelorMittal's iron ore and coal production.
The Company has iron ore mining activities in Brazil, Bosnia, Canada, Kazakhstan, Liberia, Mexico, Ukraine, the United States (until the divestment of ArcelorMittal USA see "—Key transactions and events in 2020") and through its joint venture in India. It has coal mining activities in Kazakhstan and the United States (until the divestment of ArcelorMittal Princeton see "—Key transactions and events in 2020"). ArcelorMittal’s main mining products include iron ore lump, fines, concentrate, pellets, sinter feed, metallurgical coals including hard, weak and PCI suitable coals. In addition, ArcelorMittal produces substantial amounts of direct reduced iron, or DRI, which is a scrap substitute used in its mini-mill facilities to supplement external metallic purchases. As of December 31, 2020, ArcelorMittal’s iron ore reserves (including 100% of reserves at mines where ArcelorMittal owns less than 100%, and reserves for which use is restricted) were estimated at 4,089 million tonnes run of mine and its total coking coal reserves were estimated at 101 million tonnes run of mine or 58 million wet recoverable tonnes. See “Property and capital expenditures—Reserves (iron ore and coal)” for a detailed list of the entities with reserves and ownership structure. The Company’s long-life iron ore and coal reserves provide a measure of security of supply and an important natural hedge against raw material volatility and global supply constraints. Those mines that sell primarily to external customers are managed as a separate segment while the mines which primarily supply the Company's steel operations are managed by the respective segments they supply.
ArcelorMittal’s facilities have good access to shipping facilities, including through ArcelorMittal’s own, or partially owned, 15 deep-water port facilities and linked railway sidings.
Market-leading automotive steel business. ArcelorMittal has a leading market share with approximately 17% of the worldwide market share in the automotive steel business as of December
31, 2020, and is a leader in the fast-growing advanced high strength steels ("AHSS") segment, specifically for flat products. Following the sale of ArcelorMittal USA at the end of 2020, the Company's automotive market share is expected to decrease in the U.S.. ArcelorMittal is the first steel company in the world to embed its own engineers within an automotive customer to provide engineering support. The Company begins working with OEMs as early as five years before a vehicle reaches the showroom, to provide generic steel solutions, co-engineering and help with the industrialization of the project. These relationships are founded on the Company’s continuing investment in R&D and its ability to provide well-engineered solutions that help make vehicles lighter, safer and more fuel-efficient.
In 2010, ArcelorMittal initiated a development effort of dedicated S-in motion® engineering projects. Its S-in motion® line (B,C&D car segments, SUV, pick-up trucks, light commercial vehicles, truck cabs, hybrid vehicles, battery electric vehicles ("BEVs")) is a unique offering for the automotive market that respond to OEMs’ requirements for safety, fuel economy and reduced CO2 emissions. By utilizing AHSS in the S-in motion® projects, OEMs can achieve significant weight reduction using the Company's emerging grades solutions such as Fortiform®, the Company's third generation AHSS for cold forming, or Usibor® 2000 and Ductibor® 1000, the Company's latest AHSS grades for hot stamping.
In November 2016, ArcelorMittal introduced a new generation of AHSS, including new press hardenable steels and martensitic steels. Together, these new steel grades aim to help automakers further reduce body-in-white weight to improve fuel economy without compromising vehicle safety or performance. In November 2017, ArcelorMittal launched the second generation of its iCARe® electrical steels which play a central role in the
construction of electric motors which are used in BEVs, hybrid vehicles ("HV"), plug in hybrid vehicles ("PHEV") and mild hybrid vehicles ("MHV"). This new iCARe® generation features optimized mechanical, magnetic and thermal properties of the steel as compared to the first generation of iCARe® electrical steels. Further, S-in motion® projects for electrical cars in the C segment as well as for the plug-in hybrid C-segment were completed in 2019. There are multiple specificities for BEVs: shorter front module, necessity to protect batteries against crash, lowering of the center of gravity, huge additional weight due to batteries, etc. These specificities require rethinking crash management. S-in Motion® BEV for SUV is a catalog of steel solutions adapted to this new type of vehicles. Advanced and especially ultra-high strength steels, innovative press hardened steels, laser welded blanks are especially highlighted as key solutions for an optimal performance (safety/weight) and battery safety. The growth of various types of electric vehicles will impact design and manufacturing. For instance, new large mass batteries change the mass distribution of a vehicle and impact the design and manufacturing of the chassis and wheels. Battery protection provides another example: both the battery box and body structure have to protect the battery in the event of a crash. AHSS products are among the most affordable solutions on the market for these specific applications. In a context where the supply of electric vehicles, and especially BEVs are expected to grow quickly, new projects have been launched to address these new trends.
In the automotive industry, ArcelorMittal mainly supplies the geographic markets where its production facilities are located in Europe, North and South America, South Africa and China through Valin ArcelorMittal Automotive Steel Co., Ltd (“VAMA”), its joint venture with Hunan Valin. VAMA’s product mix is oriented toward higher value products and mainly toward the OEMs to which the Company sells tailored solutions based on its products. With sales and service offices worldwide, production facilities in North and South America, South Africa, Europe and China, ArcelorMittal believes it is uniquely positioned to supply global automotive customers with the same products worldwide. The Company has multiple joint ventures and has also developed a global downstream network of partners through its distribution solutions activities. This provides the Company with a proximity advantage in virtually all regions where its global customers are present.
In 2020, ArcelorMittal was OEM qualified for galvanized Fortiform® 980 material, and sourced for the first time ever on all new vehicle platforms launching throughout 2021. Fortiform® 980 is an advanced grade of steel designed specifically for the auto industry, it offers leading-edge formability and strength with superior weldability. It is produced at the Company's joint venture facility in Calvert, Alabama, USA.
For further details on the new products under development, see "Business overview—Research and development”.
Diversified and efficient producer. As a global steel manufacturer with a leading position in many markets, ArcelorMittal benefits from scale and production cost efficiencies in various markets and a measure of protection against the cyclicality of the steel industry and raw materials prices.
•Diversified production process. In 2020, approximately 57.1 million tonnes of crude steel were produced through the basic oxygen furnace process (9.55 million tonnes of which were produced by ArcelorMittal USA), approximately 14.2 million tonnes through the electric arc furnace process (0.38 million tonnes of which were produced by ArcelorMittal USA) and approximately 0.2 million tonnes of crude steel through the open hearth furnace process. This provides ArcelorMittal with greater flexibility in its raw material and energy use, and increased ability to meet varying customer requirements in the markets it serves.
•Product and geographic diversification. By operating a portfolio of assets diversified across product segments and geographic areas, ArcelorMittal benefits from a number of natural hedges. As a global steel producer with a broad range of high-quality finished and semi-finished steel products, ArcelorMittal is able to meet the needs of diverse markets. Steel consumption and product requirements vary between mature economy markets and developing economy markets. Steel consumption in mature economies is largely from flat products and a higher value-added mix, while developing markets utilize a higher proportion of long products and commodity grades. As developing economies mature and as market needs evolve, local customers will require increasingly advanced steel products. To meet these diverse needs, ArcelorMittal maintains a high degree of product diversification and seeks opportunities to increase the proportion of its product mix consisting of higher value-added products.
•Upstream integration. ArcelorMittal believes that its own raw material production provides it with a competitive advantage over time. Additionally, ArcelorMittal benefits from the ability to optimize its steel-making facilities’ efficient use of raw materials, its global procurement strategy and the implementation of company-wide knowledge management practices with respect to raw materials. Certain of the Company’s operating units also have access to infrastructure, such as deep-water port facilities, railway sidings and engineering workshops that lower transportation and logistics costs.
•Downstream integration. ArcelorMittal’s downstream integration, primarily through its Europe segment for distribution solutions, enables it to provide customized steel solutions to its customers more effectively. The Company’s downstream assets have cut-to-length, slitting and other processing facilities, which provide value additions and help it to maximize operational efficiencies.
Dynamic responses to market challenges and opportunities. ArcelorMittal’s management team has a strong track record and extensive experience in the steel and mining industries. In line with its deleveraging focus at the time, it announced in August 2019 that it had identified opportunities to unlock up to $2 billion in value from its asset portfolio over the next two years. In 2019, the Company made progress toward this goal with the sale of a 50% stake in Global Chartering Limited, its wholly owned shipping business which decreased ArcelorMittal's debt by $0.5 billion, and therefore net debt. In 2020, the Company completed its goal of unlocking $2 billion in value from its asset portfolio with the sale of ArcelorMittal USA to Cleveland-Cliffs (see transaction details in " —Key transactions and events in 2020").
In 2020, the Company successfully reduced fixed costs, including through temporary measures, in line with lower production resulting from the impacts of the COVID-19 pandemic. This reduction was achieved through significant savings in labor cost (including temporary salary reductions, utilizing the available economic unemployment schemes to match workforce to operating rates, temporary layoffs, reduction/elimination of contractors, reduced overtime, etc.), reduction in repairs and maintenance expenses (given lower operating rates) and savings in selling, general and administrative expenses. The comprehensive measures taken to “variabilize” fixed costs were critical to protecting profitability and cash flows. As economic activity recovered during the year, the Company responded by restarting or increasing production, leading to the reversal of some of these temporary savings. At the same time, the Company remained focused on structural cost improvements to appropriately position its fixed cost base for the post-COVID-19 operating environment. These savings are expected to limit the increase in fixed costs as activity and production levels recover, thus leading to lower fixed costs per tonne. In total, $1.0 billion of structural cost improvements are identified within this fixed cost reduction program which is expected to be fully realized in 2022 relative to the 2019 scale of operation and capacity utilization (adjusted for entities sold or deconsolidated). Fixed costs related to the functional area of production and logistics are expected to provide approximately 40% of the retained savings through continuous improvement programs, improvements in productivity and maintenance efficiency and the rationalization of support functions. Fixed
costs related to repairs and maintenance will contribute approximately 35% of the savings through insourcing and reduction of subcontracting and reallocation of internal resources. Savings in selling, general and administrative expenses will contribute the remaining 25% of savings, including a 20% reduction in corporate office headcount. These improvements will augment those achieved under the Action 2020 program, which was superseded at the onset of the COVID-19 pandemic. These savings also include those realized from rationalization of the Company's operating footprint, including the permanent closure of the blast furnace and steel plant at Krakow (Poland), the permanent closure of the Florange coke oven battery and the closure of the Saldana facility in South Africa (see "Properties and capital expenditures—Property, plant and equipment—Europe" for further details).
Proven expertise in acquisitions and turnarounds. ArcelorMittal’s management team has proven expertise in successfully acquiring and subsequently integrating operations, as well as turning around underperforming assets within tight timeframes. The Company takes a disciplined approach to investing and uses teams with diverse areas of expertise from different business units across the Company to evaluate new assets, conduct due diligence and monitor integration and post-acquisition performance. The Company has grown through a series of acquisitions and by improving the operating performance and financial management at acquired facilities. In particular, ArcelorMittal seeks to improve acquired businesses by eliminating operational bottlenecks, addressing any historical under-investments and increasing the capability of acquired facilities to produce higher quality steel. The Company introduces focused capital expenditure programs, implements company-wide best practices, balances working capital, ensures adequate management resources and introduces safety and environmental improvements at acquired facilities. ArcelorMittal believes that these operating and financial measures have improved the operating performance and the quality of steel produced at such facilities.
In recent years, the Company has focused on improving its costs through its Action 2020 program and non-core asset disposals as well as through some strategic M&A activity. In 2018, the Company completed the acquisition of AMSF in Brazil and the acquisition of ArcelorMittal Italia in Italy and in 2019 the Company completed the acquisition of AMNS India through a joint venture with NSC. In 2020, the Company sold ArcelorMittal USA and entered into an agreement to create a joint venture with the Italian government for ArcelorMittal Italia. See "Introduction—Key transactions and events in 2020" for further information.
Other information
ArcelorMittal is a public limited liability company (société anonyme) that was incorporated for an unlimited period under
the laws of the Grand Duchy of Luxembourg on June 8, 2001. ArcelorMittal is registered at the R.C.S. Luxembourg under number B 82.454.
The mailing address and telephone number of ArcelorMittal’s registered office are:
| | |
| ArcelorMittal |
| 24-26, Boulevard d’Avranches |
| L-1160 Luxembourg |
| Grand Duchy of Luxembourg |
| Telephone: +352 4792-1 |
ArcelorMittal’s agent for U.S. federal securities law purposes is:
| | |
| ArcelorMittal Sales & Administration LLC |
1 South Dearborn Street, 13th Floor |
| Chicago, Illinois, 60603 |
| Telephone: +1 312 899 3866 |
Internet site
ArcelorMittal maintains an Internet site at www.arcelormittal.com. Information contained on or otherwise accessible through this Internet site is not a part of this annual report. All references in this annual report to this Internet site are inactive textual references to this URL and are for information only.
The SEC maintains an internet site that contains reports, proxy and information statements, and other information regarding issuers that file electronically with the SEC at www.sec.gov.
ArcelorMittal produces a range of publications to inform its shareholders. These documents are available in various formats: they can be viewed online, downloaded or obtained, on request, in paper format. Please refer to www.arcelormittal.com, where they can be located within the Investors menu, under Financial Reports, or within the Corporate Library.
Any request for documents may be sent to: company.secretary@arcelormittal.com or at ArcelorMittal’s registered office.
Sustainable development
ArcelorMittal’s sustainable development information is detailed in the Integrated Annual Review that will be published during the
second quarter of 2021 and will be available within the Corporate Library on www.arcelormittal.com.
ArcelorMittal as parent company of the ArcelorMittal group
ArcelorMittal, incorporated under the laws of Luxembourg, is the parent company of the ArcelorMittal group and is expected to continue this role during the coming years. The Company has no branch offices.
Listings
ArcelorMittal’s shares (also referred to as "ordinary shares" or "common shares" throughout this report) are traded on several exchanges: New York (MT), Amsterdam (MT), Paris (MT), Luxembourg (MT) and on the Spanish stock exchanges of Barcelona, Bilbao, Madrid and Valencia (MTS). Its primary stock exchange regulator is the Luxembourg CSSF (Commission de Surveillance du Secteur Financier). ArcelorMittal’s CSSF issuer number is E-0001.
ArcelorMittal’s 5.50% Mandatorily Convertible Subordinated Notes Due 2023 issued in May 2020 are listed on the New York Stock Exchange.
Indexes
ArcelorMittal is a member of more than 145 indices including: STOXX Europe 600, S&P Europe 350, CAC40, MSCI Pan-Euro, Bloomberg World Index, IBEX 35, Euronext Paris CAC Basic Materials Index, DAXglobal Steel EUR Price and Euronext Amsterdam AEX Basic Materials Index . Recognized for its commitments to sustainable development, ArcelorMittal is also included in the FTSE4Good Index, Euronext Vigeo Europe 120 and the STOXX® Global ESG Leaders Index. Further, ArcelorMittal has been participating in CDP since 2005 (currently a ‘A-’ grade) and the United National Global Compact since 2003.
Share price performance
During 2020, the price of ArcelorMittal shares increased by 32% in dollar terms compared to 2019 year on year; the chart below shows a comparison between the performance of ArcelorMittal’s shares and the Eurostoxx600 Basic Resource (SXPP).
Capital return policy
On June 13, 2020, at the annual general meeting of shareholders, as proposed by the Board of Directors, in response to the COVID-19 pandemic, the dividend payment was suspended until the operating environment normalizes.
Following the achievement of the Group’s net debt target, and in line with its previous statements, the Board of Directors will propose a new capital return policy at the next annual general meeting of shareholders. Going forward, the Company expects to pay a base annual dividend (to be progressively increased over time). In addition, 50% of the amount of free cash flow (calculated as net cash provided by operating activities less purchases of property, plant and equipment and intangibles ("capital expenditures") less dividends paid to non-controlling shareholders) remaining after paying the base annual dividend will be allocated to a share buyback program to be completed over the subsequent 12 month period. Should the ratio of net debt to operating income (loss) less depreciation, impairment and special items be greater than 1.5x then the share buyback will not be made. According to this policy, the Board will recommend a $0.30 per share base dividend be paid in June 2021. It has also approved a $570 million share buyback program to be completed within 2021. This buyback is in addition to the $650 million share buyback announced on February 15, 2021 to return the proceeds of the partial sell-down of the Company’s equity stake in Cleveland-Cliffs announced on February 9, 2021.
Investor relations
ArcelorMittal has a dedicated investor relations team at the disposal of analysts and investors. By implementing high standards of financial information disclosure and providing clear, regular, transparent and even-handed information to all its shareholders, ArcelorMittal aims to be the first choice for investors in the sector.
To meet this objective and provide information to fit the needs of all parties, ArcelorMittal implements an active and broad investor communications policy: conference calls, road shows with the financial community, regular participation at investor conferences, plant visits and meetings with individual investors.
ArcelorMittal’s senior management plans to meet investors and shareholder associations in road shows throughout 2021.
Depending on their geographical location, investors may use the following e-mails or contact numbers to reach the investor relations team:
| | | | | |
| investor.relations@arcelormittal.com | '+44 203 214 2893 |
| privateinvestors@arcelormittal.com | '+44 203 214 2893 |
| creditfixedincome@arcelormittal.com | +33 1 7192 1026 |
Sustainable responsible investors
The Investor Relations team is also a source of information for the growing sustainable responsible investment community. The team organizes special events on ArcelorMittal’s corporate responsibility strategy and answers all requests for information sent to the Group crteam@arcelormittal.com or may be contacted at +44 207 543 1132.
Financial calendar
The schedule is available on ArcelorMittal’s website www.arcelormittal.com under Investors>Financial calendar.
| | | | | |
| Financial results*: | |
| Results for the 1st quarter 2021 | May 6, 2021 |
| Results for the 2nd quarter 2021 and 6 months 2021 | July 29, 2021 |
| Results for the 3rd quarter 2021. | November 11, 2021 |
| Meeting of shareholders: | |
| Annual general meeting of shareholders | May 4, 2021 |
* Earnings results are issued before the opening of the stock exchanges on which ArcelorMittal is listed.
Contact the investor relations team on the information detailed above or please visit www.arcelormittal.com/corp/investors/contact.
Cautionary Statement Regarding Forward-Looking Statements
This annual report and the documents incorporated by reference in this annual report contain forward-looking statements based on estimates and assumptions. This annual report contains forward-looking statements within the meaning of the Private Securities Litigation Reform Act of 1995. Forward-looking statements include, among other things, statements concerning the business, future financial condition, results of operations and prospects of ArcelorMittal, including its subsidiaries. These statements usually contain the words “believes”, “plans”, “expects”, “anticipates”, “intends”, “estimates” or other similar expressions. For each of these statements, you should be aware that forward-looking statements involve known and unknown risks and uncertainties. Although it is believed that the expectations reflected in these forward-looking statements are reasonable, there is no assurance that the actual results or developments anticipated will be realized or, even if realized, that they will have the expected effects on the business, financial condition, results of operations or prospects of ArcelorMittal.
These forward-looking statements speak only as of the date on which the statements were made, and no obligation has been undertaken to publicly update or revise any forward-looking statements made in this annual report or elsewhere as a result of new information, future events or otherwise, except as required by applicable laws and regulations. A detailed discussion of principal risks and uncertainties which may cause actual results and events to differ materially from such forward-looking statements is included in the section titled “Risk factors”.
The Company undertakes no obligation to update or revise publicly any forward-looking statements whether because of new information, future events, or otherwise, except as required by securities and other applicable laws.
All information that is not historical in nature and disclosed under “Operating and financial review ” is deemed to be a forward-looking statement.
Market information
This annual report includes industry data and projections about the Company’s markets obtained from industry surveys, market research, publicly available information and industry publications. Statements on ArcelorMittal’s competitive position contained in this annual report are based primarily on public sources including, but not limited to, published information from the Company's competitors. Industry publications generally state that the information they contain has been obtained from sources believed to be reliable but that the accuracy and completeness of such information is not guaranteed and that the projections they contain are based on a number of significant assumptions. The Company has not independently verified this data or determined the reasonableness of such assumptions. In addition, in many cases the Company has made statements in this annual report regarding its industry and its position in the industry based on internal surveys, industry forecasts and market research, as well as the Company’s experience. While these statements are believed to be reliable, they have not been independently verified.
Financial information
This annual report contains the audited consolidated financial statements of ArcelorMittal and its consolidated subsidiaries, including the consolidated statements of financial position as of December 31, 2020 and 2019, and the consolidated statements of operations, other comprehensive income, changes in equity and cash flows for each of the years ended December 31, 2020, 2019 and 2018. ArcelorMittal’s consolidated financial statements were prepared in accordance with International Financial Reporting Standards (“IFRS”) as issued by the International Accounting Standards Board (“IASB”).
The financial information and certain other information presented in a number of tables in this annual report have been rounded to the nearest whole number or the nearest decimal. Therefore, the sum of the numbers in a column may not conform exactly to the total figure given for that column. In addition, certain percentages presented in the tables in this annual report reflect calculations based upon the underlying information prior to rounding and, accordingly, may not conform exactly to the percentages that would be derived if the relevant calculations were based on the rounded numbers. This annual report
includes net debt, operating working capital and free cash flow, which are non-GAAP financial measures. ArcelorMittal believes net debt, operating working capital and free cash flow to be relevant to enhance the understanding of its financial position and provides additional information to investors and management with respect to the Company’s operating cash flows, capital structure and credit assessment. In addition, it refers to “special” items in its capital return policy which will be used to determine if the base dividend will be paid. “Special” items relate to events or charges that the Company does not consider to be part of the normal income generating potential of the business. Items may qualify as “special” although they may have occurred in prior years or are likely to recur in following years. Non-GAAP financial measures should be read in conjunction with and not as an alternative for, ArcelorMittal’s financial information prepared in accordance with IFRS. Such non-GAAP measures may not be comparable to similarly titled measures applied by other companies.
Key transactions and events in 2020
ArcelorMittal Italia
On March 4, 2020, ArcelorMittal executed an amendment (the “Amendment Agreement”) to the original lease agreement with the Ilva Commissioners with a conditional obligation to purchase certain business units of Ilva in an extraordinary administration insolvency procedure (the “Ilva Agreement”). The Amendment Agreement outlined the terms for a significant equity investment by Italian state-sponsored entities, thereby forming the basis for an important new partnership between ArcelorMittal and the Italian government, with the investment agreement to be executed by November 30, 2020. The Amendment Agreement provided that the equity investment would be for a percentage of the equity of ArcelorMittal Italia in an amount at least equal to ArcelorMittal Italia’s remaining liabilities against the original purchase price under the amended Ilva Agreement. The Amendment Agreement also provided for a 50% reduction in the quarterly rental payments payable by ArcelorMittal under the Ilva Agreement, with the balance being due upon closing of the purchase obligation of the former Ilva business.
The Amendment Agreement had also provided that in the event that the investment agreement were not executed by November 30, 2020, ArcelorMittal had a right to withdraw, subject to the payment of €500 million (€350 million was payable by December 31, 2020 as a condition for the withdrawal to become effective and the remainder payable upon restitution of the business units, potentially subject to certain settlement, or offsetting mechanisms).
On March 4, 2020, simultaneously with the execution of the Amendment Agreement, ArcelorMittal and the Ilva Commissioners also entered into a separate settlement agreement whereby ArcelorMittal agreed to revoke its notice to
withdraw from the original Ilva Agreement and the Ilva Commissioners agreed to withdraw their request to enjoin such withdrawal, which was scheduled to be heard in the Civil Court of Milan on March 6, 2020.
On December 10, 2020, ArcelorMittal signed a binding agreement (the “Investment Agreement”) with Invitalia, the party designated by the Italian government to be the government-sponsored investor as contemplated in the March amendment, in order to create a partnership between Invitalia and the Company to support the completion of the purchase obligation. Among other things, the Investment Agreement provides for Invitalia to invest up to €1.105 billion in ArcelorMittal Italia in two tranches:
•The first investment of €400 million, which was contractually expected to be completed by the end of February following EU antitrust authorization on January 28, 2021, is currently expected to be made in the first quarter of 2021; in return, Invitalia will receive shares in ArcelorMittal Italia with 50% of the voting rights that, along with governance rights, will provide it with joint control over ArcelorMittal Italia;
•The second tranche (consisting of up to €680 million in equity and a shareholder loan of up to €25 million) is payable on closing of the purchase obligation under the Ilva Agreement, which itself is subject to the satisfaction of various conditions precedent by May 2022. This second investment is expected to bring Invitalia’s shareholding in ArcelorMittal Italia to 60%. ArcelorMittal may need to invest up to €70 million to retain a 40% shareholding and equivalent voting rights. The conditions precedent to closing under the Ilva Agreement include: the amendment of the existing environmental plan for the Taranto plant to account for changes in the new industrial plan (as described below); the lifting of all criminal seizures on the Taranto plant; the absence of restrictive measures – in the context of criminal proceedings where Ilva is a defendant – being imposed against ArcelorMittal Italia; and a new agreement with trade unions. If these conditions precedent are not fulfilled by May 2022, the joint venture will not be required to purchase the business units and instead will be required to return them to Ilva, which in turn will be required to pay an end-of-lease adjustment determined on the basis of the equity capital injected by its shareholders and its net financial position. In turn, if the conditions precedent are not fulfilled, Invitalia will also not be required to make the second tranche of its investment and the joint venture would be liquidated.
The updated industrial plan agreed between ArcelorMittal and Invitalia as part of the Investment Agreement involves investment in lower-carbon steelmaking technologies, including the construction of a 2.5 million tonne electric arc furnace, which is expected to open in mid-2024, and the relining of blast furnace #5, which is expected to begin production in 2024. This industrial plan, which targets reaching 8 million tonnes of production in 2025 (crude steel production is limited to 6 million tonnes until the environmental plan is completed), will become effective upon the closing of the first investment. It integrates a series of public support measures including ongoing government funded employment support and includes, for the period between 2021 and 2025, environmental capital expenditures of €345 million and industrial capital expenditures of €1,051 million as well as capital expenditures of €226 million for the revamp of blast furnace #5 and €260 million for the construction of the electric arc furnace. Going forward, the joint venture will be responsible for funding the future capital expenditure payments and lease rentals (to May 2022).
ArcelorMittal Italia’s governance will be based on the principle of joint control starting from Invitalia’s first investment; accordingly upon closing of the first investment, ArcelorMittal Italia will no longer be included in ArcelorMittal’s scope of consolidation and the carrying amount of its assets and liabilities were classified as held for sale as of December 31, 2020. See note 2.3.2 to the consolidated financial statements.
ArcelorMittal USA disposal
On December 9, 2020, pursuant to the terms of the transaction agreement, dated as of September 28, 2020, the Company sold substantially all of its U.S. operations (notably other than its interest in the Calvert joint venture, as noted below) to Cleveland-Cliffs Inc. (“Cleveland-Cliffs”), including all of the outstanding equity interests of ArcelorMittal USA, ArcelorMittal Monessen and ArcelorMittal Princeton, their subsidiaries, certain other subsidiaries and the joint operations of Hibbing Taconite Mines, Double G Coatings and I/N Tek and the joint venture I/N Kote (ArcelorMittal retained certain intellectual property assets and office space), for an aggregate total consideration of $2.2 billion (the "ArcelorMittal USA Transaction"). The total consideration included $509 million in cash (subject to a working capital adjustment), 78 million common shares of Cleveland-Cliffs (representing a 16% stake and valued at approximately $1,020 million, as of December 9, 2020, see also "—Recent developments") and 583,273 non-voting preferred shares (valued at approximately $761 million, as of December 9, 2020), redeemable at Cleveland-Cliffs’ option at any time from 180 days from the issue date at a redemption price per share (payable in cash or, subject to certain conditions, in Cleveland-Cliffs’ common shares) equal to an initial multiple (subject to anti-dilution provisions) of 100 times the volume-weighted average price of the Cleveland-Cliffs’ common shares for the 20
consecutive trading days ending on the trading day immediately preceding the date fixed for redemption, plus accumulated and unpaid dividends to, but not including, the redemption date (subject to mandatory redemption upon a change of control of Cleveland-Cliffs). In addition, from and after the 24-month anniversary of the issue date, a holder of the preferred stock will be entitled to receive additional cash dividends accruing and compounding on a daily basis at the initial rate of 10% per year on the sum of (i) the redemption price as of the 24-month anniversary and (ii) the amount of accumulated and unpaid dividends on the preferred stock, if any, which rate will increase by 2% per annum at the end of each six-month period following the 24-month anniversary. ArcelorMittal's voting power with respect to Cleveland-Cliffs’ common shares and ability to transfer such shares are subject to certain limitations (summarized below). In addition, Cleveland-Cliffs assumed certain liabilities of ArcelorMittal USA, including pensions and other post-employment benefit liabilities net of plan assets which had a carrying value as of the disposal date of $3.2 billion. The assets of the disposal group were re-measured prior to classification as held for sale at September 30, 2020 and as a result the Company reversed $660 million of prior asset impairments. For further information, see note 2.3.1 to the consolidated financial statements and, for further details about the assets impacted, "Properties and capital expenditures—Property, plant and equipment—NAFTA" .
In addition, NSC, the co-shareholder of I/N Tek and I/N Kote simultaneously exited from such entities, which were therefore transferred in full to Cleveland-Cliffs. ArcelorMittal continues to hold its investment in Calvert, a joint venture with Nippon Steel Corporation in Calvert, Alabama. See note 2.4 to the consolidated financial statements and "Properties and capital expenditures—Property, plant and equipment—Investments in joint ventures" for further information.
In connection with the ArcelorMittal USA Transaction, ArcelorMittal and Cleveland-Cliffs entered into certain other agreements, including a license agreement, mutual transition services agreement for a twelve-month period, and a slab supply agreement with Calvert as customer for an initial term of five years, subject to an automatic renewal for three years (unless either party provides notice of intent to terminate at least twelve-months prior to the end of the initial term). ArcelorMittal agreed to purchase 1.5 million tons of slabs each year for the initial five year term and 0.6 million tons of slabs each year under the renewal. The commitment for both these terms can be canceled or reduced with a six month notice for each of these terms.
ArcelorMittal is subject to certain restrictions on transfer of its Cleveland-Cliffs’ common shares to persons whose beneficial ownership of Cleveland-Cliffs’ common shares following any such transfer would exceed 5% or, in the case of a passive
holder, 10%, of the then-outstanding common shares of Cleveland-Cliffs. ArcelorMittal is also subject, for a five-year period, to certain standstill restrictions, including not to acquire beneficial ownership of 20% or more of the then-outstanding common shares of Cleveland-Cliffs or act to control or influence the board of directors or management of Cleveland-Cliffs, and certain voting restrictions on its common shares that limit its voting discretion and in particular align it with Board recommendations and/or other shareholder votes. ArcelorMittal has customary “demand” SEC registration rights for 50% of its Cleveland-Cliffs' common shares starting March 9, 2021 and for all of such shares starting June 9, 2021, as well as "piggy back" registration rights (i.e., to sell shares in an SEC-registered offering of shares by Cleveland-Cliffs, as occurred in February 2021).
Other events in 2020
•During 2020, ArcelorMittal completed several debt transactions see "Operating and financial review—Liquidity and capital resources" and note 6.1.2 to the consolidated financial statements.
•On May 14, 2020 and May 18, 2020, respectively, the Company completed an offering of common shares, without nominal value, and mandatorily convertible subordinated notes ("MCNs"). The aggregate gross proceeds from the offerings were $2.0 billion (before deduction of commissions). The share offering was for an aggregate amount of $750 million, representing 80.9 million common shares at an offering price of $9.27 (€8.57 at a EUR/USD conversion rate of 1.0816) per share. The MCNs offering was for an aggregate principal amount of $1.25 billion, issued at 100% of the principal amount and have a maturity of 3 years. The MCNs are mandatorily converted into common shares of the Company upon maturity (unless earlier converted at the option of the holders or ArcelorMittal or upon certain specified events). The MCNs will pay a coupon of 5.50% per annum, payable quarterly in arrears. The minimum conversion price of the MCNs is equal to $9.27, corresponding to the offering price of the shares, and the maximum conversion price is 117.5% of the minimum conversion price (corresponding to $10.89), subject to certain defined adjustments. See note 11.2 to the consolidated financial statements for further information. A Mittal family trust participated in the offerings by purchasing $100 million of MCNs and $100 million of shares.
•On October 30, 2020, the Company completed a share buyback program in connection with the announced sale of 100% of the shares of ArcelorMittal USA. ArcelorMittal repurchased 35,636,253 shares at an average price per share of €11.92 (equivalent to $14.03) for a total value of €425 million ($500 million).
•On December 15, 2020, ArcelorMittal signed separate, privately negotiated exchange agreements with a limited number of holders of the MCNs to exchange $247 million in aggregate principal amount of MCNs for an aggregate of 22,653,933 shares at the minimum conversion ratio plus $25 million (including accrued interest on the exchanged MCNs up to, but excluding, the settlement date). See note 11.2 to the consolidated financial statements.
•On December 22, 2020, ArcelorMittal announced the extension of the conversion date for the $1 billion privately placed mandatory convertible bond ("MCB") issued on December 28, 2009 until January 31, 2024. The other main features of the MCB remain unchanged. See note 11.2 to the consolidated financial statements.
Recent developments
On February 9, 2021, ArcelorMittal announced an agreement to sell 40 million Cleveland-Cliffs' common shares for total gross proceeds of $652 million (net proceeds of $16.12 per share) as part of a combined primary and secondary public offering of Cleveland-Cliffs' shares. Following the sale, ArcelorMittal continues to hold 38 million common shares in addition to the preferred shares described above. The proceeds from the sale of Cleveland-Cliffs' common shares will be used for a new share buyback program of ArcelorMittal common shares. The accumulated gain of $123 million recognized in other comprehensive income was transferred to retained earnings in February 2021.
On February 11, 2021, the Board of Directors of ArcelorMittal announced, effective immediately, that Aditya Mittal, currently President, CFO and CEO ArcelorMittal Europe, will become Chief Executive Officer of the Company. Mr. Mittal, who founded the Company in 1976 and is currently Chairman and CEO will become Executive Chairman. In this position, he will continue to lead the Board of Directors and work together with the CEO and management team. The CEO Office will be renamed Executive Office, consisting of the Executive Chairman and the CEO. As a result of these developments, Genuino Christino, who joined the Company in 2003 and has held the position of Head of Finance since 2016, will become Chief Financial Officer.
On February 15, 2021, ArcelorMittal announced a share buyback program under the authorization given by the annual general meeting of shareholders held on June 13, 2020. ArcelorMittal intends to repurchase shares for an aggregate maximum amount of $650 million under the program. On completion of the program, ArcelorMittal will commence a further share buyback program for an aggregate amount of $570 million, in-line with the Company’s new capital returns policy announced on February 11, 2021. Both share buyback programs will be completed by December 31, 2021. To maintain its current level of voting rights, on February 12, 2021, the
Significant Shareholder entered into a share repurchase agreement with ArcelorMittal to sell, on each trading day which ArcelorMittal purchases shares under the programs, an equivalent number of shares in the proportion of the Significant Shareholder’s 36.34% of outstanding shares of ArcelorMittal. The sale will be at the same price as the shares repurchased on the market. The share buyback program was completed on March 3, 2021 with 27,113,321 million shares repurchased (9,852,980 of which were repurchased from the Significant Shareholder for purposes of maintaining its voting rights for €195 million ($236 million)) for a total value of approximately €537 million ($650 million) at an approximate average price per share of €19.79.
On March 4, 2021, ArcelorMittal commenced a second share buyback program for an aggregate amount of $570 million, in-line with the Company’s new capital returns policy. This share buyback program will be completed by December 31, 2021.
For further information on ArcelorMittal’s ongoing capital expenditure projects, see “Properties and capital expenditures—Capital expenditures”.
Business overview
Business strategy
ArcelorMittal’s success is built on its core values of sustainability, quality and leadership and the entrepreneurial boldness that has empowered its emergence as the first truly global steel and mining company. Acknowledging that a combination of structural issues and macroeconomic conditions will continue to challenge returns in its sector, the Company has adapted its footprint to the new demand realities, intensified its efforts to control costs and repositioned its operations to outperform its competitors.
Against this backdrop, ArcelorMittal's strategy is to leverage four distinctive attributes that will enable it to capture leading positions in the most attractive areas of the steel industry value chain, from mining at one end to distribution and first-stage processing at the other:
•Global scale and scope
•Unmatched technical capabilities
•Diverse portfolio of steel and related businesses, particularly mining
•Financial capability.
Three themes
Steel. ArcelorMittal looks to expand its leadership role in attractive markets and segments by leveraging the Company’s technical capabilities and its global scale and scope. These are critical differentiators for sophisticated customers that value the distinctive technical and service capabilities the Company offers. Such customers are typically found in the automotive, energy, infrastructure and a number of smaller markets where ArcelorMittal is a market leader. In addition, the Company is present in, and will further develop, attractive steel businesses that benefit from favorable market structures or geographies. In developing attractive steel businesses, ArcelorMittal’s goal is to be the supplier of choice by anticipating customers’ requirements and exceeding their expectations. It will invest to develop and grow these businesses and enhance its ability to serve its customers. Given the current environment, that investment will be highly disciplined, balancing financial and sustaining considerations with targeted strategic opportunities. Commodity steel markets will inevitably remain an important part of ArcelorMittal’s steel portfolio. Here, a lean cost structure should limit the downside in weak markets while allowing the Company to capture the upside in strong markets.
Mining. ArcelorMittal is working to continue to create value from its world-class mining business. Mining forms part of the steel value chain but typically enjoys a number of structural advantages, such as a steeper cost curve. The Company's strategy is to create value from its most significant assets, through selective expansion/de-bottlenecking, by controlling cost and capital expenditure, and by supplying products that are highly valued by steel producers. ArcelorMittal's financial capability allowed it to continue to invest in key mining assets (notably ArcelorMittal Mines and Infrastructure Canada), while the diversity of its steel and mining portfolio facilitates the ability of the mining business to optimize the value of its products in the steelmaking process. The Company's mining business aspires to be the supplier of choice for a balanced mix of both internal and external customers, while at the same time providing a natural hedge against market volatility for its steel operations.
All operations. ArcelorMittal strives to achieve best-in-class competitiveness. Operational excellence, including health and safety, the number one priority, is at the core of the Company's strategy in both steel and mining. The Company steadily optimizes its asset base to ensure it is achieving high operating rates at its best assets. Its technical capabilities and the diversity of its portfolio of businesses underpin a strong commitment to institutional learning and continuous improvement through measures such as benchmarking and best-practice sharing. Innovation in products and processes also plays an important role while supporting overall competitiveness.
Five key strategic enablers
Critical to implementing this strategy are five key enablers:
A clear license to operate. Many of ArcelorMittal's businesses are located in regions that are in the early stages of economic development. Practically all are resource-intensive. The Company recognizes that it has an obligation to act responsibly towards all stakeholders. ArcelorMittal's commitment to sustainability is outlined below. See "Business overview—Sustainable development". Sustainability is a core value that underlies ArcelorMittal's efforts to be both the world’s safest steel and mining company and a responsible environmental steward.
A strong balance sheet. The Company has made good progress in recent years in strengthening its balance sheet. The progress achieved to date means that the Company is now in a position to have more balance and flexibility in its capital allocation and the Company can, on a selective basis, pursue organic or acquisitive growth opportunities.
A decentralized organizational structure. ArcelorMittal's scale and scope are defining characteristics that give it a competitive advantage. They also introduce complexity and the risks of inefficiency, bureaucracy and diffuse accountability. To manage these risks, the Company favors a structure in which the responsibility for profit and loss is focused on business units aligned with markets.
Active portfolio management. Throughout the Company's history, it has sought to grow and strengthen the business through acquisitions. That remains the case. The acquisition of existing assets and businesses is typically seen as a more attractive growth path than greenfield investment. The Company is, however, also willing to dispose of businesses that cannot meet its performance standards or that have more value to others.
The best talent. ArcelorMittal's success will depend on the quality of its people, and its ability to engage, motivate and reward them. As detailed below, the Company is committed to investing in its people and ensuring a strong leadership pipeline. See "Management and Employees—Employees—Employee development". It will continue to improve its processes to attract, develop and retain the best talent.
Research and development
The Company’s Global Research and Development ("R&D") division provides the technical foundation for the sustainability and commercial success of the Company by stimulating innovative thinking and the continuous improvement of products and processes.
ArcelorMittal believes it possesses leading R&D capabilities among steel producers and is committed to maintaining and extending this advantage by anticipating and responding to major technological, sustainability and social trends, while also making a significant contribution towards achieving the Company’s 10 Sustainable Development Outcomes (see “—Sustainable development” below).
To support this commitment, the Company operates 12 research sites around the world, and in 2020, ArcelorMittal’s R&D expense was $245 million (compared to $301 million and $290 million in 2019 and 2018, respectively).
Among its R&D initiatives, ArcelorMittal has developed a 15 year expertise in Lifecycle Analysis ("LCA"), which analyzes the environmental impact of products during their production, use and disposal. In 2020, the Company undertook a total of 28 LCA studies related to steel products and the processes used to produce them, all guided by the relevant standard (ISO 14040-44).
The Company’s expertise in LCA is an important asset in all of its global markets. For example, LCA is a requirement of Environmental Product Declarations ("EPD") for construction products in Europe, and contributes to increasing the Company’s competitiveness in the construction sector. The Company’s EPDs are reviewed by third parties and validated by the "Institut Bauen und Umwelt", the Institute of Construction and Environment, and are made available via ArcelorMittal Europe’s Constructalia website. The Company is also leading the development of a methodological framework for EPDs in Brazil, where it published its first EPD in 2019.
ArcelorMittal is a member of the CIRAIG International Lifecycle Chair, an international reference center for the lifecycle of products, processes and services, and the world largest research center on the topic. ArcelorMittal is active in particular in their circular economy working group and is also a member of the Roundtable for Product Social Metrics.
ArcelorMittal’s R&D strategy focuses on six main pillars:
Maintaining the competitiveness of the Company’s steel among its unique automotive customer base.
R&D continually drives innovation that enables the Company’s strategic focus on higher-added-value products. A key focus is products designed to meet the complex and changing needs of the automotive industry.
ArcelorMittal developed its S-in motion® range of solutions, which showcased the benefits of Advanced High Strength Steel ("AHSS") grades and manufacturing processes that continue to help automotive customers meet demanding targets for fuel economy, and thereby drive improvements in CO2 emissions.
In 2020, ArcelorMittal celebrated the 10th anniversary of S-in Motion®. This concept has proven to adapt to the evolving needs of the automotive market, with its most recent developments in 2019 including a catalog of solutions for the booming electrified vehicles market. The Company's S-in Motion® projects for Hybrid vehicles, BEVs and battery packs are being rolled out. A specific S-in motion® project dedicated to chassis of electric vehicles has also been developed. It demonstrates that the best steel solutions might be as light as aluminum while reducing CO2 equivalent emissions up to 58%.
The results of the ArcelorMittal S-in motion® BEV study on a Sports Utility Vehicle demonstrated why steel is expected to remain the dominant auto body metal for the growing electrified vehicle market. Steel will allow original equipment manufacturers to achieve the goals of creating more light weight vehicles with increased driving ranges in a more cost-effective manner. More than ever, steel is the material of choice for automotive customers as it combines the ability to meet
stringent expectations for passenger safety with the best price on the market.
With total life cycle emissions of BEVs expected to decrease compared to internal combustion engine vehicles, BEVs’ embedded carbon from metal production and its end-of-life impacts will become increasingly relevant. A comprehensive LCA study encompassing the vehicle’s production and end-of-life phases has been made on the Company's S-in motion® BEV. It concluded that while light-weighting still improves BEVs’ lifecycle performance, gains in powertrain efficiency will have much greater benefits. The most sensitive aspects of BEVs’ lifecycle are the environmental footprint of battery production and that of the electricity grid. Current battery production impacts are greater than those of steel body production. For BEVs to reach legislated CO2 targets, the electricity grid needs to be decarbonized much more quickly. Between 2000 and 2015, the grid decarbonized at a rate of 2%. For large cars to meet CO2 targets, progress will need to triple by 2035.
Creating a robust and diverse portfolio of niche non-automotive steel products to serve customers across multiple sectors.
Customers in many sectors share the automotive industry’s demand for innovative products and processes. The Company aims to deliver similar breakthrough advances in these sectors by creating differentiated products and unique engineering solutions, all designed to ensure that steel is the customer's material of choice.
ArcelorMittal is fully involved in the development of solutions dedicated to the Global Energy Transition. The Company's patented anti-corrosion steel coating Magnelis® which is used extensively in framing solutions for the photovoltaic module is an emblematic solution for renewable energy. Additionally, the Company is also working on the development of solutions for Hydrogen and liquified natural gas ("LNG"), for wind applications, electricity grids, carbon capture and bioenergy.
Packaging is, in the Company’s view, another important opportunity. ArcelorMittal continues to respond to the need to meet evolving health and safety regulations, to achieve lightweight, cost-saving design, and to develop new functionalities. A major opportunity is also presented by the increasing pressure to reduce packaging made of plastics, as society becomes less and less accepting of packaging that is not in line with sustainable development objectives. With its ability to be recycled and to eliminate hazardous elements, steel is well-positioned to extend its applications in packaging and replace an increasing volume of plastic packaging.
In 2020, R&D launched 29 new products and solutions to accelerate sustainable lifestyles, while also progressing further on 16 such product development programs.
The R&D division also launched 27 products and solutions this year to support sustainable construction, infrastructure and energy generation, while also progressing further on 17 such product development programs.
Fully capitalizing on the capacity of Steligence® - a holistic platform for environmentally-friendly, cost-effective construction - to create higher-added-value products and solutions for the construction market is being deployed in a variety of markets.
Construction is one of the key sectors for ArcelorMittal. The Company’s R&D effort is focused on providing higher-added-value products that meet customer needs, including their sustainable development objectives.
Steligence® highlights the innovations the Company’s steel has to offer in the design and performance of a building, and to support its customers in their use of its products. Steligence® adds value through its holistic approach of helping specialists in the architectural and engineering disciplines to meet the increasing demand for sustainability, flexibility, creativity and cost in high-performance building design by harnessing the credentials of steel through its potential for recyclability and the reduction of materials used.
A key concept within Steligence® is to make buildings easier to assemble and dismantle. As a result, buildings become quicker to construct, leading to significant efficiencies and cost savings while also creating the potential for re-use. This reflects ArcelorMittal’s wider interest in modularization and the potential re-use of steel components - a field it is discussing with customers and in its LCA assessments. The approach is demonstrated in the Company’s planned new Luxembourg headquarters, which has been designed so that nearly all the steel components can be dismantled and re-used in a new building without the need for recycling.
The use of ArcelorMittal’s innovative Grade 80 steels is an integral element of the Company’s industry-leading, independently peer-reviewed Steligence® concept. It is being used for the first time in the USA in the 51 story Canal office building in Chicago. The superior 80ksi strength of this steel used in the columns of the upper section of the building enabled the design team to reduce the overall amount of structural steel used by almost 20%, and its slimmer profile allowed the developer-owner to offer more open space on upper floors to tenants.
Developing breakthrough process innovations to deliver cost reduction, sustainability benefits to meet current and
emerging environmental challenges, and new product development.
The creation of unique processes creates value for the Company and its stakeholders by: enhancing the performance of operations through cost efficiency and improved product quality; promoting process-driven product development; and enabling environmental improvements, including carbon reductions and improvements in air, land and water. Process improvements contribute decisively to the future of the Company, both helping to preserve its license to operate and ensuring its financial sustainability through important management gains.
By-products and circular economy. Work in this area includes the re-use of slag as a valuable product for many applications, which reduces waste while avoiding the ecosystem disruption that can result from the extraction of other materials such as natural stone or sand. For example, the Company is making innovative re-use of slag in the following applications: ballast in offshore wind turbine foundations to replace natural ballast; a construction material for building protection walls to reduce noise and dust; a fertilizer source for agriculture; and the potential re-use of slag from furnaces in water filtration and greenhouse gas capture. Other circular economy initiatives include: working on the use of mining tailings as a secondary raw material, either by finding marketable solutions or generating valuable products to be used in-house; and improving the quality of the scrap the Company uses, as well as exploring automated sorting processes for treating scrap.
Improvement in air, land, water. Work in this area includes research in technology for cleaning fumes from stacks, reducing dust diffusive emissions, cleaning water discharges, and solving water scarcity issues. In 2020, the Company developed new slag applications for road construction and made progress in Circular Carbon Economy in the use of waste as an alternative solid fuel to reduce CO2 emissions.
Progress against air pollution. In 2020, ArcelorMittal's global R&D division has performed intensive work to identify the sources of all kinds of dust emissions and define the best methods to quantify them in order to assess the actual impact of ArcelorMittal's plants on the surroundings. In parallel, the Company has continued to research technologies to control de-dusting in yards and open areas and continued with the industrialization of advanced filtration technologies to reduce emissions at stacks.
Reduction of carbon emissions and energy use. ArcelorMittal’s global R&D division also continues to research processes to support carbon neutrality and energy efficiency. In 2020, significant progress was made in ArcelorMittal's key projects aimed at reaching CO2 neutrality in 2050. For the Hamburg Hydrogen project, the main operating parameters of the H2
MIDREX direct reduction process were defined in order to mitigate the risk of spontaneous ignition of the C-free DRI pellets. The pilot for cold electrolysis of iron, the "SIDERWIN" project, has been fully designed and is under construction. Its commissioning is scheduled in 2021. For the conventional integrated steel production route, significant progress was made in the development of the VeLoSint (very low sintering) sintering technology to replace up to 50% of fossil C fuel with hot bio-fumes while maintaining the metallurgical properties. The IGAR blast furnace technology lay-out including gas separation technology was fully defined based on R&D simulation and active benchmarking to identify some promising technologies. Concerning the steelmaking, the feasibility of implementing a pre-melter to reduce hot metal ratio at BOF both in Eisenhüttenstadt and Bremen was completed and the analysis of OEMs proposals are ongoing.
Confirmation of success of our product driven process research. The volumes of Magnelis® delivered have continued to increase even during the pandemic. While it is in high demand, it is hard to manufacture. In addition, despite the disruptions caused by the COVID-19 pandemic, the Company has continued to develop its breakthrough casting technology in 2020.
Mining process improvements. Global R&D has developed the capabilities to upgrade and digitalize its systems using satellites, drones, wireless sensors and robots to feed a geographic information system for detailed monitoring of tailings dams, which forms part of the Company’s mining circular economy initiative. In the future, this will be extended to both plants and wildlife, thus helping the Company respond to increasing expectations from stakeholders looking for reassurance that biodiversity hotspots are not negatively impacted by the Company’s mining operations.
For more details on environmental impact, delivering energy saving programs and lowering emissions of solids, water and gases, see “Sustainable development—Management Theme #2: Climate change and Management Theme #4: Environment”.
Fully capitalizing on opportunities from the digital economy.
ArcelorMittal envisages itself as a fully digital enterprise where everything is connected. ArcelorMittal invested early and significantly in automation systems, and for decades the Company has been a pioneer in the introduction and use of artificial neural networks. ArcelorMittal is currently fully committed to a total digital transformation, including significant advances in a number of fields and relies on the secure and reliable performance of its digital technology platforms, information technology systems, continuously updating its security measures to avoid data breaches or data theft (see also “Introduction—Risk factors”). The Company is focusing its efforts on:
•Global platforms (Big Data, Internet of Things ("IoT"), Collaborative Digital Product Development);
•Manufacturing digitalization (Production, Quality and Maintenance); and
•Business digitalization (Procurement, Commercial, Supply Chain, Strategy, Finance).
The Company's global standard platform for Big Data storage and analytics (ARTHUR) and IoT (DASHIELL) avoids the use of a mosaic of technologies and facilitates the global sharing and rapid implementation of Artificial Intelligence ("AI") models with proven results among all units. This approach makes the Company’s size a key advantage.
In its digital strategy, the Company makes use of solutions that are directly acquired in the market, solutions that are co-developed with technology suppliers, and solutions that are fully developed internally to take advantage of the rich knowledge interfaces the Company has (process, product, AI, math optimization). This combination leads to performance superiority.
The main driver for digitalization at ArcelorMittal is a competitive advantage, with new technologies and especially cutting-edge AI and mathematical optimization tools contributing to ensure:
•The best product quality, through better prediction using advanced analytics made possible through Big Data and distributed computing. This means production issues can be detected before they happen, enabling adjustments to be made to production parameters to avoid them.
•Maximizing equipment operational time and avoiding unplanned stoppages via predictive maintenance. The Company is already seeing positive results in several production units and is further deploying these solutions across the Company.
•Cost efficiency in production and logistics. For example, the R&D division has developed a unique, breakthrough technology for line scheduling - inspired by studying and mimicking the movements in ant colonies - that has significantly improved productivity. In addition, the deployment of automated stockyards, linked to line scheduling and transport devices such as autonomous cranes, means less stock is needed and lead times are cut, yielding two major supply chain benefits.
•Enlarge the offer to ArcelorMittal's customers via new web sales platforms. Together with ArcelorMittal’s commercial workforce, the R&D division has developed
specific algorithms and recommendation systems that are implemented in new IT commercial platforms adding value to its customers, who are also increasing the digital nature of their activities and ways of doing business.
While the implementation of large-scale digital and industry 4.0 projects is challenging in a company of ArcelorMittal’s size, once implemented these projects bring major benefits and value because of the Company’s scale and complexity. The global standard platforms strategy has contributed significantly to this initiative.
ArcelorMittal’s approach is to work with a broad range of entities, thus maximizing the knowledge transference into its teams, avoiding black-boxes, and increasing its development capabilities. This has led to the development of new algorithms using Big Data technologies that can solve problems in ways that were not possible before, mainly due to limitations in the manipulation of large volumes of data.
Seizing the potential of additive manufacturing. ArcelorMittal sees significant potential in additive manufacturing and 3D printing. For example, within the Company’s operations, it will be possible to ‘print’ spare parts when predictive analytics show that equipment needs replacing, thus reducing disruptions. As 3D technology matures, it will have an increasing impact on the way the Company and its customers do business. ArcelorMittal’s R&D teams are exploring opportunities and partnering in this field. In response to the COVID-19 pandemic, the Company was able to collaborate to address the severe lack of required safety and medical equipment for the public health effort by 3D printing face shields and ventilators in Europe and Brazil.
Sustainable development
ArcelorMittal recognizes the important contribution its products and processes make to Sustainable Development (“SD”) and aims to ensure that its steels are the material of choice in the transition towards a circular and low-carbon economy. This means preparing for and responding to the most significant long-term environmental and social trends that are transforming the context in which the Company operates. These include sector-focused decarbonization ambitions aligned with the Paris Agreement, the transformation of society towards a circular economy and the growing demand from customers for adherence to sustainability standards from their entire supply chains, from mine sites to delivery of products.
The Company’s SD framework, launched in 2015, sets out the 10 SD outcomes it needs to achieve in order to protect and grow long-term value for its stakeholders. These outcomes are aligned with, and aim to contribute to, many of the United Nation’s Sustainable Development Goals (“SDGs"). Details of the relationship between the 10 SD outcomes and the SDGs are
included in the reporting index to ArcelorMittal's Integrated Annual Review 2019, which is available on the Company's website. The outcomes provide the basis for engaging the Company’s workforce on SD issues, and support the development, management and reporting of sustainability across its operations.
| | | | | |
| ArcelorMittal's 10 SD Outcomes: |
| 1 | Safe, healthy, quality working lives for ArcelorMittal’s people |
| 2 | Products that accelerate more sustainable lifestyles |
| 3 | Products that create sustainable infrastructure |
| 4 | Efficient use of resources and high recycling rates |
| 5 | Trusted user of air, land and water |
| 6 | Responsible energy user that helps create a lower-carbon future |
| 7 | Supply chains that ArcelorMittal’s customers trust |
| 8 | Active and welcomed member of the community |
| 9 | A pipeline of talented scientists and engineers for tomorrow |
| 10 | ArcelorMittal’s contribution to society measured, shared and valued |
To drive its goal of inventing smarter steels for a better world, the Company recognizes the value in creating an integrated marketing offer that combines many aspects of these 10 SD outcomes. These include being the supplier of choice for innovative products while maintaining steel and mine sites that operate to standards that meet and exceed the sustainability expectations of customers and investors. This is at the heart of the Company’s approach to SD.
ArcelorMittal listens carefully to stakeholders, both locally and globally, and recognizes a trend of rising expectations among stakeholders regarding local community issues as well as the global transition toward a circular economy and the steel industry’s critical role within it. The Company assesses stakeholder trust to be a key value driver, and accordingly adopts a Board-led strategic approach to deepening trust through stakeholder engagement.
Integration of SD into the business is therefore essential for ArcelorMittal to achieve long-term value for its shareholders and other stakeholders while maintaining a profitable market share. Over the last five years, the Company has been integrating the SD outcomes into the business, beginning at the site level by explaining the need for integrating SD into planning and reporting of results. In 2018, the Company’s Board of Directors established the Appointments, Remuneration & Corporate Governance and Sustainability Committee of the Board (the "ARCGS"), an expansion of the previous Appointments, Remuneration & Corporate Governance Committee, which monitors the performance of corporate functions and business segments against the 10 SD outcomes pursuant to the five management themes discussed below. This integration of SD
was fully embedded in 2019 with the implementation of theme dashboards and quarterly reporting from local sites to the ARCGS.
The ARCGS organizes its governance of SD through five management themes, which helps deepen the Company’s strategic approach towards each one.
The themes (and the relevant SD outcomes to which they relate) are:
| | | | | | | | |
| Management Theme | Relevant SD Outcome |
| 1 | Safety | 1 |
| 2 | Climate change | 6 |
| 3 | Customer reassurance | 7 |
| 4 | Environment | 4, 5 |
| 5 | Social | 1, 8, 9, 10 |
The ARCGS's oversight underpins the Company’s strategy to ensure that both corporate functions and business segments contribute to achieving the 10 SD outcomes with the following elements:
•Each business segment, acting on its understanding of SD trends and through its engagement with stakeholders, develops a plan in pursuit of the 10 SD outcomes as a priority, with a set of key performance indicators (“KPIs") established against which they must report quarterly to the ARCGS committee;
•Corporate functions lead on key areas including: progress towards low-carbon steelmaking, innovating steel solutions and steelmaking technologies with a positive SD impact, and developing a ‘mine to metal’ chain of assurance against multi-stakeholder environmental and social standards; and
•A robust articulation of the Company's approach and progress through clear narrative and transparent, third-party assured reporting.
The Company is committed to transparency as evidenced by the comprehensive SD disclosures made in the Integrated Annual Review and Factbook each year, and by the publication of its first Group Climate Action Report in May 2019, and subsequent Climate Action in Europe report in 2020, which serve as the Company’s response to the recommendations of the Task Force on Climate-related Financial Disclosures (“TCFD”). The second Group Climate Action Report is planned to be published in the second quarter of 2021.
The Company now sees the need to go beyond transparency and invest in stakeholder dialogue by leading collaborative conversations with stakeholders on climate action and multi-
stakeholder standard setting processes and certification for both steel sites and mines (see “Management Theme #3: Customer reassurance" below).
The Company is leading the steel industry’s first global certification standard, ResponsibleSteel™, to provide customers, investors and stakeholders with reassurance on sustainability throughout the steel value chain and inform them about the credibility and rigor that has gone into auditing the Company's social and environmental performance at its steel plants and mines.
The ResponsibleSteel™ performance standard audits operations against the 12 environmental, social and governance principles. The Company has started certifying various sites across the Group in 2020, including the ArcelorMittal Europe – Flat Products sites. The Company has also committed to external certification by Initiative for Responsible Mining Assurance ("IRMA"), an internationally recognized third-party verification and certification standard. The intention is to achieve accreditation in Liberia and Brazil in three to five years and implement IRMA across other mines in the coming years as well. See "Customer reassurance".
Both schemes will provide additional level of reassurance of the Company’s sustainability standards and will also strengthen the Company's governance standards.
The Company’s management of SD is summarized along the five management themes in the following pages.
Management Theme #1: Safety
ArcelorMittal's employees are essential to its ambition to build a high-performing organization. The Company wants all its employees to be safe and healthy, committed to ArcelorMittal's success and to act with integrity in everything they do. ArcelorMittal aims to build an inclusive culture in which diversity is valued, and every individual is respected and their potential developed. Safety is the number one priority.
Health and Safety – managing response to the COVID-19 pandemic
The COVID-19 outbreak has impacted many countries around the world, and disrupted the lives of many millions of people. The Company has been taking the risks associated with the outbreak extremely seriously, and the safety and wellbeing of its employees is of paramount importance.
The Company continues to follow the recommendations of governments from around the world and managing response in line with the World Health Organization (WHO) guidelines. It has implemented measures to reduce the risk of the virus spreading at its operations. These include introduction of pandemic safety protocols, ensuring sufficient supplies of sanitation products and
essential personal protective equipment, strictly following social distancing procedures, conducting enhanced and regular cleaning operations and monitoring the health of employees when they enter and exit work premises. Wherever possible, the Company implemented remote working. Employees were provided support, advice and guidance they needed to adjust to working in challenging times. The Company’s pandemic crisis management team has been in continuous contact with leadership teams in all the regions where it operates to ensure the right decisions are being taken for the wellbeing of employees.
At the onset of the crisis, the Company’s global Health and Occupational Hygiene and Health and Safety Councils have issued ‘COVID-19 safety principles’ designed to guide and provide global consistency in the Company’s health and safety response to the COVID-19 pandemic. It outlined best practices and the minimum requirements with the recommendation to always follow best practice and it has been implemented at all of ArcelorMittal’s operations. To ensure good compliance with these principles and to foster continuous improvement of the preventive measures, regular field audits are conducted.
ArcelorMittal Mexico, located in one of the most severely impacted countries at a time, commissioned DNV GL to conduct a comprehensive infection risk assessment and provide recommendations for process improvements regarding COVID-19 exposure at the Lázaro Cárdenas complex in Mexico. Recommendations from the audit were implemented not only in the Mexican operations but they were shared with other operations as well for consideration.
Whilst the clear priority has been the safety and well-being of employees, the Company has been providing support to the extent required in the communities in which it operates (for more details see section Management theme #5: Social).
Safety
The Company-wide safety program, “Journey to Zero”, introduced in 2007, aims to achieve zero fatalities and severe lost-time injuries by creating a culture of shared vigilance in which risks and hazards are understood and monitored, best practices are shared, and appropriate action is taken at every level. The Company's remuneration policy links 10% of the bonuses of its leadership - from managers to the CEO - to safety KPIs (i.e., fatalities, lost-time injury frequency rate ("LTIFR") and frequency rate (FR’)) in the business where he or she works, where relevant. The Company works with trade unions to drive safety improvements through a global partnership, which includes joint local Health and Safety Committees at every production unit and a Global Health and Safety Committee (“GHSC”) which is made up of representatives from both the trade union IndustriALL and union
members from ArcelorMittal, together with senior ArcelorMittal managers. This is supported internally by the ArcelorMittal Health and Safety Council.
It is with deep regret that the Company reported 17 fatalities during 2020, including 14 in steel and 3 in mining operations. Any fatality is a cause of great distress to families, friends, ArcelorMittal's leadership and the entire workforce. The Company's leadership is driving a campaign to ensure that a culture of vigilance and mutual accountability, in which every individual takes responsibility for their own actions, and the actions of those around them, prevails everywhere it operates. ArcelorMittal recognizes that, more than improving its performance against LTIFR, it must work harder to ensure that its safety culture prevents fatalities and serious incidents. There are operations at ArcelorMittal that have gone years without a single injury or death and this proves that zero fatality is possible and that the Company has capabilities to realize this ambition. For example, in South America, with the safety-first culture instilled and leadership trainings implemented, the Company is achieving solid safety performance. The aim is to learn from best performing sites as well as from the Company's external benchmarking exercises. With this in mind, the Company has formed a revised Health and Safety Council of Chief Operating Officers from each business, chaired by the CEO of the segment with the best performance in the Group. It is important each business focuses on peer to peer gap analysis, effective implementation of best practice tools and leading KPIs focused on severe injuries and fatality prevention.
During the year, the Company implemented the following measures:
•The Safety Leadership program and Take Care training continued with remote sessions being introduced due to the COVID-19 pandemic. This program aims at developing the skills of middle and upper management to influence people's safety behavior and improve the safety culture within their teams. It has been implemented over the past years across ArcelorMittal’s European operations and long operations in Latin America;
•Strengthened health and safety policy on vehicles and driving;
•Improved detection, recording, and understanding of hazards and risks through potential severe injuries and fatalities ("PSIF"s) in order to prevent severe incidents;
•Strengthened Health and Safety leadership teams in CIS (Ukraine and Kazakhstan);
•Continued strengthening safety through the use of best practice tools: HIRA-Lite: hazard identification and risk analysis, undertaken before performing any non-standard task; pre-shift safety meetings, shop floor audits.
The LTIFR for the Company, defined as the number of injuries per million hours worked that result in employees or contractors taking time off work, was at 0.61 (0.92 including ArcelorMittal Italia) in 2020 compared with 0.75 in 2019 (1.21 including ArcelorMittal Italia). For comparison, ArcelorMittal recorded an LTIFR of 3.1 incidents per million hours worked in 2007, the year after the Company's formation. The table below shows the LTIFR by segment for the years ended December 31, 2020 and 2019:
| | | | | | | | | | |
| | For the year ended December 31, |
| Lost time injury frequency rate* | | 2020 | | 2019 |
| Mining | | 0.27 | | 1.53 |
| | | | |
| NAFTA | | 0.49 | | 0.51 |
| Brazil | | 0.28 | | 0.34 |
| Europe | | 1.07 | | 1.04 |
| ACIS | | 0.64 | | 0.75 |
| | | | |
| Total | | 0.61* | | 0.75* |
| ArcelorMittal Italia | | 9.46 | | 11.13 |
| Total including ArcelorMittal Italia | | 0.92 | | 1.21 |
*Data does not include the LTIFR for Ilva (subsequently renamed ArcelorMittal Italia) which was acquired on November 1, 2018.
Improving workers’ ability to monitor and analyze PSIFs is also a key focus, as it provides a deeper understanding of how safety incidents can arise and therefore be avoided. Results show that sites with no fatalities proactively detect and manage twice as many PSIFs as sites that have one or more. The volume of proactive PSIFs logged across the Company has increased more than five times since 2016, and 3,600 situations have been proactively detected and addressed in 2020. In addition, the Company is specifically focusing on improving the quality of its analysis and actions, including by sharing best practices across the Company, which has been further facilitated this year through the use of the intra-organization, social networking online tool Yammer.
PSIF is now a KPI for the Company and, alongside fatalities and LTIFR, is reported monthly to leadership as part of the governance process. Health and safety is reviewed by the GHSC and overseen by the ARCGS, which meets quarterly. When a fatality occurs, all levels of management are informed of the circumstances and the incident is subject to a comprehensive review process. The Company supports sites where fatalities have occurred to ensure stronger alignment
between Group-level safety strategy and site-level implementation.
Management Theme #2: Climate change
ArcelorMittal is committed to the objectives of the Paris Agreement. In 2020, the Company announced a group-wide commitment to being carbon neutral by 2050, building on the commitment made in 2019 for its European business to reduce CO2 emissions by 30% by 2030, and be carbon neutral by 2050.
In June 2020, the Company released its ‘Climate Action in Europe’ report, laying out the European roadmap to reach these targets, and is planning to publish the Group's second Climate Action Report in the second quarter of 2021, where it will announce its CO2 emissions reduction target by 2030.
In 2020, the Company also announced the launch of a green steel offer for the first time using a system of certificates. An independent auditor, will verify the tonnes of CO2 savings achieved through the Company’s investment in decarbonization technologies in Europe, in accordance with the GHG Protocol Project Accounting standard. These CO2 savings can then be passed onto customers in the form of verified certificates. The certificates will relate to the tonnes of CO2 saved in total, as a direct result of the decarbonization projects being implemented across a number of its European sites. The certificates can be used by customers to report an equivalent reduction in their Scope 3 emissions, in accordance with the GHG Protocol Corporate Accounting and Reporting Standard.
The Company plans to scale up the offering from 30,000 tonnes in 2020 to reach 120,000 tonnes in 2021 and 600,000 tonnes by 2022.
The Company sees the low-carbon transition as presenting significant opportunities as steel will remain a vital material in the application of new industrial technologies and the transition of the energy, transport and packaging industries, and the future construction sector. ArcelorMittal develops innovative products and processes that help its customers reduce their carbon footprint in all these sectors, including S-in motion® for automotive, Steligence® for construction, and glass granulated blast furnace slag as a low carbon alternative for use in place of cement.
The Company views steel as having many advantages in a decarbonizing world in which demand for materials will continue to grow. Steel is 100% recyclable without quality loss, and in many applications, it is a lower-carbon alternative over its lifecycle than other materials such as aluminum and concrete. However, modelling shows that global stocks of scrap will be insufficient to meet global demand for steel from secondary, recycled sources for many decades to come, so the world will
continue to rely on primary steelmaking for decades to come. Existing primary steelmaking processes are carbon intensive, and therefore the route to decarbonizing steel will be through developing new low-emissions technologies. The Company has identified two pathways to achieving this:
a.The Hydrogen-DRI route, which uses hydrogen as a reducing agent. A demonstration plant in Hamburg, where ArcelorMittal owns Europe’s only operational DRI-EAF plant, is currently planned with a targeted start-up in 2023-2025, depending on funding. The pilot plant will initially produce 100,000 tonnes of pig iron a year. In the short to medium term, the Company could use ‘blue hydrogen’, sourced by extracting hydrogen from natural gas, and capturing and storing the CO2 generated in the process. In the long term, the Company plans to use ‘green hydrogen’, sourced by extracting hydrogen from water via electrolysis using clean energy.
b.The Smart Carbon route is centered around modifying the blast furnace route to create carbon neutral steelmaking through the use of circular carbon - in the form of sustainable biomass or carbon containing waste streams - and carbon capture and use ("CCU") and storage ("CCS"). ArcelorMittal is well advanced on constructing several commercial-scale projects to test and prove a range of Smart Carbon technologies (examples below). Start-up target for key projects is targeted in 2022.
The Company is also collaborating with 11 partners on a project called Siderwin to build a three-meter industrial cell which will test iron ore reduction via electrolysis in Maizières, France. See further information in "—Research and development".
Carbon neutrality in the Smart Carbon route can be achieved by relying on the earth’s natural carbon cycle and making use of biowaste materials, such as sustainable forestry and agriculture residues, to produce bio-energy for steelmaking. Other biomaterials such as waste plastics can also be used, thus helping address the world’s waste challenge. Steelmaking’s carbon by-products can further be converted back into biomaterials at the end of the steelmaking process in a fully circular fashion. Through a process called Torero (€50 million investment), ArcelorMittal will reduce iron ore with waste carbon rather than fossil fuel coal in a demonstration plant in Ghent, Belgium, with production expected to start via reactor #1 in 2022 and reactor #2 in 2024. Meanwhile, the Company’s campus in Dunkirk, France is piloting the IGAR (Injection de Gaz Réformé) project (€20 million investment) which reforms carbon from the blast furnace, converting it into a synthetic gas to reduce iron ore, which is expected to be completed in 2022.
Fossil fuels can continue to be used for steelmaking with carbon neutrality achieved by using CCS, capturing CO2 emissions, transporting them and storing them safely underground. Combining CCS techniques with circular carbon energy sources can even move the steel industry beyond carbon neutrality, and turn steel production into a means to remove CO2 from the atmosphere. The Group's Carbalyst® project, in partnership with LanzaTech, will capture carbon gas and recycle it into chemicals. Pilot plants for both technologies are under construction at the Company’s plant in Ghent, Belgium. An investment of €165 million in Carbalyst® started in 2018 and is expected to be completed in 2022. The technology is expected to capture approximately 15% of available waste gases at the demonstration plant and convert them into 80 million litres of ethanol annually. Also, at ArcelorMittal Dunkirk, the Company is developing a carbon capture and storage pilot project (€20 million investment) to bring down the costs of capturing, purifying and liquifying CO2 from waste gases. The technology is expected to allow capturing 0.5 metric tonnes of CO2 an hour from steelmaking off-gases by 2021. The Company is also involved in the Northern Lights and Porthos carbon transport and storage projects.
These pathways could all lead to low-emissions steelmaking. However, they pose significant challenges in terms of new technology, expanded clean energy infrastructure and infrastructure for the transport and storage of CO2. They also lead to structurally higher costs of steelmaking and therefore, for them to become a reality, the right market conditions are required. The Company has identified five key requirements for the transition to a low-emissions steel industry, and for delivering on the ambitions of the Paris Agreement (see details below).
Through its innovative low-emissions steelmaking program (which is a multi-year budget covering the Company’s low carbon development and demonstration program with partners, aimed at building industrial pilots and demonstrations and is additional to its annual R&D expenditure), ArcelorMittal is actively testing technologies across each of these pathways, and developing a broad portfolio of breakthrough low-carbon steelmaking processes. The Company believes that some of these new technologies could reach commercial maturity before 2025, and that by 2030 many will be mature and partially deployed across its facilities in Europe. They will play a critical role in achieving the Company’s target of a 30% reduction in CO2 emissions in Europe by 2030.
The Company believes that these initiatives present significant opportunities for the decarbonization of steelmaking provided the correct regulatory and investment environment exists.
ArcelorMittal has identified that its most substantial climate-related risk stems from a policy environment that does not
enable the industry to cover the higher structural costs that new low-emissions technologies bring, and it has identified five key requirements for the transition to a low-emissions steel industry, and for delivering on the ambitions of the Paris Agreement.
1. Global level playing field: a global framework to create a level playing field is needed to avoid the risk of carbon leakage. This can be achieved through carbon border adjustments ("CBA"s) or other government interventions, which ensure that steelmakers bearing the structurally higher operating capital costs of low-emissions technologies can compete with imports from higher-emissions steelmakers. This is particularly relevant in Europe, where EU steel producers are increasingly exposed to costs of carbon through the European Emissions Trading Scheme ("ETS"), while imports are exempt yet continue to be responsible for a significant proportion of the carbon emissions of steel used in Europe. The ETC estimates that the total annual investment required to decarbonize the steel industry globally is around $80 billion. A well designed and fair CBA and public and private financing to roll out the technology, would be a big step closer to making this happen.
2. Access to abundant and affordable clean energy: policies giving the steel industry improved access to renewable electricity will be key, as this is currently neither sufficiently available nor economically viable to enable the roll out of low-emissions steelmaking technologies that use this energy source. For the acceleration of technologies using circular carbon energy sources, the steel industry requires priority access to biomass and waste.
3. Facilitating necessary energy infrastructure: in addition to abundant renewable electricity, policies to support investments in hydrogen infrastructure will be needed to advance large-scale hydrogen-based processes. Similarly, for the use of fossil fuels with CCS, policies are required to enable the accelerated development of carbon transport and storage infrastructure and services.
4. Access to sustainable finance for low-emissions steelmaking: the scale of the challenge requires an acceleration of technology development and roll out. Breakthrough steelmaking technologies need to be identified as a key priority area for public funding. Some of the Company's current R&D projects are funded by EU Horizon 2020, and further public funding through, for example, the EU ETS Innovation Fund will be required to continue developing and rolling out low-emissions steelmaking. Finance legislation should enable these investments to make a positive contribution to the low-carbon circular economy, with realistic criteria.
5. Accelerate transition to a circular economy: climate and materials policy should be integrated, taking a lifecycle perspective to ensure that materials are used in as circular a
way as possible. There should be a focus on driving the recycling and reuse of all waste streams, and incentivizing the use of waste streams as inputs in manufacturing processes. Products should be rewarded for their lifecycle reusability and recyclability.
ArcelorMittal is also actively engaging in analyses, with customers, investors, policymakers and global think tanks, on what policy mechanisms could be created to make low-emissions steelmaking more competitive. For example, the Company has been collaborating with the Energy Transitions Commission’s Mission Possible initiative on pursuing net-zero carbon emissions from harder-to-abate sectors, and with the Science-Based Targets initiative (“SBTi”) on the steel sector decarbonization approach. The Company is also an active member of the ETC’s Net Zero Steel Initiative underway in partnership with the World Economic Forum.
ArcelorMittal has also been driving multi-stakeholder efforts through ResponsibleSteel™ to develop standards on greenhouse gas emissions (“GHG”) for steel (see “—Management Theme #3: Customer Reassurance” below).
In addition to new technologies and policy work, ArcelorMittal’s low emissions strategy focuses on energy efficiency in its existing steelmaking operations across the globe, and on expanding opportunities for further steel production using end-of-life scrap. Each year, the Company’s Investment Allocation Committee (“IAC”) approves a number of capital investments that will bring significant energy and carbon efficiency improvements, enabling the Company to meet its medium-term emissions reduction targets. In 2020, the IAC allocated a total of $248 million in capital expenditures to 20 projects with energy and/or carbon benefits to be spent in the coming years.
The Company has once again been recognized by CDP for its strong performance in corporate transparency and action on climate change. ArcelorMittal successfully retained its A- score in the 2020 CDP Climate Change assessment, putting the Company within the top quartile of all metal smelting, refining and forming companies and the top 10% of the steel industry.
The Company has been recognized as a Steel Sustainability Champion for the third year running by the World Steel Association and its "Climate Action Report 1" won the CRRA Award for Best Climate Report in July 2020.
The Company also published its first report on the climate-related policy positions of its membership associations in 2020.
Following the sale of ArcelorMittal Princeton in December 2020, the Company’s sole coal mining operations located in Kazakhstan, Karaganda region, are exploited for the purposes of the Termitau steel plant. External sales of coal from these
mines are negligible and represent less than 0.1% of ArcelorMittal's sales.
Management Theme #3: Customer reassurance
The Company envisions the momentum behind supply chain accountability continuing to grow, with a particular focus on mined raw materials. Consumer-facing brands want to demonstrate responsible sourcing, and customers are joining together to demand, and validate, higher standards in their supply chains, driven by their own due diligence processes. This is expressed through growing demand from the Company's customers for reassurance on environmental and social standards. As a result, ArcelorMittal regards supply chain certification and reassurance as a vital commercial opportunity to forge closer links with customers and believes that taking a leading role in multi-stakeholder engagement is one of the most effective ways to achieve results. It is working with peers in the steel and mining industries, and with other stakeholders, to advance the development of new third-party standards.
To establish a single, global standard for the entire ‘mine-to-metal’ steel value chain, and in response to the strong trend of rising assurance expectations from customers, ArcelorMittal has been playing a leading role in developing ResponsibleSteel™ since 2015. ResponsibleSteel™ is the steel industry’s only global multi-stakeholder certification initiative, which has over 70 members and associates as including steel producers, mining companies, NGOs, steel-consuming customers, financial institutions, and industry bodies. It enables steel producers to prove their production processes and products meet rigorously defined standards across a broad range of social, environmental and ethical criteria. It also improves responsible sourcing of the raw materials used in steelmaking and reduces supply-chain risk.
In November 2019, following a robust accreditation process, ResponsibleSteel™ launched its first site certification standard. The standard presents 12 principles underpinned by over 50 criteria and over 200 auditable requirements, addressing: health and safety, human rights, local communities, biodiversity and GHG among other sustainability and assurance issues. A full product certification standard, which will also cover the mining of raw materials before they arrive on site, and the full chain of custody from mine to site to final customer, has been under development in 2020 and is expected to launch in 2021.
ArcelorMittal has carried out readiness assessments against the ResponsibleSteel™ site standard across nearly all its European flat products production sites with positive results. It is currently working on a site assessment and verification plan and is on track to seek certification for its European Flat sites next year. ArcelorMittal believes that its leading role in the development of ResponsibleSteel™, and its commitment to achieve certification, will enable the Company to improve customer relations,
increase market share among customers already seeking certification, and create demand for certified products.
Reassurance needs to cover the full steel value chain, including sourcing of primary raw materials. This is why ArcelorMittal also plays a leading role in the wider movement towards establishing social and environmental standards for mining that stakeholders recognize and value. As a member of the IRMA, steering committee, ArcelorMittal participates in the multi-stakeholder expert panels shaping its standards. ArcelorMittal mining’s operations in Liberia and Brazil are investigating assessments by IRMA and the intention is to achieve accreditation for these operations in three to five years. The Company is also looking into implementing IRMA across all the mines in the coming years to ensure its customers that all raw materials have been sourced and produced responsibly. Another example is its commitment to the Mining Association of Canada’s Towards Sustainable Mining initiative at its mines in Canada, which helps the Company to monitor and improve performance and customer reassurance.
Both schemes will provide customers, investors and stakeholders with reassurance on sustainability throughout the steel value chain and inform them about the credibility and rigor that has gone into auditing our social and environmental performance at our steel plants and mines. (see description above and "Sustainable development governance" below).
The Company engages directly on responsible supply chain issues with customers from the automotive, rail and other sectors, including construction, household goods and packaging, as well as with initiatives used by customers to share their processes for assessing supply chain risk, such as DRIVE Sustainability, Electronic Industry Citizen Coalition, Railsponsible, EcoVadis and the Green Building Council.
Alongside these multi-stakeholder, customer-focused initiatives, the Company is committed to driving standards in its own supply chain. The Company has been engaging with its key raw materials suppliers and recommending that they follow one of the certification routes. Implementing certification standards in mining is the best way to improve responsible sourcing of the raw materials used in steelmaking and reduce supply-chain risk.
Since 2011, the Company’s Code for Responsible Sourcing has set out minimum standards for its suppliers and described how it will work with suppliers to achieve them. The Company assesses its suppliers against this code every year.
In 2019, the Company continued to ask all new global suppliers to sign the Code and surveyed key suppliers for their implementation of the Code (for example, 96.3% of the Company’s raw materials suppliers have signed the Code).
At the same time, it reinforced its ESG risk mapping analyses, with particular reference to its raw material suppliers. This process aims to identify social and environmental areas of concern, and the key hotspots for further due diligence and engagement with suppliers; the Company is developing action plans where these are needed and encourages all suppliers to take part in certification schemes.
Overall, the Company is also aligned to the Organization for Economic Co-operation and Development (“OECD”) guidelines on due diligence on supply chains, in particular for conflict minerals, which reflect continued concern that some conflicts around the world are being financed by the trade in minerals such as tin, tantalum, tungsten and gold. Only a very limited number of ArcelorMittal products contain tin and tungsten, which are necessary for the functionality or production of certain products. The Company also publishes a Special Disclosure Report in compliance with the US Dodd Frank Act Section 1502, and has done work to meet the requirements of the EU's new conflict minerals regulation.
Management Theme #4: Environment
Behind the SDGs to which ArcelorMittal is committed, is a vision of progress that leaves no-one behind. The Company therefore focuses on making steel in ways that work for society, without creating harmful carbon footprints (as discussed in “Management Theme #2: Climate Change" above), or other negative environmental impacts. The Company aims to meet stakeholders’ expectations around the use of shared resources, particularly natural capital in the form of air, land and water. Operating transparently and responsibly in these areas is essential for retaining stakeholders’ trust.
The Company continues to make significant environmental investments, and in 2020, ArcelorMittal’s IAC has approved expected capital expenditures totaling $396 million relating to 32 projects with environmental benefits.
Some of the challenges affecting air, land and water are global in nature, and ArcelorMittal engages in multi-stakeholder forums aimed at addressing them. Where the issues and the means of addressing them are local, country managers engage with stakeholders at every level, including site-by-site. Before developing any new mine or steel plant, the Company carries out detailed environmental impact assessments, and establishes an environmental management plan. At all existing production sites, it monitors air, water, energy and residue data, and publishes data annually in its Integrated Annual Review and country level sustainability reports.
The Company monitors regulatory developments and aims to be fully compliant with regulatory standards. See “Business overview—Government regulations". The Company also aims to listen to concerns wherever they are raised, and to respond
appropriately, including by acknowledging where its standards have fallen short.
In 2020, the Company’s focus on responding to environmental issues continued to be centered on addressing air quality concerns, managing tailing storage facilities and tailings transition plans, improving land use and biodiversity, responsible water use and reducing waste disposal, as further discussed below.
Addressing air quality concerns
ArcelorMittal understands that air quality is among the most salient issues for the communities around its operations. It is also a continuing focus for regulators, and the Company’s goal is to comply fully with regulatory standards. Although the specific sources of pollutants, particularly in urban and industrial areas, are not always identifiable, the Company aims to listen to concerns wherever they are raised, and to respond appropriately. The Company also continues to make significant environmental investments that address air quality.
In 2020, the following sites raised particular air quality concerns, which were addressed by the Company:
ArcelorMittal USA
The Company worked collaboratively with the U.S. Department of Justice ("DOJ"), the U.S. Environmental Protection Agency ("EPA"), Indiana Department of Environmental Management and Ohio EPA to reach a comprehensive settlement agreement, or consent decree, and resolve Title V air permit issues reflected in Notices of Violations issued in 2011 and 2019. The consent decree resolved Title V air permit issues, the majority of which were self-reported, that occurred at five of the Company’s U.S. facilities - Burns Harbor, Cleveland, Indiana Harbor East and West, and the former Indiana Harbor Long Carbon operation. The Company agreed to pay $5 million to settle the claims. See "Introduction—Key transactions and events in 2020" for a description of the subsequent sale of ArcelorMittal USA.
Kryvyi Rih (Ukraine)
The Company is also responding to concerns raised by local stakeholders in Ukraine and Kazakhstan. In Ukraine, over almost 15 years of operating in Kryvyi Rih, the Company has invested over $5 billion in production development, which resulted not only in improving the Company’s competitiveness but also reduced environmental footprint: total reduction of emissions is over 42% since 2005 (including CO2, Nox and Sox emissions).
ArcelorMittal Kryvyi Rih's strategy to further reduce their environmental impact from dust covers all the main types of production - mining, coke, steelmaking, rolling and sintering. The latter is of key importance, since it accounts for about 75% of the plant's total dust emissions. The Company is planning to
build a pellet plant to replace the sinter plant at the steel production site and sinter plant number 1 located at the mining production site, as well as modernizing sinter plant number 2 located at the mining production site. As a result of these investments, the total volume of pollutant emissions is expected to decrease by 78 thousand metric tonnes per year, as well as decrease of the total volume of CO2 emissions by 800 thousand metric tonnes per year. The commissioning of pellet plant and the future reconstruction of blast furnace No. 9 will make it possible to achieve a significant reduction in coke consumption in sinter-blast process that will also entail a decrease in pollutant emissions. Investments over the next few years in the project to build a new pellet plant will exceed $250 million. The Company has also finished the construction of two modern continuous casting machines and a new rolling mill which will further reduce the environmental footprint of the operations.
Since 2006, over 130 highly efficient gas cleaning plants have been constructed and revamped. From the date of the plant's privatization, total air emissions were reduced by 42.7%, waste water discharge – by 78.4%, waste disposal volume – by 23.7%. In the next 3-4 years, the Company is going to implement significant investment projects, including allocation of $700 million in capital expenditures for projects which include some environmental benefits (including the pellet plant described above), which are an integral part of key investment projects.
Kazakhstan
In Kazakhstan, where emissions and their impact on air quality is the most pressing concern for local communities, ArcelorMittal has built a comprehensive environmental plan with local stakeholders. As part of this plan, the Company has launched a $211 million environmental investment program over 2018-2025. The projects in its scope will result in a series of incremental performance improvements throughout the investment plan’s implementation period to 2025. The program is focused on removing dust from a range of facilities including the lime plant, the coke shop and related processes, the sinter plant, the steel shop, blast furnace 2 and its associated storage area.
In the last three years the Company has implemented ESP for SM 5, phase 1.2 of ash pond extension, dedusting units of sinter plant, BOF mixer, coke plant, construction of new chimney in coke shop along with battery repairs. Implementation of these projects has resulted in dust reduction by 443 tons per annum along with prevention of soil contamination and reduction in fugitive emissions. In the next years, the Company will continue investing in projects with expected reduction of dust emissions by further 3500 (by 4011 including BF#2 dedusting) tons per year.
Managing tailings storage facilities
The Company’s strong governance model has recently been updated to take into account the principles laid out in the Global Industry Standard for Tailings Management. The governance model aims to ensure that our tailings storage facilities ("TSF"s) are structurally sound and safe, with all efforts directed at minimizing the risks of wet tailings.
The Company’s tailings strategy is continually benchmarked against the best industry guidelines: Mining Association of Canada (MAC), Canadian Dam Association (CDA). The Company's strong and evolving governance model aims to ensure that its TSFs are structurally sound and safe, with all efforts directed at minimizing the risks. The Company has 23 TSFs (Tailings Storage Facilities), including dry-stack, paste and in-pit disposals, of which 15 are active, seven inactive and one is in preparation for construction.
To ensure the safety of all of these, and in addition to the local 'Engineer of Record' inspections, ArcelorMittal applies two types of audit: an internal audit at corporate level to assess compliance with the company's standard and an independent audit conducted by an internationally recognised tailings consultant. These are benchmarked against the international guidelines and are considered best practice.
ArcelorMittal is also seeking continuous improvement in its tailings management program to reduce its exposure to risks associated with conventional tailings facilities, principally via:
•The Company is reducing the risk of existing conventional operations by promoting the use of reduced moisture disposal methodologies, such as high density thickened tailings (paste) or filtered tailings where appropriate.
•The Company is using latest and proven new technologies such as high precision radars, remote sensors and InSAR satellite monitoring on all its TSFs to monitor facilities globally in real time.
The Company is currently assessing all its mining operations for transition in line with these principles, and developing customized design solutions for non-conventional tailings system management. ArcelorMittal has already implemented tailings thickening steps in its assets in Mexico, Brazil and Canada, with further studies ongoing across the Company.
The Serra Azul TSF had been dormant since 2012 but in February 2019, following the Brumadinho failure, the stability of the dam was revised, taking into account the failure mode specific to Brumadinho. Based on the results, the Company decided to evacuate the local community downstream of the dam pro-actively as a precaution, enabling the Company to carry out further testing/analysis and safely implement any mitigation measures required by new Brazilian legislation implemented after the Brumadinho accident.
Following an update of the dam break analysis, and adopting the most conservative assumptions, the potential area of impact has been expanded, in order to keep a greater margin of safety. In response, ArcelorMittal relocated 54 families from two communities to temporary homes as a precautionary measure. Monthly emergency payments have been made to the relocated families as well as to people who temporarily lost access to their land – in total 174 families have been directly impacted. For safety reasons, access to the evacuated area continues to be restricted and controlled according to guidance from local authorities.
ArcelorMittal is currently reviewing its approach to safely deconstruct the Serra Azul TSF as per its original plans. Serra Azul is working directly with the public prosecutor’s office in Minas Gerais on this process. Continuous 24/7 monitoring of the tailings storage facility continues via radar, accelerometers, online water level, piezometers and imaging.
Since population downstream evacuation of the Serra Azul Dam in 2019, preventative background studies of the flora, fauna, soil, sediments and constant water resources within the dam break area have been carried out, and in 2020, these studies were intensified according to the demands of environmental agencies.
Improving land use and biodiversity
ArcelorMittal aims to practice good land use management, and to protect biodiversity in the environments where it operates, including through partnerships with local environmental organizations and others to improve and research local biodiversity.
Mining is a key focus both in terms of responsible land management and biodiversity.
ArcelorMittal Liberia ("AML") operates a comprehensive Biodiversity Conservation Program ("BCP") to limit and mitigate the interface with agriculture and mining.
The Nimba Mountains are renowned for their biodiversity, but unfortunately have been impacted over many years by agricultural practices and overhunting, beginning well before the commencement of mining. AML takes its social and environmental responsibilities and stewardship of the land very seriously. The Company’s BCP launched in 2011, has been focused on developing sustainable forest management throughout the area.
The AML BCP process has since its inception, included partnering with authorities and communities to create a healthy ecosystem and sustainable livelihoods across the region. For years, the Company has been working with international NGOs, local authorities and communities while also training and
developing its employees to be part of the program. ArcelorMittal is now partnering with the University of Liberia, local NGOs such as RICCE/ARS and local independent researchers on implementing the BCP.
This shift in strategy to partner with local organizations and interest groups is aligned with the Company's commitment to uplifting the local population by prioritizing working with local stakeholders and building Liberian capacity in environmental management while ensuring the high quality of ArcelorMittal's work.
Some of the projects ArcelorMittal continues working on through the BCP include: East Nimba Nature Reserve ("ENNR") supporting day to day conservation activities and research activities such as reforestation, biomonitoring, capacity building and training; conservation projects with communities neighboring the ENNR; continuation of various activities of conservation agriculture such as farmer schools, lowland farming, dry season vegetables and tree crops programs; and species specific research.
The impact of the Company’s steelmaking activities on biodiversity can be less apparent than mining, given that most steel operations are located in urban areas. Nonetheless, ArcelorMittal runs a range of programs aimed at protecting and enhancing ecosystems. For example, ArcelorMittal Tubarão celebrated 20 years of partnership in the TAMAR project, a Brazilian not for profit organization coordinated by the Chico Mendes Institute for Biodiversity Conservation. The project focuses on the conservation of marine life, particularly by protecting sea turtles from extinction on the Brazilian coastline, including a colony of turtles that call ArcelorMittal Tubarão home.
At Serra Azul, the area of environmental preservation is five times larger than the area destined for the extraction of iron ore. There are more than 1,000 hectares of Atlantic forest, which extend through the municipalities of Itatiaiuçu, Rio Manso, Mateus Leme and Formoso, in the North of Minas.
Another example is at ArcelorMittal USA which, prior to the sale (see "Introduction—Key transactions and events in 2020"), was a founding funder in a new, National Fish and Wildlife Foundation ("NFWF") public-private partnership created in 2018 to support community and habitat resilience in Southeast Michigan. Work supported by the fund improves resilience in the face of intensifying environmental stressors related to development, climate, invasive species, non-point source pollution and other factors. Since 2018, the Southeast Michigan Resilience Fund has awarded 13 grants totaling $2.9 million. Together, these projects are: adding 3.75 million gallons of stormwater storage, restoring and enhancing over 830 acres of wildlife habitat, improving and creating 16 acres of
neighborhood green space and adding 20 new public access points.
Responsible water use
Water is a vital resource to the Company and its stakeholders, and ArcelorMittal aims to be responsible both in the amount of water it consumes, and in the quality of the water discharged by its sites into the environment. Its work in the area is aligned to the UN's SDG 6 (Clean water and sanitation), with particular reference to the target 6.3 on water recycling, target 6.4 on water efficiency, and target 6.5 on water management.
The Company's net water use in steelmaking, defined as the difference between the water it withdraws and the water discharged, is measured, monitored and managed at each site by a dedicated team. In general, steel plants treat and recycle the same intake of water repeatedly, losing water only through evaporation. Water withdrawn from groundwater sources makes up less than 1% of the Company's water intake. Water treatment facilities play a vital role in managing the Company’s emissions to water, and in improving the water efficiency of its operations.
Unlike reducing carbon emissions, which is a global challenge, water use is a more localized issue. Where freshwater is scarce, or when there is a drought, the Company works with local municipal and water authorities to explore the best sources for water, including seawater, rainwater and wastewater from water treatment plants. When issues occur, ArcelorMittal aims to act swiftly and cooperatively with local authorities.
In August 2019, ArcelorMittal Burns Harbor experienced a failure at the pump station for the blast furnace process water recycle system, which is believed to have contributed to the reported excess of Ammonia-N and cyanide at two outfalls and impacted aquatic wildlife near those outfalls. ArcelorMittal Burns Harbor continued to daily sample for cyanide and ammonia and other regulated pollutants prior to the sale see ("Introduction—Key transactions and events in 2020"). The results are provided to the state regulatory authority responsible for water issues. The Company believes the circumstances leading up to the station failure were unique and it worked with regulatory authorities to address issues related to the incident. Significant measures to prevent recurrence of the failure were implemented.
ArcelorMittal Burns Harbor had two permits which imposed monitoring requirements and established certain limits for pollutants regulated under those permits. Any violations of permit requirements are reported to the state water authority. While any instance of non-compliance is concerning, the Company does not believe that the reported noncompliance with the permit requirements reflected systemic issues. Any instances of non-compliance are investigated, and appropriate actions are taken in response.
The Company’s application of new water technologies is responsive to local conditions. For example, at Tubarão Brazil, the Company is constructing an award-winning seawater desalination plant with the aim to increase water security and ensure stability of operations. This innovative $17 million project will collect seawater and transform it into industrial water using the reverse osmosis process. With an initial capacity to produce 12,000 m3/day, and with the potential for subsequent expansion, the plant will provide ArcelorMittal's steelmaking in Tubarão with this guaranteed water source for the future, reducing the use of water resources shared with society. And to further enhance the sustainability and circularity of the project, the energy consumed in the desalination process will be produced by the Tubarão site.
Recognizing the importance of water within ArcelorMittal's business and the surrounding communities, the Company has continued its leadership role in Sustain Our Great Lakes ("SOGL") in 2020, a public-private partnership with the NFWF, U.S. EPA, U.S. Fish and Wildlife Service, U.S.D.A. Forest Service, the National Oceanic and Atmospheric Administration, and U.S.D.A. Natural Resources Conservation Service. SOGL’s mission is to restore and protect fish, wildlife and habitat throughout the basin by leveraging funding, building conservation capacity and focusing partners and their resources on key ecological issues. Since 2006, the program has resulted in a total conservation investment of more than $189 million in the region. These investments have supported the restoration of:
•2,145 stream miles of aquatic connectivity,
•281 miles of stream and riparian habitat,
•228 million gallons of stormwater storage and
•42,878 acres of wetland and associated upland habitat.
ArcelorMittal and its partners have built upon the success of SOGL with the Chi-Cal Rivers Fund. Also a public-private partnership administered by NFWF, the Fund restores the health, vitality and accessibility of the waterways in the Chicago and Calumet region by supporting green stormwater infrastructure, habitat enhancement and public use improvements. Since 2013, the Chi-Cal Rivers Fund has awarded 41 grants totaling $8.3 million, which when combined with $20.2 million in grantee match, has resulted in a total conservation investment of more than $28.5 million in the region. These investments have resulted in:
•5.7 million gallons of additional stormwater storage capacity;
•92 acres of new public park space added or improved; and
•2,900 acres of riparian, wetland and upland habitat enhanced.
The Company seeks to improve water use and the quality of effluent discharge at its mine sites and conducts regular water quality monitoring as standard at all operations. Run-off from the Company's mining operations is treated either chemically or through sediment control dams and tested before being released into surface water bodies or reused elsewhere at the mine.
Where possible, water is reused for processing, for example, as part of the cooling process during pellet production. At AMMC, a multi-year holistic water management project aimed at controlling the surface effluents on the waste rock piles and to achieve compliance with federal regulations is ongoing. This consists of the construction of collector ditches on the perimeter of the waste rock piles and the installation of temporary and permanent water treatment units in Mont Wright and Fire-Lake.
ArcelorMittal Brazil has one of the highest rates of water recirculation amongst Brazilian steelmakers, of approximately 98%. ArcelorMittal João Monlevade, in partnership with the João Monlevade City Hall and the Minas Gerais State University ("UEMG"), installed ecobarriers on the Piracicaba River to retain solid waste from the river, facilitate cleaning and reduce water resource pollution. The collection of the residues will be done weekly and directed to the Association of Cleaning Workers and Recyclable Materials, which will be responsible for the destination of the materials.
Between 2015 and 2017, ArcelorMittal Mineração Serra Azul managed to reduce water consumption by more than 50%, from efficiencies in both mining and processing. The management of water resources at the ArcelorMittal Mineração Serra Azul plant offers high rates of water recirculation in the processing of iron ore. The index (representing the percentage of reused water, that is, water from the production process itself, which was treated by the Company and used again for processing, versus the amount of new water; the higher the percentage the less use of new water) was 87.69% and 82.97% in 2020 and 2019, respectively.
By-products and waste
The Company aims to maximize use of by-products in its own processes with the ambition to eliminate all unnecessary landfilling of residues.
Slag, the main by-product, can be blended in cement, where it reduces CO2 emissions as described below. Cement is in great demand around the world, but its production accounts for over 8% of global carbon emissions. The Company is selling 10-15 million tonnes of blast furnace slag as cement each year, thus saving 8-11 million tonnes of CO2 emissions.
The Company’s partnership with Ecocem is one example of the initiatives being pursued globally to market its blast furnace slag for reuse.
Ecocem's innovative process offers a superior quality, low-carbon alternative by using blast furnace slag, a by-product from steelmaking, to create Ground-Granulated Blast Furnance Slag ("GGBS"). GGBS is a prime example of the circular economy in action. Its declared carbon footprint is only a fraction of traditional cement and, as a construction material, it offers significant technical and architectural advantages such as strength and longevity. And by reusing a steelmaking by-product, it reduces waste, saves energy and emissions, and eliminates the disruption caused to ecosystems by the extraction of fresh raw materials.
By-product is also used as ballast for offshore wind turbines and in road-making, as a fertilizer (it is rich in phosphate, silicate, magnesium, lime, manganese and iron), and in coastal marine blocks that facilitate coral growth. Other by-products include dust and sludge, which are rich in iron and recycled back through the process.
Management Theme #5: Social
ArcelorMittal wants communities to recognize it as a good neighbor, that actively engages with local stakeholders to make a positive contribution in terms of creating economic and social value through employment, procurement, taxation and sustainable development initiatives and through strong risk management and respect for human rights. To do this, the Company understands it must take a partnership approach, listening to the concerns of stakeholders at the site, country and segment levels, to give them the confidence that ArcelorMittal will address the impacts it has on them and their environment.
ArcelorMittal wants to be a pro-active partner in local socio-economic development; one which is trusted to have an open dialogue and find constructive solutions when challenges arise. This approach is an essential part of the Company’s integrated approach to managing risks and impacts, and thus maintaining the Company’s social license to operate.
Direct management of community issues, monitoring of local risks and opportunities and how these are being addressed is led by local operations. In 2019, community dashboards were established with the ARCGS Committee to oversee the significance of a site’s risks and opportunities.
The aim is to use the dashboards to improve performance at sites identified as being at risk, in particular those considered to be high risk. For all sites that are considered ‘high risk’, a deeper dive is performed by the corporate responsibility team, to understand the underlying factors behind the site’s situation. This root cause analysis is used to identify trends and patterns
in the factors behind poor community relations. A similar but less in-depth approach is taken with 'medium risk' sites.
The Company is leading the steel industry’s first global certification standard, ResponsibleSteel, and IRMA for its mining operations, to provide stakeholders with reassurance on sustainability throughout the steel value chain and inform them about the credibility and rigor that has gone into auditing our social and environmental performance at our steel plants and mines. See "Management Theme #3: Customer reassurance" above and "Sustainable Development Governance below".
Responding to the COVID-19 pandemic
Like many in the private sector, the Company has been attempting to harness skills and resources in a useful and collaborative way to help address the challenges presented by COVID-19 and provide social and humanitarian support during this time.
The Company has been collaborating to address the severe lack of the required safety and medical equipment, including face masks and ventilators. Its businesses across the world have collectively donated to various initiatives, including financial donations to healthcare facilities in communities where the Company operates. Where excess capacity existed, the Company was offering space to medical facilities to host additional wards.
For example, ArcelorMittal’s Global R&D New Frontier center responded to the COVID-19 pandemic by focusing on making use of internal know-how and technology to support regional hospitals, healthcare centers and employees. From March to September, 14,540 face shield masks (of which, half were 3D printed) were delivered to ArcelorMittal sites and were donated regionally. ArcelorMittal R&D teams also designed and produced two models of ventilators. Both models obtained the technical approval of the Spanish Drug Agency and Ethical Committee for entering clinical research with COVID-19 patients. Moreover, the R&D team in Asturias, Spain produced and delivered 27 ventilators to Liberia, Brazil and the Dominican Republic.
ArcelorMittal Brazil made a number of contributions to support society as part of its response to the pandemic. In addition to community-based initiatives, it joined the government, class entities and other companies to be part of extensive, collaborative networks to help fight the virus. It contributed over $3.5 million (BRL 18 million) to initiatives across the country. These included a contribution of over $750,000 (BRL 4 million) to the Margarida Hospital in João Monlevade (MG); the repair of mechanical ventilators in partnership with Senai and other large industries; construction of a laboratory in Belo Horizonte to carry out COVID-19 tests; the donation of hygiene materials and hospital supplies in the states of Espírito Santo, Minas Gerais
and Santa Catarina; support in the manufacturing of 150,000 masks for health professionals from Espírito Santo, and 50,000 face shield masks for hospitals in Minas Gerais; the purchase of PCR and rapid tests for the identification of COVID-19 cases; and it launched a fundraising campaign targeted at its employees and family members to donate resources to social entities that serve the community. ArcelorMittal Brazil contributed by matching each donation made.
AMNS India, a joint venture between ArcelorMittal and Nippon Steel (see note 2.4.1 to the consolidated financial statements), collaborated with HMEL, a partnership between Hindustan Petroleum and Mittal Energy Investments, to provide a response package meant to strengthen India’s capacity to protect impacted communities. Both operations committed INR 100 Crores to Prime Minister’s Citizen Assistance and Relief in Emergency Situation Fund (PM-CARES), which provided countrywide relief. In addition, both operations contributed through the support of daily meals for over 5,000 individuals, as well as the provision of food kits to more than 30,000 individuals; increased the number of ambulance services available and prepared care centers near their production facilities; shared knowledge on preventive measures and provided sanitation kits and PPE in the communities in which they operate.
In CIS, the Company worked closely with authorities to contribute medical supplies and equipment. In Ukraine, the Company purchased personal protective equipment for the medical staff of Gorbachevskiy Khersonsk Regional Infectious Diseases Hospital, a facility central to the region ArcelorMittal Kryvyi Rih operates in. It also provided 12,000 protective masks to pharmacies in Kryvyi Rih and made its six ambulances, all fully equipped with personal protective equipment, available to safely transport people with suspected cases of COVID-19. It also purchased three ventilator units for medical facilities in Kryvyi Rih, converted its Kryvyi Rih sanatorium into an observational facility for people in quarantine, and ran online activities to keep children entertained when school is out. In Kazakhstan, the Company made two of its local health facilities available to house up to 450 people who needed to be quarantined. ArcelorMittal Temirtau assumed all expenses for the maintenance of those facilities and for catering for those quarantined there, as well as the doctors who monitored them. It also provided financial support for PCR testing in the Karaganda region, increasing the number of daily tests from 1,200 to 3,000.
In Liberia, the Company contributed urgent medical supplies to the value of $100,000 to Liberia’s Ministry of Health to support the government’s efforts to curb the spread of COVID-19. The Company also procured medical equipment for its own hospitals, which serve its employees and the communities in which it operates. ArcelorMittal has actively ensured that its response is coordinated with that of other stakeholders, with the
overarching goal of decreasing inefficiencies at a time where resources are in short supply and critical.
The Company has also catalyzed collaboration in Liberia and West Africa. When the World Health Organization officially declared COVID-19 a pandemic, ArcelorMittal set up the Liberia and West Africa Private Sector Coronavirus Platform (WAPSCON19), replicating the model created during the Ebola crisis, aiming to share and identify ideas and resources to assist vulnerable communities and business and help governments combat the crisis. The platform brought together interested stakeholders including the World Economic Forum (WEF) and other NGOs, government representatives and companies representing many industries active in the region, totaling 30-40 voices across West Africa. The diversity of players, covering sectors as wide-ranging as natural resources, banking, logistics and even management consultancy, demonstrated the power of collectives like this. The objective of the WAPSCON19 country group was to coordinate the efficient use of resources, be that financial, or in-kind by way of goods and services, to:
•Support communications and community outreach, by raising awareness among the general population of how to recognize COVID-19 symptoms and prevent the spread of the disease, as well as debunking false remedies.
•Help measure the spread of the disease by scaling up testing capacity in local communities and work to minimize under or misdiagnosis of COVID-19 cases, thereby curtailing its spread. Through enhanced data collection and analysis, the private sector can support effective decision making on managing the disease.
•Seek to better manage movement within and between countries to minimize disease transmission over wide areas by localizing testing efforts, while mitigating supply issues arising from border closures by leveraging trusted private sector supply chains to centralize purchasing of goods such as testing kits, life support equipment and personal protective equipment. For instance, ArcelorMittal Liberia worked on bringing in rapid diagnostic tests and was looking at how it can use its supply chains and technical expertise to boost local laboratory capacity, as well as offering up its distribution channels to deliver those tests across the country.
•Support the equitable distribution of medical supplies, including any vaccine.
•Help support economic recovery through continuity of business and employment, to prevent lockdown
measures turning a medical emergency into a humanitarian disaster.
•Seek to leverage any external support which may be available, such as aid from development agencies, including the package offered by USAID (U.S. Agency for International Development).
STEM
Alongside responding to communities’ needs and concerns, the Company’s community investment strategy focuses on developing skills in STEM (science, technology, engineering and mathematics). This reflects the important role scientists and engineers will play in building a sustainable future for society at large, for the steel industry and for the Company. The strategy is delivered in many ways: from providing teaching aids and technological support, through inviting students to steel plants, to the Company's long-term partnerships with leading academic organizations around the world.
For details about human resource related matters and building the workplace of tomorrow, which is part of Management Theme #5: Social, see "Management and employees—Employees".
Sustainable development governance
The Company’s commitment to integrity is enshrined in its code of business conduct and is supported by a comprehensive framework of policies in areas such as human rights, anti-corruption and insider dealing. These reflect the principles and concepts of the UN Global Compact, the OECD Guidelines on Multinational Enterprises and UN Sustainable Development Goal 16 ("Peace, justice and strong institutions"). See also “Management and employees—Corporate governance”.
Listening, learning, respect and transparency are key to the integrity of the Company’s leadership and governance, which helps ensure ArcelorMittal operates effectively and ethically in all parts of the world.
ArcelorMittal considers its relationships with its various stakeholders to be vital to its success. Conducted in the right way, these relationships help the Company know how best to respond to challenges, to anticipate future problems, and to earn trust.
ArcelorMittal’s operations in each country are encouraged to assess their stakeholders' expectations and concerns, in order to inform their approach to the 10 SD outcomes and 5 management themes. Working with customers, suppliers, unions and others can also contribute to UN SDG 17 (Partnership for the goals).
Fully integrating SD into the business is essential to reach the Company’s aim of achieving long-term value for its shareholders and other stakeholders, while maintaining a profitable market share. As discussed above, ArcelorMittal introduced a sustainable development framework including 10 SD outcomes in 2015 and the ARCGS oversees the Company's progress towards these outcomes, as well as the Company's overarching strategy towards SD according to the five management themes described above. The Company's approach to meeting its SD targets includes:
•Key Performance Indicators. A set of KPIs for every business segment to report against, overseen by the ARCGS;
•SD-focused Business Plans. An expectation that SD is integrated into each business segment plan, acting on the relevant SD issues material to its business;
•SD-focused Corporate Initiatives. Developing a ‘mine to metal’ chain of assurances measured against multi-stakeholder environmental and social standards, to provide customers, investors and stakeholders with reassurance on sustainability throughout the steel value chain and inform them about the credibility and rigor that has gone into auditing our social and environmental performance at our steel plants and mines. Corporate initiatives on SD for the benefit of the Group, which include, for example, accelerating progress towards low-carbon steelmaking; innovating steel solutions for a positive SD impact;
•SD-focused Reporting. A robust articulation of the Company’s approach and progress through clear narrative and transparent, third-party assured reporting. In 2020, the Company also continued to deepen its understanding of the relevant risks in its supply chain by strengthening its supply chain risk management and audit processes, focusing on its work to develop ResponsibleSteel™ (see “—Management Theme #3: Customer reassurance” above) at the steel sites and IRMA at the mining sites, both standards aimed at ensuring that both its own sites and its supply chain uphold international human rights, environmental and governance standards.
ArcelorMittal continues to work with external organizations on SD issues, and is a member of the Extractive Industries Transparency Initiative.
In Brazil, where transparency is of particular stakeholder concern, ArcelorMittal partners with the non-governmental organization Transparency International.
ArcelorMittal's human rights policy draws on the UN Universal Declaration of Human Rights, the International Bill of Human Rights, the core conventions of the International Labor
Organization and the UN Global Compact; it also aims to contribute to UN SDG 8 (Decent work and economic growth) focus on decent working conditions, including target 8.7 on modern slavery. The policy includes commitments to workers, local communities and business partners, and covers health and safety, labor rights and the rights of indigenous people. Employees working in relevant functions are required to undertake training in the Company’s policy every three years, and in 2020, 89.5% of the Company’s relevant workforce had completed up-to-date human rights training, down from 90.1% in 2019. Where appropriate, ArcelorMittal provides face-to-face training for employees on human rights. The Company also conducts wider ethical and integrity training: in 2020, 88.5% of ArcelorMittal's employees had completed up to date training in the Code of Business Conduct, and 96.0% had completed their Anti-Corruption training. Training compliance decreased slightly in 2020 due to the unusual working circumstances following the COVID-19 pandemic. The Company will focus on increasing training compliance in 2021.
Products
Information regarding segment sales by geographic area and sales by type of products can be found in note 3 to ArcelorMittal’s consolidated financial statements.
ArcelorMittal has a high degree of product diversification relative to other steel companies. Its plants manufacture a broad range of finished and semi-finished steel products with different specifications, including many complex and highly technical and sophisticated products that it sells to demanding customers for use in high-end applications.
ArcelorMittal’s principal steel products include:
•semi-finished flat products such as slabs;
•finished flat products such as plates, hot- and cold-rolled coils and sheets, hot-dipped and electro-galvanized coils and sheets, tinplate and color coated coils and sheets;
•semi-finished long products such as blooms and billets;
•finished long products such as bars, wire-rods, structural sections, rails, sheet piles and wire-products; and
•seamless and welded pipes and tubes.
ArcelorMittal’s main mining products include:
•iron ore lump, fines, concentrate, pellets and sinter feed; and
•coking and PCI coal.
Steel-making process
Historically, primary steel producers have been divided into “integrated” and “mini-mill” producers. Over the past few
decades, a third type of steel producer has emerged that combines the strengths of both the integrated and the mini-mill processes. These producers are referred to as “integrated mini-mill producers”.
Integrated steel-making
In integrated steel production, coal is converted to coke in a coke oven, and then combined in a blast furnace with iron ore and limestone to produce hot metal. This is then combined with scrap in a converter, which is mainly a basic oxygen or more seldom through a tandem furnace, to produce raw or liquid steel. Once produced, the liquid steel is metallurgically refined and then transported to a continuous caster for casting into a slab, bloom or billet or cast directly as ingots. The cast steel is then further shaped or rolled into its final form. Various finishing or coating processes may follow this casting and rolling. Recent modernization efforts by integrated steel producers have focused on cutting costs through eliminating unnecessary production steps, reducing manning levels through automation, and decreasing waste generation. Integrated mills are substantially dependent upon iron ore and coking coal which, due to supply and demand imbalances, shortening of contract durations and the linkage between contract prices and spot prices, have been characterized by price volatility in recent years.
Mini-mills
A mini-mill employs an electric arc furnace to directly melt scrap and/or scrap substitutes such as direct reduced iron, thus entirely replacing all of the steps up to and including the energy-intensive blast furnace. A mini-mill incorporates the melt shop, ladle metallurgical station, casting, and rolling into a unified continuous flow. Mini-mills are generally characterized by lower costs of production and higher productivity than integrated steel-makers. These attributes are due in part to the lower capital costs and lower operating costs resulting from the streamlined melting process and the more efficient plant layouts of mini-mills. The quality of steel produced by mini-mills is primarily limited by the quality of the metallic raw materials used in liquid steel-making, which in turn is affected by the limited availability of high-quality scrap or virgin ore-based metallics for use in the electric arc furnaces. Mini-mills are substantially dependent on scrap, which has been characterized by price volatility in recent years, and the cost of electricity.
Integrated mini-mills
Integrated mini-mills are mini-mills that produce their own metallic raw materials consisting of high-quality scrap substitutes, such as direct reduced iron. Unlike most mini-mills, integrated mini-mills are able to produce steel with the quality of an integrated producer, since scrap substitutes, such as direct reduced iron, are derived from virgin iron ore, which has fewer impurities. The internal production of scrap substitutes as the primary metallic feedstock provides integrated mini-mills with a
competitive advantage over traditional scrap-based mini-mills by insulating the integrated mini-mills from their dependence on scrap, which continues to be subject to price volatility. The internal production of metallic feedstock also enables integrated mini-mills to reduce handling and transportation costs. The high percentage use of scrap substitutes such as direct reduced iron also allows the integrated mini-mills to take advantage of periods of low scrap prices by procuring a wide variety of lower-cost scrap grades, which can be blended with the higher-purity direct reduced iron charge. Because the production of direct reduced iron involves the use of significant amounts of natural gas, integrated mini-mills are more sensitive to the price of natural gas than are mini-mills using scrap.
Key steel products
Steel-makers primarily produce two types of steel products: flat products and long products. Flat products, such as sheet or plate, are produced from slabs. Long products, such as bars, rods and structural shapes, are rolled from blooms and/or billets.
Flat products
Slab. A slab is a semi-finished steel product obtained by the continuous casting of steel or rolling ingots on a rolling mill and cutting them into various lengths. A slab has a rectangular cross-section and is used as a starting material in the production process of other flat products (e.g., hot-rolled sheet, plates). Slabs are typically between 200 and 250mm thick.
Hot-rolled sheet. Hot-rolled sheet is minimally processed steel that is used in the manufacture of various non-surface critical applications, such as automobile suspension arms, frames, wheels, and other unexposed parts in auto and truck bodies, agricultural equipment, construction products, machinery, tubing, pipe and guard rails. All flat-rolled steel sheet is initially hot-rolled, a process that consists of passing a cast slab through a multi-stand rolling mill to reduce its thickness to typically between 2 and 25 millimeters, depending on the final product. Flat-rolled steel sheet that has been wound is referred to as “coiled”. Alternatively, hot-rolled sheet can be produced using the thin slab casting and rolling process, where the hot-rolled sheet thickness produced can be less than one millimeter. This process is generally used in a flat products mini-mill, but some integrated examples exist as well.
Cold-rolled sheet. Cold-rolled sheet is hot-rolled sheet that has been further processed through a pickle line, which is an acid bath that removes scaling from steel’s surface, and then successively passed through a rolling mill without reheating until the desired gauge, or thickness, and other physical properties have been achieved. Cold-rolling reduces gauge and hardens the steel and, when further processed through an annealing furnace and a temper mill, improves uniformity, ductility and formability. Cold-rolling can also impart various surface finishes and textures. Cold-rolled steel is used in applications that
demand higher surface quality or finish, such as exposed automobile and appliance panels. As a result, the prices of cold-rolled sheet are higher than the prices of hot-rolled sheet. Typically, cold-rolled sheet is coated or painted prior to sale to an end-user.
Coated sheet. Coated sheet is generally cold-rolled steel that has been coated with zinc, aluminum or a combination thereof to render it corrosion-resistant and to improve its paintability. Hot-dipped galvanized, electro-galvanized and aluminized products are types of coated sheet. These are also the highest value-added sheet products because they require the greatest degree of processing and tend to have the strictest quality requirements. Coated sheet is used for many applications, often where exposed to the elements, such as automobile exteriors, major household appliances, roofing and siding, heating and air conditioning equipment, air ducts and switch boxes, as well as in certain packaging applications, such as food containers.
Plates. Plates are produced by hot-rolling either reheated slabs or ingots. The principal end uses for plates include various structural products such as for bridge construction, storage vessels, tanks, shipbuilding, line pipe, industrial machinery and equipment.
Tinplate. Tinplate is a light-gauge, cold-rolled, low-carbon steel usually coated with a micro-thin layer of tin. Tinplate is usually between 0.14 millimeters and 0.84 millimeters thick and offers particular advantages for packaging, such as strength, workability, corrosion resistance, weldability and ease in decoration. Food and general line steel containers are made from tinplate.
Electrical steels. There are three principal types of electrical steel: grain-oriented steels, non-grain oriented fully processed steels and non-grain oriented semi-processed steels. Grain-oriented steels are 3% silicon-iron alloys developed with a grain orientation to provide very low power loss and high permeability in the rolling direction, for high efficiency transformers. Non-grain oriented fully processed steels are iron-silicon alloys with varying silicon contents and have similar magnetic properties in all directions in the plane of the sheet. They are principally used for motors, generators, alternators, ballasts, small transformers and a variety of other electromagnetic applications. A wide range of products, including a newly developed thin gauge material for high frequency applications, are available. Non-grain oriented semi-processed steels are largely non-silicon alloys sold in the not finally annealed condition to enhance punchability. Low power loss and good permeability properties are developed after final annealing of the laminations. These materials are sold under the Newcor and Polycor trademarks.
Long products
Billets/Blooms. Billets and blooms are semi-finished steel products. Billets generally have square cross-sections up to 180 millimeters by 180 millimeters, and blooms generally have square or rectangular cross-sections greater than 180 millimeters by 180 millimeters. These products are either continuously cast or rolled from ingots and are used for further processing by rolling to produce finished products like bars, wire rod and sections.
Bars. Bars are long steel products that are rolled from billets. Merchant bar and reinforcing bar (rebar) are two common categories of bars. Merchant bars include rounds, flats, angles, squares, and channels that are used by fabricators to manufacture a wide variety of products such as furniture, stair railings, and farm equipment. Rebar is used to strengthen concrete in highways, bridges and buildings.
Special bar quality (“SBQ”) steel. SBQ steel is the highest quality steel long product and is typically used in safety-critical applications by manufacturers of engineered products. SBQ steel must meet specific applications’ needs for strength, toughness, fatigue life and other engineering parameters. SBQ steel is the only bar product that typically requires customer qualification and is generally sold under contract to long-term customers. End-markets are principally the automotive, heavy truck and agricultural sectors, and products made with SBQ steel include axles, crankshafts, transmission gears, bearings and seamless tubes.
Wire rods. Wire rod is ring-shaped coiled steel with diameters ranging from 5.5 to 42 millimeters. Wire rod is used in the automotive, construction, welding and engineering sectors.
Wire products. Wire products include a broad range of products produced by cold reducing wire rod through a series of dies to improve surface finish, dimensional accuracy and physical properties. Wire products are used in a variety of applications such as fasteners, springs, concrete wire, electrical conductors and structural cables.
Structural sections. Structural sections or shapes are the general terms for rolled flanged shapes with at least one dimension of their cross-section of 80 millimeters or greater. They are produced in a rolling mill from reheated blooms or billets. Structural sections include wide-flange beams, bearing piles, channels, angles and tees. They are used mainly in the construction industry and in many other structural applications.
Rails. Rails are hot-rolled from a reheated bloom. They are used mainly for railway rails but they also have many industrial applications, including rails for construction cranes.
Seamless tubes. Seamless tubes have outer dimensions of approximately 25 millimeters to 508 millimeters. They are produced by piercing solid steel cylinders in a forging operation
in which the metal is worked from both the inside and outside. The final product is a tube with uniform properties from the surface through the wall and from one end to the other.
Steel sheet piles. Steel sheet piles are hot rolled products used in civil engineering for permanent and temporary retaining structures. Main applications are the construction of quay walls, jetties, breakwaters, locks and dams, river reinforcement and channel embankments, as well as bridge abutments and underpasses. Temporary structures like river cofferdams are made with steel sheet piles. A special combination of H beams and steel sheet piles are sometimes used for the construction of large container terminals and similar port structures.
Welded pipes and tubes. Welded pipes and tubes are manufactured from steel sheet that is bent into a cylinder and welded either longitudinally or helically.
Mining products
ArcelorMittal’s principal mining products and raw material input items for steel operations include iron ore, solid fuels (coking coal and PCI coal), metallics, alloys, base metals, energy and industrial gases.
ArcelorMittal’s mining and raw materials supply strategy consists of:
•Acquiring and expanding production of certain raw materials, in particular iron ore, coal and manufacturing refractory products and developing diverse third-party customer relationships;
•Exploiting its global purchasing reach, pursuing the lowest unit price available based on the principles of total cost of ownership and value-in-use through aggregated purchasing, supply chain and consumption optimization; and
•Leveraging local and low cost advantages on a global scale.
Faced with more volatile raw materials prices in recent years, ArcelorMittal’s priority has been to optimize output and production from its existing sources focused mainly on iron ore and coking coal rather than to further expand its portfolio of mining assets. Iron ore and coking coal are its two most important inputs in the iron-making process.
ArcelorMittal is a party to contracts with other mining companies that provide long-term, stable sources of raw materials. The Company's largest iron ore supply contracts with Vale were renewed in 2017. ArcelorMittal's principal international iron ore suppliers include Vale in Brazil, Cleveland-Cliffs Inc. in the United States (prior to the sale of ArcelorMittal USA - see "—Key transactions and events in 2020"), Metinvest in Ukraine,
Metalloinvest in Russia, Luossavaara-Kirunavaara AB in Sweden, IOC (Rio Tinto Ltd.) and Baffinland iron mine (BIM) in Canada and Sishen in South Africa. ArcelorMittal’s principal coal suppliers include the BHP Billiton Mitsubishi Alliance (“BMA”), Rio Tinto, Anglo Coal, Glencore and Peabody in Australia, Contura and Warrior in the United States, Teck Coal in Canada and Vale in Mozambique.
ArcelorMittal believes that its portfolio of long-term supply contracts can play an important role in preventing disruptions in the production process. (see “Operating and financial review —Economic conditions—Raw materials”).
Iron ore
ArcelorMittal sources significant portions of its iron ore needs from its own captive mines in Kazakhstan, Ukraine, Bosnia, the United States (prior to the sale of ArcelorMittal USA), Mexico and Brazil and from its seaborne iron ore mines in Canada and Liberia. Several of ArcelorMittal’s steel plants also have in place off-take arrangements with mineral suppliers located near its production facilities.
For further information on iron ore production, see“Business overview—Competitive strengths.” For further information on each of ArcelorMittal’s principal iron ore mining operations, see “Properties and capital expenditures—Property, plant and equipment”.
Solid fuels
Coking coal
As with iron ore, ArcelorMittal sources a percentage of its coking coal from its own coal mines in Kazakhstan. The Company’s mines in Kazakhstan supply substantially all of its requirements for its steelmaking operations at ArcelorMittal Temirtau, while the mines in the United States (prior to the sale of ArcelorMittal Princeton) supplied other steel plants within the ArcelorMittal group together with external customers.
For further information on coking coal production, see “Business overview—Competitive strengths.”
Coke
ArcelorMittal has its own coke-making facilities at most of its integrated mill sites, including in Bosnia, the United States (prior to the sale of ArcelorMittal USA), Canada, Mexico, Brazil, Spain, France, Germany, Belgium, Poland, Kazakhstan, South Africa and Ukraine. While ArcelorMittal meets most of its own coke requirements, certain of ArcelorMittal’s operating subsidiaries buy coke from mostly domestic or regional sources to optimize cost savings from transport efficiencies, and certain of its subsidiaries sell, on occasion, excess coke at market prices to third parties. The remainder of the spot purchases of coke are
made from China and Colombia and the United States (prior to the sale of ArcelorMittal USA).
Other raw materials and energy
Metallics (scrap)
ArcelorMittal procures the majority of its scrap requirements locally and regionally, optimizing transport costs. Typically, scrap purchases are made in the spot market on a monthly/weekly basis or with short-term contracts.
Alloys
ArcelorMittal purchases its requirements of bulk and noble alloys from a number of global, regional and local suppliers on contracts that are linked to generally-accepted indices or negotiated on a quarterly basis.
Base metals
The majority of the Company’s base metal needs, including zinc, tin, aluminum and nickel are purchased under annual volume contracts. Pricing is based on the market-accepted indices. Material is sourced from both local and global producers.
Electricity
ArcelorMittal generally procures its electricity through tariff-based systems in regulated areas such as parts of the United States and South Africa, through direct access to markets in most of its European mills or through bilateral contracts elsewhere. The duration of these contracts varies significantly depending on the area and type of arrangement.
For integrated steel mills, plant off-gases from various process steps are utilized to generate a significant portion of the plant’s electricity requirements and lower the purchase volumes from the grid. This is either produced by the plant itself or with a partner in the form of a co-generation contract.
Natural gas
ArcelorMittal procures much of its natural gas requirements for its Canadian and Mexican operations (and prior to the ArcelorMittal USA Transaction, its US operations) from the natural gas spot market or through short-term contracts entered into with local suppliers, with prices fixed either by contract or tariff-based spot market prices. For its European and Ukrainian operations, with a contractual mix of “all-in” bilateral supply and direct access to the market, ArcelorMittal sources its natural gas requirements under the prevailing mix of oil-based pricing systems and European short term/spot-indexed supply contracts. The remainder of ArcelorMittal’s natural gas consumption represents approximately 20% of ArcelorMittal’s total consumption and is generally sourced from regulated markets.
Industrial gases
Most of ArcelorMittal’s industrial gas requirements are produced and supplied under long-term contracts with various suppliers in different geographical regions.
Shipping
ArcelorMittal Shipping ("AM Shipping") provides ocean transportation solutions to ArcelorMittal’s manufacturing subsidiaries and affiliates. AM Shipping determines cost-efficient and timely approaches for the transport of raw materials, such as iron ore, coal, coke and scrap, and semi-finished and finished products. AM Shipping is also responsible for providing shipping services to the Company’s sales organizations. It provides complete logistics solutions from plants to customer locations using various modes of transport.
In 2020, AM Shipping arranged transportation for approximately 54.90 million tonnes of raw materials and about 9.97 million tonnes of finished products. The key objectives of AM Shipping are to ensure cost-effective and timely shipping services to all units. AM Shipping acts as the coordinator for the Company's joint venture with DryLog, a Monaco based Shipping Company.
Purchasing
ArcelorMittal has implemented a global procurement process for its major procurement requirements, including raw materials, capital expenditure items, energy and shipping. ArcelorMittal’s centralized procurement teams also provide services such as optimization of contracts and the supply base, logistics and optimizing different qualities of materials suitable for different plants and low cost sourcing.
By engaging in these processes, ArcelorMittal seeks to benefit from economies of scale in a number of ways, including by establishing long-term relationships with suppliers that sometimes allow for advantageous input pricing, pooling its knowledge of the market fundamentals and drivers for inputs and deploying specialized technical knowledge. This enables ArcelorMittal to achieve a balanced supply portfolio in terms of diversification of sourcing risk in conjunction with the ability to benefit from a number of its own raw materials sources.
ArcelorMittal has institutionalized the “total cost of ownership” methodology as its way of conducting its procurement activities across the Group. This methodology focuses on the total cost of ownership for decision making, with the goal of lowering the total cost of production through minimization of waste, improved input material recovery rates and higher rates of recycling.
Sales and marketing
In 2020, ArcelorMittal sold 69.1 million tonnes of steel products.
Sales
The majority of steel sales from ArcelorMittal are destined for domestic markets. For these domestic markets, sales are usually approached as a decentralized activity that is managed either at the business unit or at the production unit level. For certain specific markets, such as automotive, there is a global approach offering similar products manufactured in different production units around the world. In instances where production facilities are in relatively close proximity to one another, and where the market requirements are similar, the sales function is aggregated to serve a number of production units. In the EU region and in South America, ArcelorMittal owns a large number of service and distribution centers. Depending on the level of complexity of the product, or the level of service required by the customer, the service center operations form an integral part of the supply chain to ArcelorMittal’s customers. Distribution centers provide access to ArcelorMittal’s products to smaller customers that cannot or do not want to buy directly from the operating facility.
The Group prefers to sell exports through its international network of sales agencies to ensure that all ArcelorMittal products are presented to the market in a cost-efficient and coordinated manner.
Sales are executed at the local level, but are conducted in accordance with the Group’s sales and marketing and code of conduct policies.
For some global industries with customers in more than one of the geographical areas that ArcelorMittal serves, the Company has established customized sales and service functions. This is particularly the case for the automotive industry. Sales through this channel are coordinated at the Group level with respect to contract, price and payment conditions.
Marketing
Marketing follows the sales activity very closely and is by preference executed at the local level. In practice, this leads to a focus on regional marketing competencies, particularly where there are similarities among regional markets in close geographical proximity. Local marketing provides guidance to sales on forecasting and pricing. At the global level, the objective is to share marketing intelligence with a view towards identifying new opportunities, either in new products or applications, new product requirements or new geographical demand. Where a new product application is involved, the in-house research and development unit of ArcelorMittal is involved in developing the appropriate products.
An important part of the marketing function at ArcelorMittal is to develop short-range outlooks that provide future perspectives on the state of market demand and supply. These outlooks are shared with the sales team in the process of finalizing the sales
strategy for the immediate future and with senior management when market conditions call for production adjustments.
Globally, sales and marketing activities are coordinated to ensure a harmonized approach to the market. The objective is to provide similar service experiences to all customers of ArcelorMittal in each market.
Insurance
ArcelorMittal maintains insurance policies to cover physical loss or damage to its property and equipment on a reinstatement basis arising from a number of specified risks, including certain natural disasters, such as earthquakes, floods or windstorms, acts of terrorism and certain consequential losses, including business interruption arising from the occurrence of an insured event under the said policies.
ArcelorMittal also purchases worldwide third-party public and product liability insurance coverage for all of its subsidiaries.
Various other types of insurance are also maintained, such as comprehensive construction and contractor insurance for its greenfield and major capital expenditures projects, directors and officers liability, transport, and charterers’ liability, as well as other customary policies such as car insurance, travel assistance and medical insurance.
Each of the operating subsidiaries of ArcelorMittal maintains various local insurance policies that are mandatory at the local level, such as employer liability, workers compensation and auto liability, as well as specific insurance such as public liability to comply with local regulations.
In addition, ArcelorMittal maintains trade credit insurance on receivables from selected customers, subject to limits that it believes are consistent with those in the industry, in order to protect it against the risk of non-payment due to customers’ insolvency or other causes. Not all of ArcelorMittal’s customers are or can be insured, and even when insurance is available, it may not fully cover the exposure.
ArcelorMittal believes that its insurance coverage is in line with industry practice and sufficient to cover normal risks in its operations. Notwithstanding the insurance coverage that ArcelorMittal and its subsidiaries carry, the occurrence of an event that causes losses in excess of limits specified under the relevant policy, or losses arising from events not covered by insurance policies, could materially harm ArcelorMittal’s financial condition and future operating results.
Intellectual property
ArcelorMittal owns and maintains a patent portfolio covering processes and steel products, including uses and applications that it creates, develops and implements in territories throughout
the world. Such patents and inventions primarily relate to steel solutions with new or enhanced properties, as well as new technologies that generate greater cost-efficiencies.
ArcelorMittal also owns trademarks, both registered and unregistered, relating to the names and logos of its companies and the brands of its products. ArcelorMittal has policies and systems in place to monitor and protect the confidentiality of its know-how and proprietary information. The Company applies a general policy for patenting selected new inventions, and its committees organize an annual patent portfolio screening by individuals from the Company’s R&D and business sectors in order to optimize the global efficiency of the Company’s patent portfolio. The Company’s patent portfolio includes more than 9,500 patents and patent applications, mostly recent and medium term, for more than 706 patent families, with 79 inventions newly-protected in 2020. Because of this constant innovation, the Company does not expect the lapse of patents that protect older technology to materially affect current revenue.
In addition to its patent portfolio, ArcelorMittal is constantly developing technical know-how and other unpatented proprietary information related to design, production process, and use of high quality steel products, leading to development of new applications or to improvement of steel solutions proposed to its customers, such as the ones aiming at weight reduction for vehicles. ArcelorMittal has also been granted licenses for technologies developed by third parties in order to allow it to propose comprehensive steel solutions to its customers. ArcelorMittal is not aware of any pending lawsuits alleging infringement on others’ intellectual property rights that could materially harm its business.
Government regulations
ArcelorMittal’s operations are subject to various regulatory regimes in the regions in which it conducts its operations. The following is an overview of the principal features of the Company's regulatory regimes, as of December 31, 2020, that affect or are likely to affect the Company's operations.
See “Risk factors” and note 9.3 to ArcelorMittal’s consolidated financial statements.
Environmental laws and regulations
ArcelorMittal’s operations are subject to a broad range of laws, directives and regulations relating to air emissions, surface and groundwater protection, wastewater storage, treatment and discharges, the use and handling of hazardous or toxic materials, waste management, recycling, treatment and disposal practices, the remediation of environmental contamination, the protection of soil, biodiversity and ecosystems or rehabilitation (including in mining). As these laws and regulations in the EU and other jurisdictions continue to become more stringent,
ArcelorMittal expects to expend substantial resources including operating and capital expenditures to achieve or maintain ongoing compliance. Further details regarding specific environmental proceedings involving ArcelorMittal, including provisions to cover environmental remedial activities and liabilities, decommissioning and asset retirement obligations are described in notes 9.1 and 9.3 to ArcelorMittal’s consolidated financial statements.
ArcelorMittal anticipates that its expenditures with respect to environmental matters in the EU over the next several years will relate primarily to installations of additional air emission controls, to requirements imposed in the course of renewal of permits and authorizations, including those pursuant to ongoing implementation of Directive 2010/75/EU of November 24, 2010 on Industrial Emissions, respecting achievement of NOx and SO2 limits when using liquid and gaseous fuels (including iron and steel process gases) in boilers, gas engines and gas turbines, and to address GHG issues, including the reduction of emissions and purchase of allowances.
In relation to ArcelorMittal Italia, certain environmental obligations (decontamination and environmental capital expenditures) regarding the Taranto plant of the previous owners have been transferred to ArcelorMittal Italia, which operates the Taranto plant as lessee and, as such, is required to implement an “environmental plan”. This will require significant capital investments by ArcelorMittal Italia, which to such end would also rely on the support of its shareholders, which upon closing of the investment agreement may be in the form of, among other things, funds coming from Invitalia’s investment, see note 9.4 to the consolidated financial statements for further information. Significant issues that need to be addressed include reduction of diffuse dust emissions (from storage yards) and channeled emissions (such as sinter primary de-dusting system and coke plant de-dusting systems), the treatment of process waste waters and implementation of rain water collection, separation and treatment. Following the Amendment Agreement, ArcelorMittal Italia continues to be subject to these obligations and will submit a request to amend the environmental plan to reflect the contents of the new industrial plan, with the approval of such amendment a condition precedent to the closing under the Ilva Agreement.
Environmental requirements impacting industrial operations also are becoming more stringent in other jurisdictions. For example, in Canada, ArcelorMittal has incurred considerable investments for emissions reductions required by the national regulation addressing Criteria Air Contaminants, which covers steel sector, emissions of NOX, SO2, VOCs and fugitive particulates, and further investments will be needed including installation of full coke oven gas desulphurization at ArcelorMittal Dofasco by December 31, 2025. Provincial regulations in Ontario and Quebec also will be requiring further emissions reductions of
SO2, particulates and other pollutants. Permits for water discharges in Canada are becoming more stringent and it is possible that ArcelorMittal Dofasco may be required to treat for ammonia discharge from its Primary Water Treatment Plant to the Hamilton Harbor. In Kazakhstan, beginning in 2025, complex ecological permits for emissions into the environment will impose more stringent emissions standards and also outline measures for reducing emissions (production improvements). In South Africa, the National Environmental Management: Air Quality Act, 39 of 2004 (“NEM:AQA”) introduced strict air emission standards introduced impacting ArcelorMittal’s coke making and other operations.
ArcelorMittal’s mining activities also are subject to increasingly stringent environmental and safety requirements. For example, in Brazil, the state of Minas Gerais has issued decrees and resolutions requiring extraordinary audits of tailings dams, generating increased costs for compliance and a number of surveillance visits from federal and state agencies (environment, geology and police departments). Furthermore, the Brumadinho accident has triggered new environmental rules for mining activities with increased restrictions on waste management and tailings dams, including an August 2019 resolution from the National Mining Agency that establishes regulatory measures to ensure the stability of mining dams, and that requires the Serra Azul mine to complete the works of the existing dam stabilization system or the construction of a new downstream containment structure by September 15, 2021, and to complete the de-characterization of the dam by September 15, 2022. In Québec Canada, renewed depollution permits that will apply to AMMC and ArcelorMittal Long Products Canada are under negotiation and are expected to establish more stringent targets for water, air, soil and waste management, as well as the monitoring and reporting frequencies and requirements, including implementation of a storm water treatment system at the AMMC pellet plant and assessment of former EAF dust stock pile site restoration and former slag management areas at ArcelorMittal Long Products Canada. Other required investments include a water management multi-year project aimed at controlling the surface effluents on the waste rock piles and achieving compliance with the applicable federal regulation on the metal and diamond mines effluent regulations and implantation of a decree issued in August 2018 for the tailings expansion consisting of construction of a water containment basin (B+ basin) and the new tailings impoundments and more restrictive environmental goals at the final mine effluent for total suspended solids, metals and nitrates.
It is difficult to fully assess the extent to which additional operating or capital expenditures will be required to comply with pending or recently-enacted amendments to environmental laws, directives and regulations or what effect they will have on the Company’s business, financial results or cash flow from
operations. In 2020, ArcelorMittal approved 32 multi-year projects with identified environmental benefits and expected capital expenditures of $396 million and 20 multi-year projects with the identified energy benefits and expected capital expenditures of $248 million. See also further information on key environmental projects in "—Sustainable development" and "—Capital expenditure projects".
Industrial emissions regulation: climate change
In December 2015, 195 countries participating in the United Nations Framework Convention on Climate Change (“UNFCC”), at its COP21 held in Paris, adopted a global agreement on the reduction of climate change (the “Paris Agreement”). The Paris Agreement sets a goal to limit the increase in global average temperature to well below 2 degrees Celsius and pursues efforts to limit the increase to 1.5 degrees Celsius, to be achieved by getting global GHG emissions to peak as soon as possible. The Paris Agreement consists of two elements: a legally binding commitment by each participating country to set an emissions reduction target, referred to as “nationally determined contributions” or “NDCs”, with a review of the NDCs that could lead to updates and enhancements every five years beginning in 2023 (Article 4) and a transparency commitment requiring participating countries to disclose in full their progress (Article 13). The majority of countries have issued their intended NDCs.
ArcelorMittal’s activities in the 27 member states of the EU are subject to the EU Emissions Trading Scheme (“EU-ETS”), which was launched in 2005 pursuant to European Directive 2003/87/EC, relating to GHG emissions. The EU-ETS is based on a cap and trade principle, setting a cap on GHG emissions from covered installations that is then reduced over time. Within this cap, companies receive emission allowances which they can sell to or buy from one another as needed. The limit on the total number of allowances available ensures that they have a value. The Commission implemented the current Phase 3 of the EU-ETS, which ran through 2020, in a manner that increased costs for the Group to obtain sufficient emission allowances for its European operations depending on steel production levels and the market price of emission allowances. The EU is implementing its more stringent Phase 4 EU-ETS for the 2021 to 2030 period in a manner that may require ArcelorMittal to incur additional costs to acquire emissions allowances. In particular, further implementation rules are expected to reduce current benchmark and free allocation levels could result in an increase of marginal production costs by approximately €40 per tonne (assuming a price of €25/tCO2) , which would put the European steel industry at a significant disadvantage versus global competition (see notes 6.3 and 9.1 to the consolidated financial statements). The EU also is implementing a revised Renewable Energy Directive, along with revised renewable energy targets for 2030, to support Europe's commitment to complete clean energy transition and meet the goals set by the Paris
Agreement. In December 2019, the Commission presented the Communication on The European Green Deal announcing several upcoming legislative proposals for the EU 2050 climate neutrality objective and to increase the EU 2030 GHG emissions reduction target, which on December 11, 2020 the Commission announced it was setting at 55% (increased from the earlier 50%) compared to 1990 levels. On September 17, 2020 the Commission presented the communication on stepping up Europe’s 2030 ambition and the proposal for regulations establishing the framework for achieving climate change neutrality, indicating the ambition to reach a 55% reduction of GHG in 2030 compared to 1990 levels. To achieve this, the EU is revising its relevant climate-related policy instruments with proposals to be presented by June 2021.
GHG emissions regulations are being implemented in an increasing number of other jurisdictions where ArcelorMittal operates. For example, in South Africa, legislation to tax carbon dioxide emissions was adopted and came into effect in 2019. In Kazakhstan, where the Emission Trading Scheme restarted operation on January 1, 2018 with new trading procedures and allocation methods supported by an online platform for monitoring, reporting and verifying emission sources and greenhouse gases. In the United Kingdom, ArcelorMittal’s activities are subject to the Carbon Reduction Energy Efficiency Scheme. In Canada, Ontario operations are currently subject to output based pricing system regulations until a new emissions performance standard which has been accepted is transitioned which is expected to be effective January 1, 2022 or retroactively to January 1. 2021. A cap and trade program is in effect in Quebec with a second more stringent compliance period becoming effective in 2021, a federal backstop program consisting of a fossil fuel levy and an emissions based pricing system applies in provinces without approved GHG regulations, and clean fuel standards are to come into effect in 2022 and 2023. In Mexico and Brazil, new regulatory initiatives are being discussed by the different government authorities. Ukraine has approved the concept of implementing a state policy in the sphere of climate change for the period until 2030 that will create and implement an internal trading system for greenhouse gas emission quotas.
ArcelorMittal is closely monitoring local, national and international negotiations, regulatory and legislative developments and is endeavoring to reduce its own emissions where appropriate.
Health and safety laws and regulations
ArcelorMittal’s operations are subject to a broad range of laws and regulations relating to the protection of human health and safety. As these laws and regulations in the United States, the EU and other jurisdictions continue to become more stringent, ArcelorMittal expects to expend substantial amounts to achieve or maintain compliance. See “Risk factors—Legal and
regulatory risks—ArcelorMittal is subject to strict environmental, health and safety laws and regulations that could give rise to a significant increase in costs and liabilities.” ArcelorMittal has established health and safety guidelines requiring each of its business units and sites to comply with all applicable laws and regulations. Compliance with such laws and regulations and monitoring changes to them are addressed primarily at the business unit level. ArcelorMittal has a clear and strong health and safety policy, aimed at reducing on a continuing basis the severity and frequency of accidents; through its Health & Safety Council and Management Committee, the Company reinforces the penetration of the safety culture in the Company. The effective policy outlines the commitment ArcelorMittal has made to the health and safety of all employees and reinforces the accountability of the local management and encourages the continuous improvement in health and safety performance at unit level, which permits the Health & Safety Council and Management Committee to define and track performance targets and monitor results from every business unit and sites. See "Business overview—Sustainable development—Management Theme #1: Health and safety" for further information.
Foreign trade
ArcelorMittal has manufacturing operations in many countries and sells its products worldwide. In 2020, certain countries and communities, such as Canada, the European Union, Egypt, India, Mexico, Philippines, South Africa, Thailand, Turkey, and the United States of America continued or launched investigations into whether to impose/continue imposing trade remedies (usually anti-dumping or safeguard measures) against injury, or the threat thereof, caused by increasing steel imports originating from various steel producing countries.
Under both international agreements and the domestic trade laws of most countries, trade remedies are available to domestic industries where imports are “dumped” or “subsidized” and such imports cause injury, or a threat thereof, to a domestic industry. Although there are differences in how trade remedies are assessed, such laws have common features established in accordance with World Trade Organization (“WTO”) standards. Dumping involves exporting a product at a price lower than that at which the same or similar product is sold in the home market of the exporter, or where the export prices are lower than a value that typically must be at or above the full cost of production (including sales and marketing costs) plus a reasonable amount for profit. Subsidies from governments (including, among others, grants and loans at artificially low interest rates) are similarly actionable under certain circumstances. The trade remedies available are typically (i) an antidumping duty order where injurious dumping is found and (ii) a countervailing duty order or suspension agreement where injurious subsidization is found. Normally, the duty is equal to
the amount of dumping or subsidization that is generally imposed on the imported product (other than in the European Union where the lesser duty rule is applied). Accordingly, such orders and suspension agreements do not prevent the importation of a product, but rather require that either the product be priced at a non-dumped level or without the benefit of subsidies, or that the importer pay the difference between such dumped or subsidized price and the actual price to the government as a duty.
Safeguard measures are addressed more generally to a particular product, irrespective of its country of origin, to protect domestic production against serious injury caused by unforeseen, sharp and sudden increase of imports.
All WTO members are required to review antidumping duty and countervailing duty orders every five years to determine if they should be maintained, revised or revoked. This requires a review of whether the dumping or subsidization is likely to continue or recur if the order/suspension agreement is revoked and whether a domestic industry in the country is likely to suffer the continuation or recurrence of the injury within the reasonably foreseeable future if the orders are revoked. If the government finds dumping or subsidization and the injury is likely to continue or recur, then the orders continue. In the case of safeguard measures enduring for greater than three years, all WTO members are required to review the imposed measures in the mid-term of the relevant measure. After a review, safeguard measures may be extended if they continue to be required, but the total period for the application of safeguard measures may not exceed eight years.
Final affirmative determinations were reached in anti-circumvention petitions filed in September 2016 by U.S. industry related to cold rolled coil and corrosion resistant steel from China (via Vietnam) and affirmative preliminary decisions have been reached in similar petitions filed by U.S. industry in June 2018 related to cold rolled coil and corrosion resistant steel imports from Korea and Taiwan (through Vietnam), with duties applied based on the exporters’ certification of the source of the substrate. Similarly, the European Commission started a circumvention investigation in July 2019, concerning the EU anti-dumping measures on imports of cold rolled steel from China, and the resolution was published in the Official Journal on August 4, 2020, extending the duties to the modified products.
In a number of markets in which ArcelorMittal has manufacturing operations, it may be the beneficiary of trade actions intended to address trade distortions consistent with WTO regulations, such as the examples mentioned above. In other situations, certain operations of ArcelorMittal may be a respondent to antidumping and countervailing duty cases and its exported products might be subject to antidumping and countervailing duties or other
trade restrictions, for example antidumping duties imposed in 2017 by the Egyptian government against rebar imports from Ukraine, Turkey and China affecting exports from ArcelorMittal operations in Ukraine.
USA Section 232:
On March 23, 2018, after a section 232 national security investigation with respect to steel imports, the Trump Administration imposed tariffs of 25% on steel products from all but a select list of countries, with a temporary suspension applied for Canada, Mexico, Argentina, South Korea, Brazil and the EU until May 1, 2018. Since then, Australia has obtained a full exemption, imports from Argentina, Brazil, and South Korea are subject to annual quotas, and steel imports from the EU remain subject to the 25% tariff. In addition, as of May 16, 2019, Turkish imports are subject to a 25% tariff after having been subject to 50% tariffs since August 2018. Tariffs on imports of steel products from Canada and Mexico were eliminated on May 17, 2019, which led to positive impacts in the Company’s NAFTA business units; imports from Canada and Mexico are monitored to identify if imported volumes surge meaningfully beyond historic levels. On August 28, 2020, President Trump closed the fourth quarter of 2020 Brazilian quota (no further imports allowed) on semi-finished steel although the Company received an expedited exclusion to import 40,000 metric tons of semi-finished steel in the fourth quarter; the 2021 quota will revert to the original aggregate 3.5 million tonnes volume.
The USA Section 232 tariffs have triggered concerns of trade deflection worldwide and several countries initiated domestic remediation measures. On March 26, 2018, the EU Commission opened ex-officio a safeguard investigation on 26 products (including 19 long, flat and stainless steel products and 7 tubes and other steel products). On July 18, 2018, the EU Commission published provisional measures which entered into force on July 19, 2018 based on global tariff quotas with a 100% quota based on average imports over the past 3 years on 23 product categories. Imports that exceeded the above quotas would face a 25% tariff but certain 'developing' countries were exempt when their import share was below 3%. The EU’s provisional safeguard measures were replaced by definitive safeguard measures approved by EU member states on January 16, 2019 and went into effect on February 2, 2019, which cover the full steel product scope, setting country-based quotas for larger importers on all product categories, except for hot rolled (global), and quarterly quota calculations for residual volumes of all products. The measures also include three phases of 5% quota relaxations in February 2019, July 2019 and July 2020, which can be adapted to market conditions for each product individually. Countries subject to quotas have an incentive to frontload the consumption of their national quota in order to benefit from the residual quotas in the final quarter of the period, thus ensuring full quota consumptions. In July 2019,
the EU commission completed a review investigation of these safeguard measures and proposed modifications, which were implemented on October 1, 2019. The main changes include:
•a reduction of quotas to 3% (from the 5% quotas applicable since July 1, 2019),
•inclusion of additional countries in the developing country quota list which had met the 3% import levels,
•a quarterly cap of 30% of the HRC global applicable to each country's total import cap for hot rolled coil, and
•a 30% cap applicable to the last quarter per period of a country's total cap on wire rod and rebar imports, as well as a new requirement that end users (product purchasers) validate any imports of category 4B products (hot dip galvanized products used in the auto industry).
In February 2020, the EU Commission started a second review of the EU Steel Safeguards to consider adjustments to the tariff-rate quota considering changes since the last review in 2019. On June 12, 2020, Member States voted in favor of the Commission’s revised measures. These were implemented from July 1, 2020.The main changes include:
•Quarterly management of country specific quotas;
•Country-specific quotas for hot rolled flat products ("HRF");
•Access to residual quotas prohibited for organic coated, wire rod, gas pipes, and cold finished bars;
•Access to residual quotas more restricted for most long products; and
•30% cap per country accessing the residual quotas for hot dip galvanized 4B (automotive grade material) and HRF in the fourth quarter of 2020.
ArcelorMittal welcomed the changes approved to the final safeguard measures in Europe, however the Company considers that the applicable relaxation clauses, which increase the level of quotas currently in place, still weaken the efficiency of these measures considering the current conditions of the market.
In response to the measures adopted by the U.S. and the EU, Turkey opened a safeguard investigation on May 2, 2018 with provisional measures effective as of October 17, 2018. Turkey’s safeguard investigation on iron and steel products, which was supposed to be concluded by January 26, 2019, was extended for six months, i.e., until July 26, 2019, with provisional safeguard measures that remained in effect until May 5, 2019.
The investigation covered hot-rolled, cold-rolled, coated, hot-dipped galvanized, bars and rods, angles, shapes and sections, wire rod, rails, tubes and hollow profiles and stainless steel and the provisional measures were in the form of a free tariff quota with 25% duties. Such investigation was terminated on May 7, 2019 without permanent safeguard measures being imposed. In Canada, as a result of the opening of a safeguard investigation on certain flat and long products, provisional measures were put in place on October 25, 2018 in the form of quotas and a 25% tariff on steel imports. Final safeguard measures were subsequently implemented in relation to plate and stainless wire, but not rebar, hot rolled, prepaint, wire rod and energy tubulars. The Eurasian economic union led by Russia also opened a safeguard investigation on August 7, 2018 covering some flat steel products only and on August 8, 2019, safeguard measures covering hot-rolled steel were put in place, imposing 20% tariffs above relevant quotas.
Key currency regulations and exchange controls
As a holding company, ArcelorMittal is dependent on the industrial franchise fees from, earnings and cash flows of, and dividends and distributions from, its operating subsidiaries to pay expenses, meet its debt service obligations, pay any cash dividends or distributions on its ordinary shares or conduct share buy-backs. Significant cash or cash equivalent balances may be held from time to time at subsidiaries where repatriation of funds may be affected by tax and foreign exchange policies, including in Argentina, Brazil, China, Kazakhstan, South Africa, Ukraine and Venezuela. Such policies are briefly summarized below; however, none of these are currently significant in the context of ArcelorMittal’s overall liquidity.
Argentina
The Argentinian foreign exchange market is regulated by the Argentine Central Bank ("BCRA"). The BCRA allows the local currency to free-float against the USD, however, capital controls have reduced volatility in an effort to provide stability to the currency. The Argentinian peso (“ARS”) is not fully convertible and is most commonly traded as a non-deliverable forward (NDF), both onshore and offshore. As of July 1, 2018, Argentina has been considered a hyperinflationary economy. Since the re-imposition of capital controls in September 2019, local restrictions on obtaining foreign currencies have tightened, requiring the BCRA's approval for all transfers to and from the local market for companies and for financial outflows, such as dividend payments. The BCRA has set a limit of 5 days for exporters to convert foreign currency, while institutions will need authorization of the bank to buy USD in the foreign exchange market, except in the case of foreign trade, according to a statement from the BCRA. In September 2020, the BCRA intensified Forex regulation once again, instituting a 30% tax on purchases made abroad and restricting withdrawals to USD 200
per month. See also note 2.2.2 to the consolidated financial statements.
Brazil
The central bank of Brazil operates a managed floating foreign exchange regime, although intervention has become more regular in recent years. The Brazilian real is fully deliverable onshore (i.e., physical settlement of the designated currency at maturity), but is non-deliverable offshore. With proper documentation, the repatriation of registered invested capital and remittance of profits do not require prior approval from the central bank of Brazil. Profits can be freely remitted as dividends or as interest on capital to foreign shareholders or portfolio investors.
China
China’s foreign exchange regime has undergone significant liberalization in recent years. The People’s Bank of China (“PBOC”) maintains the Chinese renminbi in a managed float with reference to a basket of currencies. The CNY, which refers to the Chinese renminbi on the onshore market, is partially convertible and has a non-deliverable offshore market. All transactions involving foreign exchange are strictly controlled by the State Administration of Foreign Exchange. The CNH, which is the Chinese renminbi traded offshore, became deliverable in Hong Kong in July 2010. The CNH can generally be transferred freely between offshore accounts and interaction with the onshore market is growing, although transfers of CNH from Hong Kong to onshore China are subject to regulations and approval by the PBOC. Moreover, in July 2020, integration of the interbank and exchange bond markets, as well as wider participation in the treasury bond futures market, suggest that more progress is likely to be made by the PBOC to move for more internalization of the Chinese market.
India
The Reserve Bank of India ("RBI") maintains the Indian rupee (“INR”) in a managed floating regime. The INR is partially convertible and has a non-deliverable offshore market. Onshore deliverable forwards are also available out to 10 years. The most common tenor with the best liquidity in the forwards market is one year or less. The INR is convertible for exports and imports of goods and services as well as unilateral transfers, including repatriating profits from foreign-funded companies, as well as for daily recurring transactions in the ordinary course of business. However, the INR is restricted on the capital account (purchase and sale transactions of foreign assets and liabilities) and there are specific transactions that have to be authorized by the RBI or other relevant government departments for routine capital account transactions, e.g. foreign currency borrowings under the approval route or foreign direct investments that are not permitted under the automatic route. Other permitted capital account transactions that are allowed, subject to compliance with local applicable regulations, include foreign direct
investment, foreign currency loans and bonds, securities and equity investments overseas. In April 2020, the RBI issued final guidelines on “Hedging of foreign exchange risk by Residents and Non-Residents”. The simplified guidelines are expected to have a positive material impact on product suite, procedures and requirements for hedging requests which will impact both local and global franchises.
Kazakhstan
In August 2015, the National Bank of Kazakhstan devalued the Kazakhstan tenge and introduced a free-floating exchange rate with an inflation targeting regime. The National Oil Fund conducts open market operations to finance economic programs, hence the current exchange rate regime may be best described as a managed float. Liquidity in foreign exchange markets is limited and mainly non-deliverable forwards are traded on offshore markets. There are no restrictions on tenge convertibility, but domestic legal entities must state their reasons for buying foreign currency and may only trade with authorized banks.
South Africa
The South African Reserve Bank operates a managed floating exchange rate system. The South African rand (“ZAR”) is deliverable and largely convertible, and the reserve bank is gradually relaxing exchange rate controls. Since January 1, 2014, companies may apply for approval to establish a holding company to hold their offshore investments. Subject to certain conditions, listed companies may place ZAR 3 billion per year with such holding companies, which can be transferred offshore without exchange control approval, and unlisted companies may transfer ZAR 2 billion per year.
Ukraine
The National Bank of Ukraine ("NBU") is responsible for the country’s monetary policy. The exchange rate system has gone through significant liberalization during 2018-2019, though currency control for foreign currency purchases still remains in place. Deliverable forwards and foreign currency swaps are allowed on the onshore market, with an improvement in liquidity. Non-deliverable forwards are not allowed onshore, however the local market is still in a preparatory phase. On the offshore market, UAH Non-Deliverable Forwards are traded with good liquidity from both sides, with tenors of up to 1 year. Since August 2016, foreign investors are entitled to repatriate profits, income or other funds relating to investments without any restrictions, after the payment of applicable taxes. In 2019, the NBU lifted all restrictions for dividends on securities, assets repatriated by corporates, decreases in share capital or exits from local legal entities.
Venezuela
Venezuela’s foreign exchange regime has been characterized by governmental devaluation and legislative changes. DICOM is
the country’s official exchange rate. On August 20, 2018, the bolivar soberano ("VES") replaced the bolivar fuerte ("VEF") at a rate of 1 VES to 100,000 VEF. The only way to convert the VES is through the DICOM rate, which sets an exchange limit of €340,000 per month for domestic legal entities. Since September 7, 2018, currency purchase and sale transactions can be freely converted by direct agreement between the parties, provided they do so through the exchange operators of the Central Bank, however, the Central Bank of Venezuela can intervene in these operations whenever it deems necessary to avoid distortions of the exchange value of the national currency. Since this regime's effective date, the foreign exchange market has been characterized by limited existence of customers and transactions for insignificant amounts. Transactions are allowed on a non-deliverable offshore market, but liquidity is very limited.
Disclosure pursuant to Section 219 of the Iran Threat Reduction & Syria Human Rights Act (ITRA) ArcelorMittal’s business with customers in Iran
Section 219 of the Iran Threat Reduction and Syria Human Rights Act of 2012 added Section 13(r) to the U.S. Securities Exchange Act of 1934, as amended (the Exchange Act). Section 13(r) requires an issuer to disclose in its annual reports whether it or any of its affiliates knowingly engaged in certain activities, transactions or dealings relating to Iran. Disclosure is required even where the activities, transactions or dealings are conducted outside the United States by non-US persons in compliance with applicable law, and whether or not the activities are sanctionable under US law.
In 2020, neither ArcelorMittal nor any of its affiliates engaged in activities, transactions or dealings relating to Iran triggering disclosure under Section 13(r).
ArcelorMittal continues to monitor developments in this area, in particular the status of U.S. Sanctions, the Joint Comprehensive Plan of Action ("JCPOA") and EU Sanctions, and the expansion of the EU Blocking Regulation (Council Regulation (EC) 2271/96). ArcelorMittal carefully monitors political risk and sanctions exposure and has procedures and systems in place intended to manage those risks.
However, ArcelorMittal’s business is subject to an extensive, complex and evolving regulatory framework. It is possible that ArcelorMittal may face conflicting obligations or risks under U.S. direct and secondary sanctions and the EU Blocking Regulation, or other conflicting instruments. Despite its governance, compliance policies and procedures and continuous efforts to comply with all applicable sanctions regimes, its systems and procedures may not always prevent the occurrence of violations which may lead to regulatory penalties or cause reputational harm to operating subsidiaries, joint ventures or associates. See “Risk factors.”
Organizational structure
ArcelorMittal is a holding company with no business operations of its own. All of ArcelorMittal’s significant operating subsidiaries are indirectly owned by ArcelorMittal through intermediate holding companies. The following chart represents the operational structure of the Company, including ArcelorMittal’s significant operating subsidiaries and not its legal or ownership structure.
*On December 9, 2020, the Company completed the sale of ArcelorMittal USA. See "—Key transactions and events in 2020" and note 2.3.1 to the consolidated financial statements.
** On December 10, 2020, the Company signed a binding agreement with Invitalia, an Italian state-owned company to form a public-private partnership between the parties. As a result, the carrying amount of the assets and liabilities of ArcelorMittal Italia was classified as held for sale at December 31, 2020 and ArcelorMittal Italia will be accounted for under the equity method upon closing of the first Investment from Invitalia (expected to be in the first quarter of 2021). See "Introduction—Key transactions and events in 2020" and note 2.3.2 for further information.
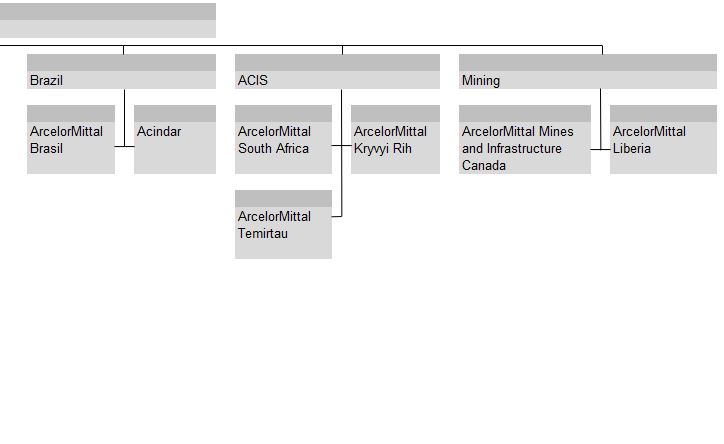
Please refer to the "Glossary - definitions, terminology and principal subsidiaries" for a listing of the Company’s principal subsidiaries, including country of incorporation. Please refer to note 2.2.1 of the consolidated financial statements for the ownership percentages of these subsidiaries. Unless otherwise stated, the subsidiaries as listed have share capital consisting solely of ordinary shares, which are held directly or indirectly by the Company and the proportion of ownership interests held equals to the voting rights held by the Company.
Investments accounted for under the equity method ArcelorMittal has investments in entities accounted for under the equity method as detailed in note 2.4 to ArcelorMittal’s consolidated financial statements. The Company's key investments in joint ventures are AMNS India, Calvert and VAMA for which the Company holds 60%, 50% and 50%, respectively. See section “Property, plant and equipment—Investments in joint ventures” for further details.
Reportable segments
ArcelorMittal reports its business in the following five reportable segments corresponding to continuing activities: NAFTA, Brazil, Europe, ACIS and Mining.
NAFTA produces flat, long and tubular products. Flat products include slabs, hot-rolled coil, cold-rolled coil, coated steel products and plate and are sold primarily to customers in the following sectors: automotive, energy, construction packaging and appliances and via distributors and processors. Flat product facilities are located at seven integrated and mini-mill sites located in three countries. Long products include wire rod, sections, rebar, billets, blooms and wire drawing. Long production facilities are located at three integrated and mini-mill sites located in three countries. In 2020, shipments from NAFTA totaled 17.9 million tonnes. The raw material supply of the NAFTA operations includes sourcing from iron ore captive mines in Mexico and iron ore and coal captive mines the United States (until disposal of ArcelorMittal USA on December 9, 2020 as mentioned above) to supply the steel facilities.
Brazil produces flat, long and tubular products. Flat products include slabs, hot-rolled coil, cold-rolled coil and coated steel. Long products comprise sections, wire rod, bar and rebars, billets and wire drawing. In 2020, shipments from Brazil totaled 9.4 million tonnes. The raw material supply of the Brazil operations includes sourcing from iron ore captive mines in Brazil.
Europe produces flat, long and tubular products. Flat products include hot-rolled coil, cold-rolled coil, coated products, tinplate, plate and slab. These products are sold primarily to customers in the automotive, general and packaging sectors. Flat product facilities are located at 12 integrated and mini-mill sites located
in five countries. Long products include sections, wire rod, rebar, billets, blooms and wire drawing. Long product facilities are located at 10 integrated and mini-mill sites in seven countries. In addition, Europe includes downstream solutions, which provides primarily distribution of long and flat products as well as value-added and customized steel solutions through further processing to meet specific customer requirements. In 2020, shipments from Europe totaled 32.9 million tonnes. The raw material supply of Europe operations includes sourcing from iron ore captive mines in Bosnia & Herzegovina.
ACIS produces a combination of flat, long and tubular products. It has five flat and long production facilities in three countries. In 2020, shipments from ACIS totaled 9.9 million tonnes, with shipments made on a worldwide basis. The raw material supply of the ACIS operations includes sourcing from iron ore captive mines in Kazakhstan and Ukraine and coal captive mines in Kazakhstan.
Mining provides the Company's steel operations with high quality and low-cost iron ore reserves and also sells mineral products to third parties. Seaborne iron ore mines are located in North America and Africa. In 2020, iron ore production totaled approximately 28.3 million.
Properties and capital expenditures
Property, plant and equipment
ArcelorMittal has steel production facilities, as well as iron ore and coal mining operations, in North and South America, Europe, Asia and Africa.
All of ArcelorMittal's operating subsidiaries are substantially owned by ArcelorMittal through intermediate holding companies, and are grouped into the five reportable segments described above. Unless otherwise stated, ArcelorMittal owns all of the assets described in this section.
For further information on environmental issues that may affect ArcelorMittal’s utilization of its assets, see “Business overview—Government regulations”, "Business overview—Sustainable development" and note 9.3 to ArcelorMittal’s consolidated financial statements.
The Company acted swiftly and rapidly to adapt production in-line with the reduced demand environment caused by the COVID-19 pandemic which started to affect the Group’s main operations from the middle of the first quarter of 2020 onwards. Production was impacted across all segments and regions.
Steel production facilities of ArcelorMittal
The following table provides an overview by type of steel facility of the principal production units of ArcelorMittal’s operations. While all of the Group’s facilities are shown in the tables, only the facilities of significant subsidiaries are described textually for each segment. The facilities included in the tables are listed from upstream to downstream in the steel-making process.
| | | | | | | | | | | | | | | | | | | | |
Facility 3 | | Number of Facilities 3 | | Capacity (in million tonnes per year)1 3 | | Production in 2020 (in million tonnes)2 3 |
| Coke Oven Battery | | 60 | | 31.0 | | 18.5 |
| Sinter Plant | | 28 | | 93.4 | | 52.8 |
| Blast Furnace | | 47 | | 89.0 | | 53.4 |
| Basic Oxygen Furnace (including Tandem Furnace) | | 63 | | 92.8 | | 58.2 |
| DRI Plant | | 12 | | 8.6 | | 5.3 |
| Electric Arc Furnace | | 32 | | 26.8 | | 14.6 |
| Continuous Caster—Slabs | | 42 | | 85.1 | | 49.6 |
| Hot Rolling Mill | | 19 | | 73.2 | | 42.2 |
| Pickling Line | | 30 | | 32.9 | | 12.9 |
| Tandem Mill | | 34 | | 40.5 | | 21.3 |
| Annealing Line (continuous / batch) | | 43 | | 19.9 | | 8.5 |
| Skin Pass Mill | | 26 | | 16.0 | | 6.3 |
| Plate Mill | | 10 | | 5.3 | | 1.9 |
| Continuous Caster—Bloom / Billet | | 33 | | 32.5 | | 19.8 |
| Breakdown Mill (Blooming / Slabbing Mill) | | 2 | | 6.7 | | 2.2 |
| Billet Rolling Mill | | 3 | | 2.6 | | 0.7 |
| Section Mill | | 22 | | 12.2 | | 6.0 |
| Bar Mill | | 21 | | 8.2 | | 5.2 |
| Wire Rod Mill | | 16 | | 10.5 | | 6.6 |
| Hot Dip Galvanizing Line | | 52 | | 20.8 | | 13.2 |
| Electro Galvanizing Line | | 11 | | 2.0 | | 0.7 |
| Tinplate Mill | | 15 | | 3.1 | | 1.6 |
| Tin Free Steel (TFS) | | 2 | | 0.4 | | 0.1 |
| Color Coating Line | | 17 | | 2.8 | | 1.6 |
| Seamless Pipes | | 4 | | 0.5 | | 0.1 |
| Welded Pipes | | 76 | | 4.7 | | 0.8 |
1.Reflects design capacity and does not take into account other constraints in the production process (such as, upstream and downstream bottlenecks and product mix changes). As a result, in some cases, design capacity may be different from the current achievable capacity.
2.Production facility details include the production numbers for each step in the steel-making process. Output from one step in the process is used as input in the next step in the process. Therefore, the sum of the production numbers does not equal the quantity of sellable finished steel products.
3.On December 9, 2020, ArcelorMittal completed the sale of ArcelorMittal USA’s operations- four integrated facilities, two mini-mills, six downstream and two coke-making facilities, see note 2.3.1 to the consolidated financial statements and “Introduction—Key transactions and events in 2020". The number of lines and their respective capacities, as well as their production through the transaction closing date are included in the table above.
Mining operations of ArcelorMittal
The Company has two types of mining operations namely captive mines and seaborne oriented operations. Captive mines whose production is fully consumed by their respective steel segments form part of such segments. The seaborne iron ore mining operations at AMMC and ArcelorMittal Liberia Ltd correspond to the Mining segment.
| | | | | | | | | | | | | | | | | | | | | | | | | | |
| NAFTA | | | | | | Crude Steel | | |
| Steel operations | | | | | | | | |
| Unit | | Country | | Locations | | Production in 2020 (in million tonnes per year)1 | Type of plant | Products |
| | | | | | | | |
| ArcelorMittal USA ² | | USA | | Warren, OH | | n/a | Coke-Making | Coke |
| ArcelorMittal USA ² | | USA | | Monessen, PA | | n/a | Coke-Making | Coke |
| ArcelorMittal USA ² ³ | | USA | | East Chicago, IN | | 3.4 | Integrated | Flat |
| ArcelorMittal USA ² | | USA | | Burns Harbor, IN | | 3.6 | Integrated | Flat |
ArcelorMittal USA 2 5 | | USA | | Cleveland, OH | | 2.0 | Integrated | Flat |
| ArcelorMittal USA ² | | USA | | Riverdale, IL | | 0.6 | Integrated | Flat |
| ArcelorMittal USA ² | | USA | | Coatesville, PA | | 0.2 | Mini-mill | Flat |
| ArcelorMittal USA ² | | USA | | Columbus, OH | | n/a | Downstream | Flat |
| I/N Tek ² | | USA | | New Carlisle, IN | | n/a | Downstream | Flat |
| ArcelorMittal USA ² | | USA | | Conshohocken, PA | | n/a | Downstream | Flat |
| ArcelorMittal USA ² | | USA | | Weirton, WV | | n/a | Downstream | Flat |
ArcelorMittal USA 2 4 | | USA | | Gary, IN | | n/a | Downstream | Flat |
| Double G ² | | USA | | Jackson, MS | | n/a | Downstream | Flat |
ArcelorMittal Dofasco 6 | | Canada | | Hamilton | | 2.7 | Integrated, Mini-mill | Flat |
| ArcelorMittal Mexico | | Mexico | | Lázaro Cárdenas, Celaya | | 3.6 | Mini-mill, Integrated, and Downstream | Flat, Long/ Bar, Wire Rod |
| ArcelorMittal Long Products Canada | | Canada | | Contrecoeur East, West | | 1.6 | Mini-mill | Long/ Wire Rod, Bars, Slabs |
| ArcelorMittal USA ² | | USA | | Steelton, PA | | 0.1 | Mini-mill | Long/ Rail |
| ArcelorMittal Tubular Products | | Canada | | Brampton | | n/a | Downstream | Pipes and Tubes |
| ArcelorMittal Tubular Products | | Canada | | London | | n/a | Downstream | Pipes and Tubes |
| ArcelorMittal Tubular Products | | Canada | | Woodstock | | n/a | Downstream | Pipes and Tubes |
| ArcelorMittal Tubular Products | | Canada | | Hamilton | | n/a | Downstream | Pipes and Tubes |
| ArcelorMittal Tubular Products | | USA | | Shelby | | n/a | Downstream | Pipes and Tubes |
| ArcelorMittal Tubular Products | | USA | | Marion | | n/a | Downstream | Pipes and Tubes |
| ArcelorMittal Tubular Products | | Mexico | | Monterrey | | n/a | Downstream | Pipes and Tubes |
| | | | | | | | | | | | | | | | | | | | | | | | | | | | | | | | |
| Captive mining operations | | | | | | | | | | |
| Unit | | Country | | Locations | | ArcelorMittal Interest (%) | | Type of Mine | | Product |
Minorca Mines 2 | | USA | | Virginia, MN | | 100.0 | | Iron Ore Mine (open pit) | | Pellets |
Hibbing Taconite Mines 2 | | USA | | Hibbing, MN | | 62.3 | | Iron Ore Mine (open pit) | | Pellets |
| ArcelorMittal Mexico (excluding Peña Colorada) | | Mexico | | Sonora, Sinaloa and Michoacán | | 100.0 | | Iron Ore Mine (open pit) | | Concentrate, lump and fines |
| ArcelorMittal Mexico Peña Colorada | | Mexico | | Minatitlán | | 50.0 | | Iron Ore Mine (open pit) | | Concentrate and pellets |
ArcelorMittal Princeton 2 | | USA | | McDowell, WV, Tazewell, VA | | 100.0 | | Coal Mine (surface and underground) | | Coking and PCI coal |
1.Note: n/a = not applicable (no crude steel production).
2.On December 9, 2020, ArcelorMittal completed the sale of ArcelorMittal USA’s operations, including all facilities listed above - four integrated facilities, two mini-mills, six downstream, two coke-making facilities and the U.S. mining operations, see note 2.3.1 to the consolidated financial statements and “Introduction—Key transactions and events in 2020". Their production is included in the table through the transaction closing date.
3.Referred to as Indiana Harbor. ArcelorMittal USA idled its #3 blast furnace at Indiana Harbor in November 2019.
4.The rolling mill in Gary has been permanently idled. The facility only does heat treating.
5.Cleveland's 84 Inch Temper Mill was permanently idled in 2020.
6.ArcelorMittal Dofasco idled HDG lines #1&2 in 2017 and permanently discontinued their operation in 2019.
Production for the second quarter of 2020 in the NAFTA segment was impacted by the COVID-19 pandemic.
After the restrictions were imposed by the local government in Canada, impacting the construction and automotive markets, the Company took action to reduce production in late March both for flat products (blast furnace#3 banked and reduced production rhythm) and long products (stoppage in Contrecoeur West and slab production in Contrecoeur East) which returned in June.
In the U.S., in the first quarter of 2020, the Company announced the safe and orderly temporary blow down of blast furnace #6 at Cleveland and blast furnace #4 at Indiana Harbor with the necessary precautions taken to preserve the assets for future production. Following the gradual improvement in demand, particularly automotive, ArcelorMittal restarted blast furnace #4 at Indiana Harbor during the third quarter and blast furnace #D at Burns Harbor following repairs undertaken mid-July.
ArcelorMittal Dofasco
ArcelorMittal Dofasco (“Dofasco”) is a leading North American steel solution provider and Canada’s largest manufacturer of flat rolled steels. Dofasco’s steel-making plant in Hamilton, Ontario is adjacent to water, rail and highway transportation. The plant uses both integrated and EAF-based steelmaking processes. Its products include hot-rolled, cold-rolled, galvanized and tinplate. Dofasco supplies these products to the automotive, construction, packaging, manufacturing, pipe and tube and steel distribution markets.
ArcelorMittal USA
On December 9, 2020, ArcelorMittal completed the sale of ArcelorMittal USA’s operations, including four integrated facilities, two mini-mills, six downstream and two coke-making facilities, listed in the table above and described below.
ArcelorMittal USA mainly produced flat products at its steelmaking facilities located at Indiana Harbor, Burns Harbor, Cleveland, Riverdale and Coatesville.
Indiana Harbor is a fully integrated steelmaker, strategically located on the southern shore of Lake Michigan in East Chicago, Indiana and benefits from Great Lakes shipping as well as highway and railroad transportation access. The Indiana Harbor facilities produce hot-rolled sheet, cold-rolled sheet and hot dip galvanized sheet for use in automotive, appliance, service center, tubular, strip converters and contractor applications.
Burns Harbor is strategically located on Lake Michigan in northwestern Indiana approximately 50 miles southeast of Chicago, Illinois. The area allows for shipping access to the Port of Indiana-Burns Harbor, as well as highway and railroad access. Burns Harbor produces hot-rolled sheet, cold-rolled sheet, hot dip galvanized sheet and steel plate for use in automotive, appliance, service center, construction and shipbuilding applications.
The Cleveland facility is located on the Cuyahoga River in Cleveland, Ohio with access to the Port of Cleveland and Great Lakes shipping, as well as highway and railroad transportation routes. The Cleveland plant serves the automotive, service centers, converters and tubular applications markets.
The Riverdale facility is located near the Indiana border in Riverdale, Illinois, with access to Lake Michigan, and highway and railroad networks. It produces hot-rolled strip for strip converter and service center applications, and obtains supplies of hot metal for its basic oxygen furnaces from the Burns Harbor or Indiana Harbor locations.
The Coatesville facility is located in Pennsylvania and produces plate products for use in rail transportation, pipes & tubes and distribution segments. The Conshohocken facility (which has been idled except for heat treating operations since August 2018) and the Gary facility provide heat treating of plates produced at either Burns Harbor or Coatesville.
ArcelorMittal USA had standalone finishing facilities in Weirton, West Virginia making tin products and in Columbus, Ohio making coated products. It had coke plants at Burns Harbor and Warren that supply coke to its production facilities.
ArcelorMittal USA, through various subsidiaries, owned interests in joint operations, including (i) I/N Tek L.P. (60% interest), a cold-rolling mill near New Carlisle, Indiana; (ii) Double G Coatings (50% interest), a coating line producing galvanized and Galvalume steel near Jackson, Mississippi, and (iii) Hibbing Taconite Company, which is described under “—Mining” below, all of which were included in the sale to Cleveland-Cliffs. The Company retained its interest in the Calvert joint venture (see "—Investments in joint ventures" below).
ArcelorMittal Mexico
ArcelorMittal Mexico produces both flat and long steel products and operates an integrated route and EAF route using DRI. It produces higher quality slabs for use in specialized steel applications in the automotive, line pipe manufacturing,
shipbuilding and appliance industries. It is also one of the largest single rebar and wire rod production facilities in Mexico and mainly uses the integrated route for steelmaking. The facility is located in Lazaro Cardenas in the Michoacán state by the Pacific coast and is highly accessible by ocean, rail, and other means. It also operates a rebar mill at Celaya with billets sourced from the Lazaro facility.
ArcelorMittal Long Products Canada
ArcelorMittal Long Products Canada is the largest mini-mill in Canada and has the flexibility to use either DRI or scrap, depending on their respective economics. It produces wire rods, wire products and bars, primarily sold in Canada and the United States and principally serves the automotive, appliance, transportation, machinery and construction industries. It also produces slabs that are used within ArcelorMittal.
ArcelorMittal USA Iron Ore Mines
ArcelorMittal USA operated an iron ore mine through its wholly-owned subsidiary ArcelorMittal Minorca and owned a majority stake in Hibbing Taconite Company, which was managed by ArcelorMittal USA from August 12, 2019 (previously managed by Cleveland-Cliffs Inc). The mining operations of ArcelorMittal USA, including all subsidiaries and investments, were sold to Cleveland-Cliffs on December 9, 2020 as referenced above.
ArcelorMittal Minorca held the mineral rights on more than 2,800 acres necessary to mine the stated reserves. Minorca's owned/leased lands increased to approximately 17,478 acres, which includes 4,039 acres of leased land and takes into account the purchase of 160 acres of land in Meadowlands, MN for construction of wetlands as required by the State of Minnesota. The operations are located approximately three kilometers north of the town of Virginia in the northeast of Minnesota, which are accessible by road and rail. The Minorca Mine controls through leases, all the mineral and surface rights needed to mine and process its estimated 2020 iron ore reserves. The expiration dates of the mining leases range from 2035 to 2056. ArcelorMittal Minorca operated a concentrating and pelletizing facility, along with two open pit iron ore mines - Laurentian, and East Pits - located 12 kilometers from the processing facilities. The processing operations consist of a crushing facility, a three-line concentration facility and a single-line straight grate pelletizing plant. The Minorca pelletizing facility produced 2.7 million metric tonnes of taconite pellets in 2020. Pellets are transported by rail to ports on Lake Superior. Lake vessels are used to transport the pellets to Indiana Harbor. The Minorca taconite plant was constructed and operated by Inland Steel from 1977 until 1998 when it was purchased by then ISPAT International, a predecessor company of ArcelorMittal.
The Hibbing Taconite Company owns 30,561 acres and holds mineral rights over 7,465 acres through mineral leases, which are located mainly within the City of Hibbing with a processing
facility located five kilometers north of the town center in the northeast of Minnesota and which is accessible by road and rail. The Hibbing operations were jointly owned by subsidiaries of ArcelorMittal USA (62.3%), Cleveland-Cliffs Inc. (23.0%) and U.S. Steel (14.7%), with ArcelorMittal USA as the managing agent of the mine and processing facilities. The Hibbing Taconite Company, through leases, controls the mineral and surface rights needed to mine and process its estimated 2020 iron ore reserves. The expiration dates of the mining leases range from 2022 to 2056. These leases can be renewed through negotiations with the mineral owners, though no obligations to renew exist for the mineral owners. The operations consist of open pit mining, crushing, concentrating and pelletizing. The finished pellets are then transported by rail to the port of Allouez at Superior, Wisconsin, a distance of 130 kilometers, and then over the Great Lakes by lake vessels to ArcelorMittal’s integrated steelmaking plants, principally Burns Harbor. The Hibbing Taconite Company began operating in the third quarter of 1976.
As a result of the reduction in internal requirements due to the COVID-19 pandemic, the Hibbing operations were idled in early May 2020. Operations resumed in July 2020 and the mine produced 5.0 million wet metric tonnes of taconite pellets for 2020, of which approximately 3.1 million wet metric tonnes were ArcelorMittal’s share.
Both the Minorca and Hibbing mines are located in the Mesabi iron range where iron ore has been extracted for over 100 years. The ore bodies are within the Biwabik Iron Formation, a series of shallow dipping Precambrian sedimentary rocks known as taconite with a total thickness in excess of 200 meters and running for approximately 200 kilometers. Although the first deposits mined in the Mesabi iron range consisted of oxidized hematite ores, production was shortened in the mid-1950 to low grade magnetic taconite ores. The processing of this ore involves a series of grinding and magnetic separation stages to remove the magnetite from the silica. Natural gas and electric power constitute the main sources of energy for both Minorca and Hibbing. The electric power is provided by the Minnesota Power company.
ArcelorMittal Mexico Mining Assets
ArcelorMittal Mexico operates three iron ore mines in Mexico, the San Jose and Las Truchas mines, and, through a joint operation with Ternium S.A., the Peña Colorada mine. In 2019, the El Volcan mine was closed and ArcelorMittal continues to operate certain parts of the El Volcan facilities with material coming from the San Jose mine.
Peña Colorada
Consorcio Minero Benito Juarez Peña Colorada, S.A. de C.V. (Peña Colorada), operating since 1974, holds mineral rights over 99,188 acres located at about 60 kilometers by highway to
the northeast of the port city of Manzanillo, in the province of Minatitlán in the northwestern part of the State of Colima, Mexico. ArcelorMittal owns 50% of Peña Colorada Ltd., and Ternium S.A. owns the other 50% of the company. The Peña Colorada mine receives electrical power from the Comisión Federal de Electricidad (CFE), which is a state-owned company that serves customers across the entire country.
Peña Colorada operates an open pit mine as well as a concentrating facility and a two-line pelletizing facility. The beneficiation plant is located at the mine, whereas the pelletizing plant is located in Manzanillo. Major processing facilities include a primary crusher, a dry cobbing plant, two autogenous mills, three horizontal and two vertical ball mills and several stages of magnetic separation. The concentrate is sent as a pulp through a pipeline from the mineral processing plant to pelletizing facilities.
Government concessions are granted by the Mexican federal government for a period of 50 years and are renewable. The expiration dates of the current mining concessions range from 2021 to 2062.
The Peña Colorada pelletizing facility produced 3.8 million tonnes of pellets in 2020. The magnetite concentrate is shipped from Manzanillo to ArcelorMittal Mexico, as well as to Ternium’s steel plants, by ship and by rail.
Peña Colorada is a complex polyphase iron ore deposit. The iron mineralization at Peña Colorada consists of banded to massive concentrations of magnetite within breccia zones and results from several magmatic, metamorphic and hydrothermal mineralization stages with associated skarns, dykes and late faults sectioning the entire deposit.
El Volcan & San Jose
ArcelorMittal holds mineral rights over 1,053 hectares which previously supported its El Volcan operations located approximately 68 kilometers northwest of the city of Obregon and 250 kilometers from the Guaymas port facility in the state of Sonora, Mexico. The El Volcan operations controlled all of the mineral rights and surface rights needed to mine and process iron ore, however the mine stopped production in April 2019 due to depletion of reserves. The El Volcan site is accessible by a 90-kilometer road from the city of Obregon, where the concentrator is located.
The El Volcan facilities that are continuing to be used with materials from the San Jose mine include the concentration plant and port installations. The concentration plant includes two ball mills on line, a magnetic separation circuit, flotation systems, a belt conveyor filter and a disposal area for tails. The major port installations include a tippler for railroad cars, a conveyor, transfer towers and two ship loading systems. San
Jose material is fed into the El Volcan plant and concentrate produced is transported by rail to the Pacific port of Guaymas and then shipped to the steel plant in Lázaro Cárdenas. The concentration facility uses electric power from the national grid.
Government concessions are granted by the Mexican federal government for a period of 50 years and are renewable. The expiration dates of the current concessions at El Volcan range from 2055 to 2061.
The exploitation of the San José mine began in 1946 and was handled by multiple owners until 2019, when ArcelorMittal secured a lease agreement and initiated mining and pre-concentration in the same year. ArcelorMittal secured the mineral rights to the San José operations and has a land lease agreement for both the land and the San José facilities, which is in place for a period of 3 years from March 22, 2019 to March 21, 2022.
The San José mine is part of a broad geological formation, where there are several metasomatic iron deposits produced by hydrothermal replacement at various spots within the Sinaloa State.
The San Jose facilities are located approximately 40 kilometers from Culiacán City, in the south of the Sinaloa State, being accessible by Highway 15, a paved 4-lane highway heading south toward Mazatlan. The mine is open pit and exploitation, as well as crushing operations and all transport activities are performed by contractors. Electrical power is supplied by the regional grid. The pre-concentration facilities at the mine include one primary crusher, one secondary crusher, a dry cobbling high-intensity magnetic pulley and one tertiary crusher.
The pre-concentrate produced is transported by truck to the Quila railroad station for loading and is then sent to the El Volcan Concentration plant owned by ArcelorMittal. The concentrate produced is then transported by rail to the Pacific port of Guaymas to be shipped to the steel plant in Lázaro Cardenas. In 2020, San José produced 1.2 million tonnes of concentrate.
Las Truchas
ArcelorMittal holds mineral rights over 53,942 hectares, of which 4,261 support the Las Truchas operations in Mexico. The Las Truchas mine is located approximately 27 kilometres southeast of the town of Lázaro Cárdenas in the State of Michoacán, Mexico. The Las Truchas operations are accessible by public highway and control all the mineral rights needed to mine and process its estimated 2020 iron ore reserves. Part of the surface rights expired in 2018 and have since been re-negotiated. An extension of 10 years was agreed and the executed agreement will expire in May 2029.
Government concessions are granted by the Mexican federal government for a period of 50 years and are renewable. The expiration dates of the current mining concessions range from 2044 to 2059.
The Las Truchas mine is an integrated iron ore operation. It began operating in 1976 as a government enterprise (Sicartsa), and its mining activities consist of an open pit mine exploitation, crushing, dry cobbing preconcentrate and concentration plant. The aggregate 2020 production of concentrate and lumps totaled 1.6 million tonnes. The concentrator includes one primary crusher, two secondary crushers and three tertiary crushers, two ball mill and two bar mill and two wet magnetic separation circuits. The electrical energy supplier for the Las Truchas mine is the state-owned power company, Comisión Federal de Electricidad (CFE). The concentrated ore is pumped from the mine site through a 26-kilometer slurry pipeline to the steel plant facility in Lázaro Cárdenas.
The Las Truchas deposits consist of massive concentrations of magnetite of irregular morphology. The main Las Truchas deposits occur along a geological trend that is about seven kilometers long and about two kilometers wide. The Las Truchas mineral deposits have been classified as hydrothermal deposits, which may have originated from late-stage plutonic activity injecting through older sedimentary rocks. The mineralization of the Las Truchas iron deposits occurs in disseminated and irregular massive concentrations of magnetite within metamorphic rocks and skarns. The mineralization also occurs as fillings of faults, breccia zones, and fractures.
ArcelorMittal Princeton Coal Mines
The ArcelorMittal Princeton (“AMP”) properties are located in McDowell County, West Virginia and Tazewell County, Virginia, approximately 30 miles west of the city of Princeton, West Virginia, where AMP’s corporate office is located. The mining operations of AMP were sold to Cleveland-Cliffs on December 9, 2020 as referenced above. AMP was created in 2008 when the Mid-Vol Coal Group and the Concept Mining Group were integrated. The properties are located in the Pocahontas Coalfields of the Central Appalachian Coal Basin. The Carboniferous age coal deposits are situated in the Pottsville Group, New River and Pocahontas Formations. The rock strata, including the coal deposits, are sedimentary rocks formed by alluvial, fluvial and deltaic sediments deposited in a shallow, subsiding basin. The most common rock types are various types of sandstone and shale, with the coal deposits typically in multiple seams in relatively thin coal beds, one to five feet thick. The property has a long history of coal mining, mostly by predecessors in title to AMP. Significant underground mining of
some of the deeper coal seams on the properties have occurred, notably the Pocahontas seams nos. 3 and 4, along with the no. 11 seam. In addition, a substantial amount of the thicker coal outcrops has been contour mined previously, providing access for highwall mining and on-bench storage of excess spoil from future surface mining. The properties consist of two operating areas: the Low Vol operations to the north and the Mid Vol operations to the south. 138kV high-voltage power lines deliver power to the company’s new 138/13kV substation where transformers reduce voltage for specific equipment requirements.
The Low Vol operations are located in McDowell County, West Virginia, near the communities of Northfork, Keystone, Eckman, Gary, and Welch. The Eckman Coal Preparation Plant and Dan’s Branch Loadout are also located there, as well as the following underground mines: XMV Mine Nos. 35, 39, and 43. XMV Mine No. 32 was sold in 2017, and No. 42 was mined out and closed in 2018. The Red Hawk surface mine and Berwind Loadout finished primary reclamation in 2018. Nearby surface operations include Easter Ridge, Mill Branch and Blue Eagle, producing coal from the upper portion of the Pocahontas Formation in seams 9-14.
The Mid Vol operations are in southeastern McDowell County, West Virginia and northwestern Tazewell County, Virginia. The nearest communities are Horsepen and Abbs Valley, Virginia as well as Anawalt, West Virginia.
All mid-vol coal production is from the surface operations of Virginia Point, Low Group and Stateline. The Roadfork Loadout is located there, providing a separate shipping point for the mid-vol metallurgical coal, as well as the oxidized (non-metallurgical) coal for the steam and PCI markets. The Red Hawk surface mine and Berwind Loadout in this area finished primary reclamation in 2018.
There were three active leases across the AMP operations which cover approximately 50% of the annual production. One of these expires in 2025 and could be renewed at the sole option of ArcelorMittal. The other two expire in 2027 and can continue to be extended until all merchantable coal is mined, subject to an amendment agreement being executed. The remaining 50% of the annual production is covered by land that is owned by Imperial Resources (an AMP entity).
The combined production of the mines in 2020 was 1.4 million tonnes of washed and direct shippable coal.
| | | | | | | | | | | | | | | | | | | | | | | | | | | | | | | | |
| BRAZIL | | | | | | Crude Steel | | | | |
| Steel operations | | | | | | | | | | |
| Unit | | Country | | Locations | | Production in 2020 (in million tonnes per year) 1 | | Type of plant | | Products |
| Sol | | Brazil | | Vitoria | | n/a | | Coke-Making | | Coke |
ArcelorMittal Tubarão 2 | | Brazil | | Vitoria | | 5.0 | | Integrated | | Flat |
| ArcelorMittal Vega | | Brazil | | São Francisco do Sul | | n/a | | Downstream | | Flat |
| ArcelorMittal Brasil | | Brazil | | João Monlevade | | 1.2 | | Integrated | | Long/ Wire Rod |
| ArcelorMittal Brasil | | Brazil | | Juiz de Fora, Piracicaba | | 1.8 | | Mini-mill | | Long/ Bar, Wire Rod |
ArcelorMittal Brasil 3 | | Brazil | | Barra Mansa,
Resende | | 0.7 | | Mini-mill | | Long/Rebar, Wire rod, Bars, Sections, Wires |
| Acindar | | Argentina | | Villa Constitucion | | 0.8 | | Mini-mill | | Long/ Wire Rod, Bar |
| ArcelorMittal Costa Rica | | Costa Rica | | Costa Rica | | n/a | | Downstream | | Long/ Wire Rod |
| Industrias Unicon | | Venezuela | | Barquisimeto, Matanzas, La Victoria | | n/a | | Downstream | | Pipes and Tubes |
| | | | | | | | | | | | | | | | | | | | | | | | | | | | | | | | |
| Captive mining operations | | | | | | | | | | |
| Unit | | Country | | Locations | | ArcelorMittal Interest (%) | | Type of Mine | | Product |
| ArcelorMittal Brasil Andrade Mine | | Brazil | | State of Minas Gerais | | 100.0 | | Iron Ore Mine (open pit) | | Fines |
| ArcelorMittal Mineração Serra Azul | | Brazil | | State of Minas Gerais | | 100.0 | | Iron Ore Mine (open pit) | | Lump and fines |
1.Note: n/a = not applicable (no crude steel production)
2.ArcelorMittal Tubarão completed the reline of its BF #2 in December 2019. The blast furnace remained idled due to market conditions until its restart in July 2020.
3.ArcelorMittal Brasil temporarily idled its electric arc furnaces #1 & #2, billet caster and long rolling mill #2 at Barra Mansa in February 2019 in response to market conditions.
Due to the outbreak of the COVID-19 pandemic in 2020, the Brazil segment production was adversely impacted, primarily for flat products.
As domestic demand improved following the initial impact of the COVID-19 pandemic during the second quarter of 2020, the Company restarted blast furnace #2 at ArcelorMittal Tubarão at the end of July 2020 (idled since June 2019) and blast furnace #3 (idled since April 2020) in the fourth quarter of 2020 to match demand levels.
Similarly, production curtailments were incurred in Argentina and in long product capacity in Brazil. A V-shape recovery of market demand, particularly in construction, better operational performance and other managerial actions were able to largely offset the production curtailments, limiting the impact on production volume for long products.
ArcelorMittal Brasil
ArcelorMittal Brasil produces both flat and long steel products. Flat products are manufactured at ArcelorMittal Tubarão and ArcelorMittal Vega. Its products include slabs, hot-rolled coil, cold-rolled coil and galvanized steel, and serve customers in automotive, appliances, construction and distribution segments. The Tubarão complex uses the integrated steelmaking route to produce slabs and rolling hot-rolled coils and is strategically located with access to the Praia Mole Marine Terminal as well
as road and railway systems. The Vega facility has cold-rolling and coating facilities and easy access to the port of São Francisco do Sul.
ArcelorMittal Brasil’s long products include wire rod and wire, sections, merchant bars, special bars and rebars, for use in civil construction, industrial manufacturing, agricultural and distribution sectors. It produces transformed products including, among others, welded mesh, trusses, annealed wire and nails. It owns upstream and downstream steel facilities in Monlevade, Juiz de Fora, Piracicaba, Barra Mansa and Resende and operates an extensive distribution network across the country selling to retail customers. It owns interests in two subsidiaries, Belgo Bekaert Arames Ltda. ("BBA"), which manufactures wire products for agricultural and industrial end-users, and Belgo-Mineira Bekaert Artefatos de Arame Ltda., which produces steel cords used in the tire industry. It also owns forests, and ArcelorMittal Bioflorestas produces charcoal from eucalyptus forestry operations that is used to fuel its furnaces in Juiz de Fora and to exchange for pig iron with local producers.
Acindar
Acindar is the largest long steel producer in Argentina. It manufactures and distributes products to meet the needs of the construction, industrial, and agricultural sectors. It produces rebars, square, round, drawn and flat bars, meshes, nails, preassembled and welded cages, structural sections, piles, wire
rod and barbed wire. It has an in-house distribution network that serves end-users across Argentina.
ArcelorMittal Brasil - Andrade Mine
ArcelorMittal Brasil holds mineral rights of over 2,421 hectares located in the Iron Quadrangle (Quadrilátero Ferrífero), in the Andrade Mine area, a widely-explored and mined region located approximately 80 kilometers east of Belo Horizonte in the Minas Gerais State of Brazil. ArcelorMittal’s operations control all of the mineral rights and surface rights needed to mine and process its estimated 2020 iron ore reserves, dominated by directly shippable hematite ore. Mining legislation in Brazil does not predetermine the duration of mineral rights and as such these rights are considered valid to the point of mine exhaustion, contingent on maintaining compliance to set conditions. In addition to the open pit mine, ArcelorMittal operates a crushing and screening facility. Feed ore is transported to Monlevade plant through a private railway line. Power is mostly generated from hydroelectric power plants and supplied by Companhia Energética de Minas Gerais ("CEMIG"), a publicly traded company controlled by the Government of the State of Minas Gerais.
Companhia Siderúrgica Belgo-Mineira (“CSBM”) initiated mining operations at the property in 1944 in order to facilitate the supply of ore to its steel plant in João Monlevade. The mine was managed by CSBM until the end of 2004. In January 2005, Vale signed a leasing agreement with CSBM for management and operation. In December 2005, CSBM changed its name to Arcelor Brasil S.A. which was then merged in August 2007 into Belgo Siderurgia S.A. The latter then changed its name to ArcelorMittal Brasil S.A. In November 2009, Vale returned the Andrade mine to ArcelorMittal Brasil S.A. In 2020, the Andrade mine produced 1.6 million tonnes of sinter feed and concentrate. An increase of the crushing and screening facility production capacity to 3.5 million tonnes per year of sinter feed was completed in 2012. In 2013, a cross road was built in order to improve shipments to the local Brazilian market. In 2018, Andrade started development of a concentration plant to improve the quality of the sinter feed to the Monlevade plant and positively impact costs and life span. This plant commenced production in early 2020 and concentrates the itabirite ores, enabling mixing with the higher grade hematite ores.
ArcelorMittal Brasil - Serra Azul Mine
ArcelorMittal Brasil holds mineral rights over the central and east claims of the Serra Azul deposit of over 375 hectares, located approximately 50 kilometers southwest of the town of Belo Horizonte in the Minas Gerais State of Brazil and accessible by public highway. ArcelorMittal’s operations control all of the mineral rights and surface rights needed to mine and process its estimated 2020 iron ore reserves. Mining legislation in Brazil does not predetermine the duration of mineral rights and as such these rights are considered valid to the point of
mine exhaustion, contingent on maintaining compliance to set conditions. ArcelorMittal operates an open pit mine and a concentrating facility. The mine site is accessible by 80 kilometers of public highway from Belo Horizonte.
In addition to the open pit mine, processing operations consist of a crushing facility and a three-line concentration facility including screening, magnetic separation, spirals separators and jigging. Production is transported either by truck for local clients of lump, or by truck to two railway terminals located 35 and 50 kilometers, respectively, from the mine site for selling to local clients of sinter feed or for export through third-party port facilities located in the Rio de Janeiro State. Production is shipped mainly to the ArcelorMittal Brasil integrated plants and to the local Brazilian market. CEMIG supplies power through a 13,800 volt line from Mateus Leme, located 20 kilometers from the mine. The electricity is locally transformed into 380 volts by six transformers spread around the operation. Minas Itatiauçu (MIL) initiated mining operations at the property in 1946. In 2007, London Mining Brazil Mineração Ltda (London Mining) purchased the mineral rights from MIL. Following the acquisition of the property from London Mining, ArcelorMittal has operated the mine since 2008. In the same year, London Mining Brazil Mineração Ltda was merged into London Mining Participações Ltda, which changed its corporate name to ArcelorMittal Mineração Serra Azul. In April 2016, ArcelorMittal Mineração Serra Azul was merged into ArcelorMittal Brasil. In 2020, ArcelorMittal Brasil - Serra Azul Mine produced 1.6 million tonnes of lumps and concentrate.
In February 2019, the Company decided to implement the evacuation plan related to its dormant Serra Azul tailing dam. The community situated downstream to the dam was evacuated as a precautionary measure based on an updated stability report following incidents in the Brazilian mining sector. This was done to enable further testing and implementation of any additional mitigating measures. As a result, the Company has executed an agreement with the Federal and State Public Prosecutors Offices and affected families to provide temporary assistance to the families and set technical measures required to re-establish factor of safety standards. Such agreement was extended in February 2020 and negotiations regarding compensation are expected for 2021.
Both the Andrade and Serra Azul mines are located in the Iron Quadrangle (Quadrilátero Ferrífero), a widely-explored and mined region. The mineralization occurs as Itabirites, banded hematite-silica rocks, with varying weathering degrees. While the Serra Azul ore reserve estimates are constituted of rich friable Itabirites requiring some beneficiation, the Andrade ore reserve estimates are dominated by directly shippable hematite ore. From early 2020, Andrade was able to concentrate Itabirite and hematite fines as described above.
| | | | | | | | | | | | | | | | | | | | | | | | | | | | | | | | |
| EUROPE | | | | | | Crude Steel | | | | |
| Steel operations | | | | | | | | | | |
| Unit | | Country | | Locations | | Production in 2020 (in million tonnes per year) 1 | | Type of plant | | Products |
| ArcelorMittal Bremen | | Germany | | Bremen, Bottrop | | 2.8 | | Integrated | | Flat |
| ArcelorMittal Eisenhüttenstadt | | Germany | | Eisenhüttenstadt | | 1.9 | | Integrated | | Flat |
| ArcelorMittal Belgium | | Belgium | | Gent, Geel, Genk, Liège | | 4.1 | | Integrated and Downstream | | Flat |
ArcelorMittal France 5 | | France | | Dunkirk,
Mardyck,
Montataire,
Desvres,
Florange, Mouzon,
Basse- Indre | | 4.9 | | Integrated and Downstream | | Flat |
| ArcelorMittal Méditerranée | | France | | Fos-sur-Mer,
Saint-Chély | | 3.0 | | Integrated and Downstream | | Flat |
| ArcelorMittal España | | Spain | | Avilés, Gijón, Etxebarri, Lesaka, Sagunto | | 3.0 | | Integrated and Downstream | | Flat, Long, Rails, Wire Rod |
| ArcelorMittal Italy | | Italy | | Taranto, Genova, Novi Ligure, Raconiggi, Salerno | | 3.4 | | Integrated and Downstream | | Flat, Pipes and Tubes |
| ArcelorMittal Avellino & Canossa | | Italy | | Avellino | | n/a | | Downstream | | Flat |
ArcelorMittal Poland 2 | | Poland | | Krakow, Swietochlowice, Dabrowa Gornicza,
Chorzow,
Sosnowiec,
Zdzieszowice | | 3.9 | | Integrated and Downstream | | Flat, Long, Coke/ Sections, Wire Rod, Sheet Piles, Rails |
| ArcelorMittal Sestao | | Spain | | Bilbao | | 0.2 | | Mini-mill | | Flat |
| Industeel | | France, Belgium | | Charleroi, Le Creusot, Chateauneuf,
Saint-Chamond,
Seraing, Dunkirk | | 0.3 | | Mini-mill and Downstream | | Flat |
| ArcelorMittal Belval & Differdange | | Luxembourg | | Esch-Belval, Differdange, Rodange | | 1.9 | | Mini-mill | | Long /Sheet Piles, Rails, Sections & Special Sections |
| ArcelorMittal Olaberria-Bergara | | Spain | | Olaberría, Bergara | | 0.9 | | Mini-mill | | Long/ Sections |
| ArcelorMittal Gandrange | | France | | Gandrange | | n/a | | Downstream | | Long/ Wire Rod, Bars |
| ArcelorMittal Warszawa | | Poland | | Warsaw | | 0.5 | | Mini-mill | | Long/ Bars |
| ArcelorMittal Hamburg | | Germany | | Hamburg | | 0.9 | | Mini-mill | | Long/ Wire Rods |
| ArcelorMittal Duisburg | | Germany | | Ruhrort, Hochfeld | | 0.9 | | Integrated | | Long/ Billets, Wire Rod |
| ArcelorMittal Hunedoara | | Romania | | Hunedoara | | 0.2 | | Mini-mill | | Long/ Sections |
| Sonasid | | Morocco | | Nador, Jorf Lasfar | | 0.5 | | Mini-mill | | Long/ Wire Rod, Bars, Rebars in Coil |
| ArcelorMittal Zenica | | Bosnia and Herzegovina | | Zenica | | 0.7 | | Mini-mill / Integrated | | Long/ Wire Rod, Bars |
ArcelorMittal Tubular Products Roman SA 6 | | Romania | | Roman | | n/a | | Downstream | | Pipes and Tubes |
ArcelorMittal Tubular Products Iasi SA 3 | | Romania | | Iasi | | n/a | | Downstream | | Pipes and Tubes |
ArcelorMittal Tubular Products Karvina a.s. 7 | | Czech Republic | | Karvina | | n/a | | Downstream | | Pipes and Tubes |
| | | | | | | | | | | | | | | | | | | | | | | | | | | | | | | | |
| EUROPE (continued) | | | | | | Crude Steel | | | | |
| | | | | | | | | | |
| Unit | | Country | | Locations | | Production in 2020 (in million tonnes per year) 1 | | Type of plant | | Products |
| ArcelorMittal Tubular Products Kraków | | Poland | | Krakow | | n/a | | Downstream | | Pipes and Tubes |
| ArcelorMittal Tubular Products Hautmont | | France | | Hautmont | | n/a | | Downstream | | Pipes and Tubes |
| ArcelorMittal Tubular Products Vitry | | France | | Vitry | | n/a | | Downstream | | Pipes and Tubes |
| ArcelorMittal Tubular Products Chevillon | | France | | Chevillon | | n/a | | Downstream | | Pipes and Tubes |
ArcelorMittal Tubular Products Lexy 4 | | France | | Lexy, Rettel,Vincey, Fresnoy-le-Grand | | n/a | | Downstream | | Pipes and Tubes |
| ArcelorMittal Tubular Products France | | France | | Socova | | n/a | | Downstream | | Pipes and Tubes |
| | | | | | | | | | | | | | | | | | | | | | | | | | | | | | | | |
| Captive mining operations | | | | | | | | | | |
| Unit | | Country | | Locations | | ArcelorMittal Interest (%) | | Type of Mine | | Product |
| ArcelorMittal Prijedor | | Bosnia and Herzegovina | | Prijedor | | 51.0 | | Iron Ore Mine (open pit) | | Concentrate and lump |
1.n/a = Not applicable (no crude steel production)
2.ArcelorMittal Poland permanently idled its coke oven batteries #3 & #4 at the Zdzieszowice coke plant in April 2019. The blast furnace, basic oxygen furnaces and slab caster at Krakow were temporarily idled in the fourth quarter of 2019 due to market conditions. A new organic coating line at Krakow was commissioned in mid-2019. On October 8, 2020, ArcelorMittal Poland announced that it intended to permanently close its primary steelmaking operations at its unit in Kraków (except the coke battery which remains in operation), and the shutdown process in the blast furnace and the steel shop was completed in November 2020.
3.ArcelorMittal Tubular Products Iasi commissioned a new pipe mill #6 in the first quarter of 2019.
4.ArcelorMittal Tubular Products Lexy decommissioned its pipe mill #1 at Lexy site in 2019.
5.The coke oven battery in Florange was permanently closed in the second quarter of 2020. The new HDG 2 line (Galsa2) in Florange ramped up production in early 2020.
6.ArcelorMittal Tubular Products Roman decommissioned its seamless pipe mill #6 in 2020.
7.ArcelorMIttal Tubular Products Karvina decommissioned its welded pipe mill #9 in 2020.
The COVID-19 pandemic containment measures began impacting European industrial activity in mid-March. The Company first announced measures on March 19, 2020 to reduce production and to temporarily idle steelmaking and finishing assets across its European operations. Production reduction measures were undertaken in Italy, France, Spain, Germany, Belgium and Poland.
In the third quarter of 2020, the Company resumed some steel-making capacity in France, Spain and Germany, some of which were required to ensure continuity of supply to customers during the period of planned major reline of a blast furnace at Gent, Belgium that began late August 2020.
ArcelorMittal France
ArcelorMittal France has locations in Dunkirk, Mardyck, Montataire, Desvres, Florange, Mouzon and Basse-Indre. ArcelorMittal France produces and markets a large range of products, including slabs, hot-rolled, pickled, galvanized, color-coated and tin-plated coils. ArcelorMittal France’s products are sold principally in the regional market in France and Western
Europe, particularly in the automotive and packaging market. The Dunkirk site has primary facilities and produces slabs for other ArcelorMittal France sites as well as supplies hot rolled coils to the sites of Desvres, Mardyck and Liège. The Mardyck site has finishing facilities and supplies the hot dip coating lines of Montataire.
The Florange site supplies through its hot strip mill and 2 cold rolling mills: the 2 hot dip lines of Florange (GALSA 1 & 2), the continuous annealing of Florange, the hot dip coating lines of Mouzon, as well as the tinplate facilities of Florange and Basse-Indre. Mouzon is specialized in finishing hot dip coating operations.
The Florange site has primary and finishing facilities that are located mainly along the Fensch River in Lorraine. The liquid phase of Florange has been idled since October 2011 and the Company began the definitive closure and dismantling of this facility in 2018. The finishing plant of Florange idled one continuous annealing line in September 2013, a tinplate mill in January 2012 and an organic coating line in June 2011.
The Florange coke oven battery was permanently closed in the second quarter of 2020.
The site of Basse-Indre is specialized in packaging activities. Its pickling line and cold-rolling mill are both idled since April 2014.
The sites of ArcelorMittal France produce and deliver a range of flat steel high-value finished products to customers, including cold-rolled, hot dip galvanized, aluminized and organic-coated material, tinplate, draw wall ironed tin plate ("DWI") and tin free steel. Certain of its products are designed for the automotive market, such as Ultragal®, Extragal®, galfan, Usibor® (hot dip), while others are designed for the appliances market, such as Solfer® (cold-rolled) for enameling applications.
ArcelorMittal Belgium
ArcelorMittal Gent
ArcelorMittal Gent is a fully integrated steel plant which is located along the Gent-Terneuzen canal, approximately 17 kilometers from the Terneuzen sea lock, which links the works directly with the North Sea. The canal is of the Panamax type and can accommodate ships of up to 65,000 tonnes. ArcelorMittal Gent produces flat steel products with high added value. A significant part of the production is coated, either by hot dip galvanizing, electro galvanizing or organic coating. ArcelorMittal Gent also includes one organic coating line located in Geel and one electro galvanizing line located in Genk. ArcelorMittal Gent’s products are mainly used in the automotive industry and in household appliances, tubes, containers, radiators and construction. In 2018, ArcelorMittal Gent invested €65 million in a new furnace at Sidgal 3 line to produce Fortiform ® grades for automotives. The blow-in of blast furnace B in Gent occurred on March 1, 2021, after the completion of the reline which commenced late August 2020.
ArcelorMittal Liège
The finishing facilities of ArcelorMittal Liège are located south of Liège. ArcelorMittal Liège produces a wide range of innovative products to meet the demanding needs of companies in the automotive industry and industrial domestic appliances. The operating assets in Liège include the continuous annealing line 1, hot dip galvanizing line 7 (combiline) and line 8 (Eurogal), the electrogalvanzing line 5, and the two organic coating lines 2 and 7 (combiline hot dip galvanizing line 7). It also includes the JVD (Jet Vapor Deposition) line inaugurated on February 3, 2017. This world-class innovative line coats moving strips of steel in a vacuum chamber by vaporizing zinc onto the steel at high speed to produce coated steels for automotive and other industrial applications.
ArcelorMittal Bremen
ArcelorMittal Bremen is situated on the bank of the Weser River north of Bremen, Germany. ArcelorMittal Bremen produces and sells a wide range of products including slab, hot-rolled, pickled, cold-rolled and hot dip galvanized rolls to the automotive and primary transformation sectors.
ArcelorMittal Méditerranée
ArcelorMittal Méditerranée operates a flat carbon steel plant in Fos-sur-Mer. It also operates a finishing facility for electrical steel located in Saint-Chély, 300 kilometers northwest of Fos-sur-Mer. The Fos-sur-Mer plant is located 50 kilometers west of Marseille on the Mediterranean Sea.
ArcelorMittal Méditerranée’s products include coils to be made into wheels, pipes for energy transport and coils for finishing facilities for exposed and non-exposed parts of car bodies, as well as for the construction, home appliance, packaging, pipe and tube, engine and office material industries.
The Saint-Chély plant produces electrical steel (with up to 3.2% silicon content), mainly for electrical motors. About 60% of its products are shipped from a private wharf, in part through a shuttle system and 30% of its products are shipped by rail, with the remaining amount transported by truck.
ArcelorMittal España
ArcelorMittal España’s Avilés and Gijón facilities, which are by far the largest of its facilities, are connected by ArcelorMittal España’s own railway system. These two facilities operate as a single integrated steel plant. The product range of ArcelorMittal España includes rail, wire rod, heavy plates and hot-rolled coil, as well as more highly processed products such as hot dip and electrogalvanized sheet, tinplate and organic-coated sheet. The facilities are also connected by rail to the region’s two main ports, Avilés and Gijón. Raw materials are received at the port of Gijón, where they are unloaded at dedicated dry-bulk terminal, which is linked to steel-making facilities by conveyor belt. A variety of products are shipped through the Avilés port facilities to other units of the Group and to ArcelorMittal España’s customers.
ArcelorMittal España is connected to the other ArcelorMittal facilities in Spain by wide-gauge and narrow-gauge rail networks. Shuttle trains link the ArcelorMittal España facilities directly to the ArcelorMittal Sagunto plant, which it supplies with hot-rolled coils for subsequent processing into cold-rolled, galvanized and electro galvanized sheet.
ArcelorMittal España production is primarily sold to the railway, automotive and construction industries.
ArcelorMittal España’s Gijón coke plant was idled in 2013. On September 23, 2015, ArcelorMittal announced an investment of over €100 million in the refurbishment of the coke oven batteries in Gijón. The main part of the approved investment focuses on
the re-construction of two 45-oven batteries at ArcelorMittal Asturias’ coke plant in Gijón, installation of a state-of-the-art emission collection and scrubbing system, and implementation of efficient by-product management systems. The refurbishment work started in 2016. The refurbished coke oven battery number 1 in Gijón started its heating in the last quarter of 2019. The first coke from coke oven battery #1 was produced at the beginning of 2020. The start of the coke oven battery #2 was delayed due to the COVID-19 crisis and the first coke was produced on February 13, 2021. In October 2019, the coke oven batteries of Aviles were decommissioned with the aim to be demolished and their coke output was then supplied by the refurbished Gijón coke batteries located near the two blast furnaces.
ArcelorMittal Italia
On November 1, 2018, ArcelorMittal leased and subsequently consolidated the business units of Ilva S.p.A. ("Ilva") following the signing on June 28, 2017 of a lease agreement with a conditional obligation to purchase. See “Introduction—Key transactions and events in 2020—ArcelorMittal Italia”.
ArcelorMittal Italia is the leading steel producer in Italy, Europe’s second largest steel consuming economy. ArcelorMittal Italia produces high-quality and sustainable steel to be used in a range of vital industry sectors across the domestic steel market such as construction, energy, automotive, home appliances, packaging and transport and for international export. ArcelorMittal Italia has operations across various structurally linked operating sites including Europe’s biggest single-site integrated steel facility in Taranto and rolling mills in Genoa and Novi Ligure. Genoa is also an important hub in terms of intermodal logistics.
The updated industrial plan agreed between ArcelorMittal and Invitalia involves investment in lower-carbon steelmaking technologies, including the construction of a 2.5 million tonne electric arc furnace, which is expected to open in mid-2024, and the relining of BF #5, which is expected to start production in 2024. This industrial plan, which targets reaching 8 million tonnes of production in 2025 (crude steel production is limited to 6 million tonnes until the environmental plan is completed), will become effective upon the closing of the first investment of Invitalia. It integrates a series of public support measures including ongoing government funded employment support and includes, for the period between 2021 and 2025, environmental capital expenditures of €345 million and industrial capital expenditures of €1,051 million as well as capital expenditures of €226 million for the revamp of blast furnace #5 and €260 million for the construction of the electric arc furnace.
ArcelorMittal Poland
ArcelorMittal Poland is the largest steel producer in Poland. ArcelorMittal Poland’s Zdzieszowice coke plant produces and supplies coke to ArcelorMittal subsidiaries and third parties.
ArcelorMittal Poland produces coke and a wide range of steel products, including both long and flat products such as slabs, billets, blooms, sections, sheet piles, rails up to 120 meters long, railway accessories, mining supports sections, hot-rolled coils, sheets and strips, cold-rolled coils, sheets and strips, hot dip galvanized coils and sheets, wire-rods and organic coated sheets and coils. Products are mainly sold in the domestic Polish market, while the remainder is exported, primarily to customers located in other EU member states. ArcelorMittal Poland’s principal customers are in the construction, engineering, transport, mining and automotive industries. In the fourth quarter of 2019, ArcelorMittal Poland temporarily idled its blast furnace and steel plant in Krakow as a result of the market downturn, high energy costs and large volumes of steel imports from outside the EU. The coke plant in Kraków will continue to operate as well as the downstream operations (two rolling mills, the hot dip galvanizing line and the new organic coating line). The slabs for the rolling mills in Kraków will come mainly from the steel shop in Dabrowa Gornicza where the company will invest in debottlenecking projects, and to produce special grades for further processing into grain-oriented steel. On October 8, 2020, ArcelorMittal Poland announced that it intended to permanently close its primary steelmaking operations (except the coke battery which remains in operation), at its unit in Kraków, and the shutdown process in the blast furnace and the steel shop was completed in November 2020.
ArcelorMittal Eisenhüttenstadt
ArcelorMittal Eisenhüttenstadt is situated on the Oder river near the German-Polish border, 110 kilometers southeast of Berlin. ArcelorMittal Eisenhüttenstadt is a fully integrated and highly-automated flat steel producing plant. The facility is run with one medium-sized blast furnace. In the third quarter of 2019, primary steel production was reduced at ArcelorMittal Eisenhüttenstadt in line with the May 2019 announcement, and was subsequently brought back to normal levels towards end of 2019.
ArcelorMittal Eisenhüttenstadt produces and sells a wide range of flat steel products, including hot-rolled, cold-rolled, electrical and hot dip galvanized and organic-coated coils to automotive, distribution, metal processing, construction and appliances industry customers in Germany, Central and Eastern Europe.
ArcelorMittal Belval & Differdange
ArcelorMittal Belval & Differdange produces a wide range of sections and sheets piles which are sold to the local European construction market as well as for export. With its Rodange facilities, it also produces a wide range of rails, special sections and heavy angles. ArcelorMittal announced a collaboration with Vow ASA (company listed on Oslo Stock Exchange and specialized in world leading solutions to convert biomass and waste into valuable resources) to build the first dedicated industrial scale biogas plant for the steel industry at Rodange, with the aim of starting production in 2022. The plant will convert
sustainable biomass into biogas to replace the use of natural gas at the plant’s rolling mill reheating furnace, so reducing CO2 emissions from the production of steel.
ArcelorMittal Hamburg
ArcelorMittal Hamburg produces billet and high quality wire rod and its production is mainly sold in the European market, primarily to automotive and engineering customers.
ArcelorMittal Olaberria-Bergara
The Olaberría-Bergara facilities produce billets and sections. The Olaberría facility's production is sold to the local construction market as well as for export, while the Bergara facility’s production is sold primarily to the local European construction market.
ArcelorMittal Duisburg
ArcelorMittal Duisburg produces blooms, billets, bars and high quality wire rod and its production is mainly sold in the European market primarily to automotive, railway and engineering customers.
ArcelorMittal Downstream Solutions (AMDS)
The Europe segment also includes ArcelorMittal Downstream Solutions (“AMDS”), which primarily covers the downstream activities of ArcelorMittal in Europe. It provides distribution of long and flat products as well as value-added and customized steel solutions through further processing to meet specific customer requirements. In addition, specific solutions are dispatched through other business lines, primarily ArcelorMittal Construction, ArcelorMittal Projects, ArcelorMittal Tubular Products, ArcelorMittal Wire Solutions and ArcelorMittal International.
AMDS also includes Industeel, with facilities in Belgium and in France. Industeel Belgium and Industeel Creusot are designed to produce special steel plates, ranging from 5 to 180 millimeters in thickness, including stainless steel products, while Industeel Loire is dedicated to extra heavy gauge products of alloyed carbon steel. Euroform operates hot forming facilities, mainly to transform extra heavy gauge products received from Industeel Loire. The R&D center in Le Creusot, France is fully dedicated to special plate products development.
ArcelorMittal Prijedor
ArcelorMittal Prijedor, based in Bosnia and Herzegovina near Prijedor, is an iron ore mining operation in which ArcelorMittal
owns 51%. ArcelorMittal Prijedor holds mineral rights over approximately 2,000 hectares, with the current concession signed in 2018 for a period of 6 years. The mine was formed in 2004 between ArcelorMittal and a local mining company that held the mining rights previously, Iron Ore Mines Ljubija. From a historical perspective, industrial iron ore mining in the area of the mine was first established by an Austrian mining company in 1916. The mines were nationalized in the 1950s and were then owned by the Iron Ore Mines Ljubija until 2004.
The ore is excavated at the open pit Buvac of the Omarska mine and processed in the processing plant. The processing plant involves crushing, screening, gravity separation, magnetic separation and filtration. The plant is close to the mine site and crude ore is transported to the plant through a conveyor. Power is supplied from the national grid through a local power distribution company. The mine is in close proximity to public roads and a state railway, which is used for transporting the final product to the customer. Additionally, ArcelorMittal Prijedor operates a limestone quarry, from which the output is used for filling of the roads in the mine, as well as product for external customers.
The Omarska deposit was originally comprised out of three ore bodies: Jezero, Buvac and a small ore body known as Mamuze. Ore reserves from Jezero and Mamuze have already been fully excavated. Since 2011, only the Buvac pit is in operation. It is formed within a carboniferous clastic and carbonate sediments. The genesis of this deposit is attributed to hydrothermal replacement and syn-sedimentary processes. The ore body is mainly composed of limonite-goethite mineralization, which was formed during weathering and oxidization of the primary siderite bodies.
In 2020, ArcelorMittal Prijedor produced and dispatched 1.4 million tonnes of final product, iron ore concentrate. The mine supplies iron ore concentrate to ArcelorMittal's steel plant, ArcelorMittal Zenica, based approximately 250 kilometers from Prijedor in central Bosnia.
| | | | | | | | | | | | | | | | | | | | | | | | | | | | | | | | |
| ACIS | | | | | | Crude Steel | | | | |
| Steel operations | | | | | | | | | | |
| Unit | | Country | | Locations | | Production in 2020 (in million tonnes per year) 1 | | Type of plant | | Products |
| ArcelorMittal Temirtau JSC | | Kazakhstan | | Temirtau | | 3.2 | | Integrated | | Flat, Long, Pipes and Tubes |
ArcelorMittal Kryvyi Rih 2 | | Ukraine | | Kryvyi Rih | | 4.7 | | Integrated | | Long |
ArcelorMittal South Africa 3 | | South Africa | | Vanderbijlpark, Saldanha, Newcastle, Vereeniging, Pretoria | | 2.3 | | Integrated Mini-mill Downstream | | Flat, Long, Pipes and Tubes |
| JSC ArcelorMittal Tubular Products Aktau | | Kazakhstan | | Aktau | | n/a | | Downstream | | Pipes and Tubes |
| | | | | | | | | | | | | | | | | | | | | | | | | | | | | | | | |
| Captive mining operations | | | | | | | | | | |
| Unit | | Country | | Locations | | ArcelorMittal Interest (%) | | Type of Mine | | Product |
| ArcelorMittal Kryvyi Rih | | Ukraine | | Kryvyi Rih | | 95.1 | | Iron Ore Mine (open pit and underground) | | Concentrate, lump and sinter feed |
| ArcelorMittal Temirtau | | Kazakhstan | | Lisakovsk, Kentobe, Atasu, Atansore | | 100.0 | | Iron Ore Mine (open pit and underground) | | Concentrate, lump and fines |
| ArcelorMittal Temirtau | | Kazakhstan | | Karaganda | | 100.0 | | Coal Mine (underground) | | Coking coal and thermal coal |
1.Note: n/a = not applicable (no crude steel production).
2.ArcelorMittal Kryvyi Rih temporarily idled its BF #8 in October 2019 for planned maintenance and also in response to market conditions. ArcelorMittal Kryvyi Rih commissioned its new billet caster #3 in June 2019 and new billet caster #2 in the first quarter of 2020. The blast furnace #5, open hearth shop, blooming shop #1 and wire rod mill #250-3 were definitely closed in 2020.
3.ArcelorMittal South Africa temporarily idled some of its downstream production lines at Vanderbijlpark (batch annealing lines, continuous annealing line, temper mills and the tinning line) in the course of 2019. The lines were permanently closed in 2020. ArcelorMittal South Africa restarted the melt shop at Vereeniging in January 2019. Vereeniging Bar Mill (16 inch) was permanently closed in 2020. ArcelorMittal South Africa put its Saldanha operations under care and maintenance beginning in the second quarter of 2020. Coke oven battery #5 within the Coke and Chemicals division was closed in the fourth quarter 2020.
The major impact of the COVID-19 pandemic on the CIS region was incurred in the second quarter of 2020 although more stringent lockdown measures were implemented after the first quarter, and production was reduced in the Ukraine and Kazakhstan due to demand weakness. The situation improved in the third quarter.
ArcelorMittal South Africa took several steps (including significant production cuts across all operations) to support the country's lockdown (i.e. restrictions on activity limited only to essential services) that ended on April 30, 2020, which required the closure of all offices and operations across the country, except essential operational staff required for care and maintenance to avoid damage. Since May 1, 2020, the operations in South Africa were operating within a partial lockdown environment which was lifted in phases: mid June for crude steel production, whereas rolling re-started beginning of May. ArcelorMittal adopted a phased response to restarting operations and will ramp up production as the demand for steel returns.
On July 16, 2020, shareholders were informed that, having reassessed its strategic asset footprint for 2020, ArcelorMittal South Africa had decided to idle Blast Furnace C (“BF C”) at Vanderbijlpark and the Vereeniging Electric Arc Furnace until demand recovered. Responding to the increased demand ArcelorMittal restarted BF C in December 2020.
ArcelorMittal South Africa
ArcelorMittal South Africa is the largest steel producer in Africa and its common shares are listed on the JSE Limited in South Africa under the symbol “ACL”. ArcelorMittal South Africa has four main steel production facilities of which Vanderbijlpark, Newcastle and Vereeniging (melt shop restarted in January 2019) are located inland, while Saldanha (under care and maintenance beginning in the second quarter of 2020 due to the current depressed economic environment) is close to a deep-water port, which is supported by a metallurgical by-products division (Coke and Chemicals) that has been closed in the fourth quarter 2020. ArcelorMittal South Africa has a diversified range of products and includes hot-rolled plates and sheet in coil form, cold-rolled sheet, coated sheet, wire-rod and sections,
as well as forgings. During 2020, approximately 85% of its products were sold in the South African domestic market, while Africa is its largest export market. It also sells into Asia and has minor tonnages into Europe and the Americas.
The Thabazimbi Iron Ore Mine was taken over by ArcelorMittal South Africa in 2018, and commenced dry screening of a calcite hematite stockpile in September 2019 in order to recover fine iron ore (-8mm) for use at its Vanderbijlpark Works. The screened material is quality controlled in order to ensure suitability of use in conjunction with its other fine iron ore sources.
ArcelorMittal Kryvyi Rih
ArcelorMittal Kryvyi Rih("AMKR")'s product range includes billets, rebars and wire rods, light sections (angles) and merchant bars (rounds, squares and strips). Its products are sold to a range of industries such as hardware, construction, re-rolling and fabrication. The markets for its products include Ukraine, CIS and Russia, North West and East Africa, Middle East and Gulf countries, Europe, Latin America and South East Asia.
In addition, AMKR includes an export sales network which supplies a complete range of steel products not only from Kryvyi Rih but also from other plants of the Group to customers outside of their respective home markets.
AMKR's iron ore captive mining operations include mineral rights over 1,383 hectares to support its operations located roughly within the borders of the city of Kryvyi Rih, 150 kilometers southwest of Dnipro, Ukraine. AMKR's operations control all of the mineral rights and surface rights needed to mine and process its estimated 2020 iron ore reserves. AMKR operates a concentrating facility, along with two open pit sites and one underground iron ore mine. The iron ore deposits are located within the southern part of the Krivorozhsky iron-ore basin. Access to the mines is via public roads, which are connected by a paved highway to Dnipro. The area is well served by rail. AMKR receives electrical power from the Kryvyi Rih thermal power plants, Zelenodolsk thermal power plants looped into common Dniproenergo system with hydro power plants of Dnepr cascade. AMKR's iron ore material base is represented by ferruginous quartzite of Novokryvorizke and Valyavkinske deposits being mined through two open pits: #2-bis and #3 and a high-grade iron ore of Kirova deposit which is processed into lump and sinter ore. In 2020, actual production was at the level of 10.7 million tonnes of concentrate and 0.6 million tonnes of sinter feed. Operations began at the Kryvyi Rih open cast in 1959 and at the Kryvyi Rih underground mine in 1933. ArcelorMittal acquired the operations in 2005.
The expiration of the agreements on the subsoil use conditions and the subsoil use permits range from 2021 for underground
mine to 2038 for open pits, while the expiration of the land lease agreements ranges from 2060 to 2061.
The iron ore extracted from the Kryvyi Rih open cast is first processed at the mine site through primary crushing. After initial processing, the product is loaded on a rail-loading facility and transported to the concentrator. The concentrator production process includes crushing, grinding, classification, magnetic separation and filtering. The iron ore extracted from the Kryvyi Rih’s underground mine by a modified sub-level caving method is crushed on surface and transported by rail to the steel plant. The main consumer of the sinter and concentrate products is the ArcelorMittal Kryvyi Rih steel plant, with some concentrate being shipped to other ArcelorMittal affiliates in Eastern Europe, as well as to third parties. The iron mineralization is hosted by early Proterozoic rocks containing seven altered ferruginous quartzite strata with shale layers. The major iron ore bearing units in the open pit mines have carbonate-silicate-magnetite composition. In addition, oxidized quartzite is mined simultaneously with primary ore but cannot be processed at present and is stored separately for future possible processing. Only the magnetite mineralization is included in the 2020 open pit iron ore reserve estimates. The underground mine is hosted by a ferruginous quartzite with martite and jaspilite.
ArcelorMittal Temirtau
ArcelorMittal Temirtau’s product range of flat and long steel products includes pig iron, continuous caster slabs, continuous caster billets, hot- and cold-rolled coils and sheets, black plates, covers, tin plates, hot dipped galvanized products, color coated products, welded pipes and rebars.
ArcelorMittal Temirtau sells steel products to a range of industries, including the tube- and pipe-making sectors, as well as manufacturers of consumer goods and appliances. The markets for its products include Kazakhstan, CIS, Russia and South-East Asia.
ArcelorMittal Temirtau has four captive iron ore mining operations in Kazakhstan. The mines are Lisakovsk, Kentobe, Atasu and Atansore. Transport of concentrate from these mines to the ArcelorMittal steel plant is by railway. ArcelorMittal Termitau’s operations control all of the mineral rights and surface rights needed to mine and process its estimated 2020 iron ore reserves.
Lisakovsk is an open pit operation located in northwest Kazakhstan about 1,100 kilometers from Temirtau, with production of 1.0 million tonnes of concentrate in 2020. The mine was initially commissioned in 1969 and was acquired by ArcelorMittal in 2000. The existing subsoil agreement was extended in September 2020 for 25 years. The production process comprises crushing, screening, grinding, wet jigging and wet magnetic separation. The iron mineralization at
Lisakovsk occurs as oolite containing mainly hygogoethite and goethite. The phosphorous content in the mineralization limits its utilization in the steel-making process. At Lisakovsk, natural gas is supplied by KazTransGazAimak JSC and transmitted through the local grid. Electric power for the other facilities is supplied by Promsnab Astana LLP.
Kentobe is an open pit operation, initially started in 1983 and acquired by ArcelorMittal in 2002, located about 300 kilometers southeast of Temirtau, with production of 0.3 million tonnes of concentrate in 2020. Clearance for extension of the existing subsoil agreement until the end of 2026 was given by Kazakhstan Ministry of innovation and development and the addendum was signed on November 23, 2017. Ore processing is performed by crushing and dry magnetic separation, producing coarse concentrate. The Kentobe mine is located in the Balkhash metallogenic province hosting numerous volcanic, sedimentary and hydrothermal deposits. The mineralization at Kentobe includes two types of iron ore: oxidized and primary magnetite. The magnetite mineralization constitutes all the 2020 estimated ore reserves. Electric power is supplied to the Kentobe operations by Karaganda Energosbyt LLP.
Atasu is an underground mine operation located about 400 kilometers south/southwest from Temirtau with production of 1.3 million tonnes of lump and fines in 2020. The mine began operating in 1956 with open pit exploitation of near surface reserves. Surface operations ended in 1980. Underground operations commenced in 1976. The mining lease was obtained in 2003. The existing subsoil agreement expires at the end of 2026. Processing comprises of crushing and wet jigging. The Atasu mine is hosted by the West Karazhal deposit, which is a primary hematite ore with associated manganese mineralization. Studies have indicated that the deposit could have a sedimentary-volcanogenic origin caused by underwater hydrothermal activity. The mine receives electric power from the ABB Energo LLP.
Atansore is an open pit operation located about 500 kilometers northeast of Temirtau with production of 0.6 million tonnes of concentrate in 2020. Mining of the deposit commenced in 1996 and it was subsequently acquired by ArcelorMittal in 2004. The existing subsoil agreement expires at the end of 2029. The Atansor deposit is located within skarn zones related to a volcanic intrusion that can be traced for more than 1.5 kilometers. The mineralization includes both martitic oxidized ore and primary magnetite ore. Ore processing is performed by crushing and dry magnetic separation. At the Atansore operations, electric power is provided from the Kokshetauenergo center LLP.
In addition, ArcelorMittal Temirtau has eight captive underground coal mines and two coal preparation plants (CPP “Vostochnaya” and Temirtau Washery-2). In 1996 the mines entered into the
structure of Ispat-Karmet JSC, Coal Division (now ArcelorMittal Temirtau JSC, Coal Division). The coal mines of ArcelorMittal Temirtau are located in the Karaganda Coal Basin. The basin is more than 3,000 square kilometers and was formed by strata of Upper Devonian and Carbonic ages, Mesozoic and Cainozoic formations. Due to structural peculiarities, the coal basin is divided into three geology-based mining areas: Karagandinskiy, Sherubay-Nurinskiy and Tentekskiy.
The mines are located in an area with well-developed infrastructure around the regional center of Karaganda city. Within a distance of 10 to 60 kilometers are the following satellite towns: Shakhtinsk, Saran and Abay, as well as Shakhan and Aktas. All mines are connected to the main railway, and coal is transported by railway to the coal wash plants and power stations. Electric power is supplied to the Karaganda coal mines, via the ArcelorMittal Temirtau Steel division, by commercial electricity suppliers TOO KaragandaEnergoSbyt and TOO AV-Energo. ArcelorMittal owns and operates significant electricity infrastructure for power distribution across its properties.
The Kostenko mine merged with the neighboring Stakhanovskaya mine in 1998. The field of Kostenko mine falls within the Oktyabrskiy district of Karaganda city.
The Kuzembaeva mine was established in 1959. Later in 1998, 50-letiya SSSR mine was merged with Kuzembaeva mine. The eastern part of the mine borders with Karaganda City.
The Saranskaya mine began operations in 1955. It merged with the Sokurskaya mine in mid-1997 and the Aktasskaya mine in 1998. Karaganda City is located approximately 12 kilometers to the northeast.
The Abayskaya mine began operations in 1961. In 1996, it was merged with the Kalinina mine. Karaganda City is located approximately 25 kilometers to the northeast.
The Kazakhstanskaya mine began operations in 1969. Karaganda City is located approximately 40 kilometers to the northeast. The railway station at MPS-Karabas is located approximately 30 kilometers to the southeast.
The Lenina mine was put in operation in 1964 and was subsequently merged with Naklonnaya no. 1/2 mine in 1968. Karaganda City, located 50 kilometers to the northeast. The railway station MPS-Karabas is located 38 kilometers to the southeast.
The Shakhtinskaya mine began operations in 1973. Karaganda City is located approximately 35 kilometers to the northeast.
The Tentekskaya mine began operations in 1979. Karaganda City is located approximately 40 kilometers to the northeast. The
railway station MPS-Karabas is located approximately 39 kilometers to the southeast.
The Kostenko, Kuzembaeva, Saranskaya, Abayskaya, Kazakhstanskaya, Lenina, Shakhtinskaya and Tentekskaya mines, together with the Vostochnaya wash plant, receive energy from the high-voltage transmission lines of Karaganda.
The subsoil use contract and license (all coal mines in Temirtau) will be valid until January 21, 2022. The process of renewal is in progress and due for completion in late 2021. Total area under mineral rights is 28,638 hectares after a small portion of land was returned to the State.
The mines produce primarily coking coal used in steel-making at ArcelorMittal Temirtau as well as thermal coal for ArcelorMittal
Temirtau’s power plants. For beneficiation of coking coal, two washeries are operated. Surplus coal concentrate is supplied to ArcelorMittal Kryvyi Rih in Ukraine, and to external customers in Russia and China. In 2020, the Karaganda Coal Mines produced 3.6 million tonnes of metallurgical coal concentrate and approximately 2.4 million tonnes was consumed by the Temirtau steel operations.
Mining
ArcelorMittal’s Mining segment has iron ore production facilities in Canada and Africa. The following table provides an overview by type of facility of ArcelorMittal’s principal mining operations.
| | | | | | | | | | | | | | | | | | | | | | | | | | | | | | | | |
| Unit | | Country | | Locations | | ArcelorMittal Interest (%) | | Type of Mine | | Product |
| | | | | | | | | | |
| ArcelorMittal Mines and Infrastructure Canada | | Canada | | Mt Wright, Fire Lake and Port Cartier, Qc | | 85.0 | | Iron Ore Mine (open pit), pellet plant, railway and port | | Concentrate and pellets |
| ArcelorMittal Liberia | | Liberia | | Yekepa | | 85.0 | | Iron Ore Mine (open pit) | | Fines |
| | | | | | | | | | |
ArcelorMittal Mines and Infrastructure Canada
ArcelorMittal Mines and Infrastructure Canada ("AMMC") is a major Canadian producer of iron ore concentrate and several types of pellets. It holds mineral rights over 33,069 hectares of land in the province of Québec, Canada. ArcelorMittal Mines and Infrastructure Canada operates the Mont-Wright Mine and concentrator near Fermont in northeastern Québec. Mont-Wright is located 416 kilometers north of the port of Port-Cartier, the site of the pelletizing plant and shipping terminal on the north shore of the Gulf of St. Lawrence, and approximately 1,000 kilometers northeast of Montreal. A private railway connects the mine and concentrator with Port-Cartier. The railway and the port are owned and operated by the infrastructure operations of AMMC. The Mont-Wright mine and the town of Fermont are connected by Highway 389 to Baie Comeau on the North Shore of the Gulf of St. Lawrence, a distance of 570 kilometers. ArcelorMittal Mines and Infrastructure Canada also holds mineral rights to iron ore deposits in Fire Lake and Mont Reed. Fire Lake, which is an open pit mine located approximately 53 kilometers south of Mont-Wright, dispatched approximately 15.8 million tonnes of crude ore by rail to the Mont-Wright concentrator in 2020. The Fire Lake deposit was first mined in 1977 and the Mont Reed deposit is currently not developed. In addition, ArcelorMittal Mines and Infrastructure Canada holds surface rights over the land on which the Mont-Wright and Port Cartier installations are
located, with the exception of a small area which remains the property of the Quebec Government but in no way compromises the mineral rights. The property began operating in 1976.
The expiration dates of the mining leases range from 2025 to 2033. According to the Quebec Mining Act, a mining lease is renewable for at least three periods of ten years, provided the lessee has performed mining operations for at least two years in the previous ten years of the lease.
The Mont-Wright and Fire Lake mines are part of the highly-folded and metamorphosed southwestern branch of the Labrador Trough. The most important rock type in the area is the specular hematite iron formation forming wide, massive deposits that often form the crest of high ridges extending for many kilometers in the Quebec-Labrador area.
The Fire Lake operation produces run of mine ore for transport to Mont Wright by rail. The site has a maintenance facility and workers camp that support the mining activity. The Mont-Wright operation consists of open pit mines and a concentrator. The ore is crushed in two gyratory crushers and the concentrator operates with seven lines of three stage spiral classifiers and horizontal filters. The mining complex and infrastructure has a production capacity of approximately 26 million tonnes of concentrate per year. The Port-Cartier pellet plant produces acid and flux pellets that operate six ball mills, ten balling discs and
two induration furnaces. The pelletizing plant has a capacity of 10 million tonnes of pellets per year.
The COVID-19 pandemic impacted production at ArcelorMittal Mines and Infrastructure Canada early in 2020. A directive from the Quebec Government restricted mining activities to a minimum level in the province of Quebec, Canada beginning March 24, 2020. As restrictions subsequently eased, normal operations resumed on May 3, 2020. The pelletizing plant produced 8.7 million tonnes of pellets in addition to 14.5 million tonnes of concentrate in 2020.
Electric power for Mont-Wright and the town of Fermont is supplied by Hydro-Quebec via a 157 kilometer line. In the event of an emergency, the Hart Jaune Power plant, also connected to the Hydro-Quebec grid, can supply sufficient power to maintain the operations of the essential processing facilities.
ArcelorMittal Liberia
ArcelorMittal Liberia Holdings Limited (“AMLH”), through its agent (and subsidiary) ArcelorMittal Liberia Limited (“AML”), has been mining ‘direct shipping ore, or DSO’ from the Mt. Tokadeh and Mt. Gangra deposits in northern Nimba, Liberia since June 2011. AML signed a Mineral Development Agreement (“MDA”) in 2005 with the Government of Liberia (“GOL”) that is valid for 25 years and renewable for an additional 25-year period. The mining operations are located approximately 300 kilometers northeast of Monrovia, Liberia. Three deposits within the MDA are grouped under the name “Western Range Project”, which includes the Mt. Tokadeh, Mt. Gangra and Mt Yuelliton deposits, covering 51,651.5 hectares. In addition to the rights to explore and mine iron ore, the GOL has granted the right to develop, use, operate and maintain the Buchanan to Yekepa railroad and the Buchanan port. A phased approach has been taken to establish the final project configuration. Currently, only high grade ore reserves of oxidized iron ore (DSO) are mined. This ore only requires crushing and screening to make it suitable for export. The materials-handling operation consists of stockyards at both the mine and port areas, linked by a 250-kilometer single track railway running from Tokadeh to the port of Buchanan. Production in 2020 was at 5.1 million tonnes, focused on the Atlantic markets. The power for the current Liberia DSO operations was previously obtained from on-site diesel based power generation. In 2019, the Company completed construction of a powerline in order to switch to a cleaner grid supply (mix of hydropower and gas). From early 2019, the mine commenced partial reliance on the grid power supply but
continues to use partial diesel gensets to prevent disruption to production.
The Nimba Itabirites is a 250 to 450 meter thick recrystallized iron formation. Although the iron deposits at Mt. Tokadeh, Mt. Gangra and Mt Yuelliton fit the general definition of Itabirite as laminated metamorphosed oxide-facies iron formation, they are of lower iron grade than the ore previously mined at Mount Nimba. Tropical weather effects have caused the decomposition of the rock forming minerals resulting in enrichment in the iron content that is sufficient to support a DSO operation.
Planning and construction of the project were commenced in 1960 by a group of Swedish companies, which ultimately became the Liberian American-Swedish Minerals Company (“LAMCO”), and production commenced on the Nimba deposit in 1963. Production reached a peak of 12 million metric tonnes in 1974 but subsequently declined due to market conditions. Production started at Mt. Tokadeh in 1985 to extend the life of the Nimba ore bodies to 1992 when operations ceased due to the Liberian civil war. In 2005, Mittal Steel won a bid to resume operations and signed the MDA with the GOL. Rehabilitation work on the railway started in 2008 and, in June 2011, ArcelorMittal started mining operations at Tokadeh, followed by a first shipment of iron ore in September 2011.
In 2013, AML had started construction of a Phase 2 project that envisaged the construction of 15 million tonnes of concentrate sinter fines capacity and associated infrastructure; this project was then suspended due to the onset of Ebola in West Africa and the subsequent force majeure declaration by the onsite contracting companies. AML has now completed the revised detailed feasibility study (which was updated in 2019 to apply best available technology and replace wet with dry stack tailings treatment) for building a 15 million tonne concentrator (Phase 2), with aligned mine, concentrate, rail and port capacity. The plan is now to recommence the project in 2021, with first concentrate expected in the fourth quarter of 2023. The capital expenditures required to conclude the project are expected to total approximately $0.8 billion as the project is effectively a brownfield opportunity given that 85% of the procurement has already been done (with the equipment on site) and 60% of the civil construction complete.
| | | | | | | | | | | | | | | | | | | | | | | | | | | | | | | | |
| Investments in joint ventures | | | | | | | | | | |
| | | | | | | | | | |
| Unit | | Country | | Locations | | Capacity in 2020 (in million tonnes per year) 1 | | Type of plant | | Products |
| AMNS India | | India | | Hazira, Gujarat | | 9 1 | | Integrated | | Flat |
| AMNS Calvert | | United States | | Calvert | | 5.3 2 | | Steel processing | | Steel finishing |
| VAMA | | China | | Loudi, Hunan | | 1.5 3 | | Steel processing | | Automotive steel finishing |
1.Crude steel capacity
2.Flat-rolled carbon steel products production capacity
3.Cold rolled coils, aluminum coils, hot-dip galvanized coils production capacity.
AMNS India
On December 11, 2019, following the unconditional approval received by the Indian Supreme Court of ArcelorMittal's Resolution Plan for Essar Steel India Limited ("ESIL" subsequently renamed AMNS India) on November 15, 2019, ArcelorMittal and NSC, Japan’s largest steel producer and the third largest steel producer in the world, created a joint venture to own and operate AMNS India with ArcelorMittal holding a 60% interest and NSC holding 40% in accordance with the second amended joint venture formation agreement signed as of December 8, 2019.
AMNS India is an integrated flat steel producer, and the largest steel company in western India. AMNS India’s main steel manufacturing facility is located at Hazira, Gujarat in western India. It also has:
–two iron ore beneficiation plants close to the mines in Kirandul and Dabuna, with slurry pipelines that then transport the beneficiated iron ore slurry to the pellet plants in the Kirandul-Vizag and Dabuna-Paradeep systems;
–a downstream facility in Pune (including a pickling line, a cold rolling mill, a galvanizing mill, a color coating mill and a batch annealing plant); and
–seven service centers in the industrial clusters of Hazira, Bhuj, Indore, Bahadurgarh, Chennai, Kolkata and Pune. It has a complete range of flat rolled steel products, including value added products, and significant iron ore pellet capacity with two main pellet plant systems in Kirandul-Vizag and Dabuna-Paradeep, which have the potential for expansion. Its facilities are located close to ports with deep draft for movement of raw materials and finished goods.
In terms of iron ore pellet capacity, the Kirandul-Vizag system has 8 million tonnes of annual pellet capacity; and the Dabuna-Paradeep system has 6 million tonnes of annual pellet capacity, which is in the process of being expanded to a new capacity level of 12 million tonnes (with the completion expected by the end of the first quarter of 2021). This expansion would bring
pellet capacity above AMNS India’s own requirements and provide the opportunity to improve operating income by fully utilizing such pellet capacity. AMNS India has also made acquisitions of certain ancillary assets including, in February 2020, the acquisition of the Thakurani iron ore block (which is expected to operate at full capacity by the end of the first quarter of 2021 see below) and, in July 2020, the acquisition of the Odisha Slurry Pipeline infrastructure Limited for a net acquisition price of $245 million, which secures an important infrastructure asset for raw material supply to the Hazira steel plant. AMNS India also intends to debottleneck the existing operations (steel shop and rolling parts) to increase production to 8.6 million tonnes of rolled products. Over the next 5 years, the production capacity at the Hazira facility is planned to increase further from 8.6 million tonnes to 14 million tonnes of rolled products following the construction of coke oven, sinter plant, blast furnace, basic oxygen furnace and hot strip mill. Finally, AMNS India is evaluating downstream auto product expansion at the Hazira site to improve its product portfolio and serve the growing automotive demand in India.
On March 4, 2021, AMNS India and the Odisha government signed a memorandum of understanding for setting up a 12 million tonne integrated steel plant in Kendrapara district of Odisha with an investment of INR 50,000 Crore, subject to several pre-conditions, including making provisions for land and iron ore mines.
In the context of the creation of the joint venture, the Company has also transferred certain payments it had been required to make in 2018 and 2019 to the financial creditors of Uttam Galva in order that the Resolution Plan would be eligible for consideration by ESIL's Committee of Creditors. The joint venture partners continue to assess various options to secure the availability of additional ancillary assets, such as port facilities.
The Resolution Plan includes a capital expenditure plan of approximately $2.6 billion to be implemented in two stages over
six years. The first stage involves investments to increase the production of finished steel goods sustainably to 6.5 million tonnes per annum and includes completion of ongoing capital expenditure projects with respect to a coke oven, second sinter plant, third line CSP caster, Paradeep pellet plant and Dabuna beneficiation plant. The first stage will also include investment in maintenance to restore current assets, the implementation of an environmental management plan and the implementation of ArcelorMittal’s best practices on raw material sourcing, plant operations, sales and product mix (in particular through greater sophistication of the quality and markets of the steel produced with a focus on developing sales to the automotive industry), people management and health & safety. The second stage will involve investments to increase the production of finished steel goods from 6.5 million tonnes per annum to 8.5 million tonnes per annum by the end of 2024, including asset reconfiguration and the addition of a coke oven, blast furnace and basic oven furnace.
In addition to its steel operations, AMNS India operates the Thakurani Iron Ore mine in the Odisha state of India. AMNS India holds surface mineral rights over 228 hectares to support its Thakurani operations, located 320km to the north of the Odisha capital Bhubaneswar and 4km east of the town of Barbil.
The operation and mining rights to the Thakurani operations were obtained by AMNS India in February 2020 through the Indian Government Mining Block auction scheme. The Thakurani open pit mine has been operated since 1961 and has both mature mining pits and undeveloped resource areas. AMNS India commenced mining operations in mid-2020, producing 1.6 million tonnes of DSO product in 2020, following the demobilization of the previous claim holder, Kaypee Enterprises. At the commencement of mining, AMNS India has a permit in place for 5.5 million tonnes per year of ore production for internal consumption only, and the ramp-up to capacity of 5 million tonnes per year is expected to be completed by the end of the first quarter of 2021. The mining lease deed was executed on June 27, 2020 for a period of 50 years to June 26, 2070. Until June 27, 2021 all production from the mine must be consumed by specified AMNS India end use plants, after which up to 25% of production may be sold to a third party. A submission approved by the Indian Bureau of Mines in late 2020, will increase the permitted production rate to 7.99 million tonnes per year from 2023.
Ore from the Thakurani operation is crushed and screened on site before being transported by road to the Dabuna beneficiation plant located approximately 40km to the south. Beneficiated material is then transported by slurry pipeline to the pelletizing plant at Paradip, located on the coast. Power requirements for the site infrastructure at Thakurani, including crushing and screening units, workshop and site offices is
supplied by a combination of 11kV electricity grid power and diesel generators.
The Thakurani operations lie in the south eastern part of the Singhbhum-Keonjhar-Bonai iron ore belt, a narrow NNE-SSW directional trending folded syncline that runs through northern Odisha, India and southern Jharkhand, India. The Precambrian horseshoe shaped belt is a well known iron ore province hosting many iron ore deposits. The enriched sequence is a traditional Banded Iron Formation that has been subject to significant weathering that has enriched the iron ore deposits. Ore is generally of the friable hematite type however more competent hematite ores and friable goethite ores are also present.
Calvert
AMNS Calvert ("Calvert"), a joint venture between the Company and NSC, is a steel processing plant in Calvert, Alabama, United States. It's 2,500 acre property layout allows for optimal product flow and room to expand. It has a HSM with 5.3 million tonnes capacity, pickling and cold rolling facilities with 3.6 million tonnes capacity and finishing facilities with a total capacity of 2.1 million tonnes. Calvert had a 6-year agreement to purchase 2 million tonnes of slabs annually from ThyssenKrupp Steel USA ("TK CSA"), an integrated steel mill complex located in Rio de Janeiro, Brazil, using a market-based price formula. TK CSA had an option to extend the agreement for an additional 3 years on terms that are more favorable to the joint venture, as compared with the initial 6-year period. In December 2017 and in connection with the acquisition of TK CSA by Ternium S.A., the agreement was amended to (i) extend the term of the agreement to December 31, 2020, (ii) make a corresponding reduction in the annual slab purchase obligation so that the aggregate slab purchase obligation over the full term of the agreement remained the same and (iii) eliminate TK CSA’s extension option. The remaining slabs for Calvert's operations are sourced from ArcelorMittal plants in Brazil and Mexico and from ArcelorMittal USA, which following the divestment to Cleveland-Cliffs, entered on December 9, 2020 into a new five year agreement with Calvert (with an automatic three year extension unless either party provides notice of intent to terminate) for 1.5 million tonnes annually for the initial term and 0.55 million tonnes annually under the extension and which, in each case, can be reduced with a six month notice. ArcelorMittal is principally responsible for marketing the product on behalf of the joint venture. Calvert serves the automotive, construction, pipe and tube, service center and appliance/ HVAC industries.
Calvert plans to invest $775 million for an on-site steelmaking facility through a 1.5 million tonne capacity EAF (produce slabs for the existing operations, replacing part of the purchased slabs). The environmental permitting has been submitted, equipment manufacturer selection is ongoing and pre-construction activities are underway. Construction is expected to commence in 2021 and the facility is expected to start in the first
half of 2023. The plan includes an option to add further capacity at lower capital expenditure intensity.
VAMA
Valin ArcelorMittal Automotive Steel (“VAMA”) is a joint venture between ArcelorMittal and Hunan Valin which produces steel (1.5 million tonne capacity) for high-end applications in the automotive industry. VAMA supplies international automakers and first-tier suppliers as well as Chinese car manufacturers and their supplier networks. It is well positioned to take advantage of the growing electric vehicle market and has plans to increase capacity by 40% in the next two years to 2 million tonnes with self-funded expansion capital expenditures expected to be $160 million.
Capital expenditures
The Company’s capital expenditures were $2.4 billion, $3.6 billion and $3.3 billion for the years ended December 31, 2020, 2019 and 2018, respectively. The Company responded to the COVID-19 impact with actions taken to reduce production and adapt its costs to the operating environment. All non-essential capital expenditures were suspended, while the Mexico hot strip mill project, the agreed Italian projects and certain projects to reduce CO2 emissions continued, and maintenance capital expenditures were intended to match reduced operating rates. The following tables summarize the Company’s principal investment projects involving significant capital expenditures completed in 2020 and those that are currently ongoing. In 2021, capital expenditures are expected to be approximately $2.8 billion. ArcelorMittal expects to fund these capital expenditures primarily through internal sources. See “Operating and financial review—Liquidity and capital resources—Sources and uses of cash—Net cash used in investing activities” and note 3.1 to the consolidated financial statements for further information, including capital expenditures by segment.
Completed projects in the past year
| | | | | | | | | | | | | | | | | | | | | | | | | | | | | | | | |
| Region | | Site | | Project | | Capacity / particulars | | Actual completion | | Note # |
| ACIS | | ArcelorMittal Kryvyi Rih (Ukraine) | | New LF&CC 2 | | Facilities upgrade to switch from ingot to continuous caster route. Additional billets of 145 thousand tonnes over ingot route through yield increase | | Q1 2020 | | |
| | | | | | | | | | | | | | | | | | | | | | | | | | | | | | | | |
| Ongoing Projects* | | |
| Region | | Site | | Project | | Capacity / particulars | | Forecast completion | | Note # |
| NAFTA | | Mexico | | New Hot Strip Mill | | Production capacity of 2.5 million tonnes per year | | 2021 | | a |
| NAFTA | | ArcelorMittal Dofasco (Canada) | | Hot Strip Mill Modernization | | Replace existing three end of life coilers with two state of the art coilers and new runout tables. | | 2021 | | b |
| NAFTA | | ArcelorMittal Dofasco (Canada) | | #5 CGL conversion to AluSi® | | Addition of up to 160 thousand tonnes per year Aluminum Silicon (AluSi®) coating capability to #5 Hot-Dip Galvanizing Line for the production of Usibor® steels | | H2 2022 | | c |
| Brazil | | ArcelorMittal Vega do Sul | | Expansion project | | Increase hot dipped/cold rolled coil capacity and construction of a new 700 thousand tonne continuous annealing line (CAL) and continuous galvanizing line (CGL) combiline | | Q4 2023 | | d |
| Mining | | Liberia | | Phase 2 premium product expansion project | | Increase production capacity to 15 million tonnes per year | | Q4 2023 | | e |
| Brazil | | Juiz de Fora | | Melt shop expansion | | Increase in melt shop capacity by 0.2 million tonnes/year | | On hold | | f |
| Brazil | | Monlevade | | Sinter plant, blast furnace and melt shop | | Increase in liquid steel capacity by 1.2 million tonnes/year; | | On hold | | f |
* Ongoing projects refer to projects for which construction has begun (excluding various projects that are under development), even if such projects have been placed on hold pending improved operating conditions.
a.On September 28, 2017, ArcelorMittal announced a major $1 billion, investment program at its Mexican operations, which is focused on building ArcelorMittal Mexico’s downstream capabilities, sustaining the competitiveness of its mining operations and modernizing its existing asset base. The program is designed to enable ArcelorMittal Mexico to meet the anticipated increased demand requirements from domestic customers, realize in full ArcelorMittal Mexico’s production capacity of 5.3 million tonnes and significantly enhance the proportion of higher added-value products in its product mix. The main investment will be the construction of a new hot strip mill. Upon completion, the project will enable ArcelorMittal Mexico to produce approximately 2.5 million tonnes of flat rolled steel, long steel approximately 1.8 million tonnes and the remainder made up of semi-finished slabs. Coils from the new hot strip mill will be supplied to domestic, non-auto, general industry customers. The hot strip mill project commenced late in the fourth quarter of 2017 and is expected to be completed at the end of 2021 (with capital expenditures of approximately $0.2 billion in 2021).
b.Investment in ArcelorMittal Dofasco (Canada) to modernize the hot strip mill. The project is to install two new state of the art coilers and runout tables to replace three end of life coilers. The strip cooling system will be upgraded and include innovative power cooling technology to improve product capability. The project is expected to be completed in 2021.
c.Investment of approximately $0.1 billion to replace #5 Hot-Dip Galvanizing Line Galvanneal coating capability with 160 thousand tonnes per year Aluminum Silicon (AluSi®) capability for the production of ArcelorMittal’s patented Usibor® Press Hardenable Steel for automotive structural and safety components. With the investment, ArcelorMittal Dofasco will become the only Canadian producer of AluSi® coated Usibor®. This investment complements additional strategic North America developments, including a new EAF at Calvert in the US and a new hot strip mill in Mexico, and will allow to capitalize on increasing Auto Aluminized PHS demand in North America. The project is expected to be completed in 2022, with the first coil planned for the second half of 2022.
d.In February 2021, ArcelorMittal announced the resumption of the Vega Do Sul expansion to provide an additional 700 thousand tonnes of cold-rolled annealed and galvanized capacity to serve the growing domestic market. The approximately $0.35 billion investment program to increase rolling capacity with construction of a new continuous annealing line and CGL combiline (and the option to add an approximately 100 thousand tonnes organic coating line to serve construction and appliance segments), and upon completion, will strengthen ArcelorMittal’s position in the fast growing automotive and industry markets through AHSS products. The investments will look to facilitate a wide range of products and applications whilst further optimizing current ArcelorMittal Vega facilities to maximize site capacity and its competitiveness, considering comprehensive digital and automation technology. The project is expected to be completed the fourth quarter of 2023.
e.ArcelorMittal Liberia has been operating a 5 million tonnes direct shipping ore (DSO) since 2011 (Phase 1). In 2013, the Company had started construction of a Phase 2 project that envisaged the construction of 15 million tonnes of concentrate sinter fines capacity and associated infrastructure; this project was then suspended due to the onset of Ebola in West Africa and the subsequent force-majeure declaration by the onsite contracting companies. ArcelorMittal Liberia has now completed the revised detailed feasibility study (which was updated in 2019 to apply best available technology and replace wet with dry stack tailings treatment) for the modular build of a 15 million tonne concentrator (Phase 2), with aligned mine, concentrator, rail and port capacity. The plan is now to recommence the project in 2021, with first concentrate expected in the fourth quarter of 2023. The capital expenditures required to conclude the project are estimated at approximately $0.8 billion as the project is effectively a brownfield opportunity given that 85% of the procurement has already been done (with the equipment on site) and 60% of the civil construction complete.
f.Although the Monlevade wire rod expansion project and Juiz de Fora rebar expansion were completed in 2015, both the melt shop expansion (in Juiz de Fora) and the sinter plant, blast furnace and meltshop (in Monlevade) projects are currently on hold and are expected to be completed upon Brazil domestic market recovery.
In addition, in 2020 the Company approved 32 multi-year projects with identified environmental benefits and involving capital expenditures of $396 million and 20 multi-year projects with the identified energy benefits and involving capital expenditures of $248 million. See also further information on key environmental projects in "—Sustainable development".
ArcelorMittal's joint ventures have also announced significant capital expenditure projects. See "Property, plant and equipment—Investments in joint ventures".
Updates on previously announced investment projects
In addition to the significant investment projects presented in the above table, the Company had previously announced several large investment projects. The status of certain of such projects as of the date of this annual report is described below. While the Company continues to study certain of its key previously announced investment projects summarized below, no assurance can be given that they will proceed.
India greenfield projects. The Company explored investment opportunities in India and in June 2010, entered into a memorandum of understanding with authorities in the state of Karnataka in South India that envisaged the construction of a six million tonnes steel plant with a captive 750 megawatt power plant, representing a potential aggregate investment of $6.5 billion. The Company completed all the necessary formalities for acquiring the land by signing and executing a lease cum sale agreement for 2643.25 acres of land on December 26, 2018 and the project is currently under review.
Baffinland (Canada). In March 2011, ArcelorMittal acquired 70% of the Mary River mine project, with Nunavut Iron Ore Inc. (“NIO”), an affiliate of The Energy and Minerals Group (“EMG”), owning the remaining 30%. This project consists of an open pit high-grade iron ore mine located in the Mary River area of Baffin Island, Nunavut (Canada). In February 2013, ArcelorMittal and
NIO entered into a joint arrangement and equalized their shareholdings at 50/50. The project began commercial production in 2016. Subsequently, following equity funding commitments and conversion of preferred shares into equity, both exercised by NIO only, ArcelorMittal’s share over time decreased to 25.70% as of December 31, 2019 and 25.23% as of December 31, 2020. In September 2020, the corporate structure was reorganized whereby NIO became the parent company of Baffinland, while ArcelorMittal together with EMG became shareholders of NIO with ArcelorMittal’s share in NIO. Following this reorganization, ArcelorMittal retained its participation in the project, holding a 25.23% share in NIO.
Baffinland has also approved Phase 3 of the project, which involves the construction of a railway, to replace the existing truck-haul operation for transport of iron ore from Mary River to Milne Inlet, as well as expansion of mining, crushing and screening operations and port ship loading capacity. Approximately $1,385 million of capital expenditures were budgeted for Phase 3, to be funded with operating cash flows, additional equity and new debt. By mid-2020, NIO completed its exclusive equity funding commitment of $575 million towards Phase 3. Subject to certain conditions, ArcelorMittal has an option to provide up to $85 million of equity funding, which expires on March 31, 2023 (as agreed as part of the reorganization described above).
Between August 2016 and June 2018, ArcelorMittal and EMG shared operator rights for Baffinland’s operations. Since July 2018 the project has been operated by EMG. ArcelorMittal’s marketing rights expired at the end of 2019. For the duration of 2020, ArcelorMittal provided transitional marketing services to Baffinland.
Reserves (iron ore and coal)
Introduction
ArcelorMittal has both iron ore and metallurgical coal reserves. The Company’s iron ore mining operations are located in Canada, Mexico, Brazil, Liberia, India (via a joint venture), Bosnia, Ukraine and Kazakhstan. The Company’s metallurgical coal mining operations are located in Kazakhstan. The iron ore and coal mining operations in the United States were sold on December 9, 2020, see "Introduction–Key transactions and events in 2020" for further information.
The estimates of proven and probable mineral reserves at the Company’s mines and projects and the estimates of the mine life included in this annual report have been prepared by ArcelorMittal experienced engineers and geologists, with the exception of the Las Truchas and San Jose mines in 2019 and 2020 (consolidated as Mexico, excluding Peña Colorada in the tables below) where the mineral reserve estimates were prepared by Gustavson Associates, the Thakurani Iron Ore Mine in 2020 (consolidated as India in the tables below) where the mineral reserve estimate was prepared by BMRC Geomining Solutions LLP, and Ukraine open pit (ArcelorMittal Kryvyi Rih Open Pit), where 2019 mineral reserve estimates considering full life of mine design were prepared by KAI Ltd. All mineral reserve estimates as of December 31, 2019 and 2020 were prepared in compliance with the requirements of SEC Industry Guide 7.
In the CIS, ArcelorMittal has conducted in-house and independent reconciliations of ore reserve estimate classifications based on SEC Industry Guide 7 and standards used by the State Committee on Reserves, known as the GKZ, or its national equivalent, in the former Soviet Union countries. The GKZ, or its national equivalent, constitutes the legal framework for ore reserve reporting in former Soviet Union countries, where ArcelorMittal operates mines. Based on these reconciliations, ArcelorMittal’s mineral reserves have been estimated by applying mine planning, technical and economic assessments defined as categories A, B and C1 according to the GKZ standards. In general, provided Industry Guide 7’s economic criteria are met (which is the case here), Category A+B is equivalent to “proven” and C1 is equivalent to “probable” reserves.
•Reserves are the part of a mineral deposit that could be economically and legally extracted or produced at the time of the reserve determination.
•Proven reserves are reserves for which (a) quantity is computed from dimensions revealed in outcrops, trenches, workings or drill holes; grade and/or quality are computed from the results of detailed sampling; and (b) the sites for inspection, sampling and
measurement are spaced so closely and the geologic character is so well defined that size, shape, depth and mineral content of reserves are well-established.
•Probable reserves are reserves for which quantity and grade and/or quality are computed from information similar to that used for proven reserves, but the sites for inspection, sampling and measurement are farther apart or are otherwise less adequately spaced. The degree of assurance, although lower than that for proven reserves, is high enough to assume continuity between points of observation.
The demonstration of economic viability is established through the application of a life of mine plan for each operation or project providing a positive net present value on a cash-forward looking basis, considering the entire value chain. Economic viability is demonstrated using forecasts of operating and capital costs based on historical performance, with forward adjustments based on planned process improvements, changes in production volumes and in fixed and variable proportions of costs, and forecasted fluctuations in costs of raw material, supplies, energy and wages. Mineral reserve estimates are updated annually in order to reflect new geological information and current mine plan and business strategies. The Company’s reserve estimates are of in-place material after adjustments for mining depletion and mining losses and recoveries, with no adjustments made for metal losses due to processing. For a description of risks relating to reserves and reserve estimates, see “Introduction—Risk factors—Risks related to ArcelorMittal’s Mining Activities—ArcelorMittal’s reserve estimates may materially differ from mineral quantities that it may be able to actually recover; ArcelorMittal’s estimates of mine life may prove inaccurate; and market price fluctuations and changes in operating and capital costs may render certain ore reserves uneconomical to mine”.
Detailed independent verifications of the methods and procedures used are conducted on a regular basis by external consultants and mineral reserves are reviewed on a rotating basis. In 2019, SRK Consulting (UK) Limited conducted the independent audit of the mineral reserve estimates for ArcelorMittal Kazakhstan's iron ore open pit and underground operations confirming the accuracy of the 2018 iron ore estimates. SRK Consulting (UK) Limited also conducted the review of the life of mine plan that was used as a basis for the 2019 and 2020 coal mineral reserves estimates for ArcelorMittal Kazakhstan's Karaganda coal operations. Recommendations made by SRK Consulting (UK) Limited in relation to the mineral reserves estimate for 2019 are being implemented by ArcelorMittal, and confirmation of reserves will be completed in 2021 following implementation of recommendations. Furthermore, in 2019, the mineral reserve estimates for ArcelorMittal Ukraine's open pit (ArcelorMittal Kryvyi Rih Open
Pit), considering full life of mine design, were prepared by KAI with support from ArcelorMittal's local team. These estimates were independently reviewed by SRK Consulting (Canada) Inc. in 2019 and improvement actions were proposed. The improvement actions have been progressively implemented during 2020, with the support of SRK Consulting (Canada) Inc. Following recommendations made in 2018 regarding the Fire Lake and Mont Wright deposits in Canada, in 2019 SRK Consulting (Canada) Inc. conducted pit optimization and strategic mine planning, designed ultimate pits and phases, and assisted in developing a long-term production schedule with up to date technical and economical parameters with respect to AMMC's 2019 iron ore mineral reserve estimates. A second independent consultant BBA Inc. conducted a review of the overall work performed by SRK Consulting (Canada) Inc., completed further detailed design work and confirmed increased iron ore mineral reserves for Canada in 2019, which were used as a base for 2020 iron ore mineral reserve estimates.
ArcelorMittal owns less than 100% of certain mining operations; mineral reserve estimates have not been adjusted to reflect ownership interests and therefore reflect 100% of mineral reserves of each mine. Please see the table below for ArcelorMittal’s ownership interest in each mine. All of the reserves presented are estimates at December 31, 2020 (unless otherwise stated).
Mine life is derived from the life of mine plans and corresponds to the duration of the mine production scheduled from mineral reserve estimates only.
The Company’s mineral leases are of sufficient duration (or convey a legal right to renew for sufficient duration) to enable all ore reserves on the leased properties to be mined in accordance with current production schedules. The Company’s mineral reserves may include areas where some additional approvals remain outstanding but where, based on the technical investigations the Company carries out as part of its mine planning process and its knowledge and experience of the approvals process, the Company expects that such approvals will be obtained as part of the normal course of business and within the timeframe required by the current life of mine schedule.
The reported iron ore and coal reserves contained in this annual report do not exceed the quantities that the Company estimates could be extracted economically if future prices were at similar levels to the average contracted price for the three years ended December 31, 2020. The average iron ore spot reference price for the last three years (2018-2020) was $90.81 per tonne (delivered to China, Qingdao 62% Fe US $ per tonne, Metal Bulletin). For the same period, the average coal spot reference price was $168.86 per tonne (Premium HCC FOB Aus, Metal Bulletin). The Company establishes optimum design and future operating cut-off grade based on its forecast of commodity prices and operating and sustaining capital costs. The cut-off grade varies from operation to operation and during the life of each operation in order to optimize cash flow, return on investments and the sustainability of the mining operations. Such sustainability in turn depends on expected future operating and capital costs. The reserve base can vary from year to year due to the revision of mine plans in response to market and operational conditions, in particular market price. See “Introduction—Risk factors—Risks related to ArcelorMittal’s Mining Activities—ArcelorMittal’s reserve estimates may materially differ from mineral quantities that it may be able to actually recover; ArcelorMittal’s estimates of mine life may prove inaccurate; and market price fluctuations and changes in operating and capital costs may render certain ore reserves uneconomical to mine”.
Tonnage and grade estimates are reported as ‘Run of Mine’. Tonnage is reported on a wet metric basis.
Iron ore reserve estimates
The tables below detail ArcelorMittal’s estimated iron ore reserves as of December 31, 2020. The classification of the iron ore reserve estimates as proven or probable reflects the variability in the mineralization at the selected cut-off grade, the mining selectivity and the production rate and ability of the operation to blend the different ore types that may occur within each deposit. At ArcelorMittal mining operations, proven iron ore reserve estimates are typically based on drill hole spacing ranging from 25m x 25m to 100m x 100m, and probable iron ore reserve estimates are based on drill hole spacing ranging from 50m x 50m to 300m x 300m.
| | | | | | | | | | | | | | | | | | | | | | | | | | | | | | | | | | | | | | | | | | | | | | | | | | |
| | As of December 31, 2020 | | As of December 31, 2019 |
| | Proven Ore Reserves | | Probable Ore Reserves | | Total Ore Reserves | | Total Ore Reserves |
| | Millions of Tonnes | | % Fe1 | | Millions of Tonnes | | % Fe1 | | Millions of Tonnes | | % Fe1 | | Millions of Tonnes | | % Fe1 |
| Canada | | 2,118 | | | 29.3 | | | 190 | | | 29.0 | | | 2,308 | | | 29.3 | | | 2,405 | | | 29.5 | |
| | | | | | | | | | | | | | | | |
Minorca - USA2 | | — | | | — | | | — | | | — | | | — | | | — | | | 130 | | | 23.7 | |
Hibbing - USA2 | | — | | | — | | | — | | | — | | | — | | | — | | | 131 | | | 19.8 | |
| Mexico (Excluding Peña Colorada) | | 11 | | | 37.7 | | | 109 | | | 31.0 | | | 120 | | | 31.6 | | | 116 | | | 31.2 | |
| Peña Colorada - Mexico | | 104 | | | 22.4 | | | 150 | | | 21.2 | | | 254 | | | 21.7 | | | 201 | | | 21.5 | |
| Brazil | | 50 | | | 55.2 | | | 40 | | | 49.4 | | | 90 | | | 52.6 | | | 93 | | | 52.8 | |
| Liberia | | 7 | | | 52.1 | | | 468 | | | 47.7 | | | 475 | | | 47.7 | | | 480 | | | 47.9 | |
India3,4 | | — | | | — | | | 85 | | | 61.1 | | | 85 | | | 61.1 | | | — | | | — | |
| Bosnia | | 5 | | | 48.9 | | | 5 | | | 45.7 | | | 10 | | | 47.3 | | | 12 | | | 47.0 | |
| Ukraine Open Pit | | 75 | | | 33.2 | | | 508 | | | 34.5 | | | 583 | | | 34.3 | | | 609 | | | 34.4 | |
| Ukraine Underground | | 8 | | | 54.4 | | | 19 | | | 54.4 | | | 27 | | | 54.4 | | | 27 | | | 54.4 | |
| Kazakhstan Open Pit | | 1 | | | 37.0 | | | 117 | | | 39.3 | | | 118 | | | 39.2 | | | 122 | | | 39.3 | |
| Kazakhstan Underground | | 1 | | | 41.6 | | | 19 | | | 45.4 | | | 20 | | | 45.2 | | | 22 | | | 45.2 | |
| Total | | | | | | | | | | 4,089 | | | 33.5 | | | 4,348 | | | 32.4 | |
1.% Fe represents total Fe content for all sites except Pena Colorada - Mexico where it represents magnetic Fe content only
2.The mining operations in the United States were sold on December 9, 2020, see "Introduction—Key transactions and events in 2020".
3.During 2020, the Company's joint venture AMNS India began operating the mine presented under India (no data available for 2019). See note 2.4.1 to the consolidated financial statements
4.Production from the Thakurani mine presented under India is permitted for internal consumption only. Until June 27 2021 all production from the mine must be consumed by specified AMNS India end use plant, after which up to 25% of production may be sold to a third party
Supplemental information on iron ore operations
The table below provides supplemental information on the producing mines.
| | | | | | | | | | | | | | | | | | | | | | | | | | | | | | | | |
| Operations/Projects | | % Ownership | | In Operation Since | | 2020 Run of Mine Production (Million Tonnes)3 | | 2020 Saleable Production (Million Tonnes)1, 3 | | Estimated Mine Life (Years)2 |
| Canada | | 85 | | 1976 | | 67.0 | | | 23.2 | | | 32 |
| | | | | | | | | | |
| Minorca - USA | | Sold | | 1977 | | 8.1 | | | 2.7 | | | NA |
| Hibbing - USA | | Sold | | 1976 | | 19.7 | | | 5.0 | | | NA |
| Mexico (Excluding Peña Colorada) | | 100 | | 1976 | | 7.4 | | | 2.8 | | | 16 |
| Peña Colorada - Mexico | | 50 | | 1974 | | 11.4 | | | 3.8 | | | 18 |
| Brazil | | 100 | | 1944 | | 4.5 | | | 3.2 | | | 42 |
| Liberia | | 85 | | 2011 | | 5.3 | | | 5.1 | | | 24 |
| India | | 60 | | 1961 | | 1.8 | | | 1.6 | | | 11 |
| Bosnia | | 51 | | 2008 | | 1.9 | | | 1.4 | | | 7 |
| Ukraine Open Pit | | 95 | | 1959 | | 24.9 | | | 10.7 | | | 25 |
| Ukraine Underground | | 95 | | 1933 | | 0.6 | | | 0.6 | | | 31 |
| Kazakhstan Open Pit | | 100 | | 1976 | | 3.3 | | | 2.0 | | | 44 |
| Kazakhstan Underground | | 100 | | 1956 | | 1.8 | | | 1.3 | | | 9 |
1.Saleable production is constituted of a mix of direct shipping ore, concentrate, pellet feed and pellet products which have an iron content of approximately 64% to 66%. Exceptions in 2020 included the shipping of ore produced in Bosnia, Ukraine Underground and the Kazakhstan mines which have an iron content ranging between approximately 50% to 60% and are solely for internal use at ArcelorMittal’s regional steel plants. The direct shipping ore produced from Liberia had an average iron content of approximately 62% in 2020 while the sinter fines produced for external customers in Brazil from the Serra Azul operations averaged approximately 63% and the lumps averaged 54%.
2.The estimated mine life reported in this table corresponds to the duration of the production schedule of each operation based on the 2020 year-end iron ore reserve estimates only. The production varies for each operation during the mine life and as a result the mine life is not the total reserve tonnage divided by the 2020 production. ArcelorMittal believes that the life of these operations will be maintained as exploration and engineering studies confirm the economic potential of the additional mineralization already known to exist in the vicinity of these iron ore reserve estimates.
3.Represents 100% of production.
Changes in iron ore mineral reserve estimates: 2020 versus 2019
The Company’s iron ore mineral reserve estimates had a net decrease of 259 million metric tonnes of Run of Mine and a 1.1% increase in iron ore content between December 31, 2019 and 2020. This decrease in reserves includes a reduction of 261 million metric tonnes
of Run of Mine due to the sale of Minorca and Hibbing and a net 97 million metric tonnes of Run of Mine reduction in Canada due to production of 67 million tonnes and a decrease in reserves by 30 million tonnes attributed to updated resource modelling and estimation being incorporated into the life of mine plan. These decreases were partially offset by an increase of 53 million tonnes for Pena Colorada and 4 million tonnes for Mexico (excl. Pena Colorada), both due to new interpretations and life of mine design, and an increase of 84.5 million tonnes from the inclusion of the Thakurani mine in India.
Metallurgical Coal Reserve Estimates
The table below details ArcelorMittal’s estimated metallurgical coal reserves as of December 31, 2020. The classification of coal reserve estimates as proven or probable reflects the variability in the coal seams thickness and quality, the mining selectivity and the planned production rate for each deposit. Proven coal reserve estimates are based on drill hole spacing ranging from 50m x 50m to 500m x 500m, and probable coal reserve estimates are based on drill hole spacing ranging from 100m x100m to 1,000m x 1,000m.
| | | | | | | | | | | | | | | | | | | | | | | | | | | | | | | | | | | | | | | | | | | | | | | | | | | | | | | | | | | | | | | | | | | | |
| | As of December 31, 2020 | | As of December 31, 2019 |
| | Proven Coal Reserves | | Probable Coal Reserves | | Total Coal Reserves | | Total Coal Reserves |
| ROM Millions of Tonnes | | Wet Recoverable Million Tonnes | | ROM Millions of Tonnes | | Wet Recoverable Million Tonnes | | ROM Millions of Tonnes | | Wet Recoverable Million Tonnes | | Ash
(%) | | Sulfur (%) | | Volatile (%) | | Millions of Tonnes | | Wet Recoverable Million Tonnes |
| Princeton - USA | | — | | — | | — | | — | | — | | — | | — | | — | | — | | 90 | | 52 |
| Karaganda - Kazakhstan | | 11 | | 4 | | 90 | | 54 | | 101 | | 58 | | 37 | | 0.7 | | 29 | | 110 | | 50 |
| Total | | | | | | | | | | 101 | | 58 | | 37 | | 0.7 | | 29 | | 200 | | 102 |
Note: Ash (%), Sulfur (%) and Volatile (%) for Karaganda - Kazakhstan are Run of Mine coal qualities. See also note 2 to the iron ore reserve estimates..
The table below provides supplemental information on the producing mines.
| | | | | | | | | | | | | | | | | | | | | | | | | | | | | | | | |
| Operations/Projects | | % Ownership | | In Operation Since | | 2020 Run of Mine Production
(Million Tonnes) | | 2020 Wet Recoverable production
(Million Tonnes) | | Estimated Mine Life (Years)1 |
| Princeton - USA | | Sold | | 1995 | | 2.8 | | | 1.4 | | | NA |
| Karaganda - Kazakhstan | | 100 | | 1934 | | 9.5 | | | 3.6 | | | 10 |
1.The estimated mine life reported in this table corresponds to the duration of the production schedule of each operation based on the 2020 year-end metallurgical coal reserve estimates only. The production varies for each operation during the mine life and as a result the mine life is not the total reserve tonnage divided by the 2020 production. ArcelorMittal believes that the life of these operations will be significantly expanded as exploration and engineering studies confirm the economic potential of the additional mineralization already known to exist in the vicinity of these estimated coal reserves.
Changes in Metallurgical Coal Reserve Estimates: 2020 versus 2019
The Company’s metallurgical coal reserve estimates had a net decrease of 99 million tonnes of Run of Mine coal between December 31, 2019 and 2020. This decrease includes the sale of the mining assets of ArcelorMittal USA, accounting for 90 million tonnes of the total variance. The additional 9 million tonnes decrease was attributable to mining depletion at the Karaganda coal operations in Kazakhstan. The reporting of recoverable coal reserves from Kazakhstan excludes the recoverable coal which in theory could be used for metallurgical applications, but which in practice is sold and used as thermal coal by ArcelorMittal at its steel plant facilities.
Operating and financial review
Economic conditions
Key factors affecting results of operations
The steel industry, and the iron ore and coal mining industries, which provide its principal raw materials, have historically been highly cyclical. They are significantly affected by general economic conditions, consumption trends as well as by worldwide production capacity and fluctuations in international steel trade and tariffs. This is due to the cyclical nature of the automotive, construction, machinery and equipment and transportation industries that are the principal consumers of steel. A telling example of the industry cyclicality was the sharp downturn in 2008/2009 after several strong years, which was a result of the global economic crisis. Similarly, the current COVID-19 pandemic caused a sudden and sharp decline in economic activity and steel consumption globally and particularly in the Company's core developed markets.
The COVID-19 pandemic had a significant impact on ArcelorMittal’s results in 2020. In the European Union (“EU”), the impact of widespread national lockdowns during March, April and into May had a significant negative effect on output across the major steel consuming industries. Manufacturing declined sharply, with almost all automotive plants closed during the early part of the lockdown with production down over 60% year-on-year during the second quarter. Industrial activity recovered sharply from April lows, and steel demand also recovered strongly through the second half of 2020, with consumption estimated to have declined by just over 10% year-on-year in 2020. While demand did not fall as low as seen in 2009 as inventory levels were much leaner than prior to the global financial crisis, demand declined to levels not seen since the Eurozone debt crisis in 2012, with a significant impact on profitability in 2020 from the Company’s largest market. Underlying steel demand in the United States was similarly impacted by the fall-out from the COVID-19 pandemic, with manufacturing output down over 15% year-on-year in the second quarter of 2020, especially light vehicle (-61% year-on-year) and machinery output (-19%). While construction was less affected, remaining close to 2019 levels, energy markets remained subdued and overall steel consumption is estimated to have declined by 18% in 2020, negatively impacting the Company’s deliveries and profitability.
The sharp global recession in 2020 significantly reduced global demand for steel but the impact on demand was not prolonged, with output in developed markets rebounding strongly during the second half of 2020. Indeed, output of key steel consuming sectors in the U.S. were almost back to pre-pandemic levels by December (e.g., machinery down around 2% from January/February 2020 levels). While the risk of continued restrictions on physical interaction through the first and into the second quarter
of 2021 is significant, due to the current high level of COVID-19 infections, the Company still believes that these will predominantly impact services while manufacturing and construction should remain relatively unscathed. Risks remain higher in developing markets, where cases and fatalities are still growing overall and are less likely to have systems to manage any surge in cases and to vaccinate a significant proportion of the population quickly through 2021. The Company’s sales and profitability have been significantly affected in its developing markets by the global nature of this pandemic. However, although cases appear to still be on an upward trajectory, underlying steel demand has in many markets rebounded strongly through the second half of 2020 to be above pre-pandemic levels in many cases (e.g. Brazil and Turkey).
Historically, demand dynamics in China have also substantially affected the global steel business, mainly due to significant changes in net steel exports. Despite the pandemic impacting China significantly in February and March 2020, increased government use of special local and sovereign bonds to fund increased investment, mainly infrastructure projects, supported a robust recovery in steel consumption. Manufacturing output also rebounded strongly and was back to trend growth early into the second half of 2020. Indeed, Chinese steel demand surprised on the upside in 2020 overall, growing around 9% year-on-year, supported by policy that mandates an increase in the steel intensity of construction. While demand is likely to grow further in 2021, it is eventually expected to decline as infrastructure spending has been front-loaded and real estate demand structurally weakens due to lower levels of rural-urban migration. If this does not coincide with renewed capacity closures, this is expected to have a negative impact on steel prices and spreads. See “Risk Factors—Risks related to the global economy and mining and steel industry—Excess capacity and oversupply in the steel industry and in the iron ore mining industry have in the past and may continue in the future to weigh on the profitability of steel producers, including ArcelorMittal”.
Unlike many commodities, steel is not completely fungible due to wide differences in its shape, chemical composition, quality, specifications and application, all of which affect sales prices. Accordingly, there is still limited exchange trading and uniform pricing of steel, whereas there is an increase in trading of steel raw materials, particularly iron ore. Commodity spot prices can vary, which causes sales prices from exports to fluctuate as a function of the worldwide balance of supply and demand at the time sales are made.
ArcelorMittal’s sales are made based on shorter-term purchase orders as well as some longer-term contracts to certain industrial customers, particularly in the automotive industry. Steel price surcharges are often implemented on steel sold pursuant to long-term contracts to recover increases in input
costs. However, longer-term contracts with low steel prices will not reflect increases in spot steel prices that occur after contract negotiation. Spot market steel, iron ore and coal prices and short-term contracts are more driven by market conditions.
One of the principal factors affecting the Company’s operating profitability is the relationship between raw material prices and steel selling prices. Profitability depends in part on the extent to which steel selling prices exceed raw material prices, and specifically the extent to which changes in raw material prices are passed through to customers in steel selling prices. Complicating factors include the extent of the time lag between (a) the raw material price change and the steel selling price change and (b) the date of the raw material purchase and of the actual sale of the steel product in which the raw material was used (average cost basis). In recent periods, steel selling prices have not always been correlated with changes in raw material prices, although steel selling prices may also be impacted quickly due in part to the tendency of distributors to increase purchases of steel products early in a rising cycle of raw material prices and to hold back from purchasing as raw material prices decline. With respect to (b), as average cost basis is used to determine the cost of the raw materials incorporated, inventories must first be worked through before a decrease in raw material prices translates into decreased operating costs. In some of ArcelorMittal’s segments, in particular Europe and NAFTA, there are several months between raw material purchases and sales of steel products incorporating those materials. Although this lag has been reduced in recent years by changes to the timing of pricing adjustments in iron ore contracts, it cannot be eliminated and exposes these segments’ margins to changes in steel selling prices in the interim (known as a “price-cost squeeze”). This lag can result in inventory write-downs, as occurred in 2015 and 2019 due to sharp declines in steel prices. In addition, decreases in steel prices may outstrip decreases in raw material costs in absolute terms, as has occurred numerous times over the past few years, for example throughout 2019 as well as the fourth quarters of 2015, 2016 and 2018. In early 2020, steel spreads improved from the weak levels during the second half of 2019 but the negative impact of the pandemic on steel demand in the second quarter of 2020 led to lower spreads as steel prices declined, while raw material costs, especially iron ore, remained broadly stable underpinned by the strong rebound in Chinese demand. In the fourth quarter of 2020, global steel prices surged toward historical highs in many markets, due in part to increased demand and a slower increase in supply, resulting in increased steel spreads and higher profitability. If, however demand wanes, and steel capacity continues to increase, steel prices would likely decline. Raw material and steel price changes in 2018, 2019 and 2020 are described below.
The Company’s operating profitability has been particularly sensitive to fluctuations in raw material prices, which have become more volatile since the iron ore industry moved away from annual benchmark pricing to quarterly pricing in 2010. Volatility on steel margins aside, the results of the Company’s Mining segment (which sells externally as well as internally) are directly impacted by iron ore prices. The disaster at Vale’s Brumadinho dam at the end of January 2019, coupled with strong steel production in China during the first half of 2019, pushed the price up to highs above $120 per tonne ("/t") in July 2019. Vale brought back 35 million tonnes of supply by the end of 2019, allowing the price to decline to an average of $92/t in December 2019 as supply better matched levels of demand. Despite the significant hit to Chinese downstream steel consumption in February and March 2020, iron ore prices fell only mildly to average $87/t in February and remained relatively stable through March and April. However, the strong recovery of Chinese steel consumption, and the beginnings of a rebound in demand in developed markets, coupled with some supply issues saw prices rebound to over $100/t by June. As world ex-China demand and production rebounded during the second half of 2020, alongside continued strong steel production in China, iron ore prices continued to climb, rising to an average of $134/t in the fourth quarter of 2020 and ending 2020 at over $160/t and increasing the profitability of ArcelorMittal’s mining operations. A significant decrease in iron ore prices as further supply is brought online, especially if Chinese demand weakens, would negatively impact ArcelorMittal’s revenues and profitability. See “Introduction—Risk factors—Risks related to the global economy and the mining and steel industry—Protracted low steel and iron ore prices would likely have an adverse effect on ArcelorMittal’s results of operations.”
Economic environment
The COVID-19 pandemic has caused the largest economic shock the world economy has witnessed in decades, causing a collapse in global activity. This followed weak global growth in 2019, which had only been 2.6% compared to 2018. The subdued growth in 2019 had been a consequence of rising trade barriers, elevated uncertainty surrounding trade and geopolitical issues and the impact of prior U.S. interest rate increases which had a tightening effect on financing conditions in emerging economies ("EM"s), as well as a sharp and geographically broad-based slowdown in manufacturing and global trade (due in particular to higher tariffs and prolonged uncertainty surrounding trade policy which dented investment and demand for capital goods that are heavily traded) and a contraction in the automobile industry due to distinct reasons, including lower demand and disruptions from new emission standards in Europe and China. The global economy is estimated to have contracted by 3.9% in 2020 compared to 2019, the largest decline since the global financial crisis (“GFC”) in 2008/09. While the initial impact of the pandemic on global economy during the first half of 2020
was much sharper than during GFC, the immediate recovery throughout the third quarter of 2020 was a lot faster, before moderating in the fourth quarter of 2020 as momentum was dampened by a resurgence of infections. Specifically, almost all major economies, including both advanced and emerging economies, are expecting a decline in GDP in 2020, with the main exception being China whose strong recovery throughout the later half of 2020 was supported by central government infrastructure spending. Globally, while both services and manufacturing sectors were initially impacted by various social restrictions implemented in order to curb the spread of the virus, manufacturing has continued to recover more strongly throughout 2020. This is particularly apparent in advanced economies, where a renewed wave of infections led to re-imposition of lockdown measures during the fourth quarter of the year, impacting services more significantly than manufacturing and construction output.
In the U.S., the number of COVID-19 cases has been persistently elevated since the outbreak of the pandemic, with approximately 20 million cases of infection and approximately 350,000 deaths attributed to the virus at the end of 2020 (over 500,000 deaths and 29 million cases currently). As a result of lockdown measures, the fall in U.S. activity in the first half of 2020 was nearly three times as large as the peak decline during the GFC, underscoring the unusual depth of the recession. Monetary policy was, however, quickly loosened to support the economy and fiscal spending far exceeded similar measures delivered during the global financial crisis, which cushioned the impact of the pandemic on household incomes and contributed to a robust rebound in economic activity. As a result, U.S. GDP in 2020 is estimated to have fallen by only 3.5% (compared to growth of 2.4% in 2019 and 2.9% in 2018, impacted by slowing investment and exports as the heightened uncertainty due to trade policy and increasing perceived risk of recession caused businesses to scale back investment). Large fiscal spending also had a positive impact on the labor market, limiting the loss of employment due to lockdown, with unemployment ending 2020 at 8.1%, a significant improvement from its April peak of 14.8%. Cases have surged since mid-September, and in response, new restrictions related to indoor gatherings and public spaces have been imposed in some states. Service sectors have been impacted the most, particularly retail sales, which declined through the fourth quarter of 2020, after recovering quickly to pre-virus levels by July. On the other hand, supported by lean inventory, industrial activity has continued to recover with manufacturing output almost recovering to pre-virus levels by the end of the year, from a level 20% below in April.
After a slowdown in growth in 2019 to 1.6% (compared to 2.0% in 2018), due to weaker external demand, including from Turkey and Asia, especially China, Brexit-related uncertainty and disruption to the automotive sector caused by emission
standards, EU27 (EU excluding the UK) GDP growth is estimated to have contracted by 6.7% in 2020 due to the impacts of the first and second waves of the virus. Following the end of lockdown measures related to the first wave, activity rebounded vigorously until mid-summer, although performance varied widely among sectors. Retail sales caught up to, and even exceeded, pre-pandemic levels during the third quarter, partly reflecting pent-up demand. In contrast, the recovery in industrial production was initially slower. After a marked epidemiological improvement from May to July, COVID-19 infections flared up again across Europe in the fall, which prompted many EU countries to tighten social restrictions, with some major countries, such as Germany, France and Netherlands, re-imposing lockdown measures (often less severe than in the first wave, however). As a result, retail sales declined during the fourth quarter of 2020, while manufacturing output continued to recover to within 3% of pre-pandemic levels. Several service sectors vital to the EU economy (for example, tourism in Southern EU countries) remain depressed and are not expected to recover until effective management of the pandemic improves confidence in the safety of face-to-face interactions. Throughout 2020, despite varying across countries, the size of the fiscal support across EU has been more substantial than during the GFC. A significant focus of spending has been to preserve employment, helping EU27 unemployment to rise more slowly than in the U.S., with the unemployment rate estimated to have risen to only 7.2% in 2020 from 6.7% in 2019. In addition, from 2021 national fiscal support packages will be bolstered by grants from the European Union of €750 billion ($859 billion) to the hardest-hit member countries.
China’s economy was the first to suffer from COVID-19, experiencing a sharp contraction in January and February, with first quarter GDP declining by 6.8% year-on-year, due to lockdown measures implemented. The strength of the recovery was then robust in 2020, and China is one of the only major economies to have grown in 2020, with GDP growing 2.3% year-on-year (compared to growth of 6.2% in 2019 and 6.6% in 2018). Despite being the epicenter of the outbreak early on, by the end of 2020, unlike in the EU and U.S., new COVID-19 cases have only been reported sporadically, and the coronavirus outbreak seems largely under control in most of the country. Investment, in particular stimulus-fuelled infrastructure spending from the government, remains the main engine of growth throughout the year. Chinese exports have also supported the recovery on the back of pent-up foreign demand for masks and other COVID-19-related materials and equipment, as well as strong demand for teleworking-related goods and domestic appliances. As a result, the recovery in the services sector lagged construction and industry in 2020, with industrial output returning to pre-pandemic trend growth in July, while retail sales did not return to trend growth until the end of the year.
In Brazil, the economy was recovering gradually from a long recession that started in 2015 when the COVID-19 pandemic hit. Despite contracting by more than 10% year-on-year in second quarter of 2020 due to COVID-19’s impact, the recovery was strong across a wide range of sectors and GDP is estimated to contract by approximately 4.7% in 2020 (compared to growth of 1.2% in 2019 and 1.3% in 2018). The key driver of growth has been a sizable fiscal response supporting the economy (exceeding 6% of GDP), significantly larger than other countries’ spending in the Latin American region. Strong stimulus cushioned the impact of the COVID-19 pandemic in April and underpinned a strong recovery thereafter. Retail sales had recovered completely by August and rose to levels around 6% above pre-virus level by the end of 2020. Similarly, manufacturing output was above pre-pandemic levels before the end of 2020, supported by a sharp recovery in auto production toward the end of the year. In Russia, COVID-19 dealt a heavy blow to the economy during the second quarter of 2020, when GDP declined 8% year-on-year. The recovery in the second half of the year, while resilient, was constrained by low oil exports and weak consumption with retail sales unable to recover to pre-virus levels. GDP is estimated to have declined by 3.8% in Russia in 2020 (compared to growth of 1.3% in 2019 and 2.3% in 2018). In Turkey, despite the drastic fall in GDP during the second quarter of 2020 (-8.5% year-on-year), a very sharp recovery followed in the third quarter of 2020 (5.4% growth year-on-year). Turkish GDP is estimated to have expanded by 1.3% year-on-year in 2020. The main driver of growth was a large credit-push from the state government, in addition to strong export demand, which benefited from a large exchange rate depreciation. Ample liquidity has boosted both consumer spending and industrial activity, with both retail sales and manufacturing output recovering to pre-virus levels in August and around 10% above by year-end. In South Africa, an early and long lockdown to tackle the virus outbreak led to a significant decrease in economic activity in the first half of 2020 (second quarter GDP fell by 17% year-on-year). A substantial rebound in the second half of the year, driven by high demand and favorable prices for South Africa’s exports, resulted in an estimated contraction of GDP of around 7% in 2020 (compared to growth of 0.3% in 2019 and 0.8% in 2018).
World manufacturing production had already registered an overall slowdown in 2019 due to slowing global trade, weakness in global automotive sales and a destocking cycle, which was then further exacerbated by the economic crisis triggered by COVID-19 pandemic. In the first half of 2020, the slump in industrial production was severe but expected given the lockdowns imposed around the world to contain the virus, which caused a near complete shutdown in automotive plants and many other factories in April. Though lagging consumption, industrial production recovery was strong during the third quarter of 2020 and toward the end of the year, with world ex-
China manufacturing output back to only approximately 2% below pre-virus levels from a decline of almost 25% in April. While a new wave of COVID-19 infections led to re-tightening of social restrictions, which have negatively impacted services, the recovery in industrial output has continued. For 2020 overall, global manufacturing output declined by an estimated 3.5%, mainly due to world ex-China output declining by 7%. In China, the world's largest manufacturer, despite being hit hard by the pandemic in the first quarter, activity has bounced back more strongly, and manufacturing output estimated to increase by over 2%. Due to the impact of lockdowns during first half of the year, and subsequent re-imposition of lockdowns toward year-end to curb a second wave of infections, European manufacturing is estimated to have declined by approximately 8% year-on-year. In the U.S., though restrictions were less stringent, manufacturing output was also significantly negatively impacted, declining by approximately 6.6% year-on-year.
Global apparent steel consumption (“ASC”) is estimated to have grown by 0.8% year-on-year in 2019, following strong growth of 2.4% in 2018. In 2019, ASC growth in China had remained resilient at 3%, primarily driven by construction, supporting robust machinery output, offsetting declining automotive output and slower growth in infrastructure. World-ex China ASC was down by around 0.8% year-on-year. Demand in developing ex-China is estimated to have declined by an estimated 1.2% year-on-year in 2019, due to domestic crises in some large emerging markets causing steel demand to decline sharply in Turkey (-10% year-on-year), Iran (-7% year-on-year) and Argentina (-14% year-on-year). This more than offset growth in India (+4% year-on-year), ASEAN (+3% year-on-year) and Russia (+4% year-on-year). In EU28 (EU including the UK), underlying demand for steel was impacted by weak manufacturing, particularly automotive and machinery, due to weaker external demand and heightened uncertainty related to both the U.S.-China trade conflict and Brexit. Weakness in real demand led to inventory destocking, causing ASC to decline by over 4% in 2019. While underlying demand for steel in the U.S. performed better than EU28, U.S. ASC is estimated to have declined by around 2% year-on-year, with construction performing better than manufacturing. Indeed, due to weaker than expected manufacturing output, and prices declining from elevated levels, stockists reduced inventory levels causing demand for flat products to decline over 4% year-on-year, more than offsetting continued growth in longs.
Global ASC is then estimated to have declined by approximately 1% in 2020 – the first decline since 2015 – as steel demand was significantly impacted by the global COVID-19 pandemic. In China, despite being the country impacted first by the virus, the subsequent recovery in economic activity was strong, particularly in construction driven by infrastructure, supporting robust ASC growth of approximately 9% year-on-year. In
contrast, the negative impact of widespread lockdowns meant most other major economies saw ASC decline, resulting in world-ex China ASC down by around 11% year-on-year in 2020. In EU28, lockdowns from March to May caused ASC to decline by approximately 10%, with demand for flat products declining more than longs, as manufacturing was impacted more severely than construction. U.S. steel demand declined more sharply, by approximately 16% year-on-year in 2020, due to the weakness of energy demand impacting pipes and tube, coupled with double digit declines in both flats and longs demand. Most developing markets also saw ASC decline in 2020, particularly India (-17% year-on-year), and to lesser extent, Russia (-5% year-on-year) and ASEAN (-6% year-on-year) where impact of the virus on economic activities were less severe. Despite the pandemic, a few markets still managed to show growth in steel demand in 2020, particularly Turkey (+13% year-on-year), where demand was rebounding from the Lira crisis which caused demand to collapse in 2018/19 and Brazil (+1% year-on-year) where the economy rebounded strongly from the lows seen in April.
Source: GDP and industrial production data and estimates sourced from Oxford Economics January 7, 2021. ASC data for U.S. from American Iron and Steel Institute (AISI) to Nov 2020, estimates for December 2020. ASC data for Brazil from Brazilian Steel Institute to November 2020, estimates for December 2020. ASC data for EU28 from Eurofer to October 2020, estimates for November and December 2020. All estimates are internal ArcelorMittal estimates.
Steel production
World steel production grew 2.8% in 2019, an increase of approximately 50 million tonnes to 1.84 billion tonnes, primarily driven by a 7.9% year-on-year increase in Chinese production, whereas world ex-China production fell 2.5% year-on-year, according to World Steel figures, as production in all major regions either fell or stagnated, except for ASEAN and the Middle East, where production grew. In 2018, production in the EU28 (168 million tonnes) was curtailed by increased import penetration despite continued demand growth and due to weakness in German steel production. In 2019, while a sharp fall in domestic European steel prices led to lower import penetration, steel production in EU28 declined by approximately 10 million tonnes to 157 million tonnes as the weakness in industrial output, particularly automotive production, led to much weaker steel demand. In North America, strong production growth in 2018 (4.4% year-on-year) was driven by U.S. fiscal stimulus and supported by Section 232 applied tariffs and quotas on steel imports. As the impact of the U.S. fiscal stimulus faded and North America steel demand fell, steel production in 2019 declined slightly (-0.8% year-on-year) due to weaker manufacturing with lower production in Mexico (-8.0%) and Canada (-4.9%) more than offsetting growth in the U.S. (+1.5%). The decline in steel output in South America was mainly caused by a 9% decline in Brazil production (down 3.2 million tonnes). Production in developed Asia fell by 3.7% year-on-year (down 7
million tonnes), particularly Japan (-4.8%) and South Korea (-1.5%). Weakness in CIS steel production is due to persistent weakness in Ukrainian steel production (2019 production of 21 million tonnes is one third below the 2011 peak of 35 million tonnes), while Russian production declined slightly to 71.7 million tonnes from its historically high production in 2018 (72.1 million tonnes). Turkish steel production fell significantly to 33.7 million tonnes in 2019 as the economy suffered from a domestic recession triggered by a lira crisis in late 2018 which led to a collapse in domestic demand, especially in the construction sector.
In 2020, world steel production declined by approximately 0.9% year-on-year – the first decline since 2015 - as a result of demand disruption caused by the global COVID-19 pandemic. Despite being initially impacted, strong demand recovery in China throughout 2020, boosted by infrastructure spending, led to a 5.9% increase in steel production in 2020. On the other hand, world ex-China production was over 10% below 2018 levels at 775 million tonnes, representing a decline of 75 million tonnes (or 8.8%) compared to 2018. Production declined in every developed market in 2020 compared to 2019, particularly the U.S. (-17%), Japan (-16%) and EU28 (-12%), as well as most major emerging markets such as India (-11%) and South America (-8.6%). Turkey was the main exception with output growing by 5.5%, and the CIS to a lesser extent with output growth of 1.4% compared to 2019. As a result, China increased its share of global steel production to 58% (2019: 54%) while others’ share declined, including East Asia (9% from 11%), EU28 (8% from 9%), NAFTA (5% from 6%), India (5% from 6%), except CIS whose share remained broadly stable at around 5%.
The COVID-19 pandemic and subsequent policy of lockdowns to control infections, caused steel production in almost all major markets to decline in 2020, except for Turkey and Vietnam where strong demand recoveries through 2020 has supported steel production. In Europe, steel production declined by approximately 19 million tonnes, to 139 million tonnes in 2020. Steel production declined mainly during the second quarter of the year (-26% year-on-year), due to widespread lockdowns from around mid-March and into May. Thereafter, the easing of restrictions led to a recovery in real demand and subsequently a rebound in steel production in the second half of 2020 (-5% year-on-year). In North America, steel production is estimated to have declined by 15% year-on-year as some production facilities were idled due to widespread lockdowns, which caused factory shutdowns especially automotive plants during the second quarter of 2020. Production was down the most in the U.S. (17% year-on-year), with Canada down by 14% and Mexico the least impacted down only 8%. Steel output in South America declined by 9% year-on-year, despite the major steel producer in the region, Brazil, accounting for around 80% of regional production seeing output decline by only 5% year-on-
year. Brazil was supported by a relatively strong fiscal stimulus leading to Brazil manufacturing and construction output up strongly year-on-year during the second half of 2020, whereas continued weakness elsewhere in the region led to steel production declining by 21% year-on-year. Production in developed Asia fell by 11% year-on-year (down more than 20 million tonnes), particularly in Japan (-16%), as South Korea (-6%) and Taiwan (-6%) were able to control COVID-19 infections more effectively. Relative to other parts of the world, C.I.S (Kazakhstan, Russia and Ukraine) production was not hit as heavily and the recovery post lockdown was relatively strong, with production increasing by 1 million tonne in 2020, with Russian production supported by increased exports. After increasing to a record 37.5 million tonnes in 2017, Turkish steel production fell significantly to 33.7 million tonnes in 2019 as the economy suffered from a domestic recession triggered by a lira crisis in late 2018 which led to a collapse in domestic demand, especially in the construction sector. In 2020, despite an initial decline earlier in the year, Turkey steel production recovered very strongly, as domestic demand was boosted by credit stimulated by government policy, with supporting an increase in steel production of approximately 2 million tonnes to 35.8 million tonnes in 2020.
Source: Steel production data are compiled using World Steel data for 61 countries for which monthly data is available (which together account for 97% of World production). Production data is available for all months of 2020.
Trade and import competition
Europe
There has been a trend of imports growing more strongly than domestic demand in Europe since 2012. Apparent steel consumption (“ASC”) increased approximately 14% between 2012 and 2019, while finished steel imports increased by approximately 80%, taking market share from domestic producers. Over this period, total finished imports have risen from just over 15 million tonnes in 2012 to around 27 million tonnes in 2019, causing import penetration to rise to 17% in 2019 from 11% in 2012.
In 2020, widespread lockdowns across Europe in March/April in order to curb the spread of COVID-19 infections led to an almost 25% year-on-year decline in steel demand during the second quarter of 2020, before recovering during the second half of the year. Overall steel demand in 2020 is estimated to have fallen by around 11% year-on-year, with imports falling similarly by 11%, to approximately 24 million tonnes in 2020, leading to a broadly stable import penetration. Flat imports decreased by approximately 12% year-on-year, in line with the decline in demand, with flat import share stable at 21%. Long product demand declined less at approximately 8% year-on-year, as lockdown impacted industrial sectors, particularly automotive sectors, more than construction. However, long product imports
fell a similar amount (-8% year-on-year) leaving import share for long products at 13%.
Traditionally, imports into Europe have come from Commonwealth of Independent States (“CIS”), China, Turkey and developed Asia, with these regions accounting for approximately 73% of imports over the past six years. In 2020, except for CIS, imports into EU28 from other major regions decreased year-on-year as a result of the contraction in demand from EU28. Following a sharp decline of 14% in 2019 due to weak domestic European steel prices, imports from CIS rose slightly in 2020 despite the fall in EU28 ASC, increasing the share of CIS imports to approximately 28% from 24% in 2019. Import share from developed Asia also rose to 17% in 2020 from 16% in 2019, despite a 4% year-on-year decline. Similarly, while Indian imports were down approximately 6% year-on-year in 2020, India’s market share in Europe increased slightly to 9% from 8% in 2019. On the other hand, the share of Chinese origin imports continued to decline from its peak of 28% in 2015 to only 6% in 2020, with Chinese imports having fallen by almost 40% year-on-year as the recovery in domestic China demand was much stronger than in Europe. Similarly, Turkey’s market share fell from 25% in 2019 to 21% in 2020 as imports declined more than 25% year-on-year, as Turkish domestic demand recovered from its domestic recession in 2018/19 and from the relative strength of Turkey’s demand recovery from the pandemic-induced lockdown in early 2020. See “Business overview—Government regulations—Foreign trade” and “Risk factors—Risks related to the global economy and the mining and steel industry—Unfair trade practices, import tariffs and/or barriers to free trade could negatively affect steel prices and ArcelorMittal’s results of operations in various markets.”
Source: Eurostat imports to November 2020, estimate for December 2020. ASC data from Eurofer to October 2020, internal company estimates for November and December 2020
United States
Finished steel imports peaked in 2014 at almost 30 million tonnes, declining to approximately 18 million tonnes in 2019 (or an import penetration of 19%). The decline in finished steel imports was mainly due to section 232 implemented in 2018 adding a 25% tariff on most imports outside NAFTA. In 2020, like Europe, widespread lockdowns were imposed across most U.S. states between late March until May, causing a sharp decline in economic activity, particularly on automotive production as auto plants were shut down. The weakness of the energy sector and an approximate 45% reduction in demand for pipes and tubes caused ASC to decline approximately 18% year-on-year in 2020. The decline in real steel demand helped push finished steels imports to fall by approximately 25% year-on-year to approximately 14 million tonnes (2019 imports 18 million tonnes), with import penetration declining to 17%,
particularly in pipe and tube and flat products, while remaining broadly stable for long products.
Traditionally, the majority of U.S. finished steel imports come from NAFTA, accounting for approximately one-third of total imports. In 2020, while imports to the U.S. declined in almost all major markets, imports from NAFTA remained relatively stable at around 6 million tonnes – similar to 2019 levels. As the result, the share of U.S. finished steel imports coming from NAFTA increased further from 35% in 2019 to 45% in 2020, with a large increase in imports share from Canada to 33% (2019: 26%) and to a lesser extent, Mexico (12% from 9% in 2019). The increase in import penetration from NAFTA comes at the expense of imports from EU28, whose import share declined from 19% to 15%, as well as CIS (3% to 1%) and ASEAN (5% to 3%). Only Turkey saw a rising import share to 4% (from 1% in 2019), while import shares from other regions remained broadly stable, including developed Asia (approximately 20%), India (1%) and China (2%). See “Business overview—Government regulations—Foreign trade” and “Risk factors—Risks related to the global economy and the mining and steel industry—Unfair trade practices, import tariffs and/or barriers to free trade could negatively affect steel prices and ArcelorMittal’s results of operations in various markets.”
Sources: American Iron and Steel Association total/regional imports data and ASC data to November 2020, internal Company estimate for December 2020.
Steel prices
Flat products
In the first quarter of 2018, steel prices for flat products in Europe continued their steady upward trend which started in November 2017. HRC prices peaked towards the end of March at €574/t in Northern Europe. In Southern Europe, HRC prices increased from €519/t in January to €558/t at the beginning of March. In the second quarter of 2018, prices decreased sharply in USD terms following the international market trend. However, the depreciation of the euro against the USD helped sustain domestic HRC prices in euro terms, with a low of €561/t in Northern Europe at the beginning of June 2018, €13 below its peak in April 2018. In Southern Europe, HRC prices bottomed out at €514/t by mid-June 2018 from a peak of €544/t in April 2018. Average HRC prices were €564/t in Northern Europe and €538/t in Southern Europe for the first half of 2018, compared to €545/t in Northern Europe and €513/t in Southern Europe for the first half of 2017. The provisional safeguard measures and tariff rate quotas implemented in July 2018 did not create a tangible effect on market protection in Europe and there was very limited improvement in flat products prices during the third quarter of 2018. In Northern Europe HRC prices increased slightly in euro terms compared to the June level but only to reach a quarterly average of €566/t representing a €1/t decrease quarter-on-quarter, while in Southern Europe the price improvement
averaged at €537/t representing a €7/t increase over the second quarter level. In USD terms, however, prices declined across the regions due to further euro depreciation against USD. Market seasonality, high inventory levels and imports pressured prices during the fourth quarter of 2018 and HRC prices declined in euro and USD terms both in Northern Europe by €18/t to €548/t and in Southern Europe by €38/t to €499/t compared to the third quarter of 2018 average levels. Overall, the second half 2018 HRC prices averaged at €557/t in Northern Europe and at €518/t in Southern Europe, corresponding to a €30/t and €13/t year-on-year increase, respectively.
In the first quarter of 2019, steel prices for flat products in Europe continued their steady downward trend which started in September 2018. The prices of HRC in Northern Europe reached €517/t in January 2019, finishing the quarter €8/t lower, at €509/t. The decrease was attributable to weak domestic demand in the beginning of the year, high levels of inventories and the influence of declining international steel prices. In Southern Europe, HRC prices followed an inverse trend starting at €470/t in January and closing the quarter at €486/t, €16/t higher. This inverse trend was partially driven by a stronger demand in Southern Europe and partially by the Turkish imports that were entering the Italian market with higher price ranges between €495/t - €500/t Cost, Insurance and Freight Free Out (“CIFFO”) effective. Domestic mills followed the Turkish import prices.
In the second quarter of 2019, prices in Northern Europe continued to decrease and ended the quarter at €487/t, which was €11/t lower compared to April 2019. HRC prices in the Southern regions followed the same trend from the previous quarter peaking in June at €472/t, from €469/t in April. Turkish suppliers continued with their export offers of €470/t - €480/t CIFFO effective into Italy and Iberia, providing room for further increases in Southern European domestic prices, given there was no import price pressure. The average HRC prices for the first half of 2019 were €499/t in Northern Europe and €472/t in Southern Europe, which were accordingly €65/t and €66/t lower than in the first half of 2018.
Flat products prices continued to slide down in the third quarter of 2019, impacted by soft demand and weakening international raw material prices. HRC in Northern Europe had several trenches of price drops, ending the quarter at €469/t, which was €18/t lower versus the previous quarter. In Southern Europe the price of HRC averaged €453/t, which was €19/t lower compared to the second quarter of 2019. Market seasonality, high inventory levels and import pressure during the fourth quarter of 2019 pushed the HRC prices on a downward spiral. Several attempts of price increases were rejected by the market, as real demand in Europe was weak. In Northern Europe, HRC prices ended the fourth quarter at €431/t, which was €38/t lower quarter-on-quarter and in Southern Europe, HRC averaged
€413/t in the fourth quarter of 2019, €40/t lower than the previous quarter. In the second half of 2019, HRC prices averaged €450/t in Northern Europe and €433/t in Southern Europe respectively €107/t and €85/t lower than the second half of 2018.
Steel prices for flat products in Europe gradually deteriorated during 2019, bottoming toward the end of the year. Prices began recovering late in November 2019. Fueled by a positive market outlook and absence of attractive imports, especially in Northern Europe, HRC spot prices improved until the end of February 2020, reaching €485/t in Northern Europe and €456/t in Southern Europe (+€47/t and +€23/t vs. beginning of January, respectively). However, with the COVID-19 outbreak becoming a pandemic and industries starting their preparation for shutdown, prices began softening, decreasing to €473/t in Northern Europe and €443/t in Southern Europe by the end of March 2020.
During the second quarter of 2020, steel prices in Europe significantly declined due to uncertainties around the pandemic crisis, decreased demand, a focus on inventory depletion and high premium over imports. HRC prices dropped at the beginning of June to €396/t in Northern Europe (-€89/t vs. Feb 2020) and €390/t in Southern Europe (-€66/t vs. Feb 2020). As lockdown measures eased, steel prices partially rebounded across all European markets toward the end of June 2020.
In the first half of 2020, HRC prices averaged €449/t in Northern Europe and €431/t in Southern Europe, in line with the second half of 2019, but remained below the first half of 2019, down by €50/t in Northern Europe and €41/t in Southern Europe.
During the third quarter of 2020, steel activity, especially in Northern Europe, gradually picked up, demand from all sectors strengthened, inventories quickly declined, while imports in South Europe remained limited and not competitive. In addition, customers anticipated a supply deficit for the first quarter of 2021. This, coupled with the strong increase in raw material cost, supported a rebound in flat steel product prices in Europe by the end of 2020, to a 12-year high.
The HRC spot price increased by €100/t during the third quarter of 2020 in Northern Europe, and a further €166/t during the fourth quarter of 2020 (from €399/t on July 1, 2020 to €499/t on October 1, 2020 and then to €665/t on December 31, 2020). Similar increases in Southern Europe of €106/t and €170/t, in the third and fourth quarter, respectively (from €381/t on July 1, 2020 to €487/t on October 1, 2020 and then to €657/t on December 31, 2020), with the strongest day-on-day increases seen during August and December.
In the second half of 2020, HRC prices averaged €494/t in Northern Europe and €482/t in Southern Europe, an increase of
€45/t and €51/t above the level in the first half of 2020, and €44/t and €49/t above the levels in the third and fourth quarter of 2019, respectively.
In the United States, as a consequence of the then-ongoing Section 232 national security investigation which started in April 2017 and the expectation of the imminent implementation of import tariffs on steel, spot HRC prices increased sharply during the first quarter of 2018. Before the release of the investigation report by the Department of Commerce on February 16, 2018, HRC prices reached $830/t from $723/t at the beginning of January 2018. After the release of the report that recommended tariffs in the range of 24 to 53%, prices spiked further to $936/t at the beginning of March 2018. The increase slowed down as 25% tariffs and exceptions went into effect during March 2018, closing the month at a high of $960/t. In the second quarter of 2018, HRC prices surpassed the $1,000/t level in the United States, peaking at $1,012/t by the end of June. The average HRC prices were $907/t for the first half of 2018 in the United States, as compared to $688/t for the first half of 2017, corresponding to a $219/t increase year-on-year. HRC prices hit a 10 year high of $1,014/t at the beginning of July 2018 in the United States. However, market seasonality and weakening of international prices in the second part of the year coupled with an increase in the domestic capacity utilization rate (thus an increase in domestic supply), resulted in consistent price deterioration, with HRC prices falling to $799/t by the end of the year. Third quarter HRC prices averaged $982/t, still $2/t above the second quarter level, while average prices declined in the fourth quarter by $99/t quarter-on-quarter to $883/t. Overall, average HRC prices for the second half of 2018 were $932/t as compared to $686/t for the second half of 2017 corresponding to a $246/t increase year-on-year.
In the United States, domestic HRC prices in the first half of 2019 continued the downward trend that began in July 2018. The first quarter of 2019 started with prices at $776/t in January and in March reached $767/t ($9/t lower). Prices in the second quarter of 2019 plunged even deeper - from $749/t in April to $598/t in June (a drop of $151/t), well below import parity levels. This descent represents the market’s search for an equilibrium point after additional local capacity came on-stream in the second half of 2018. This additional supply availability added pressure on domestic prices at the same time as domestic mills were fighting imports. U.S. suppliers' short lead time combined with comfortable inventory levels at customers contributed to the downward trend in domestic prices.
The average HRC price for the first half of 2019 in the United States was $723/t, as compared to $907/t for the first half of 2018 (a drop of $184/t). The anticipated decline in imports, as an outcome of the implementation of the Section 232 import tariffs was not as strong as expected. Therefore, import prices continued to add pressure on the domestic pricing. The HRC
import Houston DDP index continued to decline over the first half of 2019, from $746/t in the first quarter to $685/t in the second quarter.
In the second half of 2019, the average HRC price in the United States was $603/t, $330/t below the second half of 2018. The dramatic decrease is due to 2018 having been a record year in which prices were inflated by Section 232 import tariffs on steel. In 2019, prices fell due to weak real demand and decreasing scrap prices. The average HRC price for the third quarter was $627/t, a drop of $52/t versus the previous quarter which was mainly due to the scrap USA #1 Busheling price dropping by $33/t, to $290/t and pressure from destocking at both Steel Service Centers (“SSCs”) and Original Equipment Manufacturers (“OEMs”).
Prices in the fourth quarter of 2019 averaged at $579/t, which is $48/t lower versus the third quarter. The situation further deteriorated in October due to the strike at General Motors that added to the market's negative sentiment. From November onwards, some relief came as scrap started an upward trend and international prices began to show signs of recovery. As a result, the fourth quarter ended in December at $623/t from the yearly low of $545/t, recorded in October.
In the United States, domestic HRC prices continued their upward trend which started in November 2019 through January 2020. However, prices fluctuated downwards in February and March 2020, first due to weak scrap exports and the Scrap USA #1 Busheling index price decline and, towards the end of the second quarter of 2020, due to the COVID-19 pandemic related market restrictions. HRC prices then lost $79/t between the beginning of January ($661/t) and the end of March 2020 ($582/t).
During the second quarter of 2020, prices fluctuated, seeing a low level at the end of April 2020 at $507/t, followed by an uptick during May to $559/t, supported by improvement in the scrap price then in supply scarcity, as well as good activity in non-auto segments. HRC prices deteriorated again toward the end of June to $524/t, as mini-mills were seeking volumes to fill available capacities.
Domestic HRC prices in the United States averaged $593/t during the first half of 2020, a $130/t drop compared to the first half of 2019, but just a $10/t decline compared to the second half of 2019.
Flat steel prices continued to decline in the United States at the beginning of the third quarter of 2020, as the COVID-19 pandemic and presidential election related uncertainties weighed on the market. High scrap supply and weak steel demand pressured prices and HRC reached at a 4-year low of
$485/t by end of July, however, only to increase afterwards in a trend that continued until the end of 2020.
Improved buying activity during the fourth quarter of 2020, tight supply and production outage concerns pushed prices higher, while an expansion of the overall economy toward the year end, with good expectations for the first half of 2021, provided continuous support for domestic HRC to reach $1,113/t by end of December 2020 (+130% price increase). This is a historical high, only inferior to the pre-2008 economic crisis level of $1,185/t in July 2008.
Domestic HRC prices in the United States averaged $681/t during the second half of 2020, representing an $88/t improvement compared to the first half of 2020 and a $78/t increase compared to the second half of 2019.
In China, spot HRC prices fluctuated during the first quarter of 2018, peaking at $562/t VAT excluded at the end of February, followed by a sharp decline due to weak demand and high inventories. HRC prices bottomed out at the end of March at $507/t VAT excluded. Production cuts in several regions and mill inspections to ensure compliance with pollution emission standards impacted supply during the second quarter of 2018. These measures supported HRC prices in China, which increased from $524/t VAT excluded at the beginning of April to a high of $581/t VAT excluded by mid-June. However, due to improvements in production levels and seasonal weak demand, HRC prices declined at the end of the month. In China, HRC domestic prices averaged $555/t VAT excluded for the first half of 2018, as compared to $427/t VAT excluded for the first half of 2017.
Despite the implementation of tough environmental controls and positive fiscal policies to expand domestic demand, production continued to increase, sustained by attractive margins, while consumption remained flat during the second half of 2018. This resulted in further pressure on HRC prices in China, which declined by $15/t (during the third quarter of 2018) as compared to the second quarter average level to $546/t VAT excluded and by an additional $58/t to $488/t VAT excluded during the fourth quarter of 2018. HRC domestic prices averaged $517/t VAT excluded for the second half of 2018, representing a $7/t decline as compared to $524/t VAT excluded for the second half of 2017.
In China, spot HRC prices averaged at $482/t VAT excluded in the first quarter of 2019. The year started in January with prices at $467/t, strengthening to $494/t by March, as a result of the market’s resumed activity following the Chinese New Year. In the second quarter of 2019, due to Brazil's major accident at one of its largest iron ore mining facilities, as well as due to the market seasonality, the peak prices were reached in April at $523/t VAT excluded. The second quarter of 2019 closed in at
an average of $512/t VAT excluded. Despite the governmental measures targeting production cuts due to overcapacity and environmental issues, domestic mills have reacted slowly to the indications, driving the domestic price by end of June 2019 to $493/t VAT excluded, i.e. on a downward trajectory. The HRC domestic price in China averaged $497/t VAT excluded for the first half of 2019, compared to $557/t VAT excluded for the first half of 2018.
The downward spiral of the Chinese HRC price continued in the third quarter of 2019 reaching $474/t, which was $38/t lower versus the previous quarter, with increased inventory levels of both raw materials and finished products. Domestic demand was impacted by seasonality. The fourth quarter of 2019 began with further weakening of Chinese HRC prices, with October being the weakest month at an average of $441/t. The Purchasing Managers’ Index (“PMI”) dropped to its lowest point in four years, with the rate of new order intake dropping by over 5% for both domestic and exports. However, the market started to improve from November onwards when the 7-month downward spiral reversed. Better domestic demand and a decrease in finished product inventory (-10% month-on-month) helped improve the prices in November. In December, international steel prices started to improve, which also supported a positive price environment in China. The fourth quarter of 2019 ended at $462/t, $12/t lower than in the third quarter. HRC spot prices in China averaged $468/t, VAT excluded in the second half of 2019, a decrease of $50/t, VAT excluded from the second half of 2018.
At the beginning of 2020, steel prices in China continued their upward trend which started in December 2019, although peaking mid-January at $496/t VAT excluded. With HRC inventory on the rise, ahead of the Lunar New Year holidays (January 24-30), prices declined and continued the trend throughout the first quarter 2020. After the Lunar New Year holidays, due to the COVID-19 outbreak, the Chinese market opened to a reality of movement restrictions and delayed enterprise activity. By the end of March 2020, HRC prices decreased $97/t VAT excluded compared to the January peak, at $399/t VAT excluded.
At the beginning of the second quarter of 2020, HRC prices in China began to improve following the ease in restrictions and gradual release in activities and local demand. HRC prices gained $58/t from $408/t VAT excluded at the beginning of April to $466/t VAT excluded by mid-June.
HRC prices in China averaged at $445/t VAT excluded, for the first half of 2020, remaining $52/t below the average of the first half of 2019 and $23/t below the second half of 2019.
In the beginning of the third quarter of 2020, prices continued to improve with domestic HRC reaching $520/t, VAT excluded, by
August 31, 2020. However, September was marked by a price decline, with HRC losing $23/t decreasing to $497/t, VAT excluded by the end of September, as production continued at high level, exports stayed low and imports increased.
Steel prices spiked in China during the fourth quarter of 2020, as domestic demand continued strongly, while air pollution measures and production limitations in some regions fueled supply concerns. This, coupled with increases in raw material costs, pushed domestic HRC prices to $652/t VAT excluded (+$155/t compared to the end of September), the highest level since September 2011.
For the second half of 2020, HRC prices in China averaged at $534/t VAT excluded, representing an $89/t increase compared to the average of the first half of 2020 and a $66/t increase compared to the second half of 2019.
| | | | | | | | | | | | | | |
| Flat products | | | | |
| Source: Steel Business Briefing (SBB) | Northern Europe | Southern Europe | United States | China |
| Spot HRC average price per tonne | Spot HRC average price per tonne | Spot HRC average price per tonne | Spot HRC average price per tonne, VAT excluded |
| Q1 2018 | €561 | €545 | $834 | $549 |
| Q2 2018 | €567 | €530 | $980 | $565 |
| Q3 2018 | €566 | €537 | $982 | $546 |
| Q4 2018 | €548 | €499 | $883 | $489 |
| | | | |
| Q1 2019 | €510 | €477 | $766 | $482 |
| Q2 2019 | €487 | €467 | $679 | $512 |
| Q3 2019 | €469 | €453 | $627 | $474 |
| Q4 2019 | €431 | €413 | $579 | $462 |
| | | | |
| Q1 2020 | €469 | €450 | $643 | $456 |
| Q2 2020 | €428 | €412 | $543 | $435 |
| Q3 2020 | €436 | €427 | $548 | $504 |
| Q4 2020 | €551 | €537 | $853 | $563 |
Long products
Long steel product prices remained relatively stable in Europe in euro terms at the beginning of 2018 compared to the peak level in December 2017, but continued their upward trend in USD terms as the euro strengthened. Prices weakened from mid-February and towards the end of the first quarter of 2018 with inventories reaching comfortable levels and a cautious market following the volatility in raw material costs. Medium sections prices declined from €625/t in January to €600/t by the end of March. Similarly, rebar prices declined from €568/t in January to
€553/t in March. Prices remained stable again during April 2018 but followed a downward trend until mid-June when medium sections bottomed out at €585/t and rebar at €528/t. Average medium sections prices were €603/t in Europe for the first half of 2018. Average rebar prices were €552/t in Europe for the first half of 2018. Good market sentiment and strong demand supported an improvement of long product prices during the third quarter of 2018, with medium sections reaching €620/t and rebars €560/t by September corresponding to a €35/t and €32/t increase, respectively, as compared to the bottom level in June, and representing a quarter-on-quarter average improvement of €20/t for medium sections and €6 for rebars. Prices remained relatively stable during the fourth quarter of 2018 as compared to the levels at the end of September despite some weakening in rebars with a quarterly average of €538/t representing a €13/t decrease quarter-on-quarter. The average medium sections prices were €618/t in Europe for the second half of 2018. The average rebar prices were €545/t in Europe for the second half of 2018.
Prices of long steel products in Europe continued their steady downward trend in 2019. In January 2019, rebar price and medium sections price reached €528/t and €624/t, respectively. The rebar price decline started in August 2018, while the medium sections price decline started in January 2019. By the end of March 2019, the rebar price and the medium section price dropped to €526/t and €588/t, respectively, reaching a quarterly average of €526/t and €605/t, respectively. In June 2019, prices bottomed further to €501/t for rebar and €579/t for medium sections. The falling domestic pricing environment followed the trend of weakening world scrap prices on international markets.
In Europe, the average medium sections price for the first half of 2019 was €595/t as compared to an average of €603/t for the first half of 2018. The average rebar price for the first half of 2019 was €521/t as compared to €552/t for the first half of 2018.
Prices for long steel products in Europe continued their steady downward trend in the second half of 2019. The prices reached a floor in November 2019 at €452/t for rebar and €521/t for medium sections, the lowest over the last two years. The average medium sections price in Europe for the second half of 2019 was €548/t as compared to €619/t for the second half of 2018, representing a drop of €71/t year-on-year. The average rebar price in Europe for the second half of 2019 was €476/t as compared to €545/t for the second half of 2018, a decrease of €69/t year-on-year.
Steel prices for long products in Europe rebounded in November 2019 and peaked by mid-January 2020 at €540/t for medium sections and €480/t for rebars. Finished steel products prices declined throughout February, alongside scrap Turkey HMS 1&2 index correction, with medium sections reaching €525/t and
rebars at €453/t, although the first quarter of 2020 ended with similar price levels as the beginning of the year.
During the second quarter of 2020, despite a stable scrap price, long steel product prices in Europe continued declining, due to the impact of the pandemic on the market and weak downstream demand. By mid-June, medium sections reached €500/t and rebars €430/t, stabilizing at this level toward the end of the quarter. The average medium sections price for the first half of 2020 was €527/t, representing a decrease of €67/t compared to the first half of 2019 and a decrease of €21/t compared to the second half of 2019.
The average rebars price for the first half of 2020 was €461/t, a drop of €60/t compared to the first half of 2019 and a drop of €15/t compared to the second half of 2019.
During the third quarter of 2020, as market sentiment and demand improved in July, steel prices for Long products in Europe started recovering, however rather slowly, fluctuating on an upward trend alongside scrap HMS 1&2 Turkey CFR index. From the June level, at a 3-year low, the medium sections and rebar price gained €20/t and €28/t by the end of September, reaching €522/t and €458/t, respectively.
Prices plateaued at this level during October, but spiked in November and December, pushed by an increase in the scrap index to a 9-year high. Long finished product spreads compared to the raw material basket squeezed towards the end of 2020, despite medium sections and rebars prices reaching highs of €640/t and €545/t, respectively.
The average medium sections price for the second half of 2020 was €532/t, representing a mere €5/t improvement compared to the first half of 2020, while prices declined €15/t compared to the second half of 2019.
The average rebars price for the second half of 2020 was €465/t, a mere €4/t increase compared to the first half of 2020 and decrease of €10/t compared to the second half of 2019.
In the first quarter of 2018, the price of imported scrap HMS 1&2 in Turkey improved by $40/t to an average level of $363/t CFR as compared to the fourth quarter of 2017. Rebar export prices closely followed the evolution of Turkey imported scrap HMS 1&2, declining from $573/t FOB at the beginning of January to $555/t FOB by the end of the month. Rebar export prices then increased to a peak of $590/t FOB by the end of February followed by a downward trend reaching $568/t FOB at the end of March. During the second quarter of 2018, the Turkish export rebar price continued to follow a downward trend alongside the scrap HMS 1&2 index, ranging between $565/t FOB at the beginning of April to $540/t FOB at the end of May. The average Turkish export rebar price for the first half of 2018 was $562/t FOB. With US and European markets blocked for Turkish
exporters due to EU safeguard measures and doubling of the Section 232 import tariffs into the U.S., Turkish producers faced increased competition on alternative markets resulting in further pressure on export rebar prices during the first part of the third quarter. Prices seemed to bottom out mid-August at $523/t; however they continued to deteriorate during October to a $500/t level. After a small uptick in November supported by an improvement in scrap prices as well as a strengthening of the Turkish Lira, Turkish export rebar prices dropped by the end of the fourth quarter of 2018 to $455/t, the lowest level since July 2017. The average Turkish export rebar price for the second half of 2018 was $507/t FOB.
In Turkey, rebar export prices continue to align closely with the evolution of world scrap prices. The first quarter of 2019 started for Turkish rebar at one of the lowest points compared to the previous six quarters, being at $466/t FOB, which is in line with the bottomed HMS 1&2 index at $310/t CFR. However, the March 2019 rebar export price was $482/t FOB, higher by $36/t compared to January at $446/t. During the second quarter of 2019, the Turkish export rebar price followed a month over month downward trend alongside scrap HMS 1&2 index, from a high of $480/t FOB at beginning of April down to $468/t FOB at the end of June. Nevertheless, the average for the second quarter, at $473/t, was higher than the average for the previous quarter at $466/t. In the first half of 2019, the Turkish export rebar price averaged $470/t FOB compared to $562/t FOB average during the first half of 2018.
In the third quarter of 2019, the price of Turkish rebar continued the downward trend from the previous quarter, reaching $441/t FOB, which is a $32/t decrease quarter-on-quarter. July opened the quarter at $461/t, while September closed at $413/t, representing a drop of $48/t driven by the seasonally limited demand. In October, prices reached a floor for the year at $405/t, which was also the lowest point over the last three years. The prices subsequently increased with the overall fourth quarter of 2019 averaging at $421/t. The year closed in December with a price of $442/t, $37/t higher versus the low reached in October. The increase in prices was driven by the U.S. scrap price improvement from early November, which recovered the $40/t lost in September/October and ended the year in December at $290/t, although not enough to surpass the level from the first half of the year at $348/t. The average Turkish rebar export price for the second half of 2019 was $431/t FOB as compared to $508/t FOB for the second half of 2018.
In Turkey, rebar export prices continued to evolve alongside scrap HMS 1&2 index trend. After recovering since September 2019, the first quarter of 2020 started with the rebar Turkey export price at a peak level of $445/t Free on Board (“FOB”). It soon began fluctuating on a downward trend, hitting a four year low at the end of March at $380/t.
At the beginning of the second quarter of 2020, as signs of scrap shortages encouraged U.S. traders to increase scrap offers into Turkey, the rebar Turkey export price fluctuated upward, reaching its highest level mid-June at €419/t.
In the first half of 2020, the Turkish export rebar price averaged $416/t FOB compared to an average of $470/t FOB for the first half of 2019 and $431/t FOB for the second half of 2019.
During the third quarter of 2020, scrap costs increased and Billet Turkey CFR price saw an uptick due to tight supply ex CIS and improved demand in Asia. This provided support for Turkey rebar export price references, which continued to improve, reaching another peak at $460/t FOB by mid-September (+$41/t compared to the June level). Slight price declines were noted during October, but the price increase was evident during November and December 2020, in line with a strong increase in scrap costs, as well as improved export and domestic demand, while material was in shortage. Rebar Turkey export price gained another $180/t by the end of the fourth quarter of 2020, to $640/t level.
In the second half of 2020, the Turkish export rebar price averaged $473/t FOB, representing a $57/t increase compared to the first half of 2020 and s $42/t increase compared to the second half of 2019.
| | | | | | | | | | | |
| Long products | | | |
| Source: Steel Business Briefing (SBB) | Europe medium sections | Europe rebar | Turkish rebar |
| Spot average price per tonne | Spot average price per tonne | Spot FOB average price per tonne |
| Q1 2018 | €614 | €558 | $572 |
| Q2 2018 | €592 | €545 | $552 |
| Q3 2018 | €611 | €551 | $525 |
| Q4 2018 | €626 | €538 | $490 |
| | | |
| Q1 2019 | €605 | €526 | $466 |
| Q2 2019 | €583 | €515 | $473 |
| Q3 2019 | €567 | €490 | $441 |
| Q4 2019 | €529 | €461 | $421 |
| | | |
| Q1 2020 | €533 | €468 | $426 |
| Q2 2020 | €520 | €453 | $406 |
| Q3 2020 | €513 | €442 | $438 |
| Q4 2020 | €554 | €488 | $507 |
Raw materials
The primary raw material inputs for a steelmaker are iron ore, coking coal, solid fuels, metallics (e.g., scrap), alloys, electricity, natural gas and base metals. ArcelorMittal is exposed to price volatility in each of these raw materials with respect to its
purchases in the spot market and under its long-term supply contracts. In the longer term, demand for raw materials is expected to continue to correlate closely with the steel market, with prices fluctuating according to supply and demand dynamics. Since most of the minerals used in the steel-making process are finite resources, their prices may also rise in response to any perceived scarcity of remaining accessible supplies, combined with the evolution of the pipeline of new exploration projects to replace depleted resources. In the first quarter of 2018, iron ore market reference prices increased following a decrease in the fourth quarter of 2017, averaging $74.39/t, up 13.6% compared to the fourth quarter of 2017 (Metal Bulletin 2018 vs. 2017), supported by robust crude steel production in China. For the full year 2018, the strong steel production in China amid its fight against air pollution and overcapacity kept iron ore and coking coal prices at elevated levels and boosted prices for high-grade qualities as steel mills chased productivity. Though prices for the most common qualities of iron ore decreased 2.2% year-on-year in 2018, the high-grade qualities of iron ore posted a price increase on an annual basis. Coking coal prices increased 10.3% compared to 2017 (Metal Bulletin 2018 vs. 2017).
In 2019, iron ore market reference prices increased following a supply disruption caused by the collapse of the Brumadinho dam owned by Vale in Brazil on January 25, 2019 and the cyclone in Australia mining region (end of March 2019), averaging $93.63/t, up 34% compared to 2018 (Metal Bulletin 2019 vs. 2018).
In 2020, China’s demand has proven a strong price driver with crude steel production set to exceed the record 1 billion ton per year in 2020. Manufacturing activity in China continued to expand in 2020 compared to 2019 and its economy showed an enduring V-shape recovery after Covid-19. Iron ore market reference prices increased to an average of $109.03, up by 16.5% compared to an average of $93.63 in 2019.
Coking coal prices in 2018 averaged $206.58/t (compared to $187.31/t in 2017) and were supported by robust crude steel production in China as well as bullish market sentiment from risk of lower Australian supply due to the announcement of changes in the maintenance schedule by the main local rail network operator. Coking coal prices in 2019 averaged $177.36/t (compared to $206.58/t in 2018) and were initially supported by incidents in Australia (heavy rains, accident at Anglo’s Moranbah mine) and the local Australian rail network operator trade union’s industrial action and maintenance works, however, in the second half of 2019, the prices decreased, driven by coking coal import restrictions at key Chinese ports and a weak demand from India amid domestic slowdown.
Coking coal prices in 2020 averaged $123.46/t (compared to $177.36/t in 2019 ) and were initially supported in the first
quarter of 2020 by the reduction of coal production in China related to the COVID-19 pandemic and to Mongolia’s decision to close its border with China which boosted China’s import of seaborne traded coking coal. Coking coal prices then deteriorated from the second quarter of 2020 onwards after the global steel production collapsed ex-China due to the COVID-19 pandemic and has maintained low price levels due to the Chinese restrictions on imports of Australian coal that started in October 2020.
As for pricing mechanisms, since 2012, quarterly and monthly pricing systems have been the main type of contract pricing mechanisms, but spot purchases also appear to have gained a greater share as steelmakers have developed strategies to benefit from increasing spot market liquidity and volatility. In 2018, 2019 and 2020, the trend for using shorter-term pricing cycles continued. Pricing is generally linked to market price indexes and uses a variety of mechanisms, including current spot prices and average prices over specified periods. Therefore, there may not be a direct correlation between market reference prices and actual selling prices in various regions at a given time.
Iron ore
In the first quarter of 2018 iron ore prices recovered at $74.39/t, up 13.6% compared to the fourth quarter of 2017. However, great price disparities were observed. Seaborne iron ore demand was hit by a persistent weakness in downstream steel demand, the trade war developing between China and the U.S. and the extension of winter restrictions in China beyond March 15, 2018 all of which had a significant impact. In March, prices plummeted from the highest quarter price of $79.39/t in the beginning of the month to $64.99/t at the end of the month (Metal Bulletin 2017 & 2018). In the second quarter of 2018, prices decreased and remained stable at an average $65.30/t despite strong steel demand over the period. China iron ore port stocks remained high and concentrate production sharply decreased year-over-year as a result of mine inspections. However, steel PMI remained in expansion at 51.6 points in June. In the third quarter of 2018, prices were fairly stable, averaging $66.8/t. Low prices on the seaborne market found support in the fear of an intensification of the trade war between China and the U.S., depreciation of the Chinese currency, low future prices and environmental restriction in China. The last quarter of 2018 saw the iron ore price jumping and averaging $71.6/t. It reached $76.75/t on November 12, 2018 amid strong steel margins depleting stocks at Chinese ports and restocking demand in China before the start of the winter period. Also, the derailment of a BHP train carrying iron ore in Australia in the beginning of November 2018 provided some short-term support to the iron ore price that boosted the November average. However, prices dropped at the end of November, and in the beginning of December 2018, mills corrected for weak off-
season demand and reduced steel margins due to less stringent winter restrictions, which led to prices at the end of 2018 at $72.70/t.
In the first quarter of 2019, following the Vale owned Brumadinho dam disaster in Brazil, the seaborne iron ore market surged to $82.41/t on average, up 15% compared to the last quarter of 2018. The supply shock was aggravated by the cyclone season in Australia with some Australian iron ore producers lowering their output guidance for the year, which contributed to reaching $100.92/t on average in the second quarter of 2019 with a peak of $125.77/t observed on July 2 (Metal Bulletin) also supported by lower inventories at Chinese ports. Prices remained elevated in July at $119.93/t in average and sharply decreased in August to $90.69/t following expectations of weaker demand as well as the impact of currency risks which were exacerbated by the decision of China’s central bank to depreciate the yuan in response to decision of the U.S. government to extend punitive tariffs, both of which cast uncertainty on the iron ore future market, along with supply recovery. In September 2019, iron ore prices rose again on the back of a supportive paper market and expectations of increased end-user restocking activity. The average price for the third quarter of 2019 was $102.03/t. October 2019 was bearish with continued lack of end-user demand for iron ore fines ahead of announcements for winter production cuts. However, prices recovered sharply in November amid higher end-user demand for high-grade materials and supportive futures market for steel. The fourth quarter of 2019 average price was $88.97/t and the average price for 2019 was $93.63/t (Metal Bulletin).
In the first quarter of 2020, despite the COVID-19 pandemic's impact on demand, iron ore prices were supported by increased supply issues such as a partial halt of Vale’s Brucutu mine, linked to safety issues at their waste management dams, heavy rainfalls in Brazil affecting the shipments of Vale’s Northern System (Carajas) and two tropical cyclones near iron ore ports in Australia. In the second quarter of 2020, supply from both Brazil and Australia improved but it was offset by a very strong recovery of crude steel production in China in May. Iron ore reference prices increased in the second quarter of 2020 supported by supply risk due to the severe outbreak of COVID-19 in Brazil and low iron ore inventories at Chinese ports and steel mills.
In the third quarter of 2020, V-shaped recovery continued in China with increasing crude steel production in the month of July and August. The strong demand in China together with partial recovery ex-China and restocking ahead of the week-long National Day holidays in China supported Iron Ore prices that reached a multi-year high of $130.17/t in September 2020, ending the quarter with an average of $118.06/t (Metal Bulletin).
There was a gradual recovery in ex-China demand in the fourth quarter of 2020: major steelmakers such as Germany and India grew their output year-on-year in October 2020 for the first time since the COVID-19 pandemic began. At the same time, there was a disappointing supply from major iron ore suppliers in the fourth quarter: weaker shipments from Australian companies on deferred maintenance, some operational issues and tropical storms in December in Australia and lower production from Brazilian companies on delays in restarting stalled capacity and weather impacts with heavier than normal rainfalls in December. As a result, prices in the fourth quarter of 2020 increased to $133.35/t
Coking coal
Coking coal prices entered 2018 as a bullish market with record high vessel queues at a key port in Queensland, Australia and Chinese restocking demand high ahead of the Chinese New Year holiday. The spot prices (Metal Bulletin Premium HCC FOB Australia index) averaged $228.48/t in the first quarter of 2018 increasing 36.8% year-on-year and 12.2% as compared to the fourth quarter of 2017. The elevated prices were then corrected in the second quarter and reached $188.89/t (quarterly average) due to the extension of Chinese winter restrictions until April and delayed increase of steel demand in China. However, the downward movement was limited by a continued threat of supply disruptions due to Aurizon’s announced change in the maintenance plan at its rail system in Australia, and safety check at Chinese mines. The price also found support from Chinese coke prices as domestic coke producers faced environmental crackdowns. In the third quarter, coking coal prices averaged $184/t and $183/t in July and August respectively with no major supply disruption and less demand during Indian monsoon season. The prices rose again in September to $198/t with demand from strong steel production in China amid healthy margins and tight supply of low-Sulphur coking coal in the Chinese domestic market. Prices kept on increasing in the last quarter on the back of strong steel production and threat of supply issues from scheduled maintenance at key Australian ports which increased port queues again to the record levels seen at the end of 2017. The bullish sentiment found support from the breakout of a fire at one Australian mine, rendering it idle for at least six months. The coking coal spot prices increased to a quarterly average of $220.79/t in the fourth quarter of 2018.
In the first quarter of 2019, coking coal prices were volatile ranging from $190/t to $217/t. The volatility was supported by incidents in Australia, including heavy rains, an accident at Anglo’s Moranbah mine and a trade union's industrial action at a local rail network operator. The average spot price in the first quarter of 2019 was $206.33/t (Metal Bulletin Premium HCC FOB Australia index). In the second quarter of 2019, prices first increased to the quarter’s high of $213.16/t on May 13, 2019
fueled by the increased sentiment of potential less availability of metallurgical coal railroad capacity in Australia due to maintenance at a local rail network operator in April. Prices then decreased to $191.61/t on June 28, 2019 due to reduced steel margins putting pressure on coke prices. The average spot price in the second quarter of 2019 was $202.85/t. In the third quarter of 2019, tightening of coking coal import restrictions at key Chinese ports and weak demand from India during the monsoon season led to a decrease in prices with the average spot price at $161.03/t (Metal Bulletin Premium HCC FOB Australia index). In the fourth quarter of 2019, the bearish trend in the coking coal market continued driven by a slowdown in Chinese imports including a ban on imports at China’s largest coking coal handling port in Jingtang effective from October 1, 2019. Weak demand from India post the monsoon season amid domestic slowdown contributed to this bearish trend. The average coking coal spot price decreased to $139.27/t in the fourth quarter of 2019.
In the first quarter of 2020, coking coal prices ranged from $150/t to $158/t (Metal Bulletin Premium HCC FOB Australia index). Coking coal prices gradually increased in the first quarter to an average of $154.80/t with a reset of Chinese import quotas at the start of the year amid price arbitrage between domestic and imported coal and the cyclone season in Australia. However, the first quarter price rally reversed in the second quarter as ex-China market demand was severely hit by the COVID-19 outbreak with a sharp drop in crude steel production in the main coking coal import regions. Consequently, the coking coal reference price dropped in the second quarter of 2020 to an average of $117.08/t. In the third quarter of 2020, limited demand from India due to the monsoon season led to a further decrease and the average coking coal spot price fell to $112.32/t. The bearish trend in the coking coal market continued in the fourth quarter of 2020. This was influenced by the Chinese ban on import of Australian coals since October, which resulted in oversupplied high-quality Australian Hard Coking Coal in the seaborne market. The average coking coal spot price decreased to $109.88/t in the fourth quarter of 2020.
ArcelorMittal has continued to leverage its iron ore and coking coal supply chain and diversified supply portfolio as well as the flexibility provided by contractual terms to mitigate regional supply disruptions and also mitigate part of the market price volatility.
| | | | | | | | |
| Iron ore | Coking coal |
| Source: Metal Bulletin | average price per tonne (Delivered to China, Metal Bulletin index, 62% Fe) | average price per tonne (Premium Hard Coking Coal FOB Australia index) |
| Q1 2018 | 74.39 | 228.48 |
| Q2 2018 | 65.97 | 188.89 |
| Q3 2018 | 66.86 | 188.17 |
| Q4 2018 | 71.56 | 220.79 |
| | |
| Q1 2019 | 82.41 | 206.33 |
| Q2 2019 | 100.92 | 202.85 |
| Q3 2019 | 102.03 | 161.03 |
| Q4 2019 | 88.97 | 139.27 |
| | |
| Q1 2020 | 89.94 | 154.80 |
| Q2 2020 | 93.52 | 117.08 |
| Q3 2020 | 118.06 | 112.32 |
| Q4 2020 | 133.35 | 109.88 |
Scrap
The Company considers the German suppliers’ index (“BDSV”) Delivered at Place (“DAP”) as market reference.
During 2020, the “BDSV” for reference grade E3 started in January at €258/t. From February to June, it was between €229/t and €241/t reaching the lowest for the year in July at €219/t. Beginning with August, prices increased month by month reaching €246/t in November with a maximum for 2020 at €278/t at the end of December.
The average index price for 2020 was €239/t as compared to €252/t in 2019, a decrease of €13 or 5% less as compared to 2019. The average index price for 2018 was €285/t.
Turkey’s scrap imports increased by 12% in the first ten months of 2020 compared to the same period of 2019, and it remains by far the main scrap buying country in the international market. Turkish EAF steel production share dropped from 68% in 2019 to 67% in the first 10 months of 2020 while total crude steel production was up by 4.6% in the same period.
Scrap Index HMS 1&2 CFR Turkey, North Europe origin, started January 2020 at $284/t then steadily declined until reaching the 2020 low of $238/t in April. From May onwards there was a steady increase until reaching $295/t in September. In October, it went down to $281/t and towards year end increased until reaching the 2020 high in December at $413/t. This was due to lockdown measures announced in Europe in December which negatively affected the scrap generation/ availability.
The average yearly prices were $281/t in 2020, $281/t in 2019 and $334/t in 2018.
In the domestic U.S. market, HMS 1 delivered Midwest index was $10/t lower in 2020 than in 2019. The Midwest Index for HMS 1 decreased from an average of $247/t in 2019 to $237/t in 2020.
On the export market, HMS export FOB New York average prices of 2020 were at $265/t as compared to $266/t in 2019.
Ferro alloys and base metals
Ferro alloys
The underlying price driver for manganese alloys is the price of manganese ore which was at the level of $4.58 per dry metric tonne unit (“dmt”) (for 44% lump ore) on Cost, Insurance and Freight (“CIF”) China for 2020, representing a 19% decrease from $5.63/dmt in 2019 ($7.16/dmt in 2018) mainly attributed to low demand due to the COVID-19 pandemic and high stock levels at Chinese ports.
Manganese alloys prices also followed a downward trend where high carbon ferro manganese decreased by 9% from $1,203/t in 2019 to $1,099/t in 2020 ($1,330/t in 2018), silicon manganese decreased by 10% from $1,234/t in 2019 to $1,116/t in 2020 ($1,325/t in 2018) and medium carbon ferro manganese decreased by 12% from $1,780t in 2019 to $1,567/t in 2020 ($1,930/t in 2018).
Base metals
Base metals used by ArcelorMittal are zinc, tin and aluminum for coating, aluminum for deoxidization of liquid steel and nickel for producing stainless or special steels. ArcelorMittal partially hedges its exposure to its base metal inputs in accordance with its risk management policies.
The average price of zinc for 2020 was $2,265/t, representing a 11% decrease as compared to the 2019 average of $2,549/t (the 2018 average was $2,926/t). Stocks registered at the London Metal Exchange (“LME”) warehouses stood at 202,225 tonnes as of December 31, 2020, representing a almost 400% increase compared to December 31, 2019 when registered stocks stood at 51,225 tonnes (129,325 tonnes in 2018).
The average price of tin for 2020 was $17,135/t, 8.2% lower than the 2019 average of $18,671/t (2018 average was $20,167/t).
The average price of aluminum for 2020 was $1,702/t, representing a 5% decrease compared to the 2019 average of $1,792/t (the 2018 average was $2,110/t).
The average price of nickel for 2020 was $13,789/t, representing a 1.05% decrease compared to the 2019 average of $13,936/t (the 2018 average was $13,118/t).
Energy market
Solid fuels, electricity and natural gas are some of the primary raw material inputs for a steelmaker. ArcelorMittal is exposed to price volatility in each of these raw materials with respect to its purchases in the spot market and under its long-term supply contracts.
Oil
The oil price averaged $71.6/bbl and peak just above $86/bbl in early October 2018 dropping afterwards and finishing the year at a yearly low of $53.8/bbl. In 2019, the oil market tightened throughout the first and second quarter, finishing the first half of the year just higher than $65/bbl, but almost $10/bbl lower than its mid-April peak of $75/bbl. While tensions grew in the Middle East fueled by renewed sanctions on Iran, the U.S. continued to pump oil at record high levels. Facing a gloomy economic outlook, at the start of the third quarter of 2019, the Organization of Petroleum Exporting Countries ("OPEC") and Russia confirmed they would continue their efforts to balance the global market by extending the 1.2 million bpd cut by another nine months.
After averaging $62.4/bbl an range-bound trading in the fourth quarter of 2019 (see table below for quarterly average prices), during the first weeks of January oil prices traded up to $71/bbl, but immediately started to decline mainly due to OPEC and Russia failing to find an agreement to extend output cuts beyond March 2020, and the sudden drop of demand due to the worldwide pandemic driven lockdown, driving prices down 75% by April 2020. After reaching its lowest point since 2002, oil prices, backed by various economic stimulus packages, recovered by more than $20/bbl and were just above $40/bbl at the end of the first half of 2020. After a period of range-bound trading ($40 - $45/bbl for most of the time) from June to November, prices increased by 36% in the last two months of 2020 (from its lowest point in the second half of 2020 of $37.5/bbl at the end of October to $51.0/bbl by the end of December). This price increase was fueled by the optimism surrounding a COVID-19 vaccine and OPEC deciding to further cut production into 2021.
The following table shows certain quarterly average prices of oil, thermal coal and CO2 for the past three years:
| | | | | | | | | | | | | | |
| Commodities | | | | |
| Source: Thomson Reuters | Brent crude oil
spot average price $ per barrel | West Texas intermediate
spot average price $ per barrel | European thermal coal import (API2)
spot average price
$ per ton | European Union allowance
average price
€ per ton of CO2 equivalent December Delivery |
| | | |
| Q1 2018 | 67.23 | 62.89 | 86.09 | 9.80 |
| Q2 2018 | 74.97 | 67.91 | 89.97 | 14.49 |
| Q3 2018 | 75.84 | 69.43 | 98.66 | 18.85 |
| Q4 2018 | 68.60 | 59.34 | 92.45 | 20.47 |
| | | | |
| Q1 2019 | 63.83 | 54.90 | 75.38 | 22.24 |
| Q2 2019 | 68.47 | 59.91 | 57.13 | 25.55 |
| Q3 2019 | 62.03 | 56.44 | 58.75 | 26.93 |
| Q4 2019 | 62.42 | 56.87 | 58.24 | 24.88 |
| | | | |
| Q1 2020 | 50.82 | 45.78 | 49.96 | 22.81 |
| Q2 2020 | 33.39 | 28.00 | 44.61 | 21.28 |
| Q3 2020 | 43.34 | 40.92 | 51.54 | 27.41 |
| Q4 2020 | 45.26 | 42.70 | 58.69 | 27.61 |
CO2
The integrated steel process involves carbon reduction which leads to CO2 emissions, which distinguishes integrated steel producers from mini-mills and many other industries where CO2 generation is primarily linked to energy use. Launched in 2005, the European Union Emission Trading System (“EU-ETS”) has finished its third phase, which stretched from 2013 to December 2020. The fourth phase may require ArcelorMittal to incur additional costs to acquire emission allowances. However, the Company targets a reduction in emissions of 30% by 2030 and has plans to become carbon neutral by 2050 as detailed in its climate action report available on its website (which highlights that ArcelorMittal Europe is investing in two routes to carbon neutrality, Smart Carbon and an innovative DRI-based route). The EU-ETS is based on a cap-and-trade principle; it sets a cap on greenhouse gas emissions (“GHG”) from covered installations, which is then reduced year after year. Since 2009, a surplus of emission allowances has built up in the EU-ETS which kept prices below €10 per ton of CO2 equivalent (“€/tCO2e”) until 2018.
To boost the EUA price and to provide an incentive to the industry and the power sector to alter their behavior in terms of CO2 emissions, the European Commission keeps reforming the scheme. In 2018, the EUA price rallied from below €8/tCO2e in January to above €25/tCO2e by early September. Throughout the first half of 2019, the EUA price increased by 15% and finished the second quarter of 2019 at €26.5/tCO2e. Not only did the EUA price increase but the market was highly volatile mainly driven by uncertainties around Brexit, the end of the compliance period in April and the market stability reserve (“MSR”) which started operating in January 2019, reducing
auction supplies since the second week of January. A new historical high was reached in July 2019, when the price for an EUA reached €30/tCO2e. However, prices generally remained around €22/tCO2e in the first quarter of 2019 while prices were around €25/tCO2e for the rest of 2019. Prices in the first two months of 2020 remained in the same range as the fourth quarter of 2019. In March 2020, when it became clear that Europe would go into a pandemic driven lockdown, the CO2 price went down by €10/tCO2e (40%) within less than ten trading days. After bottoming below €15/tCO2e in the last week of March 2020, the market went on a steady path of recovery demonstrating a strong correlation with the global financial market. The CO2 prices at the end of the first half of the 2020 increased again to pre-COVID-19 levels around €25/tCO2e. For the second part of the year the market remained hectic with price levels between €23/tCO2e and €30.5/tCO2e. Closely mimicking the movements of the equity markets CO2 forward prices increased by 45% (+ €23/tCO2e) in the last two months of the year, reaching an all time high of €33.45/tCO2e as of December 31, 2020. One of the main drivers for such an increase was the acceptance of a 55% emissions reduction target by 2030 and the anticipation of tighter supply in the future.
The Company uses derivative financial instruments to manage its exposure to fluctuations in prices of emission rights allowances. See notes 6.3 (for the hedging impacts in the financial statements) and 9.1 (for the provisions recognized) to the consolidated financial statements for further information.
Thermal coal
Throughout the first quarter of 2018, the spot price for all publications index number 2 (“API2”) - which reflects the price for imports into ARA (Amsterdam-Rotterdam-Antwerp) - shed almost 20% as the global supply demand balance softened. After increasing throughout the second quarter of 2018, the API2 surpassed the $100/t mark in the third quarter, triggered by utilities replenishing stocks and strong demand from power stations due to a hot and dry summer. In the fourth quarter of 2018, prices remained volatile but decreased almost 20% amid China's imposition of new import restrictions, and Europe benefiting from a mild start to the winter.
During the first half of 2019, the downward trend continued and the spot price for all publications index number 2 ("API2") declined significantly, finishing the second quarter of 2019 at a 3 year low of just below $50/t (half of the 2018 peak reached in the third quarter of 2018). This sharp price decrease was driven by coal-to-gas switching across the European power sector and an abundance of supply, since Australia had to redirect its cargoes due to Chinese import restrictions. During the third quarter of 2019, short term prices rebounded amid higher spot demand and stock replenishing activity ahead of the winter. However, a milder than average winter led to a price decrease
of almost 20% during the fourth quarter of 2019, from around $64/t in September to $52/t at the end of December 2019. The first quarter of 2020 traded within a band of $47/t to $55/t. Across Europe, the physical need for thermal coal remained low as it was more favorable to burn natural gas than coal to generate power. At the end of April 2020, the power demand across North West Europe collapsed further dragging down thermal coal to a historical low of $39/t. Throughout May and June of 2020, the spot price for API2 gained more than 25% and finished the first half of 2020 where it started. The recovery was backed by a reduction in global supply due to output cuts in several key regions and increasing freight rates. The lowest point of the second half of 2020 was reached at the end of August, followed by an almost 50% increase (+ $23/t) to finish the year above $70/t for spot deliveries. As for the wider energy complex, the increase was fueled by the prospect of a brighter future. In addition, tightness in the Asian Pacific region due to trade disputes between China and Australia as well as weather related supply disruptions provided the needed support for a new 20-month high.
Natural gas - Europe
In 2018 the TTF Spot Price (the price for natural gas to be delivered the next day, which is traded on a virtual trading platform located in the Netherlands) averaged €22.85 per Megawatt hour (“€/MWh”). During the last quarter of 2018 the TTF spot price tumbled from €29.5/MWh down to €22.0/MWh. This trend continued into 2019, and the TTF spot price plummeted below the €10.0/MWh mark by the end of June 2019. This sharp decrease of 55% from the beginning of the first quarter to the end of the second quarter of 2019 happened on the back of milder than normal seasonal temperatures, rapidly improving storage levels, historical high liquefied natural gas ("LNG") arrivals and strong imports of Norwegian and Russian piped gas. Throughout the third quarter of 2019, TTF spot prices traded on average at €10.2/MWh (year-on-year decrease of 58%), with a low in September close to €7/MWh. In November, TTF spot prices increased and reached levels around €16.6/MWh. This price increase was supported by colder temperatures and the fear that Russia and Ukraine would not be able to sign a new multi-year transit contract. At the end of December 2019, the two countries agreed on a deal leading to a price decrease, closing the year at €11.7/MWh.
The TTF spot price steadily declined from January 2020 to May 2020. The average price in January 2020 was €11.1/MWh which declined further to an average of €4.6/MWh in May 2020. This price drop was fueled by oversupply in the global LNG market, continuous strong pipeline supply into Europe and weak demand due to the absence of a harsh winter and the COVID-19 pandemic slowing down industrial activity. At the end of of May, the TTF spot price dropped below €4.0/MWh marking a new all-time low. It took until end of July before prices started
to recover. Between end of July and end of December, the TTF spot price increased by almost €15.0/MWh to reach a year-high of €19.05/MWh by late December. While in August and September, U.S. LNG shut-ins limited the arrival of the super-chilled fuel, strong Asian winter demand in the fourth quarter led to poor arrivals of the period. In combination with the prospect of a quick rollout of a vaccine against COVID-19, this provided the needed support for the year-end rally.
Natural gas - United States
In North America, natural gas prices (see table below) trade independently of oil prices and are set by spot and future contracts, traded on the NYMEX exchange or over-the-counter. The recession in natural gas prices that held from the beginning of 2015 until September 2018 changed in the first two weeks of November 2018, as weather-related natural gas demand increased sharply, and the relatively low levels of natural gas in storage could not provide the needed flexibility leading to a 60% price increase in only 10 days. In mid-November 2018, the front-month Henry Hub natural gas futures hit a price of $4.8/MMBtu. Consequently, at the end of November, natural gas inventories stood 19% lower than the previous five-year average forcing the Henry Hub Month Ahead price to average $4.0/MMBtu throughout November and December 2018. Henry Hub natural gas futures lost more than 20% throughout the first half of 2019 and at the end of June were more than 50% lower than the winter peak in the fourth quarter of 2018. U.S. dry gas production during the first quarter of 2019 was almost 13% higher than in the same period a year earlier. This led to a faster than normal rise of working stocks in underground storage, resulting in downward pressure of the natural gas market. This downward pressure persisted throughout the second half of 2019, with only occasional spikes up to $2.7 per million British thermal units ("/MMBtu") in September and $2.9/MMBtu in November. Nevertheless, the fourth quarter of 2019 averaged $2.4/MMBtu (down 35% from the fourth quarter of 2018). Prices in the first half of 2020 ranged between $1.5/MMBtu - $2.0/MMBtu, a low since the first quarter of 2016. In addition to the negative impact on demand of natural gas, the COVID-19 pandemic also impacted its production, which stopped its multi-year growth trend and dropped sharply during the first half of the year. On the LNG side, U.S. exports were setting new records through the first quarter of 2020 and in first half of 2020, several plants ramped-up with only slight disruptions from the pandemic. However, low natural gas prices across the global lead to some forced shut-ins of U.S. LNG export facilities breaking the growth trend. At the end of the third quarter and into fourth quarter of 2020, exports ramped-up again to the early winter demand in Asia. While the Henry Hub average remained below $2.0/MMBtu during the first half, prices recovered steadily in the second half. At the end of October, Henry Hub reached its highest level of the year and breached the $3.2/MMBtu mark as compared to levels last observed in January 2019.
Natural gas - Asia
The Platts Japan Korea Marker ("JKM") - the LNG benchmark price assessment for spot physical cargoes delivered ex-ship into Japan, South Korea, China and Taiwan - front month contract prices dropped in the first half of 2018. In addition, at the end of the first quarter of 2018, the price spread between the Pacific and the Atlantic basin dropped below $1/MMBtu erasing the arbitrage window and allowing LNG cargoes to sail to Europe. This spread quickly increased to $3.7/MMBtu. After decreasing in the first a period of high volatility, the spread stabilized around $2.0/MMBtu by the end of the third quarter and into the fourth quarter of 2018, fueled by lackluster Asian demand, while charter rates for LNG vessels increased significantly.
During the first half of 2019, European importers had record high levels of LNG arrivals, reflecting the abundant supply across Asia amid healthy storage levels in key importing countries as a result of a mild winter. Furthermore, a significant ramp-up of new liquefaction capacity across Australia, the U.S. and Russia meant more supply to an already oversupplied market. Consequently, the JKM front month contract lost 47% from the start of the year until the end of June 2019. With muted demand and more global supply, the low prices persisted until the end of the second quarter of 2019. In the fourth quarter of 2019, amid the start of the winter, the JKM increased and averaged $5.9/MMBtu (although 42% lower than 2018).
In the first half of 2020, JKM traded at an all-time low. The decline in prices in the first half of 2020 was mainly due to greater supply than demand, mainly from the U.S. where multiple liquefaction trains ramped up, and muted demand amid full gas storage and the impact of the pandemic on oversupply. While some countries like South Korea or India benefited from the low price environment, others had a year-on-year decrease of LNG imports. Throughout the second quarter of 2020 and into August, JKM traded below $3.0/MMBtu. It continued until September before the market showed some signs of recovery ahead of the winter demand. The second half of 2020, JKM traded at historical lows during the summer and jump to lofty highs ($12.0/MMBtu) by end of December. This sharp increase was fuelled by strong Asia spot demand due to colder than average temperatures, supply disruptions in Australia and Middle East, as well as congestions at the Panama canal limiting U.S. supply to fill the void.
The following table shows quarterly average spot prices of natural gas for the past three years:
| | | | | | | | | | | |
| Natural gas | | | |
| Source: Thomson Reuters | TTF
Spot average price
€ per MWh | Henry Hub
Spot average price
$ per MMBtu | JKM
Spot average price
$ per MMBtu |
| | |
| Q1 2018 | 21.25 | 2.85 | 9.35 |
| Q2 2018 | 21.06 | 2.83 | 8.71 |
| Q3 2018 | 24.56 | 2.86 | 10.71 |
| Q4 2018 | 24.65 | 3.72 | 10.24 |
| | | |
| Q1 2019 | 18.47 | 2.87 | 6.86 |
| Q2 2019 | 13.02 | 2.51 | 4.94 |
| Q3 2019 | 10.20 | 2.33 | 4.74 |
| Q4 2019 | 12.66 | 2.41 | 5.91 |
| | | |
| Q1 2020 | 9.75 | 1.87 | 3.69 |
| Q2 2020 | 5.38 | 1.75 | 2.23 |
| Q3 2020 | 7.83 | 2.12 | 3.48 |
| Q4 2020 | 14.70 | 2.76 | 7.43 |
Electricity - Europe
Due to the regional nature of electricity markets, prices follow mainly local drivers (i.e. energy mix of the respective country, power generation from renewables, country specific energy policies, etc.). 2018 marked a structural change with the emergence of the CO2 price as one of the major price drivers. The forward baseload power contract for the front calendar year (delivery 2019) strongly increased in all European market places throughout the year (e.g. from €40.5 to €59.1/MWh in Belgium (an increase of 46% year-to-date), from €41.75 to €58.45/MWh in France (an increase of 40% year-to-date) and from €36.7 to €52.7/MWh in Germany (an increase of 44% year-to-date)). The 2018 price increase was mainly due to the overall fuel price increases, the unreliability of an aging French and Belgian nuclear fleet and a weak year in terms of renewable output, a trend which reversed in the first half of 2019, as tumbling fuel prices, combined with healthy renewable power generation and strong nuclear output helped to pressure spot prices (see average prices in the table below) across North West Europe. The lack of a severe summer heatwave helped to pressure the third quarter of 2019 prices. Wet early winter months, mild temperatures and good renewable power output contributed to a significant reduction in France and Belgium in the fourth quarter of 2019 as compared to 2018. This decrease occurred despite the fact that French nuclear availability was at a multi-year low for that time of the year, which is normally a strong support for prices. The 2019 trend continued into 2020, lower fuel prices meant lower generation cost while at the same time the renewable output across Europe grew year-on-year. On the demand side, the COVID-19 pandemic led to a sudden and severe demand drop. Consequently, in the first half of 2020, the power prices across Europe were almost reduced in half compared to the first half of 2019. May and June marked the low point for electricity prices across Europe. Along with natural gas and CO2 prices, the power prices recovered during the second
half of the year. A late heatwave in September in combination with poor renewable output provided the first strong price uptick. In December, the opposite, colder than normal temperatures in combination with poor renewables led to a second strong price uptick.
The following table shows quarterly average spot prices of electricity in Germany, France and Belgium for the past three years:
| | | | | | | | | | | |
| Electricity | | | |
| Source: Thomson Reuters | Germany
Baseload spot average price
€ per MWh | France
Baseload spot average price
€ per MWh | Belgium
Baseload spot average price
€ per MWh |
| | |
| Q1 2018 | 36.05 | 44.09 | 45.17 |
| Q2 2018 | 36.03 | 36.78 | 44.10 |
| Q3 2018 | 53.86 | 57.58 | 61.08 |
| Q4 2018 | 51.89 | 62.47 | 71.01 |
| | | |
| Q1 2019 | 41.35 | 47.18 | 48.34 |
| Q2 2019 | 35.74 | 34.81 | 34.44 |
| Q3 2019 | 37.55 | 35.64 | 35.11 |
| Q4 2019 | 36.51 | 40.23 | 39.37 |
| | | |
| Q1 2020 | 26.44 | 29.29 | 29.98 |
| Q2 2020 | 20.36 | 18.13 | 18.62 |
| Q3 2020 | 36.22 | 39.13 | 36.61 |
| Q4 2020 | 38.85 | 42.22 | 42.28 |
Ocean freight
The dry bulk market experienced its weakest year in 2020 since 2016. The Baltic Dry Index (“BDI”) average was at 1,066 points in 2020 compared to 1,352 points in 2019 (1,352 points in 2018). The Capesize index decreased by 27% year-on-year to average $13,073/day in 2020 compared to $18,025/day in 2019 ($16,529/day in 2018). The Panamax index decreased by 23% to an average of $8,587/day as compared to $11,112/day in 2019 ($11,654/day in 2018). In 2020, on the cape size, a total of 104 vessels or 23.4 million deadweight was delivered, 45 vessels were dismantled or 10.6 million deadweight as compared to 2019 when 79 vessels or 18.8 million deadweight was delivered, (52 vessels or 14.4 million deadweight in 2018). Panamax in 2020 had a total deliveries of 148 vessels or 12.2 million deadweight delivered and 0.8 million deadweight dismantled as compared to 2019 with 134 vessels or 11.1 million deadweight delivered (5.5 million deadweight in 2018).
Fleet growth across all segments was moderate, around an increase of 3.8% with order book and around 6% of the existing fleet as compared to an increase of 4.1% in deadweight terms in 2019 (2.6% increase compared to 2018).
Sources: Baltic Index, Fearnleys, Clarksons Platou, BIMCO, CTM.
Impact of exchange rate movements
Because a substantial portion of ArcelorMittal’s assets, liabilities, sales and earnings are denominated in currencies other than the U.S. dollar (its reporting currency), ArcelorMittal has exposure to fluctuations in the values of these currencies relative to the U.S. dollar. These currency fluctuations, especially the fluctuation of the U.S. dollar relative to the euro, as well as fluctuations in the currencies of the other countries in which ArcelorMittal has significant operations and sales, can have a material impact on its results of operations. For example, ArcelorMittal’s subsidiaries may purchase raw materials, including iron ore and coking coal, in U.S. dollars, but may sell finished steel products in other currencies. Consequently, an appreciation of the U.S. dollar will increase the cost of raw materials; thereby having a negative impact on the Company’s operating margins, unless the Company is able to pass along the higher cost in the form of higher selling prices. In order to minimize its currency exposure, ArcelorMittal enters into hedging transactions to lock-in a set exchange rate, as per its risk management policies.
Since April 1, 2018, the Company has designated a portfolio of euro denominated debt (€5.2 billion as of December 31, 2020) as a hedge of certain euro denominated investments (€7.4 billion as of December 31, 2020) in order to mitigate the foreign currency risk arising from certain euro denominated subsidiaries net assets. The risk arises from the fluctuation in spot exchange rates between EUR/USD, which causes the amount of the net investments to vary. See also note 6.3 to the consolidated financial statements. As a result of the hedge designation, foreign exchange gains and losses related to the portfolio of euro denominated debt are recognized in other comprehensive income.
As of December 31, 2020, the Company is mainly subject to foreign exchange exposure relating to the euro, Brazilian real, Canadian dollar, Indian rupee, Kazakhstani tenge, South African rand, Mexican peso, Polish zloty, Argentine peso and Ukrainian hryvnia against the U.S. dollar resulting from its trade payables and receivables.
In 2020, the euro increased from 1.1234 at December 31, 2019 to 1.2271 December 31, 2020 against the U.S. dollar as a result of the COVID-19 pandemic economic impact and euro rate differentials as the U.S. Federal Reserve ("FED") delivered two rates cuts in 2020 thus lowering FED Funds target rate to 0.25%.
The Polish zloty increased against the U.S. dollar throughout 2020 from 3.79 on December 31, 2019 to 3.72 on December 31, 2020. Although Polish economic performance has been impacted by the COVID-19 pandemic and lockdowns, the zloty’s behavior for the period mainly resulted from the persistent
accommodative stance from the Polish Central Bank, lowering its rate from 1.50% to 0.10%.
The Ukrainian hryvinia decreased against the U.S. dollar in 2020 starting from 23.69 on December 31, 2019 to 28.27 on December 31, 2020 reflecting the economic impacts of the COVID-19 pandemic.
The Kazakh tenge decreased against the U.S. dollar in 2020 starting from 381.18 on December 31, 2019 to 420.71 on December 31, 2020. This fluctuation was due to the economic impact of the COVID-19 pandemic, the associated lockdowns and a decrease in demand for oil.
The Indian rupee depreciated against the U.S. dollar in 2020 from 71.38 at the beginning of the year to 73.07 on December 31, 2020, because the Indian economy has been particularly hard hit by the COVID-19 pandemic.
The South African rand depreciated against the U.S. dollar from 14.12 on December 31, 2019 to 19.08 in April 2020 followed by appreciation to 14.62 on December 31, 2020, closing slightly lower year-on-year. Thus it did not significantly reflect the signs that the South African economy remains quite weak, with significant economic impact from the COVID-19 pandemic.
The Canadian dollar appreciated against the U.S. dollar throughout 2020, from 1.30 on December 31, 2019 to 1.27 on December 31, 2020, despite commodity prices weighing on the currency and the economic impact of the COVID-19 pandemic mainly due to a solid increase in domestic consumer demand.
The Mexican peso depreciated in 2020 against the U.S. dollar from 18.89 on December 31, 2019 to 25.35 in March 2020 followed by appreciation to 19.90 on December 31, 2020, closing slightly lower year-on-year. Growth in 2020 was lower than expected due to the COVID-19 pandemic, followed by low interest rates in U.S. dollar supporting the Mexican peso.
The Brazilian real depreciated against the U.S. dollar in 2020 from 4.03 on December 31, 2019 to 5.88 in May 2020 followed by appreciation to 5.20 on December 31, 2020, due to the significant impacts of the COVID-19 pandemic.
The Argentine peso depreciated against the U.S. dollar in 2020 from 59.89 on December 31, 2019 to 84.15 on December 31, 2020, as a poor economy, debt issues and the COVID-19 pandemic weighed on the local economy.
Consolidation in the steel and mining industries
Prior to 2017, consolidation transactions had decreased significantly in terms of number and value in the context of economic uncertainties in developed economies combined with a slowdown in emerging markets.
However, in an effort to reduce the worldwide structural overcapacity, some key consolidation steps were undertaken in 2020, 2019 and 2018, specifically in China, in the U.S. and in Europe.
Steel industry consolidation in China aims at enhancing international competitiveness, reducing overcapacity, rationalizing steel production based on obsolete technology, improving energy efficiency, achieving environmental targets and strengthening the bargaining position of Chinese steel companies in price negotiations for iron ore. The Chinese government set a target that 60 to 70 percent of steel should be produced by the top ten steel groups by 2025. In September 2019, Baowu Steel Group ("Baowu") and Magang (Group) Holding Co., Ltd ("Magang") signed a partnership agreement where Baowu secured a 51% stake in Magang, increasing Baowu's steel production capacity to approximately 90 million tonnes and representing a big step in the ongoing consolidation of the Chinese steel industry. On December 29, 2020, Jindal Stainless Limited announced an all-equity merger with Jindal Stainless (Hisar) Limited. The combined entity will have a capacity of 1.9 million tonnes and is expected to enter the top 10 stainless steel companies in the world and be the largest stainless steel company in India. The closing is expected in the second half of 2022 and is subject to approvals from statutory authorities, shareholders, creditors and NCLT.
In Europe, on October 29, 2019, Liberty House Group announced a merger with GFG Alliance's steel businesses to create Liberty Steel Group with a capacity of 18 million tonnes. According to the announcement, Liberty Steel Group will be the eighth largest steel producer outside China, with operations stretching from Australia to continental Europe, the United Kingdom and the United States. In addition, on October 16, 2020, Liberty Steel Group announced it made a non-binding indicative offer to acquire the steel activities of Thyssenkrupp subject to certain assumptions about the business and in December 2020 began due diligence with respect to this acquisition. The potential deal would mark the latest attempt at large-scale consolidation in Europe. In November 2018, ArcelorMittal completed the acquisition (via a long-term lease) of ArcelorMittal Italia, Europe’s largest single steel site and only integrated steelmaker in Italy with its main production facility based in Taranto. The transaction was approved by the European Commission on May 7, 2018 subject to the disposal of certain assets in Italy, Romania, North Macedonia, the Czech Republic, Luxembourg and Belgium, which were sold to Liberty Steel Group in June 2019. In December 2020, ArcelorMittal signed an agreement with Invitalia forming a public-private partnership which will result in joint control between the parties over ArcelorMittal Italia. See "Key transactions and events in 2020."
In another step towards consolidation in the U.S., United States Steel Corp announced on October 1, 2019 that it reached an agreement to purchase a minority stake in Big River Steel with an option to take complete control of the company over four years. On December 3, 2019, AK Steel and Cleveland Cliffs announced an all stock merger which was completed in March 2020. Additionally, in December 2020, ArcelorMittal sold ArcelorMittal USA's operations to Cleveland-Cliffs. See "Key transactions and events in 2020."
In December 2019, ArcelorMittal and Nippon Steel Corporation ("NSC") completed the acquisition of AMNS India through a joint venture agreement and following the submission of a competitive resolution plan setting out a positive future for the bankrupt company, an integrated flat steel producer and the largest steel company in western India. See “Business overview—Properties and capital expenditures—Investments in joint ventures.”
Critical accounting policies and use of judgments and estimates
Management’s discussion and analysis of ArcelorMittal’s operational results and financial condition is based on ArcelorMittal’s consolidated financial statements, which have been prepared in accordance with IFRS. The preparation of financial statements in conformity with IFRS recognition and measurement principles and, in particular, making the critical accounting judgments highlighted below require the use of estimates and assumptions that affect the reported amounts of assets, liabilities, revenues and expenses. Management reviews its estimates on an ongoing basis using currently available information. Changes in facts and circumstances or obtaining new information or more experience may result in revised estimates, and actual results could differ from those estimates.
An overview of ArcelorMittal's critical accounting policies under which significant judgments, estimates and assumptions are made may be found in note 1.2 to the consolidated financial statements.
Export sales
Because ArcelorMittal’s customers are mainly based outside its home country of Luxembourg, all of its sales are considered to be export sales. Annual sales to a single individual customer did not exceed 5% of sales in any of the periods presented.
Legal proceedings
ArcelorMittal is currently and may in the future be involved in litigation, arbitration or other legal proceedings. Provisions related to legal and arbitration proceedings are recorded in
accordance with the accounting policies described in note 9.1 to ArcelorMittal’s consolidated financial statements. Please refer to note 9.3 for a description of contingencies, including legal proceedings.
Operating results
The following discussion and analysis should be read in conjunction with ArcelorMittal’s consolidated financial statements included in this annual report.
ArcelorMittal reports its operations in five reportable segments: NAFTA, Brazil, Europe, ACIS and Mining.
Changes in segment composition
As from April 1, 2021, ArcelorMittal implemented changes to its organizational structure whereby primary responsibility for captive mining operations whose output is mainly consumed by their respective steel segments has been transferred to such segments. The Mining segment will retain primary responsibility for the operation of the seaborne oriented operations at ArcelorMittal Mining Canada G.P. and ArcelorMittal Infrastructure G.P. ("AMMC") and ArcelorMittal Liberia Ltd, and will continue to provide technical support to all mining operations within the Company. Accordingly, the Company modified the structure of its segment information in order to reflect changes in its approach to managing its operations and segment disclosures have been recast to reflect this new segmentation in conformity with IFRS. Only the seaborne-oriented operations of AMMC and ArcelorMittal Liberia Ltd are reported within the Mining segment. The results of any other mine are henceforth accounted for within the steel segment that it primarily supplies.
Key indicators
The key performance indicators that ArcelorMittal’s management uses to analyze operations are sales, average steel selling prices, crude steel production, steel shipments, iron ore and operating income. Management’s analysis of liquidity and capital resources is driven by net cash flow from operations less capital expenditures.
Years ended December 31, 2020, 2019 and 2018
Sales, operating income, crude steel production, steel shipments, average steel selling prices and mining production
The following tables provide a summary of ArcelorMittal’s performance by reportable segment for the year ended December 31, 2020, 2019 and 2018:
| | | | | | | | | | | | | | | | | | | | | | | | | | | | | | | | | | | |
| Sales for the year ended December 31,1 | | Operating income (loss) for the year ended December 31,2 |
| 2020 | | 2019 | | 2018 | | 2020 | | 2019 | | 2018 |
| Segment | (in $ millions) | | (in $ millions) | | (in $ millions) | | (in $ millions) | | (in $ millions) | | (in $ millions) |
| NAFTA | 13,668 | | | 18,706 | | | 20,470 | | | 1,684 | | | (1,144) | | | 1,988 | |
| Brazil | 6,336 | | | 8,166 | | | 8,761 | | | 777 | | | 853 | | | 1,370 | |
| Europe | 28,071 | | | 37,721 | | | 40,488 | | | (1,439) | | | (1,101) | | | 1,636 | |
| ACIS | 5,737 | | | 6,997 | | | 8,108 | | | 209 | | | 31 | | | 1,129 | |
| Mining | 2,785 | | | 2,664 | | | 2,226 | | | 1,247 | | | 1,026 | | | 707 | |
| Others and eliminations | (3,327) | | | (3,639) | | | (4,020) | | | (368) | | | (292) | | | (291) | |
| Total | 53,270 | | | 70,615 | | | 76,033 | | | 2,110 | | | (627) | | | 6,539 | |
1.Amounts are prior to inter-segment eliminations (except for total) and sales include non-steel sales.
2.Others and eliminations to segment operating income reflects certain adjustments made to operating income of the segments to reflect corporate costs, income from non-steel operations (e.g. energy, logistics and shipping services) and the elimination of stock margins between segments. See table below.
| | | | | | | | | | | | | | | | | |
| Others and eliminations operating (loss) income | Year ended December 31, |
| 2020 | | 2019 | | 2018 |
| (in $ millions) | | (in $ millions) | | (in $ millions) |
Corporate and shared services 1 | (199) | | | (144) | | | (170) | |
| Financial activities | (22) | | | 8 | | | (23) | |
| Shipping and logistics | 6 | | | (19) | | | 1 | |
| Intragroup stock margin eliminations | (110) | | | 18 | | | (44) | |
Depreciation and impairment 2 | (43) | | | (155) | | | (55) | |
| Total adjustments to segment operating income and other | (368) | | — | | (292) | | | (291) | |
1.Includes primarily staff and other holding costs and results from shared service activities.
2.Depreciation charges for 2019 included 94 of depreciation of right-of-use assets recognized in property, plant and equipment following the adoption of IFRS 16 "Leases" as of January 1, 2019 with respect to the Company’s shipping business Global Chartering, of which ArcelorMittal sold a 50% controlling interest on December 31, 2019.
As described earlier, in 2020, the Company successfully reduced fixed costs, (including temporary reductions and government support programs), in line with lower production resulting from the impacts of the COVID-19 pandemic. This reduction was achieved through: significant savings in labor cost (including salary reductions, utilizing the available economic unemployment schemes to match workforce to operating rates, temporary layoffs, reduction/elimination of contractors, reduced overtime, etc.), reduction in repairs and maintenance expenses (given lower operating rates) and savings in selling, general and administrative expenses. The comprehensive measures taken to “variabilize” fixed costs were critical to protecting profitability and cash flows. As economic activity recovered during the year, the Company responded by restarting or increasing production, leading to the reversal of a part of these savings. At the same time, the Company remained focused on structural cost improvements to appropriately position the fixed cost base for the post-COVID-19 operating environment.
Shipments and average steel selling price
ArcelorMittal had steel shipments of 69.1 million tonnes for the year ended December 31, 2020 as compared to steel shipments of 84.5 million tonnes for the year ended December 31, 2019, representing a decrease of 18.2%. On a comparable basis,
removing shipments from the remedy assets sold in relation to the ArcelorMittal Italia acquisition in 2019 and the shipments from ArcelorMittal USA in 2019 and 2020 due to the sale, steel shipments for 2020 declined by 15.8% to 60.1 million tonnes as compared to 71.3 million tonnes in 2019, primarily due to the impact of the COVID-19 pandemic and the slowdown that occurred in first half of 2020. Shipments were lower in Europe (22.4%), or 18.6% excluding the impact of the remedy asset sales related to the ArcelorMittal Italia acquisition in 2019), Brazil (15.9%), NAFTA (14.4%), or 8.7% excluding ArcelorMittal USA) and ACIS (14.4%).
Steel shipments decreased 23.0% to 34.3 million tonnes in the first half of 2020 compared to 44.6 million tonnes for the first half of 2019 (down 19.4% excluding the impact of the remedy asset sales related to the ArcelorMittal Italia acquisition in the first half of 2019), while steel shipments decreased 12.9% to 34.8 million tonnes in the second half of 2020 compared to 39.9 million tonnes in the second half of 2019 (down 10.6% excluding the impact of ArcelorMittal USA on a comparable basis).
ArcelorMittal had steel shipments of 84.5 million tonnes for the year ended December 31, 2019 as compared to steel shipments of 83.9 million tonnes for the year ended December 31, 2018, representing an increase of 0.8%, primarily due to higher steel shipments in Europe by 3.2% due to the impact of the
consolidation of ArcelorMittal Italia as from November 1, 2018, offset in part by the remedy asset sales related to the ArcelorMittal Italia acquisition (completed on June 30, 2019) and ongoing weak demand driven by macro headwinds including declines in automobile production. Weaker domestic apparent demand conditions led to lower shipments in NAFTA (5.1%), while weaker export markets led to lower shipments in ACIS (1.7%) and Brazil (2.4%). Steel shipments increased 3.5% to 44.6 million tonnes in the first half of 2019 compared to 43.1 million tonnes for the first half of 2018 while steel shipments decreased 2.1% to 39.9 million tonnes in the second half of 2019 compared to 40.8 million tonnes in the second half of 2018.
Average steel selling price decreased by 8.7% for the year ended December 31, 2020 as compared to the year ended December 31, 2019. Average steel selling price in the first half of 2020 decreased by 14.7% as compared to the first half of 2019 and decreased by 1.8% in the second half of 2020 as compared to the second half of 2019.
Average steel selling price decreased by 9.6% for the year ended December 31, 2019 as compared to the year ended December 31, 2018. Average steel selling price in the first half of 2019 decreased by 6.1% as compared to the first half of 2018 and decreased by 13.7% in the second half of 2019 as compared to the second half of 2018.
Sales
ArcelorMittal had sales of $53.3 billion for the year ended December 31, 2020, representing a 24.6% decrease from sales of $70.6 billion for the year ended December 31, 2019, primarily due to the impacts of the COVID-19 pandemic on lower steel shipments as discussed above and an 8.7% decrease in average steel selling prices. In the first half of 2020, sales were $25.8 billion decreasing from $38.5 billion in the first half of 2019, primarily due to 14.7% lower average steel selling prices and 23.0% lower steel shipments. In the second half of 2020, sales of $27.5 billion represented a 14.5% decrease as compared to sales of $32.1 billion in the second half of 2019, primarily driven by a 1.8% decrease in average steel selling prices and a 12.9% decrease in steel shipments.
ArcelorMittal had sales of $70.6 billion for the year ended December 31, 2019, representing a 7.1% decrease from sales of $76.0 billion for the year ended December 31, 2018, primarily due to a 9.6% decrease in average steel selling prices, partially offset by a 0.8% increase in steel shipments and higher marketable iron ore selling prices. In the first half of 2019, sales were $38.5 billion decreasing 1.8% from sales of $39.2 billion in the first half of 2018, primarily due to 6.1% lower average steel selling prices, partially offset by 3.5% higher steel shipments. In the second half of 2019, sales of $32.1 billion represented a 12.8% decrease as compared to sales of $36.8 billion in the
second half of 2018, primarily driven by a 13.7% decrease in average steel selling prices and a 2.1% decrease in steel shipments.
Cost of sales
Cost of sales consists primarily of purchases of raw materials necessary for steel-making (iron ore, coke and coking coal, scrap and alloys), energy, repair and maintenance costs, as well as direct labor costs, depreciation and impairment. Cost of sales for the year ended December 31, 2020 was $49.1 billion as compared to $68.9 billion for the year ended December 31, 2019, due to, lower steel shipments and the cost reduction measures described above in response to the COVID-19 pandemic and the gain of $1.5 billion related to the sale of ArcelorMittal USA and reversal of previous impairments of property plant and equipment at ArcelorMittal USA in connection with the sale for $660 million. These decreases were offset in part by impairments of $331 million relating to the Company's plate assets classified as held for sale in Europe, charges of $104 million following the permanent closure of a blast furnace and steel plant in Krakow (Poland) as well as $146 million of site restoration and termination charges for it, charges related to the permanent closure of the coke plant in Florange (France) of $92 million and inventory related charges in NAFTA and Europe of $0.7 billion. Selling, general and administrative expenses (“SG&A”) were $2.0 billion for the year ended December 31, 2020 compared to $2.4 billion for the year ended December 31, 2019. SG&A as a percentage of sales increased for the year ended December 31, 2020 (3.8%) as compared to 2019 (3.3%).
Cost of sales for the year ended December 31, 2019 was $68.9 billion as compared to $67.0 billion for the year ended December 31, 2018, due to an increase in shipments (primarily due to the inclusion of ArcelorMittal Italia from November 1, 2018, partially offset by the sale of remedy asset as of June 30, 2019), an increase in raw material costs, impairment charges of $1.9 billion related to impairment of the fixed assets of ArcelorMittal USA ($1.3 billion - see NAFTA analysis below), remedy asset sales in connection with the ArcelorMittal Italia acquisition ($0.5 billion) and impairment charges in South Africa ($0.1 billion) as well as $0.8 billion primarily for inventory related charges in NAFTA and Europe following a period of exceptionally weak steel pricing. SG&A were $2.4 billion for the year ended December 31, 2019 compared to $2.5 billion for the year ended December 31, 2018. SG&A as a percentage of sales increased marginally for the year ended December 31, 2019 (3.3%) as compared to 2018 (3.2%).
Operating (loss) income
ArcelorMittal’s operating income for the year ended December 31, 2020 was $2.1 billion as compared with an operating loss of $0.6 billion for the year ended December 31, 2019 and was impacted by the gains and impairments described above.
Operating income was also impacted by weaker operating conditions as compared to 2019, including a negative price-cost effect in steel segments and lower steel shipments due to the COVID-19 pandemic offset in part by the fixed cost savings described above and improved mining performance, driven by higher seaborne iron ore reference prices (which were up 16.2%).
ArcelorMittal’s operating loss for the year ended December 31, 2019 was $0.6 billion as compared with an operating income of $6.5 billion for the year ended December 31, 2018 and was primarily impacted by weaker operating conditions (negative price-cost effect in steel segments) reflecting both the decline in steel prices and higher raw material costs (due in particular to supply-side developments in Brazil), impairments and inventory related charges described above, offset in part by improved Mining segment performance driven by higher seaborne iron ore reference prices (which were up 34.3%). Raw material prices increased during 2019 and for most of the year remained disconnected from steel fundamentals, compressing steel spreads to unsustainably low levels.
Operating income in 2018 was impacted by impairment charges of $1.0 billion primarily related to the remedy asset sales in connection with the ArcelorMittal Italia acquisition and the agreed remedy package required for the approval of the AMSF acquisition, $113 million in charges related to a blast furnace dismantling in Florange (France), $60 million in charges related to the new collective labor agreement in the U.S. (including a signing bonus), a $146 million provision taken in the first quarter of 2018 in respect of a litigation case that was paid in the third quarter of 2018, partially offset by a $0.2 billion bargain purchase gain related to the acquisition of ArcelorMittal Italia and the recognition in Brazil of $202 million in PIS/Cofins tax credits related to prior periods.
| | | | | | | | | | | | | | | | | |
| NAFTA | | | | | |
| Performance for the year ended December 31, |
| (in millions of USD unless otherwise shown) | 2020 | | 2019 | | 2018 |
| Sales | 13,668 | | | 18,706 | | | 20,470 | |
| Depreciation | (537) | | | (638) | | | (593) | |
| Impairment reversal (impairment) | 660 | | | (1,300) | | | — | |
| Operating income (loss) | 1,684 | | | (1,144) | | | 1,988 | |
| Crude steel production (thousand tonnes) | 17,813 | | | 21,897 | | | 22,559 | |
| Steel shipments (thousand tonnes) | 17,902 | | | 20,921 | | | 22,047 | |
| Average steel selling price (USD/tonne) | 702 | | | 810 | | | 852 | |
The escalation of the COVID-19 pandemic during the latter part of the first quarter of 2020 impacted ArcelorMittal's key end
markets in the U.S. and Canada. The Company responded immediately by significantly adapting its capacity which continued during the second quarter of 2020. With the recovery of demand starting from the third quarter of 2020, the Company restarted some capacity. On December 9, 2020, the Company completed the sale of its steel manufacturing and mining operations comprised of the Princeton coal mines and Hibbing/Minorca iron ore mines in the USA to Cleveland-Cliffs.
Crude steel production, steel shipments and average steel selling price
Crude steel production decreased 18.7% to 17.8 million tonnes for the year ended December 31, 2020 as compared to 21.9 million tonnes for the year ended December 31, 2019. Crude steel production declined in the first half of 2020 primarily due to the adjustment of production to align with demand which was impacted by the pandemic (particularly in the U.S. and Canadian operations). Crude steel production in the second half of 2020 was 21.1% lower than the second half of 2019 mainly due to the adjustment of production to align with demand and the sale of ArcelorMittal USA to Cleveland-Cliffs on December 9, 2020. Crude steel production in the fourth quarter of 2020 for the rest of the NAFTA segment was 2.1 million tonnes, which represented a 2.8% increase compared to the third quarter of 2020 following the gradual improvement in demand.
Crude steel production decreased 2.9% to 21.9 million tonnes for the year ended December 31, 2019 as compared to 22.6 million tonnes for the year ended December 31, 2018. Crude steel production declined in the first half of 2019 primarily due to the restart of a blast furnace in Mexico which was only fully operational in the second quarter of 2019 after scheduled maintenance in the third quarter of 2018, loss due to power outage in Burns Harbour in the first quarter of 2019 and a slowdown following weaker market demand in the first half while production in the second half of 2019 was 1.6% higher than the second half of 2018 mainly due to the impact of the scheduled maintenance of a blast furnace in Mexico from third quarter of 2018, partly offset by planned outages both in flat and long product operations in the fourth quarter of 2019.
Steel shipments decreased 14.4% for the year ended December 31, 2020 as compared to the year ended December 31, 2019 (including the impact of the sale of ArcelorMittal USA as mentioned above), reflecting the lower market demand during the year. Steel shipments increased for the rest of the NAFTA segment in the fourth quarter of 2020 by 4.9% following the gradual improvement in demand compared to the third quarter of 2020 and was only down by 1.4% compared to the fourth quarter of 2019 on a comparable basis. Shipments from the U.S. operations in 2020 were 9.14 million tonnes.
Steel shipments decreased 5.1% for the year ended December 31, 2019 as compared to the year ended December 31, 2018
reflecting the decreased production and market demand during the year (including pronounced supply chain destocking).
Average steel selling prices decreased 13.4% for the year ended December 31, 2020 as compared to the year ended December 31, 2019. In the first half of 2020, average steel selling prices were 18.5% lower than the first half of 2019, inline with the decline in market prices. Average steel selling prices in the second half of 2020 began to improve but remained 7.2% lower as compared to the second half of 2019.
Average steel selling prices decreased 4.9% for the year ended December 31, 2019 as compared to the year ended December 31, 2018. Average steel selling prices increased 4.7% to $855/t in the first half of 2019 from $817/t in the first half of 2018. In the first quarter of 2019, average steel selling prices were 12.1% higher than the first quarter of 2018 while in the second quarter of 2019, average steel selling prices were 1.9% and 4.3% lower than the second quarter of 2018 and first quarter of 2019, respectively. This decline continued in the second half of 2019 with average steel selling prices decreasing by 14.3% compared to the second half of 2018, reflecting the ongoing supply chain destock. The average steel selling prices in the second half of 2018 were higher following the imposition of import tariffs on steel in the second quarter of 2018.
Sales
Sales in the NAFTA segment were $13.7 billion for the year ended December 31, 2020, representing a 26.9% decrease as compared to the year ended December 31, 2019. Sales decreased primarily as a result of a decrease in average steel selling prices by 13.4% and a decrease in steel shipments by 14.4%.
Sales in the NAFTA segment were $18.7 billion for the year ended December 31, 2019, representing a 8.6% decrease as compared to the year ended December 31, 2018. Sales decreased primarily as a result of a decrease in average steel selling prices by 4.9% and a decrease in steel shipments by 5.1%.
Operating income (loss)
Operating income for the NAFTA segment was $1.7 billion for the year ended December 31, 2020 as compared to operating loss of $1.1 billion for the year ended December 31, 2019. Operating income for the year ended December 31, 2020 includes a $1.5 billion gain on the sale of ArcelorMittal USA and a $660 million gain related to the partial reversal of impairments recorded in ArcelorMittal USA following the announced sale, as well as inventory related charges of $0.5 billion. Operating loss for the year ended December 31, 2019 was impacted by impairment charges of $1.3 billion and inventory related charges of $0.2 billion as further detailed below. Excluding these gains, operating performance reflected weaker operating conditions
(lower volumes and negative price-cost effect offset in part by lower fixed cost) due in particular to the impact of the COVID-19 pandemic.
Operating loss for the NAFTA segment was $1.1 billion for the year ended December 31, 2019 as compared to operating income of $2.0 billion for the year ended December 31, 2018, primarily driven by a 5.1% decline in steel shipments and a negative price cost effect due to a 4.9% decrease in average steel selling prices, reflecting weaker demand exacerbated by prolonged customer destocking and increased domestic supply with prices well below import parity, and an increase in raw material prices. Operating loss for the year ended December 31, 2019 was negatively impacted by an impairment in the second quarter of 2019 of property, plant and equipment of ArcelorMittal USA for $0.6 billion and a further impairment in the fourth quarter of 2019 of the property, plant and equipment of ArcelorMittal USA for $0.7 billion following downward revisions of future cash flow projections reflecting lower near term average steel selling price assumptions. Operating loss for the year ended December 31, 2019 also included $0.2 billion in charges related to inventory following a period of exceptionally weak steel pricing. Operating income in 2018 was impacted by other items as described above.
| | | | | | | | | | | | | | | | | |
| Brazil | | | | | |
| Performance for the year ended December 31, |
| (in millions of USD unless otherwise shown) | 2020 | | 2019 | | 2018 |
| Sales | 6,336 | | | 8,166 | | | 8,761 | |
| Depreciation | (228) | | | (277) | | | (301) | |
| Impairments | — | | | — | | | (86) | |
| Operating income | 777 | | | 853 | | | 1,370 | |
| Crude steel production (thousand tonnes) | 9,539 | | | 11,001 | | | 12,264 | |
| Steel shipments (thousand tonnes) | 9,410 | | | 11,192 | | | 11,464 | |
| Average steel selling price (USD/tonne) | 634 | | | 679 | | | 719 | |
The COVID-19 pandemic and government containment efforts started later in Latin America than in some other geographies. As a result, the Company idled ArcelorMittal Tubarão's blast furnace No. 3 from April 21, 2020, and implemented production curtailments in Argentina and of long product capacity in Brazil, to match demand levels. Subsequently, given the sharp recovery in domestic demand, improving export market conditions and a favorable cost position, the Company restarted activities at ArcelorMittal Tubarão's blast furnace No. 2 in July (idled since June 2019) and blast furnace No. 3 in October and substantially all of its long product capacity in Brazil.
Crude steel production, steel shipments and average steel selling price
Crude steel production decreased 13.3% to 9.5 million tonnes for the year ended December 31, 2020 as compared to 11.0 million tonnes for the year ended December 31, 2019 mainly due to the COVID-19 pandemic and reduction in demand most significantly in the second quarter of 2020. Crude steel production increased in both flat (restart of BF#3 at ArcelorMittal Tubarão in the fourth quarter of 2020) and long products given the ongoing recovery in demand in the second half of 2020.
Crude steel production decreased 10.3% to 11.0 million tonnes for the year ended December 31, 2019 as compared to 12.3 million tonnes for the year ended December 31, 2018 mainly due to lower flat production following the stoppage of ArcelorMittal Tubarão's blast furnace #2 in response to deteriorating export market conditions and lower long product production.
Steel shipments decreased to 9.4 million tonnes for the year ended December 31, 2020 as compared to 11.2 million tonnes for the year ended December 31, 2019. Steel shipments in the first half of 2020 decreased 22.2% as compared to the first half of 2019 primarily due to the impacts of the COVID-19 pandemic, while shipments for the second half of 2020 were 9.5% lower compared to the second half of 2019 reflecting the ongoing recovery in demand.
Steel shipments decreased to 11.2 million tonnes for the year ended December 31, 2019 as compared to 11.5 million tonnes for the year ended December 31, 2018. Steel shipments in the first half of 2019 increased 6.6% to 5.7 million tonnes as compared to 5.3 million tonnes in the first half of 2018 due to higher sales of flat products in both domestic and export markets, while shipments for the second half of 2019 decreased 10.1% to 5.5 million tonnes compared to 6.2 million tonnes for the second half of 2018 due to deteriorating export market conditions.
Average steel selling prices decreased 6.7% for the year ended December 31, 2020 as compared to the year ended December 31, 2019 in line with domestic and export prices and include the impact of the depreciation of the Brazilian Real on domestic selling prices. Average steel selling prices declined 15.0% in the first half of 2020 compared to first half of 2019 and increased 1.8% in the second half of 2020 compared to the second half of 2019 due to improvements for both domestic and export flat and long products.
Average steel selling prices decreased 5.5% for the year ended December 31, 2019 as compared to the year ended December 31, 2018 in line with domestic and export prices. Average steel selling prices declined 4.7% in the first half of 2019 compared to first half of 2018 and 7.0% in the second half of 2019 compared to the second half of 2018.
Sales
In the Brazil segment, sales decreased 22.4% to 6.3 billion for the year ended December 31, 2020 as compared to the year ended December 31, 2019, primarily due to a 6.7% decrease in average steel selling prices and a 15.9% decrease in shipments. In the first half of 2020, sales decreased 34.8% to $2.8 billion as compared to $4.3 billion for the first half of 2019 primarily due to 22.2% lower steel shipments and 15.0% lower average steel selling prices, while in the second half of 2020, sales decreased 8.6% compared to the second half of 2019 driven by a 9.5% decrease in shipments offset in part by 1.8% increase in average steel selling prices.
In the Brazil segment, sales decreased 6.8% to $8.2 billion for the year ended December 31, 2019 as compared to the year ended December 31, 2018, primarily due to a 5.5% decrease in average steel selling prices and a 2.4% decrease in shipments. In the first half of 2019, sales increased 2.6% to $4.3 billion as compared to $4.2 billion for the first half of 2018 primarily due to 6.6% higher steel shipments partially offset by 4.7% lower average steel selling prices while in the second half of 2019, sales decreased 15.4% compared to the second half of 2018 driven by a 10.1% decrease in shipments and a 7.0% decrease in average steel selling prices.
Operating income
Operating income for the Brazil segment was $777 million for the year ended December 31, 2020, representing a decrease of 8.9% as compared to the year ended December 31, 2019. In the first half of 2020 operating income decreased 42.8% primarily driven by lower steel shipments offset in part by lower costs, while operating income for the second half of 2020 increased 33.9% as compared to the second half of 2019, primarily due to a positive price-cost effect. Operating income for the first and second halves of 2020 was also negatively impacted by foreign exchange translation impact due to the significant depreciation of Brazilian Real for the year ended December 31, 2020.
Operating income for the Brazil segment was $853 million for the year ended December 31, 2019, representing a decrease of 37.7% as compared to the year ended December 31, 2018, driven primarily by a negative price-cost effect reflecting in part the increasing price of iron ore due to supply-side developments in Brazil, foreign exchange translation impact and lower steel shipments in the second half of 2019. Operating income in 2018 was impacted by impairment charges and other items as described above.
| | | | | | | | | | | | | | | | | |
| Europe | | | | | |
| Performance for the year ended December 31, |
| (in millions of USD unless otherwise shown) | 2020 | | 2019 | | 2018 |
| Sales | 28,071 | | | 37,721 | | | 40,488 | |
| Depreciation | (1,418) | | | (1,261) | | | (1,201) | |
| Impairments | (527) | | | (525) | | | (908) | |
| Operating (loss) income | (1,439) | | | (1,101) | | | 1,636 | |
| Crude steel production (thousand tonnes) | 34,004 | | | 43,913 | | | 44,693 | |
| Steel shipments (thousand tonnes) | 32,873 | | | 42,352 | | | 41,020 | |
| Average steel selling price (USD/tonne) | 655 | | | 696 | | | 787 | |
The COVID-19 pandemic containment measures began impacting European industrial activity in mid-March. The Company announced measures on March 19, 2020 to reduce production and the temporary idling of steel making and finishing assets, including operations in Italy, France, Spain, Germany, Belgium and Poland which continued in the second quarter of 2020. In the second half of 2020, demand and activity levels gradually improved, particularly for automotive and manufacturing activity resulting in the restart of several assets idled earlier in the year.
Crude steel production, steel shipments and average steel selling price
Crude steel production for the Europe segment decreased 22.6% to 34.0 million tonnes for the year ended December 31, 2020 as compared to 43.9 million tonnes for the year ended December 31, 2019. On a comparable basis, adjusting for the impact of the sale of remedy assets related to the acquisition of ArcelorMittal Italia in 2019, production decreased 18.6%. In the first half of 2020, crude steel production decreased 30.5% to 17.0 million tonnes from 24.5 million tonnes in the first half of 2019, primarily driven by weak demand caused by the COVID-19 pandemic and lockdown measures in response to the COVID-19 pandemic and the impact of the sale of remedy assets mentioned above. In the second half of 2020, crude steel production decreased 12.6% to 17.0 million tonnes from 19.5 million tonnes in the second half of 2019, in line with the improved activity levels described above. Despite the sequential improvement, steel demand remains well below pre-crisis levels. Although the Company has restarted capacity in the second half of 2020, some steel-making capacity during the last quarter of 2020 remained idled, including a blast furnace at Gent, Belgium that restarted March 1, 2021 following a major reline.
Crude steel production for the Europe segment decreased 1.7% to 43.9 million tonnes for the year ended December 31, 2019 as compared to 44.7 million tonnes for the year ended December 31, 2018. In the first half of 2019, crude steel production
increased 9.8% to 24.5 million tonnes from 22.3 million tonnes in the first half of 2018, primarily due to the impact of ArcelorMittal Italia (subsequent to its acquisition on November 1, 2018). The Company announced production cuts in May 2019 for approximately 4.2 million tonnes of annualized production to bring supply in line with addressable demand. The production cuts were implemented in the second half of 2019, with a portion taking effect in the third quarter of 2019 and the remainder completed as scheduled in the fourth quarter of 2019. Crude steel production decreased 13.2% in the second half of 2019 compared to the second half of 2018, including the impact of the remedy asset sales for the ArcelorMittal Italia acquisition with effect from June 30, 2019 and production cuts.
Steel shipments were 32.9 million tonnes for the year ended December 31, 2020, a 22.4% decrease from steel shipments of 42.4 million for the year ended December 31, 2019. On a comparable basis, adjusting for the exit of the remedy asset sales related to the acquisition of ArcelorMittal Italia in June 2019, shipments decreased 18.6%. Steel shipments decreased 31.0% to 16.1 million tonnes in the first half of 2020, from 23.4 million tonnes in the first half of 2019, including the lower shipments related to the sale of remedy assets for the ArcelorMittal Italia acquisition on June 30, 2019, primarily driven by lower industrial activity and steel demand due to the pandemic impact. Steel shipments in Europe started to decline in the latter part of March and early in the second quarter of 2020 due to the pandemic containment measures implemented. Steel shipments decreased 11.8% in the second half of 2020 compared to the second half of 2019, primarily due to the impacts of the COVID-19 pandemic.
Steel shipments were 42.4 million tonnes for the year ended December 31, 2019, a 3.2% increase from steel shipments of 41.0 million for the year ended December 31, 2018. Steel shipments increased 10.1% to 23.4 million tonnes in the first half of 2019, from 21.2 million tonnes in the first half of 2018, primarily due to the impact of ArcelorMittal Italia as mentioned above, partially offset by lower long product shipments, while shipments in the first half of 2018 were impacted by floods in Asturias, Spain and rail strikes in France. Steel shipments decreased 4.1% in the second half of 2019 compared to the second half of 2018, due to the impact of the remedy asset sales for the ArcelorMittal Italia acquisition and the impact of ongoing weak demand, in particular macroeconomic headwinds including declines in automobile production.
Average steel selling prices decreased 5.8% for the year ended December 31, 2020 as compared to the year ended December 31, 2019 in line with the lower market prices. Average steel selling prices decreased 11.2% during the first half of 2020 as compared to the first half of 2019 and marginally increased 0.4% during the second half of 2020 as compared to the second half of 2019, reflecting improved international prices particularly
in the fourth quarter of 2020 and including the impact of appreciation of the euro against the U.S. dollar in the second half of 2020.
Average steel selling prices decreased 11.7% for the year ended December 31, 2019 as compared to the year ended December 31, 2018 in line with market prices and the appreciation of the U.S. dollar against the euro in 2019. Average steel selling prices decreased 10.5% during the first half of 2019 as compared to the first half of 2018 in line with market prices and 13.3% during the second half of 2019 as compared to the second half of 2018.
Sales
Sales in the Europe segment were $28.1 billion for the year ended December 31, 2020, representing an 25.6% decrease as compared to sales of $37.7 billion for the year ended December 31, 2019, primarily due to a 5.8% decrease in average steel selling prices and a 22.4% decrease in steel shipments. Sales decreased by 35.6% and 13.2%in the first and second half of 2020 as compared to the first and second half of 2019, respectively.
Sales in the Europe segment were $37.7 billion for the year ended December 31, 2019, representing an 6.8% decrease as compared to sales of $40.5 billion for the year ended December 31, 2018, primarily due to an 11.7% decrease in average steel selling prices offset in part by a 3.2% increase in steel shipments. Sales decreased by 1.3% and 12.9% in the first and second half of 2019 as compared to the first and second half of 2018, respectively.
Operating (loss) income
Operating loss for the Europe segment for the year ended December 31, 2020 was $1.4 billion as compared to $1.1 billion for the year ended December 31, 2019. The operating loss was impacted by lower steel shipments and average steel selling prices driving a negative price-cost effect, partly offset by fixed cost reduction and improved performance at ArcelorMittal Italia. Operating loss in the first half of 2020 included an impairment of $0.1 billion related to the coke plant in Florange, France, which was closed at the end of April 2020 and inventory related charges of $191 million due to a weaker steel pricing outlook driven by the pandemic impacts. In the second half of 2020, operating loss included impairment charges of $331 million related to the plate assets classified as held for sale, $104 million related to the closure of the blast furnace and the steel plant in Krakow (Poland) as well as $146 million related to its site restoration and termination charges.
Operating loss for the Europe segment for the year ended December 31, 2019 was $1.1 billion as compared to an income of $1.6 billion for the year ended December 31, 2018. The operating loss was impacted by a negative price-cost effect
(with lower steel pricing due to weaker economic activity and continued high level of imports, as well as higher raw material costs), continued losses at ArcelorMittal Italia, foreign exchange impact, an impairment of $0.5 billion in the first half of 2019 related to the remedy asset sales for the ArcelorMittal Italia acquisition and inventory related charges of $0.5 billion in the fourth quarter of 2019 following a period of exceptionally weak steel pricing. For the purposes of comparison with the prior year, the operating loss contribution (excluding purchase price allocation impact in 2018 and full year depreciation effect in 2019) of ArcelorMittal Italia for 2019 deteriorated by $0.6 billion compared to 2018 as it was consolidated from November 1, 2018. Operating income in 2018 was impacted by impairment charges and other items as described above.
| | | | | | | | | | | | | | | | | |
| ACIS | | | | | |
| Performance for the year ended December 31, |
| (in millions of USD unless otherwise shown) | 2020 | | 2019 | | 2018 |
| Sales | 5,737 | | | 6,997 | | | 8,108 | |
| Depreciation | (492) | | | (499) | | | (432) | |
| Impairments | — | | | (102) | | | — | |
| Operating income | 209 | | | 31 | | | 1,129 | |
| Crude steel production (thousand tonnes) | 10,171 | | | 12,998 | | | 13,022 | |
| Steel shipments (thousand tonnes) | 9,881 | | | 11,547 | | | 11,741 | |
| Average steel selling price (USD/tonne) | 464 | | | 517 | | | 598 | |
The direct COVID-19 pandemic impact in the second quarter of 2020 in the CIS region was more limited than in South Africa. During the second quarter of 2020, ArcelorMittal South Africa took several steps, including significant production cuts across all operations, to support the country's lockdown measures. The economic activity levels remained weak and having reassessed its strategic asset footprint for 2020, the Company decided to idle blast furnace C at Vanderbijlpark, and the Vereeniging electric arc furnace until demand recovers. However, with the improvement in demand, BF C was restarted in December 2020 and Vereeniging electric arc furnace continued to operate as of December 2020.
Crude steel production, steel shipments and average steel selling price
Crude steel production for the ACIS segment decreased 21.7% to 10.2 million tonnes for the year ended December 31, 2020 from 13.0 million tonnes for the year ended December 31, 2019. In the first half of 2020, crude steel production decreased 24.7% to 5.0 million tonnes from 6.6 million tonnes in the first half of 2019, primarily due to weak demand caused by the pandemic effects in all regions, in particular due to the lockdown measures in South Africa as well as the impact of the permanent closure of
the Saldanha facility in South Africa. In the second half of 2020, crude steel production decreased 18.8% to 5.2 million tonnes from 6.4 million tonnes in the second half of 2019, primarily due to the impact of COVID-19 on the demand which remains well below pre-crisis levels, and including the impact of the permanent closure of the Saldanha facility.
Crude steel production for the ACIS segment decreased marginally by 0.2% remaining at 13.0 million tonnes for the year ended December 31, 2019 and 2018.
Steel shipments for the year ended December 31, 2020 decreased by 14.4% to 9.9 million tonnes as compared to 11.5 million tonnes for the year ended December 31, 2019 mainly due to the COVID-19 pandemic impact in South Africa as well as the impact of permanent closure of the Saldanha facility, partially offset by improved shipments in Kazakhstan.
Steel shipments for the year ended December 31, 2019 decreased by 1.7% to 11.5 million tonnes as compared to 11.7 million tonnes for the year ended December 31, 2018 primarily due to lower shipments in South Africa impacted by weaker demand, offset in part by the normalization of production in the second quarter of 2019 at Temirtau following an explosion.
Average steel selling prices decreased 10.2% for the year ended December 31, 2020 as compared to the year ended December 31, 2019 in line with lower market prices. Average steel selling prices decreased 18.0% and 1.4% in the first and second half of 2020, respectively compared to the same periods in 2019.
Average steel selling prices decreased 13.6% for the year ended December 31, 2019 as compared to the year ended December 31, 2018 in line with market prices. Average steel selling prices decreased 12.6% and 14.7% in the first and second half of 2019, respectively compared to the same periods in 2018.
Sales
Sales in the ACIS segment were $5.7 billion for the year ended December 31, 2020, representing a decrease of 18.0% as compared to the year ended December 31, 2019, primarily due to a 10.2% decrease in average steel selling prices and a 14.4% decrease in steel shipments.
Sales in the ACIS segment were $7.0 billion for the year ended December 31, 2019, representing a decrease of 13.7% as compared to the year ended December 31, 2018, primarily due to a 13.6% decrease in average steel selling prices and a 1.7% decrease in steel shipments.
Operating income (loss)
Operating income for the ACIS segment for the year ended December 31, 2020 was $209 million as compared to $31 million for the year ended December 31, 2019, primarily due to the impact of impairment charges in the year ended December 2019 as described below, and lower costs including the benefit from currency depreciation on local currency denominated costs which partially offset the impact of lower shipments and selling prices. ArcelorMittal South Africa implemented several cost reduction measures in response to the pandemic to ensure the sustainability of operations in the first half of 2020.
Operating income for the ACIS segment for the year ended December 31, 2019 was $31 million as compared to an income of $1.1 billion for the year ended December 31, 2018, primarily due to a negative price-cost effect, lower shipments, impairments of $0.1 billion related to ArcelorMittal South Africa (of which $75 million related to the fixed assets of the Newcastle facility as a result of lower domestic volume forecasts and $20 million related to the closure of the Saldanha facility) and $0.1 billion of closure and retrenchment costs related to the Saldanha facility in relation to the announced Section 189 process.
| | | | | | | | | | | | | | | | | | | | |
| Mining | | | | | | |
| | Performance for the year ended December 31, |
| (in millions of USD unless otherwise shown) | | 2020 | | 2019 | | 2018 |
| Sales | | 2,785 | | | 2,664 | | | 2,226 | |
| Depreciation | | (243) | | | (237) | | | (217) | |
| Operating income | | 1,247 | | | 1,026 | | | 707 | |
| Iron ore production (million tonnes) | | 28.3 | | | 28.3 | | | 29.1 | |
| | | | | | |
| | | | | | |
| Iron ore shipments | | 28.4 | | | 28.8 | | | 29.2 | |
| | | | | | |
| | | | | | |
| | | | | | |
| | | | | | | | | | | | | | | | | | | | |
| Note | | | Year ended December 31, |
| Iron ore production (million metric tonnes) | 1 | Type | Product | 2020 | 2019 | 2018 |
| AMMC | | Open pit | Concentrate, lump, fines and pellets | 23.2 | | 23.9 | | 24.5 | |
| ArcelorMittal Liberia Ltd | | Open pit / Underground | Fines | 5.1 | | 4.4 | | 4.6 | |
| Total iron ore production | | | | 28.3 | | 28.3 | | 29.1 | |
| | | | | | |
1.Total of all finished production of fines, concentrate, pellets and lumps.
The direct impact of the COVID-19 pandemic on the mining operations has been minimal with some initial impact at AMMC during the early part of the second quarter of 2020.The operations in AMMC resumed normal activity in early May.
Production
The Mining segment iron ore production of 28.3 million tonnes for the year ended December 31, 2020 remained stable compared to the year ended December 31, 2019. Iron ore production decreased 9.2% for the first half of 2020 compared to the first half of 2019 primarily due to the lower production in AMMC. Iron ore production increased 10.5% for the second half of 2020 compared to the second half of 2019 primarily due to higher production at AMMC.
The Mining segment had iron ore production of 28.3 million tonnes for the year ended December 31, 2019, a decrease of 2.8% compared to the year ended December 31, 2018. Iron ore production remained stable for the first half of 2019 compared to the first half of 2018. Iron ore production decreased 7.4% for the second half of 2019 compared to the second half of 2018 primarily due to lower production in AMMC (following an electrical failure in the third quarter of 2019 which led to a temporary stoppage of the concentrator followed by a slow ramp-up in the fourth quarter of 2019).
Sales
Sales in the Mining segment were $2.8 billion for the year ended December 31, 2020, representing an increase of 4.6% as compared to the year ended December 31, 2019. Sales in the first half of 2020 were 23.7% lower at $1.1 billion compared to the same period in 2019 and in the second half of 2020 were 40.0% higher at $1.7 billion compared to the same period in 2019 reflecting higher sales at both AMMC and in Liberia.
Sales in the Mining segment were $2.7 billion for the year ended December 31, 2019, representing an increase of 19.7% as compared to the year ended December 31, 2018. Sales were 31.4% higher at $1.5 billion and 7.5% higher at $1.2 billion for the first and second half of 2019, respectively as compared to the same periods in 2018.
Sales to external customers were $1.2 billion for the year ended December 31, 2020, representing an increase of 20.8% as compared to the year ended December 31, 2019 mainly due to higher external shipments and seaborne iron ore reference prices and lower freight costs. Iron ore shipments were 28.4 million tonnes for the year ended December 31, 2020, representing a 1.2% decrease as compared to 28.8 million tonnes for the year ended December 31, 2019 mainly due to lower production in the first half of 2020 as described above. Iron ore shipments to external parties were 12.1 million tonnes for the year ended December 31, 2020 as compared to 10.9 million tonnes for the year ended December 31, 2019, primarily driven by higher shipments in AMMC.
Sales to external customers were $981 million for the year ended December 31, 2019, representing an increase of 17.3% as compared to the year ended December 31, 2018 mainly due
to the increase in seaborne iron ore reference prices. Iron ore shipments were 28.8 million tonnes for the year ended December 31, 2019, representing a 1.5% decrease as compared to 29.2 million tonnes for the year ended December 31, 2018. Iron ore shipments to external parties were 10.9 million tonnes for the year ended December 31, 2019 as compared to 11.5 million tonnes for the year ended December 31, 2018, primarily due to lower production at AMMC.
The average reference iron ore price was $109.03 per tonne in 2020, $93.63 per tonne in 2019 and $69.70 per tonne in 2018 (delivered to China, normalized to Qingdao and 62% Fe US $ per tonne, Metal Bulletin). However, there may not be a direct correlation between reference prices and actual selling prices in various regions at a given time. See also quarterly reference prices in "—Raw materials" above.
Operating income
Operating income for the Mining segment was $1.2 billion for the year ended December 31, 2020 as compared to $1.0 billion for the year ended December 31, 2019, primarily driven by the increase in the iron ore reference prices. Operating income for Mining segment was $0.4 billion and $0.8 billion in the first and second half of 2020, respectively, as operating performance improved in the second half due to improved shipments and higher reference prices.
Operating income for the Mining segment was $1.0 billion for the year ended December 31, 2019 as compared to $0.7 billion for the year ended December 31, 2018, primarily driven by the increase in the iron ore reference prices offset in part by the reduction in iron ore shipments and lower iron ore quality premia.
Income or loss from investments in associates, joint ventures and other investments
ArcelorMittal recorded income of $234 million from investments in associates, joint ventures and other investments for the year ended December 31, 2020, as compared to $347 million for the year ended December 31, 2019 and includes positive contribution from AMNS India offset in part by the negative impact of the COVID-19 pandemic on other investees including a $211 million impairment of the Company's investment in DHS (Germany) following the revised future cash flow expectations. AMNS India performed strongly in 2020 with crude steel production of 6.5 million tonnes and V-shaped demand recovery post COVID-19 lockdowns (with the second quarter and particularly April impacted by lockdown measures). The annual dividend income from Erdemir was lower at $12 million as compared to $93 million in 2019.
ArcelorMittal recorded income of $347 million from investments in associates, joint ventures and other investments for the year ended December 31, 2019, as compared to $652 million for the
year ended December 31, 2018 and includes a dividend income from Erdemir of $93 million as compared to $87 million in 2018.
Financing costs-net
Financing costs-net include net interest expense, revaluation of financial instruments, net foreign exchange income/expense (i.e., the net effects of transactions in a foreign currency other than the functional currency of a subsidiary) and other net financing costs (which mainly include bank fees, accretion of defined benefit obligations and other long-term liabilities).
Net financing costs were lower at $1.3 billion for the year ended December 31, 2020 as compared to $1.7 billion for the year ended December 31, 2019. Net interest expense (interest expense less interest income) was lower at $421 million for the year ended December 31, 2020 as compared to $607 million for the year ended December 31, 2019, following debt repayments and liability management transactions.
Foreign exchange gains were $107 million and $4 million for the years ended December 31, 2020 and 2019, respectively.
Other net financing costs (including expenses related to true sale of receivables, bank fees, interest on pensions and fair value adjustments of the call option of the mandatorily convertible bond and derivative instruments) were $0.9 billion for the year ended December 31, 2020 compared to $1.0 billion for the year ended December 31, 2019, and included mark-to-market losses related to the mandatory convertible bond call option totaling $68 million as compared to $356 million for the year ended December 31, 2019. Other net financing costs for 2020 also include $178 million expenses related to the extension of the mandatory convertible bond and early bond redemption premium expenses of $120 million.
Net financing costs were lower at $1.7 billion for the year ended December 31, 2019 as compared to $2.2 billion for the year ended December 31, 2018. Net interest expense (interest expense less interest income) was lower at $607 million for the year ended December 31, 2019 as compared to $615 million for the year ended December 31, 2018.
Foreign exchange gains were $4.0 million as compared to a loss of $235 million for the years ended December 31, 2019 and 2018, respectively. The foreign exchange losses were primarily due to the effect of the depreciation of the U.S. dollar against the euro on the Company's euro denominated debt in the first quarter of 2018. As of April 1, 2018, the Company designated a portfolio of euro denominated debt (€5,169 million as of December 31, 2018) as a hedge of certain euro denominated investments (€7,804 million as of December 31, 2018) in order to mitigate the foreign currency risk arising from certain euro denominated subsidiaries' net assets. The risk arises from the fluctuation in spot exchange rates between the U.S. dollar and
euro, which causes the amount of the net investments to vary. The hedged risk in the hedge of net investments is a risk of a weakening euro against the U.S. dollar that will result in a reduction in the carrying amount of the Company's net investments in the subsidiaries subject to the hedge. The euro denominated debt is designated as a hedging instrument for the change in the value of the net investments that is attributable to changes in the euro/U.S. dollar spot rate. As a result, the Company's statement of operations no longer includes foreign exchange exposure on such euro denominated debt.
Other net financing costs (including expenses related to true sale of receivables, bank fees, interest on pensions and fair value adjustments of the call option of the mandatorily convertible bond and derivative instruments) were $1.0 billion for the year ended December 31, 2019 compared to $1.4 billion for the year ended December 31, 2018, and included mark-to-market losses related to the mandatory convertible bond call option totaling $356 million as compared to $501 million for the year ended December 31, 2018.
Income tax expense (benefit)
ArcelorMittal recorded an income tax expense of $1.7 billion for the year ended December 31, 2020 as compared to $0.5 billion for the year ended December 31, 2019. The deferred tax expense in 2020 mainly includes derecognition of deferred tax assets recorded in Luxembourg following the sale of ArcelorMittal USA ($624 million), due to anticipated lower intra-group income from ArcelorMittal USA (primarily lower branding, R&D fees and interest income).
ArcelorMittal recorded an income tax expense of $0.5 billion for the year ended December 31, 2019 as compared to income tax benefit of $0.3 billion for the year ended December 31, 2018. The current income tax expense of $786 million for the year ended December 31, 2019 as compared to $928 million for the year ended December 31, 2018 was primarily driven by lower results in a number of countries. The deferred tax benefit of $327 million for the year ended December 31, 2019 includes a $0.3 billion reduction of deferred tax assets following tax rate decrease in Luxembourg and a $0.6 billion deferred tax benefit recorded in Luxembourg, due to the expectation of higher future profits.
ArcelorMittal’s consolidated income tax expense (benefit) is affected by the income tax laws and regulations in effect in the various countries in which it operates and the pre-tax results of its subsidiaries in each of these countries, which can change from year to year. ArcelorMittal operates in jurisdictions, mainly in Eastern Europe and Asia, which have a structurally lower corporate income tax rate than the statutory tax rate as enacted in Luxembourg (24.94%), as well as in jurisdictions, mainly in Brazil and Mexico, which have a structurally higher corporate income tax rate.
The statutory income tax expense (benefit) and the statutory income tax rates of the countries that most significantly resulted in the tax expense (benefit) at statutory rate for each of the years ended December 31, 2020, 2019 and 2018 are as set forth below:
| | | | | | | | | | | | | | | | | | | | | | | | | | | | | | | | | | | |
| 2020 | | 2019 | | 2018 |
| Statutory income tax | | Statutory income tax rate | | Statutory income tax | | Statutory income tax rate | | Statutory income tax | | Statutory income tax rate |
| Argentina | 21 | | | 25.00 | % | | 3 | | | 25.00 | % | | 6 | | | 25.00 | % |
| Belgium | (60) | | | 25.00 | % | | (37) | | | 25.00 | % | | 55 | | | 25.00 | % |
| Brazil | 53 | | | 34.00 | % | | 84 | | | 34.00 | % | | 271 | | | 34.00 | % |
| Canada | 274 | | | 25.90 | % | | 234 | | | 25.90 | % | | 359 | | | 25.90 | % |
| Czech Republic | — | | | 19.00 | % | | (2) | | | 19.00 | % | | (51) | | | 19.00 | % |
| France | (158) | | | 25.82 | % | | (164) | | | 25.82 | % | | 48 | | | 25.82 | % |
| Germany | (181) | | | 30.30 | % | | (124) | | | 30.30 | % | | (22) | | | 30.30 | % |
| Italy | (145) | | | 24.00 | % | | (254) | | | 24.00 | % | | 2 | | | 24.00 | % |
| Kazakhstan | (15) | | | 20.00 | % | | 52 | | | 20.00 | % | | 65 | | | 20.00 | % |
| Liberia | 39 | | | 25.00 | % | | 31 | | | 25.00 | % | | (3) | | | 25.00 | % |
| Luxembourg | 327 | | | 24.94 | % | | 407 | | | 24.94 | % | | 123 | | | 26.01 | % |
| Mexico | (84) | | | 30.00 | % | | (105) | | | 30.00 | % | | 73 | | | 30.00 | % |
| Poland | (54) | | | 19.00 | % | | (27) | | | 19.00 | % | | 45 | | | 19.00 | % |
| Romania | (8) | | | 16.00 | % | | (14) | | | 16.00 | % | | (44) | | | 16.00 | % |
| South Africa | (35) | | | 28.00 | % | | (92) | | | 28.00 | % | | 19 | | | 28.00 | % |
| Spain | (87) | | | 25.00 | % | | (73) | | | 25.00 | % | | 18 | | | 25.00 | % |
| Ukraine | (1) | | | 18.00 | % | | (21) | | | 18.00 | % | | 69 | | | 18.00 | % |
| United States | 209 | | | 21.00 | % | | (382) | | | 21.00 | % | | 44 | | | 21.00 | % |
| Others | 41 | | | | | 16 | | | | | (34) | | | |
| Total | 136 | | | | | (468) | | | | | 1,043 | | | |
Note: The statutory tax rates are the (future) rates enacted or substantively enacted by the end of the respective period.
Non-controlling interests
Net income attributable to non-controlling interests was $155 million for the year ended December 31, 2020 as compared to $63 million for the year ended December 31, 2019. Net income attributable to non-controlling interests increased in 2020 primarily as a result of the improved operating performance of ArcelorMittal South Africa.
Net income attributable to non-controlling interests was $63 million for the year ended December 31, 2019 as compared to $181 million for the year ended December 31, 2018. Net income attributable to non-controlling interests decreased in 2019 primarily as a result of the operating performance of ArcelorMittal South Africa.
Net income attributable to equity holders of the parent
ArcelorMittal’s net loss attributable to equity holders of the parent was $0.7 billion for the year ended December 31, 2020, compared to $2.5 billion in 2019. The net income attributable to equity holders of the parent was $5.1 billion for the year ended December 31, 2018.
Liquidity and capital resources
ArcelorMittal’s principal sources of liquidity are cash generated from its operations and its credit facilities at the corporate level.
Because ArcelorMittal is a holding company, it is dependent upon the earnings and cash flows of, as well as dividends and distributions from, its operating subsidiaries to pay expenses and meet its debt service obligations. Cash and cash equivalents are primarily centralized at the parent level and are managed by ArcelorMittal Treasury SNC, although from time to time cash or cash equivalent balances may be held at the Company’s international subsidiaries or its holding companies. Some of these operating subsidiaries have debt outstanding or are subject to acquisition agreements that impose restrictions on such operating subsidiaries’ ability to pay dividends, but such restrictions are not significant in the context of ArcelorMittal’s overall liquidity. Repatriation of funds from operating subsidiaries may also be affected by tax and foreign exchange policies in place from time to time in the various countries where the Company operates, though none of these policies is
currently significant in the context of ArcelorMittal’s overall liquidity.
In management’s opinion, ArcelorMittal’s credit facilities are adequate for its present requirements.
As of December 31, 2020, ArcelorMittal’s cash and cash equivalents, restricted cash and other restricted funds amounted to $6.0 billion as compared to $5.0 billion as of December 31, 2019. Restricted cash and other restricted funds of $363 million as of December 31, 2020 included $56 million relating to various environmental obligations and true sales of receivables programs in ArcelorMittal South Africa and $260 million with respect to a cash collateral provided by the Company until collection of the TSR receivables retained in ArcelorMittal USA after disposal (see note 4.1 to the consolidated financial statements). In addition, ArcelorMittal had available borrowing capacity of $5.5 billion under its $5.5 billion revolving credit facility as of December 31, 2020 and 2019.
As of December 31, 2020, ArcelorMittal’s total debt, which includes long-term debt and short-term debt was $12.3 billion, compared to $14.3 billion as of December 31, 2019.
Net debt (defined as long-term debt ($9.8 billion) plus short-term debt ($2.5 billion), less cash and cash equivalents, restricted cash and other restricted funds ($6.0 billion) was $6.4 billion as of December 31, 2020, down from $9.3 billion at December 31, 2019, comprised of long-term debt ($11.4 billion) plus short-term debt ($2.9 billion), less cash and cash equivalents and restricted cash ($5.0 billion). Most of the external debt is borrowed by the parent company on an unsecured basis and bears interest at varying levels based on a combination of fixed and variable interest rates. Gearing (defined as net debt divided by total equity) at December 31, 2020 and 2019 was 16% and 23% respectively.
The margin applicable to ArcelorMittal’s principal credit facilities ($5.5 billion revolving credit facility and certain other credit facilities) and the coupons on certain of its outstanding bonds are subject to adjustment in the event of a change in its long-term credit ratings. In 2020, ArcelorMittal's long term corporate credit rating was downgraded by Fitch on April 8, 2020 to ‘BB+’ with negative outlook and by Moody’s on May 8, 2020 to ‘Ba1’ with stable outlook, and on February 11, 2021, S&P revised the outlook of the Company’s rating from negative to stable and reaffirmed the BBB- long-term issuer credit rating, as described in the Risk Factors above. See "Introduction—Risk factors—Risks related to ArcelorMittal's financial position and organizational structure—ArcelorMittal has a substantial amount of indebtedness, which could make it more difficult or expensive to refinance its maturing debt, incur new debt and/or flexibly manage its business and the market's perception of ArcelorMittal's leverage may affect its share price."
ArcelorMittal signed on December 19, 2018 an agreement for a $5.5 billion revolving credit facility with a maturity of December 19, 2023. During the fourth quarter of 2020, ArcelorMittal executed the second option to extend the facility to December 19, 2025. The extension was completed for $5.4 billion of the available amount, with the remaining $0.1 billion remaining with a maturity of December 19, 2023 as of December 31, 2020. Both one year extension options have now been exercised. The facility contains restrictive covenants, which among other things, limit encumbrances on the assets of ArcelorMittal and its subsidiaries, the ability of ArcelorMittal’s subsidiaries to incur debt and the ability of ArcelorMittal and its subsidiaries to dispose of assets in certain circumstances. The agreement also requires compliance with a financial covenant, as summarized below.
The Company must ensure that the ratio of “Consolidated Total Net Borrowings” (consolidated total borrowings less consolidated cash and cash equivalents) to “Consolidated EBITDA” (the consolidated net pre-taxation profits of the ArcelorMittal group for a Measurement Period, subject to certain adjustments as set out in the facility) does not, at the end of each “Measurement Period” (each period of 12 months ending on the last day of a financial half-year or a financial year of the Company), exceed a certain ratio, referred to by the Company as the “Leverage ratio”. ArcelorMittal’s principal credit facilities set this ratio to 4.25 to 1. As of December 31, 2020, the Company was in compliance with the ratio.
Non-compliance with the covenants in the Company’s borrowing agreements would entitle the lenders under such facilities to accelerate the Company’s repayment obligations. The Company was in compliance with the financial covenants in the agreements related to all of its borrowings as of December 31, 2020 and December 31, 2019.
As of December 31, 2020, ArcelorMittal had guaranteed $140 million of debt of its operating subsidiaries compared to $236 million as of December 31, 2019. See also note 9.4 to the consolidated financial statements for a description of ArcelorMittal guarantees for joint ventures of $4.5 billion as of December 31, 2020. ArcelorMittal’s debt facilities have provisions whereby the acceleration of the debt of another borrower within the ArcelorMittal group could, under certain circumstances, lead to acceleration under such facilities.
On March 16, 2020, the parent company of AMNS India entered into a $5.1 billion ten-year term loan agreement with Japan Bank for International Cooperation, MUFG Bank LTD., Sumitomo Mitsui Banking Corporation, Mizuho Bank Europe N.V., and Sumitomo Mitsui Trust Bank, Limited (London Branch). The proceeds of the loan were used to refinance in full the amounts borrowed by it in connection with the acquisition of AMNS India, including the amounts borrowed under the $7
billion bridge term facilities agreement guaranteed by ArcelorMittal. The obligations under the term loan agreement are guaranteed by ArcelorMittal and NSC in proportion to their interests in the joint venture, 60% and 40%. The guarantee provided by ArcelorMittal includes the same “Leverage Ratio” financial covenant as that described above for its $5.5 billion revolving credit facility dated December 19, 2018.
The following table summarizes the repayment schedule of ArcelorMittal’s outstanding indebtedness, which includes short-term and long-term debt, as of December 31, 2020.
| | | | | | | | | | | | | | | | | | | | | | | | | | |
| Repayment amounts per year (in billions of $) |
| Type of indebtedness as of December 31, 2020 | | 2021 | 2022 | 2023 | 2024 | 2025 | >2025 | Total |
| Bonds | | 0.4 | | 0.6 | | 1.4 | | 2.0 | | 1.1 | | 2.3 | | 7.8 | |
| Commercial paper | | 1.0 | | — | | — | | — | | — | | — | | 1.0 | |
| Lease liabilities and other loans | | 1.1 | | 0.4 | | 1.1 | | 0.2 | | 0.2 | | 0.5 | | 3.5 | |
| Total gross debt | | 2.5 | | 1.0 | | 2.5 | | 2.2 | | 1.3 | | 2.8 | | 12.3 | |
As of December 31, 2020, the $5.5 billion revolving credit facility was fully available.
The average debt maturity of the Company was 5.2 years as of December 31, 2020, as compared to 5.3 years as of December 31, 2019.
Further information regarding ArcelorMittal’s outstanding short-term and long-term indebtedness as of December 31, 2020, including the breakdown between fixed rate and variable rate debt, is set forth in note 6 to the consolidated financial statements. Further information regarding ArcelorMittal’s use of financial instruments for hedging purposes is set forth in note 6 to the consolidated financial statements.
Financings
ArcelorMittal’s principal credit facilities are described below, for further information on its existing credit facilities and several debt financing and repayment transactions completed during 2020, please refer to note 6 to the consolidated financial statements.
Principal credit facilities
On May 5, 2020, ArcelorMittal signed an agreement for a $0.7 billion and €2.1 billion term facility (together the “Term Facility”) with a maturity of May 5, 2021, to be used for general corporate purposes. The Term Facility included some restrictive covenants described under the section "Liquidity and capital resources" above. The Term Facility included a mandatory prepayment and cancellation clause for proceeds received under debt and capital market transactions, less certain costs. On May 20, 2020, further to the issuance of $0.7 billion of common shares and $1.2 billion of mandatory convertible subordinated notes, the commitments under the Term Facility were reduced to $0.2 billion and €0.7 billion. On July 17, 2020 ArcelorMittal sent a cancellation notice for all unutilized amounts under the facility. The cancellation notice was effective on July 22, 2020 and the facility was terminated.
On December 19, 2018, ArcelorMittal signed an agreement for a $5.5 billion revolving credit facility (the "Facility"). This Facility replaced the $5.5 billion revolving credit facility dated April 30, 2015, which was amended and extended on December 21, 2016. The agreement incorporates a single tranche of $5.5 billion. On November 27, 2019 and on November 26, 2020, ArcelorMittal exercised the option to extend the facility's maturity by one year to December 19, 2024 and to December 19, 2025 respectively. The commitments are $5.5 billion until December 19, 2023 and $5.4 billion until December 19, 2025. The Facility may be used for general corporate purposes. As of December 31, 2020, the $5.5 billion revolving credit facility was fully available. The Company makes drawdowns from and repayments on this Facility in the framework of its cash management.
On September 30, 2010, ArcelorMittal entered into the $500 million revolving multi-currency letter of credit facility (the “Letter of Credit Facility”). The Letter of Credit Facility is used by the Company and its subsidiaries for the issuance of letters of credit and other instruments. The terms of the letters of credit and other instruments contain certain restrictions as to duration. The Letter of Credit Facility was amended on October 26, 2012 and September 30, 2014 to reduce its amount to $450 million and to $350 million, respectively. On July 31, 2019, the Company refinanced its Letter of Credit Facility by entering into a $350 million revolving multi-currency letter of credit facility, which matures on July 31, 2022. On August 5, 2020 the Letter of Credit Facility maturity was extended to July 31, 2023. On November 25, 2020 the Letter of Credit Facility increased its amount to $395 million.
Mandatory convertible bond
Please refer to note 6.3 and 11.2 to the consolidated financial statements.
Working capital management
The Company has established a number of programs for sales without recourse of trade accounts receivable to various financial institutions (referred to as true sale of receivables (“TSR”)). As of December 31, 2020, the total amount of trade accounts receivables sold amounted to $3.8 billion. Through the TSR programs, certain operating subsidiaries of ArcelorMittal surrender the control, risks and benefits associated with the accounts receivable sold; therefore, the amount of receivables sold is recorded as a sale of financial assets and the balances are removed from the consolidated statements of financial position at the moment of sale.
As part of the Company’s ongoing efforts to improve its working capital position, it continually engages with its customers and suppliers with the aim of improving overall terms, including pricing, quality, just in time delivery, discounts and payment terms. Trade accounts payable have maturities from 15 to 180 days depending on the type of material, the geographic area in which the purchase transaction occurs and the various contractual agreements. The Company’s average outstanding number of trade payable days amounted to 82 over the last 5 years. The ability of suppliers to provide payment terms may be dependent on their ability to obtain funding for their own working capital needs and or their ability to early discount their receivables at their own discretion (the Company estimates that about $2 billion of trade payables were subject to early discount by its suppliers in 2020 as compared to $2.6 billion in 2019). Given the nature and large diversification of its suppliers base the Company does not expect any material impact to its own liquidity position as a result of suppliers not having access to liquidity. As of December 31, 2020, a 5 day reduction in trade payable days would result in a trade payables decrease by $570 million.
Earnings distribution
ArcelorMittal held 22.1 million shares in treasury as of December 31, 2020, as compared to 9.8 million shares as of December 31, 2019. As of December 31, 2020, the number of shares held by the Company in treasury represented approximately 2% of the Company’s total issued share capital.
On January 31, 2018, the Company announced that the Board had agreed on a new dividend policy which was approved by the shareholders at the annual general meeting of shareholders in May 2018. Given the current de-leveraging focus, dividends began at $0.10/share in 2018 (paid from 2017 results). The Company intended to progressively increase the base dividend paid to its shareholders, and, on attainment of the net debt target, return a percentage of net cash provided by operating activities annually. The Company paid the base dividend in 2019 (paid from 2018 earnings) of $0.20 per share to the shareholders. On February 4, 2020, given the resilient cash flow and progress towards its net debt target, the Board proposed a
base dividend of $0.30 per share for 2020 (in respect of 2019). However, against the backdrop of significant cost savings measures being taken across the business due to the COVID-19 pandemic, the Board determined during the second quarter of 2020 it both appropriate and prudent to suspend dividend payments until such a time as the operating environment normalizes.
Following the achievement of the Group’s $7 billion net debt target, and in line with its previous statements, the Board has approved during the first quarter of 2021 a new capital return policy. See "History and development of the Company—Capital return policy". According to this policy, the Board recommends a $0.30/share base dividend be paid in June 2021, subject to the approval of shareholders at the AGM in May 2021.
Pension/OPEB liabilities
The defined benefit liabilities for employee benefits decreased by $2.6 billion to $4.7 billion as of December 31, 2020, as compared to $7.3 billion as of December 31, 2019. The decrease is mainly related to the derecognition of the ArcelorMittal USA net pension and OPEB liabilities with carrying amounts of $3.2 billion partly offset by the increase in the defined benefit obligation due to higher discount rates net of an increase in asset value and other actuarial gains. For additional information with respect to the Company’s pension plan and OPEB liabilities, including a breakdown by region and by type of plan, see note 8.2 to the consolidated financial statements.
Sources and uses of cash
Years ended December 31, 2020, 2019 and 2018
The following table presents a summary of cash flow of ArcelorMittal:
| | | | | | | | | | | | | | | | | |
| Summary of cash flow | For the year ended December 31, |
| (in $ millions) | 2020 | | 2019 | | 2018 |
| Net cash provided by operating activities | 4,082 | | | 6,017 | | | 4,196 | |
| Net cash used in investing activities | (2,011) | | | (3,824) | | | (3,759) | |
| Net cash (used in) provided by financing activities | (1,498) | | | 514 | | | (689) | |
Net cash provided by operating activities
For the year ended December 31, 2020, net cash provided by operating activities decreased to $4.1 billion, as compared with $6.0 billion for the year ended December 31, 2019. The decrease in net cash provided by operating activities was mainly due to an operating working capital release of $1.5 billion as compared to an operating working capital release of $2.2 billion in 2019, including an inflow for inventories of $1.79 billion, an outflow for trade accounts receivable of $0.08 billion, partially offset by an outflow for trade accounts payable of $0.21 billion. The operating working capital release was driven by a significant reduction of inventories and improved receivable rotation days including lower overdue receivables.
For the year ended December 31, 2019, net cash provided by operating activities increased to $6.0 billion, as compared with $4.2 billion for the year ended December 31, 2018. The increase in net cash provided by operating activities was mainly due to an operating working capital release of $2.2 billion, including an inflow for inventories of $2.47 billion, an inflow for trade accounts receivables of $0.96 billion, partially offset by an outflow of trade accounts payables of $1.24 billion. The operating working capital release was driven by lower inventories and receivables, due in part to lower selling prices, particularly in the fourth quarter of 2019, as well as by raw material costs and improved collection of receivables.
Net cash used in investing activities
Net cash used in investing activities was $2.0 billion for the year ended December 31, 2020 as compared to $3.8 billion for the year ended December 31, 2019. Capital expenditures were $2.4 billion for the year ended December 31, 2020 as compared to $3.6 billion for the year ended December 31, 2019. Capital expenditures for the year ended December 31, 2020 were in line with previous guidance of $2.4 billion (down from initial guidance of $3.2 billion). Excluding the capital expenditures of ArcelorMittal USA and ArcelorMittal Italia, capital expenditures in 2020 would have been $1.9 billion. The Company expects 2021 capital expenditures to increase to $2.8 billion, broadly in line with 2019, excluding ArcelorMittal USA and ArcelorMittal Italia.
Cash provided by other investing activities include net consideration received of $497 million (net of cash disposed of and transaction fees paid), for the sale of ArcelorMittal USA and $127 million received during the first quarter of 2020 in connection with the sale of the 50% interest in Global Chartering Limited during the fourth quarter of 2019, partially offset by lease payments for ArcelorMittal Italia and $260 million with respect to a cash collateral provided by the Company until collection of the TSR receivables retained in ArcelorMittal USA after disposal.
Net cash used in investing activities was $3.8 billion for the year ended December 31, 2019 and 2018. Capital expenditures
increased to $3.6 billion for the year ended December 31, 2019 as compared to $3.3 billion for the year ended December 31, 2018. Capital expenditures for the year ended December 31, 2019 were significantly below the initial guidance of $4.3 billion but marginally above the revised $3.5 billion guidance provided after the third quarter of 2019 and below the mid-year guidance of $3.8 billion as the Company adapted its capital expenditure plans to the weaker market conditions. Cash used in investing activities included:
i.$0.8 billion net cash outflow for the acquisition of AMNS India and $83 million additional UG payments,
ii.lease payments ($200 million) for the ArcelorMittal Italia acquisition and
iii.the acquisition of Münker Metallprofile GmbH in Germany ($46 million).
These outflows were offset in part by:
i.proceeds from remedy asset sales for the ArcelorMittal Italia acquisition of $518 million (cash consideration of $694 million, net of cash disposed of $34 million, an escrow deposit of $125 million which was subsequently drawn and proceeds of $17 million paid to a joint venture of the Company),
ii.the final installment of disposal proceeds from ArcelorMittal USA's 21% stake in the Empire Iron Mine Partnership for $44 million and
iii.the sale of remaining 2.6% stake in Gerdau for $116 million.
ArcelorMittal’s major capital expenditures in 2020 included the following projects: the ArcelorMittal Mexico new hot strip mill, the ArcelorMittal Italia environmental investment program, the new LF&CC 2&3 in ArcelorMittal Kryvyi Rih which was completed in the first quarter of 2020 and the hot strip mill modernization in Dofasco.
ArcelorMittal’s major capital expenditures in 2019 included the following projects: the ArcelorMittal Mexico new hot strip mill, the ArcelorMittal Italia environmental investment program, the new LF&CC 2&3 in ArcelorMittal Kryvyi Rih and the new walking beam furnaces at Burns Harbor, along with other ongoing projects.
The Company maintains the ability to adapt its capital expenditures plan to the operating environment and expects 2021 capital expenditures to be approximately $2.8 billion. See “Properties and capital expenditures—Capital expenditures” and "—Outlook" below.
Net cash provided by financing activities
Net cash used in financing activities was $1.5 billion for the year ended December 31, 2020, as compared to the net cash provided by financing activities of $0.5 billion in 2019. In 2020,
net cash used in financing activities included an outflow for net payments of $2.4 billion for short and long-term debt, $500 million for the share buyback program, $135 million for the purchase of Intesa San Paolo S.p.A. ("ISP")'s ownership interest in ArcelorMittal Italia, dividends of $181 million paid to non-controlling shareholders and $264 million for lease payments and other financing activities. These outflows were partially offset by inflows of $1.2 billion net proceeds from the issuance of the MCNs and $740 million net proceeds from the equity offering. For further details related to capital markets, liability management transactions and debt repayments in 2020, see note 6.1.2 to the consolidated financial statements.
Net cash provided by financing activities was $0.5 billion for the year ended December 31, 2019, as compared to the net cash used in financing activities of $0.7 billion in 2018. In 2019, net cash provided by financing activities included an inflow of $1.3 billion net proceeds (proceeds of $6.4 billion offset by payments of $5.1 billion) for short and long-term debt, partially offset by dividends of $332 million, a $90 million outflow related to the share buyback program and $326 million net outflows from lease payments and other financing activities. The 2019 cash outflows for lease payments and other financing activities increased as a result of the first-time application of IFRS 16 effective from January 1, 2019, as the repayments of the principal portion of the operating leases are presented under financing activities (previously reported under operating activities).
Dividends during the year ended December 31, 2020 of $181 million were paid to non-controlling shareholders in subsidiaries. Dividends paid during the year ended December 31, 2019 were $332 million, including $203 million paid to ArcelorMittal shareholders and $129 million paid to non-controlling shareholders in subsidiaries.
Equity
Equity attributable to the equity holders of the parent decreased marginally to $38.3 billion as of December 31, 2020 from $38.5 billion as of December 31, 2019. The net loss attributable to the equity holders of the parent of $0.7 billion, foreign exchange losses of $0.9 billion, $0.3 billion actuarial losses and $0.5 billion
decrease for the share buyback program were largely offset by increases of $1.1 billion for the MCNs, $0.7 billion for the equity offering and a $0.4 billion increase in the fair value of investments held in equity instruments at FVOCI. See note 11 to ArcelorMittal’s consolidated financial statements for the year ended December 31, 2020.
Equity attributable to the equity holders of the parent decreased to $38.5 billion at December 31, 2019, as compared to $42.1 billion at December 31, 2018, primarily due to the net loss attributable to the equity holders of the parent of $2.5 billion . and $0.3 billion actuarial losses.
For additional analysis of sources and uses of cash in 2018, please refer to "Operating and financial review and prospects—Liquidity and capital resources—Sources and uses of cash” in the Company's annual report for the year ended December 31, 2019.
Contractual obligations
As of December 31, 2020, the Company had no off-balance sheet arrangements that have, or are reasonably likely to have, a material effect on its financial condition, revenues or expenses, results of operations, liquidity, capital expenditures or capital resources.
ArcelorMittal has various purchase commitments for materials, supplies and items of permanent investment incidental to the ordinary course of business. As of December 31, 2020, ArcelorMittal’s management believes that these commitments are not in excess of current market prices and reflect normal business operations.
ArcelorMittal had outstanding, as of December 31, 2020, various long-term obligations that will become due in 2021 and beyond. These various purchase commitments and long-term obligations will have an effect on ArcelorMittal’s future liquidity and capital resources. The table below shows, by major category of commitment and obligations outstanding as of December 31, 2020, ArcelorMittal’s current estimate of their annual maturities (undiscounted except for environmental commitments and asset retirement obligations).
| | | | | | | | | | | | | | | | | | | | | | | | | | | | | | | | |
| (amounts in $ millions) | | Total | | Less than 1 year | | 1-3 years | | 3-5 years | | More than 5 years |
| Debt obligations—scheduled repayments—note 6.1.2 to the consolidated financial statements | | 12,322 | | | 2,507 | | | 3,409 | | | 3,530 | | | 2,876 | |
Environmental commitments and asset retirement obligations—note 9.1 and note 9.3 to the consolidated financial statements1 | | 1,058 | | | 66 | | | 277 | | | 231 | | | 484 | |
| Purchase obligations—note 9.4 to the consolidated financial statements | | 13,047 | | | 4,588 | | | 2,730 | | | 1,846 | | | 3,883 | |
Funding contribution to the pension and post-employment plans2—note 8.2 to the consolidated financial statements | | 243 | | | 243 | | — | | | — | | | — | |
| Scheduled interest payments | | 3,022 | | | 326 | | | 569 | | | 423 | | | 1,704 | |
| Other long-term liabilities | | 259 | | | — | | | 164 | | | 32 | | | 63 | |
| Acquisition/investment commitments—note 9.4 to the consolidated financial statements | | 354 | | | 352 | | | 1 | | | — | | | 1 | |
| Total | | 30,305 | | | 8,082 | | | 7,150 | | | 6,062 | | | 9,011 | |
1ArcelorMittal may be subject to additional environmental liabilities not included in the table above.
2The funding contributions to the pension and post-retirement plans are presented for the following year and to the extent known.
Estimated payments for long-term obligations have been determined by ArcelorMittal based on payment schedules for those long-term obligations where set payments exist. For long-term obligations with no set payment schedules, estimates have been made by ArcelorMittal based on the most likely timing of cash payments based on the facts and circumstances that exist as of December 31, 2020. Also included are liabilities related to environmental matters, which are further discussed in notes 9.1 and 9.3 to the consolidated financial statements. For further details on commitments, please refer to note 9.4 to the consolidated financial statements.
Outlook
Based on the current economic outlook, ArcelorMittal expects global ASC in 2021 to grow between 4.5% to 5.5% (versus a contraction of 1.0% in 2020).
Economic activity progressively improved during the second half of 2020 as lockdown measures eased. Following a prolonged period of destocking, the global steel industry is now benefiting from a favorable supply demand balance, supporting increasing utilization as demand recovers. Given this positive outlook, and subject to pandemic-related macroeconomic uncertainties, the Company expects ASC to grow in 2021 versus 2020 in all its core markets. By region:
•In the U.S., ASC is expected to grow within a range of 10.0% to 12.0% in 2021 (versus an estimated 16.0% contraction in 2020, when flat products declined by 12.0%), with stronger ASC in flat products particularly automotive while construction demand (non-residential) remains weak.
•In Europe, ASC is expected to grow within a range of 7.5% to 9.5% in 2021 (versus an estimated 10.0% contraction in 2020); with strong automotive demand expected to recover from low levels and continued support for infrastructure and residential demand.
•In Brazil, ASC is expected to continue to expand in 2021 with growth expected in the range of 6.0% to 8.0% (versus estimated growth of 1.0% in 2020) supported by ongoing construction demand and recovery in the end markets for flat steel.
•In the CIS, ASC growth in 2021 is expected to recover to within a range of 4.0% to 6.0% (versus 5.0% estimated contraction in 2020).
•In India, ASC growth in 2021 is expected to recover to within a range of 16% to 18% (versus 17% estimated contraction in 2020).
•As a result, overall world ex-China ASC in 2021 is expected to grow within the range of 8.5% to 9.5% supported by a strong rebound in India (versus 11.0% contraction in 2020).
•In China, overall demand is expected to continue to grow in 2021 to 1.0% to 3.0% (supported by ongoing stimulus) (versus estimated growth of 9.0% in 2020 which recovered well post the initial impact of the COVID-19 pandemic earlier in the year driven by stimulus).
In 2020, cash needs of the business (including capital expenditures, interest, cash paid for taxes, pensions and certain other cash payments but excluding working capital movements) were $4.1 billion (higher than the previous $3.7 billion guidance). This includes cash paid for taxes, pensions and other cash payments of $1.3 billion ($0.5 billion higher than previous guidance largely on account of higher tax payments including higher mining profitability and $0.1 billion premium on early repayment of bonds). Capital expenditures were $2.4 billion (in line with guidance and down from initial guidance of $3.2 billion) and net interest expense was $0.4 billion ($0.1 billion lower than previous guidance). The Company has provided capital expenditure guidance for 2021 of $2.8 billion (composed of an
estimated $2.4 billion of maintenance capital expenditures and $0.4 million of strategic capital expenditures) and net interest expense of $0.3 billion. The Company expects demand conditions to improve in 2021 which is expected to result in a normalization of maintenance capital expenditure levels. Full year 2021 depreciation is expected to be approximately $2.7 billion following the sale of ArcelorMittal USA in December 2020 and the anticipated deconsolidation of ArcelorMittal Italia in early 2021 (assuming current exchange rates).
All of the statements in this "Outlook" section are subject to and qualified by the information set forth under the “Cautionary Statement Regarding Forward-Looking Statements”. See also “Economic conditions".
Management and employees
Directors and senior management
Board of Directors
ArcelorMittal places a strong emphasis on corporate governance. ArcelorMittal has six independent directors on its ten member Board of Directors. The Board’s Audit & Risk Committee and Appointments, Remuneration, Corporate Governance and Sustainability Committee (“ARCGS Committee”) are each comprised exclusively of independent directors.
The annual general meeting of shareholders on June 13, 2020 acknowledged the expiration of the terms of office of Mr. Lakshmi N. Mittal, Mr. Bruno Lafont and Mr. Michel Wurth. At the same meeting, the shareholders re-elected Mr. Lakshmi N. Mittal, Mr. Bruno Lafont and Mr. Michel Wurth, and elected Mr. Aditya Mittal and Mr. Etienne Schneider for a new term of three years each.
The Board of Directors is composed of ten directors, of which six are independent directors. Mr. Lakshmi N. Mittal was the Chairman and the CEO of the Company as of December 31, 2020. Mr. Bruno Lafont is the Lead Independent Director.
On February 11, 2021, Mr. Aditya Mittal became the CEO of the Company and Mr. Lakshmi N. Mittal remains Executive Chairman of the Board, see ("—Key transactions and events in 2020—Recent developments"). The CEO Office is renamed Executive Office and Mr. Genuino Christino became the CFO. The descriptions throughout this annual report reflect the governance structure in place during 2020.
In the most recent assessment of the Company’s leadership structure, the ARCGS Committee reviewed the key duties and responsibilities of the Company’s Chairman and Chief Executive Officer and its Lead Independent Director as follows:
| | | | | |
| Chairman | Lead Independent Director |
| * Chairs the Board of Directors' and shareholders' meetings | * Provides independent leadership to the Board of Directors |
| * Works with the Lead Independent Director to set agenda for the Board of Directors and reviews the schedule of the meetings | * Presides at executive sessions of independent directors |
| * Serves as a public face of the Board of Directors and of the Company | * Advises the Chairman of any decisions reached and suggestions made at the executive sessions, as appropriate |
| * Serves as a resource for the Board of Directors | * Coordinates the activities of the other independent directors |
| * Guides discussions at the Board of Directors meetings and encourages directors to express their positions | * Oversees Board of Directors' governance processes, including succession planning and other governance-related matters |
| * Communicates significant business developments and time-sensitive matters to the Board of Directors | * Liaison between the Chairman and the other independent directors |
| * Is responsible for managing day-to-day business and affairs of the Company | * Calls meetings of the independent directors when necessary and appropriate |
| * Interacts with the CEO Office and Executive Officers of the Company and frequently meets stakeholders and provides feedback to the Board of Directors | * Leads the Board of Directors’ self-evaluation process and such other duties as are assigned from time to time by the Board of Directors |
The members of the Board of Directors are set out below:
| | | | | | | | | | | | | | | | | | | | | | | | | | |
| Name | | Age4 | | Date of joining the Board5 | | End of Term | | Position within ArcelorMittal4 |
| Lakshmi N. Mittal | | 70 | | | May 1997 | | May 2023 | | Chairman of the Board of Directors and Chief Executive Officer |
Aditya Mittal7 | | 44 | | June 2020 | | May 2023 | | Director and Chief Financial Officer |
Vanisha Mittal Bhatia6 | | 40 | | December 2004 | | May 2022 | | Director |
Suzanne P. Nimocks2 3 | | 61 | | January 2011 | | May 2022 | | Director |
Bruno Lafont1 2 3 | | 64 | | May 2011 | | May 2023 | | Lead Independent Director |
Tye Burt2 3 | | 63 | | May 2012 | | May 2021 | | Director |
| Michel Wurth | | 66 | | May 2014 | | May 2023 | | Director |
Karyn Ovelmen1 3 | | 57 | | May 2015 | | May 2021 | | Director |
Karel de Gucht1 3 | | 66 | | May 2016 | | May 2022 | | Director |
Etienne Schneider1 3 | | 49 | | June 2020 | | May 2023 | | Director |
1.Member of the Audit & Risk Committee.
2.Member of the Appointments, Remuneration, Corporate Governance and Sustainability Committee.
3.Non-executive and independent director.
4.Age and position as of December 31, 2020.
5.Date of joining the Board of ArcelorMittal or, if prior to 2006, its predecessor Mittal Steel Company NV.
6.Ms. Vanisha Mittal Bhatia is the daughter of Mr. Lakshmi N. Mittal and sister of Mr. Aditya Mittal.
7.Mr. Aditya Mittal is the son of Mr. Lakshmi N. Mittal and brother of Ms. Vanisha Mittal Bhatia
Mr. Jeannot Krecké stepped down from the Board on June 13, 2020 due to retirement.
Henk Scheffer is the Company Secretary and, accordingly, acts as secretary of the Board of Directors.
Lakshmi N. Mittal, 70, was the Chairman and Chief Executive Officer of ArcelorMittal, a renowned global businessman who serves on the boards of various companies and advisory councils. He is an active philanthropist engaged in the fields of education and child health. Mr. Mittal was born in Sadulpur in Rajasthan in 1950. He graduated from St Xavier’s College in Kolkata, where he received a Bachelor of Commerce degree. He has received numerous awards for his contribution to the steel industry over the years and recently, in April 2018, Mr. Mittal was awarded by the American Iron and Steel Institute with the Gary medal award recognizing his great contribution to the steel industry. He is widely recognized for successfully integrating many company acquisitions in North America, South America, Europe, South Africa and the CIS. Mr. Mittal is Chairman of the board of Aperam and a member of the board of Goldman Sachs. He previously sat on the board of Airbus N.V. He is a member of the Foreign Investment Council in Kazakhstan, the National Investment Council of Ukraine, the Global CEO Council of the Chinese People’s Association for Friendship with Foreign Countries, the World Economic Forum’s International Business Council, the World Steel Association’s Executive Committee, the European Round Table of Industrialists, the India-US CEO Forum, the Indian School of Business and a member of the board of Trustees of Cleveland Clinic. Mr. Mittal is the father of Aditya Mittal (who was President, Chief Financial Officer and non-independent Director
of ArcelorMittal) and Vanisha Mittal Bhatia (who is a non-independent Director of ArcelorMittal). Mr. Mittal is a citizen of India.
Aditya Mittal, 44, was the President and Chief Financial Officer of ArcelorMittal. He was also the Chief Executive Officer of ArcelorMittal Europe. Following the formation of ArcelorMittal in 2006, Aditya Mittal held various senior leadership roles, including managerial oversight of the Group's flat carbon steel businesses in the Americas and Europe, in addition to his role as CFO and membership in the Group Management Board. In 2008, Mr. Mittal was named ‘European Business Leader of the Future’ by CNBC Europe and was ranked fourth in Fortune magazine’s ‘40 under 40’ list in 2011. He is an active philanthropist with a particular interest in child health. Together with his wife Megha, he is a significant supporter of the Great Ormond Street Children’s Hospital in London, having funded the Mittal Children’s Medical Centre, and in India, the couple work closely with UNICEF, having funded the first ever country-wide survey into child nutrition, the results of which are being used by the Government of India to inform relevant policy. Mr. Mittal serves on the boards of ArcelorMittal, Aperam, HMEL and Iconiq Capital, and is the Chairman of the Board of ArcelorMittal Nippon Steel India. He is also a Trustee at the Brookings Institution and an alumni of the World Economic Forum Young Global Leader’s Programme. Aditya Mittal holds a Bachelor’s degree in Economics with concentrations in Strategic Management and Corporate Finance from the Wharton School in Pennsylvania, United States. Aditya Mittal is the son of Mr. Lakshmi N. Mittal and brother of Ms. Vanisha Mittal Bhatia. Mr. Aditya Mittal is a citizen of India.
Vanisha Mittal Bhatia, 40, is a non-independent Director of ArcelorMittal. She was appointed as a member of the LNM Holdings Board of Directors in June 2004. Ms. Vanisha Mittal Bhatia was appointed to Mittal Steel’s Board of Directors in December 2004, where she worked in the Procurement department leading various initiatives including "total cost of ownership program". She joined Aperam in April 2011 and since has held the position of Chief Strategy Officer. She has a Bachelor of Sciences from the European Business School. Ms. Mittal Bhatia is a citizen of India.
Suzanne P. Nimocks, 61, is a non-executive and independent Director of ArcelorMittal and a member of the Appointments, Remuneration, Corporate Governance and Sustainability Committee. She was previously a director (senior partner) with McKinsey & Company, a global management consulting firm, from June 1999 to March 2010, and was with the firm in various other capacities beginning in 1989, including as a leader in the firm’s Global Petroleum Practice, Electric Power & Natural Gas Practice, Organization Practice, and Risk Management Practice. Ms. Nimocks chaired the Environmental Committee of the Greater Houston Partnership, the primary advocate of Houston’s business community, until December 31, 2010. She holds a Bachelor of Arts in Economics from Tufts University and a Masters in Business Administration from the Harvard Graduate School of Business. Ms. Nimocks is currently a board member of Ovintiv Inc (formerly Encana Corporation), Valaris Plc (formerly Ensco Rowan Companies Plc), and Owens Corning, all listed companies. Ovintiv Inc is a major natural gas exploration and production company, Valaris Plc provides drilling services for the oil and gas industry and Owens Corning is a manufacturer of building products. In the non-profit sector, she serves as a Trustee of the Texas Children’s Hospital and is on the global Advisory Board of Advancing Women in Energy. Ms. Nimocks is a citizen of the United States of America.
Bruno Lafont, 64, is Lead Independent Director of ArcelorMittal, a member of the Audit & Risk Committee and chairman of the Appointments, Remuneration, Corporate Governance and Sustainability Committee. He began his career at Lafarge in 1983 and has held numerous positions in finance and international operations with the same company. In 1995, Mr. Lafont was appointed Group Executive Vice President, Finance, and thereafter, Executive Vice President of the Gypsum Division in 1998. Mr. Lafont joined Lafarge’s General Management as Chief Operating Officer between May 2003 and December 2005, Chief Executive Officer in January 2006, and he was appointed Chairman and Chief Executive Officer in May 2007. In July 2015 Mr. Lafont was appointed Honorary Chairman of Lafarge. He was co-Chairman of the Board of Directors of LafargeHolcim between July 2015 and May 2017. He was a board member of EDF from 2008 to 2019. Mr. Lafont left the Executive Committee of the World Business Council for
Sustainable Development (WBCSD) in December 2019. Born in 1956, Mr. Lafont is a graduate from the Hautes Etudes Commerciales business school (HEC 1977, Paris) and the Ecole Nationale d’Administration (ENA 1982, Paris). Mr. Lafont is a citizen of France. Mr. Lafont has informed the Company that, on December 8, 2017, he (along with five other former Lafarge officers) was placed under formal investigation (mis en examen) in his capacity as former CEO of Lafarge SA, in relation to alleged payments made by a subsidiary of Lafarge SA (Lafarge Cement Syria) to terrorist groups in Syria, and that alleged violations of EU economic sanctions and French labor law are also being investigated.
Tye Burt, 63, is a non-executive and independent Director of ArcelorMittal and a member of the Appointments, Remuneration, Corporate Governance Committee and Sustainability Committee. He was appointed President and Chief Executive Officer of Kinross Gold Corporation in March 2005. He held this position until August 1, 2012. Kinross is listed on the New York Stock Exchange and the Toronto Stock Exchange. Mr. Burt was also a member of the board of directors of Kinross. Mr. Burt has broad experience in the global mining industry, specializing in corporate finance, business strategy and mergers and acquisitions. Prior to joining Kinross, he held the position of Vice Chairman and Executive Director of Corporate Development at Barrick Gold Corporation. He was President of the Cartesian Capital Group from 2000 to 2002; Chairman of Deutsche Bank Canada and Deutsche Bank Securities Canada; Global Managing Director of Global Metals and Mining for Deutsche Bank AG from 1997 to 2000; and Managing Director and Co-Head of the Global Mining Group at BMO Nesbitt Burns from 1995 to 1997, holding various other positions at BMO Nesbitt Burns from 1986 to 1995. Mr. Burt is the Chair and Principal at Carbon Arc Capital Investments Corp. and was the Life Sciences Research Campaign Chair of the University of Guelph's Better Planet Project. Mr. Burt is a member of the Board of Directors of Boart Longyear, a global leader in the drilling services and equipment industry. He is a graduate of Osgoode Hall Law School, a member of the Law Society of Upper Canada, and he holds a Bachelor of Arts degree from the University of Guelph. Mr. Burt is a citizen of Canada.
Michel Wurth, 66, is a non-independent Director of ArcelorMittal. He joined Arbed in 1979 and held a variety of functions before joining the Arbed Group Management Board and becoming its chief financial officer in 1996. The merger of Aceralia, Arbed and Usinor, leading to the creation of Arcelor in 2002, led to Mr. Wurth’s appointment as senior executive vice president and CFO of Arcelor. He became a member of ArcelorMittal’s Group Management Board in 2006, responsible for Flat Carbon Europe, Global R&D, Distribution Solutions and Long Carbon Worldwide respectively. Michel Wurth retired from the GMB in April 2014 and was elected to ArcelorMittal’s board of directors
in May 2014. He holds a Law degree from the University of Grenoble, France, and a degree in Political Science from the Institut d’Études Politiques de Grenoble as well as a Master’s of Economics from the London School of Economics, UK. Mr. Wurth is also doctor of laws honoris causa of the Sacred Heart University, Luxembourg. Mr. Wurth is Chairman of ArcelorMittal Luxembourg S.A. (a wholly owned subsidiary of ArcelorMittal S.A.) as well as Vice Chairman of the supervisory board of Dillinger Hütte AG and Dillinger Hütte Saarstahl AG (associates of ArcelorMittal). Mr. Wurth served as Chairman of the Luxembourg Chamber of Commerce between May 2004 and May 2019 and is a member of the Council of the Central Bank of Luxembourg. He is also non- executive board member of Orion Engineered Carbon S.A., non-executive Chairman of Paul Wurth S.A. and member of the supervisory board of SMS Group, as well as non-executive Chairman of BIP Investment Partners S.A. and BIP Capital Partners S.A., of Brasserie Nationale S.A.. Orion Engineered Carbon is a leading producer of carbon black to the tire and chemical industries and is listed on the NASDAQ. Paul Wurth S.A. is controlled by SMS Group, a leading family owned equipment and engineering supplier for the steel and non-ferrous metal producing industry. BIP Investment Partners and BIP Capital Partners S.A. are Luxembourg based companies organized as investment funds investing in small and mid-cap private equity and Brasserie Nationale is a privately owned brewery based in Luxembourg. Mr. Wurth is vice-chairman of the Luxembourg Red Cross. Mr. Wurth is a citizen of Luxembourg.
Karyn Ovelmen, 57, is a non-executive and independent Director of ArcelorMittal as well as the chairman of the Audit & Risk Committee. From January 2019 to December 31, 2019, Mrs. Ovelmen was the Gas Power Transformation Leader for the General Electric Company. Prior to that, she served as Executive Vice President and Chief Financial Officer of Flowserve, a position that she held from June 2015 to February 2017. Previously, she also served as Chief Financial Officer and Executive Vice President of LyondellBasell Industries NV from 2011 to May 2015, as Executive Vice President and Chief Financial Officer of Petroplus Holdings AG from May 2006 to September 2010 and as Executive Vice President and Chief Financial Officer of Argus Services Corporation from 2005 to 2006. Prior to that, she was Vice President of External Reporting and Investor Relations for Premcor Refining Group Inc. She also spent 12 years with PricewaterhouseCoopers, primarily serving energy industry accounts. Mrs. Ovelmen is a member of the Hess Corporation Board of Directors and a member of the Audit Committee as of November 4, 2020. Mrs. Ovelmen was a member of the Gates Industrial Corporation plc. Board of Directors as a non-executive director and was a member of their Audit Committee from December 2017 to March 2019. Mrs. Ovelmen holds a Bachelor of Arts degree from the University of Connecticut, USA, and is a Certified Public
Accountant ("CPA"). Mrs. Ovelmen is a citizen of the United States of America.
Karel de Gucht, 66, is a non-executive and independent Director and a member of the Audit & Risk Committee. Mr. de Gucht is a Belgian Minister of State. He was the European Commissioner for Trade in the 2nd Barroso Commission from 2010 to 2014 and for Development and Humanitarian Aid in the 1st Barroso Commission from 2009 to 2010. Previously, Mr. De Gucht served as Belgium's Minister of Foreign Affairs from 2004 to 2009 and Vice Prime Minister of Belgium from 2008 to 2009. In addition, in 2006, he was the Chairman in Office of the Organization for Security and Cooperation in Europe (OSCE) and Member of the Security Council of the United Nations from 2007 to 2008. Since 1991, Mr. De Gucht has been a Professor of Law at the VUB (the Dutch-speaking Free University Brussels). He is currently a member of the European Advisory Board of CVC Capital Partners, a member of the board of directors of the listed company Proximus NV and the president of the IES, the Institute of European Studies at the VUB. Mr. de Gucht holds a Master of Law degree from the VUB. Mr. de Gucht is a Belgian citizen.
Etienne Schneider, 49, is a non-executive and independent Director and a member of the Audit & Risk Committee. Etienne Schneider joined the government of Luxembourg in 2012 as Minister of the Economy and Foreign Trade before being appointed Deputy Prime Minister, Minister of the Economy, Minister of Internal Security and Minister of Defense in 2013. In 2018, Mr Schneider became Deputy Prime Minister, Minister of the Economy and Minister of Health and in February 2020 retired from politics. He has previously filled several positions as a senior civil servant, such as a research assistant at the European Parliament in Brussels, economist for the LSAP parliamentary group in the Chamber of Deputies and project leader with NATO in Brussels. He also served as a government advisor responsible for various Directorates. Mr. Schneider became a member of the executive board of several companies, such as the Société électrique de l’Our (SEO), Enovos International SA, Enovos Deutschland AG and the National Credit and Investment Company (SNCI). Upon being appointed minister in 2012, he resigned from all of these positions. Mr. Schneider holds a degree from the Institut Catholique des Hautes Etudes Commerciales (ICHEC) in Brussels and from Greenwich University in London in commercial and financial sciences. Mr. Schneider is a citizen of Luxembourg.
Senior management
On December 15, 2015, the Company announced that it would simplify its management structure in-line with the ongoing drive to promote a performance-driven culture, empowering the segments to deliver optimum business results. As a result the GMB, which was established to ensure a smooth integration following the creation of ArcelorMittal, was replaced, effective
January 1, 2016, with a more flexible structure. As of December 31, 2020, ArcelorMittal’s senior management was comprised of the CEO Office supported by five other Executive Officers. ArcelorMittal’s CEO Office was comprised of the Chief Executive Officer (“CEO”), Mr. Lakshmi N. Mittal, and the President and Chief Financial Officer (“CFO”), Mr. Aditya Mittal. Together, the Executive Officers are responsible for the implementation of the Company strategy, overall management
of the business and all operational decisions. As of January 1, 2021, Mr. John Brett and Mr. Genuino Christino were nominated Executive Officers and on February 11, 2021, the Company announced that following the promotion of Mr. Aditya Mittal, Mr. Genuino Christino would become CFO. The nomination of Bradley Davey to Executive Officer will be effective as of April 1, 2021.
| | | | | | | | | | | | | | |
| Name | | Age1 | | Position1 |
| Lakshmi N. Mittal | | 70 | | Chairman and Chief Executive Officer of ArcelorMittal |
| Aditya Mittal | | 44 | | President and Chief Financial Officer of ArcelorMittal, Investor Relations, and Chief Executive Officer of ArcelorMittal Europe |
| Brian Aranha | | 65 | | Executive vice president, head of strategy, CTO, R&D, CCM, and global automotive |
| Jefferson de Paula | | 62 | | Executive vice president, CEO ArcelorMittal South America Long |
| Geert Van Poelvoorde | | 55 | | Executive vice president, CEO ArcelorMittal Europe Flat |
| Simon C. Wandke | | 61 | | Executive vice president, CEO ArcelorMittal Mining |
| Bart Wille | | 59 | | Executive vice president, head of HR |
| John Brett | | 55 | | Chief Executive Officer of ArcelorMittal North America |
| Bradley Davey | | 56 | | Executive Vice President and Head of Corporate Business Optimization |
| Genuino Christino | | 49 | | Executive vice president, Head of Finance |
1.Age and position as of December 31, 2020.
Lakshmi N. Mittal (See “—Board of Directors”).
Aditya Mittal (See "—Board of Directors")
Brian Aranha, 65, is a member of the Group management committee and an executive vice president, responsible for several corporate functions: Strategy, Technology, R&D, Commercial Coordination, Global Automotive, Communications and CR, Capital Goods as well as certain JVs in China and Saudi Arabia. He joined Dofasco in 1979 and held various diverse positions until 2003 when he was appointed Vice President of Commercial. Following Dofasco's integration into ArcelorMittal in 2007 he held various positions in Europe and NAFTA until he assumed his current role in 2016. Brian holds a Bachelor of applied sciences and engineering from the University of Toronto and has attended the Executive Program at Queens University in Kingston, Ontario (Canada). Mr. Aranha is a citizen of Canada.
Jefferson de Paula, 62, is a member of the Group management committee who joined the group in 1991 as Meltshop Manager of Cariacica’s plant (Brazil) and became the plant’s General Manager in 1998. In 2001, he moved to Acindar in Argentina as COO and was appointed its Industrial and Commercial Vice President in 2006. In 2008, he joined Long Carbon Europe as COO of the Sections, Rails and Piles business division, later becoming CEO of Long Carbon Europe - South Division. In
2011, he was named CEO of Long Carbon Americas, which in 2014 became Long Carbon Central & South America. In 2020, he became CEO Long Carbon Latam & Mining Brazil. Mr. de Paula holds a Bachelor’s Degree in metallurgical engineering from Universidade Federal Fluminense (Brazil), a Master’s Degree in finance and marketing from Universidad Austral (Argentina) and has attended to senior executive courses from Insead (France) and from Kellogg - Northwestern University (USA). In addition to his position in the Group, Mr. de Paula is the current vice president and member of the strategic board of Minas Gerais State Industry Association (FIEMG), he sits in the board of directors of Brazil’s Steel Association (Aço Brasil) and is the former president and member of Latin American Steel Association board (Alacero). Mr. de Paula is a citizen of Brazil.
Geert Van Poelvoorde, 55, is a member of the Group management committee. He started his career in 1989 as a project engineer at the Sidmar Gent hot strip mill, where he held several senior positions in the automation and process computer department. He moved to Stahlwerke Bremen in 1995 as senior project manager. Between 1998 and 2002, he headed a number of departments, and in 2003 he was appointed director of Stahlwerke Bremen, responsible for operations and engineering. In 2005, Mr. Van Poelvoorde returned to ArcelorMittal Gent to take up the position of Chief Operating Officer. In 2008, he became Chief Executive Officer of ArcelorMittal Gent with direct responsibility for primary operations. He was appointed Chief Executive Officer of the
Business Division North within Flat Carbon Europe in 2009 and in January 2014, he was appointed Chief Executive Officer of Flat Carbon Europe and Purchasing. Since November 2015 he is also president of Eurofer, the European steel federation and is serving on several boards. He graduated from the University of Ghent with a degree in civil engineering and electronics. Mr. Van Poelvoorde is a citizen of Belgium.
Simon C. Wandke, 61, is a member of the Group management committee, Executive Vice President of ArcelorMittal and the Chief Executive Officer of ArcelorMittal Mining. He joined ArcelorMittal in January 2011 as chief commercial officer of ArcelorMittal Mining. He has over 35 years’ experience in the mining and minerals industry, starting his career in 1981 at BHP, where he held positions in mines in Australia and Indonesia and held other commercial offices globally until 2002. He then joined Destra Consulting Group as Partner before becoming Chief Marketing Officer for Ferrexpo plc in 2006 based in Hong Kong, Switzerland & United Kingdom. Simon is a graduate of the Australian Institute of Company Directors with a diploma in Company Directorship. He also holds a post graduate diploma in Corporate Finance from Swinburne University as well as a B.A., Psych, Marketing (Comm) from the University of Melbourne. Mr. Wandke holds dual citizenship in Australia and the United Kingdom.
Bart Wille, 59, is a member of the Group management committee. He was appointed head of human resources in January 2018. He joined ArcelorMittal after more than 30 years of global human resources management experience in various multinational companies. Mr. Wille joined Unilever in 1985 with 22 years of service and positions held in Belgium, the United Kingdom, Brazil and the Netherlands. After having joined Puratos (food ingredients) for a short period, Mr. Wille pursued his career with Bekaert as chief human resources officer at the beginning of 2009. As a member of the Bekaert Group Executive Board, Mr. Wille was responsible for human resources and the reorganization agenda of the company worldwide. In this role, he supported the international expansion of the company and he participated in the restructuring and change of the company's organization, as well as the continuous transformation of its culture. Mr. Wille is a graduate in international business administration of UFSIA, the University of Antwerp. Mr. Wille is a citizen of Belgium.
John Brett, 55, is a member of the Group management committee and the Chief Executive Officer of ArcelorMittal North America. He joined the group at former Inland Steel in 1988 as an associate accountant, and progressed to become a manager specializing in financial analysis and systems in 1997. In 1998, John took on the role of controller for Ispat Inland Steel and in 2005, he was promoted to vice president, finance and planning and controller for Mittal Steel USA. In 2012, John was appointed executive vice president finance, planning and procurement for
ArcelorMittal USA. Prior to becoming CEO ArcelorMittal North America in January 2021, John was CEO ArcelorMittal USA. John holds an MBA from the University of Chicago and is a graduate in economics from DePauw University. Mr. Brett is a citizen of the United States of America.
Bradley Davey, 56, is a member of the Group management committee, Executive Vice President and Head of corporate business optimization. He joined Dofasco in 1986 as a project engineer in the Central Maintenance department, joined assigned Maintenance in 1989, and then the Hot Strip Mill in 1990. He held various positions in the HSM before becoming a Business Unit Manager in 1996. He gained international manufacturing experience through this role by leading 2 separate multi-year technical exchanges with the 2 leading Japanese steelmakers and through leading Dofasco’s Hot Strip Mill modernization project. In 2002 he changed careers to Marketing as a Manager Strategic Marketing, lead Dofasco’s Marketing process redesign project before becoming General Manager of Marketing in 2005, then to Director of Industry Sales in 2007, and then Vice President Commercial in 2008. In 2014 he added CMO North America Automotive, then became CMO North America Flat Rolled later in 2014. In 2016 he became CMO of Global Automotive along with CMO North America. In 2018 Brad became CEO ArcelorMittal North America and held this until his recent nomination to head of corporate business optimization beginning April 2021. Currently based in Canada, Mr. Davey has responsibility for Global Automotive, R&D, CTO, Commercial Coordination, Corporate Capital Goods Procurement, Corporate Communications and Corporate Responsibility, Automotive JV’s in China and India, Tailored Blanks Americas, and Vice Chairman of the Investment Allocation Committee. Mr. Davey holds a mechanical engineering degree from McMaster University, Canada. Mr. Davey is a citizen of Canada.
Genuino M. Christino, 49, is a member of the Group management committee, Executive Vice President of ArcelorMittal and group head of finance. Prior to joining the group, Mr. Christino had spent ten years at KPMG in Brazil and in the United Kingdom, as an auditor and a consultant. He joined Belgo-Mineira in Brazil in 2003, as accounting manager. In 2005, after the reorganisation of the Brazilian operations that resulted in the creation of Arcelor Brazil, Mr. Christino was appointed General Manager in charge of accounting, consolidation and reporting for Brazil. In 2007, he also accumulated the tax and real-estate functions for Brazil and South America. Mr. Christino played a leading role in several reorganisations in Brazil and in the set-up and development of the Brazilian shared services centre. In January 2009, Mr. Christino took on the role of head of group accounting, consolidation, and financial reporting, and in 2014 group treasury was added to his responsibilities and he is also a
member of the ArcelorMittal Corporate Finance and Tax Committee (CFTC). Mr. Christino was in his current role, as group head of finance, since January 2016. Mr. Christino holds a bachelor’s degree in accounting and business administration from the Universidade Paulista in São Paolo, Brazil and he has also completed an Executive MBA Programme from the Dom Cabral Foundation in Belo Horizonte, Brazil. Mr. Christino is a citizen of Brazil.
Compensation
| | | | | |
| Content | |
| Annual statement by the ARCGS Committee Chairman | |
| Board of Directors | |
| Remuneration at a glance - senior management | Overview of the Company's remuneration policy and rationale of each performance metric |
| Remuneration at a glance - 2020 pay outcomes | Comparison of pay outcomes 2020 vs. 2019
Explanation of results for 2019 short-term incentives paid in 2020 |
| Remuneration | |
| Remuneration strategy | Explanation of what informs the ARCGS's decision on pay |
| Remuneration policy | Explanation of policies applied to senior management |
| Remuneration mix | Overview of the remuneration mix for senior management |
| 2020 Total remuneration | Overview of 2020 outcomes |
| Short-term incentives | Description of short-term incentives plan ("STI") |
| Long-term incentive plan | Description of long-term incentive plan ("LTIP" or "LTI"s) |
| Global stock option plan | Description of global stock option plan |
| Other benefits | Description of other benefits |
| SOX 304 and Clawback | Explanation of SOX section 304 rules regarding clawbacks of CEO/CFO remuneration |
| |
| Abbreviations | |
| EBITDA | Operating income plus depreciation, impairment expenses and exceptional items |
| FCF | Free cash flow |
| STI | Short-term incentives |
| LTI/LTIP | Long-term incentives (plans) |
| EPS | Earnings per share |
| PSU | Performance share units |
| RSU | Restricted share units |
| ROCE | Return on capital employed |
| TSR | Total shareholder return |
Annual statement by the ARCGS Committee Chairman
Dear Shareholders,
Description of the year:
Business and results
There is no doubt that 2020 was a very challenging year. However, even in such difficult market conditions, there are some positives which we should not lose sight of. We have done well at responding swiftly and effectively across the organization, temporarily idling certain assets and reducing fixed costs. We have demonstrated the benefits of vertical integration and diversification, as can be seen through the performance of our mining business. Going into the COVID-19 pandemic, we already had a strong balance sheet, and following the first quarter of 2020 results, we took the decision to further reduce our debt by raising $2 billion in new equity and convertible notes. The business has also continued to do an excellent job in generating cash flows. We reached a major milestone in achieving our net debt target of $7 billion, signaling that our deleveraging efforts are now complete. This has been a priority for some years and it is very rewarding to have reached this target. The Company's capital allocation priority will now shift to returning cash to shareholders. This process has begun with a $500 million share buyback program that was initiated following the announced sale of ArcelorMittal USA, and the program was completed on October 30, 2020. Following consultation with shareholders, the Board expects to recommend an updated distribution policy along with the year end 2020 results. In addition, the Company saw a strong contribution from the recently acquired (through a joint venture) assets of AMNS India. We also made progress on developing a sustainable business model and community partnership at ArcelorMittal Italia. While a lot of our internal efforts have helped us make progress, the sale of ArcelorMittal USA to Cleveland-Cliffs rationalized our strategic footprint in North America and was the final step that enabled us to achieve the level of net debt we believe supports investment grade credit metrics throughout the steel cycle.
Remuneration report and policy
At the Annual General Meeting of Shareholders held on June 13, 2020, we submitted our Remuneration Policy and Remuneration Report for 2019 to our shareholders. The shareholders voted 96% in favor to approve our Remuneration Policy for the coming four years. This Policy is well supported and will be further developed to meet the Company’s new challenges.
Board and Committees
The Board of Directors has overall responsibility for the governance and strategic direction of ArcelorMittal, including
considering the effects of climate change. The Board has established two committees with further oversight and responsibilities in this field, with the risk-related aspects being dealt with at the Board’s Audit & Risk Committee and the Corporate Responsibility aspect covered by the Corporate Responsibility section of the ARCGS Committee. In 2020, we reviewed management efforts in the field of Health & Safety and we believe that the new Health & Safety management structure, supported by a committee composed of Health & Safety experts at the regional and operational levels and led by the CEO of one our major divisions, Mr. Jefferson de Paula, will make a major difference in the years to come. We will actively monitor progress.
Risks are also considered by the boards of the Company’s subsidiaries worldwide. The ARCGS Committee oversees sustainability issues under five sustainability pillars, of which one is climate change. The chair of the ARCGS Committee also liaises closely with the chairman of the Audit & Risk Committee. The ARCGS Committee considers the implications of climate change for the business and oversees the Company’s strategic planning in response to the risks and opportunities that arise. It receives regular reports from senior management on stakeholder expectations, the Company’s low-emissions technology strategy, climate-related policy engagement and carbon-reduction performance.
Activities
Remuneration and Nomination
During 2020, the ARCGS Committee conducted the Annual Self-Assessment of the Board of Directors, it reviewed and approved short term incentive proposals for senior management and it approved the remuneration report for 2020. The ARCGS Committee reviewed remuneration and governance-related proposals for the annual general meeting of shareholders. The ARCGS Committee also reviewed succession plans for the Board, the CEO office and senior executives. The ARCGS Committee reviewed the salaries for the CEO, CFO and the Executive Vice Presidents. The ARCGS Committee reviewed the grant and vesting criteria for future equity awards, assessed and selected performance and compensation peer groups under the Long-Term Incentive Plan and confirmed the vesting of existing plans in accordance with the criteria set in advance. The ARCGS Committee had discussions about corporate responsibility objectives and criteria for short- and long-term incentive plans. The ARCGS Committee also considered the need for additional management retention plans in connection with specific circumstances, e.g. the sale of ArcelorMittal USA assets.
Environment
The decarbonizing of the steel-making process is one of the toughest challenges we have faced and will face in the years to come, but the Company thrives on a challenge and there is a real energy throughout the ArcelorMittal group to show of what we are capable. We want to succeed, and we believe with the right policy environment we can, which is why we have now set a net zero ArcelorMittal 2050 target. ArcelorMittal Europe has recently announced it will be bringing "green steel” to the market this year through a new certification process. As a group which today has a significant carbon footprint, we have an opportunity to make a huge contribution to the net zero challenge. In addition, the Committee held quarterly meetings dedicated to Corporate Social Responsibilities, including Health & Safety, Environment and Community relations and reviewed progress and proposed management actions in this field. The year showed substantial progress in terms of quality of corporate sustainability reporting and following up on actions. The ARCGS Committee has been interacting with the Company’s shareholders and other stakeholders to garner their opinions and come up with the best solutions for the group. It is obvious that this area will require substantial support from governments and other stakeholders as the Company will not be able to do this by itself.
Going forward
The sale of ArcelorMittal USA marks an important strategic milestone for the Company as it is the first time we have sold such a sizeable steel-making asset. The rationale reflects some of the challenges facing the steel industry today, as well as the rapidly-changing world in which we live and work. We have always believed in the benefits of size and scale: we still do, but they alone will not define the world's leading steel company for the next decade and beyond. Given the drive towards a more sustainable, circular and lower-carbon world, innovation and our ability to decarbonize will become increasingly important.
Despite the sale, we remain an important player in the North American steel market and will continue to meet customer demand from our joint venture Calvert and our Mexican and Canadian operations. We were delighted to be the first mill in North America to be OEM qualified for galvanized Fortiform® 980 material. It has also been sourced and supplied for the first time ever and will be used by multiple OEMs on all new vehicle platforms launching throughout 2021. It is produced at Calvert's facilities in Alabama.
As a result of the recommendations of the previous Board of Director's self-assessment in January 2020 being implemented, there have been some important improvements in this year’s process. For example, the new responsibilities of the ARCGS Committee on sustainable development matters, and the increased emphasis given to succession planning, are two such important improvements. In 2020, we also welcomed two new members to the Board of Directors of the Company.
Corporate Social Responsibility including Climate Action will remain a key focus area for the ARCGS Committee in 2021. Even greater emphasis will be placed on health and safety matters, with added focus on employee and community health due to COVID-19 remaining a real and present challenge. In the field of remuneration, the ARCGS Committee expects to spend more time on compensation policy, addressing its effectiveness and considering the challenges of sustainability and the increasing importance stakeholders give to this area. The Committee will also consider more detailed targets to improve diversity, in all forms, throughout the group, with its initial focus being on gender diversity.
Sincerely yours,
Bruno Lafont
Board of Directors
Directors’ fees
The ARCGS Committee of the Board of Directors prepares proposals on the remuneration to be paid annually to the members of the Board of Directors.
At the June 13, 2020 annual general meeting of shareholders, the shareholders approved the annual remuneration for non-executive directors for the 2019 financial year, based on the following annual fees (euro denominated amounts are translated into U.S. dollars as of December 31, 2019):
•Basic director’s remuneration: €151,956 ($170,707);
•Lead Independent Director’s remuneration: €214,326 ($240,774);
•Additional remuneration for the Chair of the Audit & Risk Committee: €29,484 ($33,122);
•Additional remuneration for the other Audit & Risk Committee members: €18,144 ($20,383);
•Additional remuneration for the Chairs of the other committees: €17,010 ($19,109); and
•Additional remuneration for the members of the other committees: €11,340 ($12,739).
The total annual remuneration of the members of the Board of Directors for their service for the last five financial years was as follows:
| | | | | | | | | | | | | | | | | | | | |
| | Year ended December 31, |
| (Amounts in $ thousands except Long-term incentives information) | 2020 | 2019 | | 2018 | 2017 | 2016 |
Base salary1 | 2,635 | | 1,569 | | | 1,604 | | 1,505 | | 1,550 | |
| Director fees | 1,706 | | 1,554 | | | 1,509 | | 1,744 | | 1,900 | |
Short-term performance-related bonus1 | 935 | | 3,198 | | | 2,775 | | 2,333 | | — | |
Long-term incentives 1, 2 | 148,422 | | 89,933 | | | 70,302 | | 49,431 | | 168,214 | |
1Chairman and CEO, and in 2020, only, including President and CFO. Slight differences between the years are possible, due to foreign currency effects.
2See “Management and employees—Compensation—Remuneration—Long-term incentive plan.”
The annual remuneration for the last five financial years to the current and former members of the Board of Directors for services in all capacities in the years in which they were Directors was as follows:
| | | | | | | | | | | | | | | | | | | | |
| (Amounts in $ thousands) | | 20201 | 20191 | 20181 | 20171 | 20161 |
| Lakshmi N. Mittal | | 1,374 | | 1,569 | | 1,604 | | 1,505 | | 1,550 | |
| Aditya Mittal | | 1,261 | | — | | — | | — | | — | |
| Vanisha Mittal Bhatia | | 186 | | 171 | | 166 | | 174 | | 153 | |
| Narayanan Vaghul | | — | | — | | — | | 69 | | 182 | |
| Suzanne P. Nimocks | | 200 | | 183 | | 178 | | 187 | | 164 | |
| Wilbur L. Ross, Jr. | | — | | — | | — | | 32 | | 171 | |
| Lewis B. Kaden | | — | | — | | — | | 95 | | 250 | |
| Bruno Lafont | | 306 | | 280 | | 272 | | 255 | | 171 | |
| Tye Burt | | 200 | | 183 | | 178 | | 187 | | 164 | |
| Antoine Spillmann | | — | | — | | — | | — | | 55 | |
| Karyn Ovelmen | | 223 | | 204 | | 198 | | 203 | | 171 | |
| Jeannot Krecké | | 78 | | 171 | | 166 | | 174 | | 153 | |
| Michel Wurth | | 186 | | 171 | | 166 | | 174 | | 153 | |
| Karel de Gucht | | 209 | | 191 | | 185 | | 194 | | 114 | |
| Etienne Schneider | | 118 | | — | | — | | — | | — | |
| Total | | 4,341 | | 3,123 | | 3,113 | | 3,249 | | 3,451 | |
1.Remuneration for non-executive Directors with respect to 2020 will be paid in 2021 subject to the shareholder approval at the annual general meeting to be held on May 4, 2021. Remuneration for non-executive Directors with respect to 2019, 2018, 2017 and 2016 was paid in 2020, 2019, 2018 and 2017, respectively, following the shareholder approval at the annual general meetings held on June 13, 2020, May 7, 2019, May 9, 2018 and May 10, 2017 respectively. Slight differences between the years are possible, due to foreign currency effects.
Except for the CEO and CFO, members of the Board of Directors have not received any remuneration from any subsidiary of the Group.
The annual remuneration for the last five financial years on a full-time equivalent basis of employees of ArcelorMittal S.A. was as follows:
| | | | | | | | | | | | | | | | | |
| (Amounts in $ thousands) | 20201 | 20191 | 20181 | 20171 | 20161 |
| Average Remuneration | 412 | | 389 | | 408 | | 379 | | 336 | |
1.The annual remuneration is calculated for approximately 20 employees with a labor contract with ArcelorMittal S.A.
ArcelorMittal has performed a benchmarking on remuneration with its selected peers and fixed the remuneration of the employees and Directors based on the outcome of that exercise.
The policy of the Company is not to grant any share-based remuneration to members of the Board of Directors who are not executives of the Company. As of December 31, 2020, ArcelorMittal did not have any loans or advances outstanding to members of its Board of Directors and ArcelorMittal had not given any guarantees in favor of any member of its Board of Directors. None of the members of the Board of Directors, other than the President and CFO, benefit from an ArcelorMittal pension plan. Short-term incentives paid to executive directors (including the President and CFO beginning in 2020) were as follows for the last five financial years:
| | | | | | | | | | | | | | | | | | | | |
| | Short-term Incentives |
| | 2020 | 2019 | 2018 | 2017 | 2016 |
| Lakshmi N. Mittal | | — | | 3,198 | | 2,775 | | 2,333 | | — | |
| Aditya Mittal | | 935 | | — | | — | | — | | — | |
The following tables provide a summary of the PSUs granted (long-term incentives) to the executive directors on the Board of Directors (including the President and CFO beginning in 2020), as of December 31, 2020. There were no outstanding stock options as of December 31, 2020.
| | | | | | | | | | | | | | | | | |
| | PSUs grants in 2020 | PSUs grants in 2019 | PSUs granted in 2018 | PSUs granted in 2017 | PSUs granted in 2016 |
| Lakshmi N. Mittal | 77,372 | | 89,933 | | 70,302 | | 49,431 | | 168,214 | |
| Aditya Mittal | 71,050 | | — | | — | | — | | — | |
| Term (in years) | 3 | 3 | 3 | 3 | 3+2 |
Vesting date1 | January 1, 2024 | January 1, 2023 | January 1, 2022 | January 1, 2021 | January 1, 2020 and January 1, 2022 |
1.See “Management and employees—Compensation—Remuneration—Long-term incentive plan", for vesting conditions.
Remuneration at a glance - senior management
The following table provides a brief overview of the Company’s remuneration policy for senior management. Additional information is provided below.
| | | | | | | | | | | | | | |
| ArcelorMittal's Remuneration Policy | | |
| Remuneration | Period | Strategy | | Characteristic |
| Salary | 2020 | Recruitment and retention | l | Reviewed annually by the ARCGS Committee considering market data |
| l | Increases based on Company performance and individual performance |
| STI | 2020 | Delivery of strategic priorities and financial success | l | Maximum STI award of 270% of base salary for the CEO, 225% of base salary for the CFO and 135% of base salary for other
Executive Officers |
| l | 100% STI paid in cash |
| l | ArcelorMittal's first priority Health and Safety is part of the STI |
| l | Overperformance towards competition |
| LTIP | 2021-2023 | Encourages long term shareholder return | l | Performance share units granted with a face value of 100% of base salary for the CEO and CFO and 60% as a guideline for Executive Officers |
| l | Shares vest after a three-year performance period |
| l | Performance related vesting |
| | | | | | | | | | | |
| Key Performance Metrics from 2020 |
| Metrics | Scheme | | Rationale |
| EBITDA | STI | l | Demonstrates growth and operational performance of the underlying businesses |
| FCF | STI | |
| Gap to competition | STI / LTIP | l | Outperform peers |
| Health & Safety | STI | l | Employee health and safety is a core value for the Company |
| Business Specific measures | STI | l | For corporate functions, links reward to strategic priorities of their functions |
| EPS | LTIP | l | Links reward to delivery of underlying equity returns to shareholders |
| TSR | LTIP | l | Creates a direct link between executive pay and shareholder value |
| l | Measure is split equally between comparison against S&P 500 index and a peer group of companies |
Remuneration at a glance - 2020 Pay outcomes
The following graphics compare the compensation paid to the CEO, CFO and other Executive Officers in 2020, 2019, 2018, 2017 and 2016 in thousands of U.S. dollars. Information with respect to total remuneration paid is provided under “—Remuneration—2020 Total remuneration” below.
2019 short-term incentives paid in 2020
| | | | | | | | |
| Executive | Realization as % of business target |
| CEO office | Lakshmi Mittal
Aditya Mittal | 16% |
| Corporate | Brian Aranha | 54% |
| Flat Carbon Europe | Geert van Poelvoorde | 48% |
| Long Carbon South America | Jefferson de Paula | 137% |
| Mining | Simon Wandke | 100% |
| Corporate | Bart Wille | 60% |
Note: Individual performance not included in the percent of realization. The CEO renounced the payment of his short-term incentive.
2020 LTI vesting
There was no vesting scheduled in 2020 for senior management.
CEO office
There was no vesting in 2020 for the CEO Office for the first half of the PSU 2016 grant as the performance targets were not met.
Remuneration
Remuneration strategy
The ARCGS Committee assists the Board of Directors to maintain a formal and transparent procedure for setting policy on senior management's remuneration and to determine an appropriate remuneration package for senior management. The ARCGS Committee should ensure that remuneration arrangements support the strategic aims of the business and enable the recruitment, motivation and retention of senior executives while complying with applicable rules and regulations.
Board oversight
To this end, the Board of Directors has established the ARCGS Committee to assist it in making decisions affecting employee remuneration. All members of the ARCGS Committee are required to be independent under the Company’s corporate governance guidelines, the NYSE standards and the 10 Principles of Corporate Governance of the Luxembourg Stock Exchange.
The members are appointed by the Board of Directors each year after the annual general meeting of shareholders. The members have relevant expertise or experience relating to the purposes of the ARCGS Committee. The ARCGS Committee makes decisions by a simple majority with no member having a casting vote and is chaired by Mr. Bruno Lafont, Lead Independent Director.
Appointments, remuneration, corporate governance and sustainability committee
The primary function of the ARCGS Committee is to assist the Board of Directors with respect to the following:
•review and approve corporate goals and objectives regarding remuneration relevant to the CEO Office and Executive Officers and other members of executive management as deemed appropriate by the committee, and assess performance against goals and objectives;
•make recommendations to the Board with respect to incentive remuneration plans and equity-based plans;
•identify candidates qualified to serve as members of the Board, the CEO Office and Executive Officers;
•recommend candidates to the Board for appointment by the general meeting of shareholders or for appointment by the Board to fulfill interim Board vacancies;
•develop, monitor and review corporate governance principles applicable to the Company;
•facilitate the evaluation of the Board;
•review the succession planning and the executive development of the members of the CEO Office and Executive Officers;
•submit proposals to the Board on the remuneration of the members of the CEO Office and Executive Officers, and on the appointment of new members thereto and new directors; and
•make recommendations to the Board of Directors in respect of the Company’s framework of remuneration for the members of the CEO Office and Executive Officers and such other members of the executive management as designated by the committee. In making such recommendations, the committee may take into account factors that it deems necessary. This may include a member’s total cost of employment (factoring in equity/long term incentives, any perquisites and benefits in kind and pension contributions).
The ARCGS Committee met 11 times in 2020. Its members comprise Mr. Bruno Lafont (Chairman), Ms. Suzanne Nimocks and Mr. Tye Burt.
Regular invitees include Mr. Lakshmi N. Mittal (CEO and Chairman) and Mr. Bart Wille (Head of Group Human Resources and Corporate Services). Mr. Henk Scheffer (Company Secretary) acts as secretary.
Individual remuneration is discussed by the ARCGS Committee without the person concerned being present. The ARCGS Committee Chairman presents its decisions and findings to the Board of Directors after each ARCGS Committee meeting.
Remuneration policy
The ARCGS Committee set policies applied to senior management on base salary, short-term incentives and long-term incentives. According to Shareholders Right Directive II, that was transposed into Luxembourg law in August 1, 2019, the remuneration policies must be approved at the AGM at least every 4 years and whenever there is a material change.
Scope
ArcelorMittal’s remuneration philosophy and framework apply to the following groups of senior management:
•the CEO and the President and CFO; and
•the other Executive Officers.
The remuneration philosophy and governing principles also apply, with certain limitations, to a wider group of employees including Executive Vice Presidents, Vice Presidents, General Managers and Managers.
Remuneration philosophy
ArcelorMittal’s remuneration philosophy for its senior management is based on the following principles:
•provide total remuneration competitive with executive remuneration levels of peers of similar size, scope and industry;
•encourage and reward performance that will lead to long-term enhancement of shareholder value; and
•promote internal pay equity by providing base pay and total remuneration levels that reflect the role, job size and responsibility as well as the performance and effectiveness of the individual.
Remuneration framework
The ARCGS Committee develops proposals for senior management remuneration annually for the Board of Directors' consideration. Such proposals include the following components:
•fixed annual salary;
•short-term incentives (i.e., performance-based bonus); and
•long-term incentives (i.e., stock options (prior to May 2011), RSUs and/or PSUs (after May 2011) depending on the grant year).
The Company does not have any deferred compensation plans for senior management, including the Chairman and CEO.
The following table provides an overview of the remuneration policy applied by the ARCGS:
| | | | | | | | |
| Remuneration component and link to strategy | Operational and performance framework | Opportunity |
Fixed annual salary
Competitive base salary to attract and retain high-quality and experienced senior executives | * Base salary levels are reviewed annually with effect from April 1 (except promotion) compared to the market to ensure that ArcelorMittal remains competitive with market median base pay levels
* Reviews are based on market information obtained but not led by benchmarking to comparable roles, changes in responsibility and general economic conditions | The ARCGS does not set a maximum salary, instead when determining any salary increases it takes into account a number of reference points including salary increases across the Company |
Benefits
Competitive level to ensure coverage of the executives | * May include costs of health insurance, death and disability insurances, company car, tax return preparation, etc.
* Relocation benefits may be provided where a change of location is made at Company’s request | The cost to the Company of providing benefits can change from year to year. The level of benefit provided is intended to remain competitive |
Pension
Competitive level of post-employment benefit to attract and retain executives | * Local benchmark of pension contributions for comparable roles | |
Short term incentives (STI)
Motivate the senior executives to achieve stretch performance on strategic priorities | * Scorecard is set at the commencement of each financial year
* Measures and relative weights are chosen by the ARCGS Committee to drive overall performance for the coming year
* STI calculations for each executive reflect the performance of ArcelorMittal and /or the performance of the relevant business units, the achievement of specific objectives of the department and the individual executive’s overall performance
* No STI is paid for a performance below threshold 80% for each criteria; 100% STI payout for performance achieved at 100% for each criteria; 150% STI payout for performance achieved at 120% or above for each criteria | Range for CEO: 0 to 270% with a target at 120% of base salary
Range for President and CFO: 0 to 225% with a target at 100% of base salary
Range for Executive Officers: 0 to 135% with a target at 60% of base salary |
LTIP
Sustain shareholder wealth creation in excess of performance of a peer group and incentivize executives to achieve strategy | CEO Office LTIP
* The vesting is subject to a relative TSR (Total Shareholder Return) compared to the S&P 500 and a peer group and to a relative EPS of a peer group over a three year- period *The peer group is determined by the ARCGS Committee * No vesting will occur below the median for all grants as from 2016 * Performance is determined by the ARCGS Committee
Executive Officers LTIP
*The vesting is subject to one or two measures depending on the business units or group, Gap to competition and TSR/EPS vs. peer group in 2020 *Vesting will occur if the performance is reached *Performance is determined by the ARCGS Committee | Maximum value at grant:
100% of base salary for CEO and President and CFO
Guideline: 60% of base salary for Executive Officers |
Remuneration mix
The total remuneration target of the CEO and the President and CFO is structured to attract and retain executives; the amount of the remuneration received is dependent on the achievement of superior business and individual performance and on generating sustained shareholder value from relative performance.
The following remuneration charts, which illustrate the various elements of the CEO, the President and CFO and the other Executive Officers' compensation, are applicable for 2020. For each of the charts below, the columns on the left, middle and on the right, respectively, reflect the breakdown of compensation if targets are not met, met and exceeded.
Note: no pension contribution
Note: Other benefits, as shown above, do not include international mobility incentives that may be provided.
2020 Total remuneration
The total remuneration paid in 2020 to members of ArcelorMittal’s senior management listed in “Directors, senior management and employees—Directors and senior management” (including Mr. Lakshmi N. Mittal in his capacity as CEO and Mr. Aditya Mittal as President and CFO) was $5.8 million in base salary and other benefits paid in cash (such as health, other insurances, lunch allowances, financial services, gasoline and car allowance) and $3.1 million in short-term performance-related variable remuneration consisting of a short-term incentive linked to the Company’s 2019 results. During 2020, approximately $0.7 million was accrued by ArcelorMittal to provide pension benefits to senior management (other than Mr. Lakshmi N. Mittal).
No loans or advances to ArcelorMittal’s senior management were made during 2020, and no such loans or advances were outstanding as of December 31, 2020.
The following table shows the remuneration received by the CEO, the President and CFO and the Executive Officers as determined by the ARCGS Committee in relation to the five most recent financial years including all remuneration components:
| | | | | | | | | | | | | | | | | | | | | | | | | | | | | | | | | | | | | | | | | | | | | | | | | | |
| | Chief Executive Officer | | President and Chief Financial Officer | President and Chief Financial Officer and Executive Officers 7 |
| (Amounts in $ thousands except for Long-term incentives) | | 2020 | 2019 | | 2018 | 2017 | 2016 | | 2020 | 2020 | 2019 | 20185 | 2017 | 20166 |
Base salary1 | | 1,374 | | 1,569 | | | 1,604 | | 1,505 | | 1,550 | | | 1,261 | | 2,970 | | 4,643 | | 5,371 | | 4,709 | | 8,729 | |
| Retirement benefits | | — | | — | | | — | | — | | — | | | 146 | | 555 | | 698 | | 862 | | 849 | | 898 | |
Other benefits2 | | 45 | | 47 | | | 48 | | 41 | | 42 | | | 33 | | 144 | | 223 | | 314 | | 250 | | 225 | |
Short-term incentives3 | | — | | 3,198 | | | 2,775 | | 2,333 | | — | | | 935 | | 2,169 | | 6,015 | | 5,495 | | 4,468 | | 2,029 | |
| Long-term incentives | | '- fair value in $ thousands4 | | 1,407 | | 1,339 | | | 1,166 | | 1,130 | | 2,297 | | | 1,292 | | 1,834 | | 3,096 | | 2,702 | | 1,922 | | 6,882 | |
| '- number of share units | | 77,372 | | 89,933 | | | 70,302 | | 49,431 | | 168,214 | | | 71,050 | | 90,069 | | 183,084 | | 141,109 | | 94,553 | | 509,623 | |
1.The base salaries of the CEO and President and CFO were not increased in 2020. A decrease of 10% was applied during the last eight months of 2020.
2.Other benefits comprise benefits paid in cash such as lunch allowances, financial services, gasoline and car allowances. Health insurance and other insurances are also included.
3.Short-term incentives are entirely performance-based and are fully paid in cash. The short-term incentive for a given year relates to the Company’s results in the previous year.
4.Fair value determined at the grant date is recorded as an expense using the straight line method over the vesting period and adjusted for the effect of non-market based vesting conditions.
5.Henri Blaffart was included until March 31, 2018, Robrecht Himpe was included until June 30, 2018.
6.Jim Baske was included until June 30, 2016, Davinder Chugh was included until July 20, 2016 and Robrecht Himpe was included as from July 1, 2016.
7. President and Chief Financial Officer included from 2016 through 2019.
Short-term incentives
Targets associated with ArcelorMittal’s 2020 Annual Performance Bonus Plan were aligned with the companies’ strategic objectives of improving health and safety performance and overall business performance and competitiveness.
For the CEO and the President and CFO, the 2020 annual performance bonus formula is based on the achievement of the following performance targets:
•EBITDA targets at Group level: 30%;
•FCF targets at Group level: 20%;
•Gap to competition targets at Group level: 20%; and
•Health and safety performance targets at Group level: 10%.
For the CEO, 100% achievement of the agreed performance targets results in an annual performance bonus which equals 120% of base salary. For the CFO, 100% achievement of the agreed performance targets results in an annual performance bonus which equals to 100% of base salary.
For the other Executive Officers, the 2020 annual performance bonus formula has been tailored for their respective positions and is generally based on the following performance targets:
•EBITDA targets at Group, segment or Business unit level;
•FCF targets at Group, segment or Business unit level;
•Gap to competition targets at Group level, segment or Business unit level;
•Health and safety performance targets at Group, Segment or Business unit level; and
•Business specific measures for corporate functions.
For the other Executive Officers, 100% achievement of the agreed performance targets results in an annual performance bonus which equals 60% of base salary.
For the calculation of the annual performance bonus, the achievement level of every performance target is calculated separately, and these are added up.
Individual performance and assessment ratings define the individual annual performance bonus multiplier that will be applied to the annual performance bonus calculated based on actual performance against the performance measures. Those individuals who consistently perform at expected levels will have an individual multiplier of 1. For outstanding performers, an individual multiplier of up to 1.5 may cause the annual performance bonus pay-out to be higher than 150% of the target annual performance bonus, up to 270% of the target annual performance bonus being the absolute maximum for the CEO. Similarly, a reduction factor will be applied for those at the lower end.
In exceptional circumstances, the ARCGS committee can exercise discretion in the final determination of the annual performance bonus.
The achievement level of performance for the annual performance bonus for the CEO, the President and CFO and the other Executive Officers is summarized as follows:
| | | | | | | | | | | | | | | | | | | | |
| Functional level | | Target achievement threshold @ 80% | | Target achievement @ 100% | | Target achievement ≥ ceiling @ 120% |
| Chief Executive Officer | | 60% of base pay | | 120% of base pay | | 180% of base pay |
| President and Chief Financial Officer | | 50% of base pay | | 100% of base pay | | 150% of base pay |
| Executive Officers | | 30% of base pay | | 60% of base pay | | 90% of base pay |
Long-term incentive plan
ArcelorMittal operates a long-term incentive plan to incentivize shareholder wealth creation in excess of performance of a peer group and incentivize executives to achieve strategy.
On May 10, 2011, the annual general meeting of shareholders approved the ArcelorMittal Equity Incentive Plan, a new equity-based incentive plan that replaced the Global Stock Option Plan (see below and note 8.3 to the consolidated financial statements for a description of the Global Stock Option Plan). The ArcelorMittal Equity Incentive Plan is intended to align the interests of the Company’s shareholders and eligible employees by allowing them to participate in the success of the Company. The ArcelorMittal Equity Incentive Plan provides for the grant of RSUs and PSUs to eligible Company employees (including the Executive Officers) and is designed to incentivize employees, improve the Company’s long-term performance and retain key employees. On May 8, 2013, the annual general meeting of shareholders approved the GMB PSU Plan, which provides for the grant of PSUs to GMB members (and is now applicable to the CEO Office). Until the introduction of the GMB PSU Plan in 2013, GMB members were eligible to receive RSUs and PSUs
under the ArcelorMittal Equity Incentive Plan. In 2016, a special grant was approved in order to align the grant with the Action 2020 plan put in place by ArcelorMittal.
The maximum number of PSUs and RSUs available for grant during any given year is subject to the prior approval of the Company’s shareholders at the annual general meeting. The 2018, 2019 and 2020 Caps for the number of PSUs/RSUs that may be allocated to the CEO Office and other retention and performance based grants below the CEO Office level, were approved at the AGMs on May 9, 2018, May 7, 2019 and June 13, 2020, respectively, at a maximum of 1,500,000 shares, 2,500,000 shares and 4,250,000 shares, respectively.
In 2016, ArcelorMittal adapted the plan:
•To consider the comments of shareholders that vesting should not happen below the median and
•To adapt to Action 2020 (Special grant)
Conditions of the 2020 grant were as follows:
| | | | | | | | | | | | | | | | | | | | | | | | | | | | | | | | |
| | CEO Office | | Executive Officers |
| 2020 Grant | l | PSUs with a three year performance period | l | PSUs with a three year performance period |
| l | Value at grant 100% of base salary for the CEO and the President and CFO | | |
| l | Vesting conditions: | l | Vesting conditions |
| Threshold | Target | | | | Target |
| TSR/EPS vs. peer group
| 100% median | ≥120% median | | TSR vs. peer group | | 100% target
100% vesting |
| | | | | | EPS vs. peer group | | 100% target
100% vesting |
| TSR vs. S&P 500
| Performance equal to Index
| ≥Performance equal to Index + 2% p.a. outperformance | | Gap to competition (where applicable) | | 100% target
100% vesting |
| Vesting percentage | 50% | 100% | l | RSUs with a three year vesting period |
| | | | | | | | | | |
| | | | | | l | RSUs with a one year vesting period |
Awards made in 2016 through 2019
The Company's Long-Term Incentive Plan for senior management including Executive Officers follows the Company's strategy.
In 2016, a special grant was deployed on a five-year performance period to achieve the Company's Action 2020 plan. ROCE remained a key target and Gap to Competition was added as performing against competition is essential.
The plans in 2016, 2017, 2018 and 2019 are summarized below.
| | | | | | | | | | | | | | | | | | | | | | | | | | | | | | | | | | | | | | |
| | CEO Office | | Other Executive Officers |
| 2016 Special Grant | l | PSUs with a five-year performance period, 50% vesting after three-year performance period and 50% after additional two-year performance period | l | PSUs with a five-year performance period, 50% vesting after three-year performance period and 50% after additional two-year performance period |
| l | Performance criteria: 50% TSR (½ vs. S&P 500 and ½ vs. peer group) and 50% EPS vs. peer group | l | Performance criteria: ROCE and Gap to competition in some areas
one target grant: a share will vest if performance is met at target
one overperformance grant: a share will vest if performance exceeds 120% |
| l | Value at grant: 150% of base salary for the CEO and the President and CFO | l | Vesting conditions: |
| l | Vesting conditions: | | |
| | | Threshold | Target | | Performance |
| 100% | ≥120% |
| TSR/EPS vs. peer group | | 100% median | ≥120% median | | Target award vesting | 100% | 100% |
| TSR vs. S&P 500 | | Performance equal to Index
| ≥Performance equal to Index + 2% p.a. outperformance | | Overperformance award (=20% of target award) | - | 100% |
| Vesting percentage | | 50% | 100% | | |
| 2017 Grant | l | PSUs with a three-year performance period | | l | PSUs with a three-year performance period | |
| l | Performance criteria: 50% TSR (½ vs. S&P 500 and ½ vs. peer group) and 50% EPS vs. peer group | l | Performance criteria: TSR and Gap to competition in some areas |
| l | Value at grant: 100% of base salary for the CEO and the President and CFO | | | |
| l | Vesting conditions: | | l | Vesting conditions: | |
| | Threshold | Target | | Performance | | Threshold | Target |
| TSR/EPS vs. peer group
| 100% median | ≥120% median | | TSR vs. peer group
| 100% median 50% vesting | ≥120% median 100% vesting |
| TSR vs. S&P 500
| Performance equal to Index
| ≥Performance equal to Index + 2% p.a. outperformance | | Gap to competition (where applicable) | - | 100% target
100% vesting |
| Vesting percentage
| 50% | 100% | | | |
| | | | | | | | | | | | | | | | | | | | | | | | | | | | | | | | |
| | CEO Office | | Executive Officers |
| 2018 Grant | l | PSUs with a three year performance period | l | PSUs with a three year performance period |
| l | Value at grant 100% of base salary for the CEO and the President and CFO | | |
| l | Vesting conditions: | l | Vesting conditions |
| Threshold | Target | | | | Target |
| TSR/EPS vs. peer group
| 100% median | ≥120% median | | ROCE | | 100% target
100% vesting |
| TSR vs. S&P 500
| Performance equal to Index
| ≥Performance equal to Index + 2% p.a. outperformance | | Gap to competition (where applicable) | | 100% target
100% vesting |
| Vesting percentage | 50% | 100% | | |
| | | | | | | | | | | | | | | | | | | | | | | | | | | | | | | | |
| | CEO Office | | Executive Officers |
| 2019 Grant | l | PSUs with a three year performance period | l | PSUs with a three year performance period |
| l | Value at grant 100% of base salary for the CEO and the President and CFO | | |
| l | Vesting conditions: | l | Vesting conditions |
| Threshold | Target | | | | Target |
| TSR/EPS vs. peer group
| 100% median | ≥120% median | | ROCE | | 100% target
100% vesting |
| TSR vs. S&P 500
| Performance equal to Index
| ≥Performance equal to Index + 2% p.a. outperformance | | Gap to competition (where applicable) | | 100% target
100% vesting |
| Vesting percentage | 50% | 100% | | |
See note 8.3 to the consolidated financial statements for further details on PSUs.
Global Stock Option Plan
Prior to the May 2011 annual general shareholders’ meeting adoption of the ArcelorMittal Equity Incentive Plan described above, ArcelorMittal’s equity-based incentive plan took the form of a stock option plan known as the Global Stock Option Plan.
See note 8.3 to the consolidated financial statements for further details on stock options.
Other benefits
In addition to the remuneration described above, other benefits may be provided to senior management and, in certain cases, other employees. These other benefits can include insurance, housing (in cases of international transfers), car allowances and tax assistance.
SOX 304 and clawback policy
Under Section 304 of the Sarbanes-Oxley Act, the SEC may seek to recover remuneration from the CEO and CFO of the
Company in the event that it is required to restate accounting information due to any material misstatement thereof or as a result of misconduct in respect of a financial reporting requirement under the U.S. securities laws (the “SOX Clawback”).
Under the SOX Clawback, the CEO and the CFO may have to reimburse ArcelorMittal for any short-term incentive or other incentive-based or equity-based remuneration received during the 12-month period following the first public issuance or filing with the SEC (whichever occurs first) of the relevant filing, and any profits realized from the sale of ArcelorMittal securities during that 12-month period.
The Board of Directors, through its ARCGS Committee, decided in 2012 to adopt its own clawback policy (the “Clawback Policy”) that applies to the members of the former GMB and to the Executive Vice President of Finance of ArcelorMittal. In 2016, the Clawback Policy was updated to reflect the Company’s structural changes and now applies to the CEO Office and the Executive Officers.
The Clawback Policy comprises cash short-term incentives and any other incentive-based or equity-based remuneration, as well as profits from the sale of the Company’s securities received during the 12-month period following the first public issuance or filing with the SEC (whichever first occurs) of the filing that contained the material misstatement of accounting information.
For purposes of determining whether the Clawback Policy should be applied, the Board of Directors will evaluate the circumstances giving rise to the restatement (in particular, whether there was any fraud or misconduct), determine when any such misconduct occurred and determine the amount of remuneration that should be recovered by the Company. In the event that the Board of Directors determines that remuneration should be recovered, it may take appropriate action on behalf of the Company, including, but not limited to, demanding repayment or cancellation of cash short-term incentives, incentive-based or equity-based remuneration or any gains realized as the result of options being exercised or awarded or long-term incentives vesting. The Board may also choose to reduce future remuneration as a means of recovery.
Corporate governance
This section describes the corporate governance practices of ArcelorMittal for the year ended December 31, 2020.
Board of Directors and senior management
ArcelorMittal is governed by a Board of Directors and managed by the senior management. As described in "Directors and
senior management" above, ArcelorMittal’s senior management was comprised of the CEO Office - comprising the CEO, Mr. Lakshmi N. Mittal and the President and CFO, Mr. Aditya Mittal. The CEO Office was supported by a team of five other Executive Officers, who together encompass the key regions and corporate functions.
A number of corporate governance provisions in the Articles of Association of ArcelorMittal reflect provisions of the Memorandum of Understanding signed on June 25, 2006 (prior to Mittal Steel Company N.V.’s merger with Arcelor), amended in April 2008 and which mostly expired on August 1, 2009. For more information about the Memorandum of Understanding, see “Additional information—Material contracts—Memorandum of Understanding”.
ArcelorMittal fully complies with the 10 Principles of Corporate Governance of the Luxembourg Stock Exchange. This is explained in more detail in “—Other corporate governance practices” below. ArcelorMittal also complies with the New York Stock Exchange Listed Company Manual as applicable to foreign private issuers. There are no significant differences between the corporate governance practices of ArcelorMittal and those required of a U.S. domestic issuer under the Listed Company Manual of the New York Stock Exchange.
Board of Directors
| | | | | | | | | | | | | | | | | | | | |
| 10 members | | 8 non-executive directors | | 6 independent directors | | 2 executive directors (CEO and CFO) |
| | | | | | | | | | | | | | | | | | | | |
| 30% women | | 70% men | | 7 average years on the Board | | 58 average age of directors |
The Board of Directors is in charge of the overall governance and direction of ArcelorMittal. It is responsible for the performance of all acts of administration necessary or useful in furtherance of the corporate purpose of ArcelorMittal, except for matters reserved by Luxembourg law or the Articles of Association to the general meeting of shareholders. The Articles of Association provide that the Board of Directors is composed of a minimum of three and a maximum of 18 members.
The Articles of Association provide that directors are elected and removed by the general meeting of shareholders by a simple majority of votes cast. Other than as set out in the Company’s Articles of Association, no shareholder has any specific right to nominate, elect or remove directors. Directors are elected by the general meeting of shareholders for three-year terms. In the event that a vacancy arises on the Board of Directors for any
reason, the remaining members of the Board of Directors may by a simple majority elect a new director to temporarily fulfill the duties attaching to the vacant post until the next general meeting of the shareholders.
For further information on the composition of the Board of Directors, including the expiration of each Director’s term and the period during which each Director has served, see section "—Directors and senior management " above.
Mr. Lakshmi N. Mittal was elected Chairman of the Board of Directors on May 13, 2008. Mr. Mittal was also ArcelorMittal’s CEO. Mr. Mittal was re-elected to the Board of Directors for a three-year term at the annual general meeting of shareholders on June 13, 2020.
A director is considered “independent” if:
(a)he or she is independent within the meaning of the New York Stock Exchange Listed Company Manual, as applicable to foreign private issuers,
(b)he or she is unaffiliated with any shareholder owning or controlling more than two percent of the total issued share capital of ArcelorMittal, and
(c)the Board of Directors makes an affirmative determination to this effect.
For these purposes, a person is deemed affiliated to a shareholder if he or she is an executive officer, a director who also is an employee, a general partner, a managing member or a controlling shareholder of such shareholder. The 10 Principles of Governance of the Luxembourg Stock Exchange, which constitute ArcelorMittal's domestic corporate governance code, require ArcelorMittal to define the independence criteria that apply to its directors, which are described in article 8.1 of its Articles of Association.
Specific characteristics of the director role
| | | | | | | | | | | | | | | | | | | | |
Required share ownership
Lead Independent Director - minimum of 6,000 ordinary shares
Non-executive directors - minimum of 4,000 ordinary shares | | Maximum 12 year service (independent directors) | | May not serve on the boards of directors of more than four publicly listed companies (non-executive directors) | | Required to sign the Company’s Code of Business Conduct and confirm their adherence annually |
The Company’s Articles of Association do not require directors to be shareholders of the Company. The Board of Directors nevertheless adopted a share ownership policy on October 30, 2012, that was amended on November 7, 2017, considering that it is in the best interests of all shareholders for all non-executive directors to acquire and hold a minimum number of ArcelorMittal ordinary shares in order to better align their long-term interests with those of ArcelorMittal’s shareholders. The Board of Directors believes that this share ownership policy will result in a meaningful holding of ArcelorMittal shares by each non-executive director, while at the same time taking into account the fact that the share ownership requirement should not be excessive in order not to unnecessarily limit the pool of available candidates for appointment to the Board of Directors. Directors must hold their shares directly or indirectly, and as sole or joint beneficiary owner (e.g., with a spouse or minor children), at the latest within three years of his or her election to the Board of Directors. Each director will hold the shares acquired on the basis of this policy for so long as he or she serves on the Board of Directors. Directors purchasing shares in compliance with this policy must comply with the ArcelorMittal Insider Dealing Regulations and, in particular, refrain from trading during any restricted period, including any such period that may apply
immediately after the Director’s departure from the Board of Directors for any reason.
On October 30, 2012, the Board of Directors also adopted a policy that places limitations on the terms of independent directors as well as the number of directorships that directors may hold in order to align the Company’s corporate governance practices with best practices in this area (as highlighted in the table above). Nevertheless, the Board of Directors may, by way of exception to this rule, make an affirmative determination, on a case-by-case basis, that a Director may continue to serve beyond the 12-year rule if the Board of Directors considers it to be in the best interest of the Company based on the contribution of the Director involved taking into consideration the balance between the knowledge, skills, experience of the director and the need for renewal of the Board.
As membership of the Board of Directors represents a significant time commitment, the policy requires both executive and non-executive directors to devote sufficient time to the discharge of their duties as a Director of ArcelorMittal. Directors are therefore required to consult with the Chairman and the Lead Independent Director before accepting any additional
commitment that could conflict with or impact the time they can devote to their role as a Director of ArcelorMittal. A non-executive Director’s service on the board of directors of any subsidiary or affiliate of ArcelorMittal or of any non-publicly listed company is not taken into account for purposes of complying with the service limitation.
Although non-executive directors of ArcelorMittal who change their principal occupation or business association are not necessarily required to leave the Board of Directors, the policy requires each non-executive director, in such circumstances, to promptly inform the Board of Directors of the action he or she is contemplating. Should the Board of Directors determine that the contemplated action would generate a conflict of interest, such non-executive director would be asked to tender his or her resignation to the Chairman of the Board of Directors, who would decide to accept the resignation or not.
None of the members of the Board of Directors, including the executive director, have entered into service contracts with ArcelorMittal or any of its subsidiaries that provide for any form of remuneration or for benefits upon the termination of their term. All non-executive Directors of the Company signed the Company’s Appointment Letter, which confirms the conditions of their appointment by the General Meeting of the Shareholders including compliance with certain non-compete provisions, the 10 Principles of Corporate Governance of the Luxembourg Stock Exchange and the Company’s Code of Business Conduct.
The remuneration of the members of the Board of Directors is determined on a yearly basis by the annual general meeting of shareholders.
Share transactions by management
In compliance with laws prohibiting insider dealing, the Board of Directors of ArcelorMittal has adopted insider dealing regulations, which apply throughout the ArcelorMittal group. These regulations are designed to ensure that insider information is treated appropriately within the Company and avoid insider dealing and market manipulation. Any breach of the rules set out in this procedure may lead to criminal or civil charges against the individuals involved, as well as disciplinary action by the Company.
Operation
General
The Board of Directors and the Board committees may engage the services of external experts or advisers as well as take all actions necessary or useful to implement the Company’s corporate purpose. The Board of Directors (including its two committees) has its own budget, which covers functioning costs such as external consultants, continuing education activities for directors and travel expenses.
Meetings
The Board of Directors meets when convened by the Chairman of the Board or any two members of the Board of Directors. The Board of Directors holds physical meetings at least on a quarterly basis as five regular meetings are scheduled per year. The Board of Directors holds additional meetings if and when circumstances require, in person or by teleconference and can take decisions by written circulation, provided that all members of the Board of Directors agree.
| | | | | | | | |
| 11 meetings (2020) | | 100% Average attendance rate |
In order for a meeting of the Board of Directors to be validly held, a majority of the directors must be present or represented, including at least a majority of the independent directors. In the absence of the Chairman, the Board of Directors will appoint by majority vote a chairman for the meeting in question. The Chairman may decide not to participate in a Board of Directors’ meeting, provided he has given a proxy to one of the directors who will be present at the meeting. For any meeting of the Board of Directors, a director may designate another director to represent him or her and vote in his or her name, provided that the director so designated may not represent more than one of his or her colleagues at any time.
Each director has one vote and none of the directors, including the Chairman, has a casting vote. Decisions of the Board of Directors are made by a majority of the directors present and represented at a validly constituted meeting, except for the decisions of the Board of Directors relating to the issue of any financial instruments carrying or potentially carrying a right to equity pursuant to the authorization conferred by article 5.5 of the Articles of Association, which shall be taken by a majority of two-thirds of the directors present or represented at a validly constituted meeting.
Lead Independent Director
Mr. Bruno Lafont was elected by the Board of Directors as ArcelorMittal's Lead Independent Director and re-elected as a director for a three-year term at ArcelorMittal AGM held on June 13, 2020.
The agenda of each meeting of the Board of Directors is decided jointly by the Chairman of the Board of Directors and the Lead Independent Director.
Separate meetings of independent directors
The independent members of the Board of Directors may schedule meetings outside the presence of non-independent directors. Five meetings of the independent directors outside the presence of management were held in 2020.
Annual self-evaluation
The Board of Directors decided in 2008 to start conducting an annual self-evaluation of its functioning in order to identify potential areas for improvement. The first self-evaluation process was carried out in early 2009. The self-evaluation process includes structured interviews between the Lead Independent Director and each director and covers the overall performance of the Board of Directors, its relations with senior management, the performance of individual directors, and the performance of the committees. The process is supported by the Company Secretary under the supervision of the Chairman and the Lead Independent Director. The findings of the self-evaluation process are examined by the ARCGS Committee and presented with recommendations from the ARCGS Committee to the Board of Directors for adoption and implementation. Suggestions for improvement of the Board of Directors’ process based on the prior year’s performance and functioning are implemented during the following year.
The 2020 Board of Directors’ self-evaluation was completed by the Board on January 18, 2021. The Board of Directors was of the opinion that it and the management had cooperated successfully during 2020 on important matters including operational and financial performance, the sale of ArcelorMittal USA and certain other subsidiaries and investment agreement between the Company and Invitalia, the ongoing strengthening of the balance sheet, strategy, especially on long term strategic planning, capital allocation, sustainability, labor relations and health and safety with a focus on health. The Board of Directors reviewed the practical implementation of the governance structure and thought it was working well. The Board set new priorities for discussion and review and identified a number of priority topics for 2021.
The Board of Directors believes that its members have the appropriate range of skills, knowledge and experience, as well as the degree of diversity necessary to enable it to effectively govern the business. The Board of Directors composition is reviewed on a regular basis and additional skills and experience are actively searched for in line with the expected development of ArcelorMittal’s business as and when appropriate.
Required skills, experience and other personal characteristics
Diverse skills, backgrounds, knowledge, experience, geographic location, nationalities and gender are required in order to
effectively govern a global business the size of the Company’s operations. The Board of Directors and its committees are therefore required to ensure that the Board has the right balance of skills, experience, independence and knowledge necessary to perform its role in accordance with the highest standards of governance.
The Company’s directors must demonstrate unquestioned honesty and integrity, preparedness to question, challenge and critique constructively, and a willingness to understand and commit to the highest standards of governance. They must be committed to the collective decision-making process of the Board of Directors and must be able to debate issues openly and constructively, and question or challenge the opinions of others. Directors must also commit themselves to remain actively involved in Board decisions and apply strategic thought to matters at issue. They must be clear communicators and good listeners who actively contribute to the Board in a collegial manner. Each director must also ensure that no decision or action is taken that places his or her interests before the interests of the business. Each director has an obligation to protect and advance the interests of the Company and must refrain from any conduct that would harm it.
In order to govern effectively, non-executive directors must have a clear understanding of the Company’s strategy, and a thorough knowledge of the ArcelorMittal group and the industries in which it operates. Non-executive directors must be sufficiently familiar with the Company’s core business to effectively contribute to the development of strategy and monitor performance.
With specific regard to the non-executive directors of the Company, the composition of the group of non-executive directors should be such that the combination of experience, knowledge and independence of its members allows the Board to fulfill its obligations towards the Company and other stakeholders in the best possible manner.
The ARCGS Committee ensures that the Board of Directors is comprised of high-caliber individuals whose background, skills, experience and personal characteristics enhance the overall profile of the Board and meets its needs and diversity aspirations by nominating high quality candidates for election to the Board by the general meeting of shareholders.
Board profile
The key skills and experience of the directors, and the extent to which they are represented on the Board of Directors and its committees, are set out below. In summary, the non-executive directors contribute:
| | | | | | | | | | | | | | | | | | | | |
| International and operational experience | | Understanding of the industry sectors in which ArcelorMittal operates | | Knowledge of global capital markets and being a company listed in several jurisdictions | | Understanding of the health, safety, environmental, political and community challenges that ArcelorMittal faces |
Renewal
The Board of Directors plans for its own succession, with the assistance of the ARCGS Committee. In doing this, the Board of Directors:
•considers the skills, backgrounds, knowledge, experience and diversity of geographic location, nationality and gender necessary to allow it to meet the corporate purpose;
•assesses the skills, backgrounds, knowledge, experience and diversity currently represented;
•identifies any inadequate representation of those attributes and agrees the process necessary to ensure a candidate is selected who brings them to the Board of Directors; and
•reviews how Board performance might be enhanced, both at an individual director level and for the Board as a whole.
The Board believes that orderly succession and renewal is achieved through careful planning and by continuously reviewing the composition of the Board.
When considering new appointments to the Board, the ARCGS Committee oversees the preparation of a position specification that is provided to an independent recruitment firm retained to conduct a global search, taking into account, among other factors, geographic location, nationality and gender. In addition to the specific skills, knowledge and experience required of the candidate, the specification contains the criteria set out in the ArcelorMittal Board profile.
Diversity
In line with the worldwide effort to increase gender diversity on the boards of directors of listed and unlisted companies, the Board met its goal of increasing the number of women on the Board to at least three by the end of 2015 with the election of Mrs. Karyn Ovelmen in May 2015. Out of 10 members of the Board of Directors, women represent 30% in 2020. The ArcelorMittal Board’s diversity not only relates to gender, but also to the region, background and industry of its members.
Director induction, training and development
The Board considers that the development of the directors’ knowledge of the Company, the steel-making and mining industries, and the markets in which the Company operates is an ongoing process. To further bolster the skills and knowledge of directors, the Company set up a continuous development program in 2009.
Upon his or her election, each new non-executive director undertakes an induction program specifically tailored to his or her needs and includes ArcelorMittal’s long-term vision centered on the concept of “Safe Sustainable Steel”.
The Board’s development activities include the provision of regular updates to directors on each of the Company’s products and markets. Non-executive directors may also participate in training programs designed to maximize the effectiveness of the directors throughout their tenure and link in with their individual performance evaluations. The training and development program may cover not only matters of a business nature, but also matters falling into the environmental, social and governance area.
Structured opportunities are provided to build knowledge through initiatives such as visits to plants and mine sites and business briefings provided at Board meetings. Non-executive directors also build their Company and industry knowledge through the involvement of the CEO Office and other senior employees in Board meetings. Business briefings, site visits and development sessions underpin and support the Board’s work in monitoring and overseeing progress towards the corporate purpose of creating long-term shareholder value through the development of the ArcelorMittal business in steel and mining. The Company therefore continuously builds directors’ knowledge to ensure that the Board remains up-to-date with developments within the Company’s segments, as well as developments in the markets in which the Company operates.
During the year, non-executive directors participated in the following activities:
•comprehensive business briefings intended to provide the directors with a deeper understanding of the Company’s activities, environment, key issues and
strategy of the Company’s segments. These briefings are provided to the Board of Directors by senior executives, including CEO Office members. The briefings provided during the course of 2020 covered health and safety processes, cyber security, risk management, corporate responsibility, carbon reduction strategy in steelmaking, capital allocation process and strategy. Business briefings took place at Board and committee meetings;
•briefing meetings with Company executives in charge of specific business segments or markets;
•development sessions on specific topics of relevance, such as health and safety, commodity markets, HR, investor relations, accounting, the world economy, changes in corporate governance standards, directors’ duties and shareholder feedback.
The ARCGS Committee oversees director training and development. This approach allows induction and learning opportunities to be tailored to the directors’ committee memberships, as well as the Board of Directors' specific areas of focus. In addition, this approach ensures a coordinated process in relation to succession planning, Board renewal, training, development and committee composition, all of which are relevant to the ARCGS Committee’s role in securing the supply of talent to the Board.
Board of Directors committees
The Board of Directors has two committees:
•the Audit & Risk Committee, and
•the ARCGS Committee.
Audit & Risk Committee
| | | | | | | | |
4 members (100% independent) | | 6 meetings (2020) |
In 2015, the Board decided to combine the Audit Committee with the Risk Management Committee in order to provide their members with a more holistic view of ArcelorMittal’s current governance, risks and control systems.
The primary function of the Audit & Risk Committee is to assist the Board in fulfilling its oversight responsibilities by reviewing:
•the integrity of the financial reports and other financial information provided by the Company to any governmental body or the public;
•the Company’s compliance with legal and regulatory requirements;
•the registered public accounting firm’s (Independent Auditor) qualifications and independence;
•the Company’s system of internal control regarding finance, accounting, legal compliance, ethics and risk management that management and the Board have established;
•the Company’s auditing, accounting and financial reporting processes generally;
•the identification and management of risks to which the ArcelorMittal group is exposed and
•conducting investigations into any matters, including whistleblower complaints, within its scope of responsibility and obtaining advice from outside legal, accounting, or other advisers, as necessary, to perform its duties and responsibilities.
The Audit & Risk Committee must be composed solely of independent members of the Board of Directors. The members are appointed by the Board of Directors each year after the annual general meeting of shareholders. The Audit & Risk Committee comprises three members, all of whom must be independent under the Company’s corporate governance guidelines, the New York Stock Exchange (NYSE) standards as applicable to foreign private issuers and the 10 Principles of Corporate Governance of the Luxembourg Stock Exchange. The Audit & Risk Committee makes decisions by a simple majority with no member having a casting vote.
At least one member must qualify as an Audit & Risk Committee “financial expert” as defined by the SEC and determined by the Board.
At least one member must qualify as an Audit & Risk Committee “risk management expert” having experience in identifying, assessing, and managing risk exposures of large, complex companies.
The Audit & Risk Committee currently consists of 4 members: Mrs. Karyn Ovelmen, Mr. Bruno Lafont, Mr. Karel de Gucht and Mr. Etienne Schneider, each of whom is an independent Director according to the NYSE standards and the 10 Principles of Corporate Governance of the Luxembourg Stock Exchange. The Chairman of the Audit & Risk Committee is Mrs. Ovelmen who is an “Audit & Risk committee financial expert” as defined by the SEC regulations.
Mrs. Ovelmen and each of the other members of the Audit & Risk Committee are “independent directors” as defined under the NYSE listing standards.
Please see “Directors and senior management—–Board of Directors” for Mrs. Ovelmen's experience.
According to its charter, the Audit & Risk Committee is required to meet at least four times a year. The Audit & Risk Committee performs an annual self-evaluation and completed its 2020 self-evaluation on January 18, 2021. The charter of the Audit & Risk Committee is available from ArcelorMittal upon request.
Appointments, Remuneration, Corporate Governance and Sustainability Committee (former ARCG Committee)
| | | | | | | | |
3 members (100% independent) | | 11 meetings (2020) |
The ARCGS Committee is comprised of three directors, each of whom is independent under the New York Stock Exchange standards as applicable to foreign private issuers and the 10 Principles of Corporate Governance of the Luxembourg Stock Exchange.
The members are appointed by the Board of Directors each year after the annual general meeting of shareholders. The ARCGS Committee makes decisions by a simple majority with no member having a casting vote.
The Board of Directors has established the ARCGS Committee to:
•determine, on its behalf and on behalf of the shareholders within agreed terms of reference, ArcelorMittal’s compensation framework, including short and long term incentives for the CEO, the President and CFO and for the five other Executive Officers;
•review and approve succession and contingency plans for key managerial positions at the level of the Executive Officers;
•consider any candidate for appointment or reappointment to the Board of Directors at the request of the Board of Directors and provide advice and recommendations to it regarding the same;
•evaluate the functioning of the Board of Directors and monitor the Board of Directors’ self-evaluation process;
•assess the roles of the Chairman and CEO and deliberate on the merits of the Board’s leadership structure to ensure that the most efficient and appropriate structure is in place;
•develop, monitor and review corporate governance principles and corporate responsibility policies applicable to ArcelorMittal, as well as their application in practice; and
•review the company’s sustainable development plan and associated management systems and ensure the group is well positioned to meet the evolving expectations of stakeholders, including investors, customers, regulators, employees and communities.
During its meeting of May 8, 2018, the Board renewed its emphasis on four key areas (health & safety, environment and community relations, climate change and social issues) and added these to the scope of the ARCG Committee to ensure a Board level review of these important topics. Accordingly, the ARCG Committee was renamed the ARCGS Committee ("Appointments, Remuneration, Corporate Governance and Sustainability Committee") to highlight the Company’s focus on these key areas. As a result, ArcelorMittal complies with the new Principle 9 on companies' corporate social responsibility introduced subsequently to the revision of the 10 Principles of the Luxembourg Stock Exchange. According to Recommendation 9.3 under the Principles, the Board shall regularly consider the Company's non-financial risks, including social and environmental risks. To this end, the ARCGS Committee oversees the Company's sustainable development plan and associated management systems to ensure that ArcelorMittal is well positioned to meet the evolving expectations of stakeholders including investors, customers, regulators, employees and communities.
The ARCGS Committee’s principal criteria in determining the compensation of executives is to encourage and reward performance that will lead to long-term enhancement of shareholder value. The ARCGS Committee may seek the advice of outside experts.
The three members of the ARCGS Committee are Mr. Bruno Lafont, Mrs. Suzanne P. Nimocks and Mr. Tye Burt, each of whom is independent in accordance with the NYSE standards applicable to foreign private issuers and the 10 Principles of Corporate Governance of the Luxembourg Stock Exchange. The Chairman of the ARCGS Committee is Mr. Lafont.
The ARCGS Committee is required to meet at least three times a year.
The ARCGS Committee performs an annual self-evaluation and completed its 2020 self-evaluation on January 18, 2020.
The charter of the ARCGS Committee is available from ArcelorMittal upon request.
Succession management
Succession management at ArcelorMittal is a systematic, structured process for identifying and preparing employees with potential to fill key organizational positions, should the position become vacant. This process applies to all ArcelorMittal key positions up to and including the CEO Office. Succession management aims to ensure the continued effective performance of the organization by providing for the availability of experienced and capable employees who are prepared to assume these roles as they become available. For each position, candidates are identified based on performance, potential and an assessment of leadership capabilities and their “years to readiness”. Development needs linked to the succession plans are discussed, after which “Personal Development Plans” are put in place, to accelerate development and prepare candidates. Regular reviews of succession plans are conducted at different levels of the organization to ensure that they are accurate and up to date, leading to at least once a year formal review by the CEO Office, of all key positions. Succession management is a necessary process to reduce risk of vacant positions or skill gap transitions, create a pipeline of future leaders, ensure smooth business continuity and improve employee motivation and engagement. This process has been in place for several years and reinforced, widened and made more systematic in all regions of the organization. The responsibility to review and approve succession plans and contingency plans at the highest level rests with the Board’s ARCGS Committee.
Other corporate governance practices
ArcelorMittal is committed to adhere to best practices in terms of corporate governance in its dealings with shareholders and aims to ensure good corporate governance by applying rules on transparency, quality of reporting and the balance of powers. ArcelorMittal continually monitors U.S., EU and Luxembourg legal requirements and best practices in order to make adjustments to its corporate governance controls and procedures when necessary, as evidenced by the policies adopted by the Board of Directors in 2012.
ArcelorMittal complies with the 10 Principles of Corporate Governance of the Luxembourg Stock Exchange in all respects. However, in respect of Recommendation 1.3 under the Principles, which advocates separating the roles of chairman of the board and the head of the executive management body, the Company has made a different choice. This is permitted, however, as, unlike the 10 Principles themselves with which ArcelorMittal must comply, the Recommendations are subject to a more flexible “comply or explain” standard.
The nomination of the same person to both positions was approved by the shareholders (with Lumen and Nuavam, companies controlled by the Significant Shareholder abstaining). Since that date, the rationale for combining the positions of CEO and Chairman of the Board of Directors became even more compelling. The Board of Directors is of the opinion that Mr. Mittal’s strategic vision for the steel industry in general and for ArcelorMittal in particular in his role as CEO is a key asset to the Company, while the fact that he is fully aligned with the interests of the Company’s shareholders means that he is uniquely positioned to lead the Board of Directors in his role as Chairman. The combination of these roles was revisited at the AGM of the Company held in May 2017, when Mr. Lakshmi N. Mittal was re-elected to the Board of Directors for another three year term by a strong majority.
Ethics and conflicts of interest
Ethics and conflicts of interest are governed by ArcelorMittal’s Code of Business Conduct, which establishes the standards for ethical behavior that are to be followed by all employees and directors of ArcelorMittal in the exercise of their duties, including the Company's CEO and CFO. Each employee of ArcelorMittal is required to sign and acknowledge the Code of Conduct upon joining the Company. This also applies to the members of the Board of Directors of ArcelorMittal, who signed the Company’s Appointment Letter in which they acknowledged their duties and obligations. Any new member of the Board of Directors must sign and acknowledge the Code of Conduct upon appointment.
Employees must always act in the best interests of ArcelorMittal and must avoid any situation in which their personal interests conflict, or could conflict, with their obligations to ArcelorMittal. Employees are prohibited from acquiring any financial or other interest in any business or participating in any activity that could deprive ArcelorMittal of the time or the attention needed to devote to the performance of their duties. Any behavior that deviates from the Code of Business Conduct is to be reported to the employee’s supervisor, a member of the management, the head of the legal department or the head of the internal assurance department.
Code of Business Conduct training is offered throughout ArcelorMittal on a regular basis in the form of face-to-face trainings, webinars and online trainings. Employees are periodically trained about the Code of Business Conduct in each location where ArcelorMittal has operations. The Code of Business Conduct is available in the “Corporate Governance-Our Policies-Code of Business Conduct” section of ArcelorMittal’s website at www.arcelormittal.com and has been disseminated through company-wide communications.
In addition to the Code of Business Conduct, ArcelorMittal has developed a Human Rights Policy and a number of other compliance policies in more specific areas, such as antitrust,
anti-corruption, economic sanctions, insider dealing and data protection. In all these areas, specifically targeted groups of employees are required to undergo specialized compliance training. Furthermore, ArcelorMittal’s compliance program also includes a quarterly compliance certification process covering all business segments and entailing reporting to the Audit & Risk Committee.
ArcelorMittal intends to disclose any amendment to or waiver from the Code of Business Conduct applicable to any of ArcelorMittal’s directors, its CEO, CFO or any other person who is an executive officer of ArcelorMittal on ArcelorMittal’s website at www.arcelormittal.com.
Process for Handling Complaints on Accounting Matters
As part of the procedures of the Board of Directors for handling complaints or concerns about accounting, internal controls and auditing issues, ArcelorMittal’s Anti-Fraud Policy and Code of Business Conduct encourage all employees to bring such issues to the Audit & Risk Committee’s attention on a confidential basis. In accordance with ArcelorMittal’s Anti-Fraud and Whistleblower Policy, concerns with regard to possible fraud or irregularities in accounting, auditing or banking matters or bribery within ArcelorMittal or any of its subsidiaries or other controlled entities may also be communicated through the “Corporate Governance — Whistleblower” section of the ArcelorMittal website at www.arcelormittal.com, where ArcelorMittal’s Anti-Fraud Policy and Code of Business Conduct are also available in each of the main working languages used within the Group. In recent years, ArcelorMittal has implemented local whistleblowing facilities, as needed.
During 2020, there were 168 complaints received relating to alleged fraud, which were referred to and duly reviewed by the Company’s Internal Assurance Department. Following review by the Audit & Risk Committee, none of these complaints were found to be significant.
Internal assurance
ArcelorMittal has an Internal Assurance function that, through its Head of Internal Assurance, reports to the Audit & Risk Committee. The function is staffed by full-time professional staff located within each of the principal operating subsidiaries and at the corporate level. Recommendations and matters relating to internal control and processes are made by the Internal Assurance function and their implementation is regularly reviewed by the Audit & Risk Committee.
Independent auditors
The appointment and determination of fees of the independent auditors is the direct responsibility of the Audit & Risk Committee. The Audit & Risk Committee is further responsible for obtaining, at least once each year, a written statement from the independent auditors that their independence has not been
impaired. The Audit & Risk Committee has also obtained a confirmation from ArcelorMittal’s principal independent auditors to the effect that none of its former employees are in a position within ArcelorMittal that may impair the principal auditors’ independence.
Measures to prevent insider dealing and market manipulation
The Board of Directors of ArcelorMittal has adopted Insider Dealing Regulations (“IDR”), which are updated when necessary (most recently in January 2019) and in relation to which training is conducted throughout the Group. The IDR’s most recent version has been updated in light of the new Market Abuse Regulation and is available on ArcelorMittal’s website, www.arcelormittal.com.
The IDR apply to the worldwide operations of ArcelorMittal. The compliance and data protection officer of ArcelorMittal is also the IDR compliance officer and answers questions that members of senior management, the Board of Directors, or employees may have about the IDR’s interpretation. The IDR compliance officer maintains a list of insiders as required by Regulation No 596/2014 of the European Parliament and the Council dated 16 April 2014 on market abuse or “MAR” and the Commission Implementing Regulation 2016/347 of 10 March 2016 laying down technical standards with regard to the precise format of insider lists and for updating insider lists in accordance with MAR. The IDR compliance officer may assist senior executives and directors with the filing of notices required by Luxembourg law to be filed with the Luxembourg financial regulator, the CSSF (Commission de Surveillance du Secteur Financier). Furthermore, the IDR compliance officer has the power to conduct investigations in connection with the application and enforcement of the IDR, in which any employee or member of senior management or of the Board of Directors is required to cooperate.
Selected new employees of ArcelorMittal are required to participate in a training course about the IDR upon joining ArcelorMittal and every three years thereafter. The individuals who must participate in the IDR training include the members of senior management, employees who work in finance, legal, sales, mergers and acquisitions and other areas that the Company may determine from time to time. In addition, ArcelorMittal’s Code of Business Conduct contains a section on “Trading in the Securities of the Company” that emphasizes the prohibition to trade on the basis of inside information. An online interactive training tool based on the IDR was developed in 2010 and deployed across the group through ArcelorMittal’s intranet, with the aim to enhance the staff’s awareness of the risks of sanctions applicable to insider dealing. The importance of the IDR was again reiterated in the Group's internal Group Policies and Procedures Manual in 2013.
Employees
As of December 31, 2020, ArcelorMittal employs approximately 168,000 people directly, as well as a large number of contractors and part-time workers.
The table below sets forth the total number of employees by segment for the past three years.
| | | | | | | | | | | |
| Segment | 2020 | 2019 | 2018 |
| NAFTA | 13,138 | | 27,988 | | 29,291 | |
| Brazil | 18,752 | | 19,362 | | 20,198 | |
| Europe | 71,682 | | 74,900 | | 89,508 | |
| ACIS | 58,178 | | 62,986 | | 63,637 | |
| Mining | 4,289 | | 4,397 | | 4,362 | |
| Other activities | 1,704 | | 1,615 | | 1,587 | |
| Total | 167,743 | | 191,248 | | 208,583 | |
ArcelorMittal employees in various parts of the world are represented by trade unions and ArcelorMittal is a party to collective bargaining agreements with employee organizations in certain locations. The following description summarizes the status of certain of these agreements and relationships.
The Company is committed to open, respectful and transparent social dialogue at all of its operations, to strong employee relations, and safe, healthy and quality working lives for all its workers.
COVID-19 – Supporting the Company's people
Since ArcelorMittal’s creation, the health, safety and well-being of its workforce has been the number one priority. In 2020, given the unprecedented global health crisis resulting from the COVID-19 pandemic, that pledge has never been more important. The virus spread across the globe and is present in all the countries where ArcelorMittal produces steel. The challenge and responsibility the Company therefore has, to ensure the safety and well-being of its near 168,000 strong workforce, is paramount.
ArcelorMittal has developed a COVID-19 governance structure to ensure a regular flow of information between the leadership and critical functional networks and taskforces, which have either been created for the current crisis or previously existed and have been brought together more frequently.
This structure is vital in establishing pandemic safety principles (see —"Sustainable development—Management Theme #1: Safety"), considering the impacts on ArcelorMittal`s people, maintaining regular communication, acknowledging and appreciating the incredible efforts and resilience of our workforce, ensuring organization effectiveness, and closely monitoring and supporting the most affected regions.
ArcelorMittal rigorously adhered to guidelines and recommendations from the World Health Organization and the governments of the countries in which it operates. Moreover, it has implemented many measures at all operating sites to proactively address health concerns and limit the possibility of the virus spreading. These include ensuring the operations have sufficient supplies of sanitation products and essential personal protective equipment, strictly following social distancing procedures, conducting enhanced and regular cleaning operations and monitoring the health of the employees when they enter and exit work premises.
ArcelorMittal also temporarily closed many offices, with people working from home during lockdown conditions throughout the year which may prevent them from leaving their homes aside for daily exercise and essential activities. This loss of social contact creates new challenges, and the Company has taken the time to listen to and understand people’s concerns and provide them with the support, advice and guidance they need as they adjusted to new and unusual working conditions.
The ArcelorMittal University has also played a very important role in the development of specific learning modules to support ArcelorMittal`s people dealing with the crisis worldwide. They provided training on the key guidelines, remote working, managing through the crisis and supporting people dealing with the stress and anxieties. The trainings included nearly 6,000 hours of COVID-19 support related sessions and received more than 22,000 views.
Employee development
Sourcing, developing and retaining the right people continues to be a strategic priority for ArcelorMittal in building a high-performing organization. The Company recognizes the world of work has changed and the expectations of employees and potential employees have changed with it. The COVID-19 pandemic, with its health and economic impact, has perhaps accelerated the importance of some factors (such as emotional resilience), and the implementation of others (such as digitalization) and has also reminded the Company of the importance of certain values and behavior.
Communicating and connecting with the Company's employees is certainly an area where it has made a concerted effort during 2020, through more proximity meetings and other means of communication. Virtual meetings have been around for the past 20 years, but the explosion this year, through Teams, Zoom and other collaboration vehicles has really increased the connectivity of ArcelorMittal's people.
There continues to be a strong demand for the best talent and ArcelorMittal wants to ensure it is considered as an aspirational place to work. That means ensuring employees feel safe, respected and valued. It also means building a culture that
constantly keeps employees committed, motivated and eager to perform at their best.
Employee development, including succession planning and the development of young talent, is also crucial in building a high-performing organization. It goes to the heart of the Company's ambitions to engage and retain employees. The Company aims to have a clear career pathway for employees, supported with ongoing initiatives to build their technical capabilities through training. ArcelorMittal has programs designed to spot people with potential and manage the succession of key roles, as part of its overall strategic workforce planning process, which is overseen by the ARCGS Committee. Strategic workforce planning is a key element of business unit quarterly reviews.
In 2020, the Company has continued to harness skills and resources and has stepped up its efforts to identify and accelerate the development and readiness of its High Potential employees (HiPos) to take on increased responsibilities. This has been achieved by having the right people in the right place at the right time; identifying people for key succession plans; anticipating and filling vacancies; ensuring a healthy and diverse leadership pipeline; nurturing internally the generations of tomorrow and preparing future leaders; encouraging individual performance and making sustainable performance gains; and ensuring the retention of HiPo’s, through acknowledgement, empowerment, motivation and challenges.
An effective succession planning process is based on open career discussions with HiPo’s. Every HiPo has a career counselling discussion with his/her manager and HR, which focuses on the ‘right casting for the role’ to determine fit, readiness and match with individual drivers and motivations. The outcome of this discussion is used in the succession planning process.
For the accelerated development of HiPos, the Company has developed Leadership Pipeline learning journeys, preparing them for promotion. The programs are partly personalized, based on assessments. They are customized and delivered through a blended format of face-to-face (when available) and digital.
The Talent Acceleration Pool ("TAP") is an accelerated development program for HiPo’s who have been identified deep in the organization (below Manager) and who have potential to reach at least Manager level in the organization. The HiPos are provided consistent and structured development opportunities, through assessments, career interviews, tailored individual development plans and learning journeys - to support the creation of a pipeline of HiPo candidates for succession to Manager+ roles.
The main highlights from the TAP program in 2020 were: 226 participants from 30 nationalities, including 45 women (20%); 57 have been promoted to Manager in the past 18 months, including 12 women (21%); 91 more have been promoted to new positions with expansion of responsibilities.
The COVID-19 pandemic provided challenges in the delivery of learning and development in a traditional classroom format. However, it also provided new opportunities to expand digital learning. This has allowed ArcelorMittal to expand inclusion to its global community as it expanded access through the growth of these digital learning opportunities. An excellent example of this was the involvement of over 35,000 employees worldwide in the Company's first ever global virtual Learning Week in June 2020. The Company also offered world class leadership programs to its talents and future leaders digitally. Over 300 HiPos attended leadership journeys in 2020 to prepare themselves for their next steps.
Another important program is the Company's Group Mentoring Program, which is designed to provide all ArcelorMittal employees an opportunity to participate in a mentoring relationship with a Group Mentor. By the end of 2020, 455 participants had enrolled in the program.
In addition, in 2020 work began on the implementation of a global Human Capital Management system which will provide unification of the Company's employee systems around recruitment, performance, succession planning, career development and learning. This will provide the enhanced infrastructure necessary to analyze data and identify areas for continuous improvement in ArcelorMittal's global diversity and inclusion efforts.
Diversity and inclusion
ArcelorMittal values diversity as a way of bringing fresh perspectives and experiences to the business and as part of its ambition to be an employer of choice. The Company has a presence in over 60 countries and employees from many more and its diversity and inclusion policy aims to encompass different cultures, generations, genders, ethnic groups, nationalities, abilities and social backgrounds.
ArcelorMittal’s senior management is committed to building a more inclusive culture and recruiting, retaining and promoting more talented women. It also recognizes the increasing expectations of stakeholders, including employees and investors, to report on progress in this area. In 2018, the Company developed KPIs to support this commitment, which it reports against in its Integrated Annual Review. In 2020, internal benchmarking was conducted to identify diversity and inclusion policies and initiatives in place across the Company and peers. The results of this benchmark will be used as a base for alignment and sharpening of ArcelorMittal's strategy to set and
then reach its Diversity and Inclusion ambition. In 2020, 12.6% of management positions were held by women and 13.7% of senior succession plan candidates - those who are foreseen to take over senior manager positions at General Managers level and above - are women.
In line with the worldwide effort to increase gender diversity at the board level, ArcelorMittal met its goal of increasing the number of women on the Board of Directors to at least three by the end of 2015. In 2020, three of the ten positions on the Board of Directors were held by women.
A number of programs are in place to develop women as leaders. These are supported by initiatives including training programs for women employees, mentoring and coaching, networking and role model involvement. This is aligned with a commitment to support future leaders in science, technology, engineering and maths ("STEM"). In 2020, the Company ran initiatives in a number of countries, including France and the United States, specifically designed to attract women applicants with STEM backgrounds.
In 2017, the ArcelorMittal University launched Women@ArcelorMittal, a program which includes an online learning channel, webinars and face-to-face training. To help foster a broader inclusive culture, the ArcelorMittal University also runs training programs for employees to build their understanding of how cultural orientations affect attitudes and actions and how they can manage interactions between different cultural perspectives and communication styles.
Initiatives in a number of countries support people with disabilities in the workplace. In France, the seven sites of ArcelorMittal Atlantique & Lorraine have an agreement with three unions to promote the vocational integration of workers with disabilities. In Brazil, a robust Diversity and Inclusion program has been launched in 2019 and strongly activated in 2020. The program's governance is composed by the Executive Committee, National Diversity and Inclusion Committee and a Committee per each key area (Gender, People with Disabilities, Racial, LGBTI+). In 2020, the program had contributions from 864 employees who volunteered to participate in the employee resources group of each key area defining and implementing many initiatives to raise awareness, build support and create an inclusive culture and, as a result, attract and retain the best talents. In South Africa, a local talent pool was developed to improve diversity overall including race and gender, and had 26% female representation in 2020.
Collective Labor Agreements
The Joint Global Health and Safety Agreement signed in 2008 between the Company and the IndustriALL union at the European and international level (formerly European and International Metalworkers Federations, respectively) and
United Steelworkers Union in North America remained in effect in 2020. This agreement, which is the first of its kind in the steel industry, recognizes the vital role played by trade unions in improving health and safety. It sets out minimum standards for every site the Company operates with the objective of achieving world-class performance. These standards include the commitment to form joint management of union health and safety committees, as well as training and education programs at the facility level in order to make a meaningful impact on health and safety across the Company. The creation of a joint global health and safety committee is also included in the agreement. This committee consists of representatives of management and the unions and focuses on helping ArcelorMittal's steel and mining activities further improve their health and safety performance. This committee meets regularly to support improvements in the efficiency of local committees. In 2020, due to the pandemic and the worldwide sanitary crisis, meetings were suspended but a joint discussion on specific topics took place sporadically throughout the year. In addition, several other safety training programs, including the Take Care Training were rolled out in 2019 to support the “Journey to Zero” program aimed at reducing the amount of injuries and fatalities in the Company to zero. See “Business overview—Sustainable development—Management Theme #1: Health and safety.”
In 2020, collective labor agreements (“CLAs”) were entered into or renewed in Argentina, Brazil, Liberia, Mexico, and most European countries.
In December, ArcelorMittal completed the sale of ArcelorMittal USA to Cleveland-Cliffs and employees subject to the CLA were transferred to Cleveland-Cliffs (see "—Key transactions and events in 2020").
At ArcelorMittal Long Products Canada, unionized employees at Contrecoeur West continue to work under an agreement with the United Steel Workers ("USW") renewed in July 2020 and expiring in July 2026. The six-year labor agreement ratified in February 2016, covering Contrecoeur East and Longueuil facilities remains valid. The collective agreement with USW covering the Contrecoeur Scrap Recycling Center employees, and the collective agreement with USW at Hamilton-East Wire, both renewed in 2016 remains valid. The agreement with USW at St-Patrick Wire renewed in 2017 for a six-year term also remains valid.
ArcelorMittal Mexico and the National Miners Union agreed to a new, one-year contract effective August 1, 2020. ArcelorMittal Mexico continues to explore opportunities with the union to improve workforce productivity, efficiency and competitiveness, including scheduling production stoppages due to the crisis caused by the decrease of demand and low market prices.
In Brazil, 2020 was a challenging year for working relationships
due to the new situations created by the COVID-19 Pandemic. In this respect, a total of 14 agreements were signed throughout 2020. Out of the 14 agreements, 9 Collective Emergency Agreements, expanding the validity of the original Agreements, were signed and they included themes such as: reduction of salary, suspension of the labor contracts, anticipated vacations and payment deferrals for vacation and 13th month salaries. Only one CLA was signed with no salary adjustment. ArcelorMittal also co-signed four CLAs together with other companies, three of which granted readjustments equal to inflation and one below inflation. The remaining CLAs will be negotiated in 2021.
For Tubarão and Vega do Sul, negotiations concluded between the Company and trade unions on December 1, 2020 and December 10, 2020, respectively, without salary increases. The inflation of 3.89% and 5.20%, respectively was not incorporated in salaries. However, the negotiations in Contagem (for ArcelorMittal Contagem), led to a salary increase at the current rate of inflation (3.89%) for all employees.
The annual negotiations with SINDEXTRA for Serra Azul in Brazil started at the end of 2020, similar to prior years.
In Argentina, the quarantine measures decreed by the government strongly affected the normal operation of the plants and the ability to meet customer demands. Salary increases granted to employees, which reached 21% during the year, only offset a part of the high levels of inflation of approximately 40% per year. In 2020, two different CLAs were effective for different categories of employees and regions. All CLAs have a duration of one year with different expiration periods; as such, negotiations were ongoing in Argentina throughout the year.
In Europe, ArcelorMittal France faced a strike in October 2020 in response to work requirements throughout the COVID-19 pandemic, including requests for hazard pay and continued pay in the event of idled production. A one-year salary agreement covering 2021 was finalized in December 2020 for France covering flat products entities and some AMDS entities. For other French entities, salary agreement negotiations will start early 2021. Regular meetings have been held with national representatives of the main trade unions to share information especially on the impact of the COVID-19 pandemic on ArcelorMittal's activities and employees, and also addressing the key challenges that the steel industry is facing. Due to the COVID-19 pandemic impacts, ArcelorMittal entities have implemented economic unemployment, mostly during the second and third quarter of 2020 and some entities have begun to implement a long-term scheme related to economic unemployment which has been developed by the government in order to support economic activity.
In Luxembourg, the collective labor agreement signed in June 2019 with the representatives from the two unions in the Company remains active. In September 2020, a transformation plan has been presented to both unions aimed at improving productivity with different measures with 3 to 5 year terms. On December 15, 2020, the principles of the plan were agreed.
In Belgium, the CLAs remain active. In 2020, social dialogue was especially focused on measures to be implemented in order to cope with the health crisis.
In Italy, employee relations were managed according to the agreement signed by unions on September 6, 2018 as part of the consolidation of ArcelorMittal Italia. The main focus was on the renewal of the Work Councils in all plants with a new system of social dialogue, as well as on local environment, health and safety topics, in particular for the Taranto plant. In December, ArcelorMittal agreed to an investment agreement to form a partnership with Invitalia with an updated industrial plan for ArcelorMittal Italia (see "Key transactions and events in 2020").
In Germany, the main focus was on adapting to the COVID-19 pandemic health and safety measures and production reductions to align with market demand. Social partners met twice in the social dialogue group (digital and one in person), comprised of both employer and employee representatives. Throughout the year, the union supported the Company in its demand for political framework conditions to support the steel industry in the needed transformation towards green steel.
ArcelorMittal Poland has started negotiations with trade unions for major changes to the CLA framework. Negotiations are expected to finish by May 2021. Official CLA 2020 negotiations started in January 2020 but were suspended due to the pandemic and consequently, no salary increase was agreed for 2020. The requests of the trade unions concerning 2021 were already received and the negotiations started in January 2021. Throughout 2020, regular meetings were held with the main trade unions in order to share all relevant information on various topics connected with the maintenance of ArcelorMittal Poland's production installations and temporary idling of primary operations in Kraków. On October 8, 2020, the Company announced its decision to permanently close the primary operations in Kraków (the blast furnace and steelmaking plant). This decision was driven by difficult market conditions and the impact of the pandemic on the steel industry in general. On November 9, 2020, an agreement with the trade unions on mitigating the social impact was signed. The agreement provides for permanent allocation of the employees from redundant plants to other work places throughout the Company, including the plants in Dąbrowa Górnicza. Those employees who are not interested in continuing their employment and are close to retirement could decide to leave the Company. Due to the COVID-19 pandemic, the Company signed an agreement
with the trade unions based on a governmental anti-crisis shield which allowed ArcelorMittal to reduce salaries for the economic unemployment period and to receive subsidies for employee remuneration from the government.
In Spain, ArcelorMittal is focused on promoting social dialogue. Accordingly, management and unions have consistently worked together in order to maintain social dialogue and find solutions to regain competitiveness. In 2019, a process was launched to negotiate a new framework agreement. A preliminary agreement was reached in July 2019, but it was not possible to obtain the support of a sufficient majority of the employee representatives to ratify it. Negotiations were therefore refocused on a site-by-site basis and, in this context, CLAs were signed at most of the sites in 2019 and 2020, with negotiations continuing at the other plants (Sagunto and Basauri). Additionally, the temporary layoff plan, in force since June 2009 and designed to adapt the available human resources to the levels of activity in the facilities, was extended up to the end of 2020, and, at the end of 2020, ArcelorMittal reached an agreement with the unions to extend the temporary layoff plan up to the end of 2021. It is being applied on a plant-by-plant basis depending on activity levels, and its implementation has been increased due to the market and economic situation in Spain.
Several virtual meetings were organized throughout the year in order to inform the European Works Council ("EWC") representatives about the health and safety and business situation of the Company's operations in Europe, including the EWC bureau (6), the Select Committee (2) and the Plenary Assembly.
In 2019, ArcelorMittal and the EWC began negotiations aimed at revising some of the elements of the agreement signed in 2007. The negotiations started in early November 2019 and were expected to be finalized in the first quarter of 2020. But because of the COVID-19 pandemic (lockdown and sanitary restrictions), the negotiations have been put on hold and will be relaunched in 2021.
The employee situation in Ukraine remained stable in 2020 at ArcelorMittal Kryvyi Rih despite the political environment and the growth of social activity of workers of other companies (e.g., a 44 day miners' strike, a one-day employee strike in support of miners as well as calls for protests from small trade unions).
In South Africa, out of the 6,622 employees of the company, 4,913 employees, who are part of the bargaining unit, are covered by a collective labor agreement concluded in 2018 with the recognized unions NUMSA and Solidarity (bargaining unit is 80% unionized) which expires in March 2021. The agreement included a remuneration adjustment of 7% in April 2020, the last of the multiyear agreement. With the spread of the COVID-19 virus, a national lockdown was announced in South Africa at the
end of March 2020 and resulted in the complete cessation of all primary operational activity across the company.
ArcelorMittal South Africa consequently implemented reduced working hours across the organization with employees subject to a 40-45% remuneration cut for the package category and the bargaining unit. All remuneration adjustments were frozen due to the significant impact of the lockdown on the business. With the easing of lockdown conditions and gradual restart of operations from May 2020, the employees’ remuneration was adjusted in alignment with business activity levels.
On June 18, 2020, ArcelorMittal South Africa commenced formal discussions about a reorganization and restructuring process with the two recognized unions. The discussions included proposals to resize the workforce and variabilized remuneration. After protracted consultations, the reorganization component of the discussions was closed in November and implementation commenced with a target of completion in early 2021.
On November 13, 2020, an illegal strike was organized by employees at the Vanderbijlpark operations without the support of labor unions and was primarily linked to the proposal to cut salaries and cancel the agreed remuneration adjustment for 2020. The strike was resolved on November 20, 2020 with an agreement to implement a 5% remuneration adjustment from November 1, 2020 for the bargaining unit with a principle commitment to extend the current collective agreement to March 2022 with these employees receiving only up to a 2% further adjustment in April 2021 under the condition of a consent with the directly affected unions. Solidarity confirmed a positive mandate in this regard and NUMSA is in process of finalizing their mandate from members. No remuneration adjustment was implemented for the package category for 2020 nor is an adjustment planned for 2021.
ArcelorMittal Temirtau's CLAs were expiring at the end of 2020. However, ArcelorMittal Temirtau and the trade unions agreed to extend the CLAs for one year and to begin negotiations in January 2021.
In 2020, the Mining segment maintained productive social dialogue and relationships with its trade unions and communities where there are operations. The CLA with USW in Canada was renegotiated in 2020 remains in force. The agreement with UWUL in Liberia remains in force and will be renegotiated in 2021.
Management share ownership
As of December 31, 2020, the aggregate beneficial share ownership of ArcelorMittal directors and senior management (20 individuals) totaled 533,044 ArcelorMittal shares (excluding shares beneficially owned by the Significant Shareholder)
representing 0.05% of the total issued share capital of ArcelorMittal. Other than Mr. Lakshmi Mittal, each director and member of senior management beneficially owns less than 1% of ArcelorMittal’s shares. See "Major shareholders” for the beneficial share ownership of the Significant Shareholder, Mr. Aditya Mittal and Ms. Vanisha Mittal Bhatia.
On April 27, 2015, ArcelorMittal adopted share ownership guidelines for its CEO. The share ownership policy aims to demonstrate to ArcelorMittal’ shareholders, the investing public and the Company’s employees, the commitment of the CEO to the Company and directly aligns his interests with those of the Company’s shareholders. Accordingly, the CEO should, within five years of the end of the current calendar year, own shares of the Company’s common shares at least equal to three times his
annual salary and hold the purchased shares for so long as he serves the Company.
In accordance with the Luxembourg Stock Exchange’s 10 Principles of Corporate Governance, independent non-executive members of ArcelorMittal's Board of Directors do not receive share options, RSUs or PSUs, and the policy of the Company is not to grant any share-based remuneration to members of the Board of Directors who are not executives of the Company.
See “Management and employees—Compensation” for a description of options, RSUs and PSUs held by members of ArcelorMittal’s senior management, including the Chairman and CEO.
The following tables summarize outstanding PSUs and RSUs granted to the members of the CEO Office and Executive Officers of ArcelorMittal for the last five years.
| | | | | | | | | | | | | | | | | | | | |
| PSUs granted in 2020 | PSUs granted in 2019 | PSUs granted in 2018 | PSUs granted in 2017 | | PSUs granted in 2016 |
| CEO office | 148,422 | | 172,517 | | 134,861 | | 90,084 | | | 306,536 | |
| Term (in years) | 3 | 3 | 3 | 3 | | 3+2 |
Vesting date1 | January 1, 2024 | January 1, 2023 | January 1, 2022 | January 1, 2020 - January 1, 2022 | | January 1, 2020 - January 1, 2022 |
1See “Directors, senior management and employees—Compensation—Remuneration—Long-term incentives plans”, for vesting conditions.
| | | | | | | | | | | | | | | | | | | | | | | | | | |
| PSUs granted in 2020 | RSUs granted in 2020 | PSUs granted in 2019 | PSUs granted in 2018 | PSUs granted in 2017 | | PSUs granted in 2016 |
| Executive Officers | 50,000 | | 15,169 | | 24,900 | | 100,500 | | 76,550 | | 44,720 | | | 149,920 | |
| Term (in years) | 3 | 1 | 3 | 3 | 3 | 3 | | 2 |
Vesting date1 | January 1, 2024 | December 14, 2021 | December 14, 2023 | January 1, 2023 | January 1, 2022 | January 1, 2021 | | January 1, 2021 |
1See note 8.3 to the consolidated financial statements, for vesting conditions.
See note 8.3 of the consolidated financial statements for a description of ArcelorMittal’s equity-settled share-based payments to certain employees, including stock options, RSUs and PSUs.
Glossary - definitions, terminology and principal subsidiaries
Definitions and terminology
Unless indicated otherwise, or the context otherwise requires, references herein to “ArcelorMittal”, “we”, “us”, “our”, “ArcelorMittal Group”, “Group” and the “Company” or similar terms are to ArcelorMittal S.A consolidated with its subsidiaries. References to “ArcelorMittal S.A.”, “ArcelorMittal parent” or “parent of ArcelorMittal” are to ArcelorMittal S.A., formerly known as Mittal Steel Company N.V. (“Mittal Steel”), having its registered office at 24-26, Boulevard d’Avranches, L-1160 Luxembourg, Grand Duchy of Luxembourg. ArcelorMittal’s principal operating subsidiaries, categorized by reporting segment and location, are listed below.
For the purposes of this annual report, the names of the following ArcelorMittal subsidiaries as abbreviated below are used where applicable.
| | | | | | | | | | | | | | |
| Name of Subsidiary | | Abbreviation | | Country |
| NAFTA | | | | |
| ArcelorMittal Dofasco G.P. | | ArcelorMittal Dofasco | | Canada |
| ArcelorMittal México S.A. de C.V. | | ArcelorMittal Mexico | | Mexico |
ArcelorMittal USA LLC 1 | | ArcelorMittal USA | | USA |
| ArcelorMittal Long Products Canada G.P. | | ArcelorMittal Long Products Canada | | Canada |
| | | | | |
| Brazil and neighboring countries ("Brazil") | | | | |
| ArcelorMittal Brasil S.A. | | ArcelorMittal Brasil | | Brazil |
| Acindar Industria Argentina de Aceros S.A. | | Acindar | | Argentina |
| | | | |
| Europe | | | | |
| ArcelorMittal France S.A.S. | | ArcelorMittal France | | France |
| ArcelorMittal Belgium N.V. | | ArcelorMittal Belgium | | Belgium |
| ArcelorMittal España S.A. | | ArcelorMittal España | | Spain |
| ArcelorMittal Flat Carbon Europe S.A. | | AMFCE | | Luxembourg |
| ArcelorMittal Poland S.A. | | ArcelorMittal Poland | | Poland |
| ArcelorMittal Eisenhüttenstadt GmbH | | ArcelorMittal Eisenhüttenstadt | | Germany |
| ArcelorMittal Bremen GmbH | | ArcelorMittal Bremen | | Germany |
| ArcelorMittal Méditerranée S.A.S. | | ArcelorMittal Méditerranée | | France |
| ArcelorMittal Belval & Differdange S.A. | | ArcelorMittal Belval & Differdange | | Luxembourg |
| ArcelorMittal Hamburg GmbH | | ArcelorMittal Hamburg | | Germany |
| ArcelorMittal Duisburg GmbH | | ArcelorMittal Duisburg | | Germany |
| ArcelorMittal International Luxembourg S.A. | | ArcelorMittal International Luxembourg | | Luxembourg |
ArcelorMittal Italia S.p.A. 2 | | ArcelorMittal Italia | | Italy |
| | | | |
| Africa and Commonwealth of Independent States ("ACIS") | | | | |
| ArcelorMittal South Africa Ltd. | | ArcelorMittal South Africa | | South Africa |
| JSC ArcelorMittal Temirtau | | ArcelorMittal Temirtau | | Kazakhstan |
| PJSC ArcelorMittal Kryvyi Rih | | ArcelorMittal Kryvyi Rih | | Ukraine |
| | | | |
| Mining | | | | |
| ArcelorMittal Mining Canada G.P. and ArcelorMittal Infrastructure Canada G.P. | | ArcelorMittal Mines and Infrastructure Canada ("AMMC") | | Canada |
| ArcelorMittal Liberia Ltd | | ArcelorMittal Liberia | | Liberia |
| | | | |
| | | | |
1.On December 9, 2020, the Company completed the sale of ArcelorMittal USA. See "—Key transactions and events in 2020" and note 2.3.1 to the consolidated financial statements.
2.On December 10, 2020, the Company signed a binding agreement with Invitalia, an Italian state-owned company, to form a public-private partnership between the parties. As a result, the carrying amount of the assets and liabilities of ArcelorMittal Italia was classified as held for sale at December 31, 2020 and will be accounted for under the equity method upon closing of the first investment (expected in the first quarter of 2021). See "Introduction—Key transactions and events in 2020" and note 2.3.2 for further information.
In addition, unless indicated otherwise, or the context otherwise requires, references in this annual report to abbreviations or terms shown below have the following definitions:
| | | | | | | | | | | | | | |
| ARS | Argentine Peso, the official currency of Argentina
| | GMB | the Group Management Board, the former senior management body which was replaced by the CEO Office as of January 1, 2016. The CEO Office, supported by five Executive Officers, makes up the Company’s senior management |
| Articles of Association | the amended and restated articles of association of ArcelorMittal, dated June 13, 2020 filed as Exhibit 1.1 hereto | | Greenfield project | the development of a new project |
| AUD$ or AUD | Australian dollars, the official currency of Australia | | Green steel | tonnes with an auditor verified certification of the CO2 savings achieved |
| Brownfield project | the expansion of an existing operation | | INR | Indian rupee, the official currency of India |
| C$ or CAD | Canadian dollars, the official currency of Canada | | Iron pellets | agglomerated ultra-fine iron ore particles of a size and quality suitable for use in steel-making processes |
| CEO Office | the Chairman and Chief Executive Officer, Mr. Lakshmi N. Mittal, and the President and Chief Financial Officer, Mr. Aditya Mittal | | Kilometers | measures of distance are stated in kilometers, each of which equals approximately 0.62 miles, or 1000 in meters, each of which equals approximately 3.28 feet |
| CIS | the countries of the Commonwealth of Independent States | | KZT | the Kazakhstani tenge, the official currency of Kazakhstan |
| CNY | Chinese yuan, the official currency of China | | Metallurgical coal | a broader term than coking coal that includes all coals used in steelmaking, such as coal used for the pulverized coal injection (“PCI”) process |
| Coking coal | coal that, by virtue of its coking properties, is used in the manufacture of coke, which is used in the steelmaking process | | PLN | Polish złoty, the offcial currency of Poland |
| Crude steel | the first solid steel product upon solidification of liquid steel, including ingots from conventional mills and semis (e.g., slab, billet and blooms) from continuous casters | | Production capacity | the annual production capacity of plant and equipment based on existing technical parameters as estimated by management |
| Downstream | finishing operations: flat products - the process after the production of hot-rolled coil/plates, and long products - the process after the production of blooms/billets (including production of bars, wire rods, SBQ, etc.) | | Ps or MXN | the Mexican peso, the official currency of the United Mexican States |
| DMTU or dmtu | dry metric tonne unit | | Real, reais or R$ | Brazilian reais, the official currency of Brazil |
| DRI | direct reduced iron, a metallic iron formed by removing oxygen from iron ore without the formation of, or passage through, a smelting phase. DRI can be used as feedstock for steel production | | ROM | run of mine - mined iron ore or coal to be fed to a preparation and/or concentration process |
| Energy coal | coal used as a fuel source in electrical power generation, cement manufacture and various industrial applications. Energy coal may also be referred to as steam or thermal coal | | Sales | include shipping and handling fees and costs billed to a customer in a sales transaction |
| Euro, euros, EUR or € | the official currency of the European Union (“EU”) member states participating in the European Monetary Union | | SBQ | special bar quality steel, a high-quality long product |
| Sinter | a metallic input used in the blast furnace steel-making process, which aggregates fines, binder and other materials into a coherent mass by heating without melting | | Significant Shareholder | a trust (HSBC Trustee (C.I.) Limited, as trustee), of which Mr. Lakshmi N. Mittal, Mrs. Usha Mittal and their children are the beneficiaries |
| Spanish Stock Exchanges | the stock exchanges of Madrid, Barcelona, Bilbao and Valencia | | UAH | Ukrainian hryvnia, the official currency of Ukraine |
| Steel products | finished and semi-finished steel products, and exclude raw materials (including those described under “upstream” below), direct reduced iron (“DRI”), hot metal, coke, etc. | | US$, $, dollars, USD or U.S. dollars | United States dollars, the official currency of the United States |
| Tons, net tons or ST | short tons are used in measurements involving steel products as well as crude steel, iron ore, iron ore pellets, DRI, hot metal, coke, coal, pig iron and scrap (a short ton is equal to 907.2 kilograms or 2,000 pounds) | | Upstream | operations that precede downstream steel-making, coking coal, coke, sinter, DRI, blast furnace, basic oxygen furnace (“BOF”), electric arc furnace (“EAF”), casters & hot rolling/plate mill |
| Metric Tonnes or MT | metric tonnes and are used in measurements involving steel products, as well as crude steel, iron ore, iron ore pellets, DRI, hot metal, coke, coal, pig iron and scrap (a metric tonne is equal to 1,000 kilograms or 2,204.62 pounds) | | Wet recoverable | a quantity of iron ore or coal recovered after the material from the mine has gone through a preparation and/or concentration process excluding drying |
| Executive Officers | those executives of the Company who are supporting the CEO Office and jointly with the CEO Office represent the senior management of the Company | | ZAR | South African rand, the official currency of the Republic of South Africa |
EXHIBITS
EXHIBIT INDEX
| | | | | |
| Exhibit | Description |
| Number |
| |
| 99.1 | |
| 99.2 | Consent of Gustavson Associates - Mexico (Las Truchas and San Jose) and available at Exhibit 99.2. |
| 99.3 | Consent of KAI Ltd. - Ukraine (ArecelorMittal Kryvyi Rih Open Pit) and available at Exhibit 99.3. |
| 99.4 | Consent of SRK Consulting (UK) Limited - iron ore and available at Exhibit 99.4. |
| 99.5 | Consent of SRK Consulting (UK) Limited - coal and available at Exhibit 99.5. |
| 99.6 | Consent of SRK Consulting (Canada) Inc. - Ukraine (ArcelorMittal Kryvyi Rih Open Pit) and available at Exhibit 99.6. |
| 99.7 | Consent of SRK Consulting (Canada) Inc. - AMMC and available at Exhibit 99.7. |
| 99.8 | |
| 99.9 | Consent of BMRC Geomining Solutions LLP and available at Exhibit 99.9. |
| 101.INS | XBRL Instance Document - the instance document does not appear in the Interactive Data File because its XBRL tags are embedded within the Inline XBRL document. |
| 101.SCH | XBRL Taxonomy Extension Schema Document
|
| 101.CAL | Inline XBRL Taxonomy Extension Calculation Linkbase Document
|
| 101.DEF | Inline XBRL Taxonomy Extension Definition Linkbase Document |
| 101.LAB | Inline XBRL Taxonomy Extension Label Linkbase Document |
| 101.PRE | Inline XBRL Taxonomy Extension Presentation Linkbase Document |
SIGNATURES
Pursuant to the requirements of the Securities Exchange Act of 1934, the registrant has duly caused this report to be signed on its behalf by the undersigned, thereunto duly authorized.
ARCELORMITTAL
Date: July 30, 2021
By: /s/ Henk Scheffer
Name: Henk Scheffer
Title: Company Secretary
| | | | | | | | |
Report of Independent Registered Public Accounting Firm 161 |
| | |
| | |
| | |
REPORT OF INDEPENDENT REGISTERED PUBLIC ACCOUNTING FIRM
To the shareholders and the Board of Directors of ArcelorMittal
Opinion on the Financial Statements
We have audited the accompanying consolidated statements of financial position of ArcelorMittal and subsidiaries (the "Company") as of December 31, 2020 and 2019, the related consolidated statements of operations, other comprehensive income, changes in equity, and cash flows, for each of the three years in the period ended December 31, 2020, and the related notes (collectively referred to as the "consolidated financial statements"). In our opinion, the consolidated financial statements present fairly, in all material respects, the financial position of the Company as of December 31, 2020 and 2019, and the results of its operations and its cash flows for each of the three years in the period ended December 31, 2020, in conformity with International Financial Reporting Standards (“IFRS”) as issued by the International Accounting Standards Board.
We have also audited, in accordance with the standards of the Public Company Accounting Oversight Board (United States) (“PCAOB”), the Company’s internal control over financial reporting as of December 31, 2020, based on criteria established in Internal Control — Integrated Framework (2013) issued by the Committee of Sponsoring Organizations of the Treadway Commission and our report dated March 8, 2021 (not presented herein), expressed an unqualified opinion on the Company’s internal control over financial reporting.
Adoption of New Accounting Standard
As discussed in Note 7 to the consolidated financial statements, effective January 1, 2019, the Company adopted IFRS 16 Leases using the modified retrospective transition approach.
Change in Composition of Reportable Segments
As discussed in Notes 1 and 3 to the consolidated financial statements, the Company has restated its segment disclosures to reflect a change in the composition of its reportable segments.
Basis for Opinion
These consolidated financial statements are the responsibility of the Company’s management. Our responsibility is to express an opinion on the Company’s consolidated financial statements based on our audits. We are a public accounting firm registered with the PCAOB and are required to be independent with respect to the Company in accordance with the U.S. federal securities laws and the applicable rules and regulations of the Securities and Exchange Commission and the PCAOB.
We conducted our audits in accordance with the standards of the PCAOB. Those standards require that we plan and perform the audit to obtain reasonable assurance about whether the consolidated financial statements are free of material misstatement, whether due to error or fraud. Our audits included performing procedures to assess the risks of material misstatement of the consolidated financial statements, whether due to error or fraud, and performing procedures that respond to those risks. Such procedures included examining, on a test basis, evidence regarding the amounts and disclosures in the consolidated financial statements. Our audits also included evaluating the accounting principles used and significant estimates made by management, as well as evaluating the overall presentation of the consolidated financial statements. We believe that our audits provide a reasonable basis for our opinion.
Critical Audit Matters
The critical audit matters communicated below are matters arising from the current-period audit of the consolidated financial statements that were communicated or required to be communicated to the audit committee and that (1) relate to accounts or disclosures that are material to the consolidated financial statements and (2) involved our especially challenging, subjective, or complex judgments. The communication of critical audit matters does not alter in any way our opinion on the consolidated financial statements, taken as a whole, and we are not, by communicating the critical audit matters below, providing separate opinions on the critical audit matters or on the accounts or disclosures to which they relate.
| | | | | |
162 Report of Independent Registered Public Accounting Firm |
Goodwill and Property, Plant and Equipment – Refer to Note 5.3 to the Consolidated Financial Statements
Critical Audit Matter Description
The Company’s evaluation of goodwill for impairment at the group of cash-generating units (“GCGU”) level, and property, plant and equipment (“PP&E”) as part of the relevant cash-generating unit (“CGU”), involves a comparison of the recoverable amount of each GCGU or CGU to its carrying amount. Recoverable amount is defined as the higher of fair value less costs of disposal and the value-in-use for each GCGU or CGU. The Company primarily used a discounted cash flow approach to determine the recoverable amounts, which required management to make significant assumptions related to estimates of future cash flows.
The goodwill balance as of December 31, 2020 was $3,992 million. There was no impairment of goodwill recorded as of and for the year ended December 31, 2020.
The PP&E balance of the Company as of December 31, 2020 was $30,622 million. The Company recognized a net reversal of impairment charges relating to PP&E amounting to $133 million for the year ended December 31, 2020. This was comprised of the reversal of previously recognized impairment charges of $660 million related to PP&E of ArcelorMittal USA upon classification as assets held for sale, impairment charges of $331 million related to PP&E of the plate business in the Europe segment upon classification as assets held for sale, impairment charges of $92 million and $104 million related to PP&E upon permanent closure of the coke plant at the Florange site and part of a blast furnace and steel plant in Krakow, respectively.
In developing the estimates of future cash flows of its GCGUs and CGUs, the Company considered its exposure to certain climate-related risks which could affect the recoverable amount of a GCGU or CGU. Estimates of future cash flows include near to medium term investment commitments for low emission technologies, as well as estimated costs expected to be incurred to acquire emission allowances. Estimates of future cash flows do not include longer-term investments which would be required to achieve carbon related goals given uncertainties around the requirements for such longer-term investments.
The assumptions used to estimate future cash flows are inherently uncertain in the context of the COVID-19 pandemic and require management judgment. The Company's process includes specific consideration given to the most recent short, medium and long-term price forecasts and discount rates consistent with external information, expected production and shipment volumes and updated development plans, operating costs and capital expenditure plans.
Key assumptions that had a significant impact on the Company’s estimate of the recoverable amounts of the relevant GCGUs and CGUs included volume of shipments and the discount rate. Changes in these assumptions could have a significant impact on the recoverable amount of a GCGU or CGU.
Given the significant judgments made by management to estimate the recoverable amounts of the relevant GCGUs and CGUs, performing audit procedures to evaluate the reasonableness of management’s estimates related to volume of shipments and the discount rate, specifically due to the sensitivity of these key assumptions, required a high degree of auditor judgment and an increased extent of effort, including the need to involve our fair value specialists.
How the Critical Audit Matter Was Addressed in the Audit
Our audit procedures related to volume of shipments and discount rate used by management to estimate future cash flows of the GCGUs and CGUs included the following, among others:
•We tested the effectiveness of internal controls over management’s valuation methodology and assumptions used, and estimates of future cash flows, including controls over the determination of the recoverable amount of the GCGUs and CGUs.
•We evaluated management’s ability to reasonably estimate future cash flows by comparing actual results to management’s historical forecasts.
•We evaluated the reasonableness of management’s estimates of future cash flows considering macroeconomic conditions, effects related to the COVID-19 pandemic and effects of climate-related matters, and the consistency of the estimates of future cash flows to internal and external communications of management and the Board of Directors and holding discussions with relevant personnel.
•With the assistance of our fair value specialists, we evaluated the reasonableness of the discount rate by:
| | | | | | | | |
Report of Independent Registered Public Accounting Firm 163 |
| | |
| | |
| | |
◦Evaluating the reasonableness of the methodology used and underlying source information used in the Company’s calculation of the discount rate.
◦Testing the mathematical accuracy of the calculation.
◦Developing an independent range of estimates and comparing the discount rate selected by management to our range.
•We evaluated the impact of any changes in management’s cash flow forecasts from October 1, 2020, the annual measurement date for testing impairment of goodwill, to December 31, 2020.
Deferred Tax Assets - Refer to Note 10.4 to the Consolidated Financial Statements
Critical Audit Matter Description
ArcelorMittal S.A. (parent company) has deferred tax assets primarily related to tax losses and other tax benefits carried forward. Under current tax law in Luxembourg, tax losses accumulated before January 1, 2017 do not expire and are recoverable against future taxable income. The valuation of deferred tax assets requires management to make significant estimates related to the future taxable income to be derived from entities within the Luxembourg tax integration and, as a result, the amounts of deferred tax assets expected to be realized by ArcelorMittal S.A. The assessment of the likelihood of future taxable profits being available, specifically the length of the forecast periods utilized, requires significant management judgment.
The deferred tax asset balance as of December 31, 2020 was $7,866 million, which is mainly related to the Luxembourg tax integration. Given the complexity of management’s valuation process, auditing management’s estimates of future taxable income and the determination of whether it is probable that the deferred tax assets will be realized involved a high degree of auditor judgment and an increased extent of effort, including the need to involve our tax specialists.
How the Critical Audit Matter Was Addressed in the Audit
Our audit procedures related to estimates of future taxable income and determination of whether it is probable that the deferred tax assets will be realized included the following, among others:
•We tested the effectiveness of internal controls over management’s valuation of deferred tax assets, including the controls over the assessment of the likelihood of future taxable profits being available and the length of the forecast periods.
•With the assistance of our tax specialists knowledgeable in Luxembourg-specific and international tax planning matters, we evaluated whether management’s estimates of future taxable income were consistent with available evidence related to management’s assessment of the likelihood of future taxable profits being available and the length of the forecast periods.
•We evaluated management’s ability to estimate future taxable income by comparing actual results to management’s historical forecasts, and considered the results in evaluating the current-year estimated future taxable income.
•We evaluated management’s proposed tax planning strategies, potential tax implications of material current year or future planned transactions (acquisitions, divestitures, finance and shareholding restructuring) and the related impact on management’s determination of the forecast periods and amounts of deferred tax assets recognized.
/s/ Deloitte Audit S.à r.l.
Luxembourg, Grand Duchy of Luxembourg
March 8, 2021(July 30, 2021 as to the impacts of the retrospective application of the change in the composition of reportable segments as described in Notes 1 and 3)
We have served as the Company’s auditor since 2007.
| | | | | | | | |
| | Consolidated financial statements 164 |
| ArcelorMittal and Subsidiaries | | |
| Consolidated Statements of Operations | |
| (millions of U.S. dollars, except share and per share data) | | |
| | | | | | | | | | | | | | | | | | | | | | | |
| | | Year ended December 31, |
| Notes | | 2020 | | 2019 | | 2018 |
| Sales | 4.1 and 12.1 | | 53,270 | | | 70,615 | | | 76,033 | |
(including 5,142, 7,442 and 8,259 of sales to related parties for 2020, 2019 and 2018, respectively) | | | | | | | |
| Cost of sales | 4.2 and 12.2 | | 49,138 | | | 68,887 | | | 67,025 | |
(including 1,151, 1,092 and 1,116 of purchases from related parties for 2020, 2019 and 2018, respectively) | | | | | | | |
Gross margin | | | 4,132 | | | 1,728 | | | 9,008 | |
Selling, general and administrative expenses | | | 2,022 | | | 2,355 | | | 2,469 | |
| Operating income / (loss) | | | 2,110 | | | (627) | | | 6,539 | |
Income from investments in associates, joint ventures and other investments | 2.6 | | 234 | | | 347 | | | 652 | |
Financing costs - net | 6.2 | | (1,256) | | | (1,652) | | | (2,210) | |
| Income / (loss) before taxes | | | 1,088 | | | (1,932) | | | 4,981 | |
| Income tax expense / (benefit) | 10.1 | | 1,666 | | | 459 | | | (349) | |
Net (loss) / income (including non-controlling interests) | | | (578) | | | (2,391) | | | 5,330 | |
Net (loss) / income attributable to equity holders of the parent | | | (733) | | | (2,454) | | | 5,149 | |
Net income attributable to non-controlling interests | | | 155 | | | 63 | | | 181 | |
Net (loss) / income (including non-controlling interests) | | | (578) | | | (2,391) | | | 5,330 | |
| | | | | | | | | | | | | | | | | | | | | | | |
| | | Year ended December 31, |
| | | 2020 | | 2019 | | 2018 |
| (Loss) / earning per common share (in U.S. dollars) | | | | | | | |
| Basic | | | (0.64) | | | (2.42) | | | 5.07 | |
| Diluted | | | (0.64) | | | (2.42) | | | 5.04 | |
| Weighted average common shares outstanding (in millions) | 11.3 | | | | | | |
| Basic | | | 1,140 | | | 1,013 | | | 1,015 | |
| Diluted | | | 1,140 | | | 1,013 | | | 1,021 | |
The accompanying notes are an integral part of these consolidated financial statements.
| | | | | | | | |
165 Consolidated financial statements | | |
| ArcelorMittal and Subsidiaries | | |
| Consolidated Statements of Other Comprehensive Income | | |
| (millions of U.S. dollars, except share and per share data) | | |
| | | | | | | | | | | | | | | | | | | | | | | | | | | | | | | | | | | |
| Year ended December 31, |
| 2020 | | 2019 | | 2018 |
| Net (loss) income (including non-controlling interests) | | | (578) | | | | | (2,391) | | | | | 5,330 | |
| Items that can be recycled to the consolidated statements of operations | | | | | | | | | | | |
| Derivative financial instruments: | | | | | | | | | | | |
| Gain arising during the period | 52 | | | | | 354 | | | | | 755 | | | |
| Reclassification adjustments for (gain) loss included in the consolidated statements of operations and financial position (basis adjustments) | (119) | | | | | (1,004) | | | | | 353 | | | |
| (67) | | | | | (650) | | | | | 1,108 | | | |
| Exchange differences arising on translation of foreign operations: | | | | | | | | | | | |
| (Loss) gain arising during the period | (1,388) | | | | | 177 | | | | | (1,996) | | | |
| Reclassification adjustments for gain included in the consolidated statements of operations | — | | | | | (105) | | | | | (15) | | | |
| (1,388) | | | | | 72 | | | | | (2,011) | | | |
| Share of other comprehensive income (loss) related to associates and joint ventures | | | | | | | | | | | |
| Gain (loss) arising during the period | 98 | | | | | (82) | | | | | (239) | | | |
| Reclassification adjustments for loss (gain) included in the consolidated statements of operations | — | | | | | 10 | | | | | (123) | | | |
| 98 | | | | | (72) | | | | | (362) | | | |
| Income tax benefit (expense) related to components of other comprehensive income (loss) that can be recycled to the consolidated statements of operations | 363 | | | | | 279 | | | | | (274) | | | |
| Items that cannot be recycled to the consolidated statements of operations | | | | | | | | | | | |
| Investments in equity instruments at FVOCI: | | | | | | | | | | | |
| Gain (loss) arising during the period | 486 | | | | | 28 | | | | | (603) | | | |
| Share of other comprehensive gain (loss) related to associates and joint ventures | 16 | | | | | 10 | | | | | (5) | | | |
| 502 | | | | | 38 | | | | | (608) | | | |
| Employee benefits - Recognized actuarial (losses) gains | (333) | | | | | (259) | | | | | 344 | | | |
| Share of other comprehensive (loss) income related to associates and joint ventures | (14) | | | | | — | | | | | — | | | |
| Income tax benefit (expense) related to components of other comprehensive income that cannot be recycled to the consolidated statements of operations | 13 | | | | | (32) | | | | | 228 | | | |
| Total other comprehensive (loss) income | (826) | | | | | (624) | | | | | (1,575) | | | |
| Total other comprehensive (loss) income attributable to: | | | | | | | | | | | |
| Equity holders of the parent | (781) | | | | | (666) | | | | | (1,478) | | | |
| Non-controlling interests | (45) | | | | | 42 | | | | | (97) | | | |
| | | (826) | | | | | (624) | | | | | (1,575) | |
| Total comprehensive (loss) income | | | (1,404) | | | | | (3,015) | | | | | 3,755 | |
| Total comprehensive (loss) income attributable to: | | | | | | | | | | | |
| Equity holders of the parent | | | (1,514) | | | | | (3,120) | | | | | 3,671 | |
| Non-controlling interests | | | 110 | | | | | 105 | | | | | 84 | |
| Total comprehensive (loss) income | | | (1,404) | | | | | (3,015) | | | | | 3,755 | |
The accompanying notes are an integral part of these consolidated financial statements.
| | | | | | | | |
| | Consolidated financial statements 166 |
| ArcelorMittal and Subsidiaries | | |
| Consolidated Statements of Financial Position | |
| (millions of U.S. dollars, except share and per share data) | | |
| | | | | | | | | | | | | | | | | |
| | | December 31, |
| Notes | | 2020 | | 2019 |
| ASSETS | | | | | |
| Current assets: | | | | | |
| Cash and cash equivalents | 6.1.3 | | 5,600 | | | 4,867 | |
| Restricted cash and other restricted funds | 6.1.3 | | 363 | | | 128 | |
Trade accounts receivable and other (including 269 and 298 from related parties at December 31, 2020 and 2019, respectively) | 4.3 and 12.1 | | 3,072 | | | 3,569 | |
| Inventories | 4.4 | | | 12,328 | | | 17,296 | |
| Prepaid expenses and other current assets | 4.5 | | | 2,281 | | | 2,756 | |
| Assets held for sale | 2.3.2 | | 4,329 | | | — | |
| Total current assets | | | 27,973 | | | 28,616 | |
| Non-current assets: | | | | | |
| Goodwill and intangible assets | 5.1 and 5.3 | | 4,312 | | | 5,432 | |
| Property, plant and equipment and biological assets | 5.2, 5.3 and 7 | | 30,622 | | | 36,231 | |
| Investments in associates and joint ventures | 2.4 | | | 6,817 | | | 6,529 | |
| Other investments | 2.5 | | | 2,980 | | | 772 | |
| Deferred tax assets | 10.4 | | | 7,866 | | | 8,680 | |
| Other assets | 4.6 | | | 1,482 | | | 1,648 | |
| Total non-current assets | | | 54,079 | | | 59,292 | |
| Total assets | | | 82,052 | | | 87,908 | |
| | | | | |
| LIABILITIES AND EQUITY | | | | | |
| Current liabilities: | | | | | |
| Short-term debt and current portion of long-term debt | 6.1.2.1 and 7 | | 2,507 | | | 2,869 | |
Trade accounts payable and other (including 272 and 251 to related parties at December 31, 2020 and 2019, respectively) | 4.7 and 12.2 | | 11,525 | | | 12,614 | |
| Short-term provisions | 9.1 | | 935 | | | 516 | |
| Accrued expenses and other liabilities | 4.8 | | | 4,197 | | | 4,910 | |
| Income tax liabilities | | | 464 | | | 378 | |
| Liabilities held for sale | 2.3.2 | | 3,039 | | | — | |
| Total current liabilities | | | 22,667 | | | 21,287 | |
| Non-current liabilities: | | | | | |
| Long-term debt, net of current portion | 6.1.2.2 and 7 | | 9,815 | | | 11,471 | |
| Deferred tax liabilities | 10.4 | | | 1,832 | | | 2,331 | |
| Deferred employee benefits | 8.2 | | | 4,656 | | | 7,343 | |
| Long-term provisions | 9.1 | | | 1,697 | | | 2,475 | |
| Other long-term obligations | 9.2 | | 1,148 | | | 2,518 | |
| Total non-current liabilities | | | 19,148 | | | 26,138 | |
| Total liabilities | | | 41,815 | | | 47,425 | |
| | | | | |
| Contingencies and commitments | 9.3 and 9.4 | | | | |
| Equity: | 11 | | | | | |
Common shares (no par value, 1,361,418,599 and 1,151,576,921 shares authorized, 1,102,809,772 and 1,021,903,623 shares issued, and 1,080,734,413 and 1,012,079,421 shares outstanding at December 31, 2020 and 2019, respectively) | | | 393 | | | 364 | |
Treasury shares (22,075,359 and 9,824,202 common shares at December 31, 2020 and 2019, respectively, at cost) | | | (538) | | | (602) | |
| Additional paid-in capital | | | 35,247 | | | 34,826 | |
| Mandatorily convertible notes | 11.2 | | 840 | | | — | |
| Retained earnings | | | 22,097 | | | 22,883 | |
| Reserves | | | (19,759) | | | (18,950) | |
| Equity attributable to the equity holders of the parent | | | 38,280 | | | 38,521 | |
| Non-controlling interests | | | 1,957 | | | 1,962 | |
| Total equity | | | 40,237 | | | 40,483 | |
| Total liabilities and equity | | | 82,052 | | | 87,908 | |
The accompanying notes are an integral part of these consolidated financial statements.
| | | | | | | | |
167 Consolidated financial statements | | |
| ArcelorMittal and Subsidiaries | | |
| Consolidated Statements of Changes in Equity | | |
| (millions of U.S. dollars, except share and per share data) | | |
| | | | | | | | | | | | | | | | | | | | | | | | | | | | | | | | | | | | | | | | | | | | | | | | | | | | | | | | | | | | | | | | | | | | | | | | | | | | | |
| | | | | | | | | | | | | Reserves | | | | | | |
| | | | | | | | | | | | | Items that can be recycled to the Consolidated Statements of Operations | | Items that cannot be recycled to the Consolidated Statements of Operations | | | | | | |
| Shares1 | | Share Capital | | Treasury Shares | | Mandatorily Convertible Notes | | Additional Paid-in Capital | | Retained Earnings | | Foreign
Currency
Translation
Adjustments | | Unrealized Gains (Losses) on Derivative Financial Instruments relating to CFH | | Unrealized Gains (Losses) on Investments in Equity Instruments at FVOCI | | Recognized actuarial (losses) gains | | Equity attributable to the equity holders of the parent | | Non-controlling interests | | Total
Equity |
| Balance at December 31, 2017 | 1,020 | | | 401 | | | (362) | | | — | | | 34,848 | | | 20,635 | | | (13,942) | | | (93) | | | 823 | | | (3,521) | | | 38,789 | | | 2,066 | | | 40,855 | |
| Net income (including non-controlling interests) | — | | | — | | | — | | | — | | | — | | | 5,149 | | | — | | | — | | | — | | | — | | | 5,149 | | | 181 | | | 5,330 | |
| Other comprehensive income (loss) | — | | | — | | | — | | | — | | | — | | | — | | | (2,174) | | | 732 | | | (608) | | | 572 | | | (1,478) | | | (97) | | | (1,575) | |
| Total comprehensive income (loss) | — | | | — | | | — | | | — | | | — | | | 5,149 | | | (2,174) | | | 732 | | | (608) | | | 572 | | | 3,671 | | | 84 | | | 3,755 | |
| Recognition of share-based payments (note 8.3) | — | | | — | | | 19 | | | — | | | 9 | | | — | | | — | | | — | | | — | | | — | | | 28 | | | — | | | 28 | |
| Dividend (notes 11.4 and 11.5) | — | | | — | | | — | | | — | | | — | | | (101) | | | — | | | — | | | — | | | — | | | (101) | | | (115) | | | (216) | |
| Share buyback (note 11.1) | (7) | | | — | | | (226) | | | — | | | — | | | — | | | — | | | — | | | — | | | — | | | (226) | | | — | | | (226) | |
| Change in share capital currency (note 11.1) | — | | | (37) | | | — | | | — | | | 37 | | | — | | | — | | | — | | | — | | | — | | | — | | | — | | | — | |
| Acquisition of non-controlling interests (note 11.5) | — | | | — | | | — | | | — | | | — | | | (55) | | | — | | | — | | | — | | | — | | | (55) | | | (13) | | | (68) | |
| Other movements | 1 | | | — | | | — | | | — | | | — | | | (17) | | | — | | | — | | | (3) | | | — | | | (20) | | | — | | | (20) | |
| Balance at December 31, 2018 | 1,014 | | | 364 | | | (569) | | | — | | | 34,894 | | | 25,611 | | | (16,116) | | | 639 | | | 212 | | | (2,949) | | | 42,086 | | | 2,022 | | | 44,108 | |
| Net (loss) income (including non-controlling interests) | — | | | — | | | — | | | — | | | — | | | (2,454) | | | — | | | — | | | — | | | — | | | (2,454) | | | 63 | | | (2,391) | |
| Other comprehensive income (loss) | — | | | — | | | — | | | — | | | — | | | — | | | (9) | | | (404) | | | 38 | | | (291) | | | (666) | | | 42 | | | (624) | |
| Total comprehensive income (loss) | — | | | — | | | — | | | — | | | — | | | (2,454) | | | (9) | | | (404) | | | 38 | | | (291) | | | (3,120) | | | 105 | | | (3,015) | |
| Recognition of share-based payments (note 8.3) | 2 | | | — | | | 57 | | | — | | | (68) | | | — | | | — | | | — | | | — | | | — | | | (11) | | | — | | | (11) | |
| Dividend (notes 11.4 and 11.5) | — | | | — | | | — | | | — | | | — | | | (203) | | | — | | | — | | | — | | | — | | | (203) | | | (154) | | | (357) | |
| Share buyback (note 11.1) | (4) | | | — | | | (90) | | | — | | | — | | | — | | | — | | | — | | | — | | | — | | | (90) | | | — | | | (90) | |
Sharing of cash flow hedge (gain) from INR/USD hedging
programs related to AMNS India (note 2.4.1) | — | | | — | | | — | | | — | | | — | | | (141) | | | — | | | — | | | — | | | — | | | (141) | | | — | | | (141) | |
Transfer of fair value reserve of equity instruments designated
at FVOCI (note 2.5) | — | | | — | | | — | | | — | | | — | | | 70 | | | — | | | — | | | (70) | | | — | | | — | | | — | | | — | |
| Other movements | — | | | — | | | — | | | — | | | — | | | — | | | — | | | — | | | — | | | — | | | — | | | (11) | | | (11) | |
| Balance at December 31, 2019 | 1,012 | | | 364 | | | (602) | | | — | | | 34,826 | | | 22,883 | | | (16,125) | | | 235 | | | 180 | | | (3,240) | | | 38,521 | | | 1,962 | | | 40,483 | |
| Net (loss) income (including non-controlling interests) | — | | | — | | | — | | | — | | | — | | | (733) | | | — | | | — | | | — | | | — | | | (733) | | | 155 | | | (578) | |
| Other comprehensive income (loss) | — | | | — | | | — | | | — | | | — | | | — | | | (928) | | | (6) | | | 431 | | | (278) | | | (781) | | | (45) | | | (826) | |
| Total comprehensive income (loss) | — | | | — | | | — | | | — | | | — | | | (733) | | | (928) | | | (6) | | | 431 | | | (278) | | | (1,514) | | | 110 | | | (1,404) | |
| Offering of common shares (note 11.1) | 81 | | | 29 | | | — | | | — | | | 711 | | | — | | | — | | | — | | | — | | | — | | | 740 | | | — | | | 740 | |
| Mandatorily convertible notes (note 11.2) | 23 | | | — | | | 549 | | | 840 | | | (305) | | | (28) | | | — | | | — | | | — | | | — | | | 1,056 | | | — | | | 1,056 | |
| Recognition of share-based payments (note 8.3) | 1 | | | — | | | 15 | | | — | | | 15 | | | — | | | — | | | — | | | — | | | — | | | 30 | | | — | | | 30 | |
| Dividend (notes 11.4 and 11.5) | — | | | — | | | — | | | — | | | — | | | — | | | — | | | — | | | — | | | — | | | — | | | (162) | | | (162) | |
| Share buyback (note 11.1) | (36) | | | — | | | (500) | | | — | | | — | | | — | | | — | | | — | | | — | | | — | | | (500) | | | — | | | (500) | |
Transfer of fair value reserve of equity instruments designated
at FVOCI (note 2.5) | — | | | — | | | — | | | — | | | — | | | 28 | | | — | | | — | | | (28) | | | — | | | — | | | — | | | — | |
| Mandatorily convertible bonds extension (note 11.2) | — | | | — | | | — | | | — | | | — | | | — | | | — | | | — | | | — | | | — | | | — | | | 53 | | | 53 | |
| Other movements | — | | | — | | | — | | | — | | | — | | | (53) | | | — | | | — | | | — | | | — | | | (53) | | | (6) | | | (59) | |
| Balance at Balance at December 31, 2020 | 1,081 | | | 393 | | | (538) | | | 840 | | | 35,247 | | | 22,097 | | | (17,053) | | | 229 | | | 583 | | | (3,518) | | | 38,280 | | | 1,957 | | | 40,237 | |
1.Amounts are in millions of shares (treasury shares are excluded).
The accompanying notes are an integral part of these consolidated financial statements.
| | | | | | | | |
| | Consolidated financial statements 168 |
| ArcelorMittal and Subsidiaries | | |
| Consolidated Statements of Cash Flows | |
| (millions of U.S. dollars, except share and per share data) | | |
| | | | | | | | | | | | | | | | | | | | | | | | | | |
| | | Year ended December 31, | | | |
| Notes | | 2020 | | 2019 | | 2018 | | | |
| Operating activities: | | | | | | | | | | |
| Net (loss) income (including non-controlling interests) | | | (578) | | | (2,391) | | | 5,330 | | | | |
| Adjustments to reconcile net income to net cash provided by operations: | | | | | | | | | | |
Depreciation and amortization | 5.1 and 5.2 | | 2,960 | | | 3,067 | | | 2,799 | | | | |
| Impairment (reversal of impairment) | 5.3 | | (133) | | | 1,927 | | | 994 | | | | |
| Bargain purchase gain | 2.2.4 | | — | | | — | | | (209) | | | | |
Interest expense | 6.2 | | 477 | | | 695 | | | 687 | | | | |
Interest income | 6.2 | | (56) | | | (88) | | | (72) | | | | |
Income tax expense/ (benefit) | 10.1 | | 1,666 | | | 459 | | | (349) | | | | |
| | | | | | | | | | |
Remeasurement loss relating to US deferred employee benefits | 8.2 | | — | | | — | | | 15 | | | | |
Net gain on disposal of subsidiaries | 2.3.1 | | (1,460) | | | (101) | | | (16) | | | | |
Income from investments in associates, joint ventures and other investments | 2.6 | | (234) | | | (347) | | | (652) | | | | |
| | | | | | | | | | |
Provision on pensions and OPEB | 8.2 | | 430 | | | 435 | | | 463 | | | | |
Change in fair value adjustment on call option on mandatory convertible bonds and pellet purchase agreement | 6.2 | | 143 | | | 320 | | | 572 | | | | |
| | | | | | | | | | |
Unrealized foreign exchange effects | | | 321 | | | 7 | | | 152 | | | | |
Write-downs (reversal) of inventories to net realizable value, provisions and other non-cash operating expenses net | 4.4 | | 597 | | | 818 | | | 789 | | | | |
| Changes in assets and liabilities that provided (required) cash, net of acquisitions and disposals: | | | | | | | | | | |
Trade accounts receivable and other | | | (76) | | | 964 | | | (646) | | | | |
Inventories | 4.4 | | 1,786 | | | 2,469 | | | (4,652) | | | | |
Trade accounts payable and other | 4.7 | | (214) | | | (1,236) | | | 914 | | | | |
Interest paid | | | (604) | | | (723) | | | (749) | | | | |
Interest received | | | 69 | | | 118 | | | 67 | | | | |
Income taxes paid | | | (705) | | | (484) | | | (629) | | | | |
Dividends received from associates, joint ventures and other investments | | | 189 | | | 370 | | | 360 | | | | |
Cash contributions to plan assets and benefits paid for pensions and OPEB | 8.2 | | (332) | | | (348) | | | (472) | | | | |
VAT and other amounts received (paid) from/to public authorities | | | 400 | | | 196 | | | (544) | | | | |
Other working capital and provisions movements | | | (564) | | | (110) | | | 44 | | | | |
| Net cash provided by operating activities | | | 4,082 | | | 6,017 | | | 4,196 | | | | |
| Investing activities: | | | | | | | | | | |
Purchase of property, plant and equipment and intangibles | | | (2,439) | | | (3,572) | | | (3,305) | | | | |
Disposals of net assets of subsidiaries, net of cash disposed of 7, 38 and 1 in 2020, 2019 and 2018, respectively | 2.3.1 | | 497 | | | 514 | | | 65 | | | | |
Acquisitions of net assets of subsidiaries, net of cash acquired of —, 3 and 13 in 2020, 2019 and 2018, respectively | 2.2.4 | | — | | | (46) | | | (39) | | | | |
| | | | | | | | | | |
| Lease installments and capital expenditure refund relating to ArcelorMittal Italia acquisition | | | (139) | | | (200) | | | — | | | | |
| Acquisition of AMNS India | 2.4.1 | | — | | | (755) | | | — | | | | |
Acquisition of Uttam Galva and KSS Petron debt | 4.6 | | — | | | (83) | | | (1,001) | | | | |
| Cash collateral for the TSR receivables retained in ArcelorMittal USA after disposal | 6.1.3 | | (260) | | | — | | | — | | | | |
Disposals of associates and joint ventures | 2.4.1 | | — | | | — | | | 220 | | | | |
Disposals of financial assets | 2.5 and 2.6 | | 59 | | | 196 | | | 44 | | | | |
Other investing activities net | | | 271 | | | 122 | | | 257 | | | | |
| Net cash used in investing activities | | | (2,011) | | | (3,824) | | | (3,759) | | | | |
| Financing activities: | | | | | | | | | | |
| Proceeds from mandatorily convertible subordinated notes | 11.2 | | 1,237 | | | — | | | — | | | | |
Acquisition of non-controlling interests | | | — | | | — | | | (68) | | | | |
| (Payments)/ proceeds from put and call option on shares | 2.3.2 | | (135) | | | — | | | 115 | | | | |
Proceeds from short-term debt | 6.1.3 | | 430 | | | 600 | | | 2,319 | | | | |
Proceeds from long-term debt | 6.1.3 | | 323 | | | 5,772 | | | 1,138 | | | | |
Payments of short-term debt | 6.1.3 | | (1,503) | | | (1,811) | | | (2,871) | | | | |
Payments of long-term debt | 6.1.3 | | (1,645) | | | (3,299) | | | (798) | | | | |
Equity offering | 11.1 | | 740 | | | — | | | — | | | | |
Share buyback | 11.1 | | (500) | | | (90) | | | (226) | | | | |
Dividends paid (includes 181, 129 and 119 of dividends paid to non-controlling shareholders in 2020, 2019 and 2018, respectively) | | | (181) | | | (332) | | | (220) | | | | |
Payment of principal portion of lease liabilities and other financing activities | 6.1.3 | | (264) | | | (326) | | | (78) | | | | |
| Net cash (used in) provided by financing activities | | | (1,498) | | | 514 | | | (689) | | | | |
| Net increase (decrease) in cash and cash equivalents | | | 573 | | | 2,707 | | | (252) | | | | |
Effect of exchange rate changes on cash | | | 163 | | | (22) | | | (140) | | | | |
| Cash and cash equivalents: | | | | | | | | | | |
| At the beginning of the year | | | 4,867 | | | 2,172 | | | 2,574 | | | | |
| Reclassification of the period-end cash and cash equivalents (to) from held for sale | 2.3 | | (3) | | | 10 | | | (10) | | | | |
| At the end of the year | | | 5,600 | | | 4,867 | | | 2,172 | | | | |
The accompanying notes are an integral part of these consolidated financial statements.
| | |
169 Consolidated financial statements |
SUMMARY OF NOTES TO CONSOLIDATED FINANCIAL STATEMENTS
| | | | | |
| NOTE 1: ACCOUNTING PRINCIPLES |
| 1.1 | Basis of presentation |
| 1.2 | Use of judgment and estimates |
| 1.3 | Accounting standards applied |
| NOTE 2: SCOPE OF CONSOLIDATION |
| 2.1 | Basis of consolidation |
| 2.2 | Investments in subsidiaries |
| 2.3 | Divestments and assets held for sale |
| 2.4 | Investments in associates and joint arrangements |
| 2.5 | Other investments |
| 2.6 | Income (loss) from investments in associates, joint ventures and other investments |
| NOTE 3: SEGMENT REPORTING |
| 3.1 | Reportable segments |
| 3.2 | Geographical information |
| 3.3 | Sales by type of products |
| 3.4 | Disaggregated revenue |
| NOTE 4: OPERATING DATA |
| 4.1 | Revenue |
| 4.2 | Cost of sales |
| 4.3 | Trade accounts receivable and other |
| 4.4 | Inventories |
| 4.5 | Prepaid expenses and other current assets |
| 4.6 | Other assets |
| 4.7 | Trade accounts payable and other |
| 4.8 | Accrued expenses and other liabilities |
| NOTE 5: GOODWILL, INTANGIBLE AND TANGIBLE ASSETS |
| 5.1 | Goodwill and intangible assets |
| 5.2 | Property, plant and equipment and biological assets |
| 5.3 | Impairment of intangible assets, including goodwill, and tangible assets |
| NOTE 6: FINANCING AND FINANCIAL INSTRUMENTS |
| 6.1 | Financial assets and liabilities |
| 6.2 | Financing costs - net |
| 6.3 | Risk management policy |
| NOTE 7: LEASES |
| NOTE 8: PERSONNEL EXPENSES AND DEFERRED EMPLOYEE BENEFITS |
| 8.1 | Employees and key management personnel |
| 8.2 | Deferred employee benefits |
| 8.3 | Share-based payments |
| NOTE 9: PROVISIONS, CONTINGENCIES AND COMMITMENTS |
| 9.1 | Provisions overview |
| 9.2 | Other long-term obligations |
| 9.3 | Environmental liabilities, asset retirement obligations and legal proceedings |
| 9.4 | Commitments |
| NOTE 10: INCOME TAXES |
| 10.1 | Income tax expense (benefit) |
| 10.2 | Income tax recorded directly in equity and/or other comprehensive income |
| 10.3 | Uncertain tax positions |
| 10.4 | Deferred tax assets and liabilities |
| 10.5 | Tax losses, tax credits and other tax benefits carried forward |
| NOTE 11: EQUITY |
| 11.1 | Share details |
| 11.2 | Equity instruments and hybrid instruments |
| 11.3 | Earnings per common share |
| 11.4 | Dividends |
| 11.5 | Non-controlling interests |
| NOTE 12: RELATED PARTIES |
| 12.1 | Sales and trade receivables |
| 12.2 | Purchases and trade payables |
| 12.3 | Other transactions with related parties |
| NOTE 13: SUBSEQUENT EVENTS |
|
| | |
170 Consolidated financial statements |
NOTE 1: ACCOUNTING PRINCIPLES
ArcelorMittal (“ArcelorMittal” or the “Company”), together with its subsidiaries, owns and operates steel manufacturing and mining facilities in Europe, North and South America, Asia and Africa. Collectively, these subsidiaries and facilities are referred to in the consolidated financial statements as the “operating subsidiaries”. These consolidated financial statements were authorized for issuance on March 8, 2021 by the Company’s Board of Directors.
The Company has re-issued previously issued consolidated financial statements for the three year period ended December 31, 2020 and retrospectively adjusted them to reflect the changes in reportable segments. The Company has not adjusted for any other matters between the date of initial issuance and July 30, 2021, the date that these financial statements were re-issued.
1.1 Basis of presentation
The consolidated financial statements have been prepared on a historical cost basis, except for equity instruments and certain trade receivables at fair value through other comprehensive income ("FVOCI"), financial assets at fair value through profit or loss ("FVTPL"), derivative financial instruments, biological assets and certain assets and liabilities held for sale, which are measured at fair value less cost to sell, inventories, which are measured at the lower of net realizable value or cost, and the financial statements of the Company’s Venezuelan tubular production facilities Industrias Unicon CA (“Unicon”) and the Company's Argentinian operation Acindar Industria Argentina de Aceros S.A. ("Acindar"), for which hyperinflationary accounting is applied (see note 2.2.2). The consolidated financial statements have been prepared in accordance with International Financial Reporting Standards (“IFRS”) as issued by the International Accounting Standards Board (“IASB”) and as adopted by the European Union and are presented in U.S. dollars with all amounts rounded to the nearest million, except for share and per share data.
1.2 Use of judgment and estimates
The preparation of consolidated financial statements in conformity with IFRS recognition and measurement principles and, in particular, making the critical accounting judgments requires the use of estimates and assumptions that affect the reported amounts of assets, liabilities, revenues and expenses. Management reviews its estimates on an ongoing basis using currently available information. Changes in facts and circumstances or obtaining new information or more experience may result in revised estimates, and actual results could differ from those estimates.
The following summary provides further information about the Company’s critical accounting policies under which significant judgments, estimates and assumptions are made. It should be read in conjunction with the notes mentioned in the summary:
•Deferred tax assets (note 10.4): The Company assesses the recoverability of deferred tax assets based on future taxable income projections, which are inherently uncertain and may be subject to changes over time. Judgment is required to assess the impact of such changes on the measurement of these assets and the time frame for their utilization. In addition, the Company applies judgment to recognize income tax liabilities when they are probable and can be reasonably estimated depending on the interpretation, which may be uncertain, of applicable tax laws and regulations. ArcelorMittal periodically reviews its estimates to reflect changes in facts and circumstances.
•Provisions for pensions and other post-employment benefits (note 8.2): Benefit obligations and plan assets can be subject to significant volatility, in particular due to changes in market conditions and actuarial assumptions. Such assumptions differ by plan, take local conditions into account and include discount rates, expected rates of compensation increases, health care cost trend rates, mortality and retirement rates. They are determined following a formal process involving the Company's expertise and independent actuaries. Assumptions are reviewed annually and adjusted following actuarial and experience changes.
•Provisions (note 9): Provisions, which result from legal or constructive obligations arising as a result of past events, are recognized based on the Company's, and in certain instances, third-party's best estimate of costs when the obligation arises. They are reviewed periodically to take into consideration changes in laws and regulations and underlying facts and circumstances.
•Impairment of tangible and intangible assets, including goodwill (note 5.3): In the framework of the determination of the recoverable amount of assets, the estimates, judgments and assumptions applied for the value in use calculations relate primarily to growth rates, expected changes to average selling prices, shipments and direct costs. Assumptions for average selling prices and shipments are based on historical experience and expectations of future changes in the market. Discount rates are reviewed annually.
•Business combinations (note 2.2.3): Assets acquired and liabilities assumed as part of a business combination are recorded at their acquisition-date fair values. Similarly,
| | |
Consolidated financial statements 171 |
| (millions of U.S. dollars, except share and per share data) |
consideration including consideration receivable and contingent consideration is measured at fair value. Determining the fair value of identifiable assets and liabilities requires the use of valuation techniques which may include judgment and estimates and which may affect the allocation of the amount of consideration paid to the assets and liabilities acquired and goodwill or gain from a bargain purchase recorded as part of the business combination.
•Financial instruments (note 6.1.5) and financial amounts receivable (note 4.6): Certain of the Company's financial instruments are classified as Level 3 as they include unobservable inputs. In particular, the Company uses estimates to compute unobservable historical volatility based on movements of stock market prices for the fair valuation of the call option on the 1,000 mandatory convertible bonds and unobservable inputs such as discounted cash flow model for the fair valuation of financial amounts receivable relating to Uttam Galva and KSS Petron.
•Mining reserve estimates (note 5.2): Proven iron ore and coal reserves are those quantities whose recoverability can be determined with reasonable certainty from a given date forward and under existing government regulations, economic and operating conditions; probable reserves have a lower degree of assurance but high enough to assume continuity between points of observation. Their estimates and the estimates of mine life have been prepared by ArcelorMittal experienced engineers and geologists and detailed independent verifications of the methods and procedures are conducted on a regular basis by external consultants. Reserves are updated annually and calculated using a reference price duly adjusted for quality, ore content, logistics and other considerations. In order to estimate reserves, estimates are required for a range of geological, technical and economic factors, including quantities, grades, production techniques, recovery rates, production costs, transport costs, commodity demand, commodity prices and exchange rates. Estimating the quantity and/or grade of reserves requires the size, shape and depth of ore bodies to be determined by analyzing geological data such as drilling samples. This process may require complex and difficult geological judgments to interpret the data. Because the economic assumptions used to estimate reserves change from period to period, and because additional geological data is generated during the course of operations, estimates of reserves may change from period to period.
1.3 Accounting standards applied
1.3.1 Adoption of new IFRS standards, amendments and interpretations applicable from January 1, 2020
On January 1, 2020, the Company adopted the following amendments which did not have a material impact on the consolidated financial statements of the Company:
•Revised "Conceptual Framework for Financial Reporting" published by the IASB on March 29, 2018, which includes revised definitions of an asset and a liability as well as new guidance on measurement and derecognition, presentation and disclosure and must be applied retrospectively unless retrospective application would be impracticable or involve undue cost or effort.
•Amendments to IFRS 3 "Business Combinations" issued by the IASB on October 22, 2018, which include the definition of a business aimed at resolving the difficulties that arise when an entity determines whether it has acquired a business or a group of assets.
•Amendments to IAS 1 "Presentation of Financial Statements" and IAS 8 "Accounting Policies, Changes in Accounting Estimates and Errors" issued by the IASB on October 31, 2018 to clarify the definition of ‘material’ and to align the definition used in the Conceptual Framework and the standards themselves.
•Interest Rate Benchmark Reform, amendments to IFRS 9, IAS 39 and IFRS 7 published by the IASB on September 26, 2019. These amendments provide relief from the specific hedge accounting requirements and must be applied retrospectively, so that entities would apply those hedge accounting requirements (highly probable forecast transaction and prospective effectiveness test under IFRS 9 which is applied by the Company) assuming that the interest rate benchmark is not altered as a result of the interest rate benchmark reform.
On June 1, 2020, the Company adopted the amendment to IFRS 16 "Leases" issued by the IASB on May 28, 2020 addressing COVID-19 related rent concessions. The amendment allows entities to elect, as a practical expedient and if certain criteria are met, not to assess whether a rent concession is a lease modification, therefore recognizing the change in lease expense immediately in the statement of profit or loss. ArcelorMittal elected to apply the practical expedient and applied it retrospectively in accordance with IAS 8, without any restatement of prior period figures. The amendment did not
| | |
172 Consolidated financial statements |
have a material impact on the consolidated financial statements of the Company.
1.3.2 New IFRS standards, amendments and interpretations applicable from 2021 onward
On May 18, 2017, the IASB issued IFRS 17 "Insurance Contracts", which is designed to achieve the goal of a consistent, principle-based accounting for insurance contracts. IFRS 17 requires insurance liabilities to be measured at a current fulfillment value and provides a more uniform measurement and presentation approach for all insurance contracts. IFRS 17 supersedes IFRS 4 "Insurance Contracts" and related interpretations. On June 25, 2020, the IASB issued amendments to IFRS 17, including a deferral of the effective date to periods beginning on or after January 1, 2023 and should be applied retrospectively unless impracticable, with earlier adoption permitted if both IFRS 15 "Revenue from Contracts with Customers" and IFRS 9 "Financial Instruments" have also been applied. The Company does not expect that the adoption of this standard, amendments and related interpretations will have a material impact to its consolidated financial statements.
On January 23, 2020, the IASB issued narrow-scope amendments to IAS 1 to clarify how to classify debt and other liabilities as current or non-current. The amendments aim to promote consistency in applying the requirements by helping companies determine whether, in the statement of financial position, debt and other liabilities with an uncertain settlement date should be classified as current (due or potentially due to be settled within one year) or non-current. The amendments include clarifying the classification requirements for debt a company might settle by converting it into equity. On July 15, 2020, the IASB postponed the effective date of the amendments. The amendments are effective for annual periods beginning on or after January 1, 2023 and are to be applied retrospectively, with early adoption permitted. On February 12, 2021, the IASB issued amendments to IAS 1 and IFRS Practice Statement 2. The amendments are intended to help preparers in deciding which accounting policies to disclose in their financial statements and gives further clarity on the materiality assessment of accounting policies. The amendments are effective for annual periods beginning on or after January 1, 2023 and are to be applied prospectively, with early adoption permitted.The Company does not expect that the adoption of these amendments will have a material impact to its consolidated financial statements.
On May 14, 2020, the IASB issued the following narrow-scope amendments :
•Amendments to IFRS 3 "Business Combinations" updated the reference to the Conceptual Framework for
financial reporting, without changing the accounting requirements for business combinations.
•Amendments to IAS 16 "Property, Plant and Equipment" prohibit deducting from the cost of an item of property, plant and equipment any proceeds from selling items produced while bringing that asset to the location and condition necessary for it to be capable of operating in the manner intended by management. Instead, an entity recognizes the proceeds from selling such items and related cost in profit or loss. The amendments are applied retrospectively,
•Amendments to IAS 37 "Provisions, Contingent Liabilities and Contingent Assets" clarify that the cost of fulfilling a contract comprises the costs a company includes when assessing whether a contract will be loss-making are costs that relate directly to the contract. Costs that relate directly to a contract can either be incremental costs of fulfilling that contract or an allocation of other costs that relate directly to fulfilling the contract.
•Minor amendments as part of the Annual Improvements 2018-2020 to:
•IFRS 1 "First-time Adoption of International Financial Reporting Standards" related to cumulative translation differences for a subsidiary as a first time user.
•IFRS 9 "Financial Instruments" related to which fees an entity includes when it applies the ‘10 per cent’ test in assessing whether to derecognize a financial liability.
▪IFRS 16 "Leases" removing the reimbursement of leasehold improvements by the lessor from illustrative example 13 in order to resolve any potential confusion regarding the treatment of lease incentives and
▪IAS 41 "Agriculture" removing the requirement for entities to exclude taxation cash flows when measuring the fair value of a biological asset using a present value technique to ensure consistency with the requirements in IFRS 13.
The Company does not expect that the adoption of these amendments will have a material impact to its consolidated financial statements which are effective for annual periods beginning on or after January 1, 2022.
On June 25, 2020, the IASB issued amendments to IFRS 4 Insurance contracts" which provides an extension of the temporary exemption from applying IFRS 9 until January 1,
| | |
Consolidated financial statements 173 |
| (millions of U.S. dollars, except share and per share data) |
2023 in order to align with the effective date of IFRS 17 "Insurance Contracts".
On August 27, 2020, the IASB published Phase 2 (Amendments to IFRS 9, IAS 39, IFRS 7, IFRS 4 and IFRS 16) of the Interest Rate Benchmark Reform. The amendments complement those issued in 2019 described above and focus on the effects on financial statements when a company replaces the old interest rate benchmark with an alternative benchmark rate as a result of the reform.
The amendments in this final phase relate to:
•changes to contractual cash flows—a company will not have to derecognize or adjust the carrying amount of financial instruments for changes required by the reform, but will instead update the effective interest rate to reflect the change to the alternative benchmark rate;
•hedge accounting—a company will not have to discontinue its hedge accounting solely because it makes changes required by the reform, if the hedge meets other hedge accounting criteria; and
•disclosures—a company will be required to disclose information about new risks arising from the reform and how it manages the transition to alternative benchmark rates.
The amendments are effective for annual periods beginning on or after January 1, 2021 and are to be applied retrospectively, with early adoption permitted. The Company does not expect that the adoption of these amendments will have a material impact to its consolidated financial statements.
On February 12, 2021, the IASB issued amendments to IAS 8. The amendments are intended to help entities distinguish between accounting policies and accounting estimates. The amendments are effective for annual periods beginning on or after January 1, 2023 and changes in accounting policies or accounting estimates on or after the start of that period with early adoption permitted. The Company does not expect that the adoption of these amendments will have a material impact to its consolidated financial statements.
The Company does not plan to early adopt the new accounting standards, amendments and interpretations.
NOTE 2: SCOPE OF CONSOLIDATION
2.1 Basis of consolidation
The consolidated financial statements include the accounts of the Company, its subsidiaries and its interests in associated companies and joint arrangements. Subsidiaries are consolidated from the date the Company obtains control
(ordinarily the date of acquisition) until the date control ceases. The Company controls an entity when the Company is exposed to or has rights to variable returns from its involvement with the entity and has the ability to affect those returns through its power over the entity.
Associates are those companies over which the Company has the ability to exercise significant influence on the financial and operating policy decisions, which it does not control. Generally, significant influence is presumed to exist when the Company holds more than 20% of the voting rights. Joint arrangements, which include joint ventures and joint operations, are those over whose activities the Company has joint control, typically under a contractual arrangement. In joint ventures, ArcelorMittal exercises joint control and has rights to the net assets of the arrangement. The investment is accounted for under the equity method and therefore recognized at cost at the date of acquisition and subsequently adjusted for ArcelorMittal’s share in undistributed earnings or losses since acquisition, less any impairment incurred. Any excess of the cost of the acquisition over the Company’s share of the net fair value of the identifiable assets, liabilities, and contingent liabilities of the associate or joint venture recognized at the date of acquisition is considered as goodwill. The goodwill, if any, is included in the carrying amount of the investment and is evaluated for impairment as part of the investment. The consolidated statements of operations include the Company’s share of the profit or loss of associates and joint ventures from the date that significant influence or joint control commences until the date significant influence or joint control ceases, adjusted for any impairment losses. Adjustments to the carrying amount may also be necessary for changes in the Company’s proportionate interest in the investee arising from changes in the investee’s equity that have not been recognized in the investee’s profit or loss. The Company’s share of those changes is recognized directly in the relevant reserve within equity.
The Company assesses the recoverability of its investments accounted for under the equity method whenever there is an indication of impairment. In determining the value in use of its investments, the Company estimates its share in the present value of the projected future cash flows expected to be generated by operations of associates and joint ventures. The amount of any impairment is included in income (loss) from investments in associates, joint ventures and other investments in the consolidated statements of operations (see also note 2.6).
For investments in joint operations, in which ArcelorMittal exercises joint control and has rights to the assets and obligations for the liabilities relating to the arrangement, the Company recognizes its assets, liabilities and transactions, including its share of those incurred jointly.
| | |
174 Consolidated financial statements |
Investments in other entities, over which the Company and/or its operating subsidiaries do not have the ability to exercise significant influence, are accounted for as investments in equity instruments at FVOCI with any resulting gain or loss, net of related tax effect, recognized in the consolidated statements of other comprehensive income. Realized gains and losses from the sale of investments in equity instruments at FVOCI are reclassified from other comprehensive income to retained earnings within equity upon disposal.
While there are certain limitations on the Company’s operating and financial flexibility arising from the restrictive and financial covenants of the Company’s principal credit facilities described in note 6.1.2, there are no significant restrictions resulting from borrowing agreements or regulatory requirements on the ability of consolidated subsidiaries, associates and jointly controlled entities to transfer funds to the parent in the form of cash dividends to pay commitments as they come due.
Intercompany balances and transactions, including income, expenses and dividends, are eliminated in the consolidated
financial statements. Gains and losses resulting from intercompany transactions are also eliminated.
Non-controlling interests represent the portion of profit or loss and net assets not held by the Company and are presented separately in the consolidated statements of operations, in the consolidated statements of other comprehensive income and within equity in the consolidated statements of financial position.
2.2 Investments in subsidiaries
2.2.1 List of subsidiaries
The table below provides a list of the Company’s principal operating subsidiaries at December 31, 2020. Unless otherwise stated, the subsidiaries listed below have share capital consisting solely of ordinary shares or voting interests in the case of partnerships, which are held directly or indirectly by the Company and the proportion of ownership interests held equals to the voting rights held by the Company. The country of incorporation corresponds to their principal place of operations.
| | | | | | | | | | | | | | |
| Name of Subsidiary | | Country | | % of Ownership |
| NAFTA | | | | |
| ArcelorMittal Dofasco G.P. | | Canada | | 100.00% |
| ArcelorMittal México S.A. de C.V. | | Mexico | | 100.00% |
ArcelorMittal USA LLC 1 | | United States | | Sold |
| ArcelorMittal Long Products Canada G.P. | | Canada | | 100.00% |
| Brazil and neighboring countries ("Brazil") | | | | |
| ArcelorMittal Brasil S.A. | | Brazil | | 97.01% |
| Acindar Industria Argentina de Aceros S.A. ("Acindar") | | Argentina | | 100.00% |
| Europe | | | | |
| ArcelorMittal France S.A.S. | | France | | 100.00% |
| ArcelorMittal Belgium N.V. | | Belgium | | 100.00% |
| ArcelorMittal España S.A. | | Spain | | 99.85% |
| ArcelorMittal Flat Carbon Europe S.A. | | Luxembourg | | 100.00% |
| ArcelorMittal Poland S.A. | | Poland | | 100.00% |
| ArcelorMittal Eisenhüttenstadt GmbH | | Germany | | 100.00% |
| ArcelorMittal Bremen GmbH | | Germany | | 100.00% |
| ArcelorMittal Méditerranée S.A.S. | | France | | 100.00% |
| ArcelorMittal Belval & Differdange S.A. | | Luxembourg | | 100.00% |
| ArcelorMittal Hamburg GmbH | | Germany | | 100.00% |
| ArcelorMittal Duisburg GmbH | | Germany | | 100.00% |
| ArcelorMittal International Luxembourg S.A. | | Luxembourg | | 100.00% |
ArcelorMittal Italia S.p.A.2 | | Italy | | 100.00% |
| Africa and Commonwealth of Independent States ("ACIS") | | | | |
| ArcelorMittal South Africa Ltd. ("AMSA") | | South Africa | | 69.22% |
| JSC ArcelorMittal Temirtau | | Kazakhstan | | 100.00% |
| PJSC ArcelorMittal Kryvyi Rih ("AM Kryvyi Rih") | | Ukraine | | 95.13% |
| Mining | | | | |
| ArcelorMittal Mining Canada G.P. and ArcelorMittal Infrastructure G.P.("AMMC") | | Canada | | 85.00% |
| ArcelorMittal Liberia Ltd | | Liberia | | 85.00% |
| | | | |
| | | | |
1. On December 9, 2020, the Company completed the sale of ArcelorMittal USA (see note 2.3.1).
| | |
Consolidated financial statements 175 |
| (millions of U.S. dollars, except share and per share data) |
2. On December 10, 2020, the Company signed a binding agreement with Invitalia, an Italian state-owned company, forming a public-private joint venture between the parties. As a result, the carrying amount of the assets and liabilities of ArcelorMittal Italia was classified as held for sale and the Company's investment in ArcelorMittal Italia will be accounted for under the equity method upon closing of the first investment (expected in the first quarter of 2021) (see note 2.3.2).
2.2.2 Translation of financial statements denominated in foreign currency
The functional currency of ArcelorMittal S.A. is the U.S. dollar. The functional currency of each of the principal operating subsidiaries is the local currency, except for ArcelorMittal México, AMMC and ArcelorMittal International Luxembourg, whose functional currency is the U.S. dollar and ArcelorMittal Poland, whose functional currency is the euro.
Transactions in currencies other than the functional currency of a subsidiary are recorded at the rates of exchange prevailing at the date of the transaction. Monetary assets and liabilities in currencies other than the functional currency are remeasured at the rates of exchange prevailing on the date of the consolidated statements of financial position and the related translation gains and losses are reported within financing costs in the consolidated statements of operations. Non-monetary items that are carried at cost are translated using the rate of exchange prevailing at the date of the transaction. Non-monetary items that are carried at fair value are translated using the exchange rate prevailing when the fair value was determined and the related translation gains and losses are reported in the consolidated statements of comprehensive income.
Upon consolidation, the results of operations of ArcelorMittal’s subsidiaries, associates and joint arrangements whose functional currency is other than the U.S. dollar are translated into U.S. dollars at the monthly average exchange rates and assets and liabilities are translated at the year-end exchange rates. Translation adjustments are recognized directly in other comprehensive income and are included in net income (including non-controlling interests) only upon sale or liquidation of the underlying foreign subsidiary, associate or joint arrangement.
Since July 1, 2018, Argentina has been considered a highly inflationary country and therefore the financial statements of the Company's long production facilities Acindar Industria Argentina de Aceros S.A. ("Acindar") in Argentina, using a historical cost approach, are adjusted prospectively to reflect the changes in the general purchasing power of the local currency before being translated into U.S. dollars at the year end exchange rate. The Company used an estimated general price index (Consumer Price Index "IPC") which changed by 36.1% and 54.7% for the year ended December 31, 2020 and 2019, respectively, for this purpose. As a result of the inflation-related adjustments on non-monetary items, a gain of 30 and 64 was recognized in net financing costs for the year ended December 31, 2020 and 2019, respectively.
Since 2010 Venezuela has been considered a hyperinflationary economy and therefore the financial statements of Unicon are adjusted to reflect the changes in the general purchasing power of the local currency before being translated into U.S. dollars. The Company used estimated general price indices which changed by 2.667%, 12.922% and 213.605% for the years ended December 31, 2020, 2019 and 2018, respectively, for this purpose.
2.2.3 Business combinations
Business combinations are accounted for using the acquisition method as of the acquisition date, which is the date on which control is transferred to ArcelorMittal. The Company controls an entity when it is exposed to or has rights to variable returns from its involvement with the entity and has the ability to affect those returns through its power over the entity.
The Company measures goodwill at the acquisition date as the total of the fair value of consideration transferred, plus the proportionate amount of any non-controlling interest, plus the fair value of any previously held equity interest in the acquiree, if any, less the net recognized amount (generally at fair value) of the identifiable assets acquired and liabilities assumed.
In a business combination in which the fair value of the identifiable net assets acquired exceeds the cost of the acquired business, the Company reassesses the fair value of the assets acquired and liabilities assumed. If, after reassessment, ArcelorMittal’s interest in the net fair value of the acquiree’s identifiable assets, liabilities and contingent liabilities exceeds the cost of the business combination, the excess (bargain purchase) is recognized immediately as a reduction of cost of sales in the consolidated statements of operations.
Any contingent consideration payable is recognized at fair value at the acquisition date and any costs directly attributable to the business combination are expensed as incurred.
2.2.4 Acquisitions
Ilva (renamed ArcelorMittal Italia)
On November 1, 2018, ArcelorMittal completed the acquisition of Ilva S.p.A. and certain of its subsidiaries ("Ilva") following the signing on June 28, 2017 of a lease agreement with a conditional obligation to purchase between the commissioners appointed in the ongoing extraordinary administration proceedings to which the former Ilva business is subject and AM InvestCo Italy S.p.A. ("AM InvestCo"), a consortium formed by ArcelorMittal and Intesa San Paolo S.p.A. ("ISP") with
| | |
176 Consolidated financial statements |
respective interests of 94.45% and 5.55%. The completion of the acquisition followed ArcelorMittal's notification to the European Commission ("EC") of AM InvestCo's proposed acquisition of Ilva on September 21, 2017 and the submission of commitments on October 19, 2017. The EC initiated a Phase II review of AM InvestCo’s proposed acquisition of Ilva on November 8, 2017 and approved the transaction on May 7, 2018 subject to the fulfillment of divestment commitments (see note 2.3.1) and the exit of Marcegaglia from AM InvestCo (Marcegaglia initially held a 15% interest in AM InvestCo) completed on November 9, 2018.
Ilva (now ArcelorMittal Italia) is Europe’s largest single steel site and only integrated steelmaker in Italy with its main production facility based in Taranto. ArcelorMittal Italia also has significant steel finishing capacity in Taranto, Novi Ligure and Genova. As a result of the lease agreement, the assets and liabilities subject to the transaction are leased by subsidiaries of AM InvestCo, including ArcelorMittal Italia S.p.A., which combines the sites of Taranto, Novi Ligure and Genova. The nominal purchase price amounted to €1.8 billion (2.1 billion) subject to certain adjustments including working capital adjustment, with annual leasing costs of €180 million (206) to be paid in quarterly installments resulting in a present value of 1,540 at acquisition date. The total consideration included a 54 liability corresponding to environmental capital expenditures already completed by the former Ilva business and which was refunded by ArcelorMittal to the latter. In September 2018, the former Ilva business' trade unions ratified a labor agreement following which ArcelorMittal committed to initially hire 10,700 workers based on their existing contractual terms of employment. In addition, between 2023 and 2025, the Company committed to hire any workers who remain under the former Ilva business’ extraordinary administration. The business units are initially leased with rental payments qualifying as down payments against the purchase price and are part of the Europe reportable segment. The lease period is for a minimum of four years followed by a conditional purchase obligation, subject to certain conditions precedent (see note 9.3). The Company accounted for this transaction as a business combination as it obtained control of the business subject to the lease.
ISP's interest was subject to put and call option arrangements exercisable by ISP and ArcelorMittal between November 1, 2020 and November 1, 2025 and between November 1, 2021 and November 1, 2025, respectively. The Company determined that it has a present ownership interest in the shares subject to the put option. Accordingly, it recognized at acquisition date a 122 financial liability measured at the present value of the redemption amount. The put option was subsequently exercised in December 2020 simultaneous to the signing of an investment agreement, see note 2.3.2.
Following the closing of the transaction, the acquisition-date fair value of the identifiable assets and liabilities of ArcelorMittal Italia was determined on a provisional basis as of December 31, 2018, in particular with respect to property, plant and equipment, environmental provisions, indemnification asset, tax implications and working capital balances at closing date. ArcelorMittal finalized the acquisition-date fair values during the fourth quarter of 2019. ArcelorMittal recognized provisions of 397 in connection with environmental remediation obligations. As the latter will be funded with funds seized by the Italian Government from the former shareholder, the Company recognized an indemnification asset for the same amount, of which 359 was classified as non-current assets. Current assets include trade receivables of 437 with gross contract amounts receivable of 501 and contractual cash flows not expected to be collected of 64. Intangible assets include 201 relating to CO2 emission rights held by the former Ilva business at acquisition date (the Company also recognized liabilities of 158 relating to estimated emissions for 2018) and favorable land lease contracts for 61. ArcelorMittal recognized a 209 bargain purchase gain in cost of sales in 2018 mainly as a result of the preliminary €0.4 billion (0.5 billion) working capital reduction while the total fair value of net assets acquired remained substantially driven by the economic obsolescence applied to property, plant and equipment. Following the finalization of the acquisition-date fair values, the bargain purchase gain decreased by 28 mainly as a result of the finalization of the environmental provisions (118 decrease of both environmental provision and indemnification asset), tax implications (74) and working capital balances. Property, plant and equipment increased by 92.
Revenue and net loss of ArcelorMittal Italia for the year ended December 31, 2018 since acquisition date were 398 and (49), respectively. The Company recognized acquisition-related costs of 25 in selling, general and administrative expenses for the year ended December 31, 2018. The agreement included industrial capital expenditure commitments of approximately €1.3 billion (1.4 billion) over a seven-year period focused on blast furnaces, steel shops and finishing lines and environmental capital expenditure commitments of approximately €0.8 billion (0.9 billion).
Following the signing of an investment agreement in December 2020, the carrying amounts of ArcelorMittal Italia's assets and liabilities were classified as held for sale as of December 31, 2020, see note 2.3.2.
Votorantim (renamed AMSF)
On April 1, 2018, ArcelorMittal completed the acquisition of Votorantim Siderurgia (subsequently renamed ArcelorMittal Sul Fluminense "AMSF"), Votorantim S.A.'s long steel business in Brazil pursuant to which Votorantim Siderurgia became a wholly-owned subsidiary of ArcelorMittal Brasil. The combination of ArcelorMittal Brasil's long steel business and AMSF aims to
| | |
Consolidated financial statements 177 |
| (millions of U.S. dollars, except share and per share data) |
create cost, logistical and operational synergies. The combined operations include ArcelorMittal Brasil’s production sites at Monlevade, Juiz de Fora and Piracicaba, and AMSF’s production sites at Barra Mansa, Resende and its 50% interest in the joint venture Sitrel in Três Lagoas. On February 7, 2018, the Brazilian antitrust authority CADE approved the transaction, conditioned to the fulfillment of divestment commitments by ArcelorMittal Brasil which were completed in May 2018 (see note 2.3).
The acquisition was completed through the issuance of preferred shares to Votorantim S.A. representing a 2.99% interest in ArcelorMittal Brasil. Pursuant to the shareholders' agreement, such preferred shares are subject to put and call option arrangements exercisable by Votorantim S.A. and ArcelorMittal Brasil between July 1, 2019 and December 31, 2022 and between January 1, 2023 and December 31, 2024, respectively. The Company determined that it has a present ownership interest in the preferred shares subject to the put option. Accordingly, it recognized at acquisition date a 328 financial liability at amortized cost and measured at the present value of the redemption amount. The Company completed its acquisition-date fair value of the identifiable assets and liabilities of AMSF in the first half of 2019 and recognized an increase of 8 in goodwill and other liabilities following a revised measurement of contingent liabilities. Other non-current assets include an 83 indemnification asset towards Votorantim S.A. relating to contingent liabilities of 93 and an 82 investment in Sitrel. Other liabilities include unfavorable contracts for 293 and borrowings of 211. Current assets include cash and receivables for 13 and 141, respectively (including trade receivable of 92 with gross contractual amounts of 108 and contractual cash flows not expected to be collected of 16). Revenue and net loss of AMSF for the year ended December 31, 2018 since acquisition date were 285 and (108), respectively. The Company recognized acquisition-related costs of 8 in selling, general and administrative expenses in 2018.
Revenue and net income attributable to the equity holders of the parent of the Company for the year ended December 31, 2018 were 79,192 and 4,801 respectively, as though the acquisition date for ArcelorMittal Italia and AMSF had been as of January 1, 2018.
Other
On June 4, 2019, the Company completed the acquisition of Münker Metallprofile GmbH ("Münker") for total consideration of €48 million (54) of which €44 million (46 net of cash acquired of 3) was paid at closing and €4 million (5) payable contingent upon certain criteria. The acquisition of Münker will strengthen ArcelorMittal Downstream Solutions' construction business within the Europe segment. The Company completed its acquisition-date fair value of the identifiable assets and liabilities of Münker in the second half of 2019. It recognized 6 of goodwill and 34, 11 and 22 of property, plant and equipment, intangible assets and current assets, respectively, following the final measurement. Revenue and net income since acquisition date were 45 and 2, respectively.
Revenue and net loss attributable to the equity holders of the parent of the Company, for year ended December 31, 2019 were 70,646 and 2,454, respectively, as though the acquisition date of Münker had been as of January 1, 2019.
The table below summarizes the final acquisition-date fair value of the assets acquired and liabilities assumed in respect of Münker, AMSF and the former Ilva business in 2019:
| | | | | | | | | | | | | | | | | |
| | | |
| Münker | | AMSF | | Ilva |
| Current assets | 22 | | | 262 | | | 1,156 | |
| Property, plant and equipment | 34 | | | 600 | | | 1,118 | |
| Intangible assets | 11 | | | 19 | | | 267 | |
| Other non-current assets | — | | | 252 | | | 369 | |
| Total assets acquired | 67 | | | 1,133 | | | 2,910 | |
| Deferred tax liabilities | (8) | | | (45) | | | (74) | |
| Other liabilities | (14) | | | (792) | | | (1,113) | |
| Total liabilities acquired | (22) | | | (837) | | | (1,187) | |
| Net assets acquired | 45 | | | 296 | | | 1,723 | |
| Consideration paid, net | 46 | | | — | | | 52 | |
| Consideration payable | 5 | | | 328 | | | 1,490 | |
| Goodwill/(bargain purchase gain) | 6 | | | 32 | | | (181) | |
2.3 Divestments and assets held for sale
Non-current assets and disposal groups that are classified as held for sale are measured at the lower of carrying amount and fair value less costs to sell. Assets and disposal groups are classified as held for sale if their carrying amount will be recovered through a sale transaction rather than through continuing use. The non-current asset, or disposal group, is classified as held for sale only when the sale is highly probable and is available for immediate sale in its present condition and is marketed for sale at a price that is reasonable in relation to its current fair value. Assets held for sale are presented separately in the consolidated statements of financial position and are not depreciated. Gains (losses) on disposal of subsidiaries are
| | |
178 Consolidated financial statements |
recognized in cost of sales, whereas gains (losses) on disposal of investments accounted for under the equity method are recognized in income (loss) from investments in associates, joint ventures and other investments.
2.3.1 Divestments
Divestment in 2020
On December 9, 2020, the Company completed the sale of 100% of the shares of ArcelorMittal USA, ArcelorMittal Princeton and ArcelorMittal Monessen, their subsidiaries and certain other subsidiaries as well as the joint operations of Hibbing Taconite Mines, Double G Coatings and I/N Tek and the joint venture I/N Kote, together the “ ArcelorMittal USA Divestment Business” to Cleveland-Cliffs Inc. (“Cleveland-Cliffs”) for a combination of cash and shares. ArcelorMittal retained certain intellectual property assets and office space.
In addition, Nippon Steel Corporation ("NSC"), the co-shareholder of I/N Tek and I/N Kote simultaneously exited from such entities, which were transferred in full to Cleveland-Cliffs.
The consideration (net of transaction fees of 21 and estimated working capital adjustment of 50) was 2,219 and included:
•Cash of 509 (497 net of 7 cash disposed of and 5 transaction fees paid) subject to a working capital adjustment;
•78,186,671 common shares of Cleveland-Cliffs with value of 1,020 and representing a 16% stake in Cleveland-Cliffs; and
•583,273 non-voting preferred shares redeemable, at Cleveland-Cliff's option, for 58,327,300 of its common shares with a value of 761 or an equivalent amount in cash.
In addition, Cleveland-Cliffs assumed certain liabilities of the ArcelorMittal USA Divestment Business, including pensions and other post-employment benefit liabilities net of pension fund assets with a carrying amount of 3.2 billion in ArcelorMittal's consolidated statement of financial position upon disposal. The resulting net gain on disposal was 1,460. The ArcelorMittal USA Divestment Business was part of the NAFTA reportable segment. Immediately prior to classification as held for sale as of September 30, 2020, the Company assessed whether there was an indication that the impairment loss recognized in 2019 may have decreased. The Company calculated the fair value less cost of disposal using a market approach with market multiples derived from comparable transactions, a Level 3 unobservable input. As a result, the Company reversed 660, in cost of sales, of impairment charges of property, plant and equipment previously recognized. The Company allocated 672 of the NAFTA segment goodwill to the disposal group based on
the relative values of the operations disposed of and the portion of the group of cash-generating units retained.
Divestments in 2019
ArcelorMittal Italia remedies
On May 7, 2018, the EC approved the acquisition of Ilva (renamed "ArcelorMittal Italia"). As part of the approval, ArcelorMittal agreed to divest certain of its European assets (“ArcelorMittal Italia remedies”) which were part of the Europe reportable segment. The ArcelorMittal Italia remedies included the following three divestment packages.
The Dudelange and Liège divestment package was composed of ArcelorMittal Dudelange and certain finishing facilities of ArcelorMittal Liège in Belgium including the hot dipped galvanizing lines 4 and 5 in Flémalle, hot-rolled pickling, cold rolling and tin packaging lines in Tilleur.
The Galati divestment package was mainly composed of the integrated steel making site of ArcelorMittal Galati S.A., ArcelorMittal Tubular Products Galati SRL, both in Romania, ArcelorMittal Skopje AD in North Macedonia and ArcelorMittal Piombino S.p.A. in Italy, the Company’s only galvanizing steel plant in Italy.
The Ostrava divestment package was mainly composed of the integrated steel making site of ArcelorMittal Ostrava a.s. and its subsidiary, ArcelorMittal Tubular Products Ostrava a.s.
On June 30, 2019, ArcelorMittal completed the sale of the ArcelorMittal Italia remedies to Liberty House Group ("Liberty"). The total consideration which consisted of amounts payable upon closing and deferred consideration in part contingent upon certain criteria, net of €110 million (125) deposited in escrow was €740 million (842) subject to customary closing adjustments. Of this total amount, €610 million (694) was received on June 28, 2019. The escrow which was subsequently drawn was to be used by Liberty for certain capital expenditure projects to satisfy commitments given in the EC approval process.
During 2019, prior to the completion of the disposal, the Company recorded an impairment charge in cost of sales of 497 to adjust the carrying amount of the disposal group to the sale proceeds of 692 including a cash consideration of 518 (694, net of cash disposed of 34, the escrow deposit of 125 and proceeds of 17 paid to a joint venture of the Company) and 174 of deferred consideration (of which 161 was outstanding as of December 31, 2019 following subsequent receipt of a portion of the consideration receivable) recognized at present value and fair value of contingent consideration. The Company also assigned receivables of 404 mainly comprised of cash pooling balances to Liberty. The fair value measurement of ArcelorMittal
| | |
Consolidated financial statements 179 |
| (millions of U.S. dollars, except share and per share data) |
Italia remedies was determined using the contract price, a Level 3 unobservable input, which was revised in the first half of 2019.
Global Chartering
On December 31, 2019, ArcelorMittal completed the sale of a 50% controlling interest in Global Chartering Ltd. ("Global Chartering") to DryLog Ltd. ("DryLog") for total deferred consideration of 6. The resulting net gain on disposal was 29 including the reclassification from other comprehensive income to the consolidated statements of operations of 33 foreign exchange translation gains. In connection with the disposal, the Company derecognized right-of-use assets and lease liabilities of 390 and 400, respectively.
Global Chartering is a Mauritius-based shipping company that handles shipping for a portion of the Company's raw materials through the chartering of vessels on a short- to long-term basis. Global Chartering's fleet includes owned and leased Capesize, Panamax and Supramax vessels on a medium- to long-term charter. Simultaneously, ArcelorMittal entered into a joint venture agreement with DryLog to operate jointly the Global Chartering fleet and certain other vessels chartered from DryLog. Accordingly, the Company's remaining 50% interest in Global Chartering is accounted for under the equity method. The fair value measurement was determined using the selling price, a Level 3 unobservable input. At inception of the joint venture, certain of Global Chartering's lease terms were unfavorable compared to market rates and therefore the Company agreed to indemnify the joint venture for operating losses that could
potentially arise within an agreed time frame if market rates do not improve and recognized accordingly in cost of sales a 126 provision (see note 9.1) representing the net present value of the maximum amount agreed.
Divestments in 2018
On February 28, 2018, ArcelorMittal completed the sale of Go Steel Frýdek Místek ("Frýdek Místek"), for consideration of 49 (net of cash disposed of 1) of which 10 remained outstanding at December 31, 2018. Frýdek Místek was part of the Europe segment. The fair value measurement was determined using the contract price, a Level 3 unobservable input.
On February 7, 2018, the Brazilian Antitrust Authority (CADE) approved the acquisition of Votorantim subject to divestment commitments (see note 2.2.4). Accordingly, in May 2018, ArcelorMittal Brasil disposed of its two production sites Cariacica and Itaúna as well as some wire drawing equipment in Brazil (the “Votorantim remedies”), which were part of the Brazil reportable segment. Prior to the disposal, the Company recorded an impairment charge in cost of sales of 86 to adjust the carrying amount of the disposal group to the sale proceeds of 84 (net of cash disposed of 1) of which 58 remained outstanding as of December 31, 2018. The fair value measurement of these Votorantim remedies was determined using the contract price, a Level 3 unobservable input.
| | |
180 Consolidated financial statements |
The table below summarizes the significant divestments:
| | | | | | | | | | | | | | | | | | | | | | | | | | | | | |
| 2020 | | 2019 | 2018 |
| ArcelorMittal USA Divestment Business | | Global Chartering Limited | | ArcelorMittal Italia remedies | | Frýdek Místek | | Votorantim remedies |
| Cash and cash equivalents | 7 | | | — | | | — | | | — | | | — | |
| Other current assets | 2,105 | | | 14 | | | 1,386 | | | 48 | | | 40 | |
| Goodwill and intangible assets | 684 | | | — | | | — | | | — | | | — | |
| Property, plant and equipment | 3,341 | | | 517 | | | 178 | | | 35 | | | 48 | |
| Other assets | 166 | | | 21 | | | 11 | | | — | | | — | |
| Total assets | 6,303 | | | 552 | | | 1,575 | | | 83 | | | 88 | |
| Current liabilities | 1,604 | | | 229 | | | 1,046 | | | 31 | | | 4 | |
| Other long-term liabilities | 3,938 | | | 311 | | | 241 | | | 4 | | | — | |
| Total liabilities | 5,542 | | | 540 | | | 1,287 | | | 35 | | | 4 | |
| Total net assets | 761 | | | 12 | | | 288 | | | 48 | | | 84 | |
| Assigned receivables | — | | | — | | | 404 | | | — | | | — | |
| % of net assets sold | 100 | % | | 50 | % | | 100 | % | | 100 | % | | 100 | % |
| Total net assets disposed of | 761 | | | 6 | | | 692 | | | 48 | | | 84 | |
| Consideration | 2,219 | | | (4) | | | 518 | | | 39 | | | 26 | |
| Consideration receivable | — | | | 6 | | | 174 | | | 10 | | | 58 | |
| Reclassification of foreign exchange and other reserves | 2 | | | 33 | | | 72 | | | 15 | | | — | |
| Gain on disposal | 1,460 | | | 29 | | | 72 | | | 16 | | | — | |
2.3.2 Assets held for sale
On March 4, 2020, ArcelorMittal executed an amendment (the “Amendment Agreement”) to the original lease agreement with the Ilva Commissioners with a conditional obligation to purchase the former Ilva business units ("ArcelorMittal Italia") in an extraordinary administration insolvency procedure. The Amendment Agreement outlined the terms for a significant equity investment by an Italian state-sponsored entity, thereby forming the basis for an important new partnership between ArcelorMittal and the Italian government, with the investment agreement to be executed by November 30, 2020. The Amendment Agreement also provided for a 50% reduction in the quarterly rental payments payable by ArcelorMittal, with the balance being due upon closing of the purchase obligation. On December 10, 2020, the Company entered into an investment agreement with Invitalia - Agenzia nazionale per l'attrazione degli investimenti e lo sviluppo d'impresa S.P.A (“Invitalia”), the party designated by the Italian government to be the government-sponsored investor as contemplated in the Amendment Agreement, in order to create a partnership between Invitalia and the Company to support the completion of the purchase obligation.
On December 14, 2020, ISP exercised its put option for €111 million (135) to sell its share in ArcelorMittal Italia to the
Company and the liability it had recognized upon acquisition of ArcelorMittal Italia was derecognized (see note 2.2.4).
The investment agreement includes two capital increases:
•The first investment of €400 million which was contractually expected to be completed by the end of February following EU antitrust authorization on January 28, 2021 is currently expected to be made in the first quarter of 2021. This will provide Invitalia with 50% voting and governance rights and therefore joint control over AM InvestCo;
•The second investment of up to €680 million is payable on closing of the purchase obligation, which is subject to the satisfaction of various conditions precedent by May 2022, at which point Invitalia’s shareholding in ArcelorMittal Italia is expected to reach 60%. ArcelorMittal may need to invest up to €70 million, to the extent necessary to retain a 40% shareholding and joint control over the company.
As a result of the investment agreement, the carrying amount of assets and liabilities subject to the transaction including a 45 allocation of Europe segment goodwill was classified as held for sale as of December 31, 2020. ArcelorMittal Italia is part of the
| | |
Consolidated financial statements 181 |
| (millions of U.S. dollars, except share and per share data) |
Europe reportable segment. The fair value of the assets and liabilities classified as held for sale were in line with their carrying value. The fair value measurement was determined using the contract price and a discounted cash flow model, both Level 3 unobservable inputs.
In addition, in the context of the Company's divestment process with respect to its plate operations in the Europe reportable segment, the carrying amount of such assets and liabilities was classified as held for sale as of December 31, 2020. The Company recorded an impairment charge in cost of sales of 331.
The table below provides the details for the entities classified as held for sale at December 31, 2020. There were no assets classified as held for sale at December 31, 2019.
| | | | | | | | | | | | | | |
| | December 31, 2020 |
| | ArcelorMittal Italia and plate operations in Europe | | | | |
| Current Assets: | | | | | | |
| Cash and cash equivalents | | 3 | | | | | |
| Trade accounts receivable, prepaid expenses and other current assets | | 635 | | | | | |
| Inventories | | 1,446 | | | | | |
| Total Current Assets | | 2,084 | | | | | |
| Non-current Assets: | | | | | | |
| Property, plant and equipment | | 1,843 | | | | | |
| Other assets | | 402 | | | | | |
| Total Non-current Assets | | 2,245 | | | | | |
| Total Assets | | 4,329 | | | | | |
| | | | | | |
| Current Liabilities: | | | | | | |
| Trade accounts payables, accrued expenses and other liabilities | | 1,236 | | | | | |
| Total Current Liabilities | | 1,236 | | | | | |
| Non-current Liabilities: | | | | | | |
| Long-term debt | | 21 | | | | | |
| Other long-term liabilities | | 1,782 | | | | | |
| Total Non-current Liabilities | | 1,803 | | | | | |
| Total Liabilities | | 3,039 | | | | | |
| | |
182 Consolidated financial statements |
2.4 Investments in associates and joint arrangements
The carrying amounts of the Company’s investments accounted for under the equity method were as follows:
| | | | | | | | | | | |
| December 31, |
| Category | 2020 | | 2019 |
| Joint ventures | 3,006 | | | 2,586 | |
| Associates | 2,847 | | | 2,859 | |
Individually immaterial joint ventures and associates1 | 964 | | | 1,084 | |
| Total | 6,817 | | | 6,529 | |
1.Individually immaterial joint ventures and associates represent in aggregate less than 20% of the total carrying amount of investments in joint ventures and associates at December 31, 2020 and 2019, and none of them have a carrying value exceeding 100 at December 31, 2020 and 2019.
The following tables summarize the latest available financial information and reconcile it to the carrying value of each of the Company’s material joint ventures, as well as the income statement of the Company’s material joint ventures:
| | | | | | | | | | | | | | | | | | | | | | | | | | | | | | | | | | | | | | | | |
| | December 31, 2020 |
| Joint Ventures | | AMNS India | | Calvert | | | | VAMA | | Tameh | | Borçelik | | Total |
Place of incorporation and operation 1 | | India | | United States | | | | China | | Poland | | Turkey | | |
| Principal Activity | | Integrated flat steel producer 5,6 | | Automotive steel finishing | | | | Automotive steel finishing | | Energy production and supply | | Manufacturing and sale of steel 2,3,4 | | |
| Ownership and voting rights at December 31, 2020 | | 60.00 | % | | 50.00 | % | | | | 50.00 | % | | 50.00 | % | | 50.00 | % | | |
| Current assets | | 3,528 | | | 1,236 | | | | | 252 | | | 175 | | | 510 | | | 5,701 | |
| of which cash and cash equivalents | | 1,137 | | | 53 | | | | | 77 | | | 43 | | | 82 | | | 1,392 | |
| Non-current assets | | 5,745 | | | 1,261 | | | | | 669 | | | 570 | | | 257 | | | 8,502 | |
| Current liabilities | | 657 | | | 805 | | | | | 511 | | | 180 | | | 283 | | | 2,436 | |
| of which trade and other payables and provisions | | 524 | | | 138 | | | | | 232 | | | 132 | | | 271 | | | 1,297 | |
| Non-current liabilities | | 5,604 | | | 662 | | | | | 23 | | | 226 | | | 127 | | | 6,642 | |
| of which trade and other payables and provisions | | 67 | | | — | | | | | — | | | 26 | | | 47 | | | 140 | |
| Net assets | | 3,012 | | | 1,030 | | | | | 387 | | | 339 | | | 357 | | | 5,125 | |
| Company's share of net assets | | 1,807 | | | 515 | | | | | 194 | | | 170 | | | 179 | | | 2,865 | |
| Adjustments for differences in accounting policies and other | | 149 | | | 24 | | | | | — | | | — | | | (32) | | | 141 | |
| Carrying amount in the statements of financial position | | 1,956 | | | 539 | | | | | 194 | | | 170 | | | 147 | | | 3,006 | |
| Revenue | | 3,992 | | | 2,693 | | | | | 1,001 | | | 420 | | | 1,055 | | | 9,161 | |
| Depreciation and amortization | | (371) | | | (61) | | | | | (41) | | | (48) | | | (24) | | | (545) | |
| Interest income | | 43 | | | — | | | | | 1 | | | — | | | 1 | | | 45 | |
| Interest expense | | (135) | | | (33) | | | | | (16) | | | (8) | | | (12) | | | (204) | |
| Income tax benefit (expense) | | 318 | | | — | | | | | (6) | | | (2) | | | (17) | | | 293 | |
| Profit (loss) from continuing operations | | 472 | | | 9 | | | | | 47 | | | 7 | | | 29 | | | 564 | |
| Other comprehensive income (loss) | | (98) | | | — | | | | | — | | | 6 | | | (4) | | | (96) | |
| Total comprehensive income (loss) | | 374 | | | 9 | | | | | 47 | | | 13 | | | 25 | | | 468 | |
| Cash dividends received by the Company | | — | | | 58 | | | | | — | | | — | | | 9 | | | 67 | |
1.The country of incorporation corresponds to the country of operation except for Tameh whose country of operation is also the Czech Republic.
2.Ownership interest in Borçelik was 45.33% and 50.00% based on issued shares and outstanding shares, respectively, at December 31, 2020; voting interest was 48.01% at December 31, 2020.
3.The non-current liabilities include 39 deferred tax liability.
4.Adjustment in Borçelik relates primarily to differences in accounting policies regarding revaluation of fixed assets.
5.Adjustments in AMNS India correspond primarily to transaction costs incurred to set up the joint venture and the fair value of the guarantee of the joint venture's debt (see note 9.4).
6.Includes AMNS Luxembourg, AMNS India and intermediate holding entities.
| | |
Consolidated financial statements 183 |
| (millions of U.S. dollars, except share and per share data) |
| | | | | | | | | | | | | | | | | | | | | | | | | | | | | | | | | | | | | | | | |
| | December 31, 2019 |
| Joint Ventures | | AMNS India | | Calvert | | | | VAMA | | Tameh | | Borçelik | | |
Place of incorporation and operation 1 | | India | | United States | | | | China | | Poland | | Turkey | | |
| Principal Activity | | Flat carbon steel manufacture 5,6 | | Automotive steel finishing | | | | Automotive steel finishing | | Energy production and supply | | Manufacturing and sale of steel 2,3,4 | | Total |
| Ownership and voting rights at December 31, 2019 | | 60.00 | % | | 50.00 | % | | | | 50.00 | % | | 50.00 | % | | 50.00 | % | | |
| Current assets | | 2,318 | | | 1,604 | | | | | 313 | | | 171 | | | 508 | | | 4,914 | |
| of which cash and cash equivalents | | 444 | | | 62 | | | | | 81 | | | 75 | | | 106 | | | 768 | |
| Non-current assets | | 6,295 | | | 1,282 | | | | | 637 | | | 580 | | | 267 | | | 9,061 | |
| Current liabilities | | 5,922 | | | 984 | | | | | 485 | | | 183 | | | 378 | | | 7,952 | |
| of which trade and other payables and provisions | | 670 | | | 144 | | | | | 226 | | | 139 | | | 274 | | | 1,453 | |
| Non-current liabilities | | 189 | | | 764 | | | | | 147 | | | 244 | | | 49 | | | 1,393 | |
| of which trade and other payables and provisions | | 46 | | | — | | | | | — | | | 26 | | | 49 | | | 121 | |
| Net assets | | 2,502 | | | 1,138 | | | | | 318 | | | 324 | | | 348 | | | 4,630 | |
| Company's share of net assets | | 1,501 | | | 569 | | | | | 159 | | | 162 | | | 174 | | | 2,565 | |
| Adjustments for differences in accounting policies and other | | 48 | | | 6 | | | | | — | | | — | | | (33) | | | 21 | |
| Carrying amount in the statements of financial position | | 1,549 | | | 575 | | | | | 159 | | | 162 | | | 141 | | | 2,586 | |
| Revenue | | — | | | 3,504 | | | | | 772 | | | 499 | | | 1,141 | | | 5,916 | |
| Depreciation and amortization | | — | | | (63) | | | | | (31) | | | (37) | | | (24) | | | (155) | |
| Interest income | | 2 | | | 2 | | | | | 1 | | | — | | | 1 | | | 6 | |
| Interest expense | | (10) | | | (48) | | | | | (23) | | | (7) | | | (19) | | | (107) | |
| Income tax benefit (expense) | | (83) | | | — | | | | | (22) | | | (7) | | | (10) | | | (122) | |
| Profit (loss) from continuing operations | | (116) | | | 156 | | | | | 10 | | | 28 | | | 19 | | | 97 | |
| | | | | | | | | | | | | | |
| Total comprehensive income (loss) | | (116) | | | 156 | | | | | 10 | | | 28 | | | 19 | | | 97 | |
| Cash dividends received by the Company | | — | | | 57 | | | | | — | | | 9 | | | 12 | | | 78 | |
| | | | | | | | | | | | | | |
| | | | | | | | | | | | | | |
1.The country of incorporation corresponds to the country of operation except for Tameh whose country of operation is also the Czech Republic.
2.Ownership interest in Borçelik was 45.33% and 50.00% based on issued shares and outstanding shares, respectively, at December 31, 2019; voting interest was 48.01% at December 31, 2019.
3.The non-current liabilities include 42 deferred tax liability.
4.Adjustment in Borçelik relates primarily to differences in accounting policies regarding revaluation of fixed assets.
5.Adjustments in AMNS India correspond to transaction costs incurred to set up the joint venture.
6.Includes AMNS Luxembourg, AMNS India and intermediate holding entities.
| | |
184 Consolidated financial statements |
| | | | | | | | | | | | | | | | | | | | | | | | | | | | | | | | | | | | | |
| | December 31, 2018 |
| Joint Ventures | | Calvert | | | | | VAMA | | Tameh | | Borçelik | | Total |
Place of incorporation and operation1 | | United States | | | | | China | | Poland | | Turkey | | |
| Principal Activity | | Automotive steel finishing | | | | | Automotive steel finishing | | Energy production and supply | | Manufacturing and sale of steel 2,3,4 | | |
| Ownership and voting rights at December 31, 2018 | | 50.00 | % | | | | | 50.00 | % | | 50.00 | % | | 50.00 | % | | |
| Current assets | | 1,490 | | | | | | 329 | | | 205 | | | 519 | | | 2,543 | |
| of which cash and cash equivalents | | 76 | | | | | | 85 | | | 90 | | | 67 | | | 318 | |
| Non-current assets | | 1,282 | | | | | | 688 | | | 540 | | | 282 | | | 2,792 | |
| Current liabilities | | 824 | | | | | | 491 | | | 208 | | | 398 | | | 1,921 | |
| of which trade and other payables and provisions | | 173 | | | | | | 180 | | | 176 | | | 263 | | | 792 | |
| Non-current liabilities | | 853 | | | | | | 217 | | | 226 | | | 49 | | | 1,345 | |
| of which trade and other payables and provisions | | — | | | | | | — | | | 22 | | | — | | | 22 | |
| Net assets | | 1,095 | | | | | | 309 | | | 311 | | | 354 | | | 2,069 | |
| Company's share of net assets | | 548 | | | | | | 156 | | | 156 | | | 177 | | | 1,037 | |
| Adjustments for differences in accounting policies and other | | 6 | | | | | | — | | | — | | | (32) | | | (26) | |
| Carrying amount in the statements of financial position | | 554 | | | | | | 156 | | | 156 | | | 145 | | | 1,011 | |
| Revenue | | 3,295 | | | | | | 625 | | | 467 | | | 1,328 | | | 5,715 | |
| Depreciation and amortization | | (62) | | | | | | (32) | | | (31) | | | (22) | | | (147) | |
| Interest income | | 1 | | | | | | 1 | | | — | | | 2 | | | 4 | |
| Interest expense | | (40) | | | | | | (26) | | | (4) | | | (20) | | | (90) | |
| Income tax benefit (expense) | | — | | | | | | (1) | | | (8) | | | (18) | | | (27) | |
| Profit (loss) from continuing operations | | 312 | | | | | | 5 | | | 30 | | | 6 | | | 353 | |
| Other comprehensive income (loss) | | — | | | | | | — | | | 3 | | | 1 | | | 4 | |
| Total comprehensive income (loss) | | 312 | | | | | | 5 | | | 33 | | | 7 | | | 357 | |
| Cash dividends received by the Company | | 48 | | | | | | — | | | 4 | | | 34 | | | 86 | |
1.The country of incorporation corresponds to the country of operation except for Tameh whose country of operation is also the Czech Republic.
2.Ownership interest in Borçelik was 45.33% and 50.00% based on issued shares and outstanding shares, respectively, at December 31, 2018; voting interest was 48.01% at December 31, 2018.
3.The non-current liabilities include 43 deferred tax liability.
4.Adjustment in Borçelik relates primarily to differences in accounting policies regarding revaluation of fixed assets.
AMNS India
On December 11, 2019, following the unconditional approval received by the Indian Supreme Court of ArcelorMittal's acquisition plan ("the Resolution Plan") for Essar Steel India Limited ("ESIL") subsequently renamed AMNS India Limited ("AMNS India") on November 15, 2019, ArcelorMittal and Nippon Steel Corporation ("NSC"), Japan’s largest steel producer and the third largest steel producer in the world, created a joint venture to own and operate AMNS India with ArcelorMittal holding a 60% interest and NSC holding 40% in accordance with the second amended joint venture formation agreement signed as of December 8, 2019. Through the agreement, both ArcelorMittal and NSC are guaranteed equal board representation and participation in all significant financial and operating decisions. The group has therefore determined that it does not control the entity, even though it holds 60% of
the voting rights. ArcelorMittal and NSC contributed their respective initial equity funding of 1,362 and 891 into AMNS Luxembourg Holding S.A. ("AMNS Luxembourg"), the parent company of the joint venture. ArcelorMittal's 60% interest is accounted for under the equity method. ArcelorMittal also transferred 360 cash proceeds (of which 293 was recognized in 2019 and the remainder in 2018), including through a 193 equity contribution, into the joint venture following hedging programs entered into to hedge the volatility between the Indian Rupee and the U.S. dollar in relation to the acquisition of AMNS India. The total cash proceeds included 353 designated as cash flow hedge gains and the Company reflected in retained earnings NSC's 40% entitlement in the amount of 141 in accordance with the final joint venture formation agreement.
| | |
Consolidated financial statements 185 |
| (millions of U.S. dollars, except share and per share data) |
On December 16, 2019, AMNS Luxembourg completed the acquisition of AMNS India. ArcelorMittal and NSC financed the joint venture for the acquisition of AMNS India through a combination of partnership equity of 2,253 and debt of 3,679 including 2,204 drawn by the joint venture under the 7 billion term facility agreement (see note 6.1.2) and 1,475 shareholder loan from NSC. The joint venture accounted for the acquisition of AMNS India as a business combination. The joint venture completed its purchase price accounting during 2020.
AMNS India is an integrated flat steel producer, and the largest steel company in western India. AMNS India’s main steel manufacturing facility is located at Hazira, Gujarat in western India. It also has:
–two iron ore beneficiation plants close to the mines in Kirandul and Dabuna, with slurry pipelines that then transport the beneficiated iron ore slurry to the pellet plants in the Kirandul-Vizag and Dabuna-Paradeep systems;
–a downstream facility in Pune (including a pickling line, a cold rolling mill, a galvanizing mill, a color coating mill and a batch annealing plant); and
–seven service centers in the industrial clusters of Hazira, Bhuj, Indore, Bahadurgarh, Chennai, Kolkata and Pune. It has a complete range of flat rolled steel products, including value added products, and significant iron ore pellet capacity with two main pellet plant systems in Kirandul-Vizag and Dabuna-Paradeep, which have the potential for expansion. Its facilities are located close to ports with deep draft for movement of raw materials and finished goods.
The Resolution Plan which was approved for the acquisition of AMNS India included an upfront payment of 6.0 billion towards AMNS India’s debt resolution, with a further 1.1 billion of capital injection into AMNS India to support operational improvements, increase production levels and deliver enhanced levels of profitability. The Company provided a 0.6 billion performance guarantee in connection with the execution of the Resolution Plan, which terminated on December 31, 2019. In addition, the Resolution Plan includes a capital expenditure plan of 2.6 billion to be implemented in two stages over six years.
In the context of the creation of the AMNS India joint venture, the Company transferred the Uttam Galva Steels Ltd. payments (see note 4.6) to the joint venture. ArcelorMittal and NSC financed such payments through a combination of equity contributions into the joint venture of 173 and 115, respectively, and debt of 597 including 367 drawn by the joint venture under the 7 billion term facility agreement and a 230 shareholder loan from NSC. The joint venture used such proceeds to repay the
loan granted by ArcelorMittal for an amount of 680 on December 31, 2019.
On February 13, 2020 and pursuant to the follow-on funding requirement in accordance with the second amended joint venture formation agreement, AMNS Luxembourg completed an additional equity injection into AMNS India of 840 mainly through an additional 475 drawn under the 7 billion term facility agreement and a 325 shareholder loan from NSC.
On March 16, 2020, AMNS Luxembourg entered into a 5.1 billion ten-year term loan agreement with various Japanese banks which is guaranteed by ArcelorMittal and NSC in proportion to their interests in the joint venture.The proceeds of the loan were used on March 27, 2020 to refinance in full the amounts borrowed by the Company in connection with the acquisition of AMNS India, including the amounts borrowed under the 7 billion bridge term facilities agreement guaranteed by ArcelorMittal.
On July 7, 2020, AMNS India acquired the Odisha Slurry Pipeline infrastructure Limited ("OSPIL") for a net consideration of 245 which secures an important infrastructure asset for raw material supply to the Hazira steel plant.
On July 23, 2020, AMNS India commenced mining operations after having been selected preferred bidder for the Thakurani iron ore mine license with estimated reserves of approximately 85 million tonnes in Keonjhar district of Odisha following an auction process facilitated by the state government in February 2020.
Macsteel
On May 28, 2018, ArcelorMittal announced the sale of its 50% shareholding in Macsteel International Holdings B.V. (“Macsteel”), a joint venture between Macsteel Holdings Luxembourg S.à r.l. and ArcelorMittal South Africa, which provided the Company with an international network of traders and trading channels including the shipping of steel. The Company recorded a 132 impairment to adjust the carrying amount of the investment to the expected sale proceeds partially offset by a 142 gain following the recycling upon closing of the sale on October 31, 2018 of accumulated foreign exchange translation gains from other comprehensive income to income (loss) from investments in associates, joint ventures and other investments. The fair value measurement was determined using the contract price, a Level 3 unobservable input.
VAMA
Valin ArcelorMittal Automotive Steel (“VAMA”) is a joint venture between ArcelorMittal and Hunan Valin which produces steel for high-end applications in the automobile industry. VAMA supplies international automakers and first-tier suppliers as well as Chinese car manufacturers and their supplier networks.
| | |
186 Consolidated financial statements |
Calvert
AM/NS Calvert ("Calvert"), a joint venture between the Company and NSC, is a steel processing plant in Calvert, Alabama, United States. Calvert had a 6-year agreement to purchase 2 million tonnes of slabs annually from ThyssenKrupp Steel USA ("TK CSA"), an integrated steel mill complex located in Rio de Janeiro, Brazil, using a market-based price formula. TK CSA had an option to extend the agreement for an additional 3 years on terms that are more favorable to the joint venture, as compared with the initial 6-year period. In December 2017 and in connection with the acquisition of TK CSA by Ternium S.A., the agreement was amended to (i) extend the term of the agreement to December 31, 2020, (ii) make a corresponding reduction in the annual slab purchase obligation so that the aggregate slab purchase obligation over the full term of the agreement remained the same and (iii) eliminate TK CSA’s extension option. The remaining slabs for Calvert's operations are sourced from ArcelorMittal plants in Brazil and Mexico and from ArcelorMittal USA, which following the divestment to Cleveland-Cliffs, entered on December 9, 2020 into a new five year agreement with Calvert (with an automatic three year
extension unless either party provides notice of intent to terminate) for 1.5 million tonnes annually for the initial term and 0.55 million tonnes annually under the extension and which can be reduced with a six month notice. ArcelorMittal is principally responsible for marketing the product on behalf of the joint venture. Calvert serves the automotive, construction, pipe and tube, service center and appliance/ HVAC industries.
Tameh
Tameh is a joint venture between ArcelorMittal and Tauron Group including four energy production facilities located in Poland and the Czech Republic. Tameh’s objective is to ensure energy supply to the Company’s steel plants in Poland and external customers in the Czech Republic as well as the utilization of steel plant gases for energy production processes.
Borçelik
Borçelik Çelik Sanayii Ticaret Anonim Şirketi ("Borçelik"), incorporated and located in Turkey, is a joint venture between ArcelorMittal and Borusan Holding involved in the manufacturing and sale of cold-rolled and galvanized flat steel products.
| | |
Consolidated financial statements 187 |
| (millions of U.S. dollars, except share and per share data) |
2.4.2 Associates
The following table summarizes the financial information and reconciles it to the carrying amount of each of the Company’s material associates, as well as the income statement of the Company’s material associates:
| | | | | | | | | | | | | | | | | | | | | | | | | | | | | | | | |
| | December 31, 2020 |
| Associates | | China Oriental | | DHS Group | | Gonvarri Steel Industries | | Baffinland 6 | | Total |
| Financial statements reporting date | | June 30, 2020 | | September 30, 2020 | | September 30, 2020 | | December 31, 2020 | | |
Place of incorporation and operation1 | | Bermuda | | Germany | | Spain | | Canada | | |
| Principal Activity | | Iron and steel manufacturing | | Steel manufacturing 3 | | Steel manufacturing 4 | | Extraction of iron ore 5 | | |
| Ownership and voting rights at December 31, 2020 | | 37.02 | % | | 33.43 | % | | 35.00 | % | | 25.23 | % | | |
| Current assets | | 3,611 | | | 1,330 | | | 2,233 | | | 538 | | | 7,712 | |
| Non-current assets | | 2,507 | | | 2,810 | | | 1,675 | | | 8,295 | | | 15,287 | |
| Current liabilities | | 2,780 | | | 364 | | | 1,087 | | | 479 | | | 4,710 | |
| Non-current liabilities | | 454 | | | 1,165 | | | 772 | | | 1,050 | | | 3,441 | |
| Non-controlling interests | | 46 | | | 112 | | | 288 | | | 1 | | | 447 | |
| Net assets attributable to equity holders of the parent | | 2,838 | | | 2,499 | | | 1,761 | | | 7,303 | | | 14,401 | |
| Company's share of net assets | | 1,050 | | | 835 | | | 616 | | | 1,843 | | | 4,344 | |
| Adjustments for differences in accounting policies and other | | — | | | 38 | | | (49) | | | (1,456) | | | (1,467) | |
Other adjustments2 | | 112 | | | (201) | | | 59 | | | — | | | (30) | |
| Carrying amount in the statements of financial position | | 1,162 | | | 672 | | | 626 | | | 387 | | | 2,847 | |
| Revenue | | 2,420 | | | 1,428 | | | 3,065 | | | 772 | | | 7,685 | |
| | | | | | | | | | |
| Profit (loss) from continuing operations | | 112 | | | (244) | | | 86 | | | 73 | | | 27 | |
| Other comprehensive income (loss) | | 16 | | | (5) | | | (67) | | | — | | | (56) | |
| Total comprehensive income (loss) | | 128 | | | (249) | | | 19 | | | 73 | | | (29) | |
| Cash dividends received by the Company | | 28 | | | — | | | 15 | | | — | | | 43 | |
1.The country of incorporation corresponds to the country of operation except for China Oriental whose country of operation is China.
2.Other adjustments correspond to the difference between the carrying amount at December 31, 2020 and the net assets situation corresponding to the latest financial statements ArcelorMittal is permitted to disclose translated with closing rates as of the reporting dates described in the table above. For the year ended December 31, 2020, the Company recognized a 211 impairment loss with respect to its investment in DHS.
3.The amount for DHS Group includes an adjustment to align the German GAAP financial information with the Company’s accounting policies and is mainly linked to property, plant and equipment, inventory and pension.
4.Adjustments in Gonvarri Steel Industries primarily relate to differences in accounting policies regarding revaluation of fixed assets.
5.Adjustments in Baffinland primarily relate to differences in accounting policies regarding revaluation of fixed assets and locally recognized goodwill. In September 2020, following a legal reorganization that was not a business combination for the Company, its share of provisional fair value remeasurement of 1.5 billion was not recognized in the carrying amount of Baffinland.
6.Following a legal reorganization in September 2020, the Company holds an indirect interest in Baffinland through Nunavut Iron Ore Inc. The summarized statement of comprehensive income presents full year result for Baffinland (direct owner and operator of Mary River project).
| | |
188 Consolidated financial statements |
| | | | | | | | | | | | | | | | | | | | | | | | | | | | | | | | |
| | December 31, 2019 |
| Associates | | China Oriental | | DHS Group | | Gonvarri Steel Industries | | Baffinland | | Total |
| Financial statements reporting date | | June 30, 2019 | | September 30, 2019 | | September 30, 2019 | | December 31, 2019 | | |
Place of incorporation and operation1 | | Bermuda | | Germany | | Spain | | Canada | | |
| Principal Activity | | Iron and steel manufacturing | | Steel manufacturing 3 | | Steel manufacturing 4 | | Extraction of iron ore 5 | | |
| Ownership and voting rights at December 31, 2019 | | 37.02 | % | | 33.43 | % | | 35.00 | % | | 25.70 | % | | |
| Current assets | | 2,920 | | | 1,385 | | | 2,062 | | | 479 | | | 6,846 | |
| Non-current assets | | 1,797 | | | 2,794 | | | 1,628 | | | 2,403 | | | 8,622 | |
| Current liabilities | | 1,837 | | | 402 | | | 1,038 | | | 663 | | | 3,940 | |
| Non-current liabilities | | 150 | | | 979 | | | 795 | | | 891 | | | 2,815 | |
| Non-controlling interests | | 44 | | | 122 | | | 218 | | | — | | | 384 | |
| Net assets attributable to equity holders of the parent | | 2,686 | | | 2,676 | | | 1,639 | | | 1,328 | | | 8,329 | |
| Company's share of net assets | | 994 | | | 895 | | | 574 | | | 341 | | | 2,804 | |
| Adjustments for differences in accounting policies and other | | — | | | 43 | | | (49) | | | 7 | | | 1 | |
Other adjustments2 | | 5 | | | 27 | | | 22 | | | — | | | 54 | |
| Carrying amount in the statements of financial position | | 999 | | | 965 | | | 547 | | | 348 | | | 2,859 | |
| Revenue | | 3,102 | | | 1,795 | | | 3,724 | | | 454 | | | 9,075 | |
| | | | | | | | | | |
| Profit (loss) from continuing operations | | 249 | | | (116) | | | 82 | | | (72) | | | 143 | |
| Other comprehensive income (loss) | | — | | | 8 | | | (7) | | | — | | | 1 | |
| Total comprehensive income (loss) | | 249 | | | (108) | | | 75 | | | (72) | | | 144 | |
| Cash dividends received by the Company | | 57 | | | — | | | 13 | | | — | | | 70 | |
1.The country of incorporation corresponds to the country of operation except for China Oriental whose country of operation is China.
2.Other adjustments correspond to the difference between the carrying amount at December 31, 2019 and the net assets situation corresponding to the latest financial statements ArcelorMittal is permitted to disclose as of the reporting dates described in the table above.
3.The amount for DHS Group includes an adjustment to align the German GAAP financial information with the Company’s accounting policies and is mainly linked to property, plant and equipment, inventory and pension.
4.Adjustments in Gonvarri Steel Industries primarily relate to differences in accounting policies regarding revaluation of fixed assets.
5.Adjustments in Baffinland primarily relate to differences in accounting policies regarding revaluation of fixed assets and locally recognized goodwill.
| | |
Consolidated financial statements 189 |
| (millions of U.S. dollars, except share and per share data) |
| | | | | | | | | | | | | | | | | | | | | | | | | | | | | | | | |
| | | December 31, 2018 |
| Associates | | China Oriental | | DHS Group | | Gonvarri Steel Industries | | Baffinland | | Total |
| Financial statements reporting date | | June 30, 2018 | | September 30, 2018 | | September 30, 2018 | | December 31, 2018 | | |
Place of incorporation and operation1 | | Bermuda | | Germany | | Spain | | Canada | | |
| Principal Activity | | Iron and steel manufacturing | | Steel manufacturing 3 | | Steel manufacturing 4 | | Extraction of iron ore 5 | | |
| Ownership and voting rights at December 31, 2018 | | 37.02 | % | | 33.43 | % | | 35.00 | % | | 28.76 | % | | |
| Current assets | | 2,516 | | | 1,528 | | | 2,183 | | | 390 | | | 6,617 | |
| Non-current assets | | 1,443 | | | 3,062 | | | 1,526 | | | 1,949 | | | 7,980 | |
| Current liabilities | | 1,426 | | | 480 | | | 1,134 | | | 399 | | | 3,439 | |
| Non-current liabilities | | 35 | | | 1,005 | | | 677 | | | 694 | | | 2,411 | |
| Non-controlling interests | | 45 | | | 136 | | | 219 | | | — | | | 400 | |
| Net assets attributable to equity holders of the parent | | 2,453 | | | 2,969 | | | 1,679 | | | 1,246 | | | 8,347 | |
| Company's share of net assets | | 908 | | | 992 | | | 588 | | | 358 | | | 2,846 | |
| Adjustments for differences in accounting policies and other | | — | | | 27 | | | (52) | | | 22 | | | (3) | |
Other adjustments2 | | 44 | | | (4) | | | (12) | | | — | | | 28 | |
| Carrying amount in the statements of financial position | | 952 | | | 1,015 | | | 524 | | | 380 | | | 2,871 | |
| Revenue | | 3,370 | | | 1,959 | | | 3,544 | | | 320 | | | 9,193 | |
| | | | | | | | | | |
| Profit (loss) from continuing operations | | 474 | | | 20 | | | 60 | | | (98) | | | 456 | |
| Other comprehensive income (loss) | | — | | | 5 | | | (37) | | | — | | | (32) | |
| Total comprehensive income (loss) | | 474 | | | 25 | | | 23 | | | (98) | | | 424 | |
| Cash dividends received by the Company | | 92 | | | 5 | | | 16 | | | — | | | 113 | |
1.The country of incorporation corresponds to the country of operation except for China Oriental whose country of operation is China.
2.Other adjustments correspond to the difference between the carrying amount at December 31, 2018 and the net assets situation corresponding to the latest financial statements ArcelorMittal is permitted to disclose as of the reporting dates described in the table above.
3.The amount for DHS Group includes an adjustment to align the German GAAP financial information with the Company’s accounting policies, and is mainly linked to property, plant and equipment, inventory and pension.
4.Adjustments in Gonvarri Steel Industries primarily relate to differences in accounting policies regarding revaluation of fixed assets.
5.Adjustments in Baffinland primarily relate to differences in accounting policies regarding revaluation of fixed assets and locally recognized goodwill.
China Oriental
China Oriental Group Company Limited (“China Oriental”) is a Chinese integrated iron and steel company listed on the Hong Kong Stock Exchange (“HKEx”). On January 27, 2017, in order to restore the minimum free float requirement, China Oriental issued 586,284,000 new shares resulting in a decrease of the Company’s interest from 46.99% to 39.02%. As a result, ArcelorMittal recorded a loss of 67 upon dilution partially offset by a gain of 23 following the recycling of accumulated foreign exchange translation gains from other comprehensive income to income from investments in associates, joint ventures and other investments. The trading of China Oriental’s shares, which had been suspended since April 29, 2014, resumed on February 1, 2017.
In January 2018, China Oriental issued 192 million new shares to fulfill its obligations under its share-based compensation plans. As a result, ArcelorMittal’s interest in China Oriental
decreased to 37.02%. ArcelorMittal recorded a loss of 20 upon dilution partially offset by a gain of 8 following the recycling of accumulated foreign exchange translation gains in income from investments in associates, joint ventures and other investments.
DHS Group
DHS - Dillinger Hütte Saarstahl AG (“DHS Group”), incorporated and located in Germany, is a leading producer of heavy steel plates, cast slag pots and semi-finished products, such as pressings, pressure vessel heads and shell sections in Europe. The DHS Group also includes a further rolling mill operated by Dillinger France in Dunkirk (France). As of December 31, 2020, as a result of lower cash flow projections resulting from weaker market conditions partially linked to the COVID-19 pandemic, the Company identified an impairment trigger with respect to its investment in DHS and recognized accordingly a 211 impairment charge. The Company calculated the fair value of its investment in DHS using a discounted cash flow model (using a discount rate of 7.24%), a level 3 unobservable input.
| | |
190 Consolidated financial statements |
Gonvarri Steel Industries
Holding Gonvarri SL (“Gonvarri Steel Industries”) is dedicated to the processing of steel. The entity is a European leader in steel service centers and renewable energy components, with strong presence in Europe and Latin America.
Baffinland
Baffinland owns the Mary River project, which has direct shipping, high grade iron ore on Baffin Island in Nunavut (Canada). During 2020, ArcelorMittal's shareholding in Baffinland slightly decreased from 25.70% to 25.23% following capital calls exclusively fulfilled by Nunavut Iron Ore Inc. ("NIO"), the other shareholder. In September 2020, the corporate structure was reorganized whereby NIO became the parent company of Baffinland, and ArcelorMittal together with The Energy and Minerals Group ("EMG") became shareholders of NIO with ArcelorMittal's share in NIO and thus Baffinland unchanged at 25.23%.
NIO accounted for the acquisition of Baffinland as a business combination and the acquisition-date fair value of assets and
liabilities is provisional at December 31, 2020. This legal reorganization was not a business combination for the Company which accordingly did not recognize its share of the provisional fair value measurement in the carrying amount of Baffinland.
During 2018 and 2019 the Company's shareholding in Baffinland decreased from 31.07% to 28.76% and 25.70%, respectively, following capital calls exclusively fulfilled by NIO. The Company recognized losses in 2018 and 2019 on dilution of 3 and 4 including the recycling of accumulated foreign exchange translation losses of 9 and 12, respectively, in income (loss) from investments in associates, joint ventures and other investments.
2.4.3 Other associates and joint ventures that are not individually material
The Company has interests in a number of other joint ventures and associates, none of which are regarded as individually material. The following table summarizes the financial information of all individually immaterial joint ventures and associates that are accounted for using the equity method:
| | | | | | | | | | | | | | | | | | | | | | | | | | | | | | | | | | | | | | |
| | December 31, 2020 | | December 31, 2019 |
| | Associates | | Joint Ventures | | Total | | Associates | | Joint Ventures | | Total |
| Carrying amount of interests in associates and joint ventures | | 328 | | | 636 | | | 964 | | | 304 | | | 780 | | | 1,084 | |
| Share of: | | | | | | | | | | | | |
| Income from continuing operations | | 15 | | | 33 | | | 48 | | | 26 | | | 87 | | | 113 | |
| Other comprehensive income (loss) | | (8) | | | (20) | | | (28) | | | 1 | | | 2 | | | 3 | |
| Total comprehensive income | | 7 | | | 13 | | | 20 | | | 27 | | | 89 | | | 116 | |
During 2019, the Company converted 31 of shareholders loans into equity and made an additional cash injection of 30 to its joint venture ArcelorMittal Tubular Products Jubail (“Al Jubail”) to maintain 40.80% interest in the joint venture in line with shareholding restructuring, which resulted in an increase of carrying amount of the investment from nil as of December 31, 2018 to 26 as of December 31, 2019 including the Company's share of accumulated net losses, which were recognized against shareholder loans as of December 31, 2018 (as carrying amount of investment was nil). The Company had outstanding shareholder loans given to Al Jubail for 109 as of December 31, 2020 and 2019.
2.4.4 Impairment of associates and joint ventures
For the year ended December 31, 2020, the Company recognized a 211 impairment loss with respect to its investment in DHS. For the years ended December 31, 2020, 2019 and 2018, the Company identified an impairment indicator with respect to its investment and shareholder loans in Al Jubail. Accordingly, it performed a value in use calculation and concluded the carrying amount of the investment and shareholder loans was recoverable. For the remaining
investments, the Company concluded there were no impairment triggers.
The Company is not aware of any material contingent liabilities related to associates and joint ventures for which it is severally liable for all or part of the liabilities of the associates, nor are there any contingent liabilities incurred jointly with other investors. See note 9.4 for disclosure of commitments related to associates and joint ventures.
2.4.5 Investments in joint operations
The Company had investments in the following joint operations as of December 31, 2020 and 2019:
Peña Colorada
Peña Colorada is an iron ore mine located in Mexico in which ArcelorMittal holds a 50.00% interest. Peña Colorada operates an open pit mine as well as concentrating facility and two-line pelletizing facility.
Hibbing Taconite Mines
The Hibbing Taconite Mines in which the Company held a 62.31% interest are iron ore mines located in the USA and
| | |
Consolidated financial statements 191 |
| (millions of U.S. dollars, except share and per share data) |
operations consist of open pit mining, crushing, concentrating and pelletizing. The Company assumed the managing partner role of Hibbing Taconite company in August 2019 following the resignation of Cleveland-Cliffs without changes in the ownership group.
I/N Tek
I/N Tek in which the Company held a 60.00% interest operates a cold-rolling mill in the United States.
Double G Coating
ArcelorMittal held a 50.00% interest in Double G Coating, a hot dip galvanizing and Galvalume facility in the United States.
On December 9, 2020, the Company completed the sale of its interests in Hibbing Taconite Mines, I/N Tek and Double G Coating to Cleveland-Cliffs as part of the ArcelorMittal USA Divestment Business (note 2.3.1).
Peña Colorada, Hibbing Taconite Mines and other joint operations are part of the NAFTA segment.
2.5 Other investments
Other investments include those investments in equity instruments for which the Company does not have significant influence. The Company irrevocably elected to present the changes in fair value of such equity instruments, which are not held for trading, in other comprehensive income, because these investments are held as long-term strategic investments that are not expected to be sold in the short to medium term. Other investments include the following:
| | | | | | | | | | | |
| December 31, |
| 2020 | | 2019 |
| Cleveland-Cliffs | 1,988 | | | — | |
| Erdemir | 850 | | | 642 | |
| Stalprodukt S.A. | 96 | | | 57 | |
| Powercell Sweden | — | | | 23 | |
| Others | 46 | | | 50 | |
| Investments in equity instruments at FVOCI | 2,980 | | | 772 | |
The Company’s significant investments in equity instruments at FVOCI at December 31, 2020 and 2019 are the following:
Cleveland-Cliffs
Cleveland-Cliffs was historically the largest and oldest independent iron ore mining company in the United States and it became the largest flat-rolled steel company and largest iron ore pellet producer in North America in 2020 after the acquisition of AK Steel and ArcelorMittal USA Divestment Business. It is vertically integrated from mining through iron making, steelmaking, rolling, finishing and downstream with hot and cold
stamping of steel parts and components. As part of the consideration for the sale of ArcelorMittal USA Divestment Business to Cleveland-Cliffs as described in note 2.3.1, on December 9, 2020, ArcelorMittal received 78,186,671 common shares with a value of 1,020 and representing a 16% stake in Cleveland-Cliffs and 583,273 non-voting preferred shares with a value of 761. The non-voting preferred shares are redeemable at Cleveland-Cliff’s option for 58,327,300 of its common shares or an equivalent amount in cash. Unrealized gains recognized in other comprehensive income were 119 for the common shares and 88 preferred shares for the year ended December 31, 2020.
On February 9, 2021, ArcelorMittal announced an agreement to sell 40 million Cleveland-Cliffs' common shares for total gross proceeds of 652 (net proceeds of $16.12 per share) as part of a combined primary and secondary public offering of Cleveland-Cliffs' shares. Following the sale, ArcelorMittal continues to hold 38 million common shares in addition to the preferred shares described above. The proceeds from the sale of Cleveland-Cliffs' common shares will be used for a new share buyback program of ArcelorMittal common shares. The accumulated gain of 123 recognized in other comprehensive income was transferred to retained earnings in February 2021.
Ereĝli Demir ve Çelik Fabrikalari T.A.S. (“Erdemir”)
Erdemir is the leading steel producer in Turkey and produces plates, hot and cold rolled, tin chromium and zinc coated flat steel and supplies basic inputs to automotive, white goods, pipes and tubes, rolling, manufacturing, electrics-electronics, mechanical engineering, energy, heating equipment, shipbuilding, defense and packaging industries. Unrealized gains recognized in other comprehensive income were 386 and 196 for the year ended December 31, 2020 and 2019, respectively.
Stalprodukt S.A.
Stalprodukt S.A. is a leading manufacturer and exporter of highly processed steel products based in Poland. Unrealized (losses) recognized in other comprehensive income were (1) and (32) for the year ended December 31, 2020 and 2019, respectively.
Powercell Sweden AB
Powercell Sweden AB is the leading developer and producer of fuel cell stacks and systems, powered by hydrogen, and produce electricity and heat with no emissions other than water. In 2019 and 2020 the Company sold in aggregate 3.4 million and 1.8 million remaining shares of Powercell Sweden AB for total consideration of 36 and 59, respectively. The accumulated gain recognized in other comprehensive income of 19 and 28, respectively was transferred to retained earnings.
| | |
192 Consolidated financial statements |
Gerdau
Gerdau is the largest producer of long steel in the Americas and is headquartered in Brazil. The accumulated gain recognized in other comprehensive income was 48 at December 31, 2018. On July 16, 2019, the Company sold its 30 million shares, representing a 2.6% stake of preferred shares for 116 in line with Company's ongoing efforts to optimize and unlock value from its asset portfolio that no longer coincides with the Company's investment strategy. The accumulated gain recognized in other comprehensive income of 51 was transferred to retained earnings.
Unconsolidated structured entities
Global Chartering has lease arrangements for two vessels (Panamax Bulk Carriers) involving structured entities whose main purpose is to hold legal title of the two vessels and to lease them to Global Chartering. Such entities are wholly-owned and controlled by a financial institution and are funded through equity instruments by the financial institution. Lease arrangements began for one vessel in 2013 and for the second vessel in 2014. On December 31, 2019, following the sale of a 50% controlling interest in Global Chartering to DryLog (see note 2.3.1), the Company's remaining 50% interest in Global Chartering is accounted for under the equity method and therefore ArcelorMittal no longer has any involvement with the structured entities since December 31, 2019.
2.6 Income (loss) from investments in associates, joint ventures and other investments
Income (loss) from investments in associates, joint ventures and other investments consisted of the following:
| | | | | | | | | | | | | | | | | |
| Year ended December 31, |
| 2020 | | 2019 | | 2018 |
| Share in net earnings of equity-accounted companies | 430 | | | 252 | | | 567 | |
| Impairment charges | (211) | | | — | | | (132) | |
| Gain (loss) on disposal | — | | | (4) | | | 126 | |
| Dividend income | 15 | | | 99 | | | 91 | |
| Total | 234 | | | 347 | | | 652 | |
For the year ended December 31, 2020, impairment charges of 211 related to DHS where the carrying value of the investment exceeded its fair value (see note 2.4.2).
For the year ended December 31, 2019, the loss on disposal corresponded to the loss on dilution of the Company's interest in Baffinland (see note 2.4.2).
For the year ended December 31, 2018, impairment charges included 132 relating to Macsteel in connection with the sale completed on October 31, 2018 (see note 2.4.1).
For the year ended December 31, 2018, gain (loss) on disposal included mainly a 142 gain from the recycling of the currency translation reserve following the sale of Macsteel and a 12 loss on the dilution of the Company's interest from 39.02% to 37.02% in China Oriental (see note 2.4).
During 2017, the Company sold its 21% shareholding in Empire Iron Mining Partnership ("EIMP") to Cleveland-Cliffs for total consideration of 133, whereas the cash settlement occurred through three annual installments of which 44 in 2019 and 2018, respectively.
NOTE 3: SEGMENT REPORTING
3.1 Reportable segments
As from April 1, 2021, ArcelorMittal implemented changes to its organizational structure whereby primary responsibility for captive mining operations whose output is mainly consumed by their respective steel segments has been transferred to such segments. The Mining segment will retain primary responsibility for the operation of the seaborne oriented operations at AMMC and ArcelorMittal Liberia Ltd, and will continue to provide technical support to all mining operations within the Company. Accordingly, the Company modified the structure of its segment information in order to reflect changes in its approach to managing its operations and segment disclosures have been recast to reflect this new segmentation in conformity with IFRS. Only the seaborne-oriented operations of AMMC and ArcelorMittal Liberia Ltd are reported within the Mining segment. The results of all other mines are henceforth accounted for within the steel segment that it primarily supplies.
The Company is organized in five operating and reportable segments, which are components engaged in business activities from which they earn revenues and incur expenses (including revenues and expenses relating to transactions with other components of the Company), for which discrete financial information is available and whose operating results are evaluated regularly by the chief operating decision maker “CODM” to make decisions about resources to be allocated to the segment and assess its performance. The Company's CODM as of December 31, 2020 was the CEO Office - comprising the Chairman and Chief Executive Officer, Mr. Lakshmi N. Mittal and the President and Chief Financial Officer of ArcelorMittal, Mr. Aditya Mittal. On February 11, 2021, the Board of Directors of ArcelorMittal announced that Aditya Mittal became Chief Executive Officer of the Company (see note 13).
ArcelorMittal's operating segments include the attributable goodwill, intangible assets, property, plant and equipment, and certain equity method investments. They do not include cash and short-term deposits, short-term investments, tax assets and
| | |
Consolidated financial statements 193 |
| (millions of U.S. dollars, except share and per share data) |
other current financial assets. Attributable liabilities are also those resulting from the normal activities of the segment, excluding tax liabilities and indebtedness but including post retirement obligations where directly attributable to the segment. The treasury function is managed centrally for the Company and is not directly attributable to individual operating segments or geographical areas.
ArcelorMittal’s segments are structured as follows:
•NAFTA represents the flat, long and tubular facilities of the Company located in Canada, Mexico and the United States (on December 9, 2020, the Company divested ArcelorMittal USA see note 2.3.1). NAFTA produces flat products such as slabs, hot-rolled coil, cold-rolled coil, coated steel and plate. These products are sold primarily to customers in the following sectors: automotive, energy, construction, packaging and appliances and via distributors or processors. NAFTA also produces long products such as wire rod, sections, rebar, billets, blooms and wire drawing, and tubular products.The raw material supply of the NAFTA operations includes sourcing from iron ore captive mines in Mexico and iron ore and coal captive mines the United States (until disposal of ArcelorMittal USA on December 9, 2020 as mentioned above) to supply the steel facilities.
•Brazil includes the flat operations of Brazil, the long and tubular operations of Brazil and neighboring countries including Argentina, Costa Rica and Venezuela. Flat products include slabs, hot-rolled coil, cold-rolled coil and coated steel. Long products consist of wire rod, sections, bar and rebar, billets, blooms and wire drawing. The raw material supply of the Brazil operations includes sourcing from iron ore captive mines in Brazil.
•Europe is the largest flat steel producer in Europe, with operations that range from Spain in the west to Romania in the east, and covering the flat carbon steel product portfolio in all major countries and markets. Europe produces hot-rolled coil, cold-rolled coil, coated products, tinplate, plate and slab. These products are sold primarily to customers in the automotive, general and packaging sectors. Europe also produces long products consisting of sections, wire rod, rebar, billets, blooms and wire drawing, and tubular products. In addition, it includes Downstream Solutions, primarily an in-house trading and distribution arm of ArcelorMittal. Downstream Solutions also provides value-added and customized steel solutions through further steel processing to meet specific customer requirements. The raw material supply of Europe operations includes sourcing from iron ore captive mines in Bosnia & Herzegovina.
•ACIS produces a combination of flat, long and tubular products. Its steel facilities are located in South Africa, Ukraine and Kazakhstan. The raw material supply of the ACIS operations includes sourcing from iron ore captive mines in Kazakhstan and Ukraine and coal captive mines in Kazakhstan.
•The Mining segment comprises the mines owned by ArcelorMittal in Canada and Africa (Liberia). It provides the Company's steel operations with high quality and low-cost iron ore reserves and also sells mineral products to third parties.
| | |
194 Consolidated financial statements |
The following table summarizes certain financial data for ArcelorMittal’s operations by reportable segments.
| | | | | | | | | | | | | | | | | | | | | | | | | | | | | | | | | | | | | | | | | | | | | | | |
| NAFTA | | Brazil | | Europe | | ACIS | | Mining | | Others 1 | | Elimination | | Total |
| Year ended December 31, 2020 | | | | | | | | | | | | | | | |
| Sales to external customers | 13,438 | | | 5,613 | | | 27,989 | | | 5,034 | | | 1,185 | | | 11 | | | — | | | 53,270 | |
Intersegment sales 2 | 230 | | | 723 | | | 82 | | | 703 | | | 1,600 | | | 13 | | | (3,351) | | | — | |
| Operating income (loss) | 1,684 | | | 777 | | | (1,439) | | | 209 | | | 1,247 | | | (268) | | | (100) | | | 2,110 | |
| Depreciation and amortization | (537) | | | (228) | | | (1,418) | | | (492) | | | (243) | | | (42) | | | — | | | (2,960) | |
| Impairment reversal (impairment) | 660 | | | — | | | (527) | | | — | | | — | | | — | | | — | | | 133 | |
| Capital expenditures | 527 | | | 217 | | | 1,040 | | | 476 | | | 140 | | | 39 | | | — | | | 2,439 | |
| Year ended December 31, 2019 | | | | | | | | | | | | | | | |
| Sales to external customers | 18,590 | | | 6,980 | | | 37,487 | | | 6,506 | | | 981 | | | 71 | | | — | | | 70,615 | |
Intersegment sales 2 | 116 | | | 1,186 | | | 234 | | | 491 | | | 1,683 | | | 353 | | | (4,063) | | | — | |
| Operating income (loss) | (1,144) | | | 853 | | | (1,101) | | | 31 | | | 1,026 | | | (285) | | | (7) | | | (627) | |
| Depreciation and amortization | (638) | | | (277) | | | (1,261) | | | (499) | | | (237) | | | (155) | | | — | | | (3,067) | |
| Impairment | (1,300) | | | — | | | (525) | | | (102) | | | — | | | — | | | — | | | (1,927) | |
| Capital expenditures | 828 | | | 360 | | | 1,355 | | | 673 | | | 185 | | | 171 | | | — | | | 3,572 | |
| Year ended December 31, 2018 | | | | | | | | | | | | | | | |
| Sales to external customers | 20,255 | | | 7,083 | | | 40,247 | | | 7,527 | | | 836 | | | 85 | | | — | | | 76,033 | |
Intersegment sales 2 | 215 | | | 1,678 | | | 241 | | | 581 | | | 1,390 | | | 307 | | | (4,412) | | | — | |
| Operating income (loss) | 1,988 | | | 1,370 | | | 1,636 | | | 1,129 | | | 707 | | | (247) | | | (44) | | | 6,539 | |
| Depreciation and amortization | (593) | | | (301) | | | (1,201) | | | (432) | | | (217) | | | (55) | | | — | | | (2,799) | |
Bargain purchase gain3 | — | | | — | | | 209 | | | — | | | — | | | — | | | — | | | 209 | |
| Impairment | — | | | (86) | | | (908) | | | — | | | — | | | — | | | — | | | (994) | |
| Capital expenditures | 758 | | | 256 | | | 1,340 | | | 704 | | | 210 | | | 37 | | | — | | | 3,305 | |
1.Others include all other operational and non-operational items which are not segmented, such as corporate and shared services, financial activities, and shipping and logistics.
2.Transactions between segments are reported on the same basis of accounting as transactions with third parties.
3.See note 2.2.4.
The reconciliation from operating income to net income (including non-controlling interests) is as follows:
| | | | | | | | | | | | | | | | | |
| Year ended December 31, |
| 2020 | | 2019 | | 2018 |
| Operating (loss)/income | 2,110 | | | (627) | | | 6,539 | |
| Income from investments in associates and joint ventures | 234 | | | 347 | | | 652 | |
| Financing costs - net | (1,256) | | | (1,652) | | | (2,210) | |
| (Loss) income before taxes | 1,088 | | | (1,932) | | | 4,981 | |
| Income tax expense (benefit) | 1,666 | | | 459 | | | (349) | |
| Net (loss) income (including non-controlling interests) | (578) | | | (2,391) | | | 5,330 | |
The Company does not regularly provide a measure of total assets and liabilities for each reportable segment to the CODM.
3.2 Geographical information
Geographical information, by country or region, is separately disclosed and represents ArcelorMittal’s most significant regional markets. Attributed assets are operational assets employed in each region and include items such as pension balances that are specific to a country. Unless otherwise stated in the table heading as a segment disclosure, these disclosures are specific to the country or region stated. They do not include
goodwill, deferred tax assets, other investments or receivables and other non-current financial assets. Attributed liabilities are those arising within each region, excluding indebtedness.
| | |
Consolidated financial statements 195 |
| (millions of U.S. dollars, except share and per share data) |
Sales (by destination)
| | | | | | | | | | | | | | | | | |
| Year ended December 31, |
| | 2020 | | 2019 | | 2018 |
| Americas | | | | | |
United States 1 | 9,991 | | | 15,238 | | | 16,271 | |
| Brazil | 4,396 | | | 5,094 | | | 4,982 | |
| Canada | 2,537 | | | 3,004 | | | 3,563 | |
| Mexico | 1,707 | | | 1,941 | | | 1,970 | |
| Argentina | 679 | | | 814 | | | 960 | |
| | | | | |
| Others | 872 | | | 1,195 | | | 1,322 | |
| Total Americas | 20,182 | | | 27,286 | | | 29,068 | |
| | | | | |
| Europe | | | | | |
| Germany | 4,200 | | | 5,694 | | | 6,757 | |
| Poland | 3,231 | | | 3,957 | | | 4,518 | |
| France | 3,115 | | | 4,114 | | | 4,431 | |
| Spain | 2,817 | | | 3,855 | | | 4,265 | |
| Italy | 3,195 | | | 4,317 | | | 3,333 | |
| Czech Republic | 752 | | | 1,244 | | | 1,782 | |
| Turkey | 1,075 | | | 1,499 | | | 1,683 | |
| United Kingdom | 966 | | | 1,434 | | | 1,471 | |
| Belgium | 1,274 | | | 1,617 | | | 1,309 | |
| Netherlands | 878 | | | 1,142 | | | 1,209 | |
| Russia | 804 | | | 876 | | | 1,144 | |
| Romania | 335 | | | 720 | | | 708 | |
Ukraine 2 | 515 | | | 540 | | | 635 | |
| Others | 3,148 | | | 4,359 | | | 5,018 | |
| Total Europe | 26,305 | | | 35,368 | | | 38,263 | |
| | | | | |
| Asia & Africa | | | | | |
| South Africa | 1,366 | | | 2,260 | | | 2,742 | |
| Morocco | 492 | | | 583 | | | 628 | |
| Egypt | 103 | | | 309 | | | 206 | |
| Rest of Africa | 619 | | | 1,278 | | | 1,257 | |
| China | 1,622 | | | 676 | | | 608 | |
| Kazakhstan | 425 | | | 470 | | | 496 | |
| South Korea | 331 | | | 380 | | | 365 | |
| India | 142 | | | 95 | | | 92 | |
| Rest of Asia | 1,683 | | | 1,910 | | | 2,308 | |
| Total Asia & Africa | 6,783 | | | 7,961 | | | 8,702 | |
| | | | | |
| Total | 53,270 | | | 70,615 | | | 76,033 | |
1.On December 9, 2020, the Company completed the sale of ArcelorMittal USA. The sales of the operations disposed of were consolidated by ArcelorMittal until December 9, 2020, see note 2.3.1.
2.Ukraine is presented separately in 2020, due to the increased contribution. In prior periods Ukraine was included in others. The comparative periods are revised to align with the current presentation.
Revenues from external customers attributed to the country of domicile (Luxembourg) were 114, 151 and 162 for the years ended December 31, 2020, 2019 and 2018, respectively.
Non-current assets1 per significant country:
| | | | | | | | | | | |
| December 31, |
| 2020 | | 2019 |
| Americas | | | |
| Canada | 5,213 | | | 5,336 | |
| Brazil | 3,330 | | | 4,254 | |
United States 2 | 116 | | | 2,878 | |
| Mexico | 1,457 | | | 1,408 | |
| Argentina | 249 | | | 266 | |
| Venezuela | 17 | | | 17 | |
| Others | 18 | | | 16 | |
| Total Americas | 10,400 | | | 14,175 | |
| | | |
| Europe | | | |
| France | 4,207 | | | 4,293 | |
| Germany | 2,789 | | | 2,665 | |
| Belgium | 2,712 | | | 2,695 | |
| Poland | 2,546 | | | 2,508 | |
| Ukraine | 2,154 | | | 2,674 | |
| Spain | 2,058 | | | 1,920 | |
Italy 3 | 15 | | | 1,488 | |
| Luxembourg | 1,297 | | | 1,231 | |
| Bosnia and Herzegovina | 189 | | | 188 | |
| Romania | 56 | | | 62 | |
| Czech Republic | 28 | | | 31 | |
| Others | 191 | | | 165 | |
| Total Europe | 18,242 | | | 19,920 | |
| | | |
| Asia & Africa | | | |
| Kazakhstan | 1,401 | | | 1,519 | |
| South Africa | 528 | | | 568 | |
| Liberia | 132 | | | 157 | |
| Morocco | 102 | | | 92 | |
| Others | 137 | | | 128 | |
| Total Asia & Africa | 2,300 | | | 2,464 | |
| Unallocated assets | 23,137 | | | 22,733 | |
| Total | 54,079 | | | 59,292 | |
1.Non-current assets do not include goodwill (as it is not allocated to the individual countries), deferred tax assets, investments in associates and joint ventures, other investments and other non-current financial assets. Such assets are presented under the caption “Unallocated assets”.
2.On December 9, 2020, the Company completed the sale of ArcelorMittal USA assets (see note 2.3.1).
3.On December 10, 2020, the Company signed a binding agreement with Invitalia, an Italian state-owned company, to form a public-private partnership between the parties. As a result, the carrying amounts of the assets of ArcelorMittal Italia was classified as held for sale and will be accounted for under the equity method upon closing of the first investment, see note 2.3.2.
| | |
196 Consolidated financial statements |
3.3 Sales by type of products
The table below presents sales to external customers by product type. In addition to steel produced by the Company, amounts include material purchased for additional transformation and sold through distribution services. Others mainly include non-steel and by-products sales, manufactured and specialty steel products sales, shipping and other services.
| | | | | | | | | | | | | | | | | |
| | Year ended December 31, |
| | 2020 | | 2019 | | 2018 |
| Flat products | 31,584 | | | 43,633 | | | 46,734 | |
| Long products | 11,117 | | | 13,706 | | | 15,751 | |
| Tubular products | 1,343 | | | 2,044 | | | 2,158 | |
| Mining products | 1,451 | | | 1,165 | | | 1,009 | |
| Others | 7,775 | | | 10,067 | | | 10,380 | |
| Total | 53,270 | | | 70,615 | | | 76,033 | |
3.4 Disaggregated revenue
Disaggregated revenue
The tables below summarize the disaggregated revenue recognized from contracts with customers:
| | | | | | | | | | | | | | | | | | | | | | | | | | | | | | | | | | | | | | | | | |
| Year ended December 31, 2020 | NAFTA | | Brazil | | Europe | | ACIS | | Mining | | Others | | Total |
| Steel sales | 12,791 | | | 5,226 | | | 25,437 | | | 4,232 | | | — | | | — | | | 47,686 | |
Non-steel sales 1 | 141 | | | 108 | | | 620 | | | 452 | | | 1,154 | | | — | | | 2,475 | |
By-product sales 2 | 83 | | | 82 | | | 553 | | | 90 | | | — | | | — | | | 808 | |
Other sales 3 | 423 | | | 197 | | | 1,379 | | | 260 | | | 31 | | | 11 | | | 2,301 | |
| Total | 13,438 | | | 5,613 | | | 27,989 | | | 5,034 | | | 1,185 | | | 11 | | | 53,270 | |
| | | | | | | | | | | | | | | | | | | | | | | | | | | | | | | | | | | | | | | | | |
| Year ended December 31, 2019 | NAFTA | | Brazil | | Europe | | ACIS | | Mining | | Others | | Total |
| Steel sales | 17,669 | | | 6,467 | | | 33,759 | | | 5,789 | | | — | | | — | | | 63,684 | |
Non-steel sales 1 | 233 | | | 112 | | | 1,130 | | | 254 | | | 945 | | | — | | | 2,674 | |
By-product sales 2 | 114 | | | 93 | | | 816 | | | 135 | | | — | | | — | | | 1,158 | |
Other sales 3 | 574 | | | 308 | | | 1,782 | | | 328 | | | 36 | | | 71 | | | 3,099 | |
| Total | 18,590 | | | 6,980 | | | 37,487 | | | 6,506 | | | 981 | | | 71 | | | 70,615 | |
| | | | | | | | | | | | | | | | | | | | | | | | | | | | | | | | | | | | | | | | | |
| Year ended December 31, 2018 | NAFTA | | Brazil | | Europe | | ACIS | | Mining | | Others | | Total |
| Steel sales | 19,372 | | | 6,582 | | | 36,603 | | | 6,748 | | | — | | | — | | | 69,305 | |
Non-steel sales 1 | 256 | | | 65 | | | 882 | | | 263 | | | 806 | | | — | | | 2,272 | |
By-product sales 2 | 124 | | | 115 | | | 947 | | | 182 | | | — | | | — | | | 1,368 | |
Other sales 3 | 503 | | | 321 | | | 1,815 | | | 334 | | | 30 | | | 85 | | | 3,088 | |
| Total | 20,255 | | | 7,083 | | | 40,247 | | | 7,527 | | | 836 | | | 85 | | | 76,033 | |
1.Non-steel sales mainly relate to iron ore, coal, scrap and electricity;
2.By-product sales mainly relate to slag, waste and coke by-products;
3.Other sales are mainly comprised of shipping and other services.
| | |
Consolidated financial statements 197 |
| (millions of U.S. dollars, except share and per share data) |
NOTE 4: OPERATING DATA
4.1 Revenue
The Company’s revenue is derived from the single performance obligation to transfer primarily steel and mining products under arrangements in which the transfer of control of the products and the fulfillment of the Company’s performance obligation occur at the same time. Revenue from the sale of goods is recognized when the Company has transferred control of the goods to the buyer and the buyer obtains the benefits from the goods, the potential cash flows and the amount of revenue (the transaction price) can be measured reliably, and it is probable that the Company will collect the consideration to which it is entitled to in exchange for the goods.
Whether the customer has obtained control over the asset depends on when the goods are made available to the carrier or the buyer takes possession of the goods, depending on the delivery terms. For the Company’s steel producing operations, generally the criteria to recognize revenue has been met when its products are delivered to its customers or to a carrier who will transport the goods to its customers, this is the point in time when the Company has completed its performance obligations. Revenue is measured at the transaction price of the consideration received or receivable, the amount the Company expects to be entitled to.
Additionally, the Company identifies when goods have left its premises, not when the customer receives the goods. Therefore, the Company estimates, based on its historical experience, the amount of goods in-transit when the transfer of control occurs at the destination and defers the revenue recognition.
The Company’s products must meet customer specifications. A certain portion of the Company’s products are returned or have claims filed against the sale because the products contained quality defects or other problems. Claims may be either of the following:
–Product Rejection - Product shipped and billed to an end customer that did not meet previously agreed customer specifications. Claims typically result from physical defects in the goods, goods shipped to the wrong location, goods produced with incorrect specifications and goods shipped outside acceptable time parameters.
–Consequential Damages - Damages reported by the customer not directly related to the value of the rejected goods (for example: customer processing cost or mill down time, sampling, storage, sorting, administrative cost, replacement cost, etc.).
The Company estimates the variable consideration for such claims using the expected value method and reduces the amount of revenue recognized.
Warranties:
The warranties and claims arise when the product fails on the criteria mentioned above. Sales-related warranties associated with the goods cannot be purchased separately and they serve as an assurance that the products sold comply with agreed specifications. Accordingly, the Company accounts for warranties in accordance with IAS 37 "Provisions, Contingent Liabilities and Contingent Assets" (see note 9).
Periodically, the Company enters into volume or other rebate programs where once a certain volume or other conditions are met, it refunds the customer some portion of the amounts previously billed or paid. For such arrangements, the Company only recognizes revenue for the amounts it ultimately expects to realize from the customer. The Company estimates the variable consideration for these programs using the most likely amount method or the expected value method, whichever approach best predicts the amount of the consideration based on the terms of the contract and available information and updates its estimates each reporting period.
The Company’s payment terms range from 30 to 90 days from date of delivery, depending on the market and product sold. The Company received 357 as advances from its customers which are classified as unsatisfied performance obligations and recognized as liabilities in line with IFRS 15. The Company expects 100% of these unsatisfied performance obligations as of December 31, 2020 to be recognized as revenue during 2021 as the Company’s contracts have an original expected duration of one year or less.
| | |
198 Consolidated financial statements |
The tables below summarize the movements relating to the Company's trade receivable and other for the years ended December 31, 2020, 2019 and 2018.
| | | | | | | | | | | | | | | | | |
| Year ended December 31, |
| 2020 | | 2019 | | 2018 |
| Trade accounts receivable and other - opening balance | 3,569 | | | 4,432 | | | 3,863 | |
| Performance obligations satisfied | 53,270 | | | 70,615 | | | 76,033 | |
| Payments received | (53,194) | | | (71,559) | | | (75,387) | |
| Impairment of receivables (net of write backs and utilization) | (16) | | | 9 | | | (8) | |
| Reclassification of the period-end receivables to held for sale and derecognition of receivable through business divestment | (724) | | | — | | | (182) | |
| Acquisitions through business combination | — | | | 4 | | | 532 | |
TSR receivables retained in ArcelorMittal USA divestment 1 | 260 | | | — | | | — | |
| Foreign exchange and others | (93) | | | 68 | | | (419) | |
| Trade accounts receivable and other - closing balance | 3,072 | | | 3,569 | | | 4,432 | |
1.See note 6.1.3
4.2 Cost of sales
Cost of sales includes the following components:
| | | | | | | | | | | | | | | | | |
| | Year ended December 31, |
| | 2020 | | 2019 | | 2018 |
| Materials | 34,599 | | | 47,809 | | | 46,842 | |
| Labor costs | 7,690 | | | 9,094 | | | 9,206 | |
| Logistic expenses | 3,474 | | | 4,951 | | | 4,974 | |
| Depreciation and amortization | 2,960 | | | 3,067 | | | 2,799 | |
Gain on bargain purchase1 | — | | | — | | | (209) | |
| Impairment reversal net of impairment (see note 5.3) | (133) | | | 1,927 | | | 994 | |
Gain on AM USA disposal 2 | (1,460) | | | — | | | — | |
| Other | 2,008 | | | 2,039 | | | 2,419 | |
| Total | 49,138 | | | 68,887 | | | 67,025 | |
1.See note 2.2.4
2.See note 2.3.1 for details
4.3 Trade accounts receivable and other
Trade accounts receivable are initially recorded at their transaction price and do not carry any interest. ArcelorMittal maintains an allowance for lifetime expected credit loss at an amount that it considers to be a reliable estimate of expected credit losses resulting from the inability of its customers to make required payments. In judging the adequacy of the allowance for expected credit losses, ArcelorMittal considers multiple factors including historical bad debt experience, the current and forward looking economic environment and the aging of the receivables. Recoveries of trade receivables previously reserved in the
allowance for expected credit losses are recognized as gains in selling, general and administrative expenses.
ArcelorMittal’s policy is to record an allowance for expected lifetime credit losses and a charge in selling, general and administrative expense when a specific account is deemed uncollectible. The Company concluded that a trade receivable is in default when it is overdue by more than 180 days. Based on historical experience and analysis, the Company concluded that there is a risk of default as such receivables are generally not recoverable and therefore provided for, unless the collectibility can be clearly demonstrated. Uninsured trade receivables and the associated allowance are written off when ArcelorMittal has exhausted its recovery efforts and enforcement options. ArcelorMittal considered the continued impact of the COVID-19 pandemic on the economic environment in its risk of default assessment for receivables outstanding less than 180 days. Receivables aged 31 days or older and uninsured trade receivables remain consistent with historical levels and the Company did not identify any expected increased risk of default.
Trade accounts receivable and allowance for lifetime expected credit losses
| | | | | | | | | | | |
| | December 31, |
| | 2020 | | 2019 |
| Gross amount | 3,208 | | | 3,698 | |
| Allowance for lifetime expected credit losses | (136) | | | (129) | |
| Total | 3,072 | | | 3,569 | |
The carrying amount of the trade accounts receivable and other approximates their fair value. Before granting credit to any new customer, ArcelorMittal uses an internally developed credit scoring system to assess the potential customer’s credit quality and to define credit limits by customer. For all significant customers, the credit terms must be approved by the credit committees of each reportable segment. Limits and scoring attributed to customers are reviewed periodically. There are no customers who represent more than 5% of the total balance of trade accounts receivable.
Exposure to credit risk by reportable segment
The maximum exposure to credit risk for trade accounts receivable by reportable segment is as follows:
| | | | | | | | | | | |
| | December 31, |
| | 2020 | | 2019 |
NAFTA 1 | 455 | | | 301 | |
| Brazil | 809 | | | 705 | |
| Europe | 1,396 | | | 1,983 | |
| ACIS | 190 | | | 527 | |
| Mining | 222 | | | 53 | |
| Total | 3,072 | | | 3,569 | |
1.The increase in NAFTA trade receivables is due to the TSR receivables retained as part of the sale of ArcelorMittal USA, see note 4.1.
| | |
Consolidated financial statements 199 |
| (millions of U.S. dollars, except share and per share data) |
Aging of trade accounts receivable
| | | | | | | | | | | | | | | | | | | | | | | | | | | | | | | | | | | |
| | December 31, | | December 31, |
| | 2020 | | 2019 |
| | Gross | | Allowance | | Total | | Gross | | Allowance | | Total |
| Not past due | 2,699 | | | (13) | | | 2,686 | | | 2,851 | | | (11) | | | 2,840 | |
| Overdue 1-30 days | 215 | | | (1) | | | 214 | | | 452 | | | (2) | | | 450 | |
| Overdue 31-60 days | 49 | | | (1) | | | 48 | | | 85 | | | (1) | | | 84 | |
| Overdue 61-90 days | 26 | | | — | | | 26 | | | 43 | | | — | | | 43 | |
| Overdue 91-180 days | 42 | | | (3) | | | 39 | | | 67 | | | (4) | | | 63 | |
| More than 180 days | 177 | | | (118) | | | 59 | | | 200 | | | (111) | | | 89 | |
| Total | 3,208 | | | (136) | | | 3,072 | | | 3,698 | | | (129) | | | 3,569 | |
The movements in the allowance are calculated based on lifetime expected credit loss model for 2020, 2019 and 2018. The allowances in respect of trade accounts receivable during the periods presented are as follows:
| | | | | | | | | | | | | | | | | |
| Year ended December 31, |
| 2020 | | 2019 | | 2018 |
| Allowance - opening balance | 129 | | | 173 | | | 193 | |
| Additions | 27 | | | 18 | | | 35 | |
| Write backs / utilization | (11) | | | (27) | | | (29) | |
| Foreign exchange and others | (9) | | | (35) | | | (26) | |
| Allowance - closing balance | 136 | | | 129 | | | 173 | |
The Company has established a number of programs for sales without recourse of trade accounts receivable to various financial institutions (referred to as true sale of receivables (“TSR”)). Through the TSR programs, certain operating subsidiaries of ArcelorMittal surrender the control, risks and benefits associated with the accounts receivable sold; therefore, the amount of receivables sold is recorded as a sale of financial assets and the balances are derecognized from the consolidated statements of financial position at the moment of sale. The Company classifies trade receivables subject to TSR programs as financial assets that are held to collect or to sell and recognizes them at FVOCI (see note 6). The fair value measurement is determined based on the invoice amount net of TSR expense payable, a Level 3 unobservable input. The TSR expense is insignificant due to the rate applicable and the short timeframe between the time of sale and the invoice due date. Any loss allowance for these trade receivables is recognized in OCI.
4.4 Inventories
Inventories are carried at the lower of cost or net realizable value. Cost is determined using the average cost method. Costs of production in process and finished goods include the purchase costs of raw materials and conversion costs such as direct labor and an allocation of fixed and variable production
overheads. Raw materials and spare parts are valued at cost, inclusive of freight, shipping, handling as well as any other costs incurred in bringing the inventories to their present location and condition. Interest charges, if any, on purchases have been recorded as financing costs. Costs incurred when production levels are abnormally low are capitalized as inventories based on normal capacity with the remaining costs incurred recorded as a component of cost of sales in the consolidated statements of operations.
Net realizable value represents the estimated selling price at which the inventories can be realized in the normal course of business after allowing for the cost of conversion from their existing state to a finished condition and for the cost of marketing, selling, and distribution. Net realizable value is estimated based on the most reliable evidence available at the time the estimates were made of being the amount that the inventory is expected to realize, taking into account the purpose for which the inventory is held.
Previous write-downs are reversed in case the circumstances that previously caused inventories to be written down below cost no longer exist.
Inventories, net of allowance for slow-moving inventory, excess of cost over net realizable value and obsolescence of 1,079 and 1,760 as of December 31, 2020 and 2019, respectively, are comprised of the following:
| | | | | | | | | | | |
| | December 31, |
| | 2020 | | 2019 |
| Finished products | 3,403 | | | 5,821 | |
| Production in process | 3,305 | | | 4,165 | |
| Raw materials | 3,839 | | | 5,101 | |
Manufacturing supplies, spare parts and other 1 | 1,781 | | | 2,209 | |
| Total | 12,328 | | | 17,296 | |
1.Including spare parts of 1.4 billion and 1.6 billion, and manufacturing and other of 0.4 billion and 0.6 billion as of December 31, 2020 and 2019, respectively.
| | |
200 Consolidated financial statements |
Movements in the inventory reserve are as follows:
| | | | | | | | | | | | | | | | | |
| Year ended December 31, |
| 2020 | | 2019 | | 2018 |
| Inventory reserve - opening balance | 1,760 | | | 1,168 | | | 1,239 | |
Additions 1 | 294 | | | 726 | | | 423 | |
Deductions / Releases 2 | (878) | | | (212) | | | (382) | |
| Foreign exchange and others | (97) | | | 78 | | | (112) | |
| Inventory reserve - closing balance | 1,079 | | | 1,760 | | | 1,168 | |
1.Additions in 2020 and 2019 refer to write-downs of inventories excluding those utilized or written back during the same financial year and the additions in 2018 refer to write-downs of inventories including those utilized or written back during the same financial year.
2.Deductions/releases correspond to write-backs and utilizations related to the prior periods in 2020 and 2019 and correspond to write-backs and utilizations related to the current and prior periods in 2018.
4.5 Prepaid expenses and other current assets
| | | | | | | | | | | |
| December 31, |
| 2020 | | 2019 |
| VAT receivables | 752 | | | 941 | |
| Prepaid expenses and non-trade receivables | 486 | | | 696 | |
| Financial amounts receivable | 94 | | | 350 | |
| Income tax receivable | 51 | | | 102 | |
| Receivables from public authorities | 143 | | | 137 | |
| Receivables from sale of financial and intangible assets | 78 | | | 153 | |
| Derivative financial instruments | 353 | | | 268 | |
Other 1 | 324 | | | 109 | |
| Total | 2,281 | | | 2,756 | |
1.Other includes mainly advances to employees, accrued interest, CO2 emission rights held as current assets as of December 31, 2020 of 219 and other miscellaneous receivables.
4.6 Other assets
Other assets consisted of the following:
| | | | | | | | | | | |
| | December 31, |
| | 2020 | | 2019 |
| Derivative financial instruments | 324 | | | 130 | |
| Financial amounts receivable | 503 | | | 594 | |
| Long-term VAT receivables | 156 | | | 285 | |
| Cash guarantees and deposits | 86 | | | 164 | |
| Receivables from public authorities | 41 | | | 51 | |
| Accrued interest | 30 | | | 65 | |
| Receivables from sale of financial and intangible assets | 172 | | | 131 | |
| Income tax receivable | 18 | | | 25 | |
Other 1 | 152 | | | 203 | |
| Total | 1,482 | | | 1,648 | |
1.Other mainly includes assets in pension funds and other amounts receivable.
4.7 Trade accounts payable and other
Trade accounts payable are obligations to pay for goods that have been acquired in the ordinary course of business from suppliers. Trade accounts payable have maturities from 15 to 180 days depending on the type of material, the geographic area in which the purchase transaction occurs and the various contractual agreements. The carrying value of trade accounts payable approximates fair value. The Company’s average outstanding number of trade payable days amounted to 82 over the last 5 years. The ability of suppliers to provide payment terms may be dependent on their ability to obtain funding for their own working capital needs and or their ability to early discount their receivables at their own discretion (the Company estimates that about 2 billion of trade payables were subject to early discount by its suppliers in 2020 as compared to 2.6 billion in 2019).
4.8 Accrued expenses and other liabilities
Accrued expenses and other liabilities are comprised of the following as of:
| | | | | | | | | | | |
| December 31, |
| 2020 | | 2019 |
| Accrued payroll and employee related expenses | 1,238 | | | 1,560 | |
| Accrued interest and other payables | 1,151 | | | 927 | |
Payable from acquisition of intangible, tangible & financial assets 1 | 847 | | | 1,559 | |
| Other amounts due to public authorities | 680 | | | 507 | |
Derivative financial instruments 2 | 208 | | | 308 | |
| Unearned revenue and accrued payables | 73 | | | 49 | |
| Total | 4,197 | | | 4,910 | |
1.Payables from acquisition of intangible, tangible & financial assets decreased primarily due to the divestment of ArcelorMittal USA and classification of ArcelorMittal Italia as assets held for sale at December 31, 2020. See note 2.3.1 and 2.3.2.
2.Derivative financial instruments included 125 as of December 31, 2019 relating to the fair value of the put option granted to ISP in the framework of the acquisition of ArcelorMittal Italia. The put option was exercised in December 2020 (see note 2.2.4).
| | |
Consolidated financial statements 201 |
| (millions of U.S. dollars, except share and per share data) |
NOTE 5: GOODWILL, INTANGIBLE AND TANGIBLE ASSETS
5.1 Goodwill and intangible assets
The carrying amounts of goodwill and intangible assets are summarized as follows:
| | | | | | | | | | | |
| | December 31, |
| | 2020 | | 2019 |
| Goodwill on acquisitions | 3,992 | | | 5,104 | |
| Concessions, patents and licenses | 190 | | | 197 | |
| Customer relationships and trade marks | 90 | | | 95 | |
| Other | 40 | | | 36 | |
| Total | 4,312 | | | 5,432 | |
Goodwill
Goodwill arising on an acquisition is recognized as previously described within the business combinations section in note 2.2.3. Goodwill is allocated to those groups of cash-generating units that are expected to benefit from the business combination in which the goodwill arose and in all cases is at the operating segment level, which represents the lowest level at which goodwill is monitored for internal management purposes.
Goodwill acquired in business combinations for each of the Company’s operating segments is as follows:
| | | | | | | | | | | | | | | | | | | | | | | | | |
| | December 31, 2019 | | Divestments and assets held for sale1 | | Foreign exchange differences and other movements | | | | December 31, 2020 |
| NAFTA | 2,233 | | | (672) | | | 5 | | | | | 1,566 | |
| Brazil | 1,353 | | | — | | | (284) | | | | | 1,069 | |
| Europe | 545 | | | (45) | | | 40 | | | | | 540 | |
| ACIS | 973 | | | — | | | (156) | | | | | 817 | |
| Total | 5,104 | | | (717) | | | (395) | | | | | 3,992 | |
1.See notes 2.3.1 and 2.3.2
| | | | | | | | | | | | | | | | | | | | | | | | | |
| | December 31, 2018 | | Divestments and assets held for sale | | Foreign exchange differences and other movements1 | | | | December 31, 2019 |
| NAFTA | 2,198 | | | — | | | 35 | | | | | 2,233 | |
| Brazil | 1,404 | | | — | | | (51) | | | | | 1,353 | |
| Europe | 550 | | | — | | | (5) | | | | | 545 | |
| ACIS | 834 | | | — | | | 139 | | | | | 973 | |
| Total | 4,986 | | | — | | | 118 | | | | | 5,104 | |
1.Other movements for Europe include 6 relating to the acquisition of Münker and 8 for Brazil relating to the increase in goodwill following the completion of the acquisition-date fair value of AMSF (see note 2.2.4).
Intangible assets are recognized only when it is probable that the expected future economic benefits attributable to the assets
will accrue to the Company and the cost can be reliably measured. Intangible assets acquired separately by ArcelorMittal are initially recorded at cost and those acquired in a business combination are initially recorded at fair value at the date of the business combination. These primarily include the cost of technology and licenses purchased from third parties and operating authorizations granted by governments or other public bodies (concessions). Intangible assets are amortized on a straight-line basis over their estimated economic useful lives, which typically do not exceed five years. Amortization is included in the consolidated statements of operations as part of cost of sales.
ArcelorMittal’s industrial sites which are regulated by the European Directive 2003/87/EC of October 13, 2003 on carbon dioxide (“CO2”) emission rights, effective as of January 1, 2005, are located primarily in Belgium, France, Germany, Luxembourg, Poland, Spain and Italy. In Ontario, Canada, ArcelorMittal's operations are currently subject to output based pricing system regulations, effective from January 1, 2019 until the newly accepted Ontario province program (Emissions Performance Standards) is transitioned (expected to be effective January 1, 2022 or retroactively to January 1, 2021). In South Africa, a CO2 tax system was introduced in 2019 and in Kazakhstan, the Emission Trading Scheme restarted operation on January 1, 2018. The emission rights allocated to the Company on a no-charge basis pursuant to the annual national allocation plan are recorded at nil value and purchased emission rights are recorded at cost.
| | |
202 Consolidated financial statements |
Other intangible assets are summarized as follows:
| | | | | | | | | | | | | | | | | | | | | | | |
| | Concessions, patents and licenses | | Customer relationships and trade marks | | Other | | Total |
| Cost | | | | | | | |
| At December 31, 2018 | 745 | | | 1,128 | | | 443 | | | 2,316 | |
| Acquisitions | 17 | | | — | | | 65 | | | 82 | |
| Acquisitions through business combinations (note 2.2.4) | — | | | 12 | | | — | | | 12 | |
| Disposals | — | | | — | | | (6) | | | (6) | |
| Foreign exchange differences | (8) | | | (11) | | | (4) | | | (23) | |
| | | | | | | |
| | | | | | | |
Transfers and other movements1 | (107) | | | 4 | | | (351) | | | (454) | |
Fully amortized intangible assets 2 | (17) | | | — | | | — | | | (17) | |
| At December 31, 2019 | 630 | | | 1,133 | | | 147 | | | 1,910 | |
| Acquisitions | 17 | | | — | | | 35 | | | 52 | |
| | | | | | | |
| Disposal | (8) | | | — | | | (2) | | | (10) | |
| Divestment (note 2.3.1) | (251) | | | (9) | | | — | | | (260) | |
| Foreign exchange differences | 16 | | | 24 | | | 11 | | | 51 | |
| Transfers to assets held for sale (note 2.3) | (12) | | | — | | | (11) | | | (23) | |
Transfers and other movements 1 | 37 | | | — | | | — | | | 37 | |
Fully amortized intangible assets 2 | (29) | | | — | | | — | | | (29) | |
| At December 31, 2020 | 400 | | | 1,148 | | | 180 | | | 1,728 | |
| | | | | | | |
| Accumulated amortization and impairment losses | | | | | | | |
| At December 31, 2018 | 452 | | | 1,038 | | | 84 | | | 1,574 | |
| | | | | | | |
| Amortization charge | 53 | | | 11 | | | 30 | | | 94 | |
| | | | | | | |
| Foreign exchange differences | (7) | | | (11) | | | (2) | | | (20) | |
| | | | | | | |
| | | | | | | |
Transfers and other movements1 | (48) | | | — | | | (1) | | | (49) | |
Fully amortized intangible assets 2 | (17) | | | — | | | — | | | (17) | |
| At December 31, 2019 | 433 | | | 1,038 | | | 111 | | | 1,582 | |
| Disposals | (7) | | | — | | | — | | | (7) | |
| Divestment (note 2.3.1) | (239) | | | (9) | | | — | | | (248) | |
| Amortization charge | 47 | | | 10 | | | 30 | | | 87 | |
| Impairment charge (note 5.3) | 4 | | | — | | | — | | | 4 | |
| Foreign exchange differences | 17 | | | 19 | | | 8 | | | 44 | |
| Transfers to assets held for sale (note 2.3) | (12) | | | — | | | (9) | | | (21) | |
Transfers and other movements1 | (4) | | | — | | | — | | | (4) | |
Fully amortized intangible assets 2 | (29) | | | — | | | — | | | (29) | |
| At December 31, 2020 | 210 | | | 1,058 | | | 140 | | | 1,408 | |
| | | | | | | |
| Carrying amount | | | | | | | |
| At December 31, 2019 | 197 | | | 95 | | | 36 | | | 328 | |
| At December 31, 2020 | 190 | | | 90 | | | 40 | | | 320 | |
1.In 2019, transfers and other movements mainly relate to CO2 emission rights utilized from the acquisition of ArcelorMittal Italia amounting to 158 (see note 2.2.4) and favorable land lease contracts from the acquisition of ArcelorMittal Italia and advances for land use which were transferred to right-of-use assets upon implementation of IFRS 16 (see note 7).
2.Fully amortized assets correspond mainly to licenses in 2020 and 2019.
Research and development costs not meeting the criteria for capitalization are expensed as incurred. These costs amounted to 245, 301 and 290 for the years ended December 31, 2020, 2019 and 2018, respectively and were recognized in selling, general and administrative expenses.
5.2 Property, plant and equipment and biological assets
Property, plant and equipment is recorded at cost less accumulated depreciation and impairment. Cost includes all related costs directly attributable to the acquisition or construction of the asset. Except for land and assets used in mining activities, property, plant and equipment is depreciated
| | |
Consolidated financial statements 203 |
| (millions of U.S. dollars, except share and per share data) |
using the straight-line method over the useful lives of the related assets as presented in the table below.
| | | | | | | | |
| Asset Category | | Useful Life Range |
| Land | | Not depreciated |
| Buildings | | 10 to 50 years |
| Property plant & equipment | | 15 to 64 years |
| Auxiliary facilities | | 15 to 60 years |
| Other facilities | | 5 to 20 years |
The Company’s annual review of useful lives leverages on the experience gained from an in-depth review performed every five years, any significant change in the expected pattern of consumption embodied in the asset, and the specialized knowledge of ArcelorMittal’s network of chief technical officers. The chief technical officer network includes engineers with facility-specific expertise related to plant and equipment used in the principal production units of the Company’s operations. The most recent in-depth review took place in 2019, during which the Company performed a review of the useful lives of its fixed assets and determined there were no material changes to the useful lives of property, plant and equipment. In performing this review, the Company gathered and evaluated data, including commissioning dates, designed capacities, maintenance records and programs, and asset performance history, among other attributes. In accordance with IAS 16, Property, Plant and Equipment, the Company considered this information at the level of components significant in relation to the total cost of the item of plant and equipment. Other factors the Company considered in its determination of useful lives included the expected use of the assets, technical or commercial obsolescence, and operational factors. In addition, the Company considered the accumulated technical experience and knowledge sharing programs that allowed for the exchange of best practices within the chief technical officer network and the deployment of these practices across the Company’s principal production units.
Major improvements, which add to productive capacity or extend the life of an asset, are capitalized, while repairs and maintenance are expensed as incurred. Where a tangible fixed asset comprises major components having different useful lives, these components are accounted for as separate items.
Property, plant and equipment under construction is recorded as construction in progress until it is ready for its intended use; thereafter it is transferred to the related class of property, plant and equipment and depreciated over its estimated useful life. Interest incurred during construction is capitalized if the borrowing cost is directly attributable to the construction. Gains and losses on retirement or disposal of assets are recognized in cost of sales.
The residual values and useful lives of property, plant and equipment are reviewed at each reporting date and adjusted if expectations differ from previous estimates. Depreciation methods applied to property, plant and equipment are reviewed at each reporting date and changed if there has been a significant change in the expected pattern of consumption of the future economic benefits embodied in the asset.
Mining assets comprise:
•Mineral rights acquired;
•Capitalized developmental stripping (as described below in “—Stripping and overburden removal costs”).
Property, plant and equipment used in mining activities is depreciated over its useful life or over the remaining life of the mine, if shorter, and if there is no alternative use. For the majority of assets used in mining activities, the economic benefits from the asset are consumed in a pattern which is linked to the production level and accordingly, assets used in mining activities are primarily depreciated on a units-of-production basis. A unit-of-production is based on the available estimate of proven and probable reserves.
Capitalization of pre-production expenditures ceases when the mining property is capable of commercial production as it is intended by management. General administration costs that are not directly attributable to a specific exploration area are charged to the consolidated statements of operations.
Mining Reserves
Reserves are estimates of the amount of product that can be economically and legally extracted from the Company’s properties. In order to estimate reserves, estimates are required for a range of geological, technical and economic factors, including quantities, grades, production techniques, recovery rates, production costs, transport costs, commodity demand, commodity prices and exchange rates.
Estimating the quantity and/or grade of reserves requires the size, shape and depth of ore bodies to be determined by analyzing geological data such as drilling samples. This process may require complex and difficult geological judgments to interpret the data.
Because the economic assumptions used to estimate reserves change from period to period, and because additional geological data is generated during the course of operations, estimates of reserves may change from period to period. Changes in reported reserves may affect the Company’s financial results and financial position in a number of ways, including the following:
| | |
204 Consolidated financial statements |
•Asset carrying amounts may be affected due to changes in estimated future cash flows.
•Depreciation, depletion and amortization charged in the consolidated statements of operations may change where such charges are determined by the units of production basis, or where the useful economic lives of assets change.
•Overburden removal costs recognized in the consolidated statements of financial position or charged to the consolidated statements of operations may change due to changes in stripping ratios or the units of production basis of depreciation.
•Decommissioning, site restoration and environmental provisions may change where changes in estimated reserves affect expectations about the timing or cost of these activities.
Stripping and overburden removal costs
In open pit and underground mining operations, it is often necessary to remove overburden and other waste materials to access the deposit from which minerals can be extracted. This process is referred to as stripping. Stripping costs can be incurred before the mining production commences (“developmental stripping”) or during the production stage (“production stripping”).
A mine can operate several open pits that are regarded as separate operations for the purpose of mine planning and production. In this case, stripping costs are accounted for separately, by reference to the ore extracted from each separate pit. If, however, the pits are highly integrated for the purpose of mine planning and production, stripping costs are aggregated.
The determination of whether multiple pit mines are considered separate or integrated operations depends on each mine’s specific circumstances. The following factors would point towards the stripping costs for the individual pits being accounted for separately:
•If mining of the second and subsequent pits is conducted consecutively with that of the first pit, rather than concurrently.
•If separate investment decisions are made to develop each pit, rather than a single investment decision being made at the outset.
•If the pits are operated as separate units in terms of mine planning and the sequencing of overburden and ore mining, rather than as an integrated unit.
•If expenditures for additional infrastructure to support the second and subsequent pits are relatively large.
•If the pits extract ore from separate and distinct ore bodies, rather than from a single ore body.
The relative importance of each factor is considered by local management to determine whether the stripping costs should be attributed to the individual pit or to the combined output from several pits.
Developmental stripping costs contribute to the future economic benefits of mining operations when the production begins and so are capitalized as tangible assets (construction in progress), whereas production stripping is a part of on-going activities and commences when the production stage of mining operations begins and continues throughout the life of a mine.
Capitalization of developmental stripping costs ends when the commercial production of the minerals commences.
Production stripping costs are incurred to extract the ore in the form of inventories and/or to improve access to an additional component of an ore body or deeper levels of material. Production stripping costs are accounted for as inventories to the extent the benefit from production stripping activity is realized in the form of inventories. Production stripping costs are recognized as a non-current asset (“stripping activity assets”) to the extent it is probable that future economic benefit in terms of improved access to ore will flow to the Company, the components of the ore body for which access has been improved can be identified and the costs relating to the stripping activity associated with that component can be measured reliably.
All stripping costs assets (either stripping activity assets or capitalized developmental stripping costs) are presented within a specific “mining assets” class of property, plant and equipment and then depreciated on a units-of-production basis.
Exploration and evaluation expenditure
Exploration and evaluation activities involve the search for iron ore and coal resources, the determination of technical feasibility and the assessment of commercial viability of an identified resource. Exploration and evaluation activities include:
•researching and analyzing historical exploration data;
•conducting topographical, geological, geochemical and geophysical studies;
•carrying out exploratory drilling, trenching and sampling activities;
•drilling, trenching and sampling activities to determine the quantity and grade of the deposit;
| | |
Consolidated financial statements 205 |
| (millions of U.S. dollars, except share and per share data) |
•examining and testing extraction methods and metallurgical or treatment processes; and
•detailed economic feasibility evaluations to determine whether development of the reserves is commercially justified and to plan methods for mine development.
Exploration and evaluation expenditure is charged to the consolidated statements of operations as incurred except in the following circumstances, in which case the expenditure is capitalized: (i) the exploration and evaluation activity is within an area of interest which was previously acquired in a business combination and measured at fair value on acquisition; or (ii) when management has a high degree of confidence in the project’s economic viability and it is probable that future economic benefits will flow to the Company.
Capitalized exploration and evaluation expenditures are generally recorded as a component of property, plant and equipment at cost less impairment charges, unless their nature requires them to be recorded as an intangible asset. As the asset is not available for use, it is not depreciated and all capitalized exploration and evaluation expenditure is monitored for indications of impairment. To the extent that capitalized expenditure is not expected to be recovered, it is recognized as an expense in the consolidated statements of operations.
Cash flows associated with exploration and evaluation expenditure are classified as operating activities when they are related to expenses or as an investing activity when they are related to a capitalized asset in the consolidated statements of cash flows.
Development expenditure
Development is the establishment of access to the mineral reserve and other preparations for commercial production. Development activities often continue during production and include:
•sinking shafts and underground drifts (often called mine development);
•making permanent excavations;
•developing passageways and rooms or galleries;
•building roads and tunnels; and
•advance removal of overburden and waste rock.
Development (or construction) also includes the installation of infrastructure (e.g., roads, utilities and housing), machinery, equipment and facilities.
When reserves are determined and development is approved, expenditures capitalized as exploration and evaluation are reclassified as construction in progress and are reported as a component of property, plant and equipment. All subsequent development expenditures are capitalized and classified as construction in progress. On completion of development, all assets included in construction in progress are individually reclassified to the appropriate category of property, plant and equipment and depreciated accordingly.
Biological assets
Biological assets are part of the Brazil operating segment and consist of eucalyptus forests located in the Brazilian state of Minas Gerais exclusively from renewable plantations and intended for the production of charcoal to be utilized as fuel and a source of carbon in the direct reduction process of pig iron production in some of the Company’s blast furnaces in Brazil.
Biological assets are measured at their fair value, net of estimated costs to sell at the time of harvest. The fair value (Level 3 in the fair value hierarchy) is determined based on the discounted cash flow method, taking into consideration the cubic volume of wood, segregated by plantation year, and the equivalent sales value of standing trees. The average sales price was estimated based on domestic market prices. In determining the fair value of biological assets, a discounted cash flow model was used, with a harvest cycle of 6 to 7 years.
| | |
206 Consolidated financial statements |
Property, plant and equipment and biological assets are summarized as follows:
| | | | | | | | | | | | | | | | | | | | | | | | | | | | | | | | | | | |
| | Land, buildings and
Improvements | | Machinery, equipment and other2 | | Construction in progress | | Right-of-use assets4 | | Mining
Assets | | Total |
| Cost | | | | | | | | | | | |
| At December 31, 2018 | 10,879 | | | 44,062 | | | 4,363 | | | — | | | 3,901 | | | 63,205 | |
Adoption of IFRS 16 (note 7)3 | — | | | (921) | | | — | | | 2,365 | | | — | | | 1,444 | |
| At January 1, 2019 | 10,879 | | | 43,141 | | | 4,363 | | | 2,365 | | | 3,901 | | | 64,649 | |
| Additions | 35 | | | 471 | | | 3,245 | | | 259 | | | 26 | | | 4,036 | |
| Acquisitions through business combinations (note 2.2.4) | 24 | | | 10 | | | — | | | — | | | — | | | 34 | |
| Foreign exchange differences | (99) | | | (98) | | | 50 | | | (7) | | | 38 | | | (116) | |
| Disposals | (66) | | | (654) | | | (16) | | | (4) | | | (19) | | | (759) | |
| Divestments (note 2.3.1) | — | | | (130) | | | — | | | (484) | | | — | | | (614) | |
| | | | | | | | | | | |
Other movements 1 | 124 | | | 1,888 | | | (2,152) | | | (37) | | | 167 | | | (10) | |
| At December 31, 2019 | 10,897 | | | 44,628 | | | 5,490 | | | 2,092 | | | 4,113 | | | 67,220 | |
| Additions | 27 | | | 172 | | | 1,857 | | | 233 | | | 23 | | | 2,312 | |
| | | | | | | | | | | |
| Foreign exchange differences | 621 | | | 1,121 | | | (129) | | | 36 | | | (130) | | | 1,519 | |
| Disposals | (62) | | | (630) | | | (19) | | | — | | | (4) | | | (715) | |
| Divestments (note 2.3.1) | (858) | | | (8,559) | | | (261) | | | (449) | | | (766) | | | (10,893) | |
| Transfers to assets held for sale (note 2.3.2) | (461) | | | (1,911) | | | (612) | | | (89) | | | — | | | (3,073) | |
Other movements 1 | 574 | | | 1,778 | | | (2,363) | | | (225) | | | 48 | | | (188) | |
| At December 31, 2020 | 10,738 | | | 36,599 | | | 3,963 | | | 1,598 | | | 3,284 | | | 56,182 | |
| | | | | | | | | | | |
| Accumulated depreciation and impairment | | | | | | | | | | |
| At December 31, 2018 | 3,113 | | | 20,838 | | | 981 | | | — | | | 2,635 | | | 27,567 | |
Adoption of IFRS 16 (note 7)3 | — | | | (558) | | | — | | | 597 | | | — | | | 39 | |
| At January 1, 2019 | 3,113 | | | 20,280 | | | 981 | | | 597 | | | 2,635 | | | 27,606 | |
| Depreciation charge for the year | 338 | | | 2,171 | | | — | | | 343 | | | 121 | | | 2,973 | |
| Impairment (note 5.3) | 154 | | | 1,202 | | | 9 | | | 65 | | | — | | | 1,430 | |
| Disposals | (45) | | | (614) | | | — | | | (3) | | | (17) | | | (679) | |
| Foreign exchange differences | (58) | | | (112) | | | (4) | | | 4 | | | 24 | | | (146) | |
| Divestments (note 2.3.1) | — | | | (3) | | | — | | | (94) | | | — | | | (97) | |
| | | | | | | | | | | |
Other movements 1 | (14) | | | (35) | | | 5 | | | (55) | | | 1 | | | (98) | |
| At December 31, 2019 | 3,488 | | | 22,889 | | | 991 | | | 857 | | | 2,764 | | | 30,989 | |
| Depreciation charge for the year | 338 | | | 2,188 | | | — | | | 212 | | | 135 | | | 2,873 | |
| Impairment charges/ (reversal) (note 5.3) | 111 | | | (280) | | | 29 | | | 3 | | | — | | | (137) | |
| Disposals | (40) | | | (591) | | | (7) | | | — | | | (3) | | | (641) | |
| Foreign exchange differences | 424 | | | 1,189 | | | 8 | | | 8 | | | (102) | | | 1,527 | |
| Divestments (note 2.3.1) | (527) | | | (6,002) | | | (5) | | | (300) | | | (718) | | | (7,552) | |
| Transfers to assets held for sale (note 2.3.2) | (163) | | | (1,045) | | | (13) | | | (9) | | | — | | | (1,230) | |
Other movements 1 | 177 | | | (212) | | | (9) | | | (212) | | | (13) | | | (269) | |
| At December 31, 2020 | 3,808 | | | 18,136 | | | 994 | | | 559 | | | 2,063 | | | 25,560 | |
| | | | | | | | | | | |
| Carrying amount | | | | | | | | | | | |
| At December 31, 2019 | 7,409 | | | 21,739 | | | 4,499 | | | 1,235 | | | 1,349 | | | 36,231 | |
| At December 31, 2020 | 6,930 | | | 18,463 | | | 2,969 | | | 1,039 | | | 1,221 | | | 30,622 | |
1.Other movements predominantly represent transfers from construction in progress to other categories and retirement of fully depreciated assets. In 2019, other movements also include 92 relating to finalization of acquisition date fair values of AM Italia (refer note 2.2.4).
2.Machinery, equipment and other includes biological assets of 45 and 59 as of December 31, 2020 and 2019, respectively, and bearer plants of 29 and 38 as of December 31, 2020 and 2019, respectively.
3.Includes additions due to implementation of IFRS 16 amounting to 1,136 as well as favorable terms of operating leases of ArcelorMittal Italia and amounts prepaid for the right of use of land, both reclassified from intangible assets (refer note 7).
4.Right-of-use assets as of December 31, 2018 include 921 of cost of assets and 558 of accumulated depreciation previously recognized under IAS 17 and presented within machinery, equipment and other. Upon implementation of IFRS 16, the right-of-use assets are presented separately in the table above.
| | |
Consolidated financial statements 207 |
| (millions of U.S. dollars, except share and per share data) |
The carrying amount of temporarily idle property, plant and equipment at December 31, 2020 and 2019 was 246 and 332 including 170 and 228 in Brazil, 31 and 14 in NAFTA, 37 and 88 in the Europe segment and 9 and 2 in the ACIS segment, respectively.
The carrying amount of property, plant and equipment retired from active use and not classified as held for sale was 12 and 47 at December 31, 2020 and 2019, respectively. Such assets are carried at their recoverable amount.
Assets pledged as security
Refer note 9.4 for information on assets pledged as security by the Company.
Capital commitments
Refer note 9.4 for information on contractual commitments for acquisition of property, plant and equipment by the Company.
5.3 Impairment of intangible assets, including goodwill, and tangible assets
Net impairment (reversals)/charges recognized were as follows:
| | | | | | | | | | | | | | | | | | | | |
| | | Year ended December 31, |
| Type of asset | | 2020 | | 2019 | | 2018 |
| Goodwill | | — | | | — | | | 34 | |
| | | | | | |
| Tangible assets | | (133) | | | 1,927 | | | 960 | |
| Total | | (133) | | | 1,927 | | | 994 | |
Impairment test of goodwill
Goodwill is tested for impairment annually, as of October 1 or whenever changes in circumstances indicate that the carrying amount may not be recoverable, at the level of the groups of cash-generating units (“GCGU”) which correspond to the operating segments representing the lowest level at which goodwill is monitored for internal management purposes. Whenever the cash-generating units comprising the operating segments are tested for impairment at the same time as goodwill, the cash-generating units are tested first and any impairment of the assets is recorded prior to the testing of goodwill.
The recoverable amounts of the GCGUs are mainly determined based on their value in use. The value in use of each GCGU is determined by estimating future cash flows. The 2020 impairment test of goodwill did not include the GCGU corresponding to the Mining segment as goodwill allocated to the segment was fully impaired in 2015. The key assumptions for the value in use calculations are primarily the discount rates, growth rates, expected changes to average selling prices, shipments and direct costs during the period. Assumptions for average selling prices and shipments are based on historical experience and expectations of future changes in the market. In
addition, with respect to raw material price assumptions, the Company applied a range of $67 per tonne to $100 per tonne for iron ore and $142 per tonne to $149 per tonne for coking coal. Cash flow forecasts adjusted for the risks specific to the tested assets are derived from the most recent financial plans approved by management for the next five years. Beyond the specifically forecasted period, the Company extrapolates cash flows for the remaining years based on an estimated growth rate of 2%. This rate does not exceed the average long-term growth rate for the relevant markets.
The Company considered its exposure to certain climate-related risks which could affect its estimates of future cash flow projections applied for the determination of the recoverable amount of its GCGUs and CGUs. With the switch to electric vehicles and the move to wind and solar power generation, the Company sees additional opportunities as customers deepen their understanding of embedded and lifecycle emissions of the materials where steel compares favorably. ArcelorMittal's most substantial climate-related policy risk is the EU Emissions Trading scheme ("'ETS"), which applies to all its European plants. The risk concerns the Company's primary steelmaking plants which are exposed to this regulation and yet unprotected against competition from imported steel. The Company is committed to the objectives of the Paris agreement and announced its ambition to reduce carbon emissions by 30% in Europe by 2030 and achieve group-wide carbon neutrality by 2050. These announced goals would require significant long-term investments that are conditioned by outstanding requirements such as a global level playing field, access to abundant and affordable clean energy, facilitating necessary energy infrastructure, access to sustainable finance for low-emissions steelmaking and accelerated transition to a circular economy. Therefore, given the uncertainties around these requirements, as per the Company's best estimate, the above-mentioned significant long-term investments should not be included in the Company’s assumptions for future cash flows of the recoverable amount of its GCGUs and CGUs. At the same time, the Company is engaged in developing in the near to medium term a range of low-emission technologies for the transition to decarbonized steel including the Smart Carbon route and the Hydrogen-DRI route and required investments are considered either in the Company's future cash flow projections or in the context of joint ventures, as an element of the Company's best estimate of capital expenditures which are committed and / or being implemented. Additionally, the Company’s assumptions for future cash flows include an estimate for costs that the Company expects to incur to acquire emission allowances, which primarily impacts the flat steel operations in Europe. The assumption for carbon emission cost is based on historical experience, expected opportunities to mitigate or otherwise offset such future costs and information available of future changes. Due to economic developments,
| | |
208 Consolidated financial statements |
uncertainties over the pace of transition to low-emission technologies, political and environmental actions that will be taken to meet the carbon reduction goals, regulatory changes and emissions activity arising from climate-related matters, the Company’s assumptions used in the recoverable amount calculations, such as capital expenditure, carbon emission costs and other assumptions are inherently uncertain and may ultimately differ from actual amounts.
The assumptions used in the value in use calculations are inherently uncertain in the context of the COVID-19 pandemic and require management judgment. The Company's process includes specific consideration given to the most recent short, medium and long-term price forecasts and discount rates consistent with external information, expected production and shipment volumes and updated development plans, operating costs and capital expenditure plans. The Company does not believe that the COVID-19 pandemic has structurally altered the
long-term outlook of operations and subject to certain differences by geographical areas, ArcelorMittal expects shipments to return to pre-COVID-19 levels by 2022 with the benefit from a favorable supply demand balance following a prolonged period of destocking. Operating margins are expected to be restored in 2021 with the benefit of improved selling prices and structural cost improvements sustained from the Company's response to the COVID-19 crisis.
Management estimates discount rates using pre-tax rates that reflect current market rates for investments of similar risk. The rate for each CGU, including beta, cost of debt and capital structure was estimated from the weighted average cost of capital of producers, which operate a portfolio of assets similar to those of the Company’s assets and CGU specific country risk premiums were applied. GCGU weighted average pre-tax discount rates were as follows in 2020 and 2019:
| | | | | | | | | | | | | | | | | | | | | | | | | |
| | NAFTA | | Brazil | | Europe | | ACIS | | |
| GCGU weighted average pre-tax discount rate used in 2020 (in %) | 10.5 | | 15.9 | | 8.5 | | 14.6 | | |
| GCGU weighted average pre-tax discount rate used in 2019 (in %) | 10.8 | | 15.0 | | 9.1 | | 14.5 | | |
Once recognized, impairment losses for goodwill are not reversed.
There were no impairment charges recognized with respect to goodwill following the Company’s impairment tests as of October 1, 2020 and October 1, 2019. The total value in use calculated for all GCGUs remained relatively stable overall in 2020 as compared to 2019. In 2018, the Company recognized a 18 and 16 impairment loss relating to goodwill in connection with the sale of the Votorantim remedies and the intended sale of the ArcelorMittal Italia remedies (see note 2.3.1).
In 2020, the Company did not identify any reasonably possible change in key assumptions which could cause an impairment loss to be recognized for any of its GCGUs.
Impairment test of property, plant and equipment
At each reporting date, ArcelorMittal reviews the carrying amounts of its intangible assets (excluding goodwill) and tangible assets to determine whether there is any indication that the carrying amount of those assets may not be recoverable through continuing use. If any such indication exists, the recoverable amount of the asset (or cash generating unit) is reviewed in order to determine the amount of the impairment, if any. The recoverable amount is the higher of its fair value less cost of disposal and its value in use.
In estimating its value in use, the estimated future cash flows are discounted to their present value using a pre-tax discount rate that reflects current market assessments of the time value of money and the risks specific to the asset (or cash-generating
unit). For an asset that does not generate cash inflows largely independent of those from other assets, the recoverable amount is determined for the cash-generating unit to which the asset belongs. The cash-generating unit is the smallest identifiable group of assets corresponding to operating units that generate cash inflows. If the recoverable amount of an asset (or cash-generating unit) is estimated to be less than its carrying amount, an impairment loss is recognized. An impairment loss is recognized as an expense immediately as part of operating income in the consolidated statements of operations.
In the case of permanently idled assets, the impairment is measured at the individual asset level. Otherwise, the Company’s assets are measured for impairment at the cash-generating unit level. In certain instances, the cash-generating unit is an integrated manufacturing facility which may also be an operating subsidiary. Further, a manufacturing facility may be operated in concert with another facility with neither facility generating cash flows that are largely independent from the cash flows of the other. In this instance, the two facilities are combined for purposes of testing for impairment. As of December 31, 2020, the Company determined it has 53 cash-generating units.
In the context of the investment agreement signed on December 10, 2020 with Invitalia (see note 2.3.2) in order to create a partnership between Invitalia and the Company with respect to ArcelorMittal Italia, the Company performed a fair value calculation of ArcelorMittal Italia, which was a separate cash-generating unit, prior to held for sale classification based on the
| | |
Consolidated financial statements 209 |
| (millions of U.S. dollars, except share and per share data) |
industrial plan agreed with Invitalia and concluded the carrying amount was recoverable.
An impairment loss, related to intangible assets other than goodwill and tangible assets recognized in prior years is reversed if, and only if, there has been a change in the estimates used to determine the asset’s recoverable amount since the last impairment loss was recognized. However, the increased carrying amount of an asset due to a reversal of an impairment loss will not exceed the carrying amount that would have been determined (net of amortization or depreciation) had no impairment loss been recognized for the asset in prior years. A reversal of an impairment loss is recognized immediately as part of operating income in the consolidated statements of operations.
Impairment charges and reversals relating to property, plant and equipment were as follows for the years ended December 31, 2020, 2019 and 2018:
2020
In 2020, the Company recognized a 133 net reversal of impairment including impairment charges of 92 and 104 related to the permanent closure of the coke plant in Florange (France) and the permanent closure of part of a blast furnace and steel plant in Krakow (Poland), respectively. In addition, the Company recognized an impairment loss of 331 relating to its plate
business in the Europe segment classified as held for sale at December 31, 2020 (see note 2.3.2).
In the third quarter of 2020, the Company reversed 660 of impairment charges of property, plant and equipment previously recognized for ArcelorMittal USA as a result of the increase in the recoverable amount. The Company calculated the fair value less cost of disposal using a market approach with market multiples derived from comparable transactions, a Level 3 unobservable input. ArcelorMittal USA was sold to Cleveland-Cliffs as described in note 2.3.1.
2019
In 2019, the Company recognized a total impairment charge related to property, plant and equipment amounting to 1,927, of which 1,300 relating to ArcelorMittal USA (NAFTA), 102 to ArcelorMittal South Africa (ACIS), and 525 in Europe, including 497 related to ArcelorMittal Italia remedies (see note 2.3.1).
During the six months ended June 30, 2019, the Company recognized an impairment charge for property, plant and equipment amounting to 600 relating to ArcelorMittal USA as a result of a downward revision of cash flow projections in particular with respect to near-term steel selling prices as follows:
| | | | | | | | | | | | | | | | | | | | | | | | | | | | | | | | | | | | | | |
| Cash-Generating Unit | | Country | | Operating Segment | | Impairment Recorded | | 2019 Pre-Tax Discount Rate | | 2018 Pre-Tax Discount Rate | | Carrying amount of property, plant and equipment as of June 30, 2019 |
| ArcelorMittal USA | | USA | | NAFTA | | 600 | | | 13.98 | % | | 16.91 | % | | 3,213 | |
In the second half of 2019, in connection with management’s annual test for impairment of goodwill, property, plant and equipment was also tested for impairment at that date. The Company recognized an impairment charge for property, plant
and equipment amounting to 700 relating to ArcelorMittal USA in the NAFTA operating segment as a result of a downward revision of cash flow projections in particular with respect to near-term steel selling prices consisting of the following:
| | | | | | | | | | | | | | | | | | | | | | | | | | | | | | | | | | | | | | |
| Cash-Generating Unit | | Country | | Operating Segment | | Impairment Recorded | | 2019 Pre-Tax Discount Rate | | 2018 Pre-Tax Discount Rate | | Carrying amount of property, plant and equipment as of December 31, 2019 |
| ArcelorMittal USA | | USA | | NAFTA | | 700 | | | 10.17 | % | | 16.91 | % | | 2,568 | |
In the same context, the Company recognized a impairment charge for property, plant and equipment of 75 relating to the
Long Steel Products facility of Newcastle in ArcelorMittal South Africa as a result of a lower domestic volumes as follows:
| | | | | | | | | | | | | | | | | | | | | | | | | | | | | | | | | | | | | | |
| Cash-Generating Unit | | Country | | Operating Segment | | Impairment Recorded | | 2019 Pre-Tax Discount Rate | | 2018 Pre-Tax Discount Rate | | Carrying amount of property, plant and equipment as of December 31, 2019 |
| Long Steel Products | | South Africa | | ACIS | | 75 | | | 13.87 | % | | 15.13 | % | | 163 | |
In addition, the Company recorded impairment charges for property, plant and equipment of ArcelorMittal South Africa of 27 including 20 with respect to the closure of the Saldanha facility.
2018
In 2018, the Company recognized a total impairment charge related to property, plant and equipment of 960 including 872 in connection with the intended sale of the ArcelorMittal Italia
| | |
210 Consolidated financial statements |
remedies and 68 in relation to the sale of the Votorantim remedies (see note 2.3.1).
NOTE 6: FINANCING AND FINANCIAL INSTRUMENTS
6.1 Financial assets and liabilities
Financial assets and liabilities mainly comprise:
•fair values versus carrying amounts (see note 6.1.1)
•gross debt (see note 6.1.2)
•cash and cash equivalents, restricted cash, other restricted funds and reconciliations of cash flows (see note 6.1.3)
•net debt (see note 6.1.4)
•derivative financial instruments (see note 6.1.5)
•other non-derivative financial assets and liabilities (see note 6.1.6)
6.1.1 Fair values versus carrying amounts
The estimated fair values of certain financial instruments have been determined using available market information or other valuation methodologies that require judgment in interpreting market data and developing estimates. The following table summarizes assets and liabilities based on their categories at December 31, 2020:
| | |
Consolidated financial statements 211 |
| (millions of U.S. dollars, except share and per share data) |
| | | | | | | | | | | | | | | | | | | | | | | | | | | | | | | | | | | |
| | December 31, 2020 |
| | Carrying amount in the consolidated statements of financial position | | Non-financial assets and liabilities | | Assets/Liabilities at amortized cost | | Fair value recognized in profit or loss | | Fair value recognized in OCI | | Derivatives |
| ASSETS | | | | | | | | | | | |
| Current assets: | | | | | | | | | | | |
| Cash and cash equivalents | 5,600 | | | — | | | 5,600 | | | — | | | — | | | — | |
| Restricted cash and other restricted funds | 363 | | | — | | | 363 | | | — | | | — | | | — | |
| Trade accounts receivable and other | 3,072 | | | — | | | 2,699 | | | — | | | 373 | | | — | |
| Inventories | 12,328 | | | 12,328 | | | — | | | — | | | — | | | — | |
| Prepaid expenses and other current assets | 2,281 | | | 910 | | | 1,018 | | | — | | | — | | | 353 | |
| Assets held for sale | 4,329 | | | 3,384 | | | 945 | | | — | | | — | | | — | |
| Total current assets | 27,973 | | | 16,622 | | | 10,625 | | | — | | | 373 | | | 353 | |
| | | | | | | | | | | |
| Non-current assets: | | | | | | | | | | | |
| Goodwill and intangible assets | 4,312 | | | 4,312 | | | — | | | — | | | — | | | — | |
| Property, plant and equipment and biological assets | 30,622 | | | 30,577 | | | — | | | 45 | | | — | | | — | |
| Investments in associates and joint ventures | 6,817 | | | 6,817 | | | — | | | — | | | — | | | — | |
| Other investments | 2,980 | | | — | | | — | | | — | | | 2,980 | | | — | |
| Deferred tax assets | 7,866 | | | 7,866 | | | — | | | — | | | — | | | — | |
| Other assets | 1,482 | | | 237 | | | 785 | | | 136 | | | — | | | 324 | |
| Total non-current assets | 54,079 | | | 49,809 | | | 785 | | | 181 | | | 2,980 | | | 324 | |
| Total assets | 82,052 | | | 66,431 | | | 11,410 | | | 181 | | | 3,353 | | | 677 | |
| | | | | | | | | | | |
| LIABILITIES AND EQUITY | | | | | | | | | | | |
| Current liabilities: | | | | | | | | | | | |
| Short-term debt and current portion of long-term debt | 2,507 | | | — | | | 2,507 | | | — | | | — | | | — | |
| Trade accounts payable and other | 11,525 | | | — | | | 11,525 | | | — | | | — | | | — | |
| Short-term provisions | 935 | | | 919 | | | 16 | | | — | | | — | | | — | |
| Accrued expenses and other liabilities | 4,197 | | | 1,160 | | | 2,829 | | | — | | | — | | | 208 | |
| Income tax liabilities | 464 | | | 464 | | | — | | | — | | | — | | | — | |
| Liabilities held for sale | 3,039 | | | 709 | | | 2,330 | | | — | | | — | | | — | |
| Total current liabilities | 22,667 | | | 3,252 | | | 19,207 | | | — | | | — | | | 208 | |
| | | | | | | | | | | |
| Non-current liabilities: | | | | | | | | | | | |
| Long-term debt, net of current portion | 9,815 | | | — | | | 9,815 | | | — | | | — | | | — | |
| Deferred tax liabilities | 1,832 | | | 1,832 | | | — | | | — | | | — | | | — | |
| Deferred employee benefits | 4,656 | | | 4,656 | | | — | | | — | | | — | | | — | |
| Long-term provisions | 1,697 | | | 1,691 | | | 6 | | | — | | | — | | | — | |
| Other long-term obligations | 1,148 | | | 354 | | | 698 | | | — | | | — | | | 96 | |
| Total non-current liabilities | 19,148 | | | 8,533 | | | 10,519 | | | — | | | — | | | 96 | |
| | | | | | | | | | | |
| Equity: | | | | | | | | | | | |
| Equity attributable to the equity holders of the parent | 38,280 | | | 38,280 | | | — | | | — | | | — | | | — | |
| Non-controlling interests | 1,957 | | | 1,957 | | | — | | | — | | | — | | | — | |
| Total equity | 40,237 | | | 40,237 | | | — | | | — | | | — | | | — | |
| Total liabilities and equity | 82,052 | | | 52,022 | | | 29,726 | | | — | | | — | | | 304 | |
| | |
212 Consolidated financial statements |
| | | | | | | | | | | | | | | | | | | | | | | | | | | | | | | | | | | |
| | December 31, 2019 |
| | Carrying amount in the consolidated statements of financial position | | Non-financial assets and liabilities | | Assets/Liabilities at amortized cost | | Fair value recognized in profit or loss | | Fair value recognized in OCI | | Derivatives |
| ASSETS | | | | | | | | | | | |
| Current assets: | | | | | | | | | | | |
| Cash and cash equivalents | 4,867 | | | — | | | 4,867 | | | — | | | — | | | — | |
| Restricted cash | 128 | | | — | | | 128 | | | — | | | — | | | — | |
| Trade accounts receivable and other | 3,569 | | | — | | | 3,146 | | | — | | | 423 | | | — | |
| Inventories | 17,296 | | | 17,296 | | | — | | | — | | | — | | | — | |
| Prepaid expenses and other current assets | 2,756 | | | 1,305 | | | 1,047 | | | 136 | | | — | | | 268 | |
| Total current assets | 28,616 | | | 18,601 | | | 9,188 | | | 136 | | | 423 | | | 268 | |
| | | | | | | | | | | |
| Non-current assets: | | | | | | | | | | | |
| Goodwill and intangible assets | 5,432 | | | 5,432 | | | — | | | — | | | — | | | — | |
| Property, plant and equipment and biological assets | 36,231 | | | 36,172 | | | — | | | 59 | | | — | | | — | |
| Investments in associates and joint ventures | 6,529 | | | 6,529 | | | — | | | — | | | — | | | — | |
| Other investments | 772 | | | — | | | — | | | — | | | 772 | | | — | |
| Deferred tax assets | 8,680 | | | 8,680 | | | — | | | — | | | — | | | — | |
| Other assets | 1,648 | | | 388 | | | 1,130 | | | — | | | — | | | 130 | |
| Total non-current assets | 59,292 | | | 57,201 | | | 1,130 | | | 59 | | | 772 | | | 130 | |
| Total assets | 87,908 | | | 75,802 | | | 10,318 | | | 195 | | | 1,195 | | | 398 | |
| | | | | | | | | | | |
| LIABILITIES AND EQUITY | | | | | | | | | | | |
| Current liabilities: | | | | | | | | | | | |
| Short-term debt and current portion of long-term debt | 2,869 | | | — | | | 2,869 | | | — | | | — | | | — | |
| Trade accounts payable and other | 12,614 | | | — | | | 12,614 | | | — | | | — | | | — | |
| Short-term provisions | 516 | | | 485 | | | 31 | | | — | | | — | | | — | |
| Accrued expenses and other liabilities | 4,910 | | | 1,075 | | | 3,527 | | | — | | | — | | | 308 | |
| Income tax liabilities | 378 | | | 378 | | | — | | | — | | | — | | | — | |
| Total current liabilities | 21,287 | | | 1,938 | | | 19,041 | | | — | | | — | | | 308 | |
| | | | | | | | | | | |
| Non-current liabilities: | | | | | | | | | | | |
| Long-term debt, net of current portion | 11,471 | | | — | | | 11,471 | | | — | | | — | | | — | |
| Deferred tax liabilities | 2,331 | | | 2,331 | | | — | | | — | | | — | | | — | |
| Deferred employee benefits | 7,343 | | | 7,343 | | | — | | | — | | | — | | | — | |
| Long-term provisions | 2,475 | | | 2,465 | | | 10 | | | — | | | — | | | — | |
| Other long-term obligations | 2,518 | | | 501 | | | 1,779 | | | — | | | — | | | 238 | |
| Total non-current liabilities | 26,138 | | | 12,640 | | | 13,260 | | | — | | | — | | | 238 | |
| | | | | | | | | | | |
| Equity: | | | | | | | | | | | |
| Equity attributable to the equity holders of the parent | 38,521 | | | 38,521 | | | — | | | — | | | — | | | — | |
| Non-controlling interests | 1,962 | | | 1,962 | | | — | | | — | | | — | | | — | |
| Total equity | 40,483 | | | 40,483 | | | — | | | — | | | — | | | — | |
| Total liabilities and equity | 87,908 | | | 55,061 | | | 32,301 | | | — | | | — | | | 546 | |
| | |
Consolidated financial statements 213 |
| (millions of U.S. dollars, except share and per share data) |
The Company classifies the bases used to measure certain assets and liabilities at their fair value. Assets and liabilities carried or measured at fair value have been classified into three levels based upon a fair value hierarchy that reflects the significance of the inputs used in making the measurements.
The levels are as follows:
Level 1: Quoted prices in active markets for identical assets or liabilities that the entity can access at the measurement date;
Level 2: Significant inputs other than within Level 1 that are observable for the asset or liability, either directly (i.e.: as prices) or indirectly (i.e.: derived from prices);
Level 3: Inputs for the assets or liabilities that are not based on observable market data and require management assumptions or inputs from unobservable markets.
The following tables summarize the bases used to measure certain financial assets and financial liabilities at their fair value on recurring basis.
| | | | | | | | | | | | | | | | | | | | | | | | | | |
| As of December 31, 2020 | | | | | | | | |
| | | Level 1 | | Level 2 | | Level 3 | | Total |
| Assets at fair value: | | | | | | | | |
| Investments in equity instruments at FVOCI | | 2,934 | | | — | | | 46 | | | 2,980 | |
| Trade accounts receivable and other subject to TSR programs* | | — | | | — | | | 373 | | | 373 | |
| Derivative financial current assets | | — | | | 353 | | | — | | | 353 | |
| Derivative financial non-current assets | | — | | | 265 | | | 59 | | | 324 | |
| Total assets at fair value | | 2,934 | | | 618 | | | 478 | | | 4,030 | |
| Liabilities at fair value: | | | | | | | | |
| Derivative financial current liabilities | | — | | | 208 | | | — | | | 208 | |
| Derivative financial non-current liabilities | | — | | | 96 | | | — | | | 96 | |
| Total liabilities at fair value | | — | | | 304 | | | — | | | 304 | |
*The fair value of TSR program receivables equals carrying amount due to the short time frame between the initial recognition and time of sale.
| | | | | | | | | | | | | | | | | | | | | | | | | | |
| As of December 31, 2019 | | | | | | | | |
| | | Level 1 | | Level 2 | | Level 3 | | Total |
| Assets at fair value: | | | | | | | | |
| Investments in equity instruments at FVOCI | | 699 | | | — | | | 73 | | | 772 | |
| Trade accounts receivable and other subject to TSR programs* | | — | | | — | | | 423 | | | 423 | |
| Derivative financial current assets | | — | | | 268 | | | — | | | 268 | |
| Derivative financial non-current assets | | — | | | 3 | | | 127 | | | 130 | |
| Total assets at fair value | | 699 | | | 271 | | | 623 | | | 1,593 | |
| Liabilities at fair value: | | | | | | | | |
| Derivative financial current liabilities | | — | | | 144 | | | 164 | | | 308 | |
| Derivative financial non-current liabilities | | — | | | 101 | | | 137 | | | 238 | |
| Total liabilities at fair value | | — | | | 245 | | | 301 | | | 546 | |
*The fair value of TSR program receivables equals carrying amount due to the short time frame between the initial recognition and time of sale.
Investments in equity instruments at FVOCI classified as Level 1 refer to listed securities quoted in active markets. A quoted market price in an active market provides the most reliable evidence of fair value and is used without adjustment to measure fair value whenever available, with limited exceptions. The total fair value is either the price of the most recent trade at
the time of the market close or the official close price as defined by the exchange on which the asset is most actively traded on the last trading day of the period, multiplied by the number of units held without consideration of transaction costs. The increase in investments in equity instruments at FVOCI in 2020 is mainly related to the Company's interest acquired in
| | |
214 Consolidated financial statements |
Cleveland-Cliffs following the sale of ArcelorMittal USA (see note 2.3.1).
Derivative financial assets and liabilities classified as Level 2 refer to instruments to hedge fluctuations in interest rates, foreign exchange rates, raw materials (base metals), freight, energy and emission rights, see note 6.1.5 for further information.
Derivative financial assets and liabilities classified as Level 3 are described in note 6.1.5.
6.1.2 Gross debt
Gross debt includes bank debt, debenture loans and lease obligations and is stated at amortized cost. However, loans that are hedged under a fair value hedge are remeasured for the changes in the fair value that are attributable to the risk that is being hedged.
6.1.2.1 Short-term debt
Short-term debt, including the current portion of long-term debt, consisted of the following:
| | | | | | | | | | | |
| December 31, |
| 2020 | | 2019 |
Short-term bank loans and other credit facilities including commercial paper 1 | 1,647 | | | 1,838 | |
| Current portion of long-term debt | 677 | | | 770 | |
Lease obligations2 | 183 | | | 261 | |
| Total | 2,507 | | | 2,869 | |
1.The weighted average interest rate on short-term borrowings outstanding was 1.3% and 1.1% as of December 31, 2020 and 2019, respectively.
2.See note 7.
On May 5, 2020, ArcelorMittal signed an agreement for a 0.7 billion and €2.1 billion term facility (the “Term Facility”). This Term Facility had a one year maturity (May 5, 2021) and could be used for general corporate purposes. The Term Facility included a mandatory prepayment and cancellation clause for proceeds received under debt and capital market transactions, less certain costs. On May 20, 2020, following the equity offering of 0.7 billion and MCNs issuance of 1.2 billion, the commitments were reduced to 0.2 billion and €0.7 billion. On July 17, 2020 ArcelorMittal sent a cancellation notice for all utilized amounts under the Term Facility. The cancellation notice was effective on July 22, 2020. As of such date, the Term Facility was terminated.
On April 8, 2020, ArcelorMittal amended a €300 million (341) term loan with a financial institution to extend the maturity to April 8, 2021.
In 2014, ArcelorMittal entered into certain short-term committed bilateral credit facilities. The facilities were subsequently extended annually. One of the facilities was not extended this year. As of December 31, 2020, facilities totaling approximately 0.7 billion, remain fully available and one facility is being extended.
Commercial paper
The Company has a commercial paper program enabling borrowings of up to €1.5 billion. As of December 31, 2020 and 2019, the outstanding amount was 1,044 and 1,200, respectively.
| | |
Consolidated financial statements 215 |
| (millions of U.S. dollars, except share and per share data) |
6.1.2.2 Long-term debt
Long-term debt is comprised of the following:
| | | | | | | | | | | | | | | | | | | | | | | | | | | | | |
| | | | | | | December 31, |
| Year of maturity | | Type of Interest | | Interest rate1 | | 2020 | | 2019 |
| Corporate | | | | | | | | | |
5.5 billion Revolving Credit Facility3 | 2023 - 2025 | | Floating | | | | — | | | — | |
CHF 225 million Unsecured Notes | 2020 | | Fixed | | 2.50 | % | | — | | | 233 | |
€600 million Unsecured Notes | 2020 | | Fixed | | 2.88 | % | | — | | | 316 | |
€500 million Unsecured Notes | 2021 | | Fixed | | 3.00 | % | | 350 | | | 320 | |
€750 million Unsecured Notes | 2022 | | Fixed | | 3.13 | % | | 596 | | | 841 | |
1.1 billion Unsecured Notes | 2022 | | Fixed | | 6.25 | % | | — | | | 657 | |
€500 million Unsecured Notes | 2023 | | Fixed | | 0.95 | % | | 448 | | | 558 | |
€750 million Unsecured Notes | 2023 | | Fixed | | 1.00 | % | | 917 | | | 838 | |
€1.0 billion Unsecured Notes | 2024 | | Fixed | | 2.25 | % | | 1,234 | | | 1,131 | |
750 Unsecured Notes | 2024 | | Fixed | | 3.60 | % | | 747 | | | 746 | |
500 Unsecured Notes | 2025 | | Fixed | | 6.13 | % | | 256 | | | 498 | |
€750 million Unsecured Notes | 2025 | | Fixed | | 1.75 | % | | 913 | | | 834 | |
750 Unsecured Notes | 2026 | | Fixed | | 4.55 | % | | 745 | | | 745 | |
500 Unsecured Notes | 2029 | | Fixed | | 4.25 | % | | 494 | | | 493 | |
1.5 billion Unsecured Bonds | 2039 | | Fixed | | 7.25 | % | | 671 | | | 671 | |
1.0 billion Unsecured Notes | 2041 | | Fixed | | 7.00 | % | | 428 | | | 428 | |
| Other loans | 2021 - 2022 | | Fixed | | 3.1% - 3.5% | | 218 | | | 151 | |
| EIB loan | 2025 | | Fixed | | 1.16 | % | | 304 | | | 344 | |
| Other loans | 2021 - 2035 | | Floating | | 0.4% - 2.4% | | 1,204 | | | 1,218 | |
| Total Corporate | | | | | | | 9,525 | | | 11,022 | |
| Americas | | | | | | | | | |
| Other loans | 2020 - 2030 | | Fixed/Floating | | 0.0% - 9.5% | | 83 | | | 81 | |
| Total Americas | | | | | | | 83 | | | 81 | |
| Europe, Asia & Africa | | | | | | | | | |
| EBRD Facility | 2024 | | Floating | | 2.2% - 2.5% | | 129 | | | 175 | |
| Other loans | 2021 - 2030 | | Fixed/Floating | | 0.0% - 6.2% | | 123 | | | 97 | |
| Total Europe, Asia & Africa | | | | | | | 252 | | | 272 | |
| Total | | | | | | | 9,860 | | | 11,375 | |
| Less current portion of long-term debt | | | | | | | (677) | | | (770) | |
| Total long-term debt (excluding lease obligations) | | | | | | | 9,183 | | | 10,605 | |
Long-term lease obligations2 | | | | | | | 632 | | | 866 | |
| Total long-term debt, net of current portion | | | | | | | 9,815 | | | 11,471 | |
1.Rates applicable to balances outstanding at December 31, 2020. For debt that has been redeemed in its entirety during 2020, the interest rates refer to the rates at repayment date.
2.Net of current portion of 183 and 261 as of December 31, 2020 and 2019, respectively. Further information regarding leases is provided in note 7.
3. On November 26, 2020, the commitments were extended by one year to December 19, 2025. The commitments are 5.5 billion until December 19, 2023 and 5.4 billion until December 19, 2025.
| | |
216 Consolidated financial statements |
Corporate
5.5 billion Revolving Credit Facility
On December 19, 2018, ArcelorMittal signed an agreement for a 5.5 billion revolving credit facility (the "Facility"). This Facility replaced the 5.5 billion revolving credit facility dated April 30, 2015, which was amended and extended on December 21, 2016. The agreement incorporated a single tranche of 5.5 billion maturing on December 19, 2023, with two one-year extension options (i.e. the options to extend are in the first and second years end of 2019 and end of 2020). During the fourth quarter of 2020, ArcelorMittal executed the second option to extend the facility to December 19, 2025 after having executed the first option in the fourth quarter 2019. The extension was completed for 5.4 billion of the available amount, with the 0.1 billion remaining with a maturity of December 19, 2023. The Facility may be used for general corporate purposes. As of December 31, 2020, the 5.5 billion revolving credit facility was fully available. The Company makes drawdowns from and repayments on this Facility in the framework of its cash management.
On September 30, 2010, ArcelorMittal entered into 500 revolving multi-currency letter of credit facility (the "Letter of Credit Facility"). The Letter of Credit Facility is used by the Company and its subsidiaries for the issuance of letters of credit and other instruments. The terms of the letters of credit and other instruments contain certain restrictions as to duration. The Letter of Credit Facility was amended on October 26, 2012 and September 30, 2014 to reduce its amount to 450 and to 350, respectively. On July 31, 2019, the Company refinanced its Letter of Credit Facility by entering into a 350 revolving multi-currency letter of credit facility, which matures on July 31, 2022. On August 5, 2020, the Letter of Credit Facility maturity was extended to July 31, 2023. On November 25, 2020, the Letter or Credit Facility increased its amount to 395.
Bonds
On March 9, 2020, ArcelorMittal redeemed all of the outstanding 659 of its 1.1 billion 6.250% Notes due February 25, 2022, for a total aggregate purchase price, including accrued interest and
premiums on early repayment, of 725, which was financed with existing cash resources.
On July 3, 2020, at maturity, ArcelorMittal repaid its CHF225 million (237) Fixed Rate Notes due 2020.
On July 6, 2020, at maturity, ArcelorMittal repaid all of the outstanding €282 million (319) of its €600 million Fixed Rate Notes due 2020.
On October 15, 2020, pursuant to a cash tender offer, ArcelorMittal repurchased €264 million (311) of its EUR denominated 3.125% Notes due 2022 for a total aggregate purchase price including accrued interest of €279 million. Following this purchase, €486 million (596) principal amount remained outstanding.
On October 15, 2020, pursuant to a cash tender offer, ArcelorMittal repurchased €133 million (157) of its EUR denominated 0.95% Notes due 2023 for a total aggregate purchase price including accrued interest of €134 million. Following this purchase, €365 million (448) principal amount remained outstanding.
On October 15, 2020, pursuant to a cash tender offer, ArcelorMittal repurchased 242 of its U.S. dollar denominated 6.125% notes due 2025 for a total aggregate purchase price including accrued interest of 290. On October 16, 2020, at the final expiration of the offer, ArcelorMittal repurchased additional 1 aggregate principal amount of 2025 Notes, following which 256 principal amount remained outstanding.
The margin applicable to ArcelorMittal’s principal credit facilities (5.5 billion revolving credit facility and certain other credit facilities) and the coupons on certain of its outstanding bonds are subject to adjustment in the event of a change in its long-term credit ratings. The following table provides details of the outstanding bonds on maturity, the original coupons and the current interest rates for the bonds impacted by changes in the long-term credit rating:
| | |
Consolidated financial statements 217 |
| (millions of U.S. dollars, except share and per share data) |
| | | | | | | | | | | | | | | | | | | | | | | | | | |
| Nominal value | | Date of issuance | | Repayment date | | Interest rate1 | | Issued at |
€500 million Unsecured Notes | | Apr 9, 2015 | | Apr 9, 2021 | | 3.00 | % | | 99.55 | % |
€750 million Unsecured Notes | | Jan 14, 2015 | | Jan 14, 2022 | | 3.13 | % | | 99.73 | % |
€500 million Unsecured Notes | | Dec 4, 2017 | | Jan 17, 2023 | | 0.95 | % | | 99.38 | % |
€750 million Unsecured Notes | | Nov 19, 2019 | | May 19, 2023 | | 1.00 | % | | 99.89 | % |
€250 million Unsecured Notes | | Jul 4, 2019 | | Jan 17, 2024 | | 2.25 | % | | 105.59 | % |
€750 million Unsecured Notes | | Jan 17, 2019 | | Jan 17, 2024 | | 2.25 | % | | 99.72 | % |
750 Unsecured Notes | | Jul 16, 2019 | | Jul 16, 2024 | | 3.60 | % | | 99.86 | % |
500 Unsecured Notes | | Jun 1, 2015 | | Jun 1, 2025 | | 6.13 | % | | 100.00 | % |
€750 million Unsecured Notes | | Nov 19, 2019 | | Nov 19, 2025 | | 1.75 | % | | 99.41 | % |
750 Unsecured Notes | | Mar 11, 2019 | | Mar 11, 2026 | | 4.55 | % | | 99.72 | % |
500 Unsecured Notes | | Jul 16, 2019 | | Jul 16, 2029 | | 4.25 | % | | 99.00 | % |
1.0 billion Unsecured Bonds | | Oct 8, 2009 | | Oct 15, 2039 | | 7.25 | % | | 95.20 | % |
500 Unsecured Bonds | | Aug 5, 2010 | | Oct 15, 2039 | | 7.25 | % | | 104.84 | % |
1.0 billion Unsecured Notes | | Mar 7, 2011 | | Mar 1, 2041 | | 7.00 | % | | 99.18 | % |
1.Rates applicable at December 31, 2020.
European Investment Bank (“EIB”) Loan
On December 16, 2016, ArcelorMittal signed a €350 million finance contract with the European Investment Bank (EIB) in order to finance European research, development and innovation projects over the period 2017-2020 within the European Union, predominantly in France, Belgium and Spain, but also in Poland and Luxembourg. This operation benefits from a guarantee from the European Union under the European Fund for Strategic Investments. As of December 31, 2020,€248 million (304) was outstanding.
Other loans
On November 20, 2018, ArcelorMittal entered into a 7 billion term facility agreement with a group of lenders in connection with the acquisition of AMNS India. The agreement had an initial term of one year (until November 20, 2019), subject to ArcelorMittal’s option to extend the term by six months. The agreement includes the same leverage ratio financial covenant as that included in the Company’s 5.5 billion revolving credit facility. The facility may be used for certain payments by ArcelorMittal as well as by AMNS Luxembourg, the parent company of the AMNS India joint venture in partnership with NSC (see note 2.4.1). Any amounts borrowed by AMNS Luxembourg under the agreement are irrevocably and unconditionally guaranteed by ArcelorMittal. On November 29, 2018, 1 billion was drawn under this term facility agreement by ArcelorMittal and subsequently repaid in March 2019. On June 12, 2019, the contractual maturity date was extended to June 30, 2020 with one extension possible until December 31, 2020. AMNS Luxembourg has drawn under the facility to finance the portion of the initial funding requirement beyond the shareholders’ equity contributions and NSC’s share of the debt financing. On December 9, 2019, 2,571 was drawn under the facilities agreement by AMNS Luxembourg and was outstanding
on December 31, 2019. On February 10, 2020, an additional 475 was drawn under the facility by AMNS Luxembourg, increasing the outstanding amount as of such date to 3,046. On March 27, 2020, the total amount outstanding of 3,046 was fully repaid and the facilities agreement canceled, using the proceeds of the 5.146 billion loan entered into by AMNS Luxembourg on March 16, 2020, which is guaranteed by ArcelorMittal and NSC in proportion to their interests in the joint venture.
On December 21, 2018, the Company entered into a facility agreement with a group of lenders for €235 million to finance the construction of a new hot strip mill in Mexico. This facility became effective upon issuance of a guarantee by the Oesterreichische Kontrollbank AG in March 2019. The last installment under this agreement is due 8.5 years after the starting date of the credit facility (which means the earlier of (a) the date of issue of the provisional acceptance certificate for the hot strip mill and (b) June 30, 2021). The outstanding amount in total as of December 31, 2020 was €163 million (201).
On May 21, 2019, ArcelorMittal entered into a bilateral term loan due May 20, 2022. On July 31, 2020, the bilateral term loan was extended for one year to May 19, 2023. The bilateral term loan was fully drawn on June 3, 2019 and was outstanding as of December 31, 2020 for an amount of €125 million (142).On March 4, 2021, the Company early repaid the bilateral term loan.
On December 20, 2019, the Company entered into a bilateral loan due June 20, 2023. The bilateral term loan was fully drawn on January 30, 2020, for an amount of €100 million (110). This term loan could have been extended twice, each time for one
| | |
218 Consolidated financial statements |
additional year. On March 8, 2021, the Company early repaid the bilateral term loan.
On July 2, 2020, ArcelorMittal entered into an agreement for financing with a financial institution for net proceeds of CAD174 million (128) with repayment over several dates in 2021 and 2022.
Other loans relate to various debt with banks and public institutions.
Americas
Other loans
Other loans relate mainly to loans contracted by ArcelorMittal subsidiaries in Mexico with different counterparties.
Europe, Asia and Africa
On December 21, 2017, ArcelorMittal Kryvyi Rih entered into a 175 loan agreement with the European Bank for Reconstruction and Development ("EBRD") in order to support the upgrade of its production facilities, energy efficiency improvement and environmental impact reduction. The loan agreement also provides for an additional 175 in loan facilities which are currently uncommitted. As of December 31, 2020, 175 was drawn under the agreement.
On May 25, 2017, ArcelorMittal South Africa signed a 4.5 billion South African rand revolving borrowing base finance facility maturing on May 25, 2020. The facility was amended and extended on July 26, 2019 and now matures on July 26, 2022. Any borrowings under the facility are secured by certain eligible inventory and receivables, as well as certain other working capital and related assets of ArcelorMittal South Africa. The facility is used for general corporate purposes. The facility is not guaranteed by ArcelorMittal. As of December 31, 2020, 2.5 billion South African rand (168) was drawn.
Other loans
Other loans mainly relate to loans contracted by ArcelorMittal subsidiaries in Spain with different counterparties.
Other
Certain debt agreements of the Company or its subsidiaries contain certain restrictive covenants. Among other things, these covenants limit encumbrances on the assets of ArcelorMittal and its subsidiaries, the ability of ArcelorMittal’s subsidiaries to incur debt and the ability of ArcelorMittal and its subsidiaries to dispose of assets in certain circumstances. Certain of these agreements also require compliance with a financial covenant.
Hedge of net investments
As of April 1, 2018, the Company designated a portfolio of euro denominated debt (€5,156 million as of December 31, 2020) as a hedge of certain euro denominated investments (€7,445 million as of December 31, 2020) in order to mitigate the foreign currency risk arising from certain euro denominated subsidiaries' net assets. The risk arises from the fluctuation in spot exchange rates between the U.S. dollar and euro, which causes the amount of the net investments to vary. The hedged risk in the hedge of net investments is a risk of a weakening euro against the U.S. dollar that will result in a reduction in the carrying amount of the Company's net investments in the subsidiaries subject to the hedge. The euro denominated debt is designated as a hedging instrument for the change in the value of the net investments that is attributable to changes in the euro/U.S. dollar spot rate.
To assess the hedge effectiveness, the Company determines the economic relationship between the hedging instrument and the hedged item by comparing changes in the carrying amount of the debt portfolio that are attributable to a change in the spot rate with changes in the net investments in the foreign operations due to movements in the spot rate.
As of December 31, 2020, the Company recognized 597 foreign exchange loss arising on the translation of the euro denominated debt designated as a hedge of the euro denominated net investments in foreign operations in other comprehensive income within the foreign exchange translation reserve.
Maturity profile
As of December 31, 2020 the scheduled maturities of short-term debt, long-term debt and long-term lease obligations, including their current portion are as follows:
| | | | | | | | |
| Year of maturity | | Amount |
| 2021 | | 2,507 | |
| 2022 | | 955 | |
| 2023 | | 2,454 | |
| 2024 | | 2,191 | |
| 2025 | | 1,339 | |
| Subsequent years | | 2,876 | |
| Total | | 12,322 | |
Fair value
The following tables summarize the Company’s bases used to estimate its debt at fair value. Fair value measurement has been classified into three levels based upon a fair value hierarchy that reflects the significance of the inputs used in making the measurements.
| | |
Consolidated financial statements 219 |
| (millions of U.S. dollars, except share and per share data) |
| | | | | | | | | | | | | | | | | | | | | | | | | | | | | |
| As of December 31, 2020 | Carrying amount | | Fair Value |
| | | Level 1 | | Level 2 | | Level 3 | | Total |
| Instruments payable bearing interest at fixed rates | 9,195 | | | 8,698 | | | 1,431 | | | — | | | 10,129 | |
| Instruments payable bearing interest at variable rates | 1,480 | | | | | 1,488 | | | — | | | 1,488 | |
| Total long-term debt, including current portion | 10,675 | | | 8,698 | | | 2,919 | | | — | | | 11,617 | |
| Short term bank loans and other credit facilities including commercial paper | 1,647 | | | — | | | 1,649 | | | — | | | 1,649 | |
| | | | | | | | | | | | | | | | | | | | | | | | | | | | | |
| As of December 31, 2019 | Carrying amount | | Fair Value |
| | | Level 1 | | Level 2 | | Level 3 | | Total |
| Instruments payable bearing interest at fixed rates | 10,999 | | | 9,963 | | | 1,747 | | | — | | | 11,710 | |
| Instruments payable bearing interest at variable rates | 1,503 | | | | | 1,501 | | | — | | | 1,501 | |
| Total long-term debt, including current portion | 12,502 | | | 9,963 | | | 3,248 | | | — | | | 13,211 | |
| Short term bank loans and other credit facilities including commercial paper | 1,838 | | | | | 1,854 | | | — | | | 1,854 | |
Instruments payable classified as Level 1 refer to the Company’s listed bonds quoted in active markets. The total fair value is the official closing price as defined by the exchange on which the instrument is most actively traded on the last trading day of the period, multiplied by the number of units held without consideration of transaction costs.
Instruments payable classified as Level 2 refer to all debt instruments not classified as Level 1. The fair value of the debt is based on estimated future cash flows converted into U.S. dollar at the forward rate and discounted using current U.S. dollar zero coupon rates and ArcelorMittal’s credit spread quotations for the relevant maturities.
There were no instruments payable classified as Level 3.
6.1.3 Cash and cash equivalents, restricted cash and other restricted funds and reconciliations of cash flows
Cash and cash equivalents consist of cash and short-term highly liquid investments that are readily convertible to cash with original maturities of three months or less at the time of purchase and are carried at cost plus accrued interest, which approximates fair value.
Cash and cash equivalents are primarily centralized at the parent level and are managed by ArcelorMittal Treasury SNC, although from time to time cash or cash equivalent balances may be held at the Company’s international subsidiaries or its holding companies. Some of these operating subsidiaries have debt outstanding or are subject to acquisition agreements that impose restrictions on such operating subsidiaries’ ability to pay dividends, but such restrictions are not significant in the context of ArcelorMittal’s overall liquidity. Repatriation of funds from operating subsidiaries may also be affected by tax and foreign exchange policies in place from time to time in the various
countries where the Company operates, though none of these policies are currently significant in the context of ArcelorMittal’s overall liquidity.
Cash and cash equivalents consisted of the following:
| | | | | | | | | | | |
| December 31, |
| 2020 | | 2019 |
| Cash at bank | 3,487 | | | 3,443 | |
| Term deposits | 393 | | | 246 | |
Money market funds1 | 1,720 | | | 1,178 | |
| Total | 5,600 | | | 4,867 | |
1Money market funds are highly liquid investments with a maturity of 3 months or less from the date of acquisition.
Restricted cash represents cash and cash equivalents not readily available to the Company, mainly related to insurance deposits, cash accounts in connection with environmental obligations and true sale of receivables programs, as well as various other deposits or required balance obligations related to letters of credit and credit arrangements.
Restricted cash and other restricted funds of 363 as of December 31, 2020 included 56 relating to various environmental obligations and true sales of receivables programs in ArcelorMittal South Africa and 260 with respect to a cash collateral provided by the Company until collection of the TSR receivables retained in ArcelorMittal USA after disposal (see note 4.1). Restricted cash of 128 as of December 31, 2019 included 80 relating to various environmental obligations and true sales of receivables programs in ArcelorMittal South Africa. It also included 20 and 20 in connection with the mandatory convertible bonds as of December 31, 2020 and December 31, 2019, respectively (see note 11.2).
| | |
220 Consolidated financial statements |
Changes in restricted cash are included within investing activities in the consolidated statements of cash flows.
Reconciliation of liabilities arising from financing activities
The table below details changes in the Company's liabilities arising from financing activities, including both cash and non-
cash changes. Liabilities arising from financing activities are those for which cash flows were, or future cash flows will be classified in the Company's consolidated statements of cash flows from financing activities.
| | | | | | | | | | | |
| Long-term debt, net of current portion | | Short-term debt and current portion of long term debt |
| | | |
| | | |
| | | |
| | | |
| | | |
| | | |
| | | |
| | | |
| | | |
| | | |
| | | |
| Balance as of December 31, 2018 | 9,316 | | | 3,167 | |
| Adoption of IFRS 16 (notes 1 and 7) | 893 | | | 243 | |
| Balance as of January 1, 2019 | 10,209 | | | 3,410 | |
| Proceeds from long-term debt | 5,772 | | | — | |
| Payments of long-term debt | (3,299) | | | — | |
| Amortized cost | 7 | | | 13 | |
| Unrealized foreign exchange effects | (78) | | | (42) | |
| Proceeds from short-term debt | — | | | 600 | |
| Payments of short-term debt | — | | | (1,811) | |
Payments of principal portion of lease liabilities (note 7) 1 | (10) | | | (310) | |
| Additions to lease liabilities (notes 5.2 and 7) | 185 | | | 74 | |
| Current portion of long-term debt | (1,031) | | | 1,031 | |
| Derecognition of lease liabilities following the divestment of Global Chartering (note 2.3.1) | (311) | | | (89) | |
| | | |
| Other movements | 27 | | | (7) | |
| Balance as of December 31, 2019 (note 6.1.2) | 11,471 | | | 2,869 | |
| Proceeds from long-term debt | 323 | | | — | |
| Payments of long-term debt | (1,645) | | | — | |
| Amortized cost | 8 | | | 7 | |
| Unrealized foreign exchange effects | 563 | | | 115 | |
| Proceeds from short-term debt | — | | | 430 | |
| Payments of short-term debt | — | | | (1,503) | |
| Current portion of long-term debt | (860) | | | 860 | |
Payments of principal portion of lease liabilities (note 7) 1 | (7) | | | (235) | |
| Additions to lease liabilities (notes 5.2 and 7) | 195 | | | 38 | |
| Derecognition of lease liabilities following the divestment of ArcelorMittal USA (note 2.3.1) | (208) | | | (70) | |
| Debt classified as held for sale (note 2.3.2) | (21) | | | (3) | |
| Other movements | (4) | | | (1) | |
| Balance as of December 31, 2020 (note 6.1.2) | 9,815 | | | 2,507 | |
1.Cash payments decreasing the outstanding liability relating to leases are classified under payments of principal portion of lease liabilities and other financing activities in the Company's consolidated statements of cash flows.
| | |
Consolidated financial statements 221 |
| (millions of U.S. dollars, except share and per share data) |
6.1.4 Net debt
The Company monitors its net debt in order to manage its capital. The following tables present the structure of the Company’s net debt by original currency at December 31, 2020 and December 31, 2019:
| | | | | | | | | | | | | | | | | | | | | | | | | | | | | | | | | | | | | | | | | |
| As of December 31, 2020 | Total USD | | EUR | | USD | | CAD | | PLN | | UAH | | Other
(in USD) |
| Short-term debt and current portion of long-term debt | 2,507 | | | 1,283 | | | 765 | | | 172 | | | 19 | | | 46 | | | 222 | |
| Long-term debt, net of current portion | 9,815 | | | 5,775 | | | 3,567 | | | 91 | | | 239 | | | 17 | | | 126 | |
| Cash and cash equivalents, restricted cash and other restricted funds | (5,963) | | | (2,637) | | | (2,236) | | | (35) | | | (152) | | | (19) | | | (884) | |
| Net debt | 6,359 | | | 4,421 | | | 2,096 | | | 228 | | | 106 | | | 44 | | | (536) | |
| | | | | | | | | | | | | | | | | | | | | | | | | | | | | | | | | | | | | | | | | |
| As of December 31, 2019 | Total USD | | EUR | | USD | | CHF | | PLN | | CAD | | Other
(in USD) |
| Short-term debt and current portion of long-term debt | 2,869 | | | 1,966 | | | 248 | | | 233 | | | 20 | | | 174 | | | 228 | |
| Long-term debt, net of current portion | 11,471 | | | 6,240 | | | 4,754 | | | — | | | 239 | | | 106 | | | 132 | |
| Cash and cash equivalents and restricted cash | (4,995) | | | (2,986) | | | (1,383) | | | (2) | | | (64) | | | (32) | | | (528) | |
| Net debt | 9,345 | | | 5,220 | | | 3,619 | | | 231 | | | 195 | | | 248 | | | (168) | |
6.1.5 Derivative financial instruments
The Company uses derivative financial instruments principally to manage its exposure to fluctuations in interest rates, exchange rates, prices of raw materials, energy and emission rights allowances arising from operating, financing and investing activities. Derivative financial instruments are classified as current or non-current assets or liabilities based on their maturity dates and are accounted for at the trade date. Embedded derivatives are separated from the host contract and accounted for separately if they are not closely related to the host contract. The Company measures all derivative financial instruments based on fair values derived from market prices of the instruments or from option pricing models, as appropriate. Gains or losses arising from changes in fair value of derivatives are recognized in the consolidated statements of operations, except for derivatives that are designated and qualify for cash flow or net investment hedge accounting.
Changes in the fair value of a derivative that is designated and qualifies as a cash flow hedge are recorded in other comprehensive income. Amounts deferred in equity are recorded in the consolidated statements of operations in the periods when the hedged item is recognized in the consolidated statements of operations and within the same line item (see note 6.3 Cash flow hedges).
The Company formally assesses, both at the hedge’s inception and on an ongoing basis, whether the derivatives that are used in hedging transactions are effective in offsetting changes in fair values or cash flows of hedged items. When a hedging
instrument is sold, terminated, expired or exercised, the accumulated unrealized gain or loss on the hedging instrument is maintained in equity until the forecasted transaction occurs. If the hedged transaction is no longer probable, the cumulative unrealized gain or loss, which had been recognized in equity, is reported immediately in the consolidated statements of operations.
Foreign currency differences arising on the translation of a financial liability designated as a hedge of a net investment in a foreign operation are recognized directly as a separate component of equity, to the extent that the hedge is effective. To the extent that the hedge is ineffective, such differences are recognized in the consolidated statements of operations (see note 6.3 Net investment hedge).
The Company manages the counter-party risk associated with its instruments by centralizing its commitments and by applying procedures which specify, for each type of transaction and underlying position, risk limits and/or the characteristics of the counter-party. The Company does not generally grant to or require guarantees from its counterparties for the risks incurred. Allowing for exceptions, the Company’s counterparties are part of its financial partners and the related market transactions are governed by framework agreements (mainly International Swaps and Derivatives Association agreements which allow netting only in case of counterparty default). Accordingly, derivative assets and derivative liabilities are not offset.
| | |
222 Consolidated financial statements |
Derivative financial instruments classified as Level 2:
The following tables summarize this portfolio:
| | | | | | | | | | | | | | | | | | | | | | | |
| December 31, 2020 |
| Assets | | Liabilities |
| Notional Amount | | Fair Value | | Notional Amount | | Fair Value |
| Interest rate instruments | | | | | | | |
Other interest rate instruments | 22 | | | — | | | 10 | | | — | |
Total interest rate instruments | | | — | | | | | — | |
| | | | | | | |
| Foreign exchange rate instruments | | | | | | | |
| Forward purchase contracts | 356 | | | 2 | | | 2,199 | | | (113) | |
| Forward sale contracts | 847 | | | 24 | | | 371 | | | (19) | |
| Currency swaps purchase | 260 | | | 36 | | | — | | | — | |
| Exchange option purchases | 2,938 | | | 18 | | | 1,176 | | | (15) | |
| Exchange options sales | 2,960 | | | 26 | | | 1,208 | | | (23) | |
| Total foreign exchange rate instruments | | | 106 | | | | | (170) | |
| | | | | | | |
| Raw materials (base metals), freight, energy, emission rights | | | | | | | |
| Term contracts sales | 567 | | | 38 | | | 370 | | | (46) | |
| Term contracts purchases | 1,673 | | | 473 | | | 854 | | | (87) | |
| Options sales/purchases | 47 | | | 1 | | | 48 | | | (1) | |
| Total raw materials (base metals), freight, energy, emission rights | | | 512 | | | | | (134) | |
| Total | | | 618 | | | | | (304) | |
| | | | | | | | | | | | | | | | | | | | | | | | | | | | | |
| December 31, 2019 |
| Assets | | | Liabilities |
| Notional Amount | | Fair Value | | | | | Notional Amount | | Fair Value | | | |
| | | | | | | | | | | | | |
| | | | | | | | | | | | | |
| | | | | | | | | | | | | |
| Foreign exchange rate instruments | | | | | | | | | | | | | |
| Forward purchase contracts | 1,187 | | | 29 | | | | | | 2,633 | | | (36) | | | | |
| Forward sale contracts | 1,716 | | | 42 | | | | | | 705 | | | (4) | | | | |
| Currency swaps sales | — | | | — | | | | | | 500 | | | (41) | | | | |
| Exchange option purchases | 2,317 | | | 38 | | | | | | 1,030 | | | (4) | | | | |
| Exchange options sales | 1,213 | | | 10 | | | | | | 1,418 | | | (5) | | | | |
| Total foreign exchange rate instruments | | | 119 | | | | | | | | (90) | | | | |
| | | | | | | | | | | | | |
| Raw materials (base metals), freight, energy, emission rights | | | | | | | | | | | | | |
| Term contracts sales | 250 | | | 29 | | | | | | 182 | | | (7) | | | | |
| Term contracts purchases | 419 | | | 117 | | | | | | 1,479 | | | (142) | | | | |
| Option sales/purchases | 12 | | | 6 | | | | | | 10 | | | (6) | | | | |
| Total raw materials (base metals), freight, energy, emission rights | | | 152 | | | | | | | | (155) | | | | |
| Total | | | 271 | | | | | | | | (245) | | | | |
| | |
Consolidated financial statements 223 |
| (millions of U.S. dollars, except share and per share data) |
Derivative financial assets and liabilities classified as Level 2 refer to instruments to hedge fluctuations in interest rates, foreign exchange rates, raw materials (base metals), freight, energy and emission rights. The total fair value is based on the price a dealer would pay or receive for the security or similar securities, adjusted for any terms specific to that asset or liability. Market inputs are obtained from well-established and recognized vendors of market data and the fair value is calculated using standard industry models based on significant observable market inputs such as foreign exchange rates, commodity prices, swap rates and interest rates.
Derivative financial instruments classified as Level 3:
Derivative financial non-current assets classified as Level 3 refer to the call option on the 1,000 mandatory convertible bonds (see note 11.2). The fair valuation of Level 3 derivative instruments is established at each reporting date and compared to the prior period. ArcelorMittal’s valuation policies for Level 3 derivatives are an integral part of its internal control procedures and have been reviewed and approved according to the Company’s principles for establishing such procedures. In particular, such procedures address the accuracy and reliability of input data, the accuracy of the valuation model and the knowledge of the staff performing the valuations.
ArcelorMittal establishes the fair valuation of the call option on the 1,000 mandatory convertible bonds through the use of binomial valuation models based on the estimated values of the underlying equity spot price of $141 and volatility of 16%. Binomial valuation models use an iterative procedure to price options, allowing for the specification of nodes, or points in time, during the time span between the valuation date and the option’s expiration date. In contrast to the Black-Scholes model, which provides a numerical result based on inputs, the binomial model allows for the calculation of the asset and the option for multiple periods along with the range of possible results for each period.
Observable input data used in the valuations include zero coupon yield curves, stock market price of China Oriental (2019: China Oriental and Erdemir), European Central Bank foreign exchange fixing rates and Libor interest rates. Unobservable inputs are used to measure fair value to the extent that relevant observable inputs are not available. Specifically, the Company computed unobservable volatility data during 2020 based mainly
on the movement of China Oriental stock market prices observable in the active market over 90 working days, which is particularly sensitive for the valuation resulting from the model. Following the repayment of notes issued by subsidiaries to the Company which were linked to the value of Erdemir shares in 2019 as described in note 11.2, the unobservable volatility data from the movement of Erdemir shares does no longer impact the valuation. A 10% increase or decrease in Hera Ermac share prices would result in a 156% and 92% increase and decrease of the fair value of the call option at December 31, 2020, respectively.
Derivative financial liabilities classified as Level 3 as of December 31, 2019 included the put option granted to ISP in the context of the acquisition of ArcelorMittal Italia. The put option was exercised in December 2020 simultaneously to the signing of an investment agreement (see note 2.2.4). The option exercise price was determined as the higher of a reference operating income projection and the net present value of ISP's initial €100 million equity contribution bearing interest at a contractually agreed rate at the put option exercise date. The fair value of the put option liability over the year was sensitive to unobservable inputs such as ArcelorMittal Italia's future cash flow projections and observable inputs such as ISP's credit rating.
As of December 31, 2019, derivative financial liabilities classified as Level 3 also included a pellet purchase agreement containing a special payment that varied according to the price of steel in the United States domestic market (“domestic steel price”). The instrument was derecognized on December 9, 2020 following the sale of ArcelorMittal USA (note 2.3.1). Until the divestment date the fair valuation of the special payment had been established by comparing the current forecasted domestic steel price to the projected domestic steel price at the inception of the contract. Observable input data included third-party forecasted domestic steel prices. Unobservable inputs were used to measure fair value to the extent that relevant observable inputs were not available or not consistent with the Company's views on future prices and referred specifically to domestic steel prices beyond the timeframe of available third-party forecasts. As of the date of sale the fair value of the pellet purchase was based on the future average US domestic steel price of $554 per net ton.
| | |
224 Consolidated financial statements |
The following table summarizes the reconciliation of the fair value of the financial instruments classified as Level 3:
| | | | | | | | | | | | | | | | | | | | | | | |
| | Put option with ISP | | Call option on 1,000 mandatory convertible bonds | | Special payment in pellet purchase agreement | | Total |
| Balance as of December 31, 2018 | (124) | | | 483 | | | (568) | | | (209) | |
| Change in fair value | (1) | | | (356) | | | 392 | | | 35 | |
| Balance as of December 31, 2019 | (125) | | | 127 | | | (176) | | | (174) | |
| Change in fair value/foreign exchange differences | (10) | | | (68) | | | 6 | | | (72) | |
| Value of option at exercise date/divested balance | 135 | | | — | | | 170 | | | 305 | |
| Balance as of December 31, 2020 | — | | | 59 | | | — | | | 59 | |
The fair value movement on Level 3 derivative instruments is recorded in the consolidated statements of operations and other comprehensive income. The decrease in fair value of the call option on 1,000 mandatory convertible bonds is due to a decrease in the share price of China Oriental, which impacts the value of the notes in which Hera Ermac, a wholly-owned subsidiary, invested the bonds proceeds (see note 11.2), partly offset with the increase in the option's time value following the extension of maturity from January 29, 2021 to January 31, 2024.
6.1.6 Other non-derivative financial assets and liabilities
Other non-derivative financial assets and liabilities include cash and cash equivalents, restricted cash and other restricted funds (see note 6.1.3), certain trade and certain other receivables (see note 4.3, 4.5 and 4.6), investments in equity instruments at FVOCI (see note 2.5), trade payables and certain other liabilities (see notes 4.7 and 4.8). These instruments are recognized initially at fair value when the Company becomes a party to the contractual provisions of the instrument. Non-derivative financial assets are derecognized if the Company’s contractual rights to the cash flows from the financial instruments expire or if the Company transfers the financial instruments to another party without retaining control of substantially all risks and rewards of the instruments. Non-derivative financial liabilities are derecognized when they are extinguished (i.e. when the obligation specified in the contract is discharged, canceled or expired).
Impairment of financial assets
In relation to the impairment of financial assets, IFRS 9 requires an expected credit loss ("ECL") model. The ECL model requires the Group to account for expected credit losses and changes in those ECL at each reporting date to reflect changes in credit risk since initial recognition of the financial assets. In particular, IFRS 9 requires the Company to measure the loss allowance for a financial instrument at an amount equal to the lifetime ECL if the credit risk on that financial instrument has increased significantly since initial recognition. ArcelorMittal considered the continued impact of the COVID-19 pandemic on the economic environment in its risk of default assessment for receivables outstanding less than 180 days. Receivables aged 31 days or
older and uninsured trade receivables remain consistent with historical levels and the Company did not identify any expected increased risk of default (note 4.3).
All fair value movements for investments in equity instruments at FVOCI, including the difference between the acquisition cost and the current fair value, are recorded in OCI and are not reclassified to the consolidated statements of operations. Investments in equity instruments at FVOCI are exempt from the impairment test under IFRS 9 because the fair value of the investment is recorded in OCI and not recycled to profit and loss.
Financial assets are tested for ECLs annually or whenever changes in circumstances indicate that there is a change in credit risk. Any ECL is recognized in the consolidated statements of operations. An ECL related to financial assets is reversed if and to the extent there has been a change in the factors used to determine the recoverable amount. The loss is reversed only to the extent that the asset’s carrying amount does not exceed the carrying amount that would have been determined if no ECL had been recognized. Reversals of ECLs are recognized in net income except for investments in equity instruments at FVOCI, for which all fair value movements are recognized in OCI.
| | |
Consolidated financial statements 225 |
| (millions of U.S. dollars, except share and per share data) |
6.2 Financing costs - net
Financing costs - net recognized in the years ended December 31, 2020, 2019 and 2018 are as follows:
| | | | | | | | | | | | | | | | | |
| Year ended December 31, |
| 2020 | | 2019 | | 2018 |
| | | | | |
| Interest expense | (477) | | | (695) | | | (687) | |
| Interest income | 56 | | | 88 | | | 72 | |
| Change in fair value adjustment on call option on mandatory convertible bonds and pellet purchase agreement (note 6.1.5) | (143) | | | (320) | | | (572) | |
| Accretion of defined benefit obligations and other long term liabilities | (325) | | | (405) | | | (349) | |
| Net foreign exchange result | 107 | | | 4 | | | (235) | |
Other1 | (474) | | | (324) | | | (439) | |
| Total | (1,256) | | | (1,652) | | | (2,210) | |
1.Other mainly includes expenses related to true sale of receivables (“TSR”) programs and bank fees. It also includes premiums and fees of 120 relating to the bonds early redeemed in 2020 (71 and 104 of premiums and fees relating to bonds early redeemed in 2019 and 2018, respectively). In 2020, other also includes 178 relating to renewal of mandatorily convertible bonds (see note 11.2).
6.3 Risk management policy
The Company's operations expose it to a variety of financial risks: interest rate risk, foreign exchange risk, liquidity risk and risks in fluctuations in prices of raw materials, freight, energy and emissions. The Company actively monitors and seeks to reduce volatility of these exposures through a diversity of financial instruments, where considered appropriate. The Company has formalized how it manages these risks within the Treasury and Financial Risk Management Policy, which has been approved by Management.
Capital management
The Company's objective when managing capital is to safeguard continuity, maintain a strong credit rating and healthy capital ratios to support its business and provide adequate return to shareholders through continuing growth.
The Company sets the amount of capital required on the basis of annual business and long-term operating plans which include capital and other strategic investments. The funding requirement is met through a combination of equity, bonds and other long-term and short-term borrowings.
The Company monitors capital using a gearing ratio, being the ratio of net debt as a percentage of total equity.
| | | | | | | | | | | |
| December 31, |
| 2020 | | 2019 |
| Total equity | 40,237 | | | 40,483 | |
Net debt (including 21 and nil cash and debt classified as held for sale as of December 31, 2020 and 2019 respectively) | 6,380 | | | 9,345 | |
| Gearing | 15.9 | % | | 23.1 | % |
Interest rate risk
The Company is exposed to interest rate risk on short-term and long-term floating rate instruments and on refinancing of fixed rate debt. The Company's policy is to maintain a balance of fixed and floating interest rate borrowings, which is adjusted depending on the prevailing market interest rates and outlook. As at December 31, 2020, the long-term debt was comprised of 86% fixed rate debt and 14% variable rate debt (note 6.1.2). The Company utilizes certain instruments to manage interest rate risks. Interest rate instruments allow the Company to borrow long-term at fixed or variable rates, and to swap the rate of this debt either at inception or during the lifetime of the borrowing. The Company and its counterparties exchange, at predefined intervals, the difference between the agreed fixed rate and the variable rate, calculated on the basis of the notional amount of the swap. Similarly, swaps may be used for the exchange of variable rates against other variable rates.
Foreign exchange rate risk
The Company is exposed to changes in values arising from foreign exchange rate fluctuations generated by its operating activities. Because a substantial portion of ArcelorMittal’s assets, liabilities, sales and earnings are denominated in currencies other than the U.S. dollar (its reporting currency), ArcelorMittal has an exposure to fluctuations and depreciation in the values of these currencies relative to the U.S. dollar. These currency fluctuations, especially the fluctuation of the value of the U.S. dollar relative to the euro, the Canadian dollar, Brazilian real, Polish Zloty, Kazakhstani tenge, South African rand and Ukrainian hryvnia, as well as fluctuations in the other countries’ currencies in which ArcelorMittal has significant operations and/or sales, could have a material impact on its financial position, cash flows and results of operations.
ArcelorMittal faces transaction risk, where its businesses generate sales in one currency but incur costs relating to that revenue in a different currency. For example, ArcelorMittal’s subsidiaries may purchase raw materials, including iron ore and coking coal, in U.S. dollars, but may sell finished steel products in other currencies. Consequently, an appreciation of the U.S. dollar will increase the cost of raw materials; thereby having a negative impact on the Company’s operating margins, unless the Company is able to pass along the higher cost in the form of higher selling prices.
| | |
226 Consolidated financial statements |
Following its Treasury and Financial Risk Management Policy, the Company hedges a portion of its net exposure to foreign exchange rates through forwards, options and swaps.
ArcelorMittal also faces foreign currency translation risk, which arises when ArcelorMittal translates the statements of operations of its subsidiaries, its corporate net debt (note 6.1.4) and other items denominated in currencies other than the U.S. dollar, for inclusion in the consolidated financial statements. The Company manages translation risk arising from its investments in subsidiaries by monitoring the currency mix of the consolidated statements of financial position. The Company may enter into derivative transactions to hedge the residual exposure (see “—Net investment hedge”).
The Company also uses the derivative instruments, described above, at the corporate level to hedge debt recorded in foreign currency other than the functional currency or the balance sheet risk associated with certain monetary assets denominated in a foreign currency other than the functional currency.
Foreign currency sensitivity analysis
As of December 31, 2020, the Company is mainly subject to foreign exchange exposure relating to the euro, Brazilian real, Canadian dollar, Kazakhstani tenge, South African rand, Mexican peso, Polish zloty, Argentine peso and Ukranian hryvnia against the U.S. dollar resulting from its trade payables and receivables.
| | | | | | | | | | | |
| December 31, 2020 |
| Trade receivables | | Trade payables |
| USD | 830 | | | 4,168 | |
| EUR | 805 | | | 4,507 | |
| BRL | 705 | | | 934 | |
| CAD | 42 | | | 284 | |
| KZT | 42 | | | 206 | |
| ZAR | 82 | | | 249 | |
| MXN | 55 | | | 54 | |
| UAH | 62 | | | 161 | |
| PLN | 165 | | | 615 | |
| ARS | 51 | | | 61 | |
| Other | 233 | | | 286 | |
| Total | 3,072 | | | 11,525 | |
The sensitivity analysis carried out by the Company considers the effects on its trade receivables and trade payables of a 10% increase or decrease between the relevant foreign currencies and the U.S. dollar.
| | | | | | | | | | | | | | | | | | | | | | | |
| 10% increase | | 10% decrease |
| Trade receivables | | Trade payables | | Trade receivables | | Trade payables |
| EUR | 81 | | | 451 | | | (81) | | | (451) | |
| BRL | 71 | | | 93 | | | (71) | | | (93) | |
| CAD | 4 | | | 28 | | | (4) | | | (28) | |
| KZT | 4 | | | 21 | | | (4) | | | (21) | |
| ZAR | 8 | | | 25 | | | (8) | | | (25) | |
| MXN | 6 | | | 5 | | | (6) | | | (5) | |
| UAH | 6 | | | 16 | | | (6) | | | (16) | |
| PLN | 17 | | | 62 | | | (17) | | | (62) | |
| ARS | 5 | | | 6 | | | (5) | | | (6) | |
The use of a 10% sensitivity rate is used when reporting foreign currency exposure internally to key management personnel and represents management’s assessment of the reasonably possible change in foreign exchange rates. The sensitivity analysis includes trade receivables and trade payables denominated in a currency other than the U.S. dollar and adjusts their translation at the period end for a 10% change in foreign currency rates. For trade receivables, a positive number indicates an income and a negative number an expense. For trade payables, a positive number indicates an expense and a negative number an income.
Hedge accounting policy
The Company determines the economic relationship between the hedged item and the hedging instrument by analyzing the critical terms of the hedge relationship. In case critical terms do not match and fair value changes in the hedging instrument cannot be expected to perfectly offset changes in the fair value of the hedged item, further qualitative analysis may be performed. Such analysis serves to establish whether the economic relationship is sufficiently strong to comply with the Company’s risk management policies.
The hedge ratio is set out in the Company's risk management strategy and may be individually tailored for each hedging program in the risk management objective. Hedge ratios below 100% would usually be applied on hedging of forecast exposures with the hedge ratio typically reducing where there is uncertainty due to long hedging tenors or volatility in the underlying exposure.
The most frequent sources of hedge ineffectiveness relate to changes in the hedged item (such as maturity, volume and pricing indices), basis spread and significant changes in the credit risk. Such sources are analyzed at hedge initiation and monitored throughout the life of a hedge.
Liquidity Risk
Liquidity risk is the risk that the Company may encounter difficulties in meeting its obligations associated with financial
| | |
Consolidated financial statements 227 |
| (millions of U.S. dollars, except share and per share data) |
liabilities that are settled by delivering cash. ArcelorMittal Treasury is responsible for the Company's funding and liquidity management. ArcelorMittal’s principal sources of liquidity are cash generated from its operations, its credit lines at the corporate level and various working capital credit lines at the level of its operating subsidiaries. The Company actively manages its liquidity. Following the Company's Treasury and Financial Risk Management Policy, the levels of cash, credit lines and debt are closely monitored and appropriate actions are taken in order to comply with the covenant ratios, leverage, fixed/floating ratios, maturity profile and currency mix.
The contractual maturities of the below financial liabilities include estimated loan repayments, interest payments and settlement of derivatives, excluding any impact of netting agreements. The cash flows are calculated based on market data as of December 31, 2020, and as such are sensitive to movements in mainly foreign exchange rates and interest rates. The cash flows are non-discounted, except for derivative financial liabilities where the cash flows equal their fair values.
| | | | | | | | | | | | | | | | | | | | | | | | | | | | | | | | | | | |
| December 31, 2020 |
| Carrying amount | | Contractual Cash Flow | | 2021 | | 2022 | | from 2023 to 2025 | | After 2025 |
| Non-derivative financial liabilities | | | | | | | | | | | |
| Bonds | (7,888) | | | (10,307) | | | (616) | | | (851) | | | (5,135) | | | (3,705) | |
| Loans over 100 | (1,998) | | | (2,345) | | | (769) | | | (190) | | | (998) | | | (388) | |
| Trade and other payables | (11,525) | | | (11,530) | | | (11,530) | | | — | | | — | | | — | |
| Other loans and lease | (2,436) | | | (2,692) | | | (1,448) | | | (211) | | | (546) | | | (487) | |
| Total | (23,847) | | | (26,874) | | | (14,363) | | | (1,252) | | | (6,679) | | | (4,580) | |
| Derivative financial liabilities | | | | | | | | | | | |
| Foreign exchange contracts | (170) | | | (170) | | | (149) | | | (13) | | | (8) | | | — | |
Other commodities contracts1 | (134) | | | (134) | | | (59) | | | (28) | | | (47) | | | — | |
| Total | (304) | | | (304) | | | (208) | | | (41) | | | (55) | | | — | |
1.Commodity contracts include base metals, freight, energy and emission rights.
| | | | | | | | | | | | | | | | | | | | | | | | | | | | | | | | | | | |
| December 31, 2019 |
| Carrying amount | | Contractual Cash Flow | | 2020 | | 2021 | | from 2022 to 2024 | | After 2024 |
| Non-derivative financial liabilities | | | | | | | | | | | |
| Bonds | (9,398) | | | (12,227) | | | (880) | | | (643) | | | (5,542) | | | (5,162) | |
| Loans over 100 | (1,968) | | | (2,405) | | | (534) | | | (453) | | | (1,014) | | | (404) | |
| Trade and other payables | (12,614) | | | (12,619) | | | (12,619) | | | — | | | — | | | — | |
| Other loans | (2,974) | | | (3,257) | | | (1,886) | | | (297) | | | (528) | | | (546) | |
| Total | (26,954) | | | (30,508) | | | (15,919) | | | (1,393) | | | (7,084) | | | (6,112) | |
| Derivative financial liabilities | | | | | | | | | | | |
Equity contracts (Put options)1 | (125) | | | (125) | | | (125) | | | — | | | — | | | — | |
| Foreign exchange contracts | (90) | | | (90) | | | (49) | | | — | | | — | | | (41) | |
Other commodities contracts2 | (331) | | | (331) | | | (134) | | | (76) | | | (103) | | | (18) | |
| Total | (546) | | | (546) | | | (308) | | | (76) | | | (103) | | | (59) | |
1.Equity contracts balance as of December 31, 2019 shown above included the the put option granted to ISP in the context of the acquisition of ArcelorMittal Italia, which was exercised in December 2020, see note 2.2.4 and 2.3.2.
2.Commodity contracts include base metals, freight, energy and emission rights.
| | |
228 Consolidated financial statements |
Cash flow hedges
The following tables present the periods in which the derivatives designated as cash flows hedges are expected to mature:
| | | | | | | | | | | | | | | | | | | | | | | | | | | | | | | | | | | |
| December 31, 2020 |
| Assets/ (liabilities) | | (Outflows)/inflows |
| Fair value | | 3 months and less | | 3-6 months | | 6-12 months | | 2022 | | After 2022 |
| Foreign exchange contracts | (37) | | | (29) | | | (31) | | | (21) | | | 2 | | | 42 | |
| Commodities | (35) | | | — | | | 1 | | | 6 | | | (9) | | | (33) | |
| Emission rights | 405 | | | 89 | | | — | | | 129 | | | 187 | | | — | |
| Total | 333 | | | 60 | | | (30) | | | 114 | | | 180 | | | 9 | |
| | | | | | | | | | | | | | | | | | | | | | | | | | | | | | | | | | | |
| December 31, 2019 |
| Assets/ (liabilities) | | (Outflows)/inflows |
| Fair value | | 3 months and less | | 3-6 months | | 6-12 months | | 2021 | | After 2021 |
| Foreign exchange contracts | 46 | | | 67 | | | (17) | | | (4) | | | — | | | — | |
Commodities1 | (275) | | | (12) | | | (27) | | | (40) | | | (47) | | | (149) | |
| Emission rights | 88 | | | (4) | | | — | | | 92 | | | — | | | — | |
| Total | (141) | | | 51 | | | (44) | | | 48 | | | (47) | | | (149) | |
1.The commodities balance as of December 31, 2019 shown above included the commodities liability balance of 176 for the special payment in the pellet purchase agreement, which was disposed in 2020 with the sale of ArcelorMittal USA (note 6.1.5).
Associated gains or losses that were recognized in other comprehensive income are reclassified to the consolidated statements of operations in the same period during which the hedged forecasted cash flow affects the consolidated statements of operations. The following table presents the periods in which the realized and unrealized gains or losses on derivatives designated as cash flows hedges recognized in other comprehensive income, net of tax, are expected to impact the consolidated statements of operations:
| | | | | | | | | | | | | | | | | | | | | | | | | | | | | | | | | | | |
| December 31, 2020 |
| Cash flow hedge reserve1 | | (Expense)/income |
| Carrying amount | | 3 months and less | | 3-6 months | | 6-12 months | | 2022 | | After 2022 |
| Foreign exchange contracts | (13) | | | 3 | | | 1 | | | (23) | | | 2 | | | 4 | |
| Commodity contracts | (2) | | | 2 | | | 2 | | | 8 | | | 4 | | | (18) | |
| Emission rights | 214 | | | 15 | | | 15 | | | 33 | | | 81 | | | 70 | |
| Total | 199 | | | 20 | | | 18 | | | 18 | | | 87 | | | 56 | |
1.The cash flow hedge reserve balance as of December 31, 2020 also includes 30 deferred gains for the Company's share of such reserves at its equity method investments, which are not disclosed above (nil as of December 31, 2019).
| | | | | | | | | | | | | | | | | | | | | | | | | | | | | | | | | | | |
| December 31, 2019 |
| Cash flow hedge reserve | | (Expense)/income |
| Carrying amount | | 3 months and less | | 3-6 months | | 6-12 months | | 2021 | | After 2021 |
| Foreign exchange contracts | 13 | | | 9 | | | 1 | | | 3 | | | — | | | — | |
Commodity contracts1 | (106) | | | (16) | | | (19) | | | (27) | | | (44) | | | — | |
| Emission rights | 310 | | | 72 | | | 73 | | | 145 | | | 16 | | | 4 | |
| Total | 217 | | | 65 | | | 55 | | | 121 | | | (28) | | | 4 | |
1.The commodity contracts balance as of December 31, 2019 shown above included 29 deferred losses related to the special payment in the pellet purchase agreement and other commodity hedges, which were disposed in 2020 with the sale of ArcelorMittal USA (note 6.1.5).
| | |
Consolidated financial statements 229 |
| (millions of U.S. dollars, except share and per share data) |
The following tables summarize the effect of hedge accounting on ArcelorMittal’s consolidated statement of financial position, statement of comprehensive income and statement of changes in equity.
| | | | | | | | | | | | | | | | | | | | | | | |
| December 31, 2020 |
| Hedging Instruments | Nominal amount of the hedging instrument | | Assets carrying amount | | Liabilities carrying amount | | Line item in the statement of financial position where the hedging instrument is located |
| Cash flow hedges | | | | | | | |
| Foreign exchange risk - Option/forward contracts | 2,379 | | | 3 | | | (84) | | | Prepaid expenses and other current assets/Accrued expenses and other liabilities |
| Foreign exchange risk - Option/forward/swap contracts | 440 | | | 44 | | | — | | | Other assets/Other long-term obligations |
| Price risk - Commodities forwards | 459 | | | 22 | | | (14) | | | Prepaid expenses and other current assets/Accrued expenses and other liabilities |
| Price risk - Commodities forwards | 971 | | | 32 | | | (75) | | | Other assets/Other long-term obligations |
| Price risk - Emission rights forwards | 686 | | | 218 | | | — | | | Prepaid expenses and other current assets/Accrued expenses and other liabilities |
| Price risk - Emission rights forwards | 348 | | | 187 | | | — | | | Other assets/Other long-term obligations |
| Total | | | 506 | | | (173) | | | |
| | | | | | | | | | | | | | | | | | | | | | | | | | | | | | | | | | | |
| December 31, 2020 |
| Hedging Instruments | Cash flow hedge reserve at December 31, 2019 | | Hedging gains or losses of the reporting period that were recognized in OCI | | Gains or losses reclassification adjustment and hedge ineffectiveness | | Basis adjustment | | Line item in the statement of comprehensive income that includes the reclassification adjustment and hedge ineffectiveness | | Cash flow hedge reserve at December 31, 20201 |
| Cash flow hedges | | | | | | | | | | | |
| Foreign exchange risk - Option/Forward contracts | 31 | | | (96) | | | 35 | | | 17 | | | Sales | | (13) | |
| Price risk - Commodities forwards | (106) | | | (140) | | | 241 | | | 3 | | | Sales, Cost of sales | | (2) | |
| Price risk - Emission rights forwards | 310 | | | 271 | | | (367) | | | — | | | Cost of sales | | 214 | |
| Total | 235 | | | 35 | | | (91) | | | 20 | | | | | 199 | |
1.The cash flow hedge reserve balance as of December 31, 2020 also includes 30 deferred gains for the Company's share of such reserves at its equity method investments, which are not disclosed above.
| | | | | | | | | | | | | | | | | | | | | | | |
| December 31, 2019 |
| Hedging Instruments | Nominal amount of the hedging instrument | | Assets carrying amount | | Liabilities carrying amount | | Line item in the statement of financial position where the hedging instrument is located |
| Cash flow hedges | | | | | | | |
| Foreign exchange risk - Option/Forward contracts | 5,207 | | | 80 | | | (34) | | | Prepaid expenses and other current assets/Accrued expenses and other liabilities |
Price risk - Commodities forwards1 | 531 | | | 14 | | | (93) | | | Prepaid expenses and other current assets/Accrued expenses and other liabilities |
Price risk - Commodities forwards1 | 721 | | | — | | | (196) | | | Other assets/Other long-term obligations |
| Price risk - Emission rights forwards | 559 | | | 104 | | | (16) | | | Prepaid expenses and other current assets/Accrued expenses and other liabilities |
| Total | | | 198 | | | (339) | | | |
1.The commodities balance as of December 31, 2019 shown above included 38 short-term and 138 long-term amounts for the special payment in the pellet purchase agreement, which was derecognized in 2020 with the sale of ArcelorMittal USA (note 6.1.5).
| | |
230 Consolidated financial statements |
| | | | | | | | | | | | | | | | | | | | | | | | | | | | | | | | | | | |
| December 31, 2019 |
| Hedging Instruments | Cash flow hedge reserve at December 31, 2018 | | Hedging gains or losses of the reporting period that were recognized in OCI | | Gains or losses reclassification adjustment and hedge ineffectiveness | | Basis adjustment | | Line item in the statement of comprehensive income that includes the reclassification adjustment and hedge ineffectiveness | | Cash flow hedge reserve at December 31, 2019 |
| Cash flow hedges | | | | | | | | | | | |
| Foreign exchange risk - Option/Forward contracts | 282 | | | 76 | | | (4) | | | (323) | | | Sales | | 31 | |
Price risk - Commodities forwards1 | (399) | | | 272 | | | 21 | | | — | | | Sales, Cost of sales | | (106) | |
| Price risk - Emission rights forwards | 778 | | | (32) | | | (436) | | | — | | | Cost of sales | | 310 | |
| Total | 661 | | | 316 | | | (419) | | | (323) | | | | | 235 | |
1.The commodity contracts balance as of December 31, 2019 shown above included 29 deferred losses related to the special payment in the pellet purchase agreement, which was derecognized in 2020 with the sale of ArcelorMittal USA (note 6.1.5).
Net investment hedge
As of April 1, 2018, the Company designated a portfolio of euro denominated debt (€5,156 million as of December 31, 2020) as a hedge of certain euro denominated investments (€7,445 million as of December 31, 2020) in order to mitigate the foreign currency risk arising from certain euro denominated subsidiaries net assets. The risk arises from the fluctuation of the euro/U.S dollar spot rate, which causes the amount of the net investments to vary. The euro denominated debt is designated as a hedging instrument for the change in the value of the net investments that is attributable to changes in the euro/U.S dollar spot rate. As of December 31, 2020, the Company recognized 597 foreign exchange loss arising on the translation of the euro
denominated debt designated as a hedge of the euro denominated net investments in foreign operations in other comprehensive income within the foreign exchange translation reserve. The hedging instrument is categorized as Level 2.
Since 2014, the Company has periodically hedged a part of its euro denominated net investments via euro/U.S. dollar cross currency swaps ("CCS"). These CCS, all of which have been unwound, were designated as net investment hedges.
The following tables summarizes the historical gain/loss that will be recycled to the consolidation statements of operations when the hedged assets are disposed of.
| | | | | | | | | | | | | | | | | | | | | | | |
| December 31, 2020 |
| Date traded | Date maturity /unwound | Notional | OCI gross | | Deferred tax | | OCI net of deferred tax |
| December, 2014 | January, 2016 | 375 | 83 | | | (24) | | | 59 | |
| May, 2015 | March, 20201 | 500 | 11 | | | (3) | | | 8 | |
| May, 2015 | July, 2019 | 500 | (16) | | | 5 | | | (11) | |
| March, 2018 | June, 2018 | 100 | 8 | | | (2) | | | 6 | |
| April, 2019 | November, 2019 | 200 | 11 | | | (3) | | | 8 |
| Total | | | 97 | | | (27) | | | 70 | |
1.On March 25, 2020 and March 26, 2020, the Company unwound euro/U.S. dollar CCS with a notional of 300 and 200, respectively, which were entered into on May 27, 2015 and designated as a net investment hedge of a euro denominated net investment in foreign operations amounting to €459. A deferred gain of 8, net of tax, was recorded in other comprehensive income and it will be recycled to the consolidation statements of operations when the hedged assets are disposed of.
| | |
Consolidated financial statements 231 |
| (millions of U.S. dollars, except share and per share data) |
| | | | | | | | | | | | | | | | | | | | | | | |
| December 31, 2019 |
| Date traded | Date maturity /unwound | Notional | OCI gross | | Deferred tax | | OCI net of deferred tax |
| December, 2014 | January, 2016 | 375 | 83 | | | (24) | | | 59 | |
| May, 2015 | June, 2025 | 500 | (41) | | | 12 | | | (29) | |
| May, 2015 | July, 2019 | 500 | (16) | | | 5 | | | (11) | |
| March, 2018 | June, 2018 | 100 | 8 | | | (2) | | | 6 | |
| April, 2019 | November, 2019 | 200 | 11 | | | (3) | | | 8 | |
| Total | | | 45 | | | (12) | | | 33 | |
| | | | | | | | | | | | | | | | | | | | | | | | | | | | | | | | | | | | | | | | | |
| December 31, 2020 |
| Hedging Instruments | Nominal amount of the hedging instrument | | Assets carrying amount | | Liabilities carrying amount | | Line item in the statement of financial position where the hedging instrument is located | | Change in value used for calculating hedge ineffectiveness for 2020 | | Line item in the statement of comprehensive income that includes the recognized hedge ineffectiveness | | Foreign currency translation reserve |
| Net investment hedges | | | | | | | | | | |
| Foreign exchange risk - Cross Currency Swap | — | | | — | | | — | | | N/a | | — | | | N/a | | 70 | |
| Foreign exchange risk - EUR debt | 6,335 | | | — | | | (6,327) | | | Short-term debt and current portion of long-term debt; long-term debt, net of current portion | | — | | | N/a | | (10) | |
| Total | 6,335 | | | — | | | (6,327) | | | | | — | | | | | 60 | |
| | | | | | | | | | | | | | | | | | | | | | | | | | | | | | | | |
| Derivatives | | Notional amount | | Date traded | | Fair value atFair value at December 31, 2018 | | Change in fair value | | Fair value as of December 31, 20191 |
CCS 10Y | | 300 | | | May 27, 2015 | | (39) | | | 14 | | | (25) | |
CCS 10Y | | 160 | | | May 27, 2015 | | (21) | | | 8 | | | (13) | |
CCS 10Y | | 40 | | | May 27, 2015 | | (6) | | | 3 | | | (3) | |
| Total | | 500 | | | | | (66) | | | 25 | | | (41) | |
1.The net investment hedges were fully effective. As such, the change in fair value is entirely recorded in other comprehensive income.
| | | | | | | | | | | | | | | | | | | | | | | | | | | | | | | | | | | | | | | | | |
| December 31, 2019 |
| Hedging Instruments | Nominal amount of the hedging instrument | | Assets carrying amount | | Liabilities carrying amount | | Line item in the statement of financial position where the hedging instrument is located | | Change in value used for calculating hedge ineffectiveness for 2019 | | Line item in the statement of comprehensive income that includes the recognized hedge ineffectiveness | | Foreign currency translation reserve |
| Net investment hedges | | | | | | | | | | | | | |
| Foreign exchange risk - Cross Currency Swap | 500 | | | — | | | (41) | | | Other long-term obligations | | — | | | N/a | | 33 | |
| Foreign exchange risk - EUR debt | 7,788 | | | — | | | (7,777) | | | Short-term debt and current portion of long-term debt; long-term debt, net of current portion | | — | | | N/a | | 567 | |
| Total | 8,288 | | | — | | | (7,818) | | | | | — | | | | | 600 | |
| | |
232 Consolidated financial statements |
Raw materials, freight, energy risks and emission rights
The Company is exposed to risks in fluctuations in prices of raw materials (including base metals such as zinc, nickel, aluminum, tin, copper and iron ore), freight and energy, both through the purchase of raw materials and through sales contracts. The Company uses financial instruments such as forward purchases or sales, options and swaps in order to manage the volatility of prices of certain raw materials, freight and energy.
Fair values of raw material, freight, energy and emission rights instruments categorized as Level 2 are as follows:
| | | | | | | | | | | |
| December 31, |
| 2020 | | 2019 |
| Base metals | 7 | | | (6) | |
| Freight | — | | | 7 | |
| Energy (oil, gas, electricity) | (36) | | | (92) | |
| Emission rights | 407 | | | 88 | |
| Total | 378 | | | (3) | |
| | | |
| Derivative assets associated with raw materials, energy, freight and emission rights | 512 | | | 152 | |
| Derivative liabilities associated with raw materials, energy, freight and emission rights | (134) | | | (155) | |
| Total | 378 | | | (3) | |
ArcelorMittal consumes large amounts of raw materials (the prices of which are related to the London Metals Exchange price index, the Steel Index and Platts Index), ocean freight (the price of which is related to a Baltic Exchange Index), and energy (the prices of which are mainly related to the New York Mercantile Exchange energy index (NYMEX), the European Energy Exchange (EEX) power indexes, the powernext gas indexes). As a general matter, ArcelorMittal is exposed to price volatility with respect to its purchases in the spot market and under its long-term supply contracts. In accordance with its risk management policy, ArcelorMittal hedges a part of its exposure related to raw materials procurements.
Emission rights
Pursuant to the application of the European Directive 2003/87/EC of October 13, 2003, as amended by the European Directive 2009/29/EC of April 23, 2009, establishing a scheme for emission allowance trading, the Company enters into certain types of derivatives (mainly forward transactions and options) in order to implement its management policy for associated risks. As of December 31, 2020 and 2019, the Company had a net notional position of 1,035 with a net positive fair value of 407 and a net notional position of 557 with a net positive fair value of 88, respectively.
Credit risk
The Company’s treasury department monitors various market data regarding the credit standings and overall reliability of the financial institutions for all countries where the Company’s subsidiaries operate. The choice of the financial institution for the financial transactions must be approved by the treasury
department. Credit risk related to customers, customer credit terms and receivables are discussed in note 4.3.
Sensitivity analysis
Foreign currency sensitivity
The following tables detail the Company’s derivative financial instruments' sensitivity to a 10% strengthening and a 10% weakening in the U.S. dollar against the euro. A positive number indicates an increase in profit or loss and other equity, where a negative number indicates a decrease in profit or loss and other equity.
The sensitivity analysis includes the Company’s complete portfolio of foreign currency derivatives outstanding. The impact on the non €/$ derivatives reflects the estimated move of such currency pairs, when the U.S. dollar appreciates or depreciates 10% against the euro, based on computations of correlations in the foreign exchange markets in 2020 and 2019.
| | | | | | | | | | | |
| December 31, 2020 |
| Income | | Other Equity |
10% strengthening in U.S. dollar | (60) | | | 196 | |
10% weakening in U.S. dollar | 64 | | | (202) | |
| | | | | | | | | | | |
| December 31, 2019 |
| Income | | Other Equity |
10% strengthening in U.S. dollar | (104) | | | 325 | |
10% weakening in U.S. dollar | 113 | | | (252) | |
| | |
Consolidated financial statements 233 |
| (millions of U.S. dollars, except share and per share data) |
Cash flow sensitivity analysis for variable rate instruments
The following tables detail the Company’s variable interest rate instruments’ sensitivity. A change of 100 basis points (“bp”) in interest rates during the period would have increased (decreased) profit or loss by the amounts presented below. This analysis assumes that all other variables, in particular foreign currency rates, remain constant.
| | | | | | | | | | | |
| December 31, 2020 |
| Floating porting of net debt1 | | Interest Rate Swaps/Forward Rate Agreements |
100 bp increase | 40 | | | — | |
100 bp decrease | (40) | | | — | |
| | | | | | | | | | | |
| December 31, 2019 |
| Floating porting of net debt1 | | Interest Rate Swaps/Forward Rate Agreements |
100 bp increase | 30 | | | — | |
100 bp decrease | (30) | | | — | |
1.Please refer to note 6.1.4 for a description of net debt (including fixed and floating portion).
Base metals, energy, freight, emissions rights
The following tables detail the Company’s sensitivity to a 10% increase and decrease in the price of the relevant base metals, energy, freight and emissions rights. The sensitivity analysis includes only outstanding, un-matured derivative instruments either held for trading at fair value through the consolidated statements of operations or designated in hedge accounting relationships.
| | | | | | | | | | | |
| December 31, 2020 |
| Income | | Other Equity Cash Flow Hedging Reserves |
'+10% in prices | | | |
| Base Metals | 2 | | | 10 | |
| Iron Ore | — | | | (1) | |
| Freight | — | | | 3 | |
| Emission rights | — | | | 145 | |
| Energy | — | | | 82 | |
'-10% in prices | | | |
| Base Metals | (2) | | | (10) | |
| Iron Ore | — | | | 1 | |
| Freight | — | | | (3) | |
| Emission rights | — | | | (145) | |
| Energy | — | | | (82) | |
| | | | | | | | | | | |
| December 31, 2019 |
| Income | | Other Equity Cash Flow Hedging Reserves |
'+10% in prices | | | |
| Base Metals | 2 | | | 15 | |
| Iron Ore | — | | | — | |
| Freight | — | | | — | |
| Emission rights | — | | | 65 | |
| Energy | — | | | 71 | |
'-10% in prices | | | |
| Base Metals | (2) | | | (15) | |
| Iron Ore | — | | | — | |
| Freight | — | | | — | |
| Emission rights | — | | | (65) | |
| Energy | — | | | (71) | |
NOTE 7: LEASES
As a lessee, the Company assesses if a contract is or contains a lease at inception of the contract. A contract is or contains a lease if the contract conveys the right to control the use of an identified asset for a period of time in exchange for consideration.
The Company recognizes a right-of-use asset and a lease liability at the commencement date, except for short-term leases of twelve months or less and leases for which the underlying asset is of low value, which are expensed in the consolidated statement of operations on a straight-line basis over the lease term.
The lease liability is initially measured at the present value of the lease payments that are not paid at the commencement date, discounted using the interest rate implicit in the lease, or, if not readily determinable, the incremental borrowing rate specific to the country, term and currency of the contract. Lease payments can include fixed payments, variable payments that depend on an index or rate known at the commencement date, as well as any extension or purchase options, if the Company is reasonably certain to exercise these options. The lease liability is subsequently measured at amortized cost using the effective interest method and remeasured with a corresponding adjustment to the related right-of-use asset when there is a change in future lease payments in case of renegotiation, changes of an index or rate or in case of reassessments of options.
The right-of-use asset comprises, at inception, the initial lease liability, any initial direct costs and, when applicable, the obligations to refurbish the asset, less any incentives granted by the lessors. The right-of-use asset is subsequently depreciated, on a straight-line basis, over the lease term or, if the lease transfers the ownership of the underlying asset to the Company
| | |
234 Consolidated financial statements |
at the end of the lease term or, if the cost of the right-of-use asset reflects that the lessee will exercise a purchase option, over the estimated useful life of the underlying asset. Right-of-use assets are also subject to testing for impairment if there is an indicator that they may be impaired.
Variable lease payments not included in the measurement of the lease liabilities are expensed to the consolidated statement of
operations in the period in which the events or conditions which trigger those payments occur.
In the statement of financial position, right-of-use assets and lease liabilities are classified, respectively, as part of property, plant and equipment and short-term/long-term debt.
Following the adoption of IFRS 16 "Leases" on January 1, 2019, the Company recognized lease liabilities and right-of-use assets for operating lease contracts with fixed terms and future minimum lease payments as summarized in the following table:
| | | | | | | | | |
| Non-cancellable operating lease commitments as of December 31, 2018* | | | | | 1,869 | |
| Recognition exemption for leases of low-value assets | | | | | (58) | |
| Recognition exemption for short-term leases | | | | | (20) | |
| Undiscounted operating lease commitments as of January 1, 2019 | | | | | 1,791 | |
Effects of discounting using incremental borrowing rates (weighted average rate of 4.7%) | | | | | (632) | |
| Lease liabilities related to assets held for sale | | | | | (23) | |
| Additional lease liabilities as of January 1, 2019 from leases previously classified as operating leases in accordance with IAS 17 | | | | | 1,136 | |
| * As reported in the consolidated financial statements for the year ended December 31, 2018 |
Following the application of the modified retrospective method at the date of implementation of IFRS 16 on January 1, 2019, whereby right-of-use assets of 1,405 were measured at an amount equal to the lease liabilities of 1,136, increased by 77 related to favorable terms of operating leases acquired as part of previous business combinations and 192 related to amounts prepaid for the right of use of land, both reclassified from intangible assets. There was no impact on deferred tax assets and deferred tax liabilities as the corresponding deferred tax assets and deferred tax liabilities attributable to the lease liabilities and right-of-use assets relate to income taxes levied by the same taxation authority within the same legal entity and were therefore offset.
For leases that were classified as finance leases applying IAS 17, the carrying amount of the right-of-use asset and the lease liability at the date of initial application is the carrying amount of the lease asset and lease liability immediately before that date measured applying IAS 17 on December 31, 2018. The carrying amount of finance lease assets and lease liabilities was 363 and 423, respectively as of December 31, 2018. Accordingly, the total right-of-use assets and lease liabilities as of January 1, 2019 were 1,768 and 1,559, respectively.
There were no impacts on retained earnings upon implementation of IFRS 16.
| | |
Consolidated financial statements 235 |
| (millions of U.S. dollars, except share and per share data) |
Balances for the Company’s lease activities are summarized as follows:
| | | | | | | | | | | | | | |
| As at December 31, 2020 | | As at December 31, 2019 | |
| Lease liabilities | 815 | | | 1,127 | | |
| Right of-use assets: | | | | |
| Land, buildings and improvements | 761 | | | 854 | | |
| Machinery, equipment and others | 278 | | | 381 | | |
| Total right-of-use assets | 1,039 | | | 1,235 | | |
| | | | |
| Year ended December 31, 2020 | | Year ended December 31, 2019 | |
| Depreciation and impairment charges: | | | | |
| Land, buildings and improvements | 114 | | | 118 | |
| Machinery, equipment and others | 101 | | | 288 | |
| Total depreciation and impairment charges | 215 | | | 406 | | |
| | | | |
| Other lease related expenses: | | | | |
| Interest expense on lease liabilities | 66 | | | 98 | | |
| Expenses of short-term leases | 134 | | | 165 | | |
| Expenses of leases of low-value assets | 61 | | | 68 | | |
| Expenses related to variable lease payments not included in the measurement of lease liabilities | 73 | | | 65 | | |
| | | | |
| Additions to right-of-use assets | 233 | | | 259 | | |
| Lease payments recorded as reduction of lease liabilities and cash outflow from financing activities | 242 | | | 320 | | |
The Company's lease contracts relate to a variety of assets used in its operational and administrative activities through several units, such as land, buildings, vehicles, industrial machinery, logistic and commercial facilities and power generation facilities. There are no sale and lease back transactions and no restrictions or covenants are imposed by the Company's current effective lease contracts.
The decrease in right-of-use assets and lease liabilities in 2020 resulted mainly from the sale of ArcelorMittal USA (see note 2.3.1) for 149 and 278, respectively.
The maturity analysis of the lease liabilities as of December 31, 2020 and December 31, 2019, is as follows:
| | | | | | | | | | | | | | | | | |
| | | | December 31, 2020 |
| 1 year or less | 2-3 years | 4-5 years | Greater than 5 years | TOTAL |
| Lease liabilities (undiscounted) | 217 | | 265 | | 156 | | 778 | | 1,416 | |
| | | | | | | | | | | | | | | | | |
| | | | December 31, 2019 |
| 1 year or less | 2-3 years | 4-5 years | Greater than 5 years | TOTAL |
| Lease liabilities (undiscounted) | 279 | 369 | 209 | 513 | 1,370 | |
Expenses for variable lease payments relate to rental fees that vary based on the actual level of activities or performance of the underlying leased assets such as a percentage of sales of the Company's goods through certain leased commercial warehouses and fixed rental fees per actual unit of output produced or transported by the leased assets.
An estimation of the future cash outflows to which the Company is potentially exposed in relation to those contracts involving variable lease payments, which are not reflected in the measurement of lease liabilities as of December 31, 2020 and December 31, 2019, is as follows:
| | |
236 Consolidated financial statements |
| | | | | | | | | | | | | | | | | |
| | | | | December 31, 2020 |
| 1 year or less | 2-3 years | 4-5 years | Greater than 5 years | TOTAL |
| Potential variable lease payments | 58 | | 99 | | 68 | | 123 | | 348 | |
| | | | | | | | | | | | | | | | | |
| | | | | December 31, 2019 |
| 1 year or less | 2-3 years | 4-5 years | Greater than 5 years | TOTAL |
| Potential variable lease payments | 61 | | 91 | | 69 | | 73 | | 294 | |
Also, some of the Company's lease contracts have extension and/or termination options as well as residual value guarantees whose amounts are not reflected in the measurement of the lease liabilities as of December 31, 2020 and December 31, 2019. The potential addition/(reduction) in future cash outflows to which the Company is exposed in case such options are exercised or the guarantees required are as shown in the table below:
| | | | | | | | | | | | | | | | | |
| | | | December 31, 2020 |
| 1 year or less | 2-3 years | 4-5 years | Greater than 5 years | TOTAL |
| Potential extension options | 1 | | 1 | | — | | 1 | | 3 | |
| Potential termination options | (1) | | — | | — | | — | | (1) | |
| Potential residual value guarantees | 1 | | 1 | | 2 | | 3 | | 7 | |
| | | | | | | | | | | | | | | | | |
| | | | December 31, 2019 |
| 1 year or less | 2-3 years | 4-5 years | Greater than 5 years | TOTAL |
| Potential extension options | 1 | | 8 | | 13 | | 16 | | 38 | |
| Potential termination options | (2) | | (2) | | (1) | | (1) | | (6) | |
| Potential residual value guarantees | 1 | | 1 | | 1 | | — | | 3 | |
Undiscounted amounts related to lease contracts not yet commenced and therefore not included in the recognized lease liabilities as of December 31, 2020 and December 31, 2019, to which the Company is committed are described below:
| | | | | | | | | | | | | | | | | |
| | | | December 31, 2020 |
| 1 year or less | 2-3 years | 4-5 years | Greater than 5 years | TOTAL |
| Leases not yet commenced | 2 | | 6 | | 9 | | 51 | | 68 | |
| | | | | | | | | | | | | | | | | |
| | | | December 31, 2019 |
| 1 year or less | 2-3 years | 4-5 years | Greater than 5 years | TOTAL |
| Leases not yet commenced | 2 | | 8 | | 8 | | 13 | | 31 | |
There were neither income from subleasing right-of-use assets nor gains or losses from sales and leaseback for the years ended December 31, 2020 and December 31, 2019.
NOTE 8: PERSONNEL EXPENSES AND DEFERRED EMPLOYEE BENEFITS
8.1 Employees and key management personnel
As of December 31, 2020, 2019 and 2018, ArcelorMittal had approximately 168,000, 191,000 and 209,000 employees, respectively, and the total annual compensation of
ArcelorMittal’s employees in 2020, 2019 and 2018 was as follows:
| | | | | | | | | | | | | | | | | |
| | Year ended December 31, |
| Employee Information | 2020 | | 2019 | | 2018 |
| Wages and salaries | 7,681 | | | 8,380 | | | 8,176 | |
| Defined benefits cost (see note 8.2) | 260 | | | 201 | | | 264 | |
| Loss following new labor agreement in the U.S. (see note 8.2) | — | | | — | | | 15 | |
| Other staff expenses | 1,405 | | | 1,668 | | | 2,004 | |
| Total | 9,346 | | | 10,249 | | | 10,459 | |
| | |
Consolidated financial statements 237 |
| (millions of U.S. dollars, except share and per share data) |
The total annual compensation of ArcelorMittal’s key management personnel, including its Board of Directors, expensed in 2020, 2019 and 2018 was as follows:
| | | | | | | | | | | | | | | | | |
| | Year ended December 31, |
| | 2020 | | 2019 | | 2018 |
| Base salary and directors fees | 7 | | | 8 | | | 8 | |
| Short-term performance-related bonus | 3 | | | 9 | | | 8 | |
| Post-employment benefits | 1 | | | 1 | | | 1 | |
| Share-based payments | 4 | | | — | | | 4 | |
The fair value of the shares allocated based on Restricted Share Unit (“RSU”) and Preference Share Unit (“PSU”) plans to ArcelorMittal’s key management personnel was recorded as an expense in the consolidated statements of operations over the relevant vesting periods.
As of December 31, 2020, 2019 and 2018, ArcelorMittal did not have any outstanding loans or advances to members of its Board of Directors or key management personnel, and, as of December 31, 2020, 2019 and 2018, ArcelorMittal had not given any guarantees for the benefit of any member of its Board of Directors or key management personnel.
8.2 Deferred employee benefits
ArcelorMittal’s operating subsidiaries sponsor different types of pension plans for their employees. Also, some of the operating subsidiaries offer other post-employment benefits, that are principally post-retirement healthcare plans. These benefits are broken down into defined contribution plans and defined benefit plans.
Defined contribution plans are those plans where ArcelorMittal pays fixed or determinable contributions to external life insurance or other funds for certain categories of employees. Contributions are paid in return for services rendered by the employees during the period. Contributions are expensed as incurred consistent with the recognition of wages and salaries.
Defined benefit plans are those plans that provide guaranteed benefits to certain categories of employees, either by way of contractual obligations or through a collective agreement. For defined benefit plans, the cost of providing benefits is determined using the projected unit credit method, with actuarial valuations being carried out each fiscal year.
The retirement benefit obligation recognized in the consolidated statements of financial position represents the present value of the defined benefit obligation less the fair value of plan assets. The present value of the defined benefit obligation is determined by discounting the estimated future cash outflows using interest rates of high quality corporate bonds that are denominated in the currency in which the benefits will be paid, and that have
terms to maturity approximating the terms of the related pension obligation. Remeasurement arising from experience adjustments and changes in actuarial assumptions are charged or credited to other comprehensive income in the period in which they arise. Any asset resulting from this calculation is limited to the present value of available refunds and reductions in future contributions to the plan.
Current service cost, which is the increase of the present value of the defined benefit obligation resulting from the employee service in the current period, is recorded as an expense as part of cost of sales and selling, general and administrative expenses in the consolidated statements of operations. The net interest cost, which is the change during the period in the net defined benefit liability or asset that arises from the passage of time, is recognized as part of financing costs net in the consolidated statements of operations.
The Company recognizes gains and losses on the settlement of a defined benefit plan when the settlement occurs. The gain or loss on settlement comprises any resulting change in the fair value of plan assets and any change in the present value of the defined benefit obligation. Past service cost is the change in the present value of the defined benefit obligation resulting from a plan amendment or a curtailment. Past service cost is recognized immediately in the consolidated statements of operations in the period in which it arises.
Termination plans are those plans that primarily correspond to terminating an employee’s contract following the decision of the employee before the normal retirement date. Liabilities for termination plans are recognized when the affected employees have formally been informed and when amounts owed have been determined using an appropriate actuarial calculation. Liabilities relating to long-term termination plans (like early retirement plans) are calculated annually on the basis of the number of employees that have taken or contractually agreed to take early retirement and are discounted using an interest rate that corresponds to that of high quality bonds that have maturity dates similar to the terms of the Company’s early retirement obligations. Provisions for social plans are recorded in connection with voluntary separation plans. Voluntary retirement plans primarily correspond to the practical implementation of social plans or are linked to collective agreements signed with certain categories of employees. The Company recognizes a liability and expense when it can no longer withdraw the offer or, if earlier, when it has a detailed formal plan which has been communicated to employees or their representatives.
Other long-term employee benefits include various plans that depend on the length of service, such as long service and sabbatical awards, disability benefits and long-term compensated absences such as sick leave. The amount recognized as a liability is the present value of benefit
| | |
238 Consolidated financial statements |
obligations at the consolidated statements of financial position date, and all changes in the provision (including actuarial gains and losses or past service costs) are recognized in the consolidated statements of operations in the period in which they arise.
The expense associated with the above pension plans and post-employment benefits, as well as the carrying amount of the related liability/asset on the consolidated statements of financial position are based on a number of assumptions and factors such as discount rates, expected rate of compensation increase, healthcare cost trend rates, mortality rates and retirement rates.
•Discount rates – The discount rate is based on several high quality corporate bond indexes and yield curves in the appropriate jurisdictions. In countries where there is no deep market in such bonds, the market rates on government bonds are used. Nominal interest rates vary worldwide due to exchange rates and local inflation rates.
•Rate of compensation increase – The rate of compensation increase reflects actual experience and the Company’s long-term outlook, including contractually agreed wage rate increases for represented hourly employees.
•Healthcare cost trend rate – The healthcare cost trend rate is based on historical retiree cost data, near-term healthcare outlook, including appropriate cost control measures implemented by the Company, and industry benchmarks and surveys.
•Mortality and retirement rates – Mortality and retirement rates are based on actual and projected plan experience.
Statements of Financial Position
Total deferred employee benefits including pension or other post-employment benefits, are as follows:
| | | | | | | | | | | |
| | December 31, |
| | 2020 | | 2019 |
| Pension plan benefits | 3,000 | | | 3,289 | |
| Other post-employment benefits and other long-term employee benefits ("OPEB") | 1,432 | | | 3,792 | |
| Termination benefits | 173 | | | 198 | |
| Defined benefit liabilities | 4,605 | | | 7,279 | |
| Provisions for social plans (non-current) | 51 | | | 64 | |
| Total | 4,656 | | | 7,343 | |
This note, including the table above, discloses the following benefit categories:
•pension plan benefits are pension plans and lump sum benefits that are classified under post employment benefits as required by IAS 19 which are not mandatory by law;
•other post employment and other long-term employee benefits, also referred to as, OPEB which includes all other post employment benefits as defined in IAS 19 (e.g. lump sum benefits which are mandatory by law, medical insurance and life insurance) together with all other long-term employee benefits as defined in IAS 19;
•termination benefits, which relate to provisions for long term termination benefits as defined in IAS 19 (e.g. early retirement benefits); and
•provisions for social plans (non-current) which relate to provisions for social plans in restructuring provisions as required by IAS 37.
The provisions for termination benefits mainly relate to European countries (Belgium, Spain, Germany and Luxembourg).
On December 9, 2020, following the sale of ArcelorMittal USA (see note 2.3.1), the Company derecognized all of ArcelorMittal's USA pension and OPEB liabilities net of plan assets in the amount of 3,243. The Company continues to present below the corresponding changes in pension and OPEB defined benefit obligation, plan assets and the components of net periodic pension and OPEB cost in 2020 for the United States.
Pension plans
This section includes post employment benefits that are pension plan and lump sum benefits which are not mandatory by law. A summary of the significant defined benefit pension plans is as follows:
Canada
The primary pension plans are those of ArcelorMittal Dofasco, AMMC and ArcelorMittal Long Products Canada.
The ArcelorMittal Dofasco pension plan is a hybrid plan providing the benefits of both a defined benefit and defined contribution pension plan. The defined contribution component is financed by both employer and employee contributions. The employer’s defined contribution is based on a percentage of company profits. The defined benefit pension plan was closed for new hires on December 31, 2010 and replaced by a new defined contribution pension plan with contributions related to age, service and earnings.
| | |
Consolidated financial statements 239 |
| (millions of U.S. dollars, except share and per share data) |
At the end of 2012, ArcelorMittal Dofasco froze and capped benefits for the majority of its hourly and salaried employees who were still accruing service under the defined benefit plan and began transitioning these employees to the new defined contribution pension plan for future pension benefits.
The AMMC defined benefit plan provides salary related benefit for non-union employees and a flat dollar pension depending on an employee’s length of service for union employees. This plan was closed for new non-union hires on December 31, 2009 and replaced by a defined contribution pension plan with contributions related to age and service. Effective January 1, 2015, AMMC implemented a plan to transition its non-union employees who were still benefiting under the defined benefit plan to a defined contribution pension plan. Transition dates can extend up to January 1, 2025 depending on the age and service of each member.
ArcelorMittal Long Products Canada sponsors several defined benefit and defined contribution pension plans for its various groups of employees, with most defined benefit plans closed to new entrants several years ago. The primary defined benefit pension plan sponsored by ArcelorMittal Long Products Canada provides certain unionized employees with a flat dollar pension depending on an employee’s length of service.
ArcelorMittal Long Products Canada entered into a 6 years collective labor agreement during the third quarter of 2014 with its Contrecoeur-West union group. The defined benefit plan was closed to new hires. A new defined contribution type arrangement was established for new hires. This collective labor agreement was renewed during the third quarter of 2020 for 6 years under similar conditions.
In 2020, ArcelorMittal Long Products Canada entered into a buy-in transaction for some of its fully funded pension plans representing 112 in liabilities.
Brazil
The primary defined benefit plans, financed through trust funds, have been closed to new entrants. Brazilian entities have all established defined contribution plans that are financed by employer and employee contributions. On December 28, 2018, the Brazilian Autarchy that oversees pension funds called PREVIC (Complementary Pension National Superintendence) approved a planned settlement of the major defined benefit plans. The transaction was completed in 2019 and reduced the defined benefit obligation by 169 and fair value of the plan asset by 143. The settlement gain of 26 was recognized in cost of sales and selling, general and administrative expenses.
Europe
Certain European operating subsidiaries maintain primarily unfunded defined benefit pension plans for a certain number of
employees. Benefits are based on such employees’ length of service and applicable pension table under the terms of individual agreements. Some of these unfunded plans have been closed to new entrants and replaced by defined contribution pension plans for active members financed by employer and employee contributions.
As from December 2015 new Belgian legislation modifies the minimum guaranteed rates of return applicable to Belgian defined contribution plans. For insured plans, the rates of 3.25% on employer contributions and 3.75% on employee contributions will continue to apply to the accumulated pre-2016 contributions. For contributions paid as from January 1, 2016, a new variable minimum guaranteed rate of return applies. From 2016 through 2020, the minimum guaranteed rate of return was 1.75% and this is also the best estimate for 2021. Due to the statutory minimum guaranteed return, Belgian defined contribution plans do not meet the definition of defined contribution plans under IFRS. Therefore, the Belgian defined contribution plans are classified as defined benefit plans.
Others
A very limited number of defined benefit plans are in place in other countries (such as Mexico, Kazakhstan, Ukraine and Morocco).
The majority of the funded defined benefit pension plans described earlier provide benefit payments from trustee-administered funds. ArcelorMittal also sponsors a number of unfunded plans where the Company meets the benefit payment obligation as it falls due. Plan assets held in trusts are legally separated from the Company and are governed by local regulations and practice in each country, as is the nature of the relationship between the Company and the governing bodies and their composition. In general terms, governing bodies are required by law to act in the best interest of the plan members and are responsible for certain tasks related to the plan (e.g. setting the plan's investment policy).
In case of the funded pension plans, the investment positions are generally managed within an asset-liability matching ("ALM") framework that has been developed to achieve long-term investments that are in line with the obligations of the pension plans.
A long-term investment strategy has been set for ArcelorMittal’s major funded pension plans, with its asset allocation comprising of a mixture of equity securities, fixed income securities, real estate and other appropriate assets. This recognizes that different asset classes are likely to produce different long-term returns and some asset classes may be more volatile than others. The long-term investment strategy ensures, in particular, that investments are adequately diversified.
| | |
240 Consolidated financial statements |
The following tables detail the reconciliation of defined benefit obligation (“DBO”), plan assets, irrecoverable surplus and statements of financial position.
| | | | | | | | | | | | | | | | | | | | | | | | | | | | | | | | | | | |
| Year ended December 31, 2020 |
| Total | | United States | | Canada | | Brazil | | Europe | | Other |
| Change in benefit obligation | | | | | | | | | | | |
| Benefit obligation at beginning of the period | 10,629 | | | 3,505 | | | 3,360 | | | 664 | | | 2,830 | | | 270 | |
| Current service cost | 129 | | | 28 | | | 25 | | | — | | | 64 | | | 12 | |
| Interest cost on DBO | 279 | | | 95 | | | 96 | | | 36 | | | 29 | | | 23 | |
| Past service cost - Plan amendments | 8 | | | 1 | | | 3 | | | — | | | 4 | | | — | |
| Past service cost - Curtailments | 2 | | | 2 | | | — | | | — | | | — | | | — | |
| Plan participants’ contribution | 1 | | | — | | | — | | | — | | | 1 | | | — | |
| | | | | | | | | | | |
| Actuarial (gain) loss | 705 | | | 237 | | | 250 | | | (3) | | | 185 | | | 36 | |
| Demographic assumptions | (32) | | | (32) | | | — | | | — | | | — | | | — | |
| Financial assumptions | 795 | | | 286 | | | 276 | | | 5 | | | 214 | | | 14 | |
| Experience adjustment | (58) | | | (17) | | | (26) | | | (8) | | | (29) | | | 22 | |
| Benefits paid | (693) | | | (279) | | | (206) | | | (32) | | | (149) | | | (27) | |
| | | | | | | | | | | |
| | | | | | | | | | | |
| Divestments (note 2.3.1) | (3,550) | | | (3,550) | | | — | | | — | | | — | | | — | |
| Foreign currency exchange rate differences and other movements | 94 | | | — | | | 62 | | | (148) | | | 209 | | | (29) | |
| Benefit obligation at end of the period | 7,604 | | | 39 | | | 3,590 | | | 517 | | | 3,173 | | | 285 | |
| | | | | | | | | | | |
| Change in plan assets | | | | | | | | | | | |
| Fair value of plan assets at beginning of the period | 7,395 | | | 2,881 | | | 3,021 | | | 576 | | | 917 | | | — | |
| Interest income on plan assets | 192 | | | 69 | | | 84 | | | 31 | | | 8 | | | — | |
| Return on plan assets greater/(less) than discount rate | 444 | | | 209 | | | 188 | | | (12) | | | 59 | | | — | |
| Employer contribution | 64 | | | 2 | | | 21 | | | 1 | | | 40 | | | — | |
| Plan participants’ contribution | 1 | | | — | | | — | | | — | | | 1 | | | — | |
| Plan amendments | 2 | | | 2 | | | — | | | — | | | — | | | — | |
| Benefits paid | (579) | | | (276) | | | (205) | | | (32) | | | (66) | | | — | |
| Divestments (note 2.3.1) | (2,842) | | | (2,842) | | | — | | | — | | | — | | | — | |
| Foreign currency exchange rate differences and other movements | (23) | | | — | | | 58 | | | (129) | | | 48 | | | — | |
| Fair value of plan assets at end of the period | 4,654 | | | 45 | | | 3,167 | | | 435 | | | 1,007 | | | — | |
| | | | | | | | | | | |
| Present value of the wholly or partly funded obligation | (5,831) | | | (37) | | | (3,575) | | | (517) | | | (1,702) | | | — | |
| Fair value of plan assets | 4,654 | | | 45 | | | 3,167 | | | 435 | | | 1,007 | | | — | |
| Net present value of the wholly or partly funded obligation | (1,177) | | | 8 | | | (408) | | | (82) | | | (695) | | | — | |
| Present value of the unfunded obligation | (1,773) | | | (2) | | | (15) | | | — | | | (1,471) | | | (285) | |
| Prepaid due to unrecoverable surpluses | (27) | | | — | | | (23) | | | (1) | | | (3) | | | — | |
| Net amount recognized | (2,977) | | | 6 | | | (446) | | | (83) | | | (2,169) | | | (285) | |
| | | | | | | | | | | |
| Net assets related to funded obligations | 23 | | | 8 | | | 11 | | | — | | | 4 | | | — | |
| Recognized liabilities | (3,000) | | | (2) | | | (457) | | | (83) | | | (2,173) | | | (285) | |
| | | | | | | | | | | |
| Change in unrecoverable surplus | | | | | | | | | | | |
| Unrecoverable surplus at beginning of the period | (30) | | | — | | | (25) | | | (2) | | | (3) | | | — | |
| Interest cost on unrecoverable surplus | (1) | | | — | | | (1) | | | — | | | — | | | — | |
| Change in unrecoverable surplus in excess of interest | 4 | | | — | | | 3 | | | 1 | | | — | | | — | |
| | | | | | | | | | | |
| Unrecoverable surplus at end of the period | (27) | | | — | | | (23) | | | (1) | | | (3) | | | — | |
| | |
Consolidated financial statements 241 |
| (millions of U.S. dollars, except share and per share data) |
| | | | | | | | | | | | | | | | | | | | | | | | | | | | | | | | | | | |
| Year ended December 31, 2019 |
| Total | | United States | | Canada | | Brazil | | Europe | | Other |
| Change in benefit obligation | | | | | | | | | | | |
| Benefit obligation at beginning of the period | 9,872 | | | 3,266 | | | 3,001 | | | 724 | | | 2,716 | | | 165 | |
| Current service cost | 114 | | | 26 | | | 21 | | | — | | | 58 | | | 9 | |
| Interest cost on DBO | 367 | | | 130 | | | 110 | | | 58 | | | 47 | | | 22 | |
| Past service cost - Plan amendments | 4 | | | — | | | — | | | 2 | | | 2 | | | — | |
| Plan participants’ contribution | 2 | | | — | | | — | | | — | | | 2 | | | — | |
| Settlements | (172) | | | — | | | — | | | (169) | | | (3) | | | — | |
| Actuarial (gain) loss | 1,001 | | | 342 | | | 277 | | | 121 | | | 176 | | | 85 | |
| Demographic assumptions | 16 | | | 2 | | | 43 | | | — | | | (29) | | | — | |
| Financial assumptions | 949 | | | 334 | | | 213 | | | 138 | | | 209 | | | 55 | |
| Experience adjustment | 36 | | | 6 | | | 21 | | | (17) | | | (4) | | | 30 | |
| Benefits paid | (652) | | | (261) | | | (201) | | | (42) | | | (127) | | | (21) | |
| | | | | | | | | | | |
| Foreign currency exchange rate differences and other movements | 93 | | | 2 | | | 152 | | | (30) | | | (41) | | | 10 | |
| Benefit obligation at end of the period | 10,629 | | | 3,505 | | | 3,360 | | | 664 | | | 2,830 | | | 270 | |
| | | | | | | | | | | |
| Change in plan assets | | | | | | | | | | | |
| Fair value of plan assets at beginning of the period | 6,877 | | | 2,676 | | | 2,664 | | | 655 | | | 882 | | | — | |
| Interest income on plan assets | 256 | | | 95 | | | 92 | | | 54 | | | 15 | | | — | |
| Return on plan assets greater than discount rate | 808 | | | 360 | | | 305 | | | 79 | | | 64 | | | — | |
| Employer contribution | 77 | | | 7 | | | 27 | | | 2 | | | 41 | | | — | |
| Plan participants’ contribution | 2 | | | — | | | — | | | — | | | 2 | | | — | |
| Settlements | (146) | | | — | | | — | | | (143) | | | (3) | | | — | |
| Benefits paid | (541) | | | (257) | | | (200) | | | (42) | | | (42) | | | — | |
| Foreign currency exchange rate differences and other movements | 62 | | | — | | | 133 | | | (29) | | | (42) | | | — | |
| Fair value of plan assets at end of the period | 7,395 | | | 2,881 | | | 3,021 | | | 576 | | | 917 | | | — | |
| | | | | | | | | | | |
| Present value of the wholly or partly funded obligation | (9,012) | | | (3,476) | | | (3,345) | | | (663) | | | (1,528) | | | — | |
| Fair value of plan assets | 7,395 | | | 2,881 | | | 3,021 | | | 576 | | | 917 | | | — | |
| Net present value of the wholly or partly funded obligation | (1,617) | | | (595) | | | (324) | | | (87) | | | (611) | | | — | |
| Present value of the unfunded obligation | (1,617) | | | (29) | | | (15) | | | (1) | | | (1,302) | | | (270) | |
| Prepaid due to unrecoverable surpluses | (30) | | | — | | | (25) | | | (2) | | | (3) | | | — | |
| Net amount recognized | (3,264) | | | (624) | | | (364) | | | (90) | | | (1,916) | | | (270) | |
| | | | | | | | | | | |
| Net assets related to funded obligations | 25 | | | 8 | | | 13 | | | — | | | 4 | | | — | |
| Recognized liabilities | (3,289) | | | (632) | | | (377) | | | (90) | | | (1,920) | | | (270) | |
| | | | | | | | | | | |
| Change in unrecoverable surplus | | | | | | | | | | | |
| Unrecoverable surplus at beginning of the period | (27) | | | — | | | (21) | | | (3) | | | (3) | | | — | |
| Interest cost on unrecoverable surplus | (1) | | | — | | | (1) | | | — | | | — | | | — | |
| Change in unrecoverable surplus in excess of interest | (1) | | | — | | | (2) | | | 1 | | | — | | | — | |
| Exchange rates changes | (1) | | | — | | | (1) | | | — | | | — | | | — | |
| Unrecoverable surplus at end of the period | (30) | | | — | | | (25) | | | (2) | | | (3) | | | — | |
| | |
242 Consolidated financial statements |
The following tables detail the components of net periodic pension cost:
| | | | | | | | | | | | | | | | | | | | | | | | | | | | | | | | | | | |
| | Year ended December 31, 2020 |
| Net periodic pension cost (benefit) | Total | | United States | | Canada | | Brazil | | Europe | | Others |
| Current service cost | 129 | | | 28 | | | 25 | | | — | | | 64 | | | 12 | |
| Past service cost - Plan amendments | 6 | | | (1) | | | 3 | | | — | | | 4 | | | — | |
| Past service cost - Curtailments | 2 | | | 2 | | | — | | | — | | | — | | | — | |
| | | | | | | | | | | |
| | | | | | | | | | | |
| Net interest cost/(income) on net DB liability/(asset) | 88 | | | 26 | | | 13 | | | 5 | | | 21 | | | 23 | |
| Total | 225 | | | 55 | | | 41 | | | 5 | | | 89 | | | 35 | |
| | | | | | | | | | | | | | | | | | | | | | | | | | | | | | | | | | | |
| | Year ended December 31, 2019 |
| Net periodic pension cost (benefit) | Total | | United States | | Canada | | Brazil | | Europe | | Others |
| Current service cost | 114 | | | 26 | | | 21 | | | — | | | 58 | | | 9 | |
| Past service cost - Plan amendments | 4 | | | — | | | — | | | 2 | | | 2 | | | — | |
| Past service cost - Settlements | (26) | | | — | | | — | | | (26) | | | — | | | — | |
| | | | | | | | | | | |
| Net interest cost/(income) on net DB liability/(asset) | 112 | | | 35 | | | 19 | | | 4 | | | 32 | | | 22 | |
| Total | 204 | | | 61 | | | 40 | | | (20) | | | 92 | | | 31 | |
| | | | | | | | | | | | | | | | | | | | | | | | | | | | | | | | | | | |
| | Year ended December 31, 2018 |
| Net periodic pension cost (benefit) | Total | | United States | | Canada | | Brazil | | Europe | | Others |
| Current service cost | 136 | | | 31 | | | 25 | | | 3 | | | 68 | | | 9 | |
| Past service cost - Plan amendments | 25 | | | 25 | | | — | | | — | | | — | | | — | |
| Past service cost - Settlements | 2 | | | — | | | 2 | | | — | | | — | | | — | |
| Cost of termination benefits | 6 | | | — | | | — | | | — | | | 6 | | | — | |
| Net interest cost/(income) on net DB liability/(asset) | 94 | | | 28 | | | 14 | | | 5 | | | 27 | | | 20 | |
| Total | 263 | | | 84 | | | 41 | | | 8 | | | 101 | | | 29 | |
Other post-employment benefits and other long-term employee benefits ("OPEB")
This section includes post employment employees benefits that are not disclosed above (i.e. includes lump sum benefits which are mandatory by law, medical insurance and life insurance). In addition, this section includes all other long-term employee benefits.
ArcelorMittal’s principal operating subsidiaries in Canada, Europe and certain other countries, provide other post
employment benefits and other long-term employee benefits, including medical benefits and life insurance benefits, work medals and retirement indemnity plans, to employees and retirees.
| | |
Consolidated financial statements 243 |
| (millions of U.S. dollars, except share and per share data) |
Summary of changes in the other post-employment benefit obligation and changes in plan assets are as follows:
| | | | | | | | | | | | | | | | | | | | | | | | | | | | | |
| Year ended December 31, 2020 |
| Total | | United States | | Canada | | Europe | | Others |
| Change in benefit obligation | | | | | | | | | |
| Benefit obligation at beginning of the period | 4,294 | | | 2,976 | | | 688 | | | 546 | | | 84 | |
| Current service cost | 85 | | | 44 | | | 10 | | | 27 | | | 4 | |
| Interest cost on DBO | 122 | | | 91 | | | 19 | | | 7 | | | 5 | |
| Past service cost - Plan amendments | (1) | | | — | | | (1) | | | — | | | — | |
| Past service cost - Curtailments | 3 | | | 3 | | | — | | | — | | | — | |
| Plan participants’ contribution | 23 | | | 23 | | | — | | | — | | | — | |
| Actuarial (gain) loss | 113 | | | 46 | | | 41 | | | 26 | | | — | |
| Demographic assumptions | (39) | | | (39) | | | — | | | — | | | — | |
| Financial assumptions | 266 | | | 170 | | | 54 | | | 37 | | | 5 | |
| Experience adjustment | (114) | | | (85) | | | (13) | | | (11) | | | (5) | |
| Benefits paid | (208) | | | (131) | | | (30) | | | (37) | | | (10) | |
| Divestments (note 2.3.1) | (3,024) | | | (3,024) | | | — | | | — | | | — | |
| Foreign currency exchange rate differences and other movements | 31 | | | — | |
| 15 | | | 21 | | | (5) | |
| Benefit obligation at end of the period | 1,438 | | | 28 | | | 742 | | | 590 | | | 78 | |
| | | | | | | | | |
| Change in plan assets | | | | | | | | | |
| Fair value of plan assets at beginning of the period | 502 | | | 496 | | | — | | | 6 | | | — | |
| Interest income on plan assets | 12 | | | 12 | | | — | | | — | | | — | |
| Return on plan assets greater than discount rate | 11 | | | 11 | | | — | | | — | | | — | |
| Employer contribution | (32) | | | (32) | | | — | | | — | | | — | |
| Plan participants’ contribution | 23 | | | 23 | | | — | | | — | | | — | |
| Benefits paid | (22) | | | (21) | | | — | | | (1) | | | — | |
| Divestments (note 2.3.1) | (489) | | | (489) | | | — | | | — | | | — | |
| Foreign currency exchange rate differences and other movements | 1 | | | — | | | — | | | 1 | | | — | |
| Fair value of plan assets at end of the period | 6 | | | — | | | — | | | 6 | | | — | |
| | | | | | | | | |
| Present value of the wholly or partly funded obligation | (34) | | | — | | | — | | | (34) | | | — | |
| Fair value of plan assets | 6 | | | — | | | — | | | 6 | | | — | |
| Net present value of the wholly or partly funded obligation | (28) | | | — | | | — | | | (28) | | | — | |
| Present value of the unfunded obligation | (1,404) | | | (28) | | | (742) | | | (556) | | | (78) | |
| Net amount recognized | (1,432) | | | (28) | | | (742) | | | (584) | | | (78) | |
| | |
244 Consolidated financial statements |
| | | | | | | | | | | | | | | | | | | | | | | | | | | | | |
| Year ended December 31, 2019 |
| Total | | United States | | Canada | | Europe | | Others |
| Change in benefit obligation | | | | | | | | | |
| Benefit obligation at beginning of the period | 4,098 | | | 2,907 | | | 591 | | | 531 | | | 69 | |
| Current service cost | 80 | | | 40 | | | 9 | | | 28 | | | 3 | |
| Interest cost on DBO | 163 | | | 124 | | | 22 | | | 11 | | | 6 | |
| | | | | | | | | |
| | | | | | | | | |
| Plan participants’ contribution | 29 | | | 29 | | | — | | | — | | | — | |
| Actuarial (gain) loss | 129 | | | 29 | | | 67 | | | 26 | | | 7 | |
| Demographic assumptions | 4 | | | (11) | | | 15 | | | — | | | — | |
| Financial assumptions | 256 | | | 169 | | | 53 | | | 25 | | | 9 | |
| Experience adjustment | (131) | | | (129) | | | (1) | | | 1 | | | (2) | |
| Benefits paid | (242) | | | (170) | | | (31) | | | (37) | | | (4) | |
| Foreign currency exchange rate differences and other movements | 37 | | | 17 | |
| 30 | | | (13) | | | 3 | |
| Benefit obligation at end of the period | 4,294 | | | 2,976 | | | 688 | | | 546 | | | 84 | |
| | | | | | | | | |
| Change in plan assets | | | | | | | | | |
| Fair value of plan assets at beginning of the period | 498 | | | 491 | | | — | | | 7 | | | — | |
| Interest income on plan assets | 20 | | | 20 | | | — | | | — | | | — | |
| Return on plan assets greater than discount rate | 37 | | | 37 | | | — | | | — | | | — | |
| Employer contribution | (25) | | | (25) | | | — | | | — | | | — | |
| Plan participants’ contribution | 29 | | | 29 | | | — | | | — | | | — | |
| Benefits paid | (57) | | | (56) | | | — | | | (1) | | | — | |
| | | | | | | | | |
| Fair value of plan assets at end of the period | 502 | | | 496 | | | — | | | 6 | | | — | |
| | | | | | | | | |
| Present value of the wholly or partly funded obligation | (575) | | | (531) | | | — | | | (44) | | | — | |
| Fair value of plan assets | 502 | | | 496 | | | — | | | 6 | | | — | |
| Net present value of the wholly or partly funded obligation | (73) | | | (35) | | | — | | | (38) | | | — | |
| Present value of the unfunded obligation | (3,719) | | | (2,445) | | | (688) | | | (502) | | | (84) | |
| Net amount recognized | (3,792) | | | (2,480) | | | (688) | | | (540) | | | (84) | |
| | |
Consolidated financial statements 245 |
| (millions of U.S. dollars, except share and per share data) |
The following tables detail the components of net periodic other post-employment cost:
| | | | | | | | | | | | | | | | | | | | | | | | | | | | | |
| | Year ended December 31, 2020 |
| Components of net periodic OPEB cost (benefit) | Total | | United States | | Canada | | Europe | | Others |
| Current service cost | 85 | | | 44 | | | 10 | | | 27 | | | 4 | |
| Past service cost - Plan amendments | (1) | | | — | | | (1) | | | — | | | — | |
| Past service cost - Curtailments | 3 | | | 3 | | | — | | | — | | | — | |
| Net interest cost/(income) on net DB liability/(asset) | 110 | | | 79 | | | 19 | | | 7 | | | 5 | |
| Actuarial losses recognized during the year | 8 | | | — | | | — | | | 8 | | | — | |
| Total | 205 | | | 126 | | | 28 | | | 42 | | | 9 | |
| | | | | | | | | | | | | | | | | | | | | | | | | | | | | |
| | Year ended December 31, 2019 |
| Components of net periodic OPEB cost (benefit) | Total | | United States | | Canada | | Europe | | Others |
| Current service cost | 80 | | | 40 | | | 9 | | | 28 | | | 3 | |
| | | | | | | | | |
| | | | | | | | | |
| Net interest cost/(income) on net DB liability/(asset) | 143 | | | 104 | | | 22 | | | 11 | | | 6 | |
| Actuarial losses recognized during the year | 8 | | | — | | | — | | | 8 | | | — | |
| Total | 231 | | | 144 | | | 31 | | | 47 | | | 9 | |
| | | | | | | | | | | | | | | | | | | | | | | | | | | | | |
| | Year ended December 31, 2018 |
| Components of net periodic OPEB cost (benefit) | Total | | United States | | Canada | | Europe | | Others |
| Current service cost | 85 | | | 49 | | | 10 | | | 25 | | | 1 | |
| Past service cost - Plan amendments | (13) | | | (10) | | | (1) | | | (2) | | | — | |
| Past service cost - Curtailments | (2) | | | — | | | — | | | (2) | | | — | |
| Net interest cost/(income) on net DB liability/(asset) | 138 | | | 103 | | | 21 | | | 12 | | | 2 | |
| Actuarial losses recognized during the year | 7 | | | — | | | — | | | 7 | | | — | |
| Total | 215 | | | 142 | | | 30 | | | 40 | | | 3 | |
The following tables detail where the expense is recognized in the consolidated statements of operations:
| | | | | | | | | | | | | | | | | |
| | Year ended December 31, |
| | 2020 | | 2019 | | 2018 |
| Net periodic pension cost | 225 | | | 204 | | | 263 | |
| Net periodic OPEB cost | 205 | | | 231 | | | 215 | |
| Total | 430 | | | 435 | | | 478 | |
| | | | | |
| Cost of sales | 189 | | | 142 | | | 212 | |
| Selling, general and administrative expenses | 34 | | | 30 | | | 34 | |
| Financing costs - net | 207 | | | 263 | | | 232 | |
| Total | 430 | | | 435 | | | 478 | |
| | |
246 Consolidated financial statements |
The weighted-average asset allocations for the funded defined benefit plans by asset category were as follows:
| | | | | | | | | | | | | | | | | | | | | | | | |
| | | December 31, 2020 | |
| | | Canada | | Brazil | | Europe | |
| Equity Securities | | | 47 | % | | 6 | % | | 1 | % | |
| - Asset classes that have a quoted market price in an active market | | | 39 | % | | 3 | % | | 1 | % | |
| - Asset classes that do not have a quoted market price in an active market | | | 8 | % | | 3 | % | | — | | |
| Fixed Income Securities (including cash) | | | 46 | % | | 77 | % | | 72 | % | |
| - Asset classes that have a quoted market price in an active market | | | 42 | % | | 77 | % | | 72 | % | |
| - Asset classes that do not have a quoted market price in an active market | | | 4 | % | | — | | | — | | |
| Real Estate | | | 6 | % | | 1 | % | | — | | |
| - Asset classes that have a quoted market price in an active market | | | — | | | 1 | % | | — | | |
| - Asset classes that do not have a quoted market price in an active market | | | 6 | % | | — | | | — | | |
| Other | | | 1 | % | | 16 | % | | 27 | % | |
| - Asset classes that have a quoted market price in an active market | | | — | | | 16 | % | | 5 | % | |
| - Asset classes that do not have a quoted market price in an active market | | | 1 | % | | — | | | 22 | % | '1 |
| Total | | | 100 | % | | 100 | % | | 100 | % | |
| | | | | | | | | | | | | | | | | | | | | | | | | | | | | |
| | December 31, 2019 | | |
| United States | | Canada | | Brazil | | Europe | | |
| Equity Securities | 40 | % | | 44 | % | | 6 | % | | 2 | % | | |
| - Asset classes that have a quoted market price in an active market | 13 | % | | 34 | % | | 6 | % | | 2 | % | | |
| - Asset classes that do not have a quoted market price in an active market | 27 | % | | 10 | % | | — | | | — | | | |
| Fixed Income Securities (including cash) | 43 | % | | 48 | % | | 88 | % | | 73 | % | | |
| - Asset classes that have a quoted market price in an active market | — | | | 42 | % | | 88 | % | | 73 | % | | |
| - Asset classes that do not have a quoted market price in an active market | 43 | % | | 6 | % | | — | | | — | | | |
| Real Estate | 3 | % | | 6 | % | | 1 | % | | — | | | |
| - Asset classes that have a quoted market price in an active market | — | | | — | | | 1 | % | | — | | | |
| - Asset classes that do not have a quoted market price in an active market | 3 | % | | 6 | % | | — | | | — | | | |
| Other | 14 | % | | 2 | % | | 5 | % | | 25 | % | | |
| - Asset classes that have a quoted market price in an active market | 5 | % | | — | | | 5 | % | | 5 | % | | |
| - Asset classes that do not have a quoted market price in an active market | 9 | % | | 2 | % | | — | | | 20 | % | '1 | |
| Total | 100 | % | | 100 | % | | 100 | % | | 100 | % | | |
1.The percentage consists primarily of assets from insurance contracts in Belgium.
These assets do not include direct investments in ArcelorMittal stock or ArcelorMittal bonds. These assets may include ArcelorMittal shares or bonds held by mutual fund investments. The invested assets produced an actual return of 659 and 1,121 in 2020 and 2019, respectively.
The Finance and Retirement Committees of the Boards of Directors for the respective operating subsidiaries have general supervisory authority over the respective trust funds. These committees have usually established asset allocation targets for the period as described below. Asset managers are permitted some flexibility to vary the asset allocation from the long-term investment strategy within control ranges agreed upon.
| | |
Consolidated financial statements 247 |
| (millions of U.S. dollars, except share and per share data) |
| | | | | | | | | | | | | | | | | | | | | | | | |
| | December 31, 2020 | |
| | | | Canada | | Brazil | | Europe | |
| Equity Securities | | | 43 | % | | 5 | % | | 3 | % | |
| Fixed Income Securities (including cash) | | | 47 | % | | 78 | % | | 70 | % | |
| Real Estate | | | 5 | % | | 1 | % | | — | | |
| Other | | | 5 | % | | 16 | % | | 27 | % | '1 |
| Total | | | 100 | % | | 100 | % | | 100 | % | |
1.The percentage consists primarily of assets from insurance contracts in Belgium.
Assumptions used to determine benefit obligations at December 31,
| | | | | | | | | | | | | | | | | | | | | | | | | | | | | | | | | | | |
| | Pension Plans | | Other Post-employment Benefits |
| | 2020 | | 2019 | | 2018 | | 2020 | | 2019 | | 2018 |
| Discount rate | | | | | | | | | | | |
| Range | 0.50% - 10.00% | | 1.00% - 10.50% | | 1.75% - 16.00% | | 0.50% - 6.20% | | 1.00% - 7.25% | | 1.75% - 9.50% |
| Weighted average | 2.13 | % | | 2.90 | % | | 3.80 | % | | 1.84 | % | | 3.06 | % | | 3.98 | % |
| Rate of compensation increase | | | | | | | | | | | |
| Range | 1.72% - 10.00% | | 1.90% - 10.00% | | 2.00% - 10.00% | | 1.30% - 4.80% | | 1.60% - 4.80% | | 2.00% - 4.80% |
| Weighted average | 2.71 | % | | 2.80 | % | | 2.85 | % | | 2.85 | % | | 2.95 | % | | 3.24 | % |
| | | | | | | | | | | | | | | | | |
| | Other Post-employment Benefits |
| | 2020 | | 2019 | | 2018 |
| Healthcare cost trend rate assumed | | | | | |
| Range | 1.40% - 4.50% | | 1.80% - 5.00% | | 1.80% - 8.00% |
| Weighted average | 3.94 | % | | 4.42 | % | | 4.46 | % |
Cash contributions and maturity profile of the plans
In 2021, the Company expects its cash contributions to amount to 172 for pension plans, 71 for other post-employment benefits plans and 79 for defined contribution plans. Cash contributions to defined contribution plans and to United States multi-employer plans sponsored by the Company, were respectively 88 and 65 until December 9, 2020, date of sale of ArcelorMittal USA (see note 2.3.1).
At December 31, 2020, the weighted average duration of the liabilities related to the pension and other post-employment benefits plans were 13 years (2019: 12 years) and 13 years (2019: 15 years), respectively.
Risks associated with defined benefit plans
Through its defined benefit pension plans and OPEB plans, ArcelorMittal is exposed to a number of risks, the most significant of which are detailed below:
Changes in bond yields
A decrease in corporate bond yields will increase plan liabilities, although this will be partially offset by an increase in the value of the plans’ bond holdings.
Asset volatility
The plan liabilities are calculated using a discount rate set with reference to corporate bond yields; if plan assets underperform this yield, this will create a deficit. In most countries with funded plans, plan assets hold a significant portion of equities, which are expected to outperform corporate bonds in the long-term but contribute to volatility and risk in the short-term. As the plans mature, ArcelorMittal intends to reduce the level of investment risk by investing more in assets that better match the liabilities. However, ArcelorMittal believes that due to the long-term nature of the plan liabilities, a level of continuing equity investment is an appropriate element of a long-term strategy to manage the plans efficiently.
Life expectancy
Most plans provide benefits for the life of the covered members, so increases in life expectancy will result in an increase in the plans’ benefit obligations.
Assumptions regarding future mortality rates have been set considering published statistics and, where possible, ArcelorMittal’s own experience.
| | |
248 Consolidated financial statements |
The current longevities at retirement underlying the values of the defined benefit obligation were approximately 23 years.
Healthcare cost trend rate
The majority of the OPEB plans’ benefit obligations are linked to the change in the cost of various health care components.
Future healthcare cost will vary based on several factors including price inflation, utilization rate, technology advances, cost shifting and cost containing mechanisms. A higher healthcare cost trend would lead to higher OPEB plan benefit obligations.
Sensitivity analysis
The following information illustrates the sensitivity to a change of the significant actuarial assumptions related to ArcelorMittal’s pension plans (as of December 31, 2020, the defined benefit obligation for pension plans was 7,604):
| | | | | | | | | | | |
| Effect on 2021 Pre-Tax Pension Expense (sum of service cost and interest cost) | | Effect on December 31, 2020 DBO |
| Change in assumption | | | |
100 basis points decrease in discount rate | (38) | | | 1,082 | |
100 basis points increase in discount rate | 28 | | | (869) | |
100 basis points decrease in rate of compensation | (15) | | | (203) | |
100 basis points increase in rate of compensation | 16 | | | 204 | |
1 year increase of the expected life of the beneficiaries | 5 | | | 213 | |
The following table illustrates the sensitivity to a change of the significant actuarial assumptions related to ArcelorMittal’s OPEB plans (as of December 31, 2020 the defined benefit obligation for post-employment benefit plans was 1,438):
| | | | | | | | | | | |
| Effect on 2021 Pre-Tax OPEB Expense (sum of service cost and interest cost) | | Effect on December 31, 2020 DBO |
| Change in assumption | | | |
100 basis points decrease in discount rate | (3) | | | 211 | |
100 basis points increase in discount rate | 2 | | | (169) | |
100 basis points decrease in healthcare cost trend rate | (5) | | | (93) | |
100 basis points increase in healthcare cost trend rate | 7 | | | 117 | |
1 year increase of the expected life of the beneficiaries | 1 | | | 30 | |
The above sensitivities reflect the effect of changing one assumption at a time. Actual economic factors and conditions often affect multiple assumptions simultaneously, and the effects of changes in key assumptions are not necessarily linear.
8.3 Share-based payments
ArcelorMittal issues equity-settled share-based payments to certain employees, including stock options, RSUs and PSUs. Equity-settled share-based payments are measured at fair value (excluding the effect of non market-based vesting conditions) at the grant date. The fair value determined at the grant date of the equity-settled share-based payments is expensed on a graded vesting basis over the vesting period, based on the Company’s estimate of the shares that will eventually vest and adjusted for the effect of non market-based vesting conditions. Where the fair value calculation requires modeling of the Company’s performance against other market index, fair value is measured using the Monte Carlo pricing model to estimate the forecasted target performance goal for the company and its peer companies. The expected life used in the model has been adjusted, based on management’s best estimate, for the effects of non-transferability, exercise restrictions and behavioral considerations. In addition, the expected annualized volatility
has been set by reference to the implied volatility of options available on ArcelorMittal shares in the open market, as well as, historical patterns of volatility. For the RSUs and PSUs, the fair value determined at the grant date of the equity-settled share-based payments is expensed on a straight line method over the vesting period and adjusted for the effect of non market-based vesting conditions.
Stock Option Plans
Prior to the May 2011 annual general meeting of shareholders ("AGM") adoption of the ArcelorMittal Equity Incentive Plan described below, ArcelorMittal’s equity-based incentive plan took the form of a stock option plan known as the Global Stock Option Plan.
Under the terms of the ArcelorMittal Global Stock Option Plan 2009-2018 (which replaced the ArcelorMittal Shares plan that expired in 2009), ArcelorMittal may grant options to purchase common shares to senior management of ArcelorMittal and its associates for up to 33,333,333 common shares. The exercise price of each option equals not less than the fair market value of ArcelorMittal shares on the grant date, with a maximum term of 10 years. Options are granted at the discretion of ArcelorMittal’s
| | |
Consolidated financial statements 249 |
| (millions of U.S. dollars, except share and per share data) |
Appointments, Remuneration, Corporate Governance and Sustainability ("ARCGS") Committee, or its delegate. The options vest either ratably upon each of the first three anniversaries of the grant date, or, in total, upon the death, disability or retirement of the participant.
| | | | | |
| Grant date | Exercise prices (per option) |
| August 2010 | $91.98 | |
No options were granted during the years ended December 31, 2020, 2019, and 2018. The compensation expense recognized for stock option plans was nil for each of the years ended December 31, 2020, 2019 and 2018.
Option activity with respect to ArcelorMittal Shares and ArcelorMittal Global Stock Option Plan 2009-2018 is summarized below as of and for each of the years ended December 31, 2020, 2019 and 2018:
| | | | | | | | | | | | | | | | | |
| Number of Options | | Range of Exercise Prices
(per option) | | Weighted Average Exercise Price
(per option) |
| Outstanding, December 31, 2017 | 3,284,875 | | | 63.42 – 235.32 | | 145.86 | |
| Expired | (1,295,500) | | | 63.42 – 235.32 | | 215.77 | |
| Outstanding, December 31, 2018 | 1,989,375 | | | 91.98 – 109.14 | | 100.33 | |
| Expired | (1,084,985) | | | 91.98 – 109.14 | | 107.29 | |
| Outstanding, December 31, 2019 | 904,390 | | | 91.98 | | 91.98 | |
| Expired | (904,390) | | | 91.98 | | 91.98 | |
| Outstanding, December 31, 2020 | — | | | — | | | — | |
| | | | | |
| Exercisable, December 31, 2018 | 1,989,375 | | | 91.98 – 109.14 | | 100.33 | |
| Exercisable, December 31, 2019 | 904,390 | | | 91.98 | | 91.98 | |
| Exercisable, December 31, 2020 | — | | | — | | | — | |
There were no stock options of the Company outstanding as of December 31, 2020.
Long-Term Incentives: Equity-Based Incentives (Share Unit Plans)
On May 10, 2011, the annual general shareholders' meeting ("AGM") approved the ArcelorMittal Equity Incentive Plan, a new equity-based incentive plan that replaced the Global Stock Option Plan. The ArcelorMittal Equity Incentive Plan is intended to align the interests of the Company’s shareholders and eligible employees by allowing them to participate in the success of the Company. The ArcelorMittal Equity Incentive Plan provides for the grant of RSUs and PSUs to eligible Company employees (including the Executive Officers) and is designed to incentivize employees, improve the Company’s long-term performance and retain key employees.
The maximum number of PSUs (and RSUs) available for grant during any given year is subject to the prior approval of the Company’s shareholders at the AGM. The 2018, 2019 and 2020 Caps for the number of PSUs/RSUs that may be allocated to the CEO Office and other retention and performance based grants below the CEO Office level, were approved at the AGMs on May 9, 2018, May 7, 2019 and June 13, 2020, respectively, at a maximum of 1,500,000 shares, 2,500,000 shares and 4,250,000 shares, respectively.
ArcelorMittal Equity Incentive Plan
RSUs granted under the ArcelorMittal Equity Incentive Plan are designed to provide a retention incentive to eligible employees. RSUs are subject to “cliff vesting” after three years, with 100% of the grant vesting on the third anniversary of the grant contingent upon the continued active employment of the eligible employee within the Company.
In 2020, 316,684 RSUs were granted as a special grant with a one year vesting period to compensate salary reduction in 2020 contingent upon the continued active employment of the eligible employee within the Company until the vesting date i.e. December 14, 2021.
The grant of PSUs under the ArcelorMittal Equity Incentive Plan aims to serve as an effective performance-enhancing scheme based on the employee’s contribution to the eligible achievement of the Company’s strategy. Awards in connection with PSUs are subject to the fulfillment of cumulative performance criteria (such as return on capital employed ("ROCE"), total shareholders return ("TSR"), earnings per share ("EPS") and gap to competition) over a three years period from the date of the PSU grant. The employees eligible to receive PSUs are a sub-set of the group of employees eligible to receive RSUs.
| | |
250 Consolidated financial statements |
Conditions of the 2020 grant were as follows:
| | | | | | | | | | | | | | | | | | | | | | | | | | | | | | | | |
| | CEO Office | | Other Executive Officers |
| 2020 Grant | l | PSUs with a three year performance period | l | PSUs with a three year performance period |
| l | Value at grant 100% of base salary for the CEO and the President and CFO | | |
| l | Vesting conditions: | l | Vesting conditions |
| | Threshold | Target | | | | Target |
| TSR/EPS vs. peer group
| 100% median | ≥120% median | | TSR vs. peer group | | 100% target 100% vesting |
| | | EPS vs. peer group | | 100% target 100% vesting |
| TSR vs. S&P 500
| Performance equal to Index
| ≥Performance equal to Index + 2% p.a. outperformance | | Gap to competition (where applicable) | | 100% target 100% vesting |
| Vesting percentage | 50% | 100% | l | RSUs with a three year vesting period |
| l | RSUs with a one year vesting period |
Awards made in previous financial years which have not yet reached the end of the vesting period
The Company's Long-Term Incentive Plan for senior management including Executive Officers follows the Company's strategy.
In 2016, in order to ensure achievement of the Action 2020 plan, ArcelorMittal made a special grant (“Special Grant”) to qualifying employees (including the Executive Officers), instead of the
standard grant. The value of the Special Grant at grant date is based generally on a specified percentage of the base salary depending on the position of the employee at grant date. The vesting is subject to continued active employment within the ArcelorMittal group and to yearly performance of ROCE targets and other strategic objectives within the business units.
The plans in 2019, 2018, 2017 and 2016 are summarized below:
| | |
Consolidated financial statements 251 |
| (millions of U.S. dollars, except share and per share data) |
| | | | | | | | | | | | | | | | | | | | | | | | | | | | | | | | |
| | CEO Office | | Other Executive Officers |
| 2016 Special Grant | l | PSUs with a five year performance period, 50% vesting after three year performance period and 50% after additional two year performance period | l | PSUs with a five year performance period, 50% vesting after three year performance period and 50% after additional two year performance period |
| l | Performance criteria: 50% TSR (½ vs. S&P 500 and ½ vs. peer group) and 50% EPS vs. peer group | l | Performance criteria: ROCE and Gap to competition in some areas one target grant: a share will vest if performance is met at target one overperformance grant: a share will vest if performance exceeds 120% |
| l | Value at grant: 150% of base salary for the CEO and the President and CFO | l | Vesting conditions: |
| l | Vesting conditions: | | | |
| Threshold | Target | | Performance | | 100% | ≥120% |
| TSR/EPS vs. peer group | 100% median | ≥120% median | | Target award vesting | 100% | 100% |
| TSR vs. S&P 500 | Performance equal to Index | ≥Performance equal to Index + 2% p.a. outperformance | | Overperformance award (=20% of target award) | — | 100% |
| Vesting percentage | 50% | 100% | | | |
| 2017 Grant | l | PSUs with a three year performance period | | l | PSUs with a three year performance period | |
| l | Performance criteria: 50% TSR (½ vs. S&P 500 and ½ vs. peer group) and 50% EPS vs. peer group | l | Performance criteria: TSR and Gap to competition in some areas |
| l | Value at grant: 100% of base salary for the CEO and the President and CFO | | | |
| l | Vesting conditions: | | l | Vesting conditions: | |
| | Threshold | Target | | | | Threshold | Target |
| TSR/EPS vs. peer group
| 100% median | ≥120%median | | TSR vs. peer group
| 100% median 50% vesting | ≥120% median 100% vesting |
| TSR vs. S&P 500
| Performance equal to Index
| ≥Performance equal to Index + 2% p.a. outperformance | | Gap to competition (where applicable) | | 100% target 100% vesting |
| Vesting percentage
| 50% | 100% | | | |
| 2018 Grant | l | PSUs with a three year performance period | l | PSUs with a three year performance period | |
| l | Value at grant 100% of base salary for the CEO and the President and CFO | | | |
| l | Vesting conditions: | l | Vesting conditions | |
| | Threshold | Target | | | |
| TSR/EPS vs. peer group
| 100% median | ≥120% median | | ROCE | 100% target 100% vesting |
| TSR vs. S&P 500
| Performance equal to Index
| ≥Performance equal to Index + 2% p.a. outperformance | | Gap to competition (where applicable) | 100% target 100% vesting |
| Vesting percentage | 50% | 100% | | | |
| 2019 Grant | l | PSUs with a three year performance period | l | PSUs with a three year performance period |
| l | Value at grant 100% of base salary for the CEO and the President and CFO | |
| l | Vesting conditions: | l | Vesting conditions: | |
| | Threshold | Target | | |
| TSR/EPS vs. peer group | 100% median | ≥120% median | | ROCE | 100% target 100% vesting |
| TSR vs. S&P 500 | Performance equal to Index | ≥Performance equal to Index + 2% p.a. outperformance | | Gap to competition (where applicable) | 100% target 100% vesting |
| Vesting percentage | 50% | 100% | |
| | |
252 Consolidated financial statements |
The following table summarizes the Company’s share unit plans outstanding as of December 31, 2020:
| | | | | | | | | | | | | | | | | | | | | | | | | | | | | | | | | | | | | | | | | | | | | | | | | | | | |
| At Grant date | | Number of shares issued as of December 31, 2020 |
| Grant date | | Type of plan | | Number of shares | | Number of beneficiaries | | Maturity | | Fair value
per share | | Shares outstanding | | | | Shares forfeited | | Shares exited |
| December 14, 2020 | | RSU | | 1,074,600 | | | 656 | | | December 14, 2023 | | 21.15 | | | 1,074,600 | | | | | — | | | — | |
| December 14, 2020 | | RSU | | 316,684 | | | 203 | | | December 14, 2021 | | 21.15 | | | 316,684 | | | | | — | | | — | |
| December 14, 2020 | | PSU | | 714,250 | | | 235 | | | January 1, 2024 | | 19.74 | | | 714,250 | | | | | — | | | — | |
| December 14, 2020 | | CEO Office | | 148,422 | | | 2 | | | January 1, 2024 | | 18.19 | | | 148,422 | | | | | — | | | — | |
| December 16, 2019 | | PSU | | 1,760,350 | | | 517 | | | January 1, 2023 | | 18.57 | | | 1,521,900 | | | | | 62,700 | | | 175,750 | |
| December 16, 2019 | | CEO Office | | 172,517 | | | 2 | | | January 1, 2023 | | 14.89 | | | 172,517 | | | | | — | | | — | |
| December 20, 2018 | | PSU | | 1,358,750 | | | 524 | | | January 1, 2022 | | 21.31 | | | 1,075,350 | | | | | 161,150 | | | 122,250 | |
| December 20, 2018 | | CEO Office | | 134,861 | | | 2 | | | January 1, 2022 | | 16.58 | | | 134,861 | | | | | — | | | — | |
| December 20, 2017 | | PSU | | 1,081,447 | | | 527 | | | January 1, 2021 | | 18.42 | | | 781,345 | | | | | 206,932 | | | 93,170 | |
| December 20, 2017 | | CEO Office | | 90,084 | | | 2 | | | January 1, 2021 | | 22.85 | | | 90,084 | | | | | — | | | — | |
| June 30, 2016 | | PSU | | 3,472,355 | | | 554 | | | January 1, 2021 | | 13.17 | | | 2,358,170 | | | | | 847,214 | | | 266,971 | |
| June 30, 2016 | | CEO Office | | 153,268 | | | 2 | | | January 1, 2022 | | 16.62 | | | 153,268 | | | | | — | | | — | |
| | | | | | | | | | | | | | | | | | |
| Total | | | | 10,477,588 | | | | | | | $13.17 – $22.85 | | 8,541,451 | | | | | 1,277,996 | | | 658,141 | |
The compensation expense recognized for PSUs was 30, nil and 31 for the years ended December 31, 2020, 2019 and 2018.
Share unit plan activity is summarized below as of and for each year ended December 31, 2020, 2019 and 2018:
| | | | | | | | | | | | | | | | | | | | | | | |
| RSUs | | PSUs |
| Number of shares | | Fair value per share | | Number of shares | | Fair value per share |
| Outstanding, December 31, 2017 | 306,005 | | | 11.49 | | | 8,596,836 | | | 14.83 | |
Granted 1 | — | | | — | | | 1,577,865 | | | 21.32 | |
| Exited | (288,721) | | | 11.49 | | | (412,893) | | | 28.98 | |
| Forfeited | (17,284) | | | 11.49 | | | (391,348) | | | 16.41 | |
| Outstanding, December 31, 2018 | — | | | — | | | 9,370,460 | | | 15.34 | |
Granted 2 | — | | | — | | | 2,018,176 | | | 17.96 | |
| Exited | — | | | — | | | (2,677,011) | | | 13.49 | |
| Forfeited | — | | | — | | | (1,239,569) | | | 14.25 | |
| Outstanding, December 31, 2019 | — | | | — | | | 7,472,056 | | | 16.76 | |
| Granted | 1,391,284 | | | 21.15 | | | 862,672 | | | 19.47 | |
| Exited | — | | | — | | | (658,141) | | | 16.86 | |
| Forfeited | — | | | — | | | (526,420) | | | 15.48 | |
| Outstanding, December 31, 2020 | 1,391,284 | | | 21.15 | | | 7,150,167 | | | 17.18 | |
1.Including 56,606 over-performance shares granted for the targets achievement of the PSU grant September 17, 2014 and 27,648 of the GMB PSU grant June 30, 2015.
2.Including 85,309 over-performance shares granted for the targets achievement of the PSU grant December 18, 2015.
NOTE 9: PROVISIONS, CONTINGENCIES AND COMMITMENTS
ArcelorMittal recognizes provisions for liabilities and probable losses that have been incurred when it has a present legal or constructive obligation as a result of past events, it is probable that the Company will be required to settle the obligation and a reliable estimate of the amount of the obligation can be made. If the effect of the time value of money is material, provisions are discounted using a current pre-tax rate that reflects, where appropriate, the risks specific to the liability. Where discounting is used, the increase in the provision due to the passage of time is recognized as a financing cost. Future operating expenses or losses are excluded from recognition as provisions as they do not meet the definition of a liability. Contingent assets and contingent liabilities are excluded from recognition in the consolidated statements of financial position.
Provisions for onerous contracts are recorded in the consolidated statements of operations when it becomes known that the unavoidable costs of meeting the obligations under the contract exceed the economic benefits expected to be received. Assets dedicated to the onerous contracts are tested for impairment before recognizing a separate provision for the onerous contract.
Provisions for restructuring are recognized when and only when a detailed formal plan exists and a valid expectation in those affected by the restructuring has been raised, by starting to implement the plan or announcing its main features.
ArcelorMittal records asset retirement obligations (“ARO”) initially at the fair value of the legal or constructive obligation in the period in which it is incurred and capitalizes the ARO by
| | |
Consolidated financial statements 253 |
| (millions of U.S. dollars, except share and per share data) |
increasing the carrying amount of the related non-current asset. The fair value of the obligation is determined as the discounted value of the expected future cash flows. The liability is accreted to its present value through net financing cost and the capitalized cost is depreciated in accordance with the Company’s depreciation policies for property, plant and equipment. Subsequently, when reliably measurable, ARO is recorded on the consolidated statements of financial position increasing the cost of the asset and the fair value of the related obligation. Foreign exchange gains or losses on AROs denominated in foreign currencies are recorded in the consolidated statements of operations.
ArcelorMittal is subject to changing and increasingly stringent environmental laws and regulations concerning air emissions, water discharges and waste disposal, as well as certain remediation activities that involve the clean-up of soil and groundwater. ArcelorMittal is currently engaged in the investigation and remediation of environmental contamination at a number of its facilities. Most of these are legacy obligations arising from acquisitions.
Environmental costs that relate to current operations or to an existing condition caused by past operations, and which do not contribute to future revenue generation or cost reduction, are expensed. Liabilities are recorded when environmental assessments and/or remedial efforts are probable and the cost can be reliably estimated based on ongoing engineering studies, discussions with the environmental authorities and other assumptions relevant to the nature and extent of the remediation that may be required. The ultimate cost to ArcelorMittal is dependent upon factors beyond its control such as the scope and methodology of the remedial action requirements to be established by environmental and public health authorities, new laws or government regulations, rapidly changing technology and the outcome of any potential related litigation. Environmental liabilities are discounted if the aggregate amount of the obligation and the amount and timing of the cash payments are fixed or reliably determinable.
The estimates of loss contingencies for environmental matters and other contingencies are based on various judgments and assumptions including the likelihood, nature, magnitude and timing of assessment, remediation and/or monitoring activities and the probable cost of these activities. In some cases, judgments and assumptions are made relating to the obligation or willingness and ability of third parties to bear a proportionate or allocated share of cost of these activities, including third
parties who sold assets to ArcelorMittal or purchased assets from it subject to environmental liabilities. ArcelorMittal also considers, among other things, the activity to date at particular sites, information obtained through consultation with applicable regulatory authorities and third-party consultants and contractors and its historical experience with other circumstances judged to be comparable. Due to the numerous variables associated with these judgments and assumptions, and the effects of changes in governmental regulation and environmental technologies, both the precision and reliability of the resulting estimates of the related contingencies are subject to substantial uncertainties. As estimated costs to remediate change, the Company will reduce or increase the recorded liabilities through write backs or additional provisions in the consolidated statements of operations. ArcelorMittal does not expect these environmental issues to affect the utilization of its plants, now or in the future.
ArcelorMittal is currently and may in the future be involved in litigation, arbitration or other legal proceedings. Provisions related to legal and arbitration proceedings are recorded in accordance with the principles described above.
Most of these claims involve highly complex issues. Often these issues are subject to substantial uncertainties and, therefore, the probability of loss and an estimation of damages are difficult to ascertain. Consequently, ArcelorMittal may be unable to make a reliable estimate of the expected financial effect that will result from ultimate resolution of the proceeding. In those cases, ArcelorMittal has disclosed information with respect to the nature of the contingency. ArcelorMittal has not accrued a provision for the potential outcome of these cases.
For cases in which the Company was able to make a reliable estimate of the expected loss or range of probable loss and has accrued a provision for such loss, it believes that publication of this information on a case-by-case basis would seriously prejudice the Company’s position in the ongoing legal proceedings or in any related settlement discussions. Accordingly, in these cases, the Company has disclosed information with respect to the nature of the contingency, but has not disclosed its estimate of the range of potential loss.
In the cases in which quantifiable fines and penalties have been assessed, the Company has indicated the amount of such fine or penalty or the amount of provision accrued that is the estimate of the probable loss.
| | |
254 Consolidated financial statements |
These assessments can involve a series of complex judgments about future events and can rely heavily on estimates and assumptions. The assessments are based on estimates and assumptions that have been deemed reasonable by management. The Company believes that the aggregate provisions recorded for the above matters are adequate based upon currently available information. However, given the inherent uncertainties related to these cases and in estimating contingent liabilities, the Company could, in the future, incur judgments that have a material adverse effect on its results of operations in any particular period. The Company considers it highly unlikely, however, that any such judgments could have a material adverse effect on its liquidity or financial condition.
9.1 Provisions overview
| | | | | | | | | | | | | | | | | | | | | | | | | | | | | | | | | | | | | | |
| Balance at December 31, 2019 | | Additions1 | | Deductions/
Payments | | | Effects of foreign exchange and other movements | Divestments and reclassification to held for sale 2, 3 | | | Balance at December 31, 2020 |
| Environmental (see note 9.3) | 1,074 | | | 137 | | | (88) | | | | 57 | | (519) | | | | 661 | |
| Emission obligations | 484 | | | 373 | | | (92) | | | | (40) | | (154) | | | | 571 | |
| Asset retirement obligations (see note 9.3) | 478 | | | 21 | | | (10) | | | | 41 | | (133) | | | | 397 | |
| Site restoration | 136 | | | 167 | | | (12) | | | | 18 | | — | | | | 309 | |
| Staff related obligations | 185 | | | 88 | | | (41) | | | | (14) | | (91) | | | | 127 | |
| Voluntary separation plans | 47 | | | 30 | | | (38) | | | | 20 | | (4) | | | | 55 | |
| Litigation and other (see note 9.3) | 312 | | | 40 | | | (36) | | | | (39) | | (8) | |
| | 269 | |
| Tax claims | 81 | | | 5 | | | (6) | | | | (18) | | — | | | | 62 | |
| Other legal claims | 231 | | | 35 | | | (30) | |
| | (21) | | (8) | | | | 207 | |
| Commercial agreements and onerous contracts | 46 | | | 68 | | | (31) | |
| | (4) | | (54) | | | | 25 | |
| Other | 229 | | | 29 | | | (44) | | | | 16 | | (12) | | | | 218 | |
| 2,991 | | | 953 | | | (392) | | | | 55 | | (975) | | | | 2,632 | |
| Short-term provisions | 516 | | | | | | | | | | | | 935 | |
| Long-term provisions | 2,475 | | | | | | | | | | | | 1,697 | |
| 2,991 | | | | | | | | | | | | 2,632 | |
| | | | | | | | | | | | | | | | | | | | | | | | | | | | | | | | | | | |
| Balance at December 31, 2018 | | Additions1 | | Deductions/
Payments | | | Effects of foreign exchange and other movements | | | Balance at December 31, 2019 |
| Environmental (see note 9.3) | 1,228 | | | 97 | | | (95) | | | | (156) | | '4 | | 1,074 | |
| Emission obligations | — | | | 481 | | | — | | | | 3 | | | | 484 | |
| Asset retirement obligations (see note 9.3) | 422 | | | 28 | | | (10) | | | | 38 | | | | 478 | |
| Site restoration | 141 | | | 3 | | | (5) | | | | (3) | | | | 136 | |
| Staff related obligations | 201 | | | 65 | | | (64) | | | | (17) | | | | 185 | |
| Voluntary separation plans | 38 | | | 30 | | | (13) | | | | (8) | | | | 47 | |
| Litigation and other (see note 9.3) | 369 | | | 65 | | | (91) | | | | (31) | | | | 312 | |
| Tax claims | 120 | | | 5 | | | (14) | | | | (30) | | | | 81 | |
| Other legal claims | 249 | | | 60 | | | (77) | | | | (1) | | | | 231 | |
| Commercial agreements and onerous contracts | 34 | | | 29 | | | (16) | |
| | (1) | | | | 46 | |
| Other | 101 | | | 148 | | | (30) | | | | 10 | | | | 229 | |
| 2,534 | | | 946 | | | (324) | | | | (165) | | | | 2,991 | |
| Short-term provisions | 539 | | | | | | | | | | | 516 | |
| Long-term provisions | 1,995 | | | | | | | | | | | 2,475 | |
| 2,534 | | | | | | | | | | | 2,991 | |
1.Additions exclude provisions reversed or utilized during the same year.
2.On December 9, 2020, the Company completed the sale of ArcelorMittal USA and certain other US operations (see note 2.3.1).
3.On December 10, 2020, the Company signed a binding agreement with Invitalia, an Italian state-owned company, to form a public-private partnership between the parties. As a result, the carrying amounts of the assets and liabilities of ArcelorMittal Italia were classified as held for sale as of December 31, 2020 (see note 2.3.2.)
4. Other movements primarily relate to the provisions in connection with environmental remediation obligations in Italy (see note 9.3).
| | |
Consolidated financial statements 255 |
| (millions of U.S. dollars, except share and per share data) |
As described in note 6.1.5, the Company uses derivative financial instruments to manage its exposure to fluctuations in prices of emission rights allowances. The expense associated with the provision above was largely offset by recycling of hedging reserves in 2020 and will be partially offset again in 2021. See note 6.3 for the details of the cash flow hedging in place for emission rights and note 4.5 for CO2 emission rights held as current assets. The Company also receives indirect compensation through rebates on its energy tariffs.
There are uncertainties regarding the timing and amount of the provisions above. Changes in underlying facts and circumstances for each provision could result in differences in the amounts provided for and the actual outflows. In general, provisions are presented on a non-discounted basis due to the uncertainties regarding the timing or the short period of their expected consumption.
Environmental provisions have been estimated based on internal and third-party estimates of contaminations, available remediation technology, and environmental regulations. Estimates are subject to revision as further information develops or circumstances change.
Provisions for site restoration are related to costs in connection with the dismantling of site facilities, mainly in France and Poland. In the fourth quarter of 2018, the agreement between ArcelorMittal and the French government regarding a 6 year idling period of the Florange liquid phase expired. The Company has started the process of definitive closure of the facility end of 2018. The provision included in site restoration at December 31, 2020 and 2019, related to dismantling of this facility amount to 120 and 113, respectively. In 2020, additional provisions of 77 and 77 were recognized, respectively, following the decisions to permanently close a blast furnace and steel plant in Krakow, Poland, and the coke plant in Florange, France.
Provisions for staff related obligations primarily concern Brazil (United States and Brazil in 2019) and are related to various employees’ compensation.
Provisions for voluntary separation plans primarily concern plans in Spain, Belgium, Germany, South Africa and Brazil which are expected to be settled within one year.
Provisions for litigation include losses relating to present legal obligations that are considered to be probable. Further detail regarding legal matters is provided in note 9.3.
In 2020, provisions for commercial agreements and onerous contracts concern primarily onerous contracts recognized in Poland and Brazil. In 2019, such provisions concerned mainly the United States and Brazil.
As of December 31, 2020 and 2019, other provisions include 97 and 126, respectively, related to the indemnification arrangement between the Company and Global Chartering (see note 2.3.1). Other provisions comprise as well technical warranties and guarantees.
9.2 Other long-term obligations
| | | | | | | | | | | |
| | Balance at December 31, |
| | 2020 | | 2019 |
| Derivative financial instruments (see note 6.1.5) | 96 | | | 238 | |
| Payable from acquisition of financial assets | 359 | | | 1,340 | |
| Unfavorable contracts | 132 | | | 203 | |
| Income tax payable | 214 | | | 251 | |
| Other | 347 | | | 486 | |
| Total | 1,148 | | | 2,518 | |
As of December 31, 2019, derivative financial instruments included 138 relating to the pellet purchase agreement that contained a special payment in the U.S. (see note 6.1.5). This derivative financial instrument was derecognized upon disposal of ArcelorMittal USA (see note 2.3.1).
As of December 31, 2019, payable from acquisition of financial assets included 1,032 relating to the non-current portion of the consideration payable with respect to the acquisition of ArcelorMittal Italia, which is classified as held for sale as of December 31, 2020 (see note 2.3.2). As of December 31, 2020 and 2019, payable from acquisition of financial assets included also 235 and 265, respectively, relating to the financial liability with respect to the acquisition of AMSF (see note 2.2.4).
Unfavorable contracts of 132 and 203 as of December 31, 2020 and 2019, respectively, mainly related to AMSF (see note 2.2.4).
As of December 31, 2020, the income tax payable mainly related to income tax contingencies (in majority unasserted claims) and withholding tax.
9.3 Environmental liabilities, asset retirement obligations and legal proceedings
Environmental Liabilities
ArcelorMittal’s operations are subject to a broad range of laws and regulations relating to the protection of human health and the environment at its multiple locations and operating subsidiaries. As of December 31, 2020, excluding asset retirement obligations, ArcelorMittal had established provisions of 661 for environmental remedial activities and liabilities. The provisions for all operations by geographic area were 500 in Europe, 130 in South Africa and 31 in Canada. In addition, ArcelorMittal and the previous owners of its facilities have expended substantial amounts to achieve or maintain ongoing
| | |
256 Consolidated financial statements |
compliance with applicable environmental laws and regulations. ArcelorMittal expects to continue to expend resources in this respect in the future.
Europe
Environmental provisions for ArcelorMittal’s operations in Europe total 500 and are mainly related to the investigation and remediation of environmental contamination at current and former operating sites in Belgium (247), France (74), Poland (72), Luxembourg (69), Germany (30) and Spain (8). This investigation and remediation work relates to various matters such as decontamination of water discharges, waste disposal, cleaning water ponds and remediation activities that involve the clean-up of soil and groundwater. These provisions also relate to human health protection measures such as fire prevention and additional contamination prevention measures to comply with local health and safety regulations.
Belgium
In Belgium, there is an environmental provision of 247 of which the most significant elements are legal site remediation obligations linked to the closure of the primary installations at ArcelorMittal Belgium (Liège). The provisions also concern the external recovery and disposal of waste, residues or by-products that cannot be recovered internally on the ArcelorMittal Gent and Liège sites and the removal and disposal of asbestos-containing material.
France
In France, there is an environmental provision of 74, principally relating to the remediation of former sites, including several coke plants, and the capping and monitoring of landfills or basins previously used for residues and secondary material.
The remediation of the coke plants concerns mainly the Thionville, Moyeuvre Grande, Homecourt, Hagondange and Micheville sites, and is related to treatment of soil and groundwater. At Thionville coke plant, the remediation process is ongoing and is planned to be finished in 2022. At Moyeuvre-Petite, the operation of covering the sludge basins is finished. ArcelorMittal is responsible for closure and final rehabilitation of the rest of the site, that is to say the former Conroy and Pérotin slag-heaps, from which the administrative procedure for cessation of activity is underway but due to the COVID-19 pandemic the project slowed down. On other sites, ArcelorMittal France is responsible for monitoring the concentration of organic compound and heavy metals in soil and groundwater on all former sites closed and/or already remediated.
ArcelorMittal France has an environmental provision that principally relates to the remediation and improvement of storage of secondary materials, the disposal of waste at different ponds and landfills and an action plan for removing asbestos from the installations and mandatory financial
guarantees to cover risks of major accident hazard or for gasholders and waste storage. Most of the provision relates to the stocking areas at the Dunkirk site that will need to be restored to comply with local law and to the mothballing of the liquid phase in Florange, including study and surveillance of soil and water to prevent environmental damage, treatment and elimination of waste and financial guarantees demanded by Public Authorities. The environmental provisions also include treatment of slag dumps at Florange and Dunkirk sites as well as removal and disposal of asbestos-containing material at the Dunkirk and Mardyck sites.
ArcelorMittal France also has an environmental provision that principally relates to the remediation and improvement of storage of secondary materials, the disposal of waste at different ponds and landfills: the stocking areas at the Dunkirk site need to be restored to comply with local law.
Poland
ArcelorMittal Poland’s environmental provision of 72 relates to 42 for cleaning and remediation costs recognized in 2020 following the closure of primary facilities in Krakow, and the remaining 30 relates to the obligation to reclaim a landfill in Lipówka, to dispose of the residues which cannot be internally recycled or externally recovered in Dabrowa Gornicza, the storage and disposal of iron-bearing sludge which cannot be reused in the manufacturing process under the environmental law (i.e., waste storage time cannot exceed 3 year, and, also, land remediation in post-industrial areas in Ruszcza (district of Krakow).
Luxembourg
In Luxembourg, there is an environmental provision of 69, which relates to the post-closure monitoring and remediation of former production sites, waste disposal areas, slag deposits and mining sites.
In 2007, ArcelorMittal Luxembourg sold the former Ehlerange slag deposit (93 hectares) to the State of Luxembourg. ArcelorMittal Luxembourg is contractually liable to clean the site and move approximately 400,000 cubic meters of material to other sites. ArcelorMittal Luxembourg also has an environmental provision to secure, stabilize and conduct waterproofing treatment on mining galleries and entrances and various dumping areas in Mondercange, Differdange and Dommeldange. In addition, ArcelorMittal Luxembourg has secured the disposal of ladle slag, sludge and certain other residues coming from different sites at the Differdange dump for a total volume of 1,400,000 cubic meters until mid 2023. A provision of 58 covers these obligations.
ArcelorMittal Belval and Differdange has an environmental provision of 10 to clean historical landfills in order to meet the requirements of the Luxembourg Environment Administration
| | |
Consolidated financial statements 257 |
| (millions of U.S. dollars, except share and per share data) |
and to cover dismantling and soil cleaning costs of the former PRIMOREC installation.
Germany
In Germany, the environmental provision of 30 essentially relates to ArcelorMittal Bremen’s post-closure obligations mainly established for soil remediation, groundwater treatment and monitoring at the Prosper coke plant in Bottrop.
Spain
In Spain, ArcelorMittal España has environmental provisions of 8 due to obligations of sealing landfills basically located in the Asturias site and post-closure obligations in accordance with national legislation. These obligations include the collection and treatment of leachates that can be generated during the operational phase and a period of 30 years after the closure.
Italy
ArcelorMittal Italia has environmental provisions of 374, which are classified as held for sale as of December 31, 2020 (note 2.3.2).
A provision of 158 relates to remediation activities to be carried out in the site of Taranto derived from obligations on the previous operator that have been transferred to ArcelorMittal Italia through the environmental permit, the most significant elements being the waterproofing of certain areas to confine historical pollution, the removal of historical accumulation of process materials mainly consisting of blast furnace ("BF") and basic oxygen furnace ("BOF") dusts and sludges and scales, an action plan for the removal and disposal of asbestos-containing materials present on site, the dismantling of several installations no longer in operation, the dredging of the discharge channel and disposal of the sludge removed, the decontamination of high depth groundwater in the primary yards area and the capping of an exhausted landfill.
Provisions of 216 are allocated to the implementation of preventive measures, permanent safety measures and clean up measures in relation to historical pollution of soil and groundwater, not derived from obligations in the environmental permit, but that ArcelorMittal Italia undertook to implement as a contractual obligation vis-a-vis the previous operator.
South Africa
AMSA has environmental provisions of 130 to be used over 16 years, mainly relating to environmental remediation obligations attributable to historical or legacy settling/evaporation dams and waste disposal activities. An important determinant in the final timing of the remediation work relates to the obtaining of the necessary environmental authorizations.
A provision of 43 relates to the decommissioned Pretoria Works site. This site is in a state of partial decommissioning and rehabilitation with one coke battery and a small-sections rolling
facility still in operation. AMSA transformed this old plant into an industrial hub for light industry since the late 1990s. Particular effort is directed to landfill sites, with sales of slag from legacy disposal sites to vendors in the construction industry continuing unabated, but other remediation works continued at a slow pace as remediation actions for these sites are long-term in nature due to a complex legal process that needs to be followed with authorities and surrounding landowners.
The Vanderbijlpark Works site, the main flat carbon steel operation of AMSA, contains a number of legacy facilities and areas requiring remediation. The remediation entails the implementation of rehabilitation and decontamination measures of waste disposal sites, waste water dams, ground water and historically contaminated open areas. 20 of the provision is allocated to this site.
The Newcastle Works site is the main long carbon steel operation of AMSA. A provision of 23 is allocated to this site. As with all operating sites of AMSA, the above retirement and remediation actions dovetail with numerous large capital expenditure projects dedicated to environmental management. In the case of the Newcastle site, the major current environmental capital project is for air quality improvements.
A provision of 39 relates to the environmental rehabilitation of the Thabazimbi Mine. AMSA holds an environmental trust which holds investments for a value of 26 that will be used for rehabilitation purposes.
The remainder of the obligation of 5 relates to Vereeniging site for the historical pollution that needs to be remediated at waste disposal sites, waste water dams and groundwater aquifers.
Canada
In Canada, ArcelorMittal Dofasco has an environmental provision of 31 for the expected cost of remediating toxic sediment located in the Company’s East Boatslip site, of which 5 is expected to be spent in 2021.
Retirement Obligations (“AROs”)
AROs arise from legal requirements and represent management’s best estimate of the present value of the costs that will be required to retire plant and equipment or to restore a site at the end of its useful life. As of December 31, 2020, ArcelorMittal had established provisions for asset retirement obligations of 397, including mainly 144 for Canada, 69 for Mexico, 55 for Ukraine, 45 for Germany, 23 for Liberia, 21 for South Africa, 16 for Belgium, 13 for Kazakhstan, 9 for Brazil and 2 for Bosnia and Herzegovina.
The AROs in Canada are legal obligations for site restoration and dismantling of the facilities near the mining sites in Mont-Wright and Fire Lake, and the accumulation area of mineral substances at the facility of Port-Cartier in Quebec, upon
| | |
258 Consolidated financial statements |
closure of the mines pursuant to the restoring plan of the mines. In addition, Dofasco has legal obligations for the former Sherman Mine site near Temagami, Ontario.
The AROs in Mexico relate to the restoration costs following the closure of the Las Truchas, El Volcan and the joint operation of Peña Colorada iron ore mines.
The AROs in Ukraine are legal obligations for site rehabilitation at the iron ore mining site in Kryvyi Rih, upon closure of the mine pursuant to its restoration plan.
In Germany, AROs principally relate to the Hamburg site, which operates on leased land with the contractual obligation to remove all buildings and other facilities upon the termination of the lease, and to the Prosper coke plant in Bottrop for filling the basin, restoring the layer and stabilizing the shoreline at the harbor.
In Liberia, the AROs relate to iron ore mine and associated infrastructure and mine related environmental damage and compensation. They cover the closure and rehabilitation plan under both the current operating phase and the not yet completed Phase 2 expansion project.
The AROs in South Africa are for the Pretoria, Vanderbijlpark, Saldanha, Newcastle as well as the Coke and Chemical sites, and relate to the closure and clean-up of the plant associated with decommissioned tank farms, tar plants, chemical stores, railway lines, pipelines and defunct infrastructure.
In Belgium, the AROs are to cover the demolition costs for primary facilities at the Liège site.
In Kazakhstan, the AROs relate to the restoration obligations of the iron ore and coal mines.
In Brazil, the AROs relate to legal obligations to clean and restore the mining areas of Serra Azul and Andrade, both located in the State of Minas Gerais. The related provisions are expected to be settled in 2024 and 2062, respectively.
In Bosnia and Herzegovina, the ARO relates to re-cultivation of dump yard of old iron ore pit Jezero and closing dam Medjedja.
Tax Claims
ArcelorMittal is a party to various tax claims. As of December 31, 2020, ArcelorMittal had recorded long term obligations related to income tax contingencies of 5 (see note 9.2) and provisions for other tax claims in the aggregate of 62 for which it considers the risk of loss to be probable. Set out below is a summary description of the tax claims (i) for which ArcelorMittal had recorded a provision as of December 31, 2020, (ii) that constitute a contingent liability, (iii) that were resolved in 2020 or (iv) that were resolved and had a financial
impact in 2019 or 2018 in each case involving amounts deemed material by ArcelorMittal. The Company is vigorously defending against the pending claims discussed below.
Brazil
In 2003, the Federal Revenue Service granted ArcelorMittal Brasil (through its predecessor company, then known as CST) a tax benefit for certain investments. ArcelorMittal Brasil had received certificates from SUDENE, the former Agency for the Development of the Northeast Region of Brazil, confirming ArcelorMittal Brasil’s entitlement to this benefit. In September 2004, ArcelorMittal Brasil was notified of the annulment of these certificates. ArcelorMittal Brasil has pursued its right to this tax benefit through the courts against both ADENE, the successor to SUDENE, and against the Federal Revenue Service. The Federal Revenue Service issued a tax assessment in this regard for 451 in December 2007. In December 2008, the administrative tribunal of the first instance upheld the amount of the assessment. ArcelorMittal Brasil appealed to the administrative tribunal of the second instance, and, on August 8, 2012, the administrative tribunal of the second instance found in favor of ArcelorMittal Brasil invalidating the tax assessment, thereby ending this case except for 6, which remained pending a final decision. On April 16, 2011, ArcelorMittal Brasil received a further tax assessment for the periods of March, June and September 2007, which, taking into account interest and currency fluctuations, amounted to 163 as of December 31, 2018. In October 2011, the administrative tribunal of the first instance upheld the tax assessment received by ArcelorMittal Brasil on April 16, 2011, but decided that no penalty (amounting to 77 at that time) was due. Both parties have filed an appeal with the administrative tribunal of the second instance. In February 2018, the administrative tribunal of the second instance found in favor of ArcelorMittal Brasil and, in June 2018, the Federal Revenue Service filed an appeal with the administrative tribunal of the third instance. In January 2019, the administrative tribunal of the third instance found in favor of ArcelorMittal Brasil. No further appeal was filed by the Federal Revenue Service within the time limit so the case is closed definitively in favor of ArcelorMittal Brasil.
In 2011, ArcelorMittal Brasil (at the time SOL Coqueria Tubarão S.A.) received 21 separate tax assessments from the Revenue Service of the State of Espirito Santo for ICMS (a value-added tax) in an amount which totaled 24 relating to a tax incentive (INVEST) it used. The dispute concerns the definition of fixed assets. In August 2015, the administrative tribunal of the first instance upheld the 21 separate tax assessments. In September 2015, ArcelorMittal Brasil filed appeals with respect to each of the administrative tribunal’s decisions. As of December 31, 2018, there were final unfavorable decisions at the administrative tribunal level in 15 of the 21 cases, each of which ArcelorMittal Brasil has appealed to the judicial instance. In
| | |
Consolidated financial statements 259 |
| (millions of U.S. dollars, except share and per share data) |
March 2018, the administrative tribunal of the third instance found in favor of ArcelorMittal Brasil sending the six other cases back to the administrative tribunal of the second instance. After the administrative tribunal of the second instance issued a partially favorable ruling on these six cases in December 2019, related only to the recognition of the limitation period of May 2005, a further appeal to the administrative tribunal of the third instance was filed.
In 2011, ArcelorMittal Brasil received a tax assessment for corporate income tax (known as IRPJ) and social contributions on net profits (known as CSL) in relation to (i) the amortization of goodwill on the acquisition of Mendes Júnior Siderurgia (for the 2006 and 2007 fiscal years), (ii) the amortization of goodwill arising from the mandatory tender offer (MTO) made by ArcelorMittal to minority shareholders of Arcelor Brasil following the two-step merger of Arcelor and Mittal Steel N.V. (for the 2007 tax year), (iii) expenses related to pre-export financing used to finance the MTO, which were deemed by the tax authorities to be unnecessary for ArcelorMittal Brasil since the expenses were incurred to buy shares of its own company and (iv) CSL over profits of controlled companies in Argentina and Costa Rica. The amount claimed totals 404. On January 31, 2014, the administrative tribunal of the first instance found in partial favor of ArcelorMittal Brasil, reducing the penalty component of the assessment from, according to ArcelorMittal Brasil’s calculations, 120 to 63 (as calculated at the time of the assessment), while upholding the remainder of the assessment. The Federal Revenue Service appealed the administrative tribunal’s decision to reduce the amount of the original penalty. ArcelorMittal Brasil also appealed the administrative tribunal’s decision to uphold the tax authority’s assessment (including the revised penalty component). In September 2017, the administrative tribunal of the second instance found largely in favor of the Federal Revenue Service. In January 2018, ArcelorMittal Brasil filed a motion for clarification of this decision. In February 2018, the motion for clarification was rejected and, in March 2018, an appeal was filed to the administrative tribunal of the third instance.
In 2013, ArcelorMittal Brasil received a tax assessment in relation to the 2008-2010 tax years for IRPJ and CSL in relation to (i) the amortization of goodwill on the acquisition of Mendes Júnior Siderurgia, Dedini Siderurgia and CST, (ii) the amortization of goodwill arising from the MTO made by ArcelorMittal to minority shareholders of Arcelor Brasil following the two-step merger of Arcelor and Mittal Steel N.V. and (iii) CSL and IRPJ over profits of controlled companies in Argentina, Costa Rica, Venezuela and the Netherlands. The amount claimed totals 360. In October 2014, the administrative tribunal of the first instance found in favor of the Federal Revenue Service and ArcelorMittal Brasil filed its appeal in November 2014. In September 2017, the administrative tribunal of the
second instance found in favor of the Federal Revenue Service. ArcelorMittal Brasil filed a motion for clarification with respect to this decision, which was denied, and thereafter filed an appeal to the administrative tribunal of the third instance.
In April 2016, ArcelorMittal Brasil received a tax assessment in relation to (i) the amortization of goodwill resulting from Mittal Steel’s MTO to the minority shareholders of Arcelor Brasil following Mittal Steel’s merger with Arcelor in 2007 and (ii) the amortization of goodwill resulting from ArcelorMittal Brasil’s acquisition of CST in 2008. While the assessment, if upheld, would not result in a cash payment as ArcelorMittal Brasil did not have any tax liability for the fiscal years in question (2011 and 2012), it would result in a 63 financial impact arising from a write off of net operating loss carry forwards with respect to the 2011-2012 tax year. In May 2016, ArcelorMittal Brasil filed its defense, which was not accepted at the first administrative instance. On March 10, 2017, ArcelorMittal Brasil filed an appeal to the second administrative instance, which was rejected in May 2019, filed a motion for clarification which was denied in November 2019 and thereafter filed an appeal to the administrative tribunal of the third instance.
In December 2018, ArcelorMittal Brasil received a tax assessment of 96, which could have an additional 21 financial impact arising from a write off of net operating loss carry forward with respect to the 2013-2014 tax years, principally in relation to the amortization of goodwill resulting from Mittal Steel’s MTO to the minority shareholders of Arcelor Brasil following Mittal Steel’s merger with Arcelor in 2007. In January 2019, ArcelorMittal Brasil filed a defense in the first administrative instance, which issued an unfavorable decision in June 2019. An appeal to the second administrative instance was filed in July 2019.
In December 2020, ArcelorMittal Brasil received a tax assessment of 33, which could have an additional 46 financial impact arising from a write off of net operating loss carry forwards, with respect to the 2015-2016 tax years, related to the amortization of goodwill resulting from Mittal Steel’s MTO to the minority shareholders of Arcelor Brasil following Mittal Steel’s merger with Arcelor in 2007. ArcelorMittal Brasil filed its defense in the first administrative instance in January 2021.
In 2013, ArcelorMittal Brasil filed a lawsuit against the Federal Revenue Service disputing the basis of calculation of a tax called additional freight for the renewal of the Brazilian Merchant Navy ("AFRMM"), amounting to 55. The dispute is related to the inclusion of the unloading and land transport costs of the imported goods after landing to calculate AFRMM. In June 2013, ArcelorMittal Brasil obtained a preliminary decision allowing the Company not to pay such amount until a final decision was rendered. In February 2017, ArcelorMittal Brasil
| | |
260 Consolidated financial statements |
obtained a favorable decision at the judicial first instance which was upheld by the Federal Court of Appeals in February 2019. In July 2019, the Federal Revenue Service filed appeals with the Superior Court of Justice and the Supreme Court. In February 2020, the appeal to the Supreme Court of Justice was dismissed and, in July 2020, the Appeal to the Supreme Court was dismissed. This decision is final and unappealable. In November 2018, a related tax assessment was received from the Federal Revenue Service claiming 18 as a penalty for alleged failure to comply with formal requirements in the import declarations delivered by the Company in the years 2013-2018, which were the subject matter of the preliminary decision of June 2013. In December 2018, ArcelorMittal Brasil presented its defense in the first administrative instance, which in June 2019 decided in ArcelorMittal Brasil’s favor. This decision is subject to appeal. A further related tax assessment was received in September 2018 from the Federal Revenue Service claiming 0.2 as a penalty for alleged failure to comply with formal requirements in the import declarations delivered by the Company in the period between September and November 2013. In October 2018 ArcelorMittal Brasil presented its defense in the first administrative instance, and a decision is pending.
For over 20 years, ArcelorMittal Brasil has been challenging the basis of the calculation of the Brazilian COFINS and PIS social security taxes (specifically, whether Brazilian VAT may be deducted from the base amount on which the COFINS and PIS taxes are calculated). In March 2017, the Supreme Court decided a separate case, not involving ArcelorMittal Brasil, on the same subject in favor of the relevant taxpayers. Such separate Supreme Court decision, is of binding precedential value with respect to all similar cases, including those of ArcelorMittal Brasil. In July 2018, the second judicial instance found in favor of ArcelorMittal Brasil after applying the Supreme Court’s precedent. In December 2018, the Federal Revenue Service brought an appeal of the second judicial instance’s decision to the Supreme Court. In June 2019, the Federal Revenue Service’s appeal was dismissed in a final and unappealable decision in favor of ArcelorMittal Brasil.
In the period from 2014 to 2018, ArcelorMittal Brasil received six tax assessments from the Federal Revenue Service in the amount of 38 disputing its use of credits for PIS and COFINS social security taxes in 2010, 2011 and 2013. The dispute relates to the concept of production inputs in the context of these taxes. In the first case, the administrative tribunal of the first instance found partially in favor of ArcelorMittal Brasil. The decision was upheld in the administrative tribunal of the second instance and ArcelorMittal Brasil filed an appeal to the administrative tribunal of the third instance which ruled partially in favor of ArcelorMittal Brasil in May 2019. In January 2020, the case was sent back to the Federal Revenue which is verifying the extent of the administrative tribunal of the third instance’s
decision in order to proceed with the write-off of amounts due. In August 2020, the tax assessment was reduced by 4, reflecting the partially favorable decision. The remaining amount of 12 will be discussed at the judicial level. In the second case, the administrative tribunal of the first instance found partially in favor of ArcelorMittal Brasil and an appeal has been filed to the administrative tribunal of the second instance. In the third case, the administrative tribunal of the first instance upheld the tax assessment, and ArcelorMittal Brasil appealed to the administrative tribunal of the second instance. In the fourth and fifth cases, ArcelorMittal Brasil has filed its defenses to the administrative tribunal of the first instance. In November 2020, a partially favorable decision was issued in the fifth case and an appeal was presented. In the sixth case, the administrative tribunal of the first instance upheld the tax assessment, and ArcelorMittal Brasil appealed to the administrative tribunal of the second instance. In March 2018, the Superior Court decided a leading case, not involving ArcelorMittal Brasil, that established that the restrictive concept of inputs adopted by the tax authorities is illegal and that credits over inputs must be accepted on the basis of the criteria of essentiality or relevance towards the production process of each taxpayer. In September 2018, the Federal Union published an internal orientation for its attorneys, expressing a restrictive view of the Superior Court's decision and determining that each individual case would be analyzed in order to decide whether the items are essential or not. However, this federal orientation has not been followed in unrelated cases, and therefore ArcelorMittal Brasil's cases may be submitted for review by the Federal Union Attorney's office before further decisions are taken or may be taken to trial without such review.
In May 2014, ArcelorMittal Comercializadora de Energia received a tax assessment from the state of Minas Gerais alleging that the Company did not correctly calculate tax credits on interstate sales of electricity from February 2012 to December 2013. The amount claimed totals 32. ArcelorMittal Comercializadora de Energia filed its defense in June 2014. Following an unfavorable administrative decision in November 2014, ArcelorMittal filed an appeal in December 2014. In March 2015, there was a further unfavorable decision at the second administrative level. Following the conclusion of this proceeding at the administrative level, the Company received the tax enforcement notice in December 2015 and filed its defense in February 2016. In April 2016, ArcelorMittal Comercializadora de Energia received an additional tax assessment in the amount, of 46, after taking account of a reduction of fines mentioned below regarding the same matter, for infractions which allegedly occurred during the 2014 to 2015 period, and filed its defense in May 2016. In May 2017, there was a further unfavorable decision at the second administrative level in respect of the tax assessment received in April 2016. In June 2017, ArcelorMittal Comercializadora de Energia filed an appeal to the second
| | |
Consolidated financial statements 261 |
| (millions of U.S. dollars, except share and per share data) |
administrative instance. This appeal was rejected in August 2017. In October and November 2017, the Company appealed in relation to both tax assessments to the judicial instance. In November 2017, the Company received a notice from the tax authority informing it of the reduction of the fines element by 12, due to the retroactive application of a new law. In February 2019, due to the retrospective application of a new law, a reduction of the fine element of 7 was finalized in the first case.
In the period from May to July 2015, ArcelorMittal Brasil received nine tax assessments from the state of Rio Grande do Sul alleging that the Company, through its branches in that state, had not made advance payments of ICMS on sales in that state covering the period from May 2010 to April 2015. The amount claimed totals 70. The administrative tribunal of the first instance upheld the tax assessments in each of the nine cases, and ArcelorMittal Brasil appealed each of the administrative tribunal’s decisions. Each case was decided unfavorably to ArcelorMittal Brasil at the administrative tribunal of the second instance, and ArcelorMittal Brasil appealed the cases to the judicial instance.
On May 17, 2016, ArcelorMittal Brasil received a tax assessment from the state of Santa Catarina in the amount of 100 alleging that it had used improper methods to calculate the amount of its ICMS credits. ArcelorMittal Brasil filed its defense in July 2016. In December 2016, ArcelorMittal Brasil received an unfavorable decision at the first administrative level, in respect of which it filed an appeal. In March 2018, the administrative tribunal of the second instance found against ArcelorMittal Brasil and, in April 2018, ArcelorMittal Brasil filed an appeal to the administrative tribunal of the third instance. In December 2019, the tax assessment was upheld by the administrative tribunal of the third instance. In January 2020, ArcelorMittal Brasil filed a motion for clarification which was rejected in August 2020. ArcelorMittal Brasil appealed to the judicial instance in November 2020.
Mexico
In 2015, the Mexican Tax Administration Service issued a tax assessment to ArcelorMittal Mexico, alleging that ArcelorMittal Mexico owes 158 with respect to 2008, principally due to improper interest deductions relating to certain loans, and unpaid corporate income tax for interest payments that the tax authority has categorized as dividends. In November 2015, ArcelorMittal Mexico filed an administrative appeal in respect of this assessment, which was dismissed by the tax authority. In November 2017, ArcelorMittal Mexico filed an annulment complaint before a Federal Administrative and Tax Justice Court, which has not been determined.
With respect to 2007 and 2009, the Mexican Tax Administration Service also challenged the interest deduction related to the aforementioned loans and issued tax assessments to ArcelorMittal Mexico for 23 and 28, respectively. In November 2018, a Federal Administrative and Tax Justice Court ruled against the annulment complaint filed by ArcelorMittal Mexico in relation to the 2007 tax assessment and in December 2018, ArcelorMittal Mexico filed a constitutional claim before the Collegiate Tribunal For Administrative Matters, which was rejected in June 2019. A review appeal was filed in July 2019 and rejected in August 2019. An extraordinary appeal of constitutional review was filed against this decision in September 2019 before the Supreme Court of Justice. In November 2019, the Court dismissed the extraordinary appeal of constitutional review confirming the earlier decision in favor of the tax authorities. No further appeal is possible. With respect to the 2009 tax assessment, in November 2016 ArcelorMittal Mexico filed an administrative appeal before the Administrative Authority on Federal Tax Matters, which was rejected in June 2020. In September 2020, an annulment complaint was filed before the Federal Administrative and Tax Justice Court
In 2013, the Mexican Tax Administration Service issued a tax assessment to ArcelorMittal Las Truchas, alleging that ArcelorMittal Las Truchas owes 89 in respect of (i) non-payment of withholding tax on capitalized interest, (ii) non-deduction of accrued interest regarding certain loans, and (iii) reduction of the taxable basis of assets in 2007. In 2015, ArcelorMittal Las Truchas filed an administrative appeal in respect of the aforementioned assessment, which the tax authority dismissed. In October 2015, ArcelorMittal Las Truchas filed an annulment complaint before the Federal Administrative and Tax Justice Court, which ruled partially in favor of ArcelorMittal Las Truchas in October 2018 by declaring the illegality of item (i). The tax authority filed an application for judicial review in January 2019 and in March 2020, the Court upheld the ruling in favor of ArcelorMittal Las Truchas regarding item (i) which decision is definitive. ArcelorMittal Las Truchas also filed a nullity lawsuit to challenge the ruling in respect of items (ii) and (iii), and, in June 2020, the Court upheld the rulings of the Tax Court. ArcelorMittal Las Truchas promptly thereafter submitted an extraordinary appeal for constitutional review before the Supreme Court of Justice regarding items (ii) and (iii).
In October 2018, the Mexican Tax Administration Service issued a tax assessment to ArcelorMittal Las Truchas, alleging that ArcelorMittal Las Truchas owes 84 with respect to 2013 due to: (i) improper interest deductions relating to certain loans and (ii) non-deduction of advanced rent payments. In November 2018, ArcelorMittal Las Truchas filed an administrative appeal before the Administrative Authority on Federal Tax Matters, which was partially rejected in June 2019 and is being appealed.
| | |
262 Consolidated financial statements |
Ukraine
In October 2019, ArcelorMittal Kryvyi Rih received a tax order from Ukrainian tax authorities covering the findings of a tax audit for the period from 2015 through the first quarter of 2019 which claimed the Company owes additional taxes of 282 for that period. ArcelorMittal Kryvyi Rih appealed this order to the tax authorities resulting in a significant reduction of the amounts claimed. In January 2020, ArcelorMittal Kryvyi Rih filed 3 legal actions with the Kyiv District Administrative Court seeking to cancel the remaining additional charges amounting to 124. In October 2020, ArcelorMittal Kryvyi Rih commenced a separate lawsuit seeking cancellation of additional tax charges (excise duty, VAT, CIT, fines) of 87 based on the results of a full-scope tax audit covering 2015 through the first quarter of 2019.
Competition/Antitrust Claims
ArcelorMittal is a party to various competition/antitrust claims. As of December 31, 2020, ArcelorMittal had not recorded any provisions in respect of such claims. Set out below is a summary description of competition/antitrust claims (i) that constitute a contingent liability, (ii) that were resolved in 2020 or (iii) that were resolved and had a financial impact in 2019 or 2018, in each case involving amounts deemed material by ArcelorMittal. The Company is vigorously defending against each of the pending claims discussed below.
Brazil
In September 2000, two construction trade organizations filed a complaint with Brazil’s Administrative Council for Economic Defense (“CADE”) against three long steel producers, including ArcelorMittal Brasil. The complaint alleged that these producers colluded to raise prices in the Brazilian rebar market, thereby violating applicable antitrust laws. In September 2005, CADE issued its final decision against ArcelorMittal Brasil, imposing a fine of 51. ArcelorMittal Brasil appealed the decision to the Brazilian Federal Court. In September 2006, ArcelorMittal Brasil offered a guarantee letter and obtained an injunction to suspend enforcement of this decision pending the court’s judgment. In September 2017, the Court found against ArcelorMittal Brasil. In October 2017, ArcelorMittal Brasil filed a motion for clarification of this decision, which was dismissed. In December 2017, ArcelorMittal Brasil filed an appeal to the second judicial instance.
There is also a related class action commenced by the Federal Public Prosecutor of the state of Minas Gerais against ArcelorMittal Brasil for damages in an amount of 55 based on the alleged violations investigated by CADE.
A further related lawsuit was commenced in February 2011 by four units of Sinduscons, a civil construction trade organization, in federal court in Brasilia against, inter alia, ArcelorMittal Brasil claiming damages based on an alleged cartel in the rebar market as investigated by CADE and as noted above.
Germany
In August 2017, the German Federal Cartel Office carried out unannounced investigations of ArcelorMittal Bremen, ArcelorMittal Eisenhüttenstadt GmbH and ArcelorMittal Berlin Holding GmbH principally relating to alleged breaches of antitrust rules concerning (i) an agreement between flat steel producers regarding extras from June 2006 - March 2016 (ii) impermissible exchanges of sensitive information between competitors from 1986 - 2016 and (iii) an agreement to continue market and price structures introduced by the European Coal and Steel Community from 2002-2016. In February 2020, the German Federal Cartel Office notified the companies of the formal closure of the investigation with no action being taken.
Spain
In November 2018, the Comision Nacional de los Mercados y la Competencia (“CNMC”), the Spanish competition authority, carried out a dawn raid at the offices of ArcelorMittal in Villaverde (Madrid) in relation to a preliminary investigation concerning alleged coordination between competitors to fix the purchase price of scrap. In March 2020, further dawn raids were carried out extending the investigation to the sale of long products. In July 2020, CNMC announced that they were commencing a formal sanctioning procedure against ArcelorMittal Spain Holding and its subsidiaries ArcelorMittal Madrid, ArcelorMittal Comercial Perfiles España and Arcelor Mittal España (and other companies not part of ArcelorMittal group) in respect of purchases of scrap and sale of finished steel products, especially long products. ArcelorMittal applied for access to the CNMC file and is reviewing the case in light of the elements obtained to date. At this time ArcelorMittal is unable to assess the outcome of the investigation or the amount of its potential liability (theoretically up to 10% of the entities’ turnover), if any.
Other Legal Claims
ArcelorMittal is a party to various other legal claims. As of December 31, 2020, ArcelorMittal had recorded provisions of 207 for other legal claims in respect of which it considers the risk of loss to be probable. Set out below is a summary description of the other legal claims (i) in respect of which ArcelorMittal had recorded a provision as of December 31, 2020, (ii) that constitute a contingent liability, (iii) that were resolved in 2020, or (iv) that were resolved and had a financial impact in 2019 or 2018, in each case involving amounts deemed material by ArcelorMittal. The Company is vigorously defending against each of the claims discussed below that remain pending.
Argentina
Over the course of 2007 to 2020, the Argentinian Customs Office Authority (“Aduana”) notified Acindar, of certain inquiries that it was conducting with respect to prices declared by Acindar related to iron ore imports. The Customs Office Authority was
| | |
Consolidated financial statements 263 |
| (millions of U.S. dollars, except share and per share data) |
seeking to determine whether Acindar incorrectly declared prices for iron ore imports from several different Brazilian and Bolivian suppliers and from ArcelorMittal Sourcing originally on 39 different claims concerning several shipments made between 2002 and 2014. The investigations are subject to the administrative procedures of the Customs Office Authority and are at different procedural stages depending on the filing date of the investigation. In March 2018, the Customs Office Authority issued a general instruction that ordered customs to withdraw current claims related to the difference between import prices in Argentina and export prices of iron ore when exiting Brazil, which has led to a reduction in the number of claims and amounts claimed against Acindar. As of January 2021, the aggregate amount claimed by the Customs Office Authority in respect of all iron ore shipments is 103 in 22 different cases. Of these 22 cases, 7 are still in the administrative branch of the Customs Office Authority and the other 15 cases, in which the administrative branch of the Customs Office Authority ruled against Acindar, have been appealed to the Argentinian National Fiscal Court.
Brazil
In 2015, the SINDIMETAL (employees’ union) filed a lawsuit against ArcelorMittal Brasil to annul all the collective labor agreements related to 12-hour work shifts. In 2018, at the Labor Court of Vitória/ES, the case was dismissed. SINDIMETAL subsequently appealed to the Regional Labor Court of Appeals, which in 2019 reversed the ruling of the first judicial instance and ordered the payment of overtime wages, based on the argument that the 12-hour working day was unconstitutional. In September 2019, ArcelorMittal Brasil filed an appeal with the Superior Labor Court on the grounds of (i) the constitutionality of collective labor agreements; (ii) ArcelorMittal Brasil was obliged to maintain the 12-hour work shift in the period between November 2011 and November 2012 by another judicial decision; and (iii) the Supreme Court has ordered the suspension of legal proceedings in which there is a discussion about the validity of collective labor agreements due to a pending decision in a case not involving ArcelorMittal Brasil with binding precedential value on similar cases. This decision impacts a group of approximately 2,500 employees.
In April 2017, a shareholder in Siderúrgica Três Lagoas (“SITREL”), commenced an arbitration against Votorantim Siderurgia S.A. (which subsequently merged into ArcelorMittal Brasil) and SITREL with the Center for Arbitration and Mediation of the Chamber of Commerce Brazil-Canada (CAM-CCBC). The dispute concerns a provision in SITREL’s joint venture agreement relating to the formula used to determine the selling price for steel billets supplied by ArcelorMittal Brasil to SITREL from January 2013 onwards. The shareholder has alleged that the steel billets were overpriced and is seeking compensation for overpaid amounts on both a retrospective and prospective
basis, with the initial amount claimed totaling 33. The case is currently at a pre-hearing stage, where evidence is being collected. In November 2019, an expert report on accounting questions was presented and in November 2020 an expert report concerning economic questions was presented.
Canada
In April 2011, a proceeding was commenced before the Ontario (Canada) Superior Court of Justice under the Ontario Class Proceedings Act, 1992, against ArcelorMittal, Baffinland, and certain other parties relating to the January 2011 take-over of Baffinland by ArcelorMittal, Nunavut Iron Ore Holdings and 1843208 Ontario Inc. The action alleges that the tender offer document contained certain misrepresentations and seeks damages in an aggregate amount of 764 (CAD 1 billion) or rescission of the transfer of the Baffinland securities by members of a class comprised of all Baffinland securities holders who tendered their Baffinland securities, and whose securities were taken up, in connection with the take-over between September 22, 2010 and February 17, 2011, or otherwise disposed of their Baffinland securities on or after January 14, 2011. The class certification hearings were held in January 2018, and the court certified the class in a decision dated May 18, 2018. The court also certified the statutory circular misrepresentation, insider trading, unjust enrichment and oppression claims. The court included in the class persons who tendered their Baffinland securities to the take-over bid and, for purposes of the oppression claims only, persons who sold their Baffinland securities in the secondary market after January 13, 2011. The court excluded from the class those persons who disposed of their Baffinland securities pursuant to a court ordered plan of arrangement. In June 2019, the parties entered into a settlement agreement in which the defendants agreed to pay 5 (CAD 6.5 million) to the class subject to the approval of the court. The settlement contained a threshold for opt outs which, if exceeded, gave any of the defendants the right to terminate the settlement. The settlement was approved by the Ontario Court in September 2019 and, following the expiry of the period for any appeal, is now final.
Italy
In January 2010, ArcelorMittal received notice of a claim filed by Finmasi S.p.A. relating to a memorandum of agreement (“MoA”) entered into between ArcelorMittal Distribution Services France (“AMDSF”) and Finmasi in 2008. The MoA provided that AMDSF would acquire certain of Finmasi’s businesses for an amount not to exceed 114, subject to the satisfaction of certain conditions precedent, which, in AMDSF’s view, were not fulfilled. Finmasi sued for (i) enforcement of the MoA, (ii) damages of 17 to 29 or (iii) recovery costs plus quantum damages for Finmasi’s alleged lost opportunity to sell to another buyer. In September 2011, the court rejected Finmasi’s claims other than its second claim. The court appointed an expert to determine the quantum of
| | |
264 Consolidated financial statements |
damages. In May 2013, the expert’s report was issued and valued the quantum of damages in the range of 46 to 73. ArcelorMittal appealed the decision on the merits. In May 2014, the Court of Appeal issued a decision rejecting ArcelorMittal’s appeal. On June 20, 2014, ArcelorMittal filed an appeal of the Court of Appeal’s judgment with the Italian Court of Cassation. On April 11, 2018, the Court of Cassation rejected the appeal on the merits and upheld the Court of Appeal’s decision. On December 18, 2014, the Court of Milan issued a decision on the quantum of the damages and valued the quantum of damages in the sum of 29 plus interest. In June 2015, both parties served appeals of the decision on the quantum, with ArcelorMittal also seeking the suspension of the enforceability of the decision. On July 1, 2015, Finmasi formally notified AMDSF the declaration of enforcement of the decision of December 18, 2014. On July 28, 2015, AMDSF filed an appeal against such declaration with the Court of Appeal of Reims in France. At a hearing on December 1, 2015, the Italian Court of Appeal accepted the suspension of the enforcement of the decision of December 18, 2014, following the agreement of AMDSF to provide a guarantee for its value. In March 2016, on the joint application of the parties, the Court of Appeal of Reims ordered the suspension of the proceedings. On July 19, 2018, the Court of Appeal upheld the Court of Milan’s decision on quantum dated December 18, 2014. In September 2018, ArcelorMittal filed an appeal to the Court of Cassation. In January 2019, Finmasi called on the AMDSF guarantee issued in the context of the enforcement proceedings that were suspended in 2015. In August 2020, the Court of Cassation quashed the Court of Appeal decision on quantum and referred the case back to the Court of Appeal for further review of the quantum in respect of which Finmasi formally served their writ of summons in October 2020 asking the Court of Appel to confirm the first instance judgment on quantum. Following the decision of the Court of Cassation, Finmasi has repaid half of the amount of the guarantee that was called and has agreed to provide a bank guarantee for the remainder.
On November 4, 2019, ArcelorMittal sent to the Commissioners governing the Ilva insolvency procedure (the “Commissioners”) a notice to withdraw from or terminate the lease agreement with a conditional obligation to purchase the business of Ilva and certain of its subsidiaries. This notice was based, among other things, on provisions of the agreement that allow withdrawal in the event that a new law affects it’s environmental plan for the Taranto plant in such a way that materially impairs the ability of ArcelorMittal Italia to operate the plant or implement its industrial plan; these provisions were triggered following the Italian Parliament’s removal, on November 3, 2019, of the legal protection necessary for ArcelorMittal Italia to implement its environmental plan without risk of criminal liability. In response, the Commissioners filed suit in Milan seeking an injunction to prevent ArcelorMittal's withdrawal and termination of the
agreement. Following negotiation between the parties, on March 4, 2020, ArcelorMittal and the Commissioners entered into a settlement agreement whereby ArcelorMittal agreed to revoke its notice to withdraw from the original Ilva lease agreement and the Ilva Commissioners agreed to withdraw their request for an injunction.
In addition, following a complaint filed by the Commissioners, in mid-November 2019, prosecutors in Milan and Taranto opened investigations into potential violations of numerous criminal laws. Following the (i) search decrees issued by the Milan and Taranto Prosecution Offices and ensuing seizures of documents in November 2019, and (ii) restitution decree issued by the Milan Prosecution Office in September 2020, ArcelorMittal Italia has not been notified of further developments in the criminal investigations and is therefore not in a position to assess its potential liability, if any.
In February 2020, the Mayor of Taranto issued an order to ArcelorMittal Italia related to certain emissions events that appear to have occurred in August 2019 and on February 22 and 23, 2020 and that allegedly concern the Taranto plant. The order required ArcelorMittal Italia to identify the responsible installations in 30 days and eliminate any anomalies within the subsequent 30 days or, if necessary, shut down certain installations relating to such emissions events (provided that, if no such identification was completed, the shut down would extend to substantially the entire "hot area" of the plant). The Mayor of Taranto further alleged that adequate responses concerning such emissions were not received from the Ministry of the Environment. In response to this order, ArcelorMittal Italia filed an appeal on the merits and an application for interim measures to stay the order with the Regional Administrative Court in Lecce. In April 2020, the court upheld ArcelorMittal Italia’s application for interim measures and suspended the Mayor of Taranto’s order until a further hearing in October 2020. The interim order further required the Ministry of the Environment to file reports concerning the emissions events which served as the basis for the Mayor of Taranto’s order. After the Ministry provided such reports, the October 2020 hearing was postponed until December 15, 2020, at which hearing the Court confirmed the suspension of the order and scheduled the hearing for the discussion of the merits for January 27, 2021. On February 13, 2021, the Court rejected ArcelorMittal Italia’s appeal. On February 18, 2021, ArcelorMittal Italia filed an appeal with the State Council (the highest appellate body in this case) on the merits and also requested an ex parte order to suspend the judgment pending a ruling on the merits. On February 19, 2021, the State Council (i) found that the 30-day period during which ArcelorMittal Italia would have to shut down installations has not yet started and would commence only on March 16, 2021, i.e., after the hearing to discuss the request for interim measures (which it set for March 11, 2021) and therefore
| | |
Consolidated financial statements 265 |
| (millions of U.S. dollars, except share and per share data) |
found a lack at the time of demonstrable “extreme gravity and urgency” necessary for interim measures, and (ii) set a hearing date of May 13, 2021 in respect of the merits.
Luxembourg
In June 2012, the Company received writs of summons in respect of claims made by 59 former employees of ArcelorMittal Luxembourg. The claimants allege that they are owed compensation based on the complementary pension scheme that went into effect in Luxembourg in January 2000. The aggregate amount claimed by such former employees (bearing in mind that other former employees may bring similar claims) is 72. Given the similarities in the claims, the parties agreed to limit the pending proceedings to four test claims. In April 2013, the Esch-sur-Alzette labor court rejected two of these test claims. The relevant plaintiffs are appealing these decisions. In November 2013, the Luxembourg city labor court rejected the two other test claims, which are also being appealed.
France
Certain subsidiaries of the ArcelorMittal group are parties to proceedings, dating from 2010, against Engie and Engie Thermique France which claim damages in the amount of 187 for an alleged wrongful termination of a contract for the transformation of steel production gas into electricity. The ArcelorMittal subsidiaries have filed a counterclaim in the amount of 232. The contract had been entered into in 2006 for a term of 20 years. ArcelorMittal Méditerranée terminated it in July 2010 on the basis that Engie was solely responsible for the delay in the commissioning of the power plant (which suffered from significant malfunctions) constructed for the transformation of steel production gas into electricity. Engie claims that ArcelorMittal was in breach of the contract at the time of the termination due to certain alleged issues with the furnishing and quality of its steel production gas, and therefore unable to terminate the contract based on the sole breaches of Engie. The case was heard before the Commercial Court of Nanterre. In November 2019, the Appeals Court of Versailles determined (having been asked to decide whether a decision by the Commercial Court of Nanterre was in fact an official, formal judgment) that the earlier decision of the Commercial Court of Nanterre was the official first instance decision of the court. As a result, ArcelorMittal was ordered to pay damages of 3 plus interest. In February 2020, Engie filed an appeal.
Retired and current employees of certain French subsidiaries of the former Arcelor have initiated lawsuits to obtain compensation for asbestos exposure in excess of the amounts paid by French social security (“Social Security”). Asbestos claims in France initially are made by way of a declaration of a work-related illness by the claimant to the Social Security authorities resulting in an investigation and a level of compensation paid by Social Security. Once the Social Security authorities recognize the work-related illness, the claimant,
depending on the circumstances, can also file an action for inexcusable negligence (faute inexcusable) to obtain additional compensation from the company before a special tribunal. Where procedural errors are made by Social Security, it is required to assume full payment of damages awarded to the claimants. Due to fewer procedural errors made by Social Security, changes in the regulations and, consequently, fewer rejected cases, ArcelorMittal has been required to pay some amounts in damages since 2011.
The number of claims outstanding for asbestos exposure at December 31, 2020 was 324 as compared to 337 at December 31, 2019. The range of amounts claimed for the year ended December 31, 2020 was $35,000 to $745,000. The aggregate costs and settlements for the year ended December 31, 2020 were 4.79, of which 0.2 represented legal fees and 4.59 represented damages paid to the claimant. The aggregate costs and settlements for the year ended December 31, 2019 were 7.77, of which 0.15 represented legal fees and 7.6 represented damages paid to the claimant.
Minority Shareholder Claims Regarding the Exchange Ratio in the Second-Step Merger of ArcelorMittal into Arcelor
ArcelorMittal is the company that results from the acquisition of Arcelor by Mittal Steel N.V. in 2006 and a subsequent two-step merger between Mittal Steel and ArcelorMittal and then ArcelorMittal and Arcelor. Following completion of this merger process, several former minority shareholders of Arcelor or their representatives brought legal proceedings regarding the exchange ratio applied in the second-step merger between ArcelorMittal and Arcelor and the merger process as a whole.
ArcelorMittal believes that the allegations made and claims brought by such minority shareholders are without merit and that the exchange ratio and merger process complied with the requirements of applicable law, were consistent with previous guidance on the principles that would be used to determine the exchange ratio in the second-step merger and that the merger exchange ratio was relevant and reasonable to shareholders of both merged entities.
Set out below is a summary of ongoing matters in this regard. Several other claims brought before other courts and regulators were dismissed and are definitively closed.
On January 8, 2008, ArcelorMittal received a writ of summons on behalf of four hedge fund shareholders of Arcelor to appear before the civil court of Luxembourg. The summons was also served on all natural persons sitting on the Board of Directors of ArcelorMittal at the time of the merger and on the Significant Shareholder. The plaintiffs alleged in particular that, based on Mittal Steel’s and Arcelor’s disclosure and public statements, investors had a legitimate expectation that the exchange ratio in the second-step merger would be the same as that of the
| | |
266 Consolidated financial statements |
secondary exchange offer component of Mittal Steel’s June 2006 tender offer for Arcelor (i.e., 11 Mittal Steel shares for 7 Arcelor shares), and that the second-step merger did not comply with certain provisions of Luxembourg company law. They claimed, inter alia, the cancellation of certain resolutions (of the Board of Directors and of the Shareholders meeting) in connection with the merger, the grant of additional shares, or damages in an amount of 221. By judgment dated November 30, 2011, the Luxembourg civil court declared all of the plaintiffs’ claims inadmissible and dismissed them. The judgment was appealed in May 2012. By judgment dated February 15, 2017, the Luxembourg Court of Appeal declared all but one of the plaintiffs’ claims inadmissible, remanded the proceedings on the merits to the lower court with respect to the admissible claimant and dismissed all other claims. In June 2017, the plaintiffs filed an appeal of this decision to the Court of Cassation. The Court of Cassation confirmed the Court of Appeal’s judgment on May 18, 2018. The proceedings remain pending before the lower court with the admissible claimant who claims inter alia, the cancellation of certain resolutions (of the Board of Directors and of the Shareholders meeting) in connection with the merger, the grant of additional shares, or damages in an amount of 27.
On May 15, 2012, ArcelorMittal received a writ of summons on behalf of Association Actionnaires d'Arcelor (“AAA”), a French association of former minority shareholders of Arcelor, to appear before the civil court of Paris. In such writ of summons, AAA claimed (on grounds similar to those in the Luxembourg proceedings summarized above) inter alia damages in a nominal amount and reserved the right to seek additional remedies including the cancellation of the merger. The proceedings before the civil court of Paris have been stayed, pursuant to a ruling of such court on July 4, 2013, pending a preparatory investigation (instruction préparatoire) by a criminal judge magistrate (juge d’instruction) triggered by the complaints (plainte avec constitution de partie civile) of AAA and several hedge funds (who quantified their total alleged damages at 282), including those who filed the claims before the Luxembourg courts described (and quantified) above. The dismissal of charges (non-lieu) ending the preparatory investigation became final in March 2018. On March 6, 2020 AAA revived its claim before the civil court of Paris on grounds similar to those of the Luxembourg civil claims summarized above, on its behalf and on behalf of the hedge funds who had also filed a criminal complaint, as well as two new plaintiffs. The complaint filed by AAA quantifies the total damages claimed at 479 (€390 million) (including the claims before the Luxembourg courts described above).
9.4 Commitments
| | | | | | | | | | | |
| December 31, |
| 2020 | | 2019 |
| Purchase commitments | 13,047 | | | 19,697 | |
| Guarantees, pledges and other collateral | 8,632 | | | 7,815 | |
| | | |
| Capital expenditure commitments | 354 | | | 448 | |
| Other commitments | 3,143 | | | 3,201 | |
| Total | 25,176 | | | 31,161 | |
Purchase commitments
Purchase commitments consist primarily of major agreements for procuring iron ore, coking coal, coke and hot metal. The Company also has a number of agreements for electricity, industrial and natural gas, scrap and freight. In addition to those purchase commitments disclosed above, the Company enters into purchasing contracts as part of its normal operations which have minimum volume requirements but for which there are no take-or-pay or penalty clauses included in the contract. The Company does not believe these contracts have an adverse effect on its liquidity position.
The decrease in purchase commitments in 2020 mainly included the derecognition of purchase commitments of ArcelorMittal USA (7,807 as of December 31, 2019) following its disposal (see note 2.3.1). Purchase commitments included commitments given to associates for 1,276 and 592 as of December 31, 2020 and 2019, respectively. The increase in purchase commitments given to associates mainly included 561 related to the gas supply agreement signed in 2020 with Kryvyi Rih Industrial Gas. Purchase commitments included commitments given to joint ventures for 1,570 and 1,521 as of December 31, 2020 and 2019, respectively. Purchase commitments given to joint ventures included 737 and 852 related to Tameh and 604 and 649 related to Enerfos as of December 31, 2020 and 2019, respectively.
Guarantees, pledges and other collateral
Guarantees related to financial debt and credit lines given on behalf of third parties were 150 and 158 as of December 31, 2020 and 2019, respectively. Additionally, guarantees of 4,477 and 3,836 were given on behalf of joint ventures as of December 31, 2020 and 2019, respectively.
Guarantees given on behalf of joint ventures included 226 and 288 for the guarantees issued on behalf of Calvert, 347 and 346 for the guarantees issued on behalf of ArcelorMittal Tubular Products Al Jubail ("Al Jubail") and 242 and 232 (net of 50% counter guarantee from Prime Shipping Investments Limited, an affiliate of DryLog) in relation to outstanding lease liabilities for vessels operated by Global Chartering as of December 31, 2020 and 2019, respectively. Guarantees given on behalf of joint ventures also included 3,088 as of December 31, 2020 corresponding to ArcelorMittal's 60% guarantee of the 5.146 billion ten-year term loan agreement entered into by the AMNS
| | |
Consolidated financial statements 267 |
| (millions of U.S. dollars, except share and per share data) |
India joint venture with various Japanese banks on March 17, 2020. The guarantee of 2,571 given by the Company as of December 31, 2019 under the 7 billion bridge term facilities agreement in connection with the acquisition of AMNS India expired on March 27, 2020 (see note 6.1.2).
Due to the failure of other shareholders to provide requisite equity funding by December 31, 2018, the Company's joint venture Al Jubail's indebtedness became technically in default as of such date. As of December 31, 2020, this technical default was cured.
As of December 31, 2020, pledges and other collateral mainly relate to (i) mortgages entered into by the Company’s operating subsidiaries and (ii) inventories and receivables pledged to secure the South African Rand revolving borrowing base finance facility for the amount drawn of 168 and ceded bank accounts to secure environmental obligations, true sale of receivables programs and the revolving borrowing base finance facility in South Africa of 103. Pledges of property, plant and equipment were 136 and 155 as of December 31, 2020 and 2019, respectively. Other sureties, first demand guarantees, letters of credit, pledges and other collateral included 407 and 356 of commitments given on behalf of associates as of December 31, 2020 and 2019, respectively and 173 and 293 of commitments given on behalf of joint ventures as of December 31, 2020 and 2019, respectively.
Other sureties, first demand guarantees, letters of credit, pledges and other collateral included 504 as of December 31, 2019 in relation to the Company's share of the obligation to deliver the follow-on funding for AMNS India in accordance with the second amended joint venture formation agreement. Following the completion of the equity funding of AMNS India on February 13, 2020, the guarantee extinguished. In addition, other sureties, first demand guarantees, letters of credit, pledges and other collateral included 260 with respect to a pledged cash collateral provided by the Company until collection of the TSR receivables retained in ArcelorMittal USA after disposal (see note 6.1.3).
Capital expenditure commitments
Capital expenditure commitments mainly relate to commitments associated with investments in expansion and improvement projects by various subsidiaries.
In 2016, AMSA committed to an investment program in connection with the competition commission settlement. The remaining capital expenditure commitment was 126 and 139 as of December 31, 2020 and 2019, respectively.
Capital expenditure commitments also included 196 and 250 as of December 31, 2020 and 2019, respectively, for the 1 billion investment program at the Company's Mexican operations,
which is focused on building ArcelorMittal Mexico’s downstream capabilities. The main investment will be the construction of a new hot strip mill with capacity of approximately 2.5 million tonnes.
Other commitments
Other commitments given comprise mainly commitments incurred for gas supply to electricity suppliers.
As of September 21, 2018 an Environmental Commitment Agreement ("ECA") has been executed between ArcelorMittal Brasil, local government and the Brazilian environmental authorities. ArcelorMittal Brasil committed to carry out, over the next 5 years, a series of environmental operational and capital investments with the aim to reduce atmospheric emissions from the Company's Tubarão site. To comply with the ECA requirements, ArcelorMittal Brasil may need to acquire new equipment and change some of its current operating methods and processes. As of December 31, 2020, ArcelorMittal Brasil estimated the underlying costs to implement those investments at 49. The non-compliance with ECA would lead to fines amounting to a maximum of 19 and 26 as of December 31, 2020 and 2019, respectively.
As of December 31, 2020, capital expenditure commitments relating to ArcelorMittal Italia included 1,357 industrial capital expenditure commitments over a remaining five-year period focused on blast furnaces, steel shops and finishing lines (1,311 as of December 31, 2019) and 583 environmental capital expenditure commitments (688 as of December 31, 2019).
Commitments to sell
In addition to the commitments presented above, the Company has firm commitments to sell for which it also has firm commitments to purchase included in purchase commitments for 211 and 215 as of December 31, 2020 and 2019, respectively, and mainly related to natural gas and electricity.
NOTE 10: INCOME TAXES
The current tax payable (recoverable) is based on taxable profit (loss) for the year. Taxable profit differs from profit as reported in the consolidated statements of operations because it excludes items of income or expense that are taxable or deductible in other years or are never taxable or deductible. The Company’s current income tax expense (benefit) is calculated using tax rates that have been enacted or substantively enacted as of the date of the consolidated statements of financial position.
Tax is charged or credited to the consolidated statements of operations, except when it relates to items charged or credited to other comprehensive income or directly to equity, in which case the tax is recognized in other comprehensive income or in equity.
| | |
268 Consolidated financial statements |
Deferred tax is recognized on differences between the carrying amounts of assets and liabilities, in the consolidated financial statements and the corresponding tax basis used in the computation of taxable profit, and is accounted for using the statements of financial position liability method. Deferred tax liabilities are generally recognized for all taxable temporary differences, and deferred tax assets are generally recognized for all deductible temporary differences and net operating loss carry forwards to the extent that it is probable that taxable profits will be available against which those deductible temporary differences can be utilized. Such assets and liabilities are not recognized if the taxable temporary difference arises from the initial recognition of non-deductible goodwill or if the differences arise from the initial recognition (other than in a business combination) of other assets and liabilities in a transaction that affects neither the taxable profit nor the profit reported in the consolidated statements of operations.
Deferred tax liabilities are recognized for taxable temporary differences associated with investments in subsidiaries, associates and joint ventures, except if the Company is able to control the reversal of the temporary difference and it is probable that the temporary difference will not reverse in the foreseeable future. Deferred tax assets arising from deductible temporary differences associated with such investments are only recognized to the extent that it is probable that there will be sufficient taxable profits against which the benefits of the temporary differences can be utilized and are expected to reverse in the foreseeable future.
Deferred tax assets and liabilities are measured at the tax rates that are expected to apply in the period in which the liability is settled or the asset realized, based on tax rates (and tax laws) that have been enacted or substantively enacted at the consolidated statements of financial position date. The measurement of deferred tax assets and liabilities reflects the tax consequences that would result from the manner in which the Company expects, at the reporting date, to recover or settle the carrying amount of its assets and liabilities.
The carrying amount of deferred tax assets is reviewed at each consolidated statements of financial position date and reduced to the extent that it is no longer probable that sufficient taxable profits will be available to enable all or part of the asset to be recovered. The Company reviews the deferred tax assets in the different jurisdictions in which it operates to assess the possibility of realizing such assets based on projected taxable profit, the expected timing of the reversals of existing temporary differences, the carry forward period of temporary differences and tax losses carried forward and the implementation of planning strategies. Due to the numerous variables associated with these judgments and assumptions, both the precision and reliability of the resulting estimates of the deferred tax assets are subject to substantial uncertainties. In case a history of
recent losses is present, the Company considers whether convincing other evidence exists, such as the character of (historical) losses and planning opportunities, to support the deferred tax assets recognition.
Deferred tax assets and liabilities are offset when there is a legally enforceable right to set off current tax assets against current tax liabilities, when they relate to income taxes levied by the same taxation authority and when the Company intends to settle its current tax assets and liabilities on a net basis.
Uncertain (income) tax positions are periodically assessed by the Company based on management’s best judgment given any changes in the facts, circumstances and information available and applicable tax laws. When it is probable that the tax authorities will not accept the position taken, the Group establishes provisions based on the most likely amount of the liability (recovery) or weighted average of various possible outcomes to reflect the effect of the uncertainty in determining the related taxable profit (tax loss), tax bases, unused tax losses, unused tax credits or tax rates, to the extent that a reliable estimate can be made.
10.1 Income tax expense (benefit)
The components of income tax expense (benefit) are summarized as follows:
| | | | | | | | | | | | | | | | | |
| | Year ended December 31, |
| | 2020 | | 2019 | | 2018 |
| | | | | |
| | | | | |
| | | | | |
| Total current tax expense | 839 | | | 786 | | | 928 | |
| | | | | |
| | | | | |
| | | | | |
| | | | | |
| Total deferred tax expense (benefit) | 827 | | | (327) | | | (1,277) | |
| Total income tax expense (benefit) | 1,666 | | | 459 | | | (349) | |
The following table reconciles the expected tax expense (benefit) at the statutory rates applicable in the countries where the Company operates to the total income tax expense (benefit) as calculated:
| | |
Consolidated financial statements 269 |
| (millions of U.S. dollars, except share and per share data) |
| | | | | | | | | | | | | | | | | |
| | Year ended December 31, |
| | 2020 | | 2019 | | 2018 |
| Net (loss) income (including non-controlling interests) | (578) | | | (2,391) | | | 5,330 | |
| Income tax expense (benefit) | 1,666 | | | 459 | | | (349) | |
| Income (loss) before tax | 1,088 | | | (1,932) | | | 4,981 | |
Tax expense (benefit) at the statutory rates applicable to profits (losses) in the countries1 | 136 | | | (468) | | | 1,043 | |
| Permanent items | 714 | | | (993) | | | (421) | |
| Rate changes | — | | | 340 | | | — | |
| Net change in measurement of deferred tax assets | 454 | | | 1,201 | | | (1,301) | |
| Tax effects of foreign currency translation | 41 | | | 14 | | | (47) | |
| Tax credits | (13) | | | (9) | | | (17) | |
| Other taxes | 267 | | | 160 | | | 151 | |
| Others | 67 | | | 214 | | | 243 | |
| Income tax expense (benefit) | 1,666 | | | 459 | | | (349) | |
1.Tax expense (benefit) at the statutory rates is based on income (loss) before tax excluding income (loss) from investments in associates and joint ventures.
ArcelorMittal’s consolidated income tax expense (benefit) is affected by the income tax laws and regulations in effect in the various countries in which it operates and the pre-tax results of its subsidiaries in each of these countries, which can change from year to year. ArcelorMittal operates in jurisdictions, mainly in Eastern Europe and Asia, which have a structurally lower corporate income tax rate than the statutory tax rate as enacted in Luxembourg (24.94%), as well as in jurisdictions, mainly in Brazil and Mexico, which have a structurally higher corporate income tax rate.
| | | | | | | | | | | | | | | | | |
| Permanent items | Year ended December 31, |
| 2020 | | 2019 | | 2018 |
| Taxable reversals of (tax deductible) write-downs on shares and receivables | 630 | | | (922) | | | (498) | |
| Juros sobre o Capital Próprio | (37) | | | (32) | | | (73) | |
| Non taxable gain on bargain purchase | — | | | — | | | (60) | |
| Taxable income (tax loss) of AMTFS | — | | | (8) | | | 47 | |
| Other permanent items | 121 | | | (31) | | | 163 | |
| Total permanent items | 714 | | | (993) | | | (421) | |
Taxable reversals of (tax deductible) write-downs on shares and receivables: in connection with the Company's impairment test for goodwill and property, plant and equipment, the recoverability of the carrying amounts of investments in shares and intragroup receivables is also reviewed annually, resulting in tax deductible write-downs, or taxable reversals of previously
recorded write-downs, of the values of loans and shares of consolidated subsidiaries in Luxembourg.
Juros sobre o Capital Próprio: Corporate taxpayers in Brazil, which distribute a dividend can benefit from a tax deduction corresponding to an amount of interest calculated as a yield on capital. The deduction is determined as the lower of the interest as calculated by application of the Brazilian long term interest rate on the opening balance of capital and reserves, and 50% of the income for the year or accumulated profits from the previous year. For accounting purposes, this distribution of interest on capital is regarded as a dividend distribution, while for Brazilian tax purposes it is regarded as tax deductible interest.
Non taxable gain on bargain purchase: in 2018, ArcelorMittal recognized a 209 gain on bargain purchase upon acquisition of ArcelorMittal Italia (see note 2.2.4).
Taxable income of AMTFS: ArcelorMittal Treasury Financial Services S.à r.l. (“AMTFS”), a limited liability company organized under the laws of Luxembourg subject to taxation in Luxembourg on its worldwide income, was a subsidiary of ArcelorMittal Treasury Americas LLC until a transfer to ArcelorMittal S.A in December 2019. Prior to the transfer, AMTFS was also subject to United States federal income tax as a disregarded entity.
Rate changes
The 2019 tax expense from rate changes of 340 is mainly due to the impact of the decrease in the future income tax rate on deferred tax assets in Luxembourg.
Net change in measurement of deferred tax assets
The 2020 net change in measurement of deferred tax assets of 454 mainly consists of derecognition and utilization of deferred tax assets in Luxembourg of 709 following lower income expectation mainly as a result of the disposal of ArcelorMittal USA, recognition of deferred tax assets on current year taxable reversal of write-downs of the value of shares and receivables of consolidated subsidiaries in Luxembourg (630), and 375 net non-recognition and derecognition of deferred tax assets on losses and temporary differences in other tax jurisdictions.
The 2019 net change in measurement of deferred tax assets of 1,201 mainly consists of non-recognition of deferred tax assets on write-downs of the value of shares of consolidated subsidiaries in Luxembourg and other non-recognition and derecognition of deferred tax assets in certain tax jurisdictions, partially offset by an additional recognition of deferred tax assets of previous years of 0.6 billion due to increase in projections of future taxable income in Luxembourg driven primarily by the lower external borrowing costs.
The 2018 net change in measurement of deferred tax assets of (1,301) primarily consists of tax benefit of (1,842) due to
| | |
270 Consolidated financial statements |
additional recognition of deferred tax assets for losses and other deductible temporary differences of previous years, and a tax expense of 541 due to non-recognition and derecognition of other deferred tax assets in other tax jurisdictions. In 2018, the Company recognized 1.3 billion of previously unrecognized deferred tax assets relating to the ArcelorMittal S.A. tax integration in Luxembourg. The recognition in Luxembourg includes a 0.8 billion increase in projections of future taxable income in Luxembourg driven primarily by the higher operational and financial income, and 0.6 billion effect of the elimination of the current USD exposure of Luxembourgish deferred tax assets denominated in euro.
Tax effects of foreign currency translation
The tax effects of foreign currency translation of 41, 14 and (47) at December 31, 2020, 2019 and 2018 respectively, refer mainly to deferred tax assets and liabilities of certain entities with a different functional currency than the currency applied for tax filing purposes. The 2018 effect is impacted by the elimination of the currency exposure on the deferred tax assets in ArcelorMittal parent company following the change in the currency denomination of the tax losses.
Tax credits
The tax credits are mainly attributable to the Company’s operating subsidiaries in Brazil. They relate to credits claimed on foreign investments, credits for research and development and other credits.
Other taxes
Other taxes mainly include withholding taxes on dividends, services, royalties and interests as well as mining duties in Canada and Mexico, state tax and Base Erosion and Anti-Abuse Tax ("BEAT") in the United States, and Cotisation sur la Valeur Ajoutée des Entreprises ("CVAE'') in France.
| | | | | | | | | | | | | | | | | |
| Others | Year ended December 31, |
| 2020 | | 2019 | | 2018 |
| Tax contingencies/settlements | 87 | | | 225 | | | 183 | |
| Prior period taxes | (15) | | | (20) | | | 21 | |
| Others | (5) | | | 9 | | | 39 | |
| Total | 67 | | | 214 | | | 243 | |
In 2020 and 2019, tax contingencies/settlements consist of uncertain tax positions (see note 10.3) respectively for 87 and 225, mainly related to North America and ACIS. The 2018 tax contingencies/settlements consist of uncertain tax positions mainly related to Europe.
10.2 Income tax recorded directly in equity and/or other comprehensive income
| | | | | | | | | | | | | | | | | | | | |
| | | Year ended December 31, |
| | | 2020 | | 2019 | | 2018 |
| Recognized in other comprehensive income on: | | | | | | |
| | | | | | |
| Deferred tax expense (benefit) | | | | | | |
| Unrealized gain (loss) on investments in equity instruments at FVOCI | | 56 | | | — | | | — | |
| (Loss) gain on derivative financial instruments | | (28) | | | (244) | | | 380 | |
| Recognized actuarial (loss) gain | | (69) | | | 32 | | | (228) | |
| Foreign currency translation adjustments | | (335) | | | (35) | | | (106) | |
| | (376) | | | (247) | | | 46 | |
| Recognized directly in equity on: | | | | | | |
| Current tax expense (benefit) | | | | | | |
| Realized gain (loss) on investments in equity instruments at FVOCI | | 4 | | — | | | — | |
| Deferred tax expense (benefit) | | | | | | |
| Realized gain (loss) on investments in equity instruments at FVOCI | | 9 | | | — | | | — | |
| | 13 | | | — | | | — | |
| | | | | | | |
| Total | | (363) | | | (247) | | | 46 | |
10.3 Uncertain tax positions
The Company operates in multiple jurisdictions with complex legal and tax regulatory environments. In certain of these jurisdictions, ArcelorMittal has taken income tax positions that management believes are supportable and are intended to withstand challenge by tax authorities. Some of these positions are inherently uncertain and include those relating to transfer pricing matters and the interpretation of income tax laws applied in complex transactions. The Company periodically reassesses its tax positions. Changes to the financial statement recognition, measurement and disclosure of tax positions are based on management’s best judgment given any changes in the facts, circumstances, information available and applicable tax laws. Considering all available information and the history of resolving income tax uncertainties, the Company believes that the ultimate resolution of such matters will not have a material effect on the Company’s financial position, statements of operations or cash flows (see note 9).
| | |
Consolidated financial statements 271 |
| (millions of U.S. dollars, except share and per share data) |
10.4 Deferred tax assets and liabilities
The origin of the deferred tax assets and liabilities is as follows:
| | | | | | | | | | | | | | | | | | | | | | | | | | | | | | | | | | | |
| Assets | | Liabilities | | Net |
| 2020 | | 2019 | | 2020 | | 2019 | | 2020 | | 2019 |
| Intangible assets | 15 | | | 22 | | | (538) | | | (720) | | | (523) | | | (698) | |
| Property, plant and equipment | 73 | | | 177 | | | (4,064) | | | (4,445) | | | (3,991) | | | (4,268) | |
| Inventories | 277 | | | 261 | | | (77) | | | (209) | | | 200 | | | 52 | |
| Financial instruments | 13 | | | 47 | | | (124) | | | (98) | | | (111) | | | (51) | |
| Other assets | 162 | | | 157 | | | (306) | | | (408) | | | (144) | | | (251) | |
| Provisions | 1,240 | | | 1,350 | | | (276) | | | (243) | | | 964 | | | 1,107 | |
| Other liabilities | 458 | | | 469 | | | (120) | | | (70) | | | 338 | | | 399 | |
| Tax losses and other tax benefits carried forward | 9,168 | | | 9,984 | | | — | | | — | | | 9,168 | | | 9,984 | |
| Tax credits carried forward | 133 | | | 76 | | | — | | | — | | | 133 | | | 76 | |
| Untaxed reserves | — | | | — | | | — | | | (1) | | | — | | | (1) | |
| Deferred tax assets / (liabilities) | 11,539 | | | 12,543 | | | (5,505) | | | (6,194) | | | 6,034 | | | 6,349 | |
| Deferred tax assets | | | | | | | | | 7,866 | | | 8,680 | |
| Deferred tax liabilities | | | | | | | | | (1,832) | | | (2,331) | |
The deferred tax assets recognized by the Company as of December 31, 2020 are analyzed as follows:
| | | | | | | | | | | | | | | | | | | | | | | |
| Gross amount | | Total deferred tax assets | | Recognized deferred tax assets | | Unrecognized deferred tax assets |
| Tax losses and other tax benefits carried forward | 114,266 | | | 28,554 | | | 9,168 | | | 19,386 | |
| Tax credits carried forward | 745 | | | 745 | | | 133 | | | 612 | |
| Other temporary differences | 12,029 | | | 3,072 | | | 2,238 | | | 834 | |
| Total | | | 32,371 | | | 11,539 | | | 20,832 | |
The deferred tax assets recognized by the Company as of December 31, 2019 are analyzed as follows:
| | | | | | | | | | | | | | | | | | | | | | | |
| Gross amount | | Total deferred tax assets | | Recognized deferred tax assets | | Unrecognized deferred tax assets |
| Tax losses and other tax benefits carried forward | 105,937 | | | 26,504 | | | 9,984 | | | 16,520 | |
| Tax credits carried forward | 693 | | | 693 | | | 76 | | | 617 | |
| Other temporary differences | 15,793 | | | 3,799 | | | 2,483 | | | 1,316 | |
| Total | | | 30,996 | | | 12,543 | | | 18,453 | |
As of December 31, 2020, the majority of the deferred tax assets not recognized relates to tax losses carried forward attributable to various subsidiaries located in different jurisdictions (primarily Germany, Luxembourg, Spain, South Africa and USA) with different statutory tax rates. As of each reporting date, ArcelorMittal considers existing evidence, both positive and negative, including the earnings history and results of recent operations, reversals of deferred tax liabilities, projected future taxable income, and planning strategies, that
could impact the view with regard to future realization of these deferred tax assets.
The amount of the total deferred tax assets is the aggregate amount of the various deferred tax assets recognized and unrecognized at the various subsidiaries and not the result of a computation with a given blended rate. The utilization of tax losses carried forward is restricted to the taxable income of the subsidiary or tax consolidation group to which it belongs. The utilization of tax losses carried forward may also be restricted by
| | |
272 Consolidated financial statements |
the character of the income, expiration dates and limitations on the yearly use of tax losses against taxable income.
As at December 31, 2020, the total amount of accumulated tax losses in Luxembourg with respect to the ArcelorMittal S.A. tax integration amounted to approximately 91.3 billion, of which 31.5 billion is considered realizable, resulting in the recognition of 7.9 billion of deferred tax assets at the applicable income tax rate in Luxembourg. As at December 31, 2019, the total amount of accumulated tax losses in Luxembourg with respect to the main tax consolidation amounted to approximately 83.3 billion, of this amount 34.8 billion was considered realizable, resulting in the recognition of 8.7 billion of deferred tax assets at the applicable income tax rate in Luxembourg. Under the Luxembourg tax legislation, tax losses generated before 2017 can be carried forward indefinitely and are not subject to any specific yearly loss utilization limitations. The tax losses carried forward relate primarily to tax deductible write-down charges taken on investments in shares of consolidated subsidiaries recorded by certain of ArcelorMittal’s holding companies in Luxembourg. Of the total tax losses carried forward, 20.2 billion may be subject to recapture in the future if the write-downs that caused them are reversed creating taxable income unless the Company converts them to permanent through sales or other organizational restructuring activities.
The Company believes that it is probable that sufficient future taxable profits will be generated to support the recognized deferred tax asset for tax losses carried forward in Luxembourg. As part of its recoverability assessment the Company has taken into account (i) its most recent forecast approved by management and the Board of Directors, (ii) the likelihood that the factors that have contributed to past losses in Luxembourg will not recur, (iii) the fact that ArcelorMittal in Luxembourg is the main provider of funding to the Company’s consolidated subsidiaries, leading to significant amounts of taxable interest income, (iv) the expected lower interest expenses in Luxembourg driven by the reduction of the Group net debt level, (v) the industrial franchise agreement whereby ArcelorMittal S.A. licenses its business model for manufacturing, processing and distributing steel to group subsidiaries, and (vi) other significant and reliable sources of operational income earned from ArcelorMittal’s European and worldwide operating subsidiaries for centralized distribution and procurement activities performed in Luxembourg. In performing the assessment, the Company estimates at which point in time its earnings projections are no longer reliable, and thus taxable profits are no longer probable. Accordingly, the Company has established consistent forecast periods for its different income streams for estimating probable future taxable profits, against which the unused tax losses can be utilized in Luxembourg.
At December 31, 2020, based upon the level of historical taxable income and projections for future taxable income over
the periods in which the deductible temporary differences are anticipated to reverse, management believes it is probable that ArcelorMittal will realize the benefits of the deferred tax assets of 7.9 billion recognized. The amount of future taxable income required to be generated by ArcelorMittal’s subsidiaries to utilize the deferred tax assets of 7.9 billion is at least 31.5 billion. Historically, the Company has been able to generate sufficient taxable income and believes that it will generate sufficient levels of taxable income in the coming years to allow the Company to utilize tax benefits associated with tax losses carried forward and other deferred tax assets that have been recognized in its consolidated financial statements. Where the Company has had a history of recent losses, it relied on convincing other evidence such as the character of (historical) losses and planning opportunities to support the deferred tax assets recognized.
For the period ended December 31, 2020, ArcelorMittal recorded approximately 90 (December 31, 2019: 79) of deferred income tax liabilities in respect of deferred taxation that would arise if temporary differences on investments in subsidiaries, associates and interests in joint ventures were to be realized in the foreseeable future. No deferred tax liability has been recognized in respect of other temporary differences on investments in subsidiaries, associates and interests in joint ventures because the Company is able to control the timing of the reversal of the temporary difference and it is probable that such differences will not reverse in the foreseeable future. The amount of these unrecognized deferred tax liabilities is approximately 736.
10.5 Tax losses, tax credits and other tax benefits carried forward
At December 31, 2020, the Company had total estimated tax losses carried forward and other tax benefits of 114.3 billion.
This includes net operating losses and other tax benefits of 8.6 billion primarily related to subsidiaries in Basque Country in Spain, Liberia, Luxembourg, Mexico and the United States, which expire as follows:
| | | | | | | | | | | | | | | | | | | | |
| Year expiring | | Recognized | | Unrecognized | | Total |
| 2021 | | 44 | | | 906 | | | 950 | |
| 2022 | | 82 | | | 132 | | | 214 | |
| 2023 | | 6 | | | 468 | | | 474 | |
| 2024 | | 10 | | | 211 | | | 221 | |
| 2025 | | 49 | | | 100 | | | 149 | |
| 2025 - 2039 | | 706 | | | 5,848 | | | 6,554 | |
| Total | | 897 | | | 7,665 | | | 8,562 | |
The remaining tax losses carried forward and other tax benefits for an amount of 105.7 billion (of which 36.1 billion are recognized and 69.6 billion are unrecognized) are carried
| | |
Consolidated financial statements 273 |
| (millions of U.S. dollars, except share and per share data) |
forward for unlimited period of time and primarily relate to the Company’s operations in France, Germany, Luxembourg, Spain and South Africa.
At December 31, 2020, the Company also had total estimated tax credits carried forward of 745.
Such amount includes tax credits of 658 (of which 89 recognized and 569 unrecognized) and primarily attributable to subsidiaries in Basque country in Spain which expire as follows:
| | | | | | | | | | | | | | | | | | | | |
| Year expiring | | Recognized | | Unrecognized | | Total |
| 2021 | | — | | | 1 | | | 1 | |
| 2022 | | — | | | 1 | | | 1 | |
| 2023 | | — | | | 2 | | | 2 | |
| 2024 | | — | | | 1 | | | 1 | |
| 2025 | | — | | | 1 | | | 1 | |
| 2025 - 2039 | | 89 | | | 563 | | | 652 | |
| Total | | 89 | | | 569 | | | 658 | |
The remaining tax credits for an amount of 87 (of which 44 are recognized and 43 are unrecognized) are indefinite and primarily attributable to the Company’s operations in Brazil and Spain.
Tax losses, tax credits and other tax benefits carried forward are denominated in the currency of the countries in which the
respective subsidiaries are located and operate, except for Luxembourg where the tax losses are mainly denominated in U.S. dollar. Fluctuations in currency exchange rates could impact the U.S. dollar equivalent value of these tax losses carried forward in future years.
NOTE 11: EQUITY
11.1 Share details
On May 14, 2020 and May 18, 2020, the Company completed an offering of common shares, without nominal value for 750 at a price of $9.27 per share. A Mittal family trust participated in the offerings by contributing an amount of 100 for the shares.
Following the offering of common shares described above with net proceeds of 740 (net of transaction costs of 10), on May 14, 2020, the Company issued 80,906,149 fully paid up shares. The Company allocated 29 to share capital, which increased from 364 at December 31, 2019 to 393 at December 31, 2020 and the remainder of 711 to additional paid-in-capital.
Under the terms of the offerings, there is a 180-day lock-up period for the Company on issuances or sales of shares and securities exchangeable for or convertible into shares, subject to customary exceptions.
The Company’s shares consist of the following:
| | | | | | | | | | | | | | | | | | | | | | | | | | | | | |
| December 31, 2018 | | Movement in year | | December 31, 2019 | | Movement in year | | December 31, 2020 |
| Issued shares | 1,021,903,623 | | | — | | | 1,021,903,623 | | | 80,906,149 | | | 1,102,809,772 | |
| Treasury shares | (8,335,365) | | | (1,488,837) | | | (9,824,202) | | | (12,251,157) | | | (22,075,359) | |
| Total outstanding shares | 1,013,568,258 | | | (1,488,837) | | | 1,012,079,421 | | | 68,654,992 | | | 1,080,734,413 | |
The number of issued shares were 1,021,903,623 at December 31, 2018 and 2019, and 1,102,809,772 at December 31, 2020.
Authorized shares
At the Extraordinary General Meeting of shareholders held on May 16, 2018, the shareholders approved the change of currency of the Company's share capital from euro to U.S. dollar. Following this approval, the authorized share capital amounted to 411 represented by 1,151,576,921 ordinary shares without nominal value. As a result of this change, the issued share capital amounted to 364 as of December 31, 2018, based on the exchange rate published by the European Central Bank on May 15, 2018. The difference was transferred to additional paid-in capital. There was no change in the aggregate number of shares issued and fully paid up which continued to amount to 1,021,903,623.
On June 13, 2020, at the Extraordinary General Meeting of shareholders, the shareholders approved an increase of the
authorized share capital by 74. As a result, the authorized share capital increased from 411 represented by 1,151,576,921 ordinary shares without nominal value as of December 31, 2019 to 485 represented by 1,361,418,599 ordinary shares without nominal value as of December 31, 2020.
Share buyback
On March 26, 2018, ArcelorMittal completed a share buyback program under the authorization given at the annual general meeting of shareholders held on May 5, 2015. ArcelorMittal repurchased 7 million shares for a total value of €184 million (226) at an average price per share of €26.34 (equivalent to $32.36).
On February 15, 2019, ArcelorMittal completed a share buyback program and repurchased 4 million shares for a total value of €80 million (90) at an average price per share of €19.89 (equivalent to $22.42).
| | |
274 Consolidated financial statements |
On October 30, 2020, the Company completed a share buyback program in connection with the announced sale of 100% of the shares of ArcelorMittal USA. ArcelorMittal repurchased 35,636,253 shares at an average price per share of €11.92 (equivalent to $14.03) for a total value of €425 million (500).
The shares acquired through the buyback program were recognized as treasury shares. On December 15, 2020, ArcelorMittal signed separate, privately negotiated exchange agreements with a limited number of holders of the MCNs for which it delivered 22,653,933 shares out of treasury shares (see note 11.2).
Treasury shares
ArcelorMittal held, indirectly and directly, 22.1 million and 9.8 million treasury shares as of December 31, 2020 and December 31, 2019, respectively.
11.2 Equity instruments and hybrid instruments
Mandatory convertible bonds
On December 28, 2009, the Company issued through Hera Ermac, a wholly-owned subsidiary, 750 unsecured and unsubordinated bonds mandatorily convertible into preferred shares of such subsidiary. The bonds were placed privately with a Luxembourg affiliate of Crédit Agricole (formerly Calyon) and are not listed. The Company has the option to call the mandatory convertible bonds until 10 business days before the maturity date. Hera Ermac invested the proceeds of the bonds issuance and an equity contribution by the Company in notes issued by subsidiaries of the Company linked to the values of shares of Erdemir and China Oriental. On April 20, 2011, the Company signed an agreement for an extension of the conversion date of the mandatory convertible bonds to January 31, 2013. On September 27, 2011, the Company increased the mandatory convertible bonds from 750 to 1,000. The Company has extended the conversion date for the mandatory convertible bonds from time to time with the latest extension on December 22, 2020 (resulting in the extinguishment and recognition of a new compound instrument) to January 31, 2024.
On March 29, 2019 and December 18, 2019, the Company repaid notes issued by subsidiaries which were linked to the value of the shares of Erdemir. As of December 31, 2020, the remaining notes were linked to the value of the shares of China Oriental (see note 6.1.5).
On December 22, 2020, as described above the maturity of the mandatory convertible bonds was extended from January 29, 2021 to January 31, 2024. The other main features of the mandatory convertible bonds remained unchanged. The Company determined that this transaction led to the extinguishment of the existing compound instrument and the recognition of a new compound instrument including non-
controlling interests for 869 (net of cumulative tax and fees) and other liabilities for 131. The derecognition of the previous instrument and the recognition at fair value of the new instrument resulted in a 178 expense included in financing costs-net in the consolidated statement of operations and a 53 increase in non-controlling interests.
Mandatorily convertible subordinated notes
On May 18, 2020, following the offering of common shares described in note 11.1, the Company completed an offering of mandatorily convertible subordinated notes (“MCNs”) for 1,250. The MCNs have a three year maturity, were issued at 100% of the principal amount and will be mandatorily converted into common shares of the Company upon maturity unless converted earlier at the option of the holders or ArcelorMittal during the conversion period or upon occurrence of certain defined events.
In all cases, ArcelorMittal may exercise its right to convert early, taking precedent over the other options. In case of an early conversion, ArcelorMittal must deliver shares at the “Maximum Conversion Ratio.” The mandatorily convertible notes pay a coupon of 5.50% per annum, payable quarterly in arrears. The minimum conversion price of the mandatorily convertible notes is equal to $9.27, corresponding to the offering price of the shares as described above, and the maximum conversion price is 117.5% of the minimum conversion price or $10.89, subject to certain adjustments. ArcelorMittal intends to use the net proceeds from the offerings for general corporate purposes, to deleverage and to enhance liquidity, thereby building additional resilience going forward in what remains an uncertain environment.
A Mittal family trust participated in the offerings by contributing an amount of 100 for the MCNs.
The Company determined that the MCNs are a hybrid instrument including an equity component and a debt component. The Company assessed whether there is actual economic or other business reasons that it would exercise its option to convert prior to maturity, whether the MCNs would have been priced differently if the early settlement option had not been included in the contractual terms and other factors such as the term of the instrument, the width of the range between the cap and the floor, ArcelorMittal’s share price and the volatility of the share price as important criterion in this conclusion. The early conversion right has economic substance with respect to maintaining the current credit rating if early conversion can help in preventing a rating downgrade. In this event, future savings of credit interest is expected to be more than the cost of early conversion. The debt component of 190 (net of transaction costs of 2) at issuance corresponded to the net present value of the future interest payments and is included in accrued expenses and other liabilities and other long-term
| | |
Consolidated financial statements 275 |
| (millions of U.S. dollars, except share and per share data) |
obligations. The remaining amount of 1,047 (net of transaction costs of 11) was the equity instrument.
On December 15, 2020, ArcelorMittal signed separate, privately negotiated exchange agreements with a limited number of holders of the MCNs exchanging 247 in aggregate principal amount of MCNs for an aggregate of 22,653,933 treasury shares at the minimum conversion ratio plus 25 paid in cash (including accrued interest on the exchanged MCNs up to, but excluding, the settlement date). The Company allocated the share consideration to the debt (30) and equity (207) components consistent with the original allocation using net present value of the future interest payments at the date of exchange. As of December 31, 2020 and following the
exchange, the debt and equity components were 123 and 840 (presented separately in the statements of changes in equity), net of transaction fees respectively.
11.3 Earnings per common share
Basic earnings per common share is computed by dividing net income (loss) by the weighted average number of common shares outstanding during the year. Diluted earnings per share is computed by dividing income (loss) available to equity holders by the weighted average number of common shares plus potential common shares from share unit plans and outstanding stock options whenever the conversion results in a dilutive effect.
The following table provides the numerators and a reconciliation of the denominators used in calculating basic and diluted earnings per common share for the years ended December 31, 2020, 2019 and 2018.
| | | | | | | | | | | | | | | | | |
| Year ended December 31, |
| 2020 | | 2019 | | 2018 |
| Net (loss) / income attributable to equity holders of the parent | (733) | | | (2,454) | | | 5,149 | |
| Weighted average common shares outstanding (in millions) for the purposes of basic earnings per share | 1,140 | | | 1,013 | | | 1,015 | |
| Incremental shares from assumed conversion of restricted share units and performance share units (in millions) | — | | | — | | | 6 | |
| Weighted average common shares outstanding (in millions) for the purposes of diluted earnings per share | 1,140 | | | 1,013 | | | 1,021 | |
For the purpose of calculating earnings per common share, diluted weighted average common shares outstanding excludes 9 million and 7 million potential common shares from share unit plans for the year ended December 31, 2020 and 2019, respectively; and 1 million and 2 million potential common shares from stock options outstanding for the years ended December 31, 2019 and 2018, respectively, because such share unit plans and stock options are anti-dilutive.
11.4 Dividends
Calculations to determine the amounts available for dividends are based on ArcelorMittal’s financial statements (“ArcelorMittal
S.A.”) which are prepared in accordance with IFRS, as endorsed by the European Union. ArcelorMittal S.A. has no significant manufacturing operations of its own and generates its profit mostly from financing activities and the management fees/industrial franchise agreements with Group Companies. Accordingly, it can only pay dividends or distributions to the extent it is entitled to receive cash dividend distributions from its subsidiaries’ recognized gains, profit generated by its own activities, from the sale of its assets or share premiums from the issuance of common shares. Dividends are declared in U.S. dollars and are payable in either U.S. dollars or in euros.
| | | | | | | | | | | | | | | | | | | | | | | |
| Description | Approved by | | Dividend per
share (in $) | | Payout date | | Total (in
millions of $) |
| Dividend for financial year 2017 | Annual general shareholders’ meeting on May 9, 2018 | | 0.10 | | | June 13, 2018 | | 101 | |
| Dividend for financial year 2018 | Annual general shareholders’ meeting on May 7, 2019 | | 0.20 | | | June 13, 2019 | | 203 | |
| Dividend for financial year 2019 | Annual general shareholders’ meeting on June 13, 2020 | | — | | | — | | | — | |
On June 13, 2020, at the annual general meeting of shareholders, the shareholders approved, as determined by the Board of Directors, that due to impact of the COVID-19 pandemic that it was both appropriate and prudent to suspend dividend payments until such a time as the operating environment normalizes.
On February 11, 2021, the Board proposed to restart the base dividend to shareholders at $0.30 per share (in respect of 2020)
which will be proposed to the shareholders at the annual general meeting of shareholders' in May 2021. It also proposed to return 570 of capital to shareholders through a share buyback program in 2021. This is in addition to the 650 share buyback which commenced on February 15, 2021 to return the proceeds of the partial sale of the Company's shares held in Cleveland-Cliffs as described in note 2.5. The share buyback program was completed on March 3, 2021 with 27,113,321 million shares
| | |
276 Consolidated financial statements |
repurchased (9,852,980 of which were repurchased from the Significant Shareholder for purposes of maintaining its voting rights for €195 (236)) for a total value of approximately €537 (650) at an approximate average price per share of €19.79.
On March 4, 2021, ArcelorMittal commenced the second share buyback program for an aggregate amount of 570, in-line with
the Company’s new capital returns policy. This share buyback program will be completed by December 31, 2021.
11.5 Non-controlling interests
11.5.1 Non-wholly owned subsidiaries that have material non-controlling interests
The tables below provide a list of the subsidiaries which include significant non-controlling interests at December 31, 2020 and 2019 and for the years ended December 31, 2020, 2019 and 2018.
| | | | | | | | | | | | | | | | | | | | | | | | | | | | | | | | | | | | | | | | | | | | | | | | | | |
| Name of Subsidiary | | Country of incorporation and operation | | % of non-controlling interests and non- controlling voting rights at December 31, 2020 | | % of non-controlling interests and non- controlling voting rights at December 31, 2019 | | Net income (loss) attributable to non- controlling interests for the year ended December 31, 2020 | | Non-controlling interests at December 31, 2020 | | Net income (loss) attributable to non- controlling interests for the year ended December 31, 2019 | | Non-controlling interests at December 31, 2019 | | Net income (loss) attributable to non- controlling interests for the year ended December 31, 2018 |
| AMSA | | South Africa | | 30.78 | % | | 30.78 | % | | (34) | | | 24 | | | (98) | | | 74 | | | 29 | |
Sonasid1 | | Morocco | | 67.57 | % | | 67.57 | % | | — | | | 114 | | | — | | | 103 | | | 2 | |
| ArcelorMittal Kryvyi Rih | | Ukraine | | 4.87 | % | | 4.87 | % | | (1) | | | 151 | | | (5) | | | 185 | | | 15 | |
| Belgo Bekaert Arames ("BBA") | | Brazil | | 45.00 | % | | 45.00 | % | | 33 | | | 116 | | | 28 | | | 141 | | | 28 | |
Hera Ermac2 | | Luxembourg | | — | | | — | | | — | | | 855 | | | — | | | 801 | | | — | |
| AMMC | | Canada | | 15.00 | % | | 15.00 | % | | 127 | | | 466 | | | 114 | | | 486 | | | 91 | |
| Arceo | | Belgium | | 62.86 | % | | 62.86 | % | | 2 | | | 167 | | | 3 | | | 154 | | | 4 | |
| ArcelorMittal Liberia Ltd | | Liberia | | 15.00 | % | | 15.00 | % | | 28 | | | (222) | | | 18 | | | (250) | | | (2) | |
| Other | | | | | | | | — | | | 286 | | | 3 | | | 268 | | | 14 | |
| Total | | | | | | | | 155 | | | 1,957 | | | 63 | | | 1,962 | | | 181 | |
1.Sonasid - ArcelorMittal holds a controlling stake of 50% in Nouvelles Sidérurgies Industrielles. ArcelorMittal controls Nouvelles Sidérurgies Industrielles on the basis of a shareholders’ agreement which includes deadlock arrangements in favor of the Company. Nouvelles Sidérurgies Industrielles holds a 64.86% stake in Sonasid. The total non-controlling interests in Sonasid of 67.57% are the result of ArcelorMittal’s indirect ownership percentage in Sonasid of 32.43% through its controlling stake in Nouvelles Sidérurgies Industrielles.
2.Hera Ermac - The non-controlling interests correspond to the equity component net of transaction fees of the mandatory convertible bonds maturing on January 31, 2024 (see note 11.2).
The tables below provide summarized statements of financial position for the above-mentioned subsidiaries as of December 31, 2020 and 2019 and summarized statements of operations and summarized statements of cash flows for the years ended December 31, 2020, 2019 and 2018.
| | | | | | | | | | | | | | | | | | | | | | | | | | | | | | | | | | | | | | | | | | | | | | | |
| December 31, 2020 |
| Summarized statements of financial position | AMSA | | Sonasid | | AM Kryvyi Rih | | BBA | | Hera Ermac | | AMMC | | Arceo | | AM Liberia |
| Current assets | 853 | | | 214 | | | 1,050 | | | 200 | | | 694 | | | 1,566 | | | 182 | | | 153 | |
| Non-current assets | 572 | | | 114 | | | 2,871 | | | 112 | | | 1,044 | | | 2,987 | | | 89 | | | 150 | |
| Total assets | 1,425 | | | 328 | | | 3,921 | | | 312 | | | 1,738 | | | 4,553 | | | 271 | | | 303 | |
| Current liabilities | 875 | | | 115 | | | 619 | | | 93 | | | 54 | | | 515 | | | — | | | 1,583 | |
| Non-current liabilities | 471 | | | 48 | | | 354 | | | 9 | | | 113 | | | 633 | | | — | | | 55 | |
| Net assets | 79 | | | 165 | | | 2,948 | | | 210 | | | 1,571 | | | 3,405 | | | 271 | | | (1,335) | |
| | |
Consolidated financial statements 277 |
| (millions of U.S. dollars, except share and per share data) |
| | | | | | | | | | | | | | | | | | | | | | | | | | | | | | | | | | | | | | | | | | | | | | | |
| December 31, 2020 |
| Summarized statements of operations | AMSA | | Sonasid | | AM Kryvyi Rih | | BBA | | Hera Ermac | | AMMC | | Arceo | | AM Liberia |
| Revenue | 1,526 | | | 324 | | | 2,348 | | | 650 | | | — | | | 2,746 | | | — | | | 361 | |
| Net income (loss) | (110) | | | (1) | | | 17 | | | 75 | | | (208) | | | 849 | | | 4 | | | 192 | |
| Total comprehensive income (loss) | (138) | | | 3 | | | 14 | | | 79 | | | (208) | | | 747 | | | 4 | | | 192 | |
| | | | | | | | | | | | | | | | | | | | | | | | | | | | | | | | | | | | | | | | | | | | | | | |
| | December 31, 2020 |
| Summarized statements of cash flows | AMSA | | Sonasid | | AM Kryvyi Rih | | BBA | | Hera Ermac | | AMMC | | Arceo | | AM Liberia |
| | | | | | | | | | | | | | | |
| Net cash provided by / (used in) operating activities | 30 | | | 39 | | | 697 | | | 86 | | | (209) | | | 922 | | | 8 | | | 223 | |
| Net cash provided by / (used in) investing activities | (13) | | | (5) | | | (212) | | | (12) | | | 208 | | | (137) | | | 20 | | | (19) | |
| Net cash provided by / (used in) financing activities | 77 | | | (1) | | | (485) | | | (65) | | | 1 | | | (870) | | | (6) | | | (204) | |
| Impact of currency movements on cash | 19 | | | 6 | | | (11) | | | (2) | | | — | | | — | | | 5 | | | — | |
| Cash and cash equivalents: | | | | | | | | | | | | | | | |
| At the beginning of the year | 60 | | | 53 | | | 42 | | | 13 | | | — | | | 210 | | | 46 | | | 1 | |
| At the end of the year | 173 | | | 92 | | | 31 | | | 20 | | | — | | | 125 | | | 73 | | | 1 | |
| Dividend to non-controlling interests | | | | | | | (27) | | | | | (126) | | | (3) | | | |
| | | | | | | | | | | | | | | | | | | | | | | | | | | | | | | | | | | | | | | | | | | | | | | |
| | December 31, 2019 |
| Summarized statements of financial position | AMSA | | Sonasid | | AM Kryvyi Rih | | BBA | | Hera Ermac | | AMMC | | Arceo | | AM Liberia |
| | | | | | | | | | | | | | | |
| Current assets | 997 | | | 188 | | | 1,557 | | | 225 | | | 905 | | | 1,434 | | | 129 | | | 155 | |
| Non-current assets | 618 | | | 102 | | | 3,530 | | | 148 | | | 1,193 | | | 3,083 | | | 122 | | | 123 | |
| Total assets | 1,615 | | | 290 | | | 5,087 | | | 373 | | | 2,098 | | | 4,517 | | | 251 | | | 278 | |
| Current liabilities | 907 | | | 101 | | | 1,130 | | | 98 | | | 298 | | | 457 | | | 1 | | | 1,739 | |
| Non-current liabilities | 468 | | | 39 | | | 446 | | | 14 | | | 76 | | | 591 | | | 1 | | | 46 | |
| Net assets | 240 | | | 150 | | | 3,511 | | | 261 | | | 1,724 | | | 3,469 | | | 249 | | | (1,507) | |
| | | | | | | | | | | | | | | | | | | | | | | | | | | | | | | | | | | | | | | | | | | | | | | | |
| | December 31, 2019 |
| Summarized statements of operations | AMSA | | Sonasid | | AM Kryvyi Rih | | BBA | | Hera Ermac | | AMMC | | Arceo | | AM Liberia |
| | | | | | | | | | | | | | | | |
| Revenue | 2,864 | | | 366 | | | 2,420 | | | 761 | | | — | | | 2,655 | | | — | | | 257 | |
| Net income (loss) | (319) | | | (1) | | | (100) | | | 63 | | | 144 | | | 766 | | | 5 | | | 115 | |
| Total comprehensive income (loss) | (312) | | | — | | | (141) | | | 64 | | | 144 | | | 761 | | | 5 | | | 115 | |
| | |
278 Consolidated financial statements |
| | | | | | | | | | | | | | | | | | | | | | | | | | | | | | | | | | | | | | | | | | | | | | | |
| | December 31, 2019 |
| Summarized statements of cash flows | AMSA | | Sonasid | | AM Kryvyi Rih | | BBA | | Hera Ermac | | AMMC | | Arceo | | AM Liberia |
| | | | | | | | | | | | | | | |
| Net cash provided by / (used in) operating activities | (35) | | | 9 | | | 163 | | | 76 | | | 857 | | | 1,045 | | | 9 | | | 84 | |
| Net cash provided by / (used in) investing activities | (79) | | | (5) | | | (270) | | | (12) | | | (114) | | | (332) | | | 17 | | | (18) | |
| Net cash provided by / (used in) financing activities | 97 | | | (6) | | | 68 | | | (62) | | | (743) | | | (683) | | | (7) | | | (65) | |
| Impact of currency movements on cash | 5 | | | — | | | 8 | | | — | | | — | | | — | | | — | | | — | |
| Cash and cash equivalents: | | | | | | | | | | | | | | | |
| At the beginning of the year | 72 | | | 55 | | | 73 | | | 11 | | | — | | | 180 | | | 27 | | | — | |
| At the end of the year | 60 | | | 53 | | | 42 | | | 13 | | | — | | | 210 | | | 46 | | | 1 | |
| Dividend to non-controlling interests | — | | | (4) | | | — | | | (18) | | | — | | | (102) | | | (5) | | | — | |
| | | | | | | | | | | | | | | | | | | | | | | | | | | | | | | | | | | | | | | | | | | | | | | |
| | December 31, 2018 |
| Summarized statements of operations | AMSA | | Sonasid | | AM Kryvyi Rih | | BBA | | Hera Ermac | | AMMC | | Arceo | | AM Liberia |
| | | | | | | | | | | | | | | |
| Revenue | 3,440 | | | 396 | | | 2,497 | | | 771 | | | — | | | 2,396 | | | — | | | 132 | |
| Net income (loss) | 95 | | | 4 | | | 340 | | | 59 | | | (555) | | | 636 | | | 6 | | | (12) | |
| Total comprehensive income (loss) | (40) | | | 5 | | | 331 | | | 62 | | | (555) | | | 642 | | | 6 | | | (12) | |
| | | | | | | | | | | | | | | | | | | | | | | | | | | | | | | | | | | | | | | | | | | | | | | |
| | December 31, 2018 |
| Summarized statements of cash flows | AMSA | | Sonasid | | AM Kryvyi Rih | | BBA | | Hera Ermac | | AMMC | | Arceo | | AM Liberia |
| Net cash provided by / (used in) operating activities | 69 | | | 22 | | | 313 | | | 47 | | | 38 | | | 735 | | | 10 | | | (18) | |
| Net cash provided by / (used in) investing activities | 132 | | | (5) | | | (346) | | | (14) | | | (38) | | | (134) | | | 14 | | | (29) | |
| Net cash provided by / (used in) financing activities | (260) | | | — | | | 50 | | | (27) | | | — | | | (579) | | | (9) | | | 47 | |
| Impact of currency movements on cash | (10) | | | — | | | (4) | | | — | | | — | | | — | | | (1) | | | — | |
| Cash and cash equivalents: | | | | | | | | | | | | | | | |
| At the beginning of the year | 141 | | | 38 | | | 60 | | | 5 | | | — | | | 158 | | | 13 | | | — | |
| At the end of the year | 72 | | | 55 | | | 73 | | | 11 | | | — | | | 180 | | | 27 | | | — | |
| Dividend to non-controlling interests | — | | | — | | | — | | | (18) | | | — | | | (87) | | | (7) | | | — | |
11.5.2 Transactions with non-controlling interests
Acquisitions of non-controlling interests, which do not result in a change of control, are accounted for as transactions with owners in their capacity as owners and therefore no goodwill is recognized as a result of such transactions. In such circumstances, the carrying amounts of the controlling and non-controlling interests are adjusted to reflect the changes in their relative interests in the subsidiary. Any difference between the amount by which the non-controlling interests are adjusted and the fair value of the consideration paid or received is recognized directly in equity and attributed to the owners of the parent.
Transactions with non-controlling interests also include the mandatory convertible bonds (see note 11.2).
| | |
Consolidated financial statements 279 |
| (millions of U.S. dollars, except share and per share data) |
NOTE 12: RELATED PARTIES
The related parties of the Group are predominately subsidiaries, joint operations, joint ventures, associates and key management personnel (see note 8.1) of the Group. Transactions between the parent company, its subsidiaries and joint operations are eliminated on consolidation and are not disclosed in this note. Related parties include the Significant Shareholder, which is a trust of which Mr. Lakshmi N. Mittal, Mrs. Usha Mittal and their
children are the beneficiaries and which owns, together with shares owned directly by Mr. and Mrs. Mittal, 35.64% of ArcelorMittal’s issued ordinary shares.
Transactions with related parties of the Company mainly relate to sales and purchases of raw materials and steel products and were as follows:
12.1 Sales and trade receivables
| | | | | | | | | | | | | | | | | | | | | | | | | | | | | | | | | | | |
| | | Year ended December 31, | | December 31, |
| | | Sales | | Trade receivables |
| Related parties and their subsidiaries where applicable | Category | | 2020 | | 2019 | | 2018 | | 2020 | | 2019 |
| Calvert | Joint Venture | | 1,488 | | | 2,518 | | | 2,207 | | | 18 | | | 5 | |
Gonvarri Steel Industries 1 | Associate | | 1,395 | | | 1,728 | | | 2,022 | | | 67 | | | 42 | |
| Borçelik | Joint Venture | | 312 | | | 474 | | | 536 | | | 15 | | | 20 | |
| ArcelorMittal CLN Distribuzione Italia | Joint Venture | | 304 | | | 483 | | | 511 | | | 6 | | | 57 | |
| Bamesa | Associate | | 226 | | | 365 | | | 383 | | | 27 | | | 32 | |
I/N Kote 2 | Other | | 226 | | | 321 | | | 329 | | | — | | | 2 | |
| ArcelorMittal RZK Çelik Servis Merkezi | Joint Venture | | 167 | | | 225 | | | 136 | | | 14 | | | 13 | |
| Aperam | Other | | 155 | | | 172 | | | 278 | | | 19 | | | 16 | |
| Coils Lamiere Nastri (C.L.N.) | Associate | | 146 | | | 247 | | | 265 | | | 7 | | | 10 | |
| Tuper | Joint Venture | | 128 | | | 147 | | | 155 | | | 36 | | | 43 | |
WDI 3 | Associate | | 106 | | | 105 | | | 148 | | | 1 | | | 1 | |
| Tameh | Joint Venture | | 64 | | | 109 | | | 110 | | | 6 | | | 8 | |
| SSC Tanger | Associate | | 49 | | | 55 | | | 53 | | | 1 | | | 1 | |
| Al Jubail | Joint Venture | | 4 | | | 25 | | | 115 | | | 4 | | | — | |
Macsteel 4 | Other | | — | | | — | | | 470 | | | — | | | — | |
| Other | | | 372 | | | 468 | | | 541 | | | 48 | | | 48 | |
| Total | | | 5,142 | | | 7,442 | | | 8,259 | | | 269 | | | 298 | |
1.Gonvarri Steel Industries includes ArcelorMittal Gonvarri Brasil Productos Siderúrgicos which is a joint venture.
2.I/N Kote was divested on December 9, 2020 upon completion of ArcelorMittal USA sale (see note 2.3.1).
3.WDI includes Westfälische Drahtindustrie Verwaltungsgesellschaft mbH & Co. KG and Westfälische Drahtindustrie GmbH.
4.Macsteel was sold on October 31, 2018.
| | |
280 Consolidated financial statements |
12.2 Purchases and trade payables
| | | | | | | | | | | | | | | | | | | | | | | | | | | | | | | | | | | |
| | | Year ended December 31, | | December 31, |
| | | Purchases | | Trade payables |
| Related parties and their subsidiaries where applicable | Category | | 2020 | | 2019 | | 2018 | | 2020 | | 2019 |
| Tameh | Joint Venture | | 171 | | | 273 | | | 344 | | | 37 | | | 22 | |
| Global Chartering | Joint Venture | | 138 | | | — | | | — | | | 8 | | | 12 | |
| Calvert | Joint Venture | | 124 | | | 127 | | | 107 | | | 9 | | | 41 | |
Baffinland 1 | Associate | | 64 | | | 16 | | | 28 | | | 52 | | | 1 | |
| Aperam | Other | | 56 | | | 47 | | | 85 | | | 8 | | | 7 | |
| CFL Cargo | Associate | | 54 | | | 63 | | | 59 | | | 16 | | | 17 | |
| Exeltium | Associate | | 50 | | | 52 | | | 54 | | | 12 | | | — | |
| Baycoat | Joint Venture | | 46 | | | 47 | | | 43 | | | 7 | | | 8 | |
| Sitrel | Joint Venture | | 29 | | | 49 | | | 41 | | | — | | | 1 | |
Gonvarri Steel Industries 2 | Associate | | 19 | | | 22 | | | 35 | | | 17 | | | 15 | |
| Al Jubail | Joint Venture | | 16 | | | 53 | | | 42 | | | 7 | | | 4 | |
| Other | | | 384 | | | 343 | | | 278 | | | 99 | | | 123 | |
| Total | | | 1,151 | | | 1,092 | | | 1,116 | | | 272 | | | 251 | |
1.Baffinland was classified as an associate as of October 31, 2017 (see note 2). Following a legal reorganization in September 2020, the Company holds an indirect interest in Baffinland through Nunavut Iron Ore Inc.
2.Gonvarri Steel Industries includes ArcelorMittal Gonvarri Brasil Productos Siderúrgicos which is a joint venture.
12.3 Other transactions with related parties
At December 31, 2019, subsequent to the ArcelorMittal's sale of a 50% controlling interest in Global Chartering to DryLog (see note 2.3.1), the Company signed a 10 year freight contract with Global Chartering, whereby ArcelorMittal agreed to provide cargo up to 16.8 million tonnes annually for shipping, representing 80% of the capacity of Global Chartering at that time. As of December 31, 2019, the Company also had an outstanding short-term loan of 127 granted to Global Chartering, which was repaid in 2020 following the sale-and-lease back of three vessels owned by Global Chartering.
At December 31, 2020, the shareholder loans granted by the Company to Al Jubail, with various maturity dates, had a carrying value of 109 (see note 2.4.3).
As of December 3, 2014, ArcelorMittal Calvert LLC signed a member capital expenditure loan agreement with the joint venture Calvert and as of December 31, 2020, the loans amounted to 178 including accrued interest. The loans bear interest from 2.28% to 4.77% and have various maturity dates ranging from less than 1 to 25 years.
On November 8, 2019, Baffinland entered into an agreement with a bank to finance up to 6 million tonnes at 78% of the value of the iron ore produced and hauled to the port of Milne Inlet by Baffinland up to a limit of 450. This arrangement was renewed on December 1, 2020.
ArcelorMittal's shared operator rights terminated on June 30, 2018 and the Company retained marketing rights until December 31, 2019. For the duration of 2020, ArcelorMittal provided transitional marketing services to Baffinland.
Following the Indian Supreme Court ruling dated October 4, 2018, ArcelorMittal completed a series of payments to the financial creditors of KSS Petron to clear overdue debts (see note 4.6). AMNS India has the right to enforce the KSS Petron debt on behalf of the Company for an outstanding amount of 136 as of December 31, 2020.
NOTE 13: SUBSEQUENT EVENTS
On February 11, 2021, the Board of Directors of ArcelorMittal announced that, effective immediately, Aditya Mittal, currently President, CFO and CEO ArcelorMittal Europe, will become Chief Executive Officer of the Company. Mr. Mittal, who founded the Company in 1976 and is currently Chairman and CEO will become Executive Chairman. In this position, he will continue to lead the Board of Directors and work together with the CEO and management team. The CEO Office will be renamed Executive Office, consisting of the Executive Chairman and the CEO. As a result of these developments, Genuino Christino, who joined the Company in 2003 and has held the position of Head of Finance since 2016, will become Chief Financial Officer.