UNITED STATES
SECURITIES AND EXCHANGE COMMISSION
Washington, D.C. 20549
________
FORM N-CSR
________
CERTIFIED SHAREHOLDER REPORT OF REGISTERED MANAGEMENT
INVESTMENT COMPANIES
Investment Company Act File Number 811-21364
Schroder Global Series Trust
(Exact name of registrant as specified in charter)
________
SEI Investments
One Freedom Valley Drive
Oaks, PA 19456
(Address of principal executive offices) (Zip code)
Michael Beattie
C/O SEI Investments
One Freedom Valley Drive
Oaks, PA 19456
(Name and address of agent for service)
Registrant’s telephone number, including area code: 1-800-464-3108
Date of fiscal year end: October 31, 2019
Date of reporting period: October 31, 2019
Item 1. Reports to Stockholders.
A copy of the report transmitted to stockholders pursuant to Rule 30e-1 under the Investment Company Act of 1940, as amended (the “Act”) (17 CFR § 270.30e-1), is attached hereto.
|
Schroder Mutual Funds
|
|
October 31, 2019
|
Annual Report
|
||
|
Domestic Equity
|
|||
|
Schroder North American Equity Fund
|
|||
|
International Equity
|
|||
|
Schroder Emerging Markets Small Cap Fund
|
|||
|
Fixed Income
|
|||
|
Schroder Core Bond Fund
|
|||
|
Schroder Long Duration Investment-Grade Bond Fund
|
|||
|
Schroder Short Duration Bond Fund
|
|||
|
Schroder Total Return Fixed Income Fund
|
|
Beginning on March 1, 2021, as permitted by regulations adopted by the Securities and Exchange Commission, paper copies of a Fund’s shareholder reports will no longer be
sent by mail, unless you specifically request paper copies of the reports from the Fund or from your financial intermediary, such as a broker-dealer or bank. Instead, the reports will be made available on a website, and you will be notified
by mail each time a report is posted and provided with a website link to access the report.
If you already elected to receive
shareholder reports electronically, you will not be affected by this change and you need not take any action. You may elect to receive shareholder reports and other communications from a Fund electronically by contacting your financial
intermediary.
You may elect to receive all future reports in paper free of charge. If you invest through a financial intermediary, you can follow the instructions included with
this disclosure, if applicable, or you can contact your financial intermediary to inform it that you wish to continue receiving paper copies of your shareholder reports. If you invest directly with a Fund, you can inform the Fund that you
wish to continue receiving paper copies of your shareholder reports by calling (800) 464-3108. Your election to receive reports in paper will apply to all funds held with your financial intermediary if you invest through a financial
intermediary or all Schroder Funds if you invest directly with a Fund.
|
|
Schroder Mutual Funds
|
|
Table of Contents
|
|
|
Management Discussion and Analysis
|
1
|
|
Schedules of Investments
|
|
|
North American Equity Fund
|
19
|
|
Emerging Markets Small Cap Fund
|
24
|
|
Core Bond Fund
|
26
|
|
Long Duration Investment-Grade Bond Fund
|
30
|
|
Short Duration Bond Fund
|
34
|
|
Total Return Fixed Income Fund
|
38
|
|
Statements of Assets and Liabilities
|
44
|
|
Statements of Operations
|
46
|
|
Statements of Changes in Net Assets
|
48
|
|
Financial Highlights
|
52
|
|
Notes to Financial Statements
|
56
|
|
Report of Independent Registered Public Accounting Firm
|
73
|
|
Information Regarding Review and Approval of Investment Advisory Contracts
|
75
|
|
Disclosure of Fund Expenses
|
80
|
|
Trustees and Officers
|
82
|
|
Notice to Shareholders
|
85
|
Proxy Voting (Unaudited)
A description of the Funds’ proxy voting policies and procedures is available upon request, without charge, by visiting the Securities and Exchange Commission’s (“SEC”) website
at http://www.sec.gov, or by calling 1-800-464-3108 and requesting a copy of the applicable Fund’s Statement of Additional Information or on the Schroder Funds website at http://www.schroderfunds.com, by downloading the Funds’ Statement of Additional
Information. Information regarding how the Funds voted proxies related to portfolio securities during the most recent 12-month period ended June 30 is available without charge, upon request by calling 1-800-464-3108 and on the SEC’s website at
http://www.sec.gov.
Form N-PORT (Unaudited)
The Funds file their complete schedules of portfolio holdings with the SEC for the first and third quarters of each fiscal year as an exhibit to its report on Form N-PORT. The
Funds’ Form N-PORT reports are available on the SEC’s website at http://www.sec.gov, and may be reviewed and copied at the SEC’s Public Reference Room in Washington, DC. Information on the operation of the Public Reference Room may be obtained by
calling 1-800-SEC-0330.
|
|
|
Schroder Mutual Funds
|
Important Information Concerning Management Discussion and Analysis and Performance
Except as otherwise specifically stated, all information and investment team commentary, including portfolio security positions, is as of October 31, 2019. The views expressed
in the Management Discussion and Analysis sections (the “MD&As”) are those of the respective Fund’s portfolio manager(s) and are subject to change without notice. They do not necessarily represent the views of Schroder Investment Management North
America Inc. (“SIMNA”). The MD&As contain some forward-looking statements providing current expectations or forecasts of future events; they do not necessarily relate to historical or current facts. There can be no guarantee that any
forward-looking statement will be realized. We undertake no obligation to publicly update forward-looking statements, whether as a result of new information, future events, or otherwise. Any discussions of specific securities should not be considered
a recommendation to buy or sell those securities. A Fund may buy, sell, or hold any security discussed herein, on the basis of factors described herein or the basis of other factors or other considerations. Fund holdings will change.
Performance quoted represents past performance and does not guarantee or predict future results. Investment return and principal value will fluctuate, so
shares, when redeemed, may be worth more or less than their original cost. Please keep in mind that any double digit returns are highly unusual and cannot be sustained. Fees and expenses are factored into the net asset value of your shares and any
performance numbers we release. Total return figures reflect expense limitations in effect during the periods shown; without such limitations, the performance shown would have been lower. Performance results assume the reinvestment of dividends and
capital gains. The return figures shown do not reflect the deduction of taxes that a shareholder may pay on Fund distributions or the redemption of Fund shares. Current and month-end performance and other information, which may be lower or higher
than that cited, is available by contacting SIMNA at (212) 641-3800 and is periodically updated on our website: www.schroderfunds.com.
|
|
1 |
|
Schroder North American Equity Fund
|
MANAGEMENT DISCUSSION AND ANALYSIS (As of
December 5, 2019)
Performance
For the twelve-month period ended October 31, 2019, the Schroder North American Equity Fund (the “Fund”) gained 11.88% (Investor Shares), compared to the S&P 500 Index (the
“Index”), a market index based on the market capitalizations of 500 large companies having common stock listed on the NYSE or NASDAQ, which rose 14.33% during the same period.
Market Background
The path of U.S. interest rates, Brexit, and the ebb and flow of U.S.-Chinese trade talks were prominent concerns for much of the twelve-month period. U.S. equities retreated
sharply towards the end of 2018, with the selling pressure intensifying during the period as investors reacted to concerns about a slowing global economy and the uncertainty surrounding U.S.-China trade relations.
Global equities have risen in 2019 through October as the U.S. and Chinese governments have edged closer to agreeing to a partial trade deal, and the UK once again edged back
from the precipice of a no-deal Brexit. Global central banks have accommodated soft economic data with the U.S. Federal Reserve (the “Fed”) cutting interest rates three times in 2019.
From a Style perspective, investors have maintained their preference for Quality Growth stocks, as evidenced by the strength of ongoing U.S. technology stocks. The MSCI Value
Index lagged the MSCI Growth Index by 8.40% over the twelve-month period in review.
Portfolio Review
Against this backdrop, the Fund underperformed the benchmark. The main positive influence was stock selection within the consumer staples sector. Our long held positions within
food and drink stocks were notable tailwinds for the Fund over the period. Our avoidance of Kraft Heinz supported relative performance as the stock’s price fell significantly in February.
Negative contributions were widely spread rather than being specific to individual stocks. The main detractors were in health care and in our underweight positions in rate
sensitives (e.g., utilities and real estate). Exposure to stocks negatively impacted by the U.S.-China trade war (e.g., industrials) was also a headwind.
Outlook
We continue to find an abundance of attractively valued and high quality opportunities across the market. One of the Fund’s most significant exposures remains
in health care, particularly pharmaceuticals, which we believe is the best example of an industry offering both value and quality. We also have a higher than Index allocation to industrials (e.g., electrical equipment, transport and machinery) and
technology.
Within technology, our preferred areas remain high quality, proven companies with strong balance sheets and rising dividends. We remain underweight in
utilities as we find most of these companies are highly leveraged and unattractive from a valuation perspective. We have found some opportunities in real estate over the past few months, although we still maintain lower than Index allocation to the
sector.
|
Schroder North American Equity Fund
|
Comparison of Change in the Value of a $250,000 Investment in the Schroder North American Equity Fund
Investor Shares vs. the Standard & Poor’s (S&P) 500 Index.
Investor Shares vs. the Standard & Poor’s (S&P) 500 Index.
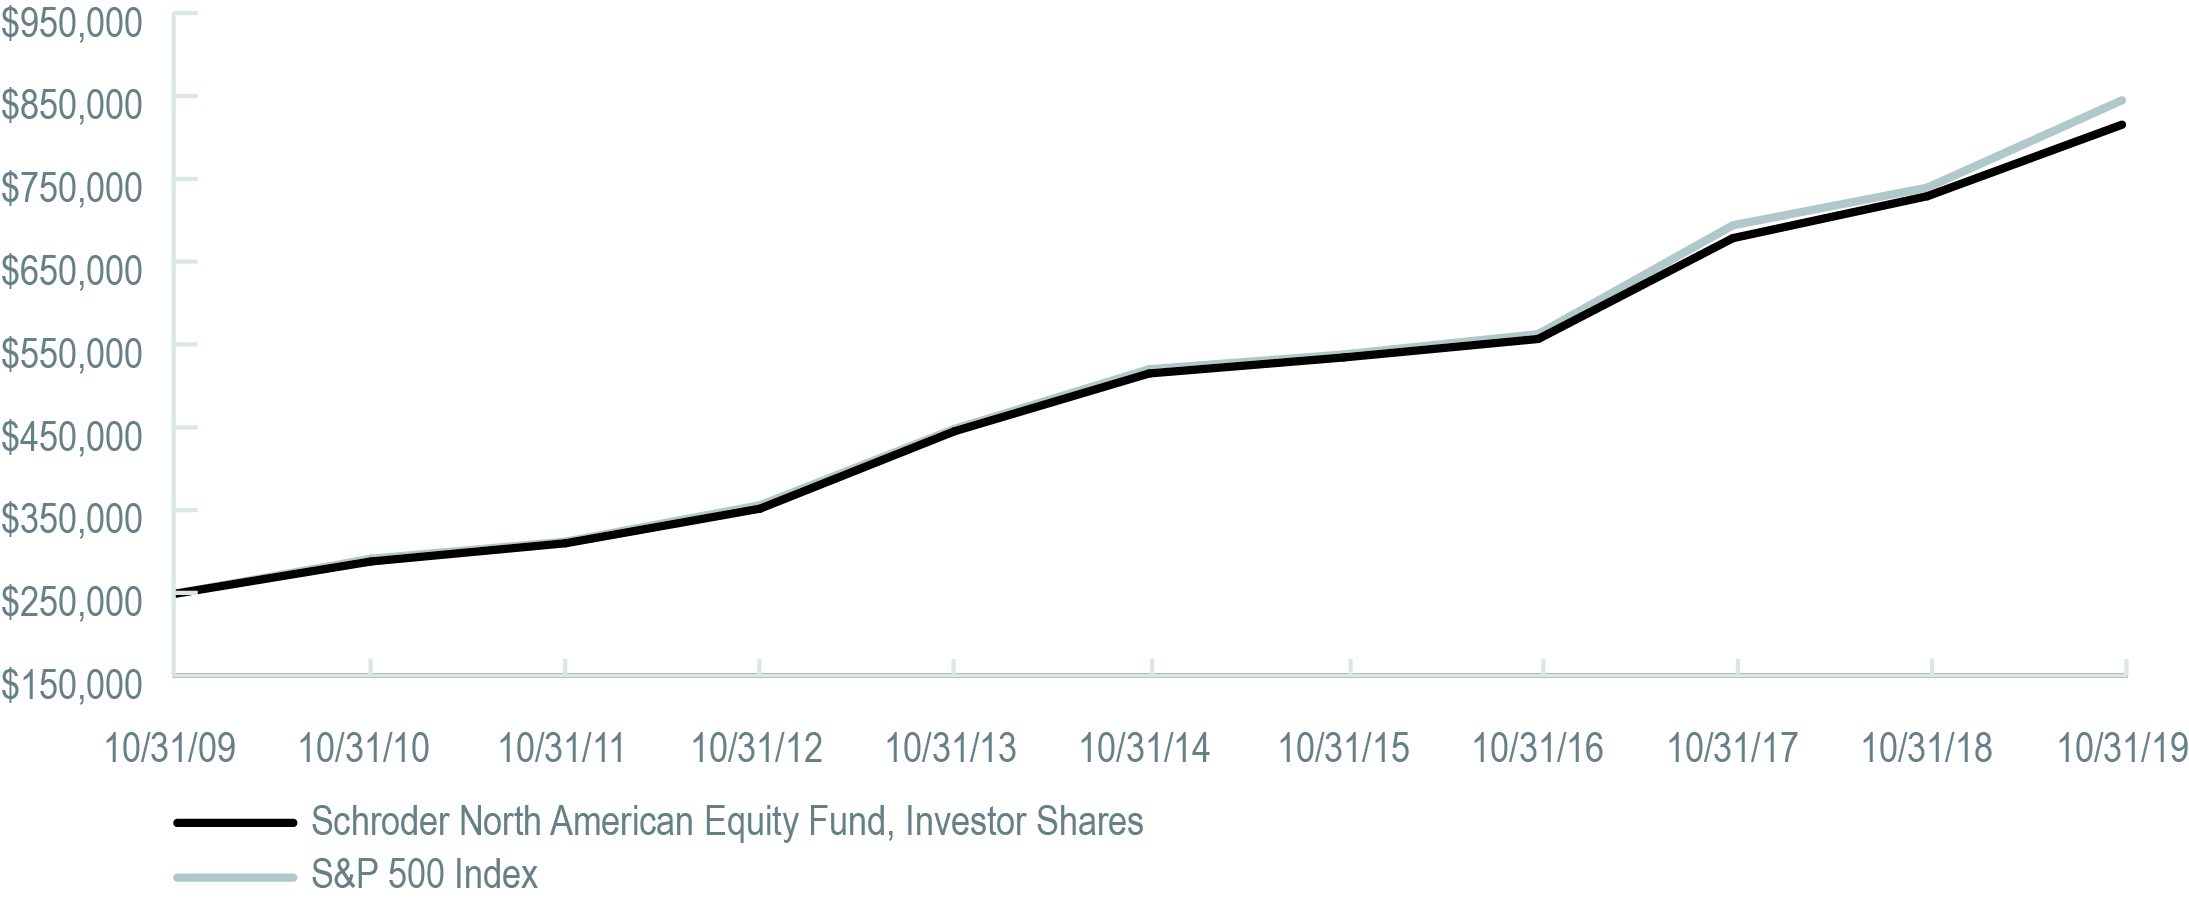
The S&P 500 Index is a market capitalization value weighted composite index of 500 large capitalization U.S. companies and reflects the
reinvestment of dividends.
Performance Information
|
One Year Ended
October 31, 2019 |
Five Years Ended
October 31, 2019(a) |
Ten Years Ended
October 31, 2019 (a) |
|
|
Schroder North American Equity Fund
|
|||
|
Investor Shares
|
11.88%
|
9.66%
|
12.66%
|
|
S&P 500 Index
|
14.33%
|
10.78%
|
13.70%
|
| (a) |
Average annual total returns.
|
“Total Return” is calculated including reinvestment of all dividends and distributions. Results do not reflect the deduction of taxes that
a shareholder would pay on fund distributions or the redemption of fund shares. Returns for certain periods reflect fee waivers and/or reimbursements in effect for that period; absent fee waivers and reimbursements, performance would have been lower.
Results represent past performance and do not indicate future results. The value of an investment in the Fund and the return on investment both will fluctuate and redemption proceeds may be higher or lower than an investor’s original cost.
|
Top 5 Holdings
|
|
|
Security
|
% of Net Assets
|
|
Microsoft
|
4.5%
|
|
Apple
|
4.0
|
|
Amazon.com
|
2.6
|
|
Johnson & Johnson
|
1.9
|
|
Alphabet Class C
|
1.7
|
|
Sector Allocation
|
|
|
Sector
|
% of Net Assets
|
|
Information Technology
|
22.8%
|
|
Healthcare
|
16.2
|
|
Financials
|
13.3
|
|
Industrials
|
11.5
|
|
Consumer Discretionary
|
10.1
|
|
Communication Services
|
9.5
|
|
Consumer Staples
|
7.8
|
|
Energy
|
3.9
|
|
Real Estate
|
2.2
|
|
Utilities
|
1.1
|
|
Materials
|
0.7
|
|
Other Assets less Liabilities
|
0.9
|
|
Schroder Emerging Markets Small Cap Fund
|
MANAGEMENT DISCUSSION AND ANALYSIS (As of
December 5, 2019)
Performance
For the twelve-month period ended October 31, 2019, the Schroder Emerging Markets Small Cap Fund (the “Fund”) returned 19.60% (R6 Shares) and 19.73% (Investor Shares), compared
to the Morgan Stanley Capital International (MSCI) Emerging Markets Small Cap Index (the “Index”) (a broad-based basket of emerging market stocks covering 1,660 securities across 26 markets), which returned 9.69%.
Market Backdrop
Global equities recorded a positive return over the twelve-month period. U.S.-China trade tensions escalated despite a short truce, and concerns over global growth continued to
build. At the end of the period, the U.S. and China indicated that a phase one trade deal was close, but no final agreement has yet been announced. The U.S. Federal Reserve (the “Fed”) responded to the weaker outlook by ending policy normalization
and began to cut interest rates. The European Central Bank followed suit, lowering its deposit rate further into negative territory, while also announcing the restart of its quantitative easing program. Against this backdrop, a number of emerging
market central banks began to ease monetary policy. The MSCI Emerging Markets Small Cap Index (total return) gained 9.69% (in USD terms) and underperformed the MSCI World Index, which increased by 11.64% (in USD terms).
Greece was the best-performing index market as its economy continued to recover. The outlook was boosted by the election of the centre-right New Democracy party, which is
expected to accelerate the reform agenda. Taiwan outperformed, supported by strong performance from technology sector names later in the period, as earnings expectations were revised upwards.
Brazil posted a robust return and finished ahead of the Index. Equities rallied following Jair Bolsonaro’s election to the presidency in October 2018. Economic growth
disappointed but sentiment was boosted by the approval of the long-awaited pension reform bill. With inflation controlled, the central bank continued to ease policy later in the period. Mexico posted a strong gain and outperformed, despite a slowdown
in economic growth that was due in part to the government transition and a slower rate of government spending, but also as congressional initiatives threatened the country’s historically stable business framework. The central bank responded by
reducing interest rates. Russia also outperformed. Although economic growth disappointed, later in the period inflation eased and the central bank began to loosen monetary policy.
By contrast, South Korea recorded a negative return and underperformed, negatively impacted by slower global trade. Chilean equities fell as civil unrest towards the end of the
period, amid wider concerns over inequality, increased uncertainty over the policy outlook. China finished in positive territory but underperformed. Economic growth continued to slow, reaching 6% year-on-year in Q3 2019. In response to slowing
activity, the authorities deployed stimulus measures. The U.S. implemented further tariffs, with $550 billion of Chinese imports subject to tariffs. The U.S. also added Chinese telecommunications group Huawei to a trade blacklist, citing security
concerns. In retaliation, China extended tariffs on U.S. goods to cover $185 billion of imports. It also allowed the renminbi to depreciate beyond the symbolic 7 threshold, leading the U.S. Treasury to label China a currency manipulator.
Portfolio Review
The Fund outperformed the Index over the reporting period.
Stock selection in China underpinned excess returns. This included positions in sportswear manufacturer Li Ning, spirits producer Anhui Gujing Distillery, property management
services provider A-Living Services, and pharmaceuticals company Wuxi AppTec. The Fund’s holdings in technology companies ASM Pacific Technology and Hefei Meiya Optoelectronic Technology were also among the largest contributors. In
|
Schroder Emerging Markets Small Cap Fund
|
Brazil, positions in retailer Alpargatas and insurance company IRB Brasil Resseguros worked well. In India, holdings in Indraprastha Gas Limited and Apollo Hospitals were
beneficial. Stock selection in Poland, in particular the position in Dino Polska, and in Russia, including the holding in Polymetal International, also added value. By contrast, stock selection in Taiwan was negative, most notably the Fund’s position
in food and beverage business Gourmet Master.
Outlook
In our view the strategic case for an investment in emerging market smaller companies is compelling. This is in large part due to their rich opportunity set and their generally
under researched nature relative to larger capitalization companies. We believe valuations are reasonably attractive, and we continue to find compelling investment opportunities in well-managed smaller companies given the breadth of the universe.
|
Schroder Emerging Markets Small Cap Fund
|
Comparison of Change in the Value of a $250,000 Investment in the Schroder Emerging Markets Small Cap Fund —
R6 and Investor Shares vs. the Morgan Stanley Capital International (MSCI) Emerging Markets Small Cap Index.
R6 and Investor Shares vs. the Morgan Stanley Capital International (MSCI) Emerging Markets Small Cap Index.

The MSCI Emerging Markets Small Cap Index includes small cap representation across 26 emerging market countries. With 1,660 constituents,
the index covers approximately 14% of the free float-adjusted market capitalization in each country. The small cap segment tends to capture more local economic and sector characteristics relative to larger emerging market capitalization segments.
Performance Information
|
One Year Ended
October 31, 2019 |
Annualized
Since Inception (a) |
|
|
Schroder Emerging Markets Small Cap Fund
|
||
|
R6 Shares
|
19.60%
|
8.83%
|
|
Investor Shares
|
19.73%
|
8.82%
|
|
MSCI Emerging Markets Small Cap Index
|
9.69%
|
5.63%
|
| (a) |
From commencement of fund operations on August 26, 2015.
|
“Total Return” is calculated including reinvestment of all dividends and distributions. Results do not reflect the deduction of taxes that
a shareholder would pay on fund distributions or the redemption of fund shares. Returns for certain periods reflect fee waivers and/or reimbursements in effect for that period; absent fee waivers and reimbursements, performance would have been lower.
Results represent past performance and do not indicate future results. The value of an investment in the Fund and the return on investment both will fluctuate and redemption proceeds may be higher or lower than an investor’s original cost.
|
Top 5 Holdings
|
|
|
Security
|
% of Net Assets
|
|
IRB Brasil Resseguros S
|
2.9%
|
|
Chroma ATE
|
2.7
|
|
Eurobank Ergasias
|
2.4
|
|
ASM Pacific Technology
|
2.3
|
|
International Container Terminal Services
|
2.3
|
|
Geographic Allocation
|
|
|
% of Net Assets
|
|
|
Asia/Far East
|
62.1%
|
|
Latin America
|
18.0
|
|
Europe
|
10.2
|
|
Africa
|
3.0
|
|
Middle East
|
2.4
|
|
Other Assets less Liabilities
|
4.3
|
|
Schroder Core Bond Fund
|
MANAGEMENT DISCUSSION AND ANALYSIS (As of
December 5, 2019)
Performance
For the twelve-month period ended October 31, 2019, the Schroder Core Bond Fund (the “Fund”) returned 11.27% (R6 Shares) compared to the Bloomberg Barclays U.S. Aggregate Bond
Index (the “Index”), which returned 11.51% during the same period.
Market Backdrop
Following a disappointing end to 2018, bond markets opened 2019 with strong performance across the board. In the U.S., risk assets rallied to start the year spurred by better
than expected economic data and a sudden dovish turn by the U.S. Federal Reserve (the “Fed”). A massive increase in non-farm payrolls drove the rally in January and was further bolstered by the Fed’s decision at their January meeting to leave rates
unchanged. Risk assets continued on a positive trajectory for the remainder of the quarter, although to a lesser degree. Later, in March, any lingering concerns that the Fed might take a hawkish turn were put to rest as they announced no rate hikes
for the remainder of the year and an end to balance sheet run-off in September. The unexpected dovish sentiment provided a short-term spark to the market that was stifled by fears of a global slowdown and trade wars. However, the pivot to easing rate
policy remained a constant theme through the rest of the year and globally for major Central Banks. Investor concern subsequently shifted from the trade war to the U.S. yield curve, as the curve inverted in March for the first time since 2007. Given
the slowdown in activity, particularly across Europe and Asia, the curve inversion was not surprising and despite this development, many risk assets continued the strong rally beginning in late December through March.
Going into the second quarter of 2019, the remaining global central banks came to the rescue. At the macro level, weaker global growth and growing concerns about the global
economy resulted in periods of weakness during the quarter. As a result, central banks made seemingly coordinated dovish comments reassuring investors that they were ready to act in order to sustain the economic expansion. Risk assets and traditional
safe haven assets both rallied in response. Somewhat surprisingly, the U.S.’s escalation of the trade war with China, as well its smaller spats with Mexico and Europe, did little to interrupt this rally.
The third quarter began quietly with positive excess returns across most fixed income sectors. Despite a widely expected rate cut by the Fed in late July, investors were left to
consider if the cut was sufficient. This was followed by a volatile month in August as market participants reacted to a growing list of stresses. Escalating rhetoric in the trade war with China, soft economic data out of Germany, the rising
probability of a “hard Brexit,” and surprise election results in Argentina all contributed to a general risk-off sentiment. Treasuries rallied as a result, with yields approaching historical lows in August. Fixed income assets rebounded in early
September, spurred by positive consumer data and an additional rate cut by the Fed. However, due to repo market turmoil, sentiment towards end the third quarter reinforced concerns about global growth, and a spike in political risk. Positive
headlines from the usual suspects led both equity and fixed income markets higher in October. Market volatility fell precipitously during the month as positive developments with the Brexit resolution and U.S.-China trade deal caused risk assets to
rally. The influx of generally soft economic data (e.g., September retail sales, ISM and CPI all below consensus estimates) seemed to support the market’s belief that the Fed would once again cut rates at the end of October. However, given stronger
housing and the Atlanta Fed’s Q3 GDP tracker pointing to an on-trend 1.8%, there was very little to suggest that a recession is imminent. Nevertheless, the Fed cut rates for the third time this year, with forward guidance signaling no further cuts.
Fixed income markets reacted accordingly, with Treasury yields dropping and spreads widening. Overall, October was a positive month for risk assets as the Fed continues to be a dominant force supporting investor sentiment, as it has throughout 2019.
|
Schroder Core Bond Fund
|
Portfolio Review
The Fund underperformed the Index for the twelve-month period ended October 31, 2019. The Fund’s overweight to Agency Mortgage-Backed Securities (“MBS”) was a major factor in
underperformance. Agency MBS posted excess returns of 8.87% through October 31, according to the Bloomberg Barclays Mortgage Backed Securities Index, lagging both corporates and Treasuries. Security selection within the Agency MBS sector was also a
modest detractor. However, out-of-benchmark Prime MBS exposure was a positive contributor within the securitized sector. Yield curve and duration positioning had a modestly negative effect, mostly due to shorter duration corporate bonds
underperforming longer duration Treasury bonds.
Positive sector allocation further mitigated negative returns, mainly due to the Fund’s overweight to the corporate sector. Within corporates, the Fund’s overweight to
financials was the leading contributor, as the financial sector posted positive excess returns of 13.33%, as measured by the Bloomberg Barclays Corporate Index. Issue selection within industrials also contributed positively to performance, with names
like AT&T and Apache standing out.
Outlook
Looking forward to the upcoming year, risk assets appear to believe in the omnipotence of central banks. With flows rather than fundamentals driving returns we would suggest
investors proceed with caution at this juncture. Markets will need to navigate various cross-currents in the coming months: uncertainty with regards to trade, a Fed that is easing amidst a cyclical slowdown, Brexit, and the ramp-up of the 2020 U.S.
election cycle, just to name a few. Our view is that the easy money in most markets has been made and that risk assets will face some challenges ahead. This is particularly true as we believe valuations in the credit sectors are now approaching the
more expensive end of their cyclical range. The liquidity environment will likely keep risk assets supported, but it’s difficult to see material appreciation from here absent a change in the underlying fundamentals.
So where does this leave us in our asset allocation? With headwinds building and valuations full, we remain cautious on riskier segments of fixed income. Our allocation to the
corporate sector remains as low as it has been in a number of years. Conversely, our allocations to highly liquid Treasuries and mortgages are at their highest levels. We prefer mortgages over other spread markets, as valuations are near their
cheapest levels of the post-crisis period. Fundamentals are also preferable, in our opinion, as debt growth in the mortgage market has significantly lagged that of the corporate market. We believe that exposure to collateralized loan obligations is
an additional way to diversify corporate exposure while maintaining an income advantage and more defensive positioning in the AAA class only. Our view is that the ensuing months will present opportunity in markets, and we want to have the liquidity
available to take advantage of it.
With regard to rates, we believe the peak in yields was seen in 2018. A Fed in easing mode and slower growth suggest that fixed income assets are likely to remain well
supported. Higher quality fixed income products should still offer value in both absolute terms and relative to other asset classes, especially in an environment where volatility is likely to remain high and central banks globally are continuing to
embrace easy money.
|
Schroder Core Bond Fund
|
Comparison of Change in the Value of a $1,000,000 Investment in the
Schroder Core Bond Fund R6 Shares vs. the Bloomberg Barclays U.S. Aggregate Bond Index.
Schroder Core Bond Fund R6 Shares vs. the Bloomberg Barclays U.S. Aggregate Bond Index.
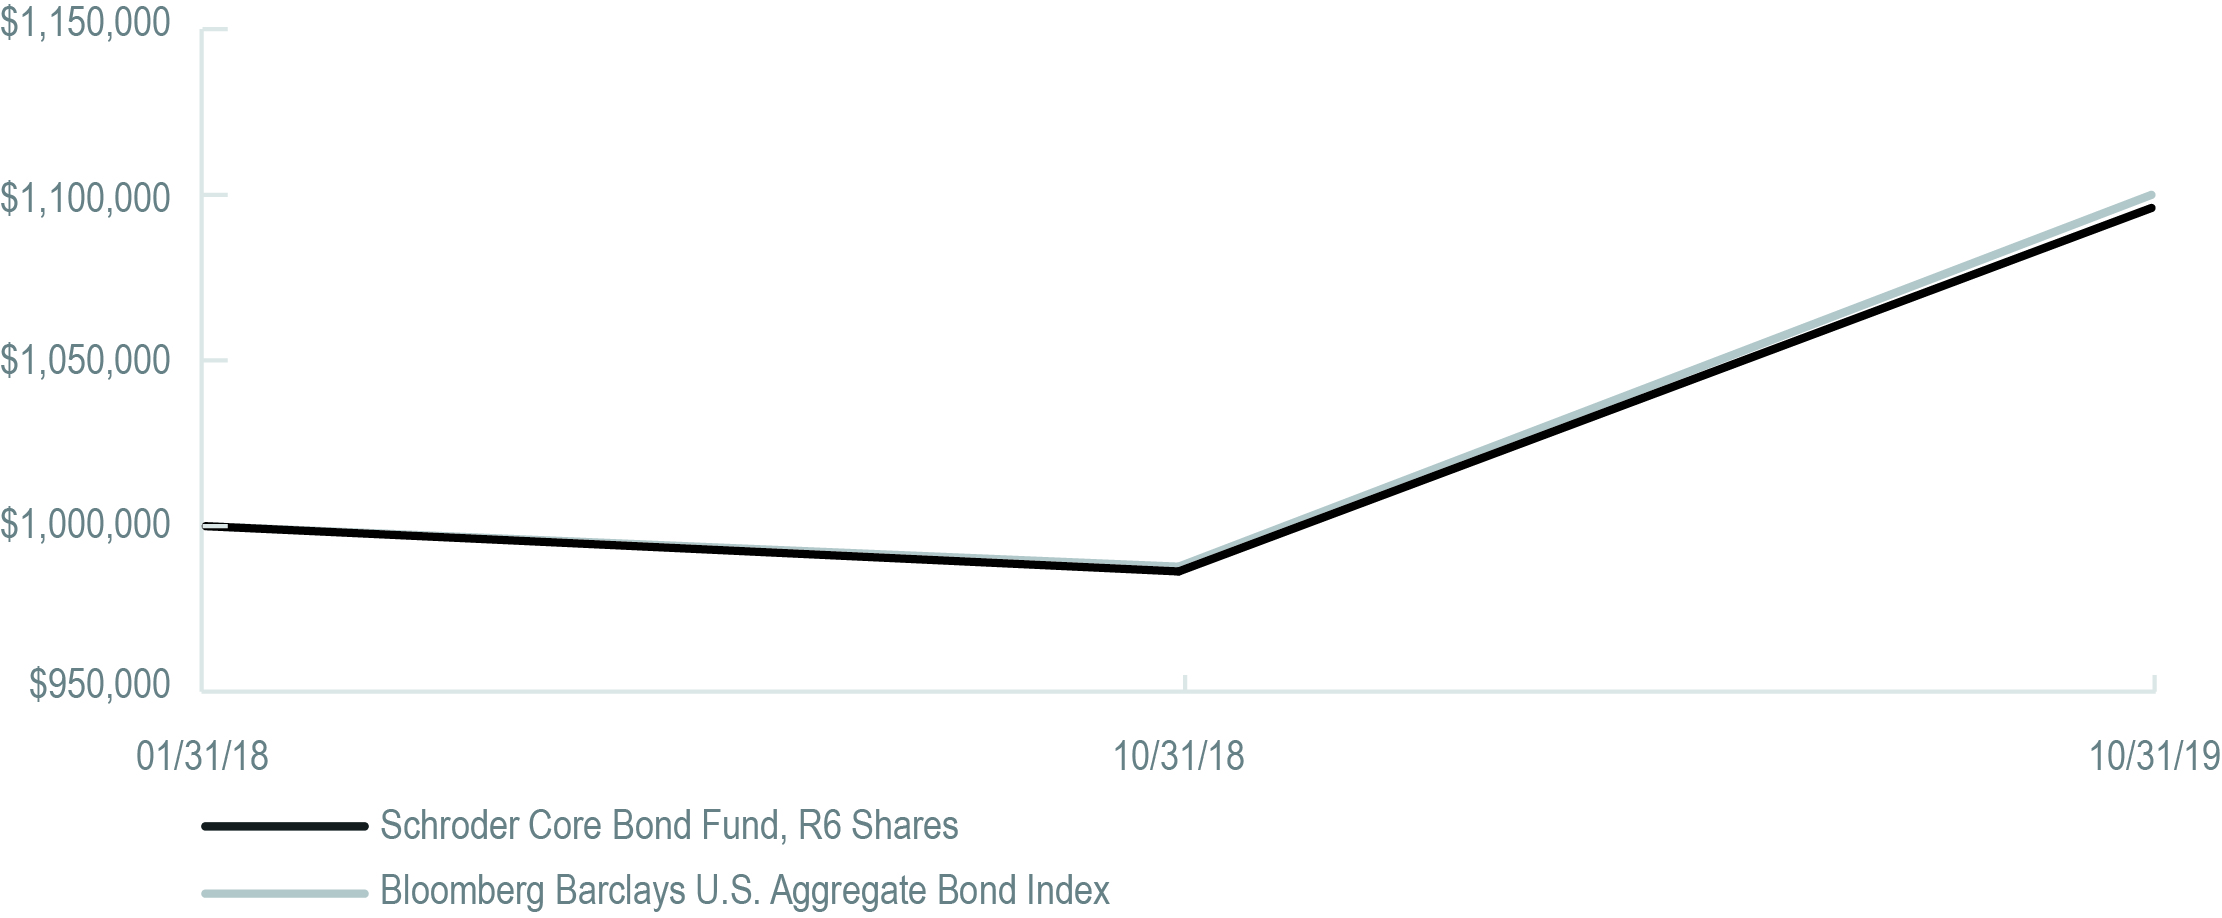
The Bloomberg Barclays U.S. Aggregate Bond Index provides a measure of the performance of the U.S. investment grade bonds market, which includes investment
grade U.S. Government bonds, investment grade corporate bonds, mortgage pass-through securities and asset-backed securities that are publicly offered for sale in the United States. The securities in the Index must have a least one year remaining to
maturity. The Index is not managed.
Performance Information
|
One Year Ended
October 31, 2019
|
Annualized
Since Inception (a) |
|
|
Schroder Core Bond Fund
|
||
|
R6 Shares
|
11.27%
|
5.45%
|
|
Bloomberg Barclays U.S. Aggregate Bond Index
|
11.51%
|
5.67%
|
| (a) |
From commencement of fund operations January 31, 2018.
|
“Total Return” is calculated including reinvestment of all dividends and distributions. Results do not reflect the deduction of taxes that
a shareholder would pay on fund distributions or the redemption of fund shares. Returns for certain periods reflect fee waivers and/or reimbursements in effect for that period; absent fee waivers and reimbursements, performance would have been lower.
Results represent past performance and do not indicate future results. The value of an investment in the Fund and the return on investment both will fluctuate and redemption proceeds may be higher or lower than an investor’s original cost.
|
Top 5 Holdings
|
|
|
Security
|
% of Net Assets
|
|
United States Treasury Note 1.500%, 08/15/22
|
8.4%
|
|
United States Treasury Note 1.500%, 09/30/24
|
6.5
|
|
FNMA 3.500%, 11/01/47
|
3.1
|
|
United States Treasury Note 1.625%, 09/30/26
|
2.7
|
|
United States Treasury Bond 4.500%, 02/15/36
|
2.7
|
|
Sector Allocation
|
|
|
Sector
|
% of Net Assets
|
|
Corporate Obligations
|
38.9%
|
|
U.S. Treasury Obligations
|
34.3
|
|
U.S. Government Mortgage-Backed Obligations
|
22.3
|
|
Collateralized Mortgage Obligations
|
2.3
|
|
Commercial Mortgage-Backed Obligations
|
0.4
|
|
Taxable Municipal Bond
|
0.2
|
|
Other Assets less Liabilities
|
1.6
|
|
Schroder Long Duration Investment-Grade Bond Fund
|
MANAGEMENT DISCUSSION AND ANALYSIS (As of
December 5, 2019)
Performance
For the twelve-month period ended October 31, 2019, the Schroder Long Duration Investment-Grade Bond Fund (the “Fund”) returned 25.74% (Investor Shares), compared to the
Bloomberg Barclays Long Government/Credit Bond Index (the “Index”), a broad-based basket of debt securities, which returned 26.03% during the same period.
Market background
Following a disappointing end to 2018, bond markets opened 2019 with strong performance across the board. In the U.S., risk assets rallied to start the year spurred by better
than expected economic data and a sudden dovish turn by the U.S. Federal Reserve (the “Fed”). A massive increase in non-farm payrolls drove the rally in January and was further bolstered by the Fed’s decision at their January meeting to leave rates
unchanged. Risk assets continued on a positive trajectory for the remainder of the quarter, although to a lesser degree. Later in March, any lingering concerns that the Fed might take a hawkish turn were put to rest as they announced no rate hikes
for the remainder of the year and an end to balance sheet run-off in September. The unexpected dovish sentiment provided a short-term spark to the market that was stifled by fears of a global slowdown and trade wars. however, the pivot to easing rate
policy remained a constant theme through the rest of the year and globally for major Central Banks. Investor concern subsequently shifted from the trade war to the U.S. yield curve, as the curve inverted in March for the first time since 2007. Given
the slowdown in activity, particularly across Europe and Asia, the curve inversion was not surprising and despite this development many risk assets continued the strong rally beginning in late December through March.
Going into the second quarter of 2019, the remaining global central banks came to the rescue. At the macro level, weaker global growth and growing concerns about the global
economy resulted in periods of weakness during the quarter. As a result, central banks made seemingly coordinated dovish comments reassuring investors that they were ready to act in order to sustain the economic expansion. Risk assets and traditional
safe haven assets both rallied in response. Somewhat surprisingly, the U.S.’s escalation of the trade war with China, as well as its smaller spats with Mexico and Europe, did little to interrupt this rally.
The third quarter began quietly with positive excess returns across most fixed income sectors. Despite a widely expected rate cut by the Fed in late July, investors were left to
consider if the cut was sufficient. This was followed by a volatile month in August as market participants reacted to a growing list of stresses. Escalating rhetoric in the trade war with China, soft economic data out of Germany, the rising
probability of a “hard Brexit,” and surprise election results in Argentina all contributed to a general risk-off sentiment. Treasuries rallied as a result, with yields approaching historical lows in August. Fixed income assets rebounded in early
September, spurred by positive consumer data and an additional rate cut by the Fed. However, due to repo market turmoil, sentiment towards end the third quarter reinforced concerns about global growth, and a spike in political risk. Positive
headlines from the usual suspects led both equity and fixed income markets higher in October. Market volatility fell precipitously during the month as positive developments with the Brexit resolution and U.S.-China trade deal caused risk assets to
rally. The influx of generally soft economic data (e.g., September retail sales, ISM and CPI all below consensus estimates) seemed to support the market’s belief that the Fed would once again cut rates at the end of October. However, given stronger
housing and the Atlanta Fed’s Q3 GDP tracker pointing to an on-trend 1.8%, there was very little to suggest that a recession is imminent. Nevertheless, the Fed cut rates for the third time this year, with forward guidance signaling no further cuts.
Fixed income markets reacted accordingly, with Treasury yields dropping and spreads widening. Overall, October was a positive month for risk assets as the Fed continues to be a dominant force supporting investor sentiment, as it has throughout 2019.
|
Schroder Long Duration Investment-Grade Bond Fund
|
Portfolio Review
The Fund underperformed the Index for the twelve-month period ended October 31, 2019. Sector allocation was a major factor in underperformance. Within corporates, overweighting
financials and slightly underweighting utilities led to outperformance, but emerging markets sovereign exposure was a major detractor. Issuer selection within corporates, particularly industrials, mitigated some underperformance. Industrial names
like Cigna Corporation, Telecom Communications, and Newell stood out as top contributors. The Fund’s slightly short duration relative to the benchmark also detracted from returns.
Outlook
Looking forward to the upcoming year, risk assets appear to believe in the omnipotence of central banks. With flows rather than fundamentals driving returns we would suggest
investors proceed with caution at this juncture. Markets will need to navigate various cross-currents in the coming months: uncertainty with regards to trade, a Fed that is easing amidst a cyclical slowdown, Brexit, and the ramp-up of the 2020 U.S.
election cycle, just to name a few. Our view is that the easy money in most markets has been made and that risk assets will face some challenges ahead. This is particularly true as we believe valuations in the credit sectors are now approaching the
more expensive end of their cyclical range. The liquidity environment will likely keep risk assets supported, but it’s difficult to see material appreciation from here absent a change in the underlying fundamentals.
So where does this leave us in our asset allocation? With headwinds building and valuations full, we remain cautious on riskier segments of fixed income. Our allocation to the
corporate sector remains as low as it has been in a number of years. Conversely, our allocations to highly liquid Treasuries are at their highest levels. We believe the ensuing months will present opportunity in markets and we want to have the
liquidity available to take advantage of it.
With regard to rates, we believe the peak in yields was seen in 2018. A Fed in easing mode and slower growth suggest that fixed income assets are likely to remain well
supported. Higher quality fixed income products should still offer value in both absolute terms and relative to other asset classes, especially in an environment where volatility is likely to remain high and central banks globally are continuing to
embrace easy money.
|
Schroder Long Duration Investment-Grade Bond Fund
|
Comparison of Change in the Value of a $250,000 Investment in
the Schroder Long Duration Investment-Grade Bond Fund, Investor Shares
vs. the Bloomberg Barclays U.S. Long Government/Credit Bond Index.
the Schroder Long Duration Investment-Grade Bond Fund, Investor Shares
vs. the Bloomberg Barclays U.S. Long Government/Credit Bond Index.
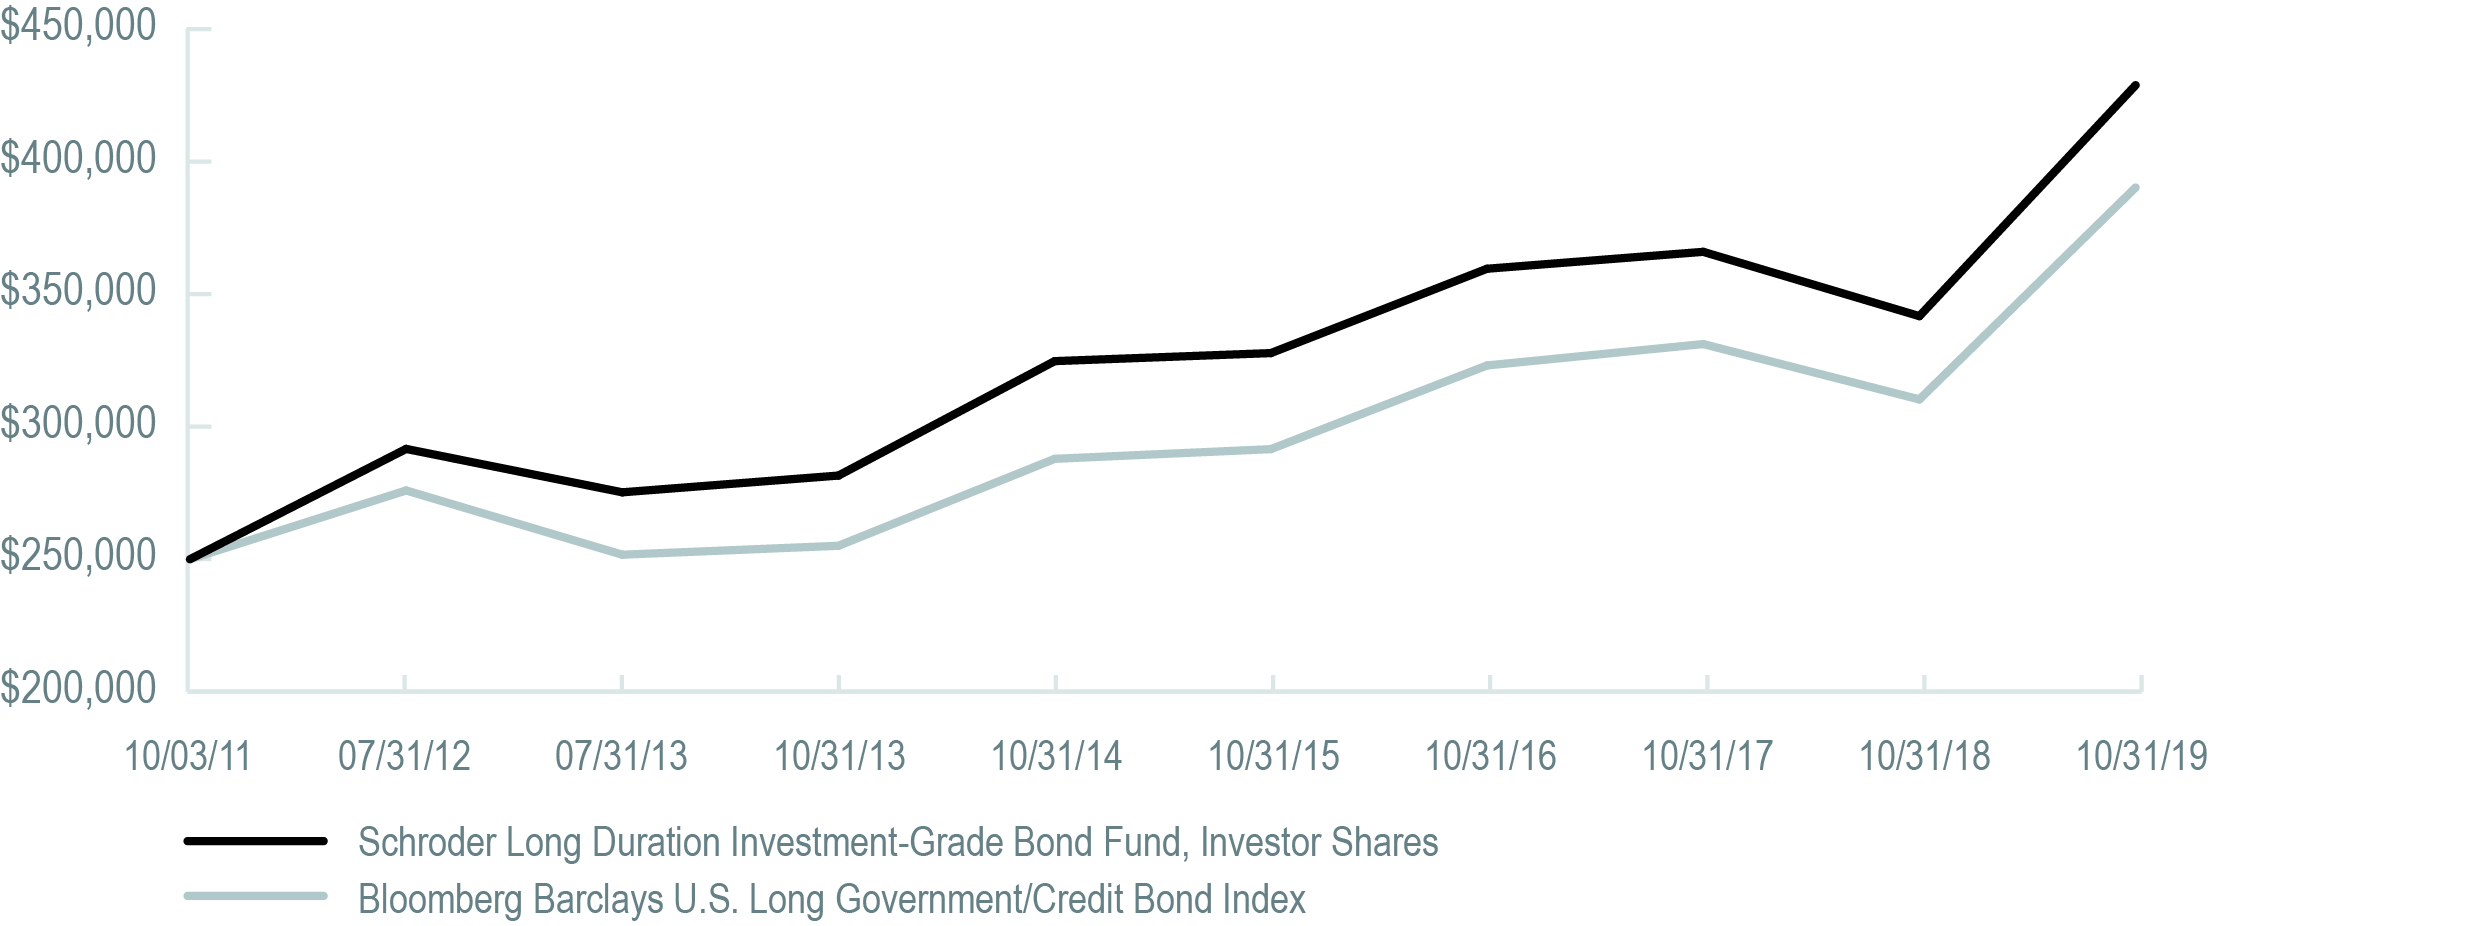
The Bloomberg Barclays U.S. Long Government/Credit Bond Index is a bond market index covering the U.S. investment-grade fixed corporate and
government bond market. The index consists of publicly issued corporate, U.S. government and specified foreign debentures and secured notes. All securities must have at least ten years to maturity and be rated investment-grade by at least two of the
following ratings agencies: Moody’s, S&P and Fitch, and be dollar-denominated, fixed rate and nonconvertible.
Performance Information
|
One Year Ended
October 31, 2019 |
Five Years Ended
October 31, 2019 (a) |
Annualized
Since Inception (b) |
|
|
Schroder Long Duration Investment-Grade Bond Fund
|
|||
|
Investor Shares
|
25.74%
|
5.77%
|
6.98%
|
|
Bloomberg Barclays U.S. Long Government/Credit Bond Index
|
26.03%
|
6.34%
|
5.72%
|
| (a) |
Average annual total returns.
|
| (b) |
From commencement of fund operations on October 3, 2011.
|
“Total Return” is calculated including reinvestment of all dividends and distributions. Results do not reflect the deduction of taxes that
a shareholder would pay on fund distributions or the redemption of fund shares. Returns for certain periods reflect fee waivers and/or reimbursements in effect for that period; absent fee waivers and reimbursements, performance would have been lower.
Results represent past performance and do not indicate future results. The value of an investment in the Fund and the return on investment both will fluctuate and redemption proceeds may be higher or lower than an investor’s original cost.
|
Top 5 Holdings
|
|
|
Security
|
% of Net Assets
|
|
United States Treasury Bond 2.875%, 05/15/43
|
10.6%
|
|
United States Treasury Bond 2.750%, 08/15/47
|
7.6
|
|
United States Treasury Bond 4.500%, 02/15/36
|
5.9
|
|
United States Treasury Bond 2.750%, 11/15/47
|
3.3
|
|
United States Treasury Bond 3.000%, 08/15/48
|
2.9
|
|
Sector Allocation
|
|
|
Sector
|
% of Net Assets
|
|
Corporate Obligations
|
59.6%
|
|
U.S. Treasury Obligations
|
38.5
|
|
Taxable Municipal Bond
|
0.8
|
|
Other Assets less Liabilities
|
1.1
|
|
Schroder Short Duration Bond Fund
|
MANAGEMENT DISCUSSION AND ANALYSIS (As of
December 5, 2019)
Performance
For the twelve-month period ended October 31, 2019, the Schroder Short Duration Bond Fund (the “Fund”) returned 4.88% (Investor Shares) and 4.99% (R6 Shares), compared to the
ICE BofAML 1-3 Year Treasury Index (the “Index”), which returned 4.54% during the same period.
Market Backdrop
Following a disappointing end to 2018, bond markets opened 2019 with strong performance across the board. In the U.S., risk assets rallied to start the year spurred by better
than expected economic data and a sudden dovish turn by the U.S. Federal Reserve (the “Fed”). A massive increase in non-farm payrolls drove the rally in January and was further bolstered by the Fed’s decision in their January meeting to leave rates
unchanged. Risk assets continued on a positive trajectory for the remainder of the quarter, although to a lesser degree. Later, in March, any lingering concerns that the Fed might take a hawkish turn were put to rest as they announced no rate hikes
for the remainder of the year and an end to balance sheet run-off in September. The unexpected dovish sentiment provided a short-term spark to the market that was stifled by fears of a global slowdown and trade wars. However, the pivot to easing rate
policy remained a constant theme through the rest of the year and globally for major Central Banks. Investor concern subsequently shifted from the trade war to the U.S. yield curve, as the curve inverted in March for the first time since 2007. Given
the slowdown in activity, particularly across Europe and Asia, the curve inversion was not surprising and despite this development many risk assets continued the strong rally beginning in late December through March.
Going into the second quarter of 2019, the remaining global central banks came to the rescue. At the macro level, weaker global growth and growing concerns about the global
economy resulted in periods of weakness during the quarter. As a result, central banks made seemingly coordinated dovish comments reassuring investors that they were ready to act in order to sustain the economic expansion. Risk assets and traditional
safe haven assets both rallied in response. Somewhat surprisingly, the escalation of the U.S.’s trade war with China, as well as its smaller spats with Mexico and Europe, did little to interrupt this rally.
The third quarter began quietly with positive excess returns across most fixed income sectors. Despite a widely expected rate cut by the Fed in late July, investors were left to
consider if the cut was sufficient. This was followed by a volatile month in August as market participants reacted to a growing list of stresses. Escalating rhetoric in the U.S.-China trade war, soft economic data out of Germany, the rising
probability of a “hard Brexit,” and surprise election results in Argentina all contributed to a general risk-off sentiment. Treasuries rallied as a result, with yields approaching historical lows in August. Fixed income assets rebounded in early
September, spurred by positive consumer data and an additional rate cut by the Fed. However, due to repo market turmoil sentiment towards end the third quarter, reinforced concerns about global growth, and a spike in political risk. Positive
headlines from the usual suspects led both equity and fixed income markets higher in October. Market volatility fell precipitously during the month as positive developments with the Brexit resolution and U.S.-China trade deal caused risk assets to
rally. The influx of generally soft economic data (e.g., September retail sales, ISM and CPI all below consensus estimates) seemed to support the market’s belief that the Fed would once again cut rates at the end of October. However, given stronger
housing and the Atlanta Fed’s Q3 GDP tracker pointing to an on-trend 1.8%, there was very little to suggest that a recession is imminent. Nevertheless, the Fed cut rates for the third time this year, with forward guidance signaling no further cuts.
Fixed income markets reacted accordingly, with Treasury yields dropping and spreads widening. Overall, October was a positive month for risk assets as the Fed continues to be a dominant force supporting investor sentiment, as it has throughout 2019.
|
Schroder Short Duration Bond Fund
|
Portfolio Review
The Fund outperformed the Index for the twelve-month period ended October 31, 2019. Sector allocation drove performance, with issue selection having no positive or negative
impact on returns given the 100% Treasury benchmark. Overweighting industrials and financials to the benchmark was the main driver due to the strong corporate rally since Q4 2018. Out-of-benchmark exposure to the securitized sector, Prime
Mortgage-Backed Securites (“MBS”) and Collateralized Loan Obligations (“CLOs”), was also a strong driver of outperformance. Agency MBS exposure slightly detracted from outperformance as lower rates and increasing prepayments left the sector lagging
corporates and Treasuries over the period in terms of excess returns. The Fund’s modestly short duration relative to the benchmark also slightly detracted from overall returns due to rates moving lower.
Although the Fund is positioned with exposure to corporates, which are not in the Index, this allocation has low sensitivity to spread risk, as measured by duration times
spread. Throughout the period we reduced the overall corporate exposure in lieu of defensive, high quality securitized bonds, which we believe has diversified risk in the Fund.
Outlook
Looking forward to the upcoming year, risk assets appear to believe in the omnipotence of central banks. With flows rather than fundamentals driving returns we would suggest
investors proceed with caution at this juncture. Markets will need to navigate various cross-currents in the coming months: uncertainty with regards to trade, a Fed that is easing amidst a cyclical slowdown, Brexit, and the ramp-up of the 2020 U.S.
election cycle just to name a few. Our view is that the easy money in most markets has been made and that risk assets will face some challenges ahead. This is particularly true as we believe valuations in the credit sectors are now approaching the
more expensive end of their cyclical range. The liquidity environment will likely keep risk assets supported, but it’s difficult to see material appreciation from here absent a change in the underlying fundamentals.
So where does this leave us in our asset allocation? With headwinds building and valuations full, we remain cautious on riskier segments of fixed income. Our allocation to the
corporate sector remains as low as it has been in a number of years. Conversely, our allocations to highly liquid Treasuries and mortgages are at their highest levels. We prefer mortgages over other spread markets, as valuations are near their
cheapest levels of the post-crisis period. Fundamentals are also preferable, in our opinion, as debt growth in the mortgage market has significantly lagged that of the corporate market. We believe exposure to collateralized loan obligations is an
additional way to diversify corporate exposure while maintaining an income advantage and more defensive positioning in the AAA class only. Our view is that the ensuing months will present opportunity in markets and we want to have the liquidity
available to take advantage of it.
With regard to rates, we believe the peak in yields was seen in 2018. A Fed in easing mode and slower growth suggest that fixed income assets are likely to remain well
supported. Higher quality fixed income products should still offer value in both absolute terms and relative to other asset classes, especially in an environment where volatility is likely to remain high and central banks globally are continuing to
embrace easy money.
|
Schroder Short Duration Bond Fund
|
Comparison of Change in the Value of a $250,000 Investment in the Schroder Short Duration Bond Fund —
R6 and Investor Shares vs. the ICE BofAML 1-3 Year Treasury Index.
R6 and Investor Shares vs. the ICE BofAML 1-3 Year Treasury Index.
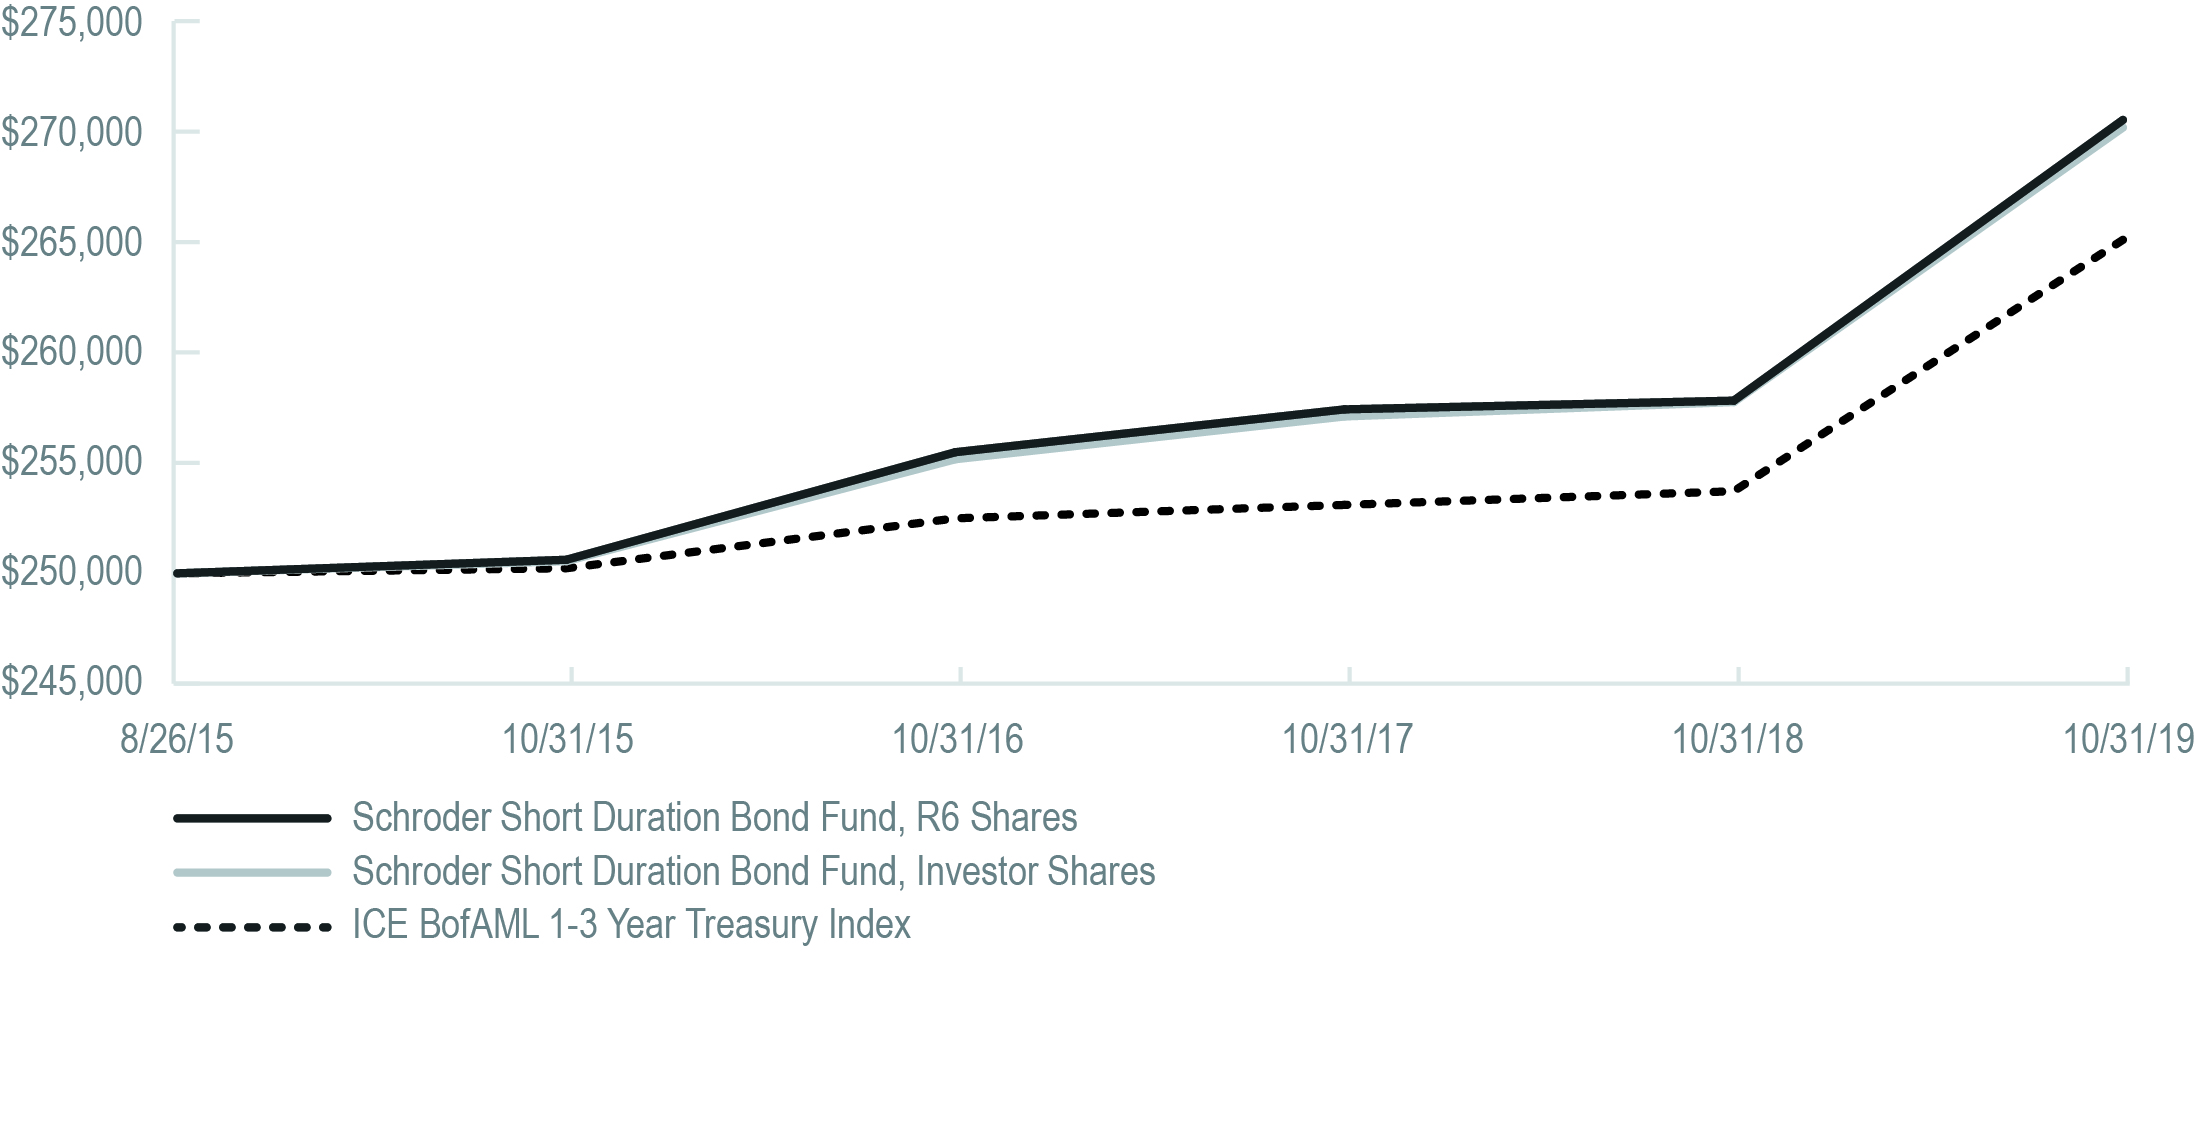
The ICE BofAML 1-3 Year Treasury Index is an unmanaged index that tracks the performance of the direct sovereign debt
of the U.S. Government having a maturity of at least one year and less than three years.
|
One Year Ended
October 31, 2019 |
Annualized
Since Inception (a) |
|
|
Schroder Short Duration Bond Fund
|
||
|
R6 Shares
|
4.99%
|
1.93%
|
|
Investor Shares
|
4.88%
|
1.90%
|
|
ICE BofAML 1-3 Year Treasury Index
|
4.54%
|
1.43%
|
| (a) |
From commencement of fund operations on August 26, 2015.
|
“Total Return” is calculated including reinvestment of all dividends and distributions. Results do not reflect the deduction of taxes that
a shareholder would pay on fund distributions or the redemption of fund shares. Returns for certain periods reflect fee waivers and/or reimbursements in effect for that period; absent fee waivers and reimbursements, performance would have been lower.
Results represent past performance and do not indicate future results. The value of an investment in the Fund and the return on investment both will fluctuate and redemption proceeds may be higher or lower than an investor’s original cost.
|
Top 5 Holdings
|
|
|
Security
|
% of Net Assets
|
|
United States Treasury Note 2.25%, 04/15/22
|
13.9%
|
|
United States Treasury Bill 1.572%, 02/27/20
|
11.3
|
|
United States Treasury Note 2.25%, 03/31/20
|
4.9
|
|
United States Treasury Note 2.5%, 02/28/21
|
3.0
|
|
Microsoft
|
2.3
|
|
Sector Allocation
|
|
|
Sector
|
% of Net Assets
|
|
U.S. Treasury Obligations
|
39.1%
|
|
Corporate Obligations
|
37.2
|
|
U.S. Government Mortgage-Backed Obligations
|
9.6
|
|
Asset-Backed Securities
|
8.9
|
|
Collateralized Mortgage Obligations
|
2.7
|
|
Commercial Mortgage-Backed Obligations
|
1.0
|
|
Taxable Municipal Bond
|
0.2
|
|
Other Assets less Liabilities
|
1.3
|
|
Schroder Total Return Fixed Income Fund
|
MANAGEMENT DISCUSSION AND ANALYSIS (As of
December 5, 2019)
Performance
For the twelve-month period ended October 31, 2019, the Schroder Total Return Fixed Income Fund (the “Fund”) returned 10.93% (Investor Shares), compared to the Bloomberg
Barclays U.S. Aggregate Bond Index (the “Index”), which returned 11.51% during the same period.
Market Background
Following a disappointing end to 2018, bond markets opened 2019 with strong performance across the board. In the U.S., risk assets rallied to start the year spurred by better
than expected economic data and a sudden dovish turn by the U.S. Federal Reserve (the “Fed”). A massive increase in non-farm payrolls drove the rally in January and was further bolstered by the Fed’s decision at their January meeting to leave rates
unchanged. Risk assets continued on a positive trajectory for the remainder of the quarter, although to a lesser degree. Later in March, any lingering concerns that the Fed might take a hawkish turn were put to rest as they announced no rate hikes
for the remainder of the year and an end to balance sheet run-offs in September. The unexpected dovish sentiment provided a short-term spark to the market that was stifled by fears of a global slowdown and trade wars. However, the pivot to easing
rate policy remained a constant theme through the rest of the year and globally for major Central Banks. Investor concern subsequently shifted from the trade war to the U.S. yield curve, as the curve inverted in March for the first time since 2007.
Given the slowdown in activity, particularly across Europe and Asia, the curve inversion was not surprising and despite this development many risk assets continued the strong rally beginning in late December through March.
Going into the second quarter of 2019, the remaining global central banks came to the rescue. At the macro level, weaker global growth and growing concerns about the global
economy resulted in periods of weakness during the quarter. As a result, central banks made seemingly coordinated dovish comments reassuring investors that they were ready to act in order to sustain the economic expansion. Risk assets and traditional
safe haven assets both rallied in response. Somewhat surprisingly, the escalation of the U.S.’s trade war with China, as well as its smaller spats with Mexico and Europe, did little to interrupt this rally.
The third quarter began quietly with positive excess returns across most fixed income sectors. Despite a widely expected rate cut by the Fed in late July, investors were left to
consider if the cut was sufficient. This was followed by a volatile month in August as market participants reacted to a growing list of stresses. Escalating rhetoric in the U.S.-China trade war, soft economic data out of Germany, the rising
probability of a “hard Brexit,” and surprise election results in Argentina all contributed to a general risk-off sentiment. Treasuries rallied as a result, with yields approaching historical lows in August. Fixed income assets rebounded in early
September, spurred by positive consumer data and an additional rate cut by the Fed. However, due to repo market turmoil, sentiment towards end the third quarter, reinforced concerns about global growth and a spike in political risk. Positive
headlines from the usual suspects led both equity and fixed income markets higher in October. Market volatility fell precipitously during the month as positive developments with the Brexit resolution and U.S.-China trade deal caused risk assets to
rally. The influx of generally soft economic data (e.g., September retail sales, ISM and CPI all below consensus estimates) seemed to support the market’s belief that the Fed would once again cut rates at the end of October. However, given stronger
housing and the Atlanta Fed’s Q3 GDP tracker pointing to an on-trend 1.8%, there was very little to suggest that a recession is imminent. Nevertheless, the Fed cut rates for the third time this year, with forward guidance signaling no further cuts.
Fixed income markets reacted accordingly, with Treasury yields dropping and spreads widening. Overall, October was a positive month for risk assets as the Fed continues to be a dominant force supporting investor sentiment, as it has throughout 2019.
|
Schroder Total Return Fixed Income Fund
|
Portfolio Review
The Fund underperformed the Index for the twelve-month period ended October 31, 2019. Issue selection was the main detractor of performance, with sector selection mitigating
negative returns. Issuer selection within corporates, particularly industrials, was the main negative driver. L Brands, the personal apparel, beauty, and personal care brand, faced a decline in earnings due to increased competition and changing
consumer preferences. Issue selection with Agency Mortgage-Backed Securities (“MBS”) was also a detractor, as was exposure to Argentina bonds, where unexpected presidential election results significantly increased risk on the sovereign bond. Strong
sector selection was primarily driven by the Fund’s overweight to corporates and corresponding underweight to U.S. Treasuries.
Although the Fund is positioned with an overweight to corporates, this allocation has low sensitivity to spread risk as measured by duration times spread. Throughout the period
we reduced the overall corporate exposure in lieu of defensive, high quality securitized bonds, which we believe has diversified risk in the Fund.
Outlook
Looking forward to the upcoming year, risk assets appear to believe in the omnipotence of central banks. With flows rather than fundamentals driving returns we would suggest
investors proceed with caution at this juncture. Markets will need to navigate various cross-currents in the coming months: uncertainty with regards to trade, a Fed that is easing amidst a cyclical slowdown, Brexit, and the ramp-up of the 2020 U.S.
election cycle, just to name a few. Our view is that the easy money in most markets has been made and that risk assets will face some challenges ahead. This is particularly true as we believe valuations in the credit sectors are now approaching the
more expensive end of their cyclical range. The liquidity environment will likely keep risk assets supported, but it’s difficult to see material appreciation from here absent a change in the underlying fundamentals.
So where does this leave us in our asset allocation? With headwinds building and valuations full, we remain cautious on riskier segments of fixed income. Our allocation to the
corporate sector remains as low as it has been in a number of years. Conversely, our allocations to highly liquid Treasuries and mortgages are at their highest levels. We prefer mortgages over other spread markets as valuations are near their
cheapest levels of the post-crisis period. Fundamentals are also preferable, in our opinion, as debt growth in the mortgage market has significantly lagged that of the corporate market. We believe exposure to collateralized loan obligations is an
additional way to diversify corporate exposure while maintaining an income advantage and more defensive positioning in the AAA class only. Our view is that the ensuing months will present opportunity in markets, and we want to have the liquidity
available to take advantage of it.
With regard to rates, we believe the peak in yields was seen in 2018. A Fed in easing mode and slower growth suggest that fixed income assets are likely to remain well
supported. Higher quality fixed income products should still offer value in both absolute terms and relative to other asset classes, especially in an environment where volatility is likely to remain high and central banks globally are continuing to
embrace easy money.
|
Schroder Total Return Fixed Income Fund
|
Comparison of Change in the Value of a $250,000 Investment in the Schroder Total Return Fixed Income Fund —
Investor Shares vs. the Bloomberg Barclays U.S. Aggregate Bond Index.
Investor Shares vs. the Bloomberg Barclays U.S. Aggregate Bond Index.
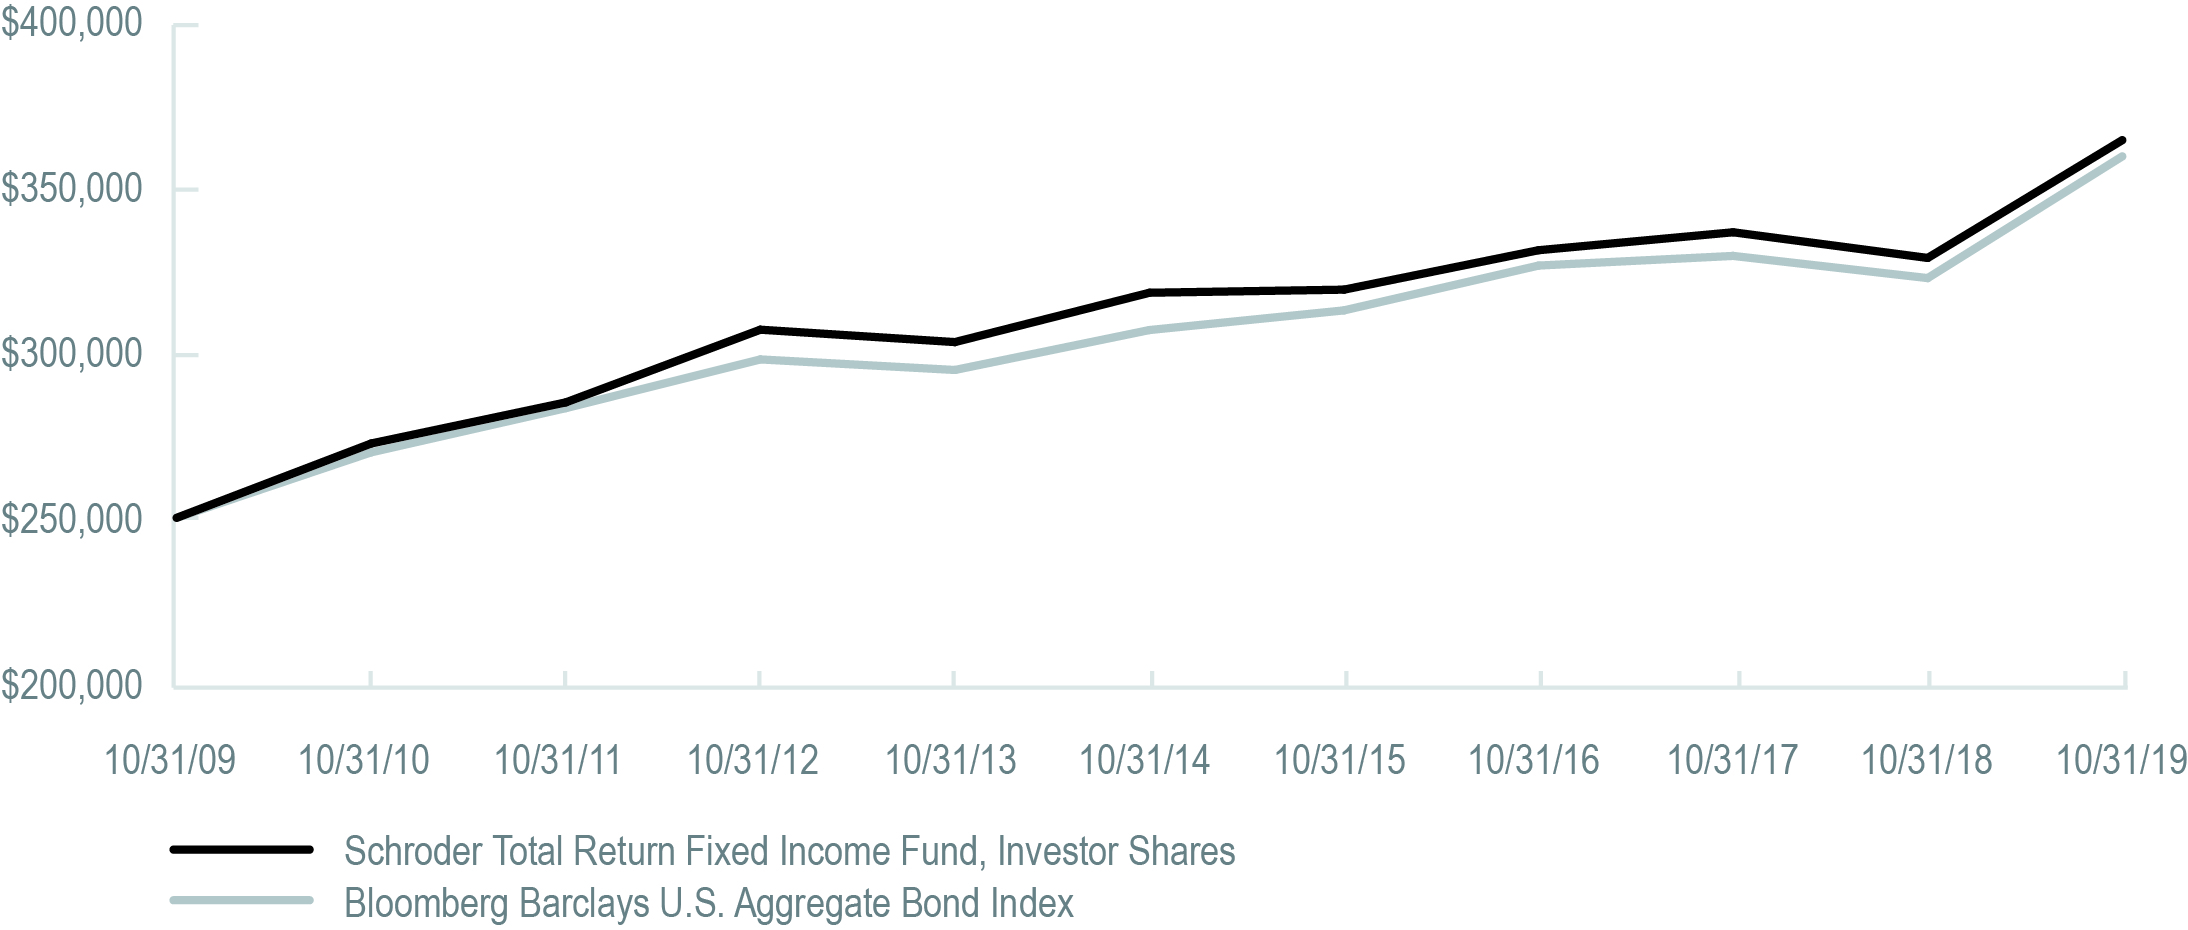
The Bloomberg Barclays U.S. Aggregate Bond Index provides a measure of the performance of the U.S. investment grade bonds market, which includes investment
grade U.S. Government bonds, investment grade corporate bonds, mortgage pass-through securities and asset-backed securities that are publicly offered for sale in the United States. The securities in the Index must have a least one year remaining to
maturity. The Index is not managed.
Performance Information
|
One Year Ended
October 31, 2019 |
Five Years Ended
October 31, 2019 (a) |
Ten Years Ended
October 31, 2019 (a) |
|
|
Schroder Total Return Fixed Income Fund
|
|||
|
Investor Shares
|
10.93%
|
2.77%
|
3.87%
|
|
Bloomberg Barclays U.S. Aggregate Bond Index
|
11.51%
|
3.24%
|
3.73%
|
| (a) |
Average annual total returns.
|
“Total Return” is calculated including reinvestment of all dividends and distributions. Results do not reflect the deduction of taxes that
a shareholder would pay on fund distributions or the redemption of fund shares. Returns for certain periods reflect fee waivers and/or reimbursements in effect for that period; absent fee waivers and reimbursements, performance would have been lower.
Results represent past performance and do not indicate future results. The value of an investment in the Fund and the return on investment both will fluctuate and redemption proceeds may be higher or lower than an investor’s original cost.
|
Top 5 Holdings
|
|
|
Security
|
% of Net Assets
|
|
United States Treasury Note 2.625%, 07/31/20
|
3.9%
|
|
United States Treasury Inflation Indexed Bond 0.750%, 07/15/28
|
2.4
|
|
FNMA 4.500%, 11/01/48
|
2.1
|
|
GNMA 4.000%, 06/20/49
|
1.9
|
|
Madison Park Funding XVIII, Ser 2017-18A, Class A1R 3.156%, 10/21/30
|
1.9
|
|
Sector Allocation
|
|
|
Sector
|
% of Net Assets
|
|
Corporate Obligations
|
38.4%
|
|
U.S. Government Mortgage-Backed Obligations
|
23.9
|
|
U.S. Treasury Obligations
|
16.3
|
|
Asset-Backed Securities
|
10.7
|
|
Collateralized Mortgage Obligations
|
5.7
|
|
Taxable Municipal Bonds
|
1.3
|
|
Commercial Mortgage-Backed Obligations
|
1.2
|
|
Sovereign Governments
|
1.1
|
|
Other Assets less Liabilities
|
1.4
|
|
Schroder North American Equity Fund
|
Schedule of Investments
October 31, 2019
|
Shares
|
Value $
|
||||||
|
COMMON STOCK – 99.1%
|
|||||||
|
Canada – 1.5%
|
|||||||
|
231,900
|
Birchcliff Energy
|
353,898
|
|||||
|
29,500
|
Canadian National Railway
|
2,638,448
|
|||||
|
7,800
|
Canadian Pacific Railway
|
1,773,729
|
|||||
|
16,600
|
CGI Class A (1)
|
1,290,341
|
|||||
|
7,783
|
CI Financial
|
113,279
|
|||||
|
134,800
|
Crew Energy (1)
|
49,126
|
|||||
|
12,100
|
Dollarama
|
407,069
|
|||||
|
23,800
|
Enerflex
|
186,482
|
|||||
|
11,400
|
Genworth MI Canada
|
460,466
|
|||||
|
12,300
|
Gildan Activewear
|
314,247
|
|||||
|
37,300
|
Husky Energy
|
260,542
|
|||||
|
23,300
|
Imperial Oil
|
580,245
|
|||||
|
34,700
|
Magna International Class A
|
1,865,807
|
|||||
|
137,800
|
Manulife Financial
|
2,566,422
|
|||||
|
13,100
|
Open Text
|
529,331
|
|||||
|
36,300
|
Teck Resources Class B
|
573,811
|
|||||
|
31,700
|
TransAlta Renewables
|
341,285
|
|||||
|
16,400
|
Westshore Terminals Investment
|
284,394
|
|||||
|
14,588,922
|
|||||||
|
Israel – 0.3%
|
|||||||
|
26,300
|
Check Point Software Technologies (1)
|
2,956,383
|
|||||
|
United States – 97.3%
|
|||||||
|
Communication Services – 9.5%
|
|||||||
|
12,549
|
Alphabet Class A (1)
|
15,796,681
|
|||||
|
13,094
|
Alphabet Class C (1)
|
16,499,880
|
|||||
|
12,000
|
AMC Networks Class A (1)
|
522,600
|
|||||
|
221,127
|
AT&T
|
8,511,178
|
|||||
|
600
|
Cable One
|
795,222
|
|||||
|
108,500
|
Comcast Class A
|
4,862,970
|
|||||
|
24,000
|
Discovery Class A (1)
|
646,920
|
|||||
|
81,700
|
Facebook Class A (1)
|
15,657,805
|
|||||
|
50,700
|
Fox
|
1,624,428
|
|||||
|
5,000
|
Netflix (1)
|
1,437,050
|
|||||
|
45,900
|
Omnicom Group
|
3,543,021
|
|||||
|
184,630
|
Verizon Communications
|
11,164,576
|
|||||
|
38,100
|
Viacom Class B
|
821,436
|
|||||
|
68,972
|
Walt Disney
|
8,960,842
|
|||||
|
90,844,609
|
|||||||
|
Consumer Discretionary – 10.0%
|
|||||||
|
14,206
|
Amazon.com (1)
|
25,239,232
|
|||||
|
1,900
|
AutoZone (1)
|
2,174,322
|
|||||
|
7,000
|
Best Buy
|
502,810
|
|||||
| Shares |
Value $
|
||||||
|
288
|
Booking Holdings (1)
|
590,046
|
|||||
|
28,600
|
Buckle
|
598,312
|
|||||
|
30,400
|
Capri Holdings (1)
|
944,528
|
|||||
|
21,100
|
Carnival
|
904,979
|
|||||
|
7,200
|
Carter’s
|
721,728
|
|||||
|
25,500
|
CBS Class B
|
919,020
|
|||||
|
20,400
|
Choice Hotels International
|
1,804,992
|
|||||
|
91,800
|
eBay
|
3,235,950
|
|||||
|
24,400
|
Foot Locker
|
1,061,644
|
|||||
|
20,000
|
GameStop Class A (1)
|
108,800
|
|||||
|
24,600
|
Gap
|
399,996
|
|||||
|
29,900
|
Garmin
|
2,803,125
|
|||||
|
25,500
|
General Motors
|
947,580
|
|||||
|
79,400
|
Gentex
|
2,227,170
|
|||||
|
149,000
|
H&R Block
|
3,723,510
|
|||||
|
3,400
|
Helen of Troy (1)
|
509,184
|
|||||
|
12,600
|
Hasbro
|
1,226,106
|
|||||
|
45,493
|
Home Depot
|
10,671,748
|
|||||
|
12,100
|
Kohl’s
|
620,246
|
|||||
|
3,628
|
Kontoor Brands
|
137,864
|
|||||
|
12,000
|
Lear
|
1,413,240
|
|||||
|
7,400
|
Lowe’s
|
825,914
|
|||||
|
22,400
|
MasterCraft Boat Holdings (1)
|
352,800
|
|||||
|
33,181
|
McDonald’s
|
6,526,703
|
|||||
|
39,300
|
Michaels (1)
|
343,089
|
|||||
|
55,800
|
Nike Class B
|
4,996,890
|
|||||
|
350
|
NVR (1)
|
1,272,806
|
|||||
|
5,200
|
O’Reilly Automotive (1)
|
2,264,652
|
|||||
|
27,000
|
PulteGroup
|
1,059,480
|
|||||
|
19,400
|
Ross Stores
|
2,127,598
|
|||||
|
59,900
|
Starbucks
|
5,065,144
|
|||||
|
16,200
|
Tapestry
|
418,932
|
|||||
|
4,500
|
Tiffany
|
560,295
|
|||||
|
59,000
|
TJX
|
3,401,350
|
|||||
|
2,600
|
UniFirst
|
522,184
|
|||||
|
25,400
|
VF
|
2,090,166
|
|||||
|
95,314,135
|
|||||||
|
Consumer Staples – 7.8%
|
|||||||
|
84,500
|
Altria Group
|
3,784,755
|
|||||
|
11,900
|
Brown-Forman Class B
|
779,688
|
|||||
|
33,300
|
Church & Dwight
|
2,329,002
|
|||||
|
14,800
|
Clorox
|
2,185,812
|
|||||
|
198,616
|
Coca-Cola
|
10,810,669
|
|||||
|
60,782
|
Colgate-Palmolive
|
4,169,645
|
|||||
|
1,300
|
Costco Wholesale
|
386,243
|
|||||
|
Schroder North American Equity Fund
|
Schedule of Investments (continued)
October 31, 2019
| Shares |
Value $
|
||||||
|
13,100
|
Estee Lauder Class A
|
2,440,137
|
|||||
|
26,200
|
Hershey
|
3,847,994
|
|||||
|
34,900
|
Kimberly-Clark
|
4,637,512
|
|||||
|
34,600
|
Lamb Weston Holdings
|
2,700,184
|
|||||
|
6,200
|
Lancaster Colony
|
862,916
|
|||||
|
38,400
|
Monster Beverage (1)
|
2,155,392
|
|||||
|
68,024
|
PepsiCo
|
9,330,852
|
|||||
|
66,691
|
Philip Morris International
|
5,431,315
|
|||||
|
115,911
|
Procter & Gamble
|
14,432,079
|
|||||
|
7,800
|
USANA Health Sciences (1)
|
578,058
|
|||||
|
15,900
|
Walgreens Boots Alliance
|
871,002
|
|||||
|
20,723
|
Walmart
|
2,429,979
|
|||||
|
1,900
|
WD-40
|
356,060
|
|||||
|
74,519,294
|
|||||||
|
Energy – 3.8%
|
|||||||
|
53,700
|
Antero Resources (1)
|
134,250
|
|||||
|
46,300
|
Cabot Oil & Gas
|
863,032
|
|||||
|
90,200
|
Callon Petroleum (1)
|
342,760
|
|||||
|
75,463
|
Chevron
|
8,764,273
|
|||||
|
62,500
|
ConocoPhillips
|
3,450,000
|
|||||
|
91,300
|
Diamond Offshore Drilling (1)
|
482,977
|
|||||
|
8,500
|
Diamondback Energy
|
728,960
|
|||||
|
18,800
|
EOG Resources
|
1,303,028
|
|||||
|
173,990
|
ExxonMobil
|
11,756,504
|
|||||
|
61,100
|
Gulfport Energy (1)
|
170,164
|
|||||
|
11,200
|
HollyFrontier
|
615,328
|
|||||
|
76,400
|
Laredo Petroleum Holdings (1)
|
180,304
|
|||||
|
33,800
|
Marathon Petroleum
|
2,161,510
|
|||||
|
99,000
|
Northern Oil and Gas (1)
|
194,040
|
|||||
|
21,700
|
Phillips 66
|
2,534,994
|
|||||
|
43,600
|
ProPetro Holding (1)
|
337,900
|
|||||
|
19,500
|
Valero Energy
|
1,891,110
|
|||||
|
26,300
|
Whiting Petroleum (1)
|
166,742
|
|||||
|
36,077,876
|
|||||||
|
Financials – 13.0%
|
|||||||
|
20,200
|
Affiliated Managers Group
|
1,613,576
|
|||||
|
80,300
|
Aflac
|
4,268,748
|
|||||
|
11,500
|
American Equity Investment Life Holding
|
283,820
|
|||||
|
10,627
|
American Express
|
1,246,335
|
|||||
|
30,000
|
American Financial Group
|
3,121,200
|
|||||
|
3,800
|
American National Insurance
|
455,924
|
|||||
|
15,200
|
Ameriprise Financial
|
2,293,528
|
|||||
|
16,600
|
Athene Holding Class A (1)
|
719,610
|
|||||
|
239,250
|
Bank of America
|
7,481,348
|
|||||
|
15,000
|
BB&T
|
795,750
|
|||||
| Shares |
Value $
|
||||||
|
57,200
|
Berkshire Hathaway Class B (1)
|
12,159,576
|
|||||
|
2,100
|
BlackRock Class A
|
969,570
|
|||||
|
18,436
|
Brighthouse Financial (1)
|
696,143
|
|||||
|
25,000
|
Capital One Financial
|
2,331,250
|
|||||
|
11,300
|
CBOE Holdings
|
1,301,195
|
|||||
|
97,342
|
Citigroup
|
6,994,996
|
|||||
|
57,300
|
Citizens Financial Group
|
2,014,668
|
|||||
|
24,100
|
Eaton Vance
|
1,098,960
|
|||||
|
5,700
|
FactSet Research Systems
|
1,445,064
|
|||||
|
37,700
|
Federated Investors Class B
|
1,204,138
|
|||||
|
13,800
|
Fidelity National Information Services
|
1,818,288
|
|||||
|
1,100
|
First Citizens BancShares Class A
|
541,112
|
|||||
|
4,800
|
First Interstate BancSystem Class A
|
201,408
|
|||||
|
72,000
|
Franklin Resources
|
1,983,600
|
|||||
|
17,400
|
Globe Life
|
1,693,542
|
|||||
|
19,004
|
Goldman Sachs Group
|
4,055,073
|
|||||
|
10,500
|
International Bancshares
|
430,080
|
|||||
|
50,000
|
Invesco
|
841,000
|
|||||
|
131,663
|
JPMorgan Chase
|
16,447,342
|
|||||
|
23,000
|
Lincoln National
|
1,299,040
|
|||||
|
9,100
|
Loews
|
445,900
|
|||||
|
6,300
|
M&T Bank
|
986,139
|
|||||
|
56,200
|
MetLife
|
2,629,598
|
|||||
|
14,200
|
Moody’s
|
3,133,798
|
|||||
|
76,900
|
Morgan Stanley
|
3,541,245
|
|||||
|
13,700
|
National Retail Properties REIT
|
807,067
|
|||||
|
34,400
|
PNC Financial Services Group
|
5,046,480
|
|||||
|
5,100
|
Popular
|
277,746
|
|||||
|
57,800
|
Principal Financial Group
|
3,085,364
|
|||||
|
26,000
|
Prudential Financial
|
2,369,640
|
|||||
|
24,800
|
Raymond James Financial
|
2,070,552
|
|||||
|
5,500
|
S&P Global
|
1,418,945
|
|||||
|
57,300
|
Synchrony Financial
|
2,026,701
|
|||||
|
21,000
|
T. Rowe Price Group
|
2,431,800
|
|||||
|
73,400
|
Unum Group
|
2,021,436
|
|||||
|
195,372
|
Wells Fargo
|
10,087,056
|
|||||
|
124,185,351
|
|||||||
|
Healthcare – 16.2%
|
|||||||
|
41,300
|
Abbott Laboratories
|
3,453,093
|
|||||
|
114,781
|
AbbVie
|
9,130,829
|
|||||
|
8,700
|
Alexion Pharmaceuticals (1)
|
916,980
|
|||||
|
9,600
|
Allergan
|
1,690,656
|
|||||
|
44,817
|
Amgen
|
9,557,225
|
|||||
|
28,300
|
Baxter International
|
2,170,610
|
|||||
|
12,562
|
Biogen (1)
|
3,752,395
|
|||||
|
Schroder North American Equity Fund
|
Schedule of Investments (continued)
October 31, 2019
| Shares |
Value $
|
||||||
|
136,171
|
Bristol-Myers Squibb
|
7,812,130
|
|||||
|
26,700
|
Cerner
|
1,792,104
|
|||||
|
4,000
|
Cooper
|
1,164,000
|
|||||
|
30,100
|
Danaher
|
4,148,382
|
|||||
|
9,900
|
Edwards Lifesciences (1)
|
2,359,962
|
|||||
|
67,261
|
Eli Lilly
|
7,664,391
|
|||||
|
72,104
|
Gilead Sciences
|
4,593,746
|
|||||
|
5,400
|
Idexx Laboratories (1)
|
1,539,054
|
|||||
|
20,500
|
Innoviva (1)
|
238,210
|
|||||
|
4,800
|
Jazz Pharmaceuticals (1)
|
603,024
|
|||||
|
134,784
|
Johnson & Johnson
|
17,796,879
|
|||||
|
6,700
|
McKesson
|
891,100
|
|||||
|
21,700
|
MEDNAX (1)
|
476,532
|
|||||
|
85,169
|
Medtronic
|
9,274,904
|
|||||
|
144,507
|
Merck
|
12,522,977
|
|||||
|
2,400
|
Mettler-Toledo International (1)
|
1,691,856
|
|||||
|
95,700
|
Mylan (1)
|
1,832,655
|
|||||
|
324,747
|
Pfizer
|
12,460,542
|
|||||
|
44,384
|
Quest Diagnostics
|
4,493,880
|
|||||
|
11,600
|
ResMed
|
1,715,872
|
|||||
|
33,600
|
SIGA Technologies (1)
|
186,480
|
|||||
|
5,800
|
STERIS
|
821,106
|
|||||
|
15,999
|
Stryker
|
3,460,104
|
|||||
|
21,200
|
Thermo Fisher Scientific
|
6,401,976
|
|||||
|
47,400
|
UnitedHealth Group
|
11,977,980
|
|||||
|
24,800
|
Varian Medical Systems (1)
|
2,996,088
|
|||||
|
12,308
|
Waters (1)
|
2,604,619
|
|||||
|
2,800
|
West Pharmaceutical Services
|
402,752
|
|||||
|
154,595,093
|
|||||||
|
Industrials – 10.8%
|
|||||||
|
29,535
|
3M
|
4,872,980
|
|||||
|
24,300
|
Allegion
|
2,819,772
|
|||||
|
49,300
|
Allison Transmission Holdings Class A
|
2,149,973
|
|||||
|
36,600
|
AMETEK
|
3,354,390
|
|||||
|
11,700
|
Boeing
|
3,976,947
|
|||||
|
7,900
|
Brady Class A
|
445,086
|
|||||
|
24,400
|
Caterpillar
|
3,362,320
|
|||||
|
21,900
|
CH Robinson Worldwide
|
1,656,516
|
|||||
|
7,800
|
Cintas
|
2,095,626
|
|||||
|
15,000
|
Copart (1)
|
1,239,600
|
|||||
|
15,300
|
Cummins
|
2,638,944
|
|||||
|
26,900
|
Delta Air Lines
|
1,481,652
|
|||||
|
14,200
|
Deluxe
|
735,986
|
|||||
|
14,100
|
Donaldson
|
743,634
|
|||||
|
20,300
|
Dover
|
2,108,967
|
|||||
| Shares |
Value $
|
||||||
|
26,100
|
Eaton
|
2,273,571
|
|||||
|
64,271
|
Emerson Electric
|
4,508,611
|
|||||
|
9,600
|
Ennis
|
188,064
|
|||||
|
42,500
|
Expeditors International of Washington
|
3,099,950
|
|||||
|
60,600
|
Fastenal
|
2,177,964
|
|||||
|
37,950
|
Fortive
|
2,618,550
|
|||||
|
17,200
|
Graco
|
777,440
|
|||||
|
41,600
|
GrafTech International
|
502,528
|
|||||
|
32,191
|
Honeywell International
|
5,560,351
|
|||||
|
16,000
|
Hubbell Class B
|
2,267,200
|
|||||
|
10,700
|
IDEX
|
1,664,171
|
|||||
|
22,400
|
Illinois Tool Works
|
3,776,192
|
|||||
|
21,700
|
Landstar System
|
2,455,355
|
|||||
|
10,659
|
Lincoln Electric Holdings
|
954,727
|
|||||
|
9,900
|
Lockheed Martin
|
3,729,132
|
|||||
|
29,000
|
Meritor (1)
|
638,870
|
|||||
|
3,400
|
MSA Safety
|
408,238
|
|||||
|
19,600
|
MSC Industrial Direct Class A
|
1,434,916
|
|||||
|
23,600
|
Norfolk Southern
|
4,295,200
|
|||||
|
2,500
|
Old Dominion Freight Line
|
455,200
|
|||||
|
9,200
|
Parker Hannifin
|
1,688,108
|
|||||
|
10,500
|
Regal-Beloit
|
777,525
|
|||||
|
34,400
|
Robert Half International
|
1,970,088
|
|||||
|
5,500
|
Rockwell Automation
|
945,945
|
|||||
|
10,200
|
Roper Technologies
|
3,436,992
|
|||||
|
14,900
|
Snap-on
|
2,423,783
|
|||||
|
8,700
|
Timken
|
426,300
|
|||||
|
13,300
|
Toro
|
1,025,829
|
|||||
|
37,500
|
Union Pacific
|
6,204,750
|
|||||
|
4,000
|
United Rentals (1)
|
534,280
|
|||||
|
11,095
|
United Technologies
|
1,593,020
|
|||||
|
15,000
|
Verisk Analytics Class A
|
2,170,500
|
|||||
|
22,100
|
Waste Management
|
2,479,841
|
|||||
|
103,145,584
|
|||||||
|
Information Technology – 22.3%
|
|||||||
|
19,352
|
Accenture Class A
|
3,588,248
|
|||||
|
12,600
|
Adobe (1)
|
3,501,918
|
|||||
|
27,800
|
Amdocs
|
1,812,560
|
|||||
|
22,400
|
Amphenol Class A
|
2,247,392
|
|||||
|
19,100
|
Analog Devices
|
2,036,633
|
|||||
|
6,500
|
ANSYS (1)
|
1,430,975
|
|||||
|
153,373
|
Apple
|
38,153,067
|
|||||
|
28,000
|
Automatic Data Processing
|
4,542,440
|
|||||
|
7,200
|
Broadcom
|
2,108,520
|
|||||
|
21,200
|
Broadridge Financial Solutions
|
2,654,664
|
|||||
|
Schroder North American Equity Fund
|
Schedule of Investments (continued)
October 31, 2019
| Shares |
Value $
|
||||||
|
244,985
|
Cisco Systems
|
11,639,237
|
|||||
|
27,800
|
Citrix Systems
|
3,026,308
|
|||||
|
62,523
|
Cognizant Technology Solutions Class A
|
3,810,152
|
|||||
|
20,900
|
DXC Technology
|
578,303
|
|||||
|
1,600
|
Fair Isaac (1)
|
486,464
|
|||||
|
40,500
|
Fiserv (1)
|
4,298,670
|
|||||
|
104,800
|
HP
|
1,820,376
|
|||||
|
229,974
|
Intel
|
13,000,430
|
|||||
|
64,894
|
International Business Machines
|
8,678,275
|
|||||
|
14,100
|
Intuit
|
3,630,750
|
|||||
|
8,500
|
Jack Henry & Associates
|
1,203,260
|
|||||
|
5,700
|
Lam Research
|
1,544,928
|
|||||
|
28,900
|
Mastercard Class A
|
7,999,809
|
|||||
|
34,700
|
Maxim Integrated Products
|
2,035,502
|
|||||
|
45,200
|
Micron Technology (1)
|
2,149,260
|
|||||
|
301,450
|
Microsoft
|
43,218,886
|
|||||
|
6,600
|
NVIDIA
|
1,326,732
|
|||||
|
114,581
|
Oracle
|
6,243,519
|
|||||
|
35,400
|
Paychex
|
2,960,856
|
|||||
|
60,700
|
PayPal Holdings (1)
|
6,318,870
|
|||||
|
8,000
|
Progress Software
|
319,040
|
|||||
|
12,277
|
QUALCOMM
|
987,562
|
|||||
|
9,400
|
salesforce.com (1)
|
1,471,006
|
|||||
|
10,000
|
TE Connectivity
|
895,000
|
|||||
|
42,922
|
Texas Instruments
|
5,064,367
|
|||||
|
70,900
|
Visa Class A
|
12,681,174
|
|||||
|
64,100
|
Xerox Holdings
|
2,174,913
|
|||||
|
19,600
|
Xilinx
|
1,778,504
|
|||||
|
213,418,570
|
|||||||
|
Materials – 0.6%
|
|||||||
|
1,700
|
Air Products & Chemicals
|
362,542
|
|||||
|
6,400
|
Eastman Chemical
|
486,656
|
|||||
|
14,100
|
LyondellBasell Industries Class A
|
1,264,770
|
|||||
|
17,300
|
Newmont Mining
|
687,329
|
|||||
|
21,200
|
Packaging Corp. of America
|
2,320,552
|
|||||
|
3,649
|
Sonoco Products
|
210,547
|
|||||
|
13,900
|
Steel Dynamics
|
422,004
|
|||||
|
5,754,400
|
|||||||
|
Real Estate – 2.2%
|
|||||||
|
117,600
|
Apple Hospitality REIT
|
1,938,048
|
|||||
|
12,700
|
CareTrust REIT
|
307,848
|
|||||
|
5,700
|
Essex Property Trust REIT
|
1,864,641
|
|||||
|
19,900
|
Highwoods Properties REIT
|
931,320
|
|||||
|
127,800
|
Host Hotels & Resorts REIT
|
2,094,642
|
|||||
| Shares |
Value $
|
||||||
|
49,400
|
Kimco Realty REIT
|
1,065,064
|
|||||
|
7,900
|
Life Storage REIT
|
860,468
|
|||||
|
3,649
|
LTC Properties REIT
|
189,201
|
|||||
|
32,800
|
Newmark Group Class A
|
348,336
|
|||||
|
11,200
|
Omega Healthcare Investors REIT
|
493,248
|
|||||
|
90,400
|
Park Hotels & Resorts REIT
|
2,101,800
|
|||||
|
2,600
|
PS Business Parks REIT
|
469,430
|
|||||
|
11,100
|
Public Storage REIT
|
2,473,746
|
|||||
|
19,200
|
Regency Centers REIT
|
1,291,008
|
|||||
|
31,100
|
RLJ Lodging Trust REIT
|
510,351
|
|||||
|
21,800
|
Simon Property Group REIT
|
3,284,824
|
|||||
|
15,600
|
Tanger Factory Outlet Centers REIT
|
251,472
|
|||||
|
25,700
|
Weingarten Realty Investors REIT
|
815,461
|
|||||
|
21,290,908
|
|||||||
|
Utilities – 1.1%
|
|||||||
|
28,000
|
AES
|
477,400
|
|||||
|
3,700
|
Ameren
|
287,490
|
|||||
|
3,700
|
American Electric Power
|
349,243
|
|||||
|
3,600
|
American Water Works
|
443,772
|
|||||
|
4,500
|
Atmos Energy
|
506,160
|
|||||
|
18,000
|
Centerpoint Energy
|
523,260
|
|||||
|
13,199
|
Consolidated Edison
|
1,217,212
|
|||||
|
6,000
|
Dominion Resources
|
495,300
|
|||||
|
2,300
|
DTE Energy
|
292,836
|
|||||
|
5,000
|
Eversource Energy
|
418,700
|
|||||
|
40,300
|
Exelon
|
1,833,247
|
|||||
|
8,200
|
NextEra Energy
|
1,954,388
|
|||||
|
27,200
|
PPL
|
910,928
|
|||||
|
1,800
|
Sempra Energy
|
260,118
|
|||||
|
9,970,054
|
|||||||
|
Total United States
|
929,115,874
|
||||||
|
TOTAL COMMON STOCK
|
|||||||
|
(Cost $598,897,258)
|
946,661,179
|
||||||
|
TOTAL INVESTMENTS IN SECURITIES – 99.1%
|
|||||||
|
(Cost $598,897,258)
|
946,661,179
|
||||||
|
OTHER ASSETS LESS LIABILITIES – 0.9%
|
8,670,656
|
||||||
|
NET ASSETS – 100%
|
$
|
955,331,835
|
|||||
| (1) |
Denotes non-income producing security.
|
|
Schroder North American Equity Fund
|
Schedule of Investments (concluded)
October 31, 2019
The open futures contracts held by the Fund at October 31, 2019, are as follows:
|
Type of
Contract |
Number of
Contracts Long |
Expiration
Date |
Notional
Amount |
Value
|
Unrealized
Appreciation |
||||||||||||
|
S&P 500 Index E-MINI
|
25
|
Dec-2019
|
$
|
3,728,042
|
$
|
3,794,750
|
$
|
66,708
|
|||||||||
A summary of the outstanding forward foreign currency contracts held by the Fund at October 31, 2019, is as follows:
|
Counterparty
|
Settlement
Date |
Currency
to Deliver |
Currency
to Receive |
Unrealized Appreciation
|
|||
|
Royal Bank of Canada
|
12/11/19
|
CAD 14,853,935
|
USD 11,346,790
|
$
|
66,965
|
||
CAD — Canadian Dollar
REIT — Real Estate Investment Trust
S&P — Standard & Poor’s
USD — United States Dollar
The following is a summary of the inputs used as of October 31, 2019, in valuing the Fund’s investments carried at value:
|
Investments in Securities (1)(2)
|
Level 1
|
Level 2
|
Level 3
|
Total
|
||||||||||||
|
Common Stock
|
$
|
946,661,179
|
$
|
—
|
$
|
—
|
$
|
946,661,179
|
||||||||
|
Total Investments in Securities
|
$
|
946,661,179
|
$
|
—
|
$
|
—
|
$
|
946,661,179
|
||||||||
|
Other Financial Instruments
|
Level 1
|
Level 2
|
Level 3
|
Total
|
||||||||||||
|
Futures — Unrealized Appreciation
|
$
|
66,708
|
$
|
—
|
$
|
—
|
$
|
66,708
|
||||||||
|
Forwards — Unrealized Appreciation
|
—
|
66,965
|
—
|
66,965
|
||||||||||||
|
Total Other Financial Instruments
|
$
|
66,708
|
$
|
66,965
|
$
|
—
|
$
|
133,673
|
||||||||
| (1) |
For the year ended October 31, 2019, there were no transfers in or out of Level 3.
|
| (2) |
All securities in this category are Level 1 securities. For a detailed break-out by classification, please refer to the Schedule of Investments.
|
|
Schroder Emerging Markets Small Cap Fund
|
Schedule of Investments
October 31, 2019
|
Shares
|
Value $
|
||||||
|
COMMON STOCK – 93.9%
|
|||||||
|
Brazil – 9.8%
|
|||||||
|
2,762
|
Cyrela Brazil Realty Empreendimentos e Participacoes
|
18,602
|
|||||
|
10,224
|
Duratex
|
33,217
|
|||||
|
5,790
|
Enauta Participacoes
|
18,869
|
|||||
|
3,248
|
Energisa SA - Units
|
38,704
|
|||||
|
6,900
|
IRB Brasil Resseguros S
|
64,828
|
|||||
|
6,719
|
Odontoprev
|
24,980
|
|||||
|
500
|
Pagseguro Digital Class A (1)
|
18,540
|
|||||
|
217,740
|
|||||||
|
Chile – 1.0%
|
|||||||
|
1,750
|
Inversiones La Construccion
|
21,179
|
|||||
|
China – 15.8%
|
|||||||
|
7,250
|
A-Living Services Class H
|
22,020
|
|||||
|
2,700
|
Anhui Kouzi Distillery Class A
|
18,767
|
|||||
|
15,000
|
Haitian International Holdings
|
35,490
|
|||||
|
5,500
|
Hefei Meiya Optoelectronic Technology Class A
|
28,519
|
|||||
|
647
|
Huazhu Group ADR
|
24,495
|
|||||
|
14,500
|
Li Ning
|
49,315
|
|||||
|
143,000
|
Lonking Holdings
|
39,784
|
|||||
|
26,000
|
Nexteer Automotive Group
|
24,288
|
|||||
|
15,400
|
Rainbow Department Store Class A
|
22,174
|
|||||
|
18,400
|
Tongcheng-Elong Holdings (1)
|
30,056
|
|||||
|
17,000
|
Topsports International Holdings (1)
|
20,502
|
|||||
|
2,660
|
WuXi AppTec Class H
|
32,147
|
|||||
|
347,557
|
|||||||
|
Colombia – 0.7%
|
|||||||
|
4,899
|
Organizacion Terpel
|
15,509
|
|||||
|
Egypt – 1.3%
|
|||||||
|
10,683
|
Credit Agricole Egypt
|
29,057
|
|||||
|
Greece – 2.4%
|
|||||||
|
52,654
|
Eurobank Ergasias (1)
|
53,322
|
|||||
|
Hong Kong – 3.3%
|
|||||||
|
3,700
|
ASM Pacific Technology
|
51,798
|
|||||
|
56,000
|
Crystal International Group
|
21,654
|
|||||
|
73,452
|
|||||||
|
India – 9.5%
|
|||||||
|
1,848
|
Apollo Hospitals Enterprise
|
38,685
|
|||||
|
14,063
|
City Union Bank
|
42,013
|
|||||
|
4,077
|
Container of India
|
33,818
|
|||||
|
63
|
Eicher Motors
|
20,019
|
|||||
|
Shares
|
Value $
|
||||||
|
1,106
|
Gateway Distriparks
|
1,462
|
|||||
|
8,291
|
Indraprastha Gas
|
45,770
|
|||||
|
1,741
|
Supreme Industries
|
28,575
|
|||||
|
210,342
|
|||||||
|
Indonesia – 0.9%
|
|||||||
|
13,400
|
United Tractors
|
20,691
|
|||||
|
Malaysia – 1.4%
|
|||||||
|
21,750
|
Bursa Malaysia
|
31,492
|
|||||
|
Mexico – 3.5%
|
|||||||
|
2,257
|
Gruma Class B
|
23,617
|
|||||
|
2,722
|
Grupo Aeroportuario del Pacifico Class B
|
28,531
|
|||||
|
4,382
|
Grupo Cementos de Chihuahua
|
24,399
|
|||||
|
76,547
|
|||||||
|
Pakistan – 0.9%
|
|||||||
|
23,606
|
United Bank
|
20,876
|
|||||
|
Peru – 1.2%
|
|||||||
|
40,850
|
Ferreycorp SAA
|
26,503
|
|||||
|
Philippines – 3.5%
|
|||||||
|
161,200
|
D&L Industries
|
27,097
|
|||||
|
21,330
|
International Container Terminal Services
|
49,894
|
|||||
|
76,991
|
|||||||
|
Poland – 1.6%
|
|||||||
|
920
|
Dino Polska (1)
|
35,879
|
|||||
|
Russia – 6.2%
|
|||||||
|
2,791
|
Globaltrans Investment GDR
|
23,863
|
|||||
|
20,068
|
Moscow Exchange MICEX-RTS PJSC (1)
|
29,765
|
|||||
|
2,398
|
Polymetal International
|
39,294
|
|||||
|
2,263
|
TCS Group Holding GDR
|
43,042
|
|||||
|
135,964
|
|||||||
|
Singapore – 1.3%
|
|||||||
|
25,100
|
First Resources
|
28,228
|
|||||
|
South Africa – 1.7%
|
|||||||
|
3,738
|
City Lodge Hotels
|
19,767
|
|||||
|
1,453
|
Foschini Group
|
16,732
|
|||||
|
36,499
|
|||||||
|
South Korea – 11.0%
|
|||||||
|
506
|
Douzone Bizon
|
31,923
|
|||||
|
528
|
Koh Young Technology
|
42,705
|
|||||
|
803
|
LEENO Industrial
|
36,718
|
|||||
|
241
|
LG Innotek
|
25,064
|
|||||
|
65
|
Medy-Tox
|
18,437
|
|||||
|
Schroder Emerging Markets Small Cap Fund
|
Schedule of Investments (concluded)
October 31, 2019
|
Shares
|
Value $
|
||||||
|
1,417
|
Orange Life Insurance
|
34,101
|
|||||
|
351
|
S-1 Class 1
|
28,268
|
|||||
|
161
|
SK Materials
|
25,352
|
|||||
|
242,568
|
|||||||
|
Taiwan – 13.8%
|
|||||||
|
30,147
|
Aerospace Industrial Development
|
31,444
|
|||||
|
12,000
|
Chroma ATE
|
60,118
|
|||||
|
27,000
|
CTCI
|
36,277
|
|||||
|
1,040
|
Eclat Textile
|
13,991
|
|||||
|
4,758
|
Gourmet Master
|
21,726
|
|||||
|
3,000
|
King Slide Works
|
35,923
|
|||||
|
6,000
|
Macauto Industrial
|
19,711
|
|||||
|
7,000
|
Merida Industry
|
40,472
|
|||||
|
5,000
|
Nien Made Enterprises
|
45,416
|
|||||
|
305,078
|
|||||||
|
Thailand – 1.7%
|
|||||||
|
16,700
|
Thai Oil
|
37,885
|
|||||
|
United Arab Emirates – 1.4%
|
|||||||
|
60,275
|
Emaar Malls PJSC
|
32,002
|
|||||
|
TOTAL COMMON STOCK
|
|||||||
|
(Cost $1,735,454)
|
2,075,361
|
||||||
|
Shares
|
Value $
|
||||||
|
PREFERRED STOCK – 1.8%
|
|||||||
|
Brazil – 1.8%
|
|||||||
|
5,988
|
Alpargatas (1)(2)
|
40,253
|
|||||
|
TOTAL PREFERRED STOCK
|
|||||||
|
(Cost $13,939)
|
40,253
|
||||||
|
TOTAL INVESTMENTS IN SECURITIES – 95.7%
|
|||||||
|
(Cost $1,749,393)
|
2,115,614
|
||||||
|
OTHER ASSETS LESS LIABILITIES – 4.3%
|
96,213
|
||||||
|
NET ASSETS – 100%
|
$
|
2,211,827
|
|||||
| (1) |
Denotes non-income producing security.
|
| (2) |
There is currently no rate available.
|
ADR — American Depositary Receipt
GDR — Global Depositary Receipt
PJSC — Private Joint Stock Company
The following is a summary of the inputs used as of October 31, 2019, in valuing the Fund’s investments carried at value:
|
Investments in Securities (1)(2)
|
Level 1
|
Level 2
|
Level 3
|
Total
|
||||||||||||
|
Common Stock
|
$
|
2,075,361
|
$
|
—
|
$
|
—
|
$
|
2,075,361
|
||||||||
|
Preferred Stock
|
40,253
|
—
|
—
|
40,253
|
||||||||||||
|
Total Investments in Securities
|
$
|
2,115,614
|
$
|
—
|
$
|
—
|
$
|
2,115,614
|
||||||||
| (1) |
For the year ended October 31, 2019, there were no transfers in or out of Level 3.
|
| (2) |
All securities in this category are Level 1 securities. For a detailed break-out by classification, please refer to the Schedule of Investments.
|
|
Schroder Core Bond Fund
|
Schedule of Investments
October 31, 2019
|
Principal Amount ($)
|
Value $
|
||||||
|
CORPORATE OBLIGATIONS – 38.9%
|
|||||||
|
Communication Services – 4.6%
|
|||||||
|
AT&T
|
|||||||
|
159,000
|
4.750%, 05/15/46
|
176,528
|
|||||
|
81,000
|
4.500%, 05/15/35
|
89,355
|
|||||
|
100,000
|
4.300%, 02/15/30
|
109,985
|
|||||
|
200,000
|
3.400%, 05/15/25
|
209,560
|
|||||
|
196,000
|
3.000%, 06/30/22
|
200,213
|
|||||
|
Charter Communications Operating LLC
|
|||||||
|
188,000
|
4.800%, 03/01/50
|
192,446
|
|||||
|
Comcast
|
|||||||
|
95,000
|
4.700%, 10/15/48
|
116,987
|
|||||
|
200,000
|
3.950%, 10/15/25
|
219,242
|
|||||
|
226,000
|
2.650%, 02/01/30
|
228,188
|
|||||
|
Discovery Communications LLC
|
|||||||
|
210,000
|
2.950%, 03/20/23
|
213,905
|
|||||
|
Verizon Communications
|
|||||||
|
137,000
|
4.329%, 09/21/28
|
156,008
|
|||||
|
160,000
|
4.016%, 12/03/29
|
179,087
|
|||||
|
129,000
|
3.258%, VAR ICE LIBOR USD 3 Month+1.100%, 05/15/25
|
131,218
|
|||||
|
Vodafone Group
|
|||||||
|
197,000
|
2.991%, VAR ICE LIBOR USD 3 Month+0.990%, 01/16/24
|
199,027
|
|||||
|
Walt Disney
|
|||||||
|
479,000
|
2.000%, 09/01/29
|
466,996
|
|||||
|
2,888,745
|
|||||||
|
Consumer Discretionary – 0.5%
|
|||||||
|
AutoNation
|
|||||||
|
45,000
|
4.500%, 10/01/25
|
48,099
|
|||||
|
Cox Communications (1)
|
|||||||
|
227,000
|
3.150%, 08/15/24
|
234,755
|
|||||
|
Magna International
|
|||||||
|
54,000
|
4.150%, 10/01/25
|
58,482
|
|||||
|
341,336
|
|||||||
|
Consumer Staples – 3.1%
|
|||||||
|
Altria Group
|
|||||||
|
459,000
|
4.800%, 02/14/29
|
503,903
|
|||||
|
Anheuser-Busch InBev Worldwide
|
|||||||
|
280,000
|
4.150%, 01/23/25
|
306,114
|
|||||
|
BAT Capital
|
|||||||
|
56,000
|
3.222%, 08/15/24
|
56,852
|
|||||
|
CVS Health
|
|||||||
|
184,000
|
5.050%, 03/25/48
|
212,084
|
|||||
|
PepsiCo
|
|||||||
|
295,000
|
2.625%, 07/29/29
|
304,390
|
|||||
|
Reynolds American
|
|||||||
|
21,000
|
5.850%, 08/15/45
|
23,349
|
|||||
|
33,000
|
5.700%, 08/15/35
|
37,275
|
|||||
|
Principal Amount ($)
|
Value $
|
||||||
|
RJ Reynolds Tobacco
|
|||||||
|
401,000
|
3.750%, 05/20/23
|
407,757
|
|||||
|
Tyson Foods
|
|||||||
|
75,000
|
3.550%, 06/02/27
|
80,285
|
|||||
|
1,932,009
|
|||||||
|
Energy – 3.5%
|
|||||||
|
Apache
|
|||||||
|
301,000
|
4.375%, 10/15/28
|
298,672
|
|||||
|
BP Capital Markets
|
|||||||
|
96,000
|
2.500%, 11/06/22
|
97,593
|
|||||
|
Enbridge
|
|||||||
|
71,000
|
4.250%, 12/01/26
|
77,654
|
|||||
|
Energy Transfer Partners
|
|||||||
|
85,000
|
5.250%, 04/15/29
|
95,607
|
|||||
|
313,000
|
3.600%, 02/01/23
|
321,856
|
|||||
|
Enterprise Products Operating LLC
|
|||||||
|
238,000
|
4.200%, 01/31/50
|
251,688
|
|||||
|
EOG Resources
|
|||||||
|
183,000
|
2.625%, 03/15/23
|
186,696
|
|||||
|
EQT
|
|||||||
|
197,000
|
3.900%, 10/01/27
|
175,557
|
|||||
|
49,000
|
3.000%, 10/01/22
|
46,798
|
|||||
|
MPLX
|
|||||||
|
169,000
|
4.500%, 04/15/38
|
172,689
|
|||||
|
Noble Energy
|
|||||||
|
142,000
|
3.850%, 01/15/28
|
147,506
|
|||||
|
Phillips 66 Partners
|
|||||||
|
135,000
|
3.750%, 03/01/28
|
141,769
|
|||||
|
155,000
|
3.605%, 02/15/25
|
162,178
|
|||||
|
2,176,263
|
|||||||
|
Financials – 15.3%
|
|||||||
|
Aflac
|
|||||||
|
2,000
|
6.450%, 08/15/40
|
2,861
|
|||||
|
American International Group
|
|||||||
|
303,000
|
3.900%, 04/01/26
|
325,956
|
|||||
|
181,000
|
3.300%, 03/01/21
|
183,942
|
|||||
|
AXA Equitable Holdings
|
|||||||
|
175,000
|
5.000%, 04/20/48
|
188,686
|
|||||
|
Bank of America
|
|||||||
|
10,000
|
5.875%, 01/05/21
|
10,459
|
|||||
|
Bank of America MTN
|
|||||||
|
544,000
|
3.500%, 04/19/26
|
578,445
|
|||||
|
425,000
|
3.248%, 10/21/27
|
441,888
|
|||||
|
464,000
|
3.004%, VAR ICE LIBOR USD 3 Month+0.790%, 12/20/23
|
474,639
|
|||||
|
Bank of Ireland Group (1)
|
|||||||
|
245,000
|
4.500%, 11/25/23
|
258,999
|
|||||
|
Bank of New York Mellon MTN
|
|||||||
|
261,000
|
1.950%, 08/23/22
|
261,598
|
|||||
|
Schroder Core Bond Fund
|
Schedule of Investments (continued)
October 31, 2019
|
Principal Amount ($)
|
Value $
|
||||||
|
Barclays
|
|||||||
|
200,000
|
4.337%, 01/10/28
|
216,267
|
|||||
|
Capital One Financial
|
|||||||
|
58,000
|
3.750%, 03/09/27
|
61,610
|
|||||
|
250,000
|
2.150%, 09/06/22
|
249,913
|
|||||
|
Citigroup
|
|||||||
|
1,009,000
|
3.200%, 10/21/26
|
1,046,452
|
|||||
|
9,000
|
2.700%, 03/30/21
|
9,088
|
|||||
|
Cooperatieve Rabobank UA MTN
|
|||||||
|
389,000
|
3.875%, 02/08/22
|
404,896
|
|||||
|
Credit Suisse Group (1)
|
|||||||
|
272,000
|
3.869%, VAR ICE LIBOR USD 3 Month+1.410%, 01/12/29
|
290,640
|
|||||
|
Fifth Third Bancorp
|
|||||||
|
239,000
|
3.650%, 01/25/24
|
252,104
|
|||||
|
275,000
|
2.375%, 01/28/25
|
276,292
|
|||||
|
GE Capital International Funding Unlimited Co
|
|||||||
|
325,000
|
3.373%, 11/15/25
|
334,407
|
|||||
|
Goldman Sachs Group
|
|||||||
|
115,000
|
4.750%, 10/21/45
|
140,168
|
|||||
|
240,000
|
3.814%, VAR ICE LIBOR USD 3 Month+1.158%, 04/23/29
|
254,757
|
|||||
|
80,000
|
3.500%, 11/16/26
|
83,350
|
|||||
|
47,000
|
2.625%, 04/25/21
|
47,436
|
|||||
|
HCP
|
|||||||
|
104,000
|
3.250%, 07/15/26
|
108,620
|
|||||
|
HSBC Holdings
|
|||||||
|
535,000
|
2.633%, VAR ICE LIBOR USD 3 Month+1.140%, 11/07/25
|
535,000
|
|||||
|
JPMorgan Chase
|
|||||||
|
382,000
|
4.625%, 05/10/21
|
397,217
|
|||||
|
50,000
|
4.500%, 01/24/22
|
52,675
|
|||||
|
152,000
|
2.950%, 10/01/26
|
156,885
|
|||||
|
Moody’s
|
|||||||
|
119,000
|
4.875%, 02/15/24
|
131,799
|
|||||
|
Morgan Stanley
|
|||||||
|
316,000
|
3.625%, 01/20/27
|
336,975
|
|||||
|
Morgan Stanley MTN
|
|||||||
|
519,000
|
2.750%, 05/19/22
|
527,017
|
|||||
|
169,000
|
2.500%, 04/21/21
|
170,229
|
|||||
|
US Bancorp MTN
|
|||||||
|
206,000
|
2.625%, 01/24/22
|
209,323
|
|||||
|
Wells Fargo
|
|||||||
|
281,000
|
3.000%, 04/22/26
|
288,921
|
|||||
|
Wells Fargo MTN
|
|||||||
|
242,000
|
2.879%, VAR ICE LIBOR USD 3 Month+1.170%, 10/30/30
|
242,772
|
|||||
|
9,552,286
|
|||||||
|
Principal
Amount ($)
|
Value $
|
||||||
|
Healthcare – 4.4%
|
|||||||
|
Abbott Laboratories
|
|||||||
|
444,000
|
3.400%, 11/30/23
|
468,380
|
|||||
|
AbbVie
|
|||||||
|
274,000
|
3.600%, 05/14/25
|
287,529
|
|||||
|
21,000
|
3.200%, 11/06/22
|
21,570
|
|||||
|
Aetna
|
|||||||
|
263,000
|
2.800%, 06/15/23
|
267,058
|
|||||
|
Allergan Funding SCS
|
|||||||
|
143,000
|
3.850%, 06/15/24
|
150,907
|
|||||
|
140,000
|
3.800%, 03/15/25
|
147,270
|
|||||
|
88,000
|
3.450%, 03/15/22
|
90,169
|
|||||
|
Bayer US Finance II LLC (1)
|
|||||||
|
487,000
|
3.875%, 12/15/23
|
510,061
|
|||||
|
Becton Dickinson
|
|||||||
|
141,000
|
3.734%, 12/15/24
|
150,659
|
|||||
|
Cardinal Health
|
|||||||
|
69,000
|
3.079%, 06/15/24
|
70,138
|
|||||
|
CommonSpirit Health
|
|||||||
|
105,000
|
3.347%, 10/01/29
|
105,815
|
|||||
|
Merck
|
|||||||
|
210,000
|
2.750%, 02/10/25
|
218,024
|
|||||
|
UnitedHealth Group
|
|||||||
|
235,000
|
3.875%, 12/15/28
|
260,488
|
|||||
|
2,748,068
|
|||||||
|
Industrials – 1.2%
|
|||||||
|
Air Lease
|
|||||||
|
152,000
|
2.250%, 01/15/23
|
151,312
|
|||||
|
Lockheed Martin
|
|||||||
|
225,000
|
3.550%, 01/15/26
|
243,023
|
|||||
|
Rockwell Collins
|
|||||||
|
226,000
|
3.200%, 03/15/24
|
235,858
|
|||||
|
United Technologies
|
|||||||
|
95,000
|
3.950%, 08/16/25
|
103,962
|
|||||
|
734,155
|
|||||||
|
Information Technology – 2.0%
|
|||||||
|
Apple
|
|||||||
|
137,000
|
2.950%, 09/11/49
|
132,449
|
|||||
|
Microsoft
|
|||||||
|
182,000
|
4.100%, 02/06/37
|
215,500
|
|||||
|
468,000
|
2.400%, 08/08/26
|
480,017
|
|||||
|
salesforce.com
|
|||||||
|
384,000
|
3.700%, 04/11/28
|
423,976
|
|||||
|
1,251,942
|
|||||||
|
Real Estate – 3.7%
|
|||||||
|
American Tower REIT
|
|||||||
|
409,000
|
3.700%, 10/15/49
|
406,359
|
|||||
|
294,000
|
3.300%, 02/15/21
|
298,447
|
|||||
|
Schroder Core Bond Fund
|
Schedule of Investments (continued)
October 31, 2019
|
Principal Amount ($)
|
Value $
|
||||||
|
Boston Properties REIT
|
|||||||
|
398,000
|
3.400%, 06/21/29
|
419,655
|
|||||
|
Crown Castle International REIT
|
|||||||
|
299,000
|
3.800%, 02/15/28
|
321,861
|
|||||
|
62,000
|
3.200%, 09/01/24
|
64,362
|
|||||
|
ERP Operating REIT
|
|||||||
|
331,000
|
3.000%, 07/01/29
|
343,005
|
|||||
|
Simon Property Group REIT
|
|||||||
|
219,000
|
2.000%, 09/13/24
|
218,567
|
|||||
|
Ventas Realty REIT
|
|||||||
|
222,000
|
3.125%, 06/15/23
|
228,359
|
|||||
|
2,300,615
|
|||||||
|
Utilities – 0.6%
|
|||||||
|
Exelon
|
|||||||
|
26,000
|
2.450%, 04/15/21
|
26,169
|
|||||
|
Southern
|
|||||||
|
315,000
|
2.950%, 07/01/23
|
322,697
|
|||||
|
348,866
|
|||||||
|
TOTAL CORPORATE OBLIGATIONS
|
|||||||
|
(Cost $23,174,923)
|
24,274,285
|
||||||
|
U.S. TREASURY OBLIGATIONS – 34.3%
|
|||||||
|
United States Treasury Bill (2)
|
|||||||
|
1,071,000
|
1.854%, 02/27/20
|
1,065,686
|
|||||
|
United States Treasury Bonds
|
|||||||
|
1,128,800
|
4.625%, 02/15/40
|
1,616,786
|
|||||
|
1,208,600
|
4.500%, 02/15/36
|
1,655,546
|
|||||
|
278,100
|
4.375%, 05/15/40
|
386,961
|
|||||
|
832,200
|
3.375%, 11/15/48
|
1,048,279
|
|||||
|
55,000
|
3.000%, 02/15/47
|
64,432
|
|||||
|
630,000
|
3.000%, 05/15/47
|
737,691
|
|||||
|
540,000
|
3.000%, 08/15/48
|
634,774
|
|||||
|
120,300
|
2.875%, 05/15/43
|
136,263
|
|||||
|
52,000
|
2.875%, 11/15/46
|
59,477
|
|||||
|
369,000
|
2.750%, 08/15/47
|
412,819
|
|||||
|
238,900
|
2.750%, 11/15/47
|
267,512
|
|||||
|
159,000
|
2.500%, 02/15/46
|
169,285
|
|||||
|
270,000
|
2.250%, 08/15/49
|
274,282
|
|||||
|
United States Treasury Notes
|
|||||||
|
198,000
|
2.625%, 07/31/20
|
199,477
|
|||||
|
182,200
|
2.625%, 02/15/29
|
196,989
|
|||||
|
1,404,100
|
2.375%, 05/15/29
|
1,488,840
|
|||||
|
1,712,000
|
1.625%, 09/30/26
|
1,713,806
|
|||||
|
5,242,000
|
1.500%, 08/15/22
|
5,240,362
|
|||||
|
4,043,000
|
1.500%, 09/30/24
|
4,037,472
|
|||||
|
TOTAL U.S. TREASURY OBLIGATIONS
|
|||||||
|
(Cost $20,672,053)
|
21,406,739
|
||||||
|
Principal Amount ($)
|
Value $
|
||||||
|
U.S. GOVERNMENT MORTGAGE-BACKED OBLIGATIONS – 22.3%
|
|||||||
|
Federal Home Loan Mortgage Corporation – 5.8%
|
|||||||
|
FHLMC
|
|||||||
|
1,137,621
|
4.500%, 08/01/48
|
1,198,283
|
|||||
|
386,729
|
4.500%, 09/01/48
|
407,920
|
|||||
|
530,572
|
4.500%, 12/01/48
|
557,796
|
|||||
|
657,787
|
4.000%, 11/01/48
|
685,593
|
|||||
|
714,033
|
4.000%, 01/01/49
|
740,630
|
|||||
|
3,590,222
|
|||||||
|
Federal National Mortgage Association – 14.2%
|
|||||||
|
FNMA
|
|||||||
|
161,274
|
4.500%, 12/01/47
|
170,145
|
|||||
|
378,936
|
4.500%, 08/01/48
|
400,065
|
|||||
|
617,057
|
4.500%, 10/01/48
|
650,564
|
|||||
|
931,351
|
4.500%, 11/01/48
|
979,878
|
|||||
|
987,296
|
4.000%, 12/01/47
|
1,035,605
|
|||||
|
1,184,597
|
4.000%, 08/01/49
|
1,230,639
|
|||||
|
1,881,686
|
3.500%, 11/01/47
|
1,945,913
|
|||||
|
215,242
|
3.500%, 12/01/47
|
222,884
|
|||||
|
1,249,596
|
3.500%, 01/01/48
|
1,293,435
|
|||||
|
913,083
|
3.500%, 11/01/48
|
935,781
|
|||||
|
8,864,909
|
|||||||
|
Government National Mortgage Association – 2.3%
|
|||||||
|
GNMA
|
|||||||
|
597,222
|
5.000%, 08/20/48
|
633,691
|
|||||
|
434,752
|
5.000%, 10/20/48
|
461,473
|
|||||
|
343,419
|
4.500%, 10/20/48
|
361,420
|
|||||
|
1,456,584
|
|||||||
|
TOTAL U.S. GOVERNMENT MORTGAGE-BACKED OBLIGATIONS
|
|||||||
|
(Cost $13,635,627)
|
13,911,715
|
||||||
|
COLLATERALIZED MORTGAGE OBLIGATIONS – 2.3%
|
|||||||
|
JPMorgan Mortgage Trust, Series 2015-6, Class A5 (1) (3)
|
|||||||
|
565,883
|
3.500%, 10/25/45
|
571,329
|
|||||
|
JPMorgan Mortgage Trust, Series 2017-1, Class A4 (1) (3)
|
|||||||
|
610,866
|
3.500%, 01/25/47
|
618,529
|
|||||
|
JPMorgan Mortgage Trust, Series 2018-8, Class A15 (1) (3)
|
|||||||
|
228,542
|
4.000%, 01/25/49
|
229,162
|
|||||
|
TOTAL COLLATERALIZED MORTGAGE OBLIGATIONS
|
|||||||
|
(Cost $1,400,200)
|
1,419,020
|
||||||
|
Schroder Core Bond Fund
|
Schedule of Investments (concluded)
October 31, 2019
|
Principal Amount ($)
|
Value $
|
||||||
|
COMMERCIAL MORTGAGE-BACKED OBLIGATIONS – 0.4%
|
|||||||
|
BX Commercial Mortgage Trust, Series 2018-IND, Class B (1)
|
|||||||
|
184,540
|
2.814%, VAR ICE LIBOR USD 1 Month+0.900%, 11/15/35
|
184,310
|
|||||
|
BX Commercial Mortgage Trust, Series 2018-IND, Class C (1)
|
|||||||
|
109,939
|
3.014%, VAR ICE LIBOR USD 1 Month+1.100%, 11/15/35
|
109,870
|
|||||
|
TOTAL COMMERCIAL MORTGAGE-BACKED OBLIGATIONS
|
|||||||
|
(Cost $294,479)
|
294,180
|
||||||
|
TAXABLE MUNICIPAL BOND – 0.2%
|
|||||||
|
New Jersey – 0.2%
|
|||||||
|
State Economic Development Authority RB, Series A, NATL
|
|||||||
|
95,000
|
7.425%, 02/15/29
|
||||||
|
(Cost $114,775)
|
120,999
|
||||||
|
TOTAL INVESTMENTS IN SECURITIES – 98.4%
|
|||||||
|
(Cost $59,292,057)
|
61,426,938
|
||||||
|
OTHER ASSETS LESS LIABILITIES – 1.6%
|
1,000,394
|
||||||
|
NET ASSETS – 100%
|
$
|
62,427,332
|
|||||
| (1) |
Security exempt from registration under Rule 144A of the Securities Act of 1933. This security may be resold in transactions exempt from registration normally to qualified
institutions. On October 31, 2019, the value of these securities amounted to $3,007,655, representing 4.8% of the net assets of the Fund.
|
| (2) |
Zero Coupon Security — Rate disclosed is the effective yield at time
of purchase. |
| (3) |
Variable or floating rate security, the interest rate of which adjusts periodically based on changes in current interest rates and prepayments on the underlying pool of assets.
|
FHLMC — Federal Home Loan Mortgage Corporation
FNMA — Federal National Mortgage Association
GNMA — Government National Mortgage Association
ICE — Intercontinental Exchange
LIBOR — London Interbank Offered Rate
LLC — Limited Liability Corporation
MTN — Medium Term Note
NATL — National Public Finance Guarantee Corporation
RB — Revenue Bond
REIT — Real Estate Investment Trust
USD — United States Dollar
VAR — Variable Rate
The following is a summary of the inputs used as of October 31, 2019, in valuing the Fund’s investments carried at value:
|
Investments in Securities (1)
|
Level 1
|
Level 2
|
Level 3
|
Total
|
||||||||||||
|
Corporate Obligations
|
$
|
—
|
$
|
24,274,285
|
$
|
—
|
$
|
24,274,285
|
||||||||
|
U.S. Treasury Obligations
|
—
|
21,406,739
|
—
|
21,406,739
|
||||||||||||
|
U.S. Government Mortgage-Backed
Obligations |
—
|
13,911,715
|
—
|
13,911,715
|
||||||||||||
|
Collateralized Mortgage Obligations
|
—
|
1,419,020
|
—
|
1,419,020
|
||||||||||||
|
Commercial Mortgage-Backed Obligations
|
—
|
294,180
|
—
|
294,180
|
||||||||||||
|
Taxable Municipal Bond
|
—
|
120,999
|
—
|
120,999
|
||||||||||||
|
Total Investments in Securities
|
$
|
—
|
$
|
61,426,938
|
$
|
—
|
$
|
61,426,938
|
||||||||
(1) For the year ended October 31, 2019, there were no transfers in or out of Level 3.
|
Schroder Long Duration Investment-Grade Bond Fund
|
Schedule of Investments
October 31, 2019
|
Principal Amount ($)
|
Value $
|
||||||
|
CORPORATE OBLIGATIONS – 59.6%
|
|||||||
|
Communication Services – 9.2%
|
|||||||
|
AT&T
|
|||||||
|
775,000
|
4.500%, 05/15/35
|
854,937
|
|||||
|
1,332,000
|
4.500%, 03/09/48
|
1,424,564
|
|||||
|
520,000
|
4.350%, 06/15/45
|
550,779
|
|||||
|
Comcast
|
|||||||
|
1,306,000
|
4.700%, 10/15/48
|
1,608,258
|
|||||
|
284,000
|
3.969%, 11/01/47
|
311,104
|
|||||
|
335,000
|
3.450%, 02/01/50
|
343,744
|
|||||
|
117,000
|
3.400%, 07/15/46
|
118,834
|
|||||
|
Discovery Communications
|
|||||||
|
294,000
|
5.300%, 05/15/49
|
330,520
|
|||||
|
183,000
|
4.125%, 05/15/29
|
194,737
|
|||||
|
Fox (1)
|
|||||||
|
397,000
|
5.476%, 01/25/39
|
488,207
|
|||||
|
Telefonica Emisiones
|
|||||||
|
344,000
|
5.520%, 03/01/49
|
418,699
|
|||||
|
Verizon Communications
|
|||||||
|
1,274,000
|
5.250%, 03/16/37
|
1,604,702
|
|||||
|
349,000
|
4.522%, 09/15/48
|
415,176
|
|||||
|
Vodafone Group
|
|||||||
|
533,000
|
5.000%, 05/30/38
|
609,909
|
|||||
|
Walt Disney
|
|||||||
|
250,000
|
4.750%, 09/15/44 (1)
|
319,682
|
|||||
|
1,397,000
|
2.000%, 09/01/29
|
1,361,990
|
|||||
|
10,955,842
|
|||||||
|
Consumer Discretionary – 1.4%
|
|||||||
|
Cox Communications (1)
|
|||||||
|
184,000
|
4.600%, 08/15/47
|
200,939
|
|||||
|
Home Depot
|
|||||||
|
805,000
|
2.950%, 06/15/29
|
849,201
|
|||||
|
McDonald’s MTN
|
|||||||
|
475,000
|
4.875%, 12/09/45
|
575,083
|
|||||
|
1,625,223
|
|||||||
|
Consumer Staples – 8.2%
|
|||||||
|
Altria Group
|
|||||||
|
561,000
|
5.800%, 02/14/39
|
644,995
|
|||||
|
732,000
|
5.375%, 01/31/44
|
818,385
|
|||||
|
Anheuser-Busch
|
|||||||
|
1,371,000
|
4.900%, 02/01/46
|
1,644,601
|
|||||
|
Anheuser-Busch InBev Worldwide
|
|||||||
|
239,000
|
4.900%, 01/23/31
|
286,866
|
|||||
|
BAT Capital
|
|||||||
|
598,000
|
4.540%, 08/15/47
|
578,338
|
|||||
|
Principal Amount ($)
|
Value $
|
||||||
|
CVS Health
|
|||||||
|
440,000
|
5.125%, 07/20/45
|
507,170
|
|||||
|
766,000
|
5.050%, 03/25/48
|
882,915
|
|||||
|
Georgetown University
|
|||||||
|
477,000
|
5.215%, 10/01/18
|
658,509
|
|||||
|
Molson Coors Brewing
|
|||||||
|
393,000
|
4.200%, 07/15/46
|
388,379
|
|||||
|
PepsiCo
|
|||||||
|
905,000
|
3.375%, 07/29/49
|
966,163
|
|||||
|
Reynolds American
|
|||||||
|
155,000
|
8.125%, 05/01/40
|
203,200
|
|||||
|
417,000
|
5.850%, 08/15/45
|
463,646
|
|||||
|
Tyson Foods
|
|||||||
|
271,000
|
4.550%, 06/02/47
|
310,082
|
|||||
|
Walmart
|
|||||||
|
1,165,000
|
3.950%, 06/28/38
|
1,360,681
|
|||||
|
41,000
|
3.625%, 12/15/47
|
45,630
|
|||||
|
9,759,560
|
|||||||
|
Energy – 8.5%
|
|||||||
|
Apache
|
|||||||
|
1,485,000
|
4.250%, 01/15/30
|
1,446,211
|
|||||
|
ConocoPhillips
|
|||||||
|
163,000
|
5.900%, 05/15/38
|
222,987
|
|||||
|
Enbridge
|
|||||||
|
254,000
|
5.500%, 12/01/46
|
321,666
|
|||||
|
Energy Transfer Operating
|
|||||||
|
486,000
|
5.250%, 04/15/29
|
546,646
|
|||||
|
Energy Transfer Partners
|
|||||||
|
78,000
|
6.500%, 02/01/42
|
93,421
|
|||||
|
Enterprise Products Operating LLC
|
|||||||
|
102,000
|
5.700%, 02/15/42
|
128,004
|
|||||
|
410,000
|
5.100%, 02/15/45
|
478,594
|
|||||
|
873,000
|
4.250%, 02/15/48
|
936,788
|
|||||
|
181,000
|
4.200%, 01/31/50
|
191,410
|
|||||
|
Halliburton
|
|||||||
|
180,000
|
5.000%, 11/15/45
|
198,405
|
|||||
|
Marathon Petroleum
|
|||||||
|
325,000
|
4.750%, 09/15/44
|
356,615
|
|||||
|
MidAmerican Energy
|
|||||||
|
354,000
|
4.250%, 07/15/49
|
434,940
|
|||||
|
MPLX
|
|||||||
|
916,000
|
4.700%, 04/15/48
|
933,139
|
|||||
|
Noble Energy
|
|||||||
|
679,000
|
5.050%, 11/15/44
|
718,279
|
|||||
|
Schroder Long Duration Investment-Grade Bond Fund
|
Schedule of Investments (continued)
October 31, 2019
|
Principal Amount ($)
|
Value $
|
||||||
|
Phillips 66 Partners
|
|||||||
|
424,000
|
4.680%, 02/15/45
|
451,373
|
|||||
|
Plains All American Pipeline
|
|||||||
|
765,000
|
3.550%, 12/15/29
|
731,412
|
|||||
|
Shell International Finance BV
|
|||||||
|
325,000
|
4.000%, 05/10/46
|
371,731
|
|||||
|
Suncor Energy
|
|||||||
|
718,000
|
6.500%, 06/15/38
|
986,437
|
|||||
|
Sunoco Logistics Partners Operations
|
|||||||
|
474,000
|
5.400%, 10/01/47
|
509,276
|
|||||
|
10,057,334
|
|||||||
|
Financials – 11.5%
|
|||||||
|
Aflac
|
|||||||
|
150,000
|
6.450%, 08/15/40
|
214,594
|
|||||
|
American Express
|
|||||||
|
150,000
|
8.150%, 03/19/38
|
240,663
|
|||||
|
American International Group
|
|||||||
|
227,000
|
4.375%, 01/15/55
|
244,164
|
|||||
|
137,000
|
3.900%, 04/01/26
|
147,380
|
|||||
|
AXA Equitable Holdings
|
|||||||
|
1,949,000
|
5.000%, 04/20/48
|
2,101,418
|
|||||
|
Bank of America
|
|||||||
|
574,000
|
6.000%, 10/15/36
|
785,138
|
|||||
|
Bank of America MTN
|
|||||||
|
769,000
|
5.000%, 01/21/44
|
980,280
|
|||||
|
159,000
|
4.443%, VAR ICE LIBOR USD 3 Month+1.990%, 01/20/48
|
191,106
|
|||||
|
668,000
|
3.500%, 04/19/26
|
710,296
|
|||||
|
Citigroup
|
|||||||
|
187,000
|
4.650%, 07/30/45
|
228,854
|
|||||
|
815,000
|
4.281%, VAR ICE LIBOR USD 3 Month+1.839%, 04/24/48
|
963,274
|
|||||
|
405,000
|
3.200%, 10/21/26
|
420,033
|
|||||
|
Goldman Sachs Group
|
|||||||
|
1,964,000
|
3.500%, 11/16/26
|
2,046,249
|
|||||
|
HSBC Holdings
|
|||||||
|
356,000
|
4.583%, VAR ICE LIBOR USD 3 Month+1.535%, 06/19/29
|
398,261
|
|||||
|
790,000
|
3.973%, VAR ICE LIBOR USD 3 Month+1.610%, 05/22/30
|
853,033
|
|||||
|
JPMorgan Chase
|
|||||||
|
295,000
|
5.600%, 07/15/41
|
396,139
|
|||||
|
151,000
|
4.260%, VAR ICE LIBOR USD 3 Month+1.580%, 02/22/48
|
176,223
|
|||||
|
Principal Amount ($)
|
Value $
|
||||||
|
MetLife
|
|||||||
|
435,000
|
6.400%, 12/15/36
|
528,355
|
|||||
|
185,000
|
5.875%, 02/06/41
|
253,043
|
|||||
|
Morgan Stanley MTN
|
|||||||
|
338,000
|
4.300%, 01/27/45
|
393,027
|
|||||
|
Prudential Financial
|
|||||||
|
146,000
|
5.700%, VAR ICE LIBOR USD 3 Month+2.665%, 09/15/48
|
165,695
|
|||||
|
204,000
|
3.935%, 12/07/49
|
222,995
|
|||||
|
Unum Group
|
|||||||
|
98,000
|
5.750%, 08/15/42
|
110,784
|
|||||
|
265,000
|
4.000%, 06/15/29
|
278,565
|
|||||
|
Wells Fargo
|
|||||||
|
487,000
|
3.900%, 05/01/45
|
550,339
|
|||||
|
13,599,908
|
|||||||
|
Healthcare – 3.2%
|
|||||||
|
AbbVie
|
|||||||
|
591,000
|
4.700%, 05/14/45
|
632,195
|
|||||
|
Aetna
|
|||||||
|
36,000
|
3.875%, 08/15/47
|
34,863
|
|||||
|
Amgen
|
|||||||
|
170,000
|
4.663%, 06/15/51
|
198,750
|
|||||
|
Anthem
|
|||||||
|
675,000
|
4.625%, 05/15/42
|
744,477
|
|||||
|
Bayer US Finance II (1)
|
|||||||
|
251,000
|
4.700%, 07/15/64
|
241,663
|
|||||
|
Bristol-Myers Squibb (1)
|
|||||||
|
626,000
|
4.125%, 06/15/39
|
713,199
|
|||||
|
Cigna
|
|||||||
|
548,000
|
4.900%, 12/15/48
|
636,492
|
|||||
|
CommonSpirit Health
|
|||||||
|
330,000
|
4.187%, 10/01/49
|
338,069
|
|||||
|
UnitedHealth Group
|
|||||||
|
201,000
|
4.450%, 12/15/48
|
237,218
|
|||||
|
3,776,926
|
|||||||
|
Industrials – 3.4%
|
|||||||
|
Burlington Northern Santa Fe
|
|||||||
|
207,000
|
4.900%, 04/01/44
|
259,348
|
|||||
|
569,000
|
4.150%, 04/01/45
|
652,733
|
|||||
|
33,000
|
4.150%, 12/15/48
|
38,479
|
|||||
|
GE Capital International Funding Unlimited
|
|||||||
|
500,000
|
4.418%, 11/15/35
|
527,724
|
|||||
|
General Electric Capital MTN
|
|||||||
|
358,000
|
6.750%, 03/15/32
|
456,017
|
|||||
|
Schroder Long Duration Investment-Grade Bond Fund
|
Schedule of Investments (continued)
October 31, 2019
|
Principal Amount ($)
|
Value $
|
||||||
|
Johnson Controls International
|
|||||||
|
77,000
|
4.500%, 02/15/47
|
83,608
|
|||||
|
Siemens Financieringsmaatschappij (1)
|
|||||||
|
618,000
|
4.200%, 03/16/47
|
736,931
|
|||||
|
Union Pacific
|
|||||||
|
512,000
|
4.150%, 01/15/45
|
566,634
|
|||||
|
Waste Management
|
|||||||
|
577,000
|
4.150%, 07/15/49
|
669,679
|
|||||
|
3,991,153
|
|||||||
|
Information Technology – 4.3%
|
|||||||
|
Apple
|
|||||||
|
149,000
|
3.750%, 11/13/47
|
167,948
|
|||||
|
386,000
|
2.950%, 09/11/49
|
373,178
|
|||||
|
Fiserv
|
|||||||
|
1,183,000
|
3.500%, 07/01/29
|
1,251,404
|
|||||
|
Microsoft
|
|||||||
|
675,000
|
4.500%, 02/06/57
|
877,104
|
|||||
|
257,000
|
4.450%, 11/03/45
|
326,399
|
|||||
|
887,000
|
3.700%, 08/08/46
|
1,009,367
|
|||||
|
Oracle
|
|||||||
|
707,000
|
4.000%, 11/15/47
|
792,473
|
|||||
|
Visa
|
|||||||
|
202,000
|
4.300%, 12/14/45
|
250,411
|
|||||
|
5,048,284
|
|||||||
|
Materials – 0.9%
|
|||||||
|
Barrick North America Finance LLC
|
|||||||
|
316,000
|
5.700%, 05/30/41
|
402,009
|
|||||
|
Dow Chemical
|
|||||||
|
148,000
|
9.400%, 05/15/39
|
244,104
|
|||||
|
122,000
|
4.625%, 10/01/44
|
131,256
|
|||||
|
International Paper
|
|||||||
|
177,000
|
7.300%, 11/15/39
|
242,765
|
|||||
|
1,020,134
|
|||||||
|
Real Estate – 2.2%
|
|||||||
|
American Tower REIT
|
|||||||
|
890,000
|
3.700%, 10/15/49
|
884,253
|
|||||
|
Camden Property Trust REIT
|
|||||||
|
595,000
|
3.350%, 11/01/49
|
602,723
|
|||||
|
Simon Property Group REIT
|
|||||||
|
1,172,000
|
3.250%, 09/13/49
|
1,161,547
|
|||||
|
2,648,523
|
|||||||
|
Utilities – 6.8%
|
|||||||
|
Commonwealth Edison
|
|||||||
|
82,000
|
4.600%, 08/15/43
|
98,883
|
|||||
|
840,000
|
4.000%, 03/01/49
|
975,482
|
|||||
|
Principal Amount
($)
|
Value $
|
||||||
|
Duke Energy Carolinas
|
|||||||
|
222,000
|
3.875%, 03/15/46
|
249,924
|
|||||
|
138,000
|
3.700%, 12/01/47
|
151,049
|
|||||
|
Duke Energy Indiana
|
|||||||
|
112,000
|
6.120%, 10/15/35
|
150,433
|
|||||
|
Duke Energy Ohio
|
|||||||
|
822,000
|
4.300%, 02/01/49
|
972,934
|
|||||
|
Duke Energy Progress
|
|||||||
|
185,000
|
4.200%, 08/15/45
|
214,291
|
|||||
|
Florida Power & Light
|
|||||||
|
175,000
|
4.050%, 10/01/44
|
203,430
|
|||||
|
1,065,000
|
3.990%, 03/01/49
|
1,250,663
|
|||||
|
PacifiCorp
|
|||||||
|
761,000
|
4.150%, 02/15/50
|
901,763
|
|||||
|
PPL Electric Utilities
|
|||||||
|
80,000
|
3.950%, 06/01/47
|
90,485
|
|||||
|
Public Service of Colorado
|
|||||||
|
183,000
|
4.300%, 03/15/44
|
215,460
|
|||||
|
267,000
|
3.800%, 06/15/47
|
300,412
|
|||||
|
140,000
|
3.550%, 06/15/46
|
147,636
|
|||||
|
Sempra Energy
|
|||||||
|
523,000
|
6.000%, 10/15/39
|
665,906
|
|||||
|
162,000
|
4.000%, 02/01/48
|
169,645
|
|||||
|
Southern
|
|||||||
|
616,000
|
4.400%, 07/01/46
|
694,576
|
|||||
|
Southwestern Public Service
|
|||||||
|
520,000
|
4.400%, 11/15/48
|
627,044
|
|||||
|
8,080,016
|
|||||||
|
TOTAL CORPORATE OBLIGATIONS
|
|||||||
|
(Cost $62,465,185)
|
70,562,903
|
||||||
|
U.S. TREASURY OBLIGATIONS – 38.5%
|
|||||||
|
United States Treasury Bonds
|
|||||||
|
1,089,700
|
4.625%, 02/15/40
|
1,560,782
|
|||||
|
5,062,900
|
4.500%, 02/15/36
|
6,935,184
|
|||||
|
1,949,400
|
4.375%, 05/15/40
|
2,712,484
|
|||||
|
628,000
|
3.375%, 11/15/48
|
791,059
|
|||||
|
938,000
|
3.125%, 05/15/48
|
1,127,176
|
|||||
|
143,100
|
3.000%, 05/15/47
|
167,561
|
|||||
|
2,922,000
|
3.000%, 08/15/48
|
3,434,834
|
|||||
|
11,106,500
|
2.875%, 05/15/43
|
12,580,280
|
|||||
|
130,000
|
2.875%, 05/15/49
|
149,795
|
|||||
|
8,098,600
|
2.750%, 08/15/47
|
9,060,309
|
|||||
|
3,487,700
|
2.750%, 11/15/47
|
3,905,407
|
|||||
|
3,037,000
|
2.659%, 05/15/48 (2)
|
1,612,914
|
|||||
|
625,000
|
2.250%, 08/15/49
|
634,912
|
|||||
|
Schroder Long Duration Investment-Grade Bond Fund
|
Schedule of Investments (concluded)
October 31, 2019
|
Principal Amount ($)
|
Value $
|
||||||
|
United States Treasury Note
|
|||||||
|
996,000
|
1.625%, 08/15/29
|
990,047
|
|||||
|
TOTAL U.S. TREASURY OBLIGATIONS
|
|||||||
|
(Cost $39,343,081)
|
45,662,744
|
||||||
|
TAXABLE MUNICIPAL BOND – 0.8%
|
|||||||
|
California – 0.8%
|
|||||||
|
University of California RB, Series AD
|
|||||||
|
739,000
|
4.858%, 05/15/12
|
||||||
|
(Cost $753,063)
|
957,803
|
||||||
|
TOTAL INVESTMENTS IN SECURITIES – 98.9%
|
|||||||
|
(Cost $102,561,329)
|
117,183,450
|
||||||
|
OTHER ASSETS LESS LIABILITIES – 1.1%
|
1,363,148
|
||||||
|
NET ASSETS – 100%
|
$
|
118,546,598
|
|||||
| (1) |
Security exempt from registration under Rule 144A of the Securities Act of 1933. This security may be resold in transactions exempt from registration normally to qualified
institutions. On October 31, 2019, the value of these securities amounted to $2,700,621, representing 2.3% of the net assets of the Fund.
|
| (2) |
United States Treasury PO STRIPS — Rate disclosed is the effective yield at time of purchase.
|
ICE — Intercontinental Exchange
LIBOR — London Interbank Offered Rate
LLC — Limited Liability Corporation
MTN — Medium Term Note
PO — Principal Only
RB — Revenue Bond
REIT — Real Estate Investment Trust
STRIPS — Separately Traded Registered Interest and Principal Securities
USD — United States Dollar
VAR — Variable Rate
The following is a summary of the inputs used as of October 31, 2019, in valuing the Fund’s investments carried at value:
|
Investments in Securities (1)
|
Level 1
|
Level 2
|
Level 3
|
Total
|
||||||||||||
|
Corporate Obligations
|
$
|
—
|
$
|
70,562,903
|
$
|
—
|
$
|
70,562,903
|
||||||||
|
U.S. Treasury Obligations
|
—
|
45,662,744
|
—
|
45,662,744
|
||||||||||||
|
Taxable Municipal Bond
|
—
|
957,803
|
—
|
957,803
|
||||||||||||
|
Total Investments in Securities
|
$
|
—
|
$
|
117,183,450
|
$
|
—
|
$
|
117,183,450
|
||||||||
(1) For the year ended October 31, 2019, there were no transfers in or out of Level 3.
|
Schroder Short Duration Bond Fund
|
Schedule of Investments
October 31, 2019
|
Principal Amount ($)
|
Value $
|
||||||
|
U.S. TREASURY OBLIGATIONS – 39.1%
|
|||||||
|
United States Treasury Bill (1)
|
|||||||
|
1,870,000
|
1.572%, 02/27/20
|
1,860,722
|
|||||
|
United States Treasury Notes
|
|||||||
|
484,000
|
2.500%, 02/28/21
|
489,653
|
|||||
|
145,000
|
2.500%, 01/15/22
|
147,979
|
|||||
|
111,000
|
2.500%, 01/31/24
|
115,401
|
|||||
|
327,000
|
2.375%, 03/15/22
|
333,553
|
|||||
|
807,000
|
2.250%, 03/31/20
|
809,112
|
|||||
|
2,247,200
|
2.250%, 04/15/22
|
2,285,648
|
|||||
|
300,000
|
1.875%, 12/31/19
|
300,026
|
|||||
|
77,300
|
1.750%, 07/15/22
|
77,756
|
|||||
|
TOTAL U.S. TREASURY OBLIGATIONS
|
|||||||
|
(Cost $6,395,356)
|
6,419,850
|
||||||
|
CORPORATE OBLIGATIONS – 37.2%
|
|||||||
|
Communication Services – 1.6%
|
|||||||
|
Comcast
|
|||||||
|
93,000
|
3.450%, 10/01/21
|
95,842
|
|||||
|
Verizon Communications
|
|||||||
|
168,000
|
2.946%, 03/15/22
|
172,275
|
|||||
|
268,117
|
|||||||
|
Consumer Discretionary – 3.8%
|
|||||||
|
Altria Group
|
|||||||
|
151,000
|
4.750%, 05/05/21
|
156,868
|
|||||
|
General Motors
|
|||||||
|
154,000
|
3.034%, VAR ICE LIBOR USD 3 Month+0.900%, 09/10/21
|
154,079
|
|||||
|
General Motors Financial
|
|||||||
|
75,000
|
4.200%, 11/06/21
|
77,535
|
|||||
|
Volkswagen Group of America Finance LLC (2)
|
|||||||
|
242,000
|
2.700%, 09/26/22
|
244,245
|
|||||
|
632,727
|
|||||||
|
Consumer Staples – 1.1%
|
|||||||
|
Altria Group
|
|||||||
|
80,000
|
3.490%, 02/14/22
|
82,245
|
|||||
|
Molson Coors Brewing
|
|||||||
|
104,000
|
2.100%, 07/15/21
|
104,072
|
|||||
|
186,317
|
|||||||
|
Energy – 2.9%
|
|||||||
|
EQT
|
|||||||
|
163,000
|
2.500%, 10/01/20
|
162,832
|
|||||
|
Kinder Morgan
|
|||||||
|
150,000
|
3.050%, 12/01/19
|
150,102
|
|||||
|
Principal Amount ($)
|
Value $
|
||||||
|
MPLX
|
|||||||
|
60,000
|
3.375%, 03/15/23
|
61,626
|
|||||
|
Occidental Petroleum
|
|||||||
|
99,000
|
2.700%, 08/15/22
|
100,043
|
|||||
|
474,603
|
|||||||
|
Financials – 17.8%
|
|||||||
|
American Express
|
|||||||
|
165,000
|
3.000%, 02/22/21
|
167,351
|
|||||
|
American International Group
|
|||||||
|
91,000
|
3.300%, 03/01/21
|
92,479
|
|||||
|
AXA Equitable Holdings
|
|||||||
|
238,000
|
3.900%, 04/20/23
|
249,464
|
|||||
|
Bank of America MTN
|
|||||||
|
185,000
|
2.456%, VAR ICE LIBOR USD 3 Month+0.870%, 10/22/25
|
185,997
|
|||||
|
Bank of New York Mellon MTN
|
|||||||
|
92,000
|
1.950%, 08/23/22
|
92,211
|
|||||
|
Bank of Nova Scotia
|
|||||||
|
140,000
|
2.375%, 01/18/23
|
141,325
|
|||||
|
Barclays Bank
|
|||||||
|
200,000
|
2.650%, 01/11/21
|
201,603
|
|||||
|
BB&T MTN
|
|||||||
|
158,000
|
2.200%, 03/16/23
|
158,733
|
|||||
|
Citigroup
|
|||||||
|
368,000
|
2.650%, 10/26/20
|
370,562
|
|||||
|
Goldman Sachs Group
|
|||||||
|
202,000
|
3.200%, 02/23/23
|
208,311
|
|||||
|
124,000
|
2.750%, 09/15/20
|
124,749
|
|||||
|
National Bank of Canada (2)
|
|||||||
|
250,000
|
2.150%, 10/07/22
|
250,382
|
|||||
|
PNC Bank
|
|||||||
|
250,000
|
2.232%, VAR ICE LIBOR USD 3 Month+0.440%, 07/22/22
|
251,027
|
|||||
|
Regions Bank
|
|||||||
|
250,000
|
2.750%, 04/01/21
|
252,165
|
|||||
|
SunTrust Bank
|
|||||||
|
169,000
|
2.590%, VAR ICE LIBOR USD 3 Month+0.298%, 01/29/21
|
169,125
|
|||||
|
2,915,484
|
|||||||
|
Healthcare – 3.0%
|
|||||||
|
Bayer US Finance II LLC (2)
|
|||||||
|
200,000
|
3.500%, 06/25/21
|
204,000
|
|||||
|
Cigna
|
|||||||
|
79,000
|
3.400%, 09/17/21
|
80,910
|
|||||
|
CommonSpirit Health
|
|||||||
|
45,000
|
2.760%, 10/01/24
|
45,678
|
|||||
|
Schroder Short Duration Bond Fund
|
Schedule of Investments (continued)
October 31, 2019
|
Principal Amount ($)
|
Value $
|
||||||
|
Humana
|
|||||||
|
164,000
|
2.500%, 12/15/20
|
164,702
|
|||||
|
495,290
|
|||||||
|
Industrials – 3.1%
|
|||||||
|
Air Lease
|
|||||||
|
53,000
|
2.250%, 01/15/23
|
52,760
|
|||||
|
Equifax
|
|||||||
|
65,000
|
3.600%, 08/15/21
|
66,646
|
|||||
|
General Electric MTN
|
|||||||
|
63,000
|
3.100%, 01/09/23
|
64,076
|
|||||
|
Northrop Grumman
|
|||||||
|
155,000
|
2.080%, 10/15/20
|
155,207
|
|||||
|
United Technologies
|
|||||||
|
155,000
|
3.650%, 08/16/23
|
163,954
|
|||||
|
502,643
|
|||||||
|
Information Technology – 2.3%
|
|||||||
|
Microsoft
|
|||||||
|
372,000
|
2.000%, 11/03/20
|
372,896
|
|||||
|
Real Estate – 1.6%
|
|||||||
|
Crown Castle International REIT
|
|||||||
|
45,000
|
3.400%, 02/15/21
|
45,745
|
|||||
|
Digital Realty Trust REIT
|
|||||||
|
32,000
|
2.750%, 02/01/23
|
32,443
|
|||||
|
Simon Property Group REIT
|
|||||||
|
76,000
|
2.000%, 09/13/24
|
75,850
|
|||||
|
Ventas Realty REIT
|
|||||||
|
105,000
|
2.650%, 01/15/25
|
106,363
|
|||||
|
260,401
|
|||||||
|
TOTAL CORPORATE OBLIGATIONS
|
|||||||
|
(Cost $6,030,435)
|
6,108,478
|
||||||
|
U.S. GOVERNMENT MORTGAGE-BACKED OBLIGATIONS – 9.6%
|
|||||||
|
Federal Home Loan Mortgage Corporation – 1.4%
|
|||||||
|
FHLMC
|
|||||||
|
223,586
|
4.000%, 01/01/49
|
231,914
|
|||||
|
Federal National Mortgage Association – 6.7%
|
|||||||
|
FNMA
|
|||||||
|
243,567
|
4.000%, 08/01/48
|
253,053
|
|||||
|
245,053
|
4.000%, 11/01/48
|
254,399
|
|||||
|
250,754
|
4.000%, 08/01/49
|
260,500
|
|||||
|
311,294
|
4.000%, 09/01/49
|
323,995
|
|||||
|
1,091,947
|
|||||||
|
Principal Amount ($)
|
Value $
|
||||||
|
Government National Mortgage Association – 1.5%
|
|||||||
|
GNMA
|
|||||||
|
233,877
|
4.000%, 10/20/48
|
243,720
|
|||||
|
TOTAL U.S. GOVERNMENT MORTGAGE-BACKED OBLIGATIONS
|
|||||||
|
(Cost $1,549,871)
|
1,567,581
|
||||||
|
ASSET-BACKED SECURITIES – 8.9%
|
|||||||
|
BlueMountain CLO, Series 2017-2A, Class A1R (2)
|
|||||||
|
250,000
|
3.133%, VAR ICE LIBOR USD 3 Month+1.180%, 10/22/30
|
248,956
|
|||||
|
Cedar Funding VIII CLO, Series 2017-8A, Class A1 (2)
|
|||||||
|
250,000
|
3.252%, VAR ICE LIBOR USD 3 Month+1.250%, 10/17/30
|
250,078
|
|||||
|
Galaxy XXI CLO, Series 2018-21A, Class AR (2)
|
|||||||
|
250,000
|
2.986%, VAR ICE LIBOR USD 3 Month+1.020%, 04/20/31
|
247,012
|
|||||
|
Sound Point CLO II, Series 2018-1A, Class A1R (2)
|
|||||||
|
250,000
|
3.006%, VAR ICE LIBOR USD 3 Month+1.070%, 01/26/31
|
247,640
|
|||||
|
Towd Point Mortgage Trust, Series 2016-4, Class A1 (2) (3)
|
|||||||
|
46,059
|
2.250%, 07/25/56
|
45,977
|
|||||
|
Towd Point Mortgage Trust, Series 2017-3, Class A1 (2) (3)
|
|||||||
|
61,421
|
2.750%, 07/25/57
|
61,989
|
|||||
|
Towd Point Mortgage Trust, Series 2017-6, Class A1 (2) (3)
|
|||||||
|
111,885
|
2.750%, 10/25/57
|
112,817
|
|||||
|
Voya CLO, Series 2017-3A, Class A1A (2)
|
|||||||
|
250,000
|
3.196%, VAR ICE LIBOR USD 3 Month+1.230%, 07/20/30
|
250,164
|
|||||
|
TOTAL ASSET-BACKED SECURITIES
|
|||||||
|
(Cost $1,476,029)
|
1,464,633
|
||||||
|
COLLATERALIZED MORTGAGE OBLIGATIONS – 2.7%
|
|||||||
|
Flagstar Mortgage Trust, Series 2017-2, Class A5 (2) (3)
|
|||||||
|
92,028
|
3.500%, 10/25/47
|
93,921
|
|||||
|
JPMorgan Mortgage Trust, Series 2015-6, Class A5 (2) (3)
|
|||||||
|
137,646
|
3.500%, 10/25/45
|
138,971
|
|||||
|
Schroder Short Duration Bond Fund
|
Schedule of Investments (continued)
October 31, 2019
|
Principal Amount ($)
|
Value $
|
||||||
|
JPMorgan Mortgage Trust, Series 2017-1, Class A5 (2) (3)
|
|||||||
|
76,596
|
3.500%, 01/25/47
|
77,440
|
|||||
|
JPMorgan Mortgage Trust, Series 2017-4, Class A5 (2) (3)
|
|||||||
|
126,457
|
3.500%, 11/25/48
|
127,972
|
|||||
|
TOTAL COLLATERALIZED MORTGAGE OBLIGATIONS
|
|||||||
|
(Cost $439,395)
|
438,304
|
||||||
|
COMMERCIAL MORTGAGE-BACKED OBLIGATIONS – 1.0%
|
|||||||
|
BX Commercial Mortgage Trust, Series 2018-IND, Class B (2)
|
|||||||
|
78,528
|
2.814%, VAR ICE LIBOR USD 1 Month+0.900%, 11/15/35
|
78,430
|
|||||
|
BX Commercial Mortgage Trust, Series 2018-IND, Class C (2)
|
|||||||
|
78,528
|
3.014%, VAR ICE LIBOR USD 1 Month+1.100%, 11/15/35
|
78,478
|
|||||
|
TOTAL COMMERCIAL MORTGAGE-BACKED OBLIGATIONS
|
|||||||
|
(Cost $157,056)
|
156,908
|
||||||
|
Principal Amount ($)
|
Value $
|
||||||
|
TAXABLE MUNICIPAL BOND – 0.2%
|
|||||||
|
Kentucky – 0.2%
|
|||||||
|
State Higher Education Student Loan RB, Series 1A
|
|||||||
|
35,000
|
3.358%, 06/01/20
|
||||||
|
(Cost $35,000)
|
35,288
|
||||||
|
TOTAL INVESTMENTS IN SECURITIES – 98.7%
|
|||||||
|
(Cost $16,083,142)
|
16,191,042
|
||||||
|
OTHER ASSETS LESS LIABILITIES – 1.3%
|
210,815
|
||||||
|
NET ASSETS – 100%
|
$
|
16,401,857
|
|||||
| (1) |
Zero Coupon Security — Rate disclosed is the effective yield at time of purchase.
|
| (2) |
Security exempt from registration under Rule 144A of the Securities Act of 1933. This security may be resold in transactions exempt from registration normally to
qualified institutions. On October 31, 2019, the value of these securities amounted to $2,758,472, representing 16.8% of the net assets of the Fund.
|
| (3) |
Variable or floating rate security, the interest rate of which adjusts periodically based on changes in current interest rates and prepayments on the underlying pool
of assets.
|
The open futures contracts held by the Fund at October 31, 2019, are as follows:
|
Type of Contract
|
Number of
Contracts Long (Short) |
Expiration
Date |
Notional
Amount |
Value
|
Unrealized Appreciation (Depreciation)
|
||||||||||||
|
U.S. 2-Year Treasury Note
|
12
|
Jan-2020
|
$
|
2,593,826
|
$
|
2,587,219
|
$
|
(6,607
|
)
|
||||||||
|
U.S. 5-Year Treasury Note
|
(1)
|
|
Jan-2020
|
(119,961
|
)
|
(119,203
|
)
|
758
|
|||||||||
|
$
|
2,473,865
|
$
|
2,468,016
|
$
|
(5,849
|
)
|
|||||||||||
|
Schroder Short Duration Bond Fund
|
Schedule of Investments (concluded)
October 31, 2019
CLO — Collateralized Loan Obligation
FHLMC — Federal Home Loan Mortgage Corporation
FNMA — Federal National Mortgage Association
GNMA — Government National Mortgage Association
ICE — Intercontinental Exchange
LIBOR — London Interbank Offered Rate
LLC — Limited Liability Corporation
MTN — Medium Term Note
RB — Revenue Bond
REIT — Real Estate Investment Trust
USD — United States Dollar
VAR — Variable Rate
The following is a summary of the inputs used as of October 31, 2019, in valuing the Fund’s investments carried at value:
|
Investments in Securities (1)
|
Level 1
|
Level 2
|
Level 3
|
Total
|
||||||||||||
|
U.S. Treasury Obligations
|
$
|
—
|
$
|
6,419,850
|
$
|
—
|
$
|
6,419,850
|
||||||||
|
Corporate Obligations
|
—
|
6,108,478
|
—
|
6,108,478
|
||||||||||||
|
U.S. Government Mortgage-Backed
Obligations |
—
|
1,567,581
|
—
|
1,567,581
|
||||||||||||
|
Asset-Backed Securities
|
—
|
1,464,633
|
—
|
1,464,633
|
||||||||||||
|
Collateralized Mortgage Obligations
|
—
|
438,304
|
—
|
438,304
|
||||||||||||
|
Commercial Mortgage-Backed Obligations
|
—
|
156,908
|
—
|
156,908
|
||||||||||||
|
Taxable Municipal Bond
|
—
|
35,288
|
—
|
35,288
|
||||||||||||
|
Total Investments in Securities
|
$
|
—
|
$
|
16,191,042
|
$
|
—
|
$
|
16,191,042
|
||||||||
|
Other Financial Instruments
|
Level 1
|
Level 2
|
Level 3
|
Total
|
||||||||||||
|
Futures — Unrealized Appreciation
|
$
|
758
|
$
|
—
|
$
|
—
|
$
|
758
|
||||||||
|
Futures — Unrealized Depreciation
|
(6,607
|
)
|
—
|
—
|
(6,607
|
)
|
||||||||||
|
Total Other Financial Instruments
|
$
|
(5,849
|
)
|
$
|
—
|
$
|
—
|
$
|
(5,849
|
)
|
||||||
(1) For the year ended October 31, 2019, there were no transfers in or out of Level 3.
|
Schroder Total Return Fixed Income Fund
|
Schedule of Investments
October 31, 2019
|
Principal Amount ($)
|
Value $
|
||||||
|
CORPORATE OBLIGATIONS – 38.4%
|
|||||||
|
Communication Services – 2.2%
|
|||||||
|
AT&T
|
|||||||
|
200,000
|
3.400%, 05/15/25
|
209,560
|
|||||
|
Charter Communications Operating LLC
|
|||||||
|
128,000
|
4.800%, 03/01/50
|
131,027
|
|||||
|
Comcast
|
|||||||
|
179,000
|
3.950%, 10/15/25
|
196,221
|
|||||
|
Verizon Communications
|
|||||||
|
150,000
|
3.258%, VAR ICE LIBOR USD 3 Month+1.100%, 05/15/25
|
152,579
|
|||||
|
Vodafone Group
|
|||||||
|
260,000
|
2.991%, VAR ICE LIBOR USD 3 Month+0.990%, 01/16/24
|
262,675
|
|||||
|
952,062
|
|||||||
|
Consumer Discretionary – 2.4%
|
|||||||
|
Ford Motor Credit LLC
|
|||||||
|
208,000
|
4.063%, 11/01/24
|
208,711
|
|||||
|
General Motors Financial
|
|||||||
|
315,000
|
3.700%, 11/24/20
|
319,690
|
|||||
|
300,000
|
3.250%, 01/05/23
|
303,831
|
|||||
|
L Brands
|
|||||||
|
205,000
|
6.875%, 11/01/35
|
174,250
|
|||||
|
1,006,482
|
|||||||
|
Consumer Staples – 4.2%
|
|||||||
|
Albertsons (1)
|
|||||||
|
17,000
|
5.875%, 02/15/28
|
18,148
|
|||||
|
Altria Group
|
|||||||
|
293,000
|
4.800%, 02/14/29
|
321,663
|
|||||
|
98,000
|
4.400%, 02/14/26
|
105,695
|
|||||
|
Anheuser-Busch InBev Worldwide
|
|||||||
|
203,000
|
4.150%, 01/23/25
|
221,932
|
|||||
|
BAT Capital
|
|||||||
|
65,000
|
3.557%, 08/15/27
|
65,364
|
|||||
|
137,000
|
3.222%, 08/15/24
|
139,084
|
|||||
|
317,000
|
2.764%, 08/15/22
|
320,033
|
|||||
|
Boston Scientific
|
|||||||
|
116,000
|
3.450%, 03/01/24
|
121,774
|
|||||
|
Bristol-Myers Squibb (1)
|
|||||||
|
185,000
|
3.400%, 07/26/29
|
198,984
|
|||||
|
CVS Health
|
|||||||
|
243,000
|
4.300%, 03/25/28
|
264,296
|
|||||
|
1,776,973
|
|||||||
|
Principal Amount ($)
|
Value $
|
||||||
|
Energy – 2.9%
|
|||||||
|
Apache
|
|||||||
|
200,000
|
4.375%, 10/15/28
|
198,453
|
|||||
|
Canadian Natural Resources
|
|||||||
|
171,000
|
6.250%, 03/15/38
|
216,216
|
|||||
|
Cenovus Energy
|
|||||||
|
198,000
|
4.250%, 04/15/27
|
207,775
|
|||||
|
Enterprise Products Operating LLC
|
|||||||
|
179,000
|
4.200%, 01/31/50
|
189,295
|
|||||
|
Plains All American Pipeline
|
|||||||
|
235,000
|
3.550%, 12/15/29
|
224,682
|
|||||
|
Williams Partners
|
|||||||
|
200,000
|
4.300%, 03/04/24
|
212,412
|
|||||
|
1,248,833
|
|||||||
|
Financials – 19.5%
|
|||||||
|
AIB Group MTN (1)
|
|||||||
|
400,000
|
4.263%, VAR ICE LIBOR USD 3 Month+1.874%, 04/10/25
|
421,306
|
|||||
|
American Tower
|
|||||||
|
312,000
|
3.800%, 08/15/29
|
333,538
|
|||||
|
AXA Equitable Holdings
|
|||||||
|
244,000
|
4.350%, 04/20/28
|
263,080
|
|||||
|
Bank of America MTN
|
|||||||
|
304,000
|
2.884%, VAR ICE LIBOR USD 3 Month+0.012%, 10/22/30
|
305,741
|
|||||
|
40,000
|
2.456%, VAR ICE LIBOR USD 3 Month+0.870%, 10/22/25
|
40,215
|
|||||
|
Bank of Ireland Group (1)
|
|||||||
|
265,000
|
4.500%, 11/25/23
|
280,142
|
|||||
|
Bank of New York Mellon MTN
|
|||||||
|
234,000
|
1.950%, 08/23/22
|
234,537
|
|||||
|
Banque Federative du Credit Mutuel MTN (1)
|
|||||||
|
210,000
|
2.700%, 07/20/22
|
213,471
|
|||||
|
Barclays Bank (1)
|
|||||||
|
650,000
|
10.179%, 06/12/21
|
727,711
|
|||||
|
Camden Property Trust
|
|||||||
|
56,000
|
3.150%, 07/01/29
|
58,923
|
|||||
|
Capital One Financial
|
|||||||
|
250,000
|
2.150%, 09/06/22
|
249,913
|
|||||
|
Citigroup
|
|||||||
|
335,000
|
4.300%, 11/20/26
|
362,951
|
|||||
|
295,000
|
3.200%, 10/21/26
|
305,950
|
|||||
|
Schroder Total Return Fixed Income Fund
|
Schedule of Investments (continued)
October 31, 2019
|
Principal Amount ($)
|
Value $
|
||||||
|
Credit Agricole MTN (1)
|
|||||||
|
280,000
|
2.956%, VAR ICE LIBOR USD 3 Month+1.020%, 04/24/23
|
281,547
|
|||||
|
Credit Suisse Group (1)
|
|||||||
|
250,000
|
3.869%, VAR ICE LIBOR USD 3 Month+1.410%, 01/12/29
|
267,132
|
|||||
|
265,000
|
2.997%, VAR ICE LIBOR USD 3 Month+1.200%, 12/14/23
|
268,816
|
|||||
|
Fifth Third Bancorp
|
|||||||
|
144,000
|
3.650%, 01/25/24
|
151,895
|
|||||
|
257,000
|
2.375%, 01/28/25
|
258,207
|
|||||
|
GE Capital International Funding Unlimited
|
|||||||
|
347,000
|
3.373%, 11/15/25
|
357,044
|
|||||
|
Goldman Sachs Group
|
|||||||
|
65,000
|
2.875%, 02/25/21
|
65,683
|
|||||
|
HCP
|
|||||||
|
65,000
|
3.250%, 07/15/26
|
67,887
|
|||||
|
HSBC Holdings
|
|||||||
|
636,000
|
2.633%, VAR ICE LIBOR USD 3 Month+1.140%, 11/07/25
|
636,000
|
|||||
|
JPMorgan Chase
|
|||||||
|
360,000
|
3.220%, VAR ICE LIBOR USD 3 Month+1.155%, 03/01/25
|
373,187
|
|||||
|
195,000
|
2.700%, 05/18/23
|
198,873
|
|||||
|
Morgan Stanley MTN
|
|||||||
|
200,000
|
3.950%, 04/23/27
|
213,056
|
|||||
|
300,000
|
3.750%, 02/25/23
|
315,377
|
|||||
|
MPT Operating Partnership
|
|||||||
|
115,000
|
4.625%, 08/01/29
|
119,961
|
|||||
|
Royal Bank of Scotland Group
|
|||||||
|
325,000
|
6.125%, 12/15/22
|
354,353
|
|||||
|
Wells Fargo
|
|||||||
|
215,000
|
3.069%, 01/24/23
|
219,218
|
|||||
|
360,000
|
2.406%, VAR ICE LIBOR USD 3 Month+0.825%, 10/30/25
|
360,305
|
|||||
|
8,306,019
|
|||||||
|
Healthcare – 1.5%
|
|||||||
|
Bayer US Finance II LLC (1)
|
|||||||
|
225,000
|
3.875%, 12/15/23
|
235,654
|
|||||
|
Cardinal Health
|
|||||||
|
130,000
|
3.079%, 06/15/24
|
132,144
|
|||||
|
CommonSpirit Health
|
|||||||
|
95,000
|
3.347%, 10/01/29
|
95,737
|
|||||
|
Principal Amount ($)
|
Value $
|
||||||
|
Shire Acquisitions Investments Ireland DAC
|
|||||||
|
195,000
|
2.400%, 09/23/21
|
196,214
|
|||||
|
659,749
|
|||||||
|
Industrials – 1.4%
|
|||||||
|
Fly Leasing
|
|||||||
|
230,000
|
6.375%, 10/15/21
|
233,881
|
|||||
|
General Electric MTN
|
|||||||
|
65,000
|
3.100%, 01/09/23
|
66,110
|
|||||
|
TransDigm (1)
|
|||||||
|
160,000
|
6.250%, 03/15/26
|
171,400
|
|||||
|
United Technologies
|
|||||||
|
100,000
|
3.950%, 08/16/25
|
109,434
|
|||||
|
580,825
|
|||||||
|
Information Technology – 1.9%
|
|||||||
|
Apple
|
|||||||
|
315,000
|
3.000%, 06/20/27
|
332,963
|
|||||
|
111,000
|
2.950%, 09/11/49
|
107,313
|
|||||
|
Dell International LLC (1)
|
|||||||
|
352,000
|
4.900%, 10/01/26
|
381,917
|
|||||
|
822,193
|
|||||||
|
Real Estate – 2.0%
|
|||||||
|
American Tower REIT
|
|||||||
|
275,000
|
3.700%, 10/15/49
|
273,224
|
|||||
|
Crown Castle International REIT
|
|||||||
|
135,000
|
3.200%, 09/01/24
|
140,143
|
|||||
|
Simon Property Group REIT
|
|||||||
|
445,000
|
2.450%, 09/13/29
|
439,740
|
|||||
|
853,107
|
|||||||
|
Utilities – 0.4%
|
|||||||
|
Mexico Generadora de Energia (1)
|
|||||||
|
168,102
|
5.500%, 12/06/32
|
180,920
|
|||||
|
TOTAL CORPORATE OBLIGATIONS
|
|||||||
|
(Cost $15,853,965)
|
16,387,163
|
||||||
|
U.S. GOVERNMENT MORTGAGE-BACKED OBLIGATIONS – 23.9%
|
|||||||
|
Federal Home Loan Mortgage Corporation – 7.5%
|
|||||||
|
FHLMC
|
|||||||
|
621,144
|
4.500%, 08/01/48
|
653,366
|
|||||
|
416,142
|
4.500%, 09/01/48
|
438,945
|
|||||
|
427,995
|
4.500%, 12/01/48
|
449,955
|
|||||
|
692,181
|
4.000%, 11/01/48
|
721,441
|
|||||
|
Schroder Total Return Fixed Income Fund
|
Schedule of Investments (continued)
October 31, 2019
|
Principal Amount ($)
|
Value $
|
||||||
|
389,379
|
3.500%, 05/01/46
|
405,268
|
|||||
|
397,672
|
3.000%, 06/01/49
|
404,670
|
|||||
|
FHLMC Gold
|
|||||||
|
14,686
|
4.500%, 10/01/24
|
15,140
|
|||||
|
121,282
|
3.000%, 01/01/43
|
125,257
|
|||||
|
3,214,042
|
|||||||
|
Federal National Mortgage Association – 10.5%
|
|||||||
|
FNMA
|
|||||||
|
29,603
|
5.000%, 10/01/29
|
31,770
|
|||||
|
410,287
|
4.500%, 08/01/48
|
433,163
|
|||||
|
649,967
|
4.500%, 10/01/48
|
685,261
|
|||||
|
850,093
|
4.500%, 11/01/48
|
894,434
|
|||||
|
645,540
|
4.000%, 12/01/47
|
677,126
|
|||||
|
484,613
|
3.500%, 11/01/47
|
500,309
|
|||||
|
719,931
|
3.500%, 11/01/48
|
737,828
|
|||||
|
97,639
|
3.241%, VAR ICE LIBOR USD 12 Month+1.757%, 06/01/42
|
100,244
|
|||||
|
74,133
|
3.000%, 05/01/43
|
76,471
|
|||||
|
232,690
|
3.000%, 06/01/43
|
240,031
|
|||||
|
91,050
|
3.000%, 07/01/43
|
93,920
|
|||||
|
4,470,557
|
|||||||
|
Government National Mortgage Association – 5.9%
|
|||||||
|
GNMA
|
|||||||
|
363,375
|
5.000%, 10/20/48
|
385,709
|
|||||
|
371,646
|
4.500%, 10/20/48
|
391,127
|
|||||
|
796,270
|
4.000%, 06/20/49
|
829,353
|
|||||
|
572,199
|
3.500%, 04/20/43
|
604,897
|
|||||
|
216,857
|
2.599%, 04/16/54 (2)
|
221,513
|
|||||
|
GNMA IO
|
|||||||
|
1,846,646
|
0.782%, 12/16/51 (2)
|
86,016
|
|||||
|
2,518,615
|
|||||||
|
TOTAL U.S. GOVERNMENT MORTGAGE-BACKED OBLIGATIONS
|
|||||||
|
(Cost $10,018,091)
|
10,203,214
|
||||||
|
U.S. TREASURY OBLIGATIONS – 16.3%
|
|||||||
|
United States Treasury Bonds
|
|||||||
|
516,400
|
4.375%, 05/15/40
|
718,542
|
|||||
|
347,000
|
3.125%, 05/15/48
|
416,983
|
|||||
|
188,000
|
3.000%, 02/15/47
|
220,239
|
|||||
|
200,000
|
3.000%, 05/15/47
|
234,187
|
|||||
|
Principal Amount ($)
|
Value $
|
||||||
|
17,500
|
3.000%, 08/15/48
|
20,572
|
|||||
|
10,400
|
3.000%, 02/15/49
|
12,261
|
|||||
|
20,000
|
2.875%, 11/15/46
|
22,876
|
|||||
|
90,000
|
2.750%, 08/15/47
|
100,688
|
|||||
|
260,000
|
2.750%, 11/15/47
|
291,139
|
|||||
|
210,000
|
2.250%, 08/15/49
|
213,330
|
|||||
|
United States Treasury Inflation Indexed Bond
|
|||||||
|
977,824
|
0.750%, 07/15/28
|
1,029,132
|
|||||
|
United States Treasury Notes
|
|||||||
|
25,000
|
3.125%, 11/15/28
|
28,034
|
|||||
|
12,000
|
2.875%, 11/30/25
|
12,890
|
|||||
|
50,300
|
2.875%, 08/15/28
|
55,255
|
|||||
|
100
|
2.750%, 08/31/25
|
106
|
|||||
|
88,000
|
2.750%, 02/15/28
|
95,525
|
|||||
|
1,669,000
|
2.625%, 07/31/20
|
1,681,452
|
|||||
|
676,100
|
2.625%, 02/15/29
|
730,980
|
|||||
|
536,000
|
2.500%, 02/28/21
|
542,260
|
|||||
|
206,000
|
2.500%, 02/15/22
|
210,418
|
|||||
|
126,000
|
2.375%, 01/31/23
|
129,367
|
|||||
|
62,800
|
1.625%, 10/31/26
|
62,871
|
|||||
|
111,000
|
1.625%, 08/15/29
|
110,337
|
|||||
|
TOTAL U.S. TREASURY OBLIGATIONS
|
|||||||
|
(Cost $6,563,903)
|
6,939,444
|
||||||
|
ASSET-BACKED SECURITIES – 10.7%
|
|||||||
|
CAL Funding III, Series 2017-1A, Class A (1)
|
|||||||
|
316,633
|
3.620%, 06/25/42
|
317,597
|
|||||
|
Cedar Funding VI CLO, Series 2018-6A, Class AR (1)
|
|||||||
|
645,000
|
3.056%, VAR ICE LIBOR USD 3 Month+1.090%, 10/20/28
|
644,141
|
|||||
|
Credit-Based Asset Servicing and Securitization LLC, Series 2003-CB4, Class AF1
|
|||||||
|
19,158
|
5.000%, 03/25/31
|
19,684
|
|||||
|
Dewolf Park CLO, Series 2017-1A, Class A (1)
|
|||||||
|
500,000
|
3.211%, VAR ICE LIBOR USD 3 Month+1.210%, 10/15/30
|
499,744
|
|||||
|
Goldentree Loan Management, Series 2017-2A, Class A (1)
|
|||||||
|
606,000
|
3.116%, VAR ICE LIBOR USD 3 Month+1.150%, 11/28/30
|
605,155
|
|||||
|
Schroder Total Return Fixed Income Fund
|
Schedule of Investments (continued)
October 31, 2019
|
Principal Amount ($)
|
Value $
|
||||||
|
Madison Park Funding XVIII, Series 2017-18A, Class A1R (1)
|
|||||||
|
800,000
|
3.156%, VAR ICE LIBOR USD 3 Month+1.190%, 10/21/30
|
799,594
|
|||||
|
Madison Park Funding XXVI, Series 2017-26A, Class AR (1)
|
|||||||
|
600,000
|
3.128%, VAR ICE LIBOR USD 3 Month+1.200%, 07/29/30
|
599,698
|
|||||
|
Octagon Investment Partners 30, Series 2017-1A, Class A1 (1)
|
|||||||
|
250,000
|
3.286%, VAR ICE LIBOR USD 3 Month+1.320%, 03/17/30
|
250,258
|
|||||
|
Textainer Marine Containers V, Series 2017-1A, Class A (1)
|
|||||||
|
77,331
|
3.720%, 05/20/42
|
77,482
|
|||||
|
Textainer Marine Containers V, Series 2017-2A, Class A (1)
|
|||||||
|
181,832
|
3.520%, 06/20/42
|
182,293
|
|||||
|
Towd Point Mortgage Trust, Series 2015-6, Class A1 (1) (2)
|
|||||||
|
38,909
|
3.500%, 04/25/55
|
39,553
|
|||||
|
Towd Point Mortgage Trust, Series 2017-2, Class A1 (1) (2)
|
|||||||
|
124,773
|
2.750%, 04/25/57
|
125,918
|
|||||
|
Towd Point Mortgage Trust, Series 2017-3, Class A1 (1) (2)
|
|||||||
|
246,911
|
2.750%, 07/25/57
|
249,195
|
|||||
|
Towd Point Mortgage Trust, Series 2017-4, Class A1 (1) (2)
|
|||||||
|
130,979
|
2.750%, 06/25/57
|
132,516
|
|||||
|
TOTAL ASSET-BACKED SECURITIES
|
|||||||
|
(Cost $4,549,423)
|
4,542,828
|
||||||
|
COLLATERALIZED MORTGAGE OBLIGATIONS – 5.7%
|
|||||||
|
Flagstar Mortgage Trust, Series 2017-2, Class A5 (1) (2)
|
|||||||
|
574,268
|
3.500%, 10/25/47
|
586,079
|
|||||
|
Impac Secured Assets Trust, Series 2006-1, Class 2A2
|
|||||||
|
53,298
|
2.233%, VAR ICE LIBOR USD 1 Month+0.410%, 05/25/36
|
52,292
|
|||||
|
Impac Secured Assets Trust, Series 2006-2, Class 2M1
|
|||||||
|
130,000
|
2.323%, VAR ICE LIBOR USD 1 Month+0.500%, 08/25/36
|
130,014
|
|||||
|
Principal Amount ($)
|
Value $
|
||||||
|
JPMorgan Mortgage Trust, Series 2015-3, Class A5 (1) (2)
|
|||||||
|
71,263
|
3.500%, 05/25/45
|
71,740
|
|||||
|
JPMorgan Mortgage Trust, Series 2016-3, Class 1A3 (1) (2)
|
|||||||
|
419,934
|
3.500%, 10/25/46
|
427,316
|
|||||
|
JPMorgan Mortgage Trust, Series 2017-1, Class A4 (1) (2)
|
|||||||
|
86,807
|
3.500%, 01/25/47
|
87,896
|
|||||
|
JPMorgan Mortgage Trust, Series 2017-3, Class 1A5 (1) (2)
|
|||||||
|
362,918
|
3.500%, 08/25/47
|
367,256
|
|||||
|
JPMorgan Mortgage Trust, Series 2017-4, Class A5 (1) (2)
|
|||||||
|
325,546
|
3.500%, 11/25/48
|
329,445
|
|||||
|
Sequoia Mortgage Trust, Series 2015-2, Class A10 (1) (2)
|
|||||||
|
171,972
|
3.500%, 05/25/45
|
174,680
|
|||||
|
Sequoia Mortgage Trust, Series 2015-3, Class A4 (1) (2)
|
|||||||
|
217,290
|
3.500%, 07/25/45
|
221,218
|
|||||
|
TOTAL COLLATERALIZED MORTGAGE OBLIGATIONS
|
|||||||
|
(Cost $2,444,719)
|
2,447,936
|
||||||
|
TAXABLE MUNICIPAL BONDS – 1.3%
|
|||||||
|
New Jersey – 0.3%
|
|||||||
|
State Economic Development Authority RB, Series A, NATL
|
|||||||
|
90,000
|
7.425%, 02/15/29
|
114,630
|
|||||
|
Ohio – 0.1%
|
|||||||
|
American Municipal Power RB, Series B
|
|||||||
|
40,000
|
8.084%, 02/15/50
|
70,719
|
|||||
|
Pennsylvania – 0.9%
|
|||||||
|
Philadelphia Authority for Industrial Development RB
|
|||||||
|
350,000
|
3.964%, 04/15/26
|
373,240
|
|||||
|
TOTAL TAXABLE MUNICIPAL BONDS
|
|||||||
|
(Cost $518,246)
|
558,589
|
||||||
|
Schroder Total Return Fixed Income Fund
|
Schedule of Investments (continued)
October 31, 2019
|
Principal Amount ($)
|
Value $
|
||||||
|
COMMERCIAL MORTGAGE-BACKED OBLIGATIONS – 1.2%
|
|||||||
|
BX Commercial Mortgage Trust, Series 2018-IND, Class B (1)
|
|||||||
|
196,320
|
2.814%, VAR ICE LIBOR USD 1 Month+0.900%, 11/15/35
|
196,074
|
|||||
|
BX Commercial Mortgage Trust, Series 2018-IND, Class C (1)
|
|||||||
|
117,792
|
3.014%, VAR ICE LIBOR USD 1 Month+1.100%, 11/15/35
|
117,718
|
|||||
|
One Market Plaza Trust, Series 2017-1MKT, Class E (1)
|
|||||||
|
195,000
|
4.142%, 02/10/32
|
196,937
|
|||||
|
TOTAL COMMERCIAL MORTGAGE-BACKED OBLIGATIONS
|
|||||||
|
(Cost $504,890)
|
510,729
|
||||||
|
SOVEREIGN GOVERNMENTS – 1.1%
|
|||||||
|
Argentine Republic Government International Bond
|
|||||||
|
124,000
|
5.875%, 01/11/28
|
47,121
|
|||||
|
Principal Amount ($)
|
Value $
|
||||||
|
South Africa Government International Bond
|
|||||||
|
200,000
|
4.850%, 09/27/27
|
203,259
|
|||||
|
Turkey Government International Bond
|
|||||||
|
200,000
|
5.750%, 03/22/24
|
201,493
|
|||||
|
TOTAL SOVEREIGN GOVERNMENTS
|
|||||||
|
(Cost $504,020)
|
451,873
|
||||||
|
TOTAL INVESTMENTS IN SECURITIES – 98.6%
|
|||||||
|
(Cost $40,957,257)
|
42,041,776
|
||||||
|
OTHER ASSETS LESS LIABILITIES – 1.4%
|
584,816
|
||||||
|
NET ASSETS – 100%
|
$
|
42,626,592
|
|||||
| (1) |
Security exempt from registration under Rule 144A of the Securities Act of 1933. This security may be resold in transactions exempt from registration normally to qualified
institutions. On October 31, 2019, the value of these securities amounted to $10,946,651, representing 25.7% of the net assets of the Fund.
|
| (2) |
Variable or floating rate security, the interest rate of which adjusts periodically based on changes in current interest rates and prepayments on the underlying pool of assets.
|
The open futures contracts held by the Fund at October 31, 2019, is as follows:
|
Type of Contract
|
Number of
Contracts Long |
Expiration
Date |
Notional
Amount |
Value
|
Unrealized (Depreciation)
|
||||||||||||
|
U.S. 2-Year Treasury Note
|
11
|
Jan-2020
|
$
|
2,377,674
|
$
|
2,371,617
|
$
|
(6,057
|
)
|
||||||||
|
U.S. 5-Year Treasury Note
|
25
|
Jan-2020
|
3,002,384
|
2,980,078
|
(22,306
|
)
|
|||||||||||
|
U.S. 10-Year Treasury Note
|
20
|
Dec-2019
|
2,633,347
|
2,605,938
|
(27,409
|
)
|
|||||||||||
|
U.S. Long Treasury Bond
|
9
|
Dec-2019
|
1,496,785
|
1,452,375
|
(44,410
|
)
|
|||||||||||
|
U.S. Ultra Long Treasury Bond
|
3
|
Dec-2019
|
596,714
|
569,250
|
(27,464
|
)
|
|||||||||||
|
$
|
10,106,904
|
$
|
9,979,258
|
$
|
(127,646
|
)
|
|||||||||||
|
Schroder Total Return Fixed Income Fund
|
Schedule of Investments (concluded)
October 31, 2019
CLO — Collateralized Loan Obligation
FHLMC — Federal Home Loan Mortgage Corporation
FNMA — Federal National Mortgage Association
GNMA — Government National Mortgage Association
ICE — Intercontinental Exchange
IO — Interest Only
LIBOR — London Interbank Offered Rate
LLC — Limited Liability Corporation
MTN — Medium Term Note
NATL — National Public Finance Guarantee Corporation
RB — Revenue Bond
REIT — Real Estate Investment Trust
USD — United States Dollar
VAR — Variable Rate
The following is a summary of the inputs used as of October 31, 2019, in valuing the Fund’s investments carried at value:
|
Investments in Securities (1)
|
Level 1
|
Level 2
|
Level 3
|
Total
|
||||||||||||
|
Corporate Obligations
|
$
|
—
|
$
|
16,387,163
|
$
|
—
|
$
|
16,387,163
|
||||||||
|
U.S. Government Mortgage-Backed Obligations
|
—
|
10,203,214
|
—
|
10,203,214
|
||||||||||||
|
U.S. Treasury Obligations
|
—
|
6,939,444
|
—
|
6,939,444
|
||||||||||||
|
Asset-Backed Securities
|
—
|
4,542,828
|
—
|
4,542,828
|
||||||||||||
|
Collateralized Mortgage Obligations
|
—
|
2,447,936
|
—
|
2,447,936
|
||||||||||||
|
Taxable Municipal Bonds
|
—
|
558,589
|
—
|
558,589
|
||||||||||||
|
Commercial Mortgage-Backed Obligations
|
—
|
510,729
|
—
|
510,729
|
||||||||||||
|
Sovereign Governments
|
—
|
451,873
|
—
|
451,873
|
||||||||||||
|
Total Investments in Securities
|
$
|
—
|
$
|
42,041,776
|
$
|
—
|
$
|
42,041,776
|
||||||||
|
Other Financial Instruments
|
Level 1
|
Level 2
|
Level 3
|
Total
|
||||||||||||
|
Futures — Unrealized Depreciation
|
$
|
(127,646
|
)
|
$
|
—
|
$
|
—
|
$
|
(127,646
|
)
|
||||||
|
Total Other Financial Instruments
|
$
|
(127,646
|
)
|
$
|
—
|
$
|
—
|
$
|
(127,646
|
)
|
||||||
(1) For the year ended October 31, 2019, there were no transfers in or out of Level 3.
|
Schroder Mutual Funds
|
Statements of Assets and Liabilities
October 31, 2019
|
North American Equity Fund
|
Emerging Markets Small Cap Fund
|
Core Bond Fund
|
Long Duration Investment-Grade Bond Fund
|
Short Duration Bond Fund
|
Total Return Fixed Income Fund
|
|||||||||||||||||||
|
ASSETS
|
||||||||||||||||||||||||
|
Investments in securities, at value — Note 2
|
$
|
946,661,179
|
$
|
2,115,614
|
$
|
61,426,938
|
$
|
117,183,450
|
$
|
16,191,042
|
$
|
42,041,776
|
||||||||||||
|
Cash
|
8,060,408
|
122,054
|
1,376,548
|
748,452
|
201,654
|
538,596
|
||||||||||||||||||
|
Foreign currency
|
—
|
2,661
|
—
|
—
|
—
|
1
|
||||||||||||||||||
|
Receivable for securities sold
|
1,082,695
|
706
|
585,534
|
10,789,198
|
113,855
|
570,345
|
||||||||||||||||||
|
Tax reclaims receivable
|
4,662
|
—
|
3,093
|
—
|
—
|
4,518
|
||||||||||||||||||
|
Receivable for Fund shares sold
|
3,891
|
—
|
—
|
3,928
|
2,931
|
8,435
|
||||||||||||||||||
|
Due from Investment Advisor — Note 3
|
—
|
17,670
|
1,251
|
—
|
16,466
|
5,682
|
||||||||||||||||||
|
Unrealized appreciation on spot foreign
currency contracts |
17
|
—
|
—
|
—
|
—
|
—
|
||||||||||||||||||
|
Unrealized appreciation on forward foreign currency contracts
|
66,965
|
—
|
—
|
—
|
—
|
—
|
||||||||||||||||||
|
Initial margin for futures contracts
|
173,250
|
—
|
—
|
—
|
7,897
|
103,884
|
||||||||||||||||||
|
Dividends and interest receivable
|
943,941
|
1,239
|
328,359
|
1,163,862
|
55,071
|
241,654
|
||||||||||||||||||
|
Variation margin receivable for
futures contracts |
—
|
—
|
—
|
—
|
4,313
|
60,133
|
||||||||||||||||||
|
Prepaid expenses
|
6,616
|
12,138
|
1,821
|
12,999
|
12,175
|
2,330
|
||||||||||||||||||
|
TOTAL ASSETS
|
957,003,624
|
2,272,082
|
63,723,544
|
129,901,889
|
16,605,404
|
43,577,354
|
||||||||||||||||||
|
LIABILITIES
|
||||||||||||||||||||||||
|
Payable for securities purchased
|
1,342,790
|
—
|
1,238,547
|
689,566
|
149,260
|
844,000
|
||||||||||||||||||
|
Variation margin payable for
futures contracts |
15,000
|
—
|
—
|
—
|
555
|
—
|
||||||||||||||||||
|
Income distributions payable
|
—
|
—
|
—
|
—
|
—
|
18,959
|
||||||||||||||||||
|
Accrued foreign capital gains tax
|
—
|
5,881
|
—
|
—
|
—
|
—
|
||||||||||||||||||
|
Payable for Fund shares redeemed
|
—
|
—
|
—
|
10,597,176
|
—
|
5,873
|
||||||||||||||||||
|
Investment Advisory fees payable — Note 3
|
198,540
|
—
|
—
|
6,766
|
—
|
—
|
||||||||||||||||||
|
Sub-administration fees payable — Note 3
|
39,709
|
10,617
|
10,617
|
11,256
|
10,617
|
10,617
|
||||||||||||||||||
|
Audit fees payable
|
16,535
|
12,200
|
16,135
|
16,135
|
18,735
|
16,135
|
||||||||||||||||||
|
Trustees’ fees payable
|
6,952
|
1,222
|
1,501
|
2,051
|
1,311
|
1,470
|
||||||||||||||||||
|
Legal fees payable
|
1,238
|
218
|
267
|
366
|
234
|
262
|
||||||||||||||||||
|
Other professional fees payable
|
6,875
|
9,052
|
4,275
|
4,275
|
6,875
|
4,275
|
||||||||||||||||||
|
Shareholder Servicing Fees, Investor Class — Note 3
|
—
|
—
|
—
|
8,863
|
—
|
30,135
|
||||||||||||||||||
|
Accrued expenses and other liabilities
|
44,150
|
21,065
|
24,870
|
18,837
|
15,960
|
19,036
|
||||||||||||||||||
|
TOTAL LIABILITIES
|
1,671,789
|
60,255
|
1,296,212
|
11,355,291
|
203,547
|
950,762
|
||||||||||||||||||
|
NET ASSETS
|
$
|
955,331,835
|
$
|
2,211,827
|
$
|
62,427,332
|
$
|
118,546,598
|
$
|
16,401,857
|
$
|
42,626,592
|
||||||||||||
|
Cost of securities
|
$
|
598,897,258
|
$
|
1,749,393
|
$
|
59,292,057
|
$
|
102,561,329
|
$
|
16,083,142
|
$
|
40,957,257
|
||||||||||||
|
Cost of foreign currency
|
$
|
—
|
$
|
2,646
|
$
|
—
|
$
|
—
|
$
|
—
|
$
|
—
|
||||||||||||
|
Schroder Mutual Funds
|
Statements of Assets and Liabilities
October 31, 2019
|
North American Equity Fund
|
Emerging Markets Small Cap Fund
|
Core Bond Fund
|
Long Duration Investment-Grade Bond Fund
|
Short Duration Bond Fund
|
Total Return Fixed Income Fund
|
|||||||||||||||||||
|
NET ASSETS
|
||||||||||||||||||||||||
|
Capital paid-in
|
$
|
550,729,357
|
$
|
1,800,430
|
$
|
59,674,032
|
$
|
100,142,972
|
$
|
16,351,745
|
$
|
45,584,387
|
||||||||||||
|
Total distributable earnings (loss)
|
404,602,478
|
411,397
|
2,753,300
|
18,403,626
|
50,112
|
(2,957,795
|
)
|
|||||||||||||||||
|
NET ASSETS
|
$
|
955,331,835
|
$
|
2,211,827
|
$
|
62,427,332
|
$
|
118,546,598
|
$
|
16,401,857
|
$
|
42,626,592
|
||||||||||||
|
Net Assets:
|
||||||||||||||||||||||||
|
R6
|
$
|
N/A
|
$
|
2,184,533
|
$
|
62,427,332
|
$
|
N/A
|
$
|
16,294,926
|
$
|
N/A
|
||||||||||||
|
Investor
|
955,331,835
|
27,294
|
N/A
|
118,546,598
|
106,931
|
42,626,592
|
||||||||||||||||||
|
Total shares outstanding end of period:
|
||||||||||||||||||||||||
|
R6
|
N/A
|
202,828
|
5,980,952
|
N/A
|
1,625,280
|
N/A
|
||||||||||||||||||
|
Investor
|
54,925,211
|
2,535
|
N/A
|
12,131,319
|
10,663
|
4,232,176
|
||||||||||||||||||
|
Net asset value, offering and redemption price per share (net assets ÷ shares outstanding)
|
||||||||||||||||||||||||
|
R6
|
$
|
N/A
|
$
|
10.77
|
$
|
10.44
|
$
|
N/A
|
$
|
10.03
|
$
|
N/A
|
||||||||||||
|
Investor
|
17.39
|
10.77
|
N/A
|
9.77
|
10.03
|
10.07
|
||||||||||||||||||
N/A — R6 or Investor Shares currently not offered.
|
Schroder Mutual Funds
|
Statements of Operations
For the Year Ended October 31, 2019
|
North American
Equity Fund |
Emerging Markets
Small Cap Fund |
|||||||
|
INVESTMENT INCOME
|
||||||||
|
Dividend income
|
$
|
22,345,957
|
$
|
64,705
|
||||
|
Interest income
|
7,847
|
—
|
||||||
|
Foreign taxes withheld
|
(65,088
|
)
|
(6,030
|
)
|
||||
|
TOTAL INCOME
|
22,288,716
|
58,675
|
||||||
|
EXPENSES
|
||||||||
|
Investment Advisory fees — Note 3
|
2,407,132
|
23,767
|
||||||
|
Sub-administration fees — Note 3
|
481,440
|
125,002
|
||||||
|
Trustees fees and expenses
|
26,403
|
4,623
|
||||||
|
Shareholder Service fees, Investor Shares — Note 3
|
—
|
—
|
||||||
|
Transfer agent fees
|
63,944
|
45,704
|
||||||
|
Legal fees
|
40,743
|
7,074
|
||||||
|
Custodian fees
|
35,909
|
7,827
|
||||||
|
Registration fees
|
29,768
|
21,202
|
||||||
|
Audit fees
|
26,209
|
23,701
|
||||||
|
Printing
|
17,519
|
4,513
|
||||||
|
Pricing fees
|
17,349
|
5,939
|
||||||
|
Other professional fees
|
7,385
|
11,427
|
||||||
|
Insurance
|
4,403
|
100
|
||||||
|
Offering costs
|
—
|
—
|
||||||
|
Other
|
33,726
|
11,579
|
||||||
|
TOTAL EXPENSES
|
3,191,930
|
292,458
|
||||||
|
Expenses waived by Investment Advisor — Note 3
|
—
|
(23,767
|
)
|
|||||
|
Reimbursement from Investment Advisor
|
—
|
(239,952
|
)
|
|||||
|
Custody Offset — Note 2
|
(23,348
|
)
|
(843
|
)
|
||||
|
NET EXPENSES
|
3,168,582
|
27,896
|
||||||
|
NET INVESTMENT INCOME
|
19,120,134
|
30,779
|
||||||
|
REALIZED AND UNREALIZED GAIN (LOSS) ON INVESTMENTS, FUTURES, SWAP CONTRACTS, FORWARD FOREIGN CURRENCY CONTRACTS, AND FOREIGN CURRENCY
TRANSACTIONS AND TRANSLATIONS
|
||||||||
|
Net realized gain on investments sold
|
43,948,761
|
40,402
|
||||||
|
Net realized gain on futures
|
901,045
|
—
|
||||||
|
Net realized loss on swap contracts
|
—
|
—
|
||||||
|
Net realized gain (loss) on forward foreign currency contract
|
421,238
|
—
|
||||||
|
Net realized gain (loss) on foreign currency transaction
|
15,146
|
(339
|
)
|
|||||
|
Net realized gain on investments, futures, swap contracts, forward foreign currency contracts and foreign currency
transactions
|
45,286,190
|
40,063
|
||||||
|
Change in unrealized appreciation on investments
|
45,368,746
|
298,308
|
||||||
|
Change in unrealized appreciation on futures
|
1,677,672
|
—
|
||||||
|
Change in unrealized appreciation (depreciation) on forward foreign currency contracts
|
(231,632
|
)
|
—
|
|||||
|
Change in accrued foreign capital gains tax on appreciated securities
|
—
|
(5,759
|
)
|
|||||
|
Change in unrealized appreciation (depreciation) on foreign currency translations
|
(33
|
)
|
106
|
|||||
|
Net change in unrealized appreciation on investments, futures, accrued foreign capital gains tax on appreciated securities, forward foreign currency
contracts and foreign currency translation
|
46,814,753
|
292,655
|
||||||
|
NET REALIZED AND UNREALIZED GAIN
|
92,100,943
|
332,718
|
||||||
|
NET INCREASE IN NET ASSETS RESULTING FROM OPERATIONS
|
$
|
111,221,077
|
$
|
363,497
|
||||
|
|
|
Core Bond Fund
|
Long Duration Investment-Grade
Bond Fund |
Short Duration
Bond Fund |
Total Return Fixed Income Fund
|
||||||||||||
|
$
|
—
|
$
|
—
|
$
|
—
|
$
|
—
|
||||||||
|
1,588,409
|
4,642,511
|
434,803
|
1,402,594
|
||||||||||||
|
—
|
—
|
—
|
—
|
||||||||||||
|
1,588,409
|
4,642,511
|
434,803
|
1,402,594
|
||||||||||||
|
122,988
|
330,073
|
39,788
|
101,606
|
||||||||||||
|
125,002
|
136,244
|
125,002
|
125,002
|
||||||||||||
|
5,700
|
7,729
|
4,942
|
5,502
|
||||||||||||
|
—
|
66,016
|
—
|
32,514
|
||||||||||||
|
26,558
|
32,320
|
46,263
|
28,643
|
||||||||||||
|
8,678
|
11,584
|
7,550
|
8,682
|
||||||||||||
|
5,499
|
9,278
|
4,447
|
5,854
|
||||||||||||
|
21,649
|
24,838
|
21,825
|
22,318
|
||||||||||||
|
22,285
|
26,296
|
26,694
|
26,296
|
||||||||||||
|
4,446
|
8,420
|
4,892
|
4,268
|
||||||||||||
|
14,869
|
15,488
|
17,619
|
24,874
|
||||||||||||
|
3,581
|
4,226
|
6,900
|
4,227
|
||||||||||||
|
1,173
|
3,949
|
631
|
1,693
|
||||||||||||
|
7,105
|
—
|
—
|
—
|
||||||||||||
|
12,315
|
12,831
|
12,223
|
12,218
|
||||||||||||
|
381,848
|
689,292
|
318,776
|
403,697
|
||||||||||||
|
(122,988
|
)
|
(263,441
|
)
|
(39,788
|
)
|
(101,606
|
)
|
||||||||
|
(99,403
|
)
|
—
|
(227,519
|
)
|
(138,498
|
)
|
|||||||||
|
(2,027
|
)
|
(3,340
|
)
|
(537
|
)
|
(1,022
|
)
|
||||||||
|
157,430
|
422,511
|
50,932
|
162,571
|
||||||||||||
|
1,430,979
|
4,220,000
|
383,871
|
1,240,023
|
||||||||||||
|
771,797
|
5,054,115
|
78,040
|
277,237
|
||||||||||||
|
—
|
—
|
4,400
|
525,982
|
||||||||||||
|
—
|
—
|
—
|
(23,161
|
)
|
|||||||||||
|
—
|
—
|
—
|
(66,075
|
)
|
|||||||||||
|
—
|
—
|
(1,500
|
)
|
(40,580
|
)
|
||||||||||
|
771,797
|
5,054,115
|
80,940
|
673,403
|
||||||||||||
|
3,059,838
|
21,426,239
|
291,198
|
2,240,002
|
||||||||||||
|
—
|
—
|
5,379
|
13,266
|
||||||||||||
|
—
|
—
|
—
|
57,333
|
||||||||||||
|
—
|
—
|
—
|
—
|
||||||||||||
|
—
|
—
|
487
|
930
|
||||||||||||
|
3,059,838
|
21,426,239
|
297,064
|
2,311,531
|
||||||||||||
|
3,831,635
|
26,480,354
|
378,004
|
2,984,934
|
||||||||||||
|
$
|
5,262,614
|
$
|
30,700,354
|
$
|
761,875
|
$
|
4,224,957
|
||||||||
|
Schroder Mutual Funds
|
Statements of Changes in Net Assets
For the Year or Period Ended October 31
|
North American Equity Fund
|
||||||||
|
2019
|
2018
|
|||||||
|
INCREASE (DECREASE) IN NET ASSETS
|
||||||||
|
From Operations:
|
||||||||
|
Net investment income
|
$
|
19,120,134
|
$
|
17,912,969
|
||||
|
Net realized gain (loss) on investments sold, futures, forward foreign currency contracts and foreign currency
transactions
|
45,286,190
|
78,571,516
|
||||||
|
Net change in unrealized appreciation (depreciation) on investments, futures, accrued foreign capital gains tax on appreciated securities, forward
foreign currency contracts and foreign currency translations
|
46,814,753
|
(16,296,035
|
)
|
|||||
|
Net increase (decrease) in net assets resulting from operations
|
111,221,077
|
80,188,450
|
||||||
|
Distribution of Income:
|
||||||||
|
R6 Shares
|
N/A
|
N/A
|
||||||
|
Investor Shares
|
(96,458,052
|
)
|
(57,564,390
|
)
|
||||
|
Total distributions
|
(96,458,052
|
)
|
(57,564,390
|
)
|
||||
|
Share Transactions (1):
|
||||||||
|
R6 Shares:
|
||||||||
|
Sales of shares
|
N/A
|
N/A
|
||||||
|
Reinvestment of distributions
|
N/A
|
N/A
|
||||||
|
Issued in connection with in-kind transfer – Note 8
|
N/A
|
N/A
|
||||||
|
Redemption of shares
|
N/A
|
N/A
|
||||||
|
Total increase from R6 Share transactions
|
N/A
|
N/A
|
||||||
|
Investor Shares:
|
||||||||
|
Sales of shares
|
4,461,454
|
10,319,755
|
||||||
|
Reinvestment of distributions
|
90,266,033
|
57,353,134
|
||||||
|
Redemption of shares
|
(115,736,328
|
)
|
(150,187,356
|
)
|
||||
|
Total increase (decrease) from Investor Share transactions
|
(21,008,841
|
)
|
(82,514,467
|
)
|
||||
|
Net increase (decrease) in net assets from share transactions
|
(21,008,841
|
)
|
(82,514,467
|
)
|
||||
|
Total increase (decrease) in net assets
|
(6,245,816
|
)
|
(59,890,407
|
)
|
||||
|
Net Assets
|
||||||||
|
Beginning of year/period
|
961,577,651
|
1,021,468,058
|
||||||
|
End of year/period
|
$
|
955,331,835
|
$
|
961,577,651
|
||||
|
N/A — Investor Shares or R6 Shares currently not offered.
|
|
(1) For share transactions, see Note 12 in the Notes to Financial
Statements.
|
|
|
|
Emerging Markets Small Cap Fund
|
Core Bond Fund
|
|||||||||||||
|
2019
|
2018
|
2019
|
2018(a)
|
|||||||||||
|
$
|
30,779
|
$
|
20,999
|
$
|
1,430,979
|
$
|
578,023
|
|||||||
|
40,063
|
92,715
|
771,797
|
(79,375
|
)
|
||||||||||
|
292,655
|
(478,124
|
)
|
3,059,838
|
(924,957
|
)
|
|||||||||
|
363,497
|
(364,410
|
)
|
5,262,614
|
(426,309
|
)
|
|||||||||
|
(110,099
|
)
|
(355,583
|
)
|
(1,509,949
|
)
|
(573,056
|
)
|
|||||||
|
(1,376
|
)
|
(4,444
|
)
|
N/A
|
N/A
|
|||||||||
|
(111,475
|
)
|
(360,027
|
)
|
(1,509,949
|
)
|
(573,056
|
)
|
|||||||
|
—
|
—
|
37,064,419
|
10,200,100
|
|||||||||||
|
110,098
|
355,583
|
1,328,183
|
441,432
|
|||||||||||
|
—
|
—
|
—
|
29,918,724
|
|||||||||||
|
—
|
—
|
(17,778,826
|
)
|
(1,500,000
|
)
|
|||||||||
|
110,098
|
355,583
|
20,613,776
|
39,060,256
|
|||||||||||
|
—
|
—
|
N/A
|
N/A
|
|||||||||||
|
1,376
|
4,444
|
N/A
|
N/A
|
|||||||||||
|
—
|
—
|
N/A
|
N/A
|
|||||||||||
|
1,376
|
4,444
|
N/A
|
N/A
|
|||||||||||
|
111,474
|
360,027
|
20,613,776
|
39,060,256
|
|||||||||||
|
363,496
|
(364,410
|
)
|
24,366,441
|
38,060,891
|
||||||||||
|
1,848,331
|
2,212,741
|
38,060,891
|
—
|
|||||||||||
|
$
|
2,211,827
|
$
|
1,848,331
|
$
|
62,427,332
|
$
|
38,060,891
|
|||||||
|
(a) Fund commenced operations on January 31, 2018.
|
|
Schroder Mutual Funds
|
Statements of Changes in Net Assets
For the Year Ended October 31
|
Long Duration Investment-Grade Bond Fund
|
||||||||
|
2019
|
2018
|
|||||||
|
INCREASE (DECREASE) IN NET ASSETS
|
||||||||
|
From Operations:
|
||||||||
|
Net investment income
|
$
|
4,220,000
|
$
|
2,896,792
|
||||
|
Net realized gain (loss) on investments, futures, swap contracts, forward foreign
currency contracts and foreign currency transactions |
5,054,115
|
(616,762
|
)
|
|||||
|
Net change in unrealized appreciation (depreciation) on investments, futures, swap contracts,
forward foreign currency contracts and foreign currency translations |
21,426,239
|
(8,673,405
|
)
|
|||||
|
Net increase (decrease) in net assets resulting from operations
|
30,700,354
|
(6,393,375
|
)
|
|||||
|
Distributions:
|
||||||||
|
R6 Shares
|
N/A
|
N/A
|
||||||
|
Investor Shares
|
(4,218,313
|
)
|
(2,902,410
|
)
|
||||
|
Return of Capital:
|
||||||||
|
Investor Shares
|
—
|
—
|
||||||
|
Total distributions
|
(4,218,313
|
)
|
(2,902,410
|
)
|
||||
|
Share Transactions (1):
|
||||||||
|
R6 Shares:
|
||||||||
|
Sales of shares
|
N/A
|
N/A
|
||||||
|
Reinvestment of distributions
|
N/A
|
N/A
|
||||||
|
Redemption of shares
|
N/A
|
N/A
|
||||||
|
Total increase (decrease) from R6 Share transactions
|
N/A
|
N/A
|
||||||
|
Investor Shares:
|
||||||||
|
Sales of shares
|
53,325,944
|
9,491,846
|
||||||
|
Reinvestment of distributions
|
4,198,986
|
2,860,558
|
||||||
|
Issued in connection with in-kind transfer — Note 8
|
—
|
28,072,294
|
||||||
|
Redemption of shares
|
(33,861,424
|
)
|
(8,630,569
|
)
|
||||
|
Redeemed in connection with in-kind transfer — Note 8
|
(30,823,454
|
)
|
—
|
|||||
|
Total increase (decrease) from Investor Share transactions
|
(7,159,948
|
)
|
31,794,129
|
|||||
|
Net increase (decrease) in net assets from share transactions
|
(7,159,948
|
)
|
31,794,129
|
|||||
|
Total increase (decrease) in net assets
|
19,322,093
|
22,498,344
|
||||||
|
Net Assets
|
||||||||
|
Beginning of year
|
99,224,505
|
76,726,161
|
||||||
|
End of year
|
$
|
118,546,598
|
$
|
99,224,505
|
||||
N/A — R6 Shares currently not offered.
(1) For share transactions, see Note 12 in the Notes to Financial Statements.
|
|
|
Short Duration Bond Fund
|
Total Return Fixed Income Fund
|
|||||||||||||
|
2019
|
2018
|
2019
|
2018
|
|||||||||||
|
$
|
383,871
|
$
|
338,373
|
$
|
1,240,023
|
$
|
1,816,857
|
|||||||
|
80,940
|
(94,709
|
)
|
673,403
|
(2,039,674
|
)
|
|||||||||
|
297,064
|
(224,767
|
)
|
2,311,531
|
(1,384,012
|
)
|
|||||||||
|
761,875
|
18,897
|
4,224,957
|
(1,606,829
|
)
|
||||||||||
|
(386,979
|
)
|
(340,977
|
)
|
N/A
|
N/A
|
|||||||||
|
(2,561
|
)
|
(2,208
|
)
|
(1,244,592
|
)
|
(1,417,244
|
)
|
|||||||
|
—
|
—
|
(49,764
|
)
|
(379,779
|
)
|
|||||||||
|
(389,540
|
)
|
(343,185
|
)
|
(1,294,356
|
)
|
(1,797,023
|
)
|
|||||||
|
690,419
|
608,395
|
N/A
|
N/A
|
|||||||||||
|
386,979
|
340,977
|
N/A
|
N/A
|
|||||||||||
|
(432,027
|
)
|
(1,537,282
|
)
|
N/A
|
N/A
|
|||||||||
|
645,371
|
(587,910
|
)
|
N/A
|
N/A
|
||||||||||
|
—
|
—
|
4,247,029
|
7,131,963
|
|||||||||||
|
2,561
|
2,556
|
1,045,053
|
1,537,205
|
|||||||||||
|
—
|
—
|
—
|
—
|
|||||||||||
|
—
|
—
|
(6,567,630
|
)
|
(31,492,963
|
)
|
|||||||||
|
—
|
—
|
—
|
—
|
|||||||||||
|
2,561
|
2,556
|
(1,275,548
|
)
|
(22,823,795
|
)
|
|||||||||
|
647,932
|
(585,354
|
)
|
(1,275,548
|
)
|
(22,823,795
|
)
|
||||||||
|
1,020,267
|
(909,642
|
)
|
1,655,053
|
(26,227,647
|
)
|
|||||||||
|
15,381,590
|
16,291,232
|
40,971,539
|
67,199,186
|
|||||||||||
|
$
|
16,401,857
|
$
|
15,381,590
|
$
|
42,626,592
|
$
|
40,971,539
|
|||||||
|
Schroder Mutual Funds
|
Financial Highlights
For the Years or Period Ended October 31,
Selected Per Share Data and Ratios for a Share Outstanding Throughout each Year or Period
|
Net Asset Value, Beginning of Period
|
Net
Investment Income (Loss) |
Net Realized and
Unrealized Gains (Losses) |
Total from Investment Operations
|
Dividends
from Net Investment Income |
Distributions from Net Realized
Gain |
Total Distributions
|
||||||||||||||||||||||
|
North American Equity Fund
|
||||||||||||||||||||||||||||
|
Investor Shares
|
||||||||||||||||||||||||||||
|
2019
|
$
|
17.31
|
$
|
0.31
|
$
|
1.47
|
$
|
1.78
|
$
|
(0.33
|
)
|
$
|
(1.37
|
)
|
$
|
(1.70
|
)
|
|||||||||||
|
2018
|
17.02
|
0.32
|
0.93
|
1.25
|
(0.28
|
)
|
(0.68
|
)
|
(0.96
|
)
|
||||||||||||||||||
|
2017
|
14.79
|
0.30
|
2.83
|
3.13
|
(0.30
|
)
|
(0.60
|
)
|
(0.90
|
)
|
||||||||||||||||||
|
2016
|
15.14
|
0.27
|
0.31
|
0.58
|
(0.33
|
)
|
(0.60
|
)
|
(0.93
|
)
|
||||||||||||||||||
|
2015
|
15.42
|
0.34
|
0.21
|
0.55
|
(0.29
|
)
|
(0.54
|
)
|
(0.83
|
)
|
||||||||||||||||||
|
Emerging Markets Small Cap Fund
|
||||||||||||||||||||||||||||
|
R6 Shares
|
||||||||||||||||||||||||||||
|
2019
|
$
|
9.56
|
$
|
0.15
|
(1)
|
$
|
1.63
|
$
|
1.78
|
$
|
(0.22
|
)
|
$
|
(0.35
|
)
|
$
|
(0.57
|
)
|
||||||||||
|
2018
|
13.65
|
0.11
|
(1)
|
(1.98
|
)
|
(1.87
|
)
|
—
|
(2.22
|
)
|
(2.22
|
)
|
||||||||||||||||
|
2017
|
12.07
|
—
|
(1)(2)
|
2.07
|
2.07
|
(0.09
|
)
|
(0.40
|
)
|
(0.49
|
)
|
|||||||||||||||||
|
2016
|
10.52
|
0.11
|
(1)
|
1.44
|
1.55
|
—
|
—
|
—
|
||||||||||||||||||||
|
2015(b)
|
10.00
|
(0.01
|
)(1)
|
0.53
|
0.52
|
—
|
—
|
—
|
||||||||||||||||||||
|
Investor Shares
|
||||||||||||||||||||||||||||
|
2019
|
$
|
9.55
|
$
|
0.15
|
(1)
|
$
|
1.64
|
$
|
1.79
|
$
|
(0.22
|
)
|
$
|
(0.35
|
)
|
$
|
(0.57
|
)
|
||||||||||
|
2018
|
13.65
|
0.11
|
(1)
|
(1.99
|
)
|
(1.88
|
)
|
—
|
(2.22
|
)
|
(2.22
|
)
|
||||||||||||||||
|
2017
|
12.06
|
0.10
|
(1)
|
1.98
|
2.08
|
(0.09
|
)
|
(0.40
|
)
|
(0.49
|
)
|
|||||||||||||||||
|
2016
|
10.52
|
0.10
|
(1)
|
1.44
|
1.54
|
—
|
—
|
—
|
||||||||||||||||||||
|
2015(b)
|
10.00
|
(0.01
|
)(1)
|
0.53
|
0.52
|
—
|
—
|
—
|
||||||||||||||||||||
|
Core Bond Fund
|
||||||||||||||||||||||||||||
|
R6 Shares
|
||||||||||||||||||||||||||||
|
2019
|
$
|
9.67
|
$
|
0.29
|
(1)
|
$
|
0.79
|
$
|
1.08
|
$
|
(0.31
|
)
|
$
|
—
|
$
|
(0.31
|
)
|
|||||||||||
|
2018(c)
|
10.00
|
0.20
|
(1)
|
(0.34
|
)
|
(0.14
|
)
|
(0.19
|
)
|
—
|
(0.19
|
)
|
||||||||||||||||
| (1) |
Per share net investment income (loss) calculated using average shares.
|
| (2) |
Amount was less than $0.01 per share.
|
| (3) |
Ratios reflect the impact of low level of average net assets. Under normal asset levels, ratios would have been 1.45% and 1.60%.
|
| (a) |
Total returns would have been lower had certain Fund expenses not been waived or reimbursed, as applicable, during the periods shown (See Note 3).
Total return calculations for a period of less than one year are not annualized. |
| (b) |
Commenced operations on August 26, 2015. All ratios for the period have been annualized, except for the Total Return and Portfolio Turnover Rate.
|
| (c) |
Commenced operations on January 31, 2018. All ratios for the period have been annualized, except for the Total Return and Portfolio Turnover Rate.
|
|
|
|
Net Asset Value, End of Period
|
Total
Return(a) |
Net Assets, End
of Period (000) |
Ratio of Expenses
to Average Net Assets (Including Waivers and Reimbursements, Excluding Offsets) |
Ratio of Expenses to Average Net Assets (Excluding Waivers, Reimbursements
and Offsets) |
Ratio of
Net Investment Income (Loss) to Average Net Assets (Including Waivers, Reimbursements and Offsets) |
Portfolio Turnover Rate
|
||||||||||||||||||||
|
$
|
17.39
|
11.88
|
%
|
$
|
955,332
|
0.33
|
%
|
0.33
|
%
|
1.99
|
%
|
50
|
%
|
|||||||||||||
|
17.31
|
7.50
|
961,578
|
0.33
|
0.33
|
1.69
|
46
|
||||||||||||||||||||
|
17.02
|
21.96
|
1,021,468
|
0.33
|
0.33
|
1.83
|
46
|
||||||||||||||||||||
|
14.79
|
4.20
|
889,400
|
0.32
|
0.32
|
2.03
|
70
|
||||||||||||||||||||
|
15.14
|
3.77
|
759,878
|
0.32
|
0.32
|
1.91
|
57
|
||||||||||||||||||||
|
$
|
10.77
|
19.60
|
%
|
$
|
2,185
|
1.35
|
%
|
14.15
|
%
|
1.49
|
%
|
25
|
%
|
|||||||||||||
|
9.56
|
(16.44
|
)
|
1,826
|
1.35
|
14.21
|
0.95
|
38
|
|||||||||||||||||||
|
13.65
|
18.09
|
2,185
|
1.48
|
(3)
|
4.80
|
0.04
|
42
|
|||||||||||||||||||
|
12.07
|
14.73
|
15,761
|
1.50
|
3.01
|
0.98
|
41
|
||||||||||||||||||||
|
10.52
|
5.20
|
12,103
|
1.50
|
6.52
|
(0.57
|
)
|
5
|
|||||||||||||||||||
|
$
|
10.77
|
19.73
|
%
|
$
|
27
|
1.35
|
%
|
14.15
|
%
|
1.49
|
%
|
25
|
%
|
|||||||||||||
|
9.55
|
(16.53
|
)
|
23
|
1.35
|
14.21
|
0.95
|
38
|
|||||||||||||||||||
|
13.65
|
18.12
|
27
|
1.46
|
(3)
|
10.31
|
0.82
|
42
|
|||||||||||||||||||
|
12.06
|
14.64
|
24
|
1.60
|
3.10
|
0.91
|
41
|
||||||||||||||||||||
|
10.52
|
5.20
|
21
|
1.65
|
6.67
|
(0.72
|
)
|
5
|
|||||||||||||||||||
|
$
|
10.44
|
11.27
|
%
|
$
|
62,427
|
0.32
|
%
|
0.78
|
%
|
2.91
|
%
|
134
|
%
|
|||||||||||||
|
9.67
|
(1.38
|
)
|
38,061
|
0.32
|
1.48
|
2.74
|
48
|
|||||||||||||||||||
|
Schroder Mutual Funds
|
Financial Highlights
For the Years or Period Ended October 31,
Selected Per Share Data and Ratios for a Share Outstanding Throughout each Year or Period
|
Net Asset Value, Beginning of Period
|
Net
Investment Income |
Net Realized and
Unrealized Gains (Losses) |
Total from Investment Operations
|
Dividends
from Net Investment Income |
Distributions from Net Realized
Gain |
Return of Capital
|
||||||||||||||||||||||
|
Long Duration Investment-Grade Bond Fund
|
||||||||||||||||||||||||||||
|
Investor Shares
|
||||||||||||||||||||||||||||
|
2019
|
$
|
8.02
|
$
|
0.28
|
(1)
|
$
|
1.75
|
$
|
2.03
|
$
|
(0.28
|
)
|
$
|
—
|
$
|
—
|
||||||||||||
|
2018
|
8.88
|
0.28
|
(1)
|
(0.86
|
)
|
(0.58
|
)
|
(0.28
|
)
|
—
|
—
|
|||||||||||||||||
|
2017
|
9.31
|
0.28
|
(1)
|
(0.14
|
)
|
0.14
|
(0.28
|
)
|
(0.29
|
)
|
—
|
|||||||||||||||||
|
2016
|
8.99
|
0.32
|
(1)
|
0.53
|
0.85
|
(0.34
|
)
|
(0.19
|
)
|
—
|
||||||||||||||||||
|
2015
|
10.53
|
0.36
|
(1)
|
(0.24
|
)
|
0.12
|
(0.36
|
)
|
(1.30
|
)
|
—
|
|||||||||||||||||
|
Short Duration Bond Fund
|
||||||||||||||||||||||||||||
|
R6 Shares
|
||||||||||||||||||||||||||||
|
2019
|
$
|
9.79
|
$
|
0.24
|
(1)
|
$
|
0.24
|
$
|
0.48
|
$
|
(0.24
|
)
|
$
|
—
|
$
|
—
|
||||||||||||
|
2018
|
9.99
|
0.21
|
(1)
|
(0.20
|
)
|
0.01
|
(0.21
|
)
|
—
|
—
|
||||||||||||||||||
|
2017
|
10.07
|
0.15
|
(1)
|
(0.08
|
)
|
0.07
|
(0.15
|
)
|
—
|
(2)
|
—
|
|||||||||||||||||
|
2016
|
10.01
|
0.13
|
(1)
|
0.06
|
0.19
|
(0.13
|
)
|
—
|
(2)
|
—
|
||||||||||||||||||
|
2015 (b)
|
10.00
|
0.02
|
(1)
|
—
|
0.02
|
(0.01
|
)
|
—
|
—
|
|||||||||||||||||||
|
Investor Shares
|
||||||||||||||||||||||||||||
|
2019
|
$
|
9.80
|
$
|
0.24
|
(1)
|
$
|
0.23
|
$
|
0.47
|
$
|
(0.24
|
)
|
$
|
—
|
$
|
—
|
||||||||||||
|
2018
|
9.99
|
0.21
|
(1)
|
(0.19
|
)
|
0.02
|
(0.21
|
)
|
—
|
—
|
||||||||||||||||||
|
2017
|
10.07
|
0.14
|
(1)
|
(0.07
|
)
|
0.07
|
(0.15
|
)
|
—
|
(2)
|
—
|
|||||||||||||||||
|
2016
|
10.01
|
0.12
|
(1)
|
0.06
|
0.18
|
(0.12
|
)
|
—
|
(2)
|
—
|
||||||||||||||||||
|
2015 (b)
|
10.00
|
0.01
|
(1)
|
0.01
|
0.02
|
(0.01
|
)
|
—
|
—
|
|||||||||||||||||||
|
Total Return Fixed Income Fund
|
||||||||||||||||||||||||||||
|
Investor Shares
|
||||||||||||||||||||||||||||
|
2019
|
$
|
9.37
|
$
|
0.30
|
$
|
0.71
|
$
|
1.01
|
$
|
(0.30
|
)
|
$
|
—
|
$
|
(0.01
|
)
|
||||||||||||
|
2018
|
9.91
|
0.33
|
(0.56
|
)
|
(0.23
|
)
|
(0.24
|
)
|
—
|
(0.07
|
)
|
|||||||||||||||||
|
2017
|
10.03
|
0.27
|
(0.11
|
)
|
0.16
|
(0.22
|
)
|
—
|
(0.06
|
)
|
||||||||||||||||||
|
2016
|
9.97
|
0.25
|
0.12
|
0.37
|
(0.26
|
)
|
(0.04
|
)
|
(0.01
|
)
|
||||||||||||||||||
|
2015
|
10.20
|
0.26
|
(0.23
|
)
|
0.03
|
(0.26
|
)
|
—
|
—
|
|||||||||||||||||||
| (1) |
Per share net investment income calculated using average shares.
|
| (2) |
Amount was less than $0.01 per share.
|
| (a) |
Total returns would have been lower had certain Fund expenses not been waived or reimbursed, as applicable, during the periods shown (See Note 3).
Total return calculations for a period of less than one year are not annualized. |
| (b) |
Commenced operations on August 26, 2015. All ratios for the period have been annualized, except for the Total Return and Portfolio Turnover Rate.
|
|
|
|
Total Distributions
|
Net Asset
Value, End of Period |
Total
Return (a) |
Net Assets,
End of Period (000) |
Ratio of
Expenses to Average Net Assets (Including Waivers and Reimbursements, Excluding Offsets) |
Ratio of
Expenses to Average Net Assets (Excluding Waivers, Reimbursements and Offsets) |
Ratio of Net Investment
Income to Average Net Assets (Including Waivers, Reimbursements and Offsets) |
Portfolio Turnover Rate
|
|||||||||||||||||||||||
|
$
|
(0.28
|
)
|
$
|
9.77
|
25.74
|
%
|
$
|
118,547
|
0.32
|
%
|
0.52
|
%
|
3.20
|
%
|
73
|
%
|
||||||||||||||
|
(0.28
|
)
|
8.02
|
(6.69
|
)
|
99,225
|
0.34
|
0.64
|
3.27
|
50
|
|||||||||||||||||||||
|
(0.57
|
)
|
8.88
|
1.79
|
76,726
|
0.39
|
0.77
|
3.17
|
62
|
||||||||||||||||||||||
|
(0.53
|
)
|
9.31
|
9.80
|
74,232
|
0.39
|
0.75
|
3.48
|
160
|
||||||||||||||||||||||
|
(1.66
|
)
|
8.99
|
0.94
|
21,082
|
0.40
|
1.05
|
3.80
|
126
|
||||||||||||||||||||||
|
$
|
(0.24
|
)
|
$
|
10.03
|
4.99
|
%
|
$
|
16,295
|
0.32
|
%
|
2.00
|
%
|
2.41
|
%
|
117
|
%
|
||||||||||||||
|
(0.21
|
)
|
9.79
|
0.16
|
15,280
|
0.34
|
2.02
|
2.13
|
100
|
||||||||||||||||||||||
|
(0.15
|
)
|
9.99
|
0.77
|
16,189
|
0.39
|
1.88
|
1.49
|
81
|
||||||||||||||||||||||
|
(0.13
|
)
|
10.07
|
1.97
|
24,417
|
0.39
|
1.10
|
1.32
|
59
|
||||||||||||||||||||||
|
(0.01
|
)
|
10.01
|
0.25
|
24,023
|
0.39
|
2.51
|
0.88
|
22
|
||||||||||||||||||||||
|
$
|
(0.24
|
)
|
$
|
10.03
|
4.88
|
%
|
$
|
107
|
0.32
|
%
|
2.00
|
%
|
2.41
|
%
|
117
|
%
|
||||||||||||||
|
(0.21
|
)
|
9.80
|
0.26
|
102
|
0.34
|
2.02
|
2.14
|
100
|
||||||||||||||||||||||
|
(0.15
|
)
|
9.99
|
0.77
|
102
|
0.39
|
1.40
|
1.39
|
81
|
||||||||||||||||||||||
|
(0.12
|
)
|
10.07
|
1.87
|
1,007
|
0.49
|
1.20
|
1.22
|
59
|
||||||||||||||||||||||
|
(0.01
|
)
|
10.01
|
0.22
|
1,001
|
0.54
|
2.66
|
0.73
|
22
|
||||||||||||||||||||||
|
$
|
(0.31
|
)
|
$
|
10.07
|
10.93
|
%
|
$
|
42,627
|
0.40
|
%
|
0.99
|
%
|
3.05
|
%
|
92
|
%
|
||||||||||||||
|
(0.31
|
)
|
9.37
|
(2.33
|
)
|
40,972
|
0.40
|
0.85
|
3.27
|
79
|
|||||||||||||||||||||
|
(0.28
|
)
|
9.91
|
1.65
|
67,199
|
0.40
|
0.85
|
2.95
|
93
|
||||||||||||||||||||||
|
(0.31
|
)
|
10.03
|
3.77
|
97,695
|
0.40
|
0.61
|
2.80
|
72
|
||||||||||||||||||||||
|
(0.26
|
)
|
9.97
|
0.30
|
183,138
|
0.40
|
0.56
|
2.58
|
93
|
||||||||||||||||||||||
|
Schroder Mutual Funds
|
Notes to Financial Statements
October 31, 2019
NOTE 1 — ORGANIZATION
Schroder Global Series Trust (“SGST”) is an open-end series management investment company registered under the Investment Company Act of 1940, as amended (the “Investment
Company Act”). SGST was organized as a business trust under the laws of The Commonwealth of Massachusetts on May 27, 2003. SGST has an unlimited number of authorized shares, which consists of one diversified series: Schroder North American Equity
Fund (the “SGST Fund” or a “Fund”). The Schroder North American Equity Fund seeks long-term capital growth.
Schroder Series Trust (“SST”) is an open-end series management investment company registered under the Investment Company Act. SST was organized as a business trust under the
laws of The Commonwealth of Massachusetts on May 6, 1993. SST has an unlimited number of authorized shares, which are divided into five separate series. Included in this report are Schroder Emerging Markets Small Cap Fund, Schroder Core Bond Fund,
Schroder Long Duration Investment-Grade Bond Fund, Schroder Short Duration Bond Fund and Schroder Total Return Fixed Income Fund (each a “Fund,” collectively, the “SST Funds,” and together with the SGST Fund, the “Funds” or “Trusts”), all of which
are diversified funds. The Schroder Emerging Markets Small Cap Fund seeks long-term capital appreciation. The Schroder Core Bond Fund and Schroder Short Duration Bond Fund seek long-term total return consistent with the preservation of capital. The
Schroder Total Return Fixed Income Fund seeks a high level of total return. The Schroder Long Duration Investment-Grade Bond Fund seeks to achieve a total return that exceeds that of the Fund’s benchmark, the Bloomberg Barclays U.S. Long
Government/Credit Bond Index.
Schroder Core Bond Fund commenced operations January 31, 2018.
NOTE 2 — SIGNIFICANT ACCOUNTING POLICIES
The Funds are investment companies that apply the accounting and reporting guidance issued in Topic 946 by the U.S. Financial Accounting Standards Board. The preparation of
financial statements in conformity with U.S. generally accepted accounting principles (“U.S. GAAP”) requires management to make estimates and assumptions that affect the reported amounts of assets and liabilities and disclosures of contingent assets
and liabilities at the date of the financial statements and the reported amounts of increases and decreases in net assets from operations during the reporting period. Actual results could differ from those estimates, and those differences could be
material.
The following is a summary of significant accounting policies followed by the Funds, which are in conformity with U.S. GAAP:
SECURITY VALUATION: Securities listed on a securities exchange, market or automated quotation system for which quotations are readily available (except for securities traded on
NASDAQ), including securities traded over the counter, are valued at the last quoted sale price on an exchange or market (foreign or domestic) on which they are traded on valuation date (or at approximately 4:00 pm ET if a security’s primary exchange
is normally open at that time), or, if there is no such reported sale on the valuation date, at the most recent quoted bid price. For securities traded on NASDAQ, the NASDAQ Official Closing Price will be used. If available, debt securities are
priced based upon valuations provided by independent, third-party pricing agents. Such values generally reflect the last reported sales price if the security is actively traded. The third-party pricing agents may also value debt securities at an
evaluated bid price by employing methodologies that utilize actual market transactions, broker-supplied valuations, or other methodologies designed to identify the market value for such securities. Such methodologies generally consider such factors
as security prices, yields, maturities, call features, ratings and developments relating to specific securities in arriving at valuations. On the first day a new debt security purchase is recorded, if a price is not available on the automated pricing
feeds from our primary and secondary pricing vendors nor is it available from an independent broker, the security may be valued at its purchase price. Each day thereafter, the debt security will be valued according to the Trusts’ fair value
procedures until an independent source can be
|
Schroder Mutual Funds
|
Notes to Financial Statements (continued)
October 31, 2019
secured. Debt obligations with remaining maturities of sixty days or less may be valued at their amortized cost, provided that it is determined the amortized cost continues to
approximate fair value. Should existing credit, liquidity or interest rate conditions in the relevant markets and issuer specific circumstances suggest that amortized cost does not approximate fair value, then the amortized cost method may not be
used. The prices for foreign securities are reported in local currency and converted to U.S. dollars using currency exchange rates.
Securities for which market prices are not “readily available” are valued in accordance with fair value procedures established by the Funds’ Board of Trustees (the “Board”). The
Funds’ fair value procedures are implemented through a fair value committee (the “Committee”) designated by the Board. Some of the more common reasons that may necessitate that a security be valued using fair value procedures include: the security’s
trading has been halted or suspended; the security has been de-listed from a national exchange; the security’s primary trading market is temporarily closed at a time when under normal conditions it would be open; the security has not been traded for
an extended period of time; the security’s primary pricing source is not able or willing to provide a price; or trading of the security is subject to local government-imposed restrictions. When a security is valued in accordance with the fair value
procedures, the Committee will determine the value after taking into consideration relevant information reasonably available to the Committee.
Swaps are marked-to-market daily based upon quotations from market makers and the resulting changes in market values, if any, are recorded as an unrealized gain or loss in the
Statements of Operations.
Futures contracts that are traded on an exchange are valued at their last reported sales price as of the valuation date.
Options for which the primary market is a national securities exchange are valued at the last sale price on the exchange on which they are traded, or, in the absence of any
sale, at the closing bid price for long positions and at the closing ask price for written options. Options not traded on a national securities exchange are valued at the last quoted bid price.
For securities that principally trade on a foreign market or exchange, a significant gap in time can exist between the time of a particular security’s last trade and the time at
which the Fund calculates its net asset value. The closing prices of such securities may no longer reflect their market value at the time the Fund calculates net asset value if an event that could materially affect the value of those securities (a
“Significant Event”) has occurred between the time of the security’s last close and the time that the Fund calculates net asset value. A Significant Event may relate to a single issuer or to an entire market sector. If SIMNA (the “Adviser”) of the
Funds becomes aware of a Significant Event that has occurred with respect to a security or group of securities after the closing of the exchange or market on which the security or securities principally trade, but before the time at which the Fund
calculates net asset value, it may request that a Committee meeting be called. In addition, SEI Investments Global Funds Services (the “Administrator”), a wholly owned subsidiary of SEI Investments Company, monitors price movements among certain
selected indices, securities and/or baskets of securities that may be an indicator that the closing prices received earlier from foreign exchanges or markets may not reflect market value at the time a Fund calculates net asset value. If price
movements in a monitored index or security exceed levels established by the Administrator, the Administrator notifies the Adviser if a Fund is holding a relevant security that such limits have been exceeded. In such event, the Adviser makes the
determination whether a Committee meeting should be called based on the information provided.
Schroder Emerging Markets Small Cap Fund uses MarkIt Fair Value (“MarkIt”) as a third party fair valuation vendor. MarkIt provides a fair value for foreign securities in the
Fund based on certain factors and methodologies (involving, generally, tracking valuation correlations between the U.S. market and each non-U.S. security) applied by MarkIt in the event that there is a movement in the U.S. markets that exceeds
|
Schroder Mutual Funds
|
Notes to Financial Statements (continued)
October 31, 2019
a specific threshold established by the Committee. The Committee establishes a “confidence interval” which is used to determine the level of correlation between the value of a
foreign security and movements in the U.S. market before a particular security is fair valued when the threshold is exceeded. In the event that the threshold established by the Committee is exceeded on a specific day, the Fund values its non-U.S.
securities that exceed the applicable “confidence interval” based upon the fair values provided by MarkIt. In such event, it is not necessary to hold a Committee meeting. In the event that the Adviser believes that the fair values provided by MarkIt
are not reliable, the Adviser contacts the Administrator and can request that a meeting of the Committee be held.
If a local market in which the Fund owns securities is closed for one or more days, the Fund shall value all securities held in that corresponding currency based on the fair
value prices provided by MarkIt using the predetermined confidence interval discussed above.
In accordance with the authoritative guidance on fair value measurements and disclosure under U.S. GAAP, the Funds disclose the fair value of their investments in a hierarchy
that prioritizes the inputs to valuation techniques used to measure the fair value. The objective of a fair value measurement is to determine the price that would be received to sell an asset or paid to transfer a liability in an orderly transaction
between market participants at the measurement date (an exit price). Accordingly, the fair value hierarchy gives the highest priority to quoted prices (unadjusted) in active markets for identical assets or liabilities (Level 1) and the lowest
priority to unobservable inputs (Level 3). The three levels of the fair value hierarchy are described below:
|
●
|
Level 1 — Unadjusted quoted prices in active markets for identical, unrestricted assets or liabilities that the Funds have the ability to access at the measurement date
|
|
●
|
Level 2 — Other significant observable inputs (including quoted prices for similar securities, interest rates, prepayment speeds, credit risk, referenced indices, quoted
prices in inactive markets, adjusted quoted prices in active markets,etc.)
|
|
●
|
Level 3 — Prices, inputs or proprietary modeling techniques which are both significant to the fair value measurement and unobservable (supported by little or no market
activity).
|
Investments are classified within the level of the lowest significant input considered in determining fair value. Investments classified within Level 3 whose fair value
measurement considers several inputs may include Level 1 or Level 2 inputs as components of the overall fair value measurement.
For the year ended October 31, 2019, there have been no significant changes to the Funds’ fair valuation methodologies. Fair value measurement classifications are summarized in
each Fund’s Schedule of Investments.
FEDERAL INCOME TAXES: It is the intention of each Fund to qualify, or continue to qualify, as a “regulated investment company” by complying with the requirements of Subchapter M
of the Internal Revenue Code of 1986, as amended. If a Fund qualifies as a regulated investment company that is accorded special tax treatment, the Fund will not be subject to Federal income taxes to the extent that, among other things, it
distributes substantially all of its taxable income, including realized capital gains, for the fiscal year in a timely manner, to its shareholders in the form of dividends. In addition, as a result of distributing substantially all of their net
investment income during each calendar year, capital gains and certain other amounts, if any, the Funds will not be subject to a Federal excise tax. The Funds evaluate tax positions taken or expected to be taken in the course of preparing the Funds’
tax returns to determine whether it is “more-likely than-not” (i.e., greater than 50%) that each tax position will be sustained upon examination by a taxing authority based on the technical merits of the position. Tax positions deemed to meet the
more-likely-than-not threshold are recorded as a tax benefit or expense in the current year. The Funds did not record any tax provision in the current period. However, management’s conclusions regarding tax positions may be subject to review and
adjustment at a later date based on factors including, but not limited to, examination
|
Schroder Mutual Funds
|
Notes to Financial Statements (continued)
October 31, 2019
by tax authorities (i.e., the last three tax year ends, as applicable), on-going analysis of and changes to tax laws, regulations and interpretations thereof.
As of, and during the year ended October 31, 2019, the Funds did not have a liability for any unrecognized tax benefits. The Funds recognize interest and penalties, if any,
related to unrecognized tax benefits as income tax expense in the Statement of Operations. During the year, the Funds did not incur any tax-related interest or penalties.
FOREIGN TAXES: The Emerging Markets Small Cap Fund may be subject to taxes imposed by countries in which it invests. Such taxes are generally based on either income or gains
earned or repatriated. The Emerging Markets Small Cap Fund accrues and applies such taxes to net investment income, net realized gains and net unrealized gains as income and/or capital gains are earned. The Emerging Markets Small Cap Fund has accrued
foreign tax in the amount of $5,881 presented on the Statement of Assets and Liabilities.
INVESTMENT TRANSACTIONS: Investment security transactions are recorded as of trade date. Realized gains and losses on sales of investments are determined on the basis of
identified cost. Capital gain taxes on securities in certain foreign countries are accrued on unrealized appreciation and are due when realized.
INVESTMENT INCOME: Dividend income is recorded on the ex-dividend date. Interest income and expense is recorded on an accrual basis. Discounts and premiums on fixed income
securities are accreted and amortized using the effective interest method. Realized gains (losses) on paydowns of mortgage-backed and asset-backed securities are recorded as an adjustment to interest income.
EXPENSES: Expenses are recorded on an accrual basis. Many of the expenses of the Funds can be directly attributable to a specific Fund. Expenses not directly attributable to a
specific Fund are allocated among the Funds based on relative average net assets or another appropriate methodology. Class specific expenses are borne by that class. Fund expenses are pro-rated to the respective classes based on relative net assets.
CLASSES OF SHARES: Income, realized and unrealized gains and losses of a Fund are prorated to the respective classes of shares based on relative net assets.
CASH: Idle cash may be swept into various overnight sweep accounts and is classified as cash on the Statements of Assets and Liabilities. The Funds maintain cash in bank deposit
accounts which, at times may exceed United States federally insured limits. Amounts invested are available on the same business day.
DIVIDENDS AND DISTRIBUTIONS TO SHAREHOLDERS: Dividends and distributions to shareholders from net investment income are declared and distributed at least annually for North
American Equity Fund and Emerging Markets Small Cap Fund, and monthly for Schroder Core Bond Fund, Schroder Short Duration Bond Fund and Schroder Long Duration Investment-Grade Bond Fund. Schroder Total Return Fixed Income Fund declares dividends to
shareholders from net investment income daily and distributes these dividends monthly. Distributions to shareholders from net realized capital gains, if any, are declared and distributed at least annually for each of the Funds.
FOREIGN CURRENCY: Foreign currency amounts are translated into U.S. dollars at the mean of the bid and asked prices of such currencies against U.S. dollars as follows: (i)
assets and liabilities at the rate of exchange at the end of the respective period; and (ii) purchases and sales of securities and income and expenses at the rate of exchange prevailing on the dates of such transactions. Each Fund generally
bifurcates that portion of realized gains (losses) on investments in debt securities which is attributed to changes in foreign exchange rates from that which is due to changes in market prices of debt securities. That portion of gains (losses) is
included in the “Statements of Operations” under “Net realized gain (loss) on foreign currencies.” For foreign equity securities, these changes are included in the “Statements of Operations” under “Net realized and unrealized gain (loss) on
investments.” Each Fund reports certain foreign currency related transactions as components of realized gains (losses) for financial reporting purposes, whereas such components are treated as ordinary income (loss) for federal income tax purposes.
Certain Funds may enter into forward foreign currency contracts to protect the U.S. dollar value of the underlying portfolio of securities against
|
Schroder Mutual Funds
|
Notes to Financial Statements (continued)
October 31, 2019
the effect of possible adverse movements in foreign exchange rates. Certain Funds may also seek to gain currency exposure or otherwise attempt to increase a Fund’s total return
by holding such forward foreign currency contracts. Principal risks associated with such transactions include the movement in value of the foreign currency relative to the U.S. dollar and the ability of the counterparty to perform. Fluctuations in
the value of such forward foreign currency transactions are recorded daily as unrealized gain or loss; realized gain or loss includes net gain or loss on transactions that have terminated by settlement or by the Funds entering into offsetting
commitments.
WHEN-ISSUED SECURITIES: Certain Funds may purchase securities on a when-issued, delayed delivery, or forward commitment basis, including TBAs, during the period covered by this
report. These transactions involve a commitment by the Fund to purchase a security for a predetermined price or yield, with payments and delivery taking place more than seven days in the future, or after a period longer than the customary settlement
period for that type of security. These transactions may increase the overall investment exposure for a Fund (and so may create investment leverage) and involve a risk of loss if the value of the securities declines prior to the settlement date.
CONVERTIBLE SECURITIES: Certain Funds may invest in securities that are convertible into preferred and common stocks, and so subject to the risks of investments in both debt and
equity securities. The market value of convertible securities tends to decline as interest rates increase and, conversely, tends to increase as interest rates decline. In addition, because of the conversion feature, the market value of convertible
securities tends to vary with fluctuations in the market value of the underlying preferred and common stocks and, therefore, also will react to variations in the general market for equity securities.
FUTURES: To the extent consistent with its investment objective and strategies, the Funds use futures contracts for tactical hedging purposes as well as to enhance the Funds’
return. Initial margin deposits of cash or securities are made upon entering into futures contracts. Financial futures contracts are valued based upon their quoted daily settlement prices; changes in initial settlement value (represented by cash paid
to or received from brokers as “variation margin”) are accounted for as unrealized appreciation (depreciation) on the Statements of Assets and Liabilities. When the futures contract is closed, the Funds record a realized gain or loss equal to the
difference between the proceeds from (or cost of) the closing transaction and the amount invested in the futures contract. Net realized and unrealized gains or losses occurring during the holding period of futures contracts are found on the
Statements of Operations as a component of net realized gain (loss) on futures contracts and net change in unrealized appreciation (depreciation) on futures contracts, respectively.
Futures contracts involve leverage and are subject to market risk that may exceed the amounts recognized in the Statements of Assets and Liabilities. Risks arise from the
possible significant movements in prices. The change in value of futures contracts primarily corresponds to the value of the securities or other index or amount underlying the contracts, but may not precisely correlate with the change in value of
such securities or other index or amount. In addition, there is the risk that a Fund may not be able to enter into a closing transaction because of an illiquid secondary market.
Refer to each Fund’s Schedule of Investments for details regarding open futures contracts as of October 31, 2019, if applicable.
OPTION/SWAPTION TRANSACTIONS: Certain Funds may purchase and write call and put options on securities, securities indices, swaps (“swaptions”) and foreign currencies, provided
such options/swaptions are traded on a national securities exchange or an over-the-counter market. When any of the Funds writes or purchases a covered call or put option/swaption, an amount equal to the premium received is included in that Fund’s
statement of assets and liabilities as a liability. The amount of the liability is subsequently marked-to-market to reflect the current market value of the option/swaption. If an option/swaption expires on its stipulated expiration date or if the
Fund enters into a closing purchase transaction, a gain or loss is realized. If a written call option/swaption is exercised, a gain or loss is realized for the sale of the underlying
|
Schroder Mutual Funds
|
Notes to Financial Statements (continued)
October 31, 2019
security and the proceeds from the sale are increased by the premium originally received. If a written put option/swaption is exercised, the cost of the security acquired is
decreased by the premium originally received. As writer of an option/swaption, the Fund has no control over whether the underlying securities are subsequently sold (call) or purchased (put) and, as a result, bears the market risk of an unfavorable
change in the price of the security or index underlying the written option/swaption. When any of the Funds purchases a call or put option/swaption, an amount equal to the premium paid is included in that Fund’s statement of assets and liabilities as
an investment, and is subsequently marked-to-market to reflect the current market value of the option/swaption. If an option/swaption expires on the stipulated expiration date or if a Fund enters into a closing sale transaction, a gain or loss is
realized. If a Fund exercises a call, the cost of the security acquired is increased by the premium paid for the call. If a Fund exercises a put option/swaption, a gain or loss is realized from the sale of the underlying security, and the proceeds
from such sale are decreased by the premium originally paid. Written and purchased options/swaptions are non-income producing securities. The option/swaption techniques utilized are generally to hedge against changes in interest rates, foreign
currency exchange rates or securities prices in order to establish more definitely the effective return on securities or currencies held or intended to be acquired by a Fund, to reduce the volatility of the currency exposure associated with an
investment in non-U.S. securities, or as an efficient means of adjusting exposure to the bond, equity and currency markets.
Refer to each Fund’s Schedule of Investments for details regarding open option/swaption contracts as of October 31, 2019, if applicable.
SWAP AGREEMENTS: Certain Funds may enter into swap agreements, including credit default swaps and interest rate swaps and other types of exchange-traded or over-the-counter
transactions with broker-dealers or other financial institutions. Depending on their structures, swap agreements may increase or decrease a Fund’s exposure to long- or short-term interest rates (in the United States or abroad), foreign currency
values, mortgage securities, corporate borrowing rates, or other factors such as security prices or inflation rates. The value of a Fund’s swap positions would increase or decrease depending on the changes in value of the underlying rates, currency
values, or other indices or measures. Swap agreements are privately negotiated in the over-the counter market (“OTC swaps”) or may be executed in a multilateral or other trade facility platform, such as a registered commodities exchange (“centrally
cleared swaps”).
In a “credit default” swap transaction, one party pays what is, in effect, an insurance premium through a stream of payments to another party in exchange for the right to
receive a specified return in an event of default (or similar events) by a third party on its obligations. Therefore, in a credit default swap, a Fund may pay a premium and, in return, have the right to put certain bonds or loans to the counterparty
upon default by the issuer of such bonds or loans (or similar events) and to receive in return the par value of such bonds or loans (or another agreed upon amount). A Fund could also receive the premium referenced above, and be obligated to pay a
counterparty the par value of certain bonds or loans upon a default (or similar event) by the issuer. A Fund’s ability to realize a profit from such transactions will depend on the ability of the financial institutions with which it enters into the
transactions to meet their obligations to the Fund. Under certain circumstances, suitable transactions may not be available to a Fund, or a Fund may be unable to close out its position under such transactions at the same time, or at the same price,
as if it had purchased comparable publicly traded securities.
“Interest rate” swaps involve the exchange by a Fund with another party of their respective commitments to pay or receive interest (e.g., an exchange of floating rate payments
for fixed rate payments) with respect to a notional amount of principal. “Inflation- linked” swaps are used to transfer inflation risk from one party to another through an exchange of cash flows. In an inflation-linked swap, one party pays a fixed
rate on a notional principal amount, while the other party pays a floating rate linked to an inflation index, such as the Consumer Price Index. The Funds could be exposed to credit or market risk due to unfavorable changes in the fluctuation of
interest rates or if the counterparty defaults on its obligation to perform. A Fund’s ability to engage in certain swap transactions may be limited by tax considerations.
|
Schroder Mutual Funds
|
Notes to Financial Statements (continued)
October 31, 2019
Swaps are marked-to-market daily and the resulting changes in market values, if any, are recorded as an unrealized gain or loss in the Statement of Operations. Net payments of
interest are recorded as realized gains or losses. Daily changes in valuation of centrally cleared swaps, if any, are recorded as a receivable or payable for the change in value as appropriate (“variation margin”) on the Statements of Assets and
Liabilities.
Legislative and regulatory reforms, including the Dodd-Frank Wall Street Reform and Consumer Protection Act, have resulted in new regulation of swap agreements, including
clearing, margin, reporting, recordkeeping and registration requirements. New regulations could, among other things, restrict a Fund’s ability to engage in swap transactions (for example, by making certain types of swap transactions no longer
available to a Fund) and/or increase the costs of such swap transactions (for example, by increasing margin or capital requirements), and a Fund may as a result be unable to execute its investment strategies in a manner the Fund might otherwise
choose.
There were no open swap contracts held by the Funds as of October 31, 2019.
CUSTODY OFFSET: The Funds have an arrangement with the custodian whereby interest earned on uninvested cash balances is used to offset a portion of the custodian fees. The
amounts are included in custodian fees and custody offset on the Statements of Operations.
OFFERING COSTS: During the period ended October 31, 2018, the Schroder Core Bond Fund commenced operations and incurred offering costs, which were amortized to expense over a
twelve month period. As of October 31, 2019, the offering costs have been fully amortized.
NOTE 3 — INVESTMENT ADVISORY FEES, ADMINISTRATION AGREEMENTS AND DISTRIBUTION PLANS
The Funds have entered into investment advisory agreements with SIMNA. Under these agreements, SIMNA provides investment management services and is entitled to receive
compensation for its services, payable monthly for the SGST Fund and the SST Funds, at the following annual rates based on average daily net assets of each Fund taken separately. No changes to the management fee rates the Funds pay to SIMNA occurred
due to the Transition. In order to limit the expenses of the R6 and Investor Shares of certain Funds, as applicable, SIMNA has contractually agreed to waive management fees, pay and/or reimburse the applicable Fund for expenses through February 28,
2020, to the extent that the total annual fund operating expenses of a Fund (other than acquired fund fees and expenses, other indirect acquired fund expenses, interest, taxes, and extraordinary expenses) allocable to each share class exceed the
following annual rates (based on the average daily net assets attributable to each share class):
|
Expense Limitation
|
|||
|
Management Fee
|
R6 Shares
|
Investor Shares
|
|
|
Schroder North American Equity Fund
|
0.25%
|
N/A
|
N/A
|
|
Schroder Emerging Markets Small Cap Fund
|
1.15%
|
1.35%
|
1.50%
|
|
Schroder Core Bond Fund
|
0.25%
|
0.32%
|
N/A
|
|
Schroder Long Duration Investment-Grade Bond Fund(1)
|
0.25%
|
N/A
|
0.32%
|
|
Schroder Short Duration Bond Fund(2)
|
0.25%
|
0.32%
|
0.47%
|
|
Schroder Total Return Fixed Income Fund
|
0.25%
|
N/A
|
0.40%
|
|
(1)
|
Prior to April 1, 2018, the management fee was 0.33%. Prior to February 28, 2018, the expense limitation was 0.39% for Investor Shares.
|
|
(2)
|
Prior to April 1, 2018, the management fee was 0.29%. Prior to February 28, 2018, the expense limitations were 0.39% for R6 Shares and 0.54% for Investor Shares.
|
|
N/A — Fund is not currently subject to the expense limitation agreement or Share Class is not currently offered.
|
|
SIMNA has retained its affiliate Schroder Investment Management North America Limited (“SIMNA Ltd.”) to serve as sub-adviser responsible for the portfolio
management of Schroder North American Equity Fund and Schroder Emerging Markets Small Cap Fund. During the reporting period, SIMNA paid SIMNA Ltd. the
|
Schroder Mutual Funds
|
Notes to Financial Statements (continued)
October 31, 2019
following percentage of the investment advisory fees it received from Schroder North American Equity Fund and Schroder Emerging Markets Small Cap Fund, after
waivers, as set forth below.
Effective October 16, 2017:
|
Fund
|
Percentage of Fees
Paid to SIMNA Ltd. |
|
|
Schroder North American Equity Fund
|
58.5%
|
|
|
Schroder Emerging Markets Small Cap Fund
|
58.5%
|
Each Trust has entered into an administration agreement with SEI Investments Global Funds Services (“SEI” or the “Administrator”), under which the Administrator
provides administrative services to the Trust. For these services, the Administrator is paid a fee, which varies based on the average daily net assets of each Fund, subject to certain minimums.
Each Trust and SEI Investments Distribution Co., (“SIDCO”), a wholly-owned subsidiary of SEI Investments, and an affiliate of the Administrator, are parties to a distribution
agreement (the “Distribution Agreement”), whereby SIDCO acts as principal underwriter for the Trusts’ shares.
Each Fund has adopted a shareholder servicing plan under which a shareholder servicing fee of up to 0.15% of average daily net assets of Investor Shares of the Funds will be
paid to financial intermediaries.
SIMNA or its affiliates may, from time to time, also make payments to financial intermediaries for sub-administration, sub-transfer agency, or other shareholder services or
distribution, out of their own resources.
NOTE 4 — DERIVATIVE CONTRACTS
Derivative instruments and hedging activities require enhanced disclosures about the Funds’ derivative and hedging activities, including how such activities are accounted for
and their effect on the Funds’ financial position, performance, and cash flows.
The fair value of derivative instruments as of October 31, 2019, was as follows:
|
Fund
|
Statement of Assets and Liabilities Location
|
Asset
Derivatives |
Liability Derivatives
|
||||||
|
Schroder North American Equity Fund
|
|||||||||
|
Equity contracts
|
|||||||||
|
Futures contracts
|
Unrealized appreciation/(depreciation)
on futures contracts* |
$
|
66,708
|
$
|
—
|
||||
|
Foreign exchange contracts
|
|||||||||
|
Forward contracts
|
Unrealized appreciation/(depreciation)
on forward foreign currency contracts |
66,965
|
—
|
||||||
|
$
|
133,673
|
$
|
—
|
||||||
|
Schroder Short Duration Bond Fund
|
|||||||||
|
Interest rate contracts
|
|||||||||
|
Futures contracts
|
Unrealized appreciation/(depreciation)
on futures contracts* |
$
|
758
|
$
|
(6,607
|
)
|
|||
|
$
|
758
|
$
|
(6,607
|
)
|
|||||
|
Schroder Total Return Fixed Income Fund
|
|||||||||
|
Interest rate contracts
|
|||||||||
|
Futures contracts
|
Unrealized appreciation/(depreciation)
on futures contracts* |
$
|
—
|
$
|
(127,646
|
)
|
|||
|
$
|
—
|
$
|
(127,646
|
)
|
|||||
*Unrealized appreciation/(depreciation) on futures contracts is included in distributable earnings (loss).
|
Schroder Mutual Funds
|
Notes to Financial Statements (continued)
October 31, 2019
The effect of derivative instruments on the Statement of Operations for the year ended October 31, 2019, was as follows:
The amount of net realized gain (loss) and change in unrealized appreciation (depreciation) on derivatives:
|
Fund
|
Net Realized
Gain/(Loss)* |
Change in Unrealized Appreciation (Depreciation)**
|
Total
|
|||||||||
|
Schroder North American Equity Fund
|
||||||||||||
|
Equity contracts
|
||||||||||||
|
Futures Contracts
|
$
|
901,045
|
$
|
1,677,672
|
$
|
2,578,717
|
||||||
|
Foreign exchange contracts
|
||||||||||||
|
Forward Contracts
|
421,238
|
(231,632
|
)
|
189,606
|
||||||||
|
$
|
1,322,283
|
$
|
1,446,040
|
$
|
2,768,323
|
|||||||
|
Schroder Short Duration Bond Fund
|
||||||||||||
|
Interest rate contracts
|
||||||||||||
|
Futures Contracts
|
$
|
4,400
|
$
|
5,379
|
$
|
9,779
|
||||||
|
Schroder Total Return Fixed Income Fund
|
||||||||||||
|
Interest rate contracts
|
||||||||||||
|
Futures Contracts
|
$
|
525,982
|
$
|
13,266
|
$
|
539,248
|
||||||
|
Foreign exchange contracts
|
||||||||||||
|
Forward Contracts
|
(66,075
|
)
|
57,333
|
(8,742
|
)
|
|||||||
|
Credit contracts
|
||||||||||||
|
Swap Contracts
|
(23,161
|
)
|
—
|
(23,161
|
)
|
|||||||
|
$
|
436,746
|
$
|
70,599
|
$
|
507,345
|
|||||||
|
*
|
Futures contracts are included in net realized gain on futures, forward contracts are included in net realized gain (loss) on forward foreign currency contracts and swap contracts are included
in net realized loss on swap contracts.
|
|
**
|
Futures contracts are included in change in unrealized appreciation on futures, forward contracts are included in change in unrealized appreciation (depreciation) on forward foreign currency contracts. |
|
Schroder Mutual Funds
|
Notes to Financial Statements (continued)
October 31, 2019
The following table discloses the volume of the futures contracts, forward foreign currency contracts, and swap contracts during the year ended October 31, 2019:
|
Schroder
North American Equity Fund |
Schroder
Short Duration Bond Fund |
Schroder Total Return Fixed Income Fund
|
||||||||||
|
Futures Contracts:
|
||||||||||||
|
Average Quarterly Market Value Balance Long
|
$
|
26,346,745
|
$
|
3,260,594
|
$
|
12,584,147
|
||||||
|
Average Quarterly Market Value Balance Short
|
—
|
(696,522
|
)
|
(4,447,297
|
)
|
|||||||
|
Forward Foreign Currency Contracts:
|
||||||||||||
|
Average Quarterly Notional Contracts Purchased
|
$
|
(976,525
|
)
|
$
|
—
|
$
|
(94,361
|
)
|
||||
|
Average Quarterly Notional Contracts Sold
|
13,488,648
|
—
|
93,272
|
|||||||||
|
Swap Contracts
|
||||||||||||
|
Average Quarterly Market Value of Centrally Cleared Swaps Long
|
$
|
—
|
$
|
—
|
$
|
(26,057
|
)
|
|||||
In accordance with the authoritative guidance under U.S. GAAP, “Disclosures about Offsetting Assets and Liabilities”
entities are required to disclose information about financial instruments and derivative instruments that have been offset or that are subject to enforceable master netting agreements. The Funds do not offset such instruments on the Statement of
Assets and Liabilities, rather such instruments are presented on a gross basis.
The following is a summary by derivative type of the market value of over the counter (“OTC”) financial derivative instruments and collateral (received)/pledged by counterparty
as of October 31, 2019:
|
Gross Assets- Recognized in the Statement of Assets and Liabilities
|
Gross Liabilities- Recognized in the Statement of Assets and Liabilities
|
Net Amount Available to be Offset
|
Cash Collateral Pledged or (Received)†
|
Net
Amount‡ |
||||||||||||||||
|
Schroder North American Equity Fund
|
||||||||||||||||||||
|
Forward Contracts
|
Forward Contracts
|
|||||||||||||||||||
|
Royal Bank of Canada
|
$
|
66,965
|
$
|
—
|
$
|
66,965
|
$
|
—
|
$
|
66,965
|
||||||||||
|
†
|
Collateral pledged is limited to the net outstanding amount due to/from an individual counterparty. The actual collateral amounts pledged may exceed these amounts and may fluctuate in value.
|
|
‡
|
Net amount represents the net receivable/(payable) that would be due from/to the counterparty in the event of default. Exposure from OTC financial derivative instruments can only be netted across transactions governed under the same master agreement with the same legal entity. |
NOTE 5 — REDEMPTION FEES
Schroder Emerging Markets Small Cap Fund generally imposes a 2.00% redemption fee on shares redeemed (including in connection with an exchange) two months or less from their
date of purchase. These fees, which are not sales charges, are retained by the Fund and not paid to SIDCO or any other entity. The redemption fees are included in the Statements of Changes in Net Assets under “Redemption fees,” and are included as
part of “Capital paid-in” on the Statements of Assets and Liabilities. There were no redemption fees retained for the years ended October 31, 2019 and October 31, 2018.
|
Schroder Mutual Funds
|
Notes to Financial Statements (continued)
October 31, 2019
NOTE 6 — INVESTMENT TRANSACTIONS
Purchases and proceeds from sales and maturities of investments, excluding short-term and U.S. Government securities for each Fund, for the year ended October 31, 2019 were as
follows:
|
Purchases
|
Sales and
Maturities |
|||||||
|
Schroder North American Equity Fund
|
$
|
462,748,029
|
$
|
528,972,316
|
||||
|
Schroder Emerging Markets Small Cap Fund
|
505,092
|
508,175
|
||||||
|
Schroder Core Bond Fund
|
17,303,826
|
11,189,935
|
||||||
|
Schroder Long Duration Investment-Grade Bond Fund
|
50,398,616
|
20,155,551
|
||||||
|
Schroder Short Duration Bond Fund
|
2,712,305
|
7,518,115
|
||||||
|
Schroder Total Return Fixed Income Fund
|
10,334,251
|
13,411,415
|
||||||
Purchases and proceeds from sales and maturities of U.S. Government securities for the year ended October 31, 2019 were as follows:
|
Purchases
|
Sales and
Maturities |
|||||||
|
Schroder Core Bond Fund
|
$
|
64,733,139
|
$
|
51,977,301
|
||||
|
Schroder Long Duration Investment-Grade Bond Fund
|
66,611,676
|
73,062,460
|
||||||
|
Schroder Short Duration Bond Fund
|
14,239,643
|
10,941,170
|
||||||
|
Schroder Total Return Fixed Income Fund
|
25,635,955
|
24,443,192
|
||||||
NOTE 7 — FEDERAL INCOME TAXES
Income and capital gain distributions are determined in accordance with income tax regulations, which may differ from U.S. GAAP. These book/tax differences are either temporary
or permanent in nature. Any permanent differences, which may result in distribution reclassifications, are primarily due to differing treatments for gains resulting from investments in passive foreign investment companies, equalization distribution,
reclassifications of long-term capital gain distributions on real estate investment trust securities, partnership investments, foreign currency transactions and paydowns. Distributions from short-term gains and from gains on foreign currency
transactions are treated as distributions from ordinary income for tax purposes.
At October 31, 2019, the Funds reclassified the following permanent amounts between capital paid-in, undistributed net investment income and accumulated realized gain (loss):
|
Distributable
Earnings (Loss) |
Increase
(Decrease) Capital Paid-in |
|||||||
|
Schroder North American Equity Fund
|
$
|
294
|
$
|
(294
|
)
|
|||
The tax character of dividends and distributions declared during the years or periods ended October 31, 2019 and October 31, 2018, was as follows:
|
Schroder Mutual Funds
|
Notes to Financial Statements (continued)
October 31, 2019
|
Ordinary
Income |
Long-Term Capital Gain
|
Return
of Capital |
Total
|
|||||||||||||
|
Schroder North American Equity Fund
|
||||||||||||||||
|
2019
|
$
|
31,721,355
|
$
|
64,736,697
|
$
|
—
|
$
|
96,458,052
|
||||||||
|
2018
|
32,669,411
|
24,894,979
|
—
|
57,564,390
|
||||||||||||
|
Schroder Emerging Markets Small Cap Fund
|
||||||||||||||||
|
2019
|
43,907
|
67,568
|
—
|
111,475
|
||||||||||||
|
2018
|
45,427
|
314,600
|
—
|
360,027
|
||||||||||||
|
Schroder Core Bond Fund
|
||||||||||||||||
|
2019
|
1,509,949
|
—
|
—
|
1,509,949
|
||||||||||||
|
2018
|
573,056
|
—
|
—
|
573,056
|
||||||||||||
|
Schroder Long Duration Investment-Grade Bond Fund
|
||||||||||||||||
|
2019
|
4,218,313
|
—
|
—
|
4,218,313
|
||||||||||||
|
2018
|
2,902,410
|
—
|
—
|
2,902,410
|
||||||||||||
|
Schroder Short Duration Bond Fund
|
||||||||||||||||
|
2019
|
389,540
|
—
|
—
|
389,540
|
||||||||||||
|
2018
|
343,185
|
—
|
—
|
343,185
|
||||||||||||
|
Schroder Total Return Fixed Income Fund
|
||||||||||||||||
|
2019
|
1,244,592
|
—
|
49,764
|
1,294,356
|
||||||||||||
|
2018
|
1,417,244
|
—
|
379,779
|
1,797,023
|
||||||||||||
As of October 31, 2019, the components of distributable earnings (accumulated losses) on a tax basis were as follows:
|
Undistributed Ordinary Income
|
Undistributed
Long-Term Capital Gain |
Capital Loss Carryforwards
|
Unrealized Appreciation (Depreciation)
|
Other
Temporary Differences |
Total
Distributable Earnings (Accumulated Losses) |
|||||||||||||||||||
|
Schroder North American Equity Fund
|
$
|
15,259,352
|
$
|
44,565,017
|
$
|
—
|
$
|
344,845,102
|
$
|
(66,993
|
)
|
$
|
404,602,478
|
|||||||||||
|
Schroder Emerging Markets Small Cap Fund
|
27,273
|
36,940
|
—
|
347,230
|
(46
|
)
|
411,397
|
|||||||||||||||||
|
Schroder Core Bond Fund
|
479,247
|
144,895
|
—
|
2,129,160
|
(2
|
)
|
2,753,300
|
|||||||||||||||||
|
Schroder Long Duration Investment-Grade Bond Fund
|
2,562,958
|
1,315,359
|
—
|
14,525,310
|
(1
|
)
|
18,403,626
|
|||||||||||||||||
|
Schroder Short Duration Bond Fund
|
3,409
|
—
|
(35,541
|
)
|
82,243
|
1
|
50,112
|
|||||||||||||||||
|
Schroder Total Return Fixed Income Fund
|
—
|
—
|
(3,616,669
|
)
|
1,075,184
|
(416,310
|
)*
|
(2,957,795
|
)
|
|||||||||||||||
* Other differences relate to distributions payable and straddles loss deferrals.
|
Schroder Mutual Funds
|
Notes to Financial Statements (continued)
October 31, 2019
Each Fund may use its tax basis capital loss carryforwards listed above to offset taxable capital gains realized in subsequent years for federal income tax
purposes. If a Fund incurs or has incurred net capital losses in taxable years beginning after December 22, 2010 (“post-RIC Mod losses”), those losses will be carried forward to one or more subsequent taxable years without expiration; any such
carryforward losses will retain their character as short-term or long-term.
The Funds listed below have the following post-RIC Mod losses, which do not expire:
|
Short-Term Loss
|
Long-Term Loss
|
Total
|
||||||||||
|
Schroder Short Duration Bond Fund
|
$
|
—
|
$
|
35,541
|
$
|
35,541
|
||||||
|
Schroder Total Return Fixed Income Fund
|
642,974
|
2,973,695
|
3,616,669
|
|||||||||
During the year ended October 31, 2019, the Funds listed below utilized capital loss carryforwards to offset capital gains:
|
Schroder Core Bond Fund
|
$
|
71,021
|
||
|
Schroder Long Duration Investment-Grade Bond Fund
|
1,001,417
|
|||
|
Schroder Short Duration Bond Fund
|
103,995
|
|||
|
Schroder Total Return Fixed Income Fund
|
1,040,876
|
For Federal income tax purposes, the difference between Federal tax cost and book cost primarily relates to the timing of recognition of gains and losses on
investments for tax and book purposes, investments in publicly traded partnerships and wash sales.
At October 31, 2019, the identified cost for Federal income tax purposes of investments owned by each Fund and their respective gross unrealized appreciation and depreciation
were as follows:
|
Identified
Tax Cost |
Gross
Unrealized Appreciation |
Gross
Unrealized (Depreciation) |
Net Unrealized Appreciation (Depreciation)
|
|||||||||||||
|
Schroder North American Equity Fund
|
$
|
601,883,001
|
$
|
368,126,684
|
$
|
(23,281,582
|
)
|
$
|
344,845,102
|
|||||||
|
Schroder Emerging Markets Small Cap Fund
|
1,762,504
|
543,982
|
(190,872
|
)
|
353,110
|
|||||||||||
|
Schroder Core Bond Fund
|
59,297,778
|
2,205,163
|
(76,003
|
)
|
2,129,160
|
|||||||||||
|
Schroder Long Duration Investment-Grade Bond Fund
|
102,658,140
|
14,742,452
|
(217,142
|
)
|
14,525,310
|
|||||||||||
|
Schroder Short Duration Bond Fund
|
16,108,793
|
123,399
|
(41,156
|
)
|
82,243
|
|||||||||||
|
Schroder Total Return Fixed Income Fund
|
40,966,592
|
1,252,070
|
(176,886
|
)
|
1,075,184
|
|||||||||||
NOTE 8 — IN-KIND TRANSFERS
On May 31 2019, the Schroder Long Duration Investment-Grade Bond Fund had an investor accept securities in lieu of cash.
|
Shares Redeemed
|
Value of Securities
|
Cash
|
Total
|
|||||||||||||
|
Schroder Long Duration Investment-Grade Bond Fund
|
3,405,907
|
$
|
30,673,702
|
$
|
149,752
|
$
|
30,823,454
|
|||||||||
On January 31, 2018, the Schroder Core Bond Fund issued shares in exchange for securities.
|
Schroder Mutual Funds
|
Notes to Financial Statements (continued)
October 31, 2019
|
Shares
Issued |
Value of Securities
|
Cash
|
Total
|
|||||||||||||
|
Schroder Core Bond Fund
|
2,005,476
|
$
|
19,836,159
|
$
|
218,606
|
$
|
20,054,765
|
|||||||||
On June 5, 2018, the Schroder Core Bond Fund and Schroder Long Duration Investment-Grade Bond Fund issued shares in exchange for securities.
|
Shares
Issued |
Value of Securities
|
Cash
|
Total
|
|||||||||||||
|
Schroder Core Bond Fund
|
1,004,476
|
$
|
9,466,972
|
$
|
396,987
|
$
|
9,863,959
|
|||||||||
|
Schroder Long Duration Investment-Grade Bond Fund
|
3,334,002
|
27,804,628
|
267,666
|
28,072,294
|
||||||||||||
NOTE 9 — PORTFOLIO INVESTMENT RISKS
Below are summaries of some, but not all, of the principal risks of investing in one or more of the Funds, each of which could adversely affect a Fund’s NAV, yield and total
return. Each risk listed below does not necessarily apply to each Fund, and you should read each Fund’s prospectus carefully for a description of the principal risks associated with investing in a particular Fund.
Schroder Emerging Markets Small Cap Fund has a relatively large portion of its assets invested in companies or issuers domiciled in particular foreign countries, including
emerging markets. The Fund may be more susceptible to political, social and economic events adversely affecting those countries and such issuers.
Schroder Emerging Markets Small Cap Fund may invest more than 25% of its total assets in issuers located in any one country or group of countries. When a Fund invests in a
foreign country, it is susceptible to a range of factors that could adversely affect its holdings in issuers of that country, including political and economic developments and foreign exchange-rate fluctuations. As a result of investing substantially
in a single country, the value of the Fund’s assets may fluctuate more widely than the value of shares of a comparable fund with a lesser degree of geographic concentration. The Funds may invest in countries with limited or developing capital
markets. Investments in these markets may involve greater risk than investments in more developed markets.
Schroder Total Return Fixed Income Fund and Schroder Short Duration Bond Fund invest a portion of their assets in securities of issuers that hold mortgage securities, including
subprime mortgage securities. The value of these securities is sensitive to changes in economic conditions, including delinquencies and/or defaults, and may be adversely affected by shifts in the market’s perception of the issuers and changes in
interest rates.
Schroder Short Duration Bond Fund and Schroder Long Duration Investment-Grade Bond Fund invest a portion of their assets in municipal bonds. Municipal bonds are investments of
any maturity issued by states, public authorities or political subdivisions to raise money for public purposes; they include, for example, general obligations of a state or other government entity supported by its taxing powers to acquire and
construct public facilities, or to provide temporary financing in anticipation of the receipt of taxes and other revenue. They also include obligations of states, public authorities or political subdivisions to finance privately owned or operated
facilities or public facilities financed solely by enterprise revenues. The values of municipal obligations that depend on a specific revenue source to fund their payment obligations may fluctuate as a result of changes in the cash flows generated by
the revenue source or changes in the priority of the municipal obligation to receive the cash flows generated by the revenue source. Changes in law or adverse determinations by the Internal Revenue Service or a state tax authority could make the
income from some of these obligations taxable.
|
Schroder Mutual Funds
|
Notes to Financial Statements (continued)
October 31, 2019
The yields on municipal bonds depend on a variety of factors, including general money market conditions, effective marginal tax rates, the financial condition of the issuer,
general conditions of the municipal bond market, the size of a particular offering, the maturity of the obligation and the rating of the issue. The ratings of nationally recognized securities rating agencies represent their opinions as to the credit
quality of the municipal bonds.
A Fund may enter into derivative transactions including futures contracts, options, and swap contracts. Derivatives are financial contracts whose values depend on, or derive
from, the value of an underlying asset, reference rate, or index. A Fund’s use of derivative instruments involves risks different from, and possibly greater than, the risks associated with investing directly in securities and other traditional
investments. Derivatives are subject to liquidity risk, interest rate risk, and credit risk, and the risk that a derivative transaction may not have the effect the Funds’ adviser anticipated. Derivatives also involve the risk of mispricing or
improper valuation and the risk that changes in the value of the derivative may not correlate perfectly with the underlying asset, rate, or index. Derivative transactions typically involve leverage and may be highly volatile. Use of derivatives other
than for hedging purposes may be considered speculative and may have the effect of creating investment leverage, and when a Fund invests in a derivative instrument it could lose more than the principal amount invested. Also, suitable derivative
transactions may not be available in all circumstances and there can be no assurance that a Fund will engage in these transactions when that would be beneficial. Additional principal risks for the Funds can be found in the prospectus.
NOTE 10 — BENEFICIAL INTEREST
The following table shows the number of shareholders each owning of record, or to the knowledge of the Funds beneficially, 5% or more of shares of a Fund outstanding as of
October 31, 2019 and the total percentage of shares of the Fund held by such shareholders. The table includes omnibus accounts that hold shares on behalf of many shareholders.
|
5% or Greater Shareholders
|
||||||||
|
Number
|
% of Fund Held
|
|||||||
|
Schroder North American Equity Fund, Investor Shares
|
2
|
98.27
|
%
|
|||||
|
Schroder Emerging Markets Small Cap Fund, R6 Shares*
|
1
|
100.00
|
||||||
|
Schroder Emerging Markets Small Cap Fund, Investor Shares*
|
1
|
99.95
|
||||||
|
Schroder Core Bond Fund, R6 Shares
|
5
|
100.00
|
||||||
|
Schroder Long Duration Investment-Grade Bond Fund, Investor Shares
|
3
|
93.82
|
||||||
|
Schroder Short Duration Bond Fund, R6 Shares*
|
1
|
96.15
|
||||||
|
Schroder Short Duration Bond Fund, Investor Shares*
|
1
|
99.99
|
||||||
|
Schroder Total Return Fixed Income Fund, Investor Shares
|
6
|
85.01
|
||||||
* Account is owned by an affiliate of SIMNA.
NOTE 11 — LINE OF CREDIT
The Funds entered into a credit agreement on October 6, 2008, as amended from time to time, that enables them to participate in a $12.5 million committed revolving line of
credit with JPMorgan Chase Bank, N.A. Any advance under the line of credit is contemplated primarily for temporary or emergency purposes, or to finance the redemption of the shares of a shareholder of the borrower. Interest is charged to the Funds
based on their borrowings at the current reference rate. The Funds pay their pro rata portion of an annual commitment fee of 0.20% on the total amount of the credit facility. There were no borrowings under the line of credit for the year ended
October 31, 2019.
|
Schroder Mutual Funds
|
Notes to Financial Statements (continued)
October 31, 2019
NOTE 12 — CAPITAL SHARE TRANSACTIONS
Capital share transactions for the year ended October 31, 2019 and the year or period ended October 31, 2018, were as follows:
|
North American
Equity Fund |
Emerging Markets
Small Cap Fund |
Core Bond Fund
|
||||||||||||||||||||||
|
2019
|
2018
|
2019
|
2018
|
2019
|
2018(a)
|
|||||||||||||||||||
|
R6 Shares:
|
||||||||||||||||||||||||
|
Sales of shares
|
N/A
|
N/A
|
—
|
—
|
3,667,663
|
1,034,494
|
||||||||||||||||||
|
Reinvestment of distributions
|
N/A
|
N/A
|
11,779
|
30,920
|
131,149
|
45,037
|
||||||||||||||||||
|
Issued in connection with in-kind transfer
|
N/A
|
N/A
|
—
|
—
|
—
|
3,009,952
|
||||||||||||||||||
|
Redemption of shares
|
N/A
|
N/A
|
—
|
—
|
(1,754,146
|
)
|
(153,197
|
)
|
||||||||||||||||
|
Net increase in R6 Shares
|
N/A
|
N/A
|
11,779
|
30,920
|
2,044,666
|
3,936,286
|
||||||||||||||||||
|
Investor Shares:
|
||||||||||||||||||||||||
|
Sales of shares
|
262,924
|
623,817
|
—
|
—
|
N/A
|
N/A
|
||||||||||||||||||
|
Reinvestment of distributions
|
5,881,701
|
3,407,792
|
148
|
386
|
N/A
|
N/A
|
||||||||||||||||||
|
Redemption of shares
|
(6,774,839
|
)
|
(8,476,332
|
)
|
—
|
—
|
N/A
|
N/A
|
||||||||||||||||
|
Net increase (decrease) in Investor Shares
|
(630,214
|
)
|
(4,444,723
|
)
|
148
|
386
|
N/A
|
N/A
|
||||||||||||||||
|
Long Duration Investment-Grade Bond Fund
|
Short Duration
Bond Fund |
Total Return
Fixed Income Fund |
||||||||||||||||||||||
|
2019
|
2018
|
2019
|
2018
|
2019
|
2018
|
|||||||||||||||||||
|
R6 Shares:
|
||||||||||||||||||||||||
|
Sales of shares
|
N/A
|
N/A
|
69,514
|
61,437
|
N/A
|
N/A
|
||||||||||||||||||
|
Reinvestment of distributions
|
N/A
|
N/A
|
38,965
|
34,612
|
N/A
|
N/A
|
||||||||||||||||||
|
Redemption of shares
|
N/A
|
N/A
|
(43,529
|
)
|
(155,999
|
)
|
N/A
|
N/A
|
||||||||||||||||
|
Net increase (decrease) in R6 Shares
|
N/A
|
N/A
|
64,950
|
(59,950
|
)
|
N/A
|
N/A
|
|||||||||||||||||
|
Investor Shares:
|
||||||||||||||||||||||||
|
Sales of shares
|
6,309,274
|
1,085,179
|
—
|
—
|
434,140
|
736,428
|
||||||||||||||||||
|
Reinvestment of distributions
|
470,083
|
336,570
|
258
|
224
|
107,007
|
159,492
|
||||||||||||||||||
|
Issued in connection with in-kind transfer
|
—
|
3,334,002
|
—
|
—
|
—
|
—
|
||||||||||||||||||
|
Redemption of shares
|
(3,614,624
|
)
|
(1,019,398
|
)
|
—
|
—
|
(682, 215
|
)
|
(3,302,647
|
)
|
||||||||||||||
|
Redemption in kind
|
(3,405,907
|
)
|
—
|
—
|
—
|
—
|
—
|
|||||||||||||||||
|
Net increase (decrease) in Investor Shares
|
(241,174
|
)
|
3,736,353
|
258
|
224
|
(141,068
|
)
|
(2,406,727
|
)
|
|||||||||||||||
(a) Fund commenced investment activities on January 31, 2018.
N/A — R6 or Investor Shares currently not offered. Advisor Shares were not offered by these funds.
NOTE 13 — REGULATORY MATTERS
On August 17, 2018, the SEC adopted amendments to Regulation S-X. These changes are effective for periods after November 5, 2018. The updates to Registered Investment Companies
were mainly focused on simplifying the presentation of distributable earnings by eliminating the need to present the components
|
Schroder Mutual Funds
|
Notes to Financial Statements (concluded)
October 31, 2019
of distributable earnings on a book basis in the Statement of Assets & Liabilities. The update also impacted the presentation of undistributed net investment income and
distribution to shareholders on the Statement of Changes in Net Assets. The amounts presented in the current Statement of Changes in Net Assets represent the aggregated total distributions of net investment income and realized capital gains, except
for distributions classified as return of capital which are still presented separately.
NOTE 14 — NEW ACCOUNTING PRONOUNCEMENT
In August 2018, the FASB issued Accounting Standards Update 2018-13, Fair Value Measurement (Topic 820). The new guidance includes additions and modifications to disclosures
requirements for fair value measurements. For public entities, the amendments are effective for financial statements issued for fiscal years beginning after December 15, 2019, and interim periods within those fiscal years. Management elected to early
adopt the removal of certain disclosures and delay the adoption of additional disclosure until the effective date.
NOTE 15 — SUBSEQUENT EVENTS
The Funds have evaluated the need for disclosures and/or adjustments resulting from subsequent events through the date the financial statements were available to be issued.
Based on this evaluation, see the below disclosure to the financial statements as of October 31, 2019:
The Board of the Schroder Series Trust, at the recommendation of the Adviser, has approved a plan of liquidation providing for the liquidation of the Schroder Emerging Markets
Small Cap Fund and Schroder Short Duration Bond Fund assets and the distribution of the net proceeds pro rata to each Fund’s shareholders. In connection therewith, the Schroder Emerging Markets Small Cap Fund and Schroder Short Duration Bond Fund are
closed to investments by new and existing shareholders. Each Fund is expected to cease operations and liquidate on or about December 31, 2019 (the “Liquidation Date”). The Liquidation Date may be changed without notice at the discretion of the
Trust’s officers.
The Board of the Schroder Series Trust, at the recommendation of the Adviser, has approved a proposed agreement and plan of reorganization (the “Reorganization”) between
Schroder Core Bond Fund (the “Acquiring Fund”) and Schroder Total Return Fixed Income Fund (the “Target Fund”). The Reorganization is expected to take place before the end of the first quarter of 2020.
|
Schroder Mutual Funds
|
Report of Independent Registered Public Accounting Firm
To the Board of Trustees of Schroder Global Series Trust and Schroder Series Trust and Shareholders of Schroder North American Equity Fund, Schroder Emerging Markets Small Cap
Fund, Schroder Core Bond Fund, Schroder Long Duration Investment-Grade Bond Fund, Schroder Short Duration Bond Fund, and Schroder Total Return Fixed Income Fund
Opinions on the Financial Statements
We have audited the accompanying statements of assets and liabilities, including the schedules of investments, of Schroder North American Equity Fund (constituting Schroder
Global Series Trust), Schroder Emerging Markets Small Cap Fund, Schroder Core Bond Fund, Schroder Long Duration Investment-Grade Bond Fund, Schroder Short Duration Bond Fund, and Schroder Total Return Fixed Income Fund (constituting Schroder Series
Trust) (hereinafter collectively referred to as the “Funds”) as of October 31, 2019, the related statements of operations and of changes in net assets for each of the periods indicated in the table below, including the related notes, and the
financial highlights for each of the periods indicated therein (collectively referred to as the “financial statements”). In our opinion, the financial statements present fairly, in all material respects, the financial position of each of the Funds as
of October 31, 2019, the results of each of their operations and the changes in each of their net assets for the periods indicated in the table below, and each of the financial highlights for each of the periods indicated therein in conformity with
accounting principles generally accepted in the United States of America.
|
Fund
|
Statement of operations
|
Statement of changes in net assets
|
|
Schroder North American Equity Fund, Schroder Emerging Markets Small Cap Fund, Schroder Long Duration Investment-Grade Bond Fund, Schroder Short Duration Bond Fund, and Schroder Total Return
Fixed Income Fund
|
For the year ended October 31, 2019
|
For the years ended October 31, 2019 and 2018
|
|
Schroder Core Bond Fund
|
For the year ended October 31, 2019
|
For the year ended October 31, 2019 and the period from January 31, 2018 (inception) through October 31, 2018
|
Basis for Opinions
These financial statements are the responsibility of the Funds’ management. Our responsibility is to express an opinion on the Funds’ financial statements based on our audits.
We are a public accounting firm registered with the Public Company Accounting Oversight Board (United States) (PCAOB) and are required to be independent with respect to the Funds in accordance with the U.S. federal securities laws and the applicable
rules and regulations of the Securities and Exchange Commission and the PCAOB.
We conducted our audits of these financial statements in accordance with the standards of the PCAOB. Those standards require that we plan and perform the audit to obtain
reasonable assurance about whether the financial statements are free of material misstatement, whether due to error or fraud.
Our audits included performing procedures to assess the risks of material misstatement of the financial statements, whether due to error or fraud, and performing procedures that
respond to those risks. Such procedures included examining, on a test basis, evidence regarding the amounts and disclosures in the
|
Schroder Mutual Funds
|
financial statements. Our audits also included evaluating the accounting principles used and significant estimates made by management, as well as evaluating the overall
presentation of the financial statements. Our procedures included confirmation of securities owned as of October 31, 2019 by correspondence with the custodian and brokers; when replies were not received from brokers, we performed other auditing
procedures. We believe that our audits provide a reasonable basis for our opinions.
/s/ PricewaterhouseCoopers LLP
Philadelphia, Pennsylvania
December 27, 2019
We have served as the auditor of one or more investment companies in Schroder Investment Management North America Inc. since 2003.
|
Schroder Mutual Funds
|
Information Regarding Review and Approval of Investment Advisory Contracts (unaudited)
RENEWAL OF INVESTMENT ADVISORY AGREEMENTS FOR THE SCHRODER MUTUAL FUNDS AND INVESTMENT SUB-ADVISORY AGREEMENTS FOR THE SCHRODER EMERGING MARKETS SMALL CAP FUND AND THE SCHRODER
NORTH AMERICAN EQUITY FUND
Pursuant to Section 15 of the Investment Company Act of 1940 (the “1940 Act”), the Funds’ advisory and sub-advisory agreements must be renewed at least annually after their
initial two-year term: (i) by the vote of the Board of Trustees (the “Board” or the “Trustees”) of Schroder Series Trust and Schroder Global Series Trust or by a vote of a majority of the shareholders of the Funds; and (ii) by the vote of a majority
of the Trustees who are not parties to the agreements or “interested persons” of any party thereto, as defined in the 1940 Act (the “Independent Trustees”), cast in person at a meeting called for the purpose of voting on such renewal.
A Board meeting was held on June 27, 2019 to decide whether to renew the following agreements (the “Agreements”) for additional one-year terms:
|
●
|
the management contract between Schroder Investment Management North America Inc. (the “Adviser”) and Schroder Series Trust, on behalf of the Schroder Emerging Markets Small Cap Fund and Schroder Short
Duration Bond Fund;
|
|
●
|
the management contract between the Adviser and Schroder Series Trust, on behalf of the Schroder Long Duration Investment-Grade Bond Fund;
|
|
●
|
the management contract between the Adviser and Schroder Series Trust, on behalf of the Schroder Total Return Fixed Income Fund;
|
|
●
|
the investment advisory agreement between the Adviser and Schroder Series Trust, on behalf of the Schroder Core Bond Fund;
|
|
●
|
the investment advisory agreement between the Adviser and Schroder Global Series Trust, on behalf of the Schroder North American Equity Fund;
|
|
●
|
the sub-advisory agreement between the Adviser, Schroder Investment Management North America Ltd. (the “Sub-Adviser”) and Schroder Series Trust, on behalf of the Schroder Emerging Markets Small Cap Fund; and
|
|
●
|
the sub-advisory agreement between the Adviser, the Sub-Adviser and Schroder Global Series Trust, on behalf of the Schroder North American Equity Fund.
|
In preparation for the meeting, the Trustees requested that the Adviser and the Sub-Adviser furnish information necessary to evaluate the terms of the Agreements. Prior to the
meeting, the Independent Trustees of the Funds met to review and discuss the information provided and submitted a request for additional information to the Adviser and the Sub-Adviser, and information was provided in response to this request. The
Trustees used this information, as well as other information that the Adviser, the Sub-Adviser and other service providers of the Funds presented or submitted to the Board at the meeting and other meetings held during the prior year, to help them
decide whether to renew the Agreements for an additional year.
Specifically, the Board requested and received written materials from the Adviser, the Sub-Adviser and other service providers of the Funds regarding: (i) the nature, extent and
quality of the Adviser’s and the Sub-Adviser’s services; (ii) the Adviser’s and the Sub-Adviser’s investment management personnel; (iii) the Adviser’s and the Sub-Adviser’s operations and financial condition; (iv) the Adviser’s and the Sub-Adviser’s
brokerage practices (including any soft dollar arrangements) and investment strategies; (v) the advisory fees paid to the Adviser and the Sub-Adviser and the Funds’ overall fees and operating expenses compared with peer groups of mutual funds; (vi)
the level of the Adviser’s and the Sub-Adviser’s profitability from their relationships with the Funds, including both direct and indirect benefits accruing to the Adviser
|
Schroder Mutual Funds
|
Information Regarding Review and Approval of Investment Advisory Contracts (unaudited)
and the Sub-Adviser and their affiliates; (vii) the Adviser’s and the Sub-Adviser’s potential economies of scale; (viii) the Adviser’s and the Sub-Adviser’s compliance programs,
including a description of material compliance matters and material compliance violations; (ix) the Adviser’s and the Sub-Adviser’s policies on and compliance procedures for personal securities transactions; and (x) the Funds’ performance compared
with peer groups of mutual funds and the Funds’ benchmark indices.
Representatives from the Adviser and the Sub-Adviser, along with other Fund service providers, presented additional information and participated in question and answer sessions
at the Board meeting to help the Trustees evaluate the Adviser’s and the Sub-Adviser’s services, fees and other aspects of the Agreements. The Independent Trustees received advice from independent counsel and met in executive sessions outside the
presence of Fund management, the Adviser and the Sub-Adviser.
At the Board meeting, the Trustees, including all of the Independent Trustees, based on their evaluation of the information provided by the Adviser, the Sub-Adviser and other
service providers of the Funds, renewed the Agreements. In considering the renewal of the Agreements, the Board considered various factors that they determined were relevant, including: (i) the nature, extent and quality of the services provided by
the Adviser and the Sub-Adviser; (ii) the investment performance of the Funds and the Adviser and the Sub-Adviser; (iii) the costs of the services provided and profits realized by the Adviser and the Sub-Adviser from their relationships with the
Funds, including both direct and indirect benefits accruing to the Adviser and the Sub-Adviser and their affiliates; (iv) the extent to which economies of scale are being realized by the Adviser and the Sub-Adviser; and (v) whether fee levels reflect
such economies of scale for the benefit of Fund investors, as discussed in further detail below.
Nature, Extent and Quality of Services Provided by the Adviser and the Sub-Adviser
In considering the nature, extent and quality of the services provided by the Adviser and the Sub-Adviser, the Board reviewed the portfolio management services provided by the
Adviser and the Sub-Adviser to the Funds, including the quality and continuity of the Adviser’s and the Sub-Adviser’s portfolio management personnel, the resources of the Adviser and the Sub-Adviser, and the Adviser’s and the Sub-Adviser’s compliance
histories and compliance programs. The Trustees reviewed the terms of the Agreements. The Trustees also reviewed the Adviser’s and the Sub-Adviser’s investment and risk management approaches for the Funds. The Trustees considered that the Adviser
supervises and monitors the performance of the Sub-Adviser. The most recent investment adviser registration forms (“Form ADV”) for the Adviser and the Sub-Adviser were available to the Board, as were the responses of the Adviser and the Sub-Adviser
to a detailed series of questions which included, among other things, information about the investment advisory services provided by the Adviser and the Sub-Adviser to the Funds.
The Trustees also considered other services provided to the Funds by the Adviser and the Sub-Adviser such as selecting broker-dealers for executing portfolio transactions,
monitoring adherence to the Funds’ investment restrictions, and monitoring compliance with various Fund policies and procedures and with applicable securities laws and regulations. Based on the factors above, as well as those discussed below, the
Board concluded, within the context of its full deliberations, that the nature, extent and quality of the services provided to the Funds by the Adviser and the Sub-Adviser were sufficient to support renewal of the Agreements.
Investment Performance of the Funds, the Adviser and the Sub-Adviser
The Board was provided with regular reports regarding the Funds’ performance over various time periods. The Trustees also reviewed reports prepared by the Funds’ administrator
comparing the Funds’ performance to their benchmark indices and peer groups of mutual funds as classified by Lipper, an independent provider of investment company data, over various periods of time. Representatives from the Adviser and the
Sub-Adviser provided information regarding and led discussions of factors impacting the performance of the Funds, outlining current market conditions and explaining their expectations and strategies for the future. The Trustees determined that the
Funds’ performance was satisfactory, or, where the Funds’ performance was materially below their benchmarks and/or peer groups, the Trustees were satisfied by the reasons for
|
Schroder Mutual Funds
|
Information Regarding Review and Approval of Investment Advisory Contracts (unaudited)
the underperformance and/or the steps taken by the Adviser and the Sub-Adviser in an effort to improve the performance of the Funds. Based on this information, the Board
concluded, within the context of its full deliberations, that the investment results that the Adviser and the Sub-Adviser had been able to achieve for the Funds were sufficient to support renewal of the Agreements.
Costs of Advisory Services, Profitability and Economies of Scale
In considering the advisory fees payable by the Funds to the Adviser, as well as the fees payable by the Adviser to the Sub-Adviser, the Trustees reviewed, among other things, a
report of the advisory fees paid to the Adviser and the Sub-Adviser. The Trustees also reviewed reports prepared by the Funds’ administrator comparing the Funds’ net and gross expense ratios and advisory fees to those paid by peer groups of mutual
funds as classified by Lipper. The Trustees reviewed the management fees charged by the Adviser and the Sub-Adviser to other clients with comparable mandates. The Trustees considered any differences in management fees and took into account the
respective demands, resources and complexity associated with the Funds and other client accounts as well as the extensive regulatory, compliance and tax regimes to which the Funds are subject. The Trustees also considered that the Adviser, not the
Schroder Emerging Markets Small Cap Fund and the Schroder North American Equity Fund, paid the Sub-Adviser pursuant to the sub-advisory agreements. The Trustees evaluated both the fees under the sub-advisory agreements and the portion of the fees
under the advisory agreements retained by the Adviser. The Board concluded, within the context of its full deliberations, that the advisory fees were reasonable in light of the nature and quality of the services rendered by the Adviser and the
Sub-Adviser.
The Trustees reviewed the costs of services provided by and the profits realized by the Adviser and the Sub-Adviser from their relationship with the Funds, including both direct
benefits and indirect benefits, such as research and brokerage services received under soft dollar arrangements, accruing to the Adviser and the Sub-Adviser and their affiliates. The Trustees considered how the Adviser’s and the Sub-Adviser’s
profitability was affected by factors such as their organizational structures and methods for allocating expenses. The Trustees concluded that the profit margins of the Adviser and the Sub-Adviser with respect to the management of the Funds were not
unreasonable. The Board also considered the Adviser’s and the Sub-Adviser’s commitment to managing the Funds and the Adviser’s willingness to continue its expense limitation and fee waiver arrangements with the Schroder Emerging Markets Small Cap
Fund, the Schroder Long Duration Investment-Grade Bond Fund, the Schroder Short Duration Bond Fund, the Schroder Total Return Fixed Income Fund and the Schroder Core Bond Fund.
The Trustees considered the Adviser’s and Sub-Adviser’s views relating to economies of scale in connection with the Funds as Fund assets grow and the extent to which the
benefits of any such economies of scale are shared with the Funds and Fund shareholders. The Board considered the existence of any economies of scale and whether those were passed along to the Funds’ shareholders through a graduated advisory fee
schedule or other means, including fee waivers. The Trustees recognized that economies of scale are difficult to identify and quantify and are rarely identifiable on a fund-by-fund basis. Based on this evaluation, the Board concluded that the
advisory fees were reasonable in light of the information that was provided to the Trustees by the Adviser and the Sub-Adviser with respect to economies of scale.
Renewal of the Agreements
Based on the Board’s deliberations and its evaluation of the information described above and other factors and information it believed relevant in the exercise of its reasonable
business judgment, the Board, including all of the Independent Trustees, with the assistance of Fund counsel and Independent Trustees’ counsel, unanimously concluded that the terms of the Agreements, including the fees payable thereunder, were fair
and reasonable and agreed to renew the Agreements for another year. In its deliberations, the Board did not identify any absence of information as material to its decision, or any particular factor (or conclusion with respect thereto) or single piece
of information that was all-important, controlling or determinative of its decision, but considered all of the factors together, and each Trustee may have attributed different weights to the various factors (and conclusions with respect thereto) and
information.
|
Schroder Mutual Funds
|
Information Regarding Review and Approval of Investment Advisory Contracts (unaudited)
APPROVAL OF INVESTMENT SUB-ADVISORY AGREEMENT FOR THE SCHRODER LONG DURATION INVESTMENT-GRADE BOND FUND, THE SCHRODER SHORT DURATION BOND FUND, THE SCHRODER TOTAL RETURN FIXED
INCOME FUND AND THE SCHRODER CORE BOND FUND
Pursuant to Section 15 of the Investment Company Act of 1940 (the “1940 Act”), the Funds’ sub-advisory agreements must be approved by the vote of a majority of the members of
the Board of Trustees (the “Board” or the “Trustees”) of Schroder Series Trust (the “Trust”) who are not parties to the sub-advisory agreement or “interested persons” of any party thereto, as defined in the 1940 Act (the “Independent Trustees”), cast
in person at a meeting called for the purpose of voting on such approval.
A Board meeting was held on September 12, 2019 to decide whether to approve a Sub-Advisory Agreement between Schroder Investment Management North America Inc. (the “Adviser”),
Schroder Investment Management North America Ltd. (the “Sub-Adviser”), and the Trust, on behalf of the Schroder Long Duration Investment-Grade Bond Fund, the Schroder Short Duration Bond Fund, the Schroder Total Return Fixed Income Fund and the
Schroder Core Bond Fund (the “Sub-Advisory Agreement”) for an initial two-year term.
In preparation for the meeting, the Trustees requested that the Adviser and the Sub-Adviser furnish information necessary to evaluate the terms of the Sub-Advisory Agreement.
The Trustees used this information, as well as other information that the Adviser, the Sub-Adviser and other service providers of the Funds presented or submitted to the Board at the meeting, to help them decide whether to approve the Sub-Advisory
Agreement for an initial two-year term.
Specifically, the Board requested and received written materials from the Adviser, the Sub-Adviser and other service providers of the Funds regarding: (i) the nature, extent and
quality of the services to be provided by the Sub-Adviser; (ii) the Sub-Adviser’s investment management personnel, including Andrew B.J. Chorolton, a portfolio manager of each Fund since the Fund’s inception, who was departing the Adviser and
becoming associated with the Sub-Adviser; (iii) Mr. Chorolton’s role with respect to the Funds; (iv) the Sub-Adviser’s operations; (v) the Sub-Adviser’s brokerage practices (including any soft dollar arrangements) and investment strategies; (vi) the
proposed sub-advisory fees to be paid to the Sub-Adviser (vii) the Sub-Adviser’s compliance program, including a description of material compliance matters and material compliance violations; (viii) the Sub-Adviser’s policies on and compliance
procedures for personal securities transactions; (iv) the Sub-Adviser’s investment experience; and (x) the Adviser’s rationale for recommending the Sub-Adviser.
Representatives from the Adviser and the Sub-Adviser, along with other Fund service providers, presented additional information and participated in question and answer sessions
at the meeting to help the Trustees evaluate the Sub-Adviser’s services, fees and other aspects of the Sub-Advisory Agreement. The Independent Trustees received advice from independent counsel and met in executive session outside the presence of Fund
management, the Adviser and the Sub-Adviser.
At the Board meeting, the Trustees, including all of the Independent Trustees, based on their evaluation of the information provided by the Adviser, the Sub-Adviser and other
service providers of the Funds, approved the Sub-Advisory Agreement. In considering the approval of the Sub-Advisory Agreement, the Board considered various factors that they determined were relevant, including: (i) the nature, extent and quality of
the services to be provided by the Sub-Adviser; and (ii) the fees to be paid to the Sub-Adviser, as discussed in further detail below.
Nature, Extent and Quality of Services to be Provided by the Sub-Adviser
In considering the nature, extent and quality of the services to be provided by the Sub-Adviser, the Board reviewed the portfolio management services to be provided by the
Sub-Adviser to the Funds, including the quality and continuity of the Sub-Adviser’s portfolio management personnel, the resources of the Sub-Adviser and the Sub-Adviser’s compliance history and compliance program. The Trustees reviewed the terms of
the proposed Sub-Advisory Agreement. The Trustees also reviewed the Sub-Adviser’s proposed
|
Schroder Mutual Funds
|
Information Regarding Review and Approval of Investment Advisory Contracts (unaudited)
investment and risk management approaches for the Funds. The Trustees considered that the Adviser would supervise and monitor the performance of the Sub-Adviser. The most recent
investment adviser registration form (“Form ADV”) for the Sub-Adviser was available to the Board, as was the response of the Sub-Adviser to a detailed series of questions which included, among other things, information about the investment
sub-advisory services to be provided by the Sub-Adviser to the Funds.
The Trustees also considered other services to be provided to the Funds by the Sub-Adviser such as selecting broker-dealers for executing portfolio transactions, monitoring
adherence to the Fund’s investment restrictions, and monitoring compliance with various Fund policies and procedures and with applicable securities laws and regulations. Based on the factors above, as well as those discussed below, the Board
concluded, within the context of its full deliberations, that the nature, extent and quality of the services to be provided to the Funds by the Sub-Adviser would be satisfactory.
Costs of Advisory Services
In considering the sub-advisory fees payable by the Adviser to the Sub-Adviser, the Trustees reviewed, among other things, a report of the proposed sub-advisory fees to be paid
to the Sub-Adviser. The Trustees also considered that the Adviser, not the Funds, would pay the Sub-Adviser pursuant to the Sub-Advisory Agreement. The Trustees evaluated both the fee that would be payable under the Sub-Advisory Agreement and the
portion of the fee under the advisory agreement that would be retained by the Adviser. The Board concluded, within the context of its full deliberations,that the sub-advisory fees were reasonable in light of the nature and quality of the services
expected to be rendered by the Sub-Adviser.
Investment Performance, Profitability and Economies of Scale
Because the Sub-Adviser is new to the Funds and has not managed Fund assets, it did not yet have an investment performance record with respect to the Funds, and it was not
possible to determine the profitability that the Sub-Adviser might achieve with respect to the Funds or the extent to which economies of scale would be realized by the Sub-Adviser as the assets of the Funds grow. Accordingly, the Trustees did not
make any conclusions regarding the Sub-Adviser’s investment performance with respect to the Funds, the Sub-Adviser’s profitability, or the extent to which economies of scale would be realized by the Sub-Adviser as the assets of the Funds grow, but
will do so during future considerations of the Sub-Advisory Agreement.
Approval of the Sub-Advisory Agreement
Based on the Board’s deliberations and its evaluation of the information described above and other factors and information it believed relevant in the exercise of its reasonable
business judgment, the Board, including all of the Independent Trustees, with the assistance of Fund counsel and Independent Trustees’ counsel, unanimously concluded that the terms of the Sub-Advisory Agreement, including the fees to be paid
thereunder, were fair and reasonable and agreed to approve the Sub-Advisory Agreement for an initial term of two years. In its deliberations, the Board did not identify any absence of information as material to its decision, or any particular factor
(or conclusion with respect thereto) or single piece of information that was all-important, controlling or determinative of its decision, but considered all of the factors together, and each Trustee may have attributed different weights to the
various factors (and conclusions with respect thereto) and information.
|
Schroder Mutual Funds
|
Disclosure of Fund Expenses (unaudited)
We believe it is important for you to understand the impact of fees regarding your investment. All mutual funds have operating expenses. As a shareholder of a Schroder Mutual
Fund, you incur ongoing costs, which include, among others, costs for portfolio management, administrative services, and shareholder reports (like this one), and in the case of Advisor Shares, distribution (12b-1) fees. Operating expenses, which are
deducted from a fund’s gross income, directly reduce the investment return of the fund. A fund’s expenses are expressed as a percentage of its average net assets. This figure is known as the expense ratio. The following examples are intended to help
you understand the ongoing costs (in dollars) of investing in your Fund and to compare these costs with those of other mutual funds. The examples are based on an investment of $1,000 made at the beginning of the period shown and held for the entire
period (May 1, 2019 to October 31, 2019).
The table below illustrates your Fund’s costs in two ways.
● Actual expenses. This section helps you to estimate the actual expenses after fee waivers, if
applicable, that you paid over the period. The “Ending Account Value” shown is derived from the Fund’s actual return, and the fourth column shows the dollar amount that would have been paid by an investor who started with $1,000 in the Fund. You may
use the information here, together with the amount you invested, to estimate the expenses that you paid over the period.
To do so, simply divide your account value by $1,000 (for example, an $8,600 account value divided by $1,000 = 8.6), then multiply the result by the number
given for your Fund under the heading “Expenses Paid During Period.”
● Hypothetical example for comparison purposes. This
section is intended to help you compare your Fund’s costs with those of other mutual funds. It assumes that the Fund had a return of 5% before expenses during the year, and that it incurred expenses at the rate of which it in the past did incur
expenses. In this case, because the return used is not the Fund’s actual return, the results may not be used to estimate the actual ending balance of an account in the Fund over the period or expenses you actually paid. The example is useful in
making comparisons because the Securities and Exchange Commission requires all mutual funds to calculate expenses in this table based on a 5% return. You can assess your Fund’s costs by comparing this hypothetical example with the hypothetical
examples that appear in shareholder reports of other funds.
Please note that the expenses shown in the table are meant to highlight and help you compare ongoing costs only and do not reflect any transactional costs such as redemption
fees, which are described in the Prospectus. If this fee were applied to your account, your costs would be higher.
|
Schroder Mutual Funds
|
Disclosure of Fund Expenses (unaudited) – (concluded)
|
Beginning
Account Value 5/1/19 |
Ending
Account Value 10/31/19 |
Net
Annualized Expense Ratios |
Expenses
Paid During Period* |
|||||||||||||
|
Schroder North American Equity Fund
|
||||||||||||||||
|
Actual Expenses
|
||||||||||||||||
|
Investor Shares
|
$
|
1,000.00
|
$
|
1,027.80
|
0.33
|
%
|
$
|
1.69
|
||||||||
|
Hypothetical Example for Comparison Purposes
|
||||||||||||||||
|
Investor Shares
|
$
|
1,000.00
|
$
|
1,023.54
|
0.33
|
%
|
$
|
1.68
|
||||||||
|
Schroder Emerging Markets Small Cap Fund
|
||||||||||||||||
|
Actual Expenses
|
||||||||||||||||
|
R6 Shares
|
$
|
1,000.00
|
$
|
1,020.90
|
1.35
|
%
|
$
|
6.88
|
||||||||
|
Investor Shares
|
1,000.00
|
1,021.80
|
1.35
|
6.88
|
||||||||||||
|
Hypothetical Example for Comparison Purposes
|
||||||||||||||||
|
R6 Shares
|
$
|
1,000.00
|
$
|
1,018.40
|
1.35
|
$
|
6.87
|
|||||||||
|
Investor Shares
|
1,000.00
|
1,018.40
|
1.35
|
6.87
|
||||||||||||
|
Schroder Core Bond Fund
|
||||||||||||||||
|
Actual Expenses
|
||||||||||||||||
|
R6 Shares
|
$
|
1,000.00
|
$
|
1,055.70
|
0.32
|
%
|
$
|
1.66
|
||||||||
|
Hypothetical Example for Comparison Purposes
|
||||||||||||||||
|
R6 Shares
|
$
|
1,000.00
|
$
|
1,023.59
|
0.32
|
$
|
1.63
|
|||||||||
|
Schroder Long Duration Investment-Grade Bond Fund
|
||||||||||||||||
|
Actual Expenses
|
||||||||||||||||
|
Investor Shares
|
$
|
1,000.00
|
$
|
1,140.60
|
0.32
|
%
|
$
|
1.73
|
||||||||
|
Hypothetical Example for Comparison Purposes
|
||||||||||||||||
|
Investor Shares
|
$
|
1,000.00
|
$
|
1,023.59
|
0.32
|
$
|
1.63
|
|||||||||
|
Schroder Short Duration Bond Fund
|
||||||||||||||||
|
Actual Expenses
|
||||||||||||||||
|
R6 Shares
|
$
|
1,000.00
|
$
|
1,022.00
|
0.32
|
%
|
$
|
1.63
|
||||||||
|
Investor Shares
|
1,000.00
|
1,022.00
|
0.32
|
1.63
|
||||||||||||
|
Hypothetical Example for Comparison Purposes
|
||||||||||||||||
|
R6 Shares
|
$
|
1,000.00
|
$
|
1,023.59
|
0.32
|
$
|
1.63
|
|||||||||
|
Investor Shares
|
1,000.00
|
1,023.59
|
0.32
|
1.63
|
||||||||||||
|
Schroder Total Return Fixed Income Fund
|
||||||||||||||||
|
Actual Expenses
|
||||||||||||||||
|
Investor Shares
|
$
|
1,000.00
|
$
|
1,055.40
|
0.40
|
%
|
$
|
2.07
|
||||||||
|
Hypothetical Example for Comparison Purposes
|
||||||||||||||||
|
Investor Shares
|
$
|
1,000.00
|
$
|
1,023.19
|
0.40
|
$
|
2.04
|
|||||||||
| * |
Expenses are equal to the Fund’s annualized expense ratio multiplied by the average account value over the account period, multiplied by 184/365 (to reflect the one-half year period).
|
|
Schroder Mutual Funds
|
Trustees and Officers (unaudited)
Set forth below are the names, years of birth, positions with the Trust, length of term of office, and the principal occupations for the last five years of each of the persons
currently serving as Trustees and Officers of the Trust. Unless otherwise noted, the business address of each Trustee is SEI Investments Company, 1 Freedom Valley Drive, Oaks, Pennsylvania 19456. Trustees who are deemed not to be “interested persons”
of the Trust are referred to as “Independent Trustees.” Mr. Doran is a Trustee who may be deemed to be “interested” persons of the Trust as that term is defined in the 1940 Act by virtue of his affiliation with the Trust’s Distributor. The Trust’s
Statement of Additional Information (“SAI”) includes additional information about the Trustees and Officers. The SAI may be obtained without charge by calling 1-800-464-3108. The following chart lists Trustees and Officers as of October 31, 2019.
|
Name and
Year of Birth |
Position with
Trust and Length of Time Served1 |
Principal Occupations
in the Past 5 Years |
Other Directorships Held in the Past 5 Years4
|
|
INTERESTED TRUSTEE2,3
|
|||
|
WILLIAM M.
DORAN (Born: 1940) |
Chairman of the Board of Trustees (Since 2014)
|
Self-Employed Consultant since 2003. Partner at Morgan, Lewis & Bockius LLP (law firm) from 1976 to 2003. Counsel to the Trust, SEI Investments, SIMC, the Administrator and the Distributor.
Secretary of SEI Investments since 1978.
|
Current Directorships: Trustee of Gallery Trust, The Advisors’ Inner Circle Fund III, SEI Daily Income Trust, SEI Institutional International Trust, SEI Institutional Investments Trust, SEI
Institutional Managed Trust, SEI Asset Allocation Trust, SEI Tax Exempt Trust, Adviser Managed Trust, New Covenant Funds, SEI Insurance Products Trust and SEI Catholic Values Trust. Director of SEI Investments, SEI Investments (Europe),
Limited, SEI Investments—Global Funds Services, Limited, SEI Investments Global, Limited, SEI Investments (Asia), Limited, SEI Global Nominee Ltd., SEI Investments – Unit Trust Management (UK) Limited and SEI Investments Co. Director of the
Distributor.
Former Directorships: Trustee of O’Connor EQUUS (closed-end investment company) to 2016. Trustee of SEI Liquid Asset Trust to 2016. Trustee of Winton Series Trust to 2017. Trustee of The
Advisors’ Inner Circle Fund, The Advisors’ Inner Circle Fund II, Bishop Street Funds, The KP Funds and Winton Diversified Opportunities Fund (closed-end investment company) to 2018.
|
|
INDEPENDENT TRUSTEES3
|
|||
|
JOHN C. HUNT
(Born: 1951)
|
Trustee and Lead Independent Trustee (Since 2014)
|
Retired since 2013. Consultant to Management, Convergent Capital Management, LLC (“CCM”) from 2012 to 2013. Managing Director and Chief Operating Officer, CCM from 1998 to 2012.
|
Current Directorships: Trustee of City National Rochdale Funds, The Advisors’ Inner Circle Fund III, and Gallery Trust.
Former Directorships: Trustee of O’Connor EQUUS (closed-end investment company) to 2016. Member of Independent Committee of Nuveen Commodities Asset Management to 2016. Trustee of Winton Series
Trust to 2017. Trustee of Winton Diversified Opportunities Fund (closed-end investment company) to 2018.
|
| 1 |
Each Trustee shall hold office during the lifetime of this Trust until the election and qualification of his or her successor, or until he or she sooner dies, resigns, or is removed in
accordance with the Trust’sDeclaration of Trust.
|
| 2 |
Denotes Trustees who may be deemed to be “interested” persons of the Fund as that term is defined in the 1940 Act by virtue of their affiliation with the Distributor and/or its affiliates.
|
| 3 |
Trustees oversee 6 funds in fund complex of Schroder Series Trust and Schroder Global Series Trust.
|
| 4 |
Directorships of Companies required to report to the Securities and Exchange Commission under the Securities Exchange Act of 1934 (i.e., “public companies”) or other investment companies
under the 1940 Act.
|
|
Schroder Mutual Funds
|
Trustees and Officers (unaudited)
|
Name and
Year of Birth |
Position with Trust and Length of Time Served1
|
Principal Occupations
in the Past 5 Years |
Other Directorships Held in the Past 5 Years3
|
|
INDEPENDENT TRUSTEES2
|
|||
|
THOMAS P. LEMKE
(Born: 1954)
|
Trustee
(Since 2014) |
Retired since 2013. Executive Vice President and General Counsel,
Legg Mason, Inc. from 2005 to 2013. |
Current Directorships: Trustee of The Advisors’ Inner Circle Fund III, Gallery Trust, JP Morgan Active Exchange-Traded Funds and Symmetry Panoramic Trust.
Former Directorships: Trustee of Munder Funds to 2014. Trustee of Victory Funds to 2015. Trustee of O’Connor EQUUS (closed-end investment company) to 2016. Trustee of Winton Series Trust and AXA
Premier VIP Trust to 2017. Trustee of Winton Diversified Opportunities Fund (closed-end investment company) to 2018.
|
|
JAY C. NADEL
(Born: 1958) |
Trustee
(Since 2016) |
Self-Employed Consultant since 2004. Executive Vice President, Bank of New York Broker Dealer from 2002 to 2004. Partner/Managing Director, Weiss Peck & Greer/Robeco from 1986 to 2001.
|
Current Directorships: Trustee of City National Rochdale Funds, The Advisors’ Inner Circle Fund III and Gallery Trust.
Former Directorships: Trustee of Winton Series Trust to 2017. Director of Lapolla Industries, Inc. to 2017. Trustee of Winton Diversified Opportunities Fund (closed-end investment company) to
2018.
|
|
RANDALL S. YANKER
(Born: 1960)
|
Trustee
(Since 2014) |
Co-Founder and Senior Partner, Alternative Asset Managers, L.P.
since 2004. |
Current Directorships: Trustee of The Advisors’ Inner Circle Fund III and Gallery Trust. Independent Non-Executive Director of HFA Holdings Limited.
Former Directorships: Trustee of O’Connor EQUUS (closed-end investment company) to 2016. Trustee of Winton Series Trust to 2017. Trustee of Winton Diversified Opportunities Fund (closed-end
investment company) to 2018.
|
|
OFFICERS
|
|||
|
MICHAEL BEATTIE
(Born: 1965)
|
President
(Since 2014) |
Director of Client Service, SEI Investments Company, since 2004.
|
None.
|
|
JAMES BERNSTEIN
(Born: 1962)
|
Vice President and Assistant Secretary (Since 2017)
|
Attorney, SEI Investments, since 2017.
Prior Positions: Self-employed consultant, 2017. Associate General Counsel & Vice President, Nationwide Funds Group and Nationwide Mutual Insurance Company, from 2002 to 2016. Assistant
General Counsel & Vice President, Market Street Funds and Provident Mutual Insurance Company, from 1999 to 2002.
|
None.
|
| 1 |
Each Trustee shall hold office during the lifetime of this Trust until the election and qualification of his or her successor, or until he or she sooner dies, resigns, or is removed in
accordance with the Trust’sDeclaration of Trust.
|
| 2 |
Trustees oversee 6 funds in fund complex of Schroder Series Trust and Schroder Global Series Trust.
|
| 3 |
Directorships of Companies required to report to the Securities and Exchange Commission under the Securities Exchange Act of 1934 (i.e., “public companies”) or other investment companies
under the 1940 Act.
|
|
Schroder Mutual Funds
|
Trustees and Officers (unaudited)
|
Name and
Year of Birth |
Position with
Trust and Length of Time Served |
Principal Occupations in Past 5 Years
|
Other Directorships
Held by Officer |
|
OFFICERS
|
|||
|
JOHN BOURGEOIS
(Born: 1973)
|
Assistant Treasurer (Since 2017)
|
Fund Accounting Manager, SEI Investments, since 2000.
|
None.
|
|
STEPHEN CONNORS
(Born: 1984)
|
Treasurer, Controller and Chief Financial Officer (Since 2015)
|
Director, SEI Investments, Fund Accounting, since 2014. Audit Manager, Deloitte & Touche LLP, from 2011 to 2014.
|
None.
|
|
DIANNE M. DESCOTEAUX
(Born: 1977) |
Vice President
and Secretary (Since 2014) |
Counsel at SEI Investments since 2010. Associate at Morgan, Lewis & Bockius LLP, from 2006 to 2010.
|
None.
|
|
RUSSELL EMERY
(Born: 1962) |
Chief Compliance Officer (Since 2014)
|
Chief Compliance Officer of SEI Structured Credit Fund, LP since 2007. Chief Compliance Officer of The Advisors’ Inner Circle Fund, The Advisors’ Inner Circle Fund II, Bishop Street Funds, The
KP Funds, The Advisors’ Inner Circle Fund III, Gallery Trust, Schroder Series Trust, Schroder Global Series Trust, SEI Institutional Managed Trust, SEI Asset Allocation Trust, SEI Institutional International Trust, SEI Institutional
Investments Trust, SEI Daily Income Trust, SEI Tax Exempt Trust, Adviser Managed Trust, New Covenant Funds, SEI Insurance Products Trust and SEI Catholic Values Trust. Chief Compliance Officer of O’Connor EQUUS (closed-end investment company)
to 2016. Chief Compliance Officer of SEI Liquid Asset Trust to 2016. Chief Compliance Officer of Winton Series Trust to 2017. Chief Compliance Officer of Winton Diversified Opportunities Fund (closed-end investment company) to 2018.
|
None.
|
|
MATTHEW M. MAHER
(Born: 1975)
|
Vice President and Assistant Secretary (Since 2018)
|
Counsel at SEI Investments since 2018. Attorney, Blank Rome LLP, from 2015 to 2018. Assistant Counsel & Vice President, Bank of New York Mellon, from 2013 to 2014. Attorney, Dilworth Paxson
LLP, from 2006 to 2013.
|
None.
|
|
ROBERT MORROW
(Born: 1968)
|
Vice President
(Since 2017) |
Account Manager, SEI Investments, since 2007.
|
None.
|
|
BRIDGET E. SUDALL
(Born: 1980)
|
Privacy Officer
(Since 2015) Anti-Money Laundering Officer (Since 2015)
|
Senior Associate and AML Officer, Morgan Stanley Alternative Investment Partners, from 2011 to 2015. Investor Services Team Lead, Morgan Stanley Alternative Investment Partners, from 2007 to
2011.
|
None.
|
|
Schroder Mutual Funds
|
Notice to Shareholders (unaudited)
For shareholders that do not have an October 31, 2019 tax year end, this notice is for informational purposes only. For shareholders with an October 31, 2019 tax year end,
please consult your tax advisor as to the pertinence of this notice. For the fiscal year ended October 31, 2019, each Fund has designated the following items with regard to distributions paid during the year.
|
Return of Capital
|
Long Term Capital Gain Distribution
|
Ordinary Income Distributions
|
Total Distributions
|
Qualifying For Corporate Dividends Rec. Deductions(1)
|
Qualifying Dividend Income(2)
|
U.S. Government Interest(3)
|
Interest Related Dividends(4)
|
Short-Term Capital Gain Dividends(5)
|
Foreign
Tax Credit |
|||||||||||||||||||||||||||||||
|
Schroder North American Equity Fund
|
0.00
|
%
|
67.11
|
%
|
32.89
|
%
|
100.00
|
%
|
71.62
|
%
|
76.23
|
%
|
0.00
|
%
|
0.00
|
%
|
100.00
|
%
|
0.00
|
%
|
||||||||||||||||||||
|
Schroder Emerging Markets Small Cap Fund (a)
|
0.00
|
%
|
57.50
|
%
|
42.50
|
%
|
100.00
|
%
|
10.67
|
%
|
72.72
|
%
|
0.00
|
%
|
0.00
|
%
|
00.00
|
%
|
5.13
|
%
|
||||||||||||||||||||
|
Schroder Core Bond Fund
|
0.00
|
%
|
0.00
|
%
|
100.00
|
%
|
100.00
|
%
|
0.00
|
%
|
0.00
|
%
|
0.00
|
%
|
0.00
|
%
|
0.00
|
%
|
0.00
|
%
|
||||||||||||||||||||
|
Schroder Long Duration Investment-Grade Bond Fund
|
0.00
|
%
|
0.00
|
%
|
100.00
|
%
|
100.00
|
%
|
0.00
|
%
|
0.00
|
%
|
0.00
|
%
|
0.00
|
%
|
0.00
|
%
|
0.00
|
%
|
||||||||||||||||||||
|
Schroder Short Duration Bond Fund
|
0.00
|
%
|
0.00
|
%
|
100.00
|
%
|
100.00
|
%
|
0.00
|
%
|
0.00
|
%
|
0.00
|
%
|
0.00
|
%
|
0.00
|
%
|
0.00
|
%
|
||||||||||||||||||||
|
Schroder Total Return Fixed Income
|
3.96
|
%
|
0.00
|
%
|
96.04
|
%
|
100.00
|
%
|
0.00
|
%
|
0.00
|
%
|
0.00
|
%
|
0.00
|
%
|
0.00
|
%
|
0.00
|
%
|
||||||||||||||||||||
| (1) |
Qualifying dividends represent dividends which qualify for the corporate dividend received deduction and is reflected as a percentage of “Ordinary Income Distributions”.
|
| (2) |
The percentage in this column represents the amount of “Qualifying Dividend Income” as created by the Jobs and Growth Tax Relief Reconciliation Act of 2003 and is reflected as a percentage
of “Ordinary Income Distributions”. It is the intention of each of the aforementioned funds to designate the maximum amount permitted by law.
|
| (3) |
“U.S. Government Interest” represents the amount of interest that was derived from direct U.S. Government Obligations and distributed during the fiscal year. This amount is reflected as a
percentage of total ordinary income. Generally, interest from direct U.S. Government Obligations is exempt from state income tax. However, for shareholders who are residents of California, Connecticut and New York, the statutory threshold
requirements were not satisfied to permit exemption of these amounts from state income.
|
| (4) |
The percentage in this column represents the amount of “Interest Related Dividends” as created by the American Jobs Creation Act of 2004 and is reflected as a percentage of net investment
income distributions that are exempt from U.S. withholding tax when paid to foreign investors.
|
| (5) |
The percentage in this column represents the amount of “Short-Term Capital Gain Dividends” as created by the American Job Creation Act of 2004 and is reflected as a percentage of short-term
capital gain distributions that are exempt from U.S. withholding tax when paid to foreign investors.
|
| (a) |
The Schroder Emerging Markets Small Cap Fund intends to pass through a Foreign Tax Credit to shareholders. For fiscal year ended 2019, the total amount of foreign source gross income is
$36,987. The total amount of foreign tax paid is $6,031. Your allocation share of the foreign tax credit will be reported on Form 1099-DIV.
|
|
Notes
|
|
|
86 |
|
Notes
|
|
|
87 |
|
Privacy Statement
|
|
FACTS
|
WHAT DOES SCHRODERS DO WITH YOUR PERSONAL INFORMATION?
|
|
Why?
|
Financial companies choose how they share your personal information. Federal law gives consumers the right to limit some but not all sharing. Federal law also requires us to
tell you how we collect, share, and protect your personal information. Please read this notice carefully to understand what we do.
|
|
What?
|
The types of personal information we collect and share depend on the product or service you have with us.
This information can include: • Social Security number and income
• account balances and account transactions
• assets and investment experience
When you are no longer our customer, we continue to share your information as described in this notice.
|
|
How?
|
All financial companies need to share clients’ personal information to run their everyday business. In the section below, we list the reasons financial companies can
share their clients’ personal information; the reasons Schroders chooses to share; and whether you can limit this sharing.
|
|
Reasons we can share your personal information
|
Does Schroders share?
|
Can you limit this sharing?
|
|
For our everyday business purposes — such as to process your transactions, maintain your account(s), or respond to court orders and legal
investigations
|
Yes
|
No
|
|
For our marketing purposes — to offer our products and services to you
|
Yes
|
No
|
|
For joint marketing with other financial companies
|
No
|
We Don’t Share
|
|
For our affiliates’ everyday business purposes — information about your transactions and experiences
|
Yes
|
No
|
|
For our affiliates’ everyday business purposes — information about your creditworthiness
|
No
|
We Don’t Share
|
|
For nonaffiliates to market to you
|
No
|
We Don’t Share
|
|
Questions?
|
For Schroder Mutual Funds, call DST AMS at (800) 464-3108.
For other inquiries, call Institutional Client Service at (212) 641-3800 or email clientserviceny@us.schroders.com
|
|
Privacy Statement
|
|
Who we are
|
|
|
Who is providing this notice?
|
• Schroder Investment Management North America Inc.
• Schroder Mutual Funds
• Schroder Fund Advisors LLC
|
|
What we do
|
|
|
How does Schroders protect my personal information?
|
To protect your personal information from unauthorized access and use, we use security measures that comply with federal law. These measures include computer safeguards
and secured files and buildings.
Access to personal information is limited to employees who need it to perform their jobs. Our policies restrict employee use of customer information; requiring it be held
in strict confidence.
|
|
How does Schroders collect my personal information?
|
We collect your personal information, for example, when you
• open an account and provide account information
• give us your contact information
• show your driver’s license or government issued ID
• enter into an investment advisory contract
• make a wire transfer
|
|
Why can’t I limit all sharing?
|
Federal law gives you the right to limit only
• sharing for affiliates’ everyday business purposes—information about your creditworthiness
• affiliates from using your information to market to you
• sharing for nonaffiliates to market to you
State laws and individual companies may give you additional rights to limit sharing.
|
|
Definitions
|
|
|
Affiliates
|
Companies related by common ownership or control. They can be financial and nonfinancial companies.
• Our affiliates include companies with the Schroder name; financial companies such as Schroder Investment
Management North America Limited and Schroder Investment Management Limited; and others, such as the parent, holding company, Schroders plc.
|
|
Nonaffiliates
|
Companies not related by common ownership or control. They can be financial and nonfinancial companies.
• Nonaffiliates we share with can include companies that help us maintain, process or service your transactions
or account(s) or financial products, including companies that perform administrative, accounting, transfer agency, custodial, brokerage or proxy solicitation services, or that assist us in marketing.
|
|
Joint marketing
|
A formal agreement between nonaffiliated financial companies that together market financial products or services to you.
• Schroders doesn’t jointly market.
|
|
|
|
Investment Adviser
|
Schroder Investment Management North America Inc.
7 Bryant Park
New York, NY 10018-3706
|
|
|
Trustees
|
William M. Doran
Jon C. Hunt
Thomas P. Lemke
Randall S. Yanker
Jay C. Nadel
|
|
|
Distributor
|
SEI Investments Distribution Co.
1 Freedom Valley Drive
Oaks, Pennsylvania 19456
|
|
|
Transfer & Shareholder Servicing Agent
|
DST Asset Manager Solutions, Inc.
|
|
|
Custodian
|
JPMorgan Chase Bank
|
|
|
Counsel
|
Morgan, Lewis & Bockius LLP
|
|
|
Independent Registered Public Accounting Firm
|
PricewaterhouseCoopers LLP
|
|
|
This report is transmitted to shareholders only. It is not authorized for use as an offer of sale or a solicitation of an offer to buy shares of a Fund unless accompanied
or preceded by that Fund’s current prospectus. Past performance results shown in this report should not be considered a representation of future performance. Investment returns and principal value of shares will fluctuate so
that shares, when redeemed, may be worth more or less than their original cost. Statements and other information herein are as dated and are subject to change.
|
||
|
Schroder Series Trust
Schroder Global Series Trust
P.O. Box 219360
Kansas City, MO 64121-9360
(800) 464-3108
|
SCH-AR-001-0300
Item 2. Code of Ethics.
The Registrant has adopted a code of ethics that applies to the Registrant’s principal executive officer, principal financial officer, controller or principal accounting officer, and any person who
performs a similar function. There have been no amendments to or waivers granted to this code of ethics.
Item 3. Audit Committee Financial Expert.
(a)(1) The Registrant’s board of trustees has determined that the Registrant has at least one audit committee financial expert serving on the audit committee.
(a)(2) The audit committee financial experts are Thomas Lemke and Jay Nadel, and each of Mr. Lemke and Mr. Nadel is considered to be “independent” as that term is defined in Form
N-CSR Item 3(a)(2).
Item 4. Principal Accountant Fees and Services.
Fees billed by PricewaterhouseCoopers LLP (“PwC”) relate to the Schroder Global Series Trust (the “Trust”).
PwC billed the Trust aggregate fees for services rendered to the Trust for the last two fiscal years as follows:
|
2019
|
2018
|
||||||
|
All fees and services to the Trust that were pre-approved
|
All fees and services to service affiliates that were pre-approved
|
All other fees and services to service affiliates that did not require pre-approval
|
All fees and services to the Trust that were pre-approved
|
All fees and services to service affiliates that were pre-approved
|
All other fees and services to service affiliates that did not require pre-approval
|
||
|
(a)
|
Audit Fees(1)
|
$24,400
|
$0
|
$0
|
$24,400
|
$0
|
$0
|
|
(b)
|
Audit-Related Fees
|
$0
|
$0
|
$0
|
$0
|
$0
|
$0
|
|
(c)
|
Tax Fees
|
$0
|
$0
|
$535,000(2)
|
$0
|
$0
|
$123,000(2)
|
|
(d)
|
All Other Fees
|
$0
|
$0
|
$0
|
$0
|
$0
|
$0
|
Notes:
|
(1)
|
Audit fees include amounts related to the audit of the Registrant’s annual financial statements and services normally provided by the accountant in connection with statutory and regulatory
filings.
|
|
(2)
|
Tax compliance services provided to service affiliates of the Funds.
|
| (e)(1) |
The Trust’s Audit Committee has adopted and the Board of Trustees has ratified an Audit and Non-Audit Services Pre-Approval Policy (the “Policy”), which sets forth the procedures and the
conditions pursuant to which services proposed to be performed by the independent auditor of the Funds may be pre-approved.
|
The Policy provides that all requests or applications for proposed services to be provided by the independent auditor must be submitted to the Registrant’s Chief Financial Officer
(“CFO”) and must include a detailed description of the services proposed to be rendered. The CFO will determine whether such services:
1. require specific pre-approval;
2. are included within the list of services that have received the general pre-approval of the Audit Committee pursuant to the Policy; or
3. have been previously pre-approved in connection with the independent auditor’s annual engagement letter for the applicable year or otherwise. In any instance
where services require pre-approval, the Audit Committee will consider whether these services are consistent with SEC’s rules and whether the provision of these services would impair the auditor’s independence.
Requests or applications to provide services that require specific pre-approval by the Audit Committee will be submitted to the Audit Committee by the CFO. The Audit Committee will
be informed by the CFO on a quarterly basis of all services rendered by the independent auditor. The Audit Committee has delegated specific pre-approval authority to either the Audit Committee Chair or financial expert, provided that the
estimated fee for any said proposed pre-approved service does not exceed $100,000 and any pre-approval decisions are reported to the Audit Committee at the Audit Committee’s next regularly-scheduled meeting.
Services that have received the general pre-approval of the Audit Committee are identified and described in the Policy. In addition, the Policy sets forth a maximum fee per
engagement with respect to each identified service that has received general pre-approval.
All services to be provided by the independent auditor shall be provided pursuant to a signed written engagement letter with the Registrant, the investment adviser or applicable
control affiliate (except that matters as to which an engagement letter would be impractical because of timing issues or because the matter is small may not be the subject of an engagement letter) that sets forth both the services to be provided
by the independent auditor and the total fees to be paid to the independent auditor for those services.
In addition, the Audit Committee has determined to take additional measures on an annual basis to meet the Audit Committee’s responsibility to oversee the work of the independent
auditor and to assure the auditor's independence from the Registrant, such as (a) reviewing a formal written statement from the independent auditor delineating all relationships between the independent auditor and the Registrant, and (b)
discussing with the independent auditor the independent auditor’s methods and procedures for ensuring independence.
| (e)(2) |
Percentage of fees billed by PwC applicable to non-audit services pursuant to the “de minimis” exception of Rule 2-01(c)(7)(i)(C) were as follows:
|
|
2019
|
2018
|
|
|
Audit-Related Fees
|
None
|
None
|
|
Tax Fees
|
None
|
None
|
|
All Other Fees
|
None
|
None
|
| (f) |
Not applicable.
|
| (g) |
The aggregate non-audit fees and services billed by PwC for services rendered to the Registrant, and rendered to the Registrant’s investment adviser (not including any sub-adviser whose role is
primarily portfolio management and is subcontracted with or overseen by another investment adviser), and any entity controlling, controlled by, or under common control with the adviser that provides ongoing services to the Registrant
for the last two fiscal-years-ended October 31st were $535,000 and $123,000 for 2019 and 2018, respectively.
|
| (h) |
During the past fiscal year, all non-audit services provided by Registrant’s principal accountant to either Registrant’s investment adviser or to any entity controlling, controlled by, or under
common control with Registrant’s investment adviser that provides ongoing services to Registrant were pre-approved by the Audit Committee of Registrant’s Board of Trustees. Included in the Audit Committee’s pre-approval of these
non-audit services was the review and consideration as to whether the provision of these non-audit services is compatible with maintaining the principal accountant’s independence.
|
Item 5. Audit Committee of Listed Registrants.
Not applicable to open-end management investment companies.
Item 6. Schedule of Investments
Schedule of Investments is included as part of the Report to Shareholders filed under Item 1 of this Form.
Item 7. Disclosure of Proxy Voting Policies and Procedures for Closed-End Management Investment Companies.
Not applicable to open-end management investment companies.
Item 8. Portfolio Managers of Closed-End Management Investment Companies
Not applicable to open-end management investment companies. Effective for closed-end management investment companies for fiscal-years-ending on or after December 31, 2005
Item 9. Purchases of Equity Securities by Closed-End Management Company and Affiliated Purchasers.
Not applicable to open-end management investment companies.
Item 10. Submission of Matters to a Vote of Security Holders.
There have been no changes to the procedures by which shareholders may recommend nominees to the Registrant’s Board of Trustees during the period covered by this report.
Item 11. Controls and Procedures.
(a) The Registrant's principal executive and principal financial officers, or persons performing similar functions have concluded that the Registrant's disclosure controls and
procedures, as defined in Rule 30a-3(c) under the Act (17 CFR § 270.30a-3(c)), as of a date within 90 days of the filing date of the report, are effective based on the evaluation of these controls and procedures required by Rule 30a-3(b) under
the Act (17 CFR § 270.30a-3(b)) and Rules 13a-15(b) or 15d-15(b) under the Securities Exchange Act, as amended (17 CFR § 270.30a-15(b) or § 240.15d-15(b)).
(b) There has been no change in the Registrant's internal control over financial reporting (as defined in Rule 30a-3(d) under the Act (17 CFR § 270.3a-3(d)) that occurred during the
period covered by this report that has materially affected, or is reasonably likely to materially affect, the Registrant's internal control over financial reporting.
Items 12. Disclosure of Securities Lending Activities for Closed-End Management Investment Companies.
Not applicable to open-end management investment companies.
Items 13. Exhibits.
(a)(1) A copy of the Registrant's Code of Ethics, as required by Item 2 of this Form, accompanies this filing as an exhibit.
(a)(2) A separate certification for the principal executive officer and the principal financial officer of the Registrant, as required by Rule 30a-2(a) under the Act (17 CFR §
270.30a-2(a)), is filed herewith.
(b) Officer certifications as required by Rule 30a-2(b) under the Act (17 CFR § 270.30a-2(b)), also accompany this filing as an exhibit.
SIGNATURES
Pursuant to the requirements of the Securities Exchange Act of 1934 and the Investment Company Act of 1940, the Registrant has duly caused this report to be signed on its behalf by the undersigned,
thereunto duly authorized.
| (Registrant) | Schroder Global Series Trust | ||
|
By (Signature and Title)
|
|
/s/ Michael Beattie
|
|
|
|
|
Michael Beattie
|
|
|
Dated: January 8, 2020
|
|
President
|
Pursuant to the requirements of the Securities Exchange Act of 1934 and the Investment Company Act of 1940, this report has been signed below by the following persons on behalf of the Registrant and in
the capacities and on the dates indicated.
|
By (Signature and Title)
|
|
/s/ Michael Beattie
|
|
|
|
|
Michael Beattie
|
|
|
Dated: January 8, 2020
|
|
President
|
|
By (Signature and Title)
|
|
/s/ Stephen Connors
|
|
|
|
|
Stephen Connors
|
|
|
Dated: January 8, 2020
|
|
Treasurer, Controller, and CFO
|