UNITED STATES
SECURITIES AND EXCHANGE COMMISSION
Washington, D.C. 20549
FORM N-CSR
CERTIFIED SHAREHOLDER REPORT OF REGISTERED MANAGEMENT
INVESTMENT COMPANIES
Investment Company Act file number 811-21318
| Name of Fund: | BlackRock Corporate High Yield Fund, Inc. (HYT) |
| Fund Address: | 100 Bellevue Parkway, Wilmington, DE 19809 |
Name and address of agent for service: John M. Perlowski, Chief Executive Officer, BlackRock Corporate High Yield Fund, Inc.,
55 East 52nd Street, New York, NY 10055
Registrant’s telephone number, including area code: (800) 882-0052, Option 4
Date of fiscal year end: 12/31/2021
Date of reporting period: 06/30/2021
Item 1 – Report to Stockholders
(a) The Report to Shareholders is attached herewith.
|
|
JUNE 30, 2021 |

| 2021 Semi-Annual Report (Unaudited) | ||
BlackRock Core Bond Trust (BHK)
BlackRock Corporate High Yield Fund, Inc. (HYT)
BlackRock Credit Allocation Income Trust (BTZ)
BlackRock Floating Rate Income Trust (BGT)
| Not FDIC Insured • May Lose Value • No Bank Guarantee |
Supplemental Information (unaudited)
Section 19(a) Notices
BlackRock Corporate High Yield Fund, Inc.’s (HYT), BlackRock Credit Allocation Income Trust’s (BTZ) and BlackRock Floating Rate Income Trust’s (BGT) (collectively the “Trusts”, or individually a “Trust”) amounts and sources of distributions reported are estimates and are being provided to you pursuant to regulatory requirements and are not being provided for tax reporting purposes. The actual amounts and sources for tax reporting purposes will depend upon each Trust’s investment experience during the remainder of its fiscal year and may be subject to changes based on tax regulations. Each Trust will provide a Form 1099-DIV each calendar year that will tell you how to report these distributions for U.S. federal income tax purposes.
June 30, 2021
| Total Cumulative Distributions for the Fiscal Period |
% Breakdown of the Total Cumulative Distributions for the Fiscal Period |
|||||||||||||||||||||||||||||||||||||||
| Trust Name |
|
Net Income |
|
|
Net Realized Capital Gains Short-Term |
|
|
Net Realized Capital Gains Long-Term |
|
|
Return of Capital |
(a) |
|
Total Per Common Share |
|
|
Net Income |
|
|
Net Realized Capital Gains Short-Term |
|
|
Net Realized Capital Gains Long-Term |
|
|
Return of Capital |
|
|
Total Per Common Share |
| ||||||||||
| HYT |
$ | 0.342245 | $ | — | $ | — | $ | 0.047255 | $ | 0.389500 | 88 | % | — | % | — | % | 12 | % | 100 | % | ||||||||||||||||||||
| BTZ |
0.401591 | — | — | 0.017909 | 0.419500 | 96 | — | — | 4 | 100 | ||||||||||||||||||||||||||||||
| BGT |
0.294087 | — | — | 0.029413 | 0.323500 | 91 | — | — | 9 | 100 | ||||||||||||||||||||||||||||||
| (a) | Each Trust estimates that it has distributed more than its net income and net realized capital gains; therefore, a portion of the distribution may be a return of capital. A return of capital may occur, for example, when some or all of the shareholder’s investment in a Trust is returned to the shareholder. A return of capital does not necessarily reflect a Trust’s investment performance and should not be confused with “yield” or “income.” When distributions exceed total return performance, the difference will reduce a Trust’s net asset value per share. |
Section 19(a) notices for the Trusts, as applicable, are available on the BlackRock website at blackrock.com.
Section 19(b) Disclosure
BlackRock Core Bond Trust’s (BHK), BlackRock Corporate High Yield Fund, Inc.’s (HYT), BlackRock Credit Allocation Income Trust’s (BTZ) and BlackRock Floating Rate Income Trust’s (BGT) (collectively the “Trusts”, or individually a “Trust”), acting pursuant to a U.S. Securities and Exchange Commission (“SEC”) exemptive order and with the approval of each Trust’s Board of Trustees or Directors, as applicable (the “Board”), each have adopted a managed distribution plan, consistent with its investment objectives and policies to support a level distribution of income, capital gains and/or return of capital (the “Plan”). In accordance with the Plans, the Trusts currently distribute the following fixed amounts per share on a monthly basis:
| Exchange Symbol | Amount Per Common Share |
|||
| BHK |
$ | 0.0746 | ||
| HYT |
0.0779 | |||
| BTZ |
0.0839 | |||
| BGT |
0.0647 | |||
The fixed amounts distributed per share are subject to change at the discretion of each Trust’s Board. Under its Plan, each Trust will distribute all available net income to its shareholders as required by the Internal Revenue Code of 1986, as amended (the “Code”). If sufficient income (inclusive of net income and short-term capital gains) is not earned on a monthly basis, the Trusts will distribute long-term capital gains and/or return of capital to shareholders in order to maintain a level distribution. Each monthly distribution to shareholders is expected to be at the fixed amount established by the Board; however, each Trust may make additional distributions from time to time, including additional capital gain distributions at the end of the taxable year, if required to meet requirements imposed by the Code and/or the Investment Company Act of 1940, as amended (the “1940 Act”).
Shareholders should not draw any conclusions about each Trust’s investment performance from the amount of these distributions or from the terms of the Plan. Each Trust’s total return performance is presented in its financial highlights table.
The Board may amend, suspend or terminate a Trust’s Plan at any time without prior notice to the Trust’s shareholders if it deems such actions to be in the best interests of the Trust or its shareholders. The suspension or termination of the Plan could have the effect of creating a trading discount (if the Trust’s stock is trading at or above net asset value) or widening an existing trading discount. The Trusts are subject to risks that could have an adverse impact on their ability to maintain level distributions. Examples of potential risks include, but are not limited to, economic downturns impacting the markets, changes in interest rates, decreased market volatility, companies suspending or decreasing corporate dividend distributions and changes in the Code.
| 2 |
2 0 2 1 B L A C K R O C K S E M I - A N N U A L R E P O R T T O S H A R E H O L D E R S |


| T H I S P A G E I S N O T P A R T O F Y O U R F U N D R E P O R T |
3 |
Table of Contents
| Page | ||||
| 2 | ||||
| 3 | ||||
| Semi-Annual Report: |
||||
| 5 | ||||
| 5 | ||||
| 6 | ||||
| Financial Statements: |
||||
| 18 | ||||
| 125 | ||||
| 127 | ||||
| 128 | ||||
| 130 | ||||
| 132 | ||||
| 136 | ||||
| Disclosure of Investment Advisory Agreements and Sub-Advisory Agreements |
150 | |||
| 154 | ||||
| 157 | ||||
| 4 |
The Benefits and Risks of Leveraging
The Trusts may utilize leverage to seek to enhance the distribution rate on, and net asset value (“NAV”) of, their common shares (“Common Shares”). However, there is no guarantee that these objectives can be achieved in all interest rate environments.
In general, the concept of leveraging is based on the premise that the financing cost of leverage, which is based on short-term interest rates, is normally lower than the income earned by a Trust on its longer-term portfolio investments purchased with the proceeds from leverage. To the extent that the total assets of each Trust (including the assets obtained from leverage) are invested in higher-yielding portfolio investments, each Trust’s shareholders benefit from the incremental net income. The interest earned on securities purchased with the proceeds from leverage (after paying the leverage costs) is paid to shareholders in the form of dividends, and the value of these portfolio holdings (less the leverage liability) is reflected in the per share NAV.
To illustrate these concepts, assume a Trust’s capitalization is $100 million and it utilizes leverage for an additional $30 million, creating a total value of $130 million available for investment in longer-term income securities. If prevailing short-term interest rates are 3% and longer-term interest rates are 6%, the yield curve has a strongly positive slope. In this case, a Trust’s financing costs on the $30 million of proceeds obtained from leverage are based on the lower short-term interest rates. At the same time, the securities purchased by a Trust with the proceeds from leverage earn income based on longer-term interest rates. In this case, a Trust’s financing cost of leverage is significantly lower than the income earned on a Trust’s longer-term investments acquired from such leverage proceeds, and therefore the holders of Common Shares (“Common Shareholders”) are the beneficiaries of the incremental net income.
However, in order to benefit shareholders, the return on assets purchased with leverage proceeds must exceed the ongoing costs associated with the leverage. If interest and other costs of leverage exceed a Trust’s return on assets purchased with leverage proceeds, income to shareholders is lower than if a Trust had not used leverage. Furthermore, the value of the Trusts’ portfolio investments generally varies inversely with the direction of long-term interest rates, although other factors can influence the value of portfolio investments. In contrast, the amount of each Trust’s obligations under its leverage arrangement generally does not fluctuate in relation to interest rates. As a result, changes in interest rates can influence the Trusts’ NAVs positively or negatively. Changes in the future direction of interest rates are very difficult to predict accurately, and there is no assurance that a Trust’s intended leveraging strategy will be successful.
The use of leverage also generally causes greater changes in each Trust’s NAV, market price and dividend rates than comparable portfolios without leverage. In a declining market, leverage is likely to cause a greater decline in the NAV and market price of a Trust’s shares than if the Trust were not leveraged. In addition, each Trust may be required to sell portfolio securities at inopportune times or at distressed values in order to comply with regulatory requirements applicable to the use of leverage or as required by the terms of leverage instruments, which may cause the Trust to incur losses. The use of leverage may limit a Trust’s ability to invest in certain types of securities or use certain types of hedging strategies. Each Trust incurs expenses in connection with the use of leverage, all of which are borne by shareholders and may reduce income to the shareholders. Moreover, to the extent the calculation of each Trust’s investment advisory fees includes assets purchased with the proceeds of leverage, the investment advisory fees payable to each Trust’s investment adviser will be higher than if the Trusts did not use leverage.
Each Trust may utilize leverage through a credit facility or reverse repurchase agreements as described in the Notes to Financial Statements, if applicable.
Under the Investment Company Act of 1940, as amended (the “1940 Act”), each Trust is permitted to issue debt up to 33 1/3% of its total managed assets. A Trust may voluntarily elect to limit its leverage to less than the maximum amount permitted under the 1940 Act. In addition, a Trust may also be subject to certain asset coverage, leverage or portfolio composition requirements imposed by its credit facility, which may be more stringent than those imposed by the 1940 Act.
If a Trust segregates or designates on its books and records cash or liquid assets having a value not less than the value of a Trust’s obligations under a reverse repurchase agreement (including accrued interest) then such transaction is not considered a senior security and is not subject to the foregoing limitations and requirements imposed by the 1940 Act.
Derivative Financial Instruments
The Trusts may invest in various derivative financial instruments. These instruments are used to obtain exposure to a security, commodity, index, market, and/or other assets without owning or taking physical custody of securities, commodities and/or other referenced assets or to manage market, equity, credit, interest rate, foreign currency exchange rate, commodity and/or other risks. Derivative financial instruments may give rise to a form of economic leverage and involve risks, including the imperfect correlation between the value of a derivative financial instrument and the underlying asset, possible default of the counterparty to the transaction or illiquidity of the instrument. The Trusts’ successful use of a derivative financial instrument depends on the investment adviser’s ability to predict pertinent market movements accurately, which cannot be assured. The use of these instruments may result in losses greater than if they had not been used, may limit the amount of appreciation a Trust can realize on an investment and/or may result in lower distributions paid to shareholders. The Trusts’ investments in these instruments, if any, are discussed in detail in the Notes to Financial Statements.
| T H E B E N E F I T S A N D R I S K S O F L E V E R A G I N G / D E R I V A T I V E F I N A N C I A L I N S T R U M E N T S |
5 |
| Trust Summary as of June 30, 2021 | BlackRock Core Bond Trust (BHK) |
Investment Objective
BlackRock Core Bond Trust’s (BHK) (the “Trust”) investment objective is to provide current income and capital appreciation. The Trust seeks to achieve its investment objective by investing, under normal market conditions, at least 75% of its managed assets in bonds that are investment grade quality at the time of investment. Under normal market conditions, the Trust intends to invest its assets primarily in a diversified portfolio of investment grade bonds, which may include, but are not limited to, corporate bonds, U.S. government and agency securities and mortgage-related securities. The Trust may invest up to 25% of its total managed assets in bonds that at the time of investment are rated Ba/BB or below by Moody’s Investors Service, Inc. (“Moody’s”), S&P Global Ratings, Fitch Ratings (“Fitch”) or another nationally recognized rating agency or bonds that are unrated but judged to be of comparable quality by the investment adviser. The Trust may invest up to 10% of its managed assets in bonds issued in foreign currencies. The Trust may invest directly in such securities or synthetically through the use of derivatives.
No assurance can be given that the Trust’s investment objective will be achieved.
Trust Information
| Symbol on New York Stock Exchange |
BHK | |
| Initial Offering Date |
November 27, 2001 | |
| Current Distribution Rate on Closing Market Price as of June 30, 2021 ($16.52)(a) |
5.42% | |
| Current Monthly Distribution per Common Share(b) |
$0.0746 | |
| Current Annualized Distribution per Common Share(b) |
$0.8952 | |
| Leverage as of June 30, 2021(c) |
35% |
| (a) | Current distribution rate on closing market price is calculated by dividing the current annualized distribution per share by the closing market price. Past performance is not an indication of future results. |
| (b) | The distribution rate is not constant and is subject to change. |
| (c) | Represents reverse repurchase agreements as a percentage of total managed assets, which is the total assets of the Trust (including any assets attributable to any borrowings) minus the sum of its liabilities (other than borrowings representing financial leverage). Does not reflect derivatives or other instruments that may give rise to economic leverage. For a discussion of leveraging techniques utilized by the Trust, please see The Benefits and Risks of Leveraging and Derivative Financial Instruments. |
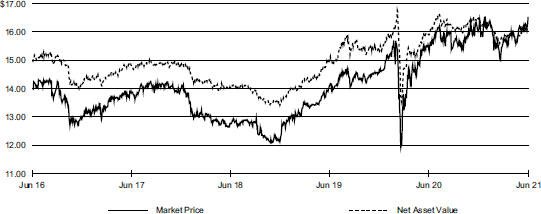
Market Price and Net Asset Value Per Share Summary
| 06/30/21 | 12/31/20 | Change | High | Low | ||||||||||||||||
| Market Price |
$ | 16.52 | $ | 16.30 | 1.35 | % | $ | 16.59 | $ | 14.97 | ||||||||||
| Net Asset Value |
16.16 | 16.45 | (1.76 | ) | 16.45 | 15.59 | ||||||||||||||
Market Price and Net Asset Value History for the Past Five Years
| 6 | 2 0 2 1 B L A C K R O C K S E M I - A N N U A L R E P O R T T O S H A R E H O L D E R S |
| Trust Summary as of June 30, 2021 (continued) | BlackRock Core Bond Trust (BHK) |
Performance and Portfolio Management Commentary
Returns for the period ended June 30, 2021 were as follows:
| Average Annual Total Returns | ||||||||||||||||
| 6-month | 1 Year | 3 Years | 5 Years | |||||||||||||
| Trust at NAV(a)(b) |
0.57 | % | 7.34 | % | 10.87 | % | 7.62 | % | ||||||||
| Trust at Market Price(a)(b) |
3.76 | 13.44 | 15.25 | 9.41 | ||||||||||||
| Reference Benchmark(c) |
(1.49 | ) | 2.41 | 7.58 | 4.88 | |||||||||||
| Bloomberg Barclays U.S. Long Government/Credit Index(d) |
(4.64 | ) | (1.86 | ) | 9.92 | 5.45 | ||||||||||
| Bloomberg Barclays Intermediate Credit Index(e) |
(0.54 | ) | 2.25 | 5.78 | 3.64 | |||||||||||
| Bloomberg Barclays U.S. Corporate High Yield 2% Issuer Capped Index(f) |
3.61 | 15.34 | 7.42 | 7.47 | ||||||||||||
| Bloomberg Barclays CMBS, Eligible for U.S. Aggregate(g) |
(0.50 | ) | 2.26 | 5.98 | 3.43 | |||||||||||
| Bloomberg Barclays MBS Index(h) |
(0.77 | ) | (0.42 | ) | 3.78 | 2.27 | ||||||||||
| Bloomberg Barclays ABS Index(i) |
0.18 | 1.34 | 3.65 | 2.39 | ||||||||||||
| (a) | All returns reflect reinvestment of dividends and/or distributions at actual reinvestment prices. Performance results reflect the Trust’s use of leverage. |
| (b) | The Trust moved from a discount to NAV to a premium during the period, which accounts for the difference between performance based on market price and performance based on NAV. |
| (c) | The Reference Benchmark is comprised of the Bloomberg Barclays U.S. Long Government/Credit Index (40%); Bloomberg Barclays Intermediate Credit Index (24%); Bloomberg Barclays U.S. Corporate High Yield 2% Issuer Capped Index (16%); Bloomberg Barclays CMBS, Eligible for U.S. Aggregate Index (8%); Bloomberg Barclays MBS Index (8%); and Bloomberg Barclays ABS Index (4%). The Reference Benchmark’s index content and weightings may have varied over past periods. |
| (d) | This unmanaged index is the long component of the Bloomberg Barclays U.S. Government/Credit Index. This unmanaged index includes publicly issued U.S. Treasury debt, U.S. government agency debt, taxable debt issued by U.S. states and territories and their political subdivisions, debt issued by U.S. and non-U.S. corporations, non-U.S. government debt and supranational debt. |
| (e) | This unmanaged index is the intermediate component of the Bloomberg Barclays U.S. Credit Index. The Bloomberg Barclays U.S. Credit Index includes publicly issued U.S. corporate and foreign debentures and secured notes that meet specified maturity, liquidity, and quality requirements. |
| (f) | An unmanaged index comprised of issuers that meet the following criteria: at least $150 million par value outstanding; maximum credit rating of Ba1; at least one year to maturity; and no issuer represents more than 2% of the index. |
| (g) | This unmanaged index is the CMBS component of the Bloomberg Barclays U.S. Aggregate Index. |
| (h) | This unmanaged index is a market value-weighted index, which covers the mortgage-backed securities component of the Bloomberg Barclays U.S. Aggregate Bond Index. The unmanaged index is comprised of agency mortgage-backed pass-through securities of the Government National Mortgage Association (Ginnie Mae), the Federal National Mortgage Association (Fannie Mae), and the Federal Home Loan Mortgage Corporation (Freddie Mac) with a minimum $150 million par amount outstanding and a weighted-average maturity of at least 1 year. The index includes reinvestment of income. |
| (i) | This unmanaged index is the asset-backed securities component of the Bloomberg Barclays U.S. Aggregate Index. |
Performance results may include adjustments made for financial reporting purposes in accordance with U.S. generally accepted accounting principles. Past performance is not an indication of future results.
BHK is presenting the Reference Benchmark to accompany trust performance. The Reference Benchmark is presented for informational purposes only, as the Trust is actively managed and does not seek to track or replicate the performance of the Reference Benchmark or any other index. The portfolio investments of the Trust may differ substantially from the securities that comprise the indices within the Reference Benchmark, which may cause the Trust’s performance to differ materially from that of the Reference Benchmark. The Trust employs leverage as part of its investment strategy, which may change over time at the discretion of BlackRock Advisors, LLC (the “Manager”) as market and other conditions warrant. In contrast, the Reference Benchmark is not adjusted for leverage. Therefore, leverage generally may result in the Trust outperforming the Reference Benchmark in rising markets and underperforming in declining markets. The Board considers additional factors to evaluate the Trust’s performance, such as the performance of the Trust relative to a peer group of funds, a leverage-adjusted benchmark and/or other information provided by the Manager.
More information about the Trust’s historical performance can be found in the “Closed End Funds” section of blackrock.com.
The following discussion relates to the Trust’s absolute performance based on NAV:
What factors influenced performance?
Positive contributions to the Trust’s absolute performance over the period came from its allocations to U.S. high yield corporate credit as well as to securitized assets including commercial mortgage-backed securities (“CMBS”) and asset-backed securities (“ABS”). The use of derivatives (primarily interest rate swaps) and non-U.S. dollar exposures also contributed positively.
The principal detractors from the Trust’s absolute performance included positioning with respect to U.S. Treasuries, as well as exposures to agency collateralized mortgage obligations (“CMOs”) and 30-year passthrough mortgage-backed securities (“MBS”).
Derivatives are utilized by the Trust in order to manage and/or take outright views on interest rates, credit risk and/or foreign exchange positions in the portfolio. During the period, the Trust’s use of derivatives contributed positively to performance.
Describe recent portfolio activity.
Over the reporting period, the Trust increased exposure to investment grade corporate bonds, U.S. Treasuries, high yield corporate bonds and 30-year MBS. The Trust trimmed exposure to CMBS and increased its short position in U.S. municipal bonds.
| T R U S T S U M M A R Y |
7 |
| Trust Summary as of June 30, 2021 (continued) | BlackRock Core Bond Trust (BHK) |
Describe portfolio positioning at period end.
At period end, the Trust maintained a diversified exposure within non-government spread sectors, including investment grade corporate credit, high yield corporate credit, CMBS, ABS and emerging market debt. The Trust also held exposure to government-related sectors such as 30-year MBS passthroughs, agency CMOs and U.S. agency securities.
The views expressed reflect the opinions of BlackRock as of the date of this report and are subject to change based on changes in market, economic or other conditions. These views are not intended to be a forecast of future events and are no guarantee of future results.
Overview of the Trust’s Total Investments
| (a) | Excludes short-term securities, options purchased and options written. |
| (b) | Rounds to less than 1% of total investments. |
| (c) | For financial reporting purposes, credit quality ratings shown above reflect the highest rating assigned by either S&P Global Ratings or Moody’s Investors Service, Inc. if ratings differ. These rating agencies are independent, nationally recognized statistical rating organizations and are widely used. Investment grade ratings are credit ratings of BBB/Baa or higher. Below investment grade ratings are credit ratings of BB/Ba or lower. Investments designated N/R are not rated by either rating agency. Unrated investments do not necessarily indicate low credit quality. Credit quality ratings are subject to change. |
| (d) | The investment adviser evaluates the credit quality of not-rated investments based upon certain factors including, but not limited to, credit ratings for similar investments and financial analysis of sectors, individual investments and/or issuer. Using this approach, the investment adviser has deemed U.S. Government Sponsored Agency Securities and U.S. Treasury Obligations as AAA/Aaa. |
| * | Includes one or more investment categories that individually represents less than 1% of the Trust’s total investments. Please refer to the Schedule of Investments for details. |
| 8 |
2 0 2 1 B L A C K R O C K S E M I - A N N U A L R E P O R T T O S H A R E H O L D E R S |
| Trust Summary as of June 30, 2021 | BlackRock Corporate High Yield Fund, Inc. (HYT) |
Investment Objective
BlackRock Corporate High Yield Fund, Inc.’s (HYT) (the “Trust”) primary investment objective is to provide shareholders with current income. The Trust’s secondary investment objective is to provide shareholders with capital appreciation. The Trust seeks to achieve its objectives by investing primarily in a diversified portfolio of fixed income securities which are rated at the time of investment to be below investment grade or, if unrated, are considered by the investment adviser to be of comparable quality. The Trust may invest directly in fixed income securities or synthetically through the use of derivatives.
No assurance can be given that the Trust’s investment objective will be achieved.
Trust Information
| Symbol on New York Stock Exchange |
HYT | |
| Initial Offering Date |
May 30, 2003 | |
| Current Distribution Rate on Closing Market Price as of June 30, 2021 ($12.32)(a) |
7.59% | |
| Current Monthly Distribution per Common Share(b) |
$0.0779 | |
| Current Annualized Distribution per Common Share(b) |
$0.9348 | |
| Leverage as of June 30, 2021(c) |
30% | |
| (a) | Current distribution rate on closing market price is calculated by dividing the current annualized distribution per share by the closing market price. The current distribution rate may consist of income, net realized gains and/or a return of capital. Past performance is not an indication of future results. |
| (b) | The distribution rate is not constant and is subject to change. A portion of the distribution may be deemed a return of capital or net realized gain. |
| (c) | Represents bank borrowings outstanding as a percentage of total managed assets, which is the total assets of the Fund (including any assets attributable to borrowings), minus the sum of liabilities (other than borrowings representing financial leverage). Does not reflect derivatives or other instruments that may give rise to economic leverage. For a discussion of leveraging techniques utilized by the Trust, please see The Benefits and Risks of Leveraging and Derivative Financial Instruments. |
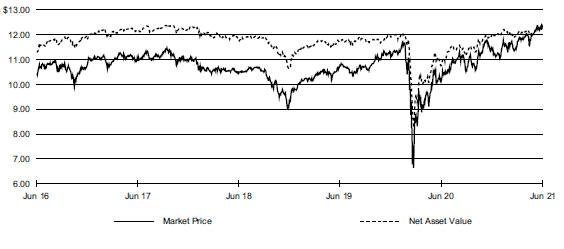
Market Price and Net Asset Value Per Share Summary
| 06/30/21 | 12/31/20 | Change | High | Low | ||||||||||||||||
| Market Price. |
$ | 12.32 | $ | 11.43 | 7.79 | % | $ | 12.47 | $ | 11.00 | ||||||||||
| Net Asset Value |
12.29 | 11.95 | 2.85 | 12.30 | 11.87 | |||||||||||||||
| T R U S T S U M M A R Y |
9 |
| Trust Summary as of August 31, 2017 (continued) | BlackRock Corporate High Yield Fund, Inc. (HYT) |
Performance and Portfolio Management Commentary
Returns for the period ended June 30, 2021 were as follows:
| Average Annual Total Returns | ||||||||||||||||||||
| 6-month | 1 Year | 3 Years | 5 Years | |||||||||||||||||
| Trust at NAV(a)(b) |
6.23 | % | 23.88 | % | 10.23 | % | 10.48 | % | ||||||||||||
| Trust at Market Price(a)(b) |
11.34 | 31.38 | 14.88 | 12.22 | ||||||||||||||||
| Bloomberg Barclays U.S. Corporate High Yield 2% Issuer Capped Index(c) |
3.61 | 15.34 | 7.42 | 7.47 | ||||||||||||||||
| (a) | All returns reflect reinvestment of dividends and/or distributions at actual reinvestment prices. Performance results reflect the Trust’s use of leverage. |
| (b) | The Trust moved from a discount to NAV to a premium during the period, which accounts for the difference between performance based on market price and performance based on NAV. (c) An unmanaged index (the “Reference Benchmark”) comprised of issuers that meet the following criteria: at least $150 million par value outstanding; maximum credit rating of Ba1; at least one year to maturity; and no issuer represents more than 2% of the index. |
Performance results may include adjustments made for financial reporting purposes in accordance with U.S. generally accepted accounting principles. Past performance is not an indication of future results.
HYT is presenting the Reference Benchmark to accompany trust performance. The Reference Benchmark is presented for informational purposes only, as the Trust is actively managed and does not seek to track or replicate the performance of the Reference Benchmark or any other index. The portfolio investments of the Trust may differ substantially from the securities that comprise the indices within the Reference Benchmark, which may cause the Trust’s performance to differ materially from that of the Reference Benchmark. The Trust employs leverage as part of its investment strategy, which may change over time at the discretion of the Manager as market and other conditions warrant. In contrast, the Reference Benchmark is not adjusted for leverage. Therefore, leverage generally may result in the Trust outperforming the Reference Benchmark in rising markets and underperforming in declining markets. The Board considers additional factors to evaluate the Trust’s performance, such as the performance of the Trust relative to a peer group of funds, a leverage-adjusted benchmark and/or other information provided by the Manager.
More information about the Trust’s historical performance can be found in the “Closed End Funds” section of blackrock.com.
The following discussion relates to the Trust’s absolute performance based on NAV:
What factors influenced performance?
High-yield bonds delivered positive returns and outpaced the investment-grade bond market in the first half of the period. The gains were driven by the combination of a strong economic recovery, rising oil prices, and continued support from fiscal and monetary policy. Together, these factors helped fuel investors’ appetite for both risk and yield.
At the sector level, positions in the independent energy, technology and health care sectors contributed to Trust performance. By credit rating, B and BB rated debt made the largest contributions. The Trust’s tactical allocations to equities and floating rate loan interest (“bank loans”) also helped absolute returns.
The Fund’s allocations to the electric utilities, railroads and natural gas sectors slightly detracted from relative performance. From a credit quality perspective, BBB rated bonds were a minor detractor.
Describe recent portfolio activity.
While the Trust’s key positioning themes remained broadly consistent, the investment adviser used tactical sector- and issuer-level positions to take advantage of market opportunities. The investment manager reduced the portfolio’s allocation to investment-grade bonds during the first half of 2021, ending the period with a weighting of approximately 4% in this area. The remaining position largely represented issuer-specific opportunities. The Trust continued to use derivatives, such as total return swaps and credit default swaps, in order to manage its positioning.
The Trust slightly increased its allocation to bank loans during the period. It increased its allocation to the technology, airlines and retailers sectors, while reducing its weighting in the banking, automotive and midstream energy sectors. The investment adviser saw an opportunity in sectors most sensitive to the re-opening of the economy—including transportation, leisure, lodging and gaming—on the belief these areas will benefit from the ongoing recovery and widespread distribution of the COVID-19 vaccine.
Describe portfolio positioning at period end.
The Trust was underweight in BB rated issues and overweight in select CCCs. It maintained an underweight in the highest-yielding portion of the market with the largest concentration of distressed assets.
The Trust also continued to hold a tactical allocation of about 19% to bank loans, which the investment adviser believed offered an attractive value versus high-yield bonds. These senior-secured assets experienced a recovery similar to high yield, but yield spreads remain wide versus historical levels. The Trust also held an out-of-benchmark allocation to equities of approximately 4%. The top sector overweight positions included technology, cable/satellite and aerospace/defense, while food & beverage, finance companies and electric utilities were the largest underweights.
The views expressed reflect the opinions of BlackRock as of the date of this report and are subject to change based on changes in market, economic or other conditions. These views are not intended to be a forecast of future events and are no guarantee of future results.
| 10 |
2 0 2 1 B L A C K R O C K S E M I - A N N U A L R E P O R T T O S H A R E H O L D E R S |
| Trust Summary as of June 30, 2021 (continued) | BlackRock Corporate High Yield Fund, Inc. (HYT) |
Overview of the Trust’s Total Investments
| (a) | Excludes options purchased. |
| (b) | Rounds to less than 1% of total investments. |
| (c) | For financial reporting purposes, credit quality ratings shown above reflect the highest rating assigned by either S&P Global Ratings or Moody’s Investors Service, Inc. if ratings differ. These rating agencies are independent, nationally recognized statistical rating organizations and are widely used. Investment grade ratings are credit ratings of BBB/Baa or higher. Below investment grade ratings are credit ratings of BB/Ba or lower. Investments designated N/R are not rated by either rating agency. Unrated investments do not necessarily indicate low credit quality. Credit quality ratings are subject to change. |
| (d) | The investment adviser evaluates the credit quality of unrated investments based upon certain factors including, but not limited to, credit ratings for similar investments and financial analysis of sectors and individual investments. Using this approach, the investment adviser has deemed certain of these unrated securities as investment grade quality. As of June 30, 2021 and December 31, 2020, the market value of unrated securities deemed by the investment adviser to be investment grade each represents less than 1% of the Trust’s total investments. |
| * | Includes one or more investment categories that individually represents less than 1% of the Trust’s total investments. Please refer to the Consolidated Schedule of Investments for details. |
| T R U S T S U M M A R Y |
11 |
| Trust Summary as of June 30, 2021 | BlackRock Credit Allocation Income Trust (BTZ) |
Investment Objective
BlackRock Credit Allocation Income Trust’s (BTZ) (the “Trust”) investment objective is to provide current income, current gains and capital appreciation. The Trust seeks to achieve its investment objective by investing, under normal market conditions, at least 80% of its assets in credit-related securities, including, but not limited to, investment grade corporate bonds, high yield bonds (commonly referred to as “junk” bonds), bank loans, preferred securities or convertible bonds or derivatives with economic characteristics similar to these credit-related securities. The Trust may invest directly in such securities or synthetically through the use of derivatives.
No assurance can be given that the Trust’s investment objective will be achieved.
Trust Information
| Symbol on New York Stock Exchange |
BTZ | |
| Initial Offering Date |
December 27, 2006 | |
| Current Distribution Rate on Closing Market Price as of June 30, 2021 ($15.59)(a) |
6.46% | |
| Current Monthly Distribution per Common Share(b) |
$ 0.0839 | |
| Current Annualized Distribution per Common Share(b) |
$ 1.0068 | |
| Leverage as of June 30, 2021(c) |
29% |
| (a) | Current distribution rate on closing market price is calculated by dividing the current annualized distribution per share by the closing market price. The current distribution rate may consist of income, net realized gains and/or a return of capital. Past performance is not an indication of future results. |
| (b) | The distribution rate is not constant and is subject to change. A portion of the distribution may be deemed a return of capital or net realized gain. |
| (c) | Represents reverse repurchase agreements as a percentage of total managed assets, which is the total assets of the Trust (including any assets attributable to any borrowings) minus the sum of its liabilities (other than borrowings representing financial leverage). Does not reflect derivatives or other instruments that may give rise to economic leverage. For a discussion of leveraging techniques utilized by the Trust, please see The Benefits and Risks of Leveraging and Derivative Financial Instruments. |
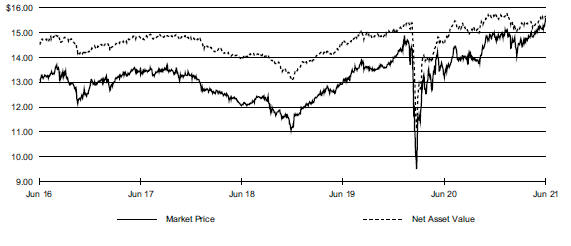
Market Price and Net Asset Value Per Share Summary
| 06/30/21 | 12/31/20 | Change | High | Low | ||||||||||||||||
| Market Price |
$ | 15.59 | $ | 14.71 | 5.98 | % | $ | 15.63 | $ | 13.97 | ||||||||||
| Net Asset Value |
15.67 | 15.71 | (0.25 | ) | 15.79 | 15.06 | ||||||||||||||
Market Price and Net Asset Value History for the Past Five Years
| 12 |
2 0 2 1 B L A C K R O C K S E M I - A N N U A L R E P O R T T O S H A R E H O L D E R S |
| Trust Summary as of June 30, 2021 (continued) | BlackRock Credit Allocation Income Trust (BTZ) |
Performance and Portfolio Management Commentary
Returns for the period ended June 30, 2021 were as follows:
| Average Annual Total Returns | ||||||||||||||||
| 6-month | 1 Year | 3 Years | 5 Years | |||||||||||||
| Trust at NAV(a)(b) |
2.56 | % | 15.41 | % | 11.23 | % | 8.64 | % | ||||||||
| Trust at Market Price(a)(b) |
8.98 | 26.48 | 16.56 | 10.80 | ||||||||||||
| Reference Benchmark(c) |
0.39 | 7.04 | 7.75 | 5.84 | ||||||||||||
| Bloomberg Barclays U.S. Credit Index(d) |
(1.28 | ) | 2.99 | 7.42 | 4.63 | |||||||||||
| Bloomberg Barclays U.S. Corporate High Yield 2% Issuer Capped Index(e) |
3.61 | 15.34 | 7.42 | 7.47 | ||||||||||||
| Bloomberg Barclays USD Capital Securities Index(f) |
(0.19 | ) | 5.31 | 8.88 | 6.33 | |||||||||||
| (a) | All returns reflect reinvestment of dividends and/or distributions at actual reinvestment prices. Performance results reflect the Trust’s use of leverage. |
| (b) | The Trust’s discount to NAV narrowed during the period, which accounts for the difference between performance based on market price and performance based on NAV. |
| (c) | The Reference Benchmark is comprised of the Bloomberg Barclays U.S. Credit Index (50.36%), the Bloomberg Barclays U.S. Corporate High Yield 2% Issuer Capped Index (29.93%), and the Bloomberg Barclays USD Capital Securities Index (19.71%). |
| (d) | This unmanaged index measures the investment grade, U.S. dollar-denominated, fixed-rate, taxable corporate and government-related bond markets. |
| (e) | An unmanaged index comprised of issuers that meet the following criteria: at least $150 million par value outstanding; maximum credit rating of Ba1; at least one year to maturity; and no issuer represents more than 2% of the index. |
| (f) | This unmanaged index tracks fixed-rate, investment grade capital securities denominated in USD. |
Performance results may include adjustments made for financial reporting purposes in accordance with U.S. generally accepted accounting principles.
Past performance is not an indication of future results.
BTZ is presenting the Reference Benchmark to accompany trust performance. The Reference Benchmark is presented for informational purposes only, as the Trust is actively managed and does not seek to track or replicate the performance of the Reference Benchmark or any other index. The portfolio investments of the Trust may differ substantially from the securities that comprise the indices within the Reference Benchmark, which may cause the Trust’s performance to differ materially from that of the Reference Benchmark. The Trust employs leverage as part of its investment strategy, which may change over time at the discretion of BlackRock Advisors, LLC (the “Manager”) as market and other conditions warrant. In contrast, the Reference Benchmark is not adjusted for leverage. Therefore, leverage generally may result in the Trust outperforming the Reference Benchmark in rising markets and underperforming in declining markets. The Board considers additional factors to evaluate the Trust’s performance, such as the performance of the Trust relative to a peer group of funds, a leverage-adjusted benchmark and/or other information provided by the Manager.
More information about the Trust’s historical performance can be found in the “Closed End Funds” section of blackrock.com.
The following discussion relates to the Trust’s absolute performance based on NAV:
What factors influenced performance?
Positive contributors to the Trust’s performance included exposure to U.S. high yield corporate bonds and collateralized loan obligations (“CLOs”). The Trust’s allocation to capital securities also aided performance. Finally, exposure to European high yield corporate bonds contributed to the Trust’s return.
Detractors from performance included exposure to emerging market debt, as rising U.S. Treasury yields weighed on the category. In a similar vein, the Trust’s exposure to duration (and corresponding interest rate sensitivity) detracted given the move higher in Treasury yields.
In addition to employing leverage, the Trust uses derivatives as part of its investment strategy, including forward contracts to manage foreign currency exposure of non-U.S. positions back to U.S. dollars and interest rate futures to adjust duration positioning tactically as needed. The use of derivatives over the period did not have a material impact on performance.
Describe recent portfolio activity.
Over the period, the Trust reduced exposure to U.S. investment grade corporate bonds, capital securities, and CLOs, while increasing exposure to U.S. high yield corporate bonds. The Trust’s use of leverage over the period had a positive impact on performance.
Describe portfolio positioning at period end.
At period end, the Trust was positioned for economic growth to be supported by continued easing of lockdowns and resumption of business activities, along with an awareness that valuations are full and a range of risks, including inflation, bear watching. With this backdrop, the Trust maintained core allocations to U.S. high yield and investment grade corporate bonds as well as capital securities, with exposure to CLOs and non-U.S. credit markets as well.
The views expressed reflect the opinions of BlackRock as of the date of this report and are subject to change based on changes in market, economic or other conditions. These views are not intended to be a forecast of future events and are no guarantee of future results.
| T R U S T S U M M A R Y |
13 |
| Trust Summary as of June 30, 2021 (continued) | BlackRock Credit Allocation Income Trust (BTZ) |
Overview of the Trust’s Total Investments
| (a) | Excludes short-term securities, options purchased and options written. |
| (b) | Rounds to less than 1% of total investments. |
| (c) | For financial reporting purposes, credit quality ratings shown above reflect the highest rating assigned by either S&P Global Ratings or Moody’s Investors Service, Inc. if ratings differ. These rating agencies are independent, nationally recognized statistical rating organizations and are widely used. Investment grade ratings are credit ratings of BBB/Baa or higher. Below investment grade ratings are credit ratings of BB/Ba or lower. Investments designated N/R are not rated by either rating agency. Unrated investments do not necessarily indicate low credit quality. Credit quality ratings are subject to change. |
| (d) | The investment adviser evaluates the credit quality of not-rated investments based upon certain factors including, but not limited to, credit ratings for similar investments and financial analysis of sectors, individual investments and/or issuer. Using this approach, the investment adviser has deemed U.S. Government Sponsored Agency Securities and U.S. Treasury Obligations as AAA/Aaa. |
| * | Includes one or more investment categories that individually represents less than 1% of the Trust’s total investments. Please refer to the Schedule of Investments for details. |
| 14 | 2 0 2 1 B L A C K R O C K S E M I - A N N U A L R E P O R T T O S H A R E H O L D E R S |
| Trust Summary as of June 30, 2021 | BlackRock Floating Rate Income Trust (BGT) |
Investment Objective
BlackRock Floating Rate Income Trust’s (BGT) (the “Trust”) primary investment objective is to provide a high level of current income. The Trust’s secondary investment objective is to seek the preservation of capital to the extent consistent with its primary objective of high current income. The Trust seeks to achieve its investment objectives by investing primarily, under normal conditions, at least 80% of its assets in floating and variable rate instruments of U.S. and non-U.S. issuers, including a substantial portion of its assets in global floating and variable rate securities including senior secured floating rate loans made to corporate and other business entities. Under normal market conditions, the Trust expects that the average effective duration of its portfolio will be no more than 1.5 years. The Trust may invest directly in such securities or synthetically through the use of derivatives.
No assurance can be given that the Trust’s investment objective will be achieved.
Trust Information
| Symbol on New York Stock Exchange |
BGT | |
| Initial Offering Date |
August 30, 2004 | |
| Current Distribution Rate on Closing Market Price as of June 30, 2021 ($12.86)(a) |
6.04% | |
| Current Monthly Distribution per Common Share(b) |
$0.0647 | |
| Current Annualized Distribution per Common Share(b) |
$0.7764 | |
| Leverage as of June 30, 2021(c) |
30% |
| (a) | Current distribution rate on closing market price is calculated by dividing the current annualized distribution per share by the closing market price. The current distribution rate may consist of income, net realized gains and/or a return of capital. Past performance is not an indication of future results. |
| (b) | The distribution rate is not constant and is subject to change. A portion of the distribution may be deemed a return of capital or net realized gain. |
| (c) | Represents bank overdraft and bank borrowings outstanding as a percentage of total managed assets, which is the total assets of the Fund (including any assets attributable to borrowings), minus the sum of liabilities (other than borrowings representing financial leverage). Does not reflect derivatives or other instruments that may give rise to economic leverage. For a discussion of leveraging techniques utilized by the Trust, please see The Benefits and Risks of Leveraging and Derivative Financial Instruments. |
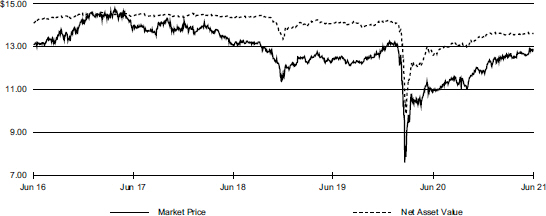
Market Price and Net Asset Value Per Share Summary
| 06/30/21 | 12/31/20 | Change | High | Low | ||||||||||||||||
| Market Price |
$ | 12.86 | $ | 11.79 | 9.08 | % | $ | 12.97 | $ | 11.72 | ||||||||||
| Net Asset Value |
13.60 | 13.40 | 1.49 | 13.65 | 13.40 | |||||||||||||||
Market Price and Net Asset Value History for the Past Five Years
| T R U S T S U M M A R Y |
15 |
| Trust Summary as of June 30, 2021 (continued) | BlackRock Floating Rate Income Trust (BGT) |
Performance and Portfolio Management Commentary
Returns for the period ended June 30, 2021 were as follows:
| Average Annual Total Returns | ||||||||||||||||
| 6-month | 1 Year | 3 Years | 5 Years | |||||||||||||
| Trust at NAV(a)(b) |
4.11 | % | 15.77 | % | 5.36 | % | 5.70 | % | ||||||||
| Trust at Market Price(a)(b) |
11.89 | 25.52 | 6.56 | 6.26 | ||||||||||||
| S&P/LSTA Leveraged Loan Index(c) |
3.28 | 11.65 | 4.39 | 4.99 | ||||||||||||
| (a) | All returns reflect reinvestment of dividends and/or distributions at actual reinvestment prices. Performance results reflect the Trust’s use of leverage. |
| (b) | The Trust’s discount to NAV narrowed during the period, which accounts for the difference between performance based on market price and performance based on NAV. |
| (c) | An unmanaged market value-weighted index (the “Reference Benchmark”) designed to measure the performance of the U.S. leveraged loan market based upon market weightings, spreads and interest payments. |
Performance results may include adjustments made for financial reporting purposes in accordance with U.S. generally accepted accounting principles. Past performance is not an indication of future results.
BGT is presenting the Reference Benchmark to accompany trust performance. The Reference Benchmark is presented for informational purposes only, as the Trust is actively managed and does not seek to track or replicate the performance of the Reference Benchmark or any other index. The portfolio investments of the Trust may differ substantially from the securities that comprise the indices within the Reference Benchmark, which may cause the Trust’s performance to differ materially from that of the Reference Benchmark. The Trust employs leverage as part of its investment strategy, which may change over time at the discretion of BlackRock Advisors, LLC (the “Manager”) as market and other conditions warrant. In contrast, the Reference Benchmark is not adjusted for leverage. Therefore, leverage generally may result in the Trust outperforming the Reference Benchmark in rising markets and underperforming in declining markets. The Board considers additional factors to evaluate the Trust’s performance, such as the performance of the Trust relative to a peer group of funds, a leverage-adjusted benchmark and/or other information provided by the Manager.
More information about the Trust’s historical performance can be found in the “Closed End Funds” section of blackrock.com.
The following discussion relates to the Trust’s absolute performance based on NAV:
What factors influenced performance?
Floating rate loan interest (“bank loans”)performed well in the first half of the period. In addition to benefiting from the tailwind of improving economic growth, concerns that the Fed may need to begin raising interest rates led to higher demand for floating rate assets.
From an asset allocation perspective, the Trust’s core exposure to bank loans and tactical allocations to high yield bonds, equities and investment-grade corporate bonds contributed to performance. From a sector perspective, the largest contributors included technology, airlines and health care. With respect to credit tiers, the Trust’s positions in B rated debt made the largest contribution to absolute returns, followed by CCCs and BBs. There were no significant detractors from absolute performance given the positive performance for the bank loan market.
Describe recent portfolio activity.
The investment adviser marginally reduced the Trust’s allocation to investment-grade bonds in favor of bank loans due to supportive supply-and-demand conditions and attractive relative values. The investment adviser’s credit rating views remained consistent over the past several quarters, with a focus on avoiding the more volatile stressed CCC category. The investment adviser tactically managed the Trust’s sector positioning, although it placed a greater focus on individual security selection later in the period. The Trust continued to use liquid, index-based derivatives in the loan and high-yield markets inorder to manage its positioning.
Describe portfolio positioning at period end.
The Trust remained predominately invested in bank loans, with the rest of the portfolio primarily invested in high yield bonds. By credit rating, B rated loans were the Trust’s largest position, and it had a much smaller weightings in the higher-risk CCC rated segment. Within the single B category, the investment adviser remained focused on higher-quality B+ and B rated debt, with less of an emphasis on securities rated B-.
The investment adviser’s core sector views stayed largely intact. Some of the Trust’s top sector positions were technology companies, particularly in the enterprise software area. Health care, consumer cyclical services and building materials were also areas where the investment adviser identified compelling risk-reward opportunities. The investment adviser maintained a lower allocation to energy and the consumer cyclical sectors, such as retailers and leisure, on the belief that these market segments continued to face significant headwinds.
The Trust had a bias toward larger loan tranches of $1 billion and above. The investment adviser maintained a preference for loan/bond capital structures over the loan-only segment. The securities that Trust did own in the latter category were typically transactions of $1 billion or more. The Trust remained underweight in the 2017 and 2018 vintages, arguably a period with more aggressive lending standards and weaker protections for loan holders.
The views expressed reflect the opinions of BlackRock as of the date of this report and are subject to change based on changes in market, economic or other conditions. These views are not intended to be a forecast of future events and are no guarantee of future results.
| 16 | 2 0 2 1 B L A C K R O C K S E M I - A N N U A L R E P O R T T O S H A R E H O L D E R S |
| Trust Summary as of June 30, 2021 (continued) | BlackRock Floating Rate Income Trust (BGT) |
Overview of the Trust’s Total Investments
| (a) | Excludes short-term securities. |
| (b) | Rounds to less than 1% of total investments. |
| (c) | For financial reporting purposes, credit quality ratings shown above reflect the highest rating assigned by either S&P Global Ratings or Moody’s Investors Service, Inc. if ratings differ. These rating agencies are independent, nationally recognized statistical rating organizations and are widely used. Investment grade ratings are credit ratings of BBB/Baa or higher. Below investment grade ratings are credit ratings of BB/Ba or lower. Investments designated N/R are not rated by either rating agency. Unrated investments do not necessarily indicate low credit quality. Credit quality ratings are subject to change. |
| (d) | The investment adviser evaluates the credit quality of unrated investments based upon certain factors including, but not limited to, credit ratings for similar investments and financial analysis of sectors and individual investments. Using this approach, the investment adviser has deemed certain of these unrated securities as investment grade quality. As of December 31, 2020, the market value of unrated securities deemed by the investment adviser to be investment grade represents less than 1% of the Trust’s total investments. |
| * | Includes one or more investment categories that individually represents less than 1% of the Trust’s total investments. Please refer to the Schedule of Investments for details. |
| T R U S T S U M M A R Y |
17 |
| Schedule of Investments (unaudited) June 30, 2021 |
BlackRock Core Bond Trust (BHK) (Percentages shown are based on Net Assets) |
| 18 | 2 0 2 1 B L A C K R O C K S E M I - A N N U A L R E P O R T T O S H A R E H O L D E R S |
| Schedule of Investments (unaudited) (continued) June 30, 2021 |
BlackRock Core Bond Trust (BHK) (Percentages shown are based on Net Assets) |
| S C H E D U L E O F I N V E S T M E N T S |
19 |
| Schedule of Investments (unaudited) (continued) June 30, 2021 |
BlackRock Core Bond Trust (BHK) (Percentages shown are based on Net Assets) |
| 20 | 2 0 2 1 B L A C K R O C K S E M I - A N N U A L R E P O R T T O S H A R E H O L D E R S |
| Schedule of Investments (unaudited) (continued) June 30, 2021 |
BlackRock Core Bond Trust (BHK) (Percentages shown are based on Net Assets) |
| S C H E D U L E O F I N V E S T M E N T S |
21 |
| Schedule of Investments (unaudited) (continued) June 30, 2021 |
BlackRock Core Bond Trust (BHK) (Percentages shown are based on Net Assets) |
| 22 | 2 0 2 1 B L A C K R O C K S E M I - A N N U A L R E P O R T T O S H A R E H O L D E R S |
| Schedule of Investments (unaudited) (continued) June 30, 2021 |
BlackRock Core Bond Trust (BHK) (Percentages shown are based on Net Assets) |
| S C H E D U L E O F I N V E S T M E N T S |
23 |
| Schedule of Investments (unaudited) (continued) June 30, 2021 |
BlackRock Core Bond Trust (BHK) (Percentages shown are based on Net Assets) |
| 24 | 2 0 2 1 B L A C K R O C K S E M I - A N N U A L R E P O R T T O S H A R E H O L D E R S |
| Schedule of Investments (unaudited) (continued) June 30, 2021 |
BlackRock Core Bond Trust (BHK) (Percentages shown are based on Net Assets) |
| S C H E D U L E O F I N V E S T M E N T S |
25 |
| Schedule of Investments (unaudited) (continued) June 30, 2021 |
BlackRock Core Bond Trust (BHK) (Percentages shown are based on Net Assets) |
| 26 | 2 0 2 1 B L A C K R O C K S E M I - A N N U A L R E P O R T T O S H A R E H O L D E R S |
| Schedule of Investments (unaudited) (continued) June 30, 2021 |
BlackRock Core Bond Trust (BHK) (Percentages shown are based on Net Assets) |
| S C H E D U L E O F I N V E S T M E N T S |
27 |
| Schedule of Investments (unaudited) (continued) June 30, 2021 |
BlackRock Core Bond Trust (BHK) (Percentages shown are based on Net Assets) |
| 28 | 2 0 2 1 B L A C K R O C K S E M I - A N N U A L R E P O R T T O S H A R E H O L D E R S |
| Schedule of Investments (unaudited) (continued) June 30, 2021 |
BlackRock Core Bond Trust (BHK) (Percentages shown are based on Net Assets) |
| S C H E D U L E O F I N V E S T M E N T S |
29 |
| Schedule of Investments (unaudited) (continued) June 30, 2021 |
BlackRock Core Bond Trust (BHK) (Percentages shown are based on Net Assets) |
| 30 | 2 0 2 1 B L A C K R O C K S E M I - A N N U A L R E P O R T T O S H A R E H O L D E R S |
| Schedule of Investments (unaudited) (continued) June 30, 2021 |
BlackRock Core Bond Trust (BHK) (Percentages shown are based on Net Assets) |
| S C H E D U L E O F I N V E S T M E N T S |
31 |
| Schedule of Investments (unaudited) (continued) June 30, 2021 |
BlackRock Core Bond Trust (BHK) (Percentages shown are based on Net Assets) |
| 32 | 2 0 2 1 B L A C K R O C K S E M I - A N N U A L R E P O R T T O S H A R E H O L D E R S |
| Schedule of Investments (unaudited) (continued) June 30, 2021 |
BlackRock Core Bond Trust (BHK) (Percentages shown are based on Net Assets) |
| S C H E D U L E O F I N V E S T M E N T S |
33 |
| Schedule of Investments (unaudited) (continued) June 30, 2021 |
BlackRock Core Bond Trust (BHK) (Percentages shown are based on Net Assets) |
| 34 | 2 0 2 1 B L A C K R O C K S E M I - A N N U A L R E P O R T T O S H A R E H O L D E R S |
| Schedule of Investments (unaudited) (continued) June 30, 2021 |
BlackRock Core Bond Trust (BHK) (Percentages shown are based on Net Assets) |
| S C H E D U L E O F I N V E S T M E N T S |
35 |
| Schedule of Investments (unaudited) (continued) June 30, 2021 |
BlackRock Core Bond Trust (BHK) (Percentages shown are based on Net Assets) |
| 36 | 2 0 2 1 B L A C K R O C K S E M I - A N N U A L R E P O R T T O S H A R E H O L D E R S |
| Schedule of Investments (unaudited) (continued) June 30, 2021 |
BlackRock Core Bond Trust (BHK) (Percentages shown are based on Net Assets) |
| S C H E D U L E O F I N V E S T M E N T S |
37 |
| Schedule of Investments (unaudited) (continued) June 30, 2021 |
BlackRock Core Bond Trust (BHK) (Percentages shown are based on Net Assets) |
| 38 | 2 0 2 1 B L A C K R O C K S E M I - A N N U A L R E P O R T T O S H A R E H O L D E R S |
| Schedule of Investments (unaudited) (continued) June 30, 2021 |
BlackRock Core Bond Trust (BHK) (Percentages shown are based on Net Assets) |
| S C H E D U L E O F I N V E S T M E N T S |
39 |
| Schedule of Investments (unaudited) (continued) June 30, 2021 |
BlackRock Core Bond Trust (BHK) (Percentages shown are based on Net Assets) |
| 40 | 2 0 2 1 B L A C K R O C K S E M I - A N N U A L R E P O R T T O S H A R E H O L D E R S |
| Schedule of Investments (unaudited) (continued) June 30, 2021 |
BlackRock Core Bond Trust (BHK) (Percentages shown are based on Net Assets) |
| S C H E D U L E O F I N V E S T M E N T S |
41 |
| Schedule of Investments (unaudited) (continued) June 30, 2021 |
BlackRock Core Bond Trust (BHK) (Percentages shown are based on Net Assets) |
| 42 | 2 0 2 1 B L A C K R O C K S E M I - A N N U A L R E P O R T T O S H A R E H O L D E R S |
| Schedule of Investments (unaudited) (continued) June 30, 2021 |
BlackRock Core Bond Trust (BHK) (Percentages shown are based on Net Assets) |
For Trust compliance purposes, the Trust’s industry classifications refer to one or more of the industry sub-classifications used by one or more widely recognized market indexes or rating group indexes, and/or as defined by the investment adviser. These definitions may not apply for purposes of this report, which may combine such industry sub-classifications for reporting ease.
| S C H E D U L E O F I N V E S T M E N T S |
43 |
| Schedule of Investments (unaudited) (continued) June 30, 2021 |
BlackRock Core Bond Trust (BHK) |
Affiliates
Investments in issuers considered to be affiliate(s) of the Trust during the six-months ended June 30, 2021 for purposes of Section 2(a)(3) of the Investment Company Act of 1940, as amended, were as follows:
| Affiliated Issuer | Value at 12/31/20 |
Purchases at Cost |
Proceeds from Sales |
Net Realized Gain (Loss) |
Change in Unrealized Appreciation (Depreciation) |
Value at 06/30/21 |
Shares Held at 06/30/21 |
Income | Capital Gain Distributions from Underlying Funds |
|||||||||||||||||||||||||||
| BlackRock Liquidity |
$ | 8,065,454 | $ | 5,756,983 | (a) | $ | — | $ | — | $ | — | $ | 13,822,437 | 13,822,437 | $ | 1,333 | $ | — | ||||||||||||||||||
|
|
|
|
|
|
|
|
|
|
|
|||||||||||||||||||||||||||
| (a) | Represents net amount purchased (sold). |
Reverse Repurchase Agreements
| Counterparty | |
Interest Rate |
|
|
Trade Date |
|
|
Maturity Date |
(a) |
Face Value | |
Face Value Including Accrued Interest |
|
Type of Non-Cash Underlying Collateral |
|
Remaining Contractual Maturity of the Agreements |
(a) | |||||||||
| BNP Paribas S.A. |
0.07 | %(b) | 11/25/20 | Open | $ | 2,607,281 | $ | 2,609,075 | U.S. Government Sponsored |
Open/Demand | ||||||||||||||||
| BNP Paribas S.A. |
0.07 | (b) | 11/25/20 | Open | 1,548,594 | 1,549,659 | U.S. Government Sponsored |
Open/Demand | ||||||||||||||||||
| BNP Paribas S.A. |
0.07 | (b) | 11/25/20 | Open | 2,586,000 | 2,587,779 | U.S. Government Sponsored |
Open/Demand | ||||||||||||||||||
| BNP Paribas S.A. |
0.08 | (b) | 11/25/20 | Open | 80,127,000 | 80,170,705 | U.S. Treasury Obligations |
Open/Demand | ||||||||||||||||||
| BNP Paribas S.A. |
0.08 | (b) | 11/25/20 | Open | 30,250,000 | 30,266,091 | U.S. Treasury Obligations |
Open/Demand | ||||||||||||||||||
| BNP Paribas S.A. |
0.08 | (b) | 11/25/20 | Open | 2,978,500 | 2,980,084 | U.S. Treasury Obligations |
Open/Demand | ||||||||||||||||||
| BNP Paribas S.A. |
0.08 | (b) | 02/12/21 | Open | 5,506,875 | 5,508,160 | U.S. Treasury Obligations |
Open/Demand | ||||||||||||||||||
| BNP Paribas S.A. |
(0.10 | )(b) | 03/25/21 | Open | 7,650,000 | 7,650,072 | U.S. Treasury Obligations |
Open/Demand | ||||||||||||||||||
| BNP Paribas S.A. |
(0.05 | )(b) | 03/30/21 | Open | 7,953,750 | 7,953,772 | U.S. Treasury Obligations |
Open/Demand | ||||||||||||||||||
| BNP Paribas S.A. |
0.07 | (b) | 03/30/21 | Open | 6,343,750 | 6,343,209 | U.S. Treasury Obligations |
Open/Demand | ||||||||||||||||||
| BNP Paribas S.A. |
(0.10 | )(b) | 04/05/21 | Open | 7,570,000 | 7,568,499 | U.S. Treasury Obligations |
Open/Demand | ||||||||||||||||||
| BNP Paribas S.A. |
(0.05 | )(b) | 04/05/21 | Open | 12,048,750 | 12,049,366 | U.S. Treasury Obligations |
Open/Demand | ||||||||||||||||||
| BNP Paribas S.A. |
0.07 | (b) | 04/05/21 | Open | 38,951,250 | 38,955,124 | U.S. Treasury Obligations |
Open/Demand | ||||||||||||||||||
| Credit Agricole Corporate and Investment Bank |
(0.03 | )(b) | 04/07/21 | Open | 1,910,000 | 1,909,339 | U.S. Treasury Obligations |
Open/Demand | ||||||||||||||||||
| Nomura Securities International, Inc. |
(0.07 | )(b) | 04/07/21 | Open | 7,049,250 | 7,047,901 | U.S. Treasury Obligations |
Open/Demand | ||||||||||||||||||
| Nomura Securities International, Inc. |
0.08 | (b) | 04/07/21 | Open | 1,500,000 | 1,500,107 | U.S. Treasury Obligations |
Open/Demand | ||||||||||||||||||
| Credit Agricole Corporate and Investment Bank |
0.25 | (b) | 04/08/21 | Open | 5,278,500 | 5,281,579 | Corporate Bonds |
Open/Demand | ||||||||||||||||||
| Credit Agricole Corporate and Investment Bank |
0.25 | (b) | 04/08/21 | Open | 4,444,200 | 4,446,792 | Corporate Bonds |
Open/Demand | ||||||||||||||||||
| Nomura Securities International, Inc. |
(0.13 | )(b) | 04/20/21 | Open | 23,593,750 | 23,591,495 | U.S. Treasury Obligations |
Open/Demand | ||||||||||||||||||
| Nomura Securities International, Inc. |
0.08 | (b) | 04/20/21 | Open | 2,838,500 | 2,838,672 | U.S. Treasury Obligations |
Open/Demand | ||||||||||||||||||
| Nomura Securities International, Inc. |
0.08 | (b) | 04/20/21 | Open | 1,117,500 | 1,117,568 | U.S. Treasury Obligations |
Open/Demand | ||||||||||||||||||
| Nomura Securities International, Inc. |
0.08 | (b) | 04/20/21 | Open | 10,526,750 | 10,527,387 | U.S. Treasury Obligations |
Open/Demand | ||||||||||||||||||
| Nomura Securities International, Inc. |
0.08 | (b) | 04/20/21 | Open | 3,435,000 | 3,435,208 | U.S. Treasury Obligations |
Open/Demand | ||||||||||||||||||
| Nomura Securities International, Inc. |
0.08 | (b) | 04/20/21 | Open | 2,649,000 | 2,649,160 | U.S. Treasury Obligations |
Open/Demand | ||||||||||||||||||
| Nomura Securities International, Inc. |
0.08 | (b) | 04/20/21 | Open | 43,028,175 | 43,030,781 | U.S. Treasury Obligations |
Open/Demand | ||||||||||||||||||
| Nomura Securities International, Inc. |
0.08 | (b) | 04/20/21 | Open | 2,227,500 | 2,227,635 | U.S. Treasury Obligations |
Open/Demand | ||||||||||||||||||
| Nomura Securities International, Inc. |
0.08 | (b) | 04/20/21 | Open | 1,808,375 | 1,808,485 | U.S. Treasury Obligations |
Open/Demand | ||||||||||||||||||
| Nomura Securities International, Inc. |
0.08 | (b) | 04/20/21 | Open | 15,839,687 | 15,840,647 | U.S. Treasury Obligations |
Open/Demand | ||||||||||||||||||
| Credit Agricole Corporate and Investment Bank |
0.06 | (b) | 04/21/21 | Open | 3,840,000 | 3,839,822 | U.S. Treasury Obligations |
Open/Demand | ||||||||||||||||||
| BNP Paribas S.A. |
0.07 | (b) | 04/30/21 | Open | 2,996,250 | 2,996,332 | U.S. Treasury Obligations |
Open/Demand | ||||||||||||||||||
| Nomura Securities International, Inc. |
0.08 | (b) | 05/06/21 | Open | 8,000,000 | 8,000,311 | U.S. Treasury Obligations |
Open/Demand | ||||||||||||||||||
| Credit Agricole Corporate and Investment Bank |
(0.03 | )(b) | 05/12/21 | Open | 952,500 | 952,460 | U.S. Treasury Obligations |
Open/Demand | ||||||||||||||||||
| Credit Agricole Corporate and Investment Bank |
0.03 | (b) | 05/12/21 | Open | 2,234,375 | 2,234,284 | U.S. Treasury Obligations |
Open/Demand | ||||||||||||||||||
| Credit Agricole Corporate and Investment Bank |
0.05 | (b) | 05/12/21 | Open | 3,000,000 | 3,000,005 | U.S. Treasury Obligations |
Open/Demand | ||||||||||||||||||
| Credit Agricole Corporate and Investment Bank |
0.09 | (b) | 05/12/21 | Open | 735,556 | 735,585 | U.S. Treasury Obligations |
Open/Demand | ||||||||||||||||||
| BNP Paribas S.A. |
0.29 | (b) | 06/04/21 | Open | 6,796,680 | 6,797,994 | Corporate Bonds |
Open/Demand |
| 44 | 2 0 2 1 B L A C K R O C K S E M I - A N N U A L R E P O R T T O S H A R E H O L D E R S
|
| Schedule of Investments (unaudited) (continued) June 30, 2021 |
BlackRock Core Bond Trust (BHK) |
Reverse Repurchase Agreements (continued)
| Counterparty | |
Interest Rate |
|
|
Trade Date |
|
|
Maturity Date |
(a) |
Face Value | |
Face Value Including Accrued Interest |
|
Type of Non-Cash Underlying Collateral |
|
Remaining Contractual Maturity of the Agreements |
(a) | |||||||||
| BNP Paribas S.A. |
0.29 | %(b) | 06/04/21 | Open | $ | 9,856,460 | $ | 9,858,366 | Corporate Bonds |
Open/Demand | ||||||||||||||||
| BNP Paribas S.A. |
0.29 | (b) | 06/04/21 | Open | 8,650,000 | 8,651,672 | Corporate Bonds |
Open/Demand | ||||||||||||||||||
| Credit Agricole Corporate and Investment Bank |
0.19 | (b) | 06/09/21 | Open | 4,195,000 | 4,195,465 | Corporate Bonds |
Open/Demand | ||||||||||||||||||
| Credit Agricole Corporate and Investment Bank |
0.05 | 06/11/21 | 07/14/21 | 8,706,848 | 8,707,054 | U.S. Government Sponsored |
Up to 30 Days | |||||||||||||||||||
| Credit Agricole Corporate and Investment Bank |
0.05 | 06/11/21 | 07/14/21 | 10,736,468 | 10,736,722 | U.S. Government Sponsored |
Up to 30 Days | |||||||||||||||||||
| Credit Agricole Corporate and Investment Bank |
0.05 | 06/11/21 | 07/14/21 | 12,752,560 | 12,752,861 | U.S. Government Sponsored |
Up to 30 Days | |||||||||||||||||||
| Royal Bank of Canada |
0.06 | 06/11/21 | 07/14/21 | 4,660,862 | 4,660,994 | U.S. Government Sponsored |
Up to 30 Days | |||||||||||||||||||
| Royal Bank of Canada |
0.06 | 06/11/21 | 07/14/21 | 3,181,912 | 3,182,002 | U.S. Government Sponsored |
Up to 30 Days | |||||||||||||||||||
| Royal Bank of Canada |
0.06 | 06/11/21 | 07/14/21 | 406,812 | 406,824 | U.S. Government Sponsored |
Up to 30 Days | |||||||||||||||||||
| Royal Bank of Canada |
0.06 | 06/11/21 | 07/14/21 | 929,388 | 929,415 | U.S. Government Sponsored |
Up to 30 Days | |||||||||||||||||||
| Royal Bank of Canada |
0.06 | 06/11/21 | 07/14/21 | 1,210,899 | 1,210,933 | U.S. Government Sponsored |
Up to 30 Days | |||||||||||||||||||
| Royal Bank of Canada |
0.06 | 06/11/21 | 07/14/21 | 30,638 | 30,639 | U.S. Government Sponsored |
Up to 30 Days | |||||||||||||||||||
| Royal Bank of Canada |
0.06 | 06/11/21 | 07/14/21 | 5,914,743 | 5,914,910 | U.S. Government Sponsored |
Up to 30 Days | |||||||||||||||||||
| Royal Bank of Canada |
0.06 | 06/11/21 | 07/14/21 | 7,187,011 | 7,187,214 | U.S. Government Sponsored |
Up to 30 Days | |||||||||||||||||||
| Royal Bank of Canada |
0.06 | 06/11/21 | 07/14/21 | 1,230,434 | 1,230,469 | U.S. Government Sponsored |
Up to 30 Days | |||||||||||||||||||
| Royal Bank of Canada |
0.06 | 06/11/21 | 07/14/21 | 5,250,199 | 5,250,348 | U.S. Government Sponsored |
Up to 30 Days | |||||||||||||||||||
| Royal Bank of Canada |
0.06 | 06/11/21 | 07/14/21 | 1,269,490 | 1,269,526 | U.S. Government Sponsored |
Up to 30 Days | |||||||||||||||||||
| Royal Bank of Canada |
0.06 | 06/11/21 | 07/14/21 | 3,766,694 | 3,766,801 | U.S. Government Sponsored |
Up to 30 Days | |||||||||||||||||||
| Royal Bank of Canada |
0.06 | 06/11/21 | 07/14/21 | 493,140 | 493,154 | U.S. Government Sponsored |
Up to 30 Days | |||||||||||||||||||
| Royal Bank of Canada |
0.06 | 06/11/21 | 07/14/21 | 976,954 | 976,982 | U.S. Government Sponsored |
Up to 30 Days | |||||||||||||||||||
| Royal Bank of Canada |
0.06 | 06/11/21 | 07/14/21 | 3,226,116 | 3,226,207 | U.S. Government Sponsored |
Up to 30 Days | |||||||||||||||||||
| Royal Bank of Canada |
0.06 | 06/11/21 | 07/14/21 | 1,455,903 | 1,455,944 | U.S. Government Sponsored |
Up to 30 Days | |||||||||||||||||||
| Barclays Capital, Inc. |
(3.00 | )(b) | 06/11/21 | Open | 144,115 | 143,911 | Corporate Bonds |
Open/Demand | ||||||||||||||||||
| Credit Suisse Securities (USA) LLC |
(3.00 | )(b) | 06/11/21 | Open | 63,652 | 63,562 | Corporate Bonds |
Open/Demand | ||||||||||||||||||
| BNP Paribas S.A. |
(1.00 | )(b) | 06/22/21 | Open | 39,093 | 39,084 | Corporate Bonds |
Open/Demand | ||||||||||||||||||
| TD Securities (USA) LLC |
0.25 | (b) | 06/29/21 | Open | 7,826,337 | 7,826,392 | Foreign Agency Obligations |
Open/Demand | ||||||||||||||||||
|
|
|
|
|
|||||||||||||||||||||||
| $ | 466,085,026 | $ | 466,168,595 | |||||||||||||||||||||||
|
|
|
|
|
| (a) | Certain agreements have no stated maturity and can be terminated by either party at any time. |
| (b) | Variable rate security. Rate as of period end and maturity is the date the principal owed can be recovered through demand. |
Derivative Financial Instruments Outstanding as of Period End
Futures Contracts
| Description | Number of Contracts |
Expiration Date |
Notional Amount (000) |
Value/ Unrealized Appreciation (Depreciation) |
||||||||||||
| Long Contracts |
||||||||||||||||
| Euro Bund |
44 | 09/08/21 | $ | 9,006 | $ | 56,821 | ||||||||||
| S C H E D U L E O F I N V E S T M E N T S |
45 |
| Schedule of Investments (unaudited) (continued) June 30, 2021 |
BlackRock Core Bond Trust (BHK) |
Futures Contracts (continued)
| Description | Number of Contracts |
Expiration Date |
Notional Amount (000) |
Value/ Unrealized |
||||||||||||
| Long Contracts (continued) |
||||||||||||||||
| 10-Year U.S. Ultra Long Treasury Note |
115 | 09/21/21 | $ | 16,912 | $ | 272,040 | ||||||||||
| Ultra U.S. Treasury Bond |
161 | 09/21/21 | 30,993 | 1,234,079 | ||||||||||||
|
|
|
|||||||||||||||
| 1,562,940 | ||||||||||||||||
|
|
|
|||||||||||||||
| Short Contracts |
||||||||||||||||
| Euro OAT |
53 | 09/08/21 | 9,995 | (44,668 | ) | |||||||||||
| 10-Year U.S. Treasury Note |
443 | 09/21/21 | 58,663 | (197,023 | ) | |||||||||||
| U.S. Long Bond |
18 | 09/21/21 | 2,890 | (64,088 | ) | |||||||||||
| 2-Year U.S. Treasury Note |
211 | 09/30/21 | 46,488 | 67,318 | ||||||||||||
| 5-Year U.S. Treasury Note |
255 | 09/30/21 | 31,463 | (24,243 | ) | |||||||||||
|
|
|
|||||||||||||||
| (262,704 | ) | |||||||||||||||
|
|
|
|||||||||||||||
| $ | 1,300,236 | |||||||||||||||
|
|
|
|||||||||||||||
Forward Foreign Currency Exchange Contracts
| Currency Purchased | Currency Sold | Counterparty | Settlement Date | Unrealized Appreciation (Depreciation) |
||||||||||||||
| USD |
265,257 | CAD | 321,000 | State Street Bank and Trust Co. | 09/15/21 | $ | 6,311 | |||||||||||
| USD |
5,582,287 | EUR | 4,605,000 | BNP Paribas S.A. | 09/15/21 | 113,597 | ||||||||||||
| USD |
984,979 | GBP | 697,000 | Barclays Bank PLC | 09/15/21 | 20,658 | ||||||||||||
| USD |
5,606,917 | GBP | 3,972,000 | Barclays Bank PLC | 09/15/21 | 111,533 | ||||||||||||
|
|
|
|||||||||||||||||
| $ | 252,099 | |||||||||||||||||
|
|
|
|||||||||||||||||
Exchange-Traded Options Purchased
| Description | Number of Contracts |
Expiration Date |
Exercise Price | Notional Amount (000) |
Value | |||||||||||||||||||||||
| Put |
||||||||||||||||||||||||||||
| 90-Day Eurodollar Future |
229 | 09/10/21 | USD | 99.63 | USD | 23 | $ | 31,488 | ||||||||||||||||||||
| 90-Day Eurodollar Future |
229 | 09/10/21 | USD | 99.50 | USD | 23 | 289,112 | |||||||||||||||||||||
| 90-Day Eurodollar Future |
244 | 10/15/21 | USD | 99.25 | USD | 24 | 24,400 | |||||||||||||||||||||
|
|
|
|||||||||||||||||||||||||||
| $ | 345,000 | |||||||||||||||||||||||||||
|
|
|
|||||||||||||||||||||||||||
OTC Interest Rate Swaptions Purchased
| Paid by the Trust |
Received by the Trust | Expiration | Exercise | Notional | ||||||||||||||||||||||||||||||
| Description | Rate | Frequency | Rate | Frequency | Counterparty | Date | Rate | Amount (000) | Value | |||||||||||||||||||||||||
| Call |
||||||||||||||||||||||||||||||||||
| 5-Year Interest Rate Swap, 04/07/27 |
3-Month LIBOR, 0.15% |
Quarterly | 1.53% | Semi-Annual | JPMorgan Chase |
04/05/22 | 1.53 | % | USD | 6,960 | $ | 152,801 | ||||||||||||||||||||||
| 5-Year Interest Rate Swap, 04/10/27 |
3-Month LIBOR, 0.15% |
Quarterly | 1.39% | Semi-Annual | Morgan Stanley & Co. International PLC |
04/08/22 | 1.39 | USD | 13,700 | 231,028 | ||||||||||||||||||||||||
| 5-Year Interest Rate Swap, 04/30/27 |
3-Month LIBOR, 0.15% |
Quarterly | 1.20% | Semi-Annual | Bank of America N.A. |
04/28/22 | 1.20 | USD | 19,220 | 212,978 | ||||||||||||||||||||||||
| 10-Year Interest Rate Swap, 03/09/34 |
3-Month LIBOR, 0.15% |
Quarterly | 2.98% | Semi-Annual | Barclays Bank PLC |
03/07/24 | 2.98 | USD | 3,510 | 398,851 | ||||||||||||||||||||||||
| 10-Year Interest Rate Swap, 03/14/34 |
3-Month LIBOR, 0.15% |
Quarterly | 2.95% | Semi-Annual | Barclays Bank PLC |
03/12/24 | 2.95 | USD | 3,510 | 391,104 | ||||||||||||||||||||||||
| 10-Year Interest Rate Swap, 06/26/34 |
3-Month LIBOR, 0.15% |
Quarterly | 1.97% | Semi-Annual | Goldman Sachs Bank |
06/24/24 | 1.97 | USD | 2,455 | 115,662 | ||||||||||||||||||||||||
| 10-Year Interest Rate Swap, 06/30/34 |
3-Month LIBOR, 0.15% |
Quarterly | 2.00% | Semi-Annual | Goldman Sachs Bank |
06/28/24 | 2.00 | USD | 2,455 | 119,444 | ||||||||||||||||||||||||
| 1-Year Interest Rate Swap, 02/26/26 |
3-Month LIBOR, 0.15% |
Quarterly | 1.60% | Semi-Annual | Bank of America N.A. |
02/24/25 | 1.59 | USD | 22,120 | 120,663 | ||||||||||||||||||||||||
| 46 | 2 0 2 1 B L A C K R O C K S E M I - A N N U A L R E P O R T T O S H A R E H O L D E R S |
| Schedule of Investments (unaudited) (continued) June 30, 2021 |
BlackRock Core Bond Trust (BHK) |
OTC Interest Rate Swaptions Purchased (continued)
| Paid by the Trust |
Received by the Trust | Expiration | Exercise | Notional | ||||||||||||||||||||||||||||
| Description | Rate | Frequency | Rate | Frequency | Counterparty | Date | Rate | Amount (000) | Value | |||||||||||||||||||||||
| Call (continued) |
||||||||||||||||||||||||||||||||
| 1-Year Interest Rate Swap, 02/26/26 |
3-Month LIBOR, 0.15% |
Quarterly | 1.62% | Semi-Annual | Morgan Stanley & Co. International PLC |
02/24/25 | 1.62 | % | USD | 55,360 | $ | 310,204 | ||||||||||||||||||||
| 10-Year Interest Rate Swap, 02/27/35 |
3-Month LIBOR, 0.15% |
Quarterly | 1.49% | Semi-Annual | Citibank N.A. |
02/25/25 | 1.49 | USD | 2,570 | 75,077 | ||||||||||||||||||||||
| 10-Year Interest Rate Swap, 05/02/35 |
3-Month LIBOR, 0.15% |
Quarterly | 0.89% | Semi-Annual | Deutsche Bank AG |
04/30/25 | 0.89 | USD | 1,640 | 24,183 | ||||||||||||||||||||||
| 10-Year Interest Rate Swap, 06/06/35 |
3-Month LIBOR, 0.15% |
Quarterly | 1.28% | Semi-Annual | Goldman Sachs Bank USA |
06/04/25 | 1.28 | USD | 1,120 | 26,631 | ||||||||||||||||||||||
| 10-Year Interest Rate Swap, 06/07/35 |
3-Month LIBOR, 0.15% |
Quarterly | 1.43% | Semi-Annual | UBS AG |
06/05/25 | 1.43 | USD | 1,120 | 31,436 | ||||||||||||||||||||||
| 10-Year Interest Rate Swap, 08/09/35 |
3-Month LIBOR, 0.15% |
Quarterly | 0.91% | Semi-Annual | Morgan Stanley & Co. International PLC |
08/07/25 | 0.91 | USD | 1,930 | 30,809 | ||||||||||||||||||||||
| 10-Year Interest Rate Swap, 08/09/35 |
3-Month LIBOR, 0.15% |
Quarterly | 0.91% | Semi-Annual | Morgan Stanley & Co. International PLC |
08/07/25 | 0.91 | USD | 620 | 9,897 | ||||||||||||||||||||||
| 10-Year Interest Rate Swap, 04/09/36 |
3-Month LIBOR, 0.15% |
Quarterly | 2.60% | Semi-Annual | Deutsche Bank AG |
04/07/26 | 2.60 | USD | 3,560 | 305,045 | ||||||||||||||||||||||
| 10-Year Interest Rate Swap, 06/29/38(a) |
3-Month LIBOR, 0.15% |
Quarterly | 3.05% | Semi-Annual | Deutsche Bank AG |
06/27/28 | 3.05 | USD | 3,125 | 146,234 | ||||||||||||||||||||||
| 10-Year Interest Rate Swap, 01/12/39 |
3-Month LIBOR, 0.15% |
Quarterly | 3.04% | Semi-Annual | Nomura International Plc |
01/10/29 | 3.04 | USD | 1,000 | 114,267 | ||||||||||||||||||||||
| 10-Year Interest Rate Swap, 01/13/39 |
3-Month LIBOR, 0.15% |
Quarterly | 3.04% | Semi-Annual | Morgan Stanley & Co. International PLC |
01/11/29 | 3.04 | USD | 1,000 | 114,092 | ||||||||||||||||||||||
| 10-Year Interest Rate Swap, 01/31/39 |
3-Month LIBOR, 0.15% |
Quarterly | 3.08% | Semi-Annual | Barclays Bank PLC |
01/29/29 | 3.08 | USD | 1,020 | 119,380 | ||||||||||||||||||||||
| 10-Year Interest Rate Swap, 08/09/40 |
3-Month LIBOR, 0.15% |
Quarterly | 1.05% | Semi-Annual | Morgan Stanley & Co. International PLC |
08/07/30 | 1.05 | USD | 1,210 | 36,313 | ||||||||||||||||||||||
| 10-Year Interest Rate Swap, 04/29/48 |
3-Month LIBOR, 0.15% |
Quarterly | 2.99% | Semi-Annual | JPMorgan Chase Bank N.A. |
04/27/38 | 2.98 | USD | 910 | 102,095 | ||||||||||||||||||||||
| 10-Year Interest Rate Swap, 02/24/49 |
3-Month LIBOR, 0.15% |
Quarterly | 2.86% | Semi-Annual | JPMorgan Chase Bank N.A. |
02/22/39 | 2.86 | USD | 933 | 98,688 | ||||||||||||||||||||||
| 10-Year Interest Rate Swap, 08/09/50 |
3-Month LIBOR, 0.15% |
Quarterly | 0.91% | Semi-Annual | Morgan Stanley & Co. International PLC |
08/07/40 | 0.91 | USD | 730 | 27,402 | ||||||||||||||||||||||
|
|
|
|||||||||||||||||||||||||||||||
| 3,314,284 | ||||||||||||||||||||||||||||||||
|
|
|
|||||||||||||||||||||||||||||||
| Put |
||||||||||||||||||||||||||||||||
| 5-Year Interest Rate Swap, 11/17/26 |
(0.15%) | Annual | |
6-Month EURIBOR, (0.52%) |
|
Semi-Annual | Barclays Bank PLC |
11/15/21 | (0.15 | ) | EUR | 12,150 | 40,948 | |||||||||||||||||||
| 10-Year Interest Rate Swap, 01/13/32 |
1.25% | |
Semi- Annual |
|
6-Month JPY LIBOR, (0.07%) |
|
Semi-Annual | Credit Suisse International |
01/11/22 | 1.25 | JPY | 250,000 | — | |||||||||||||||||||
| 10-Year Interest Rate Swap, 02/24/32 |
1.55% | |
Semi- Annual |
|
6-Month JPY LIBOR, (0.07%) |
|
Semi-Annual | Credit Suisse International |
02/22/22 | 1.55 | JPY | 250,000 | — | |||||||||||||||||||
| 10-Year Interest Rate Swap, 03/18/32 |
1.60% | |
Semi- Annual |
|
6-Month JPY LIBOR, (0.07%) |
|
Semi-Annual | JPMorgan Chase Bank N.A. |
03/16/22 | 1.60 | JPY | 250,000 | — | |||||||||||||||||||
| 10-Year Interest Rate Swap, 04/06/32 |
1.45% | |
Semi- Annual |
|
6-Month JPY LIBOR, (0.07%) |
|
Semi-Annual | JPMorgan Chase Bank N.A. |
04/04/22 | 1.45 | JPY | 250,000 | — | |||||||||||||||||||
| 5-Year Interest Rate Swap, 04/07/27 |
1.53% | |
Semi- Annual |
|
3-Month LIBOR, 0.15% |
|
Quarterly | JPMorgan Chase Bank N.A. |
04/05/22 | 1.53 | USD | 6,960 | 43,889 | |||||||||||||||||||
| 5-Year Interest Rate Swap, 04/10/27 |
1.39% | |
Semi- Annual |
|
3-Month LIBOR, 0.15% |
|
Quarterly | Morgan Stanley & Co. International PLC |
04/08/22 | 1.39 | USD | 13,700 | 113,551 | |||||||||||||||||||
| 10-Year Interest Rate Swap, 04/23/32 |
1.90% | |
Semi- Annual |
|
3-Month LIBOR, 0.15% |
|
Quarterly | Deutsche Bank AG |
04/21/22 | 1.90 | USD | 92,900 | 1,217,773 | |||||||||||||||||||
| 15-Year Interest Rate Swap, 05/05/37 |
3.25% | |
Semi- Annual |
|
3-Month LIBOR, 0.15% |
|
Quarterly | Goldman Sachs Bank USA |
05/03/22 | 3.25 | USD | 4,050 | 7,577 | |||||||||||||||||||
| 30-Year Interest Rate Swap, 05/11/52 |
2.85% | |
Semi- Annual |
|
3-Month LIBOR, 0.15% |
|
Quarterly | Nomura International Plc |
05/09/22 | 2.85 | USD | 4,750 | 31,422 | |||||||||||||||||||
| 10-Year Interest Rate Swap, 08/04/32 |
2.25% | |
Semi- Annual |
|
3-Month LIBOR, 0.15% |
|
Quarterly | JPMorgan Chase Bank N.A. |
08/02/22 | 2.25 | USD | 4,160 | 41,070 | |||||||||||||||||||
| S C H E D U L E O F I N V E S T M E N T S |
47 |
| Schedule of Investments (unaudited) (continued) June 30, 2021 |
BlackRock Core Bond Trust (BHK) |
OTC Interest Rate Swaptions Purchased (continued)
| Paid by the Trust |
Received by the Trust | Expiration | Exercise | Notional | ||||||||||||||||||||||||||||||||
| Description | Rate | Frequency | Rate | Frequency | Counterparty | Date | Rate | Amount (000) | Value | |||||||||||||||||||||||||||
| Put (continued) |
||||||||||||||||||||||||||||||||||||
| 10-Year Interest Rate Swap, 08/10/32 |
2.25% | Semi-Annual | |
3-Month LIBOR, 0.15% |
|
Quarterly | Barclays Bank PLC |
08/08/22 | 2.25 | % | USD | 4,270 | $ | 43,052 | ||||||||||||||||||||||
| 10-Year Interest Rate Swap, 03/09/34 |
2.98% | Semi-Annual | |
3-Month LIBOR, 0.15% |
|
Quarterly | Barclays Bank PLC |
03/07/24 | 2.98 | USD | 3,510 | 45,504 | ||||||||||||||||||||||||
| 10-Year Interest Rate Swap, 03/14/34 |
2.95% | Semi-Annual | |
3-Month LIBOR, 0.15% |
|
Quarterly | Barclays Bank PLC |
03/12/24 | 2.95 | USD | 3,510 | 47,105 | ||||||||||||||||||||||||
| 10-Year Interest Rate Swap, 06/15/34 |
2.50% | Semi-Annual | |
3-Month LIBOR, 0.15% |
|
Quarterly | Morgan Stanley & Co. International PLC |
06/13/24 | 2.50 | USD | 3,950 | 94,205 | ||||||||||||||||||||||||
| 10-Year Interest Rate Swap, 06/22/34 |
2.50% | Semi-Annual | |
3-Month LIBOR, 0.15% |
|
Quarterly | Morgan Stanley & Co. International PLC |
06/20/24 | 2.50 | USD | 3,950 | 94,780 | ||||||||||||||||||||||||
| 10-Year Interest Rate Swap, 06/26/34 |
1.97% | Semi-Annual | |
3-Month LIBOR, 0.15% |
|
Quarterly | Goldman Sachs Bank USA |
06/24/24 | 1.97 | USD | 2,455 | 101,090 | ||||||||||||||||||||||||
| 10-Year Interest Rate Swap, 06/30/34 |
2.00% | Semi-Annual | |
3-Month LIBOR, 0.15% |
|
Quarterly | Goldman Sachs Bank USA |
06/28/24 | 2.00 | USD | 2,455 | 98,455 | ||||||||||||||||||||||||
| 1-Year Interest Rate Swap, 02/26/26 |
1.60% | Semi-Annual | |
3-Month LIBOR, 0.15% |
|
Quarterly | Bank of America N.A. |
02/24/25 | 1.60 | USD | 22,120 | 119,585 | ||||||||||||||||||||||||
| 1-Year Interest Rate Swap, 02/26/26 |
1.62% | Semi-Annual | |
3-Month LIBOR, 0.15% |
|
Quarterly | Morgan Stanley & Co. International PLC |
02/24/25 | 1.62 | USD | 55,360 | 294,063 | ||||||||||||||||||||||||
| 10-Year Interest Rate Swap, 02/27/35 |
1.49% | Semi-Annual | |
3-Month LIBOR, 0.15% |
|
Quarterly | Citibank N.A. |
02/25/25 | 1.49 | USD | 2,570 | 181,531 | ||||||||||||||||||||||||
| 10-Year Interest Rate Swap, 05/02/35 |
0.89% | Semi-Annual | |
3-Month LIBOR, 0.15% |
|
Quarterly | Deutsche Bank AG |
04/30/25 | 0.89 | USD | 1,640 | 182,245 | ||||||||||||||||||||||||
| 10-Year Interest Rate Swap, 06/06/35 |
1.28% | Semi-Annual | |
3-Month LIBOR, 0.15% |
|
Quarterly | Goldman Sachs Bank USA |
06/04/25 | 1.28 | USD | 1,120 | 95,408 | ||||||||||||||||||||||||
| 10-Year Interest Rate Swap, 06/07/35 |
1.43% | Semi-Annual | |
3-Month LIBOR, 0.15% |
|
Quarterly | UBS AG |
06/05/25 | 1.43 | USD | 1,120 | 85,534 | ||||||||||||||||||||||||
| 10-Year Interest Rate Swap, 08/09/35 |
0.91% | Semi-Annual | |
3-Month LIBOR, 0.15% |
|
Quarterly | Morgan Stanley & Co. International PLC |
08/07/25 | 0.91 | USD | 620 | 68,960 | ||||||||||||||||||||||||
| 10-Year Interest Rate Swap, 08/09/35 |
0.91% | Semi-Annual | |
3-Month LIBOR, 0.15% |
|
Quarterly | Morgan Stanley & Co. International PLC |
08/07/25 | 0.91 | USD | 1,930 | 214,666 | ||||||||||||||||||||||||
| 10-Year Interest Rate Swap, 04/09/36 |
2.60% | Semi-Annual | |
3-Month LIBOR, 0.15% |
|
Quarterly | Deutsche Bank AG |
04/07/26 | 2.60 | USD | 3,560 | 116,608 | ||||||||||||||||||||||||
| 10-Year Interest Rate Swap, 04/14/37 |
3.00% | Semi-Annual | |
3-Month LIBOR, 0.15% |
|
Quarterly | JPMorgan Chase Bank N.A. |
04/12/27 | 3.00 | USD | 2,590 | 71,092 | ||||||||||||||||||||||||
| 10-Year Interest Rate Swap, 01/12/39 |
3.04% | Semi-Annual | |
3-Month LIBOR, 0.15% |
|
Quarterly | Nomura International Plc |
01/10/29 | 3.04 | USD | 1,000 | 31,252 | ||||||||||||||||||||||||
| 10-Year Interest Rate Swap, 01/13/39 |
3.04% | Semi-Annual | |
3-Month LIBOR, 0.15% |
|
Quarterly | Morgan Stanley & Co. International PLC |
01/11/29 | 3.04 | USD | 1,000 | 31,342 | ||||||||||||||||||||||||
| 10-Year Interest Rate Swap, 01/31/39 |
3.08% | Semi-Annual | |
3-Month LIBOR, 0.15% |
|
Quarterly | Barclays Bank PLC |
01/29/29 | 3.08 | USD | 1,020 | 31,082 | ||||||||||||||||||||||||
| 10-Year Interest Rate Swap, 08/09/40 |
1.05% | Semi-Annual | |
3-Month LIBOR, 0.15% |
|
Quarterly | Morgan Stanley & Co. International PLC |
08/07/30 | 1.05 | USD | 1,210 | 137,339 | ||||||||||||||||||||||||
| 20-Year Interest Rate Swap, 08/11/53 |
4.00% | Annual | |
6-Month EURIBOR, (0.52%) |
|
|
Semi- Annual |
Barclays Bank PLC |
08/09/33 | 4.00 | EUR | 2,410 | 37,032 | |||||||||||||||||||||||
| 10-Year Interest Rate Swap, 04/29/48 |
2.99% | Semi-Annual | |
3-Month LIBOR, 0.15% |
|
Quarterly | JPMorgan Chase Bank N.A. |
04/27/38 | 2.98 | USD | 910 | 34,466 | ||||||||||||||||||||||||
| 10-Year Interest Rate Swap, 02/24/49 |
2.86% | Semi-Annual | |
3-Month LIBOR, 0.15% |
|
Quarterly | JPMorgan Chase Bank N.A. |
02/22/39 | 2.86 | USD | 933 | 37,542 | ||||||||||||||||||||||||
| 10-Year Interest Rate Swap, 08/09/50 |
0.91% | Semi-Annual | |
3-Month LIBOR, 0.15% |
|
Quarterly | Morgan Stanley & Co. International PLC |
08/07/40 | 0.91 | USD | 730 | 76,978 | ||||||||||||||||||||||||
|
|
|
|||||||||||||||||||||||||||||||||||
| 3,867,146 | ||||||||||||||||||||||||||||||||||||
|
|
|
|||||||||||||||||||||||||||||||||||
| $ | 7,181,430 | |||||||||||||||||||||||||||||||||||
|
|
|
|||||||||||||||||||||||||||||||||||
| (a) | Forward settling swaption. |
| 48 | 2 0 2 1 B L A C K R O C K S E M I - A N N U A L R E P O R T T O S H A R E H O L D E R S |
| Schedule of Investments (unaudited) (continued) June 30, 2021 |
BlackRock Core Bond Trust (BHK) |
Exchange-Traded Options Written
| Description | Number of Contracts |
Expiration Date |
Exercise Price | Notional Amount (000) |
Value | |||||||||||||||||||
| Call | ||||||||||||||||||||||||
| 10-Year U.S. Treasury Note Future |
60 | 07/23/21 | USD | 132.50 | USD | 7,945 | $ | (30,938 | ) | |||||||||||||||
|
|
|
|||||||||||||||||||||||
| Put | ||||||||||||||||||||||||
| 10-Year U.S. Treasury Note Future |
60 | 07/23/21 | USD | 130.50 | USD | 7,945 | (3,750 | ) | ||||||||||||||||
| 90-Day Eurodollar Future |
229 | 09/10/21 | USD | 99.38 | USD | 23 | (220,412 | ) | ||||||||||||||||
| 90-Day Eurodollar Future |
229 | 09/10/21 | USD | 99.75 | USD | 23 | (70,131 | ) | ||||||||||||||||
|
|
|
|||||||||||||||||||||||
| (294,293 | ) | |||||||||||||||||||||||
|
|
|
|||||||||||||||||||||||
| $ | (325,231 | ) | ||||||||||||||||||||||
|
|
|
|||||||||||||||||||||||
OTC Interest Rate Swaptions Written
|
|
Paid by the Trust |
Received by the Trust |
|
Expiration Date |
Exercise Rate |
Notional Amount (000) |
|
|||||||||||||||||||||||
| Description | Rate | Frequency | Rate | Frequency | Counterparty | Value | ||||||||||||||||||||||||
| Call |
||||||||||||||||||||||||||||||
| 10-Year Interest Rate Swap, 08/07/31 |
0.75% | Semi-Annual | 3-Month LIBOR, 0.15% | Quarterly | Bank of America N.A. |
08/05/21 | 0.75 | % | USD | 1,195 | $ | (20 | ) | |||||||||||||||||
| 10-Year Interest Rate Swap, 09/24/31 |
1.52% | Semi-Annual | 3-Month LIBOR, 0.15% | Quarterly | Citibank N.A. |
09/22/21 | 1.52 | USD | 5,730 | (84,845 | ) | |||||||||||||||||||
| 10-Year Interest Rate Swap, 10/16/31 |
1.78% | Semi-Annual | 3-Month LIBOR, 0.15% | Quarterly | Goldman Sachs Bank USA |
10/14/21 | 1.77 | USD | 3,040 | (98,040 | ) | |||||||||||||||||||
| 2-Year Interest Rate Swap, 01/12/24 |
0.51% | Semi-Annual | 3-Month LIBOR, 0.15% | Quarterly | Morgan Stanley & Co. International PLC |
01/10/22 | 0.51 | USD | 38,450 | (93,198 | ) | |||||||||||||||||||
| 10-Year Interest Rate Swap, 01/29/32 |
1.00% | Semi-Annual | 3-Month LIBOR, 0.15% | Quarterly | Deutsche Bank AG |
01/27/22 | 1.00 | USD | 3,880 | (14,907 | ) | |||||||||||||||||||
| 10-Year Interest Rate Swap, 01/29/32 |
1.25% | Semi-Annual | 3-Month LIBOR, 0.15% | Quarterly | Bank of America N.A. |
01/27/22 | 1.25 | USD | 3,560 | (30,354 | ) | |||||||||||||||||||
| 10-Year Interest Rate Swap, 02/20/32 |
1.62% | Semi-Annual | 3-Month LIBOR, 0.15% | Quarterly | Bank of America N.A. |
02/18/22 | 1.62 | USD | 3,350 | (80,496 | ) | |||||||||||||||||||
| 2-Year Interest Rate Swap, 02/25/24 |
0.41% | Semi-Annual | 3-Month LIBOR, 0.15% | Quarterly | Goldman Sachs Bank USA |
02/23/22 | 0.41 | USD | 38,130 | (48,630 | ) | |||||||||||||||||||
| 2-Year Interest Rate Swap, 03/03/24 |
0.51% | Semi-Annual | 3-Month LIBOR, 0.15% | Quarterly | Deutsche Bank AG |
03/01/22 | 0.51 | USD | 33,910 | (73,054 | ) | |||||||||||||||||||
| 2-Year Interest Rate Swap, 03/04/24 |
0.49% | Semi-Annual | 3-Month LIBOR, 0.15% | Quarterly | JPMorgan Chase Bank N.A. |
03/02/22 | 0.49 | USD | 50,670 | (97,804 | ) | |||||||||||||||||||
| 2-Year Interest Rate Swap, 03/05/24 |
0.52% | Semi-Annual | 3-Month LIBOR, 0.15% | Quarterly | Citibank N.A. |
03/03/22 | 0.52 | USD | 17,280 | (38,531 | ) | |||||||||||||||||||
| 2-Year Interest Rate Swap, 03/23/24 |
0.56% | Semi-Annual | 3-Month LIBOR, 0.15% | Quarterly | Deutsche Bank AG |
03/21/22 | 0.56 | USD | 17,280 | (45,268 | ) | |||||||||||||||||||
| 2-Year Interest Rate Swap, 03/25/24 |
0.57% | Semi-Annual | 3-Month LIBOR, 0.15% | Quarterly | Deutsche Bank AG |
03/23/22 | 0.57 | USD | 33,470 | (89,753 | ) | |||||||||||||||||||
| 10-Year Interest Rate Swap, 04/23/32 |
1.25% | Semi-Annual | 3-Month LIBOR, 0.15% | Quarterly | Deutsche Bank AG |
04/21/22 | 1.25 | USD | 92,900 | (952,498 | ) | |||||||||||||||||||
| 5-Year Interest Rate Swap, 04/24/27 |
0.90% | Semi-Annual | 3-Month LIBOR, 0.15% | Quarterly | Bank of America N.A. |
04/22/22 | 0.90 | USD | 9,610 | (45,565 | ) | |||||||||||||||||||
| 5-Year Interest Rate Swap, 04/30/27 |
0.90% | Semi-Annual | 3-Month LIBOR, 0.15% | Quarterly | Bank of America N.A. |
04/28/22 | 0.90 | USD | 28,830 | (136,824 | ) | |||||||||||||||||||
| 10-Year Interest Rate Swap, 05/04/32 |
0.74% | Semi-Annual | 3-Month LIBOR, 0.15% | Quarterly | Deutsche Bank AG |
05/02/22 | 0.74 | USD | 2,540 | (6,622 | ) | |||||||||||||||||||
| 10-Year Interest Rate Swap, 06/09/32 |
1.40% | Semi-Annual | 3-Month LIBOR, 0.15% | Quarterly | JPMorgan Chase Bank N.A. |
06/07/22 | 1.40 | USD | 4,475 | (70,334 | ) | |||||||||||||||||||
| 10-Year Interest Rate Swap, 08/10/32 |
0.72% | Semi-Annual | 3-Month LIBOR, 0.15% | Quarterly | Deutsche Bank AG |
08/08/22 | 0.72 | USD | 485 | (1,607 | ) | |||||||||||||||||||
| 10-Year Interest Rate Swap, 10/13/32 |
1.06% | Semi-Annual | 3-Month LIBOR, 0.15% | Quarterly | Deutsche Bank AG |
10/11/22 | 1.06 | USD | 2,780 | (23,915 | ) | |||||||||||||||||||
| 10-Year Interest Rate Swap, 12/18/32 |
1.23% | Semi-Annual | 3-Month LIBOR, 0.15% | Quarterly | Goldman Sachs Bank USA |
12/16/22 | 1.23 | USD | 2,560 | (33,692 | ) | |||||||||||||||||||
| 10-Year Interest Rate Swap, 12/18/32 |
1.25% | Semi-Annual | 3-Month LIBOR, 0.15% | Quarterly | Goldman Sachs Bank USA |
12/16/22 | 1.24 | USD | 2,560 | (34,524 | ) | |||||||||||||||||||
| 10-Year Interest Rate Swap, 01/01/33 |
1.25% | Semi-Annual | 3-Month LIBOR, 0.15% | Quarterly | Citibank N.A. |
12/30/22 | 1.25 | USD | 2,820 | (39,188 | ) | |||||||||||||||||||
| S C H E D U L E O F I N V E S T M E N T S |
49 |
| Schedule of Investments (unaudited) (continued) June 30, 2021 |
BlackRock Core Bond Trust (BHK) |
OTC Interest Rate Swaptions Written (continued)
|
|
Paid by the Trust |
Received by the Trust |
|
Expiration Date |
Exercise Rate |
Notional Amount (000) |
|
|||||||||||||||||||||||
| Description | Rate | Frequency | Rate | Frequency | Counterparty | Value | ||||||||||||||||||||||||
| Call (continued) |
||||||||||||||||||||||||||||||
| 10-Year Interest Rate Swap, 01/11/33 |
1.44% | Semi-Annual | 3-Month LIBOR, 0.15% | Quarterly | Barclays Bank PLC |
01/09/23 | 1.44 | % | USD | 5,090 | $ | (100,342 | ) | |||||||||||||||||
| 10-Year Interest Rate Swap, 03/03/33 |
2.01% | Semi-Annual | 3-Month LIBOR, 0.15% |
Quarterly | Bank of America N.A. |
03/01/23 | 2.01 | USD | 5,170 | (246,984 | ) | |||||||||||||||||||
| 10-Year Interest Rate Swap, 03/14/39 |
3.05% | Semi-Annual | 3-Month LIBOR, 0.15% | Quarterly | Barclays Bank PLC |
03/12/29 | 3.05 | USD | 2,840 | (326,302 | ) | |||||||||||||||||||
|
|
|
|||||||||||||||||||||||||||||
| (2,813,297 | ) | |||||||||||||||||||||||||||||
|
|
|
|||||||||||||||||||||||||||||
| Put |
||||||||||||||||||||||||||||||
| 2-Year Interest Rate Swap, 07/03/23 |
6-Month EURIBOR, (0.52%) | Semi-Annual | 0.00% | Annual | Barclays Bank PLC |
07/01/21 | — | EUR | 5,230 | — | ||||||||||||||||||||
| 2-Year Interest Rate Swap, 07/04/23 |
6-Month EURIBOR, (0.52%) | Semi-Annual | (0.05%) | Annual | Barclays Bank PLC |
07/02/21 | (0.05 | ) | EUR | 5,120 | — | |||||||||||||||||||
| 2-Year Interest Rate Swap, 07/21/23 |
6-Month EURIBOR, (0.52%) | Semi-Annual | 0.00% | Annual | Barclays Bank PLC |
07/19/21 | — | EUR | 5,270 | — | ||||||||||||||||||||
| 10-Year Interest Rate Swap, 08/07/31 |
3-Month LIBOR, 0.15% |
Quarterly | 0.95% | Semi-Annual | Deutsche Bank AG |
08/05/21 | 0.95 | USD | 2,390 | (115,873 | ) | |||||||||||||||||||
| 2-Year Interest Rate Swap, 08/11/23 |
6-Month EURIBOR, (0.52%) | Semi-Annual | (0.25%) | Annual | Barclays Bank PLC |
08/09/21 | (0.25 | ) | EUR | 30,000 | (79 | ) | ||||||||||||||||||
| 2-Year Interest Rate Swap, 08/11/23 |
6-Month EURIBOR, (0.52%) | Semi-Annual | (0.15%) | Annual | Barclays Bank PLC |
08/09/21 | (0.15 | ) | EUR | 12,480 | (5 | ) | ||||||||||||||||||
| 2-Year Interest Rate Swap, 08/11/23 |
6-Month EURIBOR, (0.52%) | Semi-Annual | (0.15%) | Annual | Barclays Bank PLC |
08/09/21 | (0.15 | ) | EUR | 6,990 | (3 | ) | ||||||||||||||||||
| 2-Year Interest Rate Swap, 09/05/23 |
6-Month EURIBOR, (0.52%) | Semi-Annual | (0.25%) | Annual | Barclays Bank PLC |
09/03/21 | (0.25 | ) | EUR | 22,950 | (532 | ) | ||||||||||||||||||
| 5-Year Interest Rate Swap, 09/05/26 |
3-Month LIBOR, 0.15% | Quarterly | 0.60% | Semi-Annual | Deutsche Bank AG |
09/03/21 | 0.60 | USD | 10,390 | (215,260 | ) | |||||||||||||||||||
| 10-Year Interest Rate Swap, 09/24/31 |
3-Month LIBOR, 0.15% |
Quarterly | 1.52% | Semi-Annual | Citibank N.A. |
09/22/21 | 1.52 | USD | 5,730 | (63,478 | ) | |||||||||||||||||||
| 10-Year Interest Rate Swap, 10/16/31 |
3-Month LIBOR, 0.15% |
Quarterly | 1.78% | Semi-Annual | Goldman Sachs Bank USA |
10/14/21 | 1.77 | USD | 3,040 | (17,135 | ) | |||||||||||||||||||
| 2-Year Interest Rate Swap, 12/08/23 |
3-Month LIBOR, 0.15% |
Quarterly | 0.50% | Semi-Annual | Barclays Bank PLC |
12/06/21 | 0.50 | USD | 14,380 | (29,237 | ) | |||||||||||||||||||
| 2-Year Interest Rate Swap, 12/12/23 |
3-Month LIBOR, 0.15% |
Quarterly | 0.45% | Semi-Annual | Deutsche Bank AG |
12/10/21 | 0.45 | USD | 14,430 | (36,829 | ) | |||||||||||||||||||
| 10-Year Interest Rate Swap, 01/12/32 |
3-Month LIBOR, 0.15% |
Quarterly | 1.15% | Semi-Annual | Bank of America N.A. |
01/10/22 | 1.15 | USD | 1,400 | (60,102 | ) | |||||||||||||||||||
| 2-Year Interest Rate Swap, 01/12/24 |
3-Month LIBOR, 0.15% |
Quarterly | 0.51% | Semi-Annual | Morgan Stanley & Co. International PLC |
01/10/22 | 0.51 | USD | 38,450 | (103,580 | ) | |||||||||||||||||||
| 10-Year Interest Rate Swap, 01/29/32 |
3-Month LIBOR, 0.15% |
Quarterly | 1.25% | Semi-Annual | Bank of America N.A. |
01/27/22 | 1.25 | USD | 3,560 | (132,437 | ) | |||||||||||||||||||
| 10-Year Interest Rate Swap, 01/29/32 |
3-Month LIBOR, 0.15% |
Quarterly | 1.50% | Semi-Annual | Deutsche Bank AG |
01/27/22 | 1.50 | USD | 3,880 | (86,847 | ) | |||||||||||||||||||
| 10-Year Interest Rate Swap, 02/09/32 |
3-Month LIBOR, 0.15% |
Quarterly | 0.68% | Semi-Annual | Deutsche Bank AG |
02/07/22 | 0.68 | USD | 2,870 | (241,617 | ) | |||||||||||||||||||
| 10-Year Interest Rate Swap, 02/20/32 |
3-Month LIBOR, 0.15% |
Quarterly | 1.62% | Semi-Annual | Bank of America N.A. |
02/18/22 | 1.62 | USD | 3,350 | (62,458 | ) | |||||||||||||||||||
| 2-Year Interest Rate Swap, 02/27/24 |
3-Month LIBOR, 0.15% |
Quarterly | 0.75% | Semi-Annual | Deutsche Bank AG |
02/25/22 | 0.75 | USD | 38,130 | (78,060 | ) | |||||||||||||||||||
| 10-Year Interest Rate Swap, 03/02/32 |
3-Month LIBOR, 0.15% |
Quarterly | 1.60% | Semi-Annual | Deutsche Bank AG |
02/28/22 | 1.60 | USD | 2,840 | (57,048 | ) | |||||||||||||||||||
| 2-Year Interest Rate Swap, 03/03/24 |
3-Month LIBOR, 0.15% |
Quarterly | 0.51% | Semi-Annual | Deutsche Bank AG |
03/01/22 | 0.51 | USD | 33,910 | (129,572 | ) | |||||||||||||||||||
| 2-Year Interest Rate Swap, 03/04/24 |
3-Month LIBOR, 0.15% |
Quarterly | 0.49% | Semi-Annual | JPMorgan Chase Bank N.A. |
03/02/22 | 0.49 | USD | 50,670 | (205,702 | ) | |||||||||||||||||||
| 50 | 2 0 2 1 B L A C K R O C K S E M I - A N N U A L R E P O R T T O S H A R E H O L D E R S |
| Schedule of Investments (unaudited) (continued) June 30, 2021 |
BlackRock Core Bond Trust (BHK) |
OTC Interest Rate Swaptions Written (continued)
|
|
Paid by the Trust |
Received by the Trust |
|
Expiration Date |
Exercise Rate |
Notional Amount (000) |
|
|||||||||||||||||||||||
| Description | Rate | Frequency | Rate | Frequency | Counterparty | Value | ||||||||||||||||||||||||
| Put (continued) |
||||||||||||||||||||||||||||||
| 10-Year Interest Rate Swap, 03/05/32 |
3-Month LIBOR, 0.15% | Quarterly | 1.60% | Semi-Annual | Deutsche Bank AG |
03/03/22 | 1.60 | % | USD | 2,840 | $ | (57,752 | ) | |||||||||||||||||
| 2-Year Interest Rate Swap, 03/05/24 |
3-Month LIBOR, 0.15% | Quarterly | 0.52% | Semi-Annual | Citibank N.A. |
03/03/22 | 0.52 | USD | 17,280 | (65,297 | ) | |||||||||||||||||||
| 2-Year Interest Rate Swap, 03/23/24 |
3-Month LIBOR, 0.15% | Quarterly | 0.56% | Semi-Annual | Deutsche Bank AG |
03/21/22 | 0.56 | USD | 17,280 | (65,366 | ) | |||||||||||||||||||
| 2-Year Interest Rate Swap, 03/25/24 |
3-Month LIBOR, 0.15% | Quarterly | 0.57% | Semi-Annual | Deutsche Bank AG |
03/23/22 | 0.57 | USD | 33,470 | (125,585 | ) | |||||||||||||||||||
| 10-Year Interest Rate Swap, 05/04/32 |
3-Month LIBOR, 0.15% | Quarterly | 0.74% | Semi-Annual | Deutsche Bank AG |
05/02/22 | 0.74 | USD | 2,540 | (213,074 | ) | |||||||||||||||||||
| 5-Year Interest Rate Swap, 05/05/27 |
3-Month LIBOR, 0.15% | Quarterly | 3.25% | Semi-Annual | Goldman Sachs Bank USA |
05/03/22 | 3.25 | USD | 10,130 | (5,699 | ) | |||||||||||||||||||
| 10-Year Interest Rate Swap, 05/11/32 |
3-Month LIBOR, 0.15% | Quarterly | 2.75% | Semi-Annual | Nomura International Plc |
05/09/22 | 2.75 | USD | 10,350 | (29,619 | ) | |||||||||||||||||||
| 10-Year Interest Rate Swap, 06/09/32 |
3-Month LIBOR, 0.15% | Quarterly | 2.40% | Semi-Annual | JPMorgan Chase Bank N.A. |
06/07/22 | 2.40 | USD | 4,475 | (27,313 | ) | |||||||||||||||||||
| 10-Year Interest Rate Swap, 08/04/32 |
3-Month LIBOR, 0.15% | Quarterly | 2.75% | Semi-Annual | JPMorgan Chase Bank N.A. |
08/02/22 | 2.75 | USD | 4,160 | (17,865 | ) | |||||||||||||||||||
| 10-Year Interest Rate Swap, 08/04/32 |
3-Month LIBOR, 0.15% | Quarterly | 3.25% | Semi-Annual | JPMorgan Chase Bank N.A. |
08/02/22 | 3.25 | USD | 4,160 | (8,224 | ) | |||||||||||||||||||
| 10-Year Interest Rate Swap, 08/10/32 |
3-Month LIBOR, 0.15% | Quarterly | 0.72% | Semi-Annual | Deutsche Bank AG |
08/08/22 | 0.72 | USD | 485 | (44,323 | ) | |||||||||||||||||||
| 10-Year Interest Rate Swap, 08/10/32 |
3-Month LIBOR, 0.15% | Quarterly | 2.75% | Semi-Annual | Barclays Bank PLC |
08/08/22 | 2.75 | USD | 4,270 | (18,858 | ) | |||||||||||||||||||
| 10-Year Interest Rate Swap, 08/10/32 |
3-Month LIBOR, 0.15% | Quarterly | 3.25% | Semi-Annual | Barclays Bank PLC |
08/08/22 | 3.25 | USD | 4,270 | (8,735 | ) | |||||||||||||||||||
| 10-Year Interest Rate Swap, 10/13/32 |
3-Month LIBOR, 0.15% | Quarterly | 1.06% | Semi-Annual | Deutsche Bank AG |
10/11/22 | 1.06 | USD | 2,780 | (185,922 | ) | |||||||||||||||||||
| 10-Year Interest Rate Swap, 12/18/32 |
3-Month LIBOR, 0.15% | Quarterly | 1.23% | Semi-Annual | Goldman Sachs Bank USA |
12/16/22 | 1.23 | USD | 2,560 | (150,121 | ) | |||||||||||||||||||
| 10-Year Interest Rate Swap, 12/18/32 |
3-Month LIBOR, 0.15% | Quarterly | 1.25% | Semi-Annual | Goldman Sachs Bank USA |
12/16/22 | 1.24 | USD | 2,560 | (147,961 | ) | |||||||||||||||||||
| 10-Year Interest Rate Swap, 01/01/33 |
3-Month LIBOR, 0.15% | Quarterly | 1.25% | Semi-Annual | Citibank N.A. |
12/30/22 | 1.25 | USD | 2,820 | (163,476 | ) | |||||||||||||||||||
| 10-Year Interest Rate Swap, 01/11/33 |
3-Month LIBOR, 0.15% | Quarterly | 1.44% | Semi-Annual | Barclays Bank PLC |
01/09/23 | 1.44 | USD | 5,090 | (238,783 | ) | |||||||||||||||||||
| 10-Year Interest Rate Swap, 03/03/33 |
3-Month LIBOR, 0.15% | Quarterly | 2.01% | Semi-Annual | Bank of America N.A. |
03/01/23 | 2.01 | USD | 5,170 | (122,704 | ) | |||||||||||||||||||
| 10-Year Interest Rate Swap, 05/17/33 |
6-Month EURIBOR, (0.52%) |
Semi-Annual | 0.70% | Annual | Barclays Bank PLC |
05/15/23 | 0.70 | EUR | 6,070 | (103,529 | ) | |||||||||||||||||||
| 10-Year Interest Rate Swap, 06/15/34 |
3-Month LIBOR, 0.15% | Quarterly | 3.00% | Semi-Annual | Morgan Stanley & Co. International PLC |
06/13/24 | 3.00 | USD | 3,950 | (56,351 | ) | |||||||||||||||||||
| 10-Year Interest Rate Swap, 06/15/34 |
3-Month LIBOR, 0.15% | Quarterly | 3.50% | Semi-Annual | Morgan Stanley & Co. International PLC |
06/13/24 | 3.50 | USD | 3,950 | (34,239 | ) | |||||||||||||||||||
| 10-Year Interest Rate Swap, 06/22/34 |
3-Month LIBOR, 0.15% | Quarterly | 3.00% | Semi-Annual | Morgan Stanley & Co. International PLC |
06/20/24 | 3.00 | USD | 3,950 | (56,779 | ) | |||||||||||||||||||
| 10-Year Interest Rate Swap, 06/22/34 |
3-Month LIBOR, 0.15% | Quarterly | 3.50% | Semi-Annual | Morgan Stanley & Co. International PLC |
06/20/24 | 3.50 | USD | 3,950 | (34,542 | ) | |||||||||||||||||||
| 10-Year Interest Rate Swap, 08/22/34 |
3-Month LIBOR, 0.15% | Quarterly | 2.25% | Semi-Annual | Morgan Stanley & Co. International PLC |
08/20/24 | 2.25 | USD | 4,410 | (143,063 | ) | |||||||||||||||||||
| 10-Year Interest Rate Swap, 03/14/39 |
3-Month LIBOR, 0.15% | Quarterly | 3.05% | Semi-Annual | Barclays Bank PLC |
03/12/29 | 3.05 | USD | 2,840 | (89,177 | ) | |||||||||||||||||||
|
|
|
|||||||||||||||||||||||||||||
| (3,850,211 | ) | |||||||||||||||||||||||||||||
|
|
|
|||||||||||||||||||||||||||||
| $ | (6,663,508 | ) | ||||||||||||||||||||||||||||
|
|
|
|||||||||||||||||||||||||||||
| S C H E D U L E O F I N V E S T M E N T S |
51 |
| Schedule of Investments (unaudited) (continued) June 30, 2021 |
BlackRock Core Bond Trust (BHK) |
Centrally Cleared Credit Default Swaps — Buy Protection
| Reference Obligation/Index |
Financing Rate Paid by the Trust |
Payment Frequency |
Termination Date |
Notional Amount (000) |
Value | Upfront Premium Paid (Received) |
Unrealized Appreciation (Depreciation) |
|||||||||||||||||||||
| CDX.NA.HY.36.V1 |
5.00 | % | Quarterly | 06/20/26 | USD | 12,090 | $ | (1,254,710 | ) | $ | (1,076,170 | ) | $ | (178,540 | ) | |||||||||||||
| CDX.NA.IG.36.V1 |
1.00 | Quarterly | 06/20/26 | USD | 48,380 | (1,246,209 | ) | (998,258 | ) | (247,951 | ) | |||||||||||||||||
|
|
|
|
|
|
|
|||||||||||||||||||||||
| $ | (2,500,919 | ) | $ | (2,074,428 | ) | $ | (426,491 | ) | ||||||||||||||||||||
|
|
|
|
|
|
|
|||||||||||||||||||||||
Centrally Cleared Interest Rate Swaps
| Paid by the Trust |
Received by the Trust |
Effective Date |
Termination Date |
Notional Amount (000) |
Value | Upfront Premium Paid (Received) |
Unrealized Appreciation (Depreciation) |
|||||||||||||||||||||||
| Rate | Frequency | Rate | Frequency | |||||||||||||||||||||||||||
| 3-Month LIBOR, 0.15% | Quarterly | 1.07% | Semi-Annual | N/A | 03/01/23 | USD | 3,350 | $ | 56,868 | $ | 33 | $ | 56,835 | |||||||||||||||||
| 3-Month LIBOR, 0.15% | Quarterly | 1.10% | Semi-Annual | N/A | 03/01/23 | USD | 13,390 | 234,939 | 133 | 234,806 | ||||||||||||||||||||
| 3-Month LIBOR, 0.15% | Quarterly | 0.88% | Semi-Annual | N/A | 03/02/23 | USD | 6,665 | 88,421 | 66 | 88,355 | ||||||||||||||||||||
| 3-Month LIBOR, 0.15% | Quarterly | 0.88% | Semi-Annual | N/A | 03/02/23 | USD | 6,700 | 88,416 | 66 | 88,350 | ||||||||||||||||||||
| 3-Month LIBOR, 0.15% | Quarterly | 0.90% | Semi-Annual | N/A | 03/02/23 | USD | 2,230 | 30,588 | 22 | 30,566 | ||||||||||||||||||||
| 3-Month LIBOR, 0.15% | Quarterly | 0.98% | Semi-Annual | N/A | 03/02/23 | USD | 3,360 | 51,131 | 33 | 51,098 | ||||||||||||||||||||
| 3-Month LIBOR, 0.15% | Quarterly | 0.99% | Semi-Annual | N/A | 03/02/23 | USD | 3,360 | 51,702 | 33 | 51,669 | ||||||||||||||||||||
| 0.12% | Annual | 6-Month GBP LIBOR, 3.69% | Annual | N/A | 04/09/23 | GBP | 37,430 | 39,479 | (224 | ) | 39,703 | |||||||||||||||||||
| 3-Month CAD BA, 1.35% | Semi-Annual | 0.64% | Semi-Annual | N/A | 04/21/23 | CAD | 21,590 | (31,322 | ) | 102 | (31,424 | ) | ||||||||||||||||||
| 0.28% | Semi-Annual | 3-Month LIBOR, 0.15% | Quarterly | N/A | 04/23/23 | USD | 19,040 | (488 | ) | (1,106 | ) | 618 | ||||||||||||||||||
| 3-Month LIBOR, 0.15% | Quarterly | 0.25% | Semi-Annual | 07/08/22 | (a) | 07/08/23 | USD | 5,380 | (11,771 | ) | 58 | (11,829 | ) | |||||||||||||||||
| 1.61% | Semi-Annual | 3-Month LIBOR, 0.15% | Quarterly | 11/01/21 | (a) | 11/01/23 | USD | 3,260 | (76,237 | ) | 38 | (76,275 | ) | |||||||||||||||||
| 0.40% | Semi-Annual | 3-Month LIBOR, 0.15% | Quarterly | 11/22/22 | (a) | 11/22/23 | USD | 2,280 | 6,317 | 25 | 6,292 | |||||||||||||||||||
| 3-Month LIBOR, 0.15% | Quarterly | 0.34% | Semi-Annual | 12/13/21 | (a) | 12/13/23 | USD | 1,190 | (3,432 | ) | 14 | (3,446 | ) | |||||||||||||||||
| 3-Month LIBOR, 0.15% | Quarterly | 0.45% | Semi-Annual | 03/01/22 | (a) | 03/01/24 | USD | 5,850 | (16,930 | ) | 70 | (17,000 | ) | |||||||||||||||||
| 0.73% | Semi-Annual | 3-Month LIBOR, 0.15% | Quarterly | 06/21/22 | (a) | 06/21/24 | USD | 8,740 | 4,691 | 105 | 4,586 | |||||||||||||||||||
| 0.74% | Semi-Annual | 3-Month LIBOR, 0.15% | Quarterly | 06/23/22 | (a) | 06/23/24 | USD | 480 | 170 | 6 | 164 | |||||||||||||||||||
| 3-Month LIBOR, 0.15% | Quarterly | 0.45% | Semi-Annual | N/A | 11/12/25 | USD | 4,330 | (75,808 | ) | 51 | (75,859 | ) | ||||||||||||||||||
| 3-Month LIBOR, 0.15% | Quarterly | 0.48% | Semi-Annual | N/A | 01/21/26 | USD | 7,710 | (132,104 | ) | 95 | (132,199 | ) | ||||||||||||||||||
| 1.54% | Semi-Annual | 3-Month LIBOR, 0.15% | Quarterly | 02/25/25 | (a) | 02/25/26 | USD | 7,420 | 5,767 | 80 | 5,687 | |||||||||||||||||||
| 1.71% | Semi-Annual | 3-Month LIBOR, 0.15% | Quarterly | 03/06/25 | (a) | 03/06/26 | USD | 3,630 | (3,183 | ) | 39 | (3,222 | ) | |||||||||||||||||
| 6-Month EURIBOR, (0.52%) | Semi-Annual | (0.15%) | Annual | 11/16/21 | (a) | 11/16/26 | EUR | 6,070 | 19,859 | 113 | 19,746 | |||||||||||||||||||
| 0.65% | Semi-Annual | 3-Month LIBOR, 0.15% | Quarterly | 04/20/22 | (a) | 04/20/27 | USD | 530 | 15,127 | 7 | 15,120 | |||||||||||||||||||
| 1.29% | Semi-Annual | 3-Month LIBOR, 0.15% | Quarterly | 04/20/22 | (a) | 04/20/27 | USD | 3,520 | (8,635 | ) | 48 | (8,683 | ) | |||||||||||||||||
| 1.31% | Semi-Annual | 3-Month LIBOR, 0.15% | Quarterly | 04/29/22 | (a) | 04/29/27 | USD | 60 | (190 | ) | 1 | (191 | ) | |||||||||||||||||
| 1.36% | Semi-Annual | 3-Month LIBOR, 0.15% | Quarterly | 06/20/22 | (a) | 06/20/27 | USD | 1,100 | (3,355 | ) | 15 | (3,370 | ) | |||||||||||||||||
| 0.50% | Semi-Annual | 3-Month LIBOR, 0.15% | Quarterly | N/A | 08/19/27 | USD | 1,310 | 47,226 | 17 | 47,209 | ||||||||||||||||||||
| 0.84% | Semi-Annual | 3-Month LIBOR, 0.15% | Quarterly | N/A | 11/15/27 | USD | 7,990 | 149,533 | 112 | 149,421 | ||||||||||||||||||||
| 1.27% | Semi-Annual | 3-Month LIBOR, 0.15% | Quarterly | 06/30/21 | (a) | 02/15/28 | USD | 7,600 | (41,495 | ) | 111 | (41,606 | ) | |||||||||||||||||
| 0.19% | Annual | 6-Month EURIBOR, (0.52%) | Semi-Annual | N/A | 01/16/30 | EUR | 1,600 | (35,987 | ) | 289 | (36,276 | ) | ||||||||||||||||||
| 1.31% | Semi-Annual | 3-Month LIBOR, 0.15% | Quarterly | N/A | 02/27/30 | USD | 60 | 42 | 1 | 41 | ||||||||||||||||||||
| 0.68% | Semi-Annual | 3-Month LIBOR, 0.15% | Quarterly | N/A | 09/16/30 | USD | 2,760 | 173,013 | 40 | 172,973 | ||||||||||||||||||||
| 0.53% | Quarterly | 3-Month LIBOR, 0.15% | Quarterly | N/A | 10/21/30 | USD | 101 | 5,425 | — | 5,425 | ||||||||||||||||||||
| 3-Month LIBOR, 0.15% | Quarterly | 0.56% | Quarterly | N/A | 10/21/30 | USD | 101 | (5,621 | ) | — | (5,621 | ) | ||||||||||||||||||
| 0.65% | Semi-Annual | 3-Month LIBOR, 0.15% | Quarterly | N/A | 11/04/30 | USD | 2,740 | 186,793 | 40 | 186,753 | ||||||||||||||||||||
| 0.96% | Semi-Annual | 3-Month LIBOR, 0.15% | Quarterly | N/A | 11/12/30 | USD | 2,270 | 92,598 | 35 | 92,563 | ||||||||||||||||||||
| 0.95% | Semi-Annual | 3-Month LIBOR, 0.15% | Quarterly | N/A | 12/04/30 | USD | 1,620 | 68,588 | 25 | 68,563 | ||||||||||||||||||||
| 1.02% | Semi-Annual | 3-Month LIBOR, 0.15% | Quarterly | N/A | 01/08/31 | USD | 1,790 | 60,034 | 28 | 60,006 | ||||||||||||||||||||
| 1.09% | Semi-Annual | 3-Month LIBOR, 0.15% | Quarterly | N/A | 01/12/31 | USD | 1,790 | 47,584 | 28 | 47,556 | ||||||||||||||||||||
| 1.16% | Semi-Annual | 3-Month LIBOR, 0.15% | Quarterly | N/A | 02/04/31 | USD | 500 | 10,348 | 8 | 10,340 | ||||||||||||||||||||
| 1.17% | Semi-Annual | 3-Month LIBOR, 0.15% | Quarterly | N/A | 02/04/31 | USD | 1,800 | 36,752 | 28 | 36,724 | ||||||||||||||||||||
| 1.18% | Semi-Annual | 3-Month LIBOR, 0.15% | Quarterly | N/A | 02/04/31 | USD | 1,340 | 26,204 | 21 | 26,183 | ||||||||||||||||||||
| 1.68% | Semi-Annual | 3-Month LIBOR, 0.15% | Quarterly | 09/30/21 | (a) | 02/15/31 | USD | 5,700 | (101,761 | ) | (626 | ) | (101,135 | ) | ||||||||||||||||
| 2.79% | Semi-Annual | 3-Month LIBOR, 0.15% | Quarterly | N/A | 03/10/31 | USD | 5,266 | (701,418 | ) | 83 | (701,501 | ) | ||||||||||||||||||
| 1.58% | Semi-Annual | 3-Month LIBOR, 0.15% | Quarterly | N/A | 03/12/31 | USD | 640 | (11,126 | ) | 10 | (11,136 | ) | ||||||||||||||||||
| 1.77% | Semi-Annual | 3-Month LIBOR, 0.15% | Quarterly | N/A | 03/22/31 | USD | 880 | (31,214 | ) | 14 | (31,228 | ) | ||||||||||||||||||
| 3-Month LIBOR, 0.15% | Quarterly | 2.45% | Semi-Annual | N/A | 05/18/31 | USD | 860 | 82,841 | 13 | 82,828 | ||||||||||||||||||||
| 0.76% | Semi-Annual | 3-Month LIBOR, 0.15% | Quarterly | N/A | 06/03/31 | USD | 3,648 | 238,832 | 57 | 238,775 | ||||||||||||||||||||
| 1.56% | Semi-Annual | 3-Month LIBOR, 0.15% | Quarterly | N/A | 06/18/31 | USD | 1,800 | (18,486 | ) | 29 | (18,515 | ) | ||||||||||||||||||
| 3-Month LIBOR, 0.15% | Quarterly | 2.10% | Semi-Annual | N/A | 06/22/31 | USD | 430 | 26,458 | 7 | 26,451 | ||||||||||||||||||||
| 52 | 2 0 2 1 B L A C K R O C K S E M I - A N N U A L R E P O R T T O S H A R E H O L D E R S |
| Schedule of Investments (unaudited) (continued) June 30, 2021 |
BlackRock Core Bond Trust (BHK) |
Centrally Cleared Interest Rate Swaps (continued)
| Paid by the Trust |
Received by the Trust |
Effective Date |
Termination Date |
Notional Amount (000) |
Value | Upfront Premium Paid (Received) |
Unrealized Appreciation (Depreciation) |
|||||||||||||||||||||||
| Rate | Frequency | Rate | Frequency | |||||||||||||||||||||||||||
| 3-Month LIBOR, 0.15% | Quarterly | 0.72% | Semi-Annual | 07/01/21 | (a) | 07/01/31 | USD | 2,450 | $ | (174,677 | ) | $ | 40 | $ | (174,717 | ) | ||||||||||||||
| 3-Month LIBOR, 0.15% | Quarterly | 1.18% | Semi-Annual | 07/28/21 | (a) | 07/28/31 | USD | 1,640 | (46,676 | ) | 27 | (46,703 | ) | |||||||||||||||||
| 3-Month LIBOR, 0.15% | Quarterly | 1.59% | Semi-Annual | 12/29/21 | (a) | 12/29/31 | USD | 2,180 | 5,915 | 36 | 5,879 | |||||||||||||||||||
| 0.80% | Semi-Annual | 3-Month LIBOR, 0.15% | Quarterly | 02/08/22 | (a) | 02/08/32 | USD | 60 | 4,453 | 1 | 4,452 | |||||||||||||||||||
| 1.65% | Semi-Annual | 3-Month LIBOR, 0.15% | Quarterly | 02/22/22 | (a) | 02/22/32 | USD | 3,520 | (20,959 | ) | 57 | (21,016 | ) | |||||||||||||||||
| 3-Month LIBOR, 0.15% | Quarterly | 1.83% | Semi-Annual | 04/29/22 | (a) | 04/29/32 | USD | 1,610 | 30,775 | 26 | 30,749 | |||||||||||||||||||
| 0.77% | Semi-Annual | 3-Month LIBOR, 0.15% | Quarterly | 05/06/22 | (a) | 05/06/32 | USD | 2,650 | 215,458 | 42 | 215,416 | |||||||||||||||||||
| 0.85% | Semi-Annual | 3-Month LIBOR, 0.15% | Quarterly | 08/15/22 | (a) | 08/15/32 | USD | 16,460 | 1,294,570 | 68,203 | 1,226,367 | |||||||||||||||||||
| 3-Month LIBOR, 0.15% | Quarterly | 2.08% | Semi-Annual | 05/05/23 | (a) | 05/05/33 | USD | 810 | 19,917 | 13 | 19,904 | |||||||||||||||||||
| 0.44% | Annual | 6-Month EURIBOR, (0.52%) | Semi-Annual | 05/16/23 | (a) | 05/16/33 | EUR | 2,140 | (24,876 | ) | 47 | (24,923 | ) | |||||||||||||||||
| 3-Month LIBOR, 0.15% | Quarterly | 2.15% | Semi-Annual | 05/16/23 | (a) | 05/16/33 | USD | 2,770 | 85,685 | 45 | 85,640 | |||||||||||||||||||
| 2.33% | Semi-Annual | 3-Month LIBOR, 0.15% | Quarterly | 06/24/24 | (a) | 06/24/34 | USD | 310 | (10,881 | ) | 5 | (10,886 | ) | |||||||||||||||||
| 1.65% | Semi-Annual | 3-Month LIBOR, 0.15% | Quarterly | 08/22/24 | (a) | 08/22/34 | USD | 1,355 | 38,092 | 21 | 38,071 | |||||||||||||||||||
| 2.82% | Semi-Annual | 3-Month LIBOR, 0.15% | Quarterly | 04/04/29 | (a) | 04/04/39 | USD | 1,560 | (94,967 | ) | 24 | (94,991 | ) | |||||||||||||||||
| 1.01% | Semi-Annual | 3-Month LIBOR, 0.15% | Quarterly | 04/02/30 | (a) | 04/02/40 | USD | 4,100 | 367,935 | 66 | 367,869 | |||||||||||||||||||
| 3-Month LIBOR, 0.15% | Quarterly | 1.78% | Semi-Annual | 09/30/21 | (a) | 02/15/47 | USD | 2,240 | 4,032 | 49 | 3,983 | |||||||||||||||||||
| 3-Month LIBOR, 0.15% | Quarterly | 1.80% | Semi-Annual | 09/30/21 | (a) | 02/15/47 | USD | 2,080 | 9,053 | 45 | 9,008 | |||||||||||||||||||
| 1.90% | Semi-Annual | 3-Month LIBOR, 0.15% | Quarterly | 09/30/21 | (a) | 02/15/47 | USD | 2,530 | (48,678 | ) | 55 | (48,733 | ) | |||||||||||||||||
| 2.10% | Semi-Annual | 3-Month LIBOR, 0.15% | Quarterly | 09/30/21 | (a) | 02/15/47 | USD | 7,330 | (458,319 | ) | (1,087 | ) | (457,232 | ) | ||||||||||||||||
| 3.02% | Semi-Annual | 3-Month LIBOR, 0.15% | Quarterly | 12/08/38 | (a) | 12/08/48 | USD | 400 | (29,840 | ) | 6 | (29,846 | ) | |||||||||||||||||
| 2.38% | Semi-Annual | 3-Month LIBOR, 0.15% | Quarterly | 07/05/39 | (a) | 07/05/49 | USD | 620 | (18,360 | ) | 10 | (18,370 | ) | |||||||||||||||||
| 1.71% | Semi-Annual | 3-Month LIBOR, 0.15% | Quarterly | 08/16/39 | (a) | 08/16/49 | USD | 600 | 10,324 | 9 | 10,315 | |||||||||||||||||||
| 1.78% | Semi-Annual | 3-Month LIBOR, 0.15% | Quarterly | 08/16/39 | (a) | 08/16/49 | USD | 500 | 5,973 | 8 | 5,965 | |||||||||||||||||||
| 1.67% | Semi-Annual | 3-Month LIBOR, 0.15% | Quarterly | 08/17/39 | (a) | 08/17/49 | USD | 460 | 9,284 | 7 | 9,277 | |||||||||||||||||||
| 1.25% | Semi-Annual | 3-Month LIBOR, 0.15% | Quarterly | N/A | 03/06/50 | USD | 460 | 57,846 | 10 | 57,836 | ||||||||||||||||||||
| 1.10% | Semi-Annual | 3-Month LIBOR, 0.15% | Quarterly | N/A | 11/25/50 | USD | 750 | 124,541 | 17 | 124,524 | ||||||||||||||||||||
| 3-Month LIBOR, 0.15% | Quarterly | 1.93% | Semi-Annual | 12/01/26 | (a) | 12/01/56 | USD | 110 | (214 | ) | 2 | (216 | ) | |||||||||||||||||
|
|
|
|
|
|
|
|||||||||||||||||||||||||
| $ | 1,990,589 | $ | 68,077 | $ | 1,922,512 | |||||||||||||||||||||||||
|
|
|
|
|
|
|
|||||||||||||||||||||||||
| (a) | Forward Swap. |
OTC Credit Default Swaps — Sell Protection
| Reference Obligation/Index | |
Financing Rate Received by the Trust |
|
|
Payment Frequency |
|
Counterparty | |
Termination Date |
|
Credit Rating(a) |
|
Notional Amount (000)(b) |
|
Value | |
Upfront Premium Paid (Received) |
|
|
Unrealized Appreciation (Depreciation) |
| |||||||||||||||
| Adler Real Estate AG |
5.00 | % | Quarterly | Morgan Stanley & Co. International PLC |
12/20/25 | BB+ | EUR | 10 | $ | 1,450 | $ | 1,542 | $ | (92 | ) | |||||||||||||||||||||
| Virgin Media Finance PLC |
5.00 | Quarterly | JPMorgan Chase Bank N.A. | 12/20/25 | B | EUR | 10 | 1,436 | 1,190 | 246 | ||||||||||||||||||||||||||
| CMBX.NA.8 |
3.00 | Monthly | Barclays Bank PLC | 10/17/57 | NR | USD | 5,000 | (689,554 | ) | (491,506 | ) | (198,048 | ) | |||||||||||||||||||||||
| CMBX.NA.8 |
3.00 | Monthly | Credit Suisse International | 10/17/57 | NR | USD | 2,500 | (344,777 | ) | (243,137 | ) | (101,640 | ) | |||||||||||||||||||||||
| CMBX.NA.8 |
3.00 | Monthly | Morgan Stanley & Co. International PLC |
10/17/57 | NR | USD | 5,550 | (765,405 | ) | (715,534 | ) | (49,871 | ) | |||||||||||||||||||||||
| CMBX.NA.9 |
3.00 | Monthly | Credit Suisse International | 09/17/58 | NR | USD | 5,000 | (386,335 | ) | (527,073 | ) | 140,738 | ||||||||||||||||||||||||
| CMBX.NA.9 |
3.00 | Monthly | Credit Suisse International | 09/17/58 | NR | USD | 2,500 | (193,167 | ) | (263,536 | ) | 70,369 | ||||||||||||||||||||||||
| CMBX.NA.9 |
3.00 | Monthly | Credit Suisse International | 09/17/58 | NR | USD | 5,000 | (386,335 | ) | (527,023 | ) | 140,688 | ||||||||||||||||||||||||
| CMBX.NA.9 |
3.00 | Monthly | Morgan Stanley & Co. International PLC |
09/17/58 | NR | USD | 2,15 | (166,356 | ) | (238,529 | ) | 72,173 | ||||||||||||||||||||||||
|
|
|
|
|
|
|
|||||||||||||||||||||||||||||||
| $ | (2,929,043 | ) | $ | (3,003,606 | ) | $ | 74,563 | |||||||||||||||||||||||||||||
|
|
|
|
|
|
|
|||||||||||||||||||||||||||||||
| (a) | Using the rating of the issuer or the underlying securities of the index, as applicable, provided by S&P Global Ratings. |
| (b) | The maximum potential amount the Trust may pay should a negative credit event take place as defined under the terms of the agreement. |
| S C H E D U L E O F I N V E S T M E N T S |
53 |
| Schedule of Investments (unaudited) (continued) June 30, 2021 |
BlackRock Core Bond Trust (BHK) |
Balances Reported in the Statements of Assets and Liabilities for Centrally Cleared Swaps, OTC Swaps and Options Written
| Description | Swap Premiums Paid |
Swap Premiums Received |
Unrealized Appreciation |
Unrealized Depreciation |
Value | |||||||||||||||
| Centrally Cleared Swaps(a) |
$ | 71,120 | $ | (2,077,471 | ) | $ | 4,160,661 | $ | (2,664,640 | ) | $ | — | ||||||||
| OTC Swaps |
2,732 | (3,006,338 | ) | 424,214 | (349,651 | ) | — | |||||||||||||
| Options Written |
N/A | N/A | 1,983,119 | (1,751,063 | ) | (6,988,739 | ) | |||||||||||||
| (a) | Includes cumulative appreciation (depreciation) on centrally cleared swaps, as reported in the Schedule of Investments. Only current day’s variation margin is reported within the Statements of Assets and Liabilities and is net of any previously paid (received) swap premium amounts. |
Derivative Financial Instruments Categorized by Risk Exposure
As of period end, the fair values of derivative financial instruments located in the Statements of Assets and Liabilities were as follows:
| Commodity Contracts |
Credit Contracts |
Equity Contracts |
Foreign Currency Exchange Contracts |
Interest Rate Contracts |
Other Contracts |
Total | ||||||||||||||||||||||
| Assets — Derivative Financial Instruments |
||||||||||||||||||||||||||||
| Futures contracts |
||||||||||||||||||||||||||||
| Unrealized appreciation on futures contracts(a) |
$ | — | $ | — | $ | — | $ | — | $ | 1,630,258 | $ | — | $ | 1,630,258 | ||||||||||||||
| Forward foreign currency exchange contracts |
||||||||||||||||||||||||||||
| Unrealized appreciation on forward foreign currency exchange contracts |
— | — | — | 252,099 | — | — | 252,099 | |||||||||||||||||||||
| Options purchased(b) |
||||||||||||||||||||||||||||
| Investments at value — unaffiliated(c) |
— | — | — | — | 7,526,430 | — | 7,526,430 | |||||||||||||||||||||
| Swaps — centrally cleared |
||||||||||||||||||||||||||||
| Unrealized appreciation on centrally cleared swaps(a) |
— | — | — | — | 4,160,661 | — | 4,160,661 | |||||||||||||||||||||
| Swaps — OTC |
||||||||||||||||||||||||||||
| Unrealized appreciation on OTC swaps; Swap premiums paid |
— | 426,946 | — | — | — | — | 426,946 | |||||||||||||||||||||
|
|
|
|
|
|
|
|
|
|
|
|
|
|
|
|||||||||||||||
| $ | — | $ | 426,946 | $ | — | $ | 252,099 | $ | 13,317,349 | $ | — | $ | 13,996,394 | |||||||||||||||
|
|
|
|
|
|
|
|
|
|
|
|
|
|
|
|||||||||||||||
| Liabilities — Derivative Financial Instruments |
||||||||||||||||||||||||||||
| Futures contracts |
||||||||||||||||||||||||||||
| Unrealized depreciation on futures contracts(a) |
$ | — | $ | — | $ | — | $ | — | $ | 330,022 | $ | — | $ | 330,022 | ||||||||||||||
| Options written |
||||||||||||||||||||||||||||
| Options written at value |
— | — | — | — | 6,988,739 | — | 6,988,739 | |||||||||||||||||||||
| Swaps — centrally cleared |
||||||||||||||||||||||||||||
| Unrealized depreciation on centrally cleared swaps(a) |
— | 426,491 | — | — | 2,238,149 | — | 2,664,640 | |||||||||||||||||||||
| Swaps — OTC |
||||||||||||||||||||||||||||
| Unrealized depreciation on OTC swaps; Swap premiums received |
— | 3,355,989 | — | — | — | — | 3,355,989 | |||||||||||||||||||||
|
|
|
|
|
|
|
|
|
|
|
|
|
|
|
|||||||||||||||
| $ | — | $ | 3,782,480 | $ | — | $ | — | $ | 9,556,910 | $ | — | $ | 13,339,390 | |||||||||||||||
|
|
|
|
|
|
|
|
|
|
|
|
|
|
|
|||||||||||||||
| (a) | Net cumulative unrealized appreciation (depreciation) on futures contracts and centrally cleared swaps, if any, are reported in the Schedule of Investments. In the Statements of Assets and Liabilities, only current day’s variation margin is reported in receivables or payables and the net cumulative unrealized appreciation (depreciation) is included in accumulated earnings (loss). |
| (b) | Includes forward settling swaptions. |
| (c) | Includes options purchased at value as reported in the Schedule of Investments. |
For the six months ended June 30, 2021, the effect of derivative financial instruments in the Statements of Operations was as follows:
| Commodity Contracts |
Credit Contracts |
Equity Contracts |
Foreign Currency Exchange Contracts |
Interest Rate Contracts |
Other Contracts |
Total | ||||||||||||||||||||||
| Net Realized Gain (Loss) from |
||||||||||||||||||||||||||||
| Futures contracts |
$ | — | $ | — | $ | — | $ | — | $ | 249,694 | $ | — | $ | 249,694 | ||||||||||||||
| Forward foreign currency exchange contracts |
— | — | — | (119,321 | ) | — | — | (119,321 | ) | |||||||||||||||||||
| Options purchased(a) |
— | — | — | — | 7,376,132 | — | 7,376,132 | |||||||||||||||||||||
| Options written |
— | — | — | — | 1,242,302 | — | 1,242,302 | |||||||||||||||||||||
| Swaps |
— | (73,802 | ) | — | — | (600,171 | ) | — | (673,973 | ) | ||||||||||||||||||
|
|
|
|
|
|
|
|
|
|
|
|
|
|
|
|||||||||||||||
| $ | — | $ | (73,802 | ) | $ | — | $ (119,321 | ) | $ | 8,267,957 | $ | — | $ | 8,074,834 | ||||||||||||||
|
|
|
|
|
|
|
|
|
|
|
|
|
|
|
|||||||||||||||
| Net Change in Unrealized Appreciation (Depreciation) on |
||||||||||||||||||||||||||||
| Futures contracts |
$ | — | $ | — | $ | — | $ | — | $ | 1,755,592 | $ | — | $ | 1,755,592 | ||||||||||||||
| 54 | 2 0 2 1 B L A C K R O C K S E M I - A N N U A L R E P O R T T O S H A R E H O L D E R S |
| Schedule of Investments (unaudited) (continued) June 30, 2021 |
BlackRock Core Bond Trust (BHK) |
| Commodity Contracts |
Credit Contracts |
Equity Contracts |
Foreign Currency Exchange Contracts |
Interest Rate Contracts |
Other Contracts |
Total | ||||||||||||||||||||||
| Forward foreign currency exchange contracts |
$ | — | $ | — | $ | — | $ | 548,116 | $ | — | $ | — | $ | 548,116 | ||||||||||||||
| Options purchased(b) |
— | — | — | — | (1,470,824 | ) | — | (1,470,824 | ) | |||||||||||||||||||
| Options written |
— | — | — | — | (2,579,293 | ) | — | (2,579,293 | ) | |||||||||||||||||||
| Swaps |
— | 1,016,543 | — | — | 1,206,367 | — | 2,222,910 | |||||||||||||||||||||
|
|
|
|
|
|
|
|
|
|
|
|
|
|
|
|||||||||||||||
| $ | — | $ | 1,016,543 | $ | — | $ | 548,116 | $ (1,088,158 | ) | $ | — | $ | 476,501 | |||||||||||||||
|
|
|
|
|
|
|
|
|
|
|
|
|
|
|
|||||||||||||||
| (a) | Options purchased are included in net realized gain (loss) from investments — unaffiliated. |
| (b) | Options purchased are included in net change in unrealized appreciation (depreciation) on investments — unaffiliated. |
Average Quarterly Balances of Outstanding Derivative Financial Instruments
| Futures contracts |
||||
| Average notional value of contracts — long |
$ | 72,517,346 | ||
| Average notional value of contracts — short |
$ | 289,058,497 | ||
| Forward foreign currency exchange contracts |
||||
| Average amounts purchased — in USD |
$ | 12,531,426 | ||
| Options |
||||
| Average value of option contracts purchased |
$ | 431,025 | ||
| Average value of option contracts written |
$ | 333,038 | ||
| Average notional value of swaption contracts purchased |
$ | 471,527,326 | ||
| Average notional value of swaption contracts written |
$ | 1,125,315,850 | ||
| Credit default swaps |
||||
| Average notional value — buy protection |
$ | 58,815,000 | ||
| Average notional value — sell protection |
$ | 31,476,585 | ||
| Interest rate swaps |
||||
| Average notional value — pays fixed rate |
$ | 188,442,064 | ||
| Average notional value — receives fixed rate |
$ | 103,940,596 |
For more information about the Trust’s investment risks regarding derivative financial instruments, refer to the Notes to Financial Statements.
Derivative Financial Instruments — Offsetting as of Period End
The Trust’s derivative assets and liabilities (by type) were as follows:
| Assets | Liabilities | |||||||
| Derivative Financial Instruments |
||||||||
| Futures contracts |
$ | 254,220 | $ | 116,256 | ||||
| Forward foreign currency exchange contracts |
252,099 | — | ||||||
| Options(a) |
7,526,430 | (b) | 6,988,739 | |||||
| Swaps — centrally cleared |
— | 291,452 | ||||||
| Swaps — OTC(c) |
426,946 | 3,355,989 | ||||||
|
|
|
|
|
|||||
| Total derivative assets and liabilities in the Statements of Assets and Liabilities |
8,459,695 | 10,752,436 | ||||||
|
|
|
|
|
|||||
| Derivatives not subject to a Master Netting Agreement or similar agreement (“MNA”) |
(599,220 | ) | (732,939 | ) | ||||
|
|
|
|
|
|||||
| Total derivative assets and liabilities subject to an MNA |
$ | 7,860,475 | $ | 10,019,497 | ||||
|
|
|
|
|
|||||
| (a) | Includes forward settling swaptions. |
| (b) | Includes options purchased at value which is included in Investments at value — unaffiliated in the Statements of Assets and Liabilities and reported in the Schedule of Investments. |
| (c) | Includes unrealized appreciation (depreciation) on OTC swaps and swap premiums (paid/received) in the Statements of Assets and Liabilities. |
The following table presents the Trust’s derivative assets and liabilities by counterparty net of amounts available for offset under an MNA and net of the related collateral received (and pledged) by the Trust:
| Counterparty |
|
Derivative Assets Subject to an MNA by Counterparty |
|
|
Derivatives Available for Offset |
(a) |
|
Non-Cash Collateral Received |
|
|
Cash Collateral Received |
(b) |
|
Net Amount of Derivative Assets |
(c)(d) | |||||
| Bank of America N.A. |
$ | 453,226 | $ | (453,226 | ) | $ | — | $ | — | $ | — | |||||||||
| Barclays Bank PLC |
1,286,249 | (1,286,249 | ) | — | — | — | ||||||||||||||
| BNP Paribas S.A. |
113,597 | — | — | — | 113,597 |
| S C H E D U L E O F I N V E S T M E N T S |
55 |
| Schedule of Investments (unaudited) (continued) June 30, 2021 |
BlackRock Core Bond Trust (BHK) |
| Counterparty |
|
Derivative Assets Subject to an MNA by Counterparty |
|
|
Derivatives Available for Offse |
t(a) |
|
Non-Cash Collateral Received |
|
|
Cash Collateral Received |
(b) |
|
Net Amount of Derivative Assets |
(c)(d) | |||||
| Citibank N.A. |
$ | 256,608 | $ | (256,608 | ) | $ | — | $ | — | $ | — | |||||||||
| Credit Suisse International |
351,795 | (351,795 | ) | — | — | — | ||||||||||||||
| Deutsche Bank AG |
1,992,088 | (1,992,088 | ) | — | — | — | ||||||||||||||
| Goldman Sachs Bank USA |
564,267 | (535,802 | ) | — | — | 28,465 | ||||||||||||||
| JPMorgan Chase Bank N.A. |
583,079 | (427,242 | ) | — | (100,000 | ) | 55,837 | |||||||||||||
| Morgan Stanley & Co. International PLC |
1,959,344 | (1,525,778 | ) | — | (410,000 | ) | 23,566 | |||||||||||||
| Nomura International Plc |
176,941 | (29,619 | ) | — | — | 147,322 | ||||||||||||||
| State Street Bank and Trust Co. |
6,311 | — | — | — | 6,311 | |||||||||||||||
| UBS AG |
116,970 | — | — | — | 116,970 | |||||||||||||||
|
|
|
|
|
|
|
|
|
|
|
|||||||||||
| $ | 7,860,475 | $ | (6,858,407 | ) | $ | — | $ | (510,000 | ) | $ | 492,068 | |||||||||
|
|
|
|
|
|
|
|
|
|
|
|||||||||||
| Counterparty |
|
Derivative Liabilities Subject to an MNA by Counterparty |
|
|
Derivatives Available for Offset |
(a) |
|
Non-Cash Collateral Pledged |
(e) |
|
Cash Collateral Pledged |
(e) |
|
Net Amount of Derivative Liabilities |
(f) | |||||
| Bank of America N.A. |
$ | 917,944 | $ | (453,226 | ) | $ | — | $ | (464,718 | ) | $ | — | ||||||||
| Barclays Bank PLC |
1,605,136 | (1,286,249 | ) | (318,887 | ) | — | — | |||||||||||||
| Citibank N.A. |
454,815 | (256,608 | ) | — | — | 198,207 | ||||||||||||||
| Credit Suisse International |
1,662,409 | (351,795 | ) | — | (1,310,614 | ) | — | |||||||||||||
| Deutsche Bank AG |
2,860,752 | (1,992,088 | ) | — | (430,000 | ) | 438,664 | |||||||||||||
| Goldman Sachs Bank USA |
535,802 | (535,802 | ) | — | — | — | ||||||||||||||
| JPMorgan Chase Bank N.A. |
427,242 | (427,242 | ) | — | — | — | ||||||||||||||
| Morgan Stanley & Co. International PLC |
1,525,778 | (1,525,778 | ) | — | — | — | ||||||||||||||
| Nomura International Plc |
29,619 | (29,619 | ) | — | — | — | ||||||||||||||
|
|
|
|
|
|
|
|
|
|
|
|||||||||||
| $ | 10,019,497 | $ | (6,858,407 | ) | $ | (318,887 | ) | $ | (2,205,332 | ) | $ | 636,871 | ||||||||
|
|
|
|
|
|
|
|
|
|
|
| (a) | The amount of derivatives available for offset is limited to the amount of derivative asset and/or liabilities that are subject to an MNA. |
| (b) | Excess of collateral received from the individual counterparty is not shown for financial reporting purposes. |
| (c) | Net amount may also include forward foreign currency exchange contracts that are not required to be collateralized. |
| (d) | Net amount represents the net amount receivable from the counterparty in the event of default. |
| (e) | Excess of collateral pledged to the individual counterparty is not shown for financial reporting purposes. |
| (f) | Net amount represents the net amount payable due to counterparty in the event of default. Net amount may be offset further by the options written receivable/payable on the Statements of Assets and Liabilities. |
Fair Value Hierarchy as of Period End
Various inputs are used in determining the fair value of financial instruments. For a description of the input levels and information about the Trust’s policy regarding valuation of financial instruments, refer to the Notes to Financial Statements.
The following table summarizes the Trust’s financial instruments categorized in the fair value hierarchy. The breakdown of the Trust’s financial instruments into major categories is disclosed in the Schedule of Investments above.
| Level 1 | Level 2 | Level 3 | Total | |||||||||||||
| Assets |
||||||||||||||||
| Investments |
||||||||||||||||
| Long-Term Investments |
||||||||||||||||
| Asset-Backed Securities |
$ | — | $ | 69,195,476 | $ | 6,274,261 | $ | 75,469,737 | ||||||||
| Common Stocks |
||||||||||||||||
| Energy Equipment & Services |
— | — | 8,021 | 8,021 | ||||||||||||
| Oil, Gas & Consumable Fuels |
135,613 | 143,374 | — | 278,987 | ||||||||||||
| Corporate Bonds |
||||||||||||||||
| Advertising Agencies |
— | 668,452 | — | 668,452 | ||||||||||||
| Aerospace & Defense |
— | 14,729,849 | — | 14,729,849 | ||||||||||||
| Airlines |
— | 11,159,943 | — | 11,159,943 | ||||||||||||
| Auto Components |
— | 4,167,035 | — | 4,167,035 | ||||||||||||
| Automobiles |
— | 9,304,639 | — | 9,304,639 | ||||||||||||
| Banks |
— | 15,273,287 | — | 15,273,287 | ||||||||||||
| 56 | 2 0 2 1 B L A C K R O C K S E M I - A N N U A L R E P O R T T O S H A R E H O L D E R S |
| Schedule of Investments (unaudited) (continued) June 30, 2021 |
BlackRock Core Bond Trust (BHK) |
Fair Value Hierarchy as of Period End (continued)
| Level 1 | Level 2 | Level 3 | Total | |||||||||||||
| Corporate Bonds (continued) |
||||||||||||||||
| Beverages |
$ | — | $ | 9,577,571 | $ | — | $ | 9,577,571 | ||||||||
| Biotechnology |
— | 1,976,458 | — | 1,976,458 | ||||||||||||
| Building Materials |
— | 2,195,528 | — | 2,195,528 | ||||||||||||
| Building Products |
— | 5,517,200 | — | 5,517,200 | ||||||||||||
| Capital Markets |
— | 19,687,025 | — | 19,687,025 | ||||||||||||
| Chemicals |
— | 4,713,325 | — | 4,713,325 | ||||||||||||
| Commercial Services & Supplies |
— | 1,755,855 | — | 1,755,855 | ||||||||||||
| Communications Equipment |
— | 1,545,785 | — | 1,545,785 | ||||||||||||
| Construction & Engineering |
— | 4,605,743 | — | 4,605,743 | ||||||||||||
| Construction Materials |
— | 2,061,162 | — | 2,061,162 | ||||||||||||
| Consumer Discretionary |
— | 4,555,307 | — | 4,555,307 | ||||||||||||
| Consumer Finance |
— | 8,067,733 | — | 8,067,733 | ||||||||||||
| Containers & Packaging |
— | 2,596,954 | — | 2,596,954 | ||||||||||||
| Diversified Consumer Services |
— | 5,438,033 | — | 5,438,033 | ||||||||||||
| Diversified Financial Services |
— | 37,024,045 | — | 37,024,045 | ||||||||||||
| Diversified Telecommunication Services |
— | 35,255,896 | — | 35,255,896 | ||||||||||||
| Education |
— | 293,335 | — | 293,335 | ||||||||||||
| Electric Utilities |
— | 28,461,756 | — | 28,461,756 | ||||||||||||
| Electrical Equipment |
— | 315,462 | — | 315,462 | ||||||||||||
| Electronic Equipment, Instruments & Components |
— | 2,996,144 | — | 2,996,144 | ||||||||||||
| Energy Equipment & Services |
— | 2,558,916 | 392,527 | 2,951,443 | ||||||||||||
| Environmental, Maintenance, & Security Service |
— | 1,691,182 | — | 1,691,182 | ||||||||||||
| Equity Real Estate Investment Trusts (REITs) |
— | 11,643,415 | — | 11,643,415 | ||||||||||||
| Food & Staples Retailing |
— | 5,030,744 | — | 5,030,744 | ||||||||||||
| Food Products |
— | 2,085,728 | — | 2,085,728 | ||||||||||||
| Gas Utilities |
— | 149,674 | — | 149,674 | ||||||||||||
| Health Care Equipment & Supplies |
— | 2,828,511 | — | 2,828,511 | ||||||||||||
| Health Care Providers & Services |
— | 16,845,719 | — | 16,845,719 | ||||||||||||
| Health Care Technology |
— | 2,293,107 | — | 2,293,107 | ||||||||||||
| Hotels, Restaurants & Leisure |
— | 14,524,302 | 3,928,706 | 18,453,008 | ||||||||||||
| Household Durables |
— | 2,333,708 | — | 2,333,708 | ||||||||||||
| Household Products |
— | 48,720 | — | 48,720 | ||||||||||||
| Independent Power and Renewable Electricity Producers |
— | 3,285,119 | — | 3,285,119 | ||||||||||||
| Insurance |
— | 26,327,170 | — | 26,327,170 | ||||||||||||
| Interactive Media & Services |
— | 1,831,190 | — | 1,831,190 | ||||||||||||
| Internet Software & Services |
— | 3,305,890 | — | 3,305,890 | ||||||||||||
| IT Services |
— | 6,100,241 | — | 6,100,241 | ||||||||||||
| Leisure Products |
— | 500,850 | — | 500,850 | ||||||||||||
| Machinery |
— | 2,328,530 | — | 2,328,530 | ||||||||||||
| Media |
— | 48,169,772 | — | 48,169,772 | ||||||||||||
| Metals & Mining |
— | 8,572,545 | — | 8,572,545 | ||||||||||||
| Mortgage Real Estate Investment Trusts (REITs) |
— | 115,374 | — | 115,374 | ||||||||||||
| Multi-line Retail |
— | 286,090 | — | 286,090 | ||||||||||||
| Multi-Utilities |
— | 1,376,908 | — | 1,376,908 | ||||||||||||
| Offshore Drilling & Other Services |
— | 713,834 | — | 713,834 | ||||||||||||
| Oil, Gas & Consumable Fuels |
115,848 | 63,405,619 | 1,687,243 | 65,208,710 | ||||||||||||
| Personal Products |
— | 81,620 | — | 81,620 | ||||||||||||
| Pharmaceuticals |
— | 21,148,370 | — | 21,148,370 | ||||||||||||
| Producer Durables: Miscellaneous |
— | 5,641,874 | — | 5,641,874 | ||||||||||||
| Real Estate Management & Development |
— | 29,420,590 | — | 29,420,590 | ||||||||||||
| Road & Rail |
— | 9,070,147 | — | 9,070,147 | ||||||||||||
| Semiconductors & Semiconductor Equipment |
— | 6,936,234 | — | 6,936,234 | ||||||||||||
| Software |
— | 9,742,377 | — | 9,742,377 | ||||||||||||
| Specialty Retail |
— | 2,859,813 | — | 2,859,813 | ||||||||||||
| Technology Hardware, Storage & Peripherals |
— | 3,184,625 | — | 3,184,625 | ||||||||||||
| Textiles, Apparel & Luxury Goods |
— | 213,389 | — | 213,389 | ||||||||||||
| Thrifts & Mortgage Finance |
— | 606,770 | — | 606,770 | ||||||||||||
| Tobacco |
— | 7,470,383 | — | 7,470,383 | ||||||||||||
| Transportation |
— | 123,377 | — | 123,377 | ||||||||||||
| Transportation Infrastructure |
— | 2,618,098 | 786,503 | 3,404,601 | ||||||||||||
| Utilities |
— | 10,703,972 | — | 10,703,972 | ||||||||||||
| Wireless Telecommunication Services |
— | 11,605,376 | — | 11,605,376 | ||||||||||||
| Floating Rate Loan Interests |
— | 23,613,419 | 1,116,984 | 24,730,403 | ||||||||||||
| S C H E D U L E O F I N V E S T M E N T S |
57 |
| Schedule of Investments (unaudited) (continued) June 30, 2021 |
BlackRock Core Bond Trust (BHK) |
Fair Value Hierarchy as of Period End (continued)
| Level 1 | Level 2 | Level 3 | Total | |||||||||||||
| Foreign Agency Obligations |
$ | — | $ | 30,885,486 | $ | — | $ | 30,885,486 | ||||||||
| Municipal Bonds |
— | 27,504,983 | — | 27,504,983 | ||||||||||||
| Non-Agency Mortgage-Backed Securities |
— | 51,266,450 | — | 51,266,450 | ||||||||||||
| Preferred Securities |
||||||||||||||||
| Capital Trusts |
— | 47,355,191 | — | 47,355,191 | ||||||||||||
| Preferred Stocks |
||||||||||||||||
| Capital Markets |
4,485,858 | — | — | 4,485,858 | ||||||||||||
| Thrifts & Mortgage Finance |
— | 21,300 | — | 21,300 | ||||||||||||
| Trust Preferred |
825,366 | — | — | 825,366 | ||||||||||||
| U.S. Government Sponsored Agency Securities |
— | 111,266,916 | — | 111,266,916 | ||||||||||||
| U.S. Treasury Obligations |
— | 342,784,062 | — | 342,784,062 | ||||||||||||
| Short-Term Securities |
||||||||||||||||
| Money Market Funds |
13,822,437 | — | — | 13,822,437 | ||||||||||||
| U.S. Treasury Obligations |
— | 2,815,580 | — | 2,815,580 | ||||||||||||
| Options Purchased |
||||||||||||||||
| Interest Rate Contracts |
345,000 | 7,181,430 | — | 7,526,430 | ||||||||||||
| Unfunded Floating Rate Loan Interests(a) |
— | 4 | — | 4 | ||||||||||||
|
|
|
|
|
|
|
|
|
|||||||||
| $ | 19,730,122 | $ | 1,297,757,066 | $ | 14,194,245 | $ | 1,331,681,433 | |||||||||
|
|
|
|
|
|
|
|
|
|||||||||
| Derivative Financial Instruments(b) |
||||||||||||||||
| Assets |
||||||||||||||||
| Credit Contracts |
$ | — | $ | 424,214 | $ | — | $ | 424,214 | ||||||||
| Foreign Currency Exchange Contracts |
— | 252,099 | — | 252,099 | ||||||||||||
| Interest Rate Contracts |
1,630,258 | 4,160,661 | — | 5,790,919 | ||||||||||||
| Liabilities |
||||||||||||||||
| Credit Contracts |
— | (776,142 | ) | — | (776,142 | ) | ||||||||||
| Interest Rate Contracts |
(655,253 | ) | (8,901,657 | ) | — | (9,556,910 | ) | |||||||||
|
|
|
|
|
|
|
|
|
|||||||||
| $ | 975,005 | $ | (4,840,825 | ) | $ | — | $ | (3,865,820 | ) | |||||||
|
|
|
|
|
|
|
|
|
|||||||||
| (a) | Unfunded floating rate loan interests are valued at the unrealized appreciation (depreciation) on the commitment. |
| (b) | Derivative financial instruments are swaps, futures contracts, forward foreign currency exchange contracts and options written. Swaps, futures contracts and forward foreign currency exchange contracts are valued at the unrealized appreciation (depreciation) on the instrument and options written are shown at value. |
The Trust may hold assets and/or liabilities in which the fair value approximates the carrying amount or face value, including accrued interest, for financial statement purposes. As of period end, reverse repurchase agreements of $466,168,595 are categorized as Level 2 within the fair value hierarchy.
A reconciliation of Level 3 financial instruments is presented when the Trust had a significant amount of Level 3 investments at the beginning and/or end of the period in relation to net assets. The following table is a reconciliation of Level 3 investments for which significant unobservable inputs were used in determining fair value:
| Asset-Backed Securities |
Common Stocks |
Corporate Bonds |
Floating Rate Loan Interests |
Total | ||||||||||||||||
| Assets |
||||||||||||||||||||
| Opening balance, as of December 31, 2020 |
$ | 27,859 | $ | 21,047 | $ | 7,038,030 | $ | 617,454 | $ | 7,704,390 | ||||||||||
| Transfers into Level 3 |
1,286,514 | — | — | — | 1,286,514 | |||||||||||||||
| Transfers out of Level 3 |
— | — | — | (245,481 | ) | (245,481 | ) | |||||||||||||
| Accrued discounts/premiums |
(50,989 | ) | — | 7,601 | 845 | (42,543 | ) | |||||||||||||
| Net realized gain (loss) |
— | — | 771 | 35 | 806 | |||||||||||||||
| Net change in unrealized appreciation (depreciation)(a)(b) |
50,893 | (13,026 | ) | (196,849 | ) | 18,059 | (140,923 | ) | ||||||||||||
| Purchases |
4,959,984 | — | 6,891 | 727,530 | 5,694,405 | |||||||||||||||
| Sales |
— | — | (61,465 | ) | (1,458 | ) | (62,923 | ) | ||||||||||||
|
|
|
|
|
|
|
|
|
|
|
|||||||||||
| Closing balance, as of June 30, 2021 |
$ | 6,274,261 | $ | 8,021 | $ | 6,794,979 | $ | 1,116,984 | $ | 14,194,245 | ||||||||||
|
|
|
|
|
|
|
|
|
|
|
|||||||||||
| Net change in unrealized appreciation (depreciation) on investments still held at June 30, 2021(b) |
$ | 50,893 | $ | (13,026 | ) | $ | (196,849 | ) | $ | 18,059 | $ | (140,923 | ) | |||||||
|
|
|
|
|
|
|
|
|
|
|
|||||||||||
| (a) | Included in the related net change in unrealized appreciation (depreciation) in the Statements of Operations. |
| (b) | Any difference between net change in unrealized appreciation (depreciation) and net change in unrealized appreciation (depreciation) on investments still held at June 30, 2021 is generally due to investments no longer held or categorized as level 3 at period end. |
See notes to financial statements.
| 58 | 2 0 2 1 B L A C K R O C K S E M I - A N N U A L R E P O R T T O S H A R E H O L D E R S |
| Consolidated Schedule of Investments (unaudited) June 30, 2021 |
BlackRock Corporate High Yield Fund, Inc. (HYT) (Percentages shown are based on Net Assets) |
| C O N S O L I D A T E D S C H E D U L E O F I N V E S T M E N T S |
59 |
| Consolidated Schedule of Investments (unaudited) (continued) June 30, 2021 |
BlackRock Corporate High Yield Fund, Inc. (HYT) (Percentages shown are based on Net Assets) |
| 60 | 2 0 2 1 B L A C K R O C K S E M I - A N N U A L R E P O R T T O S H A R E H O L D E R S |
| Consolidated Schedule of Investments (unaudited) (continued) June 30, 2021 |
BlackRock Corporate High Yield Fund, Inc. (HYT) (Percentages shown are based on Net Assets) |
| C O N S O L I D A T E D S C H E D U L E O F I N V E S T M E N T S |
61 |
| Consolidated Schedule of Investments (unaudited) (continued) June 30, 2021 |
BlackRock Corporate High Yield Fund, Inc. (HYT) (Percentages shown are based on Net Assets) |
| 62 | 2 0 2 1 B L A C K R O C K S E M I - A N N U A L R E P O R T T O S H A R E H O L D E R S |
| Consolidated Schedule of Investments (unaudited) (continued) June 30, 2021 |
BlackRock Corporate High Yield Fund, Inc. (HYT) (Percentages shown are based on Net Assets) |
| C O N S O L I D A T E D S C H E D U L E O F I N V E S T M E N T S |
63 |
| Consolidated Schedule of Investments (unaudited) (continued) June 30, 2021 |
BlackRock Corporate High Yield Fund, Inc. (HYT) (Percentages shown are based on Net Assets) |
| 64 | 2 0 2 1 B L A C K R O C K S E M I - A N N U A L R E P O R T T O S H A R E H O L D E R S |
| Consolidated Schedule of Investments (unaudited) (continued) June 30, 2021 |
BlackRock Corporate High Yield Fund, Inc. (HYT) (Percentages shown are based on Net Assets) |
| C O N S O L I D A T E D S C H E D U L E O F I N V E S T M E N T S |
65 |
| Consolidated Schedule of Investments (unaudited) (continued) June 30, 2021 |
BlackRock Corporate High Yield Fund, Inc. (HYT) (Percentages shown are based on Net Assets) |
| 66 | 2 0 2 1 B L A C K R O C K S E M I - A N N U A L R E P O R T T O S H A R E H O L D E R S |
| Consolidated Schedule of Investments (unaudited) (continued) June 30, 2021 |
BlackRock Corporate High Yield Fund, Inc. (HYT) (Percentages shown are based on Net Assets) |
| C O N S O L I D A T E D S C H E D U L E O F I N V E S T M E N T S |
67 |
| Consolidated Schedule of Investments (unaudited) (continued) June 30, 2021 |
BlackRock Corporate High Yield Fund, Inc. (HYT) (Percentages shown are based on Net Assets) |
| 68 | 2 0 2 1 B L A C K R O C K S E M I - A N N U A L R E P O R T T O S H A R E H O L D E R S |
| Consolidated Schedule of Investments (unaudited) (continued) June 30, 2021 |
BlackRock Corporate High Yield Fund, Inc. (HYT) (Percentages shown are based on Net Assets) |
| C O N S O L I D A T E D S C H E D U L E O F I N V E S T M E N T S |
69 |
| Consolidated Schedule of Investments (unaudited) (continued) June 30, 2021 |
BlackRock Corporate High Yield Fund, Inc. (HYT) (Percentages shown are based on Net Assets) |
| 70 | 2 0 2 1 B L A C K R O C K S E M I - A N N U A L R E P O R T T O S H A R E H O L D E R S |
| Consolidated Schedule of Investments (unaudited) (continued) June 30, 2021 |
BlackRock Corporate High Yield Fund, Inc. (HYT) (Percentages shown are based on Net Assets) |
| Security | Par (000) |
Value | ||||||||||
| Media (continued) | ||||||||||||
| Telesat Canada/Telesat
LLC, |
USD | 1,146 | $ | 1,105,890 | ||||||||
| Terrier Media Buyer,
Inc., |
4,158 | 4,495,837 | ||||||||||
| Univision Communications, Inc.(b) |
||||||||||||
| 5.13%, 02/15/25 |
800 | 816,160 | ||||||||||
| 6.63%, 06/01/27 |
1,205 | 1,305,678 | ||||||||||
| UPC Broadband Finco BV, 4.88%, 07/15/31(b) |
2,494 | 2,499,736 | ||||||||||
| UPC Holding BV, 3.88%, 06/15/29 |
EUR | 100 | 120,129 | |||||||||
| UPCB Finance VII Ltd., 3.63%, 06/15/29 |
360 | 435,863 | ||||||||||
| Videotron Ltd., 3.63%, 06/15/29(b) |
USD | 1,977 | 2,015,967 | |||||||||
| Virgin Media Finance PLC, 3.75%, 07/15/30 |
EUR | 142 | 168,166 | |||||||||
| Virgin Media Secured Finance PLC(b) |
||||||||||||
| 5.50%, 05/15/29 |
USD | 906 | 973,950 | |||||||||
| 4.50%, 08/15/30 |
795 | 800,962 | ||||||||||
| Virgin Media Vendor Financing Notes III DAC, 4.88%, 07/15/28 |
GBP | 100 | 140,405 | |||||||||
| Virgin Media Vendor Financing Notes IV DAC, 5.00%, 07/15/28(b) |
USD | 3,073 | 3,134,460 | |||||||||
| WMG Acquisition Corp., 3.88%, 07/15/30(b) |
655 | 661,485 | ||||||||||
| Ziggo Bond Co. BV(b) |
||||||||||||
| 6.00%, 01/15/27 |
291 | 304,095 | ||||||||||
| 5.13%, 02/28/30 |
868 | 888,389 | ||||||||||
| Ziggo BV |
||||||||||||
| 5.50%, 01/15/27(b) |
1,368 | 1,421,352 | ||||||||||
| 2.88%, 01/15/30 |
EUR | 106 | 125,690 | |||||||||
| 4.88%, 01/15/30(b) |
USD | 1,651 | 1,692,275 | |||||||||
|
|
|
|||||||||||
| 199,312,327 | ||||||||||||
| Metals & Mining — 2.8% | ||||||||||||
| Allegheny Technologies, Inc., 7.88%, 08/15/23 |
284 | 311,335 | ||||||||||
| Arconic Corp.(b) |
||||||||||||
| 6.00%, 05/15/25 |
1,484 | 1,581,603 | ||||||||||
| 6.13%, 02/15/28 |
2,032 | 2,179,767 | ||||||||||
| Big River Steel LLC/BRS Finance Corp., 6.63%, 01/31/29(b) |
5,873 | 6,467,641 | ||||||||||
| Constellium SE(b) |
||||||||||||
| 5.88%, 02/15/26 |
3,827 | 3,940,662 | ||||||||||
| 5.63%, 06/15/28 |
1,235 | 1,324,538 | ||||||||||
| 3.75%, 04/15/29 |
3,074 | 3,043,260 | ||||||||||
| Freeport-McMoRan, Inc. |
||||||||||||
| 5.40%, 11/14/34 |
262 | 316,445 | ||||||||||
| 5.45%, 03/15/43 |
4,792 | 5,857,357 | ||||||||||
| Glencore Funding LLC, Series GLEN, 0.00%, 03/27/25(g)(k) |
200 | 194,660 | ||||||||||
| Grinding Media, Inc./Moly-Cop AltaSteel Ltd., 7.38%, 12/15/23(b) |
1,645 | 1,682,078 | ||||||||||
| Joseph T Ryerson & Son, Inc., 8.50%, 08/01/28(b) |
661 | 733,710 | ||||||||||
| Kaiser Aluminum Corp.(b) |
||||||||||||
| 4.63%, 03/01/28 |
447 | 461,807 | ||||||||||
| 4.50%, 06/01/31 |
712 | 730,185 | ||||||||||
| KME SE, 6.75%, 02/01/23 |
EUR | 100 | 109,682 | |||||||||
| New Gold, Inc.(b) |
||||||||||||
| 6.38%, 05/15/25 |
USD | 239 | 246,768 | |||||||||
| 7.50%, 07/15/27 |
2,345 | 2,544,325 | ||||||||||
| Novelis Corp.(b) |
||||||||||||
| 5.88%, 09/30/26 |
1,470 | 1,529,174 | ||||||||||
| 4.75%, 01/30/30 |
4,149 | 4,356,450 | ||||||||||
| Novelis Sheet Ingot GmbH, 3.38%, 04/15/29 |
EUR | 100 | 121,575 | |||||||||
| thyssenkrupp AG |
||||||||||||
| 1.88%, 03/06/23 |
127 | 150,873 | ||||||||||
| 2.88%, 02/22/24 |
409 | 491,860 | ||||||||||
| Security | Par (000) |
Value | ||||||||||
| Metals & Mining (continued) | ||||||||||||
| United States Steel Corp. |
||||||||||||
| 6.25%, 03/15/26 |
USD | 116 | $ | 119,573 | ||||||||
| 6.88%, 03/01/29 |
1,838 | 1,966,660 | ||||||||||
| Vedanta Resources Finance II PLC, 8.95%, 03/11/25(b) |
1,154 | 1,130,920 | ||||||||||
|
|
|
|||||||||||
| 41,592,908 | ||||||||||||
| Mortgage Real Estate Investment Trusts (REITs)(b) — 0.1% | ||||||||||||
| Apollo Commercial Real Estate Finance, Inc., 4.63%, 06/15/29 |
956 | 942,712 | ||||||||||
| Starwood Property Trust, Inc., 5.50%, 11/01/23 |
157 | 164,457 | ||||||||||
|
|
|
|||||||||||
| 1,107,169 | ||||||||||||
| Multi-line Retail — 0.5% | ||||||||||||
| Dufry One BV, 2.00%, 02/15/27 |
EUR | 194 | 216,812 | |||||||||
| Macy’s, Inc., 8.38%, 06/15/25(b) |
USD | 3,066 | 3,376,279 | |||||||||
| Marks & Spencer PLC, 4.50%, 07/10/27 |
GBP | 200 | 295,941 | |||||||||
| NMG Holding Co., Inc./Neiman Marcus Group LLC, 7.13%, 04/01/26(b) |
USD | 2,192 | 2,339,960 | |||||||||
| Victoria’s Secret & Co., 4.63%, 07/15/29(b)(c) |
867 | 867,000 | ||||||||||
|
|
|
|||||||||||
| 7,095,992 | ||||||||||||
| Offshore Drilling & Other Services(b) — 0.1% | ||||||||||||
| Entegris, Inc. |
||||||||||||
| 4.38%, 04/15/28 |
1,037 | 1,082,369 | ||||||||||
| 3.63%, 05/01/29 |
535 | 541,687 | ||||||||||
|
|
|
|||||||||||
| 1,624,056 | ||||||||||||
| Oil, Gas & Consumable Fuels — 14.6% | ||||||||||||
| Aethon United BR LP/Aethon United Finance Corp., 8.25%, 02/15/26(b) |
2,544 | 2,754,389 | ||||||||||
| Antero Midstream Partners LP/Antero Midstream Finance Corp.(b) |
||||||||||||
| 7.88%, 05/15/26 |
2,299 | 2,569,385 | ||||||||||
| 5.75%, 03/01/27 |
341 | 354,640 | ||||||||||
| 5.38%, 06/15/29 |
1,137 | 1,185,322 | ||||||||||
| Antero Resources Corp.(b) |
||||||||||||
| 7.63%, 02/01/29 |
1,310 | 1,454,100 | ||||||||||
| 5.38%, 03/01/30 |
997 | 1,017,568 | ||||||||||
| Apache Corp. |
||||||||||||
| 4.88%, 11/15/27 |
1,094 | 1,184,791 | ||||||||||
| 4.38%, 10/15/28 |
185 | 196,933 | ||||||||||
| 4.25%, 01/15/30 |
1,125 | 1,186,875 | ||||||||||
| 5.10%, 09/01/40 |
1,080 | 1,131,300 | ||||||||||
| 5.25%, 02/01/42 |
359 | 379,643 | ||||||||||
| 4.75%, 04/15/43 |
1,015 | 1,055,295 | ||||||||||
| 4.25%, 01/15/44 |
229 | 223,760 | ||||||||||
| 5.35%, 07/01/49 |
305 | 321,013 | ||||||||||
| Arcosa, Inc., 4.38%, 04/15/29(b) |
2,048 | 2,083,840 | ||||||||||
| Ascent Resources Utica Holdings LLC/ARU Finance Corp.(b) |
||||||||||||
| 9.00%, 11/01/27 |
2,218 | 3,065,587 | ||||||||||
| 5.88%, 06/30/29 |
2,109 | 2,109,000 | ||||||||||
| Baytex Energy Corp., 8.75%, 04/01/27(b) |
499 | 502,742 | ||||||||||
| Brand Industrial Services, Inc., |
2,543 | 2,585,544 | ||||||||||
| Buckeye Partners LP |
||||||||||||
| 4.13%, 03/01/25(b) |
34 | 35,233 | ||||||||||
| 5.85%, 11/15/43 |
816 | 809,880 | ||||||||||
| 5.60%, 10/15/44 |
1,073 | 1,040,810 | ||||||||||
| Callon Petroleum Co. |
||||||||||||
| 6.25%, 04/15/23 |
221 | 221,256 | ||||||||||
| 6.13%, 10/01/24 |
534 | 526,412 | ||||||||||
| 9.00%, 04/01/25(b) |
3,096 | 3,374,640 | ||||||||||
| C O N S O L I D A T E D S C H E D U L E O F I N V E S T M E N T S |
71 |
| Consolidated Schedule of Investments (unaudited) (continued) June 30, 2021 |
BlackRock Corporate High Yield Fund, Inc. (HYT) (Percentages shown are based on Net Assets) |
| Security | Par (000) |
Value | ||||||||||
| Oil, Gas & Consumable Fuels (continued) | ||||||||||||
| Callon Petroleum Co. (continued) |
||||||||||||
| 8.00%, 08/01/28(b)(c) |
USD | 3,213 | $ | 3,249,146 | ||||||||
| Cellnex Telecom SA(g) |
||||||||||||
| Series CLNX, 0.50%, 07/05/28 |
EUR | 100 | 161,713 | |||||||||
| Series CLNX, 0.75%, 11/20/31 |
800 | 926,782 | ||||||||||
| Centennial Resource Production LLC |
||||||||||||
| 6.88%, 04/01/27(b) |
USD | 1,284 | 1,313,031 | |||||||||
| 3.25%, 04/01/28(g) |
450 | 592,020 | ||||||||||
| Cheniere Energy Partners LP |
||||||||||||
| 4.50%, 10/01/29 |
2,308 | 2,481,100 | ||||||||||
| 4.00%, 03/01/31(b) |
4,004 | 4,184,180 | ||||||||||
| Cheniere Energy, Inc., 4.63%, 10/15/28(b) |
8,556 | 9,026,580 | ||||||||||
| Chesapeake Energy Corp.(b) |
||||||||||||
| 5.50%, 02/01/26 |
111 | 117,105 | ||||||||||
| 5.88%, 02/01/29 |
364 | 394,014 | ||||||||||
| CITGO Petroleum Corp.(b) |
||||||||||||
| 7.00%, 06/15/25 |
1,453 | 1,514,128 | ||||||||||
| 6.38%, 06/15/26 |
1,302 | 1,357,335 | ||||||||||
| CNX Resources Corp., 6.00%, 01/15/29(b) |
1,159 | 1,253,134 | ||||||||||
| Colgate Energy Partners III LLC(b) |
||||||||||||
| 7.75%, 02/15/26 |
647 | 709,274 | ||||||||||
| 5.88%, 07/01/29 |
1,651 | 1,712,912 | ||||||||||
| Comstock Resources, Inc.(b) |
||||||||||||
| 7.50%, 05/15/25 |
933 | 967,987 | ||||||||||
| 6.75%, 03/01/29 |
2,877 | 3,064,667 | ||||||||||
| 5.88%, 01/15/30 |
1,477 | 1,506,540 | ||||||||||
| Continental Resources, Inc. |
||||||||||||
| 4.50%, 04/15/23 |
146 | 151,925 | ||||||||||
| 5.75%, 01/15/31(b) |
662 | 792,745 | ||||||||||
| 4.90%, 06/01/44 |
691 | 782,561 | ||||||||||
| Crestwood Midstream Partners LP/Crestwood Midstream Finance Corp., 5.63%, 05/01/27(b) |
418 | 428,973 | ||||||||||
| CrownRock LP/CrownRock Finance, Inc., 5.63%, 10/15/25(b) |
3,881 | 4,016,835 | ||||||||||
| DCP Midstream Operating LP(b) |
||||||||||||
| 6.45%, 11/03/36 |
1,282 | 1,499,940 | ||||||||||
| 6.75%, 09/15/37 |
2,344 | 2,818,660 | ||||||||||
| DT Midstream, Inc.(b) |
||||||||||||
| 4.13%, 06/15/29 |
2,468 | 2,505,834 | ||||||||||
| 4.38%, 06/15/31 |
3,139 | 3,207,399 | ||||||||||
| Dycom Industries, Inc., 4.50%, 04/15/29(b) |
564 | 568,884 | ||||||||||
| eG Global Finance PLC |
||||||||||||
| 4.38%, 02/07/25 |
EUR | 133 | 155,438 | |||||||||
| 6.75%, 02/07/25(b) |
USD | 1,613 | 1,667,786 | |||||||||
| 6.25%, 10/30/25 |
EUR | 463 | 562,178 | |||||||||
| 8.50%, 10/30/25(b) |
USD | 1,586 | 1,677,195 | |||||||||
| Endeavor Energy Resources LP/EER Finance, Inc.(b) |
||||||||||||
| 5.50%, 01/30/26 |
3,785 | 3,931,669 | ||||||||||
| 5.75%, 01/30/28 |
316 | 336,935 | ||||||||||
| Energy Transfer LP, Series H, (5 year |
3,372 | 3,437,754 | ||||||||||
| EnLink Midstream LLC |
||||||||||||
| 5.63%, 01/15/28(b) |
899 | 949,695 | ||||||||||
| 5.38%, 06/01/29 |
474 | 494,676 | ||||||||||
| EnLink Midstream Partners LP |
||||||||||||
| 4.40%, 04/01/24 |
1,638 | 1,719,900 | ||||||||||
| 4.15%, 06/01/25 |
108 | 113,113 | ||||||||||
| 4.85%, 07/15/26 |
297 | 307,395 | ||||||||||
| 5.60%, 04/01/44 |
1,316 | 1,190,980 | ||||||||||
| 5.05%, 04/01/45 |
220 | 189,200 | ||||||||||
| Security | Par (000) |
Value | ||||||||||
| Oil, Gas & Consumable Fuels (continued) | ||||||||||||
| EQM Midstream Partners LP |
||||||||||||
| 6.00%, 07/01/25(b) |
USD | 1,338 | $ | 1,455,075 | ||||||||
| 4.13%, 12/01/26 |
361 | 369,574 | ||||||||||
| 6.50%, 07/01/27(b) |
1,929 | 2,150,835 | ||||||||||
| 4.50%, 01/15/29(b) |
1,274 | 1,296,139 | ||||||||||
| 4.75%, 01/15/31(b) |
2,084 | 2,147,437 | ||||||||||
| EQT Corp. |
||||||||||||
| 3.13%, 05/15/26(b) |
984 | 1,008,315 | ||||||||||
| 3.90%, 10/01/27 |
1,622 | 1,737,567 | ||||||||||
| 5.00%, 01/15/29 |
271 | 302,157 | ||||||||||
| 8.50%, 02/01/30 |
880 | 1,146,561 | ||||||||||
| 3.63%, 05/15/31(b) |
276 | 287,730 | ||||||||||
| Genesis Energy LP/Genesis Energy Finance Corp. |
||||||||||||
| 5.63%, 06/15/24 |
82 | 82,205 | ||||||||||
| 6.50%, 10/01/25 |
350 | 353,500 | ||||||||||
| 8.00%, 01/15/27 |
1,093 | 1,148,333 | ||||||||||
| 7.75%, 02/01/28 |
188 | 194,287 | ||||||||||
| Great Western Petroleum LLC/Great Western Finance Corp., 12.00%, 09/01/25(b) |
634 | 630,830 | ||||||||||
| Harvest Midstream I LP, 7.50%, 09/01/28(b) |
718 | 779,748 | ||||||||||
| Hess Midstream Operations
LP, |
466 | 488,717 | ||||||||||
| Hilcorp Energy I LP/Hilcorp Finance Co.(b) |
||||||||||||
| 5.75%, 02/01/29 |
296 | 308,580 | ||||||||||
| 6.00%, 02/01/31 |
564 | 597,840 | ||||||||||
| Independence Energy Finance LLC, 7.25%, 05/01/26(b) |
2,211 | 2,321,926 | ||||||||||
| Indigo Natural Resources LLC, 5.38%, 02/01/29(b) |
2,640 | 2,758,800 | ||||||||||
| ITT Holdings LLC, 6.50%, 08/01/29(b)(c) |
1,889 | 1,924,419 | ||||||||||
| MasTec, Inc., 4.50%, 08/15/28(b) |
1,122 | 1,181,275 | ||||||||||
| Matador Resources Co., 5.88%, 09/15/26 |
5,187 | 5,342,610 | ||||||||||
| MEG Energy Corp.(b) |
||||||||||||
| 7.13%, 02/01/27 |
295 | 314,271 | ||||||||||
| 5.88%, 02/01/29 |
562 | 585,885 | ||||||||||
| Murphy Oil Corp. |
||||||||||||
| 5.75%, 08/15/25 |
833 | 854,866 | ||||||||||
| 6.38%, 12/01/42 |
141 | 139,642 | ||||||||||
| Murphy Oil USA, Inc., 4.75%, 09/15/29 |
928 | 976,442 | ||||||||||
| Neptune Energy Bondco PLC, 6.63%, 05/15/25(b) |
200 | 205,340 | ||||||||||
| New Enterprise Stone & Lime Co., Inc.(b) |
||||||||||||
| 6.25%, 03/15/26 |
480 | 492,854 | ||||||||||
| 9.75%, 07/15/28 |
438 | 490,560 | ||||||||||
| New Fortress Energy, Inc.(b) |
||||||||||||
| 6.75%, 09/15/25 |
5,338 | 5,464,777 | ||||||||||
| 6.50%, 09/30/26 |
6,468 | 6,609,002 | ||||||||||
| NGL Energy Operating LLC/NGL Energy Finance Corp., 7.50%, 02/01/26(b) |
2,011 | 2,111,550 | ||||||||||
| NGPL PipeCo LLC, 7.77%, 12/15/37(b) |
1,640 | 2,346,025 | ||||||||||
| Northern Oil and Gas, Inc., 8.13%, 03/01/28(b) |
2,707 | 2,916,792 | ||||||||||
| NuStar Logistics LP |
||||||||||||
| 5.75%, 10/01/25 |
719 | 781,912 | ||||||||||
| 6.00%, 06/01/26 |
908 | 985,180 | ||||||||||
| 6.38%, 10/01/30 |
75 | 82,868 | ||||||||||
| Occidental Petroleum Corp. |
||||||||||||
| 2.70%, 02/15/23 |
287 | 293,371 | ||||||||||
| 6.95%, 07/01/24 |
363 | 408,912 | ||||||||||
| 2.90%, 08/15/24 |
2,523 | 2,579,767 | ||||||||||
| 5.50%, 12/01/25 |
450 | 497,259 | ||||||||||
| 5.55%, 03/15/26 |
164 | 181,220 | ||||||||||
| 3.40%, 04/15/26 |
440 | 449,900 | ||||||||||
| 3.20%, 08/15/26 |
90 | 90,675 | ||||||||||
| 72 | 2 0 2 1 B L A C K R O C K S E M I - A N N U A L R E P O R T T O S H A R E H O L D E R S |
| Consolidated Schedule of Investments (unaudited) (continued) June 30, 2021 |
BlackRock Corporate High Yield Fund, Inc. (HYT) (Percentages shown are based on Net Assets) |
| Security | Par (000) |
Value | ||||||||||
| Oil, Gas & Consumable Fuels (continued) | ||||||||||||
| Occidental Petroleum Corp. (continued) |
||||||||||||
| 3.00%, 02/15/27 |
USD | 25 | $ | 24,813 | ||||||||
| 8.88%, 07/15/30 |
164 | 219,332 | ||||||||||
| 6.13%, 01/01/31 |
1,235 | 1,453,015 | ||||||||||
| 4.30%, 08/15/39 |
2,394 | 2,286,270 | ||||||||||
| 6.20%, 03/15/40 |
3,730 | 4,217,586 | ||||||||||
| 4.50%, 07/15/44 |
1,099 | 1,057,787 | ||||||||||
| 4.63%, 06/15/45 |
2,824 | 2,753,400 | ||||||||||
| 6.60%, 03/15/46 |
57 | 67,756 | ||||||||||
| 4.40%, 04/15/46 |
2,413 | 2,317,686 | ||||||||||
| 4.10%, 02/15/47 |
340 | 316,581 | ||||||||||
| 4.20%, 03/15/48 |
1,598 | 1,494,130 | ||||||||||
| 4.40%, 08/15/49 |
472 | 453,120 | ||||||||||
| Ovintiv Exploration, Inc., 5.38%, 01/01/26 |
211 | 237,786 | ||||||||||
| Ovintiv, Inc. |
||||||||||||
| 7.38%, 11/01/31 |
485 | 643,939 | ||||||||||
| 6.50%, 08/15/34 |
314 | 414,516 | ||||||||||
| Parkland Corp.(b) |
||||||||||||
| 5.88%, 07/15/27 |
1,223 | 1,303,559 | ||||||||||
| 4.50%, 10/01/29 |
562 | 571,099 | ||||||||||
| PBF Holding Co. LLC/PBF Finance Corp., 9.25%, 05/15/25(b) |
5,637 | 5,678,657 | ||||||||||
| PDC Energy, Inc. |
||||||||||||
| 1.13%, 09/15/21(g) |
1,153 | 1,142,940 | ||||||||||
| 6.13%, 09/15/24 |
711 | 727,140 | ||||||||||
| 6.25%, 12/01/25 |
298 | 308,430 | ||||||||||
| Range Resources Corp. |
||||||||||||
| 4.88%, 05/15/25 |
464 | 480,240 | ||||||||||
| 9.25%, 02/01/26 |
114 | 125,685 | ||||||||||
| 8.25%, 01/15/29(b) |
626 | 705,815 | ||||||||||
| SM Energy Co. |
||||||||||||
| 10.00%, 01/15/25(b) |
4,914 | 5,544,663 | ||||||||||
| 5.63%, 06/01/25 |
125 | 123,750 | ||||||||||
| 6.75%, 09/15/26 |
209 | 212,658 | ||||||||||
| 6.50%, 07/15/28 |
1,095 | 1,125,112 | ||||||||||
| Southwestern Energy Co. |
||||||||||||
| 6.45%, 01/23/25 |
76 | 84,132 | ||||||||||
| 7.50%, 04/01/26 |
237 | 250,924 | ||||||||||
| 8.38%, 09/15/28 |
370 | 418,100 | ||||||||||
| Sunoco LP/Sunoco Finance Corp. |
||||||||||||
| 6.00%, 04/15/27 |
339 | 354,509 | ||||||||||
| 5.88%, 03/15/28 |
808 | 858,500 | ||||||||||
| Tallgrass Energy Partners LP/Tallgrass Energy Finance Corp.(b) |
||||||||||||
| 7.50%, 10/01/25 |
711 | 778,545 | ||||||||||
| 6.00%, 12/31/30 |
784 | 815,062 | ||||||||||
| Targa Resources Partners LP/Targa Resources Partners Finance Corp. |
||||||||||||
| 5.88%, 04/15/26 |
1,082 | 1,136,435 | ||||||||||
| 5.38%, 02/01/27 |
188 | 195,755 | ||||||||||
| 6.50%, 07/15/27 |
786 | 851,804 | ||||||||||
| 6.88%, 01/15/29 |
602 | 678,231 | ||||||||||
| 5.50%, 03/01/30 |
1,989 | 2,187,224 | ||||||||||
| 4.88%, 02/01/31(b) |
353 | 382,123 | ||||||||||
| 4.00%, 01/15/32(b) |
252 | 259,220 | ||||||||||
| Transocean, Inc., 11.50%, 01/30/27(b) |
965 | 1,031,291 | ||||||||||
| UGI International LLC, 3.25%, 11/01/25 |
EUR | 100 | 121,077 | |||||||||
| Vine Energy Holdings
LLC, |
USD | 3,217 | 3,385,892 | |||||||||
| Viper Energy Partners
LP, |
716 | 745,864 | ||||||||||
| Security | Par (000) |
Value | ||||||||||
| Oil, Gas & Consumable Fuels (continued) | ||||||||||||
| Western Midstream Operating LP |
||||||||||||
| 4.75%, 08/15/28 |
USD | 145 | $ | 156,600 | ||||||||
| 5.45%, 04/01/44 |
1,561 | 1,681,977 | ||||||||||
| 5.30%, 03/01/48 |
2,255 | 2,401,575 | ||||||||||
| 5.50%, 08/15/48 |
576 | 626,913 | ||||||||||
| 6.50%, 02/01/50 |
3,291 | 3,810,435 | ||||||||||
|
|
|
|||||||||||
| 218,502,459 | ||||||||||||
| Personal Products — 0.1% | ||||||||||||
| Coty, Inc. |
||||||||||||
| 4.00%, 04/15/23 |
EUR | 200 | 235,066 | |||||||||
| 3.88%, 04/15/26 |
206 | 245,178 | ||||||||||
| 4.75%, 04/15/26 |
100 | 115,428 | ||||||||||
| 5.00%, 04/15/26(b) |
USD | 676 | 685,451 | |||||||||
| 6.50%, 04/15/26(b) |
100 | 101,305 | ||||||||||
| Edgewell Personal Care Co., 5.50%, 06/01/28(b) |
472 | 500,320 | ||||||||||
|
|
|
|||||||||||
| 1,882,748 | ||||||||||||
| Pharmaceuticals — 3.3% | ||||||||||||
| Bausch Health Americas,
Inc., |
306 | 332,836 | ||||||||||
| Bausch Health Cos., Inc.(b) |
||||||||||||
| 6.13%, 04/15/25 |
344 | 352,600 | ||||||||||
| 9.00%, 12/15/25 |
339 | 363,510 | ||||||||||
| 5.75%, 08/15/27 |
1,292 | 1,371,303 | ||||||||||
| 7.00%, 01/15/28 |
1,393 | 1,434,790 | ||||||||||
| 5.00%, 01/30/28 |
1,385 | 1,314,019 | ||||||||||
| 4.88%, 06/01/28 |
4,013 | 4,107,306 | ||||||||||
| 5.00%, 02/15/29 |
2,500 | 2,331,250 | ||||||||||
| 6.25%, 02/15/29 |
2,338 | 2,312,399 | ||||||||||
| 7.25%, 05/30/29 |
2,892 | 2,955,364 | ||||||||||
| 5.25%, 01/30/30 |
1,627 | 1,513,110 | ||||||||||
| 5.25%, 02/15/31 |
225 | 210,026 | ||||||||||
| Cheplapharm Arzneimittel GmbH |
||||||||||||
| 3.50%, 02/11/27 |
EUR | 166 | 198,781 | |||||||||
| 4.38%, 01/15/28 |
100 | 123,170 | ||||||||||
| 5.50%, 01/15/28(b) |
USD | 1,643 | 1,684,075 | |||||||||
| Elanco Animal Health, Inc., 5.90%, 08/28/28 |
241 | 282,035 | ||||||||||
| Endo Dac/Endo Finance LLC/Endo Finco, Inc., 9.50%, 07/31/27(b) |
2,219 | 2,263,380 | ||||||||||
| Endo Luxembourg Finance Co. I Sarl/Endo US, Inc., 6.13%, 04/01/29(b) |
2,740 | 2,685,200 | ||||||||||
| Gruenenthal GmbH |
||||||||||||
| 3.63%, 11/15/26 |
EUR | 100 | 121,875 | |||||||||
| 4.13%, 05/15/28 |
100 | 122,227 | ||||||||||
| Jaguar Holding Co. II/PPD Development |
||||||||||||
| 4.63%, 06/15/25 |
USD | 529 | 555,450 | |||||||||
| 5.00%, 06/15/28 |
3,623 | 3,927,042 | ||||||||||
| Jazz Securities DAC, 4.38%, 01/15/29(b) |
2,194 | 2,274,739 | ||||||||||
| Nidda BondCo GmbH |
||||||||||||
| 5.00%, 09/30/25 |
EUR | 100 | 118,990 | |||||||||
| 7.25%, 09/30/25 |
237 | 288,456 | ||||||||||
| Nidda Healthcare Holding GmbH, 3.50%, 09/30/24 |
100 | 118,250 | ||||||||||
| Organon & Co./Organon Foreign Debt Co-Issuer BV |
||||||||||||
| 2.88%, 04/30/28 |
120 | 144,247 | ||||||||||
| 4.13%, 04/30/28(b) |
USD | 4,094 | 4,175,061 | |||||||||
| 5.13%, 04/30/31(b) |
3,727 | 3,839,555 | ||||||||||
| P&L Development LLC/PLD Finance Corp., 7.75%, 11/15/25(b) |
1,300 | 1,365,000 | ||||||||||
| Par Pharmaceutical, Inc., 7.50%, 04/01/27(b) |
5,373 | 5,492,979 | ||||||||||
| Prestige Brands, Inc., 3.75%, 04/01/31(b) |
834 | 804,080 | ||||||||||
| C O N S O L I D A T E D S C H E D U L E O F I N V E S T M E N T S |
73 |
| Consolidated Schedule of Investments (unaudited) (continued) June 30, 2021 |
BlackRock Corporate High Yield Fund, Inc. (HYT) (Percentages shown are based on Net Assets) |
| Security | Par (000) |
Value | ||||||||||
| Pharmaceuticals (continued) | ||||||||||||
| Rossini Sarl, 6.75%, 10/30/25 |
EUR | 201 | $ | 249,551 | ||||||||
| Teva Pharmaceutical Finance Netherlands II BV |
||||||||||||
| 6.00%, 01/31/25 |
100 | 127,824 | ||||||||||
| 4.50%, 03/01/25 |
100 | 122,340 | ||||||||||
| 1.88%, 03/31/27 |
100 | 108,518 | ||||||||||
| 1.63%, 10/15/28 |
100 | 104,405 | ||||||||||
| Teva Pharmaceutical Finance Netherlands III BV, 7.13%, 01/31/25 |
USD | 200 | 219,500 | |||||||||
|
|
|
|||||||||||
| 50,115,243 | ||||||||||||
| Real Estate Management & Development — 0.8% | ||||||||||||
| Adler Group SA |
||||||||||||
| 3.25%, 08/05/25 |
EUR | 200 | 244,653 | |||||||||
| 2.75%, 11/13/26 |
100 | 119,909 | ||||||||||
| Aedas Homes Opco SLU, 4.00%, 08/15/26 |
100 | 121,243 | ||||||||||
| Canary Wharf Group Investment Holdings PLC |
||||||||||||
| 1.75%, 04/07/26 |
100 | 119,366 | ||||||||||
| 3.38%, 04/23/28 |
GBP | 100 | 139,541 | |||||||||
| Cushman & Wakefield U.S. Borrower LLC, 6.75%, 05/15/28(b) |
USD | 1,654 | 1,783,773 | |||||||||
| DEMIRE Deutsche Mittelstand Real Estate AG, 1.88%, 10/15/24 |
EUR | 100 | 115,504 | |||||||||
| Fastighets AB Balder, (5 year EUR Swap + 3.19%), 2.87%, 06/02/81(a) |
175 | 205,503 | ||||||||||
| Five Point Operating Co. LP/Five Point Capital Corp., 7.88%, 11/15/25(b) |
USD | 2,113 | 2,231,751 | |||||||||
| Heimstaden Bostad AB(a)(i) |
||||||||||||
| (5 year EUR Swap + 3.15%), 2.63% |
EUR | 200 | 234,126 | |||||||||
| (5 year EUR Swap + 3.91%), 3.38% |
100 | 122,602 | ||||||||||
| Howard Hughes Corp.(b) |
||||||||||||
| 5.38%, 08/01/28 |
USD | 1,334 | 1,416,214 | |||||||||
| 4.13%, 02/01/29 |
1,090 | 1,090,022 | ||||||||||
| 4.38%, 02/01/31 |
1,032 | 1,028,264 | ||||||||||
| Peach Property Finance GmbH, 4.38%, 11/15/25 |
EUR | 100 | 124,279 | |||||||||
| Realogy Group LLC/Realogy Co-Issuer Corp.(b) |
||||||||||||
| 7.63%, 06/15/25 |
USD | 684 | 741,935 | |||||||||
| 5.75%, 01/15/29 |
1,555 | 1,625,581 | ||||||||||
|
|
|
|||||||||||
| 11,464,266 | ||||||||||||
| Road & Rail — 0.1% | ||||||||||||
| Autostrade per l’Italia SpA |
||||||||||||
| 1.88%, 11/04/25 |
EUR | 100 | 123,277 | |||||||||
| 2.00%, 01/15/30 |
279 | 341,576 | ||||||||||
| CMA CGM SA, 7.50%, 01/15/26 |
215 | 283,485 | ||||||||||
| Danaos Corp., 8.50%, 03/01/28(b) |
USD | 726 | 796,110 | |||||||||
| Getlink SE, 3.50%, 10/30/25 |
EUR | 220 | 270,648 | |||||||||
|
|
|
|||||||||||
| 1,815,096 | ||||||||||||
| Semiconductors & Semiconductor Equipment — 1.0% | ||||||||||||
| ams AG |
||||||||||||
| 6.00%, 07/31/25 |
200 | 253,869 | ||||||||||
| 2.13%, 11/03/27(g) |
100 | 116,145 | ||||||||||
| Atkore, Inc., 4.25%, 06/01/31(b) |
USD | 908 | 919,622 | |||||||||
| Microchip Technology, Inc., 4.25%, 09/01/25 |
3,008 | 3,157,997 | ||||||||||
| ON Semiconductor
Corp., |
1,700 | 1,751,238 | ||||||||||
| Sensata Technologies BV(b) |
||||||||||||
| 5.63%, 11/01/24 |
1,400 | 1,555,750 | ||||||||||
| 5.00%, 10/01/25 |
2,021 | 2,250,889 | ||||||||||
| 4.00%, 04/15/29 |
1,771 | 1,797,713 | ||||||||||
| Security | Par (000) |
Value | ||||||||||
| Semiconductors & Semiconductor Equipment (continued) | ||||||||||||
| Sensata Technologies,
Inc., |
USD | 2,001 | $ | 2,108,737 | ||||||||
| Synaptics, Inc., 4.00%, 06/15/29(b) |
1,094 | 1,099,470 | ||||||||||
|
|
|
|||||||||||
| 15,011,430 | ||||||||||||
| Software — 2.8% | ||||||||||||
| ACI Worldwide, Inc., 5.75%, 08/15/26(b) |
1,657 | 1,737,779 | ||||||||||
| Black Knight InfoServ
LLC, |
1,997 | 1,986,935 | ||||||||||
| Boxer Parent Co., Inc. |
||||||||||||
| 6.50%, 10/02/25 |
EUR | 373 | 469,145 | |||||||||
| 7.13%, 10/02/25(b) |
USD | 1,099 | 1,175,930 | |||||||||
| 9.13%, 03/01/26(b) |
3,346 | 3,531,770 | ||||||||||
| BY Crown Parent LLC, 7.38%, 10/15/24(b) |
4,370 | 4,448,660 | ||||||||||
| BY Crown Parent LLC/BY Bond Finance, Inc., 4.25%, 01/31/26(b) |
2,794 | 2,926,715 | ||||||||||
| Cedacri Mergeco SpA, (3 mo. EURIBOR + 4.63%), 4.63%, 05/15/28(a) |
EUR | 163 | 195,693 | |||||||||
| Crowdstrike Holdings, Inc., 3.00%, 02/15/29 |
USD | 1,451 | 1,452,379 | |||||||||
| Elastic NV, 4.13%, 07/15/29(b)(c) |
1,617 | 1,617,000 | ||||||||||
| Helios Software Holdings, Inc./ION Corporate Solutions Finance Sarl, 4.63%, 05/01/28(b) |
959 | 938,688 | ||||||||||
| MicroStrategy, Inc., 6.13%, 06/15/28(b) |
1,778 | 1,778,000 | ||||||||||
| MSCI, Inc.(b) |
||||||||||||
| 3.63%, 09/01/30 |
1,263 | 1,291,620 | ||||||||||
| 3.88%, 02/15/31 |
1,370 | 1,421,731 | ||||||||||
| 3.63%, 11/01/31 |
1,078 | 1,105,705 | ||||||||||
| Nuance Communications, Inc., 5.63%, 12/15/26 |
884 | 920,942 | ||||||||||
| Open Text Corp., 3.88%, 02/15/28(b) |
94 | 95,297 | ||||||||||
| Open Text Holdings, Inc., 4.13%, 02/15/30(b) |
1,365 | 1,392,027 | ||||||||||
| PTC, Inc., 4.00%, 02/15/28(b) |
493 | 509,269 | ||||||||||
| Rocket Software, Inc., 6.50%, 02/15/29(b) |
2,044 | 2,028,220 | ||||||||||
| SS&C Technologies, Inc., 5.50%, 09/30/27(b) |
5,376 | 5,696,947 | ||||||||||
| Veritas US, Inc./Veritas Bermuda Ltd., |
5,216 | 5,431,160 | ||||||||||
|
|
|
|||||||||||
| 42,151,612 | ||||||||||||
| Specialty Retail — 1.4% | ||||||||||||
| Gap, Inc., 8.88%, 05/15/27(b) |
932 | 1,078,510 | ||||||||||
| Goldstory SASU, 5.38%, 03/01/26 |
EUR | 100 | 121,243 | |||||||||
| L Brands, Inc. |
||||||||||||
| 6.63%, 10/01/30(b) |
USD | 737 | 853,078 | |||||||||
| 6.88%, 11/01/35 |
2,966 | 3,755,697 | ||||||||||
| 6.75%, 07/01/36 |
384 | 480,960 | ||||||||||
| PetSmart, Inc./PetSmart Finance Corp.(b) |
||||||||||||
| 4.75%, 02/15/28 |
1,897 | 1,970,509 | ||||||||||
| 7.75%, 02/15/29 |
6,375 | 7,028,437 | ||||||||||
| Staples, Inc.(b) |
||||||||||||
| 7.50%, 04/15/26 |
4,814 | 4,986,028 | ||||||||||
| 10.75%, 04/15/27 |
858 | 872,286 | ||||||||||
| Tendam Brands SAU, (3 mo. EURIBOR + 5.25%), 5.25%, 09/15/24(a) |
EUR | 100 | 117,074 | |||||||||
|
|
|
|||||||||||
| 21,263,822 | ||||||||||||
| Textiles, Apparel & Luxury Goods — 0.2% | ||||||||||||
| BK LC Lux Finco1 Sarl, 5.25%, 04/30/29 |
100 | 121,243 | ||||||||||
| Crocs, Inc., 4.25%, 03/15/29(b) |
USD | 870 | 887,400 | |||||||||
| European TopSoho Sarl, Series SMCP, 4.00%, 09/21/21(d)(g)(j) |
EUR | 200 | 210,179 | |||||||||
| Hanesbrands, Inc., 5.38%, 05/15/25(b) |
USD | 277 | 293,274 | |||||||||
| Levi Strauss & Co. |
||||||||||||
| 5.00%, 05/01/25 |
98 | 99,960 | ||||||||||
| 3.50%, 03/01/31(b) |
616 | 612,427 | ||||||||||
| 74 | 2 0 2 1 B L A C K R O C K S E M I - A N N U A L R E P O R T T O S H A R E H O L D E R S |
| Consolidated Schedule of Investments (unaudited) (continued) June 30, 2021 |
BlackRock Corporate High Yield Fund, Inc. (HYT) (Percentages shown are based on Net Assets) |
| Security | Par (000) |
Value | ||||||||||
| Textiles, Apparel & Luxury Goods (continued) | ||||||||||||
| William Carter Co.(b) |
||||||||||||
| 5.50%, 05/15/25 |
USD | 264 | $ | 279,315 | ||||||||
| 5.63%, 03/15/27 |
543 | 571,344 | ||||||||||
| Wolverine World Wide, Inc., 6.38%, 05/15/25(b) |
391 | 415,973 | ||||||||||
|
|
|
|||||||||||
| 3,491,115 | ||||||||||||
| Thrifts & Mortgage Finance — 0.6% | ||||||||||||
| Enact Holdings, Inc., 6.50%, 08/15/25(b) |
2,613 | 2,880,049 | ||||||||||
| Home Point Capital, Inc., 5.00%, 02/01/26(b) |
1,600 | 1,492,000 | ||||||||||
| Jerrold Finco PLC, 5.25%, 01/15/27 |
GBP | 140 | 200,008 | |||||||||
| MGIC Investment Corp., 5.25%, 08/15/28 |
USD | 857 | 908,420 | |||||||||
| Nationstar Mortgage Holdings, Inc.(b) |
||||||||||||
| 6.00%, 01/15/27 |
422 | 437,310 | ||||||||||
| 5.50%, 08/15/28 |
1,314 | 1,324,683 | ||||||||||
| 5.13%, 12/15/30 |
713 | 709,435 | ||||||||||
| United Wholesale Mortgage LLC, 5.50%, 04/15/29(b) |
519 | 518,881 | ||||||||||
|
|
|
|||||||||||
| 8,470,786 | ||||||||||||
| Transportation — 0.0% | ||||||||||||
| Autostrade per l’Italia SpA, 2.00%, 12/04/28 |
EUR | 226 | 278,833 | |||||||||
|
|
|
|||||||||||
| Transportation Infrastructure — 0.0% | ||||||||||||
| Atlantia SpA, 1.88%, 02/12/28 |
128 | 155,875 | ||||||||||
| Heathrow Finance PLC, 4.63%, 09/01/29(l) |
GBP | 215 | 305,960 | |||||||||
|
|
|
|||||||||||
| 461,835 | ||||||||||||
| Utilities — 0.3% | ||||||||||||
| Orano SA, 2.75%, 03/08/28 |
EUR | 100 | 123,792 | |||||||||
| Pattern Energy Operations LP/Pattern Energy Operations, Inc., |
USD | 2,301 | 2,381,995 | |||||||||
| Solaris Midstream Holdings LLC, 7.63%, 04/01/26(b) |
589 | 624,340 | ||||||||||
| Thames Water Kemble Finance PLC, |
GBP | 252 | 356,676 | |||||||||
| Vistra Operations Co.
LLC, |
USD | 1,257 | 1,263,285 | |||||||||
|
|
|
|||||||||||
| 4,750,088 | ||||||||||||
| Wireless Telecommunication Services — 3.2% | ||||||||||||
| Altice France SA |
||||||||||||
| 2.50%, 01/15/25 |
EUR | 169 | 197,354 | |||||||||
| 7.38%, 05/01/26(b) |
USD | 379 | 394,134 | |||||||||
| 5.88%, 02/01/27 |
EUR | 100 | 125,665 | |||||||||
| 8.13%, 02/01/27(b) |
USD | 3,783 | 4,121,579 | |||||||||
| 5.50%, 01/15/28(b) |
1,997 | 2,072,287 | ||||||||||
| 4.13%, 01/15/29 |
EUR | 200 | 237,446 | |||||||||
| 5.13%, 01/15/29(b) |
USD | 794 | 797,970 | |||||||||
| 5.13%, 07/15/29(b) |
6,752 | 6,785,085 | ||||||||||
| GLP Capital LP/GLP Financing II, Inc., 4.00%, 01/15/31 |
511 | 550,592 | ||||||||||
| Matterhorn Telecom SA, 4.00%, 11/15/27 |
EUR | 300 | 365,050 | |||||||||
| SBA Communications Corp., 3.88%, 02/15/27 |
USD | 6,017 | 6,178,887 | |||||||||
| Sprint Corp. |
||||||||||||
| 7.88%, 09/15/23 |
924 | 1,049,734 | ||||||||||
| 7.13%, 06/15/24 |
764 | 881,465 | ||||||||||
| T-Mobile USA, Inc. |
||||||||||||
| 4.75%, 02/01/28 |
357 | 382,436 | ||||||||||
| 2.63%, 02/15/29 |
396 | 391,050 | ||||||||||
| 2.88%, 02/15/31 |
2,826 | 2,804,805 | ||||||||||
| 3.50%, 04/15/31(b) |
2,011 | 2,080,480 | ||||||||||
| Security | Par (000) |
Value | ||||||||||
| Wireless Telecommunication Services (continued) | ||||||||||||
| T-Mobile USA, Inc. (continued) |
||||||||||||
| 3.50%, 04/15/31 |
USD | 1,605 | $ | 1,660,453 | ||||||||
| Uniti Group LP/Uniti Group Finance, Inc./CSL Capital LLC(b) |
||||||||||||
| 7.88%, 02/15/25 |
1,089 | 1,166,591 | ||||||||||
| 6.50%, 02/15/29 |
3,328 | 3,336,320 | ||||||||||
| VICI Properties LP/VICI Note Co., Inc.(b) |
||||||||||||
| 3.50%, 02/15/25 |
560 | 571,054 | ||||||||||
| 4.25%, 12/01/26 |
2,664 | 2,771,146 | ||||||||||
| 3.75%, 02/15/27 |
1,223 | 1,243,938 | ||||||||||
| 4.63%, 12/01/29 |
1,285 | 1,365,313 | ||||||||||
| 4.13%, 08/15/30 |
3,142 | 3,226,268 | ||||||||||
| Vmed O2 UK Financing I PLC |
||||||||||||
| 4.00%, 01/31/29 |
GBP | 200 | 273,364 | |||||||||
| 4.25%, 01/31/31(b) |
USD | 257 | 252,493 | |||||||||
| 4.50%, 07/15/31(c) |
GBP | 201 | 279,111 | |||||||||
| 4.75%, 07/15/31(b)(c) |
USD | 2,500 | 2,537,500 | |||||||||
| Vodafone Group PLC, (5 year EUR |
EUR | 100 | 121,840 | |||||||||
|
|
|
|||||||||||
| 48,221,410 | ||||||||||||
|
|
|
|||||||||||
| Total Corporate Bonds — 118.1% |
|
1,770,237,098 | ||||||||||
|
|
|
|||||||||||
| Floating Rate Loan Interests(a) |
||||||||||||
| Aerospace & Defense — 0.5% | ||||||||||||
| Peraton Holding Corp. |
||||||||||||
| 2nd Lien Term Loan B1, (1 mo. LIBOR + 0.75%, 0.75% Floor), 8.50%, 02/01/29(e) |
USD | 1,611 | 1,643,220 | |||||||||
| Term Loan B, (1 mo. LIBOR + 3.75%, 0.75% Floor), 4.50%, 02/01/28 |
4,565 | 4,574,363 | ||||||||||
| Spirit Aerosystems, Inc., 2020 Term Loan B, (1 mo. LIBOR + 5.25%, 0.75% Floor), 6.00%, 01/15/25 |
1,028 | 1,033,406 | ||||||||||
| WP CPP Holdings LLC, 2018 Term Loan, (3 mo. LIBOR + 3.75%, 1.00% Floor), 4.75%, 04/30/25 |
321 | 314,398 | ||||||||||
|
|
|
|||||||||||
| 7,565,387 | ||||||||||||
| Air Freight & Logistics — 0.0% | ||||||||||||
| AIT Worldwide Logistics, Inc, 2021 Term Loan, (3 mo. LIBOR + 4.75%, 0.75% Floor), 5.50% 04/06/28 |
388 | 387,395 | ||||||||||
|
|
|
|||||||||||
| Airlines — 0.7% | ||||||||||||
| AAdvantage Loyalty IP Ltd., 2021 Term Loan, (3 mo. LIBOR + 4.75%, 0.75% Floor), 5.50%, 04/20/28 |
3,424 | 3,567,393 | ||||||||||
| Mileage Plus Holdings LLC, 2020 Term Loan B, (3 mo. LIBOR + 5.25%, 1.00% Floor), 6.25%, 06/20/27 |
962 | 1,026,608 | ||||||||||
| SkyMiles IP Ltd., 2020 Skymiles Term Loan B, (3 mo. LIBOR + 3.75%, 1.00% Floor), 4.75%, 10/20/27 |
1,648 | 1,739,777 | ||||||||||
| United Airlines, Inc., 2021 Term Loan B, (3 mo. LIBOR + 3.75%, 0.75% Floor), 4.50%, 04/21/28 |
3,604 | 3,648,008 | ||||||||||
|
|
|
|||||||||||
| 9,981,786 | ||||||||||||
| Auto Components — 0.1% | ||||||||||||
| Clarios Global LP, 2021 USD Term Loan B, (1 mo. LIBOR + 3.25%), 3.35%, 04/30/26 |
1,335 | 1,321,566 | ||||||||||
|
|
|
|||||||||||
| C O N S O L I D A T E D S C H E D U L E O F I N V E S T M E N T S |
75 |
| Consolidated Schedule of Investments (unaudited) (continued) June 30, 2021 |
BlackRock Corporate High Yield Fund, Inc. (HYT) (Percentages shown are based on Net Assets) |
| Security | Par (000) |
Value | ||||||||||
| Building Products — 0.1% | ||||||||||||
| CP Atlas Buyer, Inc., 2021 Term Loan B, |
USD | 514 | $ | 512,053 | ||||||||
| CPG International, Inc., 2017 Term Loan, (3 mo. LIBOR + 2.50%, 0.75% Floor), 3.25%, 05/05/24 |
391 | 390,671 | ||||||||||
|
|
|
|||||||||||
| 902,724 | ||||||||||||
| Capital Markets — 0.1% | ||||||||||||
| Deerfield Dakota Holding LLC, 2021 USD 2nd Lien Term Loan, (1 mo. LIBOR + 6.75%, 0.75% Floor), 7.50%, 04/07/28(e) |
1,206 | 1,233,135 | ||||||||||
| Jefferies Finance LLC, 2019 Term Loan, |
646 | 642,906 | ||||||||||
|
|
|
|||||||||||
| 1,876,041 | ||||||||||||
| Chemicals — 0.8% | ||||||||||||
| Ascend Performance Materials Operations LLC, 2021 Term Loan B, (3 mo. LIBOR + 4.75%, 0.75% Floor), 5.50%, 08/27/26 |
2,345 | 2,375,786 | ||||||||||
| Atotech BV, 2021 USD Term Loan B, (1 mo. LIBOR + 2.50%, 0.50% Floor), 3.00%, 03/18/28 |
2,566 | 2,551,579 | ||||||||||
| Illuminate Buyer LLC, 2021 Term Loan, |
2,166 | 2,151,810 | ||||||||||
| Invictus US LLC |
||||||||||||
| 1st Lien Term Loan, (1 mo. LIBOR + 3.00%), 3.10%, 03/28/25 |
1,989 | 1,985,151 | ||||||||||
| 2nd Lien Term Loan, (1 mo. LIBOR + 6.75%), 6.85%, 03/30/26 |
298 | 298,375 | ||||||||||
| Klockner-Pentaplast of America, Inc., 2021 Term Loan B, (3 mo. LIBOR + 4.75%, 0.50%
Floor), |
550 | 552,371 | ||||||||||
| Momentive Performance Materials, Inc., Term Loan B, (1 mo. LIBOR + 3.25%), 3.36%, 05/15/24 |
2,697 | 2,678,051 | ||||||||||
|
|
|
|||||||||||
| 12,593,123 | ||||||||||||
| Commercial Services & Supplies — 0.8% | ||||||||||||
| Asurion LLC, 2020 Term Loan B8, (1 mo. LIBOR + 3.25%), 3.35%, 12/23/26 |
2,239 | 2,212,176 | ||||||||||
| Dealer Tire LLC, 2020 Term Loan B, (1 mo. LIBOR + 4.25%), 4.35%, 12/12/25 |
490 | 489,300 | ||||||||||
| Diamond (BC) BV, USD Term Loan, (1 mo. LIBOR + 3.00%), 3.15%, 09/06/24 |
2,608 | 2,592,567 | ||||||||||
| GFL Environmental, Inc., 2020 Term Loan, (1 mo. LIBOR + 3.00%, 1.00% Floor), 3.50%, 05/30/25 |
545 | 545,378 | ||||||||||
| Verscend Holding Corp., 2021 Term Loan B, (1 mo. LIBOR + 3.75%), 4.10%, 08/27/25 |
6,646 | 6,657,060 | ||||||||||
|
|
|
|||||||||||
| 12,496,481 | ||||||||||||
| Construction & Engineering — 0.8% | ||||||||||||
| Brand Energy & Infrastructure Services, Inc., 2017 Term Loan, (3 mo. LIBOR + 4.25%, 1.00% Floor), 5.25%, 06/21/24 |
12,387 | 12,175,752 | ||||||||||
|
|
|
|||||||||||
| Construction Materials — 0.0% | ||||||||||||
| Forterra Finance LLC, 2017 Term Loan B, (1 mo. LIBOR + 3.50%, 1.00% Floor), 4.00%, 10/25/23 |
442 | 441,627 | ||||||||||
|
|
|
|||||||||||
| Security | Par (000) |
Value | ||||||||||
| Containers & Packaging(c) — 0.2% | ||||||||||||
| BWAY Holding Co., 2017 Term Loan B, |
USD | 2,892 | $ | 2,820,214 | ||||||||
| Charter NEX US, Inc., 2021 Term Loan, |
467 | 467,833 | ||||||||||
|
|
|
|||||||||||
| 3,288,047 | ||||||||||||
| Diversified Consumer Services — 0.1% | ||||||||||||
| Amentum Government Services Holdings LLC, Term Loan B, (1 mo. LIBOR + 3.50%), 3.60%, 01/29/27 |
365 | 364,123 | ||||||||||
| Ascend Learning LLC, 2017 Term Loan B, (1 mo. LIBOR + 3.00%, 1.00% Floor), 4.00%, 07/12/24 |
559 | 557,909 | ||||||||||
| TruGreen Limited Partnership, 2020 2nd Lien Term Loan, (1 mo. LIBOR + 8.50%, 1.00%
Floor), |
868 | 885,360 | ||||||||||
|
|
|
|||||||||||
| 1,807,392 | ||||||||||||
| Diversified Financial Services — 1.1% | ||||||||||||
| AQGEN Ascensus, Inc., 2021 2nd Lien Term Loan, 05/04/29(c)(e)(m) |
739 | 731,610 | ||||||||||
| Delta TopCo, Inc., 2020 Term Loan B, (3 mo. LIBOR + 3.75%, 0.75% Floor), 4.50%, 12/01/27 |
2,298 | 2,302,484 | ||||||||||
| I-Logic Technologies Bidco Ltd., 2021 USD Term Loan B, (3 mo. LIBOR + 4.00%, 0.50% Floor), 4.50%, 02/16/28 |
543 | 544,378 | ||||||||||
| LBM Acquisition LLC |
||||||||||||
| Delayed Draw Term Loan, (3 mo. LIBOR + 3.75%, 0.75% Floor), 4.50%, 12/18/27 |
32 | 31,748 | ||||||||||
| Term Loan B, (3 mo. LIBOR + 3.75%, 0.75% Floor), 4.50%, 12/18/27 |
215 | 213,761 | ||||||||||
| Milano Acquisition Corp., Term Loan B, |
4,255 | 4,264,535 | ||||||||||
| Veritas US, Inc., 2021 USD Term Loan B, (3 mo. LIBOR + 5.00%, 1.00% Floor), 6.00%, 09/01/25 |
5,009 | 5,034,839 | ||||||||||
| White Cap Buyer LLC, Term Loan B, (3 mo. LIBOR + 4.00%, 0.50% Floor), 4.50%, 10/19/27 |
2,918 | 2,921,983 | ||||||||||
|
|
|
|||||||||||
| 16,045,338 | ||||||||||||
| Diversified Telecommunication Services — 1.4% | ||||||||||||
| Frontier Communications Corp., 2021 DIP Term Loan B, (1 mo. LIBOR + 3.75%, 0.75% Floor), 4.50%, 05/01/28 |
1,620 | 1,619,940 | ||||||||||
| Intelsat Jackson Holdings SA |
||||||||||||
| 2017 Term Loan B3, (PRIME + 4.75%), 8.00%, 11/27/23 |
904 | 916,973 | ||||||||||
| 2017 Term Loan B4, (PRIME + 5.50%), 8.75%, 01/02/24 |
1,899 | 1,931,251 | ||||||||||
| 2017 Term Loan B5, (Fixed + 8.62%), 8.63%, 01/02/24 |
10,040 | 10,201,073 | ||||||||||
| 2020 DIP Term Loan, (PRIME + 4.75%, 1.00% Floor), 6.50%, 07/13/22 |
4,440 | 4,465,458 | ||||||||||
| Northwest Fiber LLC, 2021 Term Loan, |
1,126 | 1,124,992 | ||||||||||
|
|
|
|||||||||||
| 20,259,687 | ||||||||||||
| Electrical Equipment — 0.1% | ||||||||||||
| Gates Global LLC, 2021 Term Loan B3, |
1,244 | 1,237,398 | ||||||||||
|
|
|
|||||||||||
| 76 | 2 0 2 1 B L A C K R O C K S E M I - A N N U A L R E P O R T T O S H A R E H O L D E R S |
| Consolidated Schedule of Investments (unaudited) (continued) June 30, 2021 |
BlackRock Corporate High Yield Fund, Inc. (HYT) (Percentages shown are based on Net Assets) |
| Security | Par (000) |
Value | ||||||||||
| Entertainment — 0.1% | ||||||||||||
| MSG National Properties LLC, Term Loan, (3 mo. LIBOR + 6.25%, 0.75% Floor), 7.00%, 11/12/25(e) |
USD | 2,096 | $ | 2,159,359 | ||||||||
|
|
|
|||||||||||
| Health Care Equipment & Supplies — 0.1% | ||||||||||||
| Ortho-Clinical Diagnostics SA |
||||||||||||
| 2018 Term Loan B, (1 mo. LIBOR + 3.00%), 3.09%, 06/30/25 |
455 | 454,727 | ||||||||||
| EUR Term Loan B, (3 mo.EURIBOR + 3.50%), 3.50%, 06/30/25 |
EUR | 990 | 1,174,139 | |||||||||
|
|
|
|||||||||||
| 1,628,866 | ||||||||||||
| Health Care Providers & Services — 1.1% | ||||||||||||
| AHP Health Partners, Inc., 2021 Term Loan, (1 mo. LIBOR + 3.75%, 1.00% Floor), 4.75%, 06/30/25 |
USD | 943 | 944,542 | |||||||||
| Da Vinci Purchaser Corp., 2019 Term Loan, (3 mo. LIBOR + 2.75%, 1.00% Floor), 5.00%, 01/08/27 |
2,130 | 2,135,316 | ||||||||||
| Envision Healthcare Corp., 2018 1st Lien Term Loan, (1 mo. LIBOR + 3.75%), 3.85%, 10/10/25 |
3,811 | 3,241,275 | ||||||||||
| EyeCare Partners LLC |
||||||||||||
| 2020 2nd Lien Term Loan, (1 mo. LIBOR + 8.25%), 8.35%, 02/18/28 |
3,500 | 3,351,250 | ||||||||||
| 2020 Term Loan, (1 mo. LIBOR + 3.75%), 3.85%, 02/18/27 |
748 | 740,928 | ||||||||||
| Gentiva Health Services, Inc., 2020 Term Loan, (1 mo. LIBOR + 2.75%), 2.88%, 07/02/25 |
1,064 | 1,060,798 | ||||||||||
| HC Group Holdings II, Inc., Term Loan B, (1 mo. LIBOR + 3.75%), 3.85%, 08/06/26 |
995 | 994,741 | ||||||||||
| Quorum Health Corp., 2020 Term Loan, |
1,479 | 1,495,770 | ||||||||||
| RegionalCare Hospital Partners Holdings, Inc., 2018 Term Loan B, (1 mo. LIBOR + 3.75%), 3.85%, 11/16/25 |
442 | 440,578 | ||||||||||
| Sotera Health Holdings LLC, 2021 Term Loan, (3 mo. LIBOR + 2.75%, 0.50% Floor), 3.25%, 12/13/26 |
2,375 | 2,364,122 | ||||||||||
|
|
|
|||||||||||
| 16,769,320 | ||||||||||||
| Health Care Services — 0.1% | ||||||||||||
| Azalea Topco, Inc., Term Loan, (1 mo. LIBOR + 3.50%), 3.69%, 07/25/26 |
983 | 976,768 | ||||||||||
|
|
|
|||||||||||
| Health Care Technology — 0.7% | ||||||||||||
| Athenahealth, Inc., 2021 Term Loan B1, |
682 | 683,784 | ||||||||||
| Polaris Newco LLC, USD Term Loan B, |
2,071 | 2,075,929 | ||||||||||
| Verscend Holdings Corp., 2nd Lien Term Loan, (1 mo. LIBOR + 7.00%), 7.50%, 02/01/29(e) |
8,084 | 8,164,840 | ||||||||||
|
|
|
|||||||||||
| 10,924,553 | ||||||||||||
| Hotels, Restaurants & Leisure — 0.6% | ||||||||||||
| Caesars Resort Collection LLC |
||||||||||||
| 2017 1st Lien Term Loan B, (1 mo. LIBOR + 2.75%), 2.85%, 12/23/24 |
1,492 | 1,478,673 | ||||||||||
| 2020 Term Loan B1, (1 mo. LIBOR + 4.50%), 4.60%, 07/20/25 |
898 | 900,419 | ||||||||||
| Golden Nugget LLC, 2017 Incremental Term Loan B, (2 mo. LIBOR + 2.50%, 0.75% Floor), 3.25%, 10/04/23 |
2,074 | 2,057,473 | ||||||||||
| Security | Par (000) |
Value | ||||||||||
| Hotels, Restaurants & Leisure (continued) | ||||||||||||
| Golden Nugget, Inc., 2020 Initial Term Loan, (3 mo. LIBOR + 12.00%, 1.00% Floor), 13.00%, 10/04/23(e) |
USD | 292 | $ | 323,862 | ||||||||
| Great Canadian Gaming Corp., Term Loan, 11/01/26(c)(m) |
303 | 303,379 | ||||||||||
| IRB Holding Corp, 2020 Fourth Amendment Incremental Term Loan, (3 mo. LIBOR + 3.25%, 1.00% Floor), 4.25%, 12/15/27 |
|
2,025 | 2,023,570 | |||||||||
| Life Time Fitness, Inc., 2021 Term Loan B, (3 mo. LIBOR + 4.75%, 1.00% Floor), 5.75%, 12/16/24 |
|
1,341 | 1,343,984 | |||||||||
|
|
|
|||||||||||
| 8,431,360 | ||||||||||||
| Independent Power and Renewable Electricity Producers — 0.0% | ||||||||||||
| Calpine Corp., 2019 Term Loan B10, (1 mo. LIBOR + 2.00%), 2.10%, 08/12/26 |
93 | 91,912 | ||||||||||
|
|
|
|||||||||||
| Industrial Conglomerates — 0.2% | ||||||||||||
| PSAV Holdings LLC, 2018 2nd Lien Term Loan, (6 mo. LIBOR + 7.25%, 1.00% Floor), 8.25%, 09/01/25 |
1,279 | 1,029,728 | ||||||||||
| Sequa Mezzanine Holdings LLC, 2020 Extended Term Loan, (3 mo. LIBOR + 6.75%, 1.00% Floor), 7.75%, 11/28/23 |
|
1,796 | 1,805,936 | |||||||||
|
|
|
|||||||||||
| 2,835,664 | ||||||||||||
| Insurance — 0.7% | ||||||||||||
| Alliant Holdings Intermediate LLC |
||||||||||||
| 2020 Term Loan B3, 11/06/27(c)(m) |
762 | 763,029 | ||||||||||
| Term Loan B, (1 mo. LIBOR + 3.25%), 3.35%, 05/09/25 |
1,990 | 1,966,964 | ||||||||||
| HUB International Ltd., 2018 Term Loan B, (3 mo. LIBOR + 2.75%), 2.93%, 04/25/25 |
1,393 | 1,376,650 | ||||||||||
| Ryan Specialty Group LLC, Term Loan, (1 mo. LIBOR + 3.00%, 0.75% Floor), 3.75%, 09/01/27 |
1,051 | 1,050,070 | ||||||||||
| Sedgwick Claims Management Services, Inc. |
||||||||||||
| 2018 Term Loan B, (1 mo. LIBOR + 3.25%), 3.35%, 12/31/25 |
3,593 | 3,552,183 | ||||||||||
| 2019 Term Loan B, (1 mo. LIBOR + 3.75%), 3.85%, 09/03/26 |
1,257 | 1,254,549 | ||||||||||
| 2020 Term Loan B3, (1 mo. LIBOR + 4.25%, 1.00% Floor), 5.25%, 09/03/26 |
538 | 538,878 | ||||||||||
|
|
|
|||||||||||
| 10,502,323 | ||||||||||||
| Interactive Media & Services — 0.3% | ||||||||||||
| Camelot U.S. Acquisition 1 Co., 2020 Incremental Term Loan B, (1 mo. LIBOR + 3.00%, 1.00% Floor), 4.00%, 10/31/26 |
640 | 639,785 | ||||||||||
| Grab Holdings, Inc., Term Loan B, (6 mo. LIBOR + 4.50%, 1.00% Floor), 5.50%, 01/29/26 |
3,886 | 3,941,328 | ||||||||||
|
|
|
|||||||||||
| 4,581,113 | ||||||||||||
| Internet & Direct Marketing Retail — 0.1% | ||||||||||||
| CNT Holdings I Corp., 2020 Term Loan, (3 mo. LIBOR + 3.75%, 0.75% Floor), 4.50%, 11/08/27 |
1,269 | 1,268,820 | ||||||||||
|
|
|
|||||||||||
| IT Services — 1.4% | ||||||||||||
| Banff Merger Sub, Inc., 2021 USD Term Loan, (1 mo. LIBOR + 3.75%), 3.85%, 10/02/25 |
1,468 | 1,459,217 | ||||||||||
| Celestial -Saturn Parent, Inc., 2nd Lien Term Loan, (1 mo. LIBOR + 6.50%, 0.50% Floor), 7.00%, 04/13/29(e) |
1,413 | 1,420,065 | ||||||||||
| C O N S O L I D A T E D S C H E D U L E O F I N V E S T M E N T S |
77 |
| Consolidated Schedule of Investments (unaudited) (continued) June 30, 2021 |
BlackRock Corporate High Yield Fund, Inc. (HYT) (Percentages shown are based on Net Assets) |
| Security | Par (000) |
Value | ||||||||||
| IT Services (continued) | ||||||||||||
| Greeneden US Holdings II LLC, 2020 USD Term Loan B, (1 mo. LIBOR + 4.00%, 0.75% Floor), 4.75%, 12/01/27 |
USD | 1,470 | $ | 1,472,101 | ||||||||
| Optiv Security, Inc., 1st Lien Term Loan, |
2,238 | 2,184,460 | ||||||||||
| Peak 10 Holding Corp. |
||||||||||||
| 2017 1st Lien Term Loan, (3 mo. LIBOR + 3.50%), 3.65%, 08/01/24 |
863 | 789,622 | ||||||||||
| 2nd Lien Term Loan, (3 mo. LIBOR + 7.25%), 7.38%, 08/01/25 |
420 | 375,001 | ||||||||||
| PUG LLC, USD Term Loan, (1 mo. LIBOR + 3.50%), 3.60%, 02/12/27 |
2,323 | 2,266,191 | ||||||||||
| Sophia LP, 2020 2nd Lien Term Loan, (3 mo. LIBOR + 8.00%, 1.00% Floor), 9.00%, 10/09/28 |
10,251 | 10,571,344 | ||||||||||
| TierPoint LLC, 2021 Term Loan, (1 mo. LIBOR + 3.75%, 0.75% Floor), 4.50%, 05/05/26 |
903 | 902,124 | ||||||||||
|
|
|
|||||||||||
| 21,440,125 | ||||||||||||
| Life Sciences Tools & Services — 0.3% | ||||||||||||
| Icon Luxembourg Sarl(c)(m) |
||||||||||||
| 1st Lien Term Loan B, 06/16/28 |
538 | 539,102 | ||||||||||
| Term Loan B, 06/16/28 |
2,162 | 2,164,645 | ||||||||||
| Parexel International Corp., Term Loan B, (1 mo. LIBOR + 2.75%), 2.85%, 09/27/24 |
1,906 | 1,894,842 | ||||||||||
|
|
|
|||||||||||
| 4,598,589 | ||||||||||||
| Machinery — 0.6% | ||||||||||||
| MHI Holdings LLC, Term Loan B, (1 mo. LIBOR + 5.00%), 5.10%, 09/21/26 |
2,342 | 2,347,879 | ||||||||||
| Titan Acquisition Ltd., 2018 Term Loan B, (3 mo. LIBOR + 3.00%), 3.17%, 03/28/25 |
7,469 | 7,333,067 | ||||||||||
|
|
|
|||||||||||
| 9,680,946 | ||||||||||||
| Media — 1.2% | ||||||||||||
| A-L Parent LLC, 2016 1st Lien Term Loan, (1 mo. LIBOR + 3.25%, 1.00% Floor), 4.25%, 12/01/23 |
474 | 457,591 | ||||||||||
| Altice Financing SA, 2017 USD Term Loan B, (3 mo. LIBOR + 2.75%), 2.93%, 07/15/25 |
240 | 235,856 | ||||||||||
| Altice France SA, 2018 Term Loan B13, |
1,000 | 997,573 | ||||||||||
| Clear Channel Outdoor Holdings, Inc., Term Loan B, (3 mo. LIBOR + 3.50%), 3.69%, 08/21/26 |
6,274 | 6,119,894 | ||||||||||
| Connect Finco Sarl, 2021 Term Loan B, |
1,011 | 1,011,158 | ||||||||||
| MH Sub I LLC |
||||||||||||
| 2017 1st Lien Term Loan, (1 mo. LIBOR + 3.50%), 3.60%, 09/13/24 |
1,990 | 1,979,159 | ||||||||||
| 2021 2nd Lien Term Loan, (1 mo. LIBOR + 6.25%), 6.35%, 02/23/29 |
288 | 292,141 | ||||||||||
| Radiate Holdco LLC, 2020 Term Loan, |
193 | 193,314 | ||||||||||
| Zayo Group Holdings, Inc., USD Term Loan, (1 mo. LIBOR + 3.00%), 3.10%, 03/09/27 |
6,160 | 6,091,004 | ||||||||||
|
|
|
|||||||||||
| 17,377,690 | ||||||||||||
| Security | Par (000) |
Value | ||||||||||
| Oil, Gas & Consumable Fuels — 0.7% | ||||||||||||
| Ascent Resources Utica LLC, 2020 Fixed 2nd Lien Term Loan, (3 mo. LIBOR + 9.00%, 1.00% Floor), 10.00%, 11/01/25(c) |
USD | 9,113 | $ | 10,050,751 | ||||||||
| McDermott Technology Americas, Inc., 2020 Make Whole Term Loan, (1 mo. LIBOR + 3.00%), 3.10%, 06/30/24(e) |
90 | 54,239 | ||||||||||
|
|
|
|||||||||||
| 10,104,990 | ||||||||||||
| Pharmaceuticals — 0.2% | ||||||||||||
| Endo Luxembourg Finance Co. I Sarl, 2021 Term Loan, (1 mo. LIBOR + 5.00%, 0.75% Floor), 5.75%, 03/27/28 |
2,494 | 2,402,493 | ||||||||||
|
|
|
|||||||||||
| Professional Services — 0.2% | ||||||||||||
| Dun & Bradstreet Corp., Term Loan, (1 mo. LIBOR + 3.25%), 3.35%, 02/06/26 |
3,041 | 3,025,446 | ||||||||||
|
|
|
|||||||||||
| Software — 3.3% | ||||||||||||
| Barracuda Networks, Inc., 2020 2nd Lien Term Loan, (1 mo. LIBOR + 6.75%, 0.75% Floor), 7.50%, 10/30/28 |
958 | 973,959 | ||||||||||
| By Crown Parent LLC, Term Loan B1, (1 mo. LIBOR + 3.00%, 1.00% Floor), 4.00%, 01/31/26 |
130 | 130,235 | ||||||||||
| Castle US Holding Corp., USD Term Loan B, (3 mo. LIBOR + 3.75%), 3.90%, 01/29/27 |
1,181 | 1,164,895 | ||||||||||
| Cypress Intermediate Holdings III, Inc., 2017 1st Lien Term Loan, (1 mo. LIBOR + 3.00%, 1.00% Floor), 4.00%, 04/29/24 |
978 | 977,281 | ||||||||||
| Digicel International Finance Ltd., 2017 Term Loan B, (6 mo. LIBOR + 3.25%), 3.43%, 05/27/24 |
1,707 | 1,635,744 | ||||||||||
| Epicor Software Corp. |
||||||||||||
| 2020 2nd Lien Term Loan, (1 mo. LIBOR + 3.25%, 1.00% Floor), 8.75%, 07/31/28 |
506 | 522,131 | ||||||||||
| 2020 Term Loan, (1 mo. LIBOR + 3.25%, 0.75% Floor), 4.00%, 07/31/27 |
1,396 | 1,393,472 | ||||||||||
| Helios Software Holdings, Inc., 2021 USD Term Loan B, (6 mo. LIBOR + 3.75%), 3.90%, 03/11/28 |
662 | 661,823 | ||||||||||
| Informatica LLC |
||||||||||||
| 2020 USD 2nd Lien Term Loan, (Fixed + 7.12%), 7.13%, 02/25/25 |
2,634 | 2,679,094 | ||||||||||
| 2020 USD Term Loan B, (1 mo. LIBOR + 3.25%), 3.35%, 02/25/27 |
2,259 | 2,243,308 | ||||||||||
| Magenta Buyer LLC(c)(m) |
||||||||||||
| 2021 USD 1st Lien Term Loan, 05/03/28 |
3,087 | 3,083,913 | ||||||||||
| 2021 USD 2nd Lien |
1,960 | 1,935,500 | ||||||||||
| Mitchell International, Inc. |
||||||||||||
| 2017 1st Lien Term Loan, (1 mo. LIBOR + 3.25%), 3.35%, 11/29/24 |
2,372 | 2,348,121 | ||||||||||
| 2017 2nd Lien Term Loan, (1 mo. LIBOR + 7.25%), 7.35%, 12/01/25 |
613 | 612,346 | ||||||||||
| Planview Parent, Inc., 2nd Lien Term Loan, |
850 | 845,750 | ||||||||||
| Project Alpha Intermediate Holding, Inc., 2021 Term Loan B, (1 mo. LIBOR + 4.00%), 4.11%, 04/26/24 |
1,006 | 1,006,659 | ||||||||||
| Proof Point, Inc.(c)(m) |
||||||||||||
| 1st Lien Term Loan, 06/09/28 |
1,334 | 1,325,836 | ||||||||||
| 2nd Lien Term Loan, 06/08/29 |
2,006 | 2,023,552 | ||||||||||
| 78 | 2 0 2 1 B L A C K R O C K S E M I - A N N U A L R E P O R T T O S H A R E H O L D E R S |
| Consolidated Schedule of Investments (unaudited) (continued) June 30, 2021 |
BlackRock Corporate High Yield Fund, Inc. (HYT) (Percentages shown are based on Net Assets) |
| Security | Par (000) |
Value | ||||||||||
| Software (continued) | ||||||||||||
| RealPage, Inc. |
||||||||||||
| 1st Lien Term Loan, (1 mo. LIBOR + 3.25%, 0.50% Floor), 3.75%, 04/22/28 |
USD | 1,799 | $ | 1,792,704 | ||||||||
| 2nd Lien Term Loan, (1 mo. LIBOR + 6.50%, 0.75% Floor), 7.25%, 04/22/29 |
6,751 | 6,945,445 | ||||||||||
| Renaissance Holding Corp., 2018 1st Lien Term Loan, (1 mo. LIBOR + 3.25%), 3.34%, 05/30/25 |
1,785 | 1,764,709 | ||||||||||
| Sabre GLBL, Inc., 2020 Term Loan B, (1 mo. LIBOR + 4.00%, 0.75% Floor), 4.75%, 12/17/27 |
483 | 484,988 | ||||||||||
| Severin Acquisition LLC, 2018 Term Loan B, (3 mo. LIBOR + 3.25%), 3.33%, 08/01/25 |
3,705 | 3,679,498 | ||||||||||
| Sophia LP, 2020 1st Lien Term Loan, (3 mo. LIBOR + 3.75%, 0.75% Floor), 4.50%, 10/07/27 |
3,380 | 3,380,725 | ||||||||||
| Tempo Acquisition LLC |
||||||||||||
| 2020 Extended Term Loan, (1 mo. LIBOR + 3.25%, 0.50% Floor), 3.75%, 11/02/26 |
171 | 171,418 | ||||||||||
| Term Loan, (PRIME + 1.75%), 5.00%, 05/01/24 . |
1,845 | 1,841,166 | ||||||||||
| Tibco Software, Inc., 2020 2nd Lien Term Loan, (1 mo. LIBOR + 7.25%), 7.36%, 03/04/28 |
1,576 | 1,597,670 | ||||||||||
| Ultimate Software Group, Inc. |
||||||||||||
| 2021 Incremental Term Loan, (3 mo. LIBOR + 3.25%, 0.75% Floor), 4.00%, 05/03/26 |
880 | 880,869 | ||||||||||
| Term Loan B, (1 mo. LIBOR + 3.75%), 3.85%, 05/03/26 |
564 | 564,120 | ||||||||||
|
|
|
|||||||||||
| 48,666,931 | ||||||||||||
| Specialty Retail — 0.3% | ||||||||||||
| Eyemart Express LLC, 2020 2nd Lien Term Loan, 08/04/25(c)(m) |
438 | 435,213 | ||||||||||
| PetSmart, Inc., 2021 Term Loan B, (3 mo. LIBOR + 3.75%, 0.75% Floor), 4.50%, 02/12/28 |
3,167 | 3,167,792 | ||||||||||
| Sotheby’s, Term Loan B, (3 mo. LIBOR + 4.75%, 0.75% Floor), 5.50%, 01/15/27 |
742 | 745,763 | ||||||||||
| Staples, Inc., 7 Year Term Loan, (3 mo. LIBOR + 5.00%), 5.18%, 04/16/26 |
845 | 822,144 | ||||||||||
|
|
|
|||||||||||
| 5,170,912 | ||||||||||||
| Trading Companies & Distributors — 0.0% | ||||||||||||
| Foundation Building Materials Holding Company LLC, 2021 Term Loan, (3 mo. LIBOR + 3.25%, 0.50% Floor), 3.75%, 02/03/28 |
570 | 565,500 | ||||||||||
|
|
|
|||||||||||
| Wireless Telecommunication Services — 0.2% | ||||||||||||
| Xplornet Communications, Inc., 2020 Term Loan B, (1 mo. LIBOR + 4.75%), 4.85%, 06/10/27 |
2,508 | 2,506,798 | ||||||||||
|
|
|
|||||||||||
| Total Floating Rate Loan Interests — 19.2% |
|
288,090,222 | ||||||||||
|
|
|
|||||||||||
| Security |
Shares |
Value | ||||||||||
| Investment Companies |
| |||||||||||
| Equity Funds — 0.6% | ||||||||||||
| iShares Preferred & Income
Securities |
203,000 | $ | 7,985,005 | |||||||||
|
|
|
|||||||||||
| Total Investment Companies — 0.6% |
|
7,985,005 | ||||||||||
|
|
|
|||||||||||
| Par (000) |
||||||||||||
| Preferred Securities |
| |||||||||||
| Capital Trusts — 2.2% | ||||||||||||
| Automobiles(a)(i) — 0.1% | ||||||||||||
| General Motors Financial Co., Inc., |
USD | 655 | 733,600 | |||||||||
| Volkswagen International Finance NV |
||||||||||||
| 3.88% |
EUR | 100 | 131,016 | |||||||||
| Series ., 3.50% |
100 | 128,016 | ||||||||||
|
|
|
|||||||||||
| 992,632 | ||||||||||||
| Banks(i) — 0.2% | ||||||||||||
| CaixaBank SA, 6.38%(a) |
200 | 258,773 | ||||||||||
| CIT Group, Inc., Series A, 5.80%(a) |
USD | 1,647 | 1,701,137 | |||||||||
| ING Groep NV, 6.75%(a) |
200 | 220,500 | ||||||||||
| Intesa Sanpaolo SpA, 7.75%(a) |
EUR | 200 | 290,193 | |||||||||
| Stichting AK Rabobank Certificaten, |
161 | 256,404 | ||||||||||
|
|
|
|||||||||||
| 2,727,007 | ||||||||||||
| Diversified Financial Services(a)(i) — 1.6% | ||||||||||||
| Banco Santander SA, 4.38% |
200 | 244,858 | ||||||||||
| Bank of America Corp. |
||||||||||||
| Series AA, 6.10% |
USD | 130 | 145,973 | |||||||||
| Series X, 6.25% |
2,242 | 2,480,212 | ||||||||||
| Series Z, 6.50% |
1,634 | 1,850,505 | ||||||||||
| Credit Suisse Group AG(b) |
||||||||||||
| 6.38% |
1,658 | 1,848,057 | ||||||||||
| 5.25% |
1,077 | 1,138,927 | ||||||||||
| 6.25% |
200 | 219,000 | ||||||||||
| HSBC Holdings PLC, 6.00% |
2,298 | 2,550,780 | ||||||||||
| JPMorgan Chase & Co. |
||||||||||||
| Series FF, 5.00% |
5,918 | 6,255,030 | ||||||||||
| Series HH, 4.60% |
1,416 | 1,467,401 | ||||||||||
| Series Q, 5.15% |
850 | 877,625 | ||||||||||
| Series U, 6.13% |
4,228 | 4,582,095 | ||||||||||
| Natwest Group PLC, 8.63% |
607 | 611,383 | ||||||||||
| UniCredit SpA, 3.88% |
EUR | 200 | 226,775 | |||||||||
|
|
|
|||||||||||
| 24,498,621 | ||||||||||||
| Diversified Telecommunication Services(a)(i) — 0.1% | ||||||||||||
| Telefonica Europe BV |
||||||||||||
| 5.88% |
200 | 263,829 | ||||||||||
| 4.38% |
600 | 771,788 | ||||||||||
|
|
|
|||||||||||
| 1,035,617 | ||||||||||||
| Electronic Equipment, Instruments & Components — 0.0% | ||||||||||||
| Belden, Inc., 4.13%, 10/15/26 |
320 | 388,879 | ||||||||||
|
|
|
|||||||||||
| C O N S O L I D A T E D S C H E D U L E O F I N V E S T M E N T S |
79 |
| Consolidated Schedule of Investments (unaudited) (continued) June 30, 2021 |
BlackRock Corporate High Yield Fund, Inc. (HYT) (Percentages shown are based on Net Assets) |
| Security | Par (000) |
Value | ||||||||||
| Food & Staples Retailing — 0.0% | ||||||||||||
| Casino Guichard Perrachon SA, |
EUR | 100 | $ | 87,271 | ||||||||
|
|
|
|||||||||||
| Health Care Providers & Services — 0.0% | ||||||||||||
| Korian SA, 4.13%(a)(i) |
GBP | 200 | 279,338 | |||||||||
|
|
|
|||||||||||
| Insurance — 0.0% | ||||||||||||
| Legal & General Group PLC, 5.63%(a)(i) |
200 | 309,859 | ||||||||||
|
|
|
|||||||||||
| Internet & Direct Marketing Retail — 0.0% | ||||||||||||
| Rakuten Group, Inc., 4.25%(a)(i) |
EUR | 225 | 274,798 | |||||||||
|
|
|
|||||||||||
| Oil, Gas & Consumable Fuels(a)(i) — 0.1% | ||||||||||||
| Abertis Infraestructuras Finance BV, 3.25% |
200 | 245,154 | ||||||||||
| BP Capital Markets PLC, 4.25% |
GBP | 125 | 183,097 | |||||||||
| Repsol International Finance BV |
||||||||||||
| 3.75% |
EUR | 100 | 126,853 | |||||||||
| 4.25% |
100 | 130,422 | ||||||||||
|
|
|
|||||||||||
| 685,526 | ||||||||||||
| Real Estate Management & Development(a)(i) — 0.0% | ||||||||||||
| Aroundtown SA, 3.38% |
100 | 123,170 | ||||||||||
| Heimstaden Bostad AB, 3.00% |
175 | 207,083 | ||||||||||
|
|
|
|||||||||||
| 330,253 | ||||||||||||
| Transportation Infrastructure — 0.0% | ||||||||||||
| Poste Italiane SpA, 2.63%(a)(i) |
200 | 236,913 | ||||||||||
|
|
|
|||||||||||
| Utilities(a)(i) — 0.1% | ||||||||||||
| Electricite de France SA |
||||||||||||
| 3.00% |
200 | 245,095 | ||||||||||
| 2.88% |
200 | 244,375 | ||||||||||
| 3.38% |
400 | 495,051 | ||||||||||
| 6.00% |
GBP | 100 | 154,515 | |||||||||
|
|
|
|||||||||||
| 1,139,036 | ||||||||||||
| Wireless Telecommunication Services — 0.0% | ||||||||||||
| Vodafone Group PLC, |
EUR | 300 | 399,301 | |||||||||
|
|
|
|||||||||||
| Total Capital Trusts — 2.2% |
|
33,385,051 | ||||||||||
|
|
|
|||||||||||
| Shares | ||||||||||||
| Preferred Stocks — 1.1% | ||||||||||||
| Banks — 0.0% | ||||||||||||
| CF-B L2 (D), LLC, (Acquired 04/08/15, Cost: $666,513)(f) |
680,898 | 7,007 | ||||||||||
|
|
|
|||||||||||
| Commercial Services & Supplies — 0.1% | ||||||||||||
| Verscend Intermediate Holding(e) |
790 | 835,027 | ||||||||||
|
|
|
|||||||||||
| Security |
Shares |
Value | ||||||
| Insurance — 0.1% | ||||||||
| Alliant Holdings, Inc.(e) |
1,431 | $ | 1,402,366 | |||||
|
|
|
|||||||
| Interactive Media & Services — 0.7% | ||||||||
| ByteDance Ltd., Series E-1, (Acquired 11/11/20, |
63,886 | 10,837,303 | ||||||
|
|
|
|||||||
| Media — 0.2% | ||||||||
| Ligado Networks LCC, 0.00%, 07/22/21 |
32,168 | 2,573,472 | ||||||
|
|
|
|||||||
| Total Preferred Stocks — 1.1% |
|
15,655,175 | ||||||
|
|
|
|||||||
| Total Preferred Securities — 3.3% |
|
49,040,226 | ||||||
|
|
|
|||||||
| Total Long-Term Investments — 145.1% |
|
2,173,759,914 | ||||||
|
|
|
|||||||
| Options Purchased — 0.0% |
|
15,203 | ||||||
|
|
|
|||||||
| Total Investments — 145.1% |
|
2,173,775,117 | ||||||
| Liabilities in Excess of Other Assets — (45.1)% |
|
(675,177,843 | ) | |||||
|
|
|
|||||||
| Net Assets — 100.0% |
|
$ | 1,498,597,274 | |||||
|
|
|
|||||||
| (a) | Variable rate security. Interest rate resets periodically. The rate shown is the effective interest rate as of period end. Security description also includes the reference rate and spread if published and available. |
| (b) | Security exempt from registration pursuant to Rule 144A under the Securities Act of 1933, as amended. These securities may be resold in transactions exempt from registration to qualified institutional investors. |
| (c) | When-issued security. |
| (d) | Non-income producing security. |
| (e) | Security is valued using significant unobservable inputs and is classified as Level 3 in the fair value hierarchy. |
| (f) | Restricted security as to resale, excluding 144A securities. The Trust held restricted securities with a current value of $12,373,415, representing 0.8% of its net assets as of period end, and an original cost of $8,075,513. |
| (g) | Convertible security. |
| (h) | Payment-in-kind security which may pay interest/dividends in additional par/shares and/or in cash. Rates shown are the current rate and possible payment rates. |
| (i) | Perpetual security with no stated maturity date. |
| (j) | Issuer filed for bankruptcy and/or is in default. |
| (k) | Zero-coupon bond. |
| (l) | Step-up bond that pays an initial coupon rate for the first period and then a higher coupon rate for the following periods. Rate as of period end. |
| (m) | Represents an unsettled loan commitment at period end. Certain details associated with this purchase are not known prior to the settlement date, including coupon rate. |
| (n) | Affiliate of the Trust. |
For Trust compliance purposes, the Trust’s industry classifications refer to one or more of the industry sub-classifications used by one or more widely recognized market indexes or rating group indexes, and/or as defined by the investment adviser. These definitions may not apply for purposes of this report, which may combine such industry sub-classifications for reporting ease.
| 80 | 2 0 2 1 B L A C K R O C K S E M I - A N N U A L R E P O R T T O S H A R E H O L D E R S |
| Consolidated Schedule of Investments (unaudited) (continued) June 30, 2021 |
BlackRock Corporate High Yield Fund, Inc. (HYT) |
Affiliates
Investments in issuers considered to be affiliate(s) of the Trust during the six-months ended June 30, 2021 for purposes of Section 2(a)(3) of the Investment Company Act of 1940, as amended, were as follows:
| Affiliated Issuer | Value at 12/31/20 |
Purchases at Cost |
Proceeds from Sales |
Net Realized Gain (Loss) |
Change in Unrealized Appreciation (Depreciation) |
Value at 06/30/21 |
Shares Held at 06/30/21 |
Income | Capital Gain Distributions from Underlying Funds |
|||||||||||||||||||||||||||
| BlackRock Liquidity Funds, T-Fund, Institutional Class(a) |
$ — | $ | — | $ | — | $ | — | $ | — | $ | — | — | $ | 174 | $ | — | ||||||||||||||||||||
| iShares Preferred & Income Securities ETF |
9,511,970 | — | (1,675,627 | ) | 62,881 | 85,781 | 7,985,005 | 203,000 | 161,719 | — | ||||||||||||||||||||||||||
|
|
|
|
|
|
|
|
|
|
|
|||||||||||||||||||||||||||
| $ | 62,881 | $ | 85,781 | $ | 7,985,005 | $ | 161,893 | $ | — | |||||||||||||||||||||||||||
|
|
|
|
|
|
|
|
|
|
|
|||||||||||||||||||||||||||
| (a) | As of period end, the entity is no longer held. |
Derivative Financial Instruments Outstanding as of Period End
Futures Contracts
| Description | Number of Contracts |
Expiration Date |
Notional Amount (000) |
Value/ Unrealized Appreciation (Depreciation) |
||||||||||||
| Short Contracts |
||||||||||||||||
| Euro Bund |
3 | 09/08/21 | $ | 614 | $ | (3,738 | ) | |||||||||
| 10-Year U.S. Treasury Note |
183 | 09/21/21 | 24,233 | (91,495 | ) | |||||||||||
| U.S. Long Bond |
4 | 09/21/21 | 642 | (14,242 | ) | |||||||||||
| Ultra U.S. Treasury Bond |
32 | 09/21/21 | 6,160 | (255,195 | ) | |||||||||||
| Long Gilt |
4 | 09/28/21 | 709 | (5,025 | ) | |||||||||||
| 5-Year U.S. Treasury Note |
146 | 09/30/21 | 18,014 | 56,808 | ||||||||||||
|
|
|
|||||||||||||||
| $ | (312,887 | ) | ||||||||||||||
|
|
|
|||||||||||||||
Forward Foreign Currency Exchange Contracts
| Currency Purchased | Currency Sold | Counterparty | Settlement Date |
|
Unrealized Appreciation (Depreciation) |
|||||||||||||||||||
| USD | 47,031,835 | EUR | 38,798,000 | BNP Paribas S.A. | 09/15/21 | $ | 957,076 | |||||||||||||||||
| USD | 159,638 | EUR | 134,000 | Morgan Stanley & Co. International PLC | 09/15/21 | 505 | ||||||||||||||||||
| USD | 239,199 | EUR | 197,000 | Natwest Markets PLC | 09/15/21 | 5,251 | ||||||||||||||||||
| USD | 75,197 | EUR | 62,000 | State Street Bank and Trust Co. | 09/15/21 | 1,569 | ||||||||||||||||||
| USD | 7,111,716 | GBP | 5,032,000 | BNP Paribas S.A. | 09/15/21 | 149,789 | ||||||||||||||||||
| USD | 139,446 | GBP | 99,000 | Morgan Stanley & Co. International PLC | 09/15/21 | 2,477 | ||||||||||||||||||
| USD | 80,703 | GBP | 57,000 | State Street Bank and Trust Co. | 09/15/21 | 1,842 | ||||||||||||||||||
| USD | 199,127 | GBP | 141,000 | State Street Bank and Trust Co. | 09/15/21 | 4,049 | ||||||||||||||||||
| USD | 206,997 | GBP | 146,000 | State Street Bank and Trust Co. | 09/15/21 | 5,002 | ||||||||||||||||||
|
|
|
|||||||||||||||||||||||
| $ | 1,127,560 | |||||||||||||||||||||||
|
|
|
|||||||||||||||||||||||
Exchange-Traded Options Purchased
| Description | Number of Contracts |
Expiration Date |
Exercise Price | Notional Amount (000) |
Value | |||||||||||||||||||
| Call |
||||||||||||||||||||||||
| Euro STOXX Banks |
39 | 09/17/21 | EUR | 90.00 | EUR | 0 | $ | 15,203 | ||||||||||||||||
|
|
|
|||||||||||||||||||||||
| C O N S O L I D A T E D S C H E D U L E O F I N V E S T M E N T S |
81 |
| Consolidated Schedule of Investments (unaudited) (continued) June 30, 2021 |
BlackRock Corporate High Yield Fund, Inc. |
OTC Credit Default Swaps — Sell Protection
| Reference Obligation/Index |
|
Financing Rate Received by the Trust |
|
Payment Frequency |
Counterparty | |
Termination Date |
|
|
Credit Rating(a) |
|
|
Notional Amount (000)(b) |
|
Value |
|
Upfront Premium Paid (Received) |
|
|
Unrealized Appreciation (Depreciation) |
|
|||||||||||||||||||||
| CenturyLink, Inc. |
1.00 | % | Quarterly | Barclays Bank PLC | 12/20/23 | NR | USD | 856 | $ | (13,399 | ) | $ | (33,764 | ) | $ | 20,365 | ||||||||||||||||||||||||||
| Altice France SA. |
5.00 | Quarterly | Credit Suisse International | 06/20/25 | B | EUR | 80 | 8,808 | 7,388 | 1,420 | ||||||||||||||||||||||||||||||||
| CenturyLink, Inc. |
1.00 | Quarterly | Barclays Bank PLC | 06/20/25 | NR | USD | 1,221 | (62,180 | ) | (134,216 | ) | 72,036 | ||||||||||||||||||||||||||||||
| Adler Real Estate AG |
5.00 | Quarterly | Morgan Stanley & Co. International PLC | 12/20/25 | BB+ | EUR | 60 | 8,701 | 9,251 | (550 | ) | |||||||||||||||||||||||||||||||
| Virgin Media Finance PLC |
5.00 | Quarterly | JPMorgan Chase Bank N.A. | 12/20/25 | B | EUR | 70 | 10,056 | 8,332 | 1,724 | ||||||||||||||||||||||||||||||||
| CMA CGM SA |
5.00 | Quarterly | Goldman Sachs International | 06/20/26 | B | EUR | 20 | 1,828 | 1,855 | (27 | ) | |||||||||||||||||||||||||||||||
| CMA CGM SA |
5.00 | Quarterly | Credit Suisse International | 06/20/26 | NR | EUR | 30 | 2,742 | 1,538 | 1,204 | ||||||||||||||||||||||||||||||||
|
|
|
|
|
|
|
|||||||||||||||||||||||||||||||||||||
| $ | (43,444 | ) | $ | (139,616 | ) | $ | 96,172 | |||||||||||||||||||||||||||||||||||
|
|
|
|
|
|
|
|||||||||||||||||||||||||||||||||||||
| (a) | Using the rating of the issuer or the underlying securities of the index, as applicable, provided by S&P Global Ratings. |
| (b) | The maximum potential amount the Trust may pay should a negative credit event take place as defined under the terms of the agreement. |
OTC Total Return Swaps
| Paid by the Trust |
Received by the Trust |
|
|
|
|
|
|
Upfront Premium |
Unrealized |
|||||||||||||||||||||||||||||
| Rate | Frequency | Reference | Frequency | Counterparty | Effective Date |
Termination Date |
Notional Amount (000) |
Value | Paid (Received) |
Appreciation Depreciation |
||||||||||||||||||||||||||||
| 3-Month LIBOR, plus 0.15% |
Quarterly | Markit iBoxx $ Liquid High Yield Index | At Maturity | Morgan Stanley & Co. International PLC | N/A | 09/20/21 | USD | 5,139 | $ | 265,050 | $ | — | $ | 265,050 | ||||||||||||||||||||||||
| 3-Month LIBOR, plus 0.15% |
Quarterly | Markit iBoxx $ Liquid High Yield Index | At Maturity | Morgan Stanley & Co. International PLC | N/A | 09/20/21 | USD | 1,513 | 63,902 | — | 63,902 | |||||||||||||||||||||||||||
| 3-Month LIBOR, plus 0.15% |
Quarterly | Markit iBoxx $ Liquid High Yield Index | At Maturity | Morgan Stanley & Co. International PLC | N/A | 09/20/21 | USD | 1,766 | 56,479 | — | 56,479 | |||||||||||||||||||||||||||
| 3-Month LIBOR, plus 0.15% |
Quarterly | Markit iBoxx $ Liquid High Yield Index | At Maturity | Morgan Stanley & Co. International PLC | N/A | 09/20/21 | USD | 7,709 | 162,163 | — | 162,163 | |||||||||||||||||||||||||||
| 3-Month LIBOR, plus 0.15% |
Quarterly | Markit iBoxx $ Liquid High Yield Index | At Maturity | Morgan Stanley & Co. International PLC | N/A | 09/20/21 | USD | 1,000 | 21,338 | — | 21,338 | |||||||||||||||||||||||||||
| 3-Month LIBOR, plus 0.15% |
Quarterly | Markit iBoxx $ Liquid High Yield Index | At Maturity | Barclays Bank PLC | N/A | 09/20/21 | USD | 1,000 | 20,676 | — | 20,676 | |||||||||||||||||||||||||||
| 3-Month LIBOR, plus 0.15% |
Quarterly | Markit iBoxx $ Liquid High Yield Index | At Maturity | Morgan Stanley & Co. International PLC | N/A | 12/20/21 | USD | 5,044 | 103,361 | — | 103,361 | |||||||||||||||||||||||||||
| 3-Month LIBOR, Plus 0.15% |
Quarterly | Markit iBoxx $ Liquid High Yield Index | At Maturity | Morgan Stanley & Co. International PLC | N/A | 12/20/21 | USD | 1,707 | 33,607 | — | 33,607 | |||||||||||||||||||||||||||
| 3-Month LIBOR, plus 0.15% |
Quarterly | Markit iBoxx $ Liquid High Yield Index | At Maturity | Morgan Stanley & Co. International PLC | N/A | 12/20/21 | USD | 1,500 | 29,462 | — | 29,462 | |||||||||||||||||||||||||||
| 3-Month LIBOR, plus 0.15% |
Quarterly | Markit iBoxx $ Liquid High Yield Index | At Maturity | Morgan Stanley & Co. International PLC | N/A | 12/20/21 | USD | 2,886 | 70,535 | — | 70,535 | |||||||||||||||||||||||||||
| 3-Month LIBOR, plus 0.15% |
Quarterly | Markit iBoxx $ Liquid High Yield Index | At Maturity | Morgan Stanley & Co. International PLC | N/A | 12/20/21 | USD | 1,800 | 55,127 | — | 55,127 | |||||||||||||||||||||||||||
| 3-Month LIBOR, plus 0.15% |
Quarterly | Markit iBoxx $ Liquid High Yield Index | At Maturity | Barclays Bank PLC | N/A | 12/20/21 | USD | 2,048 | 49,396 | — | 49,396 | |||||||||||||||||||||||||||
| 82 | 2 0 2 1 B L A C K R O C K S E M I - A N N U A L R E P O R T T O S H A R E H O L D E R S |
| Consolidated Schedule of Investments (unaudited) (continued) June 30, 2021 |
BlackRock Corporate High Yield Fund, Inc. (HYT) |
OTC Total Return Swaps (continued)
| Paid by the Trust |
Received by the Trust |
|
|
|
|
|
|
Upfront Premium |
Unrealized |
|||||||||||||||||||||||||||||
| Rate | Frequency | Reference | Frequency | Counterparty | Effective Date |
Termination Date |
Notional Amount (000) |
Value | Paid (Received) |
Appreciation Depreciation |
||||||||||||||||||||||||||||
| 3-Month LIBOR, plus 0.15% |
Quarterly | Markit iBoxx $ Liquid High Yield Index | At Maturity | Morgan Stanley & Co. International PLC | N/A | 12/20/21 | USD | 775 | $ | 12,758 | $ | — | $ | 12,758 | ||||||||||||||||||||||||
| 3-Month LIBOR, plus 0.15% |
Quarterly | Markit iBoxx $ Liquid High Yield Index | At Maturity | Morgan Stanley & Co. International PLC | N/A | 12/20/21 | USD | 2,296 | 38,526 | — | 38,526 | |||||||||||||||||||||||||||
|
|
|
|
|
|
|
|||||||||||||||||||||||||||||||||
| $ | 982,380 | $ | — | $ | 982,380 | |||||||||||||||||||||||||||||||||
|
|
|
|
|
|
|
|||||||||||||||||||||||||||||||||
Balances Reported in the Consolidated Statements of Assets and Liabilities for OTC Swaps
| Description | Swap Premiums Paid |
Swap Premiums Received |
Unrealized Appreciation |
Unrealized Depreciation |
||||||||||||
| OTC Swaps |
$ | 28,364 | $ | (167,980 | ) | $ | 1,079,129 | $ | (577 | ) | ||||||
Derivative Financial Instruments Categorized by Risk Exposure
As of period end, the fair values of derivative financial instruments located in the Consolidated Statements of Assets and Liabilities were as follows:
| Commodity Contracts |
Credit Contracts |
Equity Contracts |
Foreign Currency Exchange Contracts |
Interest Rate Contracts |
Other Contracts |
Total | ||||||||||||||||||||||
| Assets — Derivative Financial Instruments |
||||||||||||||||||||||||||||
| Futures contracts |
||||||||||||||||||||||||||||
| Unrealized appreciation on futures contracts(a) |
$ | — | $ | — | $ | — | $ | — | $ | 56,808 | $ | — | $ | 56,808 | ||||||||||||||
| Forward foreign currency exchange contracts |
||||||||||||||||||||||||||||
| Unrealized appreciation on forward foreign currency exchange contracts |
— | — | — | 1,127,560 | — | — | 1,127,560 | |||||||||||||||||||||
| Options purchased |
||||||||||||||||||||||||||||
| Investments at value — unaffiliated(b) |
— | — | 15,203 | — | — | — | 15,203 | |||||||||||||||||||||
| Swaps — OTC |
||||||||||||||||||||||||||||
| Unrealized appreciation on OTC swaps; Swap premiums paid |
— | 125,113 | — | — | 982,380 | — | 1,107,493 | |||||||||||||||||||||
|
|
|
|
|
|
|
|
|
|
|
|
|
|
|
|||||||||||||||
| $ | — | $ | 125,113 | $ | 15,203 | $ | 1,127,560 | $ | 1,039,188 | $ | — | $ | 2,307,064 | |||||||||||||||
|
|
|
|
|
|
|
|
|
|
|
|
|
|
|
|||||||||||||||
| Liabilities — Derivative Financial Instruments |
||||||||||||||||||||||||||||
| Futures contracts |
||||||||||||||||||||||||||||
| Unrealized depreciation on futures contracts(a) |
$ | — | $ | — | $ | — | $ | — | $ | 369,695 | $ | — | $ | 369,695 | ||||||||||||||
| Swaps — OTC |
||||||||||||||||||||||||||||
| Unrealized depreciation on OTC swaps; Swap premiums received |
— | 168,557 | — | — | — | — | 168,557 | |||||||||||||||||||||
|
|
|
|
|
|
|
|
|
|
|
|
|
|
|
|||||||||||||||
| $ | — | $ | 168,557 | $ | — | $ | — | $ | 369,695 | $ | — | $ | 538,252 | |||||||||||||||
|
|
|
|
|
|
|
|
|
|
|
|
|
|
|
|||||||||||||||
| (a) | Net cumulative unrealized appreciation (depreciation) on futures contracts and centrally cleared swaps, if any, are reported in the Consolidated Schedule of Investments. In the Consolidated Statements of Assets and Liabilities, only current day’s variation margin is reported in receivables or payables and the net cumulative unrealized appreciation (depreciation) is included in accumulated earnings (loss). |
| (b) | Includes options purchased at value as reported in the Consolidated Schedule of Investments. |
For the six months ended June 30, 2021, the effect of derivative financial instruments in the Consolidated Statements of Operations was as follows:
| Commodity Contracts |
Credit Contracts |
Equity Contracts |
Foreign Currency Exchange Contracts |
Interest Rate Contracts |
Other Contracts |
Total | ||||||||||||||||||||||
| Net Realized Gain (Loss) from |
||||||||||||||||||||||||||||
| Futures contracts |
$ | — | $ | — | $ | 428,122 | $ | — | $ | 5,328,475 | $ | — | $ | 5,756,597 | ||||||||||||||
| Forward foreign currency exchange contracts |
— | — | — | (842,688 | ) | — | — | (842,688 | ) | |||||||||||||||||||
| Options purchased(a) |
— | — | 36,755 | — | — | — | 36,755 | |||||||||||||||||||||
| C O N S O L I D A T E D S C H E D U L E O F I N V E S T M E N T S |
83 |
| Consolidated Schedule of Investments (unaudited) (continued) June 30, 2021 |
BlackRock Corporate High Yield Fund, Inc. (HYT) |
| Commodity Contracts |
Credit Contracts |
Equity Contracts |
Foreign Currency Exchange Contracts |
Interest Rate Contracts |
Other Contracts |
Total | ||||||||||||||||||||||
| Options written |
$ | — | $ | — | $ | (7,419 | ) | $ | — | $ | — | $ | — | $ | (7,419 | ) | ||||||||||||
| Swaps |
— | 55,394 | — | — | 1,113,082 | — | 1,168,476 | |||||||||||||||||||||
|
|
|
|
|
|
|
|
|
|
|
|
|
|
|
|||||||||||||||
| $ | — | $ | 55,394 | $ | 457,458 | $ | (842,688 | ) | $ | 6,441,557 | $ | — | $ | 6,111,721 | ||||||||||||||
|
|
|
|
|
|
|
|
|
|
|
|
|
|
|
|||||||||||||||
| Net Change in Unrealized Appreciation (Depreciation) on |
||||||||||||||||||||||||||||
| Futures contracts |
$ | — | $ | — | $ | — | $ | — | $ | (400,309 | ) | $ | — | $ | (400,309 | ) | ||||||||||||
| Forward foreign currency exchange contracts |
— | — | — | 2,444,621 | — | — | 2,444,621 | |||||||||||||||||||||
| Options purchased(b) |
— | — | 13,409 | — | — | — | 13,409 | |||||||||||||||||||||
| Swaps |
— | 52,929 | — | — | (225,801 | ) | — | (172,872 | ) | |||||||||||||||||||
|
|
|
|
|
|
|
|
|
|
|
|
|
|
|
|||||||||||||||
| $ | — | $ | 52,929 | $ | 13,409 | $ | 2,444,621 | $ | (626,110 | ) | $ | — | $ | 1,884,849 | ||||||||||||||
|
|
|
|
|
|
|
|
|
|
|
|
|
|
|
|||||||||||||||
| (a) | Options purchased are included in net realized gain (loss) from investments — unaffiliated. |
| (b) | Options purchased are included in net change in unrealized appreciation (depreciation) on investments — unaffiliated. |
Average Quarterly Balances of Outstanding Derivative Financial Instruments
| Futures contracts |
||||
| Average notional value of contracts — long |
$ | — | (a) | |
| Average notional value of contracts — short |
$ | 52,681,927 | ||
| Forward foreign currency exchange contracts |
||||
| Average amounts purchased — in USD |
$ | 55,983,102 | ||
| Average amounts sold — in USD |
$ | 1,245,366 | ||
| Options |
||||
| Average value of option contracts purchased |
$ | 16,098 | ||
| Average value of option contracts written |
$ | — | (a) | |
| Credit default swaps |
||||
| Average notional value — buy protection |
$ | 159,094 | ||
| Average notional value — sell protection |
$ | 2,407,053 | ||
| Total return swaps |
||||
| Average notional value |
$ | 36,183,000 | ||
| (a) | Derivative not held at any quarter-end. The risk exposure table serves as an indicator of activity during the period. |
For more information about the Trust’s investment risks regarding derivative financial instruments, refer to the Notes to Financial Statements.
Derivative Financial Instruments — Offsetting as of Period End
The Trust’s derivative assets and liabilities (by type) were as follows:
| Assets | Liabilities | |||||||
| Derivative Financial Instruments |
||||||||
| Futures contracts |
$ | — | $ | 65,416 | ||||
| Forward foreign currency exchange contracts |
1,127,560 | — | ||||||
| Options |
15,203 | (a) | — | |||||
| Swaps — centrally cleared |
62,592 | — | ||||||
| Swaps — OTC(b) |
1,107,493 | 168,557 | ||||||
|
|
|
|
|
|||||
| Total derivative assets and liabilities in the Consolidated Statements of Assets and Liabilities |
2,312,848 | 233,973 | ||||||
|
|
|
|
|
|||||
| Derivatives not subject to a Master Netting Agreement or similar agreement (“MNA”) |
(77,795 | ) | (65,416 | ) | ||||
|
|
|
|
|
|||||
| Total derivative assets and liabilities subject to an MNA |
$ | 2,235,053 | $ | 168,557 | ||||
|
|
|
|
|
|||||
| (a) | Includes options purchased at value which is included in Investments at value — unaffiliated in the Consolidated Statements of Assets and Liabilities and reported in the Consolidated Schedule of Investments. |
| (b) | Includes unrealized appreciation (depreciation) on OTC swaps and swap premiums (paid/received) in the Consolidated Statements of Assets and Liabilities. |
| 84 | 2 0 2 1 B L A C K R O C K S E M I - A N N U A L R E P O R T T O S H A R E H O L D E R S |
| Consolidated Schedule of Investments (unaudited) (continued) June 30, 2021 |
BlackRock Corporate High Yield Fund, Inc. (HYT) |
The following table presents the Trust’s derivative assets and liabilities by counterparty net of amounts available for offset under an MNA and net of the related collateral received (and pledged) by the Trust:
| Counterparty |
|
Derivative Assets Subject to an MNA by Counterparty |
|
|
Derivatives Available for Offset |
(a) |
|
Non-Cash Collateral Received |
|
|
Cash Collateral Received |
|
|
Net Amount of Derivative Assets |
(b)(c) | |||||
| Barclays Bank PLC |
$ | 162,473 | $ | (162,473) | $ | — | $ | — | $ | — | ||||||||||
| BNP Paribas S.A. |
1,106,865 | — | — | — | 1,106,865 | |||||||||||||||
| Credit Suisse International |
11,550 | — | — | — | 11,550 | |||||||||||||||
| Goldman Sachs International |
1,855 | (27) | — | — | 1,828 | |||||||||||||||
| JPMorgan Chase Bank N.A. |
10,056 | — | — | — | 10,056 | |||||||||||||||
| Morgan Stanley & Co. International PLC |
924,541 | (550) | — | (870,000 | ) | 53,991 | ||||||||||||||
| Natwest Markets PLC |
5,251 | — | — | — | 5,251 | |||||||||||||||
| State Street Bank and Trust Co. |
12,462 | — | — | — | 12,462 | |||||||||||||||
|
|
|
|
|
|
|
|
|
|
|
|||||||||||
| $ | 2,235,053 | $ | (163,050) | $ | — | $ | (870,000 | ) | $ | 1,202,003 | ||||||||||
|
|
|
|
|
|
|
|
|
|
|
|||||||||||
| Counterparty |
|
Derivative Liabilities Subject to an MNA by Counterparty |
|
|
Derivatives Available for Offset |
(a) |
|
Non-Cash Collateral Pledged |
|
|
Cash Collateral Pledged |
|
|
Net Amount of Derivative Liabilities |
(d) | |||||
| Barclays Bank PLC |
$ | 167,980 | $ | (162,473) | $ | — | $ | — | $ | 5,507 | ||||||||||
| Goldman Sachs International |
27 | (27) | — | — | — | |||||||||||||||
| Morgan Stanley & Co. International PLC |
550 | (550) | — | — | — | |||||||||||||||
|
|
|
|
|
|
|
|
|
|
|
|||||||||||
| $ | 168,557 | $ | (163,050) | $ | — | $ | — | $ | 5,507 | |||||||||||
|
|
|
|
|
|
|
|
|
|
|
|||||||||||
| (a) | The amount of derivatives available for offset is limited to the amount of derivative asset and/or liabilities that are subject to an MNA. |
| (b) | Net amount may also include forward foreign currency exchange contracts that are not required to be collateralized. |
| (c) | Net amount represents the net amount receivable from the counterparty in the event of default. |
| (d) | Net amount represents the net amount payable due to counterparty in the event of default. |
Fair Value Hierarchy as of Period End
Various inputs are used in determining the fair value of financial instruments. For a description of the input levels and information about the Trust’s policy regarding valuation of financial instruments, refer to the Notes to Financial Statements.
The following table summarizes the Trust’s financial instruments categorized in the fair value hierarchy. The breakdown of the Trust’s financial instruments into major categories is disclosed in the Consolidated Schedule of Investments above.
| Level 1 | Level 2 | Level 3 | Total | |||||||||||||
| Assets |
||||||||||||||||
| Investments |
||||||||||||||||
| Long-Term Investments |
||||||||||||||||
| Asset-Backed Securities |
$ | — | $ | 3,218,658 | $ | — | $ | 3,218,658 | ||||||||
| Common Stocks |
||||||||||||||||
| Auto Components |
39,789 | — | — | 39,789 | ||||||||||||
| Building Products |
47,555 | — | — | 47,555 | ||||||||||||
| Chemicals |
5,627,243 | — | — | 5,627,243 | ||||||||||||
| Communications Equipment |
1,080,161 | — | — | 1,080,161 | ||||||||||||
| Consumer Finance |
50 | — | — | 50 | ||||||||||||
| Diversified Financial Services |
— | — | 22,236 | 22,236 | ||||||||||||
| Diversified Telecommunication Services |
— | 96,453 | — | 96,453 | ||||||||||||
| Electrical Equipment |
1,477,771 | — | — | 1,477,771 | ||||||||||||
| Energy Equipment & Services |
— | — | 74,918 | 74,918 | ||||||||||||
| Entertainment |
1,273,909 | — | — | 1,273,909 | ||||||||||||
| Equity Real Estate Investment Trusts (REITs) |
10,087,087 | — | — | 10,087,087 | ||||||||||||
| Hotels, Restaurants & Leisure |
1,057,080 | — | — | 1,057,080 | ||||||||||||
| Life Sciences Tools & Services |
5,104,938 | — | — | 5,104,938 | ||||||||||||
| Media |
1,298,017 | — | — | 1,298,017 | ||||||||||||
| Metals & Mining |
3,199,878 | — | — | 3,199,878 | ||||||||||||
| Oil, Gas & Consumable Fuels |
22,289,285 | 1,529,105 | — | 23,818,390 | ||||||||||||
| C O N S O L I D A T E D S C H E D U L E O F I N V E S T M E N T S |
85 |
| Consolidated Schedule of Investments (unaudited) (continued) June 30, 2021 |
BlackRock Corporate High Yield Fund, Inc. (HYT) |
Fair Value Hierarchy as of Period End (continued)
| Level 1 | Level 2 | Level 3 | Total | |||||||||||||
| Common Stocks (continued) |
||||||||||||||||
| Road & Rail |
$ | 850,536 | $ | — | $ | — | $ | 850,536 | ||||||||
| Semiconductors & Semiconductor Equipment |
32,694 | — | — | 32,694 | ||||||||||||
| Corporate Bonds |
||||||||||||||||
| Aerospace & Defense |
— | 70,740,156 | — | 70,740,156 | ||||||||||||
| Airlines |
225,793 | 37,526,455 | — | 37,752,248 | ||||||||||||
| Auto Components |
— | 30,195,612 | — | 30,195,612 | ||||||||||||
| Automobiles |
— | 28,695,246 | — | 28,695,246 | ||||||||||||
| Banks |
— | 10,966,074 | — | 10,966,074 | ||||||||||||
| Beverages |
— | 31,476,460 | — | 31,476,460 | ||||||||||||
| Biotechnology |
— | 698,826 | — | 698,826 | ||||||||||||
| Building Materials |
— | 19,726,930 | — | 19,726,930 | ||||||||||||
| Building Products |
— | 16,115,759 | — | 16,115,759 | ||||||||||||
| Capital Markets |
— | 26,147,520 | — | 26,147,520 | ||||||||||||
| Chemicals |
— | 31,252,685 | — | 31,252,685 | ||||||||||||
| Commercial Services & Supplies |
— | 18,923,408 | — | 18,923,408 | ||||||||||||
| Communications Equipment |
— | 16,965,774 | — | 16,965,774 | ||||||||||||
| Construction & Engineering |
— | 2,450,932 | — | 2,450,932 | ||||||||||||
| Construction Materials |
— | 16,436,451 | — | 16,436,451 | ||||||||||||
| Consumer Discretionary |
— | 37,654,051 | — | 37,654,051 | ||||||||||||
| Consumer Finance |
119,729 | 31,099,028 | — | 31,218,757 | ||||||||||||
| Containers & Packaging |
— | 8,164,906 | — | 8,164,906 | ||||||||||||
| Diversified Consumer Services |
— | 44,685,761 | — | 44,685,761 | ||||||||||||
| Diversified Financial Services |
— | 23,223,151 | — | 23,223,151 | ||||||||||||
| Diversified Telecommunication Services |
— | 62,753,289 | — | 62,753,289 | ||||||||||||
| Electric Utilities |
— | 13,831,316 | — | 13,831,316 | ||||||||||||
| Electrical Equipment |
— | 2,793,141 | — | 2,793,141 | ||||||||||||
| Electronic Equipment, Instruments & Components |
— | 10,685,589 | — | 10,685,589 | ||||||||||||
| Energy Equipment & Services |
— | 10,616,678 | 3,660,579 | 14,277,257 | ||||||||||||
| Environmental, Maintenance, & Security Service |
— | 15,811,391 | — | 15,811,391 | ||||||||||||
| Equity Real Estate Investment Trusts (REITs) |
— | 34,802,694 | — | 34,802,694 | ||||||||||||
| Food & Staples Retailing |
— | 39,904,169 | — | 39,904,169 | ||||||||||||
| Food Products |
— | 13,482,872 | — | 13,482,872 | ||||||||||||
| Gas Utilities |
— | 1,221,990 | — | 1,221,990 | ||||||||||||
| Health Care Equipment & Supplies |
— | 13,118,562 | — | 13,118,562 | ||||||||||||
| Health Care Providers & Services |
— | 93,461,496 | — | 93,461,496 | ||||||||||||
| Health Care Technology |
— | 19,968,092 | — | 19,968,092 | ||||||||||||
| Healthcare |
— | 622,914 | — | 622,914 | ||||||||||||
| Hotels, Restaurants & Leisure |
97,767 | 90,413,260 | — | 90,511,027 | ||||||||||||
| Household Durables |
— | 21,140,575 | — | 21,140,575 | ||||||||||||
| Household Products |
— | 1,055,600 | — | 1,055,600 | ||||||||||||
| Independent Power and Renewable Electricity Producers |
— | 12,387,796 | — | 12,387,796 | ||||||||||||
| Insurance |
— | 30,570,466 | — | 30,570,466 | ||||||||||||
| Interactive Media & Services |
— | 12,771,677 | — | 12,771,677 | ||||||||||||
| Internet Software & Services |
— | 16,984,804 | — | 16,984,804 | ||||||||||||
| IT Services |
— | 42,415,785 | — | 42,415,785 | ||||||||||||
| Leisure Products |
— | 3,637,382 | — | 3,637,382 | ||||||||||||
| Machinery |
— | 19,923,312 | — | 19,923,312 | ||||||||||||
| Media |
— | 199,312,327 | — | 199,312,327 | ||||||||||||
| Metals & Mining |
194,660 | 41,398,248 | — | 41,592,908 | ||||||||||||
| Mortgage Real Estate Investment Trusts (REITs) |
— | 1,107,169 | — | 1,107,169 | ||||||||||||
| Multi-line Retail |
— | 7,095,992 | — | 7,095,992 | ||||||||||||
| Offshore Drilling & Other Services |
— | 1,624,056 | — | 1,624,056 | ||||||||||||
| Oil, Gas & Consumable Fuels |
1,088,495 | 217,413,964 | — | 218,502,459 | ||||||||||||
| Personal Products |
— | 1,882,748 | — | 1,882,748 | ||||||||||||
| Pharmaceuticals |
— | 50,115,243 | — | 50,115,243 | ||||||||||||
| Real Estate Management & Development |
— | 11,464,266 | — | 11,464,266 | ||||||||||||
| Road & Rail |
— | 1,815,096 | — | 1,815,096 | ||||||||||||
| Semiconductors & Semiconductor Equipment |
116,145 | 14,895,285 | — | 15,011,430 | ||||||||||||
| Software |
— | 42,151,612 | — | 42,151,612 | ||||||||||||
| Specialty Retail |
— | 21,263,822 | — | 21,263,822 | ||||||||||||
| Textiles, Apparel & Luxury Goods |
210,179 | 3,280,936 | — | 3,491,115 | ||||||||||||
| Thrifts & Mortgage Finance |
— | 8,470,786 | — | 8,470,786 | ||||||||||||
| Transportation |
— | 278,833 | — | 278,833 | ||||||||||||
| 86 | 2 0 2 1 B L A C K R O C K S E M I - A N N U A L R E P O R T T O S H A R E H O L D E R S |
| Consolidated Schedule of Investments (unaudited) (continued) June 30, 2021 |
BlackRock Corporate High Yield Fund, Inc. (HYT) |
Fair Value Hierarchy as of Period End (continued)
| Level 1 | Level 2 | Level 3 | Total | |||||||||||||
| Corporate Bonds (continued) |
||||||||||||||||
| Transportation Infrastructure |
$ | — | $ | 461,835 | $ | — | $ | 461,835 | ||||||||
| Utilities |
— | 4,750,088 | — | 4,750,088 | ||||||||||||
| Wireless Telecommunication Services |
— | 48,221,410 | — | 48,221,410 | ||||||||||||
| Floating Rate Loan Interests |
— | 268,986,661 | 19,103,561 | 288,090,222 | ||||||||||||
| Investment Companies |
7,985,005 | — | — | 7,985,005 | ||||||||||||
| Preferred Securities |
||||||||||||||||
| Capital Trusts |
— | 33,385,051 | — | 33,385,051 | ||||||||||||
| Preferred Stocks |
— | 2,573,472 | 13,074,696 | 15,648,168 | ||||||||||||
| Options Purchased |
||||||||||||||||
| Equity Contracts |
15,203 | — | — | 15,203 | ||||||||||||
| Unfunded Floating Rate Loan Interests(a) |
— | 37 | — | 37 | ||||||||||||
|
|
|
|
|
|
|
|
|
|||||||||
| $ | 63,518,969 | $ | 2,074,313,188 | $ | 35,935,990 | 2,173,768,147 | ||||||||||
|
|
|
|
|
|
|
|
|
|||||||||
| Investments Valued at NAV(b) |
7,007 | |||||||||||||||
|
|
|
|||||||||||||||
| $ | 2,173,775,154 | |||||||||||||||
|
|
|
|||||||||||||||
| Derivative Financial Instruments(c) |
||||||||||||||||
| Assets |
||||||||||||||||
| Credit Contracts |
$ | — | $ | 96,749 | $ | — | $ | 96,749 | ||||||||
| Foreign Currency Exchange Contracts |
— | 1,127,560 | — | 1,127,560 | ||||||||||||
| Interest Rate Contracts |
56,808 | 982,380 | — | 1,039,188 | ||||||||||||
| Liabilities |
||||||||||||||||
| Credit Contracts |
— | (577 | ) | — | (577 | ) | ||||||||||
| Interest Rate Contracts |
(369,695 | ) | — | — | (369,695 | ) | ||||||||||
|
|
|
|
|
|
|
|
|
|||||||||
| $ | (312,887 | ) | $ | 2,206,112 | $ | — | $ | 1,893,225 | ||||||||
|
|
|
|
|
|
|
|
|
|||||||||
| (a) | Unfunded floating rate loan interests are valued at the unrealized appreciation (depreciation) on the commitment. |
| (b) | Certain investments of the Trust were fair valued using NAV per share as no quoted market value is available and therefore have been excluded from the fair value hierarchy. |
| (c) | Derivative financial instruments are swaps, futures contracts, forward foreign currency exchange contracts and options written. Swaps, futures contracts and forward foreign currency exchange contracts are valued at the unrealized appreciation (depreciation) on the instrument and options written are shown at value. |
The Trust may hold assets and/or liabilities in which the fair value approximates the carrying amount for financial statement purposes. As of period end, bank borrowings payable of $657,000,000 are categorized as Level 2 within the fair value hierarchy.
A reconciliation of Level 3 financial instruments is presented when the Trust had a significant amount of Level 3 investments at the beginning and/or end of the period in relation to net assets. The following table is a reconciliation of Level 3 investments for which significant unobservable inputs were used in determining fair value:
| Common Stocks |
Corporate Bonds |
Floating Rate Loan Interests |
Preferred Stocks |
Total | ||||||||||||||||
| Assets |
||||||||||||||||||||
| Opening balance, as of December 31, 2020 |
$ | 1,712,957 | $ | 2,451,440 | $ | 19,366,986 | $ | 10,338,450 | $ | 33,869,833 | ||||||||||
| Transfers into Level 3(a) |
— | — | — | — | — | |||||||||||||||
| Transfers out of Level 3(b) |
— | — | (15,979,436 | ) | (1,930,104 | ) | (17,909,540 | ) | ||||||||||||
| Accrued discounts/premiums |
— | 70,859 | 11,164 | — | 82,023 | |||||||||||||||
| Net realized gain (loss) |
(3,355,506 | ) | 14,996 | 295 | — | (3,340,215 | ) | |||||||||||||
| Net change in unrealized appreciation (depreciation)(c)(d) |
4,109,875 | 1,152,660 | 398,015 | 3,892,150 | 9,552,700 | |||||||||||||||
| Purchases |
— | 64,245 | 15,318,450 | 774,200 | 16,156,895 | |||||||||||||||
| Sales |
(2,370,172 | ) | (93,621 | ) | (11,913 | ) | — | (2,475,706 | ) | |||||||||||
|
|
|
|
|
|
|
|
|
|
|
|||||||||||
| Closing balance, as of June 30, 2021 |
$ | 97,154 | $ | 3,660,579 | $ | 19,103,561 | $ | 13,074,696 | $ | 35,935,990 | ||||||||||
|
|
|
|
|
|
|
|
|
|
|
|||||||||||
| Net change in unrealized appreciation (depreciation) on investments still held at June 30, 2021(c) |
$ | (144,960 | ) | $ | 1,176,673 | $ | 398,015 | $ | 3,892,150 | $ | 5,321,878 | |||||||||
|
|
|
|
|
|
|
|
|
|
|
|||||||||||
| (a) | As of December 31, 2020, the Trust used observable inputs in determining the value of certain investments. As of June 30, 2021, the Trust used significant unobservable inputs in determining the value of the same investments. As a result, investments at beginning of period value were transferred from Level 2 to Level 3 in the disclosure hierarchy. |
| (b) | As of December 31, 2020, the Trust used significant unobservable inputs in determining the value of certain investments. As of June 30, 2021, the Trust used observable inputs in determining the value of the same investments. As a result, investments at beginning of period value were transferred from Level 3 to Level 2 in the disclosure hierarchy. |
| (c) | Included in the related net change in unrealized appreciation (depreciation) in the Consolidated Statements of Operations. |
| (d) | Any difference between net change in unrealized appreciation (depreciation) and net change in unrealized appreciation (depreciation) on investments still held at June 30, 2021 is generally due to investments no longer held or categorized as Level 3 at period end. |
The following table summarizes the valuation approaches used and unobservable inputs utilized by the BlackRock Global Valuation Methodologies Committee (the “Global Valuation Committee”) to determine the value of certain of the Trust’s Level 3 financial instruments as of period end. The table does not include Level 3 financial instruments
| C O N S O L I D A T E D S C H E D U L E O F I N V E S T M E N T S |
87 |
| Consolidated Schedule of Investments (unaudited) (continued) June 30, 2021 |
BlackRock Corporate High Yield Fund, Inc. (HYT) |
with values based upon unadjusted third party pricing information in the amount of $19,125,797. A significant change in third party information could result in a significantly lower or higher value of such Level 3 financial instruments.
| Value | |
|
|
|
Valuation Approach |
|
|
|
|
Unobservable Inputs |
|
|
|
|
Range of Unobservable Inputs Utilized |
(a) |
|
|
|
|
Weighted Average of Unobservable Inputs Based on Fair Value |
| ||||||||||||
| Assets |
||||||||||||||||||||||||||||||||||
| Common Stocks |
$ | 74,918 | Market | EBITDA Multiple | 3.50x | — | ||||||||||||||||||||||||||||
| Corporate Bonds |
3,660,579 | Income | Discount Rate | 11% | — | |||||||||||||||||||||||||||||
| Market | EBITDA Multiple | 3.50x | — | |||||||||||||||||||||||||||||||
| Preferred Stocks |
13,074,696 | Income | Discount Rate | 11% - 28% | 25% | |||||||||||||||||||||||||||||
| Market | Revenue Multiple | 7.47x | — | |||||||||||||||||||||||||||||||
|
|
|
|||||||||||||||||||||||||||||||||
| $ | 16,810,193 | |||||||||||||||||||||||||||||||||
|
|
|
|||||||||||||||||||||||||||||||||
| (a) | A significant change in unobservable input would have resulted in a correlated (inverse) significant change to value. |
See notes to financial statements.
| 88 | 2 0 2 1 B L A C K R O C K S E M I - A N N U A L R E P O R T T O S H A R E H O L D E R S |
| Schedule of Investments (unaudited) June 30, 2021 |
BlackRock Credit Allocation Income Trust (BTZ) (Percentages shown are based on Net Assets) |
| Security | Par (000) |
Value | ||||||
| Asset-Backed Securities |
| |||||||
| Allegro CLO II-S Ltd., Series 2014-1RA, Class B, (3 mo. LIBOR US + 2.15%), 2.34%, 10/21/28(a)(b) |
$ | 500 | $ | 500,032 | ||||
| Allegro CLO VI Ltd.(a)(b) |
||||||||
| Series 2017-2A, Class B, (3 mo. LIBOR US + 1.50%), 1.69%, 01/17/31 |
360 | 358,022 | ||||||
| Series 2017-2A, Class C, (3 mo. LIBOR US + 1.80%), 1.99%, 01/17/31 |
2,400 | 2,383,568 | ||||||
| ALM VII R Ltd.(a)(b) |
||||||||
| Series 2013-7R2A, Class A2R2, (3 mo. LIBOR US + 1.65%), 1.78%, 10/15/27 |
750 | 751,055 | ||||||
| Series 2013-7R2A, Class BR2, (3 mo. LIBOR US + 2.20%), 2.33%, 10/15/27 |
400 | 400,000 | ||||||
| American Airlines Group,
Inc., |
1,598 | 1,596,018 | ||||||
| Anchorage Capital CLO Ltd.(a)(b) |
||||||||
| Series 2013-1A, Class BR, (3 mo. LIBOR US + 2.15%), 2.28%, 10/13/30 |
1,000 | 997,485 | ||||||
| Series 2014-3RA, Class C, (3 mo. LIBOR US + 1.85%), 2.03%, 01/28/31 |
1,000 | 995,015 | ||||||
| Anchorage Capital CLO R Ltd., Series 2014-3RA, Class D, (3 mo. LIBOR US + 2.60%), 2.78%, 01/28/31(a)(b) |
1,000 | 973,709 | ||||||
| Apidos CLO XV, Series 2013-15A, Class DRR, (3 mo. LIBOR US + 2.70%), |
1,000 | 983,009 | ||||||
| Apidos CLO XX, Series 2015-20A, Class BRR, (3 mo. LIBOR US + 1.95%), |
1,000 | 1,000,038 | ||||||
| Ares XLIX CLO Ltd., Series 2018-49A, Class D, (3 mo. LIBOR US + 3.00%), |
1,000 | 999,902 | ||||||
| ARES XLVII CLO Ltd., Series 2018-47A, Class D, (3 mo. LIBOR US + 2.70%), 2.83%, 04/15/30(a)(b) |
1,500 | 1,481,774 | ||||||
| Ares XLVIII CLO Ltd., Series 2018-48A, Class C, (3 mo. LIBOR US + 1.80%), 1.99%, 07/20/30(a)(b) |
500 | 497,480 | ||||||
| Ares XXXVII CLO Ltd.(a)(b) |
||||||||
| Series 2015-4A, Class A3R, (3 mo. LIBOR US + 1.50%), 1.63%, 10/15/30 |
1,000 | 999,209 | ||||||
| Series 2015-4A, Class BR, (3 mo. LIBOR US + 1.80%), 1.93%, 10/15/30 |
1,750 | 1,740,781 | ||||||
| Atlas Senior Loan Fund XII Ltd., Series 2018-12A, Class A1, (3 mo. LIBOR US + 1.18%), 1.36%, 10/24/31(a)(b) |
400 | 400,039 | ||||||
| Atrium XV, Series 15A, Class C, (3 mo. LIBOR US + 2.20%), 2.37%, 01/23/31(a)(b) |
250 | 250,031 | ||||||
| Benefit Street Partners Clo XII Ltd., Series 2017-12A, Class B, (3 mo. LIBOR US + 2.00%), 2.13%, 10/15/30(a)(b) |
1,000 | 999,018 | ||||||
| Canyon CLO Ltd., Series 2020-3A, Class C, (3 mo. LIBOR US + 2.50%), |
500 | 503,088 | ||||||
| CarVal CLO I Ltd., Series 2018-1A, Class D, (3 mo. LIBOR US + 2.89%), |
500 | 499,996 | ||||||
| Cent CLO Ltd., Series C17A, Class BR, |
1,000 | 991,910 | ||||||
| CIFC Funding II Ltd.(a)(b) |
||||||||
| Series 2013-2A, Class A3LR, (3 mo. LIBOR US + 1.95%), 2.14%, 10/18/30 |
1,000 | 997,486 | ||||||
| Series 2013-2A, Class B1LR, (3 mo. LIBOR US + 3.05%), 3.24%, 10/18/30 |
1,000 | 1,000,096 | ||||||
| CIFC Funding Ltd.(a)(b) |
||||||||
| Series 2014-4RA, Class A2, (3 mo. LIBOR US + 1.65%), 1.84%, 10/17/30 |
600 | 599,998 | ||||||
| Series 2014-4RA, Class B, (3 mo. LIBOR US + 2.20%), 2.39%, 10/17/30 |
400 | 399,984 | ||||||
| Security | Par (000) |
Value | ||||||
| Asset-Backed Securities (continued) |
| |||||||
| CIFC Funding Ltd.(a)(b) (continued) |
||||||||
| Series 2018-1A, Class C, (3 mo. LIBOR US + 1.75%), 1.94%, 04/18/31 |
$ | 1,000 | $ | 991,986 | ||||
| Series 2018-1A, Class D, (3 mo. LIBOR US + 2.65%), 2.84%, 04/18/31 |
1,200 | 1,182,548 | ||||||
| Elevation CLO Ltd., Series 2017-7A, Class C, |
1,500 | 1,462,952 | ||||||
| Galaxy XX CLO Ltd., Series 2015-20A, Class D1R, (3 mo. LIBOR US + 2.60%), 2.79%, 04/20/31(a)(b) |
1,000 | 991,392 | ||||||
| Greenwood Park CLO Ltd., Series 2018-1A, Class D, (3 mo. LIBOR US + 2.50%), 2.63%, 04/15/31(a)(b) |
1,000 | 988,147 | ||||||
| Highbridge Loan Management Ltd.(a)(b) |
||||||||
| Series 12A-18, Class B, (3 mo. LIBOR US + 1.85%), 2.04%, 07/18/31 |
1,250 | 1,242,964 | ||||||
| Series 4A-2014, Class A2R, (3 mo. LIBOR US + 1.50%), 1.68%, 01/28/30 |
650 | 648,755 | ||||||
| Series 6A-2015, Class BR, (3 mo. LIBOR US + 1.75%), 1.93%, 02/05/31 |
1,500 | 1,484,317 | ||||||
| Long Point Park CLO Ltd., Series 2017-1A, Class B, (3 mo. LIBOR US + 1.70%), 1.89%, 01/17/30(a)(b) |
1,000 | 989,566 | ||||||
| Madison Park Funding XIII Ltd., Series 2014-13A, Class CR2, (3 mo. LIBOR US + 1.90%), 2.03%, 04/19/30(a)(b) |
1,000 | 996,011 | ||||||
| Madison Park Funding XXVII Ltd.(a)(b) |
||||||||
| Series 2018-27A, Class B, (3 mo. LIBOR US + 1.80%), 1.99%, 04/20/30 |
1,000 | 991,750 | ||||||
| Series 2018-27A, Class C, (3 mo. LIBOR US + 2.60%), 2.79%, 04/20/30 |
1,000 | 985,282 | ||||||
| Marble Point CLO XI Ltd., Series 2017-2A, Class B, (3 mo. LIBOR US + 1.50%), 1.69%, 12/18/30(a)(b) |
1,000 | 990,222 | ||||||
| MP CLO III Ltd., Series 2013-1A, Class CR, |
1,000 | 989,647 | ||||||
| Neuberger Berman CLO XV, Series 2013-15A, Class CR, (3 mo. LIBOR US + 2.05%), 2.18%, 10/15/29(a)(b) |
1,000 | 999,957 | ||||||
| Neuberger Berman CLO XVIII Ltd., Series 2014-18A, Class CR2, (3 mo. LIBOR US + 3.00%), 3.19%, 10/21/30(a)(b) |
2,700 | 2,686,530 | ||||||
| Neuberger Berman CLO XXII Ltd.(a)(b) |
||||||||
| Series 2016-22A, Class BR, (3 mo. LIBOR US + 1.65%), 1.78%, 10/17/30 |
400 | 400,011 | ||||||
| Series 2016-22A, Class CR, (3 mo. LIBOR US + 2.20%), 2.33%, 10/17/30 |
1,000 | 1,000,142 | ||||||
| Neuberger Berman CLO XXIII Ltd., Series 2016-23A, Class CR, (3 mo. LIBOR US + 2.15%), 2.28%, 10/17/27(a)(b) |
500 | 500,056 | ||||||
| Neuberger Berman Loan Advisers CLO Ltd.(a)(b) |
||||||||
| Series 2017-26A, Class A, (3 mo. LIBOR US + 1.17%), 1.30%, 10/18/30 |
2,000 | 2,000,051 | ||||||
| Series 2017-26A, Class B, (3 mo. LIBOR US + 1.50%), 1.63%, 10/18/30 |
1,000 | 997,760 | ||||||
| Series 2017-26A, Class C, (3 mo. LIBOR US + 1.75%), 1.88%, 10/18/30 |
1,500 | 1,496,190 | ||||||
| Series 2018-27A, Class D, (3 mo. LIBOR US + 2.60%), 2.73%, 01/15/30 |
1,000 | 984,356 | ||||||
| OCP CLO Ltd.(a)(b) |
||||||||
| Series 2014-6A, Class BR, (3 mo. LIBOR US + 2.15%), 2.28%, 10/17/30 |
500 | 500,054 | ||||||
| Series 2015-10A, Class CR, (3 mo. LIBOR US + 2.60%), 2.78%, 10/26/27 |
600 | 599,994 | ||||||
| S C H E D U L E O F I N V E S T M E N T S |
89 |
| Schedule of Investments (unaudited) (continued) June 30, 2021 |
BlackRock Credit Allocation Income Trust (BTZ) (Percentages shown are based on Net Assets) |
| Security | Par (000) |
Value | ||||||
| Asset-Backed Securities (continued) |
| |||||||
| OCP CLO Ltd.(a)(b) (continued) |
||||||||
| Series 2016-11A, Class BR, (3 mo. LIBOR US + 2.45%), 2.63%, 10/26/30 |
$ | 1,500 | $ | 1,500,618 | ||||
| Series 2016-12A, Class BR, (3 mo. LIBOR US + 2.20%), 2.39%, 10/18/28 |
1,000 | 1,000,145 | ||||||
| Series 2017-14A, Class B, (3 mo. LIBOR US + 1.95%), 2.11%, 11/20/30 |
1,000 | 997,333 | ||||||
| Octagon Investment Partners 26 Ltd., Series 2016- 1A, Class DR, (3 mo. LIBOR US + 2.85%), 2.98%, 07/15/30(a)(b) |
500 | 495,598 | ||||||
| Octagon Investment Partners 34 Ltd., Series 2017- 1A, Class B1, (3 mo. LIBOR US + 1.40%), 1.59%, 01/20/30(a)(b) |
1,000 | 990,214 | ||||||
| Octagon Investment Partners Ltd., Series 2017-1A, Class C, (3 mo. LIBOR US + 2.75%), 2.94%, 01/20/31(a)(b) |
1,000 | 991,088 | ||||||
| Octagon Investment Partners XVII Ltd.(a)(b) |
||||||||
| Series 2013-1A, Class BR2, (3 mo. LIBOR US + 1.40%), 1.58%, 01/25/31 |
1,000 | 999,215 | ||||||
| Series 2013-1A, Class CR2, (3 mo. LIBOR US + 1.70%), 1.88%, 01/25/31 |
1,000 | 989,346 | ||||||
| Octagon Investment Partners XXII Ltd., Series 2014- 1A, Class CRR, (3 mo. LIBOR US + 1.90%), 2.08%, 01/22/30(a)(b) |
900 | 898,600 | ||||||
| OHA Credit Partners XII Ltd., Series 2015-12A, Class DR, (3 mo. LIBOR US + 2.90%), 3.07%, 07/23/30(a)(b) |
600 | 593,865 | ||||||
| OHA Loan Funding Ltd., Series 2015-1A, Class DR2, (3 mo. LIBOR US + 4.00%), 4.16%, 11/15/32(a)(b) |
1,000 | 1,004,350 | ||||||
| OZLM XXI Ltd., Series 2017-21A, Class B, (3 mo. LIBOR US + 1.90%), |
1,800 | 1,801,048 | ||||||
| Palmer Square CLO Ltd.(a)(b) |
||||||||
| Series 2018-1A, Class A2, (3 mo. LIBOR US + 1.45%), 1.64%, 04/18/31 |
1,500 | 1,492,670 | ||||||
| Series 2019-1A, Class C, (3 mo. LIBOR US + 3.75%), 3.90%, 11/14/32 |
1,000 | 1,005,020 | ||||||
| Park Avenue Institutional Advisers CLO Ltd., Series 2019-1A, Class C, (3 mo. LIBOR US + 3.85%), 4.01%, 05/15/32(a)(b) |
1,500 | 1,500,258 | ||||||
| Regatta VII Funding Ltd., Series 2016-1A, Class DR2, (3 mo. LIBOR US + 3.05%), 3.18%, 06/20/34(a)(b)(c) |
500 | 500,000 | ||||||
| Regatta XVI Funding Ltd.(a)(b) |
||||||||
| Series 2019-2A, Class C, (3 mo. LIBOR US + 2.70%), 2.83%, 01/15/33 |
1,000 | 1,004,036 | ||||||
| Series 2019-2A, Class D, (3 mo. LIBOR US + 3.90%), 4.03%, 01/15/33 |
1,000 | 1,005,919 | ||||||
| Rockford Tower CLO Ltd.(a)(b) |
||||||||
| Series 2017-3A, Class A, (3 mo. LIBOR US + 1.19%), 1.38%, 10/20/30 |
2,000 | 2,000,401 | ||||||
| Series 2017-3A, Class D, (3 mo. LIBOR US + 2.65%), 2.84%, 10/20/30 |
1,000 | 987,902 | ||||||
| RR Ltd., Series 2018-5A, Class C, (3 mo. LIBOR US + 3.10%), 3.23%, 10/15/31(a)(b) |
650 | 650,075 | ||||||
| Sound Point Clo XXI Ltd., Series 2018-3A, Class A1A, (3 mo. LIBOR US + 1.18%), 1.36%, 10/26/31(a)(b) |
1,400 | 1,400,001 | ||||||
| Stewart Park CLO Ltd., Series 2015-1A, Class DR, (3 mo. LIBOR US + 2.60%), 2.73%, 01/15/30(a)(b) |
1,500 | 1,495,570 | ||||||
| Security | Par (000) |
Value | ||||||
| Asset-Backed Securities (continued) |
| |||||||
| Tiaa CLO III Ltd., Series 2017-2A, Class A, (3 mo. LIBOR US + 1.15%), |
$ | 2,500 | $ | 2,499,997 | ||||
| TICP CLO IX Ltd., Series 2017-9A, Class A, (3 mo. LIBOR US + 1.14%), |
1,000 | 999,696 | ||||||
| York CLO Ltd.(a)(b) |
||||||||
| Series 2014-1A, Class ARR, (3 mo. LIBOR US + 1.12%), 1.30%, 10/22/29 |
2,000 | 2,000,985 | ||||||
| Series 2015-1A, Class CR, (3 mo. LIBOR US + 1.85%), 2.03%, 01/22/31 |
1,500 | 1,498,928 | ||||||
| Series 2015-1A, Class DR, (3 mo. LIBOR US + 2.60%), 2.78%, 01/22/31 |
1,800 | 1,767,932 | ||||||
|
|
|
|||||||
| Total Asset-Backed Securities — 5.8% |
|
84,470,193 | ||||||
|
|
|
|||||||
| Shares | ||||||||
| Common Stocks |
| |||||||
| Oil, Gas & Consumable Fuels — 0.1% | ||||||||
| Extraction Oil & Gas, Inc., (Acquired 03/05/21, Cost: $142,030)(d) |
11,417 | 624,296 | ||||||
| SM Energy Co. |
29,048 | 715,452 | ||||||
|
|
|
|||||||
| 1,339,748 | ||||||||
|
|
|
|||||||
| Total Common Stocks — 0.1% |
1,339,748 | |||||||
|
|
|
|||||||
| Par (000) |
||||||||
| Corporate Bonds |
||||||||
| Advertising Agencies — 0.2% | ||||||||
| Interpublic Group of Cos., Inc., 5.40%, 10/01/48 |
$ | 2,215 | 2,961,243 | |||||
|
|
|
|||||||
| Aerospace & Defense — 4.1% | ||||||||
| Boeing Co., 5.15%, 05/01/30(e) |
6,775 | 8,022,650 | ||||||
| Bombardier, Inc.(b) |
||||||||
| 8.75%, 12/01/21 |
1,794 | 1,854,099 | ||||||
| 6.00%, 10/15/22(e) |
3 | 3,004 | ||||||
| 6.13%, 01/15/23 |
1,425 | 1,500,703 | ||||||
| 7.50%, 12/01/24 |
442 | 461,890 | ||||||
| 7.50%, 03/15/25 |
114 | 117,232 | ||||||
| 7.13%, 06/15/26 |
1,322 | 1,384,134 | ||||||
| 7.88%, 04/15/27(f) |
825 | 855,938 | ||||||
| 7.45%, 05/01/34 |
137 | 146,590 | ||||||
| F-Brasile SpA/F-Brasile US LLC, Series XR, 7.38%, 08/15/26(b) |
516 | 531,480 | ||||||
| General Dynamics Corp., 4.25%, 04/01/50 |
1,260 | 1,617,112 | ||||||
| General Electric Co., 3.63%, 05/01/30 |
2,340 | 2,609,285 | ||||||
| Howmet Aerospace, Inc., 5.13%, 10/01/24 |
45 | 49,669 | ||||||
| Kratos Defense & Security Solutions, Inc., 6.50%, 11/30/25(b) |
1,010 | 1,056,712 | ||||||
| Lockheed Martin Corp., 2.80%, 06/15/50 |
1,965 | 1,973,110 | ||||||
| Moog, Inc., 4.25%, 12/15/27(b) |
320 | 331,200 | ||||||
| Northrop Grumman Corp. |
||||||||
| 4.03%, 10/15/47 |
2,400 | 2,863,402 | ||||||
| 5.25%, 05/01/50 |
3,050 | 4,283,633 | ||||||
| Raytheon Technologies Corp. |
||||||||
| 4.63%, 11/16/48 |
2,805 | 3,608,549 | ||||||
| 90 | 2 0 2 1 B L A C K R O C K S E M I - A N N U A L R E P O R T T O S H A R E H O L D E R S |
| Schedule of Investments (unaudited) (continued) June 30, 2021 |
BlackRock Credit Allocation Income Trust (BTZ) (Percentages shown are based on Net Assets) |
| Security | Par (000) |
Value | ||||||
| Aerospace & Defense (continued) | ||||||||
| Raytheon Technologies Corp. (continued) |
||||||||
| 3.13%, 07/01/50(f) |
$ | 3,545 | $ | 3,639,582 | ||||
| Rolls-Royce PLC, 5.75%, 10/15/27(b) |
1,533 | 1,688,584 | ||||||
| TransDigm, Inc. |
||||||||
| 8.00%, 12/15/25(b) |
1,596 | 1,724,478 | ||||||
| 6.25%, 03/15/26(b)(f) |
15,876 | 16,749,180 | ||||||
| 6.38%, 06/15/26 |
16 | 16,576 | ||||||
| 7.50%, 03/15/27 |
432 | 459,540 | ||||||
| 4.63%, 01/15/29(b) |
516 | 516,181 | ||||||
| 4.88%, 05/01/29(b) |
622 | 627,909 | ||||||
| Triumph Group, Inc., 8.88%, 06/01/24(b) |
1,706 | 1,897,925 | ||||||
|
|
|
|||||||
| 60,590,347 | ||||||||
| Airlines — 1.7% | ||||||||
| American Airlines Group, Inc., 5.18%, 08/15/23(a)(c) |
1,584 | 1,558,620 | ||||||
| American Airlines, Inc., 11.75%, 07/15/25(b) |
775 | 972,625 | ||||||
| American Airlines, Inc./AAdvantage Loyalty IP Ltd.(b) |
||||||||
| 5.50%, 04/20/26 |
1,078 | 1,141,332 | ||||||
| 5.75%, 04/20/29 |
1,943 | 2,101,056 | ||||||
| British Airways Pass Through Trust, Series 2020-1, Class A, 4.25%, 11/15/32(b) |
1,920 | 2,066,550 | ||||||
| Delta Air Lines, Inc., 7.00%, 05/01/25(b) |
174 | 203,056 | ||||||
| Hawaiian Brand Intellectual Property Ltd./HawaiianMiles Loyalty Ltd., 5.75%, 01/20/26(b) |
531 | 570,087 | ||||||
| Mileage Plus Holdings LLC/Mileage Plus Intellectual Property Assets Ltd., 6.50%, 06/20/27(b) |
2,480 | 2,730,480 | ||||||
| Turkish Airlines Pass-Through Trust, Series 2015-1, Class A, 4.20%, 03/15/27(b) |
1,973 | 1,840,089 | ||||||
| United Airlines Pass-Through Trust |
||||||||
| Series 2020-1, Class A, 5.88%, 10/15/27(e) |
6,461 | 7,168,733 | ||||||
| Series B, 4.75%, 04/11/22(f) |
1,915 | 1,946,599 | ||||||
| United Airlines, Inc.(b) |
||||||||
| 4.38%, 04/15/26 |
1,022 | 1,057,954 | ||||||
| 4.63%, 04/15/29 |
863 | 893,205 | ||||||
|
|
|
|||||||
| 24,250,386 | ||||||||
| Auto Components — 1.2% | ||||||||
| BorgWarner, Inc., 2.65%, 07/01/27 |
2,710 | 2,874,113 | ||||||
| Clarios Global LP, 6.75%, 05/15/25(b) |
497 | 529,295 | ||||||
| Clarios Global LP/Clarios US Finance Co.(b) |
||||||||
| 6.25%, 05/15/26(f) |
4,801 | 5,114,553 | ||||||
| 8.50%, 05/15/27(e) |
6,515 | 7,102,653 | ||||||
| Goodyear Tire & Rubber Co. |
||||||||
| 5.00%, 07/15/29(b) |
270 | 282,690 | ||||||
| 5.25%, 07/15/31(b) |
797 | 832,865 | ||||||
| 5.63%, 04/30/33 |
663 | 699,266 | ||||||
|
|
|
|||||||
| 17,435,435 | ||||||||
| Automobiles — 2.9% | ||||||||
| Allison Transmission, Inc.(b) |
||||||||
| 5.88%, 06/01/29 |
855 | 936,225 | ||||||
| 3.75%, 01/30/31 |
723 | 710,615 | ||||||
| Asbury Automotive Group, Inc. |
||||||||
| 4.50%, 03/01/28 |
197 | 202,418 | ||||||
| 4.75%, 03/01/30 |
191 | 199,595 | ||||||
| Carvana Co., 5.50%, 04/15/27(b) |
602 | 621,703 | ||||||
| Ford Motor Co., 7.45%, 07/16/31(f) |
3,660 | 4,812,900 | ||||||
| Ford Motor Credit Co. LLC |
||||||||
| 5.88%, 08/02/21(f) |
9,420 | 9,468,042 | ||||||
| 4.69%, 06/09/25 |
200 | 216,500 | ||||||
| 5.13%, 06/16/25 |
1,070 | 1,178,338 | ||||||
| Security | Par (000) |
Value | ||||||
| Automobiles (continued) | ||||||||
| Ford Motor Credit Co. LLC (continued) |
||||||||
| 3.38%, 11/13/25 |
$ | 207 | $ | 214,649 | ||||
| 2.90%, 02/16/28 |
627 | 624,028 | ||||||
| 4.00%, 11/13/30 |
200 | 209,500 | ||||||
| General Motors Co. |
||||||||
| 4.88%, 10/02/23 |
1,875 | 2,042,691 | ||||||
| 6.25%, 10/02/43 |
940 | 1,297,663 | ||||||
| 5.95%, 04/01/49(f) |
3,455 | 4,703,236 | ||||||
| General Motors Financial Co., Inc. |
||||||||
| 4.25%, 05/15/23 |
931 | 989,469 | ||||||
| 2.75%, 06/20/25(f) |
4,235 | 4,458,986 | ||||||
| Group 1 Automotive, Inc., 4.00%, 08/15/28(b) |
78 | 79,365 | ||||||
| LCM Investments Holdings II LLC, 4.88%, 05/01/29(b) |
456 | 467,400 | ||||||
| Lithia Motors, Inc., 3.88%, 06/01/29(b) |
269 | 278,832 | ||||||
| Nissan Motor Co. Ltd., 4.81%, 09/17/30(b)(f) |
7,125 | 8,044,411 | ||||||
| Penske Automotive Group, Inc. |
||||||||
| 3.50%, 09/01/25 |
441 | 456,788 | ||||||
| 3.75%, 06/15/29 |
141 | 141,880 | ||||||
| Tesla, Inc., 5.30%, 08/15/25(b) |
785 | 811,407 | ||||||
|
|
|
|||||||
| 43,166,641 | ||||||||
| Banks — 3.0% | ||||||||
| Australia & New Zealand Banking Group Ltd., (5 year CMT + 1.70%), 2.57%, 11/25/35(a)(b)(f) |
5,445 | 5,289,164 | ||||||
| CIT Group, Inc., 5.00%, 08/01/23 |
286 | 309,238 | ||||||
| Credit Suisse AG, 6.50%, 08/08/23(b)(f) |
6,000 | 6,627,840 | ||||||
| Fifth Third Bancorp, Series H, (3 mo. LIBOR |
5,000 | 5,187,500 | ||||||
| Intesa Sanpaolo SpA(b) |
||||||||
| 5.71%, 01/15/26(f) |
9,840 | 11,130,371 | ||||||
| 4.95%, 06/01/42 |
3,045 | 3,153,171 | ||||||
| Santander Holdings USA, Inc., 4.40%, 07/13/27 |
830 | 932,761 | ||||||
| Truist Financial Corp., Series L, (3 mo. LIBOR US + 3.10%), 5.05%(a)(g) |
5,270 | 5,441,275 | ||||||
| Wells Fargo & Co., 5.61%, 01/15/44(f) |
4,119 | 5,629,126 | ||||||
|
|
|
|||||||
| 43,700,446 | ||||||||
| Beverages — 2.3% | ||||||||
| Anheuser-Busch Cos. LLC/Anheuser-Busch InBev Worldwide, Inc., 4.90%, 02/01/46(f) |
6,170 | 7,809,678 | ||||||
| Anheuser-Busch InBev Worldwide, Inc., 5.55%, 01/23/49(f) |
5,000 | 6,874,205 | ||||||
| ARD Finance SA, (6.50% Cash or 7.25% PIK), 6.50%, 06/30/27(b)(h) |
3,048 | 3,200,400 | ||||||
| Ardagh Metal Packaging Finance USA LLC/Ardagh Metal Packaging Finance PLC, 4.00%, 09/01/29(b) |
2,074 | 2,056,527 | ||||||
| Ardagh Packaging Finance PLC/Ardagh Holdings USA, Inc.(b) |
||||||||
| 4.13%, 08/15/26 |
1,315 | 1,357,737 | ||||||
| 5.25%, 08/15/27 |
1,662 | 1,695,240 | ||||||
| Ball Corp., 5.25%, 07/01/25 |
30 | 33,862 | ||||||
| Canpack SA/Eastern PA Land Investment Holding LLC, 3.13%, 11/01/25(b) |
228 | 231,748 | ||||||
| Crown Cork & Seal Co., Inc., 7.38%, 12/15/26 |
151 | 184,975 | ||||||
| Keurig Dr. Pepper, Inc., 4.60%, 05/25/28(f) |
3,215 | 3,774,733 | ||||||
| Trivium Packaging Finance BV(b)(f) |
||||||||
| 5.50%, 08/15/26 |
2,830 | 2,973,481 | ||||||
| 8.50%, 08/15/27 |
3,036 | 3,300,739 | ||||||
|
|
|
|||||||
| 33,493,325 | ||||||||
| Biotechnology — 0.5% | ||||||||
| Baxalta, Inc., 5.25%, 06/23/45(f) |
6,000 | 7,947,974 | ||||||
|
|
|
|||||||
| S C H E D U L E O F I N V E S T M E N T S |
91 |
| Schedule of Investments (unaudited) (continued) June 30, 2021 |
BlackRock Credit Allocation Income Trust (BTZ) (Percentages shown are based on Net Assets) |
| Security | Par (000) |
Value | ||||||
| Building Materials(b) — 0.4% | ||||||||
| CP Atlas Buyer, Inc., 7.00%, 12/01/28 |
$ | 361 | $ | 374,086 | ||||
| Forterra Finance LLC/FRTA Finance Corp., 6.50%, 07/15/25 |
783 | 843,683 | ||||||
| Jeld-Wen, Inc. |
||||||||
| 4.63%, 12/15/25 |
96 | 97,801 | ||||||
| 4.88%, 12/15/27 |
74 | 76,902 | ||||||
| Masonite International Corp. |
||||||||
| 5.75%, 09/15/26 |
282 | 291,870 | ||||||
| 5.38%, 02/01/28 |
206 | 218,294 | ||||||
| SRM Escrow Issuer LLC, 6.00%, 11/01/28 |
1,169 | 1,239,140 | ||||||
| Standard Industries, Inc. |
||||||||
| 5.00%, 02/15/27 |
303 | 313,794 | ||||||
| 4.38%, 07/15/30 |
906 | 934,312 | ||||||
| 3.38%, 01/15/31 |
390 | 373,312 | ||||||
| Summit Materials LLC/Summit Materials Finance Corp., 5.25%, 01/15/29 |
386 | 410,098 | ||||||
| Victors Merger Corp., 6.38%, 05/15/29 |
407 | 410,053 | ||||||
|
|
|
|||||||
| 5,583,345 | ||||||||
| Building Products(b) — 0.2% | ||||||||
| LBM Acquisition LLC, 6.25%, 01/15/29 |
705 | 710,428 | ||||||
| Specialty Building Products Holdings LLC/SBP Finance Corp., 6.38%, 09/30/26 |
431 | 451,350 | ||||||
| SRS Distribution, Inc., 6.13%, 07/01/29 |
805 | 828,434 | ||||||
| White Cap Buyer LLC, 6.88%, 10/15/28 |
1,172 | 1,254,333 | ||||||
|
|
|
|||||||
| 3,244,545 | ||||||||
| Capital Markets — 1.1% | ||||||||
| Blackstone CQP Holdco LP, 5.50%, 05/24/31 |
757 | 788,787 | ||||||
| Charles Schwab Corp., Series H, (10 year CMT + 3.08%), 4.00%(a)(e)(g) |
5,215 | 5,334,945 | ||||||
| Compass Group Diversified Holdings LLC, 5.25%, 04/15/29(b) |
532 | 553,280 | ||||||
| Icahn Enterprises LP/Icahn Enterprises Finance Corp. |
||||||||
| 4.75%, 09/15/24 |
520 | 543,400 | ||||||
| 6.25%, 05/15/26 |
782 | 829,702 | ||||||
| 5.25%, 05/15/27 |
1,995 | 2,059,828 | ||||||
| 4.38%, 02/01/29(b) |
435 | 432,825 | ||||||
| Jefferies Financial Group, Inc., 5.50%, 10/18/23(f) |
4,000 | 4,302,350 | ||||||
| NFP Corp., 6.88%, 08/15/28(b) |
589 | 620,046 | ||||||
| RP Escrow Issuer LLC, 5.25%, 12/15/25(b) |
340 | 354,875 | ||||||
| State Street Corp., (SOFR + 2.65%), 3.15%, 03/30/31(a) |
840 | 918,171 | ||||||
|
|
|
|||||||
| 16,738,209 | ||||||||
| Chemicals — 2.4% | ||||||||
| Axalta Coating Systems
LLC, |
760 | 742,900 | ||||||
| Axalta Coating Systems LLC/Axalta Coating Systems Dutch Holding B BV, 4.75%, 06/15/27(b) |
372 | 389,670 | ||||||
| DuPont de Nemours, Inc., 5.42%, 11/15/48(f) |
7,500 | 10,413,387 | ||||||
| Element Solutions, Inc., 3.88%, 09/01/28(b) |
2,810 | 2,867,043 | ||||||
| GCP Applied Technologies, Inc., 5.50%, 04/15/26(b) |
299 | 307,536 | ||||||
| Herens Holdco Sarl, 4.75%, 05/15/28(b) |
290 | 288,550 | ||||||
| Illuminate Buyer LLC/Illuminate Holdings IV, Inc., 9.00%, 07/01/28(b) |
203 | 226,349 | ||||||
| Ingevity Corp., 3.88%, 11/01/28(b) |
100 | 99,250 | ||||||
| International Flavors & Fragrances, Inc., 3.47%, 12/01/50(b) |
4,765 | 4,953,028 | ||||||
| LYB Finance Co. BV, 8.10%, 03/15/27(b)(f) |
6,000 | 7,986,157 | ||||||
| NOVA Chemicals Corp., 4.88%, 06/01/24(b) |
240 | 253,200 | ||||||
| SCIH Salt Holdings,
Inc.(b) |
660 | 659,921 | ||||||
| Security | Par (000) |
Value | ||||||
| Chemicals (continued) | ||||||||
| SCIH Salt Holdings, Inc.(b) (continued) |
||||||||
| 6.63%, 05/01/29 |
$ | 371 | $ | 371,928 | ||||
| Scotts Miracle-Gro Co., 4.00%, 04/01/31(b) |
547 | 545,293 | ||||||
| Valvoline, Inc., 3.63%, 06/15/31(b) |
3 | 3,000 | ||||||
| WESCO Distribution, Inc.(b) |
||||||||
| 7.13%, 06/15/25 |
1,485 | 1,604,840 | ||||||
| 7.25%, 06/15/28 |
1,354 | 1,508,153 | ||||||
| WR Grace & Co-Conn, 5.63%, 10/01/24(b) |
1,493 | 1,650,317 | ||||||
|
|
|
|||||||
| 34,870,522 | ||||||||
| Commercial Services & Supplies — 0.8% | ||||||||
| ADT Security Corp. |
||||||||
| 4.13%, 06/15/23 |
174 | 183,135 | ||||||
| 4.88%, 07/15/32(b) |
1,061 | 1,118,018 | ||||||
| AerCap Global Aviation Trust, (3 mo. LIBOR |
5,000 | 5,337,500 | ||||||
| ASGN, Inc., 4.63%, 05/15/28(b) |
230 | 240,918 | ||||||
| Avis Budget Car Rental LLC/Avis Budget Finance, Inc., 5.38%, 03/01/29(b) |
223 | 232,199 | ||||||
| Fortress Transportation & Infrastructure Investors LLC(b) |
||||||||
| 6.50%, 10/01/25 |
163 | 169,316 | ||||||
| 5.50%, 05/01/28 |
645 | 671,606 | ||||||
| Herc Holdings, Inc., 5.50%, 07/15/27(b) |
796 | 839,159 | ||||||
| Metis Merger Sub LLC, 6.50%, 05/15/29(b) |
443 | 436,289 | ||||||
| NESCO Holdings II, Inc., 5.50%, 04/15/29(b) |
635 | 662,781 | ||||||
| Prime Security Services Borrower LLC/Prime Finance, Inc.(b) |
||||||||
| 5.75%, 04/15/26 |
252 | 278,377 | ||||||
| 3.38%, 08/31/27 |
261 | 253,170 | ||||||
| 6.25%, 01/15/28 |
626 | 665,908 | ||||||
| United Rentals North America, Inc. |
||||||||
| 4.88%, 01/15/28 |
777 | 824,008 | ||||||
| 5.25%, 01/15/30 |
44 | 48,197 | ||||||
|
|
|
|||||||
| 11,960,581 | ||||||||
| Communications Equipment — 0.6% | ||||||||
| Avaya, Inc., 6.13%, 09/15/28(b) |
1,396 | 1,494,139 | ||||||
| CommScope Technologies LLC(b) |
||||||||
| 6.00%, 06/15/25 |
646 | 659,728 | ||||||
| 5.00%, 03/15/27 |
1,035 | 1,059,581 | ||||||
| CommScope, Inc.(b) |
||||||||
| 5.50%, 03/01/24 |
1,114 | 1,146,027 | ||||||
| 6.00%, 03/01/26 |
591 | 623,919 | ||||||
| 8.25%, 03/01/27 |
69 | 73,747 | ||||||
| 7.13%, 07/01/28 |
690 | 747,787 | ||||||
| Nokia OYJ, 6.63%, 05/15/39 |
324 | 419,580 | ||||||
| ViaSat, Inc.(b) |
||||||||
| 5.63%, 04/15/27 |
1,208 | 1,260,947 | ||||||
| 6.50%, 07/15/28 |
1,296 | 1,382,132 | ||||||
|
|
|
|||||||
| 8,867,587 | ||||||||
| Construction & Engineering — 0.1% | ||||||||
| SRS Distribution, Inc., 4.63%, 07/01/28(b) |
897 | 917,183 | ||||||
|
|
|
|||||||
| Construction Materials(b) — 0.5% | ||||||||
| American Builders & Contractors Supply Co., Inc., 4.00%, 01/15/28 |
764 | 782,878 | ||||||
| BCPE Empire Holdings, Inc., 7.63%, 05/01/27 |
225 | 230,422 | ||||||
| Core & Main LP, 6.13%, 08/15/25 |
2,671 | 2,724,420 | ||||||
| H&E Equipment Services, Inc., 3.88%, 12/15/28 |
280 | 275,520 | ||||||
| IAA, Inc., 5.50%, 06/15/27 |
1,054 | 1,106,405 | ||||||
| Picasso Finance Sub, Inc., 6.13%, 06/15/25 |
823 | 870,117 | ||||||
| 92 | 2 0 2 1 B L A C K R O C K S E M I - A N N U A L R E P O R T T O S H A R E H O L D E R S |
| Schedule of Investments (unaudited) (continued) June 30, 2021 |
BlackRock Credit Allocation Income Trust (BTZ) (Percentages shown are based on Net Assets) |
| Security | Par (000) |
Value | ||||||
| Construction Materials (continued) | ||||||||
| Williams Scotsman International, Inc., 4.63%, 08/15/28 |
$ | 541 | $ | 558,691 | ||||
| Wolverine Escrow LLC |
||||||||
| 8.50%, 11/15/24 |
430 | 417,100 | ||||||
| 9.00%, 11/15/26 |
246 | 239,850 | ||||||
|
|
|
|||||||
| 7,205,403 | ||||||||
| Consumer Discretionary(b) — 0.7% | ||||||||
| Carnival Corp. |
||||||||
| 10.50%, 02/01/26 |
1,404 | 1,634,607 | ||||||
| 5.75%, 03/01/27 |
2,836 | 2,970,710 | ||||||
| 9.88%, 08/01/27 |
680 | 793,900 | ||||||
| CoreLogic, Inc., 4.50%, 05/01/28 |
883 | 875,274 | ||||||
| NCL Finance Ltd., 6.13%, 03/15/28 |
1,259 | 1,319,369 | ||||||
| Nielsen Finance LLC/Nielsen Finance Co. |
||||||||
| 5.63%, 10/01/28 |
768 | 811,077 | ||||||
| 5.88%, 10/01/30 |
444 | 483,260 | ||||||
| 4.75%, 07/15/31 |
343 | 343,857 | ||||||
| Royal Caribbean Cruises Ltd., 5.50%, 04/01/28 |
1,289 | 1,349,970 | ||||||
| Viking Ocean Cruises Ship VII Ltd., 5.63%, 02/15/29 |
385 | 388,850 | ||||||
|
|
|
|||||||
| 10,970,874 | ||||||||
| Consumer Finance — 1.1% | ||||||||
| Global Payments, Inc., 2.90%, 05/15/30(f) |
4,715 | 4,912,395 | ||||||
| MPH Acquisition Holdings LLC, 5.75%, 11/01/28(b) |
1,235 | 1,241,064 | ||||||
| Navient Corp. |
||||||||
| 7.25%, 09/25/23 |
498 | 549,668 | ||||||
| 6.13%, 03/25/24 |
59 | 63,676 | ||||||
| 5.00%, 03/15/27 |
329 | 340,433 | ||||||
| OneMain Finance Corp. |
||||||||
| 7.13%, 03/15/26 |
1,231 | 1,433,758 | ||||||
| 3.50%, 01/15/27 |
627 | 631,702 | ||||||
| 6.63%, 01/15/28 |
506 | 580,058 | ||||||
| 5.38%, 11/15/29 |
26 | 28,281 | ||||||
| Sabre GLBL, Inc., 9.25%, 04/15/25(b) |
697 | 828,615 | ||||||
| Shift4 Payments LLC/Shift4 Payments Finance Sub, Inc., 4.63%, 11/01/26(b) |
362 | 377,838 | ||||||
| Square, Inc., 3.50%, 06/01/31(b) |
1,282 | 1,293,217 | ||||||
| Verscend Escrow Corp., 9.75%, 08/15/26(b) |
3,791 | 3,994,766 | ||||||
|
|
|
|||||||
| 16,275,471 | ||||||||
| Containers & Packaging — 1.7% | ||||||||
| Crown Americas LLC/Crown Americas Capital Corp. V, 4.25%, 09/30/26 |
224 | 240,240 | ||||||
| Crown Americas LLC/Crown Americas Capital Corp. VI, 4.75%, 02/01/26 |
355 | 368,383 | ||||||
| Graphic Packaging International LLC, 3.50%, 03/01/29(b) |
264 | 261,545 | ||||||
| Intelligent Packaging Ltd. Finco, Inc./Intelligent Packaging Ltd. Co-Issuer LLC, 6.00%, 09/15/28(b) |
64 | 66,560 | ||||||
| International Paper Co.(f) |
||||||||
| 8.70%, 06/15/38 |
4,000 | 6,672,614 | ||||||
| 7.30%, 11/15/39 |
10,000 | 15,468,137 | ||||||
| LABL Escrow Issuer LLC(b) |
||||||||
| 6.75%, 07/15/26 |
742 | 791,514 | ||||||
| 10.50%, 07/15/27 |
311 | 342,878 | ||||||
| Security | Par (000) |
Value | ||||||
| Containers & Packaging (continued) | ||||||||
| Sealed Air Corp.(b) |
||||||||
| 4.00%, 12/01/27 |
$ | 109 | $ | 115,949 | ||||
| 6.88%, 07/15/33 |
182 | 230,215 | ||||||
|
|
|
|||||||
| 24,558,035 | ||||||||
| Diversified Consumer Services — 1.2% | ||||||||
| Allied Universal Holdco LLC/Allied Universal Finance Corp.(b) |
||||||||
| 6.63%, 07/15/26(f) |
5,419 | 5,745,386 | ||||||
| 9.75%, 07/15/27(f) |
1,642 | 1,808,252 | ||||||
| 6.00%, 06/01/29 |
1,313 | 1,331,106 | ||||||
| Allied Universal Holdco LLC/Allied Universal Finance Corp./Atlas Luxco 4 Sarl, 4.63%, 06/01/28 |
2,649 | 2,653,975 | ||||||
| Ascend Learning LLC, 6.88%, 08/01/25 |
1,611 | 1,639,163 | ||||||
| Bidfair Holdings, Inc., 5.88%, 06/01/29(b) |
200 | 203,000 | ||||||
| Clarivate Science Holdings Corp.(b) |
||||||||
| 3.88%, 06/30/28 |
777 | 784,078 | ||||||
| 4.88%, 06/30/29 |
1,068 | 1,096,035 | ||||||
| Garda World Security
Corp., |
413 | 457,398 | ||||||
| Service Corp. International |
||||||||
| 5.13%, 06/01/29 |
468 | 507,780 | ||||||
| 3.38%, 08/15/30 |
585 | 573,183 | ||||||
| 4.00%, 05/15/31 |
744 | 759,382 | ||||||
|
|
|
|||||||
| 17,558,738 | ||||||||
| Diversified Financial Services — 5.2% | ||||||||
| Barclays PLC |
||||||||
| 4.84%, 05/09/28(f) |
4,000 | 4,496,738 | ||||||
| (3 mo. LIBOR US +
1.90%), |
3,220 | 3,770,544 | ||||||
| BNP Paribas SA, (5 year CMT + 3.34%), 4.63%(a)(b)(g) |
13,999 | 14,573,239 | ||||||
| Citigroup, Inc., 6.68%, 09/13/43(f) |
4,125 | 6,333,168 | ||||||
| Credit Suisse Group AG, (5 year USD Swap + 4.60%), 7.50%(a)(b)(g) |
3,250 | 3,605,355 | ||||||
| Deutsche Bank AG, (SOFR + 1.87%), 2.13%, 11/24/26(a) |
3,260 | 3,307,945 | ||||||
| Doric Nimrod Air Alpha Pass-Through Trust, Series 2013-1, Class A, 5.25%, 05/30/23(b) |
738 | 741,126 | ||||||
| Global Aircraft Leasing Co. Ltd., (6.50% Cash or 7.25% PIK), 6.50%, 09/15/24(b)(h) |
326 | 328,071 | ||||||
| Ladder Capital Finance Holdings LLLP/Ladder Capital Finance Corp.(b) |
||||||||
| 5.25%, 03/15/22 |
480 | 482,400 | ||||||
| 4.25%, 02/01/27 |
178 | 177,748 | ||||||
| Lloyds Banking Group PLC, 4.65%, 03/24/26(f) |
8,650 | 9,792,355 | ||||||
| Natwest Group PLC |
||||||||
| 6.10%, 06/10/23 |
2,500 | 2,739,420 | ||||||
| 6.00%, 12/19/23(f) |
10,080 | 11,306,099 | ||||||
| 5.13%, 05/28/24(f) |
5,250 | 5,830,239 | ||||||
| Spectrum Brands, Inc. |
||||||||
| 5.75%, 07/15/25 |
1,002 | 1,026,800 | ||||||
| 5.00%, 10/01/29(b) |
72 | 76,320 | ||||||
| UniCredit SPA, (5 year CMT + 4.75%), 5.46%, 06/30/35(a)(b) |
6,135 | 6,689,246 | ||||||
| WASH Multifamily Acquisition, Inc., 5.75%, 04/15/26(b) |
314 | 327,848 | ||||||
|
|
|
|||||||
| 75,604,661 | ||||||||
| S C H E D U L E O F I N V E S T M E N T S |
93 |
| Schedule of Investments (unaudited) (continued) June 30, 2021 |
BlackRock Credit Allocation Income Trust (BTZ) (Percentages shown are based on Net Assets) |
| Security | Par (000) |
Value | ||||||
| Diversified Telecommunication Services — 6.7% | ||||||||
| AT&T, Inc. |
||||||||
| 4.65%, 06/01/44 |
$ | 28 | $ | 32,982 | ||||
| 4.35%, 06/15/45 |
95 | 108,995 | ||||||
| 3.50%, 09/15/53(b)(f) |
15,960 | 16,034,542 | ||||||
| 3.55%, 09/15/55(b) |
727 | 729,438 | ||||||
| Cincinnati Bell, Inc.(b) |
||||||||
| 7.00%, 07/15/24 |
222 | 227,828 | ||||||
| 8.00%, 10/15/25 |
132 | 138,765 | ||||||
| Consolidated Communications, Inc., 6.50%, 10/01/28(b) |
1,313 | 1,412,460 | ||||||
| Intelsat Jackson Holdings SA, 8.00%, 02/15/24(b) |
1,040 | 1,074,081 | ||||||
| Level 3 Financing, Inc. |
||||||||
| 5.38%, 05/01/25 |
614 | 627,048 | ||||||
| 4.63%, 09/15/27(b) |
1,065 | 1,105,385 | ||||||
| 3.75%, 07/15/29(b) |
460 | 447,350 | ||||||
| Lumen Technologies, Inc. |
||||||||
| 5.63%, 04/01/25(f) |
1,909 | 2,071,265 | ||||||
| 5.13%, 12/15/26(b) |
1,317 | 1,368,034 | ||||||
| 4.00%, 02/15/27(b) |
890 | 907,800 | ||||||
| 4.50%, 01/15/29(b) |
1,022 | 997,421 | ||||||
| 5.38%, 06/15/29(b) |
917 | 930,191 | ||||||
| Series P, 7.60%, 09/15/39 |
112 | 127,400 | ||||||
| Series U, 7.65%, 03/15/42 |
494 | 554,515 | ||||||
| Series Y, 7.50%, 04/01/24(f) |
564 | 633,090 | ||||||
| Sprint Capital Corp. |
||||||||
| 6.88%, 11/15/28 |
2,765 | 3,546,112 | ||||||
| 8.75%, 03/15/32 |
1,764 | 2,681,280 | ||||||
| Switch Ltd.(b) |
||||||||
| 3.75%, 09/15/28 |
821 | 831,262 | ||||||
| 4.13%, 06/15/29 |
42 | 43,103 | ||||||
| Telecom Italia Capital SA |
||||||||
| 6.38%, 11/15/33 |
442 | 527,085 | ||||||
| 6.00%, 09/30/34 |
818 | 943,767 | ||||||
| 7.20%, 07/18/36 |
186 | 239,940 | ||||||
| 7.72%, 06/04/38 |
319 | 434,883 | ||||||
| Telecom Italia SpA, 5.30%, 05/30/24(b) |
1,662 | 1,819,391 | ||||||
| Telefonica Emisiones SAU, 5.21%, 03/08/47 |
5,000 | 6,241,373 | ||||||
| Uniti Group LP/Uniti Group Finance, Inc./CSL Capital LLC, 4.75%, 04/15/28(b) |
729 | 727,177 | ||||||
| Verizon Communications, Inc.(f) |
||||||||
| 6.40%, 09/15/33 |
9,475 | 13,058,654 | ||||||
| 6.55%, 09/15/43 |
13,225 | 21,137,695 | ||||||
| 5.01%, 04/15/49 |
6,998 | 9,243,550 | ||||||
| Zayo Group Holdings, Inc.(b) |
||||||||
| 4.00%, 03/01/27 |
5,098 | 5,062,926 | ||||||
| 6.13%, 03/01/28 |
2,586 | 2,640,952 | ||||||
|
|
|
|||||||
| 98,707,740 | ||||||||
| Electric Utilities — 4.1% | ||||||||
| Edison International, (5 year CMT + 4.70%), 5.38%(a)(g) |
6,851 | 6,901,012 | ||||||
| Emera, Inc., Series 16-A, (3 mo. LIBOR US + 5.44%), 6.75%, 06/15/76(a) |
7,500 | 8,784,375 | ||||||
| FirstEnergy Corp. |
||||||||
| 2.65%, 03/01/30 |
55 | 54,778 | ||||||
| Series B, 4.40%, 07/15/27 |
376 | 408,900 | ||||||
| Series B, 2.25%, 09/01/30 |
46 | 44,106 | ||||||
| Series C, 7.38%, 11/15/31 |
688 | 942,223 | ||||||
| Series C, 5.35%, 07/15/47 |
1,110 | 1,332,000 | ||||||
| Series C, 3.40%, 03/01/50 |
74 | 72,335 | ||||||
| Security | Par (000) |
Value | ||||||
| Electric Utilities (continued) | ||||||||
| FirstEnergy Transmission LLC, 5.45%, 07/15/44(b) |
$ | 849 | $ | 1,059,345 | ||||
| NextEra Energy Capital Holdings, Inc., (3 mo. LIBOR US + 2.41%), 4.80%, 12/01/77(a) |
5,000 | 5,619,131 | ||||||
| NextEra Energy Operating Partners LP(b) |
||||||||
| 4.25%, 07/15/24 |
712 | 751,160 | ||||||
| 4.25%, 09/15/24 |
26 | 27,430 | ||||||
| Oncor Electric Delivery Co. LLC, 5.30%, 06/01/42 |
2,750 | 3,791,002 | ||||||
| Pacific Gas and Electric Co., 4.20%, 06/01/41 |
2,310 | 2,275,866 | ||||||
| PG&E Corp., 5.25%, 07/01/30 |
563 | 568,349 | ||||||
| Pike Corp., 5.50%, 09/01/28(b) |
374 | 388,960 | ||||||
| Progress Energy, Inc., 7.00%, 10/30/31(f) |
12,000 | 16,652,826 | ||||||
| Puget Energy, Inc. |
||||||||
| 6.00%, 09/01/21 |
275 | 277,621 | ||||||
| 5.63%, 07/15/22(f) |
5,550 | 5,772,353 | ||||||
| Sempra Energy, (5 year CMT +
4.55%), |
4,375 | 4,746,875 | ||||||
|
|
|
|||||||
| 60,470,647 | ||||||||
| Electrical Equipment(b) — 0.1% | ||||||||
| Gates Global LLC/Gates Corp., 6.25%, 01/15/26 |
714 | 747,926 | ||||||
| GrafTech Finance, Inc., 4.63%, 12/15/28 |
296 | 303,770 | ||||||
|
|
|
|||||||
| 1,051,696 | ||||||||
| Electronic Equipment, Instruments & Components — 0.3% | ||||||||
| BWX Technologies, Inc.(b) |
||||||||
| 5.38%, 07/15/26 |
737 | 756,494 | ||||||
| 4.13%, 04/15/29 |
120 | 122,100 | ||||||
| CDW LLC/CDW Finance Corp. |
||||||||
| 4.13%, 05/01/25 |
371 | 387,695 | ||||||
| 3.25%, 02/15/29 |
715 | 724,438 | ||||||
| Energizer Holdings, Inc.(b) |
||||||||
| 4.75%, 06/15/28 |
450 | 461,137 | ||||||
| 4.38%, 03/31/29 |
41 | 41,042 | ||||||
| Imola Merger Corp., 4.75%, 05/15/29(b) |
1,337 | 1,375,439 | ||||||
|
|
|
|||||||
| 3,868,345 | ||||||||
| Energy Equipment & Services — 0.3% | ||||||||
| Archrock Partners LP/Archrock Partners Finance Corp.(b) |
||||||||
| 6.88%, 04/01/27 |
515 | 546,544 | ||||||
| 6.25%, 04/01/28 |
607 | 633,653 | ||||||
| TechnipFMC PLC, 6.50%, 02/01/26(b) |
685 | 739,639 | ||||||
| USA Compression Partners LP/USA Compression Finance Corp. |
||||||||
| 6.88%, 04/01/26 |
655 | 686,113 | ||||||
| 6.88%, 09/01/27 |
1,216 | 1,299,029 | ||||||
|
|
|
|||||||
| 3,904,978 | ||||||||
| Environmental, Maintenance, & Security Service — 0.5% | ||||||||
| Clean Harbors, Inc., 5.13%, 07/15/29(b) |
1,278 | 1,389,825 | ||||||
| Covanta Holding Corp., 5.00%, 09/01/30 |
309 | 324,450 | ||||||
| GFL Environmental, Inc.(b) |
||||||||
| 3.75%, 08/01/25 |
587 | 603,143 | ||||||
| 5.13%, 12/15/26(f) |
1,887 | 1,996,295 | ||||||
| 4.00%, 08/01/28 |
199 | 196,582 | ||||||
| 3.50%, 09/01/28 |
504 | 502,740 | ||||||
| 4.75%, 06/15/29 |
821 | 852,444 | ||||||
| Tervita Corp., 11.00%, 12/01/25(b) |
302 | 338,158 | ||||||
| Waste Pro USA, Inc., 5.50%, 02/15/26(b) |
1,010 | 1,042,573 | ||||||
|
|
|
|||||||
| 7,246,210 | ||||||||
| 94 | 2 0 2 1 B L A C K R O C K S E M I - A N N U A L R E P O R T T O S H A R E H O L D E R S |
| Schedule of Investments (unaudited) (continued) June 30, 2021 |
BlackRock Credit Allocation Income Trust (BTZ) (Percentages shown are based on Net Assets) |
| Security | Par (000) |
Value | ||||||
| Equity Real Estate Investment Trusts (REITs) — 1.5% | ||||||||
| Brookfield Property REIT, Inc./BPR Cumulus LLC/BPR Nimbus LLC/GGSI Sellco LL, 5.75%, 05/15/26(b) |
$ | 383 | $ | 402,629 | ||||
| Crown Castle International Corp., 3.30%, 07/01/30 |
1,220 | 1,306,978 | ||||||
| Global Net Lease, Inc./Global Net Lease Operating Partnership LP, |
364 | 360,267 | ||||||
| Host Hotels & Resorts LP, Series D, 3.75%, 10/15/23(f) |
3,600 | 3,795,393 | ||||||
| Iron Mountain, Inc.(b) |
||||||||
| 4.88%, 09/15/27 |
606 | 628,213 | ||||||
| 5.25%, 07/15/30 |
486 | 514,470 | ||||||
| 5.63%, 07/15/32 |
778 | 832,709 | ||||||
| MGM Growth Properties Operating Partnership LP/MGP Finance Co-Issuer, Inc. |
||||||||
| 5.63%, 05/01/24 |
4,627 | 5,010,821 | ||||||
| 4.63%, 06/15/25(b) |
755 | 806,619 | ||||||
| 4.50%, 09/01/26 |
1,658 | 1,769,915 | ||||||
| 4.50%, 01/15/28 |
430 | 454,725 | ||||||
| 3.88%, 02/15/29(b) |
697 | 707,852 | ||||||
| MPT Operating Partnership LP/MPT Finance Corp. |
||||||||
| 5.00%, 10/15/27 |
178 | 188,696 | ||||||
| 4.63%, 08/01/29 |
847 | 906,680 | ||||||
| 3.50%, 03/15/31 |
2,631 | 2,657,284 | ||||||
| RHP Hotel Properties LP/RHP Finance Corp., 4.75%, 10/15/27 |
1,500 | 1,540,575 | ||||||
|
|
|
|||||||
| 21,883,826 | ||||||||
| Food & Staples Retailing — 1.9% | ||||||||
| Albertsons Cos., Inc./Safeway, Inc./New Albertsons LP/Albertsons LLC |
||||||||
| 5.75%, 03/15/25 |
49 | 50,102 | ||||||
| 3.25%, 03/15/26(b) |
1,296 | 1,314,468 | ||||||
| 4.63%, 01/15/27(b) |
1,885 | 1,971,616 | ||||||
| 5.88%, 02/15/28(b) |
928 | 999,823 | ||||||
| 4.88%, 02/15/30(b) |
142 | 151,444 | ||||||
| General Mills, Inc. |
||||||||
| 4.20%, 04/17/28 |
620 | 714,727 | ||||||
| 2.88%, 04/15/30 |
725 | 768,003 | ||||||
| Kraft Heinz Foods Co. |
||||||||
| 4.25%, 03/01/31 |
1,341 | 1,523,361 | ||||||
| 5.00%, 07/15/35 |
297 | 364,306 | ||||||
| 7.13%, 08/01/39(b) |
4,415 | 6,445,382 | ||||||
| 4.63%, 10/01/39 |
100 | 116,467 | ||||||
| 5.00%, 06/04/42 |
12 | 14,653 | ||||||
| 5.20%, 07/15/45 |
9 | 11,173 | ||||||
| 4.38%, 06/01/46 |
226 | 256,103 | ||||||
| 4.88%, 10/01/49 |
248 | 301,060 | ||||||
| 5.50%, 06/01/50 |
2,751 | 3,570,118 | ||||||
| Lamb Weston Holdings,
Inc., |
284 | 314,175 | ||||||
| Post Holdings, Inc.(b) |
||||||||
| 5.63%, 01/15/28 |
428 | 453,680 | ||||||
| 4.63%, 04/15/30 |
596 | 606,031 | ||||||
| 4.50%, 09/15/31 |
420 | 419,307 | ||||||
| US Foods, Inc., 4.75%, 02/15/29(b) |
642 | 654,840 | ||||||
| Walmart, Inc., 5.25%, 09/01/35(f) |
5,150 | 6,996,405 | ||||||
|
|
|
|||||||
| 28,017,244 | ||||||||
| Food Products(b) — 0.5% | ||||||||
| Aramark Services, Inc. |
||||||||
| 5.00%, 04/01/25 |
1,367 | 1,401,175 | ||||||
| 6.38%, 05/01/25 |
1,038 | 1,102,875 | ||||||
| Security | Par (000) |
Value | ||||||
| Food Products (continued) | ||||||||
| Aramark Services, Inc. (continued) |
||||||||
| 5.00%, 02/01/28 |
$ | 929 | $ | 972,849 | ||||
| Chobani LLC/Chobani Finance Corp., Inc., 7.50%, 04/15/25 |
246 | 255,941 | ||||||
| JBS USA LUX SA/JBS USA Finance, Inc., 6.75%, 02/15/28 |
399 | 436,406 | ||||||
| JBS USA LUX SA/JBS USA Food Co./JBS USA Finance, Inc. |
||||||||
| 6.50%, 04/15/29 |
2,168 | 2,436,312 | ||||||
| 3.75%, 12/01/31 |
730 | 746,972 | ||||||
| Simmons Foods, Inc./Simmons Prepared Foods, Inc./Simmons Pet Food, Inc./Simmons Feed, 4.63%, 03/01/29 |
624 | 629,423 | ||||||
|
|
|
|||||||
| 7,981,953 | ||||||||
| Gas Utilities(b) — 0.0% | ||||||||
| Suburban Propane Partners LP/Suburban Energy Finance Corp., 5.00%, 06/01/31 |
346 | 354,218 | ||||||
| Superior Plus LP/Superior General Partner, Inc., 4.50%, 03/15/29 |
101 | 104,032 | ||||||
|
|
|
|||||||
| 458,250 | ||||||||
| Health Care Equipment & Supplies — 0.2% | ||||||||
| Avantor Funding, Inc., 4.63%, 07/15/28(b) |
2,351 | 2,482,115 | ||||||
| Hologic, Inc., 3.25%, 02/15/29(b) |
90 | 89,213 | ||||||
| Medtronic, Inc., 4.63%, 03/15/45(f) |
647 | 848,739 | ||||||
| Ortho-Clinical Diagnostics, Inc./Ortho-Clinical Diagnostics SA, 7.25%, 02/01/28(b) |
142 | 155,099 | ||||||
|
|
|
|||||||
| 3,575,166 | ||||||||
| Health Care Providers & Services — 4.9% | ||||||||
| Aetna, Inc., 3.88%, 08/15/47 |
3,500 | 3,914,257 | ||||||
| AHP Health Partners, Inc., 9.75%, 07/15/26(b) |
860 | 925,188 | ||||||
| Anthem, Inc., 4.55%, 03/01/48(f) |
5,000 | 6,249,068 | ||||||
| Centene Corp. |
||||||||
| 4.25%, 12/15/27 |
1,331 | 1,402,541 | ||||||
| 2.45%, 07/15/28(i) |
1,359 | 1,377,346 | ||||||
| 4.63%, 12/15/29 |
3,232 | 3,554,457 | ||||||
| 3.00%, 10/15/30 |
1,181 | 1,213,218 | ||||||
| 2.50%, 03/01/31 |
2,906 | 2,866,042 | ||||||
| CHS/Community Health Systems, Inc.(b) |
||||||||
| 6.63%, 02/15/25 |
2,540 | 2,686,025 | ||||||
| 8.00%, 03/15/26 |
1,573 | 1,694,907 | ||||||
| 5.63%, 03/15/27 |
1,180 | 1,259,650 | ||||||
| 6.00%, 01/15/29 |
812 | 868,840 | ||||||
| 6.88%, 04/15/29 |
91 | 95,229 | ||||||
| 6.13%, 04/01/30 |
473 | 480,095 | ||||||
| DaVita, Inc., 4.63%, 06/01/30(b) |
265 | 272,478 | ||||||
| Encompass Health Corp. |
||||||||
| 4.50%, 02/01/28 |
106 | 109,972 | ||||||
| 4.75%, 02/01/30 |
1,103 | 1,171,937 | ||||||
| 4.63%, 04/01/31 |
250 | 267,863 | ||||||
| HCA, Inc. |
||||||||
| 5.38%, 09/01/26 |
665 | 765,249 | ||||||
| 5.63%, 09/01/28 |
1,297 | 1,536,945 | ||||||
| 5.88%, 02/01/29 |
312 | 376,740 | ||||||
| 3.50%, 09/01/30 |
1,428 | 1,521,348 | ||||||
| 5.25%, 06/15/49 |
3,500 | 4,461,422 | ||||||
| Legacy LifePoint Health LLC(b) |
||||||||
| 6.75%, 04/15/25 |
409 | 435,851 | ||||||
| 4.38%, 02/15/27 |
491 | 496,892 | ||||||
| S C H E D U L E O F I N V E S T M E N T S |
95 |
| Schedule of Investments (unaudited) (continued) June 30, 2021 |
BlackRock Credit Allocation Income Trust (BTZ) (Percentages shown are based on Net Assets) |
| Security | Par (000) |
Value | ||||||
| Health Care Providers & Services (continued) | ||||||||
| LifePoint Health, Inc., 5.38%, 01/15/29(b) |
$ | 479 | $ | 467,025 | ||||
| ModivCare, Inc., 5.88%, 11/15/25(b) |
152 | 162,640 | ||||||
| Molina Healthcare, Inc.(b) |
||||||||
| 4.38%, 06/15/28 |
795 | 828,787 | ||||||
| 3.88%, 11/15/30 |
710 | 739,288 | ||||||
| Prime Healthcare Services, Inc., 7.25%, 11/01/25(b) |
432 | 467,675 | ||||||
| RegionalCare Hospital Partners Holdings, Inc./LifePoint Health, Inc., |
72 | 77,490 | ||||||
| Surgery Center Holdings, Inc.(b) |
||||||||
| 6.75%, 07/01/25 |
375 | 382,500 | ||||||
| 10.00%, 04/15/27 |
972 | 1,066,770 | ||||||
| Teleflex, Inc., 4.25%, 06/01/28(b) |
748 | 779,790 | ||||||
| Tenet Healthcare Corp. |
||||||||
| 4.63%, 07/15/24 |
1,145 | 1,161,831 | ||||||
| 4.63%, 09/01/24(b) |
882 | 905,250 | ||||||
| 7.50%, 04/01/25(b) |
367 | 396,408 | ||||||
| 4.88%, 01/01/26(b)(f) |
4,187 | 4,342,756 | ||||||
| 6.25%, 02/01/27(b) |
144 | 150,300 | ||||||
| 5.13%, 11/01/27(b) |
2,180 | 2,286,275 | ||||||
| 4.63%, 06/15/28(b) |
37 | 38,080 | ||||||
| 6.13%, 10/01/28(b) |
797 | 849,315 | ||||||
| 4.25%, 06/01/29(b) |
614 | 621,675 | ||||||
| UnitedHealth Group, Inc., 6.88%, 02/15/38(f) |
10,000 | 15,506,204 | ||||||
|
|
|
|||||||
| 71,233,619 | ||||||||
| Health Care Technology(b) — 0.5% | ||||||||
| Catalent Pharma Solutions, Inc., 5.00%, 07/15/27 |
733 | 765,956 | ||||||
| Change Healthcare Holdings LLC/Change Healthcare Finance, Inc., 5.75%, 03/01/25 |
650 | 660,562 | ||||||
| Charles River Laboratories International, Inc. |
||||||||
| 4.25%, 05/01/28 |
324 | 334,935 | ||||||
| 3.75%, 03/15/29 |
141 | 142,939 | ||||||
| 4.00%, 03/15/31 |
204 | 212,227 | ||||||
| Indigo Merger Sub, Inc., 2.88%, 07/15/26(i) |
1,021 | 1,037,142 | ||||||
| IQVIA, Inc. |
||||||||
| 5.00%, 10/15/26 |
554 | 573,390 | ||||||
| 5.00%, 05/15/27 |
1,192 | 1,248,620 | ||||||
| Mednax, Inc., 6.25%, 01/15/27 |
426 | 451,028 | ||||||
| Syneos Health, Inc., 3.63%, 01/15/29 |
1,446 | 1,431,540 | ||||||
|
|
|
|||||||
| 6,858,339 | ||||||||
| Hotels, Restaurants & Leisure — 2.5% | ||||||||
| 1011778 BC ULC/New Red Finance, Inc.(b) |
||||||||
| 5.75%, 04/15/25 |
552 | 584,436 | ||||||
| 3.88%, 01/15/28(i) |
1,425 | 1,442,812 | ||||||
| 4.38%, 01/15/28 |
2,509 | 2,543,499 | ||||||
| Boyd Gaming Corp. |
||||||||
| 8.63%, 06/01/25(b) |
169 | 186,301 | ||||||
| 4.75%, 12/01/27 |
393 | 406,755 | ||||||
| 4.75%, 06/15/31(b) |
775 | 804,062 | ||||||
| Boyne USA, Inc., 4.75%, 05/15/29(b) |
484 | 499,357 | ||||||
| Caesars Entertainment, Inc.(b) |
||||||||
| 6.25%, 07/01/25 |
3,215 | 3,407,900 | ||||||
| 8.13%, 07/01/27 |
2,439 | 2,712,656 | ||||||
| Caesars Resort Collection LLC/CRC Finco, Inc., 5.75%, 07/01/25(b) |
1,048 | 1,104,330 | ||||||
| Cedar Fair LP/Canada’s Wonderland Co./Magnum Management Corp./Millennium Op, 5.50%, 05/01/25(b) |
1,111 | 1,159,606 | ||||||
| Security | Par (000) |
Value | ||||||
| Hotels, Restaurants & Leisure (continued) | ||||||||
| Churchill Downs, Inc.(b) |
||||||||
| 5.50%, 04/01/27 |
$ | 1,907 | $ | 1,987,202 | ||||
| 4.75%, 01/15/28 |
282 | 291,788 | ||||||
| Golden Nugget, Inc., 6.75%, 10/15/24(b) |
1,269 | 1,281,969 | ||||||
| Hilton Domestic Operating Co., Inc. |
||||||||
| 5.38%, 05/01/25(b) |
319 | 335,747 | ||||||
| 5.75%, 05/01/28(b) |
451 | 488,014 | ||||||
| 4.88%, 01/15/30 |
1,288 | 1,374,940 | ||||||
| 4.00%, 05/01/31(b) |
285 | 287,528 | ||||||
| Las Vegas Sands Corp. |
||||||||
| 3.50%, 08/18/26 |
96 | 102,072 | ||||||
| 3.90%, 08/08/29 |
88 | 93,686 | ||||||
| Marriott International, Inc., Series EE, 5.75%, 05/01/25 |
1,295 | 1,494,818 | ||||||
| Marriott Ownership Resorts, Inc./ILG LLC, 6.50%, 09/15/26 |
186 | 193,208 | ||||||
| McDonald’s Corp., 4.20%, 04/01/50(f) |
480 | 578,368 | ||||||
| MGM Resorts International |
||||||||
| 7.75%, 03/15/22 |
1,059 | 1,106,867 | ||||||
| 6.00%, 03/15/23 |
1,335 | 1,428,049 | ||||||
| Midwest Gaming Borrower LLC/Midwest Gaming Finance Corp., 4.88%, 05/01/29(b) |
538 | 538,672 | ||||||
| Playtika Holding Corp., 4.25%, 03/15/29(b) |
954 | 953,342 | ||||||
| Scientific Games International, Inc.(b) |
||||||||
| 8.63%, 07/01/25 |
442 | 483,990 | ||||||
| 5.00%, 10/15/25 |
270 | 278,775 | ||||||
| 8.25%, 03/15/26 |
2,063 | 2,212,526 | ||||||
| 7.00%, 05/15/28 |
451 | 492,582 | ||||||
| 7.25%, 11/15/29 |
218 | 245,904 | ||||||
| Six Flags Theme Parks, Inc., 7.00%, 07/01/25(b) |
1,648 | 1,776,050 | ||||||
| Vail Resorts, Inc., 6.25%, 05/15/25(b) |
341 | 365,000 | ||||||
| Wynn Las Vegas LLC/Wynn Las Vegas Capital Corp., 5.25%, 05/15/27(b) |
602 | 646,608 | ||||||
| Wynn Resorts Finance LLC/Wynn Resorts Capital Corp., 5.13%, 10/01/29(b) |
1,386 | 1,463,962 | ||||||
| Yum! Brands, Inc. |
||||||||
| 7.75%, 04/01/25(b) |
802 | 872,175 | ||||||
| 4.75%, 01/15/30(b) |
135 | 146,139 | ||||||
| 3.63%, 03/15/31 |
134 | 133,330 | ||||||
|
|
|
|||||||
| 36,505,025 | ||||||||
| Household Durables — 0.5% | ||||||||
| Brookfield Residential Properties, Inc./Brookfield Residential US LLC, 4.88%, 02/15/30(b) |
770 | 762,531 | ||||||
| CD&R Smokey Buyer, Inc., 6.75%, 07/15/25(b) |
507 | 543,443 | ||||||
| Lennar Corp. |
||||||||
| 4.75%, 11/15/22 |
1,605 | 1,679,231 | ||||||
| 5.25%, 06/01/26 |
890 | 1,032,925 | ||||||
| Mattamy Group Corp., 4.63%, 03/01/30(b) |
524 | 535,266 | ||||||
| NCR Corp.(b) |
||||||||
| 5.75%, 09/01/27 |
512 | 541,760 | ||||||
| 5.00%, 10/01/28 |
241 | 249,211 | ||||||
| 5.13%, 04/15/29 |
289 | 298,031 | ||||||
| 6.13%, 09/01/29 |
175 | 190,750 | ||||||
| 5.25%, 10/01/30 |
245 | 254,188 | ||||||
| Newell Brands, Inc., 6.00%, 04/01/46 |
51 | 64,627 | ||||||
| PulteGroup, Inc. |
||||||||
| 5.00%, 01/15/27 |
55 | 64,321 | ||||||
| 7.88%, 06/15/32 |
56 | 80,388 | ||||||
| 96 | 2 0 2 1 B L A C K R O C K S E M I - A N N U A L R E P O R T T O S H A R E H O L D E R S |
| Schedule of Investments (unaudited) (continued) June 30, 2021 |
BlackRock Credit Allocation Income Trust (BTZ) (Percentages shown are based on Net Assets) |
| Security | Par (000) |
Value | ||||||
| Household Durables (continued) | ||||||||
| Tempur Sealy International, Inc., 4.00%, 04/15/29(b) |
$ | 569 | $ | 576,084 | ||||
| Toll Brothers Finance Corp., 4.35%, 02/15/28 |
35 | 38,413 | ||||||
|
|
|
|||||||
| 6,911,169 | ||||||||
| Household Products — 0.0% | ||||||||
| Kronos Acquisition Holdings, Inc./KIK Custom Products, Inc., 5.00%, 12/31/26(b) |
157 | 159,355 | ||||||
|
|
|
|||||||
| Independent Power and Renewable Electricity Producers — 0.7% | ||||||||
| Calpine Corp.(b) |
||||||||
| 5.25%, 06/01/26 |
906 | 932,047 | ||||||
| 4.50%, 02/15/28 |
1,057 | 1,078,140 | ||||||
| 5.13%, 03/15/28 |
3,279 | 3,336,382 | ||||||
| 4.63%, 02/01/29 |
195 | 191,712 | ||||||
| 5.00%, 02/01/31 |
125 | 124,375 | ||||||
| Clearway Energy Operating LLC, 4.75%, 03/15/28(b) |
630 | 660,713 | ||||||
| NRG Energy, Inc. |
||||||||
| 6.63%, 01/15/27 |
2,029 | 2,100,461 | ||||||
| 5.75%, 01/15/28 |
52 | 55,380 | ||||||
| 5.25%, 06/15/29(b) |
960 | 1,021,200 | ||||||
| 3.63%, 02/15/31(b) |
514 | 505,108 | ||||||
| TerraForm Power Operating LLC(b) |
||||||||
| 4.25%, 01/31/23 |
214 | 219,618 | ||||||
| 5.00%, 01/31/28 |
231 | 244,571 | ||||||
| 4.75%, 01/15/30 |
127 | 130,070 | ||||||
|
|
|
|||||||
| 10,599,777 | ||||||||
| Insurance — 3.9% | ||||||||
| Alliant Holdings Intermediate LLC/Alliant Holdings Co-Issuer, 6.75%, 10/15/27(b) |
2,837 | 2,981,573 | ||||||
| Allstate Corp., Series B, (3 mo. LIBOR US + 2.94%), 5.75%, 08/15/53(a) |
5,000 | 5,443,750 | ||||||
| American International Group, Inc., (3 mo. LIBOR US + 4.20%), 8.18%, 05/15/58(a) |
3,755 | 5,429,555 | ||||||
| AmWINS Group, Inc., 7.75%, 07/01/26(b) |
167 | 177,129 | ||||||
| Aon PLC, 4.25%, 12/12/42(f) |
6,500 | 7,547,525 | ||||||
| AssuredPartners, Inc., 5.63%, 01/15/29(b) |
581 | 581,000 | ||||||
| Farmers Exchange Capital II, (3 mo. LIBOR US + 3.74%), 6.15%, 11/01/53(a)(b) |
4,890 | 6,319,182 | ||||||
| GTCR AP Finance, Inc., 8.00%, 05/15/27(b) |
100 | 106,500 | ||||||
| HUB International Ltd., 7.00%, 05/01/26(b) |
1,724 | 1,787,943 | ||||||
| Northwestern Mutual Life Insurance Co., 6.06%, 03/30/40(b)(f) |
12,000 | 16,802,078 | ||||||
| Principal Financial Group, Inc., (3 mo. LIBOR US + 3.04%), 3.20%, 05/15/55(a) |
5,000 | 4,972,500 | ||||||
| Progressive Corp., Series B, (3 mo. LIBOR US + 2.54%), 5.38%(a)(g) |
5,000 | 5,242,450 | ||||||
|
|
|
|||||||
| 57,391,185 | ||||||||
| Interactive Media & Services — 0.5% | ||||||||
| Cablevision Lightpath LLC(b) |
||||||||
| 3.88%, 09/15/27 |
368 | 363,709 | ||||||
| 5.63%, 09/15/28 |
540 | 549,990 | ||||||
| Netflix, Inc. |
||||||||
| 3.63%, 06/15/25(b) |
210 | 225,506 | ||||||
| 5.88%, 11/15/28 |
1,698 | 2,084,176 | ||||||
| 6.38%, 05/15/29 |
72 | 91,962 | ||||||
| 5.38%, 11/15/29(b) |
2,007 | 2,437,695 | ||||||
| 4.88%, 06/15/30(b) |
461 | 548,267 | ||||||
| Twitter, Inc., 3.88%, 12/15/27(b) |
697 | 740,563 | ||||||
|
|
|
|||||||
| 7,041,868 | ||||||||
| Security | Par (000) |
Value | ||||||
| Internet Software & Services — 1.3% | ||||||||
| ANGI Group LLC, 3.88%, 08/15/28(b) |
$ | 582 | $ | 578,362 | ||||
| Booking Holdings, Inc. |
||||||||
| 3.55%, 03/15/28(f) |
3,375 | 3,765,767 | ||||||
| 4.63%, 04/13/30 |
2,185 | 2,607,308 | ||||||
| Expedia Group, Inc., 6.25%, 05/01/25(b)(f) |
5,550 | 6,456,065 | ||||||
| Go Daddy Operating Co. LLC/GD |
||||||||
| 5.25%, 12/01/27 |
370 | 388,500 | ||||||
| 3.50%, 03/01/29 |
265 | 263,278 | ||||||
| Match Group Holdings II
LLC, |
383 | 389,703 | ||||||
| Uber Technologies, Inc.(b) |
||||||||
| 7.50%, 05/15/25 |
2,018 | 2,177,826 | ||||||
| 8.00%, 11/01/26 |
481 | 518,277 | ||||||
| 7.50%, 09/15/27 |
1,892 | 2,079,270 | ||||||
| 6.25%, 01/15/28 |
440 | 473,532 | ||||||
|
|
|
|||||||
| 19,697,888 | ||||||||
| IT Services — 1.1% | ||||||||
| Banff Merger Sub, Inc., 9.75%, 09/01/26(b) |
2,178 | 2,292,345 | ||||||
| Booz Allen Hamilton, Inc.(b) |
||||||||
| 3.88%, 09/01/28 |
735 | 749,700 | ||||||
| 4.00%, 07/01/29 |
851 | 870,148 | ||||||
| Camelot Finance SA, 4.50%, 11/01/26(b) |
1,254 | 1,311,998 | ||||||
| Dun & Bradstreet Corp.(b) |
||||||||
| 6.88%, 08/15/26 |
1,210 | 1,282,600 | ||||||
| 10.25%, 02/15/27 |
822 | 907,677 | ||||||
| Gartner, Inc.(b) |
||||||||
| 4.50%, 07/01/28 |
587 | 619,942 | ||||||
| 3.63%, 06/15/29 |
410 | 416,150 | ||||||
| 3.75%, 10/01/30 |
895 | 915,683 | ||||||
| Leidos, Inc., 4.38%, 05/15/30 |
2,215 | 2,515,199 | ||||||
| Rackspace Technology Global, Inc., 5.38%, 12/01/28(b)(f) |
920 | 943,000 | ||||||
| Tempo Acquisition LLC/Tempo Acquisition Finance Corp., 6.75%, 06/01/25(b) |
2,026 | 2,060,199 | ||||||
| Twilio, Inc., 3.88%, 03/15/31 |
413 | 423,841 | ||||||
| ZoomInfo Technologies LLC/ZoomInfo Finance Corp., 3.88%, 02/01/29(b) |
551 | 547,556 | ||||||
|
|
|
|||||||
| 15,856,038 | ||||||||
| Leisure Products — 0.2% | ||||||||
| Mattel, Inc. |
||||||||
| 6.75%, 12/31/25(b)(f) |
763 | 801,684 | ||||||
| 5.88%, 12/15/27(b) |
503 | 548,270 | ||||||
| 3.75%, 04/01/29(b) |
213 | 221,520 | ||||||
| 6.20%, 10/01/40 |
325 | 400,563 | ||||||
| 5.45%, 11/01/41 |
353 | 406,832 | ||||||
|
|
|
|||||||
| 2,378,869 | ||||||||
| Machinery(b) — 0.5% | ||||||||
| Colfax Corp., 6.38%, 02/15/26 |
671 | 708,576 | ||||||
| Husky III Holding Ltd., (13.00% Cash or 13.75% PIK), 13.00%, 02/15/25(h) |
166 | 180,110 | ||||||
| Madison IAQ LLC |
||||||||
| 4.13%, 06/30/28 |
200 | 202,000 | ||||||
| 5.88%, 06/30/29 |
743 | 756,003 | ||||||
| RBS Global, Inc./Rexnord LLC, 4.88%, 12/15/25 |
878 | 895,560 | ||||||
| Terex Corp., 5.00%, 05/15/29 |
618 | 644,265 | ||||||
| Titan Acquisition Ltd./Titan Co-Borrower LLC, 7.75%, 04/15/26 |
1,307 | 1,354,379 | ||||||
| S C H E D U L E O F I N V E S T M E N T S |
97 |
| Schedule of Investments (unaudited) (continued) June 30, 2021 |
BlackRock Credit Allocation Income Trust (BTZ) (Percentages shown are based on Net Assets) |
| Security | Par (000) |
Value | ||||||
| Machinery (continued) | ||||||||
| TK Elevator US Newco Inc., 5.25%, 07/15/27 |
$ | 1,547 | $ | 1,630,151 | ||||
| Vertical Holdco GmbH, 7.63%, 07/15/28 |
664 | 720,566 | ||||||
|
|
|
|||||||
| 7,091,610 | ||||||||
| Media — 9.3% | ||||||||
| Altice Financing SA(b) |
||||||||
| 7.50%, 05/15/26 |
1,901 | 1,979,511 | ||||||
| 5.00%, 01/15/28 |
863 | 845,887 | ||||||
| Altice France Holding SA(b) |
||||||||
| 10.50%, 05/15/27 |
4,955 | 5,506,244 | ||||||
| 6.00%, 02/15/28 |
734 | 730,917 | ||||||
| AMC Networks, Inc., 4.25%, 02/15/29 |
263 | 265,301 | ||||||
| Cable One, Inc., 4.00%, 11/15/30(b) |
246 | 246,923 | ||||||
| CCO Holdings LLC/CCO Holdings Capital Corp. |
||||||||
| 5.13%, 05/01/27(b)(f) |
3,132 | 3,285,155 | ||||||
| 5.00%, 02/01/28(b) |
162 | 169,898 | ||||||
| 5.38%, 06/01/29(b) |
1,823 | 1,992,721 | ||||||
| 4.75%, 03/01/30(b) |
313 | 330,998 | ||||||
| 4.50%, 08/15/30(b) |
3,937 | 4,099,259 | ||||||
| 4.25%, 02/01/31(b) |
1,456 | 1,483,300 | ||||||
| 4.50%, 05/01/32 |
1,582 | 1,639,347 | ||||||
| 4.50%, 06/01/33(b) |
747 | 764,375 | ||||||
| Charter Communications Operating LLC/Charter Communications Operating Capital |
||||||||
| 6.38%, 10/23/35 |
479 | 640,264 | ||||||
| 6.48%, 10/23/45(f) |
9,584 | 13,198,909 | ||||||
| 5.38%, 05/01/47 |
1,500 | 1,838,115 | ||||||
| 6.83%, 10/23/55 |
3,540 | 5,210,789 | ||||||
| Cinemark USA, Inc., 5.25%, 07/15/28(b) |
236 | 241,900 | ||||||
| Clear Channel Outdoor Holdings, Inc.(b) |
||||||||
| 7.75%, 04/15/28 |
1,038 | 1,087,326 | ||||||
| 7.50%, 06/01/29 |
1,432 | 1,482,602 | ||||||
| Clear Channel Worldwide Holdings, Inc., 5.13%, 08/15/27(b)(f) |
6,446 | 6,608,568 | ||||||
| Comcast Corp. |
||||||||
| 3.75%, 04/01/40 |
545 | 614,368 | ||||||
| 4.95%, 10/15/58 |
3,795 | 5,247,777 | ||||||
| Connect Finco Sarl/Connect US Finco LLC, 6.75%, 10/01/26(b)(f) |
5,588 | 5,909,310 | ||||||
| Cox Communications, Inc., 8.38%, 03/01/39(b) |
5,000 | 8,375,651 | ||||||
| CSC Holdings LLC |
||||||||
| 5.25%, 06/01/24 |
1,061 | 1,149,810 | ||||||
| 5.38%, 02/01/28(b) |
336 | 355,471 | ||||||
| 7.50%, 04/01/28(b) |
877 | 962,507 | ||||||
| 5.75%, 01/15/30(b) |
406 | 421,732 | ||||||
| 4.13%, 12/01/30(b) |
680 | 675,750 | ||||||
| 4.63%, 12/01/30(b) |
3,197 | 3,136,609 | ||||||
| 3.38%, 02/15/31(b) |
225 | 212,605 | ||||||
| 4.50%, 11/15/31(b) |
969 | 974,950 | ||||||
| 5.00%, 11/15/31(b) |
542 | 544,602 | ||||||
| Diamond Sports Group LLC/Diamond Sports Finance Co., 5.38%, 08/15/26(b) |
1,155 | 747,862 | ||||||
| Discovery Communications LLC, 4.88%, 04/01/43 |
4,000 | 4,826,216 | ||||||
| DISH DBS Corp. |
||||||||
| 5.88%, 07/15/22 |
2,545 | 2,654,944 | ||||||
| 5.88%, 11/15/24 |
164 | 176,095 | ||||||
| 7.75%, 07/01/26 |
2,123 | 2,404,297 | ||||||
| 5.13%, 06/01/29(b) |
1,191 | 1,176,029 | ||||||
| Fox Corp., 3.05%, 04/07/25 |
475 | 508,611 | ||||||
| Frontier Communications Holdings LLC(b) |
||||||||
| 5.88%, 10/15/27 |
1,001 | 1,072,321 | ||||||
| Security | Par (000) |
Value | ||||||
| Media (continued) | ||||||||
| Frontier Communications Holdings LLC(b) (continued) |
||||||||
| 5.00%, 05/01/28 |
$ | 1,372 | $ | 1,418,415 | ||||
| 6.75%, 05/01/29 |
1,347 | 1,432,225 | ||||||
| Gray Television, Inc., 7.00%, 05/15/27(b) |
415 | 448,719 | ||||||
| Hughes Satellite Systems Corp., 5.25%, 08/01/26 |
351 | 393,183 | ||||||
| iHeartCommunications, Inc. |
||||||||
| 6.38%, 05/01/26 |
370 | 393,568 | ||||||
| 8.38%, 05/01/27 |
74 | 78,558 | ||||||
| 5.25%, 08/15/27(b) |
376 | 393,070 | ||||||
| 4.75%, 01/15/28(b) |
184 | 189,290 | ||||||
| Lamar Media Corp., 4.00%, 02/15/30 |
307 | 310,718 | ||||||
| LCPR Senior Secured Financing DAC(b) |
||||||||
| 6.75%, 10/15/27 |
955 | 1,029,203 | ||||||
| 5.13%, 07/15/29 |
963 | 995,501 | ||||||
| Ligado Networks LLC, (15.50% PIK), 15.50%, 11/01/23(b)(h) |
764 | 753,100 | ||||||
| Lions Gate Capital Holdings LLC, 5.50%, 04/15/29(b) |
132 | 138,765 | ||||||
| Live Nation Entertainment, Inc.(b) |
||||||||
| 4.88%, 11/01/24 |
136 | 138,176 | ||||||
| 6.50%, 05/15/27 |
2,164 | 2,401,607 | ||||||
| 4.75%, 10/15/27 |
391 | 405,174 | ||||||
| 3.75%, 01/15/28 |
411 | 412,817 | ||||||
| Meredith Corp., 6.88%, 02/01/26 |
116 | 120,640 | ||||||
| News Corp., 3.88%, 05/15/29(b) |
257 | 259,570 | ||||||
| Outfront Media Capital LLC/Outfront Media Capital Corp.(b) |
||||||||
| 5.00%, 08/15/27 |
554 | 573,606 | ||||||
| 4.25%, 01/15/29 |
256 | 257,600 | ||||||
| Radiate Holdco LLC/Radiate Finance, Inc.(b) |
||||||||
| 4.50%, 09/15/26 |
1,219 | 1,261,665 | ||||||
| 6.50%, 09/15/28 |
2,880 | 3,025,872 | ||||||
| Scripps Escrow II, Inc.(b) |
||||||||
| 3.88%, 01/15/29 |
37 | 36,705 | ||||||
| 5.38%, 01/15/31 |
367 | 365,840 | ||||||
| Sinclair Television Group, Inc., 4.13%, 12/01/30(b) |
225 | 221,063 | ||||||
| Sirius XM Radio, Inc.(b) |
||||||||
| 5.00%, 08/01/27 |
626 | 655,891 | ||||||
| 4.00%, 07/15/28 |
991 | 1,020,730 | ||||||
| 5.50%, 07/01/29 |
1,669 | 1,818,709 | ||||||
| 4.13%, 07/01/30 |
101 | 101,897 | ||||||
| Telenet Finance Luxembourg Notes Sarl, 5.50%, 03/01/28(b) |
1,000 | 1,052,000 | ||||||
| Telesat Canada/Telesat LLC, 4.88%, 06/01/27(b) |
650 | 627,250 | ||||||
| Time Warner Cable LLC, 6.55%, 05/01/37 |
3,519 | 4,793,690 | ||||||
| UPC Broadband Finco BV, 4.88%, 07/15/31(b) |
934 | 936,148 | ||||||
| ViacomCBS, Inc. |
||||||||
| 5.85%, 09/01/43 |
1,300 | 1,781,150 | ||||||
| (3 mo. LIBOR US + 3.90%), 5.88%, 02/28/57(a) |
2,111 | 2,148,365 | ||||||
| Videotron Ltd.(b) |
||||||||
| 5.13%, 04/15/27 |
999 | 1,043,955 | ||||||
| 3.63%, 06/15/29 |
747 | 761,723 | ||||||
| Virgin Media Secured Finance PLC(b) |
||||||||
| 5.50%, 08/15/26 |
487 | 502,219 | ||||||
| 5.50%, 05/15/29 |
833 | 895,475 | ||||||
| Virgin Media Vendor Financing Notes IV DAC, 5.00%, 07/15/28(b) |
1,452 | 1,481,040 | ||||||
| WMG Acquisition Corp., 3.88%, 07/15/30(b) |
263 | 265,604 | ||||||
| Ziggo Bond Co. BV, 6.00%, 01/15/27(b) |
955 | 997,975 | ||||||
| 98 | 2 0 2 1 B L A C K R O C K S E M I - A N N U A L R E P O R T T O S H A R E H O L D E R S |
| Schedule of Investments (unaudited) (continued) June 30, 2021 |
BlackRock Credit Allocation Income Trust (BTZ) (Percentages shown are based on Net Assets) |
| Security | Par (000) |
Value | ||||||
| Media (continued) | ||||||||
| Ziggo BV(b) |
||||||||
| 5.50%, 01/15/27 |
$ | 775 | $ | 805,225 | ||||
| 4.88%, 01/15/30 |
887 | 909,175 | ||||||
|
|
|
|||||||
| 135,848,697 | ||||||||
| Metals & Mining — 2.2% | ||||||||
| Allegheny Technologies, Inc., 7.88%, 08/15/23 |
286 | 313,528 | ||||||
| AngloGold Ashanti Holdings PLC, 5.13%, 08/01/22(f) |
5,000 | 5,200,938 | ||||||
| Arconic Corp.(b) |
||||||||
| 6.00%, 05/15/25 |
705 | 751,368 | ||||||
| 6.13%, 02/15/28 |
552 | 592,141 | ||||||
| Big River Steel LLC/BRS Finance Corp., 6.63%, 01/31/29(b) |
2,697 | 2,970,071 | ||||||
| Commercial Metals Co., 4.88%, 05/15/23 |
2,194 | 2,313,134 | ||||||
| Constellium SE(b) |
||||||||
| 5.88%, 02/15/26 |
1,701 | 1,751,520 | ||||||
| 3.75%, 04/15/29 |
1,077 | 1,066,230 | ||||||
| Freeport-McMoRan, Inc. |
||||||||
| 4.38%, 08/01/28 |
887 | 936,894 | ||||||
| 5.40%, 11/14/34 |
65 | 78,507 | ||||||
| 5.45%, 03/15/43 |
1,607 | 1,964,268 | ||||||
| Grinding Media, Inc./Moly-Cop AltaSteel Ltd., 7.38%, 12/15/23(b) |
817 | 835,415 | ||||||
| Kaiser Aluminum Corp.(b) |
||||||||
| 4.63%, 03/01/28 |
704 | 727,321 | ||||||
| 4.50%, 06/01/31 |
266 | 272,794 | ||||||
| New Gold, Inc., 7.50%, 07/15/27(b) |
1,357 | 1,472,345 | ||||||
| Novelis Corp.(b) |
||||||||
| 5.88%, 09/30/26 |
1,745 | 1,815,244 | ||||||
| 4.75%, 01/30/30 |
2,718 | 2,853,900 | ||||||
| Southern Copper Corp., 5.88%, 04/23/45 |
3,870 | 5,379,300 | ||||||
| Steel Dynamics, Inc., 3.25%, 10/15/50 |
1,145 | 1,140,936 | ||||||
| Vedanta Resources Finance II PLC, 8.95%, 03/11/25(b) |
210 | 205,800 | ||||||
|
|
|
|||||||
| 32,641,654 | ||||||||
| Multi-line Retail — 0.1% | ||||||||
| NMG Holding Co., Inc./Neiman Marcus Group LLC, 7.13%, 04/01/26(b) |
820 | 875,350 | ||||||
|
|
|
|||||||
| Multi-Utilities — 0.2% | ||||||||
| NiSource, Inc., 3.60%, 05/01/30 |
2,200 | 2,435,855 | ||||||
|
|
|
|||||||
| Offshore Drilling & Other Services — 0.1% | ||||||||
| Lam Research Corp., 4.88%, 03/15/49 |
875 | 1,179,993 | ||||||
|
|
|
|||||||
| Oil, Gas & Consumable Fuels — 16.4% | ||||||||
| Aethon United BR LP/Aethon United Finance Corp., 8.25%, 02/15/26(b) |
1,038 | 1,123,843 | ||||||
| Antero Midstream Partners LP/Antero Midstream Finance Corp.(b) |
||||||||
| 7.88%, 05/15/26 |
207 | 231,345 | ||||||
| 5.75%, 03/01/27 |
654 | 680,160 | ||||||
| 5.75%, 01/15/28 |
127 | 133,638 | ||||||
| 5.38%, 06/15/29 |
425 | 443,063 | ||||||
| Antero Resources Corp., 5.38%, 03/01/30(b) |
373 | 380,695 | ||||||
| Apache Corp. |
||||||||
| 4.88%, 11/15/27 |
470 | 509,005 | ||||||
| 4.38%, 10/15/28 |
38 | 40,451 | ||||||
| 4.25%, 01/15/30 |
458 | 483,190 | ||||||
| 5.10%, 09/01/40 |
172 | 180,170 | ||||||
| 5.25%, 02/01/42 |
57 | 60,278 | ||||||
| Security | Par (000) |
Value | ||||||
| Oil, Gas & Consumable Fuels (continued) | ||||||||
| Ascent Resources Utica Holdings LLC/ARU Finance Corp., 9.00%, 11/01/27(b) |
$ | 576 | $ | 796,113 | ||||
| Brand Industrial Services, Inc., 8.50%, 07/15/25(b) |
984 | 1,000,462 | ||||||
| Buckeye Partners LP |
||||||||
| 4.13%, 03/01/25(b) |
594 | 615,532 | ||||||
| 5.85%, 11/15/43 |
383 | 380,128 | ||||||
| 5.60%, 10/15/44 |
376 | 364,720 | ||||||
| Callon Petroleum Co. |
||||||||
| 6.25%, 04/15/23 |
92 | 92,107 | ||||||
| 6.13%, 10/01/24 |
282 | 277,993 | ||||||
| 9.00%, 04/01/25(b) |
2,039 | 2,222,510 | ||||||
| 8.00%, 08/01/28(b)(i) |
1,170 | 1,183,162 | ||||||
| Cenovus Energy, Inc. |
||||||||
| 3.00%, 08/15/22 |
183 | 186,723 | ||||||
| 3.80%, 09/15/23 |
104 | 109,724 | ||||||
| 5.38%, 07/15/25 |
1,186 | 1,356,823 | ||||||
| 5.40%, 06/15/47 |
77 | 95,282 | ||||||
| Cheniere Energy Partners LP |
||||||||
| 5.63%, 10/01/26 |
380 | 394,250 | ||||||
| 4.50%, 10/01/29 |
1,206 | 1,296,450 | ||||||
| 4.00%, 03/01/31(b) |
1,350 | 1,410,750 | ||||||
| Cheniere Energy, Inc., 4.63%, 10/15/28(b) |
3,525 | 3,718,875 | ||||||
| Chesapeake Energy Corp.(b) |
||||||||
| 5.50%, 02/01/26 |
43 | 45,365 | ||||||
| 5.88%, 02/01/29 |
162 | 175,358 | ||||||
| Cimarex Energy Co., 4.38%, 06/01/24 |
38 | 41,360 | ||||||
| CNOOC Petroleum North America ULC, 6.40%, 05/15/37 |
2,000 | 2,629,125 | ||||||
| CNX Resources Corp., 6.00%, 01/15/29(b) |
73 | 78,929 | ||||||
| Colgate Energy Partners III LLC(b) |
||||||||
| 7.75%, 02/15/26 |
276 | 302,565 | ||||||
| 5.88%, 07/01/29 |
429 | 445,087 | ||||||
| Comstock Resources, Inc.(b) |
||||||||
| 7.50%, 05/15/25 |
569 | 590,337 | ||||||
| 6.75%, 03/01/29 |
816 | 869,228 | ||||||
| 5.88%, 01/15/30 |
553 | 564,060 | ||||||
| ConocoPhillips, 4.88%, 10/01/47(b) |
3,815 | 5,019,376 | ||||||
| Continental Resources, Inc. |
||||||||
| 5.75%, 01/15/31(b) |
157 | 188,008 | ||||||
| 4.90%, 06/01/44 |
3,031 | 3,432,623 | ||||||
| Crestwood Midstream Partners LP/Crestwood Midstream Finance Corp., 5.63%, 05/01/27(b) |
216 | 221,670 | ||||||
| CrownRock LP/CrownRock Finance, Inc., 5.63%, 10/15/25(b) |
1,677 | 1,735,695 | ||||||
| DCP Midstream Operating LP(b) |
||||||||
| 6.45%, 11/03/36 |
247 | 288,990 | ||||||
| 6.75%, 09/15/37 |
1,527 | 1,836,217 | ||||||
| Devon Energy Corp.(b) |
||||||||
| 8.25%, 08/01/23 |
811 | 924,011 | ||||||
| 5.25%, 09/15/24 |
100 | 111,389 | ||||||
| 5.25%, 10/15/27 |
130 | 140,125 | ||||||
| 5.88%, 06/15/28 |
204 | 227,083 | ||||||
| 4.50%, 01/15/30 |
117 | 128,629 | ||||||
| Diamondback Energy, Inc. |
||||||||
| 4.75%, 05/31/25 |
2,170 | 2,443,300 | ||||||
| 3.50%, 12/01/29 |
692 | 740,818 | ||||||
| DT Midstream, Inc.(b) |
||||||||
| 4.13%, 06/15/29 |
894 | 907,705 | ||||||
| 4.38%, 06/15/31 |
1,092 | 1,115,795 | ||||||
| eG Global Finance PLC(b) |
||||||||
| 6.75%, 02/07/25 |
703 | 726,877 | ||||||
| S C H E D U L E O F I N V E S T M E N T S |
99 |
| Schedule of Investments (unaudited) (continued) June 30, 2021 |
BlackRock Credit Allocation Income Trust (BTZ) (Percentages shown are based on Net Assets) |
| Security | Par (000) |
Value | ||||||
| Oil, Gas & Consumable Fuels (continued) | ||||||||
| eG Global Finance PLC(b) (continued) |
||||||||
| 8.50%, 10/30/25 |
$ | 787 | $ | 832,252 | ||||
| El Paso Natural Gas Co. LLC, 8.63%, 01/15/22 |
2,345 | 2,444,679 | ||||||
| Enbridge, Inc.(a) |
||||||||
| (3 mo. LIBOR US + 3.64%), 6.25%, 03/01/78 |
5,000 | 5,457,688 | ||||||
| Series 16-A, (3 mo. LIBOR US + 3.89%), 6.00%, 01/15/77 |
5,880 | 6,520,606 | ||||||
| Endeavor Energy Resources LP/EER Finance, Inc.(b) |
||||||||
| 6.63%, 07/15/25 |
322 | 344,540 | ||||||
| 5.50%, 01/30/26 |
2,136 | 2,218,770 | ||||||
| 5.75%, 01/30/28 |
518 | 552,317 | ||||||
| Energy Transfer LP |
||||||||
| 4.25%, 03/15/23 |
553 | 580,197 | ||||||
| 5.88%, 01/15/24(f) |
3,366 | 3,729,879 | ||||||
| 6.13%, 12/15/45 |
3,579 | 4,561,862 | ||||||
| Series B, (3 mo. LIBOR US + 4.16%), 6.63%(a)(g) |
5,000 | 4,893,750 | ||||||
| Energy Transfer Operating LP |
||||||||
| 5.20%, 02/01/22(f) |
10,200 | 10,357,204 | ||||||
| 5.50%, 06/01/27 |
406 | 476,151 | ||||||
| EnLink Midstream LLC |
||||||||
| 5.63%, 01/15/28(b) |
380 | 401,428 | ||||||
| 5.38%, 06/01/29 |
188 | 196,201 | ||||||
| EnLink Midstream Partners LP |
||||||||
| 4.40%, 04/01/24 |
613 | 643,650 | ||||||
| 4.15%, 06/01/25 |
48 | 50,272 | ||||||
| 4.85%, 07/15/26 |
64 | 66,240 | ||||||
| 5.60%, 04/01/44 |
523 | 473,315 | ||||||
| 5.05%, 04/01/45 |
68 | 58,480 | ||||||
| Enterprise Products Operating LLC |
||||||||
| 4.90%, 05/15/46(f) |
5,375 | 6,636,807 | ||||||
| Series E, (3 mo. LIBOR US + 3.03%), 5.25%, 08/16/77(a) |
4,800 | 5,032,675 | ||||||
| EOG Resources, Inc., 4.38%, 04/15/30(f) |
2,965 | 3,510,007 | ||||||
| EQM Midstream Partners LP |
||||||||
| 4.13%, 12/01/26 |
226 | 231,368 | ||||||
| 4.50%, 01/15/29(b) |
408 | 415,090 | ||||||
| 4.75%, 01/15/31(b) |
1,255 | 1,293,202 | ||||||
| EQT Corp. |
||||||||
| 3.13%, 05/15/26(b) |
368 | 377,093 | ||||||
| 3.90%, 10/01/27 |
573 | 613,826 | ||||||
| 5.00%, 01/15/29 |
135 | 150,521 | ||||||
| 8.50%, 02/01/30 |
376 | 489,894 | ||||||
| 3.63%, 05/15/31(b) |
104 | 108,420 | ||||||
| Exxon Mobil Corp., 3.45%, 04/15/51(f) |
3,890 | 4,233,737 | ||||||
| Genesis Energy LP/Genesis Energy Finance Corp., 7.75%, 02/01/28 |
293 | 302,798 | ||||||
| Great Western Petroleum LLC/Great Western Finance Corp., 12.00%, 09/01/25(b) |
40 | 39,800 | ||||||
| Harvest Midstream I LP, 7.50%, 09/01/28(b) |
261 | 283,446 | ||||||
| Hess Corp., 5.80%, 04/01/47(f) |
5,000 | 6,515,151 | ||||||
| Hilcorp Energy I LP/Hilcorp Finance Co.(b) |
||||||||
| 5.75%, 02/01/29 |
109 | 113,633 | ||||||
| 6.00%, 02/01/31 |
312 | 330,720 | ||||||
| Independence Energy Finance LLC, 7.25%, 05/01/26(b) |
976 | 1,024,966 | ||||||
| Indigo Natural Resources LLC, 5.38%, 02/01/29(b) |
819 | 855,855 | ||||||
| ITT Holdings LLC, 6.50%, 08/01/29(b)(i) |
711 | 724,331 | ||||||
| Kinder Morgan, Inc. |
||||||||
| 7.80%, 08/01/31 |
197 | 281,906 | ||||||
| 7.75%, 01/15/32(f) |
4,586 | 6,578,955 | ||||||
| Security | Par (000) |
Value | ||||||
| Oil, Gas & Consumable Fuels (continued) | ||||||||
| Marathon Petroleum Corp. |
||||||||
| 4.75%, 12/15/23 |
$ | 1,230 | $ | 1,342,139 | ||||
| 4.70%, 05/01/25(f) |
4,280 | 4,826,899 | ||||||
| 5.13%, 12/15/26 |
937 | 1,101,752 | ||||||
| Matador Resources Co., 5.88%, 09/15/26 |
1,540 | 1,586,200 | ||||||
| MEG Energy Corp.(b) |
||||||||
| 6.50%, 01/15/25 |
1,486 | 1,536,152 | ||||||
| 5.88%, 02/01/29 |
71 | 74,018 | ||||||
| MPLX LP |
||||||||
| 4.13%, 03/01/27 |
825 | 921,852 | ||||||
| 5.20%, 03/01/47 |
3,500 | 4,309,248 | ||||||
| 4.70%, 04/15/48(f) |
5,000 | 5,808,501 | ||||||
| 5.50%, 02/15/49 |
2,640 | 3,417,053 | ||||||
| Murphy Oil Corp. |
||||||||
| 5.75%, 08/15/25 |
49 | 50,286 | ||||||
| 6.38%, 12/01/42 |
47 | 46,547 | ||||||
| Murphy Oil USA, Inc., 4.75%, 09/15/29 |
323 | 339,861 | ||||||
| New Fortress Energy, Inc.(b) |
||||||||
| 6.75%, 09/15/25 |
2,347 | 2,402,741 | ||||||
| 6.50%, 09/30/26 |
2,156 | 2,203,001 | ||||||
| NGL Energy Operating LLC/NGL Energy Finance Corp., 7.50%, 02/01/26(b) |
771 | 809,550 | ||||||
| NGPL PipeCo LLC, 7.77%, 12/15/37(b) |
1,117 | 1,597,872 | ||||||
| Northern Oil and Gas, Inc., 8.13%, 03/01/28(b) |
1,020 | 1,099,050 | ||||||
| NuStar Logistics LP |
||||||||
| 6.00%, 06/01/26 |
373 | 404,705 | ||||||
| 6.38%, 10/01/30 |
45 | 49,721 | ||||||
| Occidental Petroleum Corp. |
||||||||
| 2.70%, 02/15/23 |
170 | 173,774 | ||||||
| 6.95%, 07/01/24 |
92 | 103,636 | ||||||
| 2.90%, 08/15/24 |
1,236 | 1,263,810 | ||||||
| 5.50%, 12/01/25 |
218 | 240,894 | ||||||
| 5.55%, 03/15/26 |
79 | 87,295 | ||||||
| 3.40%, 04/15/26 |
149 | 152,353 | ||||||
| 3.20%, 08/15/26 |
52 | 52,390 | ||||||
| 3.00%, 02/15/27 |
10 | 9,925 | ||||||
| 8.88%, 07/15/30 |
17 | 22,736 | ||||||
| 6.13%, 01/01/31 |
522 | 614,149 | ||||||
| 4.30%, 08/15/39 |
915 | 873,825 | ||||||
| 6.20%, 03/15/40 |
1,461 | 1,651,982 | ||||||
| 4.50%, 07/15/44 |
557 | 536,112 | ||||||
| 4.63%, 06/15/45 |
967 | 942,825 | ||||||
| 4.40%, 04/15/46 |
902 | 866,371 | ||||||
| 4.10%, 02/15/47 |
177 | 164,808 | ||||||
| 4.20%, 03/15/48 |
914 | 854,590 | ||||||
| 4.40%, 08/15/49 |
161 | 154,560 | ||||||
| Ovintiv Exploration, Inc., 5.38%, 01/01/26 |
70 | 78,886 | ||||||
| Ovintiv, Inc. |
||||||||
| 7.38%, 11/01/31 |
171 | 227,038 | ||||||
| 6.50%, 08/15/34 |
104 | 137,292 | ||||||
| Parkland Corp., 4.50%, 10/01/29(b) |
210 | 213,400 | ||||||
| PBF Holding Co. LLC/PBF Finance Corp., 9.25%, 05/15/25(b) |
724 | 729,350 | ||||||
| PDC Energy, Inc. |
||||||||
| 6.25%, 12/01/25 |
135 | 139,725 | ||||||
| 5.75%, 05/15/26 |
759 | 792,912 | ||||||
| Petroleos Mexicanos |
||||||||
| 3.50%, 01/30/23 |
5,000 | 5,090,000 | ||||||
| 4.63%, 09/21/23(f) |
3,965 | 4,124,343 | ||||||
| 4.88%, 01/18/24 |
2,000 | 2,095,250 | ||||||
| 100 | 2 0 2 1 B L A C K R O C K S E M I - A N N U A L R E P O R T T O S H A R E H O L D E R S |
| Schedule of Investments (unaudited) (continued) June 30, 2021 |
BlackRock Credit Allocation Income Trust (BTZ) (Percentages shown are based on Net Assets) |
| Security | Par (000) |
Value | ||||||
| Oil, Gas & Consumable Fuels (continued) | ||||||||
| Plains All American Pipeline LP, Series B, (3 mo. LIBOR US + 4.11%), 6.13%(a)(g) |
$ | 2,215 | $ | 1,956,288 | ||||
| Range Resources Corp. |
||||||||
| 5.88%, 07/01/22 |
280 | 287,000 | ||||||
| 5.00%, 08/15/22 |
559 | 569,638 | ||||||
| 5.00%, 03/15/23(f) |
551 | 570,285 | ||||||
| 4.88%, 05/15/25 |
30 | 31,050 | ||||||
| 9.25%, 02/01/26 |
111 | 122,378 | ||||||
| 8.25%, 01/15/29(b) |
93 | 104,858 | ||||||
| Rockies Express Pipeline LLC, 6.88%, 04/15/40(b) |
580 | 613,350 | ||||||
| Sabine Pass Liquefaction LLC |
||||||||
| 5.63%, 04/15/23(f) |
10,510 | 11,290,833 | ||||||
| 5.75%, 05/15/24 |
2,575 | 2,889,627 | ||||||
| 5.88%, 06/30/26 |
1,481 | 1,753,144 | ||||||
| SM Energy Co. |
||||||||
| 10.00%, 01/15/25(b) |
1,870 | 2,109,996 | ||||||
| 5.63%, 06/01/25 |
44 | 43,560 | ||||||
| 6.75%, 09/15/26 |
74 | 75,295 | ||||||
| 6.63%, 01/15/27 |
111 | 114,053 | ||||||
| Southwestern Energy Co. |
||||||||
| 4.10%, 03/15/22 |
550 | 554,125 | ||||||
| 6.45%, 01/23/25 |
214 | 236,898 | ||||||
| 7.50%, 04/01/26 |
40 | 42,350 | ||||||
| Sunoco LP/Sunoco Finance Corp. |
||||||||
| 6.00%, 04/15/27 |
141 | 147,451 | ||||||
| 5.88%, 03/15/28 |
317 | 336,813 | ||||||
| Targa Resources Partners LP/Targa Resources Partners Finance Corp. |
||||||||
| 5.88%, 04/15/26 |
669 | 702,657 | ||||||
| 5.38%, 02/01/27 |
5 | 5,206 | ||||||
| 6.50%, 07/15/27 |
228 | 247,088 | ||||||
| 6.88%, 01/15/29 |
921 | 1,037,626 | ||||||
| 5.50%, 03/01/30 |
912 | 1,002,890 | ||||||
| 4.88%, 02/01/31(b) |
64 | 69,280 | ||||||
| TransCanada PipeLines Ltd., 4.88%, 05/15/48 |
4,000 | 5,055,547 | ||||||
| Transcanada Trust, (3 mo. LIBOR US + 3.53%), 5.63%, 05/20/75(a) |
2,755 | 2,982,287 | ||||||
| Transocean, Inc., 11.50%, 01/30/27(b) |
294 | 314,196 | ||||||
| Vine Energy Holdings
LLC, |
1,286 | 1,353,515 | ||||||
| Viper Energy Partners LP, 5.38%, 11/01/27(b) |
156 | 162,507 | ||||||
| Western Midstream Operating LP |
||||||||
| 5.45%, 04/01/44 |
12 | 12,930 | ||||||
| 5.30%, 03/01/48 |
1,180 | 1,256,700 | ||||||
| 5.50%, 08/15/48 |
61 | 66,392 | ||||||
| 6.50%, 02/01/50 |
1,525 | 1,765,698 | ||||||
| Williams Cos., Inc. |
||||||||
| 3.70%, 01/15/23 |
2,245 | 2,337,803 | ||||||
| 4.55%, 06/24/24 |
527 | 580,602 | ||||||
| 8.75%, 03/15/32 |
2,478 | 3,807,697 | ||||||
| 5.10%, 09/15/45(f) |
5,075 | 6,306,619 | ||||||
|
|
|
|||||||
| 239,938,460 | ||||||||
| Personal Products — 0.0% | ||||||||
| Edgewell Personal Care Co., 5.50%, 06/01/28(b) |
140 | 148,400 | ||||||
|
|
|
|||||||
| Pharmaceuticals — 4.7% | ||||||||
| AbbVie, Inc. |
||||||||
| 5.00%, 12/15/21(f) |
1,631 | 1,646,701 | ||||||
| 2.80%, 03/15/23 |
3,000 | 3,099,446 | ||||||
| 4.75%, 03/15/45(f) |
5,485 | 6,876,807 | ||||||
| 4.70%, 05/14/45(f) |
3,255 | 4,053,274 | ||||||
| Security | Par (000) |
Value | ||||||
| Pharmaceuticals (continued) | ||||||||
| Bausch Health Americas,
Inc., |
$ | 1,137 | $ | 1,235,805 | ||||
| Bausch Health Cos., Inc.(b) |
||||||||
| 9.00%, 12/15/25 |
1,014 | 1,087,312 | ||||||
| 5.75%, 08/15/27 |
326 | 346,010 | ||||||
| 7.00%, 01/15/28 |
536 | 552,080 | ||||||
| 5.00%, 01/30/28 |
37 | 35,104 | ||||||
| 4.88%, 06/01/28 |
1,260 | 1,289,610 | ||||||
| 5.00%, 02/15/29 |
1,023 | 953,947 | ||||||
| 6.25%, 02/15/29 |
1,122 | 1,109,714 | ||||||
| 7.25%, 05/30/29 |
1,242 | 1,269,212 | ||||||
| CVS Health Corp.(f) |
||||||||
| 5.13%, 07/20/45 |
3,879 | 5,045,221 | ||||||
| 5.05%, 03/25/48 |
8,205 | 10,657,275 | ||||||
| Elanco Animal Health, Inc., 5.90%, 08/28/28 |
353 | 413,105 | ||||||
| Endo Dac/Endo Finance LLC/Endo Finco, Inc., 9.50%, 07/31/27(b) |
1,134 | 1,156,680 | ||||||
| Endo Luxembourg Finance Co. I Sarl/Endo US, Inc., 6.13%, 04/01/29(b) |
983 | 963,340 | ||||||
| Jaguar Holding Co. II/PPD Development LP(b) |
||||||||
| 4.63%, 06/15/25 |
183 | 192,150 | ||||||
| 5.00%, 06/15/28 |
1,361 | 1,475,215 | ||||||
| Jazz Securities DAC, 4.38%, 01/15/29(b) |
1,053 | 1,091,750 | ||||||
| Merck & Co., Inc., 6.50%, 12/01/33(f) |
6,420 | 9,443,452 | ||||||
| Organon & Co./Organon Foreign Debt Co-Issuer BV(b) |
||||||||
| 4.13%, 04/30/28 |
1,633 | 1,665,333 | ||||||
| 5.13%, 04/30/31 |
1,599 | 1,647,290 | ||||||
| P&L Development LLC/PLD Finance Corp., 7.75%, 11/15/25(b) |
394 | 413,700 | ||||||
| Par Pharmaceutical, Inc., 7.50%, 04/01/27(b) |
3,021 | 3,088,459 | ||||||
| Prestige Brands, Inc., 3.75%, 04/01/31(b) |
318 | 306,592 | ||||||
| Takeda Pharmaceutical Co. Ltd., 2.05%, 03/31/30(f) |
8,270 | 8,204,519 | ||||||
| Teva Pharmaceutical Finance Netherlands III BV, 7.13%, 01/31/25 |
200 | 219,500 | ||||||
|
|
|
|||||||
| 69,538,603 | ||||||||
| Producer Durables: Miscellaneous — 0.3% | ||||||||
| Oracle Corp., 3.95%, 03/25/51 |
4,425 | 4,829,838 | ||||||
|
|
|
|||||||
| Real Estate Management & Development(b) — 0.5% | ||||||||
| Five Point Operating Co. LP/Five Point Capital Corp., 7.88%, 11/15/25 |
183 | 193,285 | ||||||
| Greystar Real Estate Partners LLC, 5.75%, 12/01/25 |
360 | 370,080 | ||||||
| Howard Hughes Corp. |
||||||||
| 5.38%, 08/01/28 |
762 | 808,962 | ||||||
| 4.13%, 02/01/29 |
321 | 321,007 | ||||||
| 4.38%, 02/01/31 |
351 | 349,729 | ||||||
| Northwest Florida Timber Finance LLC, 4.75%, 03/04/29(f) |
4,485 | 4,598,421 | ||||||
| Realogy Group LLC/Realogy Co-Issuer Corp., 5.75%, 01/15/29 |
362 | 378,431 | ||||||
|
|
|
|||||||
| 7,019,915 | ||||||||
| Road & Rail — 1.8% | ||||||||
| BNSF Funding Trust I, (3 mo. LIBOR US + 2.35%), 6.61%, 12/15/55(a) |
6,125 | 7,012,145 | ||||||
| CSX Corp., 3.80%, 04/15/50 |
770 | 877,058 | ||||||
| Norfolk Southern Corp., 6.00%, 03/15/05(f) |
12,700 | 17,885,005 | ||||||
|
|
|
|||||||
| 25,774,208 | ||||||||
| Semiconductors & Semiconductor Equipment — 2.7% | ||||||||
| Analog Devices, Inc., 2.95%, 04/01/25 |
2,010 | 2,150,584 | ||||||
| S C H E D U L E O F I N V E S T M E N T S |
101 |
| Schedule of Investments (unaudited) (continued) June 30, 2021 |
BlackRock Credit Allocation Income Trust (BTZ) (Percentages shown are based on Net Assets) |
| Security | Par (000) |
Value | ||||||
| Semiconductors & Semiconductor Equipment (continued) | ||||||||
| Broadcom, Inc. |
||||||||
| 4.70%, 04/15/25(f) |
$ | 5,865 | $ | 6,607,306 | ||||
| 5.00%, 04/15/30 |
10,970 | 12,942,095 | ||||||
| Microchip Technology, Inc., 4.25%, 09/01/25 |
1,825 | 1,916,005 | ||||||
| NVIDIA Corp. |
||||||||
| 3.50%, 04/01/50(f) |
2,785 | 3,143,979 | ||||||
| 3.70%, 04/01/60 |
1,760 | 2,070,517 | ||||||
| NXP BV/NXP Funding LLC/NXP USA, Inc., 3.40%, 05/01/30(b) |
1,755 | 1,907,281 | ||||||
| ON Semiconductor Corp., 3.88%, 09/01/28(b) |
728 | 749,942 | ||||||
| QUALCOMM, Inc., 4.30%, 05/20/47(f) |
3,500 | 4,418,943 | ||||||
| Sensata Technologies BV(b) |
||||||||
| 5.63%, 11/01/24 |
695 | 772,319 | ||||||
| 5.00%, 10/01/25 |
572 | 637,065 | ||||||
| 4.00%, 04/15/29 |
433 | 439,531 | ||||||
| Sensata Technologies,
Inc., |
1,774 | 1,869,515 | ||||||
|
|
|
|||||||
| 39,625,082 | ||||||||
| Software — 1.2% | ||||||||
| Black Knight InfoServ
LLC, |
859 | 854,671 | ||||||
| Boxer Parent Co., Inc.(b) |
||||||||
| 7.13%, 10/02/25 |
764 | 817,480 | ||||||
| 9.13%, 03/01/26 |
336 | 354,655 | ||||||
| BY Crown Parent LLC/BY Bond Finance, Inc., 4.25%, 01/31/26(b)(e) |
1,108 | 1,160,630 | ||||||
| CDK Global, Inc., 4.88%, 06/01/27 |
457 | 483,278 | ||||||
| Crowdstrike Holdings, Inc., 3.00%, 02/15/29 |
470 | 470,447 | ||||||
| Elastic NV, 4.13%, 07/15/29(b) |
590 | 590,000 | ||||||
| Helios Software Holdings, Inc./ION Corporate Solutions Finance Sarl, 4.63%, 05/01/28(b) |
205 | 200,658 | ||||||
| MSCI, Inc.(b) |
||||||||
| 3.63%, 09/01/30 |
131 | 133,968 | ||||||
| 3.88%, 02/15/31 |
1,137 | 1,179,933 | ||||||
| 3.63%, 11/01/31 |
402 | 412,331 | ||||||
| Open Text Corp., 3.88%, 02/15/28(b) |
474 | 480,541 | ||||||
| Open Text Holdings, Inc., 4.13%, 02/15/30(b) |
901 | 918,840 | ||||||
| PTC, Inc.(b) |
||||||||
| 3.63%, 02/15/25 |
166 | 170,980 | ||||||
| 4.00%, 02/15/28 |
867 | 895,611 | ||||||
| Rocket Software, Inc., 6.50%, 02/15/29(b) |
1,141 | 1,132,191 | ||||||
| SS&C Technologies,
Inc., |
4,171 | 4,420,009 | ||||||
| Veritas US, Inc./Veritas Bermuda Ltd., 7.50%, 09/01/25(b) |
3,081 | 3,208,091 | ||||||
|
|
|
|||||||
| 17,884,314 | ||||||||
| Specialty Retail — 0.5% | ||||||||
| Gap, Inc., 8.88%, 05/15/27(b) |
350 | 405,020 | ||||||
| L Brands, Inc., 6.88%, 11/01/35 |
1,119 | 1,416,934 | ||||||
| PetSmart, Inc./PetSmart Finance Corp.(b) |
||||||||
| 4.75%, 02/15/28 |
731 | 759,326 | ||||||
| 7.75%, 02/15/29 |
3,203 | 3,531,307 | ||||||
| Staples, Inc.(b) |
||||||||
| 7.50%, 04/15/26 |
1,666 | 1,725,535 | ||||||
| 10.75%, 04/15/27 |
276 | 280,595 | ||||||
|
|
|
|||||||
| 8,118,717 | ||||||||
| Technology Hardware, Storage & Peripherals — 0.5% | ||||||||
| Dell International LLC/EMC
Corp. |
1,233 | 1,264,688 | ||||||
| Security | Par (000) |
Value | ||||||
| Technology Hardware, Storage & Peripherals (continued) | ||||||||
| Dell International LLC/EMC Corp. (continued) |
||||||||
| 5.85%, 07/15/25 |
$ | 2,395 | $ | 2,809,849 | ||||
| 8.35%, 07/15/46 |
2,355 | 3,851,846 | ||||||
|
|
|
|||||||
| 7,926,383 | ||||||||
| Textiles, Apparel & Luxury Goods — 0.1% | ||||||||
| Hanesbrands, Inc., 5.38%, 05/15/25(b) |
117 | 123,874 | ||||||
| Levi Strauss & Co. |
||||||||
| 5.00%, 05/01/25 |
54 | 55,080 | ||||||
| 3.50%, 03/01/31(b) |
236 | 234,631 | ||||||
| William Carter Co., 5.63%, 03/15/27(b) |
365 | 384,053 | ||||||
|
|
|
|||||||
| 797,638 | ||||||||
| Thrifts & Mortgage Finance — 0.2% | ||||||||
| Home Point Capital, Inc., 5.00%, 02/01/26(b) |
614 | 572,555 | ||||||
| Ladder Capital Finance Holdings LLLP/Ladder Capital Finance Corp., 5.25%, 10/01/25(b) |
268 | 272,690 | ||||||
| MGIC Investment Corp., 5.25%, 08/15/28 |
337 | 357,220 | ||||||
| Nationstar Mortgage Holdings, Inc.(b) |
||||||||
| 6.00%, 01/15/27 |
794 | 822,806 | ||||||
| 5.50%, 08/15/28 |
565 | 569,594 | ||||||
| 5.13%, 12/15/30 |
303 | 301,485 | ||||||
| United Wholesale Mortgage LLC, 5.50%, 04/15/29(b) |
339 | 338,922 | ||||||
|
|
|
|||||||
| 3,235,272 | ||||||||
| Tobacco — 2.0% | ||||||||
| Altria Group, Inc., 10.20%, 02/06/39(f) |
13,392 | 23,064,787 | ||||||
| BAT Capital Corp., 4.54%, 08/15/47 |
3,000 | 3,190,264 | ||||||
| Reynolds American, Inc., 5.85%, 08/15/45 |
2,335 | 2,859,104 | ||||||
|
|
|
|||||||
| 29,114,155 | ||||||||
| Transportation Infrastructure — 0.6% | ||||||||
| FedEx Corp., 5.25%, 05/15/50(e) |
6,000 | 8,140,106 | ||||||
| Signature Aviation US Holdings, Inc., 4.00%, 03/01/28(b) |
541 | 544,906 | ||||||
|
|
|
|||||||
| 8,685,012 | ||||||||
| Utilities(b) — 0.3% | ||||||||
| Midland Cogeneration Venture LP, 5.25%, 03/15/25(f) |
2,232 | 2,243,287 | ||||||
| Pattern Energy Operations LP/Pattern Energy Operations, Inc., 4.50%, 08/15/28 |
1,087 | 1,125,262 | ||||||
| Vistra Operations Co. LLC |
||||||||
| 5.63%, 02/15/27 |
812 | 842,450 | ||||||
| 4.38%, 05/01/29 |
471 | 473,355 | ||||||
|
|
|
|||||||
| 4,684,354 | ||||||||
| Wireless Telecommunication Services — 3.4% | ||||||||
| Altice France SA(b) |
||||||||
| 7.38%, 05/01/26(f) |
2,825 | 2,937,802 | ||||||
| 8.13%, 02/01/27 |
1,112 | 1,211,524 | ||||||
| 5.50%, 01/15/28 |
1,180 | 1,224,486 | ||||||
| 5.13%, 01/15/29 |
338 | 339,690 | ||||||
| 5.13%, 07/15/29 |
2,767 | 2,780,558 | ||||||
| American Tower Corp., 3.60%, 01/15/28 |
4,000 | 4,399,561 | ||||||
| Crown Castle International Corp. |
||||||||
| 3.65%, 09/01/27(f) |
8,000 | 8,820,746 | ||||||
| 4.15%, 07/01/50 |
820 | 936,221 | ||||||
| Digicel International Finance Ltd./Digicel Holdings Bermuda Ltd., 8.75%, 05/25/24(b) |
635 | 660,202 | ||||||
| SBA Communications Corp. |
||||||||
| 4.88%, 09/01/24 |
1,938 | 1,971,915 | ||||||
| 3.88%, 02/15/27 |
2,781 | 2,855,823 | ||||||
| 102 | 2 0 2 1 B L A C K R O C K S E M I - A N N U A L R E P O R T T O S H A R E H O L D E R S |
| Schedule of Investments (unaudited) (continued) June 30, 2021 |
BlackRock Credit Allocation Income Trust (BTZ) (Percentages shown are based on Net Assets) |
| Security | Par (000) |
Value | ||||||
| Wireless Telecommunication Services (continued) | ||||||||
| Sprint Corp. |
||||||||
| 7.88%, 09/15/23 |
$ | 421 | $ | 478,288 | ||||
| 7.13%, 06/15/24 |
796 | 918,385 | ||||||
| 7.63%, 03/01/26 |
1,196 | 1,459,120 | ||||||
| T-Mobile USA, Inc. |
||||||||
| 4.50%, 02/01/26 |
538 | 548,287 | ||||||
| 4.75%, 02/01/28 |
913 | 978,051 | ||||||
| 2.63%, 02/15/29 |
156 | 154,050 | ||||||
| 3.88%, 04/15/30 |
2,925 | 3,269,623 | ||||||
| 2.88%, 02/15/31 |
881 | 874,393 | ||||||
| 3.50%, 04/15/31(b) |
751 | 776,947 | ||||||
| 3.50%, 04/15/31 |
697 | 721,081 | ||||||
| Uniti Group LP/Uniti Group Finance, Inc./CSL Capital LLC, 6.50%, 02/15/29(b) |
1,355 | 1,358,388 | ||||||
| VICI Properties LP/VICI Note Co., Inc.(b) |
||||||||
| 3.50%, 02/15/25 |
946 | 964,674 | ||||||
| 4.25%, 12/01/26 |
2,963 | 3,082,172 | ||||||
| 3.75%, 02/15/27 |
1,004 | 1,021,188 | ||||||
| 4.63%, 12/01/29 |
1,298 | 1,379,125 | ||||||
| 4.13%, 08/15/30 |
3,067 | 3,149,257 | ||||||
| Vmed O2 UK Financing I PLC, 4.75%, 07/15/31(b)(i) |
974 | 988,610 | ||||||
|
|
|
|||||||
| 50,260,167 | ||||||||
|
|
|
|||||||
| Total Corporate Bonds — 111.7% |
|
1,637,353,815 | ||||||
|
|
|
|||||||
| Floating Rate Loan Interests(a) |
| |||||||
| Oil, Gas & Consumable Fuels — 0.1% | ||||||||
| Ascent Resources Utica LLC, 2020 Fixed 2nd Lien Term Loan, (3 mo. LIBOR + 9.00%, 1.00% Floor), 10.00%, 11/01/25 |
784 | 864,689 | ||||||
|
|
|
|||||||
| Total Floating Rate Loan Interests — 0.1% |
|
864,689 | ||||||
|
|
|
|||||||
| Foreign Agency Obligations |
|
|||||||
| Brazil — 0.5% | ||||||||
| Brazilian Government International Bond, 5.00%, 01/27/45 |
6,525 | 6,615,942 | ||||||
|
|
|
|||||||
| Colombia — 0.3% | ||||||||
| Colombia Government International Bond, 5.63%, 02/26/44 |
4,000 | 4,525,750 | ||||||
|
|
|
|||||||
| Indonesia — 0.3% | ||||||||
| Indonesia Government International Bond, 5.88%, 01/15/24(b) |
4,400 | 4,964,575 | ||||||
|
|
|
|||||||
| Mexico — 0.4% | ||||||||
| Mexico Government International Bond, 4.75%, 03/08/44(f) |
5,800 | 6,422,775 | ||||||
|
|
|
|||||||
| Security | Par (000) |
Value | ||||||
| Uruguay — 0.3% | ||||||||
| Uruguay Government International Bond, 5.10%, 06/18/50 |
$ | 3,500 | $ | 4,582,375 | ||||
|
|
|
|||||||
| Total Foreign Agency Obligations — 1.8% |
|
27,111,417 | ||||||
|
|
|
|||||||
| Municipal Bonds |
||||||||
| New York — 0.9% | ||||||||
| Metropolitan Transportation Authority, RB, BAB, 6.55%, 11/15/31 |
10,000 | 13,180,000 | ||||||
|
|
|
|||||||
| Total Municipal Bonds — 0.9% |
|
13,180,000 | ||||||
|
|
|
|||||||
| Preferred Securities |
||||||||
| Capital Trusts — 14.5% | ||||||||
| Automobiles — 0.2% | ||||||||
| General Motors Financial Co., Inc., Series C, 5.70%(a)(g) |
2,565 | 2,872,800 | ||||||
|
|
|
|||||||
| Banks(a)(g) — 4.0% | ||||||||
| CIT Group, Inc., Series A, 5.80% |
3,000 | 3,098,610 | ||||||
| HSBC Capital Funding Dollar 1 LP, 10.18%(b)(f) |
11,835 | 19,592,132 | ||||||
| Huntington Bancshares, Inc., Series F, 5.63% |
6,450 | 7,490,063 | ||||||
| Macquarie Bank Ltd., 6.13%(b) |
1,885 | 2,061,719 | ||||||
| Nordea Bank Abp, 6.13%(b) |
5,540 | 6,104,415 | ||||||
| SVB Financial Group, Series C, 4.00% |
5,000 | 5,089,000 | ||||||
| US Bancorp, Series J, 5.30%(f) |
10,415 | 11,742,912 | ||||||
| Wells Fargo & Co. |
||||||||
| Series S, 5.90% |
281 | 302,778 | ||||||
| Series U, 5.88% |
2,655 | 2,973,361 | ||||||
|
|
|
|||||||
| 58,454,990 | ||||||||
| Capital Markets — 0.0% | ||||||||
| State Street Corp., Series F, 3.72%(a)(g) |
618 | 618,494 | ||||||
|
|
|
|||||||
| Consumer Finance(a)(g) — 0.6% | ||||||||
| American Express Co., Series C, 3.40% |
4,510 | 4,515,637 | ||||||
| Capital One Financial Corp., Series E, 3.93% |
5,000 | 5,017,900 | ||||||
|
|
|
|||||||
| 9,533,537 | ||||||||
| Diversified Financial Services — 7.0% | ||||||||
| Bank of America Corp., Series AA, 6.10%(a)(g) |
8,630 | 9,690,368 | ||||||
| Bank of America Corp., Series U, 5.20%(a)(f)(g) |
5,785 | 6,017,846 | ||||||
| Barclays PLC, 8.00%(a)(g) |
4,500 | 5,118,750 | ||||||
| BNP Paribas SA(a)(b)(f)(g) |
||||||||
| 7.20% |
5,000 | 5,337,500 | ||||||
| 6.75% |
5,000 | 5,170,050 | ||||||
| BNP Paribas SA, 7.38%(a)(b)(g) |
4,535 | 5,286,087 | ||||||
| Citigroup, Inc., 5.90%(a)(g) |
2,210 | 2,332,611 | ||||||
| Credit Agricole SA, 8.13%(a)(b)(g) |
5,000 | 6,075,000 | ||||||
| Credit Suisse Group AG, 7.50%(a)(b)(g) |
1,865 | 2,028,187 | ||||||
| HSBC Holdings PLC, 6.50%(a)(g) |
2,615 | 2,999,091 | ||||||
| JPMorgan Chase & Co., 8.75%, 09/01/30 |
2,000 | 3,003,950 | ||||||
| JPMorgan Chase & Co., Series Q, 5.15%(a)(g) |
4,000 | 4,130,000 | ||||||
| S C H E D U L E O F I N V E S T M E N T S |
103 |
| Schedule of Investments (unaudited) (continued) June 30, 2021 |
BlackRock Credit Allocation Income Trust (BTZ) (Percentages shown are based on Net Assets) |
| Security | Par (000) |
Value | ||||||
| Diversified Financial Services (continued) | ||||||||
| JPMorgan Chase & Co.(a)(f)(g) |
||||||||
| Series R, 6.00% |
$ | 7,408 | $ | 7,875,630 | ||||
| Series S, 6.75% |
9,775 | 10,839,009 | ||||||
| Lloyds Banking Group PLC, 7.50%(a)(g) |
8,285 | 9,693,450 | ||||||
| Natwest Group PLC, 8.00%(a)(g) |
970 | 1,147,093 | ||||||
| Natwest Group PLC, 8.63%(a)(f)(g) |
5,135 | 5,172,075 | ||||||
| Societe Generale SA, 7.38%(a)(b)(g) |
1,980 | 1,997,424 | ||||||
| UBS Group AG, 7.00%(a)(b)(f)(g) |
7,500 | 8,259,375 | ||||||
|
|
|
|||||||
| 102,173,496 | ||||||||
| Electric Utilities — 0.6% | ||||||||
| PPL Capital Funding, Inc., Series A, 2.81%, 03/30/67(a)(e) |
8,300 | 8,154,750 | ||||||
|
|
|
|||||||
| Insurance — 1.5% | ||||||||
| ACE Capital Trust II, 9.70%, 04/01/30(f) |
7,000 | 10,683,756 | ||||||
| Equitable of Iowa Cos. Capital Trust II, Series B, 8.42%, 04/01/27 |
5,000 | 5,125,985 | ||||||
| MetLife, Inc., 6.40%, 12/15/36 |
5,000 | 6,421,613 | ||||||
|
|
|
|||||||
| 22,231,354 | ||||||||
| Oil, Gas & Consumable Fuels — 0.2% | ||||||||
| Enterprise Products Operating LLC, 2.91%, 06/01/67(a) |
2,500 | 2,275,000 | ||||||
|
|
|
|||||||
| Wireless Telecommunication Services — 0.4% | ||||||||
| Vodafone Group PLC, 7.00%, 04/04/79(a) |
4,745 | 5,749,660 | ||||||
|
|
|
|||||||
| Total Capital Trusts — 14.5% |
212,064,081 | |||||||
|
|
|
|||||||
| Shares | ||||||||
| Preferred Stocks — 3.2% | ||||||||
| Banks(a)(g) — 2.0% | ||||||||
| Citigroup, Inc., Series K, 6.88% |
488,320 | 13,990,368 | ||||||
| Wells Fargo & Co., Series Q, 5.85% |
550,500 | 15,166,275 | ||||||
|
|
|
|||||||
| 29,156,643 | ||||||||
| Capital Markets(a)(g) — 0.7% | ||||||||
| Goldman Sachs Group, Inc., Series J, 5.50% |
162,450 | 4,451,130 | ||||||
| State Street Corp., Series D, 5.90% |
220,495 | 6,317,182 | ||||||
|
|
|
|||||||
| 10,768,312 | ||||||||
| Equity Real Estate Investment Trusts (REITs) — 0.1% | ||||||||
| Vornado Realty Trust, Series K, 5.70%(g) |
50,000 | 1,301,000 | ||||||
|
|
|
|||||||
| Interactive Media & Services — 0.4% | ||||||||
| ByteDance Ltd., Series E-1, (Acquired 11/11/20, |
32,185 | 5,459,703 | ||||||
|
|
|
|||||||
| Total Preferred Stocks — 3.2% |
46,685,658 | |||||||
|
|
|
|||||||
| Total Preferred Securities — 17.7% |
258,749,739 | |||||||
|
|
|
|||||||
| Total Long-Term Investments — 138.1% |
2,023,069,601 | |||||||
|
|
|
|||||||
| Security |
Shares |
Value | ||||||
|
|
||||||||
| Short-Term Securities |
||||||||
| Money Market Funds — 0.7% | ||||||||
| BlackRock Liquidity Funds, T-Fund, Institutional Class, 0.01%(j)(k) |
10,753,181 | $ | 10,753,181 | |||||
|
|
|
|||||||
| Total Short-Term Securities — 0.7% |
10,753,181 | |||||||
|
|
|
|||||||
| Options Purchased — 0.1% |
1,144,657 | |||||||
|
|
|
|||||||
| Total Investments Before Options |
|
2,034,967,439 | ||||||
|
|
|
|||||||
| Options Written — (0.0)% |
(153,796 | ) | ||||||
|
|
|
|||||||
| Total Investments, Net of Options |
|
2,034,813,643 | ||||||
| Liabilities in Excess of Other Assets — (38.9)% |
|
(569,724,990 | ) | |||||
|
|
|
|||||||
| Net Assets — 100.0% |
$ | 1,465,088,653 | ||||||
|
|
|
|||||||
| (a) | Variable rate security. Interest rate resets periodically. The rate shown is the effective interest rate as of period end. Security description also includes the reference rate and spread if published and available. |
| (b) | Security exempt from registration pursuant to Rule 144A under the Securities Act of 1933, as amended. These securities may be resold in transactions exempt from registration to qualified institutional investors. |
| (c) | Security is valued using significant unobservable inputs and is classified as Level 3 in the fair value hierarchy. |
| (d) | Restricted security as to resale, excluding 144A securities. The Trust held restricted securities with a current value of $6,083,999, representing 0.4% of its net assets as of period end, and an original cost of $3,668,675. |
| (e) | All or a portion of the security has been pledged and/or segregated as collateral in connection with outstanding exchange-traded options written. |
| (f) | All or a portion of the security has been pledged as collateral in connection with outstanding reverse repurchase agreements. |
| (g) | Perpetual security with no stated maturity date. |
| (h) | Payment-in-kind security which may pay interest/dividends in additional par/shares and/or in cash. Rates shown are the current rate and possible payment rates. |
| (i) | When-issued security. |
| (j) | Affiliate of the Trust. |
| (k) | Annualized 7-day yield as of period end. |
For Trust compliance purposes, the Trust’s industry classifications refer to one or more of the industry sub-classifications used by one or more widely recognized market indexes or rating group indexes, and/or as defined by the investment adviser. These definitions may not apply for purposes of this report, which may combine such industry sub-classifications for reporting ease.
| 104 | 2 0 2 1 B L A C K R O C K S E M I - A N N U A L R E P O R T T O S H A R E H O L D E R S |
| Schedule of Investments (unaudited) (continued) June 30, 2021 |
BlackRock Credit Allocation Income Trust (BTZ) |
Affiliates
Investments in issuers considered to be affiliate(s) of the Trust during the six-months ended June 30, 2021 for purposes of Section 2(a)(3) of the Investment Company Act of 1940, as amended, were as follows:
| Affiliated Issuer | Value at 12/31/20 |
Purchases at Cost |
Proceeds from Sales |
Net Realized Gain (Loss) |
Change in Unrealized Appreciation (Depreciation) |
Value at 06/30/21 |
Shares Held at 06/30/21 |
Income | Capital Gain Distributions from Underlying Funds |
|||||||||||||||||||||||||||
| BlackRock Liquidity Funds, T-Fund, Institutional Class |
$ | 24,122,699 | $ | — | $ | (13,369,518 | )(a) | $ | — | $ | — | $ | 10,753,181 | 10,753,181 | $ | 1,368 | $ | — | ||||||||||||||||||
|
|
|
|
|
|
|
|
|
|
|
|||||||||||||||||||||||||||
| (a) | Represents net amount purchased (sold). |
Reverse Repurchase Agreements
|
|
||||||||||||||||||||||||||
| Interest | Trade | Maturity | Face Value Including |
Type of Non-Cash Underlying | Remaining Contractual Maturity |
|||||||||||||||||||||
| Counterparty | Rate | Date | Date | (a) | Face Value | Accrued Interest | Collateral | of the Agreements(a | ) | |||||||||||||||||
|
|
||||||||||||||||||||||||||
| J.P. Morgan Securities LLC |
0.75 | %(b) | 03/19/21 | Open | $ | 580,520 | $ | 581,778 | Corporate Bonds | Open/Demand | ||||||||||||||||
| BNP Paribas S.A. |
0.55 | (b) | 04/06/21 | Open | 6,348,862 | 6,357,107 | Corporate Bonds | Open/Demand | ||||||||||||||||||
| BNP Paribas S.A. |
0.60 | (b) | 04/06/21 | Open | 13,856,017 | 13,875,647 | Corporate Bonds | Open/Demand | ||||||||||||||||||
| Credit Suisse Securities (USA) LLC |
0.25 | (b) | 04/06/21 | Open | 449,065 | 449,330 | Corporate Bonds | Open/Demand | ||||||||||||||||||
| Barclays Capital, Inc. |
0.40 | (b) | 04/07/21 | Open | 5,938,500 | 5,944,043 | Corporate Bonds | Open/Demand | ||||||||||||||||||
| Barclays Capital, Inc. |
0.40 | (b) | 04/07/21 | Open | 6,277,500 | 6,283,359 | Corporate Bonds | Open/Demand | ||||||||||||||||||
| Barclays Capital, Inc. |
0.40 | (b) | 04/07/21 | Open | 948,750 | 949,636 | Corporate Bonds | Open/Demand | ||||||||||||||||||
| Barclays Capital, Inc. |
0.40 | (b) | 04/07/21 | Open | 4,281,446 | 4,285,442 | Corporate Bonds | Open/Demand | ||||||||||||||||||
| Barclays Capital, Inc. |
0.40 | (b) | 04/07/21 | Open | 5,018,488 | 5,023,171 | Capital Trusts | Open/Demand | ||||||||||||||||||
| Barclays Capital, Inc. |
0.40 | (b) | 04/07/21 | Open | 5,256,250 | 5,261,156 | Corporate Bonds | Open/Demand | ||||||||||||||||||
| Barclays Capital, Inc. |
0.40 | (b) | 04/07/21 | Open | 5,372,812 | 5,377,827 | Corporate Bonds | Open/Demand | ||||||||||||||||||
| Barclays Capital, Inc. |
0.60 | (b) | 04/07/21 | Open | 1,174,668 | 1,176,312 | Corporate Bonds | Open/Demand | ||||||||||||||||||
| Credit Suisse Securities (USA) LLC |
0.30 | (b) | 04/07/21 | Open | 8,327,620 | 8,333,449 | Corporate Bonds | Open/Demand | ||||||||||||||||||
| Credit Suisse Securities (USA) LLC |
0.45 | (b) | 04/07/21 | Open | 3,002,889 | 3,006,042 | Corporate Bonds | Open/Demand | ||||||||||||||||||
| Credit Suisse Securities (USA) LLC |
0.45 | (b) | 04/07/21 | Open | 3,880,000 | 3,884,074 | Corporate Bonds | Open/Demand | ||||||||||||||||||
| Credit Suisse Securities (USA) LLC |
0.45 | (b) | 04/07/21 | Open | 1,436,120 | 1,437,628 | Corporate Bonds | Open/Demand | ||||||||||||||||||
| Credit Suisse Securities (USA) LLC |
0.45 | (b) | 04/07/21 | Open | 3,478,954 | 3,482,607 | Corporate Bonds | Open/Demand | ||||||||||||||||||
| Credit Suisse Securities (USA) LLC |
0.60 | (b) | 04/07/21 | Open | 1,013,528 | 1,014,946 | Corporate Bonds | Open/Demand | ||||||||||||||||||
| Credit Suisse Securities (USA) LLC |
0.60 | (b) | 04/07/21 | Open | 2,067,086 | 2,069,980 | Corporate Bonds | Open/Demand | ||||||||||||||||||
| RBC Capital Markets LLC |
0.45 | (b) | 04/07/21 | Open | 2,701,350 | 2,704,186 | Corporate Bonds | Open/Demand | ||||||||||||||||||
| BNP Paribas S.A. |
0.55 | (b) | 04/08/21 | Open | 5,281,250 | 5,288,028 | Corporate Bonds | Open/Demand | ||||||||||||||||||
| RBC Capital Markets LLC |
0.45 | (b) | 04/12/21 | Open | 8,966,700 | 8,975,555 | Corporate Bonds | Open/Demand | ||||||||||||||||||
| RBC Capital Markets LLC |
0.45 | (b) | 04/12/21 | Open | 9,273,600 | 9,282,758 | Corporate Bonds | Open/Demand | ||||||||||||||||||
| RBC Capital Markets LLC |
0.45 | (b) | 04/12/21 | Open | 2,878,758 | 2,881,600 | Corporate Bonds | Open/Demand | ||||||||||||||||||
| RBC Capital Markets LLC |
0.45 | (b) | 04/12/21 | Open | 18,564,594 | 18,582,926 | Corporate Bonds | Open/Demand | ||||||||||||||||||
| RBC Capital Markets LLC |
0.45 | (b) | 04/12/21 | Open | 2,893,359 | 2,896,216 | Corporate Bonds | Open/Demand | ||||||||||||||||||
| RBC Capital Markets LLC |
0.85 | (b) | 04/12/21 | Open | 3,129,503 | 3,135,340 | Corporate Bonds | Open/Demand | ||||||||||||||||||
| RBC Capital Markets LLC |
0.85 | (b) | 04/12/21 | Open | 10,242,900 | 10,262,006 | Corporate Bonds | Open/Demand | ||||||||||||||||||
| BNP Paribas S.A. |
0.28 | (b) | 04/13/21 | Open | 3,841,375 | 3,843,735 | Corporate Bonds | Open/Demand | ||||||||||||||||||
| J.P. Morgan Securities LLC |
0.28 | (b) | 04/29/21 | Open | 3,283,556 | 3,285,140 | Corporate Bonds | Open/Demand | ||||||||||||||||||
| J.P. Morgan Securities LLC |
0.30 | (b) | 04/29/21 | Open | 3,242,969 | 3,244,644 | Corporate Bonds | Open/Demand | ||||||||||||||||||
| J.P. Morgan Securities LLC |
0.30 | (b) | 04/29/21 | Open | 3,505,781 | 3,507,593 | Corporate Bonds | Open/Demand | ||||||||||||||||||
| Credit Suisse Securities (USA) LLC |
0.45 | (b) | 05/03/21 | Open | 1,746,420 | 1,747,708 | Corporate Bonds | Open/Demand | ||||||||||||||||||
| RBC Capital Markets LLC |
0.28 | (b) | 05/14/21 | Open | 4,558,200 | 4,559,902 | Corporate Bonds | Open/Demand | ||||||||||||||||||
| RBC Capital Markets LLC |
0.28 | (b) | 05/14/21 | Open | 4,591,231 | 4,592,945 | Corporate Bonds | Open/Demand | ||||||||||||||||||
| RBC Capital Markets LLC |
0.42 | (b) | 05/14/21 | Open | 3,550,564 | 3,552,552 | Corporate Bonds | Open/Demand | ||||||||||||||||||
| BNP Paribas S.A. |
0.30 | (b) | 06/02/21 | Open | 513,600 | 513,778 | Corporate Bonds | Open/Demand | ||||||||||||||||||
| BNP Paribas S.A. |
0.30 | (b) | 06/02/21 | Open | 4,241,013 | 4,242,479 | Corporate Bonds | Open/Demand | ||||||||||||||||||
| BNP Paribas S.A. |
0.43 | (b) | 06/02/21 | Open | 1,082,500 | 1,082,862 | Corporate Bonds | Open/Demand | ||||||||||||||||||
| BNP Paribas S.A. |
0.45 | (b) | 06/02/21 | Open | 5,693,750 | 5,695,743 | Corporate Bonds | Open/Demand | ||||||||||||||||||
| BNP Paribas S.A. |
0.45 | (b) | 06/02/21 | Open | 3,078,125 | 3,079,202 | Corporate Bonds | Open/Demand | ||||||||||||||||||
| BNP Paribas S.A. |
0.55 | (b) | 06/02/21 | Open | 3,740,625 | 3,742,506 | Corporate Bonds | Open/Demand | ||||||||||||||||||
| BNP Paribas S.A. |
0.55 | (b) | 06/02/21 | Open | 4,749,875 | 4,752,263 | Capital Trusts | Open/Demand | ||||||||||||||||||
| BNP Paribas S.A. |
0.65 | (b) | 06/02/21 | Open | 2,073,945 | 2,074,993 | Corporate Bonds | Open/Demand | ||||||||||||||||||
| BNP Paribas S.A. |
0.45 | (b) | 06/03/21 | Open | 1,571,876 | 1,572,407 | Corporate Bonds | Open/Demand | ||||||||||||||||||
| BNP Paribas S.A. |
0.45 | (b) | 06/03/21 | Open | 9,887,500 | 9,890,837 | Capital Trusts | Open/Demand | ||||||||||||||||||
| BNP Paribas S.A. |
0.65 | (b) | 06/03/21 | Open | 651,758 | 652,075 | Corporate Bonds | Open/Demand | ||||||||||||||||||
| S C H E D U L E O F I N V E S T M E N T S |
105 |
| Schedule of Investments (unaudited) (continued) June 30, 2021 |
BlackRock Credit Allocation Income Trust (BTZ) |
Reverse Repurchase Agreements (continued)
|
|
||||||||||||||||||||||||||||
| Interest | Trade | Maturity | Face Value Including |
Type of Non-Cash Underlying | Remaining Contractual Maturity |
|||||||||||||||||||||||
| Counterparty | Rate | Date | Date | (a) | Face Value | Accrued Interest | Collateral | of the Agreements(a | ) | |||||||||||||||||||
|
|
||||||||||||||||||||||||||||
| BNP Paribas S.A. |
0.65 | %(b) | 06/03/21 | Open | $ | 15,300,495 | $ | 15,307,954 | Corporate Bonds | Open/Demand | ||||||||||||||||||
| Barclays Capital, Inc. |
0.30 | (b) | 06/08/21 | Open | 5,772,962 | 5,774,021 | Corporate Bonds | Open/Demand | ||||||||||||||||||||
| Barclays Capital, Inc. |
0.30 | (b) | 06/08/21 | Open | 5,652,460 | 5,653,497 | Foreign Agency Obligations | Open/Demand | ||||||||||||||||||||
| Barclays Capital, Inc. |
0.30 | (b) | 06/08/21 | Open | 4,839,244 | 4,840,131 | Corporate Bonds | Open/Demand | ||||||||||||||||||||
| RBC Capital Markets LLC |
0.28 | (b) | 06/08/21 | Open | 9,511,500 | 9,513,128 | Corporate Bonds | Open/Demand | ||||||||||||||||||||
| RBC Capital Markets LLC |
0.28 | (b) | 06/08/21 | Open | 2,075,000 | 2,075,355 | Corporate Bonds | Open/Demand | ||||||||||||||||||||
| RBC Capital Markets LLC |
0.28 | (b) | 06/08/21 | Open | 2,205,000 | 2,205,377 | Corporate Bonds | Open/Demand | ||||||||||||||||||||
| RBC Capital Markets LLC |
0.28 | (b) | 06/08/21 | Open | 6,579,125 | 6,580,251 | Corporate Bonds | Open/Demand | ||||||||||||||||||||
| RBC Capital Markets LLC |
0.28 | (b) | 06/08/21 | Open | 7,044,375 | 7,045,580 | Corporate Bonds | Open/Demand | ||||||||||||||||||||
| RBC Capital Markets LLC |
0.28 | (b) | 06/08/21 | Open | 4,261,469 | 4,262,198 | Corporate Bonds | Open/Demand | ||||||||||||||||||||
| RBC Capital Markets LLC |
0.28 | (b) | 06/08/21 | Open | 7,164,912 | 7,166,138 | Corporate Bonds | Open/Demand | ||||||||||||||||||||
| RBC Capital Markets LLC |
0.28 | (b) | 06/08/21 | Open | 7,660,087 | 7,661,398 | Corporate Bonds | Open/Demand | ||||||||||||||||||||
| RBC Capital Markets LLC |
0.28 | (b) | 06/08/21 | Open | 21,711,780 | 21,715,495 | Corporate Bonds | Open/Demand | ||||||||||||||||||||
| RBC Capital Markets LLC |
0.28 | (b) | 06/08/21 | Open | 2,892,500 | 2,892,995 | Corporate Bonds | Open/Demand | ||||||||||||||||||||
| RBC Capital Markets LLC |
0.28 | (b) | 06/08/21 | Open | 7,543,594 | 7,544,885 | Corporate Bonds | Open/Demand | ||||||||||||||||||||
| RBC Capital Markets LLC |
0.28 | (b) | 06/08/21 | Open | 3,437,528 | 3,438,116 | Corporate Bonds | Open/Demand | ||||||||||||||||||||
| RBC Capital Markets LLC |
0.40 | (b) | 06/08/21 | Open | 4,698,750 | 4,699,899 | Corporate Bonds | Open/Demand | ||||||||||||||||||||
| RBC Capital Markets LLC |
0.40 | (b) | 06/08/21 | Open | 10,273,525 | 10,276,036 | Corporate Bonds | Open/Demand | ||||||||||||||||||||
| RBC Capital Markets LLC |
0.40 | (b) | 06/08/21 | Open | 3,847,575 | 3,848,516 | Corporate Bonds | Open/Demand | ||||||||||||||||||||
| Barclays Capital, Inc. |
0.30 | (b) | 06/09/21 | Open | 9,371,781 | 9,373,421 | Capital Trusts | Open/Demand | ||||||||||||||||||||
| Barclays Capital, Inc. |
0.30 | (b) | 06/09/21 | Open | 6,824,620 | 6,825,814 | Capital Trusts | Open/Demand | ||||||||||||||||||||
| Barclays Capital, Inc. |
0.50 | (b) | 06/09/21 | Open | 7,402,500 | 7,404,659 | Corporate Bonds | Open/Demand | ||||||||||||||||||||
| Barclays Capital, Inc. |
0.50 | (b) | 06/09/21 | Open | 17,086,781 | 17,091,765 | Capital Trusts | Open/Demand | ||||||||||||||||||||
| Barclays Capital, Inc. |
0.50 | (b) | 06/09/21 | Open | 479,400 | 479,540 | Corporate Bonds | Open/Demand | ||||||||||||||||||||
| RBC Capital Markets LLC |
0.28 | (b) | 06/09/21 | Open | 7,642,500 | 7,643,748 | Corporate Bonds | Open/Demand | ||||||||||||||||||||
| RBC Capital Markets LLC |
0.28 | (b) | 06/09/21 | Open | 3,942,256 | 3,942,900 | Corporate Bonds | Open/Demand | ||||||||||||||||||||
| RBC Capital Markets LLC |
0.28 | (b) | 06/09/21 | Open | 790,149 | 790,278 | Corporate Bonds | Open/Demand | ||||||||||||||||||||
| RBC Capital Markets LLC |
0.28 | (b) | 06/09/21 | Open | 6,460,000 | 6,461,055 | Corporate Bonds | Open/Demand | ||||||||||||||||||||
| RBC Capital Markets LLC |
0.28 | (b) | 06/09/21 | Open | 5,700,000 | 5,700,931 | Corporate Bonds | Open/Demand | ||||||||||||||||||||
| RBC Capital Markets LLC |
0.28 | (b) | 06/09/21 | Open | 7,537,500 | 7,538,731 | Corporate Bonds | Open/Demand | ||||||||||||||||||||
| RBC Capital Markets LLC |
0.28 | (b) | 06/09/21 | Open | 15,750,000 | 15,752,572 | Corporate Bonds | Open/Demand | ||||||||||||||||||||
| RBC Capital Markets LLC |
0.28 | (b) | 06/09/21 | Open | 8,613,469 | 8,614,876 | Corporate Bonds | Open/Demand | ||||||||||||||||||||
| RBC Capital Markets LLC |
0.28 | (b) | 06/09/21 | Open | 5,556,937 | 5,557,845 | Corporate Bonds | Open/Demand | ||||||||||||||||||||
| RBC Capital Markets LLC |
0.28 | (b) | 06/09/21 | Open | 10,390,000 | 10,391,697 | Corporate Bonds | Open/Demand | ||||||||||||||||||||
| RBC Capital Markets LLC |
0.28 | (b) | 06/09/21 | Open | 8,819,475 | 8,820,916 | Corporate Bonds | Open/Demand | ||||||||||||||||||||
| RBC Capital Markets LLC |
0.28 | (b) | 06/09/21 | Open | 15,660,000 | 15,662,558 | Corporate Bonds | Open/Demand | ||||||||||||||||||||
| RBC Capital Markets LLC |
0.28 | (b) | 06/09/21 | Open | 3,591,000 | 3,591,587 | Corporate Bonds | Open/Demand | ||||||||||||||||||||
| RBC Capital Markets LLC |
0.28 | (b) | 06/09/21 | Open | 14,737,500 | 14,739,907 | Corporate Bonds | Open/Demand | ||||||||||||||||||||
| RBC Capital Markets LLC |
0.28 | (b) | 06/09/21 | Open | 9,320,375 | 9,321,897 | Corporate Bonds | Open/Demand | ||||||||||||||||||||
| RBC Capital Markets LLC |
0.28 | (b) | 06/09/21 | Open | 9,784,462 | 9,786,061 | Corporate Bonds | Open/Demand | ||||||||||||||||||||
| RBC Capital Markets LLC |
0.28 | (b) | 06/09/21 | Open | 8,370,000 | 8,371,367 | Corporate Bonds | Open/Demand | ||||||||||||||||||||
| RBC Capital Markets LLC |
0.40 | (b) | 06/10/21 | Open | 2,696,760 | 2,697,389 | Corporate Bonds | Open/Demand | ||||||||||||||||||||
| Barclays Capital, Inc. |
(3.00 | )(b) | 06/11/21 | Open | 468,374 | 467,710 | Corporate Bonds | Open/Demand | ||||||||||||||||||||
| Barclays Capital, Inc. |
0.30 | (b) | 06/11/21 | Open | 5,347,781 | 5,348,539 | Corporate Bonds | Open/Demand | ||||||||||||||||||||
| Barclays Capital, Inc. |
0.30 | (b) | 06/11/21 | Open | 3,905,000 | 3,905,553 | Corporate Bonds | Open/Demand | ||||||||||||||||||||
| Barclays Capital, Inc. |
0.30 | (b) | 06/11/21 | Open | 4,987,500 | 4,988,207 | Corporate Bonds | Open/Demand | ||||||||||||||||||||
| Barclays Capital, Inc. |
0.30 | (b) | 06/11/21 | Open | 6,082,182 | 6,083,044 | Corporate Bonds | Open/Demand | ||||||||||||||||||||
| Barclays Capital, Inc. |
0.30 | (b) | 06/11/21 | Open | 10,063,494 | 10,064,919 | Capital Trusts | Open/Demand | ||||||||||||||||||||
| Barclays Capital, Inc. |
0.30 | (b) | 06/11/21 | Open | 5,075,000 | 5,075,719 | Corporate Bonds | Open/Demand | ||||||||||||||||||||
| Barclays Capital, Inc. |
0.50 | (b) | 06/11/21 | Open | 1,692,143 | 1,692,542 | Corporate Bonds | Open/Demand | ||||||||||||||||||||
| Barclays Capital, Inc. |
0.55 | (b) | 06/11/21 | Open | 1,931,250 | 1,931,752 | Corporate Bonds | Open/Demand | ||||||||||||||||||||
| Credit Suisse Securities (USA) LLC |
(3.00 | )(b) | 06/11/21 | Open | 206,483 | 206,190 | Corporate Bonds | Open/Demand | ||||||||||||||||||||
| BNP Paribas S.A. |
(1.00 | )(b) | 06/22/21 | Open | 111,925 | 111,900 | Corporate Bonds | Open/Demand | ||||||||||||||||||||
| Barclays Capital, Inc. |
0.50 | (b) | 06/29/21 | Open | 6,796,875 | 6,796,969 | Capital Trusts | Open/Demand | ||||||||||||||||||||
| Barclays Capital, Inc. |
0.50 | (b) | 06/29/21 | Open | 4,212,500 | 4,212,559 | Capital Trusts | Open/Demand | ||||||||||||||||||||
| Barclays Capital, Inc. |
0.50 | (b) | 06/29/21 | Open | 5,906,250 | 5,906,332 | Corporate Bonds | Open/Demand | ||||||||||||||||||||
| Barclays Capital, Inc. |
0.50 | (b) | 06/29/21 | Open | 4,468,750 | 4,468,812 | Capital Trusts | Open/Demand | ||||||||||||||||||||
|
|
|
|
|
|||||||||||||||||||||||||
| $ | 588,500,605 | $ | 588,758,744 | |||||||||||||||||||||||||
|
|
|
|
|
|||||||||||||||||||||||||
| (a) | Certain agreements have no stated maturity and can be terminated by either party at any time. |
| (b) | Variable rate security. Rate as of period end and maturity is the date the principal owed can be recovered through demand. |
| 106 | 2 0 2 1 B L A C K R O C K S E M I - A N N U A L R E P O R T T O S H A R E H O L D E R S |
| Schedule of Investments (unaudited) (continued) June 30, 2021 |
BlackRock Credit Allocation Income Trust (BTZ) |
Derivative Financial Instruments Outstanding as of Period End
Futures Contracts
| Description | Number of Contracts |
Expiration Date |
Notional Amount (000) |
Value/ Unrealized Appreciation (Depreciation) |
||||||||||||
| Long Contracts |
||||||||||||||||
| Ultra U.S. Treasury Bond |
98 | 09/21/21 | $ | 18,865 | $ | 801,308 | ||||||||||
|
|
|
|||||||||||||||
| Short Contracts |
||||||||||||||||
| 10-Year U.S. Treasury Note |
1,679 | 09/21/21 | 222,336 | (1,282,174 | ) | |||||||||||
| 10-Year U.S. Ultra Long Treasury Note |
68 | 09/21/21 | 10,000 | (164,362 | ) | |||||||||||
| U.S. Long Bond |
107 | 09/21/21 | 17,180 | (523,452 | ) | |||||||||||
| 5-Year U.S. Treasury Note |
127 | 09/30/21 | 15,670 | 49,416 | ||||||||||||
|
|
|
|||||||||||||||
| (1,920,572 | ) | |||||||||||||||
|
|
|
|||||||||||||||
| $ | (1,119,264 | ) | ||||||||||||||
|
|
|
|||||||||||||||
Exchange-Traded Options Purchased
| Description | Number of Contracts |
Expiration Date |
Exercise Price | Notional Amount (000) |
Value | |||||||||||||||||||||||||||
| Call | ||||||||||||||||||||||||||||||||
| Financial Select Sector SPDR Fund |
10,827 | 07/02/21 | USD | 38.00 | USD | 39,724 | $ | 16,241 | ||||||||||||||||||||||||
| Energy Select Sector SPDR Fund |
3,412 | 07/16/21 | USD | 56.00 | USD | 18,380 | 151,834 | |||||||||||||||||||||||||
| SPDR S&P 500 ETF Trust |
2,107 | 07/16/21 | USD | 432.00 | USD | 90,192 | 364,511 | |||||||||||||||||||||||||
| Financial Select Sector SPDR Fund |
8,770 | 07/23/21 | USD | 37.50 | USD | 32,177 | 267,485 | |||||||||||||||||||||||||
| Alerian MLP ETF |
7,352 | 07/30/21 | USD | 40.50 | USD | 26,769 | 91,900 | |||||||||||||||||||||||||
| Energy Select Sector SPDR Fund |
2,707 | 08/20/21 | USD | 58.00 | USD | 14,583 | 243,630 | |||||||||||||||||||||||||
|
|
|
|||||||||||||||||||||||||||||||
| $ | 1,135,601 | |||||||||||||||||||||||||||||||
|
|
|
|||||||||||||||||||||||||||||||
OTC Interest Rate Swaptions Purchased
|
|
Paid by the Trust | Received by the Trust |
|
Expiration | Exercise | Notional |
|
|||||||||||||||||||||||||||||
| Description | Rate | Frequency | Rate | Frequency | Counterparty | Date | Rate | Amount (000) | Value | |||||||||||||||||||||||||||
| Put |
||||||||||||||||||||||||||||||||||||
| 30-Year Interest Rate Swap, 08/15/51 |
2.50% | Semi-Annual | |
3-Month LIBOR, 0.15% |
|
Quarterly | |
JPMorgan Chase Bank N.A. |
|
08/13/21 | 2.50 | % | USD | 40,000 | $ | 9,056 | ||||||||||||||||||||
|
|
|
|||||||||||||||||||||||||||||||||||
Exchange-Traded Options Written
| Description | Number of Contracts |
Expiration Date |
Exercise Price | Notional Amount (000) |
Value | |||||||||||||||||||||||||||||
| Call | ||||||||||||||||||||||||||||||||||
| Energy Select Sector SPDR Fund |
3,412 | 07/16/21 | USD | 59.00 | USD | 18,380 | $ | (35,826 | ) | |||||||||||||||||||||||||
| Alerian MLP ETF |
7,352 | 07/30/21 | USD | 43.00 | USD | 26,769 | (36,760 | ) | ||||||||||||||||||||||||||
| Energy Select Sector SPDR Fund |
2,707 | 08/20/21 | USD | 63.00 | USD | 14,583 | (81,210 | ) | ||||||||||||||||||||||||||
|
|
|
|||||||||||||||||||||||||||||||||
| $ | (153,796 | ) | ||||||||||||||||||||||||||||||||
|
|
|
|||||||||||||||||||||||||||||||||
Balances Reported in the Statements of Assets and Liabilities for Options Written
| Description | Swap Paid |
Swap Received |
Unrealized Appreciation |
Unrealized Depreciation |
Value | |||||||||||||||
| Options Written |
$ | N/A | $ | N/A | $ | 61,938 | $ | (13,121 | ) | $ | (153,796 | ) | ||||||||
| S C H E D U L E O F I N V E S T M E N T S |
107 |
| Schedule of Investments (unaudited) (continued) June 30, 2021 |
BlackRock Credit Allocation Income Trust (BTZ) |
Derivative Financial Instruments Categorized by Risk Exposure
As of period end, the fair values of derivative financial instruments located in the Statements of Assets and Liabilities were as follows:
| Commodity Contracts |
Credit Contracts |
Equity Contracts |
Foreign Currency Exchange Contracts |
Interest Rate Contracts |
Other Contracts |
Total | ||||||||||||||||||||||
| Assets — Derivative Financial Instruments |
||||||||||||||||||||||||||||
| Futures contracts |
||||||||||||||||||||||||||||
| Unrealized appreciation on futures contracts(a) |
$ | — | $ | — | $ | — | $ | — | $ | 850,724 | $ | — | $ | 850,724 | ||||||||||||||
| Options purchased |
||||||||||||||||||||||||||||
| Investments at value — unaffiliated(b) |
— | — | 1,135,601 | — | 9,056 | — | 1,144,657 | |||||||||||||||||||||
|
|
|
|
|
|
|
|
|
|
|
|
|
|
|
|||||||||||||||
| $ | — | $ | — | $ | 1,135,601 | $ | — | $ | 859,780 | $ | — | $ | 1,995,381 | |||||||||||||||
|
|
|
|
|
|
|
|
|
|
|
|
|
|
|
|||||||||||||||
| Liabilities — Derivative Financial Instruments |
||||||||||||||||||||||||||||
| Futures contracts |
||||||||||||||||||||||||||||
| Unrealized depreciation on futures contracts(a) |
$ | — | $ | — | $ | — | $ | — | $ | 1,969,988 | $ | — | $ | 1,969,988 | ||||||||||||||
| Options written |
||||||||||||||||||||||||||||
| Options written at value |
— | — | 153,796 | — | — | — | 153,796 | |||||||||||||||||||||
|
|
|
|
|
|
|
|
|
|
|
|
|
|
|
|||||||||||||||
| $ | — | $ | — | $ | 153,796 | $ | — | $ | 1,969,988 | $ | — | $ | 2,123,784 | |||||||||||||||
|
|
|
|
|
|
|
|
|
|
|
|
|
|
|
|||||||||||||||
| (a) | Net cumulative unrealized appreciation (depreciation) on futures contracts and centrally cleared swaps, if any, are reported in the Schedule of Investments. In the Statements of Assets and Liabilities, only current day’s variation margin is reported in receivables or payables and the net cumulative unrealized appreciation (depreciation) is included in accumulated earnings (loss). |
| (b) | Includes options purchased at value as reported in the Schedule of Investments. |
For the six months ended June 30, 2021, the effect of derivative financial instruments in the Statements of Operations was as follows:
| Commodity Contracts |
Credit Contracts |
Equity Contracts |
Foreign Currency Exchange Contracts |
Interest Rate Contracts |
Other Contracts |
Total | ||||||||||||||||||||||
| Net Realized Gain (Loss) from |
||||||||||||||||||||||||||||
| Futures contracts |
$ | — | $ | — | $ | — | $ | — | $ | 3,269,108 | $ | — | $ | 3,269,108 | ||||||||||||||
| Options purchased(a) |
— | — | 5,809,438 | — | (2,429,396 | ) | — | 3,380,042 | ||||||||||||||||||||
| Options written |
— | — | 957,279 | — | 571,397 | — | 1,528,676 | |||||||||||||||||||||
| Swaps |
— | (79,350 | ) | — | — | — | — | (79,350 | ) | |||||||||||||||||||
|
|
|
|
|
|
|
|
|
|
|
|
|
|
|
|||||||||||||||
| $ | — | $ | (79,350 | ) | $ | 6,766,717 | $ | — | $ | 1,411,109 | $ | — | $ | 8,098,476 | ||||||||||||||
|
|
|
|
|
|
|
|
|
|
|
|
|
|
|
|||||||||||||||
| Net Change in Unrealized Appreciation (Depreciation) on |
||||||||||||||||||||||||||||
| Futures contracts |
$ | — | $ | — | $ | — | $ | — | $ | (1,095,212 | ) | $ | — | $ | (1,095,212 | ) | ||||||||||||
| Options purchased(b) |
— | — | 794,393 | — | 156,174 | — | 950,567 | |||||||||||||||||||||
| Options written |
— | — | 136,375 | — | — | — | 136,375 | |||||||||||||||||||||
| Swaps |
— | 75,621 | — | — | — | — | 75,621 | |||||||||||||||||||||
|
|
|
|
|
|
|
|
|
|
|
|
|
|
|
|||||||||||||||
| $ | — | $ | 75,621 | $ | 930,768 | $ | — | $ | (939,038 | ) | $ | — | $ | 67,351 | ||||||||||||||
|
|
|
|
|
|
|
|
|
|
|
|
|
|
|
|||||||||||||||
| (a) | Options purchased are included in net realized gain (loss) from investments — unaffiliated. |
| (b) | Options purchased are included in net change in unrealized appreciation (depreciation) on investments — unaffiliated. |
Average Quarterly Balances of Outstanding Derivative Financial Instruments
| Futures contracts |
||||
| Average notional value of contracts — long |
$ | 18,312,219 | ||
| Average notional value of contracts — short |
$ | 268,656,578 | ||
| Options |
||||
| Average value of option contracts purchased |
$ | 1,487,500 | ||
| Average value of option contracts written |
$ | 208,164 | ||
| Average notional value of swaption contracts purchased |
$ | 40,000,000 | ||
| Credit default swaps |
||||
| Average notional value — buy protection |
$ | 6,287,500 | ||
For more information about the Trust’s investment risks regarding derivative financial instruments, refer to the Notes to Financial Statements.
| 108 | 2 0 2 1 B L A C K R O C K S E M I - A N N U A L R E P O R T T O S H A R E H O L D E R S |
| Schedule of Investments (unaudited) (continued) June 30, 2021 |
BlackRock Credit Allocation Income Trust (BTZ) |
Derivative Financial Instruments — Offsetting as of Period End
The Trust’s derivative assets and liabilities (by type) were as follows:
| Assets | Liabilities | |||||||
| Derivative Financial Instruments |
||||||||
| Futures contracts |
$ | 91,875 | $ | 335,915 | ||||
| Options |
1,144,657 | (a) | 153,796 | |||||
|
|
|
|
|
|||||
| Total derivative assets and liabilities in the Statements of Assets and Liabilities |
1,236,532 | 489,711 | ||||||
|
|
|
|
|
|||||
| Derivatives not subject to a Master Netting Agreement or similar agreement (“MNA”) |
(1,227,476 | ) | (489,711 | ) | ||||
|
|
|
|
|
|||||
| Total derivative assets and liabilities subject to an MNA |
$ | 9,056 | $ | — | ||||
|
|
|
|
|
|||||
| (a) | Includes options purchased at value which is included in Investments at value — unaffiliated in the Statements of Assets and Liabilities and reported in the Schedule of Investments. |
The following table presents the Trust’s derivative assets by counterparty net of amounts available for offset under an MNA and net of the related collateral received by the Trust:
| Counterparty |
|
Derivative Assets Subject to an MNA by Counterparty |
|
|
Derivatives Available for Offset |
|
|
Non-Cash Collateral Received |
|
|
Cash Collateral Received |
|
|
Net Amount of Derivative |
| |||||
| JPMorgan Chase Bank N.A. |
$ | 9,056 | $ | — | $ | — | $ | — | $ | 9,056 | ||||||||||
|
|
|
|
|
|
|
|
|
|
|
|||||||||||
| (a) | Net amount represents the net amount receivable from the counterparty in the event of default. |
Fair Value Hierarchy as of Period End
Various inputs are used in determining the fair value of financial instruments. For a description of the input levels and information about the Trust’s policy regarding valuation of financial instruments, refer to the Notes to Financial Statements.
The following table summarizes the Trust’s financial instruments categorized in the fair value hierarchy. The breakdown of the Trust’s financial instruments into major categories is disclosed in the Schedule of Investments above.
| Level 1 | Level 2 | Level 3 | Total | |||||||||||||
| Assets |
||||||||||||||||
| Investments |
||||||||||||||||
| Long-Term Investments |
||||||||||||||||
| Asset-Backed Securities |
$ | — | $ | 82,374,175 | $ | 2,096,018 | $ | 84,470,193 | ||||||||
| Common Stocks |
||||||||||||||||
| Oil, Gas & Consumable Fuels |
715,452 | 624,296 | — | 1,339,748 | ||||||||||||
| Corporate Bonds |
— | 1,635,795,195 | 1,558,620 | 1,637,353,815 | ||||||||||||
| Floating Rate Loan Interests |
— | 864,689 | — | 864,689 | ||||||||||||
| Foreign Agency Obligations |
— | 27,111,417 | — | 27,111,417 | ||||||||||||
| Municipal Bonds |
— | 13,180,000 | — | 13,180,000 | ||||||||||||
| Preferred Securities |
||||||||||||||||
| Capital Trusts |
— | 212,064,081 | — | 212,064,081 | ||||||||||||
| Preferred Stocks |
41,225,955 | — | 5,459,703 | 46,685,658 | ||||||||||||
| Short-Term Securities |
||||||||||||||||
| Money Market Funds |
10,753,181 | — | — | 10,753,181 | ||||||||||||
| Options Purchased |
||||||||||||||||
| Equity Contracts |
1,135,601 | — | — | 1,135,601 | ||||||||||||
| Interest Rate Contracts |
— | 9,056 | — | 9,056 | ||||||||||||
|
|
|
|
|
|
|
|
|
|||||||||
| $ | 53,830,189 | $ | 1,972,022,909 | $ | 9,114,341 | $ | 2,034,967,439 | |||||||||
|
|
|
|
|
|
|
|
|
|||||||||
| Derivative Financial Instruments(a) |
||||||||||||||||
| Assets |
||||||||||||||||
| Interest Rate Contracts |
$ | 850,724 | $ | — | $ | — | $ | 850,724 | ||||||||
| S C H E D U L E O F I N V E S T M E N T S |
109 |
| Schedule of Investments (unaudited) (continued) June 30, 2021 |
BlackRock Credit Allocation Income Trust (BTZ) |
Fair Value Hierarchy as of Period End (continued)
| Level 1 | Level 2 | Level 3 | Total | |||||||||||||
| Liabilities |
||||||||||||||||
| Equity Contracts |
$ | (153,796 | ) | $ | — | $ | — | $ | (153,796 | ) | ||||||
| Interest Rate Contracts |
(1,969,988 | ) | — | — | (1,969,988 | ) | ||||||||||
|
|
|
|
|
|
|
|
|
|||||||||
| $ | (1,273,060 | ) | $ | — | $ | — | $ | (1,273,060 | ) | |||||||
|
|
|
|
|
|
|
|
|
|||||||||
| (a) | Derivative financial instruments are futures contracts and options written. Futures contracts are valued at the unrealized appreciation (depreciation) on the instrument and options written are shown at value. |
The Trust may hold assets and/or liabilities in which the fair value approximates the carrying amount or face value, including accrued interest, for financial statement purposes. As of period end, reverse repurchase agreements of $588,758,744 are categorized as Level 2 within the fair value hierarchy.
See notes to financial statements.
| 110 | 2 0 2 1 B L A C K R O C K S E M I - A N N U A L R E P O R T T O S H A R E H O L D E R S |
| Schedule of Investments (unaudited) June 30, 2021 |
BlackRock Floating Rate Income Trust (BGT) (Percentages shown are based on Net Assets) |
| Security |
Shares |
Value | ||||||||||
| Common Stocks |
||||||||||||
| Auto Components — 0.0% | ||||||||||||
| Lear Corp. |
89 | $ | 15,600 | |||||||||
|
|
|
|||||||||||
| Construction & Engineering — 0.0% | ||||||||||||
| McDermott International Ltd.(a) |
76,644 | 37,556 | ||||||||||
|
|
|
|||||||||||
| Energy Equipment & Services — 0.0% | ||||||||||||
| Pioneer Energy Services Corp.(b) |
546 | 8,081 | ||||||||||
|
|
|
|||||||||||
| Household Durables — 0.0% | ||||||||||||
| Berkline Benchcraft Equity LLC(b) |
6,155 | — | ||||||||||
|
|
|
|||||||||||
| Media — 0.1% | ||||||||||||
| Clear Channel Outdoor Holdings, Inc.(a) |
72,096 | 190,334 | ||||||||||
|
|
|
|||||||||||
| Metals & Mining — 0.0% | ||||||||||||
| Ameriforge Group, Inc. |
832 | 18,304 | ||||||||||
| Preferred Proppants LLC(b) |
7,476 | 710 | ||||||||||
|
|
|
|||||||||||
| 19,014 | ||||||||||||
| Oil, Gas & Consumable Fuels — 0.0% | ||||||||||||
| California Resources Corp.(a) |
1,252 | 37,735 | ||||||||||
|
|
|
|||||||||||
| Software — 0.0% | ||||||||||||
| Avaya Holdings Corp.(a) |
40 | 1,076 | ||||||||||
|
|
|
|||||||||||
| Specialty Retail — 0.1% | ||||||||||||
| NMG Parent LLC |
2,218 | 276,511 | ||||||||||
|
|
|
|||||||||||
| Total Common Stocks — 0.2% |
585,907 | |||||||||||
|
|
|
|||||||||||
| Par (000) |
||||||||||||
| Corporate Bonds |
||||||||||||
| Airlines(c) — 0.4% | ||||||||||||
| Allegiant Travel Co., 8.50%, 02/05/24 |
USD | 740 | 799,200 | |||||||||
| American Airlines, Inc./AAdvantage Loyalty IP Ltd., 5.50%, 04/20/26 |
347 | 367,386 | ||||||||||
|
|
|
|||||||||||
| 1,166,586 | ||||||||||||
| Auto Components — 0.1% | ||||||||||||
| Clarios Global LP, 6.75%, 05/15/25(c) |
275 | 292,870 | ||||||||||
|
|
|
|||||||||||
| Automobiles — 0.0% | ||||||||||||
| AutoNation, Inc., 4.75%, 06/01/30 |
87 | 102,895 | ||||||||||
|
|
|
|||||||||||
| Beverages — 0.1% | ||||||||||||
| Triton Water Holdings, Inc., 6.25%, 04/01/29(c) |
252 | 252,630 | ||||||||||
|
|
|
|||||||||||
| Building Materials — 0.0% | ||||||||||||
| Summit Materials LLC/Summit Materials Finance Corp., 5.25%, 01/15/29(c) |
73 | 77,557 | ||||||||||
|
|
|
|||||||||||
| Chemicals — 0.0% | ||||||||||||
| Illuminate Buyer LLC/Illuminate Holdings IV, Inc., 9.00%, 07/01/28(c) |
32 | 35,681 | ||||||||||
|
|
|
|||||||||||
| Construction Materials(c) — 0.3% | ||||||||||||
| Core & Main LP, 6.13%, 08/15/25 |
140 | 142,800 | ||||||||||
| Wolverine Escrow LLC, 9.00%, 11/15/26 |
950 | 926,250 | ||||||||||
|
|
|
|||||||||||
| 1,069,050 | ||||||||||||
| Security | Par (000) |
Value | ||||||||||
| Consumer Finance — 0.1% | ||||||||||||
| PayPal Holdings, Inc., 1.65%, 06/01/25 |
USD | 261 | $ | 267,864 | ||||||||
|
|
|
|||||||||||
| Diversified Telecommunication Services(c) — 0.5% | ||||||||||||
| Zayo Group Holdings, Inc. |
||||||||||||
| 4.00%, 03/01/27 |
1,233 | 1,224,517 | ||||||||||
| 6.13%, 03/01/28 |
155 | 158,294 | ||||||||||
|
|
|
|||||||||||
| 1,382,811 | ||||||||||||
| Electric Utilities — 0.0% | ||||||||||||
| Pike Corp., 5.50%, 09/01/28(c) |
89 | 92,560 | ||||||||||
| Texas Competitive Electric Holdings Co. LLC/TCEH Finance, Inc., |
1,050 | — | ||||||||||
|
|
|
|||||||||||
| 92,560 | ||||||||||||
| Energy Equipment & Services(b)(c)(d) — 0.1% | ||||||||||||
| Pioneer Energy Services Corp. |
||||||||||||
| (11.00% Cash or 11.00% PIK), 11.00%, 05/15/25 |
216 | 217,274 | ||||||||||
| (5.00% PIK), 5.00%, 11/15/25 |
160 | 178,088 | ||||||||||
|
|
|
|||||||||||
| 395,362 | ||||||||||||
| Equity Real Estate Investment Trusts (REITs) — 0.0% | ||||||||||||
| MGM Growth Properties Operating Partnership LP/MGP Finance Co-Issuer, Inc., 4.63%, 06/15/25(c) |
85 | 90,811 | ||||||||||
|
|
|
|||||||||||
| Hotels, Restaurants & Leisure — 0.1% | ||||||||||||
| Marriott International, Inc., Series EE, 5.75%, 05/01/25 |
233 | 268,952 | ||||||||||
|
|
|
|||||||||||
| Household Products — 0.0% | ||||||||||||
| Berkline Benchcraft LLC, 4.50%, 06/01/22(b)(e) |
400 | — | ||||||||||
|
|
|
|||||||||||
| Internet Software & Services — 0.0% | ||||||||||||
| Uber Technologies, Inc., 6.25%, 01/15/28(c) |
137 | 147,441 | ||||||||||
|
|
|
|||||||||||
| Machinery(c) — 0.4% | ||||||||||||
| Husky III Holding Ltd., (13.00% Cash or 13.75% PIK), 13.00%, 02/15/25(d) |
561 | 608,685 | ||||||||||
| Madison IAQ LLC, 5.88%, 06/30/29 |
499 | 507,732 | ||||||||||
|
|
|
|||||||||||
| 1,116,417 | ||||||||||||
| Media(c) — 0.3% | ||||||||||||
| Liberty Broadband Corp., 2.75%, 09/30/50(f) |
315 | 330,725 | ||||||||||
| Ligado Networks LLC, (15.50% PIK), 15.50%, 11/01/23(d) |
120 | 118,237 | ||||||||||
| Radiate Holdco LLC/Radiate Finance, Inc., 4.50%, 09/15/26 |
353 | 365,355 | ||||||||||
|
|
|
|||||||||||
| 814,317 | ||||||||||||
| Oil, Gas & Consumable Fuels — 0.1% | ||||||||||||
| eG Global Finance PLC, 8.50%, 10/30/25(c) |
182 | 192,381 | ||||||||||
|
|
|
|||||||||||
| Semiconductors & Semiconductor Equipment — 0.0% | ||||||||||||
| NXP BV/NXP Funding LLC/NXP USA, Inc., 2.70%, 05/01/25(c) |
47 | 49,432 | ||||||||||
|
|
|
|||||||||||
| Software — 0.1% | ||||||||||||
| BY Crown Parent LLC/BY Bond Finance, Inc., 4.25%, 01/31/26(c) |
162 | 169,695 | ||||||||||
|
|
|
|||||||||||
| Total Corporate Bonds — 2.6% |
7,985,312 | |||||||||||
|
|
|
|||||||||||
| S C H E D U L E O F I N V E S T M E N T S |
111 |
| Schedule of Investments (unaudited) (continued) June 30, 2021 |
BlackRock Floating Rate Income Trust (BGT) (Percentages shown are based on Net Assets) |
| Security | Par (000) |
Value | ||||||||||
| Floating Rate Loan Interests(e) |
||||||||||||
| Aerospace & Defense — 5.7% | ||||||||||||
| Atlas CC Acquisition Corp. |
||||||||||||
| Term Loan B, (3 mo. LIBOR + 4.25%, 0.75% Floor), 5.00%, 04/28/28 |
USD | 3,932 | $ | 3,941,935 | ||||||||
| Term Loan C, (3 mo. LIBOR + 4.25%, 0.75% Floor), 6.00%, 05/25/28 |
800 | 801,750 | ||||||||||
| Bleriot US Bidco, Inc., 2021 Term Loan B, (3 mo. LIBOR + 4.00%), 4.15%, 10/30/26 |
445 | 445,322 | ||||||||||
| Dynasty Acquisition Co., Inc. |
||||||||||||
| 2020 CAD Term Loan B2, (3 mo. LIBOR + 3.50%), 3.65%, 04/06/26 |
1,252 | 1,218,855 | ||||||||||
| 2020 Term Loan B1, (3 mo. LIBOR + 3.50%), 3.65%, 04/06/26 |
2,329 | 2,267,069 | ||||||||||
| Nordam Group, Inc., Term Loan B, (1 mo. LIBOR + 5.50%), 5.63%, 04/09/26(b) |
463 | 444,058 | ||||||||||
| Peraton Holding Corp. |
||||||||||||
| 2nd Lien Term Loan B1, (1 mo. LIBOR + 0.75%, 0.75% Floor), |
1,396 | 1,423,920 | ||||||||||
| Term Loan B, (1 mo. LIBOR + 3.75%, 0.75% Floor), 4.50%, 02/01/28 |
4,243 | 4,251,968 | ||||||||||
| Spirit Aerosystems, Inc., 2020 Term Loan B, (1 mo. LIBOR + 5.25%, 0.75% Floor), 6.00%, 01/15/25 |
614 | 617,242 | ||||||||||
| TransDigm, Inc., 2020 Term Loan F, (1 mo. LIBOR + 2.25%), 2.35%, 12/09/25 |
1,966 | 1,935,098 | ||||||||||
|
|
|
|||||||||||
| 17,347,217 | ||||||||||||
| Air Freight & Logistics — 0.8% | ||||||||||||
| AIT Worldwide Logistics, Inc, 2021 Term Loan, (3 mo. LIBOR + 4.75%, 0.75% Floor), 5.50%, 04/06/28 |
295 | 294,540 | ||||||||||
| Kestrel Bidco, Inc., Term Loan B, (6 mo. LIBOR + 3.00%, 1.00% Floor), 4.00%, 12/11/26 |
2,131 | 2,088,189 | ||||||||||
|
|
|
|||||||||||
| 2,382,729 | ||||||||||||
| Airlines — 2.3% | ||||||||||||
| AAdvantage Loyalty IP Ltd., 2021 Term Loan, (3 mo. LIBOR + 4.75%, 0.75% Floor), 5.50%, 04/20/28 |
786 | 818,815 | ||||||||||
| American Airlines, Inc. |
||||||||||||
| 2017 1st Lien Term Loan, (1 mo. LIBOR + 1.75%), 1.85%, 01/29/27 |
241 | 229,916 | ||||||||||
| 2017 Incremental Term Loan, (1 mo. LIBOR + 2.00%), 2.07%, 12/14/23 |
1,213 | 1,182,814 | ||||||||||
| Repriced TL B due 2023, (1 mo. LIBOR + 2.00%), 2.10%, 04/28/23 |
753 | 733,819 | ||||||||||
| Mileage Plus Holdings LLC, 2020 Term Loan B, (3 mo. LIBOR + 5.25%, 1.00% Floor), 6.25%, 06/20/27 |
1,472 | 1,570,860 | ||||||||||
| United Airlines, Inc., 2021 Term Loan B, (3 mo. LIBOR + 3.75%, 0.75% Floor), 4.50%, 04/21/28 |
2,306 | 2,334,402 | ||||||||||
|
|
|
|||||||||||
| 6,870,626 | ||||||||||||
| Auto Components — 2.9% | ||||||||||||
| Adient US LLC, 2021 Term Loan B, (1 mo. LIBOR + 3.50%), 3.60%, 04/08/28 |
508 | 507,843 | ||||||||||
| Clarios Global LP, 2021 USD Term Loan B, (1 mo. LIBOR + 3.25%), 3.35%, 04/30/26 |
2,843 | 2,814,876 | ||||||||||
| Truck Hero, Inc., 2021 Term Loan B, (1 mo. LIBOR + 3.75%, 0.75% Floor), 4.50%, 01/31/28 |
1,552 | 1,551,334 | ||||||||||
| Security | Par (000) |
Value | ||||||||||
| Auto Components (continued) | ||||||||||||
| USI, Inc. |
||||||||||||
| 2017 Repriced Term Loan, (3 mo. LIBOR + 3.00%), 3.15%, 05/16/24 |
USD | 2,349 | $ | 2,325,693 | ||||||||
| 2019 Incremental Term Loan B, (3 mo. LIBOR + 3.25%), 3.40%, 12/02/26 |
134 | 132,646 | ||||||||||
| Wand NewCo 3, Inc., 2020 Term Loan, (1 mo. LIBOR + 3.00%), 3.10%, 02/05/26 |
1,605 | 1,584,106 | ||||||||||
|
|
|
|||||||||||
| 8,916,498 | ||||||||||||
| Automobiles — 0.1% | ||||||||||||
| MajorDrive Holdings IV LLC, Term Loan B, (3 mo. LIBOR + 4.00%, 0.50% Floor), 4.50%, 05/12/28 |
305 | 305,095 | ||||||||||
|
|
|
|||||||||||
| Building Materials — 0.1% | ||||||||||||
| CHI Overhead Doors, Inc, Term Loan, (1 mo. LIBOR + 3.75%, 1.00% Floor), 4.50%, 07/31/25 |
112 | 112,153 | ||||||||||
| Cornerstone Building Brands, Inc., 2021 Term Loan B, (1 mo. LIBOR + 3.25%, 0.50% Floor), 3.75%, 04/12/28 |
263 | 262,181 | ||||||||||
|
|
|
|||||||||||
| 374,334 | ||||||||||||
| Building Products — 1.6% | ||||||||||||
| CP Atlas Buyer, Inc., 2021 Term Loan B, (1 mo. LIBOR + 3.75%, 0.50% Floor), 4.25%, 11/23/27 |
1,524 | 1,519,257 | ||||||||||
| CPG International, Inc., 2017 Term Loan, (3 mo. LIBOR + 2.50%, 0.75% Floor), 3.25%, 05/05/24 |
1,067 | 1,065,206 | ||||||||||
| MI Windows And Doors LLC, 2020 Term Loan, (1 mo. LIBOR + 3.75%, 0.75% Floor), 4.50%, 12/18/27 |
328 | 328,557 | ||||||||||
| Wilsonart LLC, 2021 Term Loan E, (3 mo. LIBOR + 3.50%, 1.00% Floor), 4.50%, 12/19/26 |
1,976 | 1,974,287 | ||||||||||
|
|
|
|||||||||||
| 4,887,307 | ||||||||||||
| Capital Markets — 2.6% | ||||||||||||
| Deerfield Dakota Holding LLC |
||||||||||||
| 2020 USD Term Loan B, (1 mo. LIBOR + 4.25%, 1.00% Floor), 4.75%, 04/09/27 |
3,592 | 3,604,984 | ||||||||||
| 2021 USD 2nd Lien Term Loan, (1 mo. LIBOR + 6.75%, 0.75% Floor), 7.50%, 04/07/28(b) |
1,114 | 1,139,065 | ||||||||||
| Eagle Broadband Investments LLC, Term Loan, (3 mo. LIBOR + 3.00%, 0.75% Floor), 3.75%, 11/12/27 |
877 | 875,771 | ||||||||||
| FinCo I LLC, 2020 Term Loan B, (1 mo. LIBOR + 2.50%), 2.60%, 06/27/25 |
513 | 511,402 | ||||||||||
| Focus Financial Partners LLC |
||||||||||||
| 2021 Delayed Draw Term Loan, 3.00%, 06/24/28 |
172 | 171,772 | ||||||||||
| 2021 Term Loan, 06/24/28(g) |
747 | 744,346 | ||||||||||
| Greenhill & Co., Inc., Term Loan B, (1 mo. LIBOR + 3.25%), 3.35%, 04/12/24(b) |
814 | 811,173 | ||||||||||
|
|
|
|||||||||||
| 7,858,513 | ||||||||||||
| Chemicals — 6.1% | ||||||||||||
| Ascend Performance Materials Operations LLC, 2021 Term Loan B, (3 mo. LIBOR + 4.75%, 0.75% Floor), 5.50%, 08/27/26 |
1,583 | 1,603,583 | ||||||||||
| Atotech BV, 2021 USD Term Loan B, (1 mo. LIBOR + 2.50%, 0.50% Floor), 3.00%, 03/18/28 |
2,155 | 2,142,889 | ||||||||||
| Axalta Coating Systems US Holdings Inc., USD Term Loan B3, (3 mo. LIBOR + 1.75%), 1.90%, 06/01/24 |
1,146 | 1,137,992 | ||||||||||
| 112 | 2 0 2 1 B L A C K R O C K S E M I - A N N U A L R E P O R T T O S H A R E H O L D E R S |
| Schedule of Investments (unaudited) (continued) June 30, 2021 |
BlackRock Floating Rate Income Trust (BGT) (Percentages shown are based on Net Assets) |
| Security | Par (000) |
Value | ||||||||||
| Chemicals (continued) | ||||||||||||
| Element Materials Technology Group US Holdings, Inc., 2017 Term Loan B, (3 mo. LIBOR + 3.50%, 1.00% Floor), 4.50%, 06/28/24(b) |
USD | 717 | $ | 709,617 | ||||||||
| Element Solutions, Inc., 2021 Term Loan B, 01/31/26(g) |
1,243 | 1,240,676 | ||||||||||
| Encapsys LLC, 2020 Term Loan B2, (1 mo. LIBOR + 3.75%, 1.00% Floor), 4.25%, 11/07/24 |
760 | 759,187 | ||||||||||
| Illuminate Buyer LLC, 2021 Term Loan, (1 mo. LIBOR + 3.50%), 3.60%, 06/30/27 |
915 | 909,127 | ||||||||||
| Invictus US LLC |
||||||||||||
| 1st Lien Term Loan, (1 mo. LIBOR + 3.00%), 3.10%, 03/28/25 |
472 | 471,427 | ||||||||||
| 2nd Lien Term Loan, (1 mo. LIBOR + 6.75%), 6.85%, 03/30/26 |
526 | 525,738 | ||||||||||
| Klockner-Pentaplast of America, Inc., 2021 Term Loan B, (3 mo. LIBOR + 4.75%, 0.50% Floor), 5.25%, 02/09/26(b) |
792 | 795,975 | ||||||||||
| Lonza Group AG, USD Term Loan B, 04/29/28(g) |
643 | 643,347 | ||||||||||
| Messer Industries GmbH, 2018 USD Term Loan, (3 mo. LIBOR + 2.50%), 2.65%, 03/02/26 |
1,597 | 1,584,588 | ||||||||||
| Minerals Technologies, Inc., 2017 Term Loan B, (1 mo. LIBOR + 2.25%, 0.75% Floor), 3.00%, 02/14/24(b) |
262 | 262,587 | ||||||||||
| Momentive Performance Materials, Inc., Term Loan B, (1 mo. LIBOR + 3.25%), 3.36%, 05/15/24 |
1,065 | 1,057,659 | ||||||||||
| NIC Acquisition Corp., Term Loan, (3 mo. LIBOR + 3.75%, 0.75% Floor), 4.50%, 12/29/27 |
456 | 454,577 | ||||||||||
| Oxea Holding Drei GmbH, 2017 USD Term Loan B2, (1 mo. LIBOR + 3.50%), 3.63%, 10/14/24 |
1,078 | 1,071,021 | ||||||||||
| PQ Corp., 2021 Term Loan B, 05/26/28(g) |
1,083 | 1,082,101 | ||||||||||
| Pregis TopCo Corp., 2021 Incremental Term Loan, (3 mo. LIBOR + 4.00%, 0.50% Floor), 4.50%, 08/01/26 |
438 | 437,691 | ||||||||||
| SCIH Salt Holdings, Inc., 2021 Incremental Term Loan B, (3 mo. LIBOR + 4.00%, 0.75% Floor), 4.75%, 03/16/27 |
800 | 803,339 | ||||||||||
| Sparta US Holdco LLC, 2021 Term Loan, 2021 Term Loan, 05/04/28(g) |
716 | 716,222 | ||||||||||
| Starfruit Finco BV, 2018 USD Term Loan B, (PRIME + 1.75%), 3.13%, 10/01/25 |
122 | 121,373 | ||||||||||
|
|
|
|||||||||||
| 18,530,716 | ||||||||||||
| Commercial Services & Supplies — 5.0% | ||||||||||||
| Allied Universal Holdco LLC, 2021 USD Incremental Term Loan B, (1 mo. LIBOR + 3.75%, 0.50% Floor), 4.25%, 05/12/28 |
2,335 | 2,340,775 | ||||||||||
| Aramark Services, Inc., 2018 Term Loan B3, (1 mo. LIBOR + 1.75%), 1.85%, 03/11/25 |
95 | 94,106 | ||||||||||
| Asurion LLC |
||||||||||||
| 2018 Term Loan B6, (1 mo. LIBOR + 3.00%), 3.10%, 11/03/23 |
1,467 | 1,458,567 | ||||||||||
| 2018 Term Loan B7, (1 mo. LIBOR + 3.00%), 3.10%, 11/03/24 |
701 | 693,638 | ||||||||||
| 2020 Term Loan B8, (1 mo. LIBOR + 3.25%), 3.35%, 12/23/26 |
490 | 484,184 | ||||||||||
| 2021 2nd Lien Term Loan B3, (1 mo. LIBOR + 5.25%), 5.35%, 01/31/28 |
689 | 693,578 | ||||||||||
| Creative Artists Agency LLC, 2020 Incremental Term Loan B1, (1 mo. LIBOR + 4.25%, 1.00% Floor), 5.25%, 11/26/26 |
1,213 | 1,207,498 | ||||||||||
| Dealer Tire LLC, 2020 Term Loan B, (1 mo. LIBOR + 4.25%), 4.35%, 12/12/25 |
1,588 | 1,587,523 | ||||||||||
| Security | Par (000) |
Value | ||||||||||
| Commercial Services & Supplies (continued) | ||||||||||||
| Diamond (BC) BV, USD Term Loan, (1 mo. LIBOR + 3.00%), 3.15%, 09/06/24 |
USD | 1,009 | $ | 1,002,729 | ||||||||
| EnergySolutions LLC, 2018 Term Loan B, (3 mo. LIBOR + 3.75%, 1.00% Floor), 4.75%, 05/09/25 |
331 | 328,179 | ||||||||||
| Harland Clarke Holdings Corp., Term Loan B7, (3 mo. LIBOR + 4.75%, 1.00% Floor), 5.75%, 11/03/23 |
265 | 236,178 | ||||||||||
| KAR Auction Services, Inc., 2019 Term Loan B6, (1 mo. LIBOR + 2.25%), 2.38%, 09/19/26 |
607 | 598,030 | ||||||||||
| Packers Holdings LLC, 2021 Term Loan, (3 mo. LIBOR + 3.25%, 0.75% Floor), 4.00%, 03/09/28 |
1,088 | 1,083,055 | ||||||||||
| Prime Security Services Borrower LLC, 2021 Term Loan, (1 mo. LIBOR + 2.75%, 0.75% Floor), 3.50%, 09/23/26 |
1,230 | 1,228,434 | ||||||||||
| Verscend Holding Corp., 2021 Term Loan B, (1 mo. LIBOR + 3.75%), 4.10%, 08/27/25 |
2,164 | 2,167,722 | ||||||||||
|
|
|
|||||||||||
| 15,204,196 | ||||||||||||
| Communications Equipment — 0.2% | ||||||||||||
| Avantor Funding, Inc., USD Term Loan B3, (1 mo. LIBOR + 2.00%, 1.00% Floor), 3.00%, 11/21/24 |
462 | 461,464 | ||||||||||
|
|
|
|||||||||||
| Construction & Engineering — 2.1% | ||||||||||||
| Brand Energy & Infrastructure Services, Inc., 2017 Term Loan, (3 mo. LIBOR + 4.25%, 1.00% Floor), 5.25%, 06/21/24 |
2,503 | 2,460,305 | ||||||||||
| Pike Corp., 2021 Incremental Term Loan B, (1 mo. LIBOR + 3.00%), 3.11%, 01/21/28 |
644 | 642,484 | ||||||||||
| SRS Distribution, Inc., 2021 Term Loan B, (1 mo. LIBOR + 3.75%, 0.50% Floor), 4.25%, 06/02/28 |
2,112 | 2,109,656 | ||||||||||
| USIC Holdings, Inc., 2021 Term Loan, (3 mo. LIBOR + 3.50%, 0.75% Floor), 4.25%, 05/12/28 |
1,094 | 1,090,879 | ||||||||||
|
|
|
|||||||||||
| 6,303,324 | ||||||||||||
| Construction Materials — 2.5% | ||||||||||||
| Core & Main LP |
||||||||||||
| 2017 Term Loan B, (3 mo. LIBOR + 2.00%, 1.00% Floor), 3.75%, 08/01/24 |
1,521 | 1,519,051 | ||||||||||
| 2021 Term Loan B, 2.75%, 06/09/28 |
2,727 | 2,708,569 | ||||||||||
| Filtration Group Corp. |
||||||||||||
| 2018 1st Lien Term Loan, (1 mo. LIBOR + 3.00%), 3.10%, 03/29/25 |
1,487 | 1,473,345 | ||||||||||
| 2020 Incremental Term Loan, (1 mo. LIBOR + 3.75%, 0.75% Floor), 4.50%, 03/29/25 |
746 | 746,360 | ||||||||||
| Forterra Finance LLC, 2017 Term Loan B, (1 mo. LIBOR + 3.50%, 1.00% Floor), 4.00%, 10/25/23 |
704 | 703,450 | ||||||||||
| Tamko Building Products, Inc., Term Loan B, (1 mo. LIBOR + 3.00%), 3.13%, 05/29/26 |
543 | 540,930 | ||||||||||
|
|
|
|||||||||||
| 7,691,705 | ||||||||||||
| Containers & Packaging — 2.0% | ||||||||||||
| BWAY Holding Co., 2017 Term Loan B, (1 mo. LIBOR + 3.25%), 3.35%, 04/03/24 |
1,493 | 1,456,092 | ||||||||||
| Charter NEX US, Inc. |
||||||||||||
| 2020 Term Loan, (1 mo. LIBOR + 4.25%), 0.00%, 12/01/27 |
— | — | ||||||||||
| 2021 Term Loan, 12/01/27(g) |
2,597 | 2,600,071 | ||||||||||
| Flex Acquisition Co., Inc., 2021 Term Loan, (3 mo. LIBOR + 3.50%, 0.50% Floor), 4.00%, 03/02/28 |
1,261 | 1,255,357 | ||||||||||
| S C H E D U L E O F I N V E S T M E N T S |
113 |
| Schedule of Investments (unaudited) (continued) June 30, 2021 |
BlackRock Floating Rate Income Trust (BGT) (Percentages shown are based on Net Assets) |
| Security | Par (000) |
Value | ||||||||||
| Containers & Packaging (continued) | ||||||||||||
| Pregis TopCo Corp., 1st Lien Term Loan, (1 mo. LIBOR + 4.00%), 4.10%, 08/01/26 |
USD | 385 | $ | 384,434 | ||||||||
| Tosca Services LLC, 2021 Term Loan, (1 mo. LIBOR + 3.50%, 0.75% Floor), 4.25%, 08/18/27 |
507 | 505,822 | ||||||||||
|
|
|
|||||||||||
| 6,201,776 | ||||||||||||
| Distributors — 1.0% | ||||||||||||
| American Builders & Contractors Supply Co., Inc., 2019 Term Loan, (1 mo. LIBOR + 2.00%), 2.10%, 01/15/27 |
915 | 907,864 | ||||||||||
| TMK Hawk Parent Corp. |
||||||||||||
| 2020 Super Priority First Out Term Loan A, (1 mo. LIBOR + 2.25%, 1.00% Floor), 10.50%, 05/30/24(b) |
585 | 573,665 | ||||||||||
| 2020 Super Priority Second Out Term Loan B, (1 mo. LIBOR + 3.50%, 1.00% Floor), 4.50%, 08/28/24 |
1,920 | 1,705,531 | ||||||||||
|
|
|
|||||||||||
| 3,187,060 | ||||||||||||
| Diversified Consumer Services — 2.4% | ||||||||||||
| Ascend Learning LLC |
||||||||||||
| 2017 Term Loan B, (1 mo. LIBOR + 3.00%, 1.00% Floor), 4.00%, 07/12/24 |
305 | 304,251 | ||||||||||
| 2020 Incremental Term Loan, (1 mo. LIBOR + 3.75%, 1.00% Floor), 4.75%, 07/12/24 |
627 | 627,260 | ||||||||||
| Bright Horizons Family Solutions LLC, 2017 Term Loan B, (1 mo. LIBOR + 1.75%, 1.00% Floor), 2.50%, 11/07/23 |
1,142 | 1,137,559 | ||||||||||
| Frontdoor, Inc., 2021 Term Loan B, (3 mo. LIBOR + 2.25%), 2.35%, 05/20/28 |
452 | 452,000 | ||||||||||
| Genuine Financial Holdings LLC, 2018 1st Lien Term Loan, (3 mo. LIBOR + 3.75%), 3.85%, 07/11/25 |
1,602 | 1,569,524 | ||||||||||
| Midas Intermediate Holdco II LLC, 2020 Term Loan B, (3 mo. LIBOR + 6.75%, 0.75% Floor), 7.50%, 12/22/25 |
1,036 | 1,008,692 | ||||||||||
| Nomad Foods Europe Midco Ltd., 2017 USD Term Loan B4, (1 mo. LIBOR + 2.25%), 2.32%, 05/15/24 |
694 | 689,701 | ||||||||||
| PAI Holdco, Inc., 2020 Term Loan B, (1 mo. LIBOR + 3.75%, 0.75% Floor), 4.50%, 10/28/27 |
222 | 222,790 | ||||||||||
| Serta Simmons Bedding LLC |
||||||||||||
| 2020 Super Priority First Out Term Loan, (1 mo. LIBOR + 7.50%), 8.50%, 08/10/23 |
290 | 293,327 | ||||||||||
| 2020 Super Priority Second Out Term Loan, (1 mo. LIBOR + 7.50%, 1.00% Floor), 8.50%, 08/10/23 |
455 | 433,952 | ||||||||||
| Voyage Australia Property Ltd., USD Term Loan B, 06/16/28(b)(g) |
461 | 461,000 | ||||||||||
|
|
|
|||||||||||
| 7,200,056 | ||||||||||||
| Diversified Financial Services — 9.4% | ||||||||||||
| Advisor Group, Inc., 2021 Term Loan, (1 mo. LIBOR + 4.50%), 4.60%, 07/31/26 |
866 | 866,957 | ||||||||||
| Alchemy Copyrights LLC, Term Loan B, (1 mo. LIBOR + 3.00%, 0.50% Floor), 3.50%, 03/10/28(b) |
526 | 525,374 | ||||||||||
| AlixPartners LLP, 2021 USD Term Loan B, (1 mo. LIBOR + 2.75%, 0.50% Floor), 3.25%, 02/04/28 |
1,521 | 1,514,220 | ||||||||||
| AQGEN Ascensus, Inc., 2021 2nd Lien Term Loan, 6.25%, 05/04/29(b) |
1,557 | 1,541,430 | ||||||||||
| AQGEN Island Holdings, Inc., Term Loan, 05/20/28(g) |
1,744 | 1,738,559 | ||||||||||
| Belron Finance US LLC, 2021 USD Term Loan B, (1 mo. LIBOR + 2.75%, 0.50% Floor), 3.25%, 04/13/28 |
1,727 | 1,723,571 | ||||||||||
| Security | Par (000) |
Value | ||||||||||
| Diversified Financial Services (continued) | ||||||||||||
| Delta TopCo, Inc. |
||||||||||||
| 2020 2nd Lien Term Loan, (3 mo. LIBOR + 7.25%, 0.75% Floor), 8.00%, 12/01/28 |
USD | 412 | $ | 416,635 | ||||||||
| 2020 Term Loan B, (3 mo. LIBOR + 3.75%, 0.75% Floor), 4.50%, 12/01/27 |
2,261 | 2,265,251 | ||||||||||
| EG Finco Ltd., 2018 Term Loan, (3 mo. LIBOR + 4.00%), 4.15%, 02/07/25 |
564 | 559,034 | ||||||||||
| I-Logic Technologies Bidco Ltd., 2021 USD Term Loan B, (3 mo. LIBOR + 4.00%, 0.50% Floor), 4.50%, 02/16/28 |
527 | 528,088 | ||||||||||
| Kingpin Intermediate Holdings LLC, 2018 Term Loan B, (1 mo. LIBOR + 2.25%, 1.00% Floor), 4.50%, 07/03/24 |
1,040 | 1,033,336 | ||||||||||
| LBM Acquisition LLC |
||||||||||||
| 2021 Incremental Delayed Draw Term Loan B2, 4.50%, 12/17/27 |
257 | 254,751 | ||||||||||
| 2021 Incremental Term Loan B2, 12/17/27 |
514 | 509,503 | ||||||||||
| Delayed Draw Term Loan, (3 mo. LIBOR + 3.75%, 0.75% Floor), 4.50%, 12/18/27 |
87 | 86,601 | ||||||||||
| Term Loan B, (3 mo. LIBOR + 3.75%, 0.75% Floor), 4.50%, 12/18/27 |
589 | 584,559 | ||||||||||
| LEB Holdings (USA), Inc, Term Loan B, (3 mo. LIBOR + 3.75%, 0.75% Floor), 4.50%, 11/02/27 |
629 | 629,666 | ||||||||||
| Milano Acquisition Corp., Term Loan B, (3 mo. LIBOR + 4.00%, 0.75% Floor), 4.75%, 10/01/27 |
3,483 | 3,491,160 | ||||||||||
| RV Retailer LLC, Term Loan B, (3 mo. LIBOR + 4.00%, 0.75% Floor), 4.75%, 02/08/28(b) |
577 | 577,996 | ||||||||||
| SMG US Midco 2, Inc., 2020 Term Loan, (3 mo. LIBOR + 2.50%), 2.66%, 01/23/25 |
954 | 920,438 | ||||||||||
| SSH Group Holdings, Inc., 2018 1st Lien Term Loan, (3 mo. LIBOR + 4.25%), 4.40%, 07/30/25 |
1,432 | 1,378,876 | ||||||||||
| Therma Intermediate LLC, 2020 Term Loan, (1 mo. LIBOR + 4.00%, 0.75% Floor), 4.75%, 12/16/27 |
432 | 432,486 | ||||||||||
| Veritas US, Inc., 2021 USD Term Loan B, (3 mo. LIBOR + 5.00%, 1.00% Floor), 6.00%, 09/01/25 |
4,468 | 4,491,409 | ||||||||||
| VS Buyer LLC, Term Loan B, (1 mo. LIBOR + 3.00%), 3.10%, 02/28/27 |
917 | 913,229 | ||||||||||
| White Cap Buyer LLC, Term Loan B, (3 mo. LIBOR + 4.00%, 0.50% Floor), 4.50%, 10/19/27 |
766 | 767,108 | ||||||||||
| Ziggo Financing Partnership, USD Term Loan I, (1 mo. LIBOR + 2.50%), 2.57%, 04/30/28 |
1,003 | 991,857 | ||||||||||
|
|
|
|||||||||||
| 28,742,094 | ||||||||||||
| Diversified Telecommunication Services — 3.0% | ||||||||||||
| Cablevision Lightpath LLC, Term Loan B, (1 mo. LIBOR + 3.25%, 0.50% Floor), 3.75%, 11/30/27 |
354 | 354,220 | ||||||||||
| Consolidated Communications, Inc., 2021 Term Loan B, (1 mo. LIBOR + 3.50%, 0.75% Floor), 4.25%, 10/02/27 |
497 | 497,568 | ||||||||||
| Frontier Communications Corp., 2021 DIP Term Loan B, (1 mo. LIBOR + 3.75%, 0.75% Floor), 4.50%, 05/01/28 |
1,235 | 1,234,909 | ||||||||||
| GCI LLC, 2020 Term Loan B, (1 mo. LIBOR + 2.75%, 0.75% Floor), 3.50%, 10/15/25 |
760 | 758,354 | ||||||||||
| Intelsat Jackson Holdings SA |
||||||||||||
| 2017 Term Loan B3, (PRIME + 4.75%), 8.00%, 11/27/23 |
245 | 248,472 | ||||||||||
| 2020 DIP Term Loan, (PRIME + 4.75%, 1.00% Floor), 6.50%, 07/13/22 |
85 | 85,314 | ||||||||||
| 114 | 2 0 2 1 B L A C K R O C K S E M I - A N N U A L R E P O R T T O S H A R E H O L D E R S |
| Schedule of Investments (unaudited) (continued) June 30, 2021 |
BlackRock Floating Rate Income Trust (BGT) (Percentages shown are based on Net Assets) |
| Security | Par (000) |
Value | ||||||||||
| Diversified Telecommunication Services (continued) | ||||||||||||
| Iridium Satellite LLC, 2021 Term Loan B, (1 mo. LIBOR + 6.75%, 1.00% Floor), 3.75%, 11/04/26 |
USD | 1,077 | $ | 1,078,282 | ||||||||
| Level 3 Financing, Inc., 2019 Term Loan B, (1 mo. LIBOR + 1.75%), 1.85%, 03/01/27 |
1,183 | 1,163,988 | ||||||||||
| MTN Infrastructure TopCo, Inc., 1st Lien Term Loan B, (1 mo. LIBOR + 3.00%, 1.00% Floor), 4.00%, 11/15/24 |
1,414 | 1,411,979 | ||||||||||
| Orbcomm, Inc., Term Loan B, 06/17/28(g) |
454 | 452,865 | ||||||||||
| TDC A/S, EUR Term Loan, (6 mo.EURIBOR + 3.00%), 3.00%, 06/04/25 |
EUR | 819 | 964,960 | |||||||||
| Virgin Media SFA Finance Ltd., GBP Term Loan L, (LIBOR - GBP + 3.25%), 3.31%, 01/15/27 |
GBP | 600 | 817,621 | |||||||||
|
|
|
|||||||||||
| 9,068,532 | ||||||||||||
| Electric Utilities — 1.2% | ||||||||||||
| ExGen Renewables IV LLC, 2020 Term Loan, (3 mo. LIBOR + 2.50%, 1.00% Floor), 3.50%, 12/15/27 |
USD | 818 | 817,485 | |||||||||
| Triton Water Holdings, Inc, Term Loan, 03/31/28(g) |
2,800 | 2,796,108 | ||||||||||
|
|
|
|||||||||||
| 3,613,593 | ||||||||||||
| Electrical Equipment — 0.7% | ||||||||||||
| Arcline FM Holdings LLC, 2021 1st Lien Term Loan, 06/23/28(g) |
536 | 536,338 | ||||||||||
| Gates Global LLC, 2021 Term Loan B3, (1 mo. LIBOR + 2.75%, 0.75% Floor), 3.50%, 03/31/27 |
1,514 | 1,506,271 | ||||||||||
|
|
|
|||||||||||
| 2,042,609 | ||||||||||||
| Electronic Equipment, Instruments & Components — 0.1% | ||||||||||||
| GrafTech Finance, Inc., 2018 Term Loan B, (1 mo. LIBOR + 3.00%, 0.50% Floor), 3.50%, 02/12/25 |
417 | 417,022 | ||||||||||
|
|
|
|||||||||||
| Energy Equipment & Services — 0.1% | ||||||||||||
| Dell International LLC, 2021 Term Loan B, (1 mo. LIBOR + 1.75%, 0.25% Floor), 2.00%, 09/19/25 |
357 | 357,349 | ||||||||||
|
|
|
|||||||||||
| Entertainment — 0.4% | ||||||||||||
| MSG National Properties LLC, Term Loan, (3 mo. LIBOR + 6.25%, 0.75% Floor), 7.00%, 11/12/25(b) |
1,217 | 1,253,391 | ||||||||||
|
|
|
|||||||||||
| Environmental, Maintenance, & Security Service — 0.7% | ||||||||||||
| Asplundh Tree Expert LLC, 2021 Term Loan B, (1 mo. LIBOR + 1.75%), 1.85%, 09/07/27 |
1,229 | 1,223,935 | ||||||||||
| TruGreen Limited Partnership, 2020 Term Loan, (1 mo. LIBOR + 4.00%, 0.75% Floor), 4.75%, 11/02/27 |
758 | 760,371 | ||||||||||
|
|
|
|||||||||||
| 1,984,306 | ||||||||||||
| Equity Real Estate Investment Trusts (REITs) — 0.6% | ||||||||||||
| RHP Hotel Properties LP, 2017 Term Loan B, (1 mo. LIBOR + 2.00%), 2.10%, 05/11/24 |
445 | 439,975 | ||||||||||
| VICI Properties LLC, Replacement Term Loan B, (1 mo. LIBOR + 1.75%), 1.84%, 12/20/24 |
1,529 | 1,515,284 | ||||||||||
|
|
|
|||||||||||
| 1,955,259 | ||||||||||||
| Food & Staples Retailing — 1.0% | ||||||||||||
| H Food Holdings LLC, 2018 Incremental Term Loan B2, (1 mo. LIBOR + 4.00%), 4.10%, 05/23/25 |
458 | 456,061 | ||||||||||
| Hearthside Food Solutions LLC |
518 | 514,921 | ||||||||||
| Security | Par (000) |
Value | ||||||||||
| Food & Staples Retailing (continued) | ||||||||||||
| Hearthside Food Solutions LLC (continued) |
||||||||||||
| 2020 Incremental Term Loan B3, (1 mo. LIBOR + 5.00%, 1.00% Floor), 6.00%, 05/23/25 |
USD | 102 | $ | 101,843 | ||||||||
| US Foods, Inc. |
||||||||||||
| 2016 Term Loan B, (1 mo. LIBOR + 1.75%), 1.85%, 06/27/23 |
1,456 | 1,440,333 | ||||||||||
| 2019 Term Loan B, (1 mo. LIBOR + 2.00%), 2.10%, 09/13/26 |
399 | 392,873 | ||||||||||
|
|
|
|||||||||||
| 2,906,031 | ||||||||||||
| Food Products — 2.7% | ||||||||||||
| 8th Avenue Food & Provisions, Inc., 2018 1st Lien Term Loan, (1 mo. LIBOR + 3.50%), 3.59%, 10/01/25 |
670 | 667,218 | ||||||||||
| B&G Foods, Inc., 2019 Term Loan B4, (1 mo. LIBOR + 2.50%), 2.60%, 10/10/26 |
262 | 261,993 | ||||||||||
| Chobani LLC, 2020 Term Loan B, (1 mo. LIBOR + 3.50%, 1.00% Floor), 4.50%, 10/23/27 |
1,912 | 1,914,747 | ||||||||||
| Froneri International Ltd., 2020 USD Term Loan, (1 mo. LIBOR + 2.25%), 2.35%, 01/29/27 |
2,213 | 2,177,722 | ||||||||||
| JBS USA LUX SA, 2019 Term Loan B, (1 mo. LIBOR + 2.00%), 2.10%, 05/01/26 |
318 | 317,118 | ||||||||||
| Reynolds Group Holdings, Inc. |
||||||||||||
| 2017 Term Loan, (1 mo. LIBOR + 2.75%), 2.85%, 02/05/23 |
1,182 | 1,179,509 | ||||||||||
| 2020 Term Loan B2, (1 mo. LIBOR + 3.25%), 3.35%, 02/05/26 |
250 | 248,595 | ||||||||||
| Sovos Brands Intermediate, Inc., 2021 Term Loan, (3 mo. LIBOR + 4.25%, 0.75% Floor), 5.00%, 06/08/28 |
1,132 | 1,136,272 | ||||||||||
| UTZ Quality Foods LLC, 2021 Term Loan B, 01/20/28(g) |
427 | 425,976 | ||||||||||
|
|
|
|||||||||||
| 8,329,150 | ||||||||||||
| Health Care Equipment & Supplies — 1.0% | ||||||||||||
| Avantor Funding, Inc., 2020 Incremental Term Loan B4, (1 mo. LIBOR + 2.25%, 1.00% Floor), 3.25%, 11/06/27 |
1,276 | 1,275,054 | ||||||||||
| Insulet Corp., Term Loan B, (1 mo. LIBOR + 3.25%, 0.50% Floor), 3.75%, 05/04/28 |
479 | 479,302 | ||||||||||
| Ortho-Clinical Diagnostics SA, 2018 Term Loan B, (1 mo. LIBOR + 3.00%), 3.09%, 06/30/25 |
1,282 | 1,281,213 | ||||||||||
|
|
|
|||||||||||
| 3,035,569 | ||||||||||||
| Health Care Providers & Services — 3.7% | ||||||||||||
| AHP Health Partners, Inc., 2021 Term Loan, (1 mo. LIBOR + 3.75%, 1.00% Floor), 4.75%, 06/30/25 |
491 | 491,626 | ||||||||||
| CCRR Parent, Inc, Term Loan B, (3 mo. LIBOR + 4.25%, 0.75% Floor), 5.00%, 03/06/28 |
828 | 832,065 | ||||||||||
| CHG Healthcare Services, Inc., 2017 1st Lien Term Loan B, (3 mo. LIBOR + 3.00%, 1.00% Floor), 4.00%, 06/07/23 |
1,147 | 1,145,887 | ||||||||||
| Da Vinci Purchaser Corp., 2019 Term Loan, 01/08/27(g) . |
743 | 744,857 | ||||||||||
| Envision Healthcare Corp., 2018 1st Lien Term Loan, (1 mo. LIBOR + 3.75%), 3.85%, 10/10/25 |
1,193 | 1,018,690 | ||||||||||
| EyeCare Partners LLC |
||||||||||||
| 2020 2nd Lien Term Loan, (1 mo. LIBOR + 8.25%), 8.35%, 02/18/28 |
780 | 746,850 | ||||||||||
| S C H E D U L E O F I N V E S T M E N T S |
115 |
| Schedule of Investments (unaudited) (continued) June 30, 2021 |
BlackRock Floating Rate Income Trust (BGT) (Percentages shown are based on Net Assets) |
| Security | Par (000) |
Value | ||||||||||
| Health Care Providers & Services (continued) | ||||||||||||
| EyeCare Partners LLC (continued) |
||||||||||||
| 2020 Term Loan, (1 mo. LIBOR + 3.75%), 3.85%, 02/18/27 |
USD | 1,053 | $ | 1,042,798 | ||||||||
| Femur Buyer, Inc., 1st Lien Term Loan, (3 mo. LIBOR + 4.50%), 4.65%, 03/05/26 |
654 | 625,967 | ||||||||||
| HC Group Holdings II, Inc., Term Loan B, (1 mo. LIBOR + 3.75%), 3.85%, 08/06/26 |
2,642 | 2,641,742 | ||||||||||
| MPH Acquisition Holdings LLC, 2016 Term Loan B, (3 mo. LIBOR + 2.75%, 1.00% Floor), 3.75%, 06/07/23 |
305 | 303,742 | ||||||||||
| PetVet Care Centers LLC, 2021 Term Loan B3, (1 mo. LIBOR + 3.50%, 0.75% Floor), 4.25%, 02/14/25 |
33 | 32,882 | ||||||||||
| Sotera Health Holdings LLC, 2021 Term Loan, (3 mo. LIBOR + 2.75%, 0.50% Floor), 3.25%, 12/13/26 |
1,564 | 1,556,837 | ||||||||||
|
|
|
|||||||||||
| 11,183,943 | ||||||||||||
| Health Care Services — 1.2% | ||||||||||||
| Azalea Topco, Inc., Term Loan, (1 mo. LIBOR + 3.50%), 3.69%, 07/25/26 |
1,289 | 1,280,951 | ||||||||||
| Unified Physician Management LLC, 2020 Term Loan, 12/18/27(b)(g) |
1,154 | 1,155,235 | ||||||||||
| WP CityMD Bidco LLC, 2021 Term Loan B, (3 mo. LIBOR + 3.75%, 0.75% Floor), 4.50%, 08/13/26 |
1,098 | 1,099,318 | ||||||||||
|
|
|
|||||||||||
| 3,535,504 | ||||||||||||
| Health Care Technology — 3.0% | ||||||||||||
| Athenahealth, Inc., 2021 Term Loan B1, (3 mo. LIBOR + 4.25%), 4.41%, 02/11/26 |
226 | 226,928 | ||||||||||
| Change Healthcare Holdings, Inc., 2017 Term Loan B, (1 mo. LIBOR + 2.50%, 1.00% Floor), 3.50%, 03/01/24 |
899 | 897,582 | ||||||||||
| GoodRx, Inc., 1st Lien Term Loan, (1 mo. LIBOR + 2.75%), 2.85%, 10/10/25 |
1,362 | 1,352,418 | ||||||||||
| Polaris Newco LLC, USD Term Loan B, (6 mo. LIBOR + 4.00%, 0.50% Floor), 4.50%, 06/04/28 |
3,314 | 3,321,418 | ||||||||||
| Press Ganey Holdings, Inc., 2021 Term Loan B, 07/25/26(g) |
1,049 | 1,050,426 | ||||||||||
| Quintiles IMS, Inc., 2017 USD Term Loan B1, (1 mo. LIBOR + 1.75%), 1.85%, 03/07/24 |
307 | 304,717 | ||||||||||
| Verscend Holdings Corp., 2nd Lien Term Loan, (1 mo. LIBOR + 7.00%), 7.50%, 02/01/29(b) |
1,902 | 1,921,020 | ||||||||||
|
|
|
|||||||||||
| 9,074,509 | ||||||||||||
| Hotels, Restaurants & Leisure — 7.8% | ||||||||||||
| 1011778 B.C. Unlimited Liability Co., Term Loan B4, (1 mo. LIBOR + 1.75%), 1.85%, 11/19/26 |
1,013 | 998,742 | ||||||||||
| Aimbridge Acquisition Co., Inc., 2019 Term Loan B, (1 mo. LIBOR + 3.75%), 3.85%, 02/02/26 |
265 | 258,549 | ||||||||||
| Aristocrat Leisure Ltd., 2020 Incremental Term Loan B, (3 mo. LIBOR + 3.75%, 1.00% Floor), 4.75%, 10/19/24 |
615 | 615,337 | ||||||||||
| Boyd Gaming Corp., Term Loan B3, (1 Week LIBOR + 2.25%), 2.34%, 09/15/23 |
700 | 698,498 | ||||||||||
| Caesars Resort Collection LLC |
||||||||||||
| 2017 1st Lien Term Loan B, (1 mo. LIBOR + 2.75%), 2.85%, 12/23/24 |
1,266 | 1,254,071 | ||||||||||
| 2020 Term Loan B1, (1 mo. LIBOR + 4.50%), 4.60%, 07/20/25 |
2,234 | 2,239,339 | ||||||||||
| Security | Par (000) |
Value | ||||||||||
| Hotels, Restaurants & Leisure (continued) | ||||||||||||
| CCM Merger, Inc., 2020 Term Loan B, (3 mo. LIBOR + 3.75%, 0.75% Floor), 4.50%, 11/04/25 |
USD | 385 | $ | 384,526 | ||||||||
| Churchill Downs, Inc., 2021 Incremental Term Loan B1, (1 mo. LIBOR + 2.00%), 2.11%, 03/10/28(b) |
484 | 478,950 | ||||||||||
| ECL Entertainment LLC, Term Loan, (1 mo. LIBOR + 7.50%, 0.75% Floor), 8.25%, 03/31/28(b) |
573 | 584,460 | ||||||||||
| Equinox Holdings, Inc., 2017 1st Lien Term Loan, (3 mo. LIBOR + 3.00%, 1.00% Floor), 4.00%, 03/08/24 |
2,769 | 2,649,088 | ||||||||||
| Four Seasons Hotels Ltd., New 1st Lien Term Loan, (1 mo. LIBOR + 2.00%), 2.10%, 11/30/23 |
832 | 828,501 | ||||||||||
| Gateway Casinos & Entertainment Ltd., 2018 Term Loan B, (3.00% PIK), 5.25%, 12/01/23(d) |
96 | 95,684 | ||||||||||
| Golden Nugget LLC, 2017 Incremental Term Loan B, (2 mo. LIBOR + 2.50%, 0.75% Floor), 3.25%, 10/04/23 |
1,047 | 1,038,393 | ||||||||||
| Golden Nugget, Inc., 2020 Initial Term Loan, (3 mo. LIBOR + 12.00%, 1.00% Floor), 13.00%, 10/04/23(b) |
110 | 121,749 | ||||||||||
| Herschend Entertainment Co. LLC, Term Loan B, (3 mo. LIBOR + 3.75%, 1.00% Floor), 6.75%, 08/25/25(b) |
367 | 369,061 | ||||||||||
| IRB Holding Corp, 2020 Fourth Amendment Incremental Term Loan, (3 mo. LIBOR + 3.25%, 1.00% Floor), 4.25%, 12/15/27 |
2,997 | 2,994,980 | ||||||||||
| IRB Holding Corp., 2020 Term Loan B, (3 mo. LIBOR + 2.75%, 1.00% Floor), 3.75%, 02/05/25 |
983 | 980,979 | ||||||||||
| Playa Resorts Holding BV, 2017 Term Loan B, (1 mo. LIBOR + 2.75%, 1.00% Floor), 3.75%, 04/29/24 |
359 | 344,608 | ||||||||||
| Playtika Holding Corp., 2021 Term Loan, (1 mo. LIBOR + 2.75%), 2.85%, 03/11/28 |
1,223 | 1,216,686 | ||||||||||
| Scientific Games International, Inc., 2018 Term Loan B5, (1 mo. LIBOR + 2.75%), 2.85%, 08/14/24 |
795 | 789,309 | ||||||||||
| Stars Group Holdings BV, 2018 USD Incremental Term Loan, (3 mo. LIBOR + 3.50%), 3.65%, 07/10/25 |
544 | 543,992 | ||||||||||
| Station Casinos LLC, 2020 Term Loan B, (1 mo. LIBOR + 2.25%, 0.25% Floor), 2.50%, 02/08/27 |
1,279 | 1,263,643 | ||||||||||
| Travelport Finance (Luxembourg) Sarl |
||||||||||||
| 2019 Term Loan, (3 mo. LIBOR + 5.00%), 5.20%, 05/29/26 |
1,376 | 1,253,218 | ||||||||||
| 2020 Super Priority Term Loan, (3 mo. LIBOR + 5.00%, 1.00% Floor), 3.50%, 02/28/25 |
815 | 853,706 | ||||||||||
| Whatabrands LLC, 2020 Term Loan B, (1 mo. LIBOR + 2.75%), 2.83%, 08/02/26 |
584 | 581,450 | ||||||||||
| Wyndham Hotels & Resorts, Inc., Term Loan B, (1 mo. LIBOR + 1.75%), 1.85%, 05/30/25 |
341 | 338,174 | ||||||||||
|
|
|
|||||||||||
| 23,775,693 | ||||||||||||
| Household Durables — 1.3% | ||||||||||||
| ACProducts Holdings, Inc., 2021 Term Loan B, (6 mo. LIBOR + 4.25%, 0.50% Floor), 4.75%, 05/17/28 |
2,158 | 2,145,678 | ||||||||||
| Reynolds Consumer Products LLC, Term Loan, (1 mo. LIBOR + 1.75%), 1.85%, 02/04/27 |
941 | 932,792 | ||||||||||
| Weber-Stephen Products LLC, Term Loan B, (1 mo. LIBOR + 3.25%, 0.75% Floor), 4.00%, 10/30/27 |
735 | 736,224 | ||||||||||
|
|
|
|||||||||||
| 3,814,694 | ||||||||||||
| Household Products — 0.1% | ||||||||||||
| Spectrum Brands, Inc., 2021 Term Loan, (3 mo. LIBOR + 2.00%, 0.50% Floor), 2.50%, 03/03/28(b) |
333 | 331,658 | ||||||||||
|
|
|
|||||||||||
| 116 | 2 0 2 1 B L A C K R O C K S E M I - A N N U A L R E P O R T T O S H A R E H O L D E R S |
| Schedule of Investments (unaudited) (continued) June 30, 2021 |
BlackRock Floating Rate Income Trust (BGT) (Percentages shown are based on Net Assets) |
| Security | Par (000) |
Value | ||||||||||
| Independent Power and Renewable Electricity Producers — 0.5% | ||||||||||||
| Calpine Construction Finance Co. LP, 2017 Term Loan B, (1 mo. LIBOR + 2.00%), 2.10%, 01/15/25 |
USD | 315 | $ | 310,895 | ||||||||
| Calpine Corp. |
||||||||||||
| 2019 Term Loan B10, (1 mo. LIBOR + 2.00%), 2.10%, 08/12/26 |
473 | 466,731 | ||||||||||
| Term Loan B9, (1 mo. LIBOR + 2.00%), 2.11%, 04/06/26 |
880 | 868,197 | ||||||||||
|
|
|
|||||||||||
| 1,645,823 | ||||||||||||
| Industrial Conglomerates — 2.2% | ||||||||||||
| AVSC Holding Corp.(d) |
||||||||||||
| 2020 Term Loan B1, (0.25% PIK), 2.25%, 03/03/25 |
2,346 | 2,147,040 | ||||||||||
| 2020 Term Loan B3, (10.00% PIK), 7.50%, 10/15/26 |
|
732 | 873,169 | |||||||||
| Sequa Mezzanine Holdings LLC, 2020 Extended Term Loan, (3 mo. LIBOR + 6.75%, 1.00% Floor), 7.75%, 11/28/23 |
|
810 | 814,880 | |||||||||
| Vertical Midco GmbH, USD Term Loan B, (6 mo. LIBOR + 4.25%), 4.48%, 07/29/27 |
|
1,185 | 1,185,550 | |||||||||
| Vertiv Group Corp., 2021 Term Loan B, (1 mo. LIBOR + 2.75%), 2.84%, 03/02/27 |
|
1,833 | 1,820,307 | |||||||||
|
|
|
|||||||||||
| 6,840,946 | ||||||||||||
| Insurance — 3.7% | ||||||||||||
| Alliant Holdings Intermediate LLC |
||||||||||||
| 2018 Term Loan B, (1 mo. LIBOR + 3.25%), 3.35%, 05/09/25 |
|
1,798 | 1,777,320 | |||||||||
| 2020 Term Loan B3, 11/06/27(g) |
926 | 926,821 | ||||||||||
| Term Loan B, (1 mo. LIBOR + 3.25%), 3.35%, 05/09/25 |
635 | 627,577 | ||||||||||
| AmWINS Group, Inc., 2021 Term Loan B, (1 mo. LIBOR + 2.25%, 0.75% Floor), 3.00%, 02/19/28 |
|
1,529 | 1,519,134 | |||||||||
| AssuredPartners Capital, Inc., 2020 Incremental Term Loan B, (1 mo. LIBOR + 4.50%, 1.00% Floor), 5.50%, 02/13/27 |
|
419 | 418,909 | |||||||||
| AssuredPartners, Inc. |
||||||||||||
| 2020 Term Loan B, (1 mo. LIBOR + 3.50%), 3.60%, 02/13/27 |
633 | 629,785 | ||||||||||
| 2021 Term Loan B, 02/12/27(g) |
193 | 193,097 | ||||||||||
| HUB International Ltd. |
||||||||||||
| 2018 Term Loan B, (3 mo. LIBOR + 2.75%), 2.93%, 04/25/25 |
|
1,783 | 1,762,420 | |||||||||
| 2021 Term Loan B, (3 mo. LIBOR + 3.25%, 0.75% Floor), 4.00%, 04/25/25 |
543 | 542,323 | ||||||||||
| Ryan Specialty Group LLC, Term Loan, (1 mo. LIBOR + 3.00%, 0.75% Floor), 3.75%, 09/01/27 |
1,015 | 1,014,373 | ||||||||||
| Sedgwick Claims Management Services, Inc. |
||||||||||||
| 2018 Term Loan B, (1 mo. LIBOR + 3.25%), 3.35%, 12/31/25 |
492 | 486,455 | ||||||||||
| 2019 Term Loan B, (1 mo. LIBOR + 3.75%), 3.85%, 09/03/26 |
743 | 741,339 | ||||||||||
| 2020 Term Loan B3, (1 mo. LIBOR + 4.25%, 1.00% Floor), 5.25%, 09/03/26 |
517 | 517,594 | ||||||||||
|
|
|
|||||||||||
| 11,157,147 | ||||||||||||
| Interactive Media & Services — 3.0% | ||||||||||||
| Adevinta ASA, USD Term |
1,545 | 1,544,808 | ||||||||||
| Arches Buyer, Inc., 2021 Term Loan B, (1 mo. LIBOR + 3.25%, 0.50% Floor), 3.75%, 12/06/27 |
1,475 | 1,469,886 | ||||||||||
| Security | Par (000) |
Value | ||||||||||
| Interactive Media & Services (continued) | ||||||||||||
| Camelot U.S. Acquisition 1 Co., 2020 Incremental Term Loan B, (1 mo. LIBOR + 3.00%, 1.00% Floor), 4.00%, 10/31/26 |
USD | 1,763 | $ | 1,763,140 | ||||||||
| Go Daddy Operating Co. LLC, 2021 Term Loan B4, (1 mo. LIBOR + 2.00%), 2.10%, 08/10/27 |
458 | 454,759 | ||||||||||
| Grab Holdings, Inc., Term Loan B, (6 mo. LIBOR + 4.50%, 1.00% Floor), 5.50%, 01/29/26 |
3,967 | 4,023,271 | ||||||||||
|
|
|
|||||||||||
| 9,255,864 | ||||||||||||
| Internet & Direct Marketing Retail — 0.6% | ||||||||||||
| CNT Holdings I Corp., 2020 Term Loan, (3 mo. LIBOR + 3.75%, 0.75% Floor), 4.50%, 11/08/27 |
1,684 | 1,683,780 | ||||||||||
|
|
|
|||||||||||
| Internet Software & Services — 0.4% | ||||||||||||
| Uber Technologies, Inc., 2021 Term Loan B, (1 mo. LIBOR + 3.50%), 3.60%, 02/25/27 |
1,311 | 1,309,381 | ||||||||||
|
|
|
|||||||||||
| IT Services — 6.9% | ||||||||||||
| Aruba Investments, Inc. |
||||||||||||
| 2020 2nd Lien Term Loan, (3 mo. LIBOR + 7.75%, 0.75% Floor), 8.50%, 11/24/28 |
885 | 887,947 | ||||||||||
| 2020 USD Term Loan, (3 mo. LIBOR + 4.00%, 0.75% Floor), 4.75%, 11/24/27 |
478 | 478,997 | ||||||||||
| Banff Merger Sub, Inc., 2021 USD Term Loan, (1 mo. LIBOR + 3.75%), 3.85%, 10/02/25 |
1,274 | 1,265,704 | ||||||||||
| Camelot U.S. Acquisition 1 Co., Term Loan B, (1 mo. LIBOR + 3.00%), 3.10%, 10/31/26 |
1,532 | 1,524,352 | ||||||||||
| Celestial -Saturn Parent, Inc., 2nd Lien Term Loan, (1 mo. LIBOR + 6.50%, 0.50% Floor), 7.00%, 04/13/29(b) |
783 | 786,915 | ||||||||||
| CoreLogic, Inc., Term Loan, (1 mo. LIBOR + 3.50%), 4.00%, 06/04/28 |
2,284 | 2,276,006 | ||||||||||
| Fleetcor Technologies Operating Company, LLC, 2021 Term Loan B4, 04/28/28(g) |
305 | 304,366 | ||||||||||
| Greeneden US Holdings II LLC, 2020 USD Term Loan B, (1 mo. LIBOR + 4.00%, 0.75% Floor), 4.75%, 12/01/27 |
3,459 | 3,465,671 | ||||||||||
| GreenSky Holdings LLC, 2020 Term Loan B2, (1 mo. LIBOR + 4.50%, 1.00% Floor), 5.50%, 03/29/25(b) |
962 | 954,520 | ||||||||||
| Maximus, Inc., Term Loan B, 05/28/28(g) |
625 | 624,481 | ||||||||||
| Optiv Security, Inc., 1st Lien Term Loan, (3 mo. LIBOR + 3.25%, 1.00% Floor), 4.25%, 02/01/24 |
625 | 609,572 | ||||||||||
| Peak 10 Holding Corp., 2nd Lien Term Loan, (3 mo. LIBOR + 7.25%), 7.38%, 08/01/25 |
605 | 540,180 | ||||||||||
| PUG LLC, USD Term Loan, (1 mo. LIBOR + 3.50%), 3.60%, 02/12/27 |
1,580 | 1,541,389 | ||||||||||
| Sophia LP, 2020 2nd Lien Term Loan, (3 mo. LIBOR + 8.00%, 1.00% Floor), 9.00%, 10/09/28 |
2,590 | 2,670,937 | ||||||||||
| TierPoint LLC, 2021 Term Loan, (1 mo. LIBOR + 3.75%, 0.75% Floor), 4.50%, 05/05/26 |
597 | 595,717 | ||||||||||
| Trans Union LLC, 2019 Term Loan B5, (1 mo. LIBOR + 1.75%), 1.85%, 11/16/26 |
1,163 | 1,154,887 | ||||||||||
| Virtusa Corp., Term Loan B, (1 mo. LIBOR + 4.25%, 0.75% Floor), 5.00%, 02/11/28. |
651 | 653,322 | ||||||||||
| WEX, Inc., 2021 Term Loan, (1 mo. LIBOR + 2.25%), 2.35%, 03/31/28 |
609 | 604,524 | ||||||||||
|
|
|
|||||||||||
| 20,939,487 | ||||||||||||
| S C H E D U L E O F I N V E S T M E N T S |
117 |
| Schedule of Investments (unaudited) (continued) June 30, 2021 |
BlackRock Floating Rate Income Trust (BGT) (Percentages shown are based on Net Assets) |
| Security | Par (000) |
Value | ||||||||||
| Leisure Products — 0.2% | ||||||||||||
| MND Holdings III Corp., 2018 1st Lien Term Loan, (3 mo. LIBOR + 3.50%, 1.00% Floor), 4.50%, 06/19/24 |
USD | 621 | $ | 599,825 | ||||||||
|
|
|
|||||||||||
| Life Sciences Tools & Services — 2.8% | ||||||||||||
| eResearchTechnology, Inc., 2020 1st Lien Term Loan, (1 mo. LIBOR + 4.50%, 1.00% Floor), 5.50%, 02/04/27 |
2,742 | 2,753,148 | ||||||||||
| Icon Luxembourg Sarl(g) |
||||||||||||
| 1st Lien Term Loan B, 06/16/28 |
456 | 456,237 | ||||||||||
| Term Loan B, 06/16/28 |
1,828 | 1,831,166 | ||||||||||
| Maravai Intermediate Holdings LLC, 2020 Term Loan B, (1 mo. LIBOR + 3.75%, 1.00% Floor), 4.75%, 10/19/27 |
765 | 767,569 | ||||||||||
| PPD, Inc., Initial Term Loan, (1 mo. LIBOR + 2.25%, 0.50% Floor), 2.75%, 01/13/28 |
2,738 | 2,733,428 | ||||||||||
|
|
|
|||||||||||
| 8,541,548 | ||||||||||||
| Machinery — 2.7% | ||||||||||||
| Clark Equipment Co., 2021 Incremental Term Loan, (3 mo. LIBOR + 2.25%), 2.40%, 05/18/24 |
843 | 841,202 | ||||||||||
| Columbus McKinnon Corp., 2021 Term Loan B, (3 mo. LIBOR + 2.75%, 0.50% Floor), 3.25%, 05/14/28(b) |
266 | 265,668 | ||||||||||
| Ingersoll-Rand Services Co., 2020 USD Spinco Term Loan, (1 mo. LIBOR + 1.75%), 1.85%, 02/28/27 |
1,399 | 1,382,188 | ||||||||||
| Madison IAQ LLC, Term Loan, (1 mo. LIBOR + 3.25%, 0.50% Floor), 3.75%, 06/16/28 |
2,280 | 2,280,000 | ||||||||||
| Titan Acquisition Ltd., 2018 Term Loan B, (3 mo. LIBOR + 3.00%), 3.17%, 03/28/25 |
3,423 | 3,360,283 | ||||||||||
|
|
|
|||||||||||
| 8,129,341 | ||||||||||||
| Media — 13.6% | ||||||||||||
| A-L Parent LLC, 2016 1st Lien Term Loan, (1 mo. LIBOR + 3.25%, 1.00% Floor), 4.25%, 12/01/23 |
1,791 | 1,728,189 | ||||||||||
| Altice Financing SA |
||||||||||||
| 2017 USD Term Loan B, (3 mo. LIBOR + 2.75%), 2.93%, 07/15/25 |
699 | 686,187 | ||||||||||
| USD 2017 1st Lien Term Loan, (3 mo. LIBOR + 2.75%), 2.90%, 01/31/26 |
965 | 947,192 | ||||||||||
| Altice France SA, 2018 Term Loan B13, (3 mo. LIBOR + 4.00%), 4.15%, 08/14/26 |
2,163 | 2,157,529 | ||||||||||
| Cable One, Inc., 2021 Term Loan B4, 05/03/28(g) |
306 | 304,623 | ||||||||||
| Charter Communications Operating LLC, 2019 Term Loan B1, (1 mo. LIBOR + 1.75%), 1.86%, 04/30/25 |
2,082 | 2,077,910 | ||||||||||
| Clear Channel Outdoor Holdings, Inc., Term Loan B, (3 mo. LIBOR + 3.50%), 3.69%, 08/21/26 |
4,008 | 3,910,025 | ||||||||||
| Connect Finco Sarl, 2021 Term Loan B, (1 mo. LIBOR + 3.50%, 1.00% Floor), 4.50%, 12/12/26 |
5,634 | 5,637,212 | ||||||||||
| CSC Holdings LLC |
||||||||||||
| 2017 Term Loan B1, (1 mo. LIBOR + 2.25%), 2.32%, 07/17/25 |
1,326 | 1,305,996 | ||||||||||
| 2019 Term Loan B5, (1 mo. LIBOR + 2.50%), 2.57%, 04/15/27 |
1,307 | 1,293,109 | ||||||||||
| E.W. Scripps Co., 2020 Term Loan B3, (1 mo. LIBOR + 3.00%, 0.75% Floor), 3.75%, 01/07/28 |
592 | 591,397 | ||||||||||
| Lions Gate Capital Holdings LLC, 2018 Term Loan B, (1 mo. LIBOR + 2.25%), 2.35%, 03/24/25 |
831 | 825,869 | ||||||||||
| Live Nation Entertainment, Inc., Term Loan B4, (1 mo. LIBOR + 1.75%), 1.88%, 10/19/26 |
1,579 | 1,535,296 | ||||||||||
| Security | Par (000) |
Value | ||||||||||
| Media (continued) | ||||||||||||
| MCC Iowa LLC, Term Loan N, (1 Week LIBOR + 1.75%), 1.85%, 02/15/24 |
USD | 55 | $ | 54,473 | ||||||||
| MH Sub I LLC |
||||||||||||
| 2017 1st Lien Term Loan, (1 mo. LIBOR + 3.50%), 3.60%, 09/13/24 |
2,168 | 2,156,720 | ||||||||||
| 2020 Incremental Term Loan, (1 mo. LIBOR + 3.50%, 1.00% Floor), 4.75%, 09/15/24 |
1,587 | 1,589,021 | ||||||||||
| 2021 2nd Lien Term Loan, (1 mo. LIBOR + 6.25%), 6.35%, 02/23/29 |
764 | 774,986 | ||||||||||
| Nexstar Broadcasting, Inc., 2019 Term Loan B4, (1 mo. LIBOR + 2.50%), 2.59%, 09/19/26 |
828 | 825,933 | ||||||||||
| Radiate Holdco LLC, 2020 Term Loan, (1 mo. LIBOR + 3.50%, 0.75% Floor), 4.25%, 09/25/26 |
1,500 | 1,500,322 | ||||||||||
| Sinclair Television Group Inc., 2021 Term Loan B3, (1 mo. LIBOR + 3.00%), 3.11%, 04/01/28 |
518 | 512,529 | ||||||||||
| Terrier Media Buyer, Inc., 2021 Term Loan, (1 mo. LIBOR + 3.50%), 3.60%, 12/17/26 |
— | (h) | 145 | |||||||||
| Trader Corp., 2017 Term Loan B, (1 mo. LIBOR + 3.00%, 1.00% Floor), 3.10%, 09/28/23(b) |
2,539 | 2,525,878 | ||||||||||
| UPC Financing Partnership, 2021 USD Term Loan AX, (1 mo. LIBOR + 3.00%), 3.07%, 01/31/29 |
356 | 353,508 | ||||||||||
| Virgin Media Bristol LLC |
||||||||||||
| 2020 USD Term Loan Q, (3 mo. LIBOR + 3.25%), 3.35%, 01/31/29 |
1,453 | 1,450,777 | ||||||||||
| USD Term Loan N, (1 mo. LIBOR + 2.50%), 2.57%, 01/31/28 |
609 | 603,382 | ||||||||||
| William Morris Endeavor Entertainment LLC, 2018 1st Lien Term Loan, (1 mo. LIBOR + 2.75%), 2.86%, 05/18/25 |
1,829 | 1,792,696 | ||||||||||
| WMG Acquisition Corp., 2021 Term Loan G, (1 mo. LIBOR + 2.12%), 2.23%, 01/20/28 |
412 | 408,142 | ||||||||||
| Zayo Group Holdings, Inc., USD Term Loan, (1 mo. LIBOR + 3.00%), 3.10%, 03/09/27 |
3,846 | 3,803,249 | ||||||||||
|
|
|
|||||||||||
| 41,352,295 | ||||||||||||
| Metals & Mining — 0.4% | ||||||||||||
| Ball Metalpack LLC, 2018 1st Lien Term Loan B, (3 mo. LIBOR + 4.50%), 4.64%, 07/31/25 |
1,093 | 1,083,745 | ||||||||||
|
|
|
|||||||||||
| Multi-line Retail — 0.2% | ||||||||||||
| Eyemart Express LLC, 2017 Term Loan B, (1 mo. LIBOR + 3.00%, 1.00% Floor), 4.00%, 08/04/24 |
582 | 580,857 | ||||||||||
|
|
|
|||||||||||
| Oil, Gas & Consumable Fuels — 0.6% | ||||||||||||
| Edgewater Generation LLC, Term Loan, (1 mo. LIBOR + 3.75%), 3.85%, 12/13/25 |
896 | 853,025 | ||||||||||
| EG Group Ltd., 2018 USD Term Loan B, (3 mo. LIBOR + 4.00%), 4.15%, 02/07/25 |
479 | 474,981 | ||||||||||
| Lealand Finance Company BV, 2020 Take Back Term Loan, (3.00% PIK), 3.00%, 06/30/25(d) |
177 | 78,975 | ||||||||||
| McDermott Technology Americas, Inc., 2020 Make Whole Term Loan, (1 mo. LIBOR + 3.00%), 3.10%, 06/30/24(b) |
25 | 14,951 | ||||||||||
| Murphy USA, Inc., Term Loan B, (1 mo. LIBOR + 1.75%, 0.50% Floor), 2.25%, 01/31/28 |
399 | 399,251 | ||||||||||
|
|
|
|||||||||||
| 1,821,183 | ||||||||||||
| 118 | 2 0 2 1 B L A C K R O C K S E M I - A N N U A L R E P O R T T O S H A R E H O L D E R S |
| Schedule of Investments (unaudited) (continued) June 30, 2021 |
BlackRock Floating Rate Income Trust (BGT) (Percentages shown are based on Net Assets) |
| Security | Par (000) |
Value | ||||||||||
| Personal Products — 1.5% | ||||||||||||
| Sunshine Luxembourg VII SARL, 2021 Term Loan B3, (3 mo. LIBOR + 3.75%, 0.75% Floor), 4.50%, 09/25/26 |
USD | 4,506 | $ | 4,520,138 | ||||||||
|
|
|
|||||||||||
| Pharmaceuticals — 3.5% | ||||||||||||
| Amneal Pharmaceuticals LLC, 2018 Term Loan B, (1 mo. LIBOR + 3.50%), 3.63%, 05/04/25 |
1,207 | 1,182,835 | ||||||||||
| Catalent Pharma Solutions, Inc., 2021 Term Loan B3, (1 mo. LIBOR + 2.00%, 0.50% Floor), 2.50%, 02/22/28 |
1,262 | 1,263,348 | ||||||||||
| Elanco Animal Health, Inc., Term Loan B, (1 mo. LIBOR + 1.75%), 1.84%, 08/01/27 |
766 | 753,761 | ||||||||||
| Grifols Worldwide Operations USA, Inc., USD |
||||||||||||
| 2019 Term Loan B, (1 Week LIBOR + 2.00%), 2.09%, 11/15/27 |
1,044 | 1,033,803 | ||||||||||
| Jazz Financing Lux Sarl, USD Term Loan, (1 mo. LIBOR + 3.50%, 0.50% Floor), 4.00%, 04/21/28 |
1,409 | 1,412,959 | ||||||||||
| Organon Finance 1 LLC, USD Term Loan, (3 mo. LIBOR + 3.00%, 0.50% Floor), 3.50%, 06/02/28 |
1,022 | 1,022,644 | ||||||||||
| Precision Medicine Group LLC, 2021 Term Loan, (3 mo. LIBOR + 3.00%, 0.75% Floor), 3.75%, 11/18/27 |
812 | 808,521 | ||||||||||
| Prestige Brands, Inc., 2021 Term Loan B, 06/11/28(g) |
314 | 314,132 | ||||||||||
| Valeant Pharmaceuticals International, Inc., 2018 Term Loan B, (1 mo. LIBOR + 3.00%), 3.10%, 06/02/25 |
2,773 | 2,760,039 | ||||||||||
|
|
|
|||||||||||
| 10,552,042 | ||||||||||||
| Professional Services — 1.2% | ||||||||||||
| Dun & Bradstreet Corp., Term Loan, (1 mo. LIBOR + 3.25%), 3.35%, 02/06/26 |
3,811 | 3,791,616 | ||||||||||
|
|
|
|||||||||||
| Real Estate Management & Development — 0.7% | ||||||||||||
| CityCenter Holdings LLC, 2017 Term Loan B, (1 mo. LIBOR + 2.25%, 0.75% Floor), 3.00%, 04/18/24 |
1,265 | 1,253,696 | ||||||||||
| Cushman & Wakefield U.S. Borrower LLC, 2020 Term Loan B, (1 mo. LIBOR + 2.75%), 2.85%, 08/21/25 |
902 | 893,055 | ||||||||||
| Realogy Corp., 2018 Term Loan B, (1 mo. LIBOR + 2.25%, 0.75% Floor), 3.00%, 02/08/25 |
28 | 28,089 | ||||||||||
|
|
|
|||||||||||
| 2,174,840 | ||||||||||||
| Road & Rail — 0.3% | ||||||||||||
| Moda Ingleside Energy Center LLC, 2018 Term Loan B, (1 mo. LIBOR + 3.25%), 3.35%, 09/25/25 |
|
154 | 153,812 | |||||||||
| SIRVA Worldwide, Inc., 2018 1st Lien Term Loan, (3 mo. LIBOR + 5.50%), 5.62%, 08/04/25 |
|
751 | 710,823 | |||||||||
|
|
|
|||||||||||
| 864,635 | ||||||||||||
| Semiconductors & Semiconductor Equipment — 0.1% | ||||||||||||
| ON Semiconductor Corp., 2019 Term Loan B, (1 mo. LIBOR + 2.00%), 2.10%, 09/19/26 |
300 | 298,865 | ||||||||||
|
|
|
|||||||||||
| Software — 17.5% | ||||||||||||
| 2U, Inc., Term Loan, 11/30/24(g) |
893 | 877,372 | ||||||||||
| Applied Systems, Inc. |
||||||||||||
| 2017 1st Lien Term Loan, (PRIME + 2.25%), 3.77%, 09/19/24 |
|
306 | 304,911 | |||||||||
| 2021 2nd Lien Term Loan, (3 mo. LIBOR + 5.50%, 0.75% Floor), 6.25%, 09/19/25 |
439 | 444,048 | ||||||||||
| Barracuda Networks, Inc. |
||||||||||||
| 1st Lien Term Loan, (3 mo. LIBOR + 3.75%, 0.75% Floor), 4.50%, 02/12/25 |
1,519 | 1,522,329 | ||||||||||
| 2020 2nd Lien Term Loan, (1 mo. LIBOR + 6.75%, 0.75% Floor), 7.50%, 10/30/28 |
535 | 544,031 | ||||||||||
| Security | Par (000) |
Value | ||||||||||
| Software (continued) | ||||||||||||
| Cloudera, Inc., Term Loan B, (1 mo. LIBOR + 2.50%, 0.75% Floor), 3.25%, 12/22/27 |
USD | 604 | $ | 603,796 | ||||||||
| Cornerstone OnDemand, Inc., 2021 Term Loan B, (1 mo. LIBOR + 3.25%), 3.34%, 04/22/27 |
395 | 394,751 | ||||||||||
| Cypress Intermediate Holdings III, Inc., 2017 1st Lien Term Loan, (1 mo. LIBOR + 3.00%, 1.00% Floor), 4.00%, 04/29/24 |
1,155 | 1,154,757 | ||||||||||
| Digicel International Finance Ltd., 2017 Term Loan B, (6 mo. LIBOR + 3.25%), 3.43%, 05/27/24 |
870 | 833,475 | ||||||||||
| DTI Holdco, Inc., 2018 Term Loan B, (3 mo. LIBOR + 4.75%, 1.00% Floor), 5.75%, 09/29/23 |
314 | 302,973 | ||||||||||
| E2open LLC, 2020 Term Loan B, 10/29/27(g) |
178 | 178,000 | ||||||||||
| Epicor Software Corp., 2020 2nd Lien Term Loan, (1 mo. LIBOR + 3.25%, 1.00% Floor), 8.75%, 07/31/28 |
1,316 | 1,357,954 | ||||||||||
| Helios Software Holdings, Inc., 2021 USD Term Loan B, (6 mo. LIBOR + 3.75%), 3.90%, 03/11/28 |
1,315 | 1,314,535 | ||||||||||
| Informatica LLC |
||||||||||||
| 2020 USD 2nd Lien Term Loan, (Fixed + 7.12%), 7.13%, 02/25/25 |
1,093 | 1,114,860 | ||||||||||
| 2020 USD Term Loan B, (1 mo. LIBOR + 3.25%), 3.35%, 02/25/27 |
4,594 | 4,561,678 | ||||||||||
| Magenta Buyer LLC |
||||||||||||
| 2021 USD 1st Lien Term Loan, 05/03/28(g) |
2,851 | 2,848,149 | ||||||||||
| 2021 USD 2nd Lien Term Loan, 9.00%, 05/03/29(b) |
1,491 | 1,472,362 | ||||||||||
| McAfee LLC, 2018 USD Term Loan B, (1 mo. LIBOR + 3.75%), 3.85%, 09/30/24 |
609 | 608,697 | ||||||||||
| MED ParentCo LP, 2020 Incremental Term Loan B, (1 mo. LIBOR + 6.25%, 1.00% Floor), 7.25%, 08/31/26 |
535 | 534,957 | ||||||||||
| Mitchell International, Inc. |
||||||||||||
| 2017 1st Lien Term Loan, (1 mo. LIBOR + 3.25%), 3.35%, 11/29/24 |
307 | 304,196 | ||||||||||
| 2017 2nd Lien Term Loan, (1 mo. LIBOR + 7.25%), 7.35%, 12/01/25 |
752 | 750,529 | ||||||||||
| 2020 Add-On Term Loan, (1 mo. LIBOR + 4.25%, 0.50% Floor), 4.75%, 12/01/24 |
1,268 | 1,272,487 | ||||||||||
| Netsmart Technologies, Inc., 2020 Term Loan B, (3 mo. LIBOR + 4.00%, 0.75% Floor), 4.75%, 10/01/27 |
901 | 902,832 | ||||||||||
| Planview Parent, Inc. |
||||||||||||
| 2nd Lien Term Loan, (1 Week LIBOR + 7.25%, 0.75% Floor), 8.00%, 12/17/28 |
572 | 569,140 | ||||||||||
| Term Loan, (3 mo. LIBOR + 4.00%, 0.75% Floor), 4.75%, 12/17/27 |
1,334 | 1,335,419 | ||||||||||
| Project Alpha Intermediate Holding, Inc., 2021 Term Loan B, (1 mo. LIBOR + 4.00%), 4.11%, 04/26/24 |
944 | 944,925 | ||||||||||
| Proof Point, Inc.(g) |
||||||||||||
| 1st Lien Term Loan, 06/09/28 |
1,719 | 1,708,480 | ||||||||||
| 2nd Lien Term Loan, 06/08/29 |
895 | 902,831 | ||||||||||
| RealPage, Inc. |
||||||||||||
| 1st Lien Term Loan, (1 mo. LIBOR + 3.25%, 0.50% Floor), 3.75%, 04/22/28 |
3,803 | 3,790,192 | ||||||||||
| 2nd Lien Term Loan, (1 mo. LIBOR + 6.50%, 0.75% Floor), 7.25%, 04/22/29 |
1,825 | 1,877,579 | ||||||||||
| Renaissance Holding Corp., 2018 1st Lien Term Loan, (1 mo. LIBOR + 3.25%), 3.34%, 05/30/25 |
422 | 416,900 | ||||||||||
| Sabre GLBL, Inc., 2020 Term Loan B, (1 mo. LIBOR + 4.00%, 0.75% Floor), 4.75%, 12/17/27 |
684 | 686,983 | ||||||||||
| Severin Acquisition LLC, 2018 Term Loan B, (3 mo. LIBOR + 3.25%), 3.33%, 08/01/25 |
2,411 | 2,394,808 | ||||||||||
| S C H E D U L E O F I N V E S T M E N T S |
119 |
| Schedule of Investments (unaudited) (continued) June 30, 2021 |
BlackRock Floating Rate Income Trust (BGT) (Percentages shown are based on Net Assets) |
| Security | Par (000) |
Value | ||||||||||
| Software (continued) | ||||||||||||
| Sophia LP, 2020 1st Lien Term Loan, (3 mo. LIBOR + 3.75%, 0.75% Floor), 4.50%, 10/07/27 |
USD | 3,161 | $ | 3,161,779 | ||||||||
| Tempo Acquisition LLC, 2020 Extended Term Loan, (1 mo. LIBOR + 3.25%, 0.50% Floor), 3.75%, 11/02/26 |
3,341 | 3,344,315 | ||||||||||
| Tibco Software, Inc., 2020 2nd Lien Term Loan, (1 mo. LIBOR + 7.25%), 7.36%, 03/04/28 |
1,799 | 1,823,842 | ||||||||||
| Ultimate Software Group, Inc. |
||||||||||||
| 2020 2nd Lien Incremental Term Loan, (3 mo. LIBOR + 6.75%, 0.75% Floor), 7.50%, 05/03/27 |
1,225 | 1,244,392 | ||||||||||
| 2021 Incremental Term Loan, (3 mo. LIBOR + 3.25%, 0.75% Floor), 4.00%, 05/03/26 |
2,254 | 2,255,448 | ||||||||||
| Term Loan B, (1 mo. LIBOR + 3.75%), 3.85%, 05/03/26 |
2,435 | 2,435,122 | ||||||||||
|
|
|
|||||||||||
| 53,095,834 | ||||||||||||
| Specialty Retail — 4.5% | ||||||||||||
| Belron Finance US LLC |
||||||||||||
| 2018 Term Loan B, (3 mo. LIBOR + 2.25%), 2.44%, 11/13/25 |
272 | 270,325 | ||||||||||
| 2019 USD Term Loan B, (3 mo. LIBOR + 2.25%), 2.44%, 10/30/26 |
665 | 660,095 | ||||||||||
| CD&R Firefly Bidco Ltd., 2018 GBP Term Loan B1, (LIBOR - GBP + 4.75%), 4.83%, 06/23/25 |
GBP | 1,000 | 1,378,638 | |||||||||
| EG Group Ltd., 2021 Term Loan, 03/31/26(g) |
USD | 354 | 354,000 | |||||||||
| Eyemart Express LLC, 2020 2nd Lien Term Loan, 6.25%, 08/04/25 |
869 | 864,899 | ||||||||||
| Mavis Tire Express Services Corp., 2021 Term Loan B, (3 mo. LIBOR + 4.00%, 0.75% Floor), 4.75%, 05/04/28 |
1,876 | 1,880,690 | ||||||||||
| MED ParentCo LP, 1st Lien Term Loan, (1 mo. LIBOR + 4.25%), 4.35%, 08/31/26 |
1,070 | 1,068,988 | ||||||||||
| PetSmart, Inc., 2021 Term Loan B, (3 mo. LIBOR + 3.75%, 0.75% Floor), 4.50%, 02/12/28 |
3,651 | 3,651,913 | ||||||||||
| Research Now Group, Inc., 2017 1st Lien Term Loan, (6 mo. LIBOR + 5.50%, 1.00% Floor), 6.50%, 12/20/24 |
986 | 972,340 | ||||||||||
| Sotheby’s, Term Loan B, (3 mo. LIBOR + 4.75%, 0.75% Floor), 5.50%, 01/15/27 |
2,017 | 2,026,184 | ||||||||||
| Woof Holdings, Inc., 1st Lien Term Loan, (3 mo. LIBOR + 3.75%, 0.75% Floor), 4.50%, 12/21/27 |
340 | 339,865 | ||||||||||
| WOOF Holdings, Inc., 2nd Lien Term Loan, (1 mo. LIBOR + 7.25%, 0.75% Floor), 8.00%, 12/21/28 |
345 | 348,450 | ||||||||||
|
|
|
|||||||||||
| 13,816,387 | ||||||||||||
| Technology Hardware, Storage & Peripherals — 0.4% | ||||||||||||
| Electronics for Imaging, Inc., Term Loan, (1 mo. LIBOR + 5.00%), 5.10%, 07/23/26 |
858 | 815,285 | ||||||||||
| Western Digital Corp., 2018 Term Loan B4, (1 mo. LIBOR + 1.75%), 1.84%, 04/29/23 |
349 | 348,790 | ||||||||||
|
|
|
|||||||||||
| 1,164,075 | ||||||||||||
| Thrifts & Mortgage Finance — 0.1% | ||||||||||||
| IG Investment Holdings LLC, 2018 1st Lien Term Loan, (3 mo. LIBOR + 3.25%, 1.00% Floor), 4.75%, 05/23/25 |
457 | 457,281 | ||||||||||
|
|
|
|||||||||||
| Security | Par (000) |
Value | ||||||||||
| Trading Companies & Distributors — 0.7% | ||||||||||||
| Beacon Roofing Supply, Inc., 2021 Term Loan B, (1 mo. LIBOR + 2.50%), 2.60%, 04/23/28 |
USD | 859 | $ | 853,417 | ||||||||
| Foundation Building Materials Holding Company LLC, 2021 Term Loan, (3 mo. LIBOR + 3.25%, 0.50% Floor), 3.75%, 02/03/28 |
947 | 940,420 | ||||||||||
| ION Trading Finance Ltd., 2021 Term Loan, (3 mo. LIBOR + 4.75%), 4.92%, 04/01/28 |
422 | 423,283 | ||||||||||
|
|
|
|||||||||||
| 2,217,120 | ||||||||||||
| Wireless Telecommunication Services — 1.8% | ||||||||||||
| GOGO Intermediate Holdings LLC, Term Loan B, (3 mo. LIBOR + 3.75%, 0.75% Floor), 4.50%, 04/30/28 |
684 | 682,442 | ||||||||||
| Metronet Systems Holdings LLC, 2021 1st Lien Term Loan, (1 mo. LIBOR + 4.00%, 0.75% Floor), 4.50%, 05/26/28 |
397 | 396,690 | ||||||||||
| SBA Senior Finance II LLC, 2018 Term Loan B, (1 mo. LIBOR + 1.75%), 1.86%, 04/11/25 |
2,086 | 2,066,182 | ||||||||||
| Xplornet Communications, Inc., 2020 Term Loan B, (1 mo. LIBOR + 4.75%), 4.85%, 06/10/27 |
2,215 | 2,214,544 | ||||||||||
|
|
|
|||||||||||
| 5,359,858 | ||||||||||||
|
|
|
|||||||||||
| Total Floating Rate Loan Interests — 145.5% |
|
442,397,435 | ||||||||||
|
|
|
|||||||||||
| Shares | ||||||||||||
| Investment Companies |
||||||||||||
| Fixed Income Funds — 2.4% | ||||||||||||
| Invesco Senior Loan ETF |
133,000 | 2,945,950 | ||||||||||
| iShares iBoxx $ High Yield Corporate Bond ETF(i)(j) |
|
28,000 | 2,465,120 | |||||||||
| iShares iBoxx $ Investment Grade Corporate Bond ETF(i)(j) |
15,000 | 2,015,400 | ||||||||||
|
|
|
|||||||||||
| 7,426,470 | ||||||||||||
|
|
|
|||||||||||
| Total Investment Companies — 2.4% |
|
7,426,470 | ||||||||||
|
|
|
|||||||||||
| Benefical Interest (000) |
||||||||||||
| Other Interests |
||||||||||||
| IT Services(k) — 0.0% | ||||||||||||
| Millennium Corp. |
USD | 991 | — | |||||||||
| Millennium Lender Claims |
930 | — | ||||||||||
|
|
|
|||||||||||
| Total Other Interests — 0.0% |
|
— | ||||||||||
|
|
|
|||||||||||
| Shares | ||||||||||||
| Warrants |
||||||||||||
| Metals & Mining — 0.0% | ||||||||||||
| Ameriforge Group, Inc. (Expires 06/08/22) |
2,642 | — | ||||||||||
|
|
|
|||||||||||
| 120 | 2 0 2 1 B L A C K R O C K S E M I - A N N U A L R E P O R T T O S H A R E H O L D E R S |
| Schedule of Investments (unaudited) (continued) June 30, 2021 |
BlackRock Floating Rate Income Trust (BGT) (Percentages shown are based on Net Assets) |
| Security | Shares | Value | ||||||
| Oil, Gas & Consumable Fuels — 0.0% | ||||||||
| California Resources
Corp. |
617 | $ | 4,739 | |||||
|
|
|
|||||||
| Total Warrants — 0.0% |
|
4,739 | ||||||
|
|
|
|||||||
| Total Long-Term Investments — 150.7% |
|
458,399,863 | ||||||
|
|
|
|||||||
| Short-Term Securities |
||||||||
| Money Market Funds — 0.1% | ||||||||
| BlackRock Liquidity Funds, T-Fund, Institutional Class, 0.01%(i)(j) |
217,930 | 217,930 | ||||||
|
|
|
|||||||
| Total Short-Term Securities — 0.1% |
|
217,930 | ||||||
|
|
|
|||||||
| Total Investments — 150.8% |
|
458,617,793 | ||||||
| Liabilities in Excess of Other Assets — (50.8)% |
|
(154,516,747 | ) | |||||
|
|
|
|||||||
| Net Assets — 100.0% |
|
$ | 304,101,046 | |||||
|
|
|
|||||||
| (a) | Non-income producing security. |
| (b) | Security is valued using significant unobservable inputs and is classified as Level 3 in the fair value hierarchy. |
| (c) | Security exempt from registration pursuant to Rule 144A under the Securities Act of 1933, as amended. These securities may be resold in transactions exempt from registration to qualified institutional investors. |
| (d) | Payment-in-kind security which may pay interest/dividends in additional par/shares and/or in cash. Rates shown are the current rate and possible payment rates. |
| (e) | Variable rate security. Interest rate resets periodically. The rate shown is the effective interest rate as of period end. Security description also includes the reference rate and spread if published and available. |
| (f) | Convertible security. |
| (g) | Represents an unsettled loan commitment at period end. Certain details associated with this purchase are not known prior to the settlement date, including coupon rate. |
| (h) | Amount is less than 500. |
| (i) | Affiliate of the Trust. |
| (j) | Annualized 7-day yield as of period end. |
| (k) | Other interests represent beneficial interests in liquidation trusts and other reorganization or private entities. |
For Trust compliance purposes, the Trust’s industry classifications refer to one or more of the industry sub-classifications used by one or more widely recognized market indexes or rating group indexes, and/or as defined by the investment adviser. These definitions may not apply for purposes of this report, which may combine such industry sub-classifications for reporting ease.
Affiliates
Investments in issuers considered to be affiliate(s) of the Trust during the six-months ended June 30, 2021 for purposes of Section 2(a)(3) of the Investment Company Act of 1940, as amended, were as follows:
| Affiliated Issuer | Value at 12/31/20 |
Purchases at Cost |
Proceeds from Sales |
Net Realized Gain (Loss) |
Change in Unrealized Appreciation (Depreciation) |
Value at 06/30/21 |
Shares Held at 06/30/21 |
Income | Capital Gain Distributions from Underlying Funds |
|||||||||||||||||||||||||||
| BlackRock Liquidity Funds, T-Fund, Institutional Class |
$ | — | $ | 217,930 | (a) | $ | — | $ | — | $ | — | $ | 217,930 | 217,930 | $ | 21 | $ | — | ||||||||||||||||||
| iShares iBoxx $ High Yield Corporate Bond ETF |
5,499,900 | — | (3,042,464 | ) | 215,893 | (208,209 | ) | 2,465,120 | 28,000 | 74,250 | — | |||||||||||||||||||||||||
| iShares iBoxx $ Investment Grade Corporate Bond ETF |
2,071,950 | — | — | — | (56,550 | ) | 2,015,400 | 15,000 | 19,533 | — | ||||||||||||||||||||||||||
|
|
|
|
|
|
|
|
|
|
|
|||||||||||||||||||||||||||
| $ | 215,893 | $ | (264,759 | ) | $ | 4,698,450 | $ | 93,804 | $ | — | ||||||||||||||||||||||||||
|
|
|
|
|
|
|
|
|
|
|
|||||||||||||||||||||||||||
| (a) | Represents net amount purchased (sold). |
Derivative Financial Instruments Outstanding as of Period End
Forward Foreign Currency Exchange Contracts
| Currency Purchased | Currency Sold | Counterparty | Settlement Date | Unrealized Appreciation (Depreciation) |
||||||||||||||||||||
| USD | 901,894 | EUR | 744,000 | BNP Paribas S.A. | 09/15/21 | $ | 18,353 | |||||||||||||||||
| USD | 1,800,369 | GBP | 1,274,000 | Citibank N.A. | 09/15/21 | 37,751 | ||||||||||||||||||
|
|
|
|||||||||||||||||||||||
| $ | 56,104 | |||||||||||||||||||||||
|
|
|
|||||||||||||||||||||||
| S C H E D U L E O F I N V E S T M E N T S |
121 |
| Schedule of Investments (unaudited) (continued) June 30, 2021 |
BlackRock Floating Rate Income Trust (BGT) |
Derivative Financial Instruments Categorized by Risk Exposure
As of period end, the fair values of derivative financial instruments located in the Statements of Assets and Liabilities were as follows:
| Commodity Contracts |
Credit Contracts |
Equity Contracts |
Foreign Currency Exchange Contracts |
Interest Rate Contracts |
Other Contracts |
Total | ||||||||||||||||||||||
| Assets — Derivative Financial Instruments |
||||||||||||||||||||||||||||
| Forward foreign currency exchange contracts |
||||||||||||||||||||||||||||
| Unrealized appreciation on forward foreign currency exchange contracts |
$ | — | $ | — | $ | — | $ | 56,104 | $ | — | $ | — | $ | 56,104 | ||||||||||||||
|
|
|
|
|
|
|
|
|
|
|
|
|
|
|
|||||||||||||||
For the six months ended June 30, 2021, the effect of derivative financial instruments in the Statements of Operations was as follows:
| Commodity Contracts |
Credit Contracts |
Equity Contracts |
Foreign Currency Exchange Contracts |
Interest Rate Contracts |
Other Contracts |
Total | ||||||||||||||||||||||
| Net Realized Gain (Loss) from |
||||||||||||||||||||||||||||
| Forward foreign currency exchange contracts |
$ | — | $ | — | $ | — | $ | (132,078 | ) | $ | — | $ | — | $ | (132,078 | ) | ||||||||||||
|
|
|
|
|
|
|
|
|
|
|
|
|
|
|
|||||||||||||||
| Net Change in Unrealized Appreciation (Depreciation) on |
||||||||||||||||||||||||||||
| Forward foreign currency exchange contracts |
$ | — | $ | — | $ | — | $ | 148,527 | $ | — | $ | — | $ | 148,527 | ||||||||||||||
|
|
|
|
|
|
|
|
|
|
|
|
|
|
|
|||||||||||||||
Average Quarterly Balances of Outstanding Derivative Financial Instruments
| Forward foreign currency exchange contracts |
||||
| Average amounts purchased — in USD |
$ | 3,398,657 | ||
For more information about the Trust’s investment risks regarding derivative financial instruments, refer to the Notes to Financial Statements.
Derivative Financial Instruments — Offsetting as of Period End
The Trust’s derivative assets and liabilities (by type) were as follows:
| Assets | Liabilities | |||||||
| Derivative Financial Instruments |
||||||||
| Forward foreign currency exchange contracts |
$ | 56,104 | $ | — | ||||
|
|
|
|
|
|||||
| Total derivative assets and liabilities in the Statements of Assets and Liabilities |
56,104 | — | ||||||
|
|
|
|
|
|||||
| Derivatives not subject to a Master Netting Agreement or similar agreement (“MNA”) |
— | — | ||||||
|
|
|
|
|
|||||
| Total derivative assets and liabilities subject to an MNA |
$ | 56,104 | $ | — | ||||
|
|
|
|
|
|||||
The following table presents the Trust’s derivative assets by counterparty net of amounts available for offset under an MNA and net of the related collateral received by the Trust:
| Counterparty |
|
Derivative Assets Subject to an MNA by Counterparty |
|
|
Derivatives Available for Offset |
|
|
Non-Cash Collateral Received |
|
|
Cash Collateral Received |
|
|
Net Amount of Derivative Assets |
(a) | |||||
| BNP Paribas S.A. |
$ | 18,353 | $ | — | $ | — | $ | — | $ | 18,353 | ||||||||||
| Citibank N.A. |
37,751 | — | — | — | 37,751 | |||||||||||||||
|
|
|
|
|
|
|
|
|
|
|
|||||||||||
| $ | 56,104 | $ | — | $ | — | $ | — | $ | 56,104 | |||||||||||
|
|
|
|
|
|
|
|
|
|
|
|||||||||||
| (a) | Net amount represents the net amount receivable from the counterparty in the event of default. |
| 122 | 2 0 2 1 B L A C K R O C K S E M I - A N N U A L R E P O R T T O S H A R E H O L D E R S |
| Schedule of Investments (unaudited) (continued) June 30, 2021 |
BlackRock Floating Rate Income Trust (BGT) |
Fair Value Hierarchy as of Period End
Various inputs are used in determining the fair value of financial instruments. For a description of the input levels and information about the Trust’s policy regarding valuation of financial instruments, refer to the Notes to Financial Statements.
The following table summarizes the Trust’s financial instruments categorized in the fair value hierarchy. The breakdown of the Trust’s financial instruments into major categories is disclosed in the Schedule of Investments above.
| Level 1 | Level 2 | Level 3 | Total | |||||||||||||
| Assets |
||||||||||||||||
| Investments |
||||||||||||||||
| Long-Term Investments |
||||||||||||||||
| Common Stocks |
||||||||||||||||
| Auto Components |
$ | 15,600 | $ | — | $ | — | $ | 15,600 | ||||||||
| Construction & Engineering |
37,556 | — | — | 37,556 | ||||||||||||
| Energy Equipment & Services |
— | — | 8,081 | 8,081 | ||||||||||||
| Household Durables |
— | — | — | — | ||||||||||||
| Media |
190,334 | — | — | 190,334 | ||||||||||||
| Metals & Mining |
— | 18,304 | 710 | 19,014 | ||||||||||||
| Oil, Gas & Consumable Fuels |
37,735 | — | — | 37,735 | ||||||||||||
| Software |
1,076 | — | — | 1,076 | ||||||||||||
| Specialty Retail |
— | 276,511 | — | 276,511 | ||||||||||||
| Corporate Bonds |
— | 7,589,950 | 395,362 | 7,985,312 | ||||||||||||
| Floating Rate Loan Interests |
— | 420,895,757 | 21,501,678 | 442,397,435 | ||||||||||||
| Investment Companies |
7,426,470 | — | — | 7,426,470 | ||||||||||||
| Other Interests |
— | — | — | — | ||||||||||||
| Warrants |
4,739 | — | — | 4,739 | ||||||||||||
| Short-Term Securities |
||||||||||||||||
| Money Market Funds |
217,930 | — | — | 217,930 | ||||||||||||
| Unfunded Floating Rate Loan Interests(a) |
— | 177 | — | 177 | ||||||||||||
| Liabilities |
||||||||||||||||
| Unfunded Floating Rate Loan Interests(a) |
— | (363 | ) | — | (363 | ) | ||||||||||
|
|
|
|
|
|
|
|
|
|||||||||
| $ | 7,931,440 | $ | 428,780,336 | $ | 21,905,831 | $ | 458,617,607 | |||||||||
|
|
|
|
|
|
|
|
|
|||||||||
| Derivative Financial Instruments(b) |
||||||||||||||||
| Assets |
||||||||||||||||
| Foreign Currency Exchange Contracts |
$ | — | $ | 56,104 | $ | — | $ | 56,104 | ||||||||
|
|
|
|
|
|
|
|
|
|||||||||
| (a) | Unfunded floating rate loan interests are valued at the unrealized appreciation (depreciation) on the commitment. |
| (b) | Derivative financial instruments are forward foreign currency exchange contracts. Forward foreign currency exchange contracts are valued at the unrealized appreciation (depreciation) on the instrument. |
The Trust may hold assets and/or liabilities in which the fair value approximates the carrying amount for financial statement purposes. As of period end, bank borrowings payable of $131,000,000 are categorized as Level 2 within the fair value hierarchy.
|
|
||||||||||||||||
| Common Stocks |
Corporate Bonds |
Floating Rate Loan Interests |
Total | |||||||||||||
|
|
||||||||||||||||
| Assets |
||||||||||||||||
| Opening balance, as of December 31, 2020 |
$ | 32,417 | $ | 262,106 | $ | 19,654,013 | $ | 19,948,536 | ||||||||
| Transfers into Level 3 |
— | — | 2,723,223 | 2,723,223 | ||||||||||||
| Transfers out of Level 3(a) |
— | — | (9,750,730 | ) | (9,750,730 | ) | ||||||||||
| Accrued discounts/premiums |
— | 7,656 | 13,525 | 21,181 | ||||||||||||
| Net realized gain (loss) |
— | 1,773 | 32,010 | 33,783 | ||||||||||||
| Net change in unrealized appreciation (depreciation)(b),(c) |
(23,626 | ) | 127,144 | 253,103 | 356,621 | |||||||||||
| S C H E D U L E O F I N V E S T M E N T S |
123 |
| Schedule of Investments (unaudited) (continued) June 30, 2021 |
BlackRock Floating Rate Income Trust (BGT) |
|
|
||||||||||||||||
| Common Stocks |
Corporate Bonds |
Floating Rate Loan Interests |
Total | |||||||||||||
|
|
||||||||||||||||
| Purchases |
$ | — | $ | 6,940 | $ | 12,079,943 | $ | 12,086,883 | ||||||||
| Sales |
— | (10,257 | ) | (3,503,409 | ) | (3,513,666 | ) | |||||||||
|
|
|
|
|
|
|
|
|
|||||||||
| Closing balance, as of June 30, 2021 |
$ | 8,791 | $ | 395,362 | $ | 21,501,678 | $ | 21,905,831 | ||||||||
|
|
|
|
|
|
|
|
|
|||||||||
| Net change in unrealized appreciation (depreciation) on investments still held at June 30, 2021(c) |
$ | (23,626 | ) | $ | 127,144 | $ | 286,261 | $ | 389,779 | |||||||
|
|
|
|
|
|
|
|
|
|||||||||
| (a) | As of December 31, 2020, the Trust used significant unobservable inputs in determining the value of certain investments. As of June 30, 2021, the Trust used observable inputs in determining the value of the same investments. As a result, investments at beginning of period value were transferred from Level 3 to Level 2 in the disclosure hierarchy. |
| (b) | Included in the related net change in unrealized appreciation (depreciation) in the Statements of Operations. |
| (c) | Any difference between net change in unrealized appreciation (depreciation) and net change in unrealized appreciation (depreciation) on investments still held at June 30, 2021 is generally due to investments no longer held or categorized as Level 3 at period end. |
See notes to financial statements.
| 124 | 2 0 2 1 B L A C K R O C K S E M I - A N N U A L R E P O R T T O S H A R E H O L D E R S |
Statements of Assets and Liabilities (unaudited)
June 30, 2021
| BHK | HYT(a) | BTZ | BGT | |||||||||||||
| ASSETS |
||||||||||||||||
| Investments, at value — unaffiliated(b) |
$ | 1,317,858,992 | $ | 2,165,790,112 | $ | 2,024,214,258 | $ | 453,919,343 | ||||||||
| Investments, at value — affiliated(c) |
13,822,437 | 7,985,005 | 10,753,181 | 4,698,450 | ||||||||||||
| Cash |
594,492 | 14,412 | — | 1,503,138 | ||||||||||||
| Cash pledged: |
||||||||||||||||
| Collateral — exchange-traded options written |
— | — | 1,200,000 | — | ||||||||||||
| Collateral — OTC derivatives |
3,400,000 | — | — | — | ||||||||||||
| Futures contracts |
985,970 | 650,000 | 2,798,000 | — | ||||||||||||
| Centrally cleared swaps |
6,467,940 | — | — | — | ||||||||||||
| Foreign currency, at value(d) |
791,142 | 1,004,470 | 3,760,832 | — | ||||||||||||
| Receivables: |
||||||||||||||||
| Investments sold |
2,775,435 | 7,273,474 | 7,452,243 | 10,185,994 | ||||||||||||
| Options written |
11,802 | — | — | — | ||||||||||||
| Reverse repurchase agreements |
— | — | 4,389,694 | — | ||||||||||||
| Dividends — unaffiliated |
24,339 | 65,655 | 17,813 | — | ||||||||||||
| Dividends — affiliated |
245 | 10 | 103 | — | ||||||||||||
| Interest — unaffiliated |
11,515,632 | 27,853,586 | 24,242,311 | 1,091,672 | ||||||||||||
| Variation margin on futures contracts |
254,220 | — | 91,875 | — | ||||||||||||
| Variation margin on centrally cleared swaps |
— | 62,592 | — | — | ||||||||||||
| Swap premiums paid |
2,732 | 28,364 | — | — | ||||||||||||
| Unrealized appreciation on: |
||||||||||||||||
| Forward foreign currency exchange contracts |
252,099 | 1,127,560 | — | 56,104 | ||||||||||||
| OTC swaps |
424,214 | 1,079,129 | — | — | ||||||||||||
| Unfunded floating rate loan interests |
4 | 37 | — | 177 | ||||||||||||
|
|
|
|
|
|
|
|
|
|||||||||
| Total assets |
1,359,181,695 | 2,212,934,406 | 2,078,920,310 | 471,454,878 | ||||||||||||
|
|
|
|
|
|
|
|
|
|||||||||
| LIABILITIES |
||||||||||||||||
| Foreign bank overdraft(d) |
— | — | — | 2,670 | ||||||||||||
| Cash received: |
||||||||||||||||
| Collateral — reverse repurchase agreements |
611,000 | — | 4,825,906 | — | ||||||||||||
| Collateral — OTC derivatives |
510,000 | 870,000 | 80,000 | — | ||||||||||||
| Options written, at value(e) |
6,988,739 | — | 153,796 | — | ||||||||||||
| Reverse repurchase agreements, at value |
466,168,595 | — | 588,758,744 | — | ||||||||||||
| Payables: |
||||||||||||||||
| Investments purchased |
7,903,829 | 52,909,082 | 12,220,314 | 35,413,930 | ||||||||||||
| Reverse repurchase agreements |
— | — | 4,389,694 | — | ||||||||||||
| Swaps |
— | 1,888 | — | — | ||||||||||||
| Bank borrowings |
— | 657,000,000 | — | 131,000,000 | ||||||||||||
| Income dividend distributions |
— | — | 343,826 | 37,146 | ||||||||||||
| Interest expense |
— | 517,046 | — | 111,899 | ||||||||||||
| Investment advisory fees |
544,151 | 1,053,017 | 1,031,919 | 266,064 | ||||||||||||
| Trustees’ and Officer’s fees |
309,170 | 790,821 | 1,028,285 | 297,348 | ||||||||||||
| Options written |
21,748 | — | — | — | ||||||||||||
| Other accrued expenses |
573,968 | 961,305 | 663,258 | 224,412 | ||||||||||||
| Variation margin on futures contracts |
116,256 | 65,416 | 335,915 | — | ||||||||||||
| Variation margin on centrally cleared swaps |
291,452 | — | — | — | ||||||||||||
| Swap premiums received |
3,006,338 | 167,980 | — | — | ||||||||||||
| Unrealized depreciation on: |
||||||||||||||||
| OTC swaps |
349,651 | 577 | — | — | ||||||||||||
| Unfunded floating rate loan interests |
— | — | — | 363 | ||||||||||||
|
|
|
|
|
|
|
|
|
|||||||||
| Total liabilities |
487,394,897 | 714,337,132 | 613,831,657 | 167,353,832 | ||||||||||||
|
|
|
|
|
|
|
|
|
|||||||||
| NET ASSETS |
$ | 871,786,798 | $ | 1,498,597,274 | $ | 1,465,088,653 | $ | 304,101,046 | ||||||||
|
|
|
|
|
|
|
|
|
|||||||||
| F I N A N C I A L S T A T E M E N T S |
125 |
Statements of Assets and Liabilities (unaudited) (continued)
June 30, 2021
| BHK | HYT(a) | BTZ | BGT | |||||||||||||
| NET ASSETS CONSIST OF |
||||||||||||||||
| Paid-in capital(f)(g)(h) |
$ | 754,730,308 | $ | 1,562,963,576 | $ | 1,266,567,413 | $ | 331,286,022 | ||||||||
| Accumulated earnings (loss) |
117,056,490 | (64,366,302 | ) | 198,521,240 | (27,184,976 | ) | ||||||||||
|
|
|
|
|
|
|
|
|
|||||||||
| NET ASSETS |
$ | 871,786,798 | $ | 1,498,597,274 | $ | 1,465,088,653 | $ | 304,101,046 | ||||||||
|
|
|
|
|
|
|
|
|
|||||||||
| Net asset value(f)(g)(h) |
$ | 16.16 | $ | 12.29 | $ | 15.67 | $ | 13.60 | ||||||||
|
|
|
|
|
|
|
|
|
|||||||||
| (a) Consolidated Statement of Assets and Liabilities. |
||||||||||||||||
| (b) Investments, at cost — unaffiliated |
$ | 1,219,635,237 | $ | 2,079,419,005 | $ | 1,797,406,768 | $ | 453,202,641 | ||||||||
| (c) Investments, at cost — affiliated |
$ | 13,822,437 | $ | 7,427,338 | $ | 10,753,181 | $ | 4,333,899 | ||||||||
| (d) Foreign currency, at cost |
$ | 798,627 | $ | 1,007,011 | $ | 3,836,647 | $ | (2,772 | ) | |||||||
| (e) Premiums received |
$ | 7,220,795 | $ | — | $ | 202,613 | $ | — | ||||||||
| (f) Shares outstanding |
53,958,567 | 121,944,143 | 93,478,999 | 22,360,371 | ||||||||||||
| (g) Shares authorized |
Unlimited | 200 million | Unlimited | Unlimited | ||||||||||||
| (h) Par value |
$ | 0.001 | $ | 0.10 | $ | 0.001 | $ | 0.001 | ||||||||
See notes to financial statements.
| 126 | 2 0 2 1 B L A C K R O C K S E M I - A N N U A L R E P O R T T O S H A R E H O L D E R S |
Statements of Operations (unaudited)
Six Months Ended June 30, 2021
| BHK | HYT(a) | BTZ | BGT | |||||||||||||
|
|
||||||||||||||||
| INVESTMENT INCOME |
||||||||||||||||
| Dividends — unaffiliated |
$ | 136,619 | $ | 712,699 | $ | 1,131,034 | $ | 44,805 | ||||||||
| Dividends — affiliated |
1,333 | 161,893 | 1,368 | 93,804 | ||||||||||||
| Interest — unaffiliated |
23,023,236 | 55,502,188 | 46,989,575 | 9,178,158 | ||||||||||||
| Other income — unaffiliated |
— | 448,027 | — | 251,098 | ||||||||||||
| Foreign taxes withheld |
(191 | ) | — | — | — | |||||||||||
|
|
|
|
|
|
|
|
|
|||||||||
| Total investment income |
23,160,997 | 56,824,807 | 48,121,977 | 9,567,865 | ||||||||||||
|
|
|
|
|
|
|
|
|
|||||||||
| EXPENSES |
||||||||||||||||
| Investment advisory |
3,080,820 | 6,273,087 | 6,271,993 | 1,621,079 | ||||||||||||
| Accounting services |
67,016 | 100,792 | 98,755 | 33,852 | ||||||||||||
| Professional |
63,092 | 84,171 | 69,619 | 59,479 | ||||||||||||
| Trustees and Officer |
62,694 | 141,720 | 176,278 | 48,241 | ||||||||||||
| Custodian |
40,595 | 37,807 | 16,634 | 15,340 | ||||||||||||
| Transfer agent |
27,555 | 46,370 | 108,555 | 19,394 | ||||||||||||
| Registration |
9,281 | 29,290 | 17,868 | 4,194 | ||||||||||||
| Printing and postage |
4,836 | 4,357 | 18,331 | 3,306 | ||||||||||||
| Miscellaneous |
103,659 | 101,381 | 50,875 | 13,274 | ||||||||||||
|
|
|
|
|
|
|
|
|
|||||||||
| Total expenses excluding interest expense |
3,459,548 | 6,818,975 | 6,828,908 | 1,818,159 | ||||||||||||
| Interest expense |
143,886 | 2,917,508 | 1,572,003 | 619,801 | ||||||||||||
|
|
|
|
|
|
|
|
|
|||||||||
| Total expenses |
3,603,434 | 9,736,483 | 8,400,911 | 2,437,960 | ||||||||||||
| Less: |
||||||||||||||||
| Fees waived and/or reimbursed by the Manager |
(2,708 | ) | (24,785 | ) | (3,788 | ) | (22,487 | ) | ||||||||
|
|
|
|
|
|
|
|
|
|||||||||
| Total expenses after fees waived and/or reimbursed |
3,600,726 | 9,711,698 | 8,397,123 | 2,415,473 | ||||||||||||
|
|
|
|
|
|
|
|
|
|||||||||
| Net investment income |
19,560,271 | 47,113,109 | 39,724,854 | 7,152,392 | ||||||||||||
|
|
|
|
|
|
|
|
|
|||||||||
| REALIZED AND UNREALIZED GAIN (LOSS) |
||||||||||||||||
| Net realized gain (loss) from: |
||||||||||||||||
| Investments — unaffiliated |
14,150,246 | 36,989,533 | 12,294,317 | 2,642,134 | ||||||||||||
| Investments — affiliated |
— | 62,881 | — | 215,893 | ||||||||||||
| Forward foreign currency exchange contracts |
(119,321 | ) | (842,688 | ) | — | (132,078 | ) | |||||||||
| Foreign currency transactions |
25,991 | (27,287 | ) | 17,924 | (38,438 | ) | ||||||||||
| Futures contracts |
249,694 | 5,756,597 | 3,269,108 | — | ||||||||||||
| Options written |
1,242,302 | (7,419 | ) | 1,528,676 | — | |||||||||||
| Swaps |
(673,973 | ) | 1,168,476 | (79,350 | ) | — | ||||||||||
|
|
|
|
|
|
|
|
|
|||||||||
| 14,874,939 | 43,100,093 | 17,030,675 | 2,687,511 | |||||||||||||
|
|
|
|
|
|
|
|
|
|||||||||
| Net change in unrealized appreciation (depreciation) on: |
||||||||||||||||
| Investments — unaffiliated |
(31,739,826 | ) | (3,587,720 | ) | (19,640,776 | ) | 1,904,517 | |||||||||
| Investments — affiliated |
— | 85,781 | — | (264,759 | ) | |||||||||||
| Forward foreign currency exchange contracts |
548,116 | 2,444,621 | — | 148,527 | ||||||||||||
| Foreign currency translations |
(78,144 | ) | 96,576 | (81,592 | ) | (12 | ) | |||||||||
| Futures contracts |
1,755,592 | (400,309 | ) | (1,095,212 | ) | — | ||||||||||
| Options written |
(2,579,293 | ) | — | 136,375 | — | |||||||||||
| Swaps |
2,222,910 | (172,872 | ) | 75,621 | — | |||||||||||
| Unfunded floating rate loan interests |
4 | 37 | — | 92 | ||||||||||||
|
|
|
|
|
|
|
|
|
|||||||||
| (29,870,641 | ) | (1,533,886 | ) | (20,605,584 | ) | 1,788,365 | ||||||||||
|
|
|
|
|
|
|
|
|
|||||||||
| Net realized and unrealized gain (loss) |
(14,995,702 | ) | 41,566,207 | (3,574,909 | ) | 4,475,876 | ||||||||||
|
|
|
|
|
|
|
|
|
|||||||||
| NET INCREASE IN NET ASSETS RESULTING FROM OPERATIONS |
$ | 4,564,569 | $ | 88,679,316 | $ | 36,149,945 | $ | 11,628,268 | ||||||||
|
|
|
|
|
|
|
|
|
|||||||||
| (a) | Consolidated Statement of Operations. |
See notes to financial statements.
| F I N A N C I A L S T A T E M E N T S |
127 |
Statements of Changes in Net Assets
| BHK | HYT(a) | |||||||||||||||
| Six Months Ended 06/30/21 (unaudited) |
Year Ended 12/31/20 |
Six Months Ended (unaudited) |
Year Ended 12/31/20 |
|||||||||||||
|
|
||||||||||||||||
| INCREASE (DECREASE) IN NET ASSETS |
||||||||||||||||
| OPERATIONS |
||||||||||||||||
| Net investment income |
$ | 19,560,271 | $ | 38,672,682 | $ | 47,113,109 | $ | 96,242,373 | ||||||||
| Net realized gain (loss) |
14,874,939 | 16,499,153 | 43,100,093 | (33,028,961 | ) | |||||||||||
| Net change in unrealized appreciation (depreciation) |
(29,870,641 | ) | 49,956,262 | (1,533,886 | ) | 55,781,645 | ||||||||||
|
|
|
|
|
|
|
|
|
|||||||||
| Net increase in net assets resulting from operations |
4,564,569 | 105,128,097 | 88,679,316 | 118,995,057 | ||||||||||||
|
|
|
|
|
|
|
|
|
|||||||||
| DISTRIBUTIONS TO SHAREHOLDERS(b) |
||||||||||||||||
| From net investment income and net realized gain |
(20,120,605 | ) | (44,507,265 | ) | (47,481,630 | )(c) | (100,401,036 | ) | ||||||||
| Return of capital |
— | — | — | (13,554,876 | ) | |||||||||||
|
|
|
|
|
|
|
|
|
|||||||||
| Decrease in net assets resulting from distributions to shareholders |
(20,120,605 | ) | (44,507,265 | ) | (47,481,630 | ) | (113,955,912 | ) | ||||||||
|
|
|
|
|
|
|
|
|
|||||||||
| CAPITAL SHARE TRANSACTIONS |
||||||||||||||||
| Reinvestment of distributions |
373,022 | — | 492,678 | — | ||||||||||||
|
|
|
|
|
|
|
|
|
|||||||||
| NET ASSETS |
||||||||||||||||
| Total increase (decrease) in net assets |
(15,183,014 | ) | 60,620,832 | 41,690,364 | 5,039,145 | |||||||||||
| Beginning of period |
886,969,812 | 826,348,980 | 1,456,906,910 | 1,451,867,765 | ||||||||||||
|
|
|
|
|
|
|
|
|
|||||||||
| End of period |
$ | 871,786,798 | $ | 886,969,812 | $ | 1,498,597,274 | $ | 1,456,906,910 | ||||||||
|
|
|
|
|
|
|
|
|
|||||||||
| (a) | Consolidated Statement of Changes in Net Assets. |
| (b) | Distributions for annual periods determined in accordance with U.S. federal income tax regulations. |
| (c) | A portion of the distributions from net investment income may be deemed a return of capital or net realized gain at fiscal year-end. |
See notes to financial statements.
| 128 | 2 0 2 1 B L A C K R O C K S E M I - A N N U A L R E P O R T T O S H A R E H O L D E R S |
Statements of Changes in Net Assets (continued)
| BTZ | BGT | |||||||||||||||
| Six Months Ended 06/30/21 (unaudited) |
Year Ended 12/31/20 |
Six Months Ended 06/30/21 (unaudited) |
Year Ended 12/31/20 |
|||||||||||||
|
|
||||||||||||||||
| INCREASE (DECREASE) IN NET ASSETS |
||||||||||||||||
| OPERATIONS |
||||||||||||||||
| Net investment income |
$ | 39,724,854 | $ | 79,503,585 | $ | 7,152,392 | $ | 15,066,809 | ||||||||
| Net realized gain (loss) |
17,030,675 | 20,528,950 | 2,687,511 | (12,507,913 | ) | |||||||||||
| Net change in unrealized appreciation (depreciation) |
(20,605,584 | ) | 62,634,726 | 1,788,365 | 135,008 | |||||||||||
|
|
|
|
|
|
|
|
|
|||||||||
| Net increase in net assets resulting from operations |
36,149,945 | 162,667,261 | 11,628,268 | 2,693,904 | ||||||||||||
|
|
|
|
|
|
|
|
|
|||||||||
| DISTRIBUTIONS TO SHAREHOLDERS(a) |
||||||||||||||||
| From net investment income |
(39,214,440 | )(b) | (79,320,638 | ) | (7,233,580 | )(b) | (15,793,436 | ) | ||||||||
| Return of capital |
— | (14,794,018 | ) | — | (4,425,207 | ) | ||||||||||
|
|
|
|
|
|
|
|
|
|||||||||
| Decrease in net assets resulting from distributions to shareholders |
(39,214,440 | ) | (94,114,656 | ) | (7,233,580 | ) | (20,218,643 | ) | ||||||||
|
|
|
|
|
|
|
|
|
|||||||||
| CAPITAL SHARE TRANSACTIONS |
||||||||||||||||
| Redemption of shares resulting from share repurchase program (including transaction costs) |
— | (155,227,064 | ) | (419,729 | ) | (6,057,572 | ) | |||||||||
|
|
|
|
|
|
|
|
|
|||||||||
| NET ASSETS |
||||||||||||||||
| Total increase (decrease) in net assets |
(3,064,495 | ) | (86,674,459 | ) | 3,974,959 | (23,582,311 | ) | |||||||||
| Beginning of period |
1,468,153,148 | 1,554,827,607 | 300,126,087 | 323,708,398 | ||||||||||||
|
|
|
|
|
|
|
|
|
|||||||||
| End of period |
$ | 1,465,088,653 | $ | 1,468,153,148 | $ | 304,101,046 | $ | 300,126,087 | ||||||||
|
|
|
|
|
|
|
|
|
|||||||||
| (a) | Distributions for annual periods determined in accordance with U.S. federal income tax regulations. |
| (b) | A portion of the distributions from net investment income may be deemed a return of capital or net realized gain at fiscal year-end. |
See notes to financial statements.
|
F I N A N C I A L S T A T E M E N T S |
129 |
Statements of Cash Flows (unaudited)
Six Months Ended June 30, 2021
| BHK | HYT | BTZ | BGT | |||||||||||||
|
|
||||||||||||||||
| CASH PROVIDED BY (USED FOR) OPERATING ACTIVITIES |
||||||||||||||||
| Net increase in net assets resulting from operations |
$ | 4,564,569 | $ | 88,679,316 | $ | 36,149,945 | $ | 11,628,268 | ||||||||
| Adjustments to reconcile net increase in net assets resulting from operations to net cash provided by (used for) operating activities |
||||||||||||||||
| Proceeds from sales of long-term investments and principal paydowns/payups |
165,502,903 | 706,015,071 | 245,323,790 | 127,891,646 | ||||||||||||
| Purchases of long-term investments |
(325,843,419 | ) | (676,857,516 | ) | (216,252,882 | ) | (128,857,443 | ) | ||||||||
| Net proceeds from sales (purchases) of short-term securities |
(5,753,555 | ) | 200,000 | 13,369,518 | (217,930 | ) | ||||||||||
| Amortization of premium and accretion of discount on investments and other fees |
1,038,642 | 685,482 | 1,347,543 | (410,765 | ) | |||||||||||
| Premiums paid on closing options written |
(8,143,318 | ) | (11,167 | ) | (6,420,566 | ) | — | |||||||||
| Premiums received from options written |
6,957,440 | 3,748 | 5,022,926 | — | ||||||||||||
| Net realized gain on investments and options written |
(16,192,789 | ) | (36,821,490 | ) | (13,811,024 | ) | (2,856,316 | ) | ||||||||
| Net unrealized (appreciation) depreciation on investments, options written, swaps, foreign currency translations and unfunded floating rate loan interests |
32,858,034 | 1,230,153 | 19,428,780 | (1,788,365 | ) | |||||||||||
| (Increase) Decrease in Assets |
||||||||||||||||
| Receivables |
||||||||||||||||
| Dividends — affiliated |
56 | 26 | 321 | 23 | ||||||||||||
| Dividends — unaffiliated |
— | 6,090 | (1 | ) | — | |||||||||||
| Interest — unaffiliated |
(945,137 | ) | 1,516,342 | (65,362 | ) | 343,997 | ||||||||||
| Variation margin on futures contracts |
(123,406 | ) | — | (18,375 | ) | — | ||||||||||
| Variation margin on centrally cleared swaps |
— | (62,592 | ) | — | — | |||||||||||
| Swap premiums paid |
(2,732 | ) | 48,729 | 15,776 | — | |||||||||||
| Prepaid expenses |
8,283 | 13,253 | 13,920 | 2,791 | ||||||||||||
| Increase (Decrease) in Liabilities |
||||||||||||||||
| Cash received |
||||||||||||||||
| Collateral — reverse repurchase agreements |
611,000 | — | (7,152,586 | ) | — | |||||||||||
| Collateral — OTC derivatives |
20,000 | 30,000 | (110,000 | ) | — | |||||||||||
| Payables |
||||||||||||||||
| Swaps |
— | 1,888 | — | — | ||||||||||||
| Interest expense |
21,312 | (32,301 | ) | (1,191,556 | ) | (7,092 | ) | |||||||||
| Investment advisory fees |
44,686 | (13,425 | ) | (50,965 | ) | (6,619 | ) | |||||||||
| Trustees’ and Officer’s fees |
41,865 | 85,513 | 111,683 | 29,325 | ||||||||||||
| Other accrued expenses |
149,016 | 228,772 | 240,136 | 42,845 | ||||||||||||
| Variation margin on futures contracts |
(3,756 | ) | (90,835 | ) | 200,982 | — | ||||||||||
| Variation margin on centrally cleared swaps |
165,357 | — | — | — | ||||||||||||
| Swap premiums received |
(578,178 | ) | (44,340 | ) | — | — | ||||||||||
|
|
|
|
|
|
|
|
|
|||||||||
| Net cash provided by (used for) operating activities |
(145,603,127 | ) | 84,810,717 | 76,152,003 | 5,794,365 | |||||||||||
|
|
|
|
|
|
|
|
|
|||||||||
| CASH PROVIDED BY (USED FOR) FINANCING ACTIVITIES |
||||||||||||||||
| Cash dividends paid to shareholders |
(23,771,144 | ) | (56,485,278 | ) | (46,713,502 | ) | (8,645,433 | ) | ||||||||
| Payments for bank borrowings |
— | (323,000,000 | ) | — | (83,000,000 | ) | ||||||||||
| Net payments on redemption of capital shares |
— | — | — | (419,729 | ) | |||||||||||
| Proceeds from bank borrowings |
— | 295,000,000 | — | 85,000,000 | ||||||||||||
| Increase (decrease) in bank overdraft |
(89,584 | ) | (819,608 | ) | — | 2,670 | ||||||||||
| Net borrowing of reverse repurchase agreements |
169,226,269 | — | (24,221,880 | ) | — | |||||||||||
|
|
|
|
|
|
|
|
|
|||||||||
| Net cash provided by (used for) for financing activities |
145,365,541 | (85,304,886 | ) | (70,935,382 | ) | (7,062,492 | ) | |||||||||
|
|
|
|
|
|
|
|
|
|||||||||
| CASH IMPACT FROM FOREIGN EXCHANGE FLUCTUATIONS |
||||||||||||||||
| Cash impact from foreign exchange fluctuations |
(73,933 | ) | (5,465 | ) | (81,592 | ) | (12 | ) | ||||||||
|
|
|
|
|
|
|
|
|
|||||||||
| CASH AND FOREIGN CURRENCY |
||||||||||||||||
| Net increase (decrease) in restricted and unrestricted cash and foreign currency |
(311,519 | ) | (499,634 | ) | 5,135,029 | (1,268,139 | ) | |||||||||
| Restricted and unrestricted cash and foreign currency at beginning of period |
12,551,063 | 2,168,516 | 2,623,803 | 2,771,277 | ||||||||||||
|
|
|
|
|
|
|
|
|
|||||||||
| Restricted and unrestricted cash and foreign currency at end of period |
$ | 12,239,544 | $ | 1,668,882 | $ | 7,758,832 | $ | 1,503,138 | ||||||||
|
|
|
|
|
|
|
|
|
|||||||||
| SUPPLEMENTAL DISCLOSURE OF CASH FLOW INFORMATION |
||||||||||||||||
| Cash paid during the period for interest expense |
$ | 122,574 | $ | 2,949,809 | $ | 2,763,559 | $ | 626,893 | ||||||||
|
|
|
|
|
|
|
|
|
|||||||||
| NON-CASH FINANCING ACTIVITIES |
||||||||||||||||
| Capital shares issued in reinvestment of distributions paid to shareholders |
$ | 373,022 | $ | 492,678 | $ | — | $ | — | ||||||||
|
|
|
|
|
|
|
|
|
|||||||||
| 130 | 2 0 2 1 B L A C K R O C K S E M I - A N N U A L R E P O R T T O S H A R E H O L D E R S |
Statements of Cash Flows (unaudited) (continued)
Six Months Ended June 30, 2021
| BHK | HYT | BTZ | BGT | |||||||||||||
| RECONCILIATION OF RESTRICTED AND UNRESTRICTED CASH AND FOREIGN CURRENCY AT THE END OF PERIOD TO THE STATEMENTS OF ASSETS AND LIABILITIES |
||||||||||||||||
| Cash |
$ | 594,492 | $ | 14,412 | $ | — | $ | 1,503,138 | ||||||||
| Cash pledged |
||||||||||||||||
| Collateral — exchange-traded options written |
— | — | 1,200,000 | — | ||||||||||||
| Collateral — OTC derivatives |
3,400,000 | — | — | — | ||||||||||||
| Futures contracts |
985,970 | 650,000 | 2,798,000 | — | ||||||||||||
| Centrally cleared swaps |
6,467,940 | — | — | — | ||||||||||||
| Foreign currency at value |
791,142 | 1,004,470 | 3,760,832 | — | ||||||||||||
|
|
|
|
|
|
|
|
|
|||||||||
| $ | 12,239,544 | $ | 1,668,882 | $ | 7,758,832 | $ | 1,503,138 | |||||||||
|
|
|
|
|
|
|
|
|
|||||||||
See notes to financial statements.
| F I N A N C I A L S T A T E M E N T S |
131 |
(For a share outstanding throughout each period)
| BHK | ||||||||||||||||||||||||||||||||||
| Six Months Ended 06/30/21 (unaudited) |
Year Ended 12/31/20 |
Period from 09/01/19 to 12/31/19 |
Year Ended August 31, | |||||||||||||||||||||||||||||||
| 2019 | 2018 | 2017 | 2016 | |||||||||||||||||||||||||||||||
| Net asset value, beginning of period |
$ | 16.45 | $ | 15.32 | $ | 15.79 | $ | 14.08 | $ | 14.96 | $ | 15.25 | $ | 14.29 | ||||||||||||||||||||
|
|
|
|
|
|
|
|
|
|
|
|
|
|
|
|||||||||||||||||||||
| Net investment income(a) |
0.36 | 0.72 | 0.22 | 0.66 | 0.72 | 0.76 | 0.79 | |||||||||||||||||||||||||||
| Net realized and unrealized gain (loss) |
(0.28 | ) | 1.24 | (0.36 | ) | 1.82 | (0.82 | ) | (0.27 | ) | 1.01 | |||||||||||||||||||||||
|
|
|
|
|
|
|
|
|
|
|
|
|
|
|
|||||||||||||||||||||
| Net increase (decrease) from investment operations |
0.08 | 1.96 | (0.14 | ) | 2.48 | (0.10 | ) | 0.49 | 1.80 | |||||||||||||||||||||||||
|
|
|
|
|
|
|
|
|
|
|
|
|
|
|
|||||||||||||||||||||
| Distributions(b) |
||||||||||||||||||||||||||||||||||
| From net investment income |
(0.37 | ) | (0.64 | ) | (0.27 | ) | (0.73 | ) | (0.78 | ) | (0.78 | ) | (0.84 | ) | ||||||||||||||||||||
| From net realized gain |
— | (0.19 | ) | (0.04 | ) | (0.04 | ) | — | — | — | ||||||||||||||||||||||||
| Return of capital |
— | — | (0.02 | ) | — | — | — | — | ||||||||||||||||||||||||||
|
|
|
|
|
|
|
|
|
|
|
|
|
|
|
|||||||||||||||||||||
| Total distributions |
(0.37 | ) | (0.83 | ) | (0.33 | ) | (0.77 | ) | (0.78 | ) | (0.78 | ) | (0.84 | ) | ||||||||||||||||||||
|
|
|
|
|
|
|
|
|
|
|
|
|
|
|
|||||||||||||||||||||
| Net asset value, end of period |
$ | 16.16 | $ | 16.45 | $ | 15.32 | $ | 15.79 | $ | 14.08 | $ | 14.96 | $ | 15.25 | ||||||||||||||||||||
|
|
|
|
|
|
|
|
|
|
|
|
|
|
|
|||||||||||||||||||||
| Market price, end of period |
$ | 16.52 | $ | 16.30 | $ | 14.58 | $ | 14.56 | $ | 12.85 | $ | 14.10 | $ | 14.33 | ||||||||||||||||||||
|
|
|
|
|
|
|
|
|
|
|
|
|
|
|
|||||||||||||||||||||
| Total Return(c) |
||||||||||||||||||||||||||||||||||
| Based on net asset value |
0.57 | %(d) | 13.24 | % | (0.75 | )%(d) | 18.86 | % | (0.24 | )% | 3.88 | % | 13.67 | % | ||||||||||||||||||||
|
|
|
|
|
|
|
|
|
|
|
|
|
|
|
|||||||||||||||||||||
| Based on market price |
3.76 | %(d) | 17.90 | % | 2.43 | %(d) | 20.09 | % | (3.40 | )% | 4.20 | % | 20.85 | % | ||||||||||||||||||||
|
|
|
|
|
|
|
|
|
|
|
|
|
|
|
|||||||||||||||||||||
| Ratios to Average Net Assets |
||||||||||||||||||||||||||||||||||
| Total expenses |
0.84 | %(e) | 0.91 | %(f) | 1.42 | %(e)(g) | 1.72 | % | 1.60 | % | 1.16 | % | 0.97 | % | ||||||||||||||||||||
|
|
|
|
|
|
|
|
|
|
|
|
|
|
|
|||||||||||||||||||||
| Total expenses after fees waived and/or reimbursed |
0.84 | %(e) | 0.90 | %(f) | 1.42 | %(e) | 1.72 | % | 1.60 | % | 1.16 | % | 0.97 | % | ||||||||||||||||||||
|
|
|
|
|
|
|
|
|
|
|
|
|
|
|
|||||||||||||||||||||
| Total expenses after fees waived and/or reimbursed and excluding interest expense |
0.81 | %(e) | 0.75 | %(f) | 0.79 | %(e) | 0.77 | % | 0.82 | % | 0.78 | % | 0.78 | % | ||||||||||||||||||||
|
|
|
|
|
|
|
|
|
|
|
|
|
|
|
|||||||||||||||||||||
| Net investment income |
4.57 | %(e) | 4.52 | %(f) | 4.15 | %(e) | 4.63 | % | 4.99 | % | 5.19 | % | 5.48 | % | ||||||||||||||||||||
|
|
|
|
|
|
|
|
|
|
|
|
|
|
|
|||||||||||||||||||||
| Supplemental Data |
||||||||||||||||||||||||||||||||||
| Net assets, end of period (000) |
$ | 871,787 | $ | 886,970 | $ | 826,349 | $ | 851,650 | $ | 759,385 | $ | 806,848 | $ | 822,549 | ||||||||||||||||||||
|
|
|
|
|
|
|
|
|
|
|
|
|
|
|
|||||||||||||||||||||
| Borrowings outstanding, end of period (000) |
$ | 466,169 | $ | 296,921 | $ | 271,749 | $ | 273,621 | $ | 316,216 | $ | 289,078 | $ | 288,239 | ||||||||||||||||||||
|
|
|
|
|
|
|
|
|
|
|
|
|
|
|
|||||||||||||||||||||
| Portfolio turnover rate(h) |
13 | % | 69 | % | 21 | % | 27 | % | 28 | % | 32 | % | 35 | % | ||||||||||||||||||||
|
|
|
|
|
|
|
|
|
|
|
|
|
|
|
|||||||||||||||||||||
| (a) Based on average shares outstanding. (b) Distributions for annual periods determined in accordance with U.S. federal income tax regulations. (c) Total returns based on market price, which can be significantly greater or less than the net asset value, may result in substantially different returns. Where applicable, excludes the effects of any sales charges and assumes the reinvestment of distributions at actual reinvestment prices. (d) Aggregate total return. (e) Annualized. (f) Excludes expenses incurred indirectly as a result of investments in underlying funds of approximately 0.01%. (g) Audit costs were not annualized in the calculation of the expense ratios. If these expenses were annualized, the total expenses and total expenses after fees waived and/or reimbursed would have been 1.45%. (h) Includes mortgage dollar roll transactions (“MDRs”). Additional information regarding portfolio turnover rate is as follows:
|
| |||||||||||||||||||||||||||||||||
|
Six Months Ended (unaudited) |
Year Ended 12/31/20 |
Period from 09/01/19 to 12/31/19 |
Year Ended August 31, | |||||||||||||||||||||||||||||||
| 2019 | 2018 | 2017 | 2016 | |||||||||||||||||||||||||||||||
| Portfolio turnover rate (excluding MDRs) |
13 | % | 55 | % | 11 | % | 27 | % | 28 | % | 32 | % | 35 | % | ||||||||||||||||||||
|
|
|
|
|
|
|
|
|
|
|
|
|
|
|
|||||||||||||||||||||
See notes to financial statements.
| 132 | 2 0 2 1 B L A C K R O C K S E M I - A N N U A L R E P O R T T O S H A R E H O L D E R S |
Financial Highlights (continued)
(For a share outstanding throughout each period)
| HYT(a) | ||||||||||||||||||||||||||||||||||
|
Six Months Ended (unaudited) |
Year Ended 12/31/20 |
Period from to 12/31/19 |
Year Ended August 31, | |||||||||||||||||||||||||||||||
| 2019 | 2018 | 2017 | 2016 | |||||||||||||||||||||||||||||||
| Net asset value, beginning of period |
$ | 11.95 | $ | 11.91 | $ | 11.82 | $ | 11.90 | $ | 12.22 | $ | 11.79 | $ | 12.06 | ||||||||||||||||||||
|
|
|
|
|
|
|
|
|
|
|
|
|
|
|
|||||||||||||||||||||
| Net investment income(b) |
0.39 | 0.79 | 0.25 | 0.79 | 0.83 | 0.85 | 0.82 | |||||||||||||||||||||||||||
| Net realized and unrealized gain (loss) |
0.34 | 0.18 | 0.22 | (0.01 | ) | (0.31 | ) | 0.47 | (0.10 | ) | ||||||||||||||||||||||||
|
|
|
|
|
|
|
|
|
|
|
|
|
|
|
|||||||||||||||||||||
| Net increase from investment operations |
0.73 | 0.97 | 0.47 | 0.78 | 0.52 | 1.32 | 0.72 | |||||||||||||||||||||||||||
|
|
|
|
|
|
|
|
|
|
|
|
|
|
|
|||||||||||||||||||||
| Distributions(c) |
||||||||||||||||||||||||||||||||||
| From net investment income |
(0.39 | )(d) | (0.82 | ) | (0.35 | ) | (0.86 | ) | (0.84 | ) | (0.89 | ) | (0.99 | ) | ||||||||||||||||||||
| Return of capital |
— | (0.11 | ) | (0.03 | ) | — | — | — | — | |||||||||||||||||||||||||
|
|
|
|
|
|
|
|
|
|
|
|
|
|
|
|||||||||||||||||||||
| Total distributions |
(0.39 | ) | (0.93 | ) | (0.38 | ) | (0.86 | ) | (0.84 | ) | (0.89 | ) | (0.99 | ) | ||||||||||||||||||||
|
|
|
|
|
|
|
|
|
|
|
|
|
|
|
|||||||||||||||||||||
| Net asset value, end of period |
$ | 12.29 | $ | 11.95 | $ | 11.91 | $ | 11.82 | $ | 11.90 | $ | 12.22 | $ | 11.79 | ||||||||||||||||||||
|
|
|
|
|
|
|
|
|
|
|
|
|
|
|
|||||||||||||||||||||
| Market price, end of period |
$ | 12.32 | $ | 11.43 | $ | 11.20 | $ | 10.51 | $ | 10.70 | $ | 11.13 | $ | 10.88 | ||||||||||||||||||||
|
|
|
|
|
|
|
|
|
|
|
|
|
|
|
|||||||||||||||||||||
| Total Return(e) |
||||||||||||||||||||||||||||||||||
| Based on net asset value |
6.23 | %(f) | 9.57 | % | 4.28 | %(f) | 8.06 | % | 5.25 | % | 12.41 | %(g) | 7.76 | % | ||||||||||||||||||||
|
|
|
|
|
|
|
|
|
|
|
|
|
|
|
|||||||||||||||||||||
| Based on market price |
11.34 | %(f) | 11.45 | % | 10.28 | %(f) | 6.86 | % | 3.91 | % | 10.94 | % | 20.29 | % | ||||||||||||||||||||
|
|
|
|
|
|
|
|
|
|
|
|
|
|
|
|||||||||||||||||||||
| Ratios to Average Net Assets(h) |
||||||||||||||||||||||||||||||||||
| Total expenses |
1.33 | %(i) | 1.50 | % | 1.92 | %(i)(j) | 2.19 | % | 1.99 | % | 1.54 | % | 1.39 | %(k) | ||||||||||||||||||||
|
|
|
|
|
|
|
|
|
|
|
|
|
|
|
|||||||||||||||||||||
| Total expenses after fees waived and/or reimbursed |
1.33 | %(i) | 1.49 | % | 1.92 | %(i) | 2.19 | % | 1.99 | % | 1.54 | % | 1.39 | % | ||||||||||||||||||||
|
|
|
|
|
|
|
|
|
|
|
|
|
|
|
|||||||||||||||||||||
| Total expenses after fees waived and/or reimbursed and excluding interest expense |
0.93 | %(i) | 0.94 | % | 0.93 | %(i) | 0.92 | % | 0.94 | % | 0.91 | % | 0.93 | % | ||||||||||||||||||||
|
|
|
|
|
|
|
|
|
|
|
|
|
|
|
|||||||||||||||||||||
| Net investment income |
6.45 | %(i) | 7.06 | % | 6.39 | %(i) | 6.87 | % | 6.88 | % | 7.04 | % | 7.30 | % | ||||||||||||||||||||
|
|
|
|
|
|
|
|
|
|
|
|
|
|
|
|||||||||||||||||||||
| Supplemental Data |
||||||||||||||||||||||||||||||||||
| Net assets, end of period (000) |
$ | 1,498,597 | $ | 1,456,907 | $ | 1,451,868 | $ | 1,440,436 | $ | 1,482,422 | $ | 1,545,622 | $ | 1,492,948 | ||||||||||||||||||||
|
|
|
|
|
|
|
|
|
|
|
|
|
|
|
|||||||||||||||||||||
| Borrowings outstanding, end of period (000) |
$ | 657,000 | $ | 685,000 | $ | 607,000 | $ | 486,000 | $ | 647,000 | $ | 649,000 | $ | 604,000 | ||||||||||||||||||||
|
|
|
|
|
|
|
|
|
|
|
|
|
|
|
|||||||||||||||||||||
| Asset coverage, end of period per $1,000 of bank borrowings |
$ | 3,281 | $ | 3,127 | $ | 3,392 | $ | 3,965 | $ | 3,292 | $ | 3,382 | $ | 3,472 | ||||||||||||||||||||
|
|
|
|
|
|
|
|
|
|
|
|
|
|
|
|||||||||||||||||||||
| Portfolio turnover rate |
33 | % | 82 | % | 20 | % | 64 | % | 65 | % | 75 | % | 66 | % | ||||||||||||||||||||
|
|
|
|
|
|
|
|
|
|
|
|
|
|
|
|||||||||||||||||||||
| (a) Consolidated Financial Highlights. (b) Based on average shares outstanding. (c) Distributions for annual periods determined in accordance with U.S. federal income tax regulations. (d) A portion of the distributions from net investment income may be deemed a return of capital or net realized gain at fiscal year-end. (e) Total returns based on market price, which can be significantly greater or less than the net asset value, may result in substantially different returns. Where applicable, excludes the effects of any sales charges and assumes the reinvestment of distributions at actual reinvestment prices. (f) Aggregate total return. (g) Includes proceeds received from a settlement of litigation, which had no impact on the Trust’s total return. (h) Excludes expenses incurred indirectly as a result of investments in underlying funds as follows:
|
| |||||||||||||||||||||||||||||||||
|
Six Months Ended (unaudited) |
Year Ended 12/31/20 |
Period from 09/01/19 to 12/31/19 |
Year Ended August 31, | |||||||||||||||||||||||||||||||
| 2019 | 2018 | 2017 | 2016 | |||||||||||||||||||||||||||||||
|
|
Investments in underlying funds |
— | % | 0.01 | % | 0.01 | % | — | % | 0.01 | % | 0.04 | % | 0.11 | % | |||||||||||||||||||
|
|
|
|
|
|
|
|
|
|
|
|
|
|
|
|||||||||||||||||||||
| (i) | Annualized. |
| (j) | Audit costs were not annualized in the calculation of the expense ratios. If these expenses were annualized, the total expenses and total expenses after fees waived and/or reimbursed would have been 1.95%. |
| (k) | Includes reorganization costs. Without these costs, total expenses, total expenses after fees waived and paid indirectly, and total expenses after fees waived and paid indirectly and excluding interest expense would have been 1.34%, 1.34% and 0.97%, respectively. |
See notes to consolidated financial statements.
| F I N A N C I A L H I G H L I G H T S |
133 |
Financial Highlights (continued)
(For a share outstanding throughout each period)
| BTZ | ||||||||||||||||||||||||||||||||
|
Six Months Ended (unaudited) |
Year Ended 12/31/20 |
Period from to 12/31/19 |
Year Ended October 31, | |||||||||||||||||||||||||||||
| 2019 | 2018 | 2017 | 2016 | |||||||||||||||||||||||||||||
| Net asset value, beginning of period |
$ | 15.71 | $ | 14.97 | $ | 14.94 | $ | 13.72 | $ | 14.88 | $ | 14.61 | $ | 14.33 | ||||||||||||||||||
|
|
|
|
|
|
|
|
|
|
|
|
|
|
|
|||||||||||||||||||
| Net investment income(a) |
0.42 | 0.84 | 0.13 | 0.79 | 0.81 | 0.81 | 0.88 | |||||||||||||||||||||||||
| Net realized and unrealized gain (loss) |
(0.04 | ) | 0.91 | 0.15 | 1.25 | (1.17 | ) | 0.30 | 0.32 | |||||||||||||||||||||||
|
|
|
|
|
|
|
|
|
|
|
|
|
|
|
|||||||||||||||||||
| Net increase (decrease) from investment operations |
0.38 | 1.75 | 0.28 | 2.04 | (0.36 | ) | 1.11 | 1.20 | ||||||||||||||||||||||||
|
|
|
|
|
|
|
|
|
|
|
|
|
|
|
|||||||||||||||||||
| Distributions(b) |
||||||||||||||||||||||||||||||||
| From net investment income |
(0.42 | )(c) | (0.85 | ) | (0.23 | ) | (0.79 | ) | (0.80 | ) | (0.79 | ) | (0.86 | ) | ||||||||||||||||||
| Return of capital |
— | (0.16 | ) | (0.02 | ) | (0.03 | ) | — | (0.05 | ) | (0.06 | ) | ||||||||||||||||||||
|
|
|
|
|
|
|
|
|
|
|
|
|
|
|
|||||||||||||||||||
| Total distributions |
(0.42 | ) | (1.01 | ) | (0.25 | ) | (0.82 | ) | (0.80 | ) | (0.84 | ) | (0.92 | ) | ||||||||||||||||||
|
|
|
|
|
|
|
|
|
|
|
|
|
|
|
|||||||||||||||||||
| Net asset value, end of period |
$ | 15.67 | $ | 15.71 | $ | 14.97 | $ | 14.94 | $ | 13.72 | $ | 14.88 | $ | 14.61 | ||||||||||||||||||
|
|
|
|
|
|
|
|
|
|
|
|
|
|
|
|||||||||||||||||||
| Market price, end of period |
$ | 15.59 | $ | 14.71 | $ | 13.98 | $ | 13.55 | $ | 11.72 | $ | 13.36 | $ | 12.87 | ||||||||||||||||||
|
|
|
|
|
|
|
|
|
|
|
|
|
|
|
|||||||||||||||||||
| Total Return(d) |
||||||||||||||||||||||||||||||||
| Based on net asset value |
2.56 | %(e) | 12.78 | % | 2.02 | %(e) | 16.17 | % | (1.72 | )% | 8.53 | % | 9.61 | % | ||||||||||||||||||
|
|
|
|
|
|
|
|
|
|
|
|
|
|
|
|||||||||||||||||||
| Based on market price |
8.98 | %(e) | 13.07 | % | 5.05 | %(e) | 23.34 | % | (6.49 | )% | 10.62 | % | 10.43 | % | ||||||||||||||||||
|
|
|
|
|
|
|
|
|
|
|
|
|
|
|
|||||||||||||||||||
| Ratios to Average Net Assets |
||||||||||||||||||||||||||||||||
| Total expenses |
1.17 | %(f) | 1.35 | % | 1.68 | %(f)(g) | 2.26 | % | 1.82 | % | 1.23 | % | 1.20 | % | ||||||||||||||||||
|
|
|
|
|
|
|
|
|
|
|
|
|
|
|
|||||||||||||||||||
| Total expenses after fees waived and/or reimbursed |
1.17 | %(f) | 1.35 | % | 1.68 | %(f)(g) | 2.25 | % | 1.82 | % | 1.23 | % | 1.20 | % | ||||||||||||||||||
|
|
|
|
|
|
|
|
|
|
|
|
|
|
|
|||||||||||||||||||
| Total expenses after fees waived and/or reimbursed and excluding interest expense |
0.95 | %(f) | 0.94 | % | 0.92 | %(f) | 1.08 | % | 0.94 | % | 0.87 | % | 0.95 | % | ||||||||||||||||||
|
|
|
|
|
|
|
|
|
|
|
|
|
|
|
|||||||||||||||||||
| Net investment income |
5.55 | %(f) | 5.69 | % | 5.29 | %(f) | 5.57 | % | 5.69 | % | 5.53 | % | 6.21 | % | ||||||||||||||||||
|
|
|
|
|
|
|
|
|
|
|
|
|
|
|
|||||||||||||||||||
| Supplemental Data |
||||||||||||||||||||||||||||||||
| Net assets, end of period (000) |
$ | 1,465,089 | $ | 1,468,153 | $ | 1,554,828 | $ | 1,551,243 | $ | 1,439,954 | $ | 1,598,034 | $ | 1,579,170 | ||||||||||||||||||
|
|
|
|
|
|
|
|
|
|
|
|
|
|
|
|||||||||||||||||||
| Borrowings outstanding, end of period (000) |
$ | 588,759 | $ | 614,172 | $ | 577,231 | $ | 568,461 | $ | 707,102 | $ | 477,822 | $ | 638,327 | ||||||||||||||||||
|
|
|
|
|
|
|
|
|
|
|
|
|
|
|
|||||||||||||||||||
| Portfolio turnover rate |
10 | % | 34 | % | 2 | % | 18 | % | 30 | % | 25 | % | 29 | % | ||||||||||||||||||
|
|
|
|
|
|
|
|
|
|
|
|
|
|
|
|||||||||||||||||||
| (a) | Based on average shares outstanding. |
| (b) | Distributions for annual periods determined in accordance with U.S. federal income tax regulations. |
| (c) | A portion of the distributions from net investment income may be deemed a return of capital or net realized gain at fiscal year-end. |
| (d) | Total returns based on market price, which can be significantly greater or less than the net asset value, may result in substantially different returns. Where applicable, excludes the effects of any sales charges and assumes the reinvestment of distributions at actual reinvestment prices. |
| (e) | Aggregate total return. |
| (f) | Annualized. |
| (g) | Audit costs were not annualized in the calculation of the expense ratio. If these expenses were annualized, the total expenses would have been 1.70%. |
See notes to financial statements.
| 134 | 2 0 2 1 B L A C K R O C K S E M I - A N N U A L R E P O R T T O S H A R E H O L D E R S |
Financial Highlights (continued)
(For a share outstanding throughout each period)
| BGT | ||||||||||||||||||||||||||||||||||
|
Six Months Ended (unaudited) |
Year Ended 12/31/20 |
Period from to 12/31/19 |
Year Ended October 31, | |||||||||||||||||||||||||||||||
| 2019 | 2018 | 2017 | 2016 | |||||||||||||||||||||||||||||||
| Net asset value, beginning of period |
$ | 13.40 | $ | 14.10 | $ | 13.95 | $ | 14.33 | $ | 14.49 | $ | 14.41 | $ | 14.18 | ||||||||||||||||||||
|
|
|
|
|
|
|
|
|
|
|
|
|
|
|
|||||||||||||||||||||
| Net investment income(a) |
0.32 | 0.66 | 0.12 | 0.80 | 0.76 | 0.73 | 0.74 | |||||||||||||||||||||||||||
| Net realized and unrealized gain (loss) |
0.20 | (0.47 | ) | 0.26 | (0.37 | ) | (0.21 | ) | 0.12 | 0.19 | ||||||||||||||||||||||||
|
|
|
|
|
|
|
|
|
|
|
|
|
|
|
|||||||||||||||||||||
| Net increase from investment operations |
0.52 | 0.19 | 0.38 | 0.43 | 0.55 | 0.85 | 0.93 | |||||||||||||||||||||||||||
|
|
|
|
|
|
|
|
|
|
|
|
|
|
|
|||||||||||||||||||||
| Distributions(b) |
||||||||||||||||||||||||||||||||||
| From net investment income |
(0.32 | )(c) | (0.69 | ) | (0.23 | ) | (0.81 | ) | (0.71 | ) | (0.77 | ) | (0.70 | ) | ||||||||||||||||||||
| Return of capital |
— | (0.20 | ) | — | — | — | — | — | ||||||||||||||||||||||||||
|
|
|
|
|
|
|
|
|
|
|
|
|
|
|
|||||||||||||||||||||
| Total distributions |
(0.32 | ) | (0.89 | ) | (0.23 | ) | (0.81 | ) | (0.71 | ) | (0.77 | ) | (0.70 | ) | ||||||||||||||||||||
|
|
|
|
|
|
|
|
|
|
|
|
|
|
|
|||||||||||||||||||||
| Net asset value, end of period |
$ | 13.60 | $ | 13.40 | $ | 14.10 | $ | 13.95 | $ | 14.33 | $ | 14.49 | $ | 14.41 | ||||||||||||||||||||
|
|
|
|
|
|
|
|
|
|
|
|
|
|
|
|||||||||||||||||||||
| Market price, end of period |
$ | 12.86 | $ | 11.79 | $ | 12.87 | $ | 12.42 | $ | 12.72 | $ | 14.31 | $ | 13.58 | ||||||||||||||||||||
|
|
|
|
|
|
|
|
|
|
|
|
|
|
|
|||||||||||||||||||||
| Total Return(d) |
||||||||||||||||||||||||||||||||||
| Based on net asset value |
4.11 | %(e) | 2.83 | % | 2.89 | %(e) | 4.00 | % | 4.25 | % | 6.13 | % | 7.27 | % | ||||||||||||||||||||
|
|
|
|
|
|
|
|
|
|
|
|
|
|
|
|||||||||||||||||||||
| Based on market price |
11.89 | %(e) | (0.88 | )% | 5.48 | %(e) | 4.31 | % | (6.30 | )% | 11.21 | % | 12.25 | % | ||||||||||||||||||||
|
|
|
|
|
|
|
|
|
|
|
|
|
|
|
|||||||||||||||||||||
| Ratios to Average Net Assets(f) |
||||||||||||||||||||||||||||||||||
| Total expenses |
1.62 | %(g) | 1.72 | % | 2.11 | %(g) | 2.41 | % | 2.29 | % | 1.92 | % | 1.58 | % | ||||||||||||||||||||
|
|
|
|
|
|
|
|
|
|
|
|
|
|
|
|||||||||||||||||||||
| Total expenses after fees waived and/or reimbursed |
1.60 | %(g) | 1.70 | % | 2.11 | %(g) | 2.41 | % | 2.29 | % | 1.92 | % | 1.58 | % | ||||||||||||||||||||
|
|
|
|
|
|
|
|
|
|
|
|
|
|
|
|||||||||||||||||||||
| Total expenses after fees waived and/or reimbursed and excluding interest expense |
1.19 | %(g) | 1.17 | % | 1.28 | %(g) | 1.16 | % | 1.21 | % | 1.20 | % | 1.16 | % | ||||||||||||||||||||
|
|
|
|
|
|
|
|
|
|
|
|
|
|
|
|||||||||||||||||||||
| Net investment income |
4.75 | %(g) | 5.13 | % | 5.23 | %(g) | 5.68 | % | 5.27 | % | 5.02 | % | 5.29 | % | ||||||||||||||||||||
|
|
|
|
|
|
|
|
|
|
|
|
|
|
|
|||||||||||||||||||||
| Supplemental Data |
||||||||||||||||||||||||||||||||||
| Net assets, end of period (000) |
$ | 304,101 | $ | 300,126 | $ | 323,708 | $ | 321,091 | $ | 339,096 | $ | 342,890 | $ | 340,944 | ||||||||||||||||||||
|
|
|
|
|
|
|
|
|
|
|
|
|
|
|
|||||||||||||||||||||
| Borrowings outstanding, end of period (000) |
$ | 131,000 | $ | 129,000 | $ | 130,000 | $ | 123,000 | $ | 142,000 | $ | 150,000 | $ | 148,000 | ||||||||||||||||||||
|
|
|
|
|
|
|
|
|
|
|
|
|
|
|
|||||||||||||||||||||
| Asset coverage, end of period per $1,000 of bank borrowings |
$ | 3,321 | $ | 3,327 | $ | 3,490 | $ | 3,610 | $ | 3,389 | $ | 3,287 | $ | 3,304 | ||||||||||||||||||||
|
|
|
|
|
|
|
|
|
|
|
|
|
|
|
|||||||||||||||||||||
| Portfolio turnover rate |
30 | % | 65 | % | 6 | % | 53 | % | 57 | % | 63 | % | 47 | % | ||||||||||||||||||||
|
|
|
|
|
|
|
|
|
|
|
|
|
|
|
|||||||||||||||||||||
| (a) Based on average shares outstanding. (b) Distributions for annual periods determined in accordance with U.S. federal income tax regulations. (c) A portion of the distributions from net investment income may be deemed a return of capital or net realized gain at fiscal year-end. (d) Total returns based on market price, which can be significantly greater or less than the net asset value, may result in substantially different returns. Where applicable, excludes the effects of any sales charges and assumes the reinvestment of distributions at actual reinvestment prices. (e) Aggregate total return. (f) Excludes expenses incurred indirectly as a result of investments in underlying funds as follows:
|
| |||||||||||||||||||||||||||||||||
|
Six Months Ended (unaudited) |
Year Ended 12/31/20 |
Period from to 12/31/19 |
Year Ended October 31, | |||||||||||||||||||||||||||||||
| 2019 | 2018 | 2017 | 2016 | |||||||||||||||||||||||||||||||
| Investments in underlying funds |
0.01 | % | 0.02 | % | 0.04 | % | 0.04 | % | 0.01 | % | — | % | — | % | ||||||||||||||||||||
|
|
|
|
|
|
|
|
|
|
|
|
|
|
|
|||||||||||||||||||||
| (g) | Annualized. |
See notes to financial statements.
| F I N A N C I A L H I G H L I G H T S |
135 |
Notes to Financial Statements (unaudited)
| 1. | ORGANIZATION |
The following are registered under the Investment Company Act of 1940, as amended (the “1940 Act”), as closed-end management investment companies and are referred to herein collectively as the “Trusts”, or individually as a “Trust”:
|
|
||||||||||||
| Trust Name | Herein Referred To As | Organized | Diversification Classification |
|||||||||
|
|
||||||||||||
| BlackRock Core Bond Trust |
BHK | Delaware | Diversified | |||||||||
| BlackRock Corporate High Yield Fund, Inc. |
HYT | Maryland | Diversified | |||||||||
| BlackRock Credit Allocation Income Trust |
BTZ | Delaware | Diversified | |||||||||
| BlackRock Floating Rate Income Trust |
BGT | Delaware | Diversified | |||||||||
|
|
||||||||||||
The Boards of Directors and Boards of Trustees of the Trusts are collectively referred to throughout this report as the “Board,” and the trustees thereof are collectively referred to throughout this report as “Trustees”. The Trusts determine and make available for publication the net asset values (“NAVs”) of their Common Shares on a daily basis.
The Trusts, together with certain other registered investment companies advised by BlackRock Advisors, LLC (the “Manager”) or its affiliates, are included in a complex of non-index fixed-income mutual funds and all BlackRock-advised closed-end funds referred to as the BlackRock Fixed-Income Complex.
Basis of Consolidation: The accompanying consolidated financial statements of HYT include the accounts of BLK HYT (Luxembourg) Investments, S.a.r.l., BLK HYV (Luxembourg) Investments, S.a.r.l., BLK COY (Luxembourg) Investments, S.a.r.l., BLK CYE (Luxembourg) Investments, S.a.r.l. (the “Luxembourg Subsidiaries”) and HYT Subsidiary LLC (Delaware) (the “U.S. Subsidiary”), which are wholly-owned taxable subsidiaries of HYT (collectively, the “Taxable Subsidiaries”). The U.S. Subsidiary enables the Trust to hold investments in operating companies and still satisfy regulated investment company tax requirements. Income earned and gains realized on the investments held by the U.S. Subsidiary are taxable to such subsidiary. The Luxembourg Subsidiaries hold shares of private Canadian companies. Such shares are held in the Taxable Subsidiaries in order to realize benefits under the Double Tax Avoidance Convention between Canada and Luxembourg, the result of which that gains on the sale of such shares will generally not be subject to capital gains taxes in Canada. Income earned on the investments held by the Luxembourg Subsidiaries may be taxable to such subsidiary in Luxembourg. A tax provision for income, if any, is shown as income tax in the Consolidated Statement of Operations for HYT. A tax provision for realized and unrealized gains, if any, is included as a reduction of realized and/or unrealized gain (loss) in the Consolidated Statement of Operations for HYT. HYT may invest up to 25% of its total assets in the U.S. Subsidiary. Intercompany accounts and transactions have been eliminated. The Taxable Subsidiaries are subject to the same investment policies and restrictions that apply to the Trust.
| 2. | SIGNIFICANT ACCOUNTING POLICIES |
The financial statements are prepared in conformity with accounting principles generally accepted in the United States of America (“U.S. GAAP”), which may require management to make estimates and assumptions that affect the reported amounts of assets and liabilities in the financial statements, disclosure of contingent assets and liabilities at the date of the financial statements and the reported amounts of increases and decreases in net assets from operations during the reporting period. Actual results could differ from those estimates. Each Trust is considered an investment company under U.S. GAAP and follows the accounting and reporting guidance applicable to investment companies. Below is a summary of significant accounting policies:
Investment Transactions and Income Recognition: For financial reporting purposes, investment transactions are recorded on the dates the transactions are executed. Realized gains and losses on investment transactions are determined using the specific identification method. Dividend income and capital gain distributions, if any, are recorded on the ex-dividend dates. Non-cash dividends, if any, are recorded on the ex-dividend dates at fair value. Dividends from foreign securities where the ex-dividend dates may have passed are subsequently recorded when the Trusts are informed of the ex-dividend dates. Under the applicable foreign tax laws, a withholding tax at various rates may be imposed on capital gains, dividends and interest. Upon notification from issuers, a portion of the dividend income received from a real estate investment trust may be redesignated as a reduction of cost of the related investment and/or realized gain. Interest income, including amortization and accretion of premiums and discounts on debt securities, is recognized daily on an accrual basis. For convertible securities, premiums attributable to the debt instrument are amortized, but premiums attributable to the conversion feature are not amortized.
Foreign Currency Translation: Each Trust’s books and records are maintained in U.S. dollars. Securities and other assets and liabilities denominated in foreign currencies are translated into U.S. dollars using exchange rates determined as of the close of trading on the New York Stock Exchange (“NYSE”). Purchases and sales of investments are recorded at the rates of exchange prevailing on the respective dates of such transactions. Generally, when the U.S. dollar rises in value against a foreign currency, the investments denominated in that currency will lose value; the opposite effect occurs if the U.S. dollar falls in relative value.
Each Trust does not isolate the portion of the results of operations arising as a result of changes in the exchange rates from the changes in the market prices of investments held or sold for financial reporting purposes. Accordingly, the effects of changes in exchange rates on investments are not segregated in the Statements of Operations from the effects of changes in market prices of those investments, but are included as a component of net realized and unrealized gain (loss) from investments. Realized currency gains (losses) on foreign currency related transactions are reported as components of net realized gain (loss) for financial reporting purposes, whereas such components are generally treated as ordinary income for U.S. federal income tax purposes. Each Trust has elected to treat realized gains (losses) from certain forward foreign currency exchange contracts as capital gain (loss) for U.S. federal income tax purposes.
Foreign Taxes: The Trusts may be subject to foreign taxes (a portion of which may be reclaimable) on income, stock dividends, capital gains on investments, or certain foreign currency transactions. All foreign taxes are recorded in accordance with the applicable foreign tax regulations and rates that exist in the foreign jurisdictions in which each Trust invests. These foreign taxes, if any, are paid by each Trust and are reflected in its Statements of Operations as follows: foreign taxes withheld at source are presented as a reduction of income, foreign taxes on securities lending income are presented as a reduction of securities lending income, foreign taxes on stock dividends are presented as
| 136 | 2 0 2 1 B L A C K R O C K S E M I - A N N U A L R E P O R T T O S H A R E H O L D E R S |
Notes to Financial Statements (unaudited) (continued)
“Foreign taxes withheld”, and foreign taxes on capital gains from sales of investments and foreign taxes on foreign currency transactions are included in their respective net realized gain (loss) categories. Foreign taxes payable or deferred as of June 30, 2021, if any, are disclosed in the Statements of Assets and Liabilities.
The Trusts file withholding tax reclaims in certain jurisdictions to recover a portion of amounts previously withheld. The Trusts may record a reclaim receivable based on collectability, which includes factors such as the jurisdiction’s applicable laws, payment history and market convention. The Statements of Operations include tax reclaims recorded as well as professional and other fees, if any, associated with recovery of foreign withholding taxes.
Segregation and Collateralization: In cases where a Trust enters into certain investments (e.g., futures contracts, forward foreign currency exchange contracts, options written and swaps) or certain borrowings (e.g., reverse repurchase transactions) that would be treated as “senior securities” for 1940 Act purposes, a Trust may segregate or designate on its books and records cash or liquid assets having a market value at least equal to the amount of its future obligations under such investments or borrowings. Doing so allows the investment or borrowings to be excluded from treatment as a “senior security.” Furthermore, if required by an exchange or counterparty agreement, the Trusts may be required to deliver/deposit cash and/or securities to/with an exchange, or broker-dealer or custodian as collateral for certain investments or obligations.
Distributions: Distributions paid by the Trusts are recorded on the ex-dividend dates. Subject to the Trusts’ managed distribution plan, the Trusts intend to make monthly cash distributions to shareholders, which may consist of net investment income, and net realized and unrealized gains on investments and/or return of capital.
The character of distributions is determined in accordance with U.S. federal income tax regulations, which may differ from U.S. GAAP. The portion of distributions that exceeds a Trust’s current and accumulated earnings and profits, which are measured on a tax basis, will constitute a non-taxable return of capital.
Deferred Compensation Plan: Under the Deferred Compensation Plan (the “Plan”) approved by each Trust’s Board, the trustees who are not “interested persons” of the Trusts, as defined in the 1940 Act (“Independent Trustees”), may defer a portion of their annual complex-wide compensation. Deferred amounts earn an approximate return as though equivalent dollar amounts had been invested in common shares of certain funds in the BlackRock Fixed-Income Complex selected by the Independent Trustees. This has the same economic effect for the Independent Trustees as if the Independent Trustees had invested the deferred amounts directly in certain funds in the BlackRock Fixed-Income Complex.
The Plan is not funded and obligations thereunder represent general unsecured claims against the general assets of each Trust, as applicable. Deferred compensation liabilities, if any, are included in the Trustees’ and Officer’s fees payable in the Statements of Assets and Liabilities and will remain as a liability of the Trusts until such amounts are distributed in accordance with the Plan.
Indemnifications: In the normal course of business, a Trust enters into contracts that contain a variety of representations that provide general indemnification. A Trust’s maximum exposure under these arrangements is unknown because it involves future potential claims against a Trust, which cannot be predicted with any certainty.
Other: Expenses directly related to a Trust are charged to that Trust. Other operating expenses shared by several funds, including other funds managed by the Manager, are prorated among those funds on the basis of relative net assets or other appropriate methods.
| 3. | INVESTMENT VALUATION AND FAIR VALUE MEASUREMENTS |
Investment Valuation Policies: Each Trust’s investments are valued at fair value (also referred to as “market value” within the financial statements) each day that the Trust is open for business and, for financial reporting purposes, as of the report date. U.S. GAAP defines fair value as the price a fund would receive to sell an asset or pay to transfer a liability in an orderly transaction between market participants at the measurement date. Each Trust determines the fair values of its financial instruments using various independent dealers or pricing services under policies approved by the Board. If a security’s market price is not readily available or does not otherwise accurately represent the fair value of the security, the security will be valued in accordance with a policy approved by the Board as reflecting fair value. The BlackRock Global Valuation Methodologies Committee (the “Global Valuation Committee”) is the committee formed by management to develop global pricing policies and procedures and to oversee the pricing function for all financial instruments.
Fair Value Inputs and Methodologies: The following methods and inputs are used to establish the fair value of each Trust’s assets and liabilities:
| • | Equity investments traded on a recognized securities exchange are valued at that day’s official closing price, as applicable, on the exchange where the stock is primarily traded. Equity investments traded on a recognized exchange for which there were no sales on that day may be valued at the last available bid (long positions) or ask (short positions) price. |
Generally, trading in foreign instruments is substantially completed each day at various times prior to the close of trading on the NYSE. Occasionally, events affecting the values of such instruments may occur between the foreign market close and the close of trading on the NYSE that may not be reflected in the computation of the Trusts’ net assets. Each business day, the Trusts use a pricing service to assist with the valuation of certain foreign exchange-traded equity securities and foreign exchange-traded and over-the-counter (“OTC”) options (the “Systematic Fair Value Price”). Using current market factors, the Systematic Fair Value Price is designed to value such foreign securities and foreign options at fair value as of the close of trading on the NYSE, which follows the close of the local markets.
| • | Fixed-income investments for which market quotations are readily available are generally valued using the last available bid price or current market quotations provided by independent dealers or third party pricing services. Floating rate loan interests are valued at the mean of the bid prices from one or more independent brokers or dealers as obtained from a third party pricing service. Pricing services generally value fixed-income securities assuming orderly transactions of an institutional round lot size, but a fund may hold or transact in such securities in smaller, odd lot sizes. Odd lots may trade at lower prices than institutional round lots. The pricing services may use matrix pricing or valuation models that utilize certain inputs and assumptions to derive values, including transaction data (e.g., recent representative bids and offers), market data, credit quality information, perceived market movements, news, and other relevant information. Certain fixed-income securities, including asset-backed and mortgage related securities may be valued based on valuation models that consider the estimated cash flows of each tranche of the entity, establish a |
| N O T E S T O F I N A N C I A L S T A T E M E N T S |
137 |
Notes to Financial Statements (unaudited) (continued)
| benchmark yield and develop an estimated tranche specific spread to the benchmark yield based on the unique attributes of the tranche. The amortized cost method of valuation may be used with respect to debt obligations with sixty days or less remaining to maturity unless the Manager determines such method does not represent fair value. |
| • | Exchange-traded funds (“ETFs”) and closed-end funds traded on a recognized securities exchange are valued at that day’s official closing price, as applicable, on the exchange where the stock is primarily traded. ETFs and closed-end funds traded on a recognized exchange for which there were no sales on that day may be valued at the last available bid (long positions) or ask (short positions) price. |
| • | Investments in open-end U.S. mutual funds (including money market funds) are valued at that day’s published NAV. |
| • | Futures contracts are valued based on that day’s last reported settlement or trade price on the exchange where the contract is traded. |
| • | Forward foreign currency exchange contracts are valued at the mean between the bid and ask prices and are determined as of the close of trading on the NYSE based on that day’s prevailing forward exchange rate for the underlying currencies. |
| • | Exchange-traded options are valued at the mean between the last bid and ask prices at the close of the options market in which the options trade. An exchange-traded option for which there is no mean price is valued at the last bid (long positions) or ask (short positions) price. If no bid or ask price is available, the prior day’s price will be used, unless it is determined that the prior day’s price no longer reflects the fair value of the option. OTC options and options on swaps (“swaptions”) are valued by an independent pricing service using a mathematical model, which incorporates a number of market data factors, such as the trades and prices of the underlying instruments. |
| • | Swap agreements are valued utilizing quotes received daily by independent pricing services or through brokers, which are derived using daily swap curves and models that incorporate a number of market data factors, such as discounted cash flows, trades and values of the underlying reference instruments. |
If events (e.g., a market closure, market volatility, company announcement or a natural disaster) occur that are expected to materially affect the value of such investment, or in the event that application of these methods of valuation results in a price for an investment that is deemed not to be representative of the market value of such investment, or if a price is not available, the investment will be valued by the Global Valuation Committee, or its delegate, in accordance with a policy approved by the Board as reflecting fair value (“Fair Valued Investments”). The fair valuation approaches that may be used by the Global Valuation Committee include market approach, income approach and cost approach. Valuation techniques such as discounted cash flow, use of market comparables and matrix pricing are types of valuation approaches and are typically used in determining fair value. When determining the price for Fair Valued Investments, the Global Valuation Committee, or its delegate, seeks to determine the price that each Trust might reasonably expect to receive or pay from the current sale or purchase of that asset or liability in an arm’s-length transaction. Fair value determinations shall be based upon all available factors that the Global Valuation Committee, or its delegate, deems relevant and consistent with the principles of fair value measurement. The pricing of all Fair Valued Investments is subsequently reported to the Board or a committee thereof on a quarterly basis.
For investments in equity or debt issued by privately held companies or funds (“Private Company” or collectively, the “Private Companies”) and other Fair Valued Investments, the fair valuation approaches that are used by the Global Valuation Committee and third party pricing services utilize one or a combination of, but not limited to, the following inputs.
| Standard Inputs Generally Considered By Third Party Pricing Services | ||
| Market approach |
(i) recent market transactions, including subsequent rounds of financing, in the underlying investment or comparable issuers; | |
| (ii) recapitalizations and other transactions across the capital structure; and | ||
| (iii) market multiples of comparable issuers. | ||
| Income approach |
(i) future cash flows discounted to present and adjusted as appropriate for liquidity, credit, and/or market risks; | |
| (ii) quoted prices for similar investments or assets in active markets; and | ||
| (iii) other risk factors, such as interest rates, yield curves, volatilities, prepayment speeds, loss severities, credit risks, recovery rates, liquidation amounts and/or default rates. | ||
| Cost approach |
(i) audited or unaudited financial statements, investor communications and financial or operational metrics issued by the Private Company; | |
| (ii) changes in the valuation of relevant indices or publicly traded companies comparable to the Private Company; | ||
| (iii) relevant news and other public sources; and | ||
| (iv) known secondary market transactions in the Private Company’s interests and merger or acquisition activity in companies comparable to the Private Company. | ||
Investments in series of preferred stock issued by Private Companies are typically valued utilizing market approach in determining the enterprise value of the company. Such investments often contain rights and preferences that differ from other series of preferred and common stock of the same issuer. Enterprise valuation techniques such as an option pricing model (“OPM”), a probability weighted expected return model (“PWERM”), current value method or a hybrid of those techniques are used, as deemed appropriate under the circumstances. The use of these valuation techniques involve a determination of the exit scenarios of the investment in order to appropriately allocate the enterprise value of the company among the various parts of its capital structure.
The Private Companies are not subject to the public company disclosure, timing, and reporting standards applicable to other investments held by a Trust. Typically, the most recently available information by a Private Company is as of a date that is earlier than the date a Trust is calculating its NAV. This factor may result in a difference between the value of the investment and the price a Trust could receive upon the sale of the investment.
Fair Value Hierarchy: Various inputs are used in determining the fair value of financial instruments. These inputs to valuation techniques are categorized into a fair value hierarchy consisting of three broad levels for financial reporting purposes as follows:
| 138 | 2 0 2 1 B L A C K R O C K S E M I - A N N U A L R E P O R T T O S H A R E H O L D E R S |
Notes to Financial Statements (unaudited) (continued)
| • | Level 1 – Unadjusted price quotations in active markets/exchanges for identical assets or liabilities that each Trust has the ability to access; |
| • | Level 2 – Other observable inputs (including, but not limited to, quoted prices for similar assets or liabilities in markets that are active, quoted prices for identical or similar assets or liabilities in markets that are not active, inputs other than quoted prices that are observable for the assets or liabilities (such as interest rates, yield curves, volatilities, prepayment speeds, loss severities, credit risks and default rates) or other market–corroborated inputs); and |
| • | Level 3 – Unobservable inputs based on the best information available in the circumstances, to the extent observable inputs are not available (including the Global Valuation Committee’s assumptions used in determining the fair value of financial instruments). |
The hierarchy gives the highest priority to unadjusted quoted prices in active markets for identical assets or liabilities (Level 1 measurements) and the lowest priority to unobservable inputs (Level 3 measurements). Accordingly, the degree of judgment exercised in determining fair value is greatest for instruments categorized in Level 3. The inputs used to measure fair value may fall into different levels of the fair value hierarchy. In such cases, for disclosure purposes, the fair value hierarchy classification is determined based on the lowest level input that is significant to the fair value measurement in its entirety. Investments classified within Level 3 have significant unobservable inputs used by the Global Valuation Committee in determining the price for Fair Valued Investments. Level 3 investments include equity or debt issued by Private Companies that may not have a secondary market and/or may have a limited number of investors. The categorization of a value determined for financial instruments is based on the pricing transparency of the financial instruments and is not necessarily an indication of the risks associated with investing in those securities.
As of June 30, 2021, certain investments of HYT were fair valued using NAV per share as no quoted market value is available and therefore have been excluded from the fair value hierarchy.
| 4. | SECURITIES AND OTHER INVESTMENTS |
Asset-Backed and Mortgage-Backed Securities: Asset-backed securities are generally issued as pass-through certificates or as debt instruments. Asset-backed securities issued as pass-through certificates represent undivided fractional ownership interests in an underlying pool of assets. Asset-backed securities issued as debt instruments, which are also known as collateralized obligations, are typically issued as the debt of a special purpose entity organized solely for the purpose of owning such assets and issuing such debt. Asset-backed securities are often backed by a pool of assets representing the obligations of a number of different parties. The yield characteristics of certain asset-backed securities may differ from traditional debt securities. One such major difference is that all or a principal part of the obligations may be prepaid at any time because the underlying assets (i.e., loans) may be prepaid at any time. As a result, a decrease in interest rates in the market may result in increases in the level of prepayments as borrowers, particularly mortgagors, refinance and repay their loans. An increased prepayment rate with respect to an asset-backed security will have the effect of shortening the maturity of the security. In addition, a fund may subsequently have to reinvest the proceeds at lower interest rates. If a fund has purchased such an asset-backed security at a premium, a faster than anticipated prepayment rate could result in a loss of principal to the extent of the premium paid.
For mortgage pass-through securities (the “Mortgage Assets”) there are a number of important differences among the agencies and instrumentalities of the U.S. Government that issue mortgage-related securities and among the securities that they issue. For example, mortgage-related securities guaranteed by Ginnie Mae are guaranteed as to the timely payment of principal and interest by Ginnie Mae and such guarantee is backed by the full faith and credit of the United States. However, mortgage-related securities issued by Freddie Mac and Fannie Mae, including Freddie Mac and Fannie Mae guaranteed mortgage pass-through certificates, which are solely the obligations of Freddie Mac and Fannie Mae, are not backed by or entitled to the full faith and credit of the United States, but are supported by the right of the issuer to borrow from the U.S. Treasury.
Non-agency mortgage-backed securities are securities issued by non-governmental issuers and have no direct or indirect government guarantees of payment and are subject to various risks. Non-agency mortgage loans are obligations of the borrowers thereunder only and are not typically insured or guaranteed by any other person or entity. The ability of a borrower to repay a loan is dependent upon the income or assets of the borrower. A number of factors, including a general economic downturn, acts of God, terrorism, social unrest and civil disturbances, may impair a borrower’s ability to repay its loans.
Collateralized Debt Obligations: Collateralized debt obligations (“CDOs”), including collateralized bond obligations (“CBOs”) and collateralized loan obligations (“CLOs”), are types of asset-backed securities. A CDO is an entity that is backed by a diversified pool of debt securities (CBOs) or syndicated bank loans (CLOs). The cash flows of the CDO can be split into multiple segments, called “tranches,” which will vary in risk profile and yield. The riskiest segment is the subordinated or “equity” tranche. This tranche bears the greatest risk of defaults from the underlying assets in the CDO and serves to protect the other, more senior, tranches from default in all but the most severe circumstances. Since it is shielded from defaults by the more junior tranches, a “senior” tranche will typically have higher credit ratings and lower yields than their underlying securities, and often receive investment grade ratings from one or more of the nationally recognized rating agencies. Despite the protection from the more junior tranches, senior tranches can experience substantial losses due to actual defaults, increased sensitivity to future defaults and the disappearance of one or more protecting tranches as a result of changes in the credit profile of the underlying pool of assets.
Multiple Class Pass-Through Securities: Multiple class pass-through securities, including collateralized mortgage obligations (“CMOs”) and commercial mortgage-backed securities, may be issued by Ginnie Mae, U.S. Government agencies or instrumentalities or by trusts formed by private originators of, or investors in, mortgage loans. In general, CMOs are debt obligations of a legal entity that are collateralized by a pool of residential or commercial mortgage loans or Mortgage Assets. The payments on these are used to make payments on the CMOs or multiple pass-through securities. Multiple class pass-through securities represent direct ownership interests in the Mortgage Assets. Classes of CMOs include interest only (“IOs”), principal only (“POs”), planned amortization classes and targeted amortization classes. IOs and POs are stripped mortgage-backed securities representing interests in a pool of mortgages, the cash flow from which has been separated into interest and principal components. IOs receive the interest portion of the cash flow while POs receive the principal portion. IOs and POs can be extremely volatile in response to changes in interest rates. As interest rates rise and fall, the value of IOs tends to move in the same direction as interest rates. POs perform best when prepayments on the underlying mortgages rise since this increases the rate at which the principal is returned and the yield to maturity on the PO. When payments on mortgages underlying a PO are slower than anticipated, the life of the PO is lengthened and the yield to maturity is reduced. If the underlying Mortgage Assets experience greater than anticipated prepayments of principal, a fund’s initial investment in the IOs may not fully recoup.
| N O T E S T O F I N A N C I A L S T A T E M E N T S |
139 |
Notes to Financial Statements (unaudited) (continued)
Stripped Mortgage-Backed Securities: Stripped mortgage-backed securities are typically issued by the U.S. Government, its agencies and instrumentalities. Stripped mortgage-backed securities are usually structured with two classes that receive different proportions of the interest (IOs) and principal (POs) distributions on a pool of Mortgage Assets. Stripped mortgage-backed securities may be privately issued.
Zero-Coupon Bonds: Zero-coupon bonds are normally issued at a significant discount from face value and do not provide for periodic interest payments. These bonds may experience greater volatility in market value than other debt obligations of similar maturity which provide for regular interest payments.
Capital Securities and Trust Preferred Securities: Capital securities, including trust preferred securities, are typically issued by corporations, generally in the form of interest-bearing notes with preferred securities characteristics. In the case of trust preferred securities, an affiliated business trust of a corporation issues these securities, generally in the form of beneficial interests in subordinated debentures or similarly structured securities. The securities can be structured with either a fixed or adjustable coupon that can have either a perpetual or stated maturity date. For trust preferred securities, the issuing bank or corporation pays interest to the trust, which is then distributed to holders of these securities as a dividend. Dividends can be deferred without creating an event of default or acceleration, although maturity cannot take place unless all cumulative payment obligations have been met. The deferral of payments does not affect the purchase or sale of these securities in the open market. These securities generally are rated below that of the issuing company’s senior debt securities and are freely callable at the issuer’s option.
Preferred Stocks: Preferred stock has a preference over common stock in liquidation (and generally in receiving dividends as well), but is subordinated to the liabilities of the issuer in all respects. As a general rule, the market value of preferred stock with a fixed dividend rate and no conversion element varies inversely with interest rates and perceived credit risk, while the market price of convertible preferred stock generally also reflects some element of conversion value. Because preferred stock is junior to debt securities and other obligations of the issuer, deterioration in the credit quality of the issuer will cause greater changes in the value of a preferred stock than in a more senior debt security with similar stated yield characteristics. Unlike interest payments on debt securities, preferred stock dividends are payable only if declared by the issuer’s board of directors. Preferred stock also may be subject to optional or mandatory redemption provisions.
Warrants: Warrants entitle a fund to purchase a specified number of shares of common stock and are non-income producing. The purchase price and number of shares are subject to adjustment under certain conditions until the expiration date of the warrants, if any. If the price of the underlying stock does not rise above the strike price before the warrant expires, the warrant generally expires without any value and a fund will lose any amount it paid for the warrant. Thus, investments in warrants may involve more risk than investments in common stock. Warrants may trade in the same markets as their underlying stock; however, the price of the warrant does not necessarily move with the price of the underlying stock.
Floating Rate Loan Interests: Floating rate loan interests are typically issued to companies (the “borrower”) by banks, other financial institutions, or privately and publicly offered corporations (the “lender”). Floating rate loan interests are generally non-investment grade, often involve borrowers whose financial condition is troubled or uncertain and companies that are highly leveraged or in bankruptcy proceedings. In addition, transactions in floating rate loan interests may settle on a delayed basis, which may result in proceeds from the sale not being readily available for a fund to make additional investments or meet its redemption obligations. Floating rate loan interests may include fully funded term loans or revolving lines of credit. Floating rate loan interests are typically senior in the corporate capital structure of the borrower. Floating rate loan interests generally pay interest at rates that are periodically determined by reference to a base lending rate plus a premium. Since the rates reset only periodically, changes in prevailing interest rates (and particularly sudden and significant changes) can be expected to cause some fluctuations in the NAV of a fund to the extent that it invests in floating rate loan interests. The base lending rates are generally the lending rate offered by one or more European banks, such as the London Interbank Offered Rate (“LIBOR”), the prime rate offered by one or more U.S. banks or the certificate of deposit rate. Floating rate loan interests may involve foreign borrowers, and investments may be denominated in foreign currencies. These investments are treated as investments in debt securities for purposes of a fund’s investment policies.
When a fund purchases a floating rate loan interest, it may receive a facility fee and when it sells a floating rate loan interest, it may pay a facility fee. On an ongoing basis, a fund may receive a commitment fee based on the undrawn portion of the underlying line of credit amount of a floating rate loan interest. Facility and commitment fees are typically amortized to income over the term of the loan or term of the commitment, respectively. Consent and amendment fees are recorded to income as earned. Prepayment penalty fees, which may be received by a fund upon the prepayment of a floating rate loan interest by a borrower, are recorded as realized gains. A fund may invest in multiple series or tranches of a loan. A different series or tranche may have varying terms and carry different associated risks.
Floating rate loan interests are usually freely callable at the borrower’s option. A fund may invest in such loans in the form of participations in loans (“Participations”) or assignments (“Assignments”) of all or a portion of loans from third parties. Participations typically will result in a fund having a contractual relationship only with the lender, not with the borrower. A fund has the right to receive payments of principal, interest and any fees to which it is entitled only from the lender selling the Participation and only upon receipt by the lender of the payments from the borrower. In connection with purchasing Participations, a fund generally will have no right to enforce compliance by the borrower with the terms of the loan agreement, nor any rights of offset against the borrower. A fund may not benefit directly from any collateral supporting the loan in which it has purchased the Participation. As a result, a fund assumes the credit risk of both the borrower and the lender that is selling the Participation. A fund’s investment in loan participation interests involves the risk of insolvency of the financial intermediaries who are parties to the transactions. In the event of the insolvency of the lender selling the Participation, a fund may be treated as a general creditor of the lender and may not benefit from any offset between the lender and the borrower. Assignments typically result in a fund having a direct contractual relationship with the borrower, and a fund may enforce compliance by the borrower with the terms of the loan agreement.
In connection with floating rate loan interests, the Trusts may also enter into unfunded floating rate loan interests (“commitments”). In connection with these commitments, a fund earns a commitment fee, typically set as a percentage of the commitment amount. Such fee income, which is included in interest income in the Statements of Operations, is recognized ratably over the commitment period. Unfunded floating rate loan interests are marked-to-market daily, and any unrealized appreciation (depreciation) is included in the Statements of Assets and Liabilities and Statements of Operations. As of period end, the Trusts had the following unfunded floating rate loan interests:
| Trust Name | Borrower | Par | Commitment Amount |
Value | Unrealized Appreciation (Depreciation) |
|||||||||||||
| BHK |
LBM Acquisition LLC | $ | 1,925 | $ | 1,906 | $ | 1,910 | $ | 4 | |||||||||
| 140 | 2 0 2 1 B L A C K R O C K S E M I - A N N U A L R E P O R T T O S H A R E H O L D E R S |
Notes to Financial Statements (unaudited) (continued)
| Trust Name | Borrower | Par | Commitment Amount |
Value | Unrealized Appreciation (Depreciation) |
|||||||||||||
| HYT |
LBM Acquisition LLC | $ | 15,997 | $ | 15,837 | $ | 15,874 | $ | 37 | |||||||||
| BGT |
LBM Acquisition LLC | 43,637 | 43,201 | 43,301 | 100 | |||||||||||||
| Metronet Systems Holdings LLC | 44,110 | 44,000 | 44,077 | 77 | ||||||||||||||
| Precision Medicine Group LLC | 96,813 | 96,813 | 96,450 | (363 | ) | |||||||||||||
| Therma Intermediate LLC | 83,588 | 83,588 | 83,588 | — | ||||||||||||||
Forward Commitments, When-Issued and Delayed Delivery Securities: The Trusts may purchase securities on a when-issued basis and may purchase or sell securities on a forward commitment basis. Settlement of such transactions normally occurs within a month or more after the purchase or sale commitment is made. A Trust may purchase securities under such conditions with the intention of actually acquiring them, but may enter into a separate agreement to sell the securities before the settlement date. Since the value of securities purchased may fluctuate prior to settlement, a Trust may be required to pay more at settlement than the security is worth. In addition, a Trust is not entitled to any of the interest earned prior to settlement. When purchasing a security on a delayed delivery basis, a Trust assumes the rights and risks of ownership of the security, including the risk of price and yield fluctuations. In the event of default by the counterparty, a Trust’s maximum amount of loss is the unrealized appreciation of unsettled when-issued transactions.
Commitments: Commitments are agreements to acquire an investment at a future date (subject to conditions) in connection with a potential public or non-public offering. Such agreements may obligate HYT to make future cash payments. As of June 30, 2021, HYT had outstanding commitments of $1,084,310. These commitments are not included in the net assets of HYT as of June 30, 2021.
Reverse Repurchase Agreements: Reverse repurchase agreements are agreements with qualified third party broker dealers in which a fund sells securities to a bank or broker-dealer and agrees to repurchase the same securities at a mutually agreed upon date and price. A fund receives cash from the sale to use for other investment purposes. During the term of the reverse repurchase agreement, a fund continues to receive the principal and interest payments on the securities sold. Certain agreements have no stated maturity and can be terminated by either party at any time. Interest on the value of the reverse repurchase agreements issued and outstanding is based upon competitive market rates determined at the time of issuance. A fund may utilize reverse repurchase agreements when it is anticipated that the interest income to be earned from the investment of the proceeds of the transaction is greater than the interest expense of the transaction. Reverse repurchase agreements involve leverage risk. If a fund suffers a loss on its investment of the transaction proceeds from a reverse repurchase agreement, a fund would still be required to pay the full repurchase price. Further, a fund remains subject to the risk that the market value of the securities repurchased declines below the repurchase price. In such cases, a fund would be required to return a portion of the cash received from the transaction or provide additional securities to the counterparty.
Cash received in exchange for securities delivered plus accrued interest due to the counterparty is recorded as a liability in the Statements of Assets and Liabilities at face value including accrued interest. Due to the short-term nature of the reverse repurchase agreements, face value approximates fair value. Interest payments made by a fund to the counterparties are recorded as a component of interest expense in the Statements of Operations. In periods of increased demand for the security, a fund may receive a fee for the use of the security by the counterparty, which may result in interest income to a fund.
For the six months ended June 30, 2021, the average amount of reverse repurchase agreements outstanding and the daily weighted average interest rate for the Trusts were as follows:
| Trust Name | Average Amount Outstanding |
Daily Weighted Average Interest Rate |
||||||
| BHK |
$ | 381,487,631 | 0.08 | % | ||||
| BTZ |
598,214,260 | 0.53 | ||||||
Reverse repurchase transactions are entered into by a fund under Master Repurchase Agreements (each, an “MRA”), which permit a fund, under certain circumstances, including an event of default (such as bankruptcy or insolvency), to offset payables and/or receivables under the MRA with collateral held and/or posted to the counterparty and create one single net payment due to or from a fund. With reverse repurchase transactions, typically a fund and counterparty under an MRA are permitted to sell, re-pledge, or use the collateral associated with the transaction. Bankruptcy or insolvency laws of a particular jurisdiction may impose restrictions on or prohibitions against such a right of offset in the event of the MRA counterparty’s bankruptcy or insolvency. Pursuant to the terms of the MRA, a fund receives or posts securities and cash as collateral with a market value in excess of the repurchase price to be paid or received by a fund upon the maturity of the transaction. Upon a bankruptcy or insolvency of the MRA counterparty, a fund is considered an unsecured creditor with respect to excess collateral and, as such, the return of excess collateral may be delayed.
As of period end, the following table is a summary of BHK and BTZ’s open reverse repurchase agreements by counterparty which are subject to offset under an MRA on a net basis:
| Trust Name/Counterparty | Reverse Repurchase Agreements |
Fair Value of Non-Cash Collateral Pledged Including Accrued Interest(a) |
Cash Collateral Pledged/Received(a) |
Net Amount | ||||||||||||
| BHK |
||||||||||||||||
| Barclays Capital, Inc. |
$ | (143,911 | ) | $ | 143,911 | $ | — | $ | — | |||||||
| BNP Paribas S.A. |
(234,535,043 | ) | 234,535,043 | — | — | |||||||||||
| Credit Agricole Corporate and Investment Bank |
(58,791,968 | ) | 58,791,968 | — | — | |||||||||||
| Credit Suisse Securities (USA) LLC |
(63,562 | ) | 63,562 | — | — | |||||||||||
| Nomura Securities International, Inc. |
(123,615,357 | ) | 123,615,357 | — | — | |||||||||||
| N O T E S T O F I N A N C I A L S T A T E M E N T S |
141 |
Notes to Financial Statements (unaudited) (continued)
| Trust Name/Counterparty | Reverse Repurchase Agreements |
Fair Value of Non-Cash Collateral Pledged Including Accrued Interest(a) |
Cash Collateral Pledged/Received(a) |
Net Amount | ||||||||||||
| Royal Bank of Canada |
$ | (41,192,362 | ) | $ | 41,192,362 | $ | — | $ | — | |||||||
| TD Securities (USA) LLC |
(7,826,392 | ) | 7,826,392 | — | — | |||||||||||
|
|
|
|
|
|
|
|
|
|||||||||
| $ | (466,168,595 | ) | $ | 466,168,595 | $ | — | $ | — | ||||||||
|
|
|
|
|
|
|
|
|
|||||||||
| (a) | Net collateral, including accrued interest, with a value of $470,846,810 has been pledged/received in connection with open reverse repurchase agreements. Excess of net collateral pledged to the individual counterparty is not shown for financial reporting purposes. |
| Trust Name/Counterparty | Reverse Repurchase Agreements |
Fair Value of Non-Cash Collateral Pledged Including Accrued Interest(a) |
Cash Collateral Pledged/Received(a) |
Net Amount | ||||||||||||
| BTZ |
||||||||||||||||
| Barclays Capital, Inc. |
$ | (152,686,451 | ) | $ | 152,686,451 | $ | — | $ | — | |||||||
| BNP Paribas S.A. |
(82,083,516 | ) | 82,083,516 | — | — | |||||||||||
| Credit Suisse Securities (USA) LLC |
(25,631,954 | ) | 25,631,954 | — | — | |||||||||||
| J.P. Morgan Securities LLC |
(10,619,155 | ) | 10,619,155 | — | — | |||||||||||
| RBC Capital Markets LLC |
(317,737,668 | ) | 317,737,668 | — | — | |||||||||||
|
|
|
|
|
|
|
|
|
|||||||||
| $ | (588,758,744 | ) | $ | 588,758,744 | $ | — | $ | — | ||||||||
|
|
|
|
|
|
|
|
|
|||||||||
| (a) | Net collateral, including accrued interest, with a value of $659,354,596 has been pledged/received in connection with open reverse repurchase agreements. Excess of net collateral pledged to the individual counterparty is not shown for financial reporting purposes. |
In the event the counterparty of securities under an MRA files for bankruptcy or becomes insolvent, a fund’s use of the proceeds from the agreement may be restricted while the counterparty, or its trustee or receiver, determines whether or not to enforce a fund’s obligation to repurchase the securities.
| 5. | DERIVATIVE FINANCIAL INSTRUMENTS |
The Trusts engage in various portfolio investment strategies using derivative contracts both to increase the returns of the Trusts and/or to manage their exposure to certain risks such as credit risk, equity risk, interest rate risk, foreign currency exchange rate risk, commodity price risk or other risks (e.g., inflation risk). Derivative financial instruments categorized by risk exposure are included in the Schedules of Investments. These contracts may be transacted on an exchange or OTC.
Futures Contracts: Futures contracts are purchased or sold to gain exposure to, or manage exposure to, changes in interest rates (interest rate risk) and changes in the value of equity securities (equity risk) or foreign currencies (foreign currency exchange rate risk).
Futures contracts are exchange-traded agreements between the Trusts and a counterparty to buy or sell a specific quantity of an underlying instrument at a specified price and on a specified date. Depending on the terms of a contract, it is settled either through physical delivery of the underlying instrument on the settlement date or by payment of a cash amount on the settlement date. Upon entering into a futures contract, the Trusts are required to deposit initial margin with the broker in the form of cash or securities in an amount that varies depending on a contract’s size and risk profile. The initial margin deposit must then be maintained at an established level over the life of the contract. Amounts pledged, which are considered restricted, are included in cash pledged for futures contracts in the Statements of Assets and Liabilities.
Securities deposited as initial margin are designated in the Schedules of Investments and cash deposited, if any, are shown as cash pledged for futures contracts in the Statements of Assets and Liabilities. Pursuant to the contract, the Trusts agree to receive from or pay to the broker an amount of cash equal to the daily fluctuation in market value of the contract (“variation margin”). Variation margin is recorded as unrealized appreciation (depreciation) and, if any, shown as variation margin receivable (or payable) on futures contracts in the Statements of Assets and Liabilities. When the contract is closed, a realized gain or loss is recorded in the Statements of Operations equal to the difference between the notional amount of the contract at the time it was opened and the notional amount at the time it was closed. The use of futures contracts involves the risk of an imperfect correlation in the movements in the price of futures contracts and interest rates, foreign currency exchange rates or underlying assets.
Forward Foreign Currency Exchange Contracts: Forward foreign currency exchange contracts are entered into to gain or reduce exposure to foreign currencies (foreign currency exchange rate risk).
A forward foreign currency exchange contract is an agreement between two parties to buy and sell a currency at a set exchange rate on a specified date. These contracts help to manage the overall exposure to the currencies in which some of the investments held by the Trusts are denominated and in some cases, may be used to obtain exposure to a particular market. The contracts are traded OTC and not on an organized exchange.
The contract is marked-to-market daily and the change in market value is recorded as unrealized appreciation (depreciation) in the Statements of Assets and Liabilities. When a contract is closed, a realized gain or loss is recorded in the Statements of Operations equal to the difference between the value at the time it was opened and the value at the time it was closed. Non-deliverable forward foreign currency exchange contracts are settled with the counterparty in cash without the delivery of foreign currency. The use of forward foreign currency exchange contracts involves the risk that the value of a forward foreign currency exchange contract changes unfavorably due to movements in the value of the referenced foreign currencies, and such value may exceed the amount(s) reflected in the Statements of Assets and Liabilities. Cash amounts pledged for forward foreign currency exchange contracts are considered restricted and are included in cash pledged as collateral for OTC derivatives in the Statements of Assets and Liabilities. A Trust’s risk of loss from counterparty credit risk on OTC derivatives is generally limited to the aggregate unrealized gain netted against any collateral held by the Trust.
| 142 | 2 0 2 1 B L A C K R O C K S E M I - A N N U A L R E P O R T T O S H A R E H O L D E R S |
Notes to Financial Statements (unaudited) (continued)
Options: The Trusts may purchase and write call and put options to increase or decrease their exposure to the risks of underlying instruments, including equity risk, interest rate risk and/or commodity price risk and/or, in the case of options written, to generate gains from options premiums.
A call option gives the purchaser (holder) of the option the right (but not the obligation) to buy, and obligates the seller (writer) to sell (when the option is exercised) the underlying instrument at the exercise or strike price at any time or at a specified time during the option period. A put option gives the holder the right to sell and obligates the writer to buy the underlying instrument at the exercise or strike price at any time or at a specified time during the option period.
Premiums paid on options purchased and premiums received on options written, as well as the daily fluctuation in market value, are included in investments at value –unaffiliated and options written at value, respectively, in the Statements of Assets and Liabilities. When an instrument is purchased or sold through the exercise of an option, the premium is offset against the cost or proceeds of the underlying instrument. When an option expires, a realized gain or loss is recorded in the Statements of Operations to the extent of the premiums received or paid. When an option is closed or sold, a gain or loss is recorded in the Statements of Operations to the extent the cost of the closing transaction exceeds the premiums received or paid. When the Trusts write a call option, such option is typically “covered,” meaning that they hold the underlying instrument subject to being called by the option counterparty. When the Trusts write a put option, cash is segregated in an amount sufficient to cover the obligation. These amounts, which are considered restricted, are included in cash pledged as collateral for options written in the Statements of Assets and Liabilities.
| • | Swaptions — The Trusts may purchase and write options on swaps (“swaptions”) primarily to preserve a return or spread on a particular investment or portion of the Trusts’ holdings, as a duration management technique or to protect against an increase in the price of securities it anticipates purchasing at a later date. The purchaser and writer of a swaption is buying or granting the right to enter into a previously agreed upon interest rate or credit default swap agreement (interest rate risk and/or credit risk) at any time before the expiration of the option. |
| • | Interest rate caps and floors — Interest rate caps and floors are entered into to gain or reduce exposure to interest rates (interest rate risk and/or other risk). Caps are agreements whereby one party agrees to make payments to the other, in return for a premium, to the extent that interest rate indexes exceed a specified rate, or “cap.” Floors are agreements whereby one party agrees to make payments to the other, in return for a premium, to the extent that interest rate indexes fall below a specified rate, or “floor.” The maximum potential amount of future payments that a Fund would be required to make under an interest rate cap would be the notional amount times the percentage increase in interest rates determined by the difference between the interest rate index current value and the value at the time the cap was entered into. |
| • | Foreign currency options — The Trusts may purchase and write foreign currency options, foreign currency futures and options on foreign currency futures to gain or reduce exposure to foreign currencies (foreign currency exchange rate risk). Foreign currency options give the purchaser the right to buy from or sell to the writer a foreign currency at any time before the expiration of the option. |
In purchasing and writing options, the Trusts bear the risk of an unfavorable change in the value of the underlying instrument or the risk that they may not be able to enter into a closing transaction due to an illiquid market. Exercise of a written option could result in the Trusts purchasing or selling a security when they otherwise would not, or at a price different from the current market value.
Swaps: Swap contracts are entered into to manage exposure to issuers, markets and securities. Such contracts are agreements between the Trusts and a counterparty to make periodic net payments on a specified notional amount or a net payment upon termination. Swap agreements are privately negotiated in the OTC market and may be entered into as a bilateral contract (“OTC swaps”) or centrally cleared (“centrally cleared swaps”).
For OTC swaps, any upfront premiums paid and any upfront fees received are shown as swap premiums paid and swap premiums received, respectively, in the Statements of Assets and Liabilities and amortized over the term of the contract. The daily fluctuation in market value is recorded as unrealized appreciation (depreciation) on OTC Swaps in the Statements of Assets and Liabilities. Payments received or paid are recorded in the Statements of Operations as realized gains or losses, respectively. When an OTC swap is terminated, a realized gain or loss is recorded in the Statements of Operations equal to the difference between the proceeds from (or cost of) the closing transaction and the Trusts’ basis in the contract, if any. Generally, the basis of the contract is the premium received or paid.
In a centrally cleared swap, immediately following execution of the swap contract, the swap contract is novated to a central counterparty (the “CCP”) and the CCP becomes the Trusts’ counterparty on the swap. Each Trust is required to interface with the CCP through the broker. Upon entering into a centrally cleared swap, each Trust is required to deposit initial margin with the broker in the form of cash or securities in an amount that varies depending on the size and risk profile of the particular swap. Securities deposited as initial margin are designated in the Schedules of Investments and cash deposited is shown as cash pledged for centrally cleared swaps in the Statements of Assets and Liabilities. Amounts pledged, which are considered restricted cash, are included in cash pledged for centrally cleared swaps in the Statements of Assets and Liabilities. Pursuant to the contract, each Trust agrees to receive from or pay to the broker an amount of cash equal to the daily fluctuation in market value of the contract (“variation margin”). Variation margin is recorded as unrealized appreciation (depreciation) and shown as variation margin receivable (or payable) on centrally cleared swaps in the Statements of Assets and Liabilities. Payments received from (paid to) the counterparty are amortized over the term of the contract and recorded as realized gains (losses) in the Statements of Operations, including those at termination.
| • | Credit default swaps — Credit default swaps are entered into to manage exposure to the market or certain sectors of the market, to reduce risk exposure to defaults of corporate and/or sovereign issuers or to create exposure to corporate and/or sovereign issuers to which a fund is not otherwise exposed (credit risk). |
The Trusts may either buy or sell (write) credit default swaps on single-name issuers (corporate or sovereign), a combination or basket of single-name issuers or traded indexes. Credit default swaps are agreements in which the protection buyer pays fixed periodic payments to the seller in consideration for a promise from the protection seller to make a specific payment should a negative credit event take place with respect to the referenced entity (e.g., bankruptcy, failure to pay, obligation acceleration, repudiation, moratorium or restructuring). As a buyer, if an underlying credit event occurs, the Trusts will either (i) receive from the seller an amount equal to the notional amount of the swap and deliver the referenced security or underlying securities comprising the index, or (ii) receive a net settlement of cash equal to the notional amount of the swap less the recovery value of the security or underlying securities comprising the index. As a seller (writer), if an underlying credit event occurs, the Trusts will
| N O T E S T O F I N A N C I A L S T A T E M E N T S |
143 |
Notes to Financial Statements (unaudited) (continued)
either pay the buyer an amount equal to the notional amount of the swap and take delivery of the referenced security or underlying securities comprising the index or pay a net settlement of cash equal to the notional amount of the swap less the recovery value of the security or underlying securities comprising the index.
| • | Total return swaps — Total return swaps are entered into to obtain exposure to a security or market without owning such security or investing directly in such market or to exchange the risk/return of one security or market (e.g., fixed-income) with another security or market (e.g., equity or commodity prices) (equity risk, commodity price risk and/or interest rate risk). |
Total return swaps are agreements in which there is an exchange of cash flows whereby one party commits to make payments based on the total return (distributions plus capital gains/losses) of an underlying instrument, or basket of underlying instruments, in exchange for fixed or floating rate interest payments. If the total return of the instrument(s) or index underlying the transaction exceeds or falls short of the offsetting fixed or floating interest rate obligation, the Trusts receive payment from or make a payment to the counterparty.
| • | Interest rate swaps — Interest rate swaps are entered into to gain or reduce exposure to interest rates or to manage duration, the yield curve or interest rate (interest rate risk). |
Interest rate swaps are agreements in which one party pays a stream of interest payments, either fixed or floating, in exchange for another party’s stream of interest payments, either fixed or floating, on the same notional amount for a specified period of time. In more complex interest rate swaps, the notional principal amount may decline (or amortize) over time.
Swap transactions involve, to varying degrees, elements of interest rate, credit and market risk in excess of the amounts recognized in the Statements of Assets and Liabilities. Such risks involve the possibility that there will be no liquid market for these agreements, that the counterparty to the agreements may default on its obligation to perform or disagree as to the meaning of the contractual terms in the agreements, and that there may be unfavorable changes in interest rates and/or market values associated with these transactions.
Master Netting Arrangements: In order to define its contractual rights and to secure rights that will help it mitigate its counterparty risk, a Trust may enter into an International Swaps and Derivatives Association, Inc. Master Agreement (“ISDA Master Agreement”) or similar agreement with its counterparties. An ISDA Master Agreement is a bilateral agreement between a Trust and a counterparty that governs certain OTC derivatives and typically contains, among other things, collateral posting terms and netting provisions in the event of a default and/or termination event. Under an ISDA Master Agreement, a Trust may, under certain circumstances, offset with the counterparty certain derivative financial instruments’ payables and/or receivables with collateral held and/or posted and create one single net payment. The provisions of the ISDA Master Agreement typically permit a single net payment in the event of default including the bankruptcy or insolvency of the counterparty. However, bankruptcy or insolvency laws of a particular jurisdiction may impose restrictions on or prohibitions against the right of offset in bankruptcy, insolvency or other events.
Collateral Requirements: For derivatives traded under an ISDA Master Agreement, the collateral requirements are typically calculated by netting the mark-to-market amount for each transaction under such agreement and comparing that amount to the value of any collateral currently pledged by the Trust and the counterparty.
Cash collateral that has been pledged to cover obligations of the Trusts and cash collateral received from the counterparty, if any, is reported separately in the Statements of Assets and Liabilities as cash pledged as collateral and cash received as collateral, respectively. Non-cash collateral pledged by the Trusts, if any, is noted in the Schedules of Investments. Generally, the amount of collateral due from or to a counterparty is subject to a certain minimum transfer amount threshold before a transfer is required, which is determined at the close of business of the Trusts. Any additional required collateral is delivered to/pledged by the Trusts on the next business day. Typically, the counterparty is not permitted to sell, re-pledge or use cash and non-cash collateral it receives. A Trust generally agrees not to use non-cash collateral that it receives but may, absent default or certain other circumstances defined in the underlying ISDA Master Agreement, be permitted to use cash collateral received. In such cases, interest may be paid pursuant to the collateral arrangement with the counterparty. To the extent amounts due to the Trusts from the counterparties are not fully collateralized, each Trust bears the risk of loss from counterparty non-performance. Likewise, to the extent the Trusts have delivered collateral to a counterparty and stand ready to perform under the terms of their agreement with such counterparty, each Trust bears the risk of loss from a counterparty in the amount of the value of the collateral in the event the counterparty fails to return such collateral. Based on the terms of agreements, collateral may not be required for all derivative contracts.
For financial reporting purposes, the Trusts do not offset derivative assets and derivative liabilities that are subject to netting arrangements, if any, in the Statements of Assets and Liabilities.
| 6. | INVESTMENT ADVISORY AGREEMENT AND OTHER TRANSACTIONS WITH AFFILIATES |
Investment Advisory: Each Trust entered into an Investment Advisory Agreement with the Manager, the Trusts’ investment adviser and an indirect, wholly-owned subsidiary of BlackRock, Inc. (“BlackRock”), to provide investment advisory and administrative services. The Manager is responsible for the management of each Trust’s portfolio and provides the personnel, facilities, equipment and certain other services necessary to the operations of each Trust.
For such services, BHK, BTZ and BGT pays the Manager a monthly fee at an annual rate equal to the following percentages of the average weekly value of the Trust’s managed assets.
| Trust Name | Investment Advisory Fees |
|||
| BHK |
0.50 | % | ||
| BTZ |
0.62 | |||
| BGT |
0.75 | |||
| 144 | 2 0 2 1 B L A C K R O C K S E M I - A N N U A L R E P O R T T O S H A R E H O L D E R S |
Notes to Financial Statements (unaudited) (continued)
For purposes of calculating these fees, “managed assets” are determined as total assets of (including any assets attributable to money borrowed for investment purposes) less the sum of its accrued liabilities (other than money borrowed for investment purposes).
For such services, HYT pays the Manager a monthly fee at an annual rate equal to 0.60% of the average daily value of HYT’s net assets, plus the proceeds of any debt securities or outstanding borrowings used for leverage.
The Manager provides investment management and other services to the Taxable Subsidiary. The Manager does not receive separate compensation from the Taxable Subsidiary for providing investment management or administrative services. However, HYT pays the Manager based on HYT’s net assets, plus the proceeds of any debt securities or outstanding borrowings used for leverage, which includes the assets of the Taxable Subsidiary.
With respect to each Trust, the Manager entered into separate sub-advisory agreements with BlackRock International Limited (“BIL”) and, with respect to BHK, BlackRock (Singapore) Limited (“BRS”) (collectively, the “Sub-Advisers”), each an affiliate of the Manager. The Manager pays BIL and BRS for services they provide for that portion of each Trust for which BIL and BRS, as applicable, acts as sub-adviser, a monthly fee that is equal to a percentage of the investment advisory fees paid by each Trust to the Manager.
Expense Waivers and Reimbursements: With respect to each Trust, the Manager contractually agreed to waive its investment advisory fees by the amount of investment advisory fees each Trust pays to the Manager indirectly through its investment in affiliated money market funds (the “affiliated money market fund waiver”) through June 30, 2022. The contractual agreement may be terminated upon 90 days’ notice by a majority of the Independent Trustees, or by a vote of a majority of the outstanding voting securities of a Trust. These amounts are included in fees waived and/or reimbursed by the Manager in the Statements of Operations. For the six months ended June 30, 2021, the amounts waived were as follows:
| Trust Name | Fees Waived and/or Reimbursed by the Manager |
|||
| BHK |
$ | 2,708 | ||
| HYT |
370 | |||
| BTZ |
3,788 | |||
| BGT |
71 | |||
The Manager contractually agreed to waive its investment advisory fee with respect to any portion of each Trust’s assets invested in affiliated equity and fixed-income mutual funds and affiliated exchange-traded funds that have a contractual management fee through June 30, 2022. The agreement can be renewed for annual periods thereafter, and may be terminated on 90 days’ notice, each subject to approval by a majority of the Trusts’ Independent Trustees. These amounts are included in fees waived and/or reimbursed by the Manager in the Statements of Operations. For the six months ended June 30, 2021, the amounts waived in investment advisory fees pursuant to these arrangements were as follows:
| Trust Name | Fees Waived and/or Reimbursed by the Manager |
|||
| HYT |
$ | 24,415 | ||
| BGT |
22,416 | |||
Trustees and Officers: Certain trustees and/or officers of the Trust are directors and/or officers of BlackRock or its affiliates. The Trusts reimburse the Manager for a portion of the compensation paid to the Trusts’ Chief Compliance Officer, which is included in Trustees and Officer in the Statements of Operations.
Other Transactions: The Trusts may purchase securities from, or sell securities to, an affiliated fund provided the affiliation is due solely to having a common investment adviser, common officers, or common trustees. For the six months ended June 30, 2021, the purchase and sale transactions and any net realized gains (losses) with affiliated funds in compliance with Rule 17a-7 under the 1940 Act were as follows:
| Trust Name | Purchases | Sales | Net Realized Gain (Loss) |
|||||||||
| BHK |
$ | 199,038 | $ | 8,932 | $ | 677 | ||||||
| 7. | PURCHASES AND SALES |
For the six months ended June 30, 2021, purchases and sales of investments, including paydowns/payups and excluding short-term securities, were as follows:
| Trust Name | Purchases | Sales | ||||||
| BHK |
$ | 328,854,319 | $ | 158,460,743 | ||||
| HYT |
723,961,468 | 709,044,113 | ||||||
| BTZ |
211,055,893 | 229,839,457 | ||||||
| BGT |
147,033,830 | 136,515,653 | ||||||
| 8. | INCOME TAX INFORMATION |
It is each Trust’s policy to comply with the requirements of the Internal Revenue Code of 1986, as amended, applicable to regulated investment companies, and to distribute substantially all of its taxable income to its shareholders. Therefore, no U.S. federal income tax provision is required, except with respect to any taxes related to the Taxable Subsidiaries.
| N O T E S T O F I N A N C I A L S T A T E M E N T S |
145 |
Notes to Financial Statements (unaudited) (continued)
Each Trust files U.S. federal and various state and local tax returns. No income tax returns are currently under examination. The statute of limitations on each Trust’s U.S. federal tax returns generally remains open for a period of three fiscal years after they are filed. The statutes of limitations on each Trust’s state and local tax returns may remain open for an additional year depending upon the jurisdiction.
Management has analyzed tax laws and regulations and their application to the Trusts as of June 30, 2021, inclusive of the open tax return years, and does not believe that there are any uncertain tax positions that require recognition of a tax liability in the Trusts’ financial statements.
As of December 31, 2020, the Trusts had non-expiring capital loss carryforwards available to offset future realized capital gains as follows:
| Trust Name | Non-Expiring | |||
| HYT |
$ | 180,070,278 | ||
| BTZ |
30,497,786 | |||
| BGT |
28,596,408 | |||
As of June 30, 2021, gross unrealized appreciation and depreciation based on cost of investments (including short positions and derivatives, if any) for U.S. federal income tax purposes were as follows:
| BHK | HYT | BTZ | BGT | |||||||||||||
| Tax cost |
$ | 1,234,677,909 | $ | 2,089,426,808 | $ | 1,812,875,858 | $ | 458,038,561 | ||||||||
| Gross unrealized appreciation |
$ | 118,283,497 | $ | 125,354,836 | $ | 228,292,657 | $ | 5,204,414 | ||||||||
| Gross unrealized depreciation |
(16,975,637 | ) | (39,113,302 | ) | (7,271,523 | ) | (4,569,078 | ) | ||||||||
| Net unrealized appreciation (depreciation) |
$ | 101,307,860 | $ | 86,241,534 | $ | 221,021,134 | $ | 635,336 | ||||||||
| 9. | BANK BORROWINGS |
BGT and HYT are party to a senior committed secured, 360-day rolling line of credit facility and a separate security agreement (the “SSB Agreement”) with State Street Bank and Trust Company (“SSB”). SSB may elect to terminate its commitment upon 360-days written notice to HYT and BGT. As of period end, HYT and BGT have not received any notice to terminate. HYT and BGT has granted a security interest in substantially all of their assets to SSB.
The SSB Agreement allows for the maximum commitment amounts of $732,000,000 for HYT and $168,000,000 for BGT.
Advances will be made by SSB to BGT and HYT, at HYT and BGT’s option of (a) the higher of (i) 0.80% above the Fed Funds rate and (ii) 0.80% above Overnight LIBOR or (b) 0.80% above 7-day, 30-day, 60-day or 90-day LIBOR. Overnight LIBOR and LIBOR rates are subject to a 0% floor.
In addition, BGT and HYT paid a commitment fee (based on the daily unused portion of the commitments). The fees associated with each of the agreements are included in the Statements of Operations as borrowing costs, if any. Advances to BGT and HYT as of period end, if any, are shown in the Statements of Assets and Liabilities as bank borrowings payable. Based on the short-term nature of the borrowings under the line of credit and the variable interest rate, the carrying amount of the borrowings approximates fair value.
BGT and HYT may not declare dividends or make other distributions on shares or purchase any such shares if, at the time of the declaration, distribution or purchase, asset coverage with respect to the outstanding short-term borrowings is less than 300%.
For the six months ended June 30, 2021, the average amount of bank borrowings and the daily weighted average interest rates for BGT and HYT for loans under the revolving credit agreements were as follows:
| Trust Name | Average Amount Outstanding |
Daily Weighted Average Interest Rate |
||||||
| HYT |
$ | 635,198,895 | 0.93 | % | ||||
| BGT |
132,353,591 | 0.94 | ||||||
| 10. | PRINCIPAL RISKS |
In the normal course of business, the Trusts invest in securities or other instruments and may enter into certain transactions, and such activities subject each Trust to various risks, including among others, fluctuations in the market (market risk) or failure of an issuer to meet all of its obligations. The value of securities or other instruments may also be affected by various factors, including, without limitation: (i) the general economy; (ii) the overall market as well as local, regional or global political and/or social instability; (iii) regulation, taxation or international tax treaties between various countries; or (iv) currency, interest rate and price fluctuations. Local, regional or global events such as war, acts of terrorism, the spread of infectious illness or other public health issues, recessions, or other events could have a significant impact on the Trusts and their investments.
Each Trust may invest without limitation in illiquid or less liquid investments or investments in which no secondary market is readily available or which are otherwise illiquid, including private placement securities. A Trust may not be able to readily dispose of such investments at prices that approximate those at which a Trust could sell such investments if they were more widely traded and, as a result of such illiquidity, a Trust may have to sell other investments or engage in borrowing transactions if necessary to
| 146 | 2 0 2 1 B L A C K R O C K S E M I - A N N U A L R E P O R T T O S H A R E H O L D E R S |
Notes to Financial Statements (unaudited) (continued)
raise funds to meet its obligations. Limited liquidity can also affect the market price of investments, thereby adversely affecting a Trust’s NAV and ability to make dividend distributions. Privately issued debt securities are often of below investment grade quality, frequently are unrated and present many of the same risks as investing in below investment grade public debt securities.
Market Risk: Each Trust may be exposed to prepayment risk, which is the risk that borrowers may exercise their option to prepay principal earlier than scheduled during periods of declining interest rates, which would force each Trust to reinvest in lower yielding securities. Each Trust may also be exposed to reinvestment risk, which is the risk that income from each Trust’s portfolio will decline if each Trust invests the proceeds from matured, traded or called fixed-income securities at market interest rates that are below each Trust portfolio’s current earnings rate.
Municipal securities are subject to the risk that litigation, legislation or other political events, local business or economic conditions, credit rating downgrades, or the bankruptcy of the issuer could have a significant effect on an issuer’s ability to make payments of principal and/or interest or otherwise affect the value of such securities. Municipal securities can be significantly affected by political or economic changes, including changes made in the law after issuance of the securities, as well as uncertainties in the municipal market related to, taxation, legislative changes or the rights of municipal security holders, including in connection with an issuer insolvency. Municipal securities backed by current or anticipated revenues from a specific project or specific assets can be negatively affected by the discontinuance of the tax benefits supporting the project or assets or the inability to collect revenues for the project or from the assets. Municipal securities may be less liquid than taxable bonds, and there may be less publicly available information on the financial condition of municipal security issuers than for issuers of other securities.
An outbreak of respiratory disease caused by a novel coronavirus has developed into a global pandemic and has resulted in closing borders, quarantines, disruptions to supply chains and customer activity, as well as general concern and uncertainty. The impact of this pandemic, and other global health crises that may arise in the future, could affect the economies of many nations, individual companies and the market in general in ways that cannot necessarily be foreseen at the present time. This pandemic may result in substantial market volatility and may adversely impact the prices and liquidity of a fund’s investments. The duration of this pandemic and its effects cannot be determined with certainty.
Valuation Risk: The market values of equities, such as common stocks and preferred securities or equity related investments, such as futures and options, may decline due to general market conditions which are not specifically related to a particular company. They may also decline due to factors which affect a particular industry or industries. A Trust may invest in illiquid investments. An illiquid investment is any investment that a Trust reasonably expects cannot be sold or disposed of in current market conditions in seven calendar days or less without the sale or disposition significantly changing the market value of the investment. A Trust may experience difficulty in selling illiquid investments in a timely manner at the price that it believes the investments are worth. Prices may fluctuate widely over short or extended periods in response to company, market or economic news. Markets also tend to move in cycles, with periods of rising and falling prices. This volatility may cause each Trust’s NAV to experience significant increases or decreases over short periods of time. If there is a general decline in the securities and other markets, the NAV of a Trust may lose value, regardless of the individual results of the securities and other instruments in which a Trust invests.
The price a Trust could receive upon the sale of any particular portfolio investment may differ from a Trust’s valuation of the investment, particularly for securities that trade in thin or volatile markets or that are valued using a fair valuation technique or a price provided by an independent pricing service. Changes to significant unobservable inputs and assumptions (i.e., publicly traded company multiples, growth rate, time to exit) due to the lack of observable inputs may significantly impact the resulting fair value and therefore a Trust’s results of operations. As a result, the price received upon the sale of an investment may be less than the value ascribed by a Trust, and a Trust could realize a greater than expected loss or lesser than expected gain upon the sale of the investment. A Trust’s ability to value its investments may also be impacted by technological issues and/or errors by pricing services or other third party service providers.
Counterparty Credit Risk: The Trusts may be exposed to counterparty credit risk, or the risk that an entity may fail to or be unable to perform on its commitments related to unsettled or open transactions, including making timely interest and/or principal payments or otherwise honoring its obligations. The Trusts manage counterparty credit risk by entering into transactions only with counterparties that the Manager believes have the financial resources to honor their obligations and by monitoring the financial stability of those counterparties. Financial assets, which potentially expose the Trusts to market, issuer and counterparty credit risks, consist principally of financial instruments and receivables due from counterparties. The extent of the Trusts’ exposure to market, issuer and counterparty credit risks with respect to these financial assets is approximately their value recorded in the Statements of Assets and Liabilities, less any collateral held by the Trusts.
A derivative contract may suffer a mark-to-market loss if the value of the contract decreases due to an unfavorable change in the market rates or values of the underlying instrument. Losses can also occur if the counterparty does not perform under the contract.
For OTC options purchased, each Trust bears the risk of loss in the amount of the premiums paid plus the positive change in market values net of any collateral held by the Trusts should the counterparty fail to perform under the contracts. Options written by the Trusts do not typically give rise to counterparty credit risk, as options written generally obligate the Trusts, and not the counterparty, to perform. The Trusts may be exposed to counterparty credit risk with respect to options written to the extent each Trust deposits collateral with its counterparty to a written option.
With exchange-traded options purchased and exchange-traded futures and centrally cleared swaps, there is less counterparty credit risk to the Trusts since the exchange or clearinghouse, as counterparty to such instruments, guarantees against a possible default. The clearinghouse stands between the buyer and the seller of the contract; therefore, credit risk is limited to failure of the clearinghouse. While offset rights may exist under applicable law, a Trust does not have a contractual right of offset against a clearing broker or clearinghouse in the event of a default (including the bankruptcy or insolvency). Additionally, credit risk exists in exchange-traded futures and centrally cleared swaps with respect to initial and variation margin that is held in a clearing broker’s customer accounts. While clearing brokers are required to segregate customer margin from their own assets, in the event that a clearing broker becomes insolvent or goes into bankruptcy and at that time there is a shortfall in the aggregate amount of margin held by the clearing broker for all its clients, typically the shortfall would be allocated on a pro rata basis across all the clearing broker’s customers, potentially resulting in losses to the Trusts.
| N O T E S T O F I N A N C I A L S T A T E M E N T S |
147 |
Notes to Financial Statements (unaudited) (continued)
Concentration Risk: A diversified portfolio, where this is appropriate and consistent with a fund’s objectives, minimizes the risk that a price change of a particular investment will have a material impact on the NAV of a fund. The investment concentrations within each Trust’s portfolio are disclosed in its Schedule of Investments.
Certain Trusts invest a significant portion of their assets in high yield securities. High yield securities that are rated below investment-grade (commonly referred to as “junk bonds”) or are unrated may be deemed speculative, involve greater levels of risk than higher-rated securities of similar maturity and are more likely to default. High yield securities may be issued by less creditworthy issuers, and issuers of high yield securities may be unable to meet their interest or principal payment obligations. High yield securities are subject to extreme price fluctuations, may be less liquid than higher rated fixed-income securities, even under normal economic conditions, and frequently have redemption features.
Certain Trusts invest a significant portion of their assets in fixed-income securities and/or use derivatives tied to the fixed-income markets. Changes in market interest rates or economic conditions may affect the value and/or liquidity of such investments. Interest rate risk is the risk that prices of bonds and other fixed-income securities will increase as interest rates fall and decrease as interest rates rise. The Trusts may be subject to a greater risk of rising interest rates due to the current period of historically low rates.
Certain Trusts invest a significant portion of their assets in securities backed by commercial or residential mortgage loans or in issuers that hold mortgage and other asset-backed securities. When a Trust concentrates its investments in this manner, it assumes a greater risk of prepayment or payment extension by securities issuers. Changes in economic conditions, including delinquencies and/or defaults on assets underlying these securities, can affect the value, income and/or liquidity of such positions. Investment percentages in these securities are presented in the Schedules of Investments.
LIBOR Transition Risk: The United Kingdom’s Financial Conduct Authority announced a phase out of the London Interbank Offered Rate (“LIBOR”). Although many LIBOR rates will be phased out by the end of 2021, a selection of widely used USD LIBOR rates will continue to be published through June 2023 in order to assist with the transition. The Trusts may be exposed to financial instruments tied to LIBOR to determine payment obligations, financing terms, hedging strategies or investment value. The transition process away from LIBOR might lead to increased volatility and illiquidity in markets for, and reduce the effectiveness of new hedges placed against, instruments whose terms currently include LIBOR. The ultimate effect of the LIBOR transition process on the Trusts is uncertain.
| 11. | CAPITAL SHARE TRANSACTIONS |
BHK, BTZ and BGT is authorized to issue an unlimited number of shares, par value $0.001, all of which were initially classified as Common Shares. HYT is authorized to issue 200 million shares, par value $0.10, all of which were initially classified as Common Shares. The Board is authorized, however, to reclassify any unissued Common Shares to Preferred Shares without the approval of Common Shareholders.
For the periods shown, shares issued and outstanding increased by the following amounts as a result of dividend reinvestment:
| Trust Name | Six Months Ended 06/30/21 |
Year Ended 12/31/20 |
||||||
| BHK |
||||||||
| Shares issued from dividend reinvestment |
23,441 | — | ||||||
| HYT |
||||||||
| Shares issued from dividend reinvestment |
40,087 | — | ||||||
The Trusts participate in an open market share repurchase program (the “Repurchase Program”). From December 1, 2020 through November 30, 2021, each Trust may repurchase up to 5% of its outstanding common shares under the Repurchase Program, based on common shares outstanding as of the close of business on November 30, 2020, subject to certain conditions. There is no assurance that the Trusts will purchase shares in any particular amounts. For the six months ended June 30, 2021, BHK, HYT and BTZ did not repurchase any shares.
The total cost of the shares repurchased is reflected in Trusts’ Statements of Changes in Net Assets. For the periods shown, shares repurchased and cost, including transaction costs were as follows:
| BTZ | BGT | |||||||||||||||
| Shares | Amounts | Shares | Amounts | |||||||||||||
| Six Months Ended June 30, 2021 |
— | $ | — | 35,289 | $ | 419,729 | ||||||||||
| Year Ended December 31, 2020 |
10,386,555 | (a) | 155,227,064 | 557,488 | 6,057,572 | |||||||||||
| (a) | Common shares issued and outstanding had a net decrease of 10,386,555 as a result of shares repurchased in a tender offer. |
| 12. | SUBSEQUENT EVENTS |
Management’s evaluation of the impact of all subsequent events on the Trusts’ financial statements was completed through the date the financial statements were issued and the following items were noted:
The Trusts declared and paid or will pay distributions to Common Shareholders as follows:
| Trust Name | Declaration Date |
Record Date |
Payable/ Paid Date |
Dividend Per Common Share |
||||||||||||
| BHK |
07/01/21 | 07/15/21 | 07/30/21 | $ | 0.074600 | |||||||||||
| 148 | 2 0 2 1 B L A C K R O C K S E M I - A N N U A L R E P O R T T O S H A R E H O L D E R S |
Notes to Financial Statements (unaudited) (continued)
| Trust Name | Declaration Date |
Record Date |
Payable/ Paid Date |
Dividend Per Common Share |
||||||||||||
| 08/02/21 | 08/16/21 | 08/31/21 | $ | 0.074600 | ||||||||||||
| HYT |
||||||||||||||||
| 07/01/21 | 07/15/21 | 07/30/21 | 0.077900 | |||||||||||||
| 08/02/21 | 08/16/21 | 08/31/21 | 0.077900 | |||||||||||||
| BTZ |
||||||||||||||||
| 07/01/21 | 07/15/21 | 07/30/21 | 0.083900 | |||||||||||||
| 08/02/21 | 08/16/21 | 08/31/21 | 0.083900 | |||||||||||||
| BGT |
||||||||||||||||
| 07/01/21 | 07/15/21 | 07/30/21 | 0.064700 | |||||||||||||
| 08/02/21 | 08/16/21 | 08/31/21 | 0.064700 | |||||||||||||
| N O T E S T O F I N A N C I A L S T A T E M E N T S |
149 |
Disclosure of Investment Advisory Agreements and Sub-Advisory Agreements
The Boards of Directors/Trustees, as applicable (collectively, the “Board,” the members of which are referred to as “Board Members”) of BlackRock Core Bond Trust (“BHK”), BlackRock Corporate High Yield Fund, Inc. (“HYT”), BlackRock Credit Allocation Income Trust (“BTZ”) and BlackRock Floating Rate Income Trust (“BGT” and together with BHK, HYT and BTZ,, the “Funds” and each, a “Fund”) met on May 4, 2021 (the “May Meeting”) and June 8-9, 2021 (the “June Meeting”) to consider the approval to continue the investment advisory agreements (the “Advisory Agreements”) between each Fund and BlackRock Advisors, LLC (the “Manager”), each Fund’s investment advisor. The Board also considered the approval to continue the sub-advisory agreements (the “Sub-Advisory Agreements”) between (1) the Manager, BlackRock International Limited (“BIL”) and each Fund and (2) the Manager, BlackRock (Singapore) Limited (“BRS” and together with BIL, the “Sub-Advisors”) and BHK. The Manager and the Sub-Advisors are referred to herein as “BlackRock.” The Advisory Agreements and the Sub-Advisory Agreements are referred to herein as the “Agreements.”
The Approval Process
Consistent with the requirements of the Investment Company Act of 1940 (the “1940 Act”), the Board considers the approval of the continuation of the Agreements for each Fund on an annual basis. The Board members whom are not “interested persons” of each Fund, as defined in the 1940 Act, are considered independent Board members (the “Independent Board Members”). The Board’s consideration entailed a year-long deliberative process during which the Board and its committees assessed BlackRock’s various services to each Fund, including through the review of written materials and oral presentations, and the review of additional information provided in response to requests from the Independent Board Members. The Board had four quarterly meetings per year, each typically extending for two days, as well as additional ad hoc meetings and executive sessions throughout the year, as needed. The committees of the Board similarly met throughout the year. The Board also had a fifth one-day meeting to consider specific information surrounding the renewal of the Agreements. In particular, the Board assessed, among other things, the nature, extent and quality of the services provided to each Fund by BlackRock, BlackRock’s personnel and affiliates, including (as applicable): investment management services; accounting oversight; administrative and shareholder services; oversight of each Fund’s service providers; risk management and oversight; and legal, regulatory and compliance services. Throughout the year, including during the contract renewal process, the Independent Board Members were advised by independent legal counsel, and met with independent legal counsel in various executive sessions outside of the presence of BlackRock’s management.
During the year, the Board, acting directly and through its committees, considered information that was relevant to its annual consideration of the renewal of the Agreements, including the services and support provided by BlackRock to each Fund and its shareholders. BlackRock also furnished additional information to the Board in response to specific questions from the Board. Among the matters the Board considered were: (a) investment performance for one-year, three-year, five-year, and/or since inception periods, as applicable, against peer funds, relevant benchmarks, and other performance metrics, as applicable, as well as BlackRock senior management’s and portfolio managers’ analyses of the reasons for any outperformance or underperformance relative to its peers, benchmarks, and other performance metrics, as applicable; (b) leverage management, as applicable; (c) fees, including advisory, administration, if applicable, and other amounts paid to BlackRock and its affiliates by each Fund for services; (d) Fund operating expenses and how BlackRock allocates expenses to each Fund; (e) the resources devoted to risk oversight of, and compliance reports relating to, implementation of each Fund’s investment objective, policies and restrictions, and meeting regulatory requirements; (f) BlackRock’s and each Fund’s adherence to applicable compliance policies and procedures; (g) the nature, character and scope of non-investment management services provided by BlackRock and its affiliates and the estimated cost of such services, as available; (h) BlackRock’s and other service providers’ internal controls and risk and compliance oversight mechanisms; (i) BlackRock’s implementation of the proxy voting policies approved by the Board; (j) execution quality of portfolio transactions; (k) BlackRock’s implementation of each Fund’s valuation and liquidity procedures; (l) an analysis of management fees paid to BlackRock for products with similar investment mandates across the open-end fund, closed-end fund, sub-advised mutual fund, collective investment trust and institutional separate account product channels, as applicable, and the similarities and differences between these products and the services provided as compared to each Fund; (m) BlackRock’s compensation methodology for its investment professionals and the incentives and accountability it creates, along with investment professionals’ investments in the fund(s) they manage; (n) periodic updates on BlackRock’s business; and (o) each Fund’s market discount/premium compared to peer funds.
Prior to and in preparation for the May Meeting, the Board received and reviewed materials specifically relating to the renewal of the Agreements. The Independent Board Members are continuously engaged in a process with their independent legal counsel and BlackRock to review the nature and scope of the information provided to the Board to better assist its deliberations. The materials provided in connection with the May Meeting included, among other things: (a) information independently compiled and prepared by Broadridge Financial Solutions, Inc. (“Broadridge”), based on Lipper classifications, regarding each Fund’s fees and expenses as compared with a peer group of funds as determined by Broadridge (“Expense Peers”) and the investment performance of each Fund as compared with a peer group of funds (“Performance Peers”); (b) information on the composition of the Expense Peers and Performance Peers and a description of Broadridge’s methodology; (c) information on the estimated profits realized by BlackRock and its affiliates pursuant to the Agreements and a discussion of fall-out benefits to BlackRock and its affiliates; (d) a general analysis provided by BlackRock concerning investment management fees received in connection with other types of investment products, such as institutional accounts, sub-advised mutual funds, closed-end funds, and open-end funds, under similar investment mandates, as applicable; (e) a review of non-management fees; (f) the existence, impact and sharing of potential economies of scale, if any, with each Fund; (g) a summary of aggregate amounts paid by each Fund to BlackRock; and (h) various additional information requested by the Board as appropriate regarding BlackRock’s and each Fund’s operations.
At the May Meeting, the Board reviewed materials relating to its consideration of the Agreements. As a result of the discussions that occurred during the May Meeting, and as a culmination of the Board’s year-long deliberative process, the Board presented BlackRock with questions and requests for additional information. BlackRock responded to these questions and requests with additional written information in advance of the June Meeting.
At the June Meeting, the Board concluded its assessment of, among other things: (a) the nature, extent and quality of the services provided by BlackRock; (b) the investment performance of each Fund as compared to its Performance Peers and to other metrics, as applicable; (c) the advisory fee and the estimated cost of the services and estimated profits realized by BlackRock and its affiliates from their relationship with each Fund; (d) each Fund’s fees and expenses compared to its Expense Peers; (e) the existence and sharing of potential economies of scale; (f) any fall-out benefits to BlackRock and its affiliates as a result of BlackRock’s relationship with each Fund; and (g) other factors deemed relevant by the Board Members.
The Board also considered other matters it deemed important to the approval process, such as other payments made to BlackRock or its affiliates relating to securities lending and cash management, and BlackRock’s services related to the valuation and pricing of Fund portfolio holdings. The Board noted the willingness of BlackRock’s personnel to
| 150 | 2 0 2 1 B L A C K R O C K S E M I - A N N U A L R E P O R T T O S H A R E H O L D E R S |
Disclosure of Investment Advisory Agreements and Sub-Advisory Agreements (continued)
engage in open, candid discussions with the Board. The Board Members did not identify any particular information, or any single factor as determinative, and each Board Member may have attributed different weights to the various items and factors considered.
A. Nature, Extent and Quality of the Services Provided by BlackRock
The Board, including the Independent Board Members, reviewed the nature, extent and quality of services provided by BlackRock, including the investment advisory services, and the resulting performance of each Fund. Throughout the year, the Board compared Fund performance to the performance of a comparable group of closed-end funds, relevant benchmarks, and performance metrics, as applicable. The Board met with BlackRock’s senior management personnel responsible for investment activities, including the senior investment officers. The Board also reviewed the materials provided by each Fund’s portfolio management team discussing each Fund’s performance, investment strategies and outlook.
The Board considered, among other factors, with respect to BlackRock: the number, education and experience of investment personnel generally and each Fund’s portfolio management team; research capabilities; investments by portfolio managers in the funds they manage; portfolio trading capabilities; use of technology; commitment to compliance; credit analysis capabilities; risk analysis and oversight capabilities; and the approach to training and retaining portfolio managers and other research, advisory and management personnel. The Board also considered BlackRock’s overall risk management program, including the continued efforts of BlackRock and its affiliates to address cybersecurity risks and the role of BlackRock’s Risk & Quantitative Analysis Group. The Board engaged in a review of BlackRock’s compensation structure with respect to each Fund’s portfolio management team and BlackRock’s ability to attract and retain high-quality talent and create performance incentives.
In addition to investment advisory services, the Board considered the nature and quality of the administrative and other non-investment advisory services provided to each Fund. BlackRock and its affiliates provide each Fund with certain administrative, shareholder and other services (in addition to any such services provided to each Fund by third parties) and officers and other personnel as are necessary for the operations of each Fund. In particular, BlackRock and its affiliates provide each Fund with administrative services including, among others: (i) responsibility for disclosure documents, such as the prospectus and the statement of additional information in connection with the initial public offering and periodic shareholder reports; (ii) preparing communications with analysts to support secondary market trading of each Fund; (iii) oversight of daily accounting and pricing; (iv) responsibility for periodic filings with regulators and stock exchanges; (v) overseeing and coordinating the activities of third-party service providers including, among others, each Fund’s custodian, fund accountant, transfer agent, and auditor; (vi) organizing Board meetings and preparing the materials for such Board meetings; (vii) providing legal and compliance support; (viii) furnishing analytical and other support to assist the Board in its consideration of strategic issues such as the merger, consolidation or repurposing of certain closed-end funds; and (ix) performing or managing administrative functions necessary for the operation of each Fund, such as tax reporting, expense management, fulfilling regulatory filing requirements, and shareholder call center and other services. The Board reviewed the structure and duties of BlackRock’s fund administration, shareholder services, and legal and compliance departments and considered BlackRock’s policies and procedures for assuring compliance with applicable laws and regulations. The Board considered the operation of BlackRock’s business continuity plans, including in light of the ongoing COVID-19 pandemic.
B. The Investment Performance of each Fund and BlackRock
The Board, including the Independent Board Members, reviewed and considered the performance history of each Fund throughout the year and at the May Meeting. In preparation for the May Meeting, the Board was provided with reports independently prepared by Broadridge, which included an analysis of each Fund’s performance as of December 31, 2020, as compared to its Performance Peers. The performance information is based on net asset value (NAV), and utilizes Lipper data. Lipper’s methodology calculates a fund’s total return assuming distributions are reinvested on the ex-date at a fund’s ex-date NAV. Broadridge ranks funds in quartiles, ranging from first to fourth, where first is the most desirable quartile position and fourth is the least desirable. In connection with its review, the Board received and reviewed information regarding the investment performance of each Fund as compared to its Performance Peers and, with respect to BTZ and BGT, a custom peer group of funds as defined by BlackRock (“Customized Peer Group”) and the performance of BHK as compared with its custom benchmark. The Board and its Performance Oversight Committee regularly review and meet with Fund management to discuss the performance of each Fund throughout the year.
In evaluating performance, the Board focused particular attention on funds with less favorable performance records. The Board also noted that while it found the data provided by Broadridge generally useful, it recognized the limitations of such data, including in particular, that notable differences may exist between a fund and its Performance Peers (for example, the investment objectives and strategies). Further, the Board recognized that the performance data reflects a snapshot of a period as of a particular date and that selecting a different performance period could produce significantly different results. The Board also acknowledged that long-term performance could be impacted by even one period of significant outperformance or underperformance, and that a single investment theme could have the ability to disproportionately affect long-term performance.
The Board noted that for the one-, three- and five-year periods reported, BHK underperformed, outperformed, and outperformed, respectively, its customized benchmark. The Board noted that BlackRock believes that performance relative to the customized benchmark is an appropriate performance metric for BHK, and that BlackRock has explained its rationale for this belief to the Board. The Board and BlackRock reviewed BHK’s underperformance relative to its customized benchmark during the applicable periods.
The Board noted that for the one-, three- and five-year periods reported, HYT ranked in the first quartile against its Performance Peers.
The Board noted that for each of the one-, three- and five-year periods reported, BTZ ranked in the first quartile against its Customized Peer Group. The Board noted that BlackRock believes that the Customized Peer Group is an appropriate performance metric for BTZ, and that BlackRock has explained its rationale for this belief to the Board.
The Board noted that for the one-, three- and five-year periods reported, BGT ranked in the first, first and third quartiles, respectively, against its Customized Peer Group. The Board noted that BlackRock believes that the Customized Peer Group is an appropriate performance metric for BGT, and that BlackRock has explained its rationale for this belief to the Board. The Board and BlackRock reviewed BGT’s underperformance relative to its Customized Peer Group during the applicable period.
C. Consideration of the Advisory/Management Fees and the Estimated Cost of the Services and Estimated Profits Realized by BlackRock and its Affiliates from their Relationship with each Fund
|
D I S C L O S U R E O F I N V E S T M E N T A D V I S O R Y A G R E E M E N T S A N D S U B - A D V I S O R Y A G R E E M E N T S |
151 |
Disclosure of Investment Advisory Agreements and Sub-Advisory Agreements (continued)
The Board, including the Independent Board Members, reviewed each Fund’s contractual management fee rate compared with those of its Expense Peers. The contractual management fee rate represents a combination of the advisory fee and any administrative fees, before taking into account any reimbursements or fee waivers. The Board also compared each Fund’s total expense ratio, as well as its actual management fee rate as a percentage of managed assets, which is the total assets of each Fund (including any assets attributable to money borrowed for investment purposes) minus the sum of each Fund’s accrued liabilities (other than money borrowed for investment purposes) to those of its Expense Peers. The total expense ratio represents a fund’s total net operating expenses, excluding any investment related expenses. The total expense ratio gives effect to any expense reimbursements or fee waivers, and the actual management fee rate gives effect to any management fee reimbursements or waivers. The Board considered the services provided and the fees charged by BlackRock and its affiliates to other types of clients with similar investment mandates, as applicable, including institutional accounts and sub-advised mutual funds (including mutual funds sponsored by third parties).
The Board received and reviewed statements relating to BlackRock’s financial condition. The Board reviewed BlackRock’s profitability methodology and was also provided with an estimated profitability analysis that detailed the revenues earned and the expenses incurred by BlackRock for services provided to each Fund. The Board reviewed BlackRock’s estimated profitability with respect to each Fund and other funds the Board currently oversees for the year ended December 31, 2020 compared to available aggregate estimated profitability data provided for the prior two years. The Board reviewed BlackRock’s estimated profitability with respect to certain other U.S. fund complexes managed by the Manager and/or its affiliates. The Board reviewed BlackRock’s assumptions and methodology of allocating expenses in the estimated profitability analysis, noting the inherent limitations in allocating costs among various advisory products. The Board recognized that profitability may be affected by numerous factors including, among other things, fee waivers and expense reimbursements by the Manager, the types of funds managed, precision of expense allocations and business mix. The Board thus recognized that calculating and comparing profitability at the individual fund level is difficult.
The Board noted that, in general, individual fund or product line profitability of other advisors is not publicly available. The Board reviewed BlackRock’s overall operating margin, in general, compared to that of certain other publicly traded asset management firms. The Board considered the differences between BlackRock and these other firms, including the contribution of technology at BlackRock, BlackRock’s expense management, and the relative product mix.
The Board considered whether BlackRock has the financial resources necessary to attract and retain high quality investment management personnel to perform its obligations under the Agreements and to continue to provide the high quality of services that is expected by the Board. The Board further considered factors including but not limited to BlackRock’s commitment of time, assumption of risk, and liability profile in servicing each Fund, including in contrast to what is required of BlackRock with respect to other products with similar investment mandates across the open-end fund, closed-end fund, sub-advised mutual fund, collective investment trust, and institutional separate account product channels, as applicable.
The Board noted that BHK’s contractual management fee rate ranked in the second quartile, and that the actual management fee rate and total expense ratio ranked in the second and first quartiles, respectively, relative to the Expense Peers.
The Board noted that HYT’s contractual management fee rate ranked in the first quartile, and that the actual management fee rate and total expense ratio each ranked in the first quartile, relative to the Expense Peers.
The Board noted that BTZ’s contractual management fee rate ranked in the third quartile, and that the actual management fee rate and total expense ratio ranked in the fourth and second quartiles, respectively, relative to the Expense Peers. The Board also noted, however, that given the comparability limitations of the Expense Peers, BlackRock provided the Board a supplemental peer group consisting of funds that are generally similar to BTZ. The Board noted that BTZ’s actual management fee rate and total expense ratio each ranked in the second quartile relative to the supplemental peer group.
The Board noted that BGT’s contractual management fee rate ranked in the first quartile, and that the actual management fee rate and total expense ratio each ranked in the first quartile, relative to the Expense Peers.
D. Economies of Scale
The Board, including the Independent Board Members, considered the extent to which economies of scale might be realized as the assets of each Fund increase. The Board also considered the extent to which each Fund benefits from such economies of scale in a variety of ways, and whether there should be changes in the advisory fee rate or breakpoint structure in order to enable each Fund to more fully participate in these economies of scale. The Board considered each Fund’s asset levels and whether the current fee was appropriate.
Based on the Board’s review and consideration of the issue, the Board concluded that most closed-end funds do not have fund level breakpoints because closed-end funds generally do not experience substantial growth after the initial public offering. Closed-end funds are typically priced at scale at a fund’s inception.
E. Other Factors Deemed Relevant by the Board Members
The Board, including the Independent Board Members, also took into account other ancillary or “fall-out” benefits that BlackRock or its affiliates may derive from BlackRock’s respective relationships with each Fund, both tangible and intangible, such as BlackRock’s ability to leverage its investment professionals who manage other portfolios and its risk management personnel, an increase in BlackRock’s profile in the investment advisory community, and the engagement of BlackRock’s affiliates as service providers to each Fund, including for administrative, securities lending and cash management services. The Board also considered BlackRock’s overall operations and its efforts to expand the scale of, and improve the quality of, its operations. The Board also noted that, subject to applicable law, BlackRock may use and benefit from third-party research obtained by soft dollars generated by certain registered fund transactions to assist in managing all or a number of its other client accounts.
In connection with its consideration of the Agreements, the Board also received information regarding BlackRock’s brokerage and soft dollar practices. The Board received reports from BlackRock which included information on brokerage commissions and trade execution practices throughout the year.
The Board noted the competitive nature of the closed-end fund marketplace, and that shareholders are able to sell their Fund shares in the secondary market if they believe that each Fund’s fees and expenses are too high or if they are dissatisfied with the performance of each Fund.
| 152 | 2 0 2 1 B L A C K R O C K S E M I - A N N U A L R E P O R T T O S H A R E H O L D E R S |
Disclosure of Investment Advisory Agreements and Sub-Advisory Agreements (continued)
The Board also considered the various notable initiatives and projects BlackRock performed in connection with its closed-end fund product line. These initiatives included developing equity shelf programs; efforts to eliminate product overlap with fund mergers; ongoing services to manage leverage that has become increasingly complex; periodic evaluation of share repurchases and other support initiatives for certain BlackRock funds; and continued communication efforts with shareholders, fund analysts and financial advisers. With respect to the latter, the Independent Board Members noted BlackRock’s continued commitment to supporting the secondary market for the common shares of its closed-end funds through a comprehensive secondary market communication program designed to raise investor and analyst awareness and understanding of closed-end funds. BlackRock’s support services included, among other things: sponsoring and participating in conferences; communicating with closed-end fund analysts covering the BlackRock funds throughout the year; providing marketing and product updates for the closed-end funds; and maintaining and enhancing its closed-end fund website.
Conclusion
The Board, including the Independent Board Members, unanimously approved the continuation of the Advisory Agreements between the Manager and each Fund for a one-year term ending June 30, 2022, and the Sub-Advisory Agreements among (1) the Manager, BIL and each Fund and (2) the Manager, BRS and BHK for a one-year term ending June 30, 2022. Based upon its evaluation of all of the aforementioned factors in their totality, as well as other information, the Board, including the Independent Board Members, was satisfied that the terms of the Agreements were fair and reasonable and in the best interest of each Fund and its shareholders. In arriving at its decision to approve the Agreements, the Board did not identify any single factor or group of factors as all-important or controlling, but considered all factors together, and different Board Members may have attributed different weights to the various factors considered. The Independent Board Members were also assisted by the advice of independent legal counsel in making this determination.
|
D I S C L O S U R E O F I N V E S T M E N T A D V I S O R Y A G R E E M E N T S A N D S U B - A D V I S O R Y A G R E E M E N T S |
153 |
Trust Certification
The Trusts are listed for trading on the NYSE and have filed with the NYSE their annual chief executive officer certification regarding compliance with the NYSE’s listing standards. The Trusts filed with the SEC the certification of its chief executive officer and chief financial officer required by Section 302 of the Sarbanes-Oxley Act.
Regulation Regarding Derivatives
On October 28, 2020, the Securities and Exchange Commission (the “SEC”) adopted new regulations governing the use of derivatives by registered investment companies (“Rule 18f-4”). The Trusts will be required to implement and comply with Rule 18f-4 by August 19, 2022. Once implemented, Rule 18f-4 will impose limits on the amount of derivatives a fund can enter into, eliminate the asset segregation framework currently used by funds to comply with Section 18 of the 1940 Act, treat derivatives as senior securities and require funds whose use of derivatives is more than a limited specified exposure amount to establish and maintain a comprehensive derivatives risk management program and appoint a derivatives risk manager.
Environmental, Social and Governance (“ESG”) Integration
Although a Trust does not seek to implement a specific ESG, impact or sustainability strategy unless otherwise disclosed, Trust management will consider ESG characteristics as part of the investment process for actively managed Trusts. These considerations will vary depending on a Trust’s particular investment strategies and may include consideration of third-party research as well as consideration of proprietary BlackRock research across the ESG risks and opportunities regarding an issuer. Trust management will consider those ESG characteristics it deems relevant or additive when making investment decisions for a Trust. The ESG characteristics utilized in a Trust’s investment process are anticipated to evolve over time and one or more characteristics may not be relevant with respect to all issuers that are eligible for investment. ESG characteristics are not the sole considerations when making investment decisions for a Trust. Further, investors can differ in their views of what constitutes positive or negative ESG characteristics. As a result, a Trust may invest in issuers that do not reflect the beliefs and values with respect to ESG of any particular investor. ESG considerations may affect a Trust’s exposure to certain companies or industries and a Trust may forego certain investment opportunities. While Trust management views ESG considerations as having the potential to contribute to a Trust’s long-term performance, there is no guarantee that such results will be achieved.
Dividend Policy
Each Trust’s policy is to make monthly distributions to shareholders. In order to provide shareholders with a more stable level of dividend distributions, each Trust employs a managed distribution plan (the “Plan”), the goal of which is to provide shareholders with consistent and predictable cash flows by setting distribution rates based on expected long-term returns of each Trust.
The distributions paid by a Trust for any particular month may be more or less than the amount of net investment income earned by a Trust during such month. Furthermore, the final tax characterization of distributions is determined after the year-end of a Trust and is reported in each Trust’s annual report to shareholders. Distributions can be characterized as ordinary income, capital gains and/or return of capital. Each Trust’s taxable net investment income and net realized capital gains (“taxable income”) may not be sufficient to support the level of distributions paid. To the extent that distributions exceed the Trust’s current and accumulated earnings and profits, the excess may be treated as a non-taxable return of capital.
A return of capital is a return of a portion of an investor’s original investment. A return of capital is not expected to be taxable, but it reduces a shareholder’s tax basis in his or her shares, thus reducing any loss or increasing any gain on a subsequent disposition by the shareholder of his or her shares. It is possible that a substantial portion of the distributions paid during a calendar year may ultimately be classified as return of capital for U.S. federal income tax purposes when the final determination of the source and character of the distributions is made.
Such distributions, under certain circumstances, may exceed a Trust’s total return performance. When total distributions exceed total return performance for the period, the difference reduces the Trust’s total assets and net asset value per share (“NAV”) and, therefore, could have the effect of increasing the Trust’s expense ratio and reducing the amount of assets the Trust has available for long term investment.
General Information
The Trusts do not make available copies of their Statements of Additional Information because the Trusts’ shares are not continuously offered, which means that the Statement of Additional Information of each Trust has not been updated after completion of the respective Trust’s offerings and the information contained in each Trust’s Statement of Additional Information may have become outdated.
The following information is a summary of certain changes since December 31, 2020. This information may not reflect all of the changes that have occurred since you purchased the relevant Trust.
Except if noted otherwise herein, there were no changes to the Trusts’ charters or by-laws that would delay or prevent a change of control of the Trusts that were not approved by the shareholders.
In accordance with Section 23(c) of the Investment Company Act of 1940, each Trust may from time to time purchase shares of its common stock in the open market or in private transactions.
Quarterly performance, semi-annual and annual reports, current net asset value and other information regarding the Trusts may be found on BlackRock’s website, which can be accessed at blackrock.com. Any reference to BlackRock’s website in this report is intended to allow investors public access to information regarding the Trusts and does not, and is not intended to, incorporate BlackRock’s website in this report.
| 154 | 2 0 2 1 B L A C K R O C K S E M I - A N N U A L R E P O R T T O S H A R E H O L D E R S |
Additional Information (continued)
Electronic Delivery
Shareholders can sign up for e-mail notifications of quarterly statements, annual and semi-annual shareholder reports by enrolling in the electronic delivery program. Electronic copies of shareholder reports are available on BlackRock’s website.
To enroll in electronic delivery:
Shareholders Who Hold Accounts with Investment Advisers, Banks or Brokerages:
Please contact your financial adviser. Please note that not all investment advisers, banks or brokerages may offer this service.
Householding
The Trusts will mail only one copy of shareholder documents, annual and semi-annual reports, Rule 30e-3 notices and proxy statements, to shareholders with multiple accounts at the same address. This practice is commonly called “householding” and is intended to reduce expenses and eliminate duplicate mailings of shareholder documents. Mailings of your shareholder documents may be householded indefinitely unless you instruct us otherwise. If you do not want the mailing of these documents to be combined with those for other members of your household, please call the Trusts at (800) 882-0052.
Availability of Quarterly Schedule of Investments
The Trusts file their complete schedules of portfolio holdings with the SEC for the first and third quarters of each fiscal year as an exhibit to their reports on Form N-PORT. The Trusts’ Forms N-PORT are available on the SEC’s website at sec.gov. Additionally, each Trust makes its portfolio holdings for the first and third quarters of each fiscal year available at blackrock.com/fundreports.
Availability of Proxy Voting Policies, Procedures and Voting Records
A description of the policies and procedures that the Trusts use to determine how to vote proxies relating to portfolio securities and information about how the Trusts voted proxies relating to securities held in the Trusts’ portfolios during the most recent 12-month period ended June 30 is available without charge, upon request (1) by calling (800) 882-0052; (2) on the BlackRock website at blackrock.com; and (3) on the SEC’s website at sec.gov.
Availability of Trust Updates
BlackRock will update performance and certain other data for the Trusts on a monthly basis on its website in the “Closed-end Funds” section of blackrock.com as well as certain other material information as necessary from time to time. Investors and others are advised to check the website for updated performance information and the release of other material information about the Trusts. This reference to BlackRock’s website is intended to allow investors public access to information regarding the Trusts and does not, and is not intended to, incorporate BlackRock’s website in this report.
BlackRock Privacy Principles
BlackRock is committed to maintaining the privacy of its current and former fund investors and individual clients (collectively, “Clients”) and to safeguarding their non-public personal information. The following information is provided to help you understand what personal information BlackRock collects, how we protect that information and why in certain cases we share such information with select parties.
If you are located in a jurisdiction where specific laws, rules or regulations require BlackRock to provide you with additional or different privacy-related rights beyond what is set forth below, then BlackRock will comply with those specific laws, rules or regulations.
BlackRock obtains or verifies personal non-public information from and about you from different sources, including the following: (i) information we receive from you or, if applicable, your financial intermediary, on applications, forms or other documents; (ii) information about your transactions with us, our affiliates, or others; (iii) information we receive from a consumer reporting agency; and (iv) from visits to our websites.
BlackRock does not sell or disclose to non-affiliated third parties any non-public personal information about its Clients, except as permitted by law or as is necessary to respond to regulatory requests or to service Client accounts. These non-affiliated third parties are required to protect the confidentiality and security of this information and to use it only for its intended purpose.
We may share information with our affiliates to service your account or to provide you with information about other BlackRock products or services that may be of interest to you. In addition, BlackRock restricts access to non-public personal information about its Clients to those BlackRock employees with a legitimate business need for the information. BlackRock maintains physical, electronic and procedural safeguards that are designed to protect the non-public personal information of its Clients, including procedures relating to the proper storage and disposal of such information.
| A D D I T I O N A L I N F O R M A T I O N |
155 |
Additional Information (continued)
| Trust and Service Providers | ||||
|
Investment Adviser BlackRock Advisors, LLC Wilmington, DE 19809
Sub-Adviser BlackRock International Limited Edinburgh, EH3 8BL United Kingdom
BlackRock (Singapore) Limited(a) 079912 Singapore
Accounting Agent and Custodian State Street Bank and Trust Company Boston, MA 02111 |
Transfer Agent Computershare Trust Company, N.A. Canton, MA 02021
Independent Registered Public Accounting Firm Deloitte & Touche LLP Boston, MA 02116
Legal Counsel Willkie Farr & Gallagher LLP New York, NY 10019
Address of the Trusts 100 Bellevue Parkway Wilmington, DE 19809 |
| ||
| (a) For BHK. |
||||
| 156 | 2 0 2 1 B L A C K R O C K S E M I - A N N U A L R E P O R T T O S H A R E H O L D E R S |
Glossary of Terms Used in this Report
| Currency Abbreviation | ||||
| CAD | Canadian Dollar | |||
| EUR | Euro | |||
| GBP | British Pound | |||
| JPY | Japanese Yen | |||
| USD | United States Dollar | |||
| Portfolio Abbreviation | ||||
| AGM | Assured Guaranty Municipal Corp. | |||
| BAB | Build America Bond | |||
| CAB | Capital Appreciation Bonds | |||
| CLO | Collateralized Loan Obligation | |||
| CMT | Constant Maturity Treasury | |||
| CR | Custodian Receipt | |||
| DAC | Designated Activity Company | |||
| DIP | Debtor-In-Possession | |||
| ETF | Exchange-Traded Fund | |||
| EURIBOR | Euro Interbank Offered Rate | |||
| GO | General Obligation Bonds | |||
| LIBOR | London Interbank Offered Rate | |||
| MSCI | Morgan Stanley Capital International | |||
| MTN | Medium-Term Note | |||
| PCL | Public Company Limited | |||
| PIK | Payment-in-Kind | |||
| RB | Revenue Bond | |||
| REIT | Real Estate Investment Trust | |||
| S&P | Standard & Poor’s | |||
| SAB | Special Assessment Bonds | |||
| SOFR | Secured Overnight Financing Rate | |||
| SPDR | Standard & Poor’s Depository Receipt | |||
| G L O S S A R Y O F T E R M S U S E D I N T H I S R E P O R T |
157 |
Want to know more?
blackrock.com | 800-882-0052
This report is intended for current holders. It is not a prospectus. Past performance results shown in this report should not be considered a representation of future performance. Statements and other information herein are as dated and are subject to change.
TAXBOND-06/21-SAR
|
|

|
(b) Not Applicable
| Item 2 – | Code of Ethics – Not Applicable to this semi-annual report |
| Item 3 – | Audit Committee Financial Expert – Not Applicable to this semi-annual report |
| Item 4 – | Principal Accountant Fees and Services – Not Applicable to this semi-annual report |
| Item 5 – | Audit Committee of Listed Registrants – Not Applicable to this semi-annual report |
| Item 6 – | Investments |
(a) The registrant’s Schedule of Investments is included as part of the Report to Stockholders filed under Item 1(a) of this Form.
(b) Not Applicable due to no such divestments during the semi-annual period covered since the previous Form N-CSR filing.
| Item 7 – | Disclosure of Proxy Voting Policies and Procedures for Closed-End Management Investment Companies – Not Applicable to this semi-annual report |
| Item 8 – | Portfolio Managers of Closed-End Management Investment Companies |
(a) Not Applicable to this semi-annual report.
(b) As of the date of this filing, there have been no changes in any of the portfolio managers identified in the most recent annual report on Form N-CSR.
| Item 9 – | Purchases of Equity Securities by Closed-End Management Investment Company and Affiliated Purchasers — Not Applicable due to no such purchases during the period covered by this report. |
| Item 10 – | Submission of Matters to a Vote of Security Holders – There have been no material changes to these procedures. |
| Item 11 – | Controls and Procedures |
(a) The registrant’s principal executive and principal financial officers, or persons performing similar functions, have concluded that the registrant’s disclosure controls and procedures (as defined in Rule 30a-3(c) under the Investment Company Act of 1940, as amended (the “1940 Act”)) are effective as of a date within 90 days of the filing of this report based on the evaluation of these controls and procedures required by Rule 30a-3(b) under the 1940 Act and Rule 13a-15(b) under the Securities Exchange Act of 1934, as amended.
(b) There were no changes in the registrant’s internal control over financial reporting (as defined in Rule 30a-3(d) under the 1940 Act) that occurred during the period covered by this report that have materially affected, or are reasonably likely to materially affect, the registrant’s internal control over financial reporting.
| Item 12 – | Disclosure of Securities Lending Activities for Closed-End Management Investment |
Companies – Not Applicable to this semi-annual report
2
| Item 13 – | Exhibits attached hereto |
(a)(1) Code of Ethics – Not Applicable to this semi-annual report
(a)(2) Section 302 Certifications are attached
(a)(3) Not Applicable
(a)(4) Not Applicable
(b) Section 906 Certifications are attached
| 1 | The Fund has received exemptive relief from the Securities and Exchange Commission permitting it to make periodic distributions of long-term capital gains with respect to its outstanding common stock as frequently as twelve times each year, and as frequently as distributions are specified by or in accordance with the terms of its outstanding preferred stock. This relief is conditioned, in part, on an undertaking by the Fund to make the disclosures to the holders of the Fund’s common shares, in addition to the information required by Section 19(a) of the 1940 Act and Rule 19a-1 thereunder. The Fund is likewise obligated to file with the SEC the information contained in any such notice to shareholders and, in that regard, has attached hereto copies of each such notice made during the period. |
3
Pursuant to the requirements of the Securities Exchange Act of 1934 and the Investment Company Act of 1940, the registrant has duly caused this report to be signed on its behalf by the undersigned, thereunto duly authorized.
BlackRock Corporate High Yield Fund, Inc.
| By: |
/s/ John M. Perlowski | |||
| John M. Perlowski | ||||
| Chief Executive Officer (principal executive officer) of | ||||
| BlackRock Corporate High Yield Fund, Inc. |
Date: September 2, 2021
Pursuant to the requirements of the Securities Exchange Act of 1934 and the Investment Company Act of 1940, this report has been signed below by the following persons on behalf of the registrant and in the capacities and on the dates indicated.
| By: | /s/ John M. Perlowski | |||
| John M. Perlowski | ||||
| Chief Executive Officer (principal executive officer) of | ||||
| BlackRock Corporate High Yield Fund, Inc. |
Date: September 2, 2021
| By: | /s/ Trent Walker | |||
| Trent Walker | ||||
| Chief Financial Officer (principal financial officer) of | ||||
| BlackRock Corporate High Yield Fund, Inc. |
Date: September 2, 2021
4