0001185348false2021FYP3YP3YP10YP1YP1YP1YP1YP7Y00011853482021-01-012021-12-3100011853482021-06-30iso4217:USD00011853482022-02-23xbrli:shares00011853482021-12-3100011853482020-12-310001185348us-gaap:CarryingReportedAmountFairValueDisclosureMember2021-12-31iso4217:USDxbrli:shares00011853482020-01-012020-12-3100011853482019-01-012019-12-310001185348us-gaap:CommonStockMembersrt:CumulativeEffectPeriodOfAdoptionAdjustedBalanceMember2018-12-310001185348srt:CumulativeEffectPeriodOfAdoptionAdjustedBalanceMemberus-gaap:AdditionalPaidInCapitalMember2018-12-310001185348srt:CumulativeEffectPeriodOfAdoptionAdjustedBalanceMemberus-gaap:RetainedEarningsMember2018-12-310001185348us-gaap:AccumulatedOtherComprehensiveIncomeMembersrt:CumulativeEffectPeriodOfAdoptionAdjustedBalanceMember2018-12-310001185348us-gaap:NoncontrollingInterestMembersrt:CumulativeEffectPeriodOfAdoptionAdjustedBalanceMember2018-12-310001185348srt:CumulativeEffectPeriodOfAdoptionAdjustedBalanceMember2018-12-310001185348us-gaap:RetainedEarningsMember2019-01-012019-12-310001185348us-gaap:NoncontrollingInterestMember2019-01-012019-12-310001185348us-gaap:AccumulatedOtherComprehensiveIncomeMember2019-01-012019-12-310001185348us-gaap:CommonStockMember2019-01-012019-12-310001185348us-gaap:AdditionalPaidInCapitalMember2019-01-012019-12-310001185348us-gaap:CommonStockMember2019-12-310001185348us-gaap:AdditionalPaidInCapitalMember2019-12-310001185348us-gaap:RetainedEarningsMember2019-12-310001185348us-gaap:AccumulatedOtherComprehensiveIncomeMember2019-12-310001185348us-gaap:NoncontrollingInterestMember2019-12-3100011853482019-12-310001185348us-gaap:RetainedEarningsMember2020-01-012020-12-310001185348us-gaap:NoncontrollingInterestMember2020-01-012020-12-310001185348us-gaap:AccumulatedOtherComprehensiveIncomeMember2020-01-012020-12-310001185348us-gaap:CommonStockMember2020-01-012020-12-310001185348us-gaap:AdditionalPaidInCapitalMember2020-01-012020-12-310001185348us-gaap:CommonStockMember2020-12-310001185348us-gaap:AdditionalPaidInCapitalMember2020-12-310001185348us-gaap:RetainedEarningsMember2020-12-310001185348us-gaap:AccumulatedOtherComprehensiveIncomeMember2020-12-310001185348us-gaap:NoncontrollingInterestMember2020-12-310001185348srt:CumulativeEffectPeriodOfAdoptionAdjustmentMemberus-gaap:AdditionalPaidInCapitalMember2020-12-310001185348srt:CumulativeEffectPeriodOfAdoptionAdjustmentMemberus-gaap:RetainedEarningsMember2020-12-310001185348srt:CumulativeEffectPeriodOfAdoptionAdjustmentMember2020-12-310001185348us-gaap:CommonStockMembersrt:CumulativeEffectPeriodOfAdoptionAdjustedBalanceMember2020-12-310001185348srt:CumulativeEffectPeriodOfAdoptionAdjustedBalanceMemberus-gaap:AdditionalPaidInCapitalMember2020-12-310001185348srt:CumulativeEffectPeriodOfAdoptionAdjustedBalanceMemberus-gaap:RetainedEarningsMember2020-12-310001185348us-gaap:AccumulatedOtherComprehensiveIncomeMembersrt:CumulativeEffectPeriodOfAdoptionAdjustedBalanceMember2020-12-310001185348us-gaap:NoncontrollingInterestMembersrt:CumulativeEffectPeriodOfAdoptionAdjustedBalanceMember2020-12-310001185348srt:CumulativeEffectPeriodOfAdoptionAdjustedBalanceMember2020-12-310001185348us-gaap:RetainedEarningsMember2021-01-012021-12-310001185348us-gaap:NoncontrollingInterestMember2021-01-012021-12-310001185348us-gaap:AccumulatedOtherComprehensiveIncomeMember2021-01-012021-12-310001185348us-gaap:CommonStockMember2021-01-012021-12-310001185348us-gaap:AdditionalPaidInCapitalMember2021-01-012021-12-310001185348us-gaap:CommonStockMember2021-12-310001185348us-gaap:AdditionalPaidInCapitalMember2021-12-310001185348us-gaap:RetainedEarningsMember2021-12-310001185348us-gaap:AccumulatedOtherComprehensiveIncomeMember2021-12-310001185348us-gaap:NoncontrollingInterestMember2021-12-3100011853482018-12-31praa:segment0001185348country:US2021-01-012021-12-310001185348country:US2020-01-012020-12-310001185348country:US2019-01-012019-12-310001185348country:US2021-12-310001185348country:US2020-12-310001185348country:GB2021-01-012021-12-310001185348country:GB2020-01-012020-12-310001185348country:GB2019-01-012019-12-310001185348country:GB2021-12-310001185348country:GB2020-12-310001185348praa:OtherCountriesOutsideOfTheUnitedStatesAndUnitedKingdomMember2021-01-012021-12-310001185348praa:OtherCountriesOutsideOfTheUnitedStatesAndUnitedKingdomMember2020-01-012020-12-310001185348praa:OtherCountriesOutsideOfTheUnitedStatesAndUnitedKingdomMember2019-01-012019-12-310001185348praa:OtherCountriesOutsideOfTheUnitedStatesAndUnitedKingdomMember2021-12-310001185348praa:OtherCountriesOutsideOfTheUnitedStatesAndUnitedKingdomMember2020-12-310001185348srt:MinimumMemberus-gaap:ComputerEquipmentMember2021-01-012021-12-310001185348srt:MaximumMemberus-gaap:ComputerEquipmentMember2021-01-012021-12-310001185348us-gaap:FurnitureAndFixturesMembersrt:MaximumMember2021-01-012021-12-310001185348srt:MinimumMemberus-gaap:EquipmentMember2021-01-012021-12-310001185348srt:MinimumMemberus-gaap:LeaseholdImprovementsMember2021-01-012021-12-310001185348srt:MaximumMemberus-gaap:LeaseholdImprovementsMember2021-01-012021-12-310001185348srt:MinimumMemberus-gaap:BuildingImprovementsMember2021-01-012021-12-310001185348us-gaap:BuildingImprovementsMembersrt:MaximumMember2021-01-012021-12-310001185348us-gaap:AccountingStandardsUpdate202006Member2021-01-010001185348us-gaap:AccountingStandardsUpdate202006Member2021-01-012021-12-31xbrli:pure0001185348srt:MinimumMember2021-12-310001185348srt:MaximumMember2021-12-310001185348srt:MinimumMember2021-01-012021-12-310001185348srt:MaximumMember2021-01-012021-12-310001185348praa:CorePortfolioSegmentMember2020-12-310001185348praa:InsolvencyPortfolioSegmentMember2020-12-310001185348praa:CorePortfolioSegmentMember2021-01-012021-12-310001185348praa:InsolvencyPortfolioSegmentMember2021-01-012021-12-310001185348praa:CorePortfolioSegmentMember2021-12-310001185348praa:InsolvencyPortfolioSegmentMember2021-12-310001185348praa:CorePortfolioSegmentMember2019-12-310001185348praa:InsolvencyPortfolioSegmentMember2019-12-310001185348praa:CorePortfolioSegmentMember2020-01-012020-12-310001185348praa:InsolvencyPortfolioSegmentMember2020-01-012020-12-310001185348us-gaap:ExchangeTradedFundsMemberus-gaap:FairValueInputsLevel1Member2021-12-310001185348us-gaap:ExchangeTradedFundsMember2020-12-310001185348us-gaap:PrivateEquityFundsMember2021-12-310001185348us-gaap:PrivateEquityFundsMember2020-12-310001185348us-gaap:MutualFundMember2021-12-310001185348us-gaap:MutualFundMember2020-12-310001185348praa:GovernmentBondsandFixedIncomeFundsMember2021-12-310001185348praa:GovernmentBondsandFixedIncomeFundsMember2020-12-310001185348praa:RCBInvestimentosS.A.Member2021-12-310001185348us-gaap:LineOfCreditMemberpraa:AmericasRevolvingCreditFacilityMember2021-12-310001185348us-gaap:LineOfCreditMemberpraa:AmericasRevolvingCreditFacilityMember2020-12-310001185348us-gaap:LineOfCreditMemberpraa:EuropeRevolvingCreditFacilityMember2021-12-310001185348us-gaap:LineOfCreditMemberpraa:EuropeRevolvingCreditFacilityMember2020-12-310001185348us-gaap:MediumTermNotesMember2021-12-310001185348us-gaap:MediumTermNotesMember2020-12-310001185348us-gaap:SeniorNotesMember2021-12-310001185348us-gaap:CarryingReportedAmountFairValueDisclosureMember2020-12-310001185348us-gaap:SeniorNotesMember2020-12-310001185348us-gaap:ConvertibleDebtMember2021-12-310001185348us-gaap:ConvertibleDebtMember2020-12-310001185348us-gaap:RevolvingCreditFacilityMemberpraa:ColombianRevolvingCreditFacilityMember2021-12-310001185348praa:NorthAmericanCreditAgreementMember2021-12-310001185348us-gaap:LineOfCreditMemberus-gaap:LineOfCreditMember2021-12-310001185348us-gaap:RevolvingCreditFacilityMemberpraa:NorthAmericanCreditAgreementMember2021-12-310001185348praa:NorthAmericanCreditAgreementMemberpraa:CanadianRevolvingCreditFacilityMember2021-12-310001185348praa:CreditAgreementMemberus-gaap:EurodollarMember2021-01-012021-12-310001185348us-gaap:EurodollarMembersrt:MinimumMemberpraa:CreditAgreementMember2021-01-012021-12-310001185348praa:CreditAgreementMemberus-gaap:ConvertibleDebtMember2021-12-310001185348us-gaap:InterestRateFloorMember2021-01-012021-12-310001185348praa:CreditAgreementMember2021-01-012021-12-310001185348srt:MinimumMemberpraa:CreditAgreementMember2021-01-012021-12-310001185348praa:CreditAgreementMemberpraa:EligibleCoreAssetPoolMember2021-01-012021-12-310001185348praa:CreditAgreementMemberpraa:EligibleInsolventAssetPoolMember2021-01-012021-12-310001185348praa:CreditAgreementMember2021-12-310001185348us-gaap:RevolvingCreditFacilityMemberpraa:NorthAmericanCreditAgreementMemberus-gaap:LoansPayableMember2021-12-310001185348us-gaap:RevolvingCreditFacilityMemberpraa:NorthAmericanCreditAgreementMemberus-gaap:LoansPayableMember2020-12-310001185348us-gaap:RevolvingCreditFacilityMemberus-gaap:DomesticLineOfCreditMemberpraa:NorthAmericanCreditAgreementMember2021-12-310001185348us-gaap:RevolvingCreditFacilityMemberus-gaap:DomesticLineOfCreditMemberpraa:NorthAmericanCreditAgreementMember2020-12-310001185348us-gaap:RevolvingCreditFacilityMemberus-gaap:LineOfCreditMemberpraa:EuropeanRevolvingFacilityandTermLoanMember2021-03-120001185348us-gaap:RevolvingCreditFacilityMemberus-gaap:LineOfCreditMemberpraa:EuropeanRevolvingFacilityandTermLoanMember2021-12-310001185348us-gaap:RevolvingCreditFacilityMembersrt:MinimumMemberus-gaap:LineOfCreditMemberpraa:EuropeanRevolvingFacilityandTermLoanMemberpraa:InterbankOfferedRateIBORMember2021-01-012021-12-310001185348us-gaap:RevolvingCreditFacilityMemberus-gaap:LineOfCreditMembersrt:MaximumMemberpraa:EuropeanRevolvingFacilityandTermLoanMemberpraa:InterbankOfferedRateIBORMember2021-01-012021-12-310001185348us-gaap:RevolvingCreditFacilityMemberus-gaap:LineOfCreditMemberpraa:EuropeanRevolvingFacilityandTermLoanMember2021-01-012021-12-310001185348praa:OverdraftFacilityMemberpraa:EuropeanRevolvingFacilityandTermLoanMember2021-12-310001185348praa:OverdraftFacilityMemberpraa:EuropeanRevolvingFacilityandTermLoanMember2021-01-012021-12-310001185348us-gaap:RevolvingCreditFacilityMemberpraa:EuropeanRevolvingFacilityandTermLoanMember2021-12-310001185348praa:EuropeanRevolvingFacilityandTermLoanMember2021-01-012021-12-310001185348us-gaap:RevolvingCreditFacilityMemberpraa:EuropeanRevolvingFacilityandTermLoanMember2021-01-012021-12-31iso4217:SEK0001185348us-gaap:RevolvingCreditFacilityMemberpraa:EuropeanRevolvingFacilityandTermLoanMemberus-gaap:ForeignLineOfCreditMember2021-12-310001185348us-gaap:RevolvingCreditFacilityMemberpraa:EuropeanRevolvingFacilityandTermLoanMemberus-gaap:ForeignLineOfCreditMember2020-12-310001185348us-gaap:SeniorNotesMemberpraa:A2029NotesMember2021-09-220001185348praa:OnOrAfterOctober12024Memberus-gaap:SeniorNotesMemberpraa:A2029NotesMember2021-09-220001185348praa:October12024ToSeptember302026Memberus-gaap:SeniorNotesMemberpraa:A2029NotesMember2021-09-222021-09-220001185348praa:October12026AndThereafterMemberus-gaap:SeniorNotesMemberpraa:A2029NotesMember2021-09-222021-09-220001185348praa:OnOrBeforeOctober12024Memberus-gaap:SeniorNotesMemberpraa:A2029NotesMember2021-09-222021-09-220001185348praa:ChangeOfControlEventMemberpraa:OnOrBeforeOctober12024Memberus-gaap:SeniorNotesMemberpraa:A2029NotesMember2021-09-222021-09-220001185348us-gaap:SeniorNotesMemberpraa:October12024AndThereafterMemberpraa:A2029NotesMember2021-09-222021-09-220001185348praa:A2025NotesMemberus-gaap:SeniorNotesMember2020-08-270001185348praa:A2025NotesMemberpraa:OnOrAfterSeptember12022Memberus-gaap:SeniorNotesMember2020-08-272020-08-270001185348praa:A2025NotesMemberus-gaap:SeniorNotesMemberpraa:September12023ToOctober312024Member2020-08-272020-08-270001185348praa:A2025NotesMemberpraa:September12024AndThereafterMemberus-gaap:SeniorNotesMember2020-08-272020-08-270001185348praa:A2025NotesMemberpraa:OnOrBeforeSeptember12022Memberus-gaap:SeniorNotesMember2020-08-272020-08-270001185348praa:ChangeOfControlEventMemberpraa:A2025NotesMemberpraa:OnOrBeforeSeptember12022Memberus-gaap:SeniorNotesMember2020-08-272020-08-270001185348us-gaap:ConvertibleDebtMemberpraa:NoteDue2023Member2017-05-260001185348us-gaap:ConvertibleDebtMemberpraa:NoteDue2023Member2017-05-262017-05-26praa:day0001185348us-gaap:ConvertibleDebtMemberpraa:NoteDue2023Member2021-12-310001185348us-gaap:ConvertibleDebtMember2021-01-012021-12-310001185348us-gaap:ConvertibleDebtMember2020-01-012020-12-310001185348us-gaap:ConvertibleDebtMember2019-01-012019-12-310001185348praa:NoteDue2020Memberus-gaap:ConvertibleDebtMember2020-12-310001185348us-gaap:EstimateOfFairValueFairValueDisclosureMember2021-12-310001185348us-gaap:EstimateOfFairValueFairValueDisclosureMember2020-12-310001185348us-gaap:FairValueInputsLevel1Member2021-12-310001185348us-gaap:FairValueInputsLevel2Member2021-12-310001185348us-gaap:FairValueInputsLevel3Member2021-12-310001185348us-gaap:FairValueInputsLevel2Memberus-gaap:ExchangeTradedFundsMember2021-12-310001185348us-gaap:ExchangeTradedFundsMemberus-gaap:FairValueInputsLevel3Member2021-12-310001185348us-gaap:ExchangeTradedFundsMember2021-12-310001185348us-gaap:MutualFundMemberus-gaap:FairValueInputsLevel1Member2021-12-310001185348us-gaap:MutualFundMemberus-gaap:FairValueInputsLevel2Member2021-12-310001185348us-gaap:MutualFundMemberus-gaap:FairValueInputsLevel3Member2021-12-310001185348us-gaap:FairValueInputsLevel1Member2020-12-310001185348us-gaap:FairValueInputsLevel2Member2020-12-310001185348us-gaap:FairValueInputsLevel3Member2020-12-310001185348us-gaap:FairValueInputsLevel2Memberus-gaap:ExchangeTradedFundsMember2020-12-310001185348us-gaap:ExchangeTradedFundsMemberus-gaap:FairValueInputsLevel3Member2020-12-310001185348us-gaap:MutualFundMemberus-gaap:FairValueInputsLevel1Member2020-12-310001185348us-gaap:MutualFundMemberus-gaap:FairValueInputsLevel2Member2020-12-310001185348us-gaap:MutualFundMemberus-gaap:FairValueInputsLevel3Member2020-12-310001185348us-gaap:PrivateEquityFundsMembersrt:MinimumMember2021-01-012021-12-310001185348us-gaap:PrivateEquityFundsMembersrt:MaximumMember2021-01-012021-12-310001185348us-gaap:InterestRateContractMemberus-gaap:DesignatedAsHedgingInstrumentMemberus-gaap:OtherAssetsMember2021-12-310001185348us-gaap:InterestRateContractMemberus-gaap:DesignatedAsHedgingInstrumentMemberus-gaap:OtherAssetsMember2020-12-310001185348us-gaap:InterestRateContractMemberus-gaap:DesignatedAsHedgingInstrumentMemberus-gaap:OtherLiabilitiesMember2021-12-310001185348us-gaap:InterestRateContractMemberus-gaap:DesignatedAsHedgingInstrumentMemberus-gaap:OtherLiabilitiesMember2020-12-310001185348us-gaap:ForeignExchangeContractMemberus-gaap:OtherAssetsMemberus-gaap:NondesignatedMember2021-12-310001185348us-gaap:ForeignExchangeContractMemberus-gaap:OtherAssetsMemberus-gaap:NondesignatedMember2020-12-310001185348us-gaap:ForeignExchangeContractMemberus-gaap:OtherLiabilitiesMemberus-gaap:NondesignatedMember2021-12-310001185348us-gaap:ForeignExchangeContractMemberus-gaap:OtherLiabilitiesMemberus-gaap:NondesignatedMember2020-12-310001185348us-gaap:InterestRateContractMemberus-gaap:DesignatedAsHedgingInstrumentMember2021-12-310001185348us-gaap:InterestRateContractMemberus-gaap:DesignatedAsHedgingInstrumentMember2020-12-310001185348srt:MinimumMemberus-gaap:CashFlowHedgingMemberus-gaap:DesignatedAsHedgingInstrumentMember2021-01-012021-12-310001185348us-gaap:CashFlowHedgingMemberus-gaap:DesignatedAsHedgingInstrumentMembersrt:MaximumMember2021-01-012021-12-310001185348us-gaap:InterestRateContractMember2021-01-012021-12-310001185348us-gaap:InterestRateContractMember2020-01-012020-12-310001185348us-gaap:InterestRateContractMember2019-01-012019-12-310001185348us-gaap:InterestRateContractMemberus-gaap:InterestExpenseMember2021-01-012021-12-310001185348us-gaap:InterestRateContractMemberus-gaap:InterestExpenseMember2020-01-012020-12-310001185348us-gaap:InterestRateContractMemberus-gaap:InterestExpenseMember2019-01-012019-12-310001185348us-gaap:ForeignExchangeContractMemberus-gaap:NondesignatedMember2021-12-310001185348us-gaap:ForeignExchangeContractMemberus-gaap:NondesignatedMember2020-12-310001185348us-gaap:ForeignCurrencyGainLossMemberus-gaap:ForeignExchangeContractMember2021-01-012021-12-310001185348us-gaap:ForeignCurrencyGainLossMemberus-gaap:ForeignExchangeContractMember2020-01-012020-12-310001185348us-gaap:ForeignCurrencyGainLossMemberus-gaap:ForeignExchangeContractMember2019-01-012019-12-310001185348us-gaap:ForeignExchangeContractMemberus-gaap:InterestExpenseMember2021-01-012021-12-310001185348us-gaap:ForeignExchangeContractMemberus-gaap:InterestExpenseMember2020-01-012020-12-310001185348us-gaap:ForeignExchangeContractMemberus-gaap:InterestExpenseMember2019-01-012019-12-310001185348us-gaap:AccumulatedGainLossCashFlowHedgeIncludingNoncontrollingInterestMemberus-gaap:ReclassificationOutOfAccumulatedOtherComprehensiveIncomeMember2021-01-012021-12-310001185348us-gaap:AccumulatedGainLossCashFlowHedgeIncludingNoncontrollingInterestMemberus-gaap:ReclassificationOutOfAccumulatedOtherComprehensiveIncomeMember2020-01-012020-12-310001185348us-gaap:AccumulatedNetInvestmentGainLossIncludingPortionAttributableToNoncontrollingInterestMember2018-12-310001185348us-gaap:AccumulatedGainLossCashFlowHedgeIncludingNoncontrollingInterestMember2018-12-310001185348us-gaap:AccumulatedForeignCurrencyAdjustmentIncludingPortionAttributableToNoncontrollingInterestMember2018-12-310001185348us-gaap:AccumulatedOtherComprehensiveIncomeMember2018-12-310001185348us-gaap:AccumulatedNetInvestmentGainLossIncludingPortionAttributableToNoncontrollingInterestMember2019-01-012019-12-310001185348us-gaap:AccumulatedGainLossCashFlowHedgeIncludingNoncontrollingInterestMember2019-01-012019-12-310001185348us-gaap:AccumulatedForeignCurrencyAdjustmentIncludingPortionAttributableToNoncontrollingInterestMember2019-01-012019-12-310001185348us-gaap:AccumulatedNetInvestmentGainLossIncludingPortionAttributableToNoncontrollingInterestMember2019-12-310001185348us-gaap:AccumulatedGainLossCashFlowHedgeIncludingNoncontrollingInterestMember2019-12-310001185348us-gaap:AccumulatedForeignCurrencyAdjustmentIncludingPortionAttributableToNoncontrollingInterestMember2019-12-310001185348us-gaap:AccumulatedNetInvestmentGainLossIncludingPortionAttributableToNoncontrollingInterestMember2020-01-012020-12-310001185348us-gaap:AccumulatedGainLossCashFlowHedgeIncludingNoncontrollingInterestMember2020-01-012020-12-310001185348us-gaap:AccumulatedForeignCurrencyAdjustmentIncludingPortionAttributableToNoncontrollingInterestMember2020-01-012020-12-310001185348us-gaap:AccumulatedNetInvestmentGainLossIncludingPortionAttributableToNoncontrollingInterestMember2020-12-310001185348us-gaap:AccumulatedGainLossCashFlowHedgeIncludingNoncontrollingInterestMember2020-12-310001185348us-gaap:AccumulatedForeignCurrencyAdjustmentIncludingPortionAttributableToNoncontrollingInterestMember2020-12-310001185348us-gaap:AccumulatedNetInvestmentGainLossIncludingPortionAttributableToNoncontrollingInterestMember2021-01-012021-12-310001185348us-gaap:AccumulatedGainLossCashFlowHedgeIncludingNoncontrollingInterestMember2021-01-012021-12-310001185348us-gaap:AccumulatedForeignCurrencyAdjustmentIncludingPortionAttributableToNoncontrollingInterestMember2021-01-012021-12-310001185348us-gaap:AccumulatedNetInvestmentGainLossIncludingPortionAttributableToNoncontrollingInterestMember2021-12-310001185348us-gaap:AccumulatedGainLossCashFlowHedgeIncludingNoncontrollingInterestMember2021-12-310001185348us-gaap:AccumulatedForeignCurrencyAdjustmentIncludingPortionAttributableToNoncontrollingInterestMember2021-12-310001185348praa:NonvestedAwardsMember2021-12-310001185348praa:NonvestedAwardsMember2021-01-012021-12-310001185348srt:MinimumMemberpraa:NonvestedAwardsMember2021-01-012021-12-310001185348srt:MaximumMemberpraa:NonvestedAwardsMember2021-01-012021-12-310001185348praa:LongTermIncentiveProgramsMember2018-12-310001185348praa:LongTermIncentiveProgramsMember2019-01-012019-12-310001185348praa:LongTermIncentiveProgramsMember2019-12-310001185348praa:LongTermIncentiveProgramsMember2020-01-012020-12-310001185348praa:LongTermIncentiveProgramsMember2020-12-310001185348praa:LongTermIncentiveProgramsMember2021-01-012021-12-310001185348praa:LongTermIncentiveProgramsMember2021-12-3100011853482021-07-2900011853482021-10-2800011853482018-01-012018-12-310001185348us-gaap:ForeignCountryMember2021-12-310001185348us-gaap:ForeignCountryMember2020-12-310001185348srt:MinimumMemberus-gaap:ForeignCountryMember2021-01-012021-12-310001185348us-gaap:ForeignCountryMembersrt:MaximumMember2021-01-012021-12-310001185348us-gaap:SubsequentEventMemberpraa:PriorRepurchaseProgramMember2022-02-250001185348us-gaap:SubsequentEventMemberpraa:NewRepurchaseProgramMember2022-02-25
UNITED STATES SECURITIES AND EXCHANGE COMMISSION
FORM 10-K
☒ Annual Report Pursuant to Section 13 or 15(d) of the Securities Exchange Act of 1934
For the fiscal year ended December 31, 2021
☐ Transition Report pursuant to Section 13 or 15(d) of the Securities Exchange Act of 1934
For the transition period from ________ to ________
Commission File Number: 000-50058 PRA Group, Inc.
(Exact name of registrant as specified in its charter) | | | | | | | | | | | | | | |
| Delaware | | | | 75-3078675 |
| (State or other jurisdiction of incorporation or organization) | | | | (I.R.S. Employer Identification No.) |
120 Corporate Boulevard, Norfolk, Virginia 23502
(888) 772-7326
(Address of principal executive offices, zip code, telephone number)
Securities registered pursuant to Section 12(b) of the Act: | | | | | | | | |
| Title of each class | Trading Symbol(s) | Name of each exchange on which registered |
| Common Stock, $0.01 par value per share | PRAA | NASDAQ Global Select Market |
Securities registered pursuant to Section 12(g) of the Act: None
Indicate by check mark if the registrant is a well-known seasoned issuer, as defined in Rule 405 of the Securities Act. Yes ☑ No ☐
Indicate by check mark if the registrant is not required to file reports pursuant to Section 13 or Section 15 (d) of the Act. Yes ☐ No ☑
Indicate by check mark whether the registrant (1) has filed all reports required to be filed by Section 13 or 15(d) of the Securities Exchange Act of 1934 during the preceding 12 months (or for such shorter period that the registrant was required to file such reports), and (2) has been subject to such filing requirements for the past 90 days. Yes ☑ No ☐
Indicate by check mark whether the registrant has submitted electronically every Interactive Data File required to be submitted pursuant to Rule 405 of Regulation S-T during the preceding 12 months (or for such shorter period that the registrant was required to submit such files). Yes ☑ No ☐
Indicate by check mark whether the registrant is a large accelerated filer, an accelerated filer, a non-accelerated filer, smaller reporting company or emerging growth company. See the definitions of "large accelerated filer", "accelerated filer", "smaller reporting company" and "emerging growth company" in Rule 12b-2 of the Exchange Act. (Check one): Large accelerated filer ☑ Accelerated filer ☐ Non-accelerated filer ☐ Smaller reporting company ☐ Emerging growth company ☐
If an emerging growth company, indicate by check mark if the registrant has elected not to use the extended transition period for complying with any new or revised financial accounting standards provided pursuant to Section 13(a) of the Exchange Act. ☐
Indicate by check mark whether the registrant is a shell company (as defined in Rule 12b-2 of the Exchange Act). Yes ☐ No ☑
Indicate by check mark whether the registrant has filed a report on and attestation to its management’s assessment of the effectiveness of its internal control over financial reporting under Section 404(b) of the Sarbanes-Oxley Act (15 U.S.C. 7262(b)) by the registered public accounting firm that prepared or issued its audit report. ☑
The aggregate market value of the common stock held by non-affiliates of the registrant as of June 30, 2021 was $1,730,201,484 based on the $38.47 closing price as reported on the NASDAQ Global Select Market.
The number of shares of the registrant's Common Stock outstanding as of February 23, 2022 was 40,685,522.
Documents incorporated by reference
Portions of the Registrant's definitive Proxy Statement for its 2022 Annual Meeting of Stockholders are incorporated by reference into Part III of this Form 10-K.
| | | | | | | | |
| | |
| Item 1. | | |
| Item 1A. | | |
| Item 1B. | | |
| Item 2. | | |
| Item 3. | | |
| Item 4. | | |
| | |
| | |
| Item 5. | | |
| Item 6. | | |
| Item 7. | | |
| Item 7A. | | |
| Item 8. | | |
| | |
| | |
| | |
| | |
| | |
| | |
| | |
| | |
| | |
| | |
| | |
| | |
| | |
| | |
| | |
| | |
| | |
| | |
| | |
| | |
| | |
| | |
| | |
| | |
| Item 9. | | |
| Item 9A. | | |
| Item 9B. | | |
| Item 9C. | | |
| | |
| | |
| | |
| | |
| | |
|
| | |
| Item 10. | | |
| continued |
| | | | | | | | |
| Item 11. | | |
| Item 12. | | |
| Item 13. | | |
| | |
| Item 14. | | |
| | |
| | |
| Item 15. | | |
| Item 16. | | |
| | |
| Signatures | | |
All references in this Annual Report on Form 10-K ("Form 10-K") to "PRA Group," "our," "we," "us," the "Company" or similar terms are to PRA Group, Inc. and its subsidiaries.
Forward-Looking Statements:
This report contains forward-looking statements as defined by the Private Securities Litigation Reform Act of 1995. Statements other than statements of historical fact are forward-looking statements, including statements regarding overall cash collection trends, operating cost trends, liquidity and capital needs and other statements of expectations, beliefs, future plans, strategies and anticipated events or trends. Our results could differ materially from those expressed or implied by such forward-looking statements, or our forward-looking statements could be wrong, as a result of risks, uncertainties and assumptions including the following:
•the impact of the novel coronavirus ("COVID-19") pandemic on the markets in which we operate, including business disruptions, unemployment, economic disruption, overall market volatility and the inability or unwillingness of consumers to pay the amounts owed to us;
•our inability to successfully manage the challenges associated with a disease outbreak, including epidemics, pandemics or similar widespread public health concerns, including the COVID-19 pandemic;
•a deterioration in the economic or inflationary environment in the markets in which we operate;
•our inability to replace our portfolios of nonperforming loans with additional portfolios sufficient to operate efficiently and profitably and/or purchase nonperforming loans at appropriate prices;
•our inability to collect sufficient amounts on our nonperforming loans to fund our operations, including as a result of restrictions imposed by local, state, federal and international laws and regulations;
•changes in accounting standards and their interpretations;
•the recognition of significant decreases in our estimate of future recoveries on nonperforming loans;
•the occurrence of goodwill impairment charges;
•loss contingency accruals that are inadequate to cover actual losses;
•our inability to manage risks associated with our international operations;
•changes in local, state, federal or international laws or the interpretation of these laws, including tax, bankruptcy and collection laws;
•changes in the administrative practices of various bankruptcy courts;
•our inability to comply with existing and new regulations of the collection industry;
•investigations, reviews, or enforcement actions by governmental authorities, including the Consumer Financial Protection Bureau ("CFPB");
•our inability to comply with data privacy regulations such as the General Data Protection Regulation ("GDPR");
•adverse outcomes in pending litigation or administrative proceedings;
•our inability to retain, expand, renegotiate or replace our credit facilities and our inability to comply with the covenants under our financing arrangements;
•our inability to manage effectively our capital and liquidity needs, including as a result of changes in credit or capital markets;
•changes in interest or exchange rates;
•default by or failure of one or more of our counterparty financial institutions;
•uncertainty about the transition from the London Inter-Bank Offer Rate ("LIBOR");
•disruptions of business operations caused by cybersecurity incidents or the underperformance or failure of information technology infrastructure, networks or communication systems; and
•the "Risk Factors" in Item 1A of this Form 10-K and in our other filings with the Securities and Exchange Commission ("SEC"). You should assume that the information appearing in this Form 10-K is accurate only as of the date it was issued. Our business, financial condition, results of operations and prospects may have changed since that date. The future events, developments or results described in, or implied by, this Form 10-K could turn out to be materially different. Except as required by law, we assume no obligation to publicly update or revise our forward-looking statements after the date of this Form 10-K and you should not expect us to do so.
PART I
Item 1. Business.
General
PRA Group Inc. is a global financial and business services company with operations in the Americas, Europe and Australia.
Our primary business is the purchase, collection and management of portfolios of nonperforming loans. The accounts we purchase are primarily the unpaid obligations of individuals owed to credit originators, which include banks and other types of consumer, retail and auto finance companies. We purchase portfolios of nonperforming loans at a discount in two broad categories: Core and Insolvency. Our Core operation specializes in purchasing and collecting nonperforming loans, which we purchased since either the credit originators and/or other third-party collection agencies have been unsuccessful in collecting the full balance owed. Our Insolvency operation consists primarily of purchasing and collecting on nonperforming loan accounts where the customer is involved in a bankruptcy proceeding or the equivalent in some European countries. We also provide fee-based services on class action claims recoveries and by servicing consumer bankruptcy accounts in the United States ("U.S.").
As part of our strategic plans, we have expanded through various acquisitions and organic growth. In 2014, we acquired Aktiv Kapital AS, a Norway-based company specializing in the purchase, collection and management of portfolios of nonperforming loans throughout Europe and Canada. In 2015, we expanded into South America by acquiring 55% of the equity interest in RCB Investimentos S.A. ("RCB"), a servicing platform for nonperforming loans and established a business that purchases nonperforming loans in Brazil. Our subsequent sale of 79% of our interest in RCB to Banco Bradesco S.A. completed in 2019, had no impact on the nonperforming loan purchasing business we established. In 2016, we acquired DTP S.A., a Polish-based debt collection company, furthering our in-house collection efforts in Poland. In 2020, we began operations in Australia, leveraging an entity we established in 2011.
We have one reportable segment based on similarities among the operating segments, including the nature of the products and services, the nature of the production processes, the types or classes of customers for our products and services, the methods used to distribute our products and services and the nature of the regulatory environment.
For discussion of COVID-19, refer to Item 7 "Management's Discussion and Analysis of Financial Condition and Results of Operations" of this Form 10-K. Nonperforming Loan Portfolio Acquisitions
To identify purchasing opportunities, we maintain an extensive marketing effort with our senior officers contacting known and prospective sellers of nonperforming loans. From these sellers, we have acquired a variety of nonperforming loans including Visa® and MasterCard® credit cards, private label and other credit cards, installment loans, lines of credit, deficiency balances of various types, legal judgments and trade payables. Sellers of nonperforming loans include major banks, credit unions, consumer finance companies, retailers, utilities, automobile finance companies and other credit originators. The price at which we purchase portfolios depends on the age of the portfolio, whether it is a Core or Insolvency portfolio, geographic region, the seller's selection criteria, our historical experience with a certain asset type or credit originator and other similar factors.
We purchase portfolios of nonperforming loans from credit originators through auctions and negotiated sales. In an auction process, the seller will assemble a portfolio of nonperforming loans and will seek purchase prices from specifically invited bidders. In a privately negotiated sale process, the credit originator will contact one or more purchasers directly, receive a bid and negotiate the terms of sale. In either case, typically, invited purchasers will have already successfully completed a qualification process that can include the seller's review of any or all of the following: the purchaser's experience, reputation, financial standing, operating procedures, business practices and compliance oversight.
We purchase portfolios of nonperforming loans through either single portfolio transactions, referred to as spot sales, or through the pre-arranged purchase of multiple portfolios over time, referred to as forward flow sales. Under a forward flow contract, we agree to purchase statistically similar nonperforming loan portfolios from credit originators on a periodic basis, at a negotiated price over a specified time period, typically from three to 12 months.
Nonperforming Loan Portfolio Collection Operations
Call Center Operations
In higher volume markets, our collection efforts leverage internally staffed call centers. In some newer markets or in markets that have less consistent debt purchasing patterns, most notably outside the U.S., we may utilize external vendors to do some of this work. Whether the accounts are being worked internally or externally, we utilize our proprietary analysis to proportionally direct work efforts to those customers most likely to pay. The analysis driving those decisions relies on models and variables that have the highest correlation to profitable collections from call activity.
Legal Recovery - Core Portfolios
An important component of our collections effort involves our legal recovery operations and the judicial collection of balances from customers who, in general, we believe have the ability, but not the willingness, to resolve their obligations. There are some markets in which the collection process follows a prescribed, time-sensitive and sequential set of legal actions, but in the majority of instances, we use models and analysis to select those accounts reflecting a high propensity to pay in a legal environment. Depending on the characteristics of the account and the applicable local collection laws, we determine whether to commence legal action to judicially collect on the account. The legal process can take an extended period of time and can be costly, but when accounts are selected properly, it usually generates net cash collections that likely would not have been realized otherwise. We use a combination of internal staff (attorney and support) and external staff to pursue legal collections under certain circumstances, as we deem appropriate.
Insolvency Operations
Accounts that are in an insolvent or bankrupt status are managed by our insolvency operations team. These accounts fall under insolvency plans ranging from Individual Voluntary Arrangements ("IVAs") and Trust Deeds in the United Kingdom ("UK"), to Consumer Proposals in Canada, to various forms of bankruptcy plans in the U.S., Canada, Germany and the UK. We file claims or claim transfers securing our creditor rights in plans, and actively manage these accounts through the entire life cycle of the insolvency proceeding to ensure that we participate in any distributions to creditors. The accounts we manage are derived from two sources: (1) our purchased portfolios of insolvent nonperforming loans and (2) our Core purchased portfolios of nonperforming loans where our customers filed for protection under the insolvency or bankruptcy laws after being purchased by us. We purchase these types of accounts in the U.S., Canada, Germany and the UK.
These accounts are filed under the relevant country's insolvency or bankruptcy codes and may have an associated payment plan that generally ranges from three to seven years in duration. Accounts which are purchased while insolvent can be purchased at any stage in the insolvency or bankruptcy plan life cycle. Portfolios sold close to the filing of the insolvency or bankruptcy plan may take months to generate cash flow; however, aged portfolios sold years after the filing of the insolvency or bankruptcy plan will typically generate cash flows immediately.
Digital
As a complement to our collection operations, we have developed digital capabilities to support our collection efforts. We have developed these platforms in all of our operating markets that provide for inbound collections, as well as outbound collections where the regulatory environment allows us to operate in such a manner.
Equity Investments
We have an 11.7% equity interest in RCB, a servicing platform of nonperforming loans in Brazil.
Fee-Based Services
In addition to the purchase, collection and management of portfolios of nonperforming loans, we provide fee-based services including class action claims recovery purchasing and servicing through Claims Compensation Bureau, LLC ("CCB") and third-party servicing of bankruptcy accounts in the U.S.
Seasonality
Although the years ended December 31, 2021 and 2020 deviated from usual seasonal patterns due to the impact of COVID-19, as discussed under "COVID-19" in Item 7 of this Form 10-K, typically cash collections in the Americas tend to be higher in the first half of the year due to the high volume of income tax refunds received by individuals in the U.S., and trend lower as the year progresses. Customer payment patterns in all of the countries in which we operate can be affected by seasonal employment trends, income tax refunds and holiday spending habits.
Competition
Competition is derived from both third-party contingent fee collection agencies and purchasers of debt that manage their own nonperforming loans or outsource such servicing. Regulatory complexity and burdens, combined with seller preference for experienced portfolio purchasers, create significant barriers to successful entry for new competitors particularly in the U.S. While both remain competitive, the contingent fee industry is more fragmented than the purchased portfolio industry.
We compete in our purchase of nonperforming loans on the basis of price, reputation, industry experience and performance. We believe that our competitive strengths include our disciplined and proprietary underwriting process, the extensive data set we have developed since our founding in 1996, our ability to bid on portfolios at appropriate prices, our capital position, our reputation from previous portfolio purchase transactions, our ability to close transactions in a timely fashion, our strong relationships with credit originators, our team of well-trained collectors who provide quality customer service while complying with applicable collection laws and our ability to efficiently and effectively collect on various asset types.
Government Regulation
We are subject to a variety of federal, state, local and international laws that establish specific guidelines and procedures that debt collectors must follow when collecting customer accounts, including laws relating to the collection, use, retention, security and transfer of personal information. It is our policy to comply with applicable federal, state, local and international laws in all our activities. To promote compliance with applicable laws and regulations, we provide extensive training upon hire and additional training at least annually. We also continuously monitor and evaluate our collectors in order to provide meaningful and prompt feedback. Our compliance management system and related controls that are embedded in business processes are also tested regularly by our compliance and internal audit departments to foster compliance with laws, regulations and internal policy.
Our failure to comply with these laws could result in enforcement action against us, the payment of significant fines and penalties, restrictions upon our operations or our inability to recover amounts owed to us. Significant laws and regulations applicable to our business include the following:
•Fair Debt Collection Practices Act ("FDCPA"), which imposes certain obligations and restrictions on the practices of debt collectors, including specific restrictions regarding the time, place and manner of the communications.
•Fair Credit Reporting Act ("FCRA"), which obligates credit information providers to verify the accuracy of information provided to credit reporting agencies and investigate consumer disputes concerning the accuracy of such information.
•Gramm-Leach-Bliley Act, which requires that certain financial institutions, including collection agencies, develop policies to protect the privacy of consumers' private financial information and provide notices to consumers advising them of their privacy policies.
•Electronic Funds Transfer Act, which regulates electronic fund transfer transactions, including a consumer’s right to stop payments on a pre-approved fund transfer and right to receive certain documentation of the transaction.
•Telephone Consumer Protection Act ("TCPA"), which, along with similar state laws, places certain restrictions on users of certain automated dialing equipment and pre-recorded messages that place telephone calls to consumers.
•Servicemembers Civil Relief Act ("SCRA"), which gives U.S. military service personnel relief from credit obligations they may have incurred prior to entering military service and may also apply in certain circumstances to obligations and liabilities incurred by a servicemember while serving on active duty.
•Health Insurance Portability and Accountability Act, which provides standards to protect the confidentiality of patients' personal healthcare and financial information in the U.S.
•U.S. Bankruptcy Code, which prohibits certain contacts with consumers after the filing of bankruptcy petitions and dictates what types of claims will or will not be allowed in a bankruptcy proceeding including how such claims may be discharged.
•Americans with Disabilities Act, which requires that telecommunications companies operating in the U.S. take steps to ensure functionally equivalent services are available for their consumers with disabilities, and requires accommodation of consumers with disabilities, such as the implementation of telecommunications relay services.
•U.S. Foreign Corrupt Practices Act ("FCPA"), United Kingdom Bribery Act ("UK Bribery Act") and Similar Laws. Our operations outside the U.S. are subject to various U.S. and international laws and regulations, such as the FCPA and the UK Bribery Act, which prohibit corrupt payments to governmental officials and certain other individuals. The FCPA prohibits U.S. companies and their agents and employees from providing anything of value to a foreign official
for the purposes of influencing any act or decision of these individuals in order to obtain an unfair advantage or help obtain or retain business. Although similar to the FCPA, the UK Bribery Act is broader in scope and covers bribes given to or received by any person with improper intent.
•Dodd-Frank Wall Street Reform and Consumer Protection Act (the "Dodd-Frank Act"), which restructured the regulation and supervision of the financial services industry in the U.S. and created the CFPB. The CFPB has rulemaking, supervisory, and enforcement authority over larger consumer debt collectors. The Dodd-Frank Act, along with the Unfair, Deceptive, or Abusive Acts or Practices ("UDAAP") provisions included therein, and the Federal Trade Commission Act, prohibit unfair, deceptive, and/or abusive acts and practices.
•International data protection and privacy laws, which include relevant country specific legislation in the UK and other European countries where we operate that regulate the processing of information relating to individuals, including the obtaining, holding, use or disclosure of such information; the Personal Information Protection and Electronic Documents Act, which aims to protect personal information that is collected, used or disclosed in certain circumstances for purposes of electronic commerce in Canada; and the GDPR, which regulates the processing and free movement of personal data within the European Union ("EU") and transfer of such data outside the EU.
•Consumer Credit Act 1974 (and its related regulations), Unfair Terms in Consumer Contracts Regulations of 1999 and the Financial Conduct Authority's consumer credit conduct of business rules, which apply to our UK operations and govern consumer credit agreements.
In addition, certain of our EU subsidiaries are subject to capital adequacy, liquidity and other requirements imposed by regulators, such as the Swedish Financial Supervisory Authority.
Human Capital
As of December 31, 2021, we employed 3,446 full-time equivalents globally across 18 countries, with approximately 74% of our workforce distributed across the Americas and Australia and 26% in Europe. Our employees share a common set of values and commitments that define how we treat each other, how we relate to our customers and the responsibilities we have to shareholders, regulators, clients and others. We refer to this shared set of values as C.A.R.E.S, which stands for Committed, Accountable, Respectful, Ethical and Successful. These values are intended to foster a high performing workforce and sense of belonging by working together to build an equitable and inclusive culture where employees can be themselves, to be their best.
In support of these values we offer comprehensive total rewards programs, competitive pay and bonus structures, health and wellness benefits, retirement plans and an employee assistance program. Additionally, we offer tuition reimbursement assistance and have a robust suite of training and development offerings for employees across the globe, many available in multiple languages.
Management considers our employee relations to be good. While none of our North American employees are represented by a union or covered by a collective bargaining agreement, in Europe we work closely with a number of works councils, and in countries where it is the customary local practice, such as Finland and Spain, we have collective bargaining agreements.
Available Information
We make available on or through our website, www.pragroup.com, certain reports that we file with or furnish to the SEC in accordance with the Securities Exchange Act of 1934, as amended (the "Exchange Act"). These include our Annual Reports on Form 10-K, our Quarterly Reports on Form 10-Q, our Current Reports on Form 8-K and amendments to those reports filed or furnished pursuant to Section 13(a) or 15(d) of the Exchange Act ("SEC Filings"). We make this information available on our website free of charge as soon as reasonably practicable after we electronically file the information with, or furnish it to, the SEC. The SEC maintains a website that contains reports, proxy and information statements and other information regarding issuers that file electronically with the SEC at: www.sec.gov.
The information contained on, or that can be accessed through our website, is not, and shall not be deemed to be a part of this Form 10-K or incorporated into any of our other SEC Filings.
Reports filed with, or furnished to, the SEC are also available free of charge upon request by contacting our corporate office at:
PRA Group, Inc.
Attn: Investor Relations
120 Corporate Boulevard, Suite 100
Norfolk, Virginia 23502
Item 1A. Risk Factors.
You should carefully read the following discussion of material factors, events and uncertainties when evaluating our business and the forward-looking information contained in this Form 10-K. The events and consequences discussed in these risk factors could materially and adversely affect our business, operating results, liquidity and financial condition. While we believe we have identified and discussed below the material risk factors affecting our business, these risk factors do not identify all the risks we face, and there may be additional risks and uncertainties that we do not presently know or that we do not currently believe to be material that may have an adverse effect on our business, performance or financial condition in the future.
Operational and Industry Risks
The continuation of the COVID-19 pandemic could have an adverse effect on our business, results of operations and financial results.
We cannot predict the extent to which the continuing COVID-19 pandemic, including the evolution of its variants, will impact our business, results of operations and financial results due to numerous evolving factors such as the extent to which available vaccines will be effective against variants of COVID-19. However, the continuation or worsening of the COVID-19 pandemic could adversely affect our business, results of operations and financial results if:
•the negative impacts to the economic and inflationary environment resulting from the pandemic worsen or continue throughout 2022;
•political, legal and regulatory actions and policies in response to the pandemic prevent us from performing our collection activities or result in material increases in our costs to comply with such laws and regulations;
•consumers respond to ongoing developments from the COVID-19 pandemic by failing to pay amounts owed to us as a result of factors that impact their ability to make payments;
•we are unable to maintain staffing levels necessary to operate our business due to the continued spread of COVID-19 and its variants causing employees to be unable or unwilling to work;
•we are unable to collect on existing nonperforming loans or experience material decreases in our cash collections;
•we are unable to purchase nonperforming loans needed to operate our business because credit originators become unable or unwilling to sell their nonperforming loans consistent with historical levels; or
•we suffer a cybersecurity incident as a result of increased vulnerability while a larger number of our employees work remotely.
A deterioration in the economic or inflationary environment in the countries in which we operate could have an adverse effect on our business and results of operations.
Our performance may be adversely affected by economic, political or inflationary conditions in any market in which we operate. These conditions could include regulatory developments, changes in global or domestic economic policy, legislative changes, and any sovereign debt crises experienced in several European countries. Deterioration in economic conditions, or a significant rise in inflation could cause personal bankruptcy and insolvency filings to increase, and the ability of consumers to pay their debts could be adversely affected. This may in turn adversely impact our business and financial results.
If global credit market conditions and the stability of global banks deteriorate, the amount of consumer or commercial lending and financing could be reduced, thus reducing the volume of nonperforming loans available for purchase, which could adversely affect our business, financial results and ability to succeed in international markets.
Other economic factors that could influence our performance include the financial stability of the lenders on our credit facilities and our access to capital and credit. For example, deterioration in the financial markets, including as a result of the COVID-19 pandemic, could contribute to the insolvency of lending institutions, notably those providing our credit facilities, or the tightening of credit markets, which could make it difficult or impossible for us to obtain credit on favorable terms. These and other economic factors could have an adverse effect on our financial condition and results of operations.
We may not be able to continually replace our nonperforming loans with additional portfolios sufficient to operate efficiently and profitably, and/or we may not be able to purchase nonperforming loans at appropriate prices.
To operate profitably, we must purchase and service a sufficient amount of nonperforming loans to generate revenue that exceeds our expenses. Costs such as salaries and other compensation expense constitute a significant portion of our overhead and, if we do not replace the nonperforming loan portfolios we service with additional portfolios, we may have to reduce the
number of our collection personnel. We would then, have to rehire collection staff if we subsequently obtain additional portfolios. These practices could lead to negative consequences including the following:
•low employee morale;
•fewer experienced employees;
•higher training costs;
•disruptions in our operations;
•loss of efficiency; and
•excess costs associated with unused space in our facilities.
The availability of nonperforming loan portfolios at prices that generate an appropriate return on our investment depends on a number of factors, including the following:
•the continuation of high levels of consumer debt obligations;
•sales of nonperforming loan portfolios by credit originators; and
•competitive factors affecting potential purchasers and credit originators of nonperforming loans.
Furthermore, heightened regulation of the credit card and consumer lending industry or changing credit origination strategies may result in decreased availability of credit to consumers, potentially leading to a future reduction in nonperforming loans available for purchase from credit originators. We cannot predict how our ability to identify and purchase nonperforming loans and the quality of those nonperforming loans would be affected if there were a shift in lending practices, whether caused by changes in the regulations or accounting practices applicable to credit originators or purchasers, a sustained economic downturn or otherwise.
Moreover, there can be no assurance that credit originators will continue to sell their nonperforming loans consistent with historical levels or at all, or that we will be able to bid competitively for those portfolios. Because of the length of time involved in collecting on acquired portfolios and the variability in the timing of our collections, we may not be able to identify trends and make changes in our purchasing strategies in a timely manner. If we are unable to maintain our business or adapt to changing market needs as well as our current or future competitors, we may experience reduced access to nonperforming loan portfolios at appropriate prices and, therefore, reduced profitability.
We may not be able to collect sufficient amounts on our nonperforming loans to fund our operations.
Our principal business consists of purchasing and collecting nonperforming loans that consumers or others have failed to pay. The credit originators have typically made numerous attempts to recover on their accounts, often using a combination of in-house recovery efforts and third-party collection agencies. These nonperforming loans are difficult to collect, and we may not collect a sufficient amount to cover our investment and the costs of running our business.
Our collections may decrease if certain types of insolvency proceedings and bankruptcy filings involving liquidations increase.
Various economic trends and potential changes to existing legislation may contribute to an increase in the amount of personal bankruptcy and insolvency filings. Under certain of these filings, a debtor's assets may be sold to repay creditors, but because most of the accounts we collect through our collections operations are unsecured, we typically would not be able to collect on those accounts. Although our insolvency collections business could benefit from an increase in personal bankruptcies and insolvencies, we cannot ensure that our collections operations business would not decline with an increase in personal insolvencies or bankruptcy filings or changes in related regulations or practices. If our actual collection experience with respect to a nonperforming or insolvent bankrupt accounts are significantly lower than the total amount we projected when we acquired the portfolio, our financial condition and results of operations could be adversely impacted.
Goodwill impairment charges could negatively impact our net income and stockholders' equity.
We have recorded a significant amount of goodwill as a result of our business acquisitions. Goodwill is not amortized, but is tested for impairment at the reporting unit level. Goodwill is required to be tested for impairment annually and between annual tests if events or circumstances indicate that it is more likely than not that the fair value of a reporting unit is less than its carrying amount. There are numerous risks that may cause the fair value of a reporting unit to fall below its carrying amount, which could lead to the recognition of a goodwill impairment charge. These risks include:
•adverse changes in macroeconomic conditions, the business climate, or the market for the entity's products or services;
•significant variances between actual and expected financial results;
•negative or declining cash flows;
•lowered expectations of future results;
•failure to realize anticipated synergies from acquisitions;
•significant expense increases;
•a more likely-than-not expectation of selling or disposing all, or a portion of, a reporting unit;
•the loss of key personnel;
•an adverse action or assessment by a regulator;
•significant increase in discount rates; or
•a sustained decrease in the price per share of our common stock.
Our goodwill impairment testing involves the use of estimates and the exercise of judgment, including judgments regarding expected future business performance and market conditions. Significant changes in our assessment of such factors, including the deterioration of market conditions, could affect our assessment of the fair value of one or more of our reporting units and could result in a goodwill impairment charge in a future period.
Our loss contingency accruals may not be adequate to cover actual losses.
We are involved in judicial, regulatory and arbitration proceedings or investigations concerning matters arising from our business activities. We establish accruals for potential liability arising from legal proceedings when it is probable that such liability has been incurred and the amount of the loss can be reasonably estimated. However, there can be no assurance as to the ultimate outcome. We may still incur legal costs for a matter even if we have not accrued a liability. In addition, actual losses may be higher than the amount accrued for a certain matter, or in the aggregate. An unfavorable resolution of a legal proceeding or claim could adversely impact our business, financial condition, results of operations, or liquidity. For more information, refer to the "Litigation and Regulatory Matters" section of Note 14 to our Consolidated Financial Statements included in Item 8 of this Form 10-K. International Operations Risks
Our international operations expose us to risks which could harm our business, results of operations and financial condition.
A significant portion of our operations is conducted outside the U.S. This could expose us to adverse economic, industry and political conditions that may have a negative impact on our ability to manage our existing operations or pursue alternative strategic transactions, which could have a negative effect on our business, results of operations and financial condition.
The global nature of our operations expands the risks and uncertainties described elsewhere in this section, including the following:
•changes in local political, economic, social and labor conditions in the markets in which we operate;
•foreign exchange controls on currency conversion and the transfer of funds that might prevent us from repatriating cash earned in countries outside the U.S. in a tax-efficient manner;
•currency exchange rate fluctuations, currency restructurings, inflation or deflation and our ability to manage these fluctuations through a foreign exchange risk management program;
•different employee/employer relationships, laws and regulations, union recognition and the existence of employment tribunals and works councils;
•laws and regulations imposed by international governments, including those governing data security, sharing and transfer;
•potentially adverse tax consequences resulting from changes in tax laws in the jurisdictions in which we operate or challenges to our interpretations and application of complex international tax laws;
•logistical, communications and other challenges caused by distance and cultural and language differences, each making it harder to do business in certain jurisdictions;
•volatility of global credit markets and the availability of consumer credit and financing in our international markets;
•uncertainty as to the enforceability of contract rights under local laws;
•the potential of forced nationalization of certain industries, or the impact on creditors' rights, consumer disposable income levels, flexibility and availability of consumer credit and the ability to enforce and collect aged or charged-off debts stemming from international governmental actions, whether through austerity or stimulus measures or initiatives,
intended to control or influence macroeconomic factors such as wages, unemployment, national output or consumption, inflation, investment, credit, finance, taxation or other economic drivers;
•the presence of varying levels of business corruption in international markets and the effect of various anti-corruption and other laws on our international operations;
•the impact on our day-to-day operations and our ability to staff our international operations given our changing labor conditions and long-term trends towards higher wages in developed and emerging international markets as well as the potential impact of union organizing efforts;
•potential damage to our reputation due to non-compliance with international and local laws; and
•the complexity and necessity of using non-U.S. representatives, consultants and other third-party vendors.
Any one of these factors could adversely affect our business, results of operations and financial condition.
Compliance with complex and evolving international and U.S. laws and regulations that apply to our international operations could increase our cost of doing business in international jurisdictions.
We operate on a global basis with offices and activities in a number of jurisdictions throughout the Americas, Europe and Australia. We face increased exposure to risks inherent in conducting business internationally, including compliance with complex international and U.S. laws and regulations that apply to our international operations, which could increase our cost of doing business in international jurisdictions. These laws and regulations include those related to taxation and anti-corruption laws such as the FCPA and the UK Bribery Act. Given the complexity of these laws, there is a risk that we may inadvertently breach certain provisions of these laws, such as through the negligent behavior of an employee or our failure to comply with certain formal documentation requirements. Violations of these laws and regulations by us, any of our employees or our third-party vendors, either inadvertently or intentionally, could result in fines and penalties, criminal sanctions, restrictions on our operations and ability to offer our products and services in one or more countries. Violations of these laws could also adversely affect our business, brand, international expansion efforts, ability to attract and retain employees and results of operations.
Additionally, new or pending international regulations, such as the EU Directive (2021/2167) on Credit Servicers and Credit Purchasers and the Financial Conduct Authority’s Consumer Duty proposals, could adversely affect our operations in Europe once they are effective and require implementation.
Legal and Regulatory Risks
Our ability to collect and enforce our nonperforming loans may be limited under federal, state and international laws, regulations and policies.
Our operations are subject to licensing and regulation by governmental and regulatory bodies in the many jurisdictions in which we operate. U.S. federal and state laws, and the laws and regulations of the international countries in which we operate, may limit our ability to collect on and enforce our rights with respect to our nonperforming loans regardless of any act or omission on our part. Some laws and regulations applicable to credit issuers may preclude us from collecting on nonperforming loans we acquire if the credit issuer previously failed to comply with applicable laws in generating or servicing those accounts. Collection laws and regulations also directly apply to our business. Such laws and regulations are extensive and subject to change. A variety of state, federal and international laws and regulations govern the collection, use, retention, transmission, sharing and security of consumer data. Consumer protection and privacy protection laws, changes in the ways that existing rules or laws are interpreted or enforced and any procedures that may be implemented as a result of regulatory consent orders may adversely affect our ability to collect on our nonperforming loans and adversely affect our business. Our failure to comply with laws or regulations applicable to us could limit our ability to collect on our nonperforming loans, which could reduce our profitability and adversely affect our business.
Failure to comply with government regulation of the collections industry could result in penalties, fines, litigation, damage to our reputation or the suspension or termination of our ability to conduct our business.
The collections industry throughout the markets in which we operate is governed by various laws and regulations, many of which require us to be a licensed debt collector. Our industry is also at times investigated by regulators and offices of state attorneys general, and subpoenas and other requests or demands for information may be issued by governmental authorities who are investigating debt collection activities. These investigations may result in enforcement actions, fines and penalties, or the assertion of private claims and lawsuits. If any such investigations result in findings that we or our vendors have failed to comply with applicable laws and regulations, we could be subject to penalties, litigation losses and expenses, damage to our reputation, or the suspension or termination of, or required modification to, our ability to conduct collections, which would adversely affect our business, results of operations and financial condition.
In a number of jurisdictions, we must maintain licenses to purchase or own debt, and/or to perform debt recovery services and must satisfy related bonding requirements. Our failure to comply with existing licensing requirements, changing interpretations of existing requirements, or adoption of new licensing requirements, could restrict our ability to collect in certain jurisdictions, subject us to increased regulation, increase our costs or adversely affect our ability to purchase, own and/or collect our nonperforming loans.
Some laws, among other things, also may limit the interest rate and the fees that a credit originator may impose on our consumers, limit the time in which we may file legal actions to enforce consumer accounts and require specific account information for certain collection activities. In addition, local requirements and court rulings in various jurisdictions may affect our ability to collect.
Regulations and statutes applicable to our industry further provide that, in some cases, consumers cannot be held liable for, or their liability may be limited with respect to, charges to their debit or credit card accounts that resulted from unauthorized use of their credit. These laws, among others, may limit our ability to recover amounts owing with respect to the nonperforming loans, whether or not we committed any wrongful act or omission in connection with the account.
If we fail to comply with any applicable laws and regulations discussed above, such failure could result in penalties, litigation losses and expenses, damage to our reputation, or otherwise impact our ability to conduct collections efforts, which could adversely affect our business, results of operations and financial condition.
Investigations, reviews or enforcement actions by governmental authorities may result in changes to our business practices; negatively impact our nonperforming loan portfolio acquisition volume; make collection of nonperforming loans more difficult; or expose us to the risk of fines, penalties, restitution payments and litigation.
Our debt collection activities and business practices are subject to review from time to time by various governmental authorities and regulators, including the CFPB, which may commence investigations, reviews or enforcement actions targeted at businesses in the financial services industry. These investigations or reviews may involve individual consumer complaints or our debt collection policies and practices generally. Such investigations or reviews could lead to assertions by governmental authorities that we are not complying with applicable laws or regulations. In such circumstances, authorities may request or seek to impose a range of remedies that could involve potential compensatory or punitive damage claims, fines, restitution payments, sanctions or injunctive relief, that if agreed to or granted, could require us to make payments or incur other expenditures that could have an adverse effect on our financial position. The CFPB has the authority to obtain cease and desist orders (which can include orders for restitution or rescission of contracts, as well as other kinds of affirmative relief), recover costs, and impose monetary penalties (ranging from $5,000 per day to over $1 million per day, depending on the nature and gravity of the violation). In addition, where a company has violated Title X of the Dodd-Frank Act or CFPB regulations implemented thereunder, the Dodd-Frank Act empowers state attorneys general and other state regulators to bring civil actions to remedy violations under state law. Governmental authorities could also request or seek to require us to cease certain practices or institute new practices. Negative publicity relating to investigations or proceedings brought by governmental authorities could have an adverse impact on our reputation, harm our ability to conduct business with industry participants, and result in financial institutions reducing or eliminating sales of nonperforming loan portfolios to us which would harm our business and negatively impact our results of operations. Moreover, changing or modifying our internal policies or procedures, responding to governmental inquiries and investigations and defending lawsuits or other proceedings could require significant efforts on the part of management and result in increased costs to our business. In addition, such efforts could divert management's full attention from our business operations. All of these factors could have an adverse effect on our business, results of operations and financial condition.
The CFPB has issued civil investigative demands ("CIDs") to many companies that it regulates, including PRA Group, and periodically examines practices regarding the collection of consumer debt. As previously reported in our Current Report on Form 8-K filed on September 9, 2015, Portfolio Associates, LLC ("PRA"), our wholly owned subsidiary, entered into a consent order with the CFPB effective September 9, 2015 settling a previously disclosed investigation of certain debt collection practices of PRA (the "Consent Order"). As further discussed in the "Litigation and Regulatory Matters" section of Note 14 to our Consolidated Financial Statements included in Item 8 of this Form 10-K, we are in discussions with the CFPB regarding CIDs and requests for information issued by the CFPB to us related to our compliance with the Consent Order and applicable law. Although we believe we have implemented the requirements of the Consent Order, there can be no assurance that additional litigation or new industry regulations currently under consideration by the CFPB would not have an adverse effect on our business, results of operations and financial condition.
The regulation of data privacy in the U.S and globally could have an adverse effect on our business, results of operations and financial condition by increasing our compliance costs.
The regulation of data privacy, including interpretations and determinations by regulatory authorities in the U.S. and in the countries in which we operate, continues to evolve. It is not possible to predict the effect of such rigorous data protection regulations over time. For example, GDPR impacts our European operations and required us to adapt our business practices accordingly. Financial penalties for noncompliance with the GDPR can be significant. It is also the case that the U.S. federal government and states within the U.S. have enacted or are considering legislation to enact data privacy protections. Data privacy regulations could result in increased costs of conducting business to maintain compliance with such regulations. Although we take significant steps to protect the security of our data and the personal data of our customers, we may be required to expend significant resources to comply with regulations if third parties improperly obtain and use such data.
Changes in tax provisions or exposures to additional tax liabilities could have an adverse tax effect on our financial condition.
We record reserves for uncertain tax positions based on our assessment of the probability of successfully sustaining tax filing positions. Management exercises significant judgment when assessing the probability of successfully sustaining tax filing positions, in determining whether a tax liability should be recorded and, if so, estimating that amount. Our tax filings are subject to audit by domestic and international tax authorities. If our tax filing positions are successfully challenged, payments could be required that are in excess of reserved amounts or we may be required to reduce the carrying amount of our net deferred tax asset, either of which could be significant to our financial condition or results of operations. Although we believe our estimates are reasonable, the ultimate tax outcome may differ from the amounts recorded in our financial statements and may adversely or beneficially affect our financial results in the period(s) for which such determination is made.
Financial and Liquidity Risks
We expect to use leverage in executing our business strategy, which may adversely affect the return on our assets.
We may incur a substantial amount of debt in the future. Our existing indebtedness is recourse to us, and we anticipate that future indebtedness will likewise be recourse. As of December 31, 2021, we had total consolidated indebtedness of approximately $2.6 billion, all of which, except for $345.0 million outstanding principal amount of our 3.50% Convertible Notes due 2023 (the "2023 Notes"), $300.0 million outstanding principal amount of our 7.375% Senior Notes due 2025 (the "2025 Notes"), and $350.0 million outstanding principal amount of our 5.00% Senior Notes due 2029 (the "2029 Notes" and together with the 2025 Notes, the "Senior Notes"), was secured indebtedness. In addition, as of December 31, 2021, we had total committed revolving borrowing capacity of $1.3 billion available under our credit facilities, all of which if borrowed would be secured indebtedness. Considering borrowing base restrictions and other covenants, the amount available to be borrowed under our credit facilities would have been $624.7 million as of December 31, 2021. Our management team will consider a number of factors when evaluating our level of indebtedness and when making decisions regarding the incurrence of any new indebtedness, including the purchase price of assets to be acquired with debt financing, the estimated market value of our assets and the ability of particular assets and the Company as a whole, to generate cash flow to cover the expected debt service.
Incurring a substantial amount of debt could have important consequences for our business, including:
•making it more difficult for us to satisfy our obligations with respect to our debt, to our trade or other creditors;
•increasing our vulnerability to adverse economic or industry conditions;
•limiting our ability to obtain additional financing to fund capital expenditures and acquisitions, particularly when the availability of financing in the capital markets is constrained;
•requiring a substantial portion of our cash flows from operations and reducing our ability to use our cash flows to fund working capital, capital expenditures, acquisitions and general corporate requirements;
•increasing the amount of interest expense because most of the indebtedness under our credit facilities bear interest at floating rates, which, if interest rates increase, will result in higher interest expense;
•limiting our flexibility in planning for, or reacting to, changes in our business and the industry in which we operate; and
•placing us at a competitive disadvantage to less leveraged competitors.
We cannot assure you that our business will generate sufficient cash flow from operations or that future borrowings will be available to us through capital markets financings, under credit facilities or otherwise, in an amount sufficient to enable us to repay our indebtedness, repurchase our 2023 Notes upon a fundamental change or settle conversions in cash, repurchase our Senior Notes upon a change of control or fund our other liquidity needs. We may need to refinance all or a portion of our
indebtedness, at or before its scheduled maturity. We cannot assure you that we will be able to refinance any of our indebtedness on commercially reasonable terms or at all. In addition, we may incur additional indebtedness in order to finance our operations or to repay existing indebtedness. If we cannot service our indebtedness, we may have to take actions such as selling assets, seeking additional debt or equity or reducing or delaying capital expenditures, strategic acquisitions, investments and alliances. We cannot assure you that any such actions, if necessary, could be effected on commercially reasonable terms or at all, or on terms that would be advantageous to our stockholders or on terms that would not require us to breach the terms and conditions of our existing or future debt agreements. Our ability to access additional future borrowings could be negatively impacted as a result of the impact of the COVID-19 pandemic on the global debt and capital markets.
We may not be able to generate sufficient cash flow to meet our debt service obligations.
Our ability to generate sufficient cash flow from operations to make scheduled payments on our debt obligations will depend on our current and future financial performance, which is subject to general economic, financial, competitive, legislative, regulatory and other factors that are beyond our control. In the future, we may fail to generate sufficient cash flow from the collection of nonperforming loans to meet our cash requirements. Further, our capital requirements may vary materially from those currently planned if, for example, our revenues do not reach expected levels, we have to incur unforeseen expenses, we invest in acquisitions or make other investments that we believe will benefit our competitive position. If we do not generate sufficient cash flow from operations to satisfy our debt obligations, including interest payments and the payment of principal at maturity, we may have to undertake alternative financing plans, such as refinancing or restructuring our debt, selling assets or seeking to raise additional capital. We cannot provide assurance that any refinancing would be possible, that any assets could be sold, or, if sold, of the timeliness and amount of proceeds realized from those sales, that additional financing could be obtained on acceptable terms, if at all, or that additional financing would be permitted under the terms of our various debt instruments then in effect. Furthermore, our ability to refinance would depend upon the condition of the finance and credit markets. Our inability to generate sufficient cash flow to satisfy our debt obligations, or to refinance our obligations on commercially reasonable terms or on a timely basis, would materially affect our business, financial condition or results of operations and may delay or prevent the expansion of our business.
The agreements governing our indebtedness include provisions that may restrict our financial and business operations.
Our credit facilities and the indentures that govern our 2023 Notes and our Senior Notes contain financial and other restrictive covenants, including restrictions on how we operate our business and our ability to pay dividends to our stockholders. These restrictions may interfere with our ability to engage in other necessary or desirable business activities, which could materially affect our business, financial condition or results of operations.
Failure to satisfy any one of these covenants could result in negative consequences, including the following:
•acceleration of outstanding indebtedness;
•exercise by our lenders of rights with respect to the collateral pledged under certain of our outstanding indebtedness;
•our inability to continue to purchase nonperforming loans needed to operate our business; or
•our inability to secure alternative financing on favorable terms, if at all.
Uncertainty about the transition from LIBOR may adversely affect our business.
LIBOR is used extensively in the U.S. and globally as a "benchmark" or "reference rate" for various types of investments, including derivatives contracts and adjustable-rate loans. Historically, these investments paid an interest rate based on, or their performance was otherwise tied to, LIBOR on the assumption that LIBOR’s fluctuating rate would be published regularly. However, the Financial Conduct Authority ceased publishing most LIBOR rates effective January 1, 2022 with an extension to June 30, 2023 for the remaining LIBOR rates. Although alternative reference rates have been proposed to replace LIBOR, market adoption of these rates varies across products, services and contracts, potentially leading to market fragmentation, reduced liquidity in the market and increased operational complexity. As a result, we have developed a plan to transition from LIBOR for applicable borrowings and derivative hedging agreements. Our borrowings and the operation of our derivative hedging agreements could be adversely impacted if our current plans for the transition from LIBOR are not effective or if the alternative reference rates we will rely on do not behave as expected.
Cybersecurity and Technology Risks
A cybersecurity incident could disrupt our operations, compromise or corrupt our confidential information or damage our reputation, all of which could negatively impact our business and financial results.
Our business is highly dependent on our ability to process and monitor a large number of transactions across markets and in multiple currencies. As we expand geographically, maintaining the security of our information technology systems and infrastructure becomes more significant and challenging. The three primary risks we face from a cybersecurity incident are operational disruption, the exposure of private data including, customer information, our employees' personally identifiable information, or proprietary business information such as underwriting and collections methodologies and reputational damage. As our reliance on technology has increased, so have the risks posed to our systems, some of which are internal, some hosted in the cloud and others we have outsourced.
Although we take preventive steps, including patching our systems and infrastructure, monitoring and blocking malicious traffic with intrusion and detection prevention systems, monitoring firewalls to safeguard critical business applications, conducting regular external and internal security penetrations testing and supervising third party providers that have access to our systems, our computer systems, software and network, may still be vulnerable to unauthorized access, computer viruses or other malicious code, and other events that could have a security impact. To date, interruptions of our systems and infrastructure resulting from cybersecurity incidents have been infrequent and have not had a material impact on operations. However, these measures, as well as our organization's increased awareness of our risk of a cybersecurity incident, do not guarantee that our business, reputation or financial results will not be impacted in a material adverse manner by such an incident. Should such a cybersecurity incident occur, we may be required to expend significant additional resources to notify affected consumers, modify our protective measures or to investigate and remediate vulnerabilities or other exposures. Additionally, we may be subject to fines, penalties, litigation costs and settlements and financial losses that may not be fully covered by our cybersecurity insurance.
The underperformance or failure of our information technology infrastructure, networks or communication systems could result in loss in productivity, loss of competitive advantage and business disruption.
We depend on effective information and communication systems to operate our business. We have also acquired and expect to acquire additional systems as a result of business acquisitions. Significant resources are required to maintain or enhance our existing information and telephone systems and to replace obsolete systems. Although we periodically upgrade, streamline, and integrate our systems and have invested in strategies to prevent a failure, our systems are susceptible to outages due to natural disasters, power loss, computer viruses, security breaches, hardware or software vulnerabilities, disruptions, and similar events. Failure to adequately implement or maintain effective and efficient information systems with sufficiently advanced technological capabilities, or our failure to efficiently and effectively consolidate our information systems to eliminate redundant or obsolete applications, could cause us to lose our competitive advantage, divert management’s time, result in a loss of productivity or disrupt business operations, which could have a material adverse effect on our business, financial condition and results of operations.
Item 1B. Unresolved Staff Comments.
None.
Item 2. Properties.
Our corporate headquarters and primary domestic operations facilities are located in Norfolk, Virginia. In addition, at December 31, 2021, we had 15 operational centers in the Americas and Australia (12 leased and three owned), and 11 in Europe (all leased).
Item 3. Legal Proceedings.
We and our subsidiaries are from time to time subject to a variety of routine legal and regulatory claims, inquiries and proceedings, most of which are incidental to the ordinary course of our business. We initiate lawsuits against customers and are occasionally countersued by them in such actions. Also, customers, either individually, as members of a class action, or through a governmental entity on behalf of customers, may initiate litigation against us in which they allege that we have violated a state or federal law in the process of collecting on an account. From time to time, other types of lawsuits are brought against us.
Refer to Note 14 to our Consolidated Financial Statements included in Item 8 of this Form 10-K for information regarding legal proceedings in which we are involved. Item 4. Mine Safety Disclosures.
Not applicable.
PART II
Item 5. Market for Registrant's Common Equity, Related Stockholder Matters and Issuer Purchases of Equity Securities.
Common Stock
Our common stock is traded on Nasdaq Global Select Market under the symbol "PRAA." Based on information provided by our transfer agent and registrar, as of February 21, 2021, there were 46 holders of record.
Stock Performance
The following graph and subsequent table compare from December 31, 2016 to December 31, 2021, the cumulative stockholder returns assuming an initial investment of $100 in our common stock (PRAA), the stocks comprising the Nasdaq Financial 100 (IXF) and the stocks comprising the Nasdaq Global Market Composite Index (NQGM) at the beginning of the period. Any dividends paid during the five-year period are assumed to be reinvested.
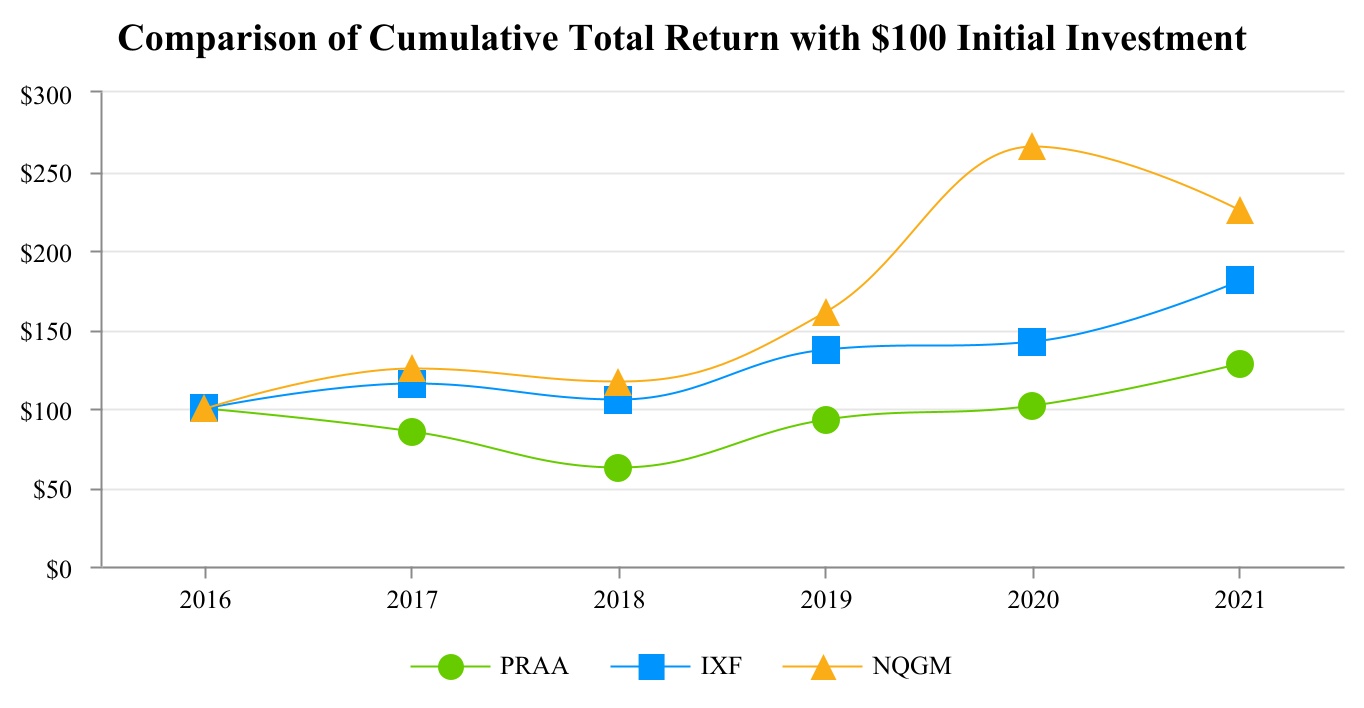
| | | | | | | | | | | | | | | | | | | | | | | | | | | | | | | | | | | | | | | | | |
| Ticker | | 2016 | | 2017 | | 2018 | | 2019 | | 2020 | | 2021 |
| PRA Group, Inc. | PRAA | | $ | 100 | | | $ | 85 | | | $ | 62 | | | $ | 93 | | | $ | 101 | | | $ | 128 | |
| Nasdaq Financial 100 | IXF | | $ | 100 | | | $ | 115 | | | $ | 106 | | | $ | 137 | | | $ | 142 | | | $ | 181 | |
| Nasdaq Global Market Composite Index | NQGM | | $ | 100 | | | $ | 125 | | | $ | 117 | | | $ | 161 | | | $ | 265 | | | $ | 225 | |
Prepared by Zacks Investment Research, Inc. Used with permission. All rights reserved. Copyright 1980-2022. Index Data: Copyright NASDAQ OMX, Inc. Used with permission. All rights reserved.
The comparisons of stock performance shown above are not intended to forecast or be indicative of possible future performance of our common stock. We do not make or endorse any predictions as to our future stock performance.
Dividend Policy
Our Board of Directors sets our dividend policy. We do not currently pay regular dividends on our common stock and did not pay dividends in the three years ended December 31, 2021; however, our Board of Directors may determine in the future to declare or pay dividends on our common stock. Our credit facilities and the indentures that govern our 2023 Notes, 2025 Notes and 2029 Notes contain financial and other restrictive covenants, including restrictions on how we operate our business and our ability to pay dividends to our stockholders. Any future determination as to the declaration and payment of dividends will be at the discretion of our Board of Directors and will depend on conditions then existing, including our results of operations, financial condition, contractual restrictions, capital requirements, business prospects and other factors that our Board of Directors may consider relevant.
Recent Sales of Unregistered Securities
None.
Securities Authorized for Issuance Under Equity Compensation Plans
For information regarding securities authorized for issuance under equity compensation plans see Note 11 to our Consolidated Financial Statements included in Item 8 of this Form 10-K. Share Repurchase Programs
On July 29, 2021, our Board of Directors approved a share repurchase program under which we are authorized to repurchase up to $150.0 million of our outstanding common stock. On October 28, 2021, the Board of Directors approved an increase of $80.0 million to the existing share repurchase program for a total of $230.0 million. For more information, see Item 7 "Management's Discussion and Analysis of Financial Condition and Results of Operations - Liquidity and Capital Resources" of this Form 10-K. The following table provides information about the Company's common stock purchased during the fourth quarter of the year ended December 31, 2021.
| | | | | | | | | | | | | | | | | | | | | | | | | | |
| | Total Number of Shares Purchased | | Average Price Paid per Share | | Total Number of Shares Purchased as Part of Publicly Announced Programs | | Maximum Remaining Purchase Price for Share Repurchases Under the Program (1) |
| Period | | | | |
| October 1, 2021 to October 31, 2021 | | 427,103 | | | $ | 42.56 | | | 427,103 | | | $ | 137,977 | |
| November 1,2021 to November 30, 2021 | | 710,100 | | | 43.67 | | | 710,100 | | | 106,969 | |
| December 1, 2021 to December 31, 2021 | | 1,907,236 | | | 47.10 | | | 1,907,236 | | | 17,132 | |
| Total | | 3,044,439 | | | $ | 45.66 | | | 3,044,439 | | | $ | 17,132 | |
(1) Dollars in thousands.Item 6. [Reserved]
Item 7. Management's Discussion and Analysis of Financial Condition and Results of Operations.
Objective
This discussion is from the perspective of management and is intended to help the reader understand our financial condition, cash flows and other changes in financial condition and results of operations. It should be read in conjunction with the financial statements and notes thereto included in Part II, Item 8 of this Form 10-K. Additionally, this discussion includes material events and uncertainties known to management that are reasonably likely to cause reported financial information not to be indicative of our future operating results or of our future financial condition. Overview
We are a global financial and business services company with operations in the Americas, Europe and Australia. Our primary business is the purchase, collection and management of portfolios of nonperforming loans.
COVID-19
Since March 2020, we have been, and continue to be, impacted by the COVID-19 pandemic and its variants in all countries in which we operate. The on-going effects of COVID-19, continue to be difficult to predict due to various uncertainties including transmissibility, new variants, severity and duration. The global spread of COVID-19 continues to disrupt normal business operations and has had a negative impact on the economy and contributed to an inflationary environment.
In an effort to control the spread of COVID-19, the countries in which we operate continue to consider governmental, legal and regulatory actions as well as health and safety measures. We continue to monitor the impact on our business, operations and financial results and have taken steps to mitigate adverse effects wherever possible. These steps include communicating with regulators and government officials concerning legislation and regulations, enabling employees to work remotely and implementing social distancing in the workplaces that remain open.
Specific impacts on our business, results of operations and financial condition included:
•a continued increase in cash collections, which we believe to be acceleration of future payments. In the second half of 2021, we started to see cash collections return to more normalized levels; and
•a continued decrease in portfolio purchases in the U.S due to lower levels of bankruptcy filings and charge-offs.
Funds generated from operations, cash collections on nonperforming loan portfolios, existing cash, available borrowings under our revolving credit facilities, the addition of our Senior Notes and access to the capital markets have been sufficient to finance our operations, planned capital expenditures, forward flow purchase commitments, debt maturities and portfolio purchases during the pandemic. We continue to monitor the need to expand our access to credit to fund the aforementioned business activities.
Our analysis of the current and future impact of the COVID-19 pandemic on our operations is based on management’s constant monitoring of key data and information, including (1) changes in laws, regulations and governmental actions, (2) trends in the macroeconomic environment, consumer behavior and key operational metrics such as cash collections and (3) conditions in the nonperforming loan market. However, we cannot predict the full extent to which the COVID-19 pandemic will impact our business, results of operations and financial condition due to the numerous evolving factors associated with the pandemic. See the "Risk Factors" in Item 1A of this Form 10-K. Frequently Used Terms
We may use the following terminology throughout this Form 10-K:
•"Buybacks" refers to purchase price refunded by the seller due to the return of ineligible accounts.
•"Cash collections" refers to collections on our nonperforming loan portfolios.
•"Cash receipts" refers to cash collections on our nonperforming loan portfolios plus fee income.
•"Change in expected recoveries" refers to the differences of actual recoveries received when compared to expected recoveries and the net present value of changes in estimated remaining collections.
•"Core" accounts or portfolios refer to accounts or portfolios that are nonperforming loans and are not in an insolvent status upon acquisition. These accounts are aggregated separately from insolvency accounts.
•"Estimated remaining collections" or "ERC" refers to the sum of all future projected cash collections on our nonperforming loan portfolios.
•"Finance receivables" or "receivables" refers to the negative allowance for expected recoveries recorded on our balance sheet as an asset.
•"Insolvency" accounts or portfolios refer to accounts or portfolios of nonperforming loans that are in an insolvent status when we purchase them and as such are purchased as a pool of insolvent accounts. These accounts include IVAs, Trust Deeds in the UK, Consumer Proposals in Canada and bankruptcy accounts in the U.S., Canada, Germany and the UK.
•"Negative Allowance" refers to the present value of cash flows expected to be collected on our finance receivables.
•"Portfolio acquisitions" refers to all nonperforming loan portfolios acquired as a result of a purchase, but also includes portfolios added as a result of a business acquisition.
•"Portfolio purchases" refers to all nonperforming loan portfolios purchased in the normal course of business and excludes those added as a result of business acquisitions.
•"Portfolio income" reflects revenue recorded due to the passage of time using the effective interest rate calculated based on the purchase price of nonperforming loan portfolios and estimated remaining collections.
•"Purchase price" refers to the cash paid to a seller to acquire nonperforming loans.
•"Purchase price multiple" refers to the total estimated collections (as defined below) on our nonperforming loan portfolios divided by purchase price.
•"Recoveries" refers to cash collections plus buybacks and other adjustments.
•"Total estimated collections" or "TEC" refers to actual cash collections plus estimated remaining collections on our nonperforming loan portfolios.
Unless otherwise specified, references to 2021, 2020 and 2019 are for the years ended December 31, 2021, December 31, 2020 and December 31, 2019, respectively.
Results of Operations
The results of operations include the financial results of the Company and all of our subsidiaries. As of January 1, 2020 we adopted Accounting Standards Codification ("ASC") Topic 326 "Financial Instruments-Credit Losses" ("ASC 326") on a prospective basis. Prior period amounts were accounted for under ASC Topic 310-30 "Loans and Debt Securities Acquired with Deteriorated Credit Quality. The following table sets forth Consolidated Income Statement amounts as a percentage of total revenues for the periods indicated (dollars in thousands):
| | | | | | | | | | | | | | | | | | | | | | | | | | | | | | | | | | | |
| 2021 | | 2020 | | 2019 |
| Revenues: | | | | | | | | | | | |
| Portfolio income | $ | 875,327 | | | 79.9 | % | | $ | 984,036 | | | 92.4 | % | | $ | — | | | — | % |
| Changes in expected recoveries | 197,904 | | | 18.1 | | | 69,297 | | | 6.5 | | | — | | | — | |
| Total portfolio revenue | 1,073,231 | | | 98.0 | | | 1,053,333 | | | 98.9 | | | — | | | — | |
| Income recognized on finance receivables | — | | | — | | | — | | | — | | | 998,361 | | | 98.2 | |
| Fee income | 14,699 | | | 1.3 | | | 9,748 | | | 0.9 | | | 15,769 | | | 1.5 | |
| Other revenue | 7,802 | | | 0.7 | | | 2,333 | | | 0.2 | | | 2,951 | | | 0.3 | |
| Total revenues | 1,095,732 | | | 100.0 | | | 1,065,414 | | | 100.0 | | | 1,017,081 | | | 100.0 | |
| | | | | | | | | | | |
| Net allowance charges | — | | | — | | | — | | | — | | | (24,025) | | | (2.4) | |
| | | | | | | | | | | |
| Operating expenses: | | | | | | | | | | | |
| Compensation and employee services | 301,981 | | | 27.6 | | | 295,150 | | | 27.7 | | | 310,441 | | | 30.5 | |
| Legal collection fees | 47,206 | | | 4.3 | | | 53,758 | | | 5.1 | | | 55,261 | | | 5.4 | |
| Legal collection costs | 78,330 | | | 7.1 | | | 101,635 | | | 9.5 | | | 134,156 | | | 13.2 | |
| Agency fees | 63,140 | | | 5.8 | | | 56,418 | | | 5.3 | | | 55,812 | | | 5.5 | |
| Outside fees and services | 92,615 | | | 8.5 | | | 84,087 | | | 7.9 | | | 63,513 | | | 6.2 | |
| Communication | 42,755 | | | 3.9 | | | 40,801 | | | 3.8 | | | 44,057 | | | 4.3 | |
| Rent and occupancy | 18,376 | | | 1.7 | | | 17,973 | | | 1.7 | | | 17,854 | | | 1.8 | |
| Depreciation and amortization | 15,256 | | | 1.4 | | | 18,465 | | | 1.7 | | | 17,464 | | | 1.7 | |
| Other operating expenses | 61,077 | | | 5.5 | | | 47,426 | | | 4.5 | | | 46,811 | | | 4.6 | |
| | | | | | | | | | | |
| Total operating expenses | 720,736 | | | 65.8 | | | 715,713 | | | 67.2 | | | 745,369 | | | 73.2 | |
| | | | | | | | | | | |
| Income from operations | 374,996 | | | 34.2 | | | 349,701 | | | 32.8 | | | 247,687 | | | 24.4 | |
| Other income and (expense): | | | | | | | | | | | |
| | | | | | | | | | | |
| Interest expense, net | (124,143) | | | (11.3) | | | (141,712) | | | (13.2) | | | (141,918) | | | (14.0) | |
| Foreign exchange (loss)/ gain | (809) | | | (0.1) | | | 2,005 | | | 0.2 | | | 11,954 | | | 1.2 | |
| Other | 282 | | | — | | | (1,049) | | | (0.2) | | | (364) | | | (0.1) | |
| Income before income taxes | 250,326 | | | 22.8 | | | 208,945 | | | 19.6 | | | 117,359 | | | 11.5 | |
| Income tax expense | 54,817 | | | 5.0 | | | 41,203 | | | 3.9 | | | 19,680 | | | 1.9 | |
| Net income | 195,509 | | | 17.8 | | | 167,742 | | | 15.7 | | | 97,679 | | | 9.6 | |
| Adjustment for net income attributable to noncontrolling interests | 12,351 | | | 1.1 | | | 18,403 | | | 1.7 | | | 11,521 | | | 1.1 | |
| Net income attributable to PRA Group, Inc. | $ | 183,158 | | | 16.7 | % | | $ | 149,339 | | | 14.0 | % | | $ | 86,158 | | | 8.5 | % |
Year Ended December 31, 2021 Compared With Year Ended December 31, 2020
Cash Collections
Cash collections for the years indicated were as follows (amounts in millions): | | | | | | | | | | | | | | | | | | | | | | | | | | | |
| 2021 | | 2020 | | | | $ Change | | % Change | | |
| Americas and Australia Core | $ | 1,206.9 | | | $ | 1,271.9 | | | | | $ | (65.0) | | | (5.1) | % | | |
| Americas Insolvency | 147.3 | | | 155.3 | | | | | (8.0) | | | (5.2) | | | |
| Europe Core | 614.6 | | | 519.7 | | | | | 94.9 | | | 18.3 | | | |
| Europe Insolvency | 92.9 | | | 58.9 | | | | | 34.0 | | | 57.7 | | | |
| Total cash collections | $ | 2,061.7 | | | $ | 2,005.8 | | | | | $ | 55.9 | | | 2.8 | % | | |
| | | | | | | | | | | |
Cash collections adjusted (1) | $ | 2,061.7 | | | $ | 2,035.6 | | | | | $ | 26.1 | | | 1.3 | % | | |
| | | | | | | | | | | |
| | | | | | | | | | | |
| | | | | | | | | | | |
(1) Cash collections adjusted refers to 2020 cash collections translated using 2021 exchange rates.
Cash collections were $2,061.7 million in 2021, an increase of $55.9 million, or 2.8%, compared to $2,005.8 million in 2020. The increase was largely due to increased cash collections in Europe of $128.9 million, or 22.3%, primarily reflecting the impact from significant levels of portfolio purchases in the last few years. This increase was partially offset by a decrease of $40.1 million, or 10.7%, in U.S. legal cash collections reflecting a lower volume of accounts in the legal channel. Cash collections in our U.S. call center and other collections decreased by $14.3 million, or 1.9%, primarily due to the level of cash collections normalizing compared to elevated levels from the impact of excess consumer liquidity and government programs in response to the COVID-19 pandemic in 2020 and lower purchasing. Additionally, cash collections in Other Americas and Australia Core decreased $10.6 million, or 7.9%, and cash collections in Americas Insolvency decreased $8.0 million, or 5.2%, primarily due to the runoff of older portfolios.
Revenues
Revenue generation for the years indicated were as follows (amounts in thousands): | | | | | | | | | | | | | | | | | | | | | | | |
| 2021 | | 2020 | | $ Change | | % Change |
| Portfolio income | $ | 875,327 | | | $ | 984,036 | | | $ | (108,709) | | | (11.0) | % |
| Changes in expected recoveries | 197,904 | | | 69,297 | | | 128,607 | | | 185.6 | |
| Total portfolio revenue | 1,073,231 | | | 1,053,333 | | | 19,898 | | | 1.9 | |
| Fee income | 14,699 | | | 9,748 | | | 4,951 | | | 50.8 | |
| Other revenue | 7,802 | | | 2,333 | | | 5,469 | | | 234.4 | |
| Total revenues | $ | 1,095,732 | | | $ | 1,065,414 | | | $ | 30,318 | | | 2.8 | % |
Total Portfolio Revenue
Total portfolio revenues were $1,073.2 million in 2021, an increase of $19.9 million, or 1.9%, compared to $1,053.3 million in 2020. The increase reflects cash collections overperformance mostly offset by the net impact of forecast adjustments and, to a lesser extent, lower purchasing. We assumed that the majority of the cash collections overperformance was acceleration of future collections. We also increased near-term expected cash collections in certain geographies to reflect recent performance and trends in collections, and made corresponding reductions later in the forecast period.
Fee Income
Fee income was $14.7 million in 2021, an increase of $5.0 million, or 50.8%, compared to $9.7 million in 2020. The increase is primarily attributable to higher settlements during 2021 in our claims processing company, CCB.
Other Revenue
Other revenue was $7.8 million in 2021, an increase of $5.5 million compared to $2.3 million in 2020. The increase reflects a gain on sale from certain other assets during the first quarter of 2021.
Operating Expenses
Total operating expenses were $720.7 million in 2021, an increase of $5.0 million, or 0.7%, compared to $715.7 million in 2020.
Compensation and Employee Services
Compensation and employee service expenses were $302.0 million in 2021, an increase of $6.8 million, or 2.3%, compared to $295.2 million in 2020. The increase was primarily attributable to higher costs associated with additional headcount in Europe, unfavorable foreign exchange rates and increased stock based compensation expense, partially offset by a reduction of costs associated with lower average headcount in the U.S. call center workforce. Total full-time equivalents decreased 9.8% to 3,446 as of December 31, 2021 from 3,820 as of December 31, 2020.
Legal Collection Fees
Legal collection fees represent contingent fees incurred for the cash collections generated by our independent third-party attorney network. Legal collection fees were $47.2 million in 2021, a decrease of $6.6 million, or 12.3%, compared to $53.8 million in 2020. The decrease was mainly due to lower external legal cash collections in the U.S.
Legal Collection Costs
Legal collection costs primarily consist of costs paid to courts where a lawsuit is filed for the purpose of attempting to collect on an account. Legal collection costs were $78.3 million in 2021, a decrease of $23.3 million, or 22.9%, compared to $101.6 million in 2020. The decrease was primarily due to lower levels of accounts placed into the legal channel in the U.S., primarily reflecting a shift in collections from the legal channel to our call centers and digital platforms. This decrease was partially offset by an increase in Europe reflecting higher recent purchases and muted levels of accounts placed into the legal channel during 2020 from the impact of the COVID-19 pandemic.
Agency Fees
Agency fees primarily represent third-party collection fees. Agency fees were $63.1 million in 2021, an increase of $6.7 million, or 11.9%, compared to $56.4 million in 2020 primarily reflecting an increase in agency fees outside of the U.S. during the first half of the year.
Outside Fees and Services
Outside fees and services expenses were $92.6 million in 2021, an increase of $8.5 million, or 10.1%, compared to $84.1 million in 2020. The increase was primarily due to higher legal expenses.
Communication
Communication expenses primarily represent postage and telephone related expenses incurred as a result of our collection efforts. Communication expenses were $42.8 million in 2021, an increase of $2.0 million, or 4.9%, compared to $40.8 million in 2020. The increase mainly reflects higher postage costs due to our decision to delay mailing in 2020 in response to the COVID-19 pandemic.
Other
Other expenses were $61.1 million in 2021, an increase of $13.7 million, or 28.9%, compared to $47.4 million in 2020. The increase was primarily driven by investments in digital operations and data and analytics as well as higher software expenses.
Interest Expense, Net
Interest expense, net for the years indicated were as follows (amounts in thousands):
| | | | | | | | | | | | | | | | | | | | | | | |
| 2021 | | 2020 | | $ Change | | % Change |
Interest on debt obligations and unused line fees (1) | $ | 76,759 | | | $ | 96,979 | | | $ | (20,220) | | | (20.8) | % |
| Interest on senior notes | 26,889 | | | 7,621 | | | 19,268 | | | 252.8 | |
| Coupon interest on convertible notes | 12,075 | | | 17,064 | | | (4,989) | | | (29.2) | |
| Amortization of convertible notes discount | — | | | 10,811 | | | (10,811) | | | (100.0) | |
| Amortization of loan fees and other loan costs | 9,508 | | | 10,252 | | | (744) | | | (7.3) | |
| Interest income | (1,088) | | | (1,015) | | | (73) | | | 7.2 | |
| Interest expense, net | $ | 124,143 | | | $ | 141,712 | | | $ | (17,569) | | | (12.4) | % |
(1) Excludes interest related to our Convertible Notes.
Interest expense, net was $124.1 million in 2021, a decrease of $17.6 million, or 12.4%, compared to $141.7 million in 2020 primarily due to lower levels of average outstanding borrowings under our debt obligations and the 2021 change in accounting related to our convertible notes. See Note 1 to our Consolidated Financial Statements included in Item 8 of this Form 10-K. Foreign Exchange (Loss)/Gain
Foreign exchange losses were $0.8 million in 2021 compared to foreign exchange gains of $2.0 million in 2020. In any given period, we may incur foreign currency exchange gains or losses from transactions in currencies other than the functional currency.
Income Tax Expense
Income tax expense was $54.8 million in 2021, an increase of $13.6 million, or 33.0%, compared to $41.2 million in 2020. The increase was primarily due to higher income before income taxes, which increased $41.4 million, or 19.8%, and a change in the mix of income between countries of operation. These increases were partially offset by a decrease in uncertain tax positions. In 2021 our effective tax rate was 21.9% compared to 19.7% in 2020.
Year Ended December 31, 2020 Compared To Year Ended December 31, 2019
Refer to Item 7 "Management’s Discussion and Analysis of Financial Condition and Results of Operations" of our 2020 Form 10-K for a discussion of our 2020 results compared to our 2019 results.
Supplemental Performance Data
Finance Receivables Portfolio Performance
We purchase nonperforming loans from a variety of credit originators and segregate them into two main portfolio segments: Core or Insolvency, based on the status of the account upon acquisition. In addition, the accounts are further segregated into geographical regions based upon where the account was purchased. The accounts represented in the Insolvency tables below are those portfolios of accounts that were in an insolvency status at the time of purchase. This contrasts with accounts in our Core portfolios that file for bankruptcy/insolvency protection after we purchase them, which continue to be tracked in their corresponding Core portfolio. Core customers sometimes file for bankruptcy/insolvency protection subsequent to our purchase of the related Core portfolio. When this occurs, we adjust our collection practices to comply with bankruptcy/insolvency rules and procedures; however, for accounting purposes, these accounts remain in the original Core pool. Insolvency accounts may be dismissed voluntarily or involuntarily subsequent to our purchase of the Insolvency portfolio. Dismissal occurs when the terms of the bankruptcy are not met by the petitioner. When this occurs, we are typically free to pursue collection outside of bankruptcy procedures; however, for accounting purposes, these accounts remain in the original Insolvency pool.
Purchase price multiples can vary over time due to a variety of factors, including pricing competition, supply levels, age of the accounts acquired, and changes in our operational efficiency. For example, increased pricing competition during the 2005 to 2008 period negatively impacted purchase price multiples of our Core portfolio compared to prior years. Conversely, during the 2009 to 2011 period, additional supply occurred as a result of the economic downturn. This variance created unique and advantageous purchasing opportunities, particularly within the Insolvency market, relative to the prior four years. Purchase price multiples can also vary among types of finance receivables. For example, we generally incur lower collection costs on our Insolvency portfolio compared with our Core portfolio. This allows us, in general, to pay more for an Insolvency portfolio and experience lower purchase price multiples, while generating similar net income margins when compared with a Core portfolio.
When competition increases and/or supply decreases, pricing often becomes negatively impacted relative to expected collections, and effective interest rates tend to trend lower. The opposite tends to occur when competition decreases and/or supply increases.
Within a given portfolio type, to the extent that lower purchase price multiples are the result of more competitive pricing and lower net yields, this will generally lead to lower profitability. As portfolio pricing becomes more favorable on a relative basis, our profitability will tend to increase. Profitability within given Core portfolio types may also be impacted by the age and quality of the accounts, which impact the cost to collect those accounts. Fresher accounts, for example, typically carry lower associated collection costs, while older accounts and lower balance accounts typically carry higher costs and, as a result, require higher purchase price multiples to achieve the same net profitability as fresher paper.
Revenue recognition under ASC 326 is driven by estimates of the amount and timing of collections. We record new portfolio acquisitions at the purchase price, which reflects the amount we expect to collect discounted at an effective interest rate. During the year of acquisition, the annual pool is aggregated and the blended effective interest rate will change to reflect new buying and new cash flow estimates until the end of the year. At that time, the effective interest rate is fixed at the amount we expect to collect discounted at the rate to equate purchase price to the recovery estimate. During the first year following purchase, we typically do not allow purchase price multiples to expand. Subsequent to the initial year, as we gain collection experience and confidence with a pool of accounts, we regularly update ERC. As a result, our estimate of total collections has often increased as pools have aged. These processes have tended to cause the ratio of ERC to purchase price for any given year of buying to gradually increase over time. Thus, all factors being equal in terms of pricing, one would typically tend to see a higher collection to purchase price ratio from a pool of accounts that was six years from acquisition than a pool that was just two years from acquisition.
The numbers presented in the following tables represent gross cash collections and do not reflect any costs to collect; therefore, they may not represent relative profitability. Due to all the factors described above, readers should be cautious when making comparisons of purchase price multiples among periods and between types of categories of portfolio segments and related geographies.
| | | | | | | | | | | | | | | | | | | | |
Purchase Price Multiples as of December 31, 2021 Amounts in thousands | |
| Purchase Period | Purchase Price (1)(2) | | Total Estimated Collections (3) | Estimated Remaining Collections (4) | Current Purchase Price Multiple | Original Purchase Price Multiple (5) | | |
| Americas and Australia Core | | | | | | | | |
| 1996-2011 | $ | 1,287,821 | | | $ | 4,119,794 | | $ | 27,874 | | 320% | 240% | | |
| 2012 | 254,076 | | | 652,359 | | 11,867 | | 257% | 226% | | |
| 2013 | 390,826 | | | 894,234 | | 17,955 | | 229% | 211% | | |
| 2014 | 404,117 | | | 859,555 | | 29,634 | | 213% | 204% | | |
| 2015 | 443,114 | | | 910,077 | | 79,134 | | 205% | 205% | | |
| 2016 | 455,767 | | | 1,117,255 | | 163,295 | | 245% | 201% | | |
| 2017 | 532,851 | | | 1,215,524 | | 240,172 | | 228% | 193% | | |
| 2018 | 653,975 | | | 1,394,839 | | 301,952 | | 213% | 202% | | |
| 2019 | 581,476 | | | 1,257,641 | | 434,423 | | 216% | 206% | | |
| 2020 | 435,668 | | | 940,982 | | 522,918 | | 216% | 213% | | |
| 2021 | 435,846 | | | 833,624 | | 748,852 | | 191% | 191% | | |
| Subtotal | 5,875,537 | | | 14,195,884 | | 2,578,076 | | | | | |
| Americas Insolvency | | | | | | | |
| 1996-2011 | 786,827 | | | 1,752,771 | | 790 | | 223% | 174% | | |
| 2012 | 251,395 | | | 393,018 | | 67 | | 156% | 136% | | |
| 2013 | 227,834 | | | 355,274 | | 373 | | 156% | 133% | | |
| 2014 | 148,420 | | | 219,141 | | 1,583 | | 148% | 124% | | |
| 2015 | 63,170 | | | 87,377 | | 361 | | 138% | 125% | | |
| 2016 | 91,442 | | | 116,498 | | 1,468 | | 127% | 123% | | |
| 2017 | 275,257 | | | 353,296 | | 23,180 | | 128% | 125% | | |
| 2018 | 97,879 | | | 134,417 | | 38,130 | | 137% | 127% | | |
| 2019 | 123,077 | | | 163,200 | | 79,392 | | 133% | 128% | | |
| 2020 | 62,130 | | | 86,107 | | 63,473 | | 139% | 136% | | |
| 2021 | 55,187 | | | 74,931 | | 70,317 | | 136% | 136% | | |
| Subtotal | 2,182,618 | | | 3,736,030 | | 279,134 | | | | | |
| Total Americas and Australia | 8,058,155 | | | 17,931,914 | | 2,857,210 | | | | | |
| Europe Core | | | | | | | | |
| 2012 | 20,409 | | | 42,579 | | — | | 209% | 187% | | |
| 2013 | 20,334 | | | 26,267 | | — | | 129% | 119% | | |
| 2014 | 773,811 | | | 2,239,932 | | 460,391 | | 289% | 208% | | |
| 2015 | 411,340 | | | 720,559 | | 203,212 | | 175% | 160% | | |
| 2016 | 333,090 | | | 561,569 | | 243,437 | | 169% | 167% | | |
| 2017 | 252,174 | | | 353,450 | | 154,560 | | 140% | 144% | | |
| 2018 | 341,775 | | | 527,012 | | 287,725 | | 154% | 148% | | |
| 2019 | 518,610 | | | 775,332 | | 485,171 | | 150% | 152% | | |
| 2020 | 324,119 | | | 553,951 | | 410,322 | | 171% | 172% | | |
| 2021 | 412,411 | | | 699,959 | | 652,200 | | 170% | 170% | | |
| Subtotal | 3,408,073 | | | 6,500,610 | | 2,897,018 | | | | | |
| Europe Insolvency | | | | | | | |
| 2014 | 10,876 | | | 18,370 | | 28 | | 169% | 129% | | |
| 2015 | 18,973 | | | 29,002 | | 892 | | 153% | 139% | | |
| 2016 | 39,338 | | | 56,831 | | 4,398 | | 144% | 130% | | |
| 2017 | 39,235 | | | 49,287 | | 10,641 | | 126% | 128% | | |
| 2018 | 44,908 | | | 51,499 | | 22,265 | | 115% | 123% | | |
| 2019 | 77,218 | | | 102,095 | | 53,796 | | 132% | 130% | | |
| 2020 | 105,440 | | | 135,907 | | 94,242 | | 129% | 129% | | |
| 2021 | 53,230 | | | 71,526 | | 66,095 | | 134% | 134% | | |
| Subtotal | 389,218 | | | 514,517 | | 252,357 | | | | | |
| Total Europe | 3,797,291 | | | 7,015,127 | | 3,149,375 | | | | | |
| Total PRA Group | $ | 11,855,446 | | | $ | 24,947,041 | | $ | 6,006,585 | | | | | |
| | | | | | | | |
(1)Includes the acquisition date finance receivables portfolios that were acquired through our business acquisitions.
(2)For our non-U.S. amounts, purchase price is presented at the exchange rate at the end of the year in which the portfolio was purchased. In addition, any purchase price adjustments that occur throughout the life of the portfolio are presented at the year-end exchange rate for the respective year of purchase.
(3)For our non-U.S. amounts, TEC is presented at the year-end exchange rate for the respective year of purchase.
(4)For our non-U.S. amounts, ERC is presented at the December 31, 2021 exchange rate.
(5)The Original Purchase Price Multiple represents the purchase price multiple at the end of the year of acquisition.
| | | | | | | | | | | | | | | | | |
Portfolio Financial Information For the Year Ended December 31, 2021 Amounts in thousands |
| Purchase Period | Cash Collections (1) | Portfolio Income (1) | Changes in Expected Recoveries (1) | Total Portfolio Revenue (1) | Net Finance Receivables as of December 31, 2021 (2) |
| Americas and Australia Core | | | | | |
| 1996-2011 | $ | 20,819 | | $ | 12,632 | | $ | 5,346 | | $ | 17,978 | | $ | 6,433 | |
| | | | | |
| | | | | |
| | | | | |
| 2012 | 9,046 | | 4,123 | | 2,610 | | 6,733 | | 4,446 | |
| 2013 | 16,657 | | 7,520 | | 1,613 | | 9,133 | | 8,763 | |
| 2014 | 22,323 | | 10,040 | | (742) | | 9,298 | | 12,225 | |
| 2015 | 34,938 | | 19,582 | | (9,082) | | 10,500 | | 31,412 | |
| 2016 | 74,206 | | 40,717 | | (1,395) | | 39,322 | | 58,086 | |
| 2017 | 129,962 | | 61,776 | | 11,275 | | 73,051 | | 108,433 | |
| 2018 | 239,862 | | 83,566 | | 38,960 | | 122,526 | | 167,343 | |
| 2019 | 289,779 | | 117,189 | | 34,744 | | 151,933 | | 240,112 | |
| 2020 | 284,284 | | 125,173 | | 46,195 | | 171,368 | | 299,290 | |
| 2021 | 85,003 | | 61,842 | | (4,866) | | 56,976 | | 408,212 | |
| Subtotal | 1,206,879 | | 544,160 | | 124,658 | | 668,818 | | 1,344,755 | |
| Americas Insolvency | | | | | |
| 1996-2011 | 792 | | 882 | | (73) | | 809 | | — | |
| | | | | |
| | | | | |
| | | | | |
| 2012 | 601 | | 188 | | 425 | | 613 | | — | |
| 2013 | 811 | | 459 | | 363 | | 822 | | — | |
| 2014 | 1,118 | | 1,108 | | (44) | | 1,064 | | 148 | |
| 2015 | 1,250 | | 538 | | 32 | | 570 | | 218 | |
| 2016 | 7,352 | | 1,321 | | (332) | | 989 | | 1,060 | |
| 2017 | 43,978 | | 7,795 | | 4,718 | | 12,513 | | 20,304 | |
| 2018 | 31,637 | | 5,944 | | 3,757 | | 9,701 | | 33,715 | |
| 2019 | 39,073 | | 8,739 | | 2,590 | | 11,329 | | 69,514 | |
| 2020 | 16,108 | | 7,220 | | 1,885 | | 9,105 | | 50,482 | |
| 2021 | 4,616 | | 2,799 | | 804 | | 3,603 | | 53,837 | |
| Subtotal | 147,336 | | 36,993 | | 14,125 | | 51,118 | | 229,278 | |
| Total Americas and Australia | 1,354,215 | | 581,153 | | 138,783 | | 719,936 | | 1,574,033 | |
| Europe Core | | | | | |
| 2012 | 1,160 | | — | | 1,160 | | 1,160 | | — | |
| 2013 | 680 | | — | | 681 | | 681 | | — | |
| 2014 | 149,246 | | 94,750 | | 25,771 | | 120,521 | | 131,950 | |
| 2015 | 51,397 | | 26,474 | | (7,320) | | 19,154 | | 107,415 | |
| 2016 | 46,702 | | 23,859 | | (1,569) | | 22,290 | | 141,981 | |
| 2017 | 34,800 | | 11,718 | | (2,815) | | 8,903 | | 106,026 | |
| 2018 | 69,106 | | 23,502 | | 5,352 | | 28,854 | | 189,813 | |
| 2019 | 121,385 | | 37,266 | | 12,333 | | 49,599 | | 328,709 | |
| 2020 | 91,672 | | 35,697 | | 13,610 | | 49,307 | | 250,434 | |
| 2021 | 48,453 | | 18,809 | | 6,159 | | 24,968 | | 388,850 | |
| Subtotal | 614,601 | | 272,075 | | 53,362 | | 325,437 | | 1,645,178 | |
| Europe Insolvency | | | | | |
| 2014 | 328 | | 109 | | 144 | | 253 | | 14 | |
| 2015 | 1,605 | | 647 | | 3 | | 650 | | 653 | |
| 2016 | 5,951 | | 1,685 | | 208 | | 1,893 | | 3,398 | |
| 2017 | 9,366 | | 1,301 | | 379 | | 1,680 | | 9,673 | |
| 2018 | 11,678 | | 2,212 | | (1,153) | | 1,059 | | 19,877 | |
| 2019 | 23,867 | | 5,552 | | 1,307 | | 6,859 | | 45,649 | |
| 2020 | 34,647 | | 8,791 | | 3,067 | | 11,858 | | 79,363 | |
| 2021 | 5,483 | | 1,802 | | 1,804 | | 3,606 | | 50,447 | |
| Subtotal | 92,925 | | 22,099 | | 5,759 | | 27,858 | | 209,074 | |
| Total Europe | 707,526 | | 294,174 | | 59,121 | | 353,295 | | 1,854,252 | |
| Total PRA Group | $ | 2,061,741 | | $ | 875,327 | | $ | 197,904 | | $ | 1,073,231 | | $ | 3,428,285 | |
(1)Non-U.S. amounts are presented using the average exchange rates during the reporting period.
(2)For non-U.S. amounts, net finance receivables are presented at the December 31, 2021 exchange rate.
| | | | | | | | | | | | | | | | | | | | | | | | | | | | | | | | | | | | | | | | | | | |
Cash Collections by Year, By Year of Purchase (1) as of December 31, 2021 Amounts in millions | |
| | Cash Collections |
| Purchase Period | Purchase Price (2)(3) | 1996-2011 | | 2012 | 2013 | 2014 | 2015 | 2016 | 2017 | 2018 | 2019 | 2020 | 2021 | Total | |
| Americas and Australia Core | |
| 1996-2011 | $ | 1,287.8 | | $ | 2,419.5 | | | $ | 486.0 | | $ | 381.3 | | $ | 266.3 | | $ | 183.1 | | $ | 119.0 | | $ | 78.0 | | $ | 56.0 | | $ | 45.0 | | $ | 29.7 | | $ | 20.8 | | $ | 4,084.7 | | |
| 2012 | 254.1 | | — | | | 56.9 | | 173.6 | | 146.2 | | 97.3 | | 60.0 | | 40.0 | | 27.8 | | 17.9 | | 11.8 | | 9.0 | | 640.5 | | |
| 2013 | 390.8 | | — | | | — | | 101.6 | | 247.8 | | 194.0 | | 120.8 | | 78.9 | | 56.4 | | 36.9 | | 23.2 | | 16.7 | | 876.3 | | |
| 2014 | 404.1 | | — | | | — | | — | | 92.7 | | 253.4 | | 170.3 | | 114.2 | | 82.2 | | 55.3 | | 31.9 | | 22.3 | | 822.3 | | |
| 2015 | 443.1 | | — | | | — | | — | | — | | 117.0 | | 228.4 | | 185.9 | | 126.6 | | 83.6 | | 57.2 | | 34.9 | | 833.6 | | |
| 2016 | 455.8 | | — | | | — | | — | | — | | | 138.7 | | 256.5 | | 194.6 | | 140.6 | | 105.9 | | 74.2 | | 910.5 | | |
| 2017 | 532.9 | | — | | | — | | — | | — | | — | | — | | 107.3 | | 278.7 | | 256.5 | | 192.5 | | 130.0 | | 965.0 | | |
| 2018 | 654.0 | | — | | | — | | — | | — | | — | | — | | — | | 122.7 | | 361.9 | | 337.7 | | 239.9 | | 1,062.2 | | |
| 2019 | 581.5 | | — | | | — | | — | | — | | — | | — | | — | | — | | 143.8 | | 349.0 | | 289.8 | | 782.6 | | |
| 2020 | 435.7 | | — | | | — | | — | | — | | — | | — | | — | | — | | — | | 133.0 | | 284.3 | | 417.3 | | |
| 2021 | 435.8 | | — | | | — | | — | | — | | — | | — | | — | | — | | — | | — | | 85.0 | | 85.0 | | |
| Subtotal | 5,875.6 | | 2,419.5 | | | 542.9 | | 656.5 | | 753.0 | | 844.8 | | 837.2 | | 860.8 | | 945.0 | | 1,141.5 | | 1,271.9 | | 1,206.9 | | 11,480.0 | | |
| Americas Insolvency | |
| 1996-2011 | 786.8 | | 667.4 | | | 336.8 | | 313.7 | | 244.7 | | 128.2 | | 44.6 | | 8.4 | | 4.0 | | 2.1 | | 1.3 | | 0.8 | | 1,752.0 | | |
| 2012 | 251.4 | | — | | | 17.4 | | 103.6 | | 94.1 | | 80.1 | | 60.7 | | 29.3 | | 4.3 | | 1.9 | | 0.9 | | 0.6 | | 392.9 | | |
| 2013 | 227.8 | | — | | | — | | 52.5 | | 82.6 | | 81.7 | | 63.4 | | 47.8 | | 21.9 | | 2.9 | | 1.3 | | 0.8 | | 354.9 | | |
| 2014 | 148.4 | | — | | | — | | — | | 37.0 | | 50.9 | | 44.3 | | 37.4 | | 28.8 | | 15.8 | | 2.2 | | 1.1 | | 217.5 | | |
| 2015 | 63.2 | | — | | | — | | — | | — | | 3.4 | | 17.9 | | 20.1 | | 19.8 | | 16.7 | | 7.9 | | 1.3 | | 87.1 | | |
| 2016 | 91.4 | | — | | | — | | — | | — | | — | | 18.9 | | 30.4 | | 25.0 | | 19.9 | | 14.4 | | 7.4 | | 116.0 | | |
| 2017 | 275.3 | | — | | | — | | — | | — | | — | | — | | 49.1 | | 97.3 | | 80.9 | | 58.8 | | 44.0 | | 330.1 | | |
| 2018 | 97.9 | | — | | | — | | — | | — | | — | | — | | — | | 6.7 | | 27.4 | | 30.5 | | 31.6 | | 96.2 | | |
| 2019 | 123.1 | | — | | | — | | — | | — | | — | | — | | — | | — | | 13.4 | | 31.4 | | 39.1 | | 83.9 | | |
| 2020 | 62.1 | | — | | | — | | — | | — | | — | | — | | — | | — | | — | | 6.5 | | 16.1 | | 22.6 | | |
| 2021 | 55.2 | | — | | | — | | — | | — | | — | | — | | — | | — | | — | | — | | 4.5 | | 4.5 | | |
| Subtotal | 2,182.6 | | 667.4 | | | 354.2 | | 469.8 | | 458.4 | | 344.3 | | 249.8 | | 222.5 | | 207.8 | | 181.0 | | 155.2 | | 147.3 | | 3,457.7 | | |
| Total Americas and Australia | 8,058.2 | | 3,086.9 | | | 897.1 | | 1,126.3 | | 1,211.4 | | 1,189.1 | | 1,087.0 | | 1,083.3 | | 1,152.8 | | 1,322.5 | | 1,427.1 | | 1,354.2 | | 14,937.7 | | |
| Europe Core | | | | | | | | | | | | | | |
| 2012 | 20.4 | | — | | | 11.6 | | 9.0 | | 5.6 | | 3.2 | | 2.2 | | 2.0 | | 2.0 | | 1.5 | | 1.2 | | 1.2 | | 39.5 | | |
| 2013 | 20.3 | | — | | | — | | 7.1 | | 8.5 | | 2.3 | | 1.3 | | 1.2 | | 1.3 | | 0.9 | | 0.7 | | 0.7 | | 24.0 | | |
| 2014 | 773.8 | | — | | | — | | — | | 153.2 | | 292.0 | | 246.4 | | 220.8 | | 206.3 | | 172.9 | | 149.8 | | 149.2 | | 1,590.6 | | |
| 2015 | 411.3 | | — | | | — | | — | | — | | 45.8 | | 100.3 | | 86.2 | | 80.9 | | 66.1 | | 54.3 | | 51.4 | | 485.0 | | |
| 2016 | 333.1 | | — | | | — | | — | | — | | — | | 40.4 | | 78.9 | | 72.6 | | 58.0 | | 48.3 | | 46.7 | | 344.9 | | |
| 2017 | 252.2 | | — | | | — | | — | | — | | — | | — | | 17.9 | | 56.0 | | 44.1 | | 36.1 | | 34.8 | | 188.9 | | |
| 2018 | 341.8 | | — | | | — | | — | | — | | — | | — | | — | | 24.3 | | 88.7 | | 71.2 | | 69.1 | | 253.3 | | |
| 2019 | 518.6 | | — | | | — | | — | | — | | — | | — | | — | | — | | 47.9 | | 125.7 | | 121.4 | | 295.0 | | |
| 2020 | 324.1 | | — | | | — | | — | | — | | — | | — | | — | | — | | — | | 32.4 | | 91.7 | | 124.1 | | |
| 2021 | 412.4 | | — | | | — | | — | | — | | — | | — | | — | | — | | — | | — | | 48.4 | | 48.4 | | |
| Subtotal | 3,408.0 | | — | | | 11.6 | | 16.1 | | 167.3 | | 343.3 | | 390.6 | | 407.0 | | 443.4 | | 480.1 | | 519.7 | | 614.6 | | 3,393.7 | | |
| Europe Insolvency | | | | | | | | | | | | | | |
| 2014 | 10.9 | | — | | | — | | — | | — | | 4.3 | | 3.9 | | 3.2 | | 2.6 | | 1.5 | | 0.8 | | 0.3 | | 16.6 | | |
| 2015 | 19.0 | | — | | | — | | — | | — | | 3.0 | | 4.4 | | 5.0 | | 4.8 | | 3.9 | | 2.9 | | 1.6 | | 25.6 | | |
| 2016 | 39.3 | | — | | | — | | — | | — | | — | | 6.2 | | 12.7 | | 12.9 | | 10.7 | | 7.9 | | 6.0 | | 56.4 | | |
| 2017 | 39.2 | | — | | | — | | — | | — | | — | | — | | 1.2 | | 7.9 | | 9.2 | | 9.8 | | 9.4 | | 37.5 | | |
| 2018 | 44.9 | | — | | | — | | — | | — | | — | | — | | — | | 0.6 | | 8.4 | | 10.3 | | 11.7 | | 31.0 | | |
| 2019 | 77.2 | | — | | | — | | — | | — | | — | | — | | — | | — | | 5.1 | | 21.1 | | 23.9 | | 50.1 | | |
| 2020 | 105.4 | | — | | | — | | — | | — | | — | | — | | — | | — | | — | | 6.1 | | 34.6 | | 40.7 | | |
| 2021 | 53.3 | | — | | | — | | — | | — | | — | | — | | — | | — | | — | | — | | 5.4 | | 5.4 | | |
| Subtotal | 389.2 | | — | | | — | | — | | — | | 7.3 | | 14.5 | | 22.1 | | 28.8 | | 38.8 | | 58.9 | | 92.9 | | 263.3 | | |
| Total Europe | 3,797.2 | | — | | | 11.6 | | 16.1 | | 167.3 | | 350.6 | | 405.1 | | 429.1 | | 472.2 | | 518.9 | | 578.6 | | 707.5 | | 3,657.0 | | |
| Total PRA Group | $ | 11,855.4 | | $ | 3,086.9 | | | $ | 908.7 | | $ | 1,142.4 | | $ | 1,378.7 | | $ | 1,539.7 | | $ | 1,492.1 | | $ | 1,512.4 | | $ | 1,625.0 | | $ | 1,841.4 | | $ | 2,005.7 | | $ | 2,061.7 | | $ | 18,594.7 | | |
| | | | | | | | | | | | | | | |
(1)For our non-U.S. amounts, cash collections are presented using the average exchange rates during the cash collection period.
(2)Includes the nonperforming loan portfolios that were acquired through our business acquisitions.
(3)For our non-U.S. amounts, purchase price is presented at the exchange rate at the end of the year in which the portfolio was purchased. In addition, any purchase price adjustments that occur throughout the life of the pool are presented at the year-end exchange rate for the respective year of purchase.
Estimated Remaining Collections
The following chart shows our ERC of $6,006.6 million at December 31, 2021 by geographical region (amounts in millions).
The following chart shows our ERC by year as of December 31, 2021. The forecast amounts reflect our current estimate of how much we expect to collect on our portfolios. These estimates are translated to U.S. dollars at the December 31, 2021 exchange rate.
Seasonality
Although the years ended December 31, 2021 and 2020 deviated from usual seasonal patterns due to the impact of COVID-19, typically cash collections in the Americas tend to be higher in the first half of the year due to the high volume of income tax refunds received by individuals in the U.S., and trend lower as the year progresses. Customer payment patterns in all of the countries in which we operate can be affected by seasonal employment trends, income tax refunds, and holiday spending habits.
Cash Collections
The following table displays our quarterly cash collections by geography and portfolio type, for the periods indicated (amounts in thousands).
| | | | | | | | | | | | | | | | | | | | | | | | | | | | | | | | | | | | | | | | | | | | | | | |
| Cash Collections by Geography and Type |
| 2021 | | 2020 |
| Q4 | | Q3 | | Q2 | | Q1 | | Q4 | | Q3 | | Q2 | | Q1 |
| Americas and Australia Core | $ | 257,705 | | | $ | 276,691 | | | $ | 324,845 | | | $ | 347,638 | | | $ | 286,524 | | | $ | 336,322 | | | $ | 343,269 | | | $ | 305,780 | |
| Americas Insolvency | 36,851 | | | 37,464 | | | 37,768 | | | 35,253 | | | 36,048 | | | 37,344 | | | 38,685 | | | 43,210 | |
| Europe Core | 155,853 | | | 151,625 | | | 157,637 | | | 149,486 | | | 141,471 | | | 131,702 | | | 115,145 | | | 131,340 | |
| Europe Insolvency | 23,262 | | | 22,574 | | | 23,579 | | | 23,510 | | | 17,830 | | | 13,971 | | | 12,841 | | | 14,243 | |
| Total Cash Collections | $ | 473,671 | | | $ | 488,354 | | | $ | 543,829 | | | $ | 555,887 | | | $ | 481,873 | | | $ | 519,339 | | | $ | 509,940 | | | $ | 494,573 | |
The following table provides additional details on the composition of our Core cash collections for the periods indicated (amounts in thousands).
| | | | | | | | | | | | | | | | | | | | | | | | | | | | | | | | | | | | | | | | | | | | | | | |
| Cash Collections by Source - Core Portfolios Only |
| 2021 | | 2020 |
| Q4 | | Q3 | | Q2 | | Q1 | | Q4 | | Q3 | | Q2 | | Q1 |
| Call Center and Other Collections | $ | 283,606 | | | $ | 298,717 | | | $ | 338,022 | | | $ | 355,043 | | | $ | 296,865 | | | $ | 325,898 | | | $ | 319,236 | | | $ | 288,596 | |
| External Legal Collections | 55,760 | | | 54,445 | | | 61,836 | | | 65,613 | | | 58,481 | | | 68,861 | | | 70,310 | | | 75,699 | |
| Internal Legal Collections | 74,192 | | | 75,154 | | | 82,624 | | | 76,468 | | | 72,649 | | | 73,265 | | | 68,868 | | | 72,825 | |
| Total Core Cash Collections | $ | 413,558 | | | $ | 428,316 | | | $ | 482,482 | | | $ | 497,124 | | | $ | 427,995 | | | $ | 468,024 | | | $ | 458,414 | | | $ | 437,120 | |
| | | | | | | | | | | | | | | |
Collections Productivity (U.S. Portfolio)
The following table displays a collections productivity measure for our U.S. Portfolios.
| | | | | | | | | | | | | | | | | | | | | | | | | | | | | |
Cash Collections per Collector Hour Paid
U.S. Portfolio |
| Call center and other cash collections (1) |
| 2021 | | 2020 | | 2019 | | 2018 | | 2017 |
| First Quarter | $ | 279 | | | $ | 172 | | | $ | 139 | | | $ | 121 | | | $ | 161 | |
| Second Quarter | 270 | | | 263 | | | 139 | | | 101 | | | 129 | |
| Third Quarter | 242 | | | 246 | | | 124 | | | 107 | | | 125 | |
| Fourth Quarter | 232 | | | 204 | | | 128 | | | 104 | | | 112 | |
(1)Represents total cash collections less internal legal cash collections, external legal cash collections and Insolvency cash collections from trustee-administered accounts.
Cash Efficiency Ratio
The following table displays our cash efficiency for the periods indicated.
| | | | | | | | | | | | | | | | | | | | | |
| |
| | | | | | | | | |
| | | | | | | | | |
| | | | | | | | | |
| | | | | | | | | |
| | | | | | | | | |
| | | | | | | | | |
| |
| | | | | | | | | |
| | | | | | | | | |
| | | | | | | | | |
| | | | | | | | | |
| | | | | | | | | |
| | | | | | | | | |
| |
| | | | | | | | | |
| | | | | | | | | |
| | | | | | | | | |
| | | | | | | | | |
| | | | | | | | | |
| | | | | | | | | |
| |
| | | | | | | | | |
| | | | | | | | | |
| | | | | | | | | |
| | | | | | | | | |
| | | | | | | | | |
Cash Efficiency Ratio (1) |
| 2021 | | 2020 | | 2019 | | | | |
| First Quarter | 68.0% | | 61.5% | | 59.2% | | | | |
| Second Quarter | 66.8 | | 68.7 | | 60.4 | | | | |
| Third Quarter | 62.4 | | 65.6 | | 60.2 | | | | |
| Fourth Quarter | 63.5 | | 61.9 | | 59.7 | | | | |
| Full Year | 65.3 | | 64.5 | | 59.9 | | | | |
(1) Calculated by dividing cash receipts less operating expenses by cash receipts.
Portfolio Acquisitions
The following graph shows the purchase price of our portfolios by year since 2011. It also includes the acquisition date nonperforming loan portfolios that were acquired through our business acquisitions.
The following table displays our quarterly portfolio acquisitions for the periods indicated (amounts in thousands).
| | | | | | | | | | | | | | | | | | | | | | | | | | | | | | | | | | | | | | | | | | | | | | | |
| Portfolio Acquisitions by Geography and Type |
| 2021 | | 2020 |
| Q4 | | Q3 | | Q2 | | Q1 | | Q4 | | Q3 | | Q2 | | Q1 |
| Americas and Australia Core | $ | 90,263 | | | $ | 162,451 | | | $ | 98,901 | | | $ | 88,912 | | | $ | 67,460 | | | $ | 84,139 | | | $ | 110,474 | | | $ | 172,697 | |
| Americas Insolvency | 21,183 | | | 9,878 | | | 14,642 | | | 9,486 | | | 12,504 | | | 14,328 | | | 14,527 | | | 20,772 | |
| Europe Core | 60,430 | | | 212,194 | | | 106,134 | | | 44,095 | | | 137,647 | | | 74,930 | | | 34,247 | | | 60,990 | |
| Europe Insolvency | 29,820 | | | 7,424 | | | — | | | 16,468 | | | 72,171 | | | 4,203 | | | 5,251 | | | 18,778 | |
| Total Portfolio Acquisitions | $ | 201,696 | | | $ | 391,947 | | | $ | 219,677 | | | $ | 158,961 | | | $ | 289,782 | | | $ | 177,600 | | | $ | 164,499 | | | $ | 273,237 | |
Portfolio Acquisitions by Stratifications (U.S. Only)
The following table categorizes our quarterly U.S. portfolio acquisitions for the periods indicated into major asset type and delinquency category. Since our inception in 1996, we have acquired more than 59 million customer accounts in the U.S. (amounts in thousands).
| | | | | | | | | | | | | | | | | | | | | | | | | | | | | | | | | | | | | | | | | | | | | | | | | |
| U.S. Portfolio Acquisitions by Major Asset Type | | | | | |
| 2021 | | 2020 | | | | | |
| Q4 | | Q3 | | Q2 | | Q1 | | Q4 | | | | | |
| Major Credit Cards | $ | 50,017 | | 51.4 | % | | $ | 46,888 | | 48.9 | % | | $ | 43,229 | | 38.9 | % | | $ | 28,230 | | 31.1 | % | | $ | 22,500 | | 28.9 | % | | | | | |
| Private Label Credit Cards | 28,293 | | 29.1 | | | 42,249 | | 44.1 | | | 52,475 | | 47.3 | | | 50,180 | | 55.4 | | | 48,335 | | 62.1 | | | | | | |
| Consumer Finance | 4,617 | | 4.8 | | | 6,081 | | 6.3 | | | 12,555 | | 11.3 | | | 11,861 | | 13.1 | | | 5,978 | | 7.6 | | | | | | |
| Auto Related | 14,319 | | 14.7 | | | 668 | | 0.7 | | | 2,741 | | 2.5 | | | 381 | | 0.4 | | | 1,081 | | 1.4 | | | | | | |
| Total | $ | 97,246 | | 100.0 | % | | $ | 95,886 | | 100.0 | % | | $ | 111,000 | | 100.0 | % | | $ | 90,652 | | 100.0 | % | | $ | 77,894 | | 100.0 | % | | | | | |
| | | | | | | | | | | | | | | | | | | | | | | | | | | | | | | | | | | | | | | | | | | | | |
| U.S. Portfolio Acquisitions by Delinquency Category |
| 2021 | | 2020 |
| Q4 | | | Q3 | | Q2 | | Q1 | | Q4 |
Fresh (1) | $ | 17,096 | | 22.5 | % | | | $ | 21,511 | | 25.0 | % | | $ | 29,031 | | 30.1 | % | | $ | 21,502 | | 26.4 | % | | $ | 21,985 | | 33.6 | % |
Primary (2) | 557 | | 0.7 | | | | 560 | | 0.7 | | | 431 | | 0.4 | | | 1,360 | | 1.7 | | | 1,002 | | 1.5 | |
Secondary (3) | 54,915 | | 72.2 | | | | 62,382 | | 72.5 | | | 58,459 | | 60.7 | | | 50,546 | | 62.1 | | | 41,164 | | 63.0 | |
Other (4) | 3,495 | | 4.6 | | | | 1,555 | | 1.8 | | | 8,437 | | 8.8 | | | 8,050 | | 9.8 | | | 1,239 | | 1.9 | |
| Total Core | 76,063 | | 100.0 | % | | | 86,008 | | 100.0 | % | | 96,358 | | 100.0 | % | | 81,458 | | 100.0 | % | | 65,390 | | 100.0 | % |
| Insolvency | 21,183 | | | | | 9,878 | | | | 14,642 | | | | 9,194 | | | | 12,504 | | |
| Total | $ | 97,246 | | | | | $ | 95,886 | | | | $ | 111,000 | | | | $ | 90,652 | | | | $ | 77,894 | | |
(1)Fresh accounts are typically past due 120 to 270 days, charged-off by the credit originator and sold prior to any post-charge-off collection activity.
(2)Primary accounts are typically 240 to 450 days past due, charged-off and have been previously placed with one contingent fee servicer.
(3)Secondary accounts are typically 360 to 630 days past due, charged-off and have been previously placed with two contingent fee servicers.
(4)Other accounts are 480 days or more past due, charged-off and have previously been worked by three or more contingent fee servicers.
Non-GAAP Financial Measures
We report our financial results in accordance with U.S. generally accepted accounting principles ("GAAP"). However, management uses certain non-GAAP financial measures, including adjusted earnings before interest, taxes, depreciation and amortization ("Adjusted EBITDA"), to evaluate our operating and financial performance as well as to set performance goals. We present Adjusted EBITDA because we consider it an important supplemental measure of operations and financial performance. Management believes Adjusted EBITDA helps provide enhanced period-to-period comparability of operations and financial performance, as it excludes certain items whose fluctuations from period to period do not necessarily correspond to changes in the operations of our business, and is useful to investors as other companies in the industry report similar financial measures. Adjusted EBITDA should not be considered as an alternative to net income determined in accordance with GAAP. In addition, our calculation of Adjusted EBITDA may not be comparable to the calculation of similarly titled measures presented by other companies.
Adjusted EBITDA is calculated starting with our GAAP financial measure, net income attributable to PRA Group, Inc. and is adjusted for:
•income tax expense (or less income tax benefit);
•foreign exchange loss (or less foreign exchange gain);
•interest expense, net (or less interest income, net);
•other expense (or less other income);
•depreciation and amortization;
•net income attributable to noncontrolling interests;
•loss on sale of subsidiaries (or less gain on sale of subsidiaries);
•recoveries applied to negative allowance less changes in expected recoveries for the years ended December 31, 2021 and 2020; and
•collections applied to principal on finance receivables for the year ended December 31, 2019.
The following table is a reconciliation of net income attributable to PRA Group, Inc., as reported in accordance with GAAP, to Adjusted EBITDA for the years ended December 31, 2021, 2020 and 2019 (amounts in thousands).
| | | | | | | | | | | | | | | | | |
| Reconciliation of Non-GAAP Financial Measures |
| 2021 | | 2020 | | 2019 |
| Net income attributable to PRA Group, Inc. | $ | 183,158 | | | $ | 149,339 | | | $ | 86,158 | |
| Adjustments: | | | | | |
| Income tax expense | 54,817 | | | 41,203 | | | 19,680 | |
| Foreign exchange losses/(gains) | 809 | | | (2,005) | | | (11,954) | |
| Interest expense, net | 124,143 | | | 141,712 | | | 141,918 | |
Other (income)/expense (1) | (282) | | | 1,049 | | | 364 | |
| Depreciation and amortization | 15,256 | | | 18,465 | | | 17,464 | |
| Adjustment for net income attributable to noncontrolling interests | 12,351 | | | 18,403 | | | 11,521 | |
| | | | | |
| Recoveries applied to negative allowance less Changes in expected recoveries | 988,050 | | | 968,362 | | | — | |
| Collections applied to principal on finance receivables | — | | | — | | | 842,910 | |
| Adjusted EBITDA | $ | 1,378,302 | | | $ | 1,336,528 | | | $ | 1,108,061 | |
(1) Other (income)/expense reflects non-operating related activity.
Additionally, we evaluate our business using certain ratios that use Adjusted EBITDA, including Debt to Adjusted EBITDA, which is calculated by dividing borrowings by Adjusted EBITDA. The following table reflects our Debt to Adjusted EBITDA at December 31, 2021 and 2020 (amounts in thousands).
| | | | | | | | | | | | | | | | | |
| Debt to Adjusted EBITDA |
| 2021 | | 2020 |
| Borrowings | $ | 2,608,714 | | | | $ | 2,661,289 | | |
| Adjusted EBITDA | $ | 1,378,302 | | | | $ | 1,336,528 | | |
| Debt to Adjusted EBITDA | 1.89 | x | | 1.99 | x |
Liquidity and Capital Resources
We actively manage our liquidity to help provide access to sufficient funding to meet our business needs and financial obligations.
Sources of Liquidity
Cash and cash equivalents. As of December 31, 2021, cash and cash equivalents totaled $87.6 million. Of the cash and cash equivalents balance as of December 31, 2021, $61.9 million consisted of cash on hand related to international operations with indefinitely reinvested earnings. See the "Undistributed Earnings of International Subsidiaries" section below for more information.
Borrowings. At December 31, 2021, we had the following borrowings outstanding and availability under our credit facilities (amounts in thousands): | | | | | | | | | | | | | | | | | | | | |
| | Outstanding | | Available without Restrictions | | Available with Restrictions (1) |
Americas revolving credit (2) | | $ | 372,119 | | | $ | 703,865 | | | $ | 131,375 | |
| European revolving credit | | 795,687 | | | 594,313 | | | 493,313 | |
| Term loan | | 460,000 | | | — | | | — | |
| Senior Notes | | 650,000 | | | — | | | — | |
| Convertible Notes | | 345,000 | | | — | | | — | |
| Less: Debt discounts and issuance costs | | (14,092) | | | — | | | — | |
| Total | | $ | 2,608,714 | | | $ | 1,298,178 | | | $ | 624,688 | |
| | | | | | |
| | | | | | |
| | | | | | |
| | | | | | |
(1) Available borrowings after calculation of borrowing base and debt covenants as of December 31, 2021.
(2) Includes North American revolver and the Colombian revolver. For more information, see Note 6 to our Consolidated Financial Statements included in Item 8 of this Form 10-K.
In 2021, we completed the private offering of $350.0 million in aggregate principal amount of its 5.00% Senior Notes due October 1, 2029. The funds received from these notes were used to repay borrowings outstanding under our North American revolver.
Interest-bearing deposits. Per the terms of our European credit facility, we are permitted to obtain interest-bearing deposit funding of up to SEK 1.2 billion (approximately $132.6 million as of December 31, 2021). Interest-bearing deposits as of December 31, 2021 were $124.6 million.
Furthermore, we have the ability to slow the purchase of nonperforming loans if necessary, and use the net cash flow generated from our cash collections from our portfolio of existing nonperforming loans to temporarily service our debt and fund existing operations. For example, we invested $972.3 million in portfolio acquisitions in 2021. The portfolios acquired in 2021 generated $143.3 million of cash collections, representing only 7.0% of 2021 cash collections.
Uses of Liquidity and Material Cash Requirements
Forward Flows. Contractual obligations over the next year are primarily related to purchase commitments. As of December 31, 2021, we have forward flow commitments in place for the purchase of nonperforming loans with a maximum purchase price of $650.6 million, of which $650.0 million is due within the next 12 months. The $650.6 million includes $246.7 million for the Americas and Australia and $403.9 million for Europe. We may also enter into new or renewed forward flow commitments and close on spot transactions in addition to the aforementioned forward flow agreements.
Borrowings. Of our $2.6 billion borrowings at December 31, 2021, estimated interest, unused fees and principal payments for the next 12 months are approximately $107.3 million, of which, $10.3 million relates to principal. Beyond 12 months our principal payment obligations related to debt maturities occur between one and eight years. Many of our financing arrangements include restrictive covenants with which we must comply. As of December 31, 2021, we determined that we were in compliance with these covenants. For more information, see Note 6 to our Consolidated Financial Statements included in Item 8 of this Form 10-K. Share Repurchase. On July 29, 2021, our Board of Directors approved a $150.0 million share repurchase program. On October 28, 2021, the Board of Directors approved an increase of $80.0 million to the Company's existing share repurchase program for a total of $230.0 million. Repurchases may be made from time-to-time in open market transactions, through privately negotiated transactions, through block transactions, or other methods subject to market and/or other conditions and applicable regulations. Repurchases are made using cash on hand and shares repurchased are retired. We are not obligated to repurchase any specified amount of shares and, at our discretion and subject to compliance with applicable laws, the repurchase program may be modified, suspended or discontinued at any time. During the year ended December 31, 2021, we repurchased 4,841,313 shares of our common stock for approximately $212.9 million.
Leases. The majority of our leases have remaining lease terms of one to 14 years. As of December 31, 2021, we had $61.2 million in lease liabilities, of which $11.2 million matures within the next 12 months. For more information, see Note 4 to our Consolidated Financial Statements included in Item 8 of this Form 10-K. Derivatives. Derivative financial instruments are entered into to reduce our exposure to fluctuations in interest rates on variable rate debt and foreign currency exchange rates. As of December 31, 2021, we had $26.0 million of derivative liabilities, of which $17.7 million are due with 12 months. For more information, see Note 9 to our Consolidated Financial Statements included in Item 8 of this Form 10-K. Employment Agreements. We have entered into employment agreements with certain executive officers for approximately $13.0 million, of which $6.5 million is payable if executed within the next 12 months. Our U.S. executive officer agreements mature in December 2023, while executive officer agreements entered into outside of the U.S. are pursuant to local country regulations and typically do not have expiration dates. For more information, see Note 14 to our Consolidated Financial Statements included in Item 8 of this Form 10-K. We believe that funds generated from operations and from cash collections on nonperforming loan portfolios, together with existing cash, available borrowings under our revolving credit facilities, including recent modifications to the terms of those facilities, and access to the capital markets will be sufficient to finance our operations, planned capital expenditures, forward flow purchase commitments, debt maturities and additional portfolio purchases during the next 12 months and beyond. We may seek to access the debt or equity capital markets as we deem appropriate, market permitting. Business acquisitions or higher than expected levels of portfolio purchasing could require additional financing from other sources.
Cash Flows Analysis
The following table summarizes our cash flow activity for the years ended December 31, 2021 and 2020 (amounts in thousands):
| | | | | | | | | | | | | | | | | | | | |
| | 2021 | | 2020 | | Change |
| Total cash provided by (used in): | | | | | | |
| Operating activities | | $ | 84,925 | | | $ | 141,704 | | | $ | (56,779) | |
| Investing activities | | 160,376 | | | 115,003 | | | 45,373 | |
| Financing activities | | (262,812) | | | (252,100) | | | (10,712) | |
| Effect of exchange rate on cash | | (14,464) | | | (7,367) | | | (7,097) | |
| Net decrease in cash and cash equivalents | | $ | (31,975) | | | $ | (2,760) | | | $ | (29,215) | |
Operating Activities
Cash provided by operating activities mainly reflects cash collections recognized as revenue partially offset by cash paid for operating expenses, interest and income taxes. Key drivers of operating activities were adjusted for (i) non-cash items included in net income such as provisions for unrealized gains and losses, changes in expected recoveries, depreciation and amortization, deferred taxes, fair value changes in equity securities and stock-based compensation as well as (ii) changes in the balances of operating assets and liabilities, which can vary significantly in the normal course of business due to the amount and timing of payments.
Net cash provided by operating activities decreased $56.8 million, or 40.1%, during the year ended December 31, 2021 mainly driven by lower cash collections recognized as portfolio income and lower cash paid for income taxes, partially offset by the impact of unrealized foreign currency transactions and higher cash paid for operating expenses.
Investing Activities
Cash provided by investing activities mainly reflects recoveries applied to our negative allowance. Cash used in investing activities mainly reflects acquisitions of nonperforming loans and net investment activity.
Net cash provided by investing activities increased $45.4 million during the year ended December 31, 2021, primarily driven by higher cash collections applied to our negative allowance partially offset by higher purchases of finance receivables. Additionally, investing activities were impacted by our purchase of additional government securities during the second quarter.
Financing Activities
Cash provided by financing activities is normally provided by additional borrowings under our revolving credit facilities and proceeds from debt offerings. Cash used in financing activities is primarily driven by principal payments on our revolving credit facilities, long-term debt and other debt.
Cash used in financing activities increased $10.7 million during the year ended December 31, 2021, primarily due to cash used to repurchase common stock mostly offset by lower net cash used related to borrowings activity, including the payment on convertible notes in the third quarter of 2020 and higher net contributions from noncontrolling interests.
Undistributed Earnings of International Subsidiaries
We intend to use predominantly all of our accumulated and future undistributed earnings of international subsidiaries to expand operations outside the U.S.; therefore, such undistributed earnings of international subsidiaries are considered to be indefinitely reinvested outside the U.S. Accordingly, no provision for income tax or withholding tax has been provided thereon. If management's intentions change and eligible undistributed earnings of international subsidiaries are repatriated, we could be subject to additional income taxes and withholding taxes. This could result in a higher effective tax rate in the period in which such a decision is made to repatriate accumulated or future undistributed international earnings. The amount of cash on hand related to international operations with indefinitely reinvested earnings was $61.9 million and $97.0 million as of December 31, 2021 and 2020, respectively. Refer to the Note 13 to our Consolidated Financial Statements included in Item 8 of this Form 10-K for further information related to our income taxes and undistributed international earnings. Critical Accounting Estimates
Our Consolidated Financial Statements have been prepared in accordance with GAAP. Some of our significant accounting policies require that we use estimates, assumptions and judgments that affect the reported amounts of revenues,
expenses, assets and liabilities. For a discussion of our significant accounting policies refer to Note 1 to our Consolidated Financial Statements included in Item 8 of this Form 10-K. We consider accounting estimates to be critical if (1) the accounting estimates made involve a significant level of estimation uncertainty and (2) has had or are reasonably likely to have a material impact on our financial condition or results of operations. We base our estimates on historical experience, current trends and various other assumptions that we believe are reasonable under the circumstances, the results of which form the basis for making judgments about the carrying values of assets and liabilities that are not readily apparent from other sources. If these estimates differ significantly from actual results, the impact on our Consolidated Financial Statements may be material.
We have determined that the following accounting policies involve critical estimates:
Revenue Recognition - Finance Receivables
Revenue recognition for finance receivables involves the use of estimates and the exercise of judgment on the part of management. These estimates include projections of the amount and timing of future cash flows and economic lives of our pools of accounts. We review pools for trends, actual performance versus projections and curve shape (a graphical depiction of the timing of cash flows). We then re-forecast future cash flows by applying a discounted cash flow methodology to our ERC.
During 2020, we made assumptions that the majority of cash collections overperformance was due to acceleration of future collections rather than an increase to total expected collections. As a result, we reduced cash flow forecasts by the amount of the overperformance. During 2021, this assumption remained relatively consistent with the exception of certain adjustments we applied to near-term forecasted cash collections. In the most recent quarters, we adjusted the next three to six month forecast to reflect the most recent actual results with corresponding reductions to the collection forecast later in the forecast period.
Significant changes in such estimates could result in increased or decreased revenue as we immediately recognize the discounted value of such changes using the constant effective interest rate of the pool. Generally, adjustments to reduce estimated cash forecasts for overperformance experienced in the current period result in a negative adjustment to revenue at an amount less than the impact of the overperformance due to the effects of discounting. Additionally, cash flow forecast increases will generally result in more revenue being recognized. Based on historical data, we determined there was no evidence to suggest that the overperformance in cash was improvement to the total estimated collections instead of acceleration. This assumption resulted in offsetting reductions in future cash flow expectations across most of our geographies. As we continue to perform against these revised expectations, performance may vary, which could result in additional adjustments to our cash flow forecasts with a corresponding adjustment to total portfolio revenue.
Income Taxes
We are subject to income taxes throughout the U.S. and in numerous international jurisdictions. These tax laws are complex and are subject to different interpretations by the taxpayer and the relevant government taxing authorities. When determining our domestic and non-U.S. income tax expense, we make judgments about the application of these inherently complex laws.
We record a tax provision for the anticipated tax consequences of the reported results of operations. The provision for income taxes is estimated using the asset and liability method, under which deferred tax assets and liabilities are recognized for the expected future tax consequences of temporary differences between the financial reporting and tax basis of assets and liabilities, and for operating losses and tax credit carryforwards. Deferred tax assets and liabilities are measured using the currently enacted tax rates that apply to taxable income in effect for the years in which those tax assets are expected to be realized or settled.
We exercise significant judgment in estimating the potential exposure to unresolved tax matters and apply a more likely than not criteria approach for recording tax benefits related to uncertain tax positions in the application of the complex tax laws. While actual results could vary, we believe we have adequate tax accruals with respect to the ultimate outcome of such unresolved tax matters. We record interest and penalties related to unresolved tax matters as a component of income tax expense when the more likely than not standards are met.
If all or part of the deferred tax assets are determined not to be realizable in the future, we would establish a valuation allowance and charge to earnings the impact in the period such a determination is made. If we subsequently realize deferred tax assets that were previously determined to be unrealizable, the respective valuation allowance would be reversed, resulting in a positive adjustment to earnings. The establishment or release of a valuation allowance does not have an impact on cash, nor does such an allowance preclude the use of loss carryforwards or other deferred tax assets in future periods. The calculation of
tax liabilities involves significant judgment in estimating the impact of uncertainties in the application of complex tax laws. Resolution of these uncertainties in a manner inconsistent with our expectations could have a material impact on our results of operations and financial position. For further information regarding our uncertain tax positions, refer to Note 13 to our Consolidated Financial Statements included in Item 8 of this Form 10-K. Recent Accounting Pronouncements
For a summary of recent accounting pronouncements and the anticipated effects on our Consolidated Financial Statements see Note 1 to our Consolidated Financial Statements included in Item 8 of this Form 10-K. Item 7A. Quantitative and Qualitative Disclosures About Market Risk.
Our activities are subject to various financial risks including market risk, currency and interest rate risk, credit risk, liquidity risk and cash flow risk. Our financial risk management program focuses on the unpredictability of financial markets and seeks to minimize potential adverse effects on our financial performance. We may periodically enter into derivative financial instruments, typically interest rate and currency derivatives, to reduce our exposure to fluctuations in interest rates on variable-rate debt, fluctuations in currency rates and their impact on earnings and cash flows. We do not utilize derivative financial instruments with a level of complexity or with a risk greater than the exposure to be managed nor do we enter into or hold derivatives for trading or speculative purposes. Derivative instruments involve, to varying degrees, elements of non-performance, or credit risk. We do not believe that we currently face a significant risk of loss in the event of non-performance by the counterparties associated with these instruments as these transactions were executed with a diversified group of major financial institutions with an investment-grade credit rating. Our intention is to spread our counterparty credit risk across a number of counterparties so that exposure to a single counterparty is minimized.
Interest Rate Risk
We are subject to interest rate risk from outstanding borrowings on our variable rate credit facilities. As such, our consolidated financial results are subject to fluctuations due to changes in the market rate of interest. We assess this interest rate risk by estimating the increase or decrease in interest expense that would occur due to a change in short-term interest rates. The borrowings on our variable rate credit facilities were approximately $1.6 billion as of December 31, 2021. Based on our current debt structure, assuming a 50 basis point decrease in interest rates, for example, interest expense over the following 12 months would increase by an estimated $0.4 million. Assuming a 50 basis point increase in interest rates, interest expense over the following 12 months would increase by an estimated $4.8 million.
To reduce the exposure to changes in the market rate of interest and to be in compliance with the terms of our European credit facility, we have entered into interest rate derivative contracts for a portion of our borrowings under our floating rate financing arrangements. We apply hedge accounting to certain of our interest rate derivative contracts. By applying hedge accounting, changes in market value are reflected as adjustments in other comprehensive income. All derivatives to which we have applied hedge accounting were evaluated and remain highly effective at December 31, 2021. Terms of the interest rate derivative contracts require us to receive a variable interest rate and pay a fixed interest rate. The sensitivity calculations above consider the impact of our interest rate derivative contracts and zero floors on revolving loans under both our North America and European credit facilities.
Currency Exchange Risk
We operate internationally and enter into transactions denominated in various foreign currencies. In 2021, we generated $443.7 million of revenues from operations outside the U.S. and used 12 functional currencies, excluding the U.S. dollar. Weakness in one particular currency might be offset by strength in other currencies over time.
As a result of our international operations, fluctuations in foreign currencies could cause us to incur foreign currency exchange gains and losses, and could adversely affect our comprehensive income and stockholders' equity. Additionally, our reported financial results could change from period to period due solely to fluctuations between currencies.
Foreign currency gains and losses are primarily the result of the re-measurement of transactions in certain other currencies into an entity's functional currency. Foreign currency gains and losses are included as a component of other income and (expense) in our Consolidated Income Statements. From time to time we may elect to enter into foreign exchange derivative contracts to reduce these variations in our Consolidated Income Statements.
When an entity's functional currency is different than the reporting currency of its parent, foreign currency translation adjustments may occur. Foreign currency translation adjustments are included as a component of other comprehensive (loss)/
income in our Consolidated Statements of Comprehensive Income and as a component of equity in our Consolidated Balance Sheets.
We have taken measures to mitigate the impact of foreign currency fluctuations. We have organized our European operations so that portfolio ownership and collections generally occur within the same entity. Our European credit facility is a multi-currency facility, allowing us to better match funding and portfolio acquisitions by currency. We actively monitor the value of our finance receivables by currency. In the event adjustments are required to our liability composition by currency we may, from time to time, execute re-balancing foreign exchange contracts to more closely align funding and portfolio acquisitions by currency.
Item 8. Financial Statements and Supplementary Data.
Index to Financial Statements
Report of Independent Registered Public Accounting Firm
To the Stockholders and Board of Directors
PRA Group, Inc.:
Opinion on the Consolidated Financial Statements
We have audited the accompanying consolidated balance sheets of PRA Group, Inc. and subsidiaries (the Company) as of December 31, 2021 and 2020, the related consolidated income statements, statements of comprehensive income, changes in equity, and cash flows for each of the years in the three-year period ended December 31, 2021, and the related notes (collectively, the consolidated financial statements). In our opinion, the consolidated financial statements present fairly, in all material respects, the financial position of the Company as of December 31, 2021 and 2020, and the results of its operations and its cash flows for each of the years in the three-year period ended December 31, 2021, in conformity with U.S. generally accepted accounting principles.
We also have audited, in accordance with the standards of the Public Company Accounting Oversight Board (United States) (PCAOB), the Company’s internal control over financial reporting as of December 31, 2021, based on criteria established in Internal Control – Integrated Framework (2013) issued by the Committee of Sponsoring Organizations of the Treadway Commission, and our report dated February 28, 2022 expressed an unqualified opinion on the effectiveness of the Company’s internal control over financial reporting.
Changes in Accounting Principle
As discussed in Note 1 to the consolidated financial statements, the Company has changed its method of accounting for convertible instruments as of January 1, 2021 due to the adoption of Accounting Standards Update (ASU) 2020-06, Accounting for Convertible Instruments and Contracts in an Entity’s Own Equity.
As discussed in Note 1 to the consolidated financial statements, the Company has changed its method of accounting for expected credit losses for financial instruments as of January 1, 2020 due to the adoption of Accounting Standards Codification (ASC) Topic 326, Financial Instruments - Credit Losses.
Basis for Opinion
These consolidated financial statements are the responsibility of the Company’s management. Our responsibility is to express an opinion on these consolidated financial statements based on our audits. We are a public accounting firm registered with the PCAOB and are required to be independent with respect to the Company in accordance with the U.S. federal securities laws and the applicable rules and regulations of the Securities and Exchange Commission and the PCAOB.
We conducted our audits in accordance with the standards of the PCAOB. Those standards require that we plan and perform the audit to obtain reasonable assurance about whether the consolidated financial statements are free of material misstatement, whether due to error or fraud. Our audits included performing procedures to assess the risks of material misstatement of the consolidated financial statements, whether due to error or fraud, and performing procedures that respond to those risks. Such procedures included examining, on a test basis, evidence regarding the amounts and disclosures in the consolidated financial statements. Our audits also included evaluating the accounting principles used and significant estimates made by management, as well as evaluating the overall presentation of the consolidated financial statements. We believe that our audits provide a reasonable basis for our opinion.
Critical Audit Matter
The critical audit matter communicated below is a matter arising from the current period audit of the consolidated financial statements that was communicated or required to be communicated to the audit committee and that: (1) relates to accounts or disclosures that are material to the consolidated financial statements and (2) involved our especially challenging, subjective, or complex judgments. The communication of a critical audit matter does not alter in any way our opinion on the consolidated financial statements, taken as a whole, and we are not, by communicating the critical audit matter below, providing a separate opinion on the critical audit matter or on the accounts or disclosures to which it relates.
Assessment of the estimate of expected recoveries on purchased credit deteriorated assets
As discussed in Note 2 to the consolidated financial statements, the Company’s estimate of expected recoveries on purchased credit deteriorated assets as of December 31, 2021 was $3.4 billion, presented as finance receivables, net in the consolidated balance sheet, and the resulting changes in expected recoveries for the year ended December 31, 2021 were $197.9 million. The Company accounts for the estimate of expected recoveries and resulting changes in expected
recoveries under the guidance of ASC Topic 326, Financial Instruments - Credit Losses. The Company develops its estimate of expected recoveries by applying a discounted cash flow methodology to its estimated remaining collections (“ERC”). Subsequent changes (favorable and unfavorable) in expected cash flows are recognized within changes in expected recoveries by adjusting the present value of increases or decreases in ERC at a constant effective interest rate. Factors that may contribute to the changes in expected cash flows include both external and internal factors such as trends in collections performance and operational activities. When the Company has an expectation of collecting cash flows at the portfolio level, a negative allowance is established for expected recoveries at an amount not to exceed the amount paid for the financial portfolios. The negative allowance is recorded as an asset and presented as finance receivables, net on the Company's consolidated balance sheets. The Company pools accounts with similar risk characteristics that are acquired in the same year.
We identified the assessment of the estimate of expected recoveries on purchased credit deteriorated assets as a critical audit matter. A high degree of audit effort, including specialized skills and knowledge, and complex auditor judgment was involved in the assessment of the expected recoveries due to significant measurement uncertainty. Specifically, the assessment encompassed the evaluation of the methodology used to estimate recoveries, including the inputs and significant assumptions related to estimating the expected recoveries. Such inputs and significant assumptions include historical trends and actual performance versus projections and certain qualitative factors. In addition, auditor judgment was required to evaluate the sufficiency of audit evidence obtained.
The following are the primary procedures we performed to address this critical audit matter. We evaluated the design and tested the operating effectiveness of certain internal controls related to the Company's continued use and appropriateness of changes made to (1) the methodology and estimate of expected recoveries, including controls over the inputs and significant assumptions, and (2) the performance monitoring of the expected recoveries and incorporation of qualitative factors into the estimate of expected recoveries. We evaluated the Company’s process to assess the estimates by testing certain sources of data, factors, and assumptions that the Company used, and considered the relevance and reliability of such data, factors, and assumptions. In addition, we involved credit risk professionals with specialized industry knowledge and experience who assisted in evaluating the methodology for compliance with U.S. generally accepted accounting principles and assessing the Company's estimates of expected recoveries, including the inputs and significant assumptions, for a selection of pools of finance receivables by comparing to historical trends. We also assessed the sufficiency of the audit evidence obtained related to the Company’s expected recoveries by evaluating the cumulative results of the audit procedures and potential bias in the accounting estimate.
/s/ KPMG LLP
We have served as the Company’s auditor since 2007.
Norfolk, Virginia
February 28, 2022
PRA Group, Inc.
Consolidated Balance Sheets
December 31, 2021 and 2020
(Amounts in thousands, except per share amounts) | | | | | | | | | | | |
| 2021 | | 2020 |
| Assets | | | |
| Cash and cash equivalents | $ | 87,584 | | | $ | 108,613 | |
| | | |
| Investments | 92,977 | | | 55,759 | |
| Finance receivables, net | 3,428,285 | | | 3,514,788 | |
| | | |
| Income taxes receivable | 41,146 | | | 21,928 | |
| Deferred tax assets, net | 67,760 | | | 83,205 | |
| Right-of-use assets | 56,713 | | | 52,951 | |
| Property and equipment, net | 54,513 | | | 58,356 | |
| Goodwill | 480,263 | | | 492,989 | |
| | | |
| Other assets | 57,002 | | | 64,472 | |
| | | |
| Total assets | $ | 4,366,243 | | | $ | 4,453,061 | |
| Liabilities and Equity | | | |
| Liabilities: | | | |
| Accounts payable | $ | 3,821 | | | $ | 5,294 | |
| Accrued expenses | 127,802 | | | 97,320 | |
| Income taxes payable | 19,276 | | | 29,692 | |
| Deferred tax liabilities, net | 36,630 | | | 40,867 | |
| Lease liabilities | 61,188 | | | 57,348 | |
| Interest-bearing deposits | 124,623 | | | 132,739 | |
| Borrowings | 2,608,714 | | | 2,661,289 | |
| Other liabilities | 59,352 | | | 54,986 | |
| | | |
| Total liabilities | 3,041,406 | | | 3,079,535 | |
| | | |
| Equity: | | | |
Preferred stock, $0.01 par value, 2,000 shares authorized, no shares issued and outstanding | — | | | — | |
Common stock, $0.01 par value, 100,000 shares authorized, 41,008 shares issued and outstanding at December 31, 2021; 100,000 shares authorized, 45,585 shares issued and outstanding at December 31, 2020 | 410 | | | 456 | |
| Additional paid-in capital | — | | | 75,282 | |
| Retained earnings | 1,552,845 | | | 1,511,970 | |
| Accumulated other comprehensive loss | (266,909) | | | (245,791) | |
| Total stockholders' equity - PRA Group, Inc. | 1,286,346 | | | 1,341,917 | |
| Noncontrolling interests | 38,491 | | | 31,609 | |
| Total equity | 1,324,837 | | | 1,373,526 | |
| Total liabilities and equity | $ | 4,366,243 | | | $ | 4,453,061 | |
The accompanying notes are an integral part of these Consolidated Financial Statements.
PRA Group, Inc.
Consolidated Income Statements
For the years ended December 31, 2021, 2020 and 2019
(Amounts in thousands, except per share amounts) | | | | | | | | | | | | | | | | | |
| 2021 | | 2020 | | 2019 |
| Revenues: | | | | | |
| Portfolio income | $ | 875,327 | | | $ | 984,036 | | | $ | — | |
| Changes in expected recoveries | 197,904 | | | 69,297 | | | — | |
| Total portfolio revenue | 1,073,231 | | | 1,053,333 | | | — | |
| Income recognized on finance receivables | — | | | — | | | 998,361 | |
| Fee income | 14,699 | | | 9,748 | | | 15,769 | |
| Other revenue | 7,802 | | | 2,333 | | | 2,951 | |
| Total revenues | 1,095,732 | | | 1,065,414 | | | 1,017,081 | |
| | | | | |
| Net allowance charges | — | | | — | | | (24,025) | |
| | | | | |
| Operating expenses: | | | | | |
| Compensation and employee services | 301,981 | | | 295,150 | | | 310,441 | |
| Legal collection fees | 47,206 | | | 53,758 | | | 55,261 | |
| Legal collection costs | 78,330 | | | 101,635 | | | 134,156 | |
| Agency fees | 63,140 | | | 56,418 | | | 55,812 | |
| Outside fees and services | 92,615 | | | 84,087 | | | 63,513 | |
| Communication | 42,755 | | | 40,801 | | | 44,057 | |
| Rent and occupancy | 18,376 | | | 17,973 | | | 17,854 | |
| Depreciation and amortization | 15,256 | | | 18,465 | | | 17,464 | |
| Other operating expenses | 61,077 | | | 47,426 | | | 46,811 | |
| | | | | |
| Total operating expenses | 720,736 | | | 715,713 | | | 745,369 | |
| | | | | |
| | | | | |
| Income from operations | 374,996 | | | 349,701 | | | 247,687 | |
| | | | | |
| Other income and (expense): | | | | | |
| | | | | |
| Interest expense, net | (124,143) | | | (141,712) | | | (141,918) | |
| Foreign exchange (loss)/gain | (809) | | | 2,005 | | | 11,954 | |
| Other | 282 | | | (1,049) | | | (364) | |
| Income before income taxes | 250,326 | | | 208,945 | | | 117,359 | |
| Income tax expense | 54,817 | | | 41,203 | | | 19,680 | |
| Net income | 195,509 | | | 167,742 | | | 97,679 | |
| Adjustment for net income attributable to noncontrolling interests | 12,351 | | | 18,403 | | | 11,521 | |
| Net income attributable to PRA Group, Inc. | $ | 183,158 | | | $ | 149,339 | | | $ | 86,158 | |
| | | | | |
| Net income per share attributable to PRA Group, Inc.: | | | | | |
| Basic | $ | 4.07 | | | $ | 3.28 | | | $ | 1.90 | |
| Diluted | $ | 4.04 | | | $ | 3.26 | | | $ | 1.89 | |
| Weighted average number of shares outstanding: | | | | | |
| Basic | 44,960 | | | 45,540 | | | 45,387 | |
| Diluted | 45,330 | | | 45,860 | | | 45,577 | |
The accompanying notes are an integral part of these Consolidated Financial Statements.
PRA Group, Inc.
Consolidated Statements of Comprehensive Income
For the years ended December 31, 2021, 2020 and 2019
(Amounts in thousands) | | | | | | | | | | | | | | | | | |
| | 2021 | | 2020 | | 2019 |
| Net income | $ | 195,509 | | | $ | 167,742 | | | $ | 97,679 | |
| Other comprehensive (loss)/income, net of tax | | | | | |
| Currency translation adjustments | (56,219) | | | 20,056 | | | (6,359) | |
| Cash flow hedges | 27,978 | | | (20,261) | | | (13,132) | |
| Debt securities available-for-sale | (348) | | | 171 | | | 39 | |
| Other comprehensive loss | (28,589) | | | (34) | | | (19,452) | |
| Total comprehensive income | 166,920 | | | 167,708 | | | 78,227 | |
| Less comprehensive income attributable to noncontrolling interests | 4,880 | | | 3,141 | | | 10,978 | |
| Comprehensive income attributable to PRA Group, Inc. | $ | 162,040 | | | $ | 164,567 | | | $ | 67,249 | |
The accompanying notes are an integral part of these Consolidated Financial Statements.
PRA Group, Inc.
Consolidated Statements of Changes in Equity
For the years ended December 31, 2021, 2020 and 2019
(Amounts in thousands) | | | | | | | | | | | | | | | | | | | | | | | | | | | | | | | | | | | | | | | | | |
| Common Stock | | Additional Paid-in Capital | | Retained Earnings | | Accumulated Other Comprehensive (Loss) | | Noncontrolling Interests | | Total Equity |
| Shares | | Amount | | | | | |
| Balance at December 31, 2018 | 45,304 | | | $ | 453 | | | $ | 60,303 | | | $ | 1,276,473 | | | $ | (242,109) | | | $ | 28,849 | | | $ | 1,123,969 | |
| Components of comprehensive income, net of tax: | | | | | | | | | | | | | |
| Net income | — | | | — | | | — | | | 86,158 | | | — | | | 11,521 | | | 97,679 | |
| Currency translation adjustment | — | | | — | | | — | | | — | | | (5,816) | | | (543) | | | (6,359) | |
| Cash flow hedges | — | | | — | | | — | | | — | | | (13,132) | | | — | | | (13,132) | |
| Debt securities available-for-sale | — | | | — | | | — | | | — | | | 39 | | | — | | | 39 | |
| Distributions to noncontrolling interest | — | | | — | | | — | | | — | | | — | | | (6,877) | | | (6,877) | |
| Contributions from noncontrolling interest | — | | | — | | | — | | | — | | | — | | | 24,675 | | | 24,675 | |
| Vesting of restricted stock | 112 | | | 1 | | | (1) | | | — | | | — | | | — | | | — | |
| Share-based compensation expense | — | | | — | | | 10,717 | | | — | | | — | | | — | | | 10,717 | |
| Employee stock relinquished for payment of taxes | — | | | — | | | (1,609) | | | — | | | — | | | — | | | (1,609) | |
| Other | — | | | — | | | (2,089) | | | — | | | — | | | — | | | (2,089) | |
| | | | | | | | | | | | | |
| | | | | | | | | | | | | |
| | | | | | | | | | | | | |
| Balance at December 31, 2019 | 45,416 | | | $ | 454 | | | $ | 67,321 | | | $ | 1,362,631 | | | $ | (261,018) | | | $ | 57,625 | | | $ | 1,227,013 | |
| Components of comprehensive income, net of tax: | | | | | | | | | | | | | |
| Net income | — | | | — | | | — | | | 149,339 | | | — | | | 18,403 | | | 167,742 | |
| Currency translation adjustment | — | | | — | | | — | | | — | | | 35,317 | | | (15,261) | | | 20,056 | |
| Cash flow hedges | — | | | — | | | — | | | — | | | (20,261) | | | — | | | (20,261) | |
| Debt securities available-for-sale | — | | | — | | | — | | | — | | | 171 | | | — | | | 171 | |
| Distributions to noncontrolling interest | — | | | — | | | — | | | — | | | — | | | (30,276) | | | (30,276) | |
| Contributions from noncontrolling interest | — | | | — | | | — | | | — | | | — | | | 1,118 | | | 1,118 | |
| | | | | | | | | | | | | |
| Vesting of restricted stock | 169 | | | 2 | | | (2) | | | — | | | — | | | — | | | — | |
| | | | | | | | | | | | | |
| Shared-based compensation expense | — | | | — | | | 14,387 | | | — | | | — | | | — | | | 14,387 | |
| | | | | | | | | | | | | |
| | | | | | | | | | | | | |
| Employee stock relinquished for payment of taxes | — | | | — | | | (3,299) | | | — | | | — | | | — | | | (3,299) | |
| | | | | | | | | | | | | |
| Other | — | | | — | | | (3,125) | | | — | | | — | | | — | | | (3,125) | |
| Balance at December 31, 2020 | 45,585 | | | $ | 456 | | | $ | 75,282 | | | $ | 1,511,970 | | | $ | (245,791) | | | $ | 31,609 | | | $ | 1,373,526 | |
Effect of change in accounting principle (1) | — | | | — | | | (26,697) | | | 12,008 | | | — | | | — | | | (14,689) | |
| Balance at January 1, 2021 | 45,585 | | | 456 | | | 48,585 | | | 1,523,978 | | | (245,791) | | | 31,609 | | | 1,358,837 | |
| Components of comprehensive income, net of tax: | | | | | | | | | | | | | |
| Net income | — | | | — | | | — | | | 183,158 | | | — | | | 12,351 | | | 195,509 | |
| Currency translation adjustments | — | | | — | | | — | | | — | | | (48,748) | | | (7,471) | | | (56,219) | |
| Cash flow hedges | — | | | — | | | — | | | — | | | 27,978 | | | — | | | 27,978 | |
| Debt securities available-for-sale | — | | | — | | | — | | | — | | | (348) | | | — | | | (348) | |
| Distributions to noncontrolling interest | — | | | — | | | — | | | — | | | — | | | (21,411) | | | (21,411) | |
| Contributions from noncontrolling interests | — | | | — | | | — | | | — | | | — | | | 23,413 | | | 23,413 | |
| Vesting of restricted stock | 264 | | | 2 | | | (2) | | | — | | | — | | | — | | | — | |
| Repurchase and cancellation of common stock | (4,841) | | | (48) | | | (58,531) | | | (154,291) | | | — | | | — | | | (212,870) | |
| Share-based compensation expense | — | | | — | | | 15,940 | | | — | | | — | | | — | | | 15,940 | |
| Employee stock relinquished for payment of taxes | — | | | — | | | (5,992) | | | — | | | — | | | — | | | (5,992) | |
| | | | | | | | | | | | | |
| | | | | | | | | | | | | |
| | | | | | | | | | | | | |
| | | | | | | | | | | | | |
| | | | | | | | | | | | | |
| Balance at December 31, 2021 | 41,008 | | | $ | 410 | | | $ | — | | | $ | 1,552,845 | | | $ | (266,909) | | | $ | 38,491 | | | $ | 1,324,837 | |
(1) Refer to Note 1 for further detail. The accompanying notes are an integral part of these Consolidated Financial Statements.
PRA Group, Inc.
Consolidated Statements of Cash Flows
For the years ended December 31, 2021, 2020 and 2019
(Amounts in thousands) | | | | | | | | | | | | | | | | | |
| 2021 | | 2020 | | 2019 |
| Cash flows from operating activities: | | | | | |
| Net income | $ | 195,509 | | | $ | 167,742 | | | $ | 97,679 | |
| Adjustments to reconcile net income to net cash provided by operating activities: | | | | | |
| Share-based compensation expense | 15,940 | | | 14,387 | | | 10,717 | |
| | | | | |
| Depreciation and amortization | 15,256 | | | 18,465 | | | 17,464 | |
| | | | | |
| Amortization of debt discount and issuance costs | 9,508 | | | 21,063 | | | 22,987 | |
| | | | | |
| | | | | |
| Changes in expected recoveries | (197,904) | | | (69,297) | | | — | |
| Deferred income taxes | 6,803 | | | (58,503) | | | (37,561) | |
| Net unrealized foreign currency transactions | 29,003 | | | 15,240 | | | (4,543) | |
| | | | | |
| Fair value in earnings for equity securities | (386) | | | 977 | | | (5,826) | |
| Net allowance charges | — | | | — | | | 24,025 | |
| Other operating activities | (211) | | | (893) | | | (234) | |
| Changes in operating assets and liabilities: | | | | | |
| Other assets | 195 | | | (4,644) | | | 9,613 | |
| | | | | |
| Accounts payable | (1,323) | | | 914 | | | (2,070) | |
| Income taxes payable, net | (30,824) | | | 22,001 | | | (12,375) | |
| Accrued expenses | 19,586 | | | 7,767 | | | 11,632 | |
| Other liabilities | 23,691 | | | 6,496 | | | 1,149 | |
| Right of use assets/lease liabilities | 82 | | | (11) | | | 731 | |
| Net cash provided by operating activities | 84,925 | | | 141,704 | | | 133,388 | |
| Cash flows from investing activities: | | | | | |
| Purchases of property and equipment, net | (11,212) | | | (17,230) | | | (18,033) | |
| | | | | |
| Purchases of finance receivables | (971,708) | | | (903,588) | | | (1,231,351) | |
| Recoveries applied to negative allowance | 1,185,954 | | | 1,037,659 | | | — | |
| Collections applied to principal on finance receivables | — | | | — | | | 842,910 | |
| Purchase of investments | (110,915) | | | (45,229) | | | (83,291) | |
| Proceeds from sales and maturities of investments | 68,904 | | | 43,391 | | | 75,008 | |
| Business acquisition, net of cash acquired | (647) | | | — | | | (57,610) | |
| Proceeds from sale of subsidiaries, net | — | | | — | | | 31,177 | |
| | | | | |
| | | | | |
| | | | | |
| Net cash provided by/(used in) investing activities | 160,376 | | | 115,003 | | | (441,190) | |
| Cash flows from financing activities: | | | | | |
| | | | | |
| | | | | |
| | | | | |
| Proceeds from lines of credit | 769,903 | | | 1,290,799 | | | 1,340,700 | |
| Principal payments on lines of credit | (1,163,075) | | | (1,557,186) | | | (728,282) | |
| Payments on convertible senior notes | — | | | (287,442) | | | — | |
| Proceeds from senior notes | 350,000 | | | 300,000 | | | — | |
| Proceeds from long-term debt | — | | | 55,000 | | | — | |
| Principal payments on long-term debt | (10,000) | | | (10,000) | | | (313,165) | |
| Repurchases of common stock | (200,887) | | | — | | | — | |
Payments of origination costs and fees
| (9,479) | | | (17,218) | | | — | |
| | | | | |
| Tax withholdings related to share-based payments | (5,992) | | | (3,301) | | | (1,609) | |
| Distributions paid to noncontrolling interest | (21,411) | | | (30,276) | | | (6,877) | |
| Contributions from noncontrolling interest | 23,413 | | | 1,118 | | | 24,675 | |
| Cash paid for purchase of portion of noncontrolling interest | — | | | — | | | (1,255) | |
| Net increase in interest-bearing deposits | 4,716 | | | 9,591 | | | 27,427 | |
| Other financing activities | — | | | (3,185) | | | (2,091) | |
| | | | | |
| Net cash (used in)/provided by financing activities | (262,812) | | | (252,100) | | | 339,523 | |
| Effect of exchange rate on cash | (14,464) | | | (7,367) | | | (6,609) | |
| Net (decrease)/increase in cash and cash equivalents | (31,975) | | | (2,760) | | | 25,112 | |
| Cash and cash equivalents, beginning of the year | 121,047 | | | 123,807 | | | 98,695 | |
| Cash and cash equivalents, end of year | $ | 89,072 | | | $ | 121,047 | | | $ | 123,807 | |
| Supplemental disclosure of cash flow information: | | | | | |
| Cash paid for interest | $ | 112,277 | | | $ | 117,986 | | | $ | 119,424 | |
| Cash paid for income taxes | 77,817 | | | 80,856 | | | 68,979 | |
| Cash, cash equivalents and restricted cash reconciliation: | | | | | |
| Cash, cash equivalents per Consolidated Balance Sheets | $ | 87,584 | | | $ | 108,613 | | | $ | 119,774 | |
| Restricted cash included in Other Assets per Consolidated Balance Sheets | 1,488 | | | 12,434 | | | 4,033 | |
| Total cash, cash equivalents and restricted cash | $ | 89,072 | | | $ | 121,047 | | | $ | 123,807 | |
| | | | | |
| | | | | |
| | | | | |
| | | | | |
| | | | | |
| | | | | |
| | | | | |
The accompanying notes are an integral part of these Consolidated Financial Statements.
PRA Group, Inc.
Notes to Consolidated Financial Statements
1. General and Summary of Significant Accounting Policies:
Nature of operations: As used herein, the terms "PRA Group," the "Company," or similar terms refer to PRA Group, Inc. and its subsidiaries.
PRA Group, Inc., a Delaware corporation, is a global financial and business services company with operations in the Americas, Europe and Australia. The Company's primary business is the purchase, collection and management of portfolios of nonperforming loans. The Company also provides fee-based services on class action claims recoveries and by servicing of consumer bankruptcy accounts in the United States ("U.S.").
Since March 2020, the world has been, and continues to be, impacted by the novel coronavirus ("COVID-19") and its variants. The Company has taken steps to modify its operations to mitigate adverse effects where possible while conforming with various COVID-19 protocols within the countries in which it operates. These actions have allowed the Company to operate its business while minimizing disruption and complying with country-specific, federal, state and local laws, regulations and governmental actions related to the pandemic.
Basis of presentation: The Consolidated Financial Statements of the Company are prepared in accordance with U.S. generally accepted accounting principles ("GAAP"). The preparation of the Consolidated Financial Statements in conformity with GAAP requires management to make estimates and assumptions that affect reported amounts and disclosures. Realized results could differ from those estimates and assumptions.
Changes in accounting principles: Beginning January 1, 2021, the Company implemented Accounting Standards Update ("ASU") 2020-06 Debt-Debt with Conversion and Other Options (Subtopic 470-20) and Derivatives and Hedging-Contracts in Entity’s Own Equity (Subtopic 815-40): Accounting for Convertible Instruments and Contracts in an Entity’s Own Equity ("ASU 2020-06") using a modified retrospective method. See Convertible Notes accounting policy below for more information.
Beginning January 1, 2020, the Company implemented Accounting Standards Codification ("ASC") Financial Instruments-Credit Losses ("ASC 326"), on a prospective basis. Prior to January 1, 2020, the Company's investments in finance receivables were accounted for under ASC 310-30 "Loans and Debt Securities Acquired with Deteriorated Credit Quality" ("ASC 310-30").
Reclassification of prior year presentation: Certain prior year amounts have been reclassified for consistency with the current year presentation. Other receivables and Restricted cash are now included within Other assets on the Consolidated Balance Sheets. They were previously separate line items.
Consolidation: The Consolidated Financial Statements include the accounts of PRA Group and other entities in which the Company has a controlling interest. All significant intercompany accounts and transactions have been eliminated.
Entities in which the Company has a controlling financial interest, through ownership of the majority of the entities’ voting equity interests, or through other contractual rights that give the Company control, consist of entities that purchase and collect on portfolios of nonperforming loans.
Investments in companies in which the Company has significant influence over operating and financing decisions, but does not own a majority of the voting equity interests, are accounted for in accordance with the equity method of accounting, which requires the Company to recognize its proportionate share of the entity’s net earnings. These investments are included in Other assets, with income or loss included in Other revenue.
The Company performs on-going reassessments whether changes in the facts and circumstances regarding the Company’s involvement with an entity cause the Company’s consolidation conclusion to change.
Foreign currency: Assets and liabilities have been translated to the reporting currency using the exchange rates in effect on the Consolidated Balance Sheets dates. Equity accounts are translated at historical rates, except for the change in retained earnings during the year, which is the result of the income statement translation process. Revenue and expense accounts are translated using the weighted average exchange rate during the period. The cumulative translation adjustments associated with the net assets of international subsidiaries are recorded in Accumulated other comprehensive loss in the accompanying Consolidated Statements of Changes in Equity.
Segments: The Company has determined that it has two operating segments that meet the aggregation criteria of ASC 280, Segment Reporting ("ASC 280"), and, therefore, it has one reportable segment, accounts receivable management.
PRA Group, Inc.
Notes to Consolidated Financial Statements
This conclusion is based on similarities among the operating segments, including economic characteristics, the nature of the products and services, the nature of the production processes, the types or classes of customers for their products and services, the methods used to distribute their products and services and the nature of the regulatory environment.
Revenues and long-lived assets by geographical location: Revenue for the years ended December 31, 2021, 2020 and 2019, and long-lived assets held at December 31, 2021 and 2020, both for the U.S., the Company's country of domicile, and outside of the U.S. were (amounts in thousands):
| | | | | | | | | | | | | | | | | | | | | | | | | | | | | |
| | | |
| 2021 | | 2020 | | 2019 | | 2021 | | 2020 |
| Revenues (2) | | Long-Lived Assets |
| United States | $ | 651,991 | | | $ | 677,234 | | | $ | 673,264 | | | $ | 87,881 | | | $ | 99,271 | |
| United Kingdom | 175,383 | | | 132,749 | | | 120,377 | | | 7,264 | | | 2,500 | |
Others (1) | 268,358 | | | 255,431 | | | 223,440 | | | 16,081 | | | 9,536 | |
| Total | $ | 1,095,732 | | | $ | 1,065,414 | | | $ | 1,017,081 | | | $ | 111,226 | | | $ | 111,307 | |
(1) None of the countries included in "Others" comprise greater than 10% of the Company's consolidated revenues or long-lived assets.
(2) Based on the Company’s financial statement information used to produce the Company's general-purpose financial statements, it is impracticable to report further breakdowns of revenues from external customers by product or service.
Revenues are attributed to countries based on the location of the related operations. Long-lived assets consist of net property and equipment and right-of-use assets. The Company reports revenues earned from collection activities on finance receivables, fee-based services and investments. For additional information on the Company's investments, see Note 3. Cash and cash equivalents: The Company considers all highly liquid investments with a maturity of three months or less when purchased to be cash equivalents.
Restricted cash: Cash that is subject to legal restrictions or is unavailable for general operating purposes is classified as restricted cash and included in Other assets on the Company's Consolidated Balance Sheets.
Concentrations of credit risk: Financial instruments, which potentially expose the Company to concentrations of credit risk, consist primarily of cash and cash equivalents, investments, derivative instruments and finance receivables.
Accumulated other comprehensive loss: The Company records unrealized gains and losses on certain available-for-sale investments and foreign currency translation adjustments in other comprehensive income ("OCI"). Unrealized gains and losses on available for sale investments are reclassified to earnings as the gains or losses are realized upon sale of the securities. Translation gains or losses on foreign currency translation adjustments are reclassified to earnings upon the substantial sale or liquidation of investments in international operations. For the Company’s financial derivative instruments that are designated as hedging instruments, the change in fair value of the derivative is recorded in OCI.
Investments:
Debt Securities: The Company determines the appropriate classification of its investments in debt securities at the time of purchase and reevaluates such determinations at each balance sheet date. Debt securities are classified as held-to-maturity when the Company has the positive intent and ability to hold the securities to maturity. Held-to-maturity securities are carried at amortized cost. Debt securities for which the Company does not have the intent or ability to hold to maturity are classified as available-for-sale. Available-for-sale securities are carried at fair market value. Fair value is determined using quoted market prices. Unrealized gains and losses are included in comprehensive income and reported in stockholders' equity. The Company evaluates debt securities for impairment. When there has been a decline in fair value below the amortized cost, the Company recognizes an impairment if: (1) it has the intent to sell the security; (2) it is more likely than not that it will be required to sell the security before recovery of the amortized cost; or (3) it does not expect to recover the entire amortized cost of the security. If the Company identifies that the decline in fair value has resulted from credit losses, the credit loss component is recognized as an allowance on the Consolidated Balance Sheets with a corresponding charge to Other expense on the Consolidated Income Statements. The non-credit loss component remains in Other comprehensive loss until realized from a sale or subsequent impairment.
Equity Securities: Investments in equity securities are measured at fair value with changes in unrealized gains and losses reported in earnings.
Equity Method Investments: Equity investments that are not consolidated, but over which the Company exercises significant influence, are accounted for as equity method investments. Whether or not the Company exercises significant influence with respect to an investee company depends on an evaluation of several factors including, among others,
PRA Group, Inc.
Notes to Consolidated Financial Statements
representation on the investee company’s board of directors and ownership level, which is generally a 20% to 50% interest in the voting securities of the investee company. Under the equity method of accounting, an investee company’s accounts are not reflected within the Company’s Consolidated Balance Sheets and Income Statements; however, the Company’s share of the earnings or losses of the investee company is reflected in the caption ‘‘Other revenue’’ in the Consolidated Income Statements. The Company’s carrying value in an equity method investee company is reflected in the caption ‘‘Investments’’ in the Company’s Consolidated Balance Sheets.
When the Company’s carrying value in an equity method investee company is reduced to zero, no further losses are recorded in the Company’s Consolidated Financial Statements unless the Company guaranteed obligations of the investee company or has committed additional funding. When the investee company subsequently reports income, the Company will not record its share of such income until it equals the amount of its share of losses not previously recognized.
Finance receivables and income recognition: The Company's financial assets (or a group of financial assets) are measured at amortized cost and presented at the net amount expected to be collected.
Credit quality information: The Company acquires portfolios of accounts that have experienced deterioration of credit quality between origination and the Company's acquisition of the accounts. The amount paid for a portfolio reflects the Company's determination that it is probable the Company will be unable to collect all amounts due according to an account's contractual terms. The Company accounts for the portfolios in accordance with the guidance for purchased credit deteriorated ("PCD") assets. The initial allowance for credit losses is added to the purchase price rather than recorded as a credit loss expense. The Company has established a policy to write off the amortized cost of individual assets when it deems probable that it will not collect on an individual asset. Due to the deteriorated credit quality of the individual accounts, the Company may write off the unpaid principal balance of all accounts in a portfolio at the time of acquisition. However, when the Company has an expectation of collecting cash flows at the portfolio level, a negative allowance is established for expected recoveries at an amount not to exceed the amount paid for the financial portfolios. The negative allowance is recorded as an asset and presented as Finance receivables, net on the Company's Consolidated Balance Sheets.
Portfolio segments: The Company develops systematic methodologies to determine its allowance for credit losses at the portfolio segment level. The Company’s nonperforming loan portfolio segments consist of two broad categories: Core and Insolvency. The Company’s Core portfolios contain loan accounts that are in default, which were purchased at a substantial discount to face value because either the credit originator and/or other third-party collection agencies have been unsuccessful in collecting the full balance owed. The Company’s Insolvency portfolios contain loan accounts that are in default and the customer is involved in a bankruptcy or insolvency proceeding and the accounts were purchased at a substantial discount to face value. Each of the two broad portfolio segments of purchased nonperforming loan portfolios consist of large numbers of homogeneous receivables with similar risk characteristics.
Effective interest rate and accounting pools: Within each portfolio segment, the Company pools accounts with similar risk characteristics that are acquired in the same year. Similar risk characteristics generally include portfolio segment and geographic region. The initial effective interest rate of the pool is established based on the purchase price and expected recoveries of each individual purchase at the purchase date. During the year of acquisition, the annual pool is aggregated, and the blended effective interest rate will adjust to reflect new acquisitions and new cash flow estimates until the end of the year. The effective interest rate for a pool is fixed for the remaining life of the pool once the year has ended.
Methodology: The Company develops its estimates of expected recoveries in the Consolidated Balance Sheets by applying discounted cash flow methodologies to its estimated remaining collections ("ERC") and recognizes income over the estimated life of the pool at the constant effective interest rate of the pool. Subsequent changes (favorable and unfavorable) in expected cash flows are recognized within Changes in expected recoveries in the Consolidated Income Statements by adjusting the present value of increases or decreases in ERC at a constant effective interest rate. Amounts included in the estimate of recoveries do not exceed the aggregate amount of the amortized cost basis previously written off or expected to be written off.
The measurement of expected recoveries is based on relevant information about past events, including historical experience, current conditions, and reasonable and supportable forecasts that affect the collectability of the reported amount. Development of the Company’s forecasts rely on both quantitative and qualitative factors. Qualitative factors can include both external and internal information and consider management’s view on available facts and circumstances at each reporting period. More specifically, external factors that may have an impact on the collectability, and subsequently on the overall profitability of acquired portfolios of nonperforming loans, would include new laws or regulations relating to collections, new interpretations of existing laws or regulations, and the overall condition of the economy. Internal factors that may have an impact on the collectability, and subsequently the overall profitability of acquired portfolios of nonperforming loans, would include necessary revisions to initial and post-acquisition scoring and modeling estimates, operational activities, expected impact of operational strategies and changes in productivity related to turnover and tenure of the Company's collection staff.
PRA Group, Inc.
Notes to Consolidated Financial Statements
Portfolio income: The recognition of income on expected recoveries is based on the constant effective interest rate established for a pool.
Changes in expected recoveries: The activity consists of differences between actual recoveries compared to expected recoveries for the reporting period, as well as the net present value of increases or decreases in ERC at the constant effective interest rate.
Agreements to acquire the aforementioned receivables include general representations and warranties from the sellers covering matters such as account holder death or insolvency and accounts settled or disputed prior to sale. The representation and warranty period permitting the return of these accounts from the Company to the seller is typically 90 to 180 days, with certain international agreements extending as long as 24 months. Any funds received from the seller as a return of purchase price are referred to as buybacks. Buyback funds are included in changes in expected recoveries when received.
Fees paid to third parties other than the seller related to the direct acquisition of a portfolio of accounts are expensed when incurred.
Fee income recognition: The Company recognizes revenue from its class action claims recovery services when there is persuasive evidence that an arrangement exists, delivery has occurred or services have been rendered, the amount is fixed or determinable, and collectability is reasonably assured.
Property and equipment: Property and equipment, including improvements that significantly add to the productive capacity or extend useful life, are recorded at cost. Maintenance and repairs are expensed as incurred. Property and equipment are depreciated over their useful lives using the straight-line method of depreciation. Software and computer equipment are generally amortized or depreciated over three to five years. Furniture and fixtures are depreciated over ten years. Equipment is depreciated over five years. Leasehold improvements are depreciated over the lesser of the useful life, which ranges from three to ten years, or the remaining term of the lease. Building improvements are depreciated straight-line over ten to 39 years. When property is sold or retired, the cost and related accumulated depreciation are removed from the balance sheet and any gain or loss is included in the Company's Consolidated Income Statements.
Goodwill: Goodwill is not amortized but rather is reviewed for impairment annually or more frequently if indicators of potential impairment exist. The Company performs its annual assessment of goodwill as of October 1. The Company may first assess qualitative factors to determine whether it is more likely than not that the fair value of a reporting unit is less than its carrying amount, including goodwill. If management concludes that it is more likely than not that the fair value of a reporting unit is less than its carrying amount, an impairment loss is recognized. The loss will be recorded at the amount by which the carrying amount exceeds the reporting unit’s fair value, not to exceed the total amount of goodwill allocated to the respective reporting unit.
Convertible Notes: The Company has outstanding 3.50% Convertible Notes due 2023 (the "2023 Notes" or "Convertible Notes"). On January 1, 2021, the Company adopted ASU 2020-06 using a modified retrospective method. ASU 2020-06 reduces the number of accounting models for convertible debt instruments and convertible preferred stock. Additionally, ASU 2020-06 removes certain settlement conditions that are required for equity contracts to qualify for the derivative scope exception and simplifies the diluted earnings per share ("EPS") calculation in certain areas.
Under ASU 2020-06, the embedded conversion features are no longer separated from the host contract for convertible instruments with conversion features that are not required to be accounted for as derivatives or that do not result in substantial premiums accounted for as paid-in capital. Consequently, a convertible debt instrument is accounted for as a single liability measured at its amortized cost. Upon adoption, the Company made adjustments that increased retained earnings by $12.0 million, reduced additional paid-in capital by $26.7 million and increased the net carrying amount of the 2023 Notes by $19.8 million. Additionally, for the year ended December 31, 2021, the effect of adoption reduced interest expense by $8.2 million, increased net income by $6.4 million and impacted EPS by $0.14 per share. For more information on the 2023 Notes, see Note 6. Prior to ASU 2020-06, the Company accounted for its Convertible Notes by separately accounting for the liability and equity components in a manner that reflected the entity's nonconvertible debt borrowing rate when interest cost was recognized in subsequent periods. The excess of the principal amount of the liability component over its carrying amount was amortized to interest expense over the expected life of a similar liability that did not have an associated equity component, using the effective interest method. The equity component was not remeasured as long as it continued to meet the conditions for equity classification. Transaction costs incurred with third parties were allocated to the liability and equity components in proportion to the allocation of proceeds and accounted for as debt issuance costs and equity issuance costs, respectively.
PRA Group, Inc.
Notes to Consolidated Financial Statements
Income taxes: The Company records a tax provision for the anticipated tax consequences of the reported results of operations. The provision for income taxes is estimated using the asset and liability method, under which deferred tax assets and liabilities are recognized for the expected future tax consequences of temporary differences between the financial reporting and tax basis of assets and liabilities, and for operating losses and tax credit carryforwards. Deferred tax assets and liabilities are measured using the currently enacted tax rates that apply to taxable income in effect for the years in which those tax assets are expected to be realized or settled.
The Company is subject to income taxes throughout the U.S. and in numerous international jurisdictions. The Company recognizes the financial statement benefits of a tax position if it is more likely than not to be sustained in the event of challenges by relevant taxing authorities based on the technical merit. The amounts of benefit to recognize in the financial statements are the largest benefits that have a greater than 50 percent likelihood of being realized upon settlement with the relevant tax authorities. The Company records interest and penalties related to unrecognized tax benefits as a component of income tax expense when the more likely than not standards are not met.
In preparation of the Consolidated Financial Statements, the Company exercises significant judgment in estimating the potential exposure to unresolved tax matters and applies a more likely than not criteria approach for recording tax benefits related to uncertain tax positions in the application of complex tax laws. While actual results could vary, the Company believes it has adequate tax accruals with respect to the ultimate outcome of such tax matters.
The Company establishes a valuation allowance when it determines all or part of the deferred tax assets are not realizable. If the Company subsequently realizes deferred tax assets that were previously determined to be unrealizable, the respective valuation allowance would be reversed, resulting in a positive adjustment to earnings.
Leases: The Company recognizes a liability for future lease payments and a right-of-use ("ROU") asset representing its right to use the underlying asset for the lease term on the balance sheet.
The Company's operating lease portfolio primarily includes corporate offices and call centers. The majority of its leases have remaining lease terms of one year to 14 years, some of which include options to extend the leases for up to five years, and others include options to terminate the leases within one year. Exercises of lease renewal options are typically at the Company's sole discretion and are included in its ROU assets and lease liabilities based upon whether the Company is reasonably certain of exercising the renewal options. The Company has lease agreements with lease and non-lease components, which are generally accounted for separately. The Company's lease agreements do not contain any material residual value guarantees or material restrictive covenants.
As most of the Company's leases do not provide an implicit rate, the Company uses its incremental borrowing rate based on the information available at the lease commencement date in determining the present value of the lease payments.
Share-based compensation: Compensation expense associated with share equity awards are recognized in the income statement. The Company determines stock-based compensation expense for all share-based payment awards based on the measurement date fair value. The Company has certain share awards that include market conditions that affect vesting. The fair value of these shares is estimated using a lattice model. Compensation cost is not adjusted if the market condition is not met, as long as the requisite service is provided. The Company estimates a forfeiture rate for most equity share grants based on historical experience. Time-based equity share awards generally vest between one and three years from the grant date and are expensed on a straight-line basis over the vesting period. Equity share awards that contain a performance metric, are expensed over the requisite service period, generally three years, in accordance with the performance level achieved at each reporting period. See Note 11 for additional information. Derivatives: The Company periodically enters into derivative financial instruments, typically interest rate swap agreements, interest rate caps, and foreign currency contracts to reduce its exposure to fluctuations in interest rates on variable-rate debt and foreign currency exchange rates. The Company does not utilize derivative financial instruments with a level of complexity or with a risk greater than the exposure to be managed nor does it enter into or hold derivatives for trading or speculative purposes.
All of the Company's outstanding derivative financial instruments are recognized in the balance sheet at their fair values. The effect on earnings from recognizing the fair values of these derivative financial instruments depends on their intended use, their hedge designation, and their effectiveness in offsetting changes in the fair values of the exposures they are hedging. Changes in the fair values of instruments designated to reduce or eliminate adverse fluctuations in the fair values of recognized assets and liabilities and unrecognized firm commitments are reported in earnings along with changes in the fair values of the hedged items. Changes in the effective portions of the fair values of instruments used to reduce or eliminate adverse fluctuations in cash flows of anticipated or forecasted transactions are reported in equity as a component of Accumulated other
PRA Group, Inc.
Notes to Consolidated Financial Statements
comprehensive loss. Amounts in Accumulated other comprehensive loss are reclassified to earnings when the related hedged items affect earnings or the anticipated transactions are no longer probable. Changes in the fair values of derivative instruments that are not designated as hedges or do not qualify for hedge accounting treatment are reported in earnings. The Company realizes gains and losses from derivative instruments in the same financial statement line item as the hedged item/forecasted transaction. Changes in unrealized gains and losses for derivatives not designated in a hedge accounting relationship are recorded directly in earnings each period and are also recorded in the same financial statement line item as the hedged item/forecasted transaction. Cash flows from the settlement of derivatives, including both economic hedges and those designated in hedge accounting relationships, appear in the Consolidated Statements of Cash Flows in the same categories as the cash flows of the hedged item.
For derivative financial instruments accounted for as hedging instruments, the Company formally designates and documents, at inception, the financial instrument as a hedge of a specific underlying exposure, the risk management objective, and the manner in which effectiveness of the hedge will be assessed. The Company formally assesses, both at inception and at each reporting period thereafter, whether the derivative financial instruments used in hedging transactions are effective in offsetting changes in fair value or cash flows of the related underlying exposures.
In 2020, the Company adopted ASU 2020-04, "Reference Rate Reform (Topic 848): Facilitation of the Effect of Reference Rate Reform on Financial Reporting" ("ASU 2020-04"). ASU 2020-04 is effective for a limited time through December 31, 2022 and allows the Company to elect certain expedients to continue accounting for its interest rate swaps contracts designated as cash flow hedges.
The Company discontinues the use of hedge accounting prospectively when (1) the derivative instrument is no longer effective in offsetting changes in fair value or cash flows of the underlying hedged item; (2) the derivative instrument expires, is sold, terminated, or exercised; or (3) designating the derivative instrument as a hedge is no longer appropriate. See Note 9 for additional information. Use of estimates: The preparation of the Consolidated Financial Statements in conformity with U.S. GAAP requires management to make estimates and assumptions that affect the reported amounts of assets and liabilities and disclosure of contingent assets and liabilities at the date of the Consolidated Financial Statements and the reported amounts of revenues and expenses during the reporting period. Actual results could differ from those estimates.
Significant estimates have been made by management with respect to the timing and amount of future cash collections of the Company's finance receivables portfolios. Actual results could differ from these estimates making it reasonably possible that a change in these estimates could occur within one year.
Commitments and contingencies: The Company is subject to various claims and contingencies related to lawsuits, certain taxes and commitments under contractual and other obligations. The Company recognizes liabilities for commitments and contingencies when a loss is probable and estimable. The Company expenses related legal costs as incurred. See Note 14 for additional information. Estimated fair value of financial instruments: Fair value is the price that would be received to sell an asset or paid to transfer a liability in an orderly transaction between market participants at the measurement date. The Company takes into consideration differing levels of inputs in the determination of fair values. Disclosure of the estimated fair values of financial instruments often requires the use of estimates. See Note 8 for additional information. Recent accounting pronouncements:
Recently issued accounting standards adopted:
Income Taxes
In December 2019, the Financial Accounting Standards Board ("FASB") issued ASU 2019-12, Income Taxes (Topic 740): Simplifying the Accounting for Income Taxes ("ASU 2019-12"). ASU 2019-12 removes certain exceptions for recognizing deferred taxes for investments and calculating income taxes in interim periods. Additionally, the standard adds guidance to reduce complexity in certain areas, including recognizing taxes for tax goodwill and allocating taxes to members of a consolidated group. ASU 2019-12 is effective for annual and interim periods beginning after December 15, 2020 on a prospective basis. The Company adopted ASU 2019-12 on January 1, 2021 with no material impact to the Company's Consolidated Financial Statements upon adoption.
PRA Group, Inc.
Notes to Consolidated Financial Statements
Investments - Equity Securities
In January 2020, the FASB issued ASU 2020-01 “Investments-Equity Securities (Topic 321), Investments-Equity Method and Joint Ventures (Topic 323), and Derivatives and Hedging (Topic 815)-Clarifying the Interactions between Topic 321, Topic 323, and Topic 815” ("ASU 2020-01"). ASU 2020-01 clarifies that a company should consider observable transactions that require a company to either apply or discontinue the equity method of accounting under Topic 323, Investments - Equity Method and Joint Ventures, for the purposes of applying the measurement alternative in accordance with Topic 321 immediately before applying or upon discontinuing the equity method. Additionally, it clarifies that, when determining the accounting for certain forward contracts and purchased options a company should not consider, whether upon settlement or exercise, if the underlying securities would be accounted for under the equity method or fair value option. The Company adopted ASU 2020-01 on January 1, 2021 with no impact to the Company's Consolidated Financial Statements upon adoption.
Accounting for Convertible Instruments
Effective January 1, 2021, the Company early adopted ASU 2020-06. Refer to the Convertible Notes accounting policy above.
Reference Rate Reform
In January 2021, the FASB issued ASU 2021-01, "Reference Rate Reform (Topic 848): Overall" ("ASU 2021-01"). ASU 2021-01 expands the scope of ASC 848 to include derivatives affected by the discounting transition for certain optional expedients and exceptions. ASU 2021-01 is effective immediately for a limited time through December 31, 2022. The Company is evaluating the effect of ASU 2020-01 but does not expect transition to an alternative reference rate will have a material impact on the Company's Consolidated Financial Statements.
Recently issued accounting standards not yet adopted:
The Company does not expect that any other recently issued accounting pronouncements will have a material impact on its Consolidated Financial Statements.
2. Finance Receivables, net:
Finance receivables, net consisted of the following at December 31, 2021 and 2020 (amounts in thousands):
| | | | | | | | | | | |
| 2021 | | 2020 |
| Amortized cost | $ | — | | | $ | — | |
Negative allowance for expected recoveries (1) | 3,428,285 | | | 3,514,788 | |
| Balance at end of year | $ | 3,428,285 | | | $ | 3,514,788 | |
(1) The negative allowance balance includes certain portfolios of nonperforming loans for which the Company holds a beneficial interest representing approximately 1% of the balance.
Changes in the negative allowance for expected recoveries by portfolio segment for the years ended December 31, 2021 and 2020 were as follows (amounts in thousands):
| | | | | | | | | | | | | | | | | |
| 2021 |
| Core | | Insolvency | | Total |
| Balance at beginning of year | $ | 3,019,477 | | | $ | 495,311 | | | $ | 3,514,788 | |
Initial negative allowance for expected recoveries - portfolio acquisitions (1) | 863,379 | | | 108,901 | | | 972,280 | |
| Foreign currency translation adjustment | (68,544) | | | (2,189) | | | (70,733) | |
Recoveries applied to negative allowance (2) | (1,002,400) | | | (183,554) | | | (1,185,954) | |
Changes in expected recoveries (3) | 178,020 | | | 19,884 | | | 197,904 | |
| Balance at end of year | $ | 2,989,932 | | | $ | 438,353 | | | $ | 3,428,285 | |
| | | | | | | | | | | | | | | | | |
| 2020 |
| Core | | Insolvency | | Total |
| Balance at beginning of year | $ | 3,051,426 | | | $ | 462,739 | | | $ | 3,514,165 |
Initial negative allowance for expected recoveries - portfolio acquisitions (1) | 742,583 | | | 162,535 | | | 905,118 |
| Foreign currency translation adjustment | 54,735 | | | 9,132 | | | 63,867 |
Recoveries applied to negative allowance (2) | (891,925) | | | (145,734) | | | (1,037,659) |
Changes in expected recoveries (3) | 62,658 | | | 6,639 | | | 69,297 |
| Balance at end of year | $ | 3,019,477 | | $ | 495,311 | | $ | 3,514,788 |
(1) Initial negative allowance for expected recoveries - portfolio acquisitions
Portfolio acquisitions for the years ended December 31, 2021 and 2020 were as follows (amounts in thousands):
| | | | | | | | | | | | | | | | | |
| 2021 |
| Core | | Insolvency | | Total |
| Face value | $ | 5,917,827 | | | $ | 508,868 | | | $ | 6,426,695 | |
| Noncredit discount | (696,983) | | | (37,202) | | | (734,185) | |
| Allowance for credit losses at acquisition | (4,357,465) | | | (362,765) | | | (4,720,230) | |
| Purchase price | $ | 863,379 | | | $ | 108,901 | | | $ | 972,280 | |
| | | | | | | | | | | | | | | | | |
| 2020 |
| Core | | Insolvency | | Total |
| Face value | $ | 5,820,159 | | | $ | 887,134 | | | $ | 6,707,293 | |
| Noncredit discount | (710,636) | | | (53,357) | | | (763,993) | |
| Allowance for credit losses at acquisition | (4,366,940) | | | (671,242) | | | (5,038,182) | |
| Purchase price | $ | 742,583 | | | $ | 162,535 | | | $ | 905,118 | |
The initial negative allowance recorded on portfolio acquisitions for the years ended December 31, 2021 and 2020 were as follows (amounts in thousands):
| | | | | | | | | | | | | | | | | |
| 2021 |
| Core | | Insolvency | | Total |
| Allowance for credit losses at acquisition | $ | (4,357,465) | | | $ | (362,765) | | | $ | (4,720,230) | |
| Writeoffs, net | 4,357,465 | | | 362,765 | | | 4,720,230 | |
| Expected recoveries | 863,379 | | | 108,901 | | | 972,280 | |
| Initial negative allowance for expected recoveries | $ | 863,379 | | | $ | 108,901 | | | $ | 972,280 | |
| | | | | | | | | | | | | | | | | |
| 2020 |
| Core | | Insolvency | | Total |
| Allowance for credit losses at acquisition | $ | (4,366,940) | | | $ | (671,242) | | | $ | (5,038,182) | |
| Writeoffs, net | 4,366,940 | | | 671,242 | | | 5,038,182 | |
| Expected recoveries | 742,583 | | | 162,535 | | | 905,118 | |
| Initial negative allowance for expected recoveries | $ | 742,583 | | | $ | 162,535 | | | $ | 905,118 | |
PRA Group, Inc.
Notes to Consolidated Financial Statements
(2) Recoveries applied to negative allowance
Recoveries applied to the negative allowance for the years ended December 31, 2021 and 2020 were as follows (amounts in thousands):
| | | | | | | | | | | | | | | | | |
| 2021 |
| Core | | Insolvency | | Total |
Recoveries (a) | $ | 1,818,635 | | | $ | 242,646 | | | $ | 2,061,281 | |
| Less - amounts reclassified to portfolio income | 816,235 | | | 59,092 | | | 875,327 | |
| Recoveries applied to negative allowance | $ | 1,002,400 | | | $ | 183,554 | | | $ | 1,185,954 | |
| | | | | | | | | | | | | | | | | |
| 2020 |
| Core | | Insolvency | | Total |
Recoveries (a) | $ | 1,803,480 | | | $ | 218,215 | | | $ | 2,021,695 | |
| Less - amounts reclassified to portfolio income | 911,555 | | | 72,481 | | | 984,036 | |
| Recoveries applied to negative allowance | $ | 891,925 | | | $ | 145,734 | | | $ | 1,037,659 | |
(a) Recoveries includes cash collections, buybacks and other cash-based adjustments.
(3) Changes in expected recoveries
Changes in expected recoveries for the years ended December 31, 2021 and 2020 were as follows (amounts in thousands):
| | | | | | | | | | | | | | | | | |
| 2021 |
| Core | | Insolvency | | Total |
| Changes in expected future recoveries | $ | (35,432) | | | $ | (16,816) | | | $ | (52,248) | |
| Recoveries received in excess of forecast | 213,452 | | | 36,700 | | | 250,152 | |
| Changes in expected recoveries | $ | 178,020 | | | $ | 19,884 | | | $ | 197,904 | |
| | | | | | | | | | | | | | | | | |
| 2020 |
| Core | | Insolvency | | Total |
| Changes in expected future recoveries | $ | (207,982) | | | $ | (5,289) | | | $ | (213,271) | |
| Recoveries received in excess of forecast | 270,640 | | | 11,928 | | | 282,568 | |
| Changes in expected recoveries | $ | 62,658 | | | $ | 6,639 | | | $ | 69,297 | |
In order to make estimates of future cash collections, the Company considered historical performance, current economic forecasts, short-term and long-term growth in the various geographies in which the Company operates and consumer habits. The Company considered recent collection activity in its determination to adjust assumptions related to near-term ERC for certain pools. Based on these considerations, the Company’s estimates incorporate changes in both amounts and in the timing of expected cash collections over the forecast period.
For the year ended December 31, 2021, Changes in expected recoveries were a net positive $197.9 million. The changes were the net result of recoveries received in excess of forecast of $250.2 million from significant cash collections overperformance during the year reduced by a $52.2 million net negative adjustment to changes in expected future recoveries. The changes in expected future recoveries includes the Company's assumption that the majority of the current year overperformance was due to acceleration of future collections. The Company also increased near-term expected collections in certain geographies to reflect recent performance trends in collections, and made corresponding reductions later in the forecast period.
For the year ended December 31, 2020, Changes in expected recoveries were a net positive $69.3 million. This reflected $282.6 million in recoveries received in excess of forecast, which was largely due to significant cash collections overperformance during the last three quarters of 2020. This was mostly offset by a $213.3 million decrease in the present value of expected future recoveries. The decrease reflected the Company's assumption that the majority of the overperformance was primarily due to acceleration in the timing of cash collections rather than an increase to total expected collections.
PRA Group, Inc.
Notes to Consolidated Financial Statements
Additionally, the Company made forecast adjustments in all quarters deemed appropriate given the environment in which the Company operated.
Changes in the Company’s assumptions regarding the duration and impact of the COVID-19 pandemic to cash collections, could change significantly as conditions evolve.
3. Investments:
Investments consisted of the following at December 31, 2021 and 2020 (amounts in thousands):
| | | | | | | | | | | |
| 2021 | | 2020 |
| Debt securities | | | |
| Available-for-sale | $ | 77,538 | | | $ | 5,368 | |
| | | |
| Equity securities | | | |
| Exchange traded funds | 1,746 | | | 34,847 | |
| Private equity funds | 5,137 | | | 6,123 | |
| Mutual funds | 508 | | | 1,023 | |
| Equity method investments | 8,048 | | | 8,398 | |
| Total investments | $ | 92,977 | | | $ | 55,759 | |
Debt Securities
Available-for-Sale
Government securities: The Company's investments primarily in short-term government instruments with maturities of twelve months or less, including bonds and treasury securities, which are classified as available-for-sale and are stated at fair value.
The amortized cost and estimated fair value of investments in debt securities at December 31, 2021 and 2020 were as follows (amounts in thousands):
| | | | | | | | | | | | | | | | | | | | | | | |
| 2021 |
| Amortized Cost | | Gross Unrealized Gains | | Gross Unrealized Losses | | Aggregate Fair Value |
| Available-for-sale | | | | | | | |
| Government securities | $ | 77,757 | | | $ | — | | | $ | 219 | | | $ | 77,538 | |
| | | | | | | |
| | | | | | | |
| | | | | | | |
| 2020 |
| Amortized Cost | | Gross Unrealized Gains | | Gross Unrealized Losses | | Aggregate Fair Value |
| Available-for-sale | | | | | | | |
| | | | | | | |
| Government securities | $ | 5,239 | | | $ | 129 | | | $ | — | | | $ | 5,368 | |
| | | | | | | |
| | | | | | | |
Equity Securities
Exchange traded funds: The Company invested in certain treasury bill exchange traded funds, which were accounted for as equity securities and carried at fair value. In August 2021, the Company sold the majority of these funds. Gains and losses from these investments are included within Other income and (expense) in the Company's Consolidated Income Statements.
Investments in private equity funds: Investments in private equity funds represent limited partnerships in which the Company has less than a 1% interest.
Mutual funds: Represents investment funds held in Brazil in a Brazilian real denominated mutual fund benchmarked to the U.S. dollar that invests principally in Brazilian fixed income securities. The investments are carried at fair value based on quoted market prices. Gains and losses from these investments are included as a foreign exchange component of Other income and (expense) in the Company's Consolidated Income Statements.
PRA Group, Inc.
Notes to Consolidated Financial Statements
Equity Method Investments
The Company has an 11.7% interest in RCB Investimentos S.A. ("RCB"), a servicing platform for nonperforming loans in Brazil, which is accounted for on the equity method because the Company exercises significant influence over RCB’s operating and financial activities. Accordingly, the Company’s investment in RCB is adjusted for the Company’s proportionate share of RCB’s earnings or losses, capital contributions made and distributions received.
4. Leases:
The Company leases office space and equipment under operating leases. The components of lease expense for the years ended December 31, 2021 and 2020 were as follows (amounts in thousands):
| | | | | | | | | | | |
| 2021 | | 2020 |
| Operating lease expense | $ | 12,256 | | | $ | 12,263 | |
| Short-term lease expense | 2,986 | | | 2,598 | |
| Sublease income | (196) | | | — | |
| Total lease expense | $ | 15,046 | | | $ | 14,861 | |
Supplemental cash flow information and non-cash activity related to leases for the years ended December 31, 2021 and 2020 were as follows (amounts in thousands):
| | | | | | | | | | | |
| 2021 | | 2020 |
| Cash paid for amounts included in the measurement of operating lease liabilities | $ | 12,034 | | | $ | 12,416 | |
| | | |
| ROU assets obtained/(disposed), net in exchange for operating lease obligations | $ | 13,525 | | | $ | (7,506) | |
Lease term and discount rate information related to operating leases were as follows as of the date indicated:
| | | | | | | | | | | |
| 2021 | | 2020 |
| Weighted-average remaining lease terms (years) | 8.6 | | 9.1 |
| | | |
| Weighted-average discount rate | 4.5 | % | | 4.7 | % |
Maturities of lease liabilities at December 31, 2021, are as follows for the years ending December 31, (amounts in thousands):
| | | | | |
| Operating Leases |
| 2022 | $ | 11,231 | |
| 2023 | 9,288 | |
| 2024 | 8,851 | |
| 2025 | 8,673 | |
| 2026 | 7,671 | |
| Thereafter | 28,512 | |
Total lease payments | $ | 74,226 | |
| Less: imputed interest | 13,038 | |
| Total present value of lease liabilities | $ | 61,188 | |
5. Goodwill:
The Company performs an annual review of goodwill as of October 1 of each year or more frequently if indicators of impairment exist. The Company performed an annual review of goodwill as of October 1, 2021 and concluded that no goodwill impairment was necessary.
PRA Group, Inc.
Notes to Consolidated Financial Statements
The following table represents the changes in goodwill for the years ended December 31, 2021 and 2020 (amounts in thousands):
| | | | | | | | | | | |
| 2021 | | 2020 |
| Balance at beginning of year | $ | 492,989 | | | $ | 480,794 | |
| | | |
| | | |
| | | |
| | | |
| Change in foreign currency translation adjustment | (12,726) | | | 12,195 | |
| | | |
| | | |
| | | |
| | | |
| Balance at end of year | $ | 480,263 | | | $ | 492,989 | |
6. Borrowings:
The Company's borrowings consisted of the following as of December 31, 2021 and 2020 (amounts in thousands):
| | | | | | | | | | | |
| 2021 | | 2020 |
Americas revolving credit (1) | $ | 372,119 | | | $ | 405,706 | |
| Europe revolving credit | 795,687 | | | 1,171,890 | |
| Term loan | 460,000 | | | 470,000 | |
| Senior Notes | 650,000 | | | 300,000 | |
| Convertible Notes | 345,000 | | | 345,000 | |
| 2,622,806 | | | 2,692,596 | |
| Less: Debt discount and issuance costs | (14,092) | | | (31,307) | |
| Total | $ | 2,608,714 | | | $ | 2,661,289 | |
(1) Includes a credit agreement with Banco de Occidente in an aggregate amount of approximately $1.0 million. As of December 31, 2021, the outstanding balance under the credit agreement was approximately $0.9 million, with an interest rate of 5.85%.The following principal payments are due on the Company's borrowings at December 31, 2021 for the years ending December 31, (amounts in thousands):
| | | | | |
| 2022 | $ | 10,300 | |
| 2023 | 1,150,986 | |
| 2024 | 10,300 | |
| 2025 | 310,000 | |
| 2026 | 791,220 | |
| Thereafter | 350,000 | |
| Total | $ | 2,622,806 | |
The Company determined that it was in compliance with the covenants of its financing arrangements as of December 31, 2021.
Set forth below is a description of the Company's material borrowing arrangements:
North American Revolving Credit and Term Loan
The Company has a credit agreement with Bank of America, N.A., as administrative agent, Bank of America, National Association, acting through its Canada branch, as the Canadian Administrative Agent, and a syndicate of lenders named therein. On July 30, 2021, the Company entered into the Fourth Amendment to the North American Credit Agreement (as amended, the "North American Credit Agreement"), which extended the maturity date to July 30, 2026 and, among other things, decreased the floors on the revolving loans, increased the limit of stock repurchases and redemption of convertible notes, lowered both the margin and unused line fee and added London Interbank Offered Rate ("LIBOR") replacement provisions to reflect the current market approach.
The total credit facility under the North American Credit Agreement includes an aggregate principal amount of $1.5 billion (subject to compliance with a borrowing base and applicable debt covenants), which consists of (i) a fully-funded $460.0 million term loan, (ii) a $1.0 billion domestic revolving credit facility and (iii) a $75.0 million Canadian revolving credit facility. The facility includes an accordion feature for up to $500.0 million in additional commitments (at the option of the lender) and also provides for up to $25.0 million of letters of credit and a $25.0 million swingline loan sub-limit that would
PRA Group, Inc.
Notes to Consolidated Financial Statements
reduce amounts available for borrowing. The term and revolving loans accrue interest, at the option of the Company, at either the base rate, Canadian Dollar Offered Rate, or the Eurodollar rate (each, as defined in the North American Credit Agreement) for the applicable term plus 2.25% per annum, or 2.00% if the consolidated senior secured leverage ratio (as defined in the North American Credit Agreement) is less than or equal to 1.60 to 1.0. The revolving loans within the credit facilities are subject to a 0% floor. The revolving credit facilities also bear an unused line fee of 0.35% per annum, or 0.30% if the consolidated senior secured leverage ratio (as defined in the North American Credit Agreement) is less than or equal to 1.60 to 1.0, payable quarterly in arrears. As of December 31, 2021, the unused portion of the North American Credit Agreement was $703.8 million. Considering borrowing base calculations as of December 31, 2021, the amount available to be drawn was $131.3 million.
The North American Credit Agreement is secured by a first priority lien on substantially all of the Company's North American assets. The North American Credit Agreement contains restrictive covenants and events of default including the following:
•the ERC borrowing base is 35% for all eligible core asset pools and 55% for all insolvency eligible asset pools;
•the consolidated total leverage ratio (as defined in the North American Credit Agreement) cannot exceed 3.50 to 1.0 as of the end of any fiscal quarter;
•the consolidated senior secured leverage ratio cannot exceed 2.25 to 1.0 as of the end of any fiscal quarter;
•subject to no default or event of default, cash dividends and distributions during any fiscal year cannot exceed $20.0 million; and
•the Company must maintain positive consolidated income from operations during any fiscal quarter.
The outstanding balances and weighted average interest rates by type of borrowing under the credit facility as of December 31, 2021 and 2020 are as follows (dollar amounts in thousands):
| | | | | | | | | | | | | | | | | | | | | | | |
| 2021 | | 2020 |
| Amount Outstanding | | Weighted Average Interest Rate | | Amount Outstanding | | Weighted Average Interest Rate |
| Term loan | $ | 460,000 | | | 2.10 | % | | $ | 470,000 | | | 2.65 | % |
| Revolving credit facilities | $ | 371,220 | | | 2.14 | % | | $ | 403,669 | | | 3.25 | % |
European Revolving Credit Facility
European subsidiaries of the Company ("PRA Europe") are parties to a credit agreement with DNB Bank ASA and a syndicate of lenders named therein, for a Multicurrency Revolving Credit Facility. On March 12, 2021, the Company entered into the Seventh Amendment and Restatement to its European Credit Agreement (as amended, the "European Credit Agreement") that, among other things, increased borrowings by $50.0 million through the accordion feature.
The European Credit Agreement provides borrowings for an aggregate amount of approximately $1.35 billion (subject to the borrowing base), accrues interest at the Interbank Offered Rate plus 2.70% - 3.80% (as determined by the estimated remaining collections ratio ("ERC Ratio") as defined in the European Credit Agreement), bears an unused line fee, currently 1.12% per annum, or 35% of the margin, is subject to a 0% floor, is payable monthly in arrears and matures February 19, 2023. The European Credit Agreement also includes an overdraft facility in the aggregate amount of $40.0 million (subject to the borrowing base), which accrues interest (per currency) at the daily rates as published by the facility agent, bears a facility line fee of 0.125% per quarter, payable quarterly in arrears and matures February 19, 2023. As of December 31, 2021, the unused portion of the European Credit Agreement (including the overdraft facility) was $594.3 million. Considering borrowing base restrictions and other covenants as of December 31, 2021, the amount available to be drawn under the European Credit Agreement (including the overdraft facility) was $493.3 million.
The European Credit Agreement is secured by the shares of most of the Company's European subsidiaries and all intercompany loans receivable in Europe. The European Credit Agreement contains restrictive covenants and events of default including the following:
•the ERC Ratio cannot exceed 45%;
•the gross interest-bearing debt ratio in Europe cannot exceed 3.25 to 1.0 as of the end of any fiscal quarter;
•interest bearing deposits in AK Nordic AB cannot exceed SEK 1.2 billion; and
•PRA Europe's cash collections must meet certain thresholds, measured on a quarterly basis.
PRA Group, Inc.
Notes to Consolidated Financial Statements
The outstanding balances and weighted average interest rates by type of borrowing under the European Credit Agreement as of December 31, 2021 and 2020 are as follows (dollar amounts in thousands):
| | | | | | | | | | | | | | | | | | | | | | | |
| 2021 | | 2020 |
| Amount Outstanding | | Weighted Average Interest Rate | | Amount Outstanding | | Weighted Average Interest Rate |
| | | | | | | |
| Revolving credit facility | $ | 795,687 | | | 3.48 | % | | $ | 1,171,890 | | | 3.74 | % |
Senior Notes due 2029
On September 22, 2021, the Company completed the private offering of $350.0 million in aggregate principal amount of its 5.00% Senior Notes due October 1, 2029 (the "2029 Notes"). The 2029 Notes were issued pursuant to an Indenture dated September 22, 2021 (the "2021 Indenture"), between the Company and Regions Bank, as trustee. The 2021 Indenture contains customary terms and covenants, including certain events of default after which the 2029 Notes may be due and payable immediately. The 2029 Notes are senior unsecured obligations of the Company and are guaranteed on a senior unsecured basis by all of the Company's existing and future domestic restricted subsidiaries that guarantee the North American Credit Agreement, subject to certain exceptions. Interest on the Notes is payable semi-annually, in arrears, on October 1 and April 1 of each year.
On or after October 1, 2024, the Notes may be redeemed, at the Company's option in whole or in part at a price equal to 102.50% of the aggregate principal amount of the 2029 Notes being redeemed. The applicable redemption price changes if redeemed during the 12-months beginning October 1 of each year to 101.25% for 2025 and then 100% for 2026 and thereafter.
In addition, on or before October 1, 2024, the Company may redeem up to 40% of the aggregate principal amount of the 2029 Notes at a redemption price of 105.00% plus accrued and unpaid interest subject to the rights of holders of the 2029 Notes with the net cash proceeds of a public offering of common stock of the Company provided, that at least 60% in aggregate principal amount of the 2029 Notes remains outstanding immediately after the occurrence of such redemption and that such redemption will occur within 90 days of the date of the closing of such public offering.
In the event of a Change of Control (as defined in the 2021 Indenture), each holder will have the right to require the Company to repurchase all or any part of such holder's 2029 Notes at an offer price equal to 101% of the aggregate principal amount plus accrued and unpaid interest. If the Company sells assets under certain circumstances and does not use the proceeds for specified purposes, the Company will be required to make an offer to repurchase the 2029 Notes at 100% of their principal amount.
Senior Notes due 2025
On August 27, 2020, the Company completed the private offering of $300.0 million in aggregate principal amount of its 7.375% Senior Notes due September 1, 2025 (the "2025 Notes" and together with the 2029 Notes, the "Senior Notes"). The 2025 Notes were issued pursuant to an Indenture dated August 27, 2020 (the "2020 Indenture"), between the Company and Regions Bank, as a trustee. The 2020 Indenture contains customary terms and covenants, including certain events of default after which the 2025 Notes may be due and payable immediately. The 2025 Notes are senior unsecured obligations of the Company and are guaranteed on a senior unsecured basis by all of the Company's existing and future domestic restricted subsidiaries that guarantee the North American Credit Agreement, subject to certain exceptions. Interest on the 2025 Notes is payable semi-annually, in arrears, on September 1 and March 1 of each year.
On or after September 1, 2022, the 2025 Notes may be redeemed, in whole or in part, at a price equal to 103.688% of the aggregate principal amount of the 2025 Notes being redeemed. The applicable redemption price changes if redeemed during the 12-months beginning September 1 of each year to 101.844% for 2023 and then 100% for 2024 and thereafter.
In addition, on or before September 1, 2022, the Company may redeem up to 40% of the aggregate principal amount of the 2025 Notes at a redemption price of 107.375% plus accrued and unpaid interest subject to the rights of holders of the 2025 Notes with the net cash proceeds of a public offering of common stock of the Company provided that at least 60% in aggregate principal amount of the 2025 Notes remains outstanding immediately after the occurrence of such redemption and that such redemption will occur within 90 days of the date of the closing of such public offering.
In the event of a Change of Control (as defined in the 2020 Indenture), the Company must offer to repurchase all of the 2025 Notes (unless otherwise redeemed) at a price equal to 101% of their aggregate principal amount plus accrued and unpaid interest. If the Company sells assets under certain circumstances and does not use the proceeds for specified purposes, the
PRA Group, Inc.
Notes to Consolidated Financial Statements
Company will be required to make an offer to repurchase the 2025 Notes at 100% of their principal amount plus accrued and unpaid interest.
Convertible Senior Notes due 2023
On May 26, 2017, the Company completed the private offering of $345.0 million in aggregate principal amount of its 3.50% Convertible Senior Notes due June 1, 2023. The 2023 Notes were issued pursuant to an Indenture, dated May 26, 2017 (the "2017 Indenture"), between the Company and Regions Bank, as trustee. The 2017 Indenture contains customary terms and covenants, including certain events of default after which the 2023 Notes may be due and payable immediately. The 2023 Notes are senior unsecured obligations of the Company. Interest on the 2023 Notes is payable semi-annually, in arrears, on June 1 and December 1 of each year.
The holders of the 2023 Notes have the right to convert all, or a portion of, the 2023 Notes upon occurrence of specific events prior to the close of business on the business day immediately preceding March 1, 2023, including:
•if during any calendar quarter, the last reported sales price of the Company's common stock is greater than 130% of the conversion price for at least 20 trading days during the period of 30 consecutive trading days;
•if the trading price of the 2023 Notes is less than 98% of the product of the last reported sales price of the Company's common stock and the conversion rate for a 10 consecutive trading day period;
•the Company elects to issue to all, or substantially all, holders of its common stock any rights, options or warrants entitling them, for a period of more than 45 calendar days, to subscribe for or purchase shares at a price per share that is less than the average of the last reported sales price (as defined in the 2017 Indenture) for the 10 consecutive trading day-period ending on the trading day immediately preceding the date of announcement of such issuance;
•the Company elects to distribute to all, or substantially all, holders of its common stock the Company’s assets, debt securities or rights to purchase securities of the Company, which distribution has a share value exceeding 10% of the last reported sale price (as defined in the 2017 Indenture) on the trading day preceding the announcement of such distribution; or
•a transaction occurs that constitutes a fundamental change (as defined in the 2017 Indenture) or, the Company is party to a consolidation, merger, binding share exchange, or transfer or lease of all, or substantially all, of the Company’s assets.
On or after March 1, 2023, the 2023 Notes will be convertible at any time. As of December 31, 2021, the Company does not believe that any of the conditions allowing holders of the 2023 Notes to convert their notes has occurred.
Furthermore, the Company has the right, at its election, to redeem all or any part of the outstanding 2023 Notes at any time on or after June 1, 2021 for cash, but only if the last reported sale price (as defined in the 2017 Indenture) of the Company's common stock exceeds 130% of the conversion price on each of at least 20 trading days during the 30 consecutive trading days ending on and including the trading day immediately before the date the Company sends the related redemption notice.
The conversion rate for the 2023 Notes is initially 21.6275 shares per $1,000 principal amount of 2023 Notes, which is equivalent to an initial conversion price of approximately $46.24 per share of the Company's common stock and is subject to adjustment in certain circumstances pursuant to the 2017 Indenture. Upon conversion, holders of the 2023 Notes will receive cash, shares of the Company's common stock or a combination of cash and shares of the Company's common stock, at the Company's election. The Company has made an irrevocable election to settle conversions by paying holders of the 2023 Notes cash up to the aggregate principal amount of the 2023 Notes and shares of the Company's common stock or a combination of cash and shares of the Company's common stock, at the Company's election, for the remaining amounts owed, if any.
In accordance with authoritative guidance related to derivatives and hedging and EPS, only the conversion spread is included in the diluted EPS calculation, if dilutive. Under such method, the settlement of the conversion spread has a dilutive effect when the market conversion criteria is met.
The Company determined that the fair value of the 2023 Notes at the date of issuance was approximately $298.8 million and designated the residual value of approximately $46.2 million as the equity component. Additionally, the Company allocated approximately $8.3 million of the $9.6 million issuance cost as debt issuance cost and the remaining $1.3 million as an equity issuance cost. Upon adoption of ASU 2020-06, the equity classification model was eliminated, resulting in an adjustment to retained earnings and an increase to the 2023 Notes. Refer to the Company's Convertible Notes accounting policy in Note 1 for further information.
PRA Group, Inc.
Notes to Consolidated Financial Statements
The balances of the liability and equity components of the Company's Convertible Notes outstanding as of December 31, 2021 and 2020 were as follows (amounts in thousands):
| | | | | | | | | | | |
| 2021 | | 2020 |
| Liability component - principal amount | $ | 345,000 | | | $ | 345,000 | |
| Unamortized debt discount | — | | | (20,603) | |
| Unamortized debt issuance costs | (2,476) | | | (3,335) | |
| Liability component - net carrying amount | $ | 342,524 | | | $ | 321,062 | |
| Equity component | $ | — | | | $ | 44,910 | |
The Company amortizes debt issuance costs over the life of the debt using the effective interest method. Upon adoption of ASU 2020-06 the debt discount was eliminated and the debt issuance costs were remeasured, resulting in an effective interest rate of 4.00%.
Interest expense related to the Company's Convertible Notes for the years ended December 31, 2021, 2020 and 2019 was as follows (amounts in thousands):
| | | | | | | | | | | | | | | | | |
| 2021 | | 2020 (1) | | 2019 (1) |
| Interest expense - stated coupon rate | $ | 12,075 | | | $ | 17,064 | | | $ | 20,700 | |
| Interest expense - amortization of debt discount | — | | | 10,811 | | | 12,398 | |
| Interest expense - amortization of debt issuance costs | 1,660 | | | 1,989 | | | 2,424 | |
| Total interest expense - Convertible Notes | $ | 13,735 | | | $ | 29,864 | | | $ | 35,522 | |
(1) 2020 and 2019 amounts include interest expense related to the Company's 3.00% Convertible Senior Notes due August 1, 2020, which were repaid in the third quarter of 2020.
Interest Expense, Net
The Company incurs interest expense on its borrowings, interest-bearing deposits, and interest rate derivative agreements. The Company earns interest income on certain of its cash and cash equivalents, restricted cash and its interest rate derivative agreements. Interest expense, net, was as follows for the years ended December 31, 2021, 2020 and 2019 (amounts in thousands):
| | | | | | | | | | | | | | | | | |
| 2021 | | 2020 | | 2019 |
| Interest expense | $ | 125,231 | | | $ | 142,727 | | | $ | 144,165 | |
| Interest income | (1,088) | | | (1,015) | | | (2,247) | |
| Interest expense, net | $ | 124,143 | | | $ | 141,712 | | | $ | 141,918 | |
7. Property and Equipment, net:
Property and equipment, at cost, consisted of the following as of December 31, 2021 and 2020 (amounts in thousands):
| | | | | | | | | | | |
| 2021 | | 2020 |
| Software | $ | 69,549 | | | $ | 66,947 | |
| Computer equipment | 25,457 | | | 23,740 | |
| Furniture and fixtures | 20,034 | | | 17,978 | |
| Equipment | 15,297 | | | 15,137 | |
| Leasehold improvements | 17,606 | | | 17,403 | |
| Building and improvements | 19,456 | | | 17,905 | |
| Land | 1,407 | | | 1,407 | |
| Accumulated depreciation | (117,420) | | | (105,707) | |
| Assets in process | 3,127 | | | 3,546 | |
| Property and equipment, net | $ | 54,513 | | | $ | 58,356 | |
PRA Group, Inc.
Notes to Consolidated Financial Statements
Depreciation expense relating to property and equipment for the years ended December 31, 2021, 2020 and 2019 was $15.1 million, $15.6 million and $15.9 million, respectively.
8. Fair Value:
Fair value is the price that would be received to sell an asset or paid to transfer a liability in an orderly transaction between market participants at the measurement date. ASC Topic 820, "Fair Value Measurement", ("ASC 820") also requires the consideration of differing levels of inputs in the determination of fair values.
Those levels of input are summarized as follows:
•Level 1: Quoted prices in active markets for identical assets and liabilities.
•Level 2: Observable inputs other than Level 1 quoted prices, such as quoted prices for similar instruments in active markets, quoted prices for identical or similar instruments in markets that are not active, and model-based valuation techniques for which all significant assumptions are observable in the market.
•Level 3: Unobservable inputs that are supported by little or no market activity. Level 3 assets and liabilities include financial instruments whose value is determined using pricing models, discounted cash flow methodologies, or similar techniques as well as instruments for which the determination of fair value requires significant management judgment or estimation.
The level in the fair value hierarchy within which a fair value measurement in its entirety falls is based on the lowest level input that is significant to the fair value measurement in its entirety.
Financial Instruments Not Required To Be Carried at Fair Value
In accordance with the disclosure requirements of ASC Topic 825, "Financial Instruments" ("ASC 825"), the table below summarizes fair value estimates for the Company's financial instruments that are not required to be carried at fair value. The total of the fair value calculations presented does not represent, and should not be construed to represent, the underlying value of the Company.
The carrying amounts in the table are recorded in the Consolidated Balance Sheets at December 31, 2021 and 2020 (amounts in thousands):
| | | | | | | | | | | | | | | | | | | | | | | |
| 2021 | | 2020 |
| Carrying
Amount | | Estimated
Fair Value | | Carrying
Amount | | Estimated
Fair Value |
| Financial assets: | | | | | | | |
| Cash and cash equivalents | $ | 87,584 | | | $ | 87,584 | | | $ | 108,613 | | | $ | 108,613 | |
| Finance receivables, net | 3,428,285 | | | 3,317,658 | | | 3,514,788 | | | 3,541,159 | |
| Financial liabilities: | | | | | | | |
| Interest-bearing deposits | 124,623 | | | 124,623 | | | 132,739 | | | 132,739 | |
| Revolving lines of credit | 1,167,806 | | | 1,167,806 | | | 1,577,596 | | | 1,577,596 | |
| Term loan | 460,000 | | | 460,000 | | | 470,000 | | | 470,000 | |
| Senior Notes | 650,000 | | | 673,366 | | | 300,000 | | | 324,408 | |
| Convertible Notes | 345,000 | | | 406,607 | | | 324,397 | | | 376,012 | |
Disclosure of the estimated fair values of financial instruments often requires the use of estimates. The carrying amount and estimates of the fair value of the Company's debt obligations outlined above do not include any related debt issuance costs associated with the debt obligations. The Company uses the following methods and assumptions to estimate the fair value of financial instruments:
Cash and cash equivalents: The carrying amount approximates fair value and quoted prices for identical assets in active markets. Accordingly, the Company estimates the fair value of cash and cash equivalents using Level 1 inputs.
Finance receivables, net: The Company estimates the fair value of these receivables using proprietary pricing models that the Company utilizes to make portfolio acquisition decisions. Accordingly, the Company's fair value estimates use Level 3 inputs as there is little observable market data available and management is required to use significant judgment in its estimates.
PRA Group, Inc.
Notes to Consolidated Financial Statements
Interest-bearing deposits: The carrying amount approximates fair value due to the short-term nature of the deposits and the observable quoted prices for similar instruments in active markets. Accordingly, the Company uses Level 2 inputs for its fair value estimates.
Revolving lines of credit: The carrying amount approximates fair value due to the short-term nature of the interest rate periods and the observable quoted prices for similar instruments in active markets. Accordingly, the Company uses Level 2 inputs for its fair value estimates.
Term loan: The carrying amount approximates fair value due to the short-term nature of the interest rate periods and the observable quoted prices for similar instruments in active markets. Accordingly, the Company uses Level 2 inputs for its fair value estimates.
Senior Notes and Convertible Notes: The fair value estimates for the Senior Notes and Convertible Notes incorporate quoted market prices that were obtained from secondary market broker quotes that were derived from a variety of inputs including client orders, information from their pricing vendors, modeling software, and actual trading prices when they occur. Accordingly, the Company uses Level 2 inputs for its fair value estimates. Furthermore, in the table above, the carrying amount as of the December 31, 2020 represents the Convertible Notes net of the debt discount. Upon adoption of ASU 2020-06, the carrying amount of the Convertible Notes reflects face value as the debt discount was eliminated.
Financial Instruments Required To Be Carried At Fair Value
The carrying amounts in the following table are measured at fair value on a recurring basis in the accompanying Consolidated Balance Sheets at December 31, 2021 and 2020 (amounts in thousands):
| | | | | | | | | | | | | | | | | | | | | | | |
| Fair Value Measurements as of December 31, 2021 |
| Level 1 | | Level 2 | | Level 3 | | Total |
| Assets: | | | | | | | |
| | | | | | | |
| Government securities | $ | 77,538 | | | $ | — | | | $ | — | | | $ | 77,538 | |
| | | | | | | |
| Exchange traded funds | 1,746 | | | — | | | — | | | 1,746 | |
| Mutual funds | 508 | | | — | | | — | | | 508 | |
| Derivative contracts (recorded in other assets) | — | | | 9,785 | | | — | | | 9,785 | |
| Liabilities: | | | | | | | |
| Derivative contracts (recorded in other liabilities) | — | | | 25,978 | | | — | | | 25,978 | |
| | | | | | | |
| Fair Value Measurements as of December 31, 2020 |
| Level 1 | | Level 2 | | Level 3 | | Total |
| Assets: | | | | | | | |
| | | | | | | |
| Government securities | $ | 5,368 | | | $ | — | | | $ | — | | | $ | 5,368 | |
| | | | | | | |
| Exchange traded funds | 34,847 | | | — | | | — | | | 34,847 | |
| Mutual funds | 1,023 | | | — | | | — | | | 1,023 | |
| Derivative contracts (recorded in other assets) | — | | | 3,512 | | | — | | | 3,512 | |
| Liabilities: | | | | | | | |
| Derivative contracts (recorded in other liabilities) | — | | | 45,432 | | | — | | | 45,432 | |
Government securities: Fair value of the Company's investment in government instruments is estimated using quoted market prices. Accordingly, the Company uses Level 1 inputs.
Exchange traded funds: Fair value of the Company's investment in exchange traded funds is estimated using quoted market prices. Accordingly, the Company uses Level 1 inputs.
Mutual funds: Fair value of the Company's investment in mutual funds is estimated using quoted market prices. Accordingly, the Company uses Level 1 inputs.
Derivative contracts: The estimated fair value of the derivative contracts is determined using industry standard valuation models. These models project future cash flows and discount the future amounts to a present value using market-based observable inputs, including interest rate curves and other factors. Accordingly, the Company uses Level 2 inputs for its fair value estimates.
PRA Group, Inc.
Notes to Consolidated Financial Statements
Investments measured using net asset value ("NAV")
Private equity funds: This class of investments consists of private equity funds that invest primarily in loans and securities including single-family residential debt; corporate debt products; and financially-oriented, real estate-rich and other operating companies in the Americas, Western Europe, and Japan. These investments are subject to certain restrictions regarding transfers and withdrawals. The investments cannot be redeemed with the funds. Instead, the nature of the investments in this class is that distributions are received through the liquidation of the underlying assets of the fund. The investments are expected to be returned through distributions as a result of liquidations of the funds' underlying assets over one to five years. The fair value of these private equity funds following the application of the NAV practical expedient was $5.1 million and $6.1 million as of December 31, 2021 and December 31, 2020, respectively.
9. Derivatives:
The following table summarizes the fair value of derivative instruments in the Company's Consolidated Balance Sheets as of December 31, 2021 and 2020 (amounts in thousands):
| | | | | | | | | | | | | | | | | | | | | | | | | | |
| | 2021 | | 2020 |
| | Balance Sheet Location | | Fair Value | | Balance Sheet Location | | Fair Value |
| Derivatives designated as hedging instruments: | | | | | | | | |
| Interest rate contracts | | Other assets | | $ | 6,251 | | | Other assets | | $ | — | |
| Interest rate contracts | | Other liabilities | | 14,879 | | | Other liabilities | | 43,017 | |
| Derivatives not designated as hedging instruments: | | | | | | | | |
| Foreign currency contracts | | Other assets | | 3,534 | | | Other assets | | 3,512 | |
| Foreign currency contracts | | Other liabilities | | 11,099 | | | Other liabilities | | 2,415 | |
| | | | | | | | |
| | | | | | | | |
Derivatives Designated as Hedging Instruments:
Changes in the fair value of derivative contracts designated as cash flow hedging instruments are recognized in OCI. As of December 31, 2021 and December 31, 2020, the notional amount of interest rate contracts designated as cash flow hedging instruments was $869.1 million and $967.2 million, respectively. Derivatives designated as cash flow hedging instruments were evaluated and remained highly effective at December 31, 2021 and have initial terms of one to four years. The Company estimates that approximately $4.2 million of net derivative loss included in OCI will be reclassified into earnings within the next 12 months.
The following table summarizes the effects of derivatives designated as cash flow hedging instruments on the Consolidated Financial Statements for the years ended December 31, 2021, 2020 and 2019 (amounts in thousands):
| | | | | | | | | | | | | | | | | | | | | | | | | |
| | Gain or (loss) recognized in OCI, net of tax | | | | |
| Derivatives designated as cash flow hedging instruments | | 2021 | | 2020 | | 2019 | | | | | |
| Interest rate contracts | | $ | 17,961 | | | $ | (28,101) | | | $ | (14,311) | | | | | | |
| | | | | | | | | | | |
| | Gain or (loss) reclassified from OCI into income | | | | |
| Location of gain or (loss) reclassified from OCI into income | | 2021 | | 2020 | | 2019 | | | | | |
| Interest expense, net | | $ | (12,722) | | | $ | (10,027) | | | $ | (1,457) | | | | | | |
Derivatives Not Designated as Hedging Instruments:
Changes in fair value of derivative contracts not designated as hedging instruments are recognized in earnings. The Company also enters into foreign currency contracts to economically hedge the foreign currency re-measurement exposure related to certain balances that are denominated in currencies other than the functional currency of the entity. As of December 31, 2021 and December 31, 2020, the notional amount of foreign currency contracts that are not designated as hedging instruments was $1,061.7 million and $500.8 million, respectively.
PRA Group, Inc.
Notes to Consolidated Financial Statements
The following table summarizes the effects of derivatives not designated as hedging instruments on the Company’s Consolidated Income Statements for the years ended December 31, 2021, 2020 and 2019 (amounts in thousands):
| | | | | | | | | | | | | | | | | | | | | | | | | | |
| | | | Amount of gain or (loss) recognized in income |
| Derivatives not designated as hedging instruments | | Location of gain or (loss) recognized in income | | 2021 | | 2020 | | 2019 |
| Foreign currency contracts | | Foreign exchange gain/(loss) | | $ | 12,160 | | | $ | 24,009 | | | $ | (7,008) | |
| Foreign currency contracts | | Interest expense, net | | 406 | | | (2,475) | | | (3,875) | |
| Interest rate contracts | | Interest expense, net | | — | | | — | | | (492) | |
| | | | | | | | |
10. Accumulated Other Comprehensive Loss:
The following table provides details about the reclassifications out of accumulated other comprehensive loss for the years ended December 31, 2021 and 2020 (amounts in thousands):
| | | | | | | | | | | | | | | | | | | | | | |
| Gains and losses on cash flow hedges | | 2021 | | 2020 | | | | Affected line in the Consolidated Income Statements |
| Interest rate swaps | | $ | (12,722) | | | $ | (10,027) | | | | | Interest expense, net |
| Income tax effect of item above | | 2,705 | | | 2,187 | | | | | Income tax expense |
| Total losses on cash flow hedges | | $ | (10,017) | | | $ | (7,840) | | | | | |
| | | | | | | | |
| | | | | | | | |
| | | | | | | | |
| | | | | | | | |
| | | | | | | | |
The following table represents the changes in accumulated other comprehensive loss by component after tax, for the years ended December 31, 2021, 2020 and 2019 (amounts in thousands):
| | | | | | | | | | | | | | | | | | | | | | | |
| Debt Securities Available for Sale | | Cash Flow Hedges | | Currency Translation Adjustment | | Accumulated Other Comprehensive Loss 1 |
|
| Balance at December 31, 2018 | $ | (83) | | | $ | 44 | | | $ | (242,070) | | | $ | (242,109) | |
| | | | | | | |
| Other comprehensive gain/(loss) before reclassifications | 39 | | (14,311) | | (5,816) | | | (20,088) | |
| Reclassifications, net | — | | | 1,179 | | | — | | | 1,179 | |
| Net current period other comprehensive gain/(loss) | 39 | | | (13,132) | | | (5,816) | | | (18,909) | |
| Balance at December 31, 2019 | $ | (44) | | | $ | (13,088) | | | $ | (247,886) | | | $ | (261,018) | |
| Other comprehensive gain/(loss) before reclassifications | 171 | | | (28,101) | | | 35,317 | | | 7,387 | |
| Reclassifications, net | — | | | 7,840 | | | — | | | 7,840 | |
| Net current period other comprehensive gain/(loss) | 171 | | | (20,261) | | | 35,317 | | | 15,227 | |
| Balance at December 31, 2020 | $ | 127 | | | $ | (33,349) | | | $ | (212,569) | | | $ | (245,791) | |
| Other comprehensive (loss)/gain before reclassifications | (348) | | | 17,961 | | | (48,748) | | | (31,135) | |
| Reclassifications, net | — | | | 10,017 | | | — | | | 10,017 | |
| Net current period other comprehensive (loss)/gain | (348) | | | 27,978 | | | (48,748) | | | (21,118) | |
| Balance at December 31, 2021 | $ | (221) | | | $ | (5,371) | | | $ | (261,317) | | | $ | (266,909) | |
(1) For the years ended December 31, 2021, 2020 and 2019, net deferred taxes for unrealized losses from cash flow hedges were $3.1 million, $9.2 million and $4.4 million, respectively.11. Share-Based Compensation:
The Company has an Omnibus Incentive Plan (the "Plan") that is intended to assist the Company in attracting and retaining selected individuals to serve as employees and directors, who are expected to contribute to the Company's success and to achieve long-term objectives that will benefit stockholders of the Company. The Plan enables the Company to award shares of the Company's common stock to select employees and directors, not to exceed 5,400,000 shares as authorized by the Plan.
Total share-based compensation expense was $15.9 million, $14.4 million and $10.7 million for the years ended December 31, 2021, 2020 and 2019, respectively. The Company recognizes all excess tax benefits and tax deficiencies in the
PRA Group, Inc.
Notes to Consolidated Financial Statements
income statement when the awards vest or are settled. The total tax benefit realized from share-based compensation was approximately $3.9 million, $2.4 million and $1.2 million for the years ended December 31, 2021, 2020 and 2019, respectively.
Nonvested Shares
As of December 31, 2021, total future compensation expense related to nonvested share grants to individual employee plans and directors (not including nonvested shares granted under the Long-Term Incentive ("LTI") program discussed below), is estimated to be $11.4 million with a weighted average remaining life of 1.5 years. For these shares, the Company assumed no forfeiture rates, generally the shares vest ratably over one to three years and the shares are expensed over their vesting period.
The following summarizes all nonvested share activity, excluding those pursuant to the LTI program, from December 31, 2018 through December 31, 2021 (amounts in thousands, except per share amounts):
| | | | | | | | | | | |
| Nonvested Shares
Outstanding | | Weighted-Average
Price at Grant Date |
| Balance at December 31, 2018 | 379 | | | $ | 34.85 | |
| Granted | 329 | | | 28.47 | |
| Vested | (167) | | | 34.81 | |
| Canceled | (9) | | | 31.01 | |
| Balance at December 31, 2019 | 532 | | | 30.97 | |
| Granted | 256 | | | 38.69 | |
| Vested | (219) | | | 31.56 | |
| Canceled | (14) | | | 33.95 | |
| Balance at December 31, 2020 | 555 | | | 34.23 | |
| Granted | 312 | | | 38.14 | |
| Vested | (320) | | | 33.80 | |
| Canceled | (37) | | | 36.06 | |
| Balance at December 31, 2021 | 510 | | | $ | 36.76 | |
The total grant date fair value of shares vested, excluding those granted under the LTI program, during the years ended December 31, 2021, 2020 and 2019, was $10.8 million, $6.9 million and $5.8 million, respectively.
Long-Term Incentive Program
Pursuant to the Plan, the Compensation Committee may grant time-vested and performance-based nonvested shares. All shares granted under the LTI program were granted to key employees of the Company.
PRA Group, Inc.
Notes to Consolidated Financial Statements
The following table summarizes all LTI share activity from December 31, 2018 through December 31, 2021 (amounts in thousands, except per share amounts):
| | | | | | | | | | | |
| Nonvested LTI Shares
Outstanding | | Weighted-Average
Price at Grant Date |
| Balance at December 31, 2018 | 454 | | | $ | 33.27 | |
| Granted at target level | 168 | | | 28.28 | |
| | | |
| Adjustments for actual performance | (172) | | | 28.98 | |
| Vested | — | | | — | |
| Canceled | (3) | | | 35.87 | |
| Balance at December 31, 2019 | 447 | | | 33.03 | |
| Granted at target level | 118 | | | 39.04 | |
| | | |
| Adjustments for actual performance | (131) | | | 34.44 | |
| Vested | (36) | | | 33.50 | |
| Canceled | (6) | | | 33.77 | |
| Balance at December 31, 2020 | 392 | | | 34.30 | |
| Granted at target level | 148 | | | 37.45 | |
| | | |
| Adjustments for actual performance | (10) | | | 39.40 | |
| Vested | (99) | | | 39.40 | |
| Canceled | (24) | | | 35.31 | |
| Balance at December 31, 2021 | 407 | | | $ | 34.01 | |
The total grant date fair value of LTI shares vested during the years ended December 31, 2021, 2020 and 2019, was $3.9 million, $1.2 million and $0.0 million, respectively.
At December 31, 2021, total future compensation expense, assuming the current estimated performance levels are achieved, related to nonvested shares granted under the LTI program is estimated to be approximately $5.4 million. The Company assumed a 5.0% forfeiture rate for these grants and the remaining shares have a weighted average remaining life of 1.1 years at December 31, 2021.
12. Earnings per Share:
Basic EPS are computed by dividing net income available to common stockholders of PRA Group, Inc. by weighted average common shares outstanding. Diluted EPS are computed using the same components as basic EPS with the denominator adjusted for the dilutive effect of the conversion spread of the Convertible Notes and nonvested share awards, if dilutive. There has been no dilutive effect of the Convertible Notes since issuance through December 31, 2021. Share-based awards that are contingent upon the attainment of performance goals are included in the computation of diluted EPS if the effect is dilutive. The dilutive effect of nonvested shares is computed using the treasury stock method, which assumes any proceeds that could be obtained upon the vesting of nonvested shares would be used to purchase common shares at the average market price for the period.
On July 29, 2021, the Board of Directors approved a share repurchase program that authorized the repurchase of up to $150.0 million of the Company's outstanding shares of common stock. On October 28, 2021, the Board of Directors approved an increase of $80.0 million to the existing share repurchase program for a total of $230.0 million. During the year ended December 31, 2021, the Company repurchased 4,841,313 shares of its common stock for approximately $212.9 million, at an average price of $43.97 per share. The Company's practice is to retire the shares it repurchases.
PRA Group, Inc.
Notes to Consolidated Financial Statements
The following table provides a reconciliation between the computation of basic EPS and diluted EPS for the years ended December 31, 2021, 2020 and 2019 (amounts in thousands, except per share amounts):
| | | | | | | | | | | | | | | | | | | | | | | | | | | | | | | | | | | | | | | | | | | | | | | | | | | | | |
| | 2021 | | 2020 | | 2019 |
| Net Income Attributable to PRA Group, Inc. | | Weighted Average Common Shares | | EPS | | Net Income Attributable to PRA Group, Inc. | | Weighted Average Common Shares | | EPS | | Net Income Attributable to PRA Group, Inc. | | Weighted Average Common Shares | | EPS |
| Basic EPS | $ | 183,158 | | | 44,960 | | | $ | 4.07 | | | $ | 149,339 | | | 45,540 | | | $ | 3.28 | | | $ | 86,158 | | | 45,387 | | | $ | 1.90 | |
| Dilutive effect of nonvested share awards | — | | | 370 | | | (0.03) | | | — | | | 320 | | | (0.02) | | | — | | | 190 | | | (0.01) | |
| Diluted EPS | $ | 183,158 | | | 45,330 | | | $ | 4.04 | | | $ | 149,339 | | | 45,860 | | | $ | 3.26 | | | $ | 86,158 | | | 45,577 | | | $ | 1.89 | |
There were no options outstanding, antidilutive or otherwise, as of December 31, 2021, 2020 and 2019.
13. Income Taxes:
The income tax expense recognized for the years ended December 31, 2021, 2020 and 2019 is comprised of the following (amounts in thousands): | | | | | | | | | | | | | | | | | | | | | | | |
| Federal | | State | | International | | Total |
| For the year ended December 31, 2021: | | | | | | | |
| Current tax expense | $ | 30,659 | | | $ | 5,397 | | | $ | 11,958 | | | $ | 48,014 | |
| Deferred tax (benefit)/expense | (3,056) | | | (323) | | | 10,182 | | | 6,803 | |
| Total income tax expense | $ | 27,603 | | | $ | 5,074 | | | $ | 22,140 | | | $ | 54,817 | |
| | | | | | | |
| For the year ended December 31, 2020: | | | | | | | |
| Current tax expense | $ | 48,223 | | | $ | 12,416 | | | $ | 39,067 | | | $ | 99,706 | |
| Deferred tax benefit | (32,699) | | | (8,921) | | | (16,883) | | | (58,503) | |
| Total income tax expense | $ | 15,524 | | | $ | 3,495 | | | $ | 22,184 | | | $ | 41,203 | |
| | | | | | | |
| For the year ended December 31, 2019: | | | | | | | |
| Current tax expense | $ | 41,391 | | | $ | 6,390 | | | $ | 9,460 | | | $ | 57,241 | |
| Deferred tax benefit | (27,311) | | | (6,030) | | | (4,220) | | | (37,561) | |
| Total income tax expense | $ | 14,080 | | | $ | 360 | | | $ | 5,240 | | | $ | 19,680 | |
On December 22, 2017, the United States government enacted comprehensive tax legislation commonly referred to as the "Tax Act." The main impact of the Tax Act was a reduction of the U.S. federal corporate tax rate from 35% to 21% and the current taxation of international entities. New legislation and authoritative guidance as a result of the Tax Act are still being released that may impact tax amounts recorded in the financial statements. Under U.S. GAAP, the Company made an accounting policy election to treat taxes due related to global intangible low-taxed income ("GILTI") as a current-period expense when incurred.
On March 27, 2020, the Coronavirus Aid, Relief, and Economic Security Act was enacted into U.S. law in response to COVID-19, with varying legislation enacted in many of the other countries in which the Company operates. The Company has implemented the tax payment and filing deferral provisions as applicable on a global basis and does not believe that any of the other provisions will have a material impact to its financial reporting. COVID-19 related legislation and administrative releases are monitored by the Company.
PRA Group, Inc.
Notes to Consolidated Financial Statements
A reconciliation of the Company's expected tax expense at the U.S. statutory federal tax rate to actual tax expense/(benefit) for the years ended December 31, 2021, 2020 and 2019 is as follows (amounts in thousands):
| | | | | | | | | | | | | | | | | |
| 2021 | | 2020 | | 2019 |
| Income tax expense at statutory federal rates | $ | 52,568 | | | $ | 43,878 | | | $ | 24,645 | |
| State tax expense, net of federal tax benefit | 4,303 | | | 2,449 | | | 161 | |
| | | | | |
| Tax impact on international earnings, excluding uncertain tax positions | (4,449) | | | (29,992) | | | (7,326) | |
| | | | | |
| | | | | |
| Uncertain tax positions on international earnings | — | | | 23,917 | | | — | |
| | | | | |
| Other | 2,395 | | | 951 | | | 2,200 | |
| Total income tax expense | $ | 54,817 | | | $ | 41,203 | | | $ | 19,680 | |
The Company recognized a net deferred tax asset of $31.1 million and $42.3 million as of December 31, 2021 and 2020, respectively. The components of the net deferred tax are as follows (amounts in thousands):
| | | | | | | | | | | |
| 2021 | | 2020 |
| Deferred tax assets: | | | |
| Employee compensation | $ | 8,609 | | | $ | 8,770 | |
| Net operating loss carryforward | 121,035 | | | 117,889 | |
| | | |
| | | |
| | | |
| | | |
| | | |
| | | |
| Interest | 10,160 | | | 12,840 | |
| Finance receivable revenue recognition - international | 2,351 | | | 17,160 | |
| Lease liability | 11,811 | | | 14,478 | |
| Other | 4,873 | | | 6,348 | |
| Valuation allowance | (75,375) | | | (73,595) | |
| | | |
| Total deferred tax asset | 83,464 | | | 103,890 | |
| Deferred tax liabilities: | | | |
| Property and equipment | (5,075) | | | (6,214) | |
| Intangible assets and goodwill | (4,185) | | | (3,245) | |
| ROU asset | (10,884) | | | (13,509) | |
| Convertible debt | — | | | (5,113) | |
| | | |
| | | |
| Finance receivable revenue recognition - domestic | (32,189) | | | (33,471) | |
| | | |
| Total deferred tax liability | (52,333) | | | (61,552) | |
| | | |
| | | |
| Net deferred tax asset/(liability) | $ | 31,131 | | | $ | 42,338 | |
A valuation allowance for deferred tax assets is recognized and charged to earnings in the period such determination is made, if it is determined that it is more likely than not that the deferred tax asset will not be realized. If the Company subsequently realized deferred tax assets that were previously determined to be unrealizable, the respective valuation allowance would be reversed, resulting in a positive adjustment to earnings in the period such determination is made. The determination for a valuation allowance is made on a jurisdiction-by-jurisdiction basis. At December 31, 2021 and 2020, the valuation allowance, relating mainly to net operating losses, capital losses and deferred interest expense in Norway, Poland, Luxembourg, Sweden and Switzerland was $75.4 million and $73.6 million, respectively. The increase in the valuation allowance is primarily related to foreign tax credits in Sweden. The Company believes it is more likely than not that the results of future operations will generate sufficient taxable income to realize the remaining net deferred tax assets.
ASC Topic 740 "Income Taxes" ("ASC 740") requires the recognition of interest if the tax law would require interest to be paid on the underpayment of taxes, and recognition of penalties if a tax position does not meet the minimum statutory threshold to avoid payment of penalties. The Company believes it has sufficient support for the technical merits of its positions and that it is more likely than not these positions will be sustained. Accordingly, the Company has not accrued for interest or penalties on any of its tax positions, except as noted for uncertain tax positions.
At December 31, 2021, the tax years subject to examination by the major federal, state and international taxing jurisdictions are 2015 and subsequent years.
As of December 31, 2021, the cumulative unremitted earnings of the Company's international subsidiaries were approximately $116.3 million. The Company intends for predominantly all international earnings to be indefinitely reinvested
PRA Group, Inc.
Notes to Consolidated Financial Statements
in its international operations and, therefore, the recording of deferred tax liabilities for such unremitted earnings is not required. It is impracticable to determine the total amount of unrecognized deferred taxes with respect to these indefinitely reinvested earnings.
The Company's non-U.S. subsidiaries had $514.4 million and $517.0 million of net operating loss carryforwards as of December 31, 2021 and 2020, respectively. There are $276.6 million and $275.3 million of valuation allowances recorded to offset those losses as of December 31, 2021 and 2020, respectively. The net operating losses do not expire under most local laws and the remaining jurisdictions allow for a seven to 20 year carryforward period.
Uncertain Tax Positions
ASC 740 prescribes a recognition threshold and measurement attribute for a tax position taken or expected to be taken in a tax return. Under ASC 740, an entity should recognize a financial statement benefit for a tax position if it determines that it is more likely than not that the position will be sustained upon examination.
The balance for unrecognized tax benefits at December 31, 2021 and 2020, was $114.3 million and $110.4 million, respectively. The unrecognized tax benefits recorded in 2021 are included in the provision for income taxes. The following is a reconciliation of gross unrecognized tax benefits for the year ended December 31, 2021 and 2020 (amounts in thousands):
| | | | | | | | | | | |
| 2021 | | 2020 |
| Balance at beginning of year | $ | 110,425 | | | $ | — | |
Additions, based on tax positions related to current year (1) | — | | | 32,673 | |
Additions, based on tax positions related to prior year (2) | 3,869 | | | 77,752 | |
| Balance at end of year | $ | 114,294 | | | $ | 110,425 | |
(1) The 2020 additions relate to international transactions, primarily due to an ongoing audit of the prior year returns.
(2) The 2021 additions relate to international transactions, primarily due to statutory audit adjustments.
The total amount of unrecognized tax benefits at December 31, 2021, that, if recognized, would affect the effective tax rate was $22.1 million.
During the year ended December 31, 2021, the Company accrued potential interest of $1.2 million and penalties of $1.7 million related to unrecognized tax benefits.
During the next 12 months it is possible that international tax reserves will be reduced for audit settlements. At this time, the Company is unable to predict the outcome of these audits.
14. Commitments and Contingencies:
Employment Agreements:
The Company has entered into employment agreements with each of its U.S. executive officers, which expire on December 31, 2023. Such agreements provide for base salary payments as well as potential discretionary bonuses that consider the Company's overall performance against its short and long-term financial and strategic objectives. The agreements also contain confidentiality and non-compete provisions. As of December 31, 2021, estimated future compensation under these agreements was approximately $13.0 million. Outside the U.S., the Company has entered into employment agreements with certain employees pursuant to local country regulations. Generally, these agreements do not have expiration dates. As a result it is impractical to estimate the amount of future compensation under these agreements. Accordingly, the future compensation under these agreements is not included in the $13.0 million total above.
Forward Flow Agreements:
The Company is party to several forward flow agreements that allow for the purchase of nonperforming loans at pre-established prices. The maximum remaining amount to be purchased under forward flow agreements at December 31, 2021 was approximately $650.6 million.
Finance Receivables:
Certain agreements for the purchase of finance receivables portfolios contain provisions that may, in limited circumstances, require the Company to refund a portion or all of the collections subsequently received by the Company on particular accounts. The potential refunds as of the balance sheet date are not considered to be significant.
PRA Group, Inc.
Notes to Consolidated Financial Statements
Litigation and Regulatory Matters:
The Company and its subsidiaries are from time to time subject to a variety of routine legal and regulatory claims, inquiries and proceedings and regulatory matters, most of which are incidental to the ordinary course of its business. The Company initiates lawsuits against customers and is occasionally countersued by them in such actions. Also, customers, either individually, as members of a class action, or through a governmental entity on behalf of customers, may initiate litigation against the Company in which they allege that the Company has violated a state or federal law in the process of collecting on an account. From time to time, other types of lawsuits are brought against the Company. Additionally, the Company receives subpoenas and other requests or demands for information from regulators or governmental authorities who are investigating the Company's debt collection activities.
The Company accrues for potential liability arising from legal proceedings and regulatory matters when it is probable that such liability has been incurred and the amount of the loss can be reasonably estimated. This determination is based upon currently available information for those proceedings in which the Company is involved, taking into account the Company's best estimate of such losses for those cases for which such estimates can be made. The Company's estimate involves significant judgment, given the varying stages of the proceedings (including the fact that many of them are currently in preliminary stages), the number of unresolved issues in many of the proceedings (including issues regarding class certification and the scope of many of the claims), and the related uncertainty of the potential outcomes of these proceedings. In making determinations of the likely outcome of pending litigation, the Company considers many factors, including, but not limited to, the nature of the claims, the Company's experience with similar types of claims, the jurisdiction in which the matter is filed, input from outside legal counsel, the likelihood of resolving the matter through alternative mechanisms, the matter's current status and the damages sought or demands made. Accordingly, the Company's estimate will change from time to time, and actual losses could be more than the current estimate.
The Company believes that the estimate of the aggregate range of reasonably possible losses in excess of the amount accrued for its legal proceedings outstanding at December 31, 2021, where the range of loss can be estimated, was not material.
In certain legal proceedings, the Company may have recourse to insurance or third-party contractual indemnities to cover all or portions of its litigation expenses, judgments, or settlements. Loss estimates and accruals for potential liability related to legal proceedings are typically exclusive of potential recoveries, if any, under the Company's insurance policies or third-party indemnities. The Company has not recorded any potential recoveries under the Company's insurance policies or third-party indemnities as of December 31, 2021.
The matters described below fall outside of the normal parameters of the Company's routine legal proceedings.
Consumer Financial Protection Bureau ("CFPB") Investigation
In response to requests and civil investigative demands from the CFPB, the Company has provided certain documents and data regarding its debt collection practices to the CFPB. In December 2020, the CFPB advised the Company that the CFPB believes the Company may have violated certain provisions of the Company's Consent Order with the CFPB and applicable law and provided the Company with the opportunity to respond. The Company has discussed with the CFPB the possible resolution of the investigation. During the Company's discussions with the CFPB, the CFPB has taken positions with which the Company disagrees, including positions related to penalties, restitution and/or the adoption of new practices in the conduct of the Company's business. At this time, the Company is unable to predict the outcome of the investigation.
Multi-State Investigation
On November 17, 2015, the Company received civil investigative demands from multiple state Attorneys General offices ("AGOs") broadly relating to its U.S. debt collection practices. The Company believes that it has fully cooperated with the investigations and discussed potential resolution of the investigations with the AGOs. In these discussions, the AGOs have taken positions with which the Company disagrees, including positions related to penalties, restitution and/or the adoption of new practices and controls in the conduct of the Company's business.
Although the Company has settled certain claims with one of the states, it is possible that one or more of the remaining individual state AGOs may file claims against the Company if the Company is unable to resolve its differences with them.
Iris Pounds v. Portfolio Recovery Associates, LLC
On November 21, 2016, Iris Pounds filed suit against the Company in Durham County, North Carolina alleging violations of the North Carolina Prohibited Practices by Collection Agencies Act. The purported class consists of all individuals against whom the Company had obtained a judgment by default in North Carolina on or after October 1, 2009. On December 9,
PRA Group, Inc.
Notes to Consolidated Financial Statements
2016, the Company removed the matter to the United States District Court for the Middle District of North Carolina (the "District Court"). On March 28, 2018, the District Court entered an order remanding the matter to the North Carolina state court, which the Fourth Circuit Court of Appeals affirmed on May 17, 2018. On January 11, 2019, the Company filed motions to compel arbitration with the North Carolina state court, which was denied. The Company is seeking review of the North Carolina state court's decision to deny the Company's motion to compel arbitration. The range of loss, if any, cannot be estimated at this time due to the uncertainty surrounding liability, class certification and the interpretation of statutory damages.
Telephone Consumer Protection Act ("TCPA") Litigation
On January 25, 2017, the Company resolved the matter of In Re Portfolio Recovery Associates, LLC Telephone Consumer Protection Act Litigation, which consisted of a number of class actions and single plaintiff claims consolidated by order of the Panel for Multi-District Litigation ("MDL"). While the settlement disposed of a large number of claims, several hundred class members opted out ("Opt-Out Plaintiffs") of that settlement. Many of these Opt-Out Plaintiffs have been consolidated before the MDL appointed court, which is the U.S. District Court for the Southern District of California, and are pending a determination on cross-motions for summary judgment. On April 1, 2021, the U.S. Supreme Court defined "automatic telephone dialing system" in its Facebook v. Duguid decision, which the Company expects to be dispositive of most or all of the Company's currently pending TCPA matters. However, the Company does not have certainty regarding such dispositions. As a result, the range of loss, if any, cannot be estimated at this time due to the uncertainty surrounding liability.
15. Retirement Plans:
The Company sponsors defined contribution plans primarily in the U.S. and Europe. The U.S. plan is organized as a 401(k) plan under which all employees over 18 years of age are eligible to make voluntary contributions to the plan up to 100% of their compensation, subject to IRS limitations, after completing six months of service, as defined in the plan. The Company makes matching contributions of up to 4% of an employee's salary. For the defined contribution plans in Europe, the Company pays contributions to publicly or privately administered pension insurance plans on a mandatory, contractual or voluntary basis. Total compensation expense related to the Company's contributions was $6.5 million, $6.4 million and $5.9 million for the years ended December 31, 2021, 2020 and 2019, respectively.
16. Subsequent Event:
On February 25, 2022, the Company completed its $230.0 million share repurchase program. Also on February 25, 2022, the Company's Board of Directors approved a new share repurchase program under which the Company is authorized to repurchase up to $150.0 million of its outstanding common stock. Repurchases may be made from time-to-time in open market transactions, through privately negotiated transactions, in block transactions, through purchases made in accordance with trading plans adopted under Rule 10b5-1 of the Securities Exchange Act of 1934 or other methods, subject to market and/or other conditions and applicable regulatory requirements. The new share repurchase program has no stated expiration date and does not obligate the Company to repurchase any specified amount of shares, remains subject to the discretion of the Board of Directors and, subject to compliance with applicable laws, may be modified, suspended or discontinued at any time.
PRA Group, Inc.
Notes to Consolidated Financial Statements
Item 9. Changes in and Disagreements with Accountants on Accounting and Financial Disclosure.
None.
Item 9A. Controls and Procedures.
Evaluation of Disclosure Controls and Procedures. We maintain disclosure controls and procedures (as defined in Exchange Act Rules 13a-15(e) and 15d-15(e)) that are designed to ensure that information required to be disclosed in our Exchange Act reports is recorded, processed, summarized and reported within the time periods specified in the SEC’s rules and forms, and that such information is accumulated and communicated to our management, including our Chief Executive Officer and Chief Financial Officer, as appropriate, to allow timely decisions regarding required disclosure. In designing and evaluating the disclosure controls and procedures, management recognized that any controls and procedures, no matter how well designed and operated, can provide only reasonable assurance of achieving the desired control objectives, and management necessarily was required to apply its judgment in evaluating the cost-benefit relationship of possible controls and procedures. Also, projections of any evaluation of effectiveness to future periods are subject to the risk that controls may become inadequate because of changes in conditions or that the degree of compliance with the policies or procedures may deteriorate. We conducted an evaluation, under the supervision and with the participation of our Chief Executive Officer and Chief Financial Officer, of the effectiveness of our disclosure controls and procedures as of the end of the period covered by this Form 10-K. Based on this evaluation, the principal executive officer and principal financial officer have concluded that, as of December 31, 2021, our disclosure controls and procedures were effective.
Management’s Report on Internal Control Over Financial Reporting. Our management is responsible for establishing and maintaining effective internal control over financial reporting. Internal control over financial reporting is defined in Exchange Act Rules 13a-15(f) and 15d-15(f) as a process designed by, or under the supervision of, the company’s principal executive and principal financial officers and effected by the company’s board of directors, management and other personnel, to provide reasonable assurance regarding the reliability of financial reporting and the preparation of financial statements for external purposes in accordance with generally accepted accounting principles. Because of its inherent limitations, internal control over financial reporting may not prevent or detect misstatements. Under the supervision and with the participation of our management, including our Chief Executive Officer and Chief Financial Officer, we carried out an evaluation of the effectiveness of our internal control over financial reporting based on the Internal Control - Integrated Framework (2013) issued by the Committee of Sponsoring Organizations (COSO) of the Treadway Commission. Based on its assessment under this framework, management has determined that our internal control over financial reporting was effective as of December 31, 2021. Our independent registered public accounting firm, KPMG LLP, has issued an audit report on the effectiveness of our internal control over financial reporting as of December 31, 2021, which is included herein.
Changes in Internal Control over Financial Reporting. There was no change in our internal control over financial reporting that occurred during the quarter ended December 31, 2021 that has materially affected, or is reasonably likely to materially affect, our internal control over financial reporting.
Report of Independent Registered Public Accounting Firm
To the Stockholders and Board of Directors
PRA Group, Inc.:
Opinion on Internal Control Over Financial Reporting
We have audited PRA Group, Inc. and subsidiaries' (the Company) internal control over financial reporting as of December 31, 2021, based on criteria established in Internal Control – Integrated Framework (2013) issued by the Committee of Sponsoring Organizations of the Treadway Commission. In our opinion, the Company maintained, in all material respects, effective internal control over financial reporting as of December 31, 2021, based on criteria established in Internal Control – Integrated Framework (2013) issued by the Committee of Sponsoring Organizations of the Treadway Commission.
We also have audited, in accordance with the standards of the Public Company Accounting Oversight Board (United States) (PCAOB), the consolidated balance sheets of the Company as of December 31, 2021 and 2020, the related consolidated income statements, statements of comprehensive income, changes in equity, and cash flows for each of the years in the three-year period ended December 31, 2021, and the related notes (collectively, the consolidated financial statements), and our report dated February 28, 2022 expressed an unqualified opinion on those consolidated financial statements.
Basis for Opinion
The Company’s management is responsible for maintaining effective internal control over financial reporting and for its assessment of the effectiveness of internal control over financial reporting, included in the accompanying Management's Report on Internal Control Over Financial Reporting. Our responsibility is to express an opinion on the Company’s internal control over financial reporting based on our audit. We are a public accounting firm registered with the PCAOB and are required to be independent with respect to the Company in accordance with the U.S. federal securities laws and the applicable rules and regulations of the Securities and Exchange Commission and the PCAOB.
We conducted our audit in accordance with the standards of the PCAOB. Those standards require that we plan and perform the audit to obtain reasonable assurance about whether effective internal control over financial reporting was maintained in all material respects. Our audit of internal control over financial reporting included obtaining an understanding of internal control over financial reporting, assessing the risk that a material weakness exists, and testing and evaluating the design and operating effectiveness of internal control based on the assessed risk. Our audit also included performing such other procedures as we considered necessary in the circumstances. We believe that our audit provides a reasonable basis for our opinion.
Definition and Limitations of Internal Control Over Financial Reporting
A company’s internal control over financial reporting is a process designed to provide reasonable assurance regarding the reliability of financial reporting and the preparation of financial statements for external purposes in accordance with generally accepted accounting principles. A company’s internal control over financial reporting includes those policies and procedures that (1) pertain to the maintenance of records that, in reasonable detail, accurately and fairly reflect the transactions and dispositions of the assets of the company; (2) provide reasonable assurance that transactions are recorded as necessary to permit preparation of financial statements in accordance with generally accepted accounting principles, and that receipts and expenditures of the company are being made only in accordance with authorizations of management and directors of the company; and (3) provide reasonable assurance regarding prevention or timely detection of unauthorized acquisition, use, or disposition of the company’s assets that could have a material effect on the financial statements.
Because of its inherent limitations, internal control over financial reporting may not prevent or detect misstatements. Also, projections of any evaluation of effectiveness to future periods are subject to the risk that controls may become inadequate because of changes in conditions, or that the degree of compliance with the policies or procedures may deteriorate.
/s/ KPMG LLP
Norfolk, Virginia
February 28, 2022
Item 9B. Other Information.
None.
Item 9C. Disclosure Regarding Foreign Jurisdictions that Prevent Inspections.
Not applicable.
PART III
Item 10. Directors, Executive Officers and Corporate Governance.
The information required by Item 10 is incorporated herein by reference to the sections labeled "Executive Officers," "Security Ownership," "Corporate Governance Board Committees," "Proposal 1: Election of Directors" and "Corporate Governance – Code of Conduct," in our definitive Proxy Statement for use in connection with the Company's 2022 Annual Meeting of Stockholders (the "Proxy Statement").
Item 11. Executive Compensation.
The information required by Item 11 is incorporated herein by reference to the sections labeled "Compensation Discussion and Analysis," "Compensation Tables and Information," "Corporate Governance – Director Compensation" and "Compensation Committee Report" in the Proxy Statement.
Item 12. Security Ownership of Certain Beneficial Owners And Management And Related Stockholder Matters.
The information required by Item 12 is incorporated herein by reference to the section labeled "Security Ownership" and "Compensation Tables and Information – Securities Authorized for Issuance Under Equity Compensation Plans" in the Proxy Statement.
Item 13. Certain Relationships and Related Transactions, and Director Independence.
The information required by Item 13 is incorporated herein by reference to the sections labeled "Corporate Governance –Policy for Approval of Related Party Transactions" and "Corporate Governance-Director Independence" in the Proxy Statement.
Item 14. Principal Accountant Fees and Services.
Our independent registered public accounting firm is KPMG LLP, Norfolk, VA, Auditor Firm ID: 185.
The information required by Item 14 is incorporated herein by reference to the section labeled "Fees Paid to KPMG" and "Audit Committee Pre-Approval Policies and Procedures" in the Proxy Statement.
PART IV
Item 15. Exhibits and Financial Statement Schedules.
(a)Financial Statements.
The following financial statements are included in Item 8 of this Form 10-K:
| | | | | |
| |
| |
| |
| |
| |
| |
| |
| |
| |
| |
| |
| |
| |
| Fourth Amendment to the Credit Agreement dated July 30, 2021, by and among PRA Group Inc. and PRA Group Canada Inc., the Guarantors, the Lenders party thereto,Bank of America, N.A., as Administrative Agent and Bank of America, N.A., acting through its Canada Branch, as Canadian Administrative Agent (Incorporated by reference to Exhibit 10.3 of the Quarterly Report on Form 10-Q filed November 8, 2021 (File No. 000-50058)). |
| |
| |
| |
| |
| |
| |
| |
| |
| |
| 101.INS | Inline XBRL Instance Document |
| 101.SCH | Inline XBRL Taxonomy Extension Schema Document |
| | | | | |
| 101.CAL | Inline XBRL Taxonomy Extension Calculation Linkbase Document |
| 101.LAB | Inline XBRL Taxonomy Extension Label Linkbase Document |
| 101.PRE | Inline XBRL Taxonomy Extension Presentation Linkbase Document |
| 101.DEF | Inline XBRL Taxonomy Extension Definition Linkbase Document |
| 104 | Cover Page Interactive Data File (formatted as Inline XBRL and contained in Exhibit 101) |
* Denotes management contract or compensatory plan or arrangement in which directors or executive officers are eligible to participate.
Item 16. Form 10-K Summary.
None.
SIGNATURES
Pursuant to the requirements of Section 13 or 15(d) of the Securities Exchange Act of 1934, the registrant has duly caused this report to be signed on its behalf by the undersigned, thereunto duly authorized.
| | | | | | | | | | | | | | | | | |
| | | | | |
| | | | PRA Group, Inc. |
| | | | (Registrant) |
| | | | | |
| February 28, 2022 | | | | By: | /s/ Kevin P. Stevenson |
| | | | | Kevin P. Stevenson |
| | | | | President and Chief Executive Officer |
| | | | | (Principal Executive Officer) |
KNOW ALL PERSONS BY THESE PRESENTS, that each of the undersigned whose signature appears below constitutes and appoints Kevin P. Stevenson and Peter M. Graham, his true and lawful attorneys-in-fact, with full power of substitution and resubstitution for him and on his behalf, and in his name, place and stead, in any and all capacities to execute and sign any and all amendments or post-effective amendments to this Annual Report on Form 10-K, and to file the same, with all exhibits thereto, and other documents in connection therewith, with the Securities and Exchange Commission, hereby ratifying and confirming all that said attorneys-in-fact or any of them or their or his substitute or substitutes, may lawfully do or cause to be done by virtue hereof and the registrant hereby confers like authority on its behalf.
Pursuant to the requirements of the Securities Exchange Act of 1934, this report has been signed below by the following persons on behalf of the registrant and in the capacities and on the dates indicated.
| | | | | | | | | | | | | | | | | |
| | | | | |
| | | | | |
| February 28, 2022 | | | | By: | /s/ Kevin P. Stevenson |
| | | | | Kevin P. Stevenson |
| | | | | President, Chief Executive Officer and Director |
| | | | | (Principal Executive Officer) |
| | | | | | | | | | | | | | | | | |
| | | | | |
| | | | | |
| February 28, 2022 | | | | By: | /s/ Peter M. Graham |
| | | | | Peter M. Graham |
| | | | | Executive Vice President and Chief Financial Officer |
| | | | | (Principal Financial and Accounting Officer) |
| | | | | | | | | | | | | | | | | |
| | | | | |
| | | | | |
| | | | | |
| | | | | |
| | | | | |
| | | | | |
| | | | | |
| February 28, 2022 | | | | By: | /s/ Steven D. Fredrickson |
| | | | | Steven D. Fredrickson |
| | | | | Director |
| | | | | |
| | | | | |
| February 28, 2022 | | | | By: | /s/Vikram A. Atal |
| | | | | Vikram A. Atal |
| | | | | Director |
| | | | | |
| | | | | |
| February 28, 2022 | | | | By: | /s/ Danielle M. Brown |
| | | | | Danielle M. Brown |
| | | | | Director |
| | | | | |
| | | | | |
| February 28, 2022 | | | | By: | /s/ Marjorie M. Connelly |
| | | | | Marjorie M. Connelly |
| | | | | Director |
| | | | | |
| | | | | |
| February 28, 2022 | | | | By: | /s/ John H. Fain |
| | | | | John H. Fain |
| | | | | Director |
| | | | | |
| | | | | |
| February 28, 2022 | | | | By: | /s/ James A. Nussle |
| | | | | James A. Nussle |
| | | | | Director |
| | | | | |
| | | | | |
| February 28, 2022 | | | | By: | /s/ Brett L. Paschke |
| | | | | Brett L. Paschke |
| | | | | Director |
| | | | | |
| | | | | |
| February 28, 2022 | | | | By: | /s/ Scott M. Tabakin |
| | | | | Scott M. Tabakin |
| | | | | Director |
| | | | | |
| | | | | |
| February 28, 2022 | | | | By: | /s/Peggy P. Turner |
| | | | | Peggy P. Turner |
| | | | | Director |
| | | | | |
| | | | | |
| February 28, 2022 | | | | By: | /s/ Lance L. Weaver |
| | | | | Lance L. Weaver |
| | | | | Director |