EXHIBIT 99.2


UNITED STATES
SECURITIES AND EXCHANGE COMMISSION
Washington, D.C. 20549
FORM 8-K
CURRENT REPORT
Pursuant to Section 13 or 15(d) of
The Securities Exchange Act of 1934
Date of Report (Date of earliest event reported): February 25, 2016
PRA Group, Inc.
(Exact name of registrant as specified in its charter)
| Delaware | 000-50058 | 75-3078675 |
| (State or other jurisdiction of incorporation) |
(Commission File Number) | (IRS Employer Identification No.) |
| 120 Corporate Boulevard, Suite 100, Norfolk, Virginia | 23502 |
| (Address of principal executive offices) | (Zip Code) |
Registrant's telephone number, including area code: 888-772-7326
________________________________________________________________________________
(Former name or former address, if changed since last report)
Check the appropriate box below if the Form 8-K filing is intended to simultaneously satisfy the filing obligation of the registrant under any of the following provisions:
| [ ] | Written communications pursuant to Rule 425 under the Securities Act (17 CFR 230.425) | |
| [ ] | Soliciting material pursuant to Rule 14a-12 under the Exchange Act (17 CFR 240.14a-12) | |
| [ ] | Pre-commencement communications pursuant to Rule 14d-2(b) under the Exchange Act (17 CFR 240.14d-2(b)) | |
| [ ] | Pre-commencement communications pursuant to Rule 13e-4(c) under the Exchange Act (17 CFR 240.13e-4(c)) |
Item 2.02. Results of Operations and Financial Condition.
On February 25, 2016 the Registrant issued a press release, a copy of which is attached hereto as Exhibit 99.1 and is incorporated into this Item 2.02 by reference.
The information contained in this Item 2.02 and in the accompanying Exhibit 99.1 to this Current Report shall be deemed to be “furnished” and shall not be deemed to be “filed” for purposes of Section 18 of the Securities Exchange Act of 1934, as amended (the “Exchange Act”), or otherwise subject to the liabilities of that Section or Sections 11 and 12(a)(2) of the Securities Act of 1933, as amended (the “Securities Act”). The information contained in this Item 2.02 and in the accompanying Exhibit 99.1 to this Current Report shall not be incorporated by reference into any filing with the U.S. Securities and Exchange Commission under the Securities Act or the Exchange Act made by the Company, whether made before or after the date hereof, regardless of any general incorporation language in such filing.
Item 7.01. Regulation FD Disclosure.
The Registrant provided a slide presentation to be utilized during its February 25, 2016 conference call and webcast, a copy of which is attached hereto as Exhibit 99.2 and is incorporated into this Item 7.01 by reference.
The information contained in this Item 7.01 and in the accompanying Exhibit 99.2 to this Current Report shall be deemed to be “furnished” and shall not be deemed to be “filed” for purposes of Section 18 of the Exchange Act, or otherwise subject to the liabilities of that Section or Sections 11 and 12(a)(2) of the Securities Act. The information contained in this Item 7.01 and in the accompanying Exhibit 99.2 to this Current Report shall not be incorporated by reference into any filing with the U.S. Securities and Exchange Commission under the Securities Act or the Exchange Act made by the Company, whether made before or after the date hereof, regardless of any general incorporation language in such filing.
Item
9.01. Financial Statements and Exhibits. Slide
Presentation to be utilized February 25, 2016, during a conference call and webcast by PRA Group, Inc. SIGNATURE Pursuant to the requirements of the Securities Exchange Act of 1934, the Registrant has duly caused this report to be signed on its behalf by the undersigned hereunto duly authorized. Slide Presentation to be
utilized February 25, 2016, during conference call and webcast by PRA Group, Inc.
Exhibit 99.1
Press release dated February 25, 2016
Exhibit 99.2
PRA Group, Inc.
(Registrant)
February 25, 2016
(Date)
/s/ KEVIN P. STEVENSON
Kevin P. Stevenson
President & Chief Financial Officer
Exhibit Index
99.1
Press release dated February 25, 2016
99.2
EXHIBIT 99.1
PRA Group Reports Fourth Quarter and Full Year 2015 Results
Acquires Recovery Management Systems Corporation
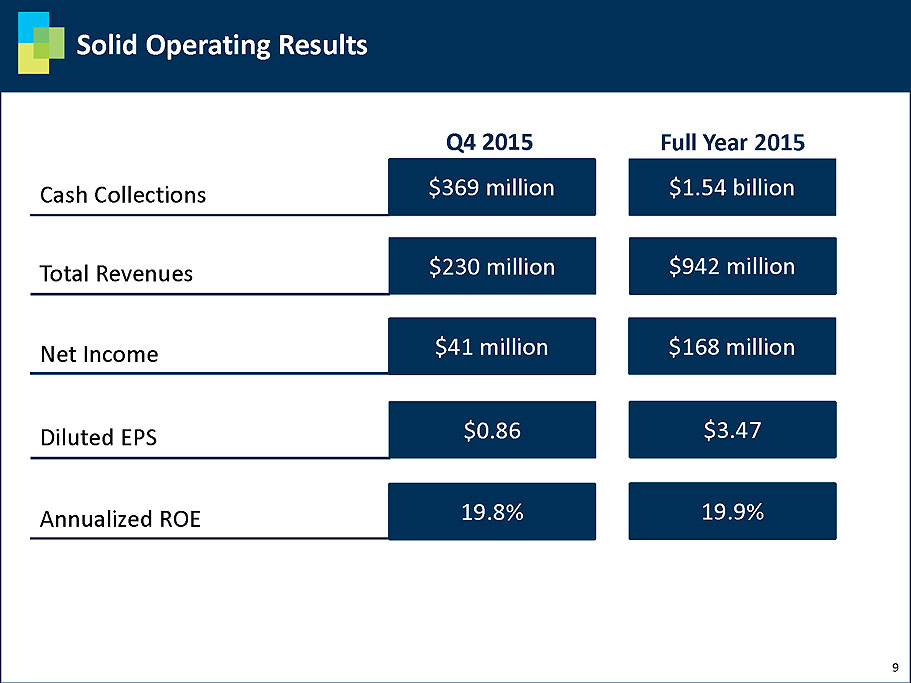
NORFOLK, Va., Feb. 25, 2016 (GLOBE NEWSWIRE) -- PRA Group (Nasdaq:PRAA), a global leader in acquiring and collecting nonperforming loans, today reported its financial results for the fourth quarter and full year of 2015. The company reported diluted earnings per share of $0.86 and non-GAAP diluted earnings per share of $1.03 for the fourth quarter of 2015. For the full year, the company reported diluted earnings per share of $3.47 and non-GAAP diluted earnings per share of $4.30. Non-GAAP financial results are presented in constant currency with the third and fourth quarter of 2014 and exclude items unrelated to normal operations. A reconciliation of all non-GAAP financial measures to the most directly comparable GAAP financial measure can be found at the end of this press release.
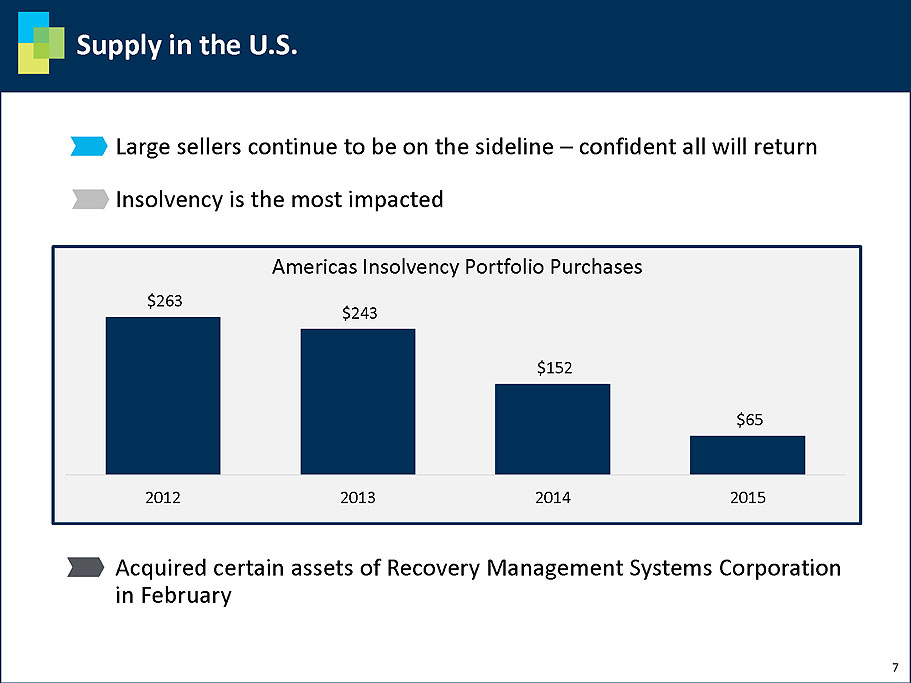
The company also announced the acquisition of certain assets of Recovery Management Systems Corporation (RMSC). The transaction also includes the hiring of most RMSC employees. Mike Petit, president of PRA Insolvency Investment Services, said, “We are extremely impressed with RMSC’s technology platform supporting its bankrupt account processing and recovery management business. This acquisition strengthens and broadens our ability to offer bankruptcy processing services to our clients and complements our existing Insolvency business.”
Fourth Quarter Highlights
Full Year Highlights
“One thing remains evident for our future long term results, the industry consolidation in the U.S. Core market remains a critical positive for us,” said Steve Fredrickson, chairman and chief executive officer, PRA Group. “When any of the events decreasing supply in the U.S. change, PRA will be there to win our fair share and our results should begin to show the effects soon thereafter. We feel confident that with our industry low leverage, we will be ready and able to purchase portfolios that are within our return profile both now and when volume inevitably picks up. In the meantime, we are highly profitable, producing strong results for shareholders, while we grow rapidly in Europe and South America, and improve our operating effectiveness consistently.”
REVENUES AND CASH COLLECTIONS
| Cash Collection Source ($ in thousands) | Q4-2015 | Q3-2015 | Q2-2015 | Q1-2015 | Q4-2014 | ||||||||||
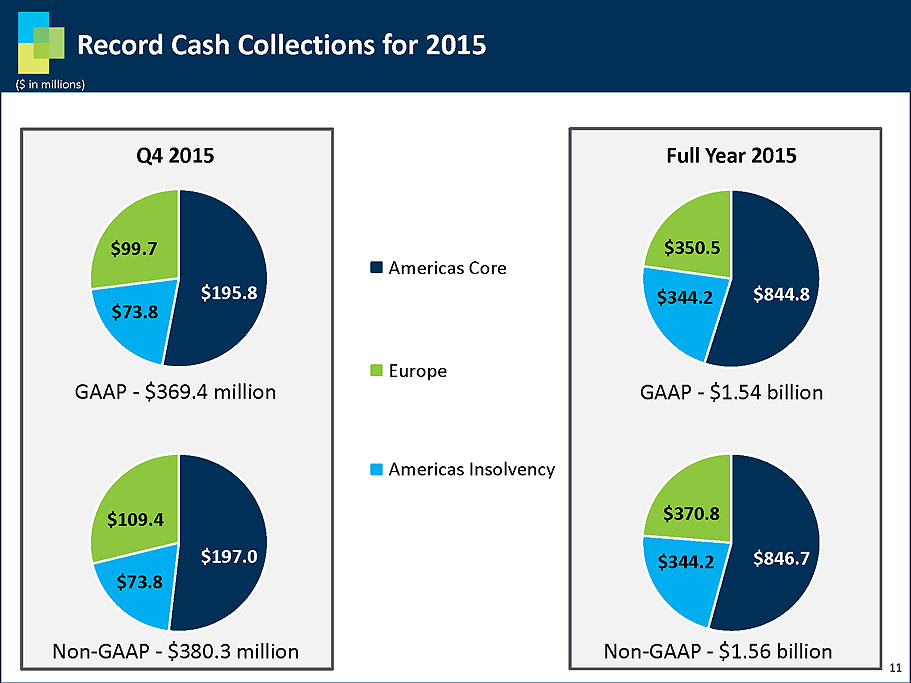
| Americas-Core | $ | 195,834 | $ | 210,725 | $ | 218,838 | $ | 219,371 | $ | 185,921 | |||||
| Americas-Insolvency | 73,843 | 81,865 | 92,974 | 95,533 | 103,104 | ||||||||||
| Europe-Core | 97,149 | 85,635 | 76,602 | 83,876 | 84,398 | ||||||||||
| Europe-Insolvency | 2,545 | 2,528 | 1,210 | 967 | 5 | ||||||||||
| Total Cash Collections | $ | 369,371 | $ | 380,753 | $ | 389,624 | $ | 399,747 | $ | 373,428 | |||||
| Cash Collection Source - Constant Currency Adjusted ($ in thousands) | Q4-2015 | YTD-2015 | Q4-2014 | YTD-2014 | |||||||||||
| Americas-Core | $ | 196,967 | $ | 846,703 | $ | 185,921 | $ | 752,995 | |||||||
| Americas-Insolvency | 73,843 | 344,215 | 103,104 | 458,451 | |||||||||||
| Europe-Core | 106,899 | 363,557 | 84,398 | 167,361 | |||||||||||
| Europe-Insolvency | 2,546 | 7,252 | 5 | 5 | |||||||||||
| Total Cash Collections | $ | 380,255 | $ | 1,561,727 | $ | 373,428 | $ | 1,378,812 | |||||||
EXPENSES AND OPERATING INCOME
PORTFOLIO ACQUISITIONS
| Portfolio Purchase Source ($ in thousands) | Q42015 | Q32015 | Q22015 | Q12015 | Q42014 | ||||||||||
| Americas-Core | $ | 120,554 | $ | 90,912 | $ | 98,317 | $ | 138,498 | $ | 119,714 | |||||
| Americas-Insolvency | 20,589 | 9,300 | 19,111 | 16,437 | 24,949 | ||||||||||
| Europe-Core (1) | 79,735 | 240,385 | 88,499 | 21,579 | 123,194 | ||||||||||
| Europe-Insolvency | 4,976 | 3,959 | 2,450 | 8,510 | 11,625 | ||||||||||
| Total Portfolio Purchasing | $ | 225,854 | $ | 344,556 | $ | 208,377 | $ | 185,024 | $ | 279,482 | |||||
| (1) Excludes the $27.9 million and $34.7 million investment in the securitized fund in Poland during the three months ended March 31, 2015 and December 31, 2014, respectively. | |||||||||||||||
BALANCE SHEET
Conference Call Information
PRA Group will hold a conference call today at 5:00 p.m. ET to discuss results with institutional investors and stock analysts. To listen to a webcast of the call, visit http://ir.pragroup.com/events.cfm. To listen by phone, call 888-695-7639 in the U.S. or 970-315-0482 outside the U.S. The conference ID is 50970357. A question-and-answer session on the call will be open only to analysts or investors. To listen to a replay of the call until March 3, 2016, call 855-859-2056 in the U.S. or 404-537-3406 outside the U.S. and use conference ID 50970357.
About PRA Group
As a global leader in acquiring and collecting nonperforming loans, PRA Group (Nasdaq:PRAA) returns capital to banks and other creditors to help expand financial services for consumers in the Americas and Europe. PRA Group companies collaborate with customers to help them resolve their debt and provide a broad range of additional revenue and recovery services to business and government clients.
PRA has been recognized as one of Fortune's 100 Fastest-Growing Companies for three years and one of Forbes' Best Small Companies in America for eight consecutive years since 2007. For more information, please visit www.pragroup.com.
About Forward Looking Statements
Statements made herein which are not historical in nature, including PRA Group’s or its management's intentions, hopes, beliefs, expectations, representations, projections, plans or predictions of the future, are forward-looking statements within the meaning of Section 27A of the Securities Act of 1933, as amended, and Section 21E of the Securities Exchange Act of 1934, as amended.
The forward-looking statements in this press release are based upon management's current beliefs, estimates, assumptions and expectations of PRA Group’s future operations and economic performance, taking into account currently available information. These statements are not statements of historical fact or guarantees of future performance, and there can be no assurance that anticipated events will transpire or that our expectations will prove to be correct. Forward-looking statements involve risks and uncertainties, some of which are not currently known to PRA Group. Actual events or results may differ materially from those expressed or implied in any such forward-looking statements as a result of various factors, including risk factors and other risks that are described from time to time in PRA Group’s filings with the Securities and Exchange Commission including but not limited to PRA Group’s annual reports on Form 10-K, its quarterly reports on Form 10-Q and its current reports on Form 8-K, filed with the Securities and Exchange Commission and available through PRA Group's website, which contain a detailed discussion of PRA Group's business, including risks and uncertainties that may affect future results.
Due to such uncertainties and risks, you are cautioned not to place undue reliance on such forward-looking statements, which speak only as of today. Information in this press release may be superseded by recent information or statements, which may be disclosed in later press releases, subsequent filings with the Securities and Exchange Commission or otherwise. Except as required by law, PRA assumes no obligation to publicly update or revise its forward-looking statements contained herein to reflect any change in PRA Group’s expectations with regard thereto or to reflect any change in events, conditions or circumstances on which any such forward-looking statements are based, in whole or in part.
| PRA Group, Inc. | ||||||||||||
| Unaudited Consolidated Income Statements | ||||||||||||
| (in thousands, except per share amounts) | ||||||||||||
| Three Months Ended | Twelve Months Ended | |||||||||||
| December 31, | December 31, | |||||||||||
| 2015 | 2014 | 2015 | 2014 | |||||||||
| Revenues: | ||||||||||||
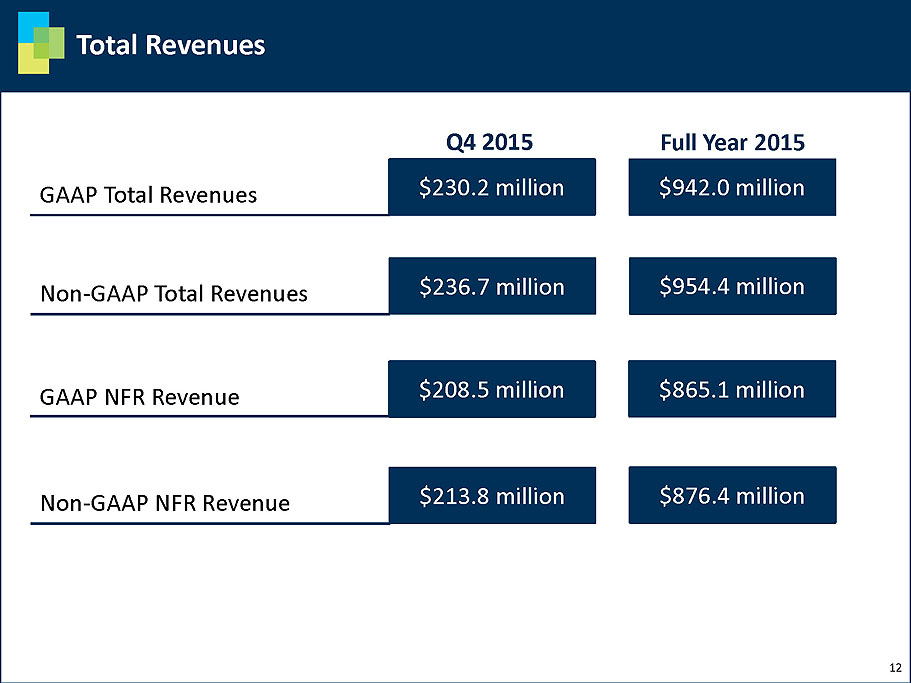
| Income recognized on finance receivables, net | $ | 208,471 | $ | 222,660 | $ | 865,122 | $ | 807,474 | ||||
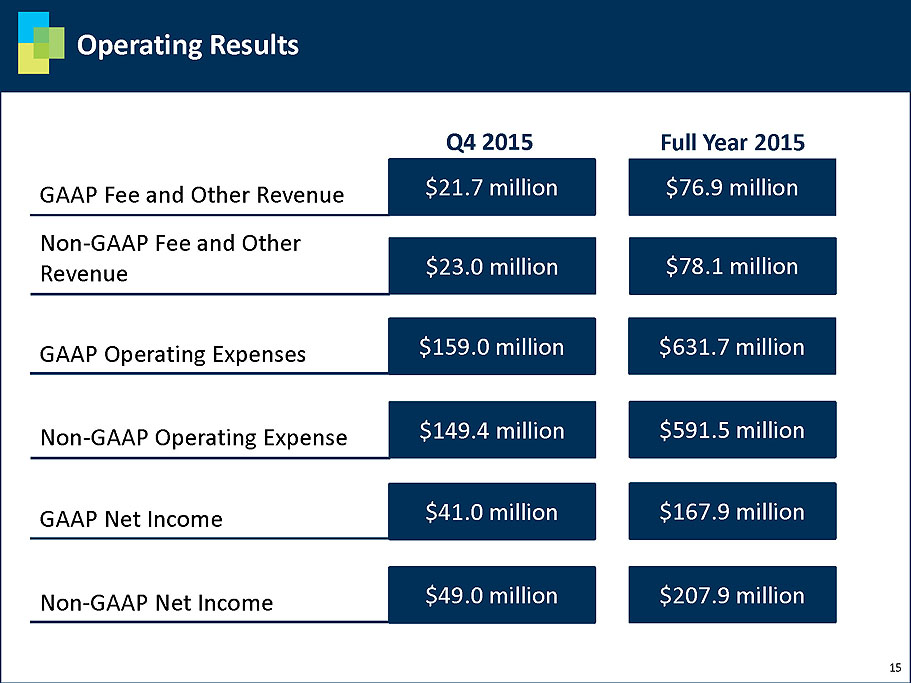
| Fee income | 19,649 | 22,800 | 64,383 | 65,675 | ||||||||
| Other revenue | 2,065 | 5,271 | 12,513 | 7,820 | ||||||||
| Total revenues | 230,185 | 250,731 | 942,018 | 880,969 | ||||||||
| Operating expenses: | ||||||||||||
| Compensation and employee services | 68,670 | 65,448 | 268,345 | 234,531 | ||||||||
| Legal collection fees | 11,873 | 15,125 | 53,393 | 51,107 | ||||||||
| Legal collection costs | 16,774 | 15,725 | 76,063 | 88,054 | ||||||||
| Agency fees | 8,182 | 7,497 | 32,188 | 16,399 | ||||||||
| Outside fees and services | 27,309 | 15,707 | 65,155 | 55,821 | ||||||||
| Communication | 6,601 | 7,715 | 33,113 | 33,085 | ||||||||
| Rent and occupancy | 3,991 | 3,477 | 14,714 | 11,509 | ||||||||
| Depreciation and amortization | 4,935 | 5,307 | 19,874 | 18,414 | ||||||||
| Other operating expenses | 10,678 | 4,870 | 68,829 | 29,981 | ||||||||
| Total operating expenses | 159,013 | 140,871 | 631,674 | 538,901 | ||||||||
| Income from operations | 71,172 | 109,860 | 310,344 | 342,068 | ||||||||
| Other income and (expense): | ||||||||||||
| Interest expense | (15,321 | ) | (13,493 | ) | (60,336 | ) | (35,226 | ) | ||||
| Foreign exchange gain/(loss) | 301 | (2,898 | ) | 7,514 | (5,829 | ) | ||||||
| Income before income taxes | 56,152 | 93,469 | 257,522 | 301,013 | ||||||||
| Provision for income taxes | 15,164 | 46,478 | 89,391 | 124,508 | ||||||||
| Net income | $ | 40,988 | $ | 46,991 | $ | 168,131 | $ | 176,505 | ||||
| Adjustment for net income attributable to noncontrolling interest | 18 | - | 205 | - | ||||||||
| Net income attributable to PRA Group, Inc. | $ | 40,970 | $ | 46,991 | $ | 167,926 | $ | 176,505 | ||||
| Net income per common share attributable to PRA Group, Inc.: | ||||||||||||
| Basic | $ | 0.87 | $ | 0.94 | $ | 3.49 | $ | 3.53 | ||||
| Diluted | $ | 0.86 | $ | 0.93 | $ | 3.47 | $ | 3.50 | ||||
| Weighted average number of shares outstanding: | ||||||||||||
| Basic | 47,197 | 49,892 | 48,128 | 49,990 | ||||||||
| Diluted | 47,539 | 50,444 | 48,405 | 50,421 | ||||||||
| PRA Group, Inc. | ||||||
| Unaudited Consolidated Balance Sheets | ||||||
| (in thousands) | ||||||
| December 31, | ||||||
| ASSETS | 2015 | 2014 | ||||
| Cash and cash equivalents | $ | 71,372 | $ | 39,661 | ||
| Investments | 73,799 | 89,703 | ||||
| Finance receivables, net | 2,202,113 | 2,001,790 | ||||
| Other receivables, net | 30,771 | 12,959 | ||||
| Income taxes receivable | 1,717 | - | ||||
| Net deferred tax asset | 13,068 | 6,126 | ||||
| Property and equipment, net | 45,394 | 48,258 | ||||
| Goodwill | 495,156 | 527,445 | ||||
| Intangible assets, net | 23,788 | 10,933 | ||||
| Other assets | 39,528 | 41,876 | ||||
| Total assets | $ | 2,996,706 | $ | 2,778,751 | ||
| LIABILITIES AND EQUITY | ||||||
| Liabilities: | ||||||
| Accounts payable | $ | 4,190 | $ | 4,446 | ||
| Accrued expenses | 95,380 | 89,361 | ||||
| Income taxes payable | 21,236 | 11,020 | ||||
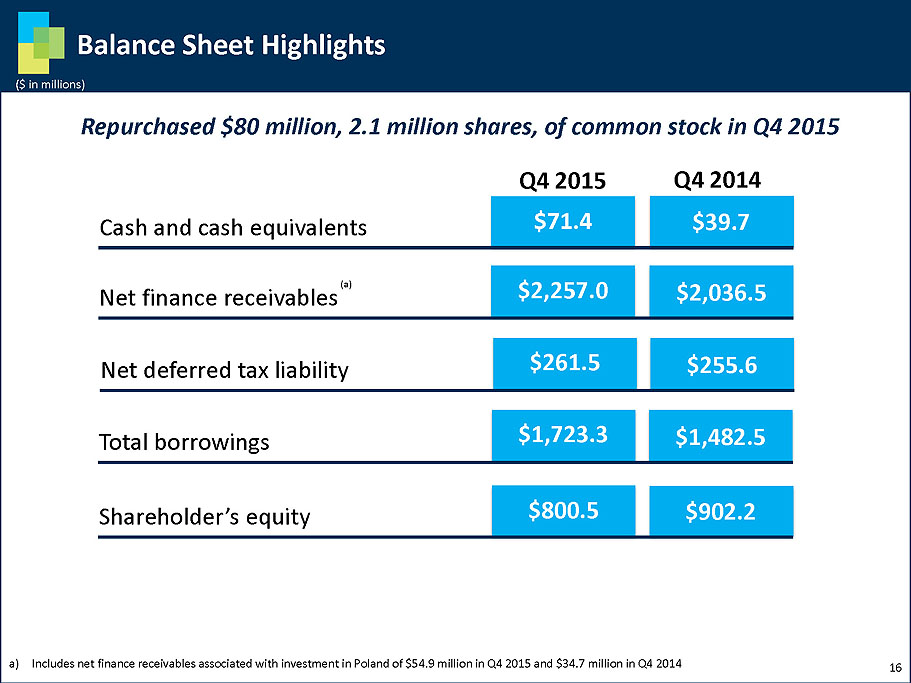
| Net deferred tax liability | 261,498 | 255,587 | ||||
| Interest-bearing deposits | 46,991 | 27,704 | ||||
| Borrowings | 1,723,268 | 1,482,456 | ||||
| Other liabilities | 4,396 | 5,962 | ||||
| Total liabilities | 2,156,959 | 1,876,536 | ||||
| Equity: | ||||||
| Preferred stock, par value $0.01, authorized shares, 2,000, issued and outstanding shares, 0 | - | - | ||||
| Common stock, par value $0.01, authorized shares, 100,000, issued and outstanding shares, 46,173 at December 31, 2015; 100,000 authorized shares, 49,577 issued and outstanding shares at December 31, 2014 | 462 | 496 | ||||
| Additional paid-in capital | 64,622 | 111,659 | ||||
| Retained earnings | 964,270 | 906,010 | ||||
| Accumulated other comprehensive loss | (228,861 | ) | (115,950 | ) | ||
| Total stockholders' equity - PRA Group, Inc. | 800,493 | 902,215 | ||||
| Noncontrolling interest | 39,254 | - | ||||
| Total equity | 839,747 | 902,215 | ||||
| Total liabilities and total equity | $ | 2,996,706 | $ | 2,778,751 | ||
| PRA Group, Inc. | ||||||||||||||||||
| FINANCIAL HIGHLIGHTS | ||||||||||||||||||
| As of and for the | As of and for the | |||||||||||||||||
| Three Months Ended December 31, | Twelve Months Ended December 31, | |||||||||||||||||
| 2015 | 2014 | Change | 2015 | 2014 | Change | |||||||||||||
| EARNINGS (in thousands) | ||||||||||||||||||
| Income recognized on finance receivables, net | $ | 208,471 | $ | 222,660 | -6 | % | $ | 865,122 | $ | 807,474 | 7 | % | ||||||
| Fee income | 19,649 | 22,800 | -14 | % | 64,383 | 65,675 | -2 | % | ||||||||||
| Other revenue | 2,065 | 5,271 | -61 | % | 12,513 | 7,820 | 60 | % | ||||||||||
| Total revenues | 230,185 | 250,731 | -8 | % | 942,018 | 880,969 | 7 | % | ||||||||||
| Operating expenses | 159,013 | 140,871 | 13 | % | 631,674 | 538,901 | 17 | % | ||||||||||
| Income from operations | 71,172 | 109,860 | -35 | % | 310,344 | 342,068 | -9 | % | ||||||||||
| Net interest expense | 15,321 | 13,493 | 14 | % | 60,336 | 35,226 | 71 | % | ||||||||||
| Net income | 40,988 | 46,991 | -13 | % | 168,131 | 176,505 | -5 | % | ||||||||||
| Net income attributable to PRA Group, Inc. | 40,970 | 46,991 | -13 | % | 167,926 | 176,505 | -5 | % | ||||||||||
| PERIOD-END BALANCES (in thousands) | ||||||||||||||||||
| Cash and cash equivalents | $ | 71,372 | $ | 39,661 | 80 | % | $ | 71,372 | $ | 39,661 | 80 | % | ||||||
| Finance receivables, net | 2,202,113 | 2,001,790 | 10 | % | 2,202,113 | 2,001,790 | 10 | % | ||||||||||
| Goodwill and intangible assets, net | 518,944 | 538,378 | -4 | % | 518,944 | 538,378 | -4 | % | ||||||||||
| Total assets | 2,996,706 | 2,778,751 | 8 | % | 2,996,706 | 2,778,751 | 8 | % | ||||||||||
| Borrowings | 1,723,268 | 1,482,456 | 16 | % | 1,723,268 | 1,482,456 | 16 | % | ||||||||||
| Total liabilities | 2,156,959 | 1,876,536 | 15 | % | 2,156,959 | 1,876,536 | 15 | % | ||||||||||
| Total equity - PRA Group, Inc. | 800,493 | 902,215 | -11 | % | 800,493 | 902,215 | -11 | % | ||||||||||
| FINANCE RECEIVABLE INCOME (dollars in thousands) | ||||||||||||||||||
| Cash collections | $ | 369,371 | $ | 373,428 | -1 | % | $ | 1,539,495 | $ | 1,378,812 | 12 | % | ||||||
| Cash collections on fully amortized pools | 8,280 | 17,785 | -53 | % | 52,202 | 68,349 | -24 | % | ||||||||||
| Principal amortization without allowance (reversals)/charges | 149,381 | 149,753 | 0 | % | 645,004 | 576,273 | 12 | % | ||||||||||
| Allowance (reversal)/charge | 11,519 | 1,015 | 1035 | % | 29,369 | (4,935 | ) | -695 | % | |||||||||
| Principal amortization with allowance (reversals)/charges | 160,900 | 150,768 | 7 | % | 674,373 | 571,338 | 18 | % | ||||||||||
| Principal amortization w/ allowance charges as % of cash collections: | ||||||||||||||||||
| Including fully amortized pools | 43.6 | % | 40.4 | % | 8 | % | 43.8 | % | 41.4 | % | 6 | % | ||||||
| Excluding fully amortized pools | 44.6 | % | 42.4 | % | 5 | % | 45.3 | % | 43.6 | % | 4 | % | ||||||
| Allowance (reversal)/charge to period-end net finance receivables | 0.5 | % | 0.1 | % | 932 | % | 1.3 | % | (0.2 | %) | -641 | % | ||||||
| PURCHASES OF FINANCE RECEIVABLES (dollars in thousands) | ||||||||||||||||||
| Purchase price - Americas core | $ | 120,554 | $ | 119,714 | 1 | % | $ | 448,281 | $ | 408,721 | 10 | % | ||||||
| Purchase price - Americas insolvency | 20,589 | 24,949 | -17 | % | 65,437 | 151,674 | -57 | % | ||||||||||
| Purchase price - Europe core | 79,735 | 123,194 | -35 | % | 430,198 | 860,744 | -50 | % | ||||||||||
| Purchase price - Europe insolvency | 4,976 | 11,625 | -57 | % | 19,895 | 11,625 | 71 | % | ||||||||||
| Purchase price - total | 225,854 | 279,482 | -19 | % | 963,811 | 1,432,764 | -33 | % | ||||||||||
| Number of portfolios - total | 139 | 142 | -2 | % | 542 | 456 | 19 | % | ||||||||||
| ESTIMATED REMAINING COLLECTIONS (in thousands) | ||||||||||||||||||
| Estimated remaining collections - Americas core | $ | 2,558,529 | $ | 2,229,403 | 15 | % | $ | 2,558,529 | $ | 2,229,403 | 15 | % | ||||||
| Estimated remaining collections - Americas insolvency | 448,652 | 642,552 | -30 | % | 448,652 | 642,552 | -30 | % | ||||||||||
| Estimated remaining collections - Europe core | 1,964,763 | 1,478,738 | 33 | % | 1,964,763 | 1,478,738 | 33 | % | ||||||||||
| Estimated remaining collections - Europe insolvency | 34,878 | 15,021 | 132 | % | 34,878 | 15,021 | 132 | % | ||||||||||
| Estimated remaining collections - total | 5,006,822 | 4,365,714 | 15 | % | 5,006,822 | 4,365,714 | 15 | % | ||||||||||
| Adjusted estimated remaining collections (7) | 5,114,923 | 4,437,264 | 15 | % | 5,114,923 | 4,437,264 | 15 | % | ||||||||||
| SHARE DATA (share amounts in thousands) | ||||||||||||||||||
| Net income per common share - diluted | $ | 0.86 | $ | 0.93 | -7 | % | $ | 3.47 | $ | 3.50 | -1 | % | ||||||
| Weighted average number of shares outstanding - diluted | 47,539 | 50,444 | -6 | % | 48,405 | 50,421 | -4 | % | ||||||||||
| Shares repurchased | 2,072 | 574 | 261 | % | 3,683 | 574 | 542 | % | ||||||||||
| Average price paid per share repurchased (including acquisitions costs) | $ | 38.60 | $ | 57.79 | -33 | % | $ | 44.94 | 57.79 | -22 | % | |||||||
| Closing market price | $ | 34.69 | $ | 57.93 | -40 | % | $ | 34.69 | $ | 57.93 | -40 | % | ||||||
| RATIOS AND OTHER DATA (dollars in thousands) | ||||||||||||||||||
| Return on average equity (1) | 19.8 | % | 20.2 | % | -2 | % | 19.9 | % | 18.9 | % | 5 | % | ||||||
| Return on revenue (2) | 17.8 | % | 18.7 | % | -5 | % | 17.8 | % | 20.0 | % | -11 | % | ||||||
| Return on average assets (3) | 5.5 | % | 6.9 | % | -20 | % | 5.9 | % | 8.0 | % | -26 | % | ||||||
| Operating margin (4) | 30.9 | % | 43.8 | % | -29 | % | 32.9 | % | 38.8 | % | -15 | % | ||||||
| Operating expense to cash receipts (5) | 40.9 | % | 35.6 | % | 15 | % | 39.4 | % | 37.3 | % | 6 | % | ||||||
| Debt to stockholders'equity (6) | 215.3 | % | 164.3 | % | 31 | % | 215.3 | % | 164.3 | % | 31 | % | ||||||
| Number of full-time equivalent collectors | 2,173 | 2,457 | -12 | % | 2,173 | 2,457 | -12 | % | ||||||||||
| Number of full-time equivalent employees | 3,799 | 3,880 | -2 | % | 3,799 | 3,880 | -2 | % | ||||||||||
| Cash receipts (5) | $ | 389,020 | $ | 396,228 | -2 | % | $ | 1,603,878 | $ | 1,444,487 | 11 | % | ||||||
| Line of credit - unused portion at period end | 446,769 | 352,926 | 27 | % | 446,769 | 352,926 | 27 | % | ||||||||||
| (1) Calculated as annualized net income divided by average equity for the period | ||||||||||||||||||
| (2) Calculated as net income divided by total revenues | ||||||||||||||||||
| (3) Calculated as annualized net income divided by average assets for the period | ||||||||||||||||||
| (4) Calculated as income from operations divided by total revenues | ||||||||||||||||||
| (5) "Cash receipts" is defined as cash collections plus fee income | ||||||||||||||||||
| (6) For purposes of this ratio, "debt" equals borrowings | ||||||||||||||||||
| (7) Equals total estimated remaining collections on our owned finance receivable portfolios plus the estimated remaining collections on certain of our other investments. | ||||||||||||||||||
| PRA Group, Inc. | |||||||||||||||
| FINANCIAL HIGHLIGHTS | |||||||||||||||
| For the Quarter Ended | |||||||||||||||
| December 31 | September 30 | June 30 | March 31 | December 31 | |||||||||||
| 2015 | 2015 | 2015 | 2015 | 2014 | |||||||||||
| EARNINGS (in thousands) | |||||||||||||||
| Income recognized on finance receivables, net | $ | 208,471 | $ | 208,184 | $ | 220,064 | $ | 228,403 | $ | 222,660 | |||||
| Fee income | 19,649 | 17,803 | 13,878 | 13,053 | 22,800 | ||||||||||
| Other revenue | 2,065 | 3,443 | 3,255 | 3,750 | 5,271 | ||||||||||
| Total revenues | 230,185 | 229,430 | 237,197 | 245,206 | 250,731 | ||||||||||
| Operating expenses | 159,013 | 175,303 | 148,318 | 149,040 | 140,871 | ||||||||||
| Income from operations | 71,172 | 54,127 | 88,879 | 96,166 | 109,860 | ||||||||||
| Net interest expense | 15,321 | 16,787 | 13,452 | 14,776 | 13,493 | ||||||||||
| Net income | 40,988 | 17,583 | 51,425 | 58,135 | 46,991 | ||||||||||
| Net income attributable to PRA Group, Inc. | 40,970 | 17,396 | 51,425 | 58,135 | 46,991 | ||||||||||
| PERIOD-END BALANCES (in thousands) | |||||||||||||||
| Cash and cash equivalents | $ | 71,372 | $ | 69,111 | $ | 56,811 | $ | 40,542 | $ | 39,661 | |||||
| Finance receivables, net | 2,202,113 | 2,167,178 | 2,012,552 | 1,954,772 | 2,001,790 | ||||||||||
| Goodwill and intangible assets, net | 518,944 | 526,841 | 512,451 | 506,695 | 538,378 | ||||||||||
| Total assets | 2,996,706 | 2,984,550 | 2,783,756 | 2,700,613 | 2,778,751 | ||||||||||
| Borrowings | 1,723,268 | 1,654,457 | 1,503,363 | 1,479,262 | 1,482,456 | ||||||||||
| Total liabilities | 2,156,959 | 2,083,131 | 1,885,880 | 1,883,295 | 1,876,536 | ||||||||||
| Total equity - PRA Group, Inc. | 800,493 | 863,517 | 897,876 | 817,318 | 902,215 | ||||||||||
| FINANCE RECEIVABLE COLLECTIONS (dollars in thousands) | |||||||||||||||
| Cash collections | $ | 369,371 | $ | 380,753 | $ | 389,624 | $ | 399,747 | $ | 373,428 | |||||
| Cash collections on fully amortized pools | 8,280 | 11,453 | 15,162 | 17,307 | 17,785 | ||||||||||
| Principal amortization without allowance (reversals)/charges | 149,381 | 161,234 | 164,675 | 169,714 | 149,753 | ||||||||||
| Allowance (reversal)/charge | 11,519 | 11,335 | 4,885 | 1,630 | 1,015 | ||||||||||
| Principal amortization with allowance (reversals)/charges | 160,900 | 172,569 | 169,560 | 171,344 | 150,768 | ||||||||||
| Principal amortization w/ allowance charges as % of cash collections: | |||||||||||||||
| Including fully amortized pools | 43.6 | % | 45.3 | % | 43.5 | % | 42.9 | % | 40.4 | % | |||||
| Excluding fully amortized pools | 44.6 | % | 46.7 | % | 45.3 | % | 44.8 | % | 42.4 | % | |||||
| Allowance (reversal)/charge to period-end net finance receivables | 0.5 | % | 0.5 | % | 0.2 | % | 0.1 | % | 0.1 | % | |||||
| PURCHASES OF FINANCE RECEIVABLES (dollars in thousands) | |||||||||||||||
| Purchase price - North America core | $ | 120,554 | $ | 90,912 | $ | 98,317 | $ | 138,498 | $ | 119,714 | |||||
| Purchase price - North America insolvency | 20,589 | 9,300 | 19,111 | 16,437 | 24,949 | ||||||||||
| Purchase price - Europe core | 79,735 | 240,385 | 88,499 | 21,579 | 123,194 | ||||||||||
| Purchase price - Europe insolvency | 4,976 | 3,959 | 2,450 | 8,510 | 11,625 | ||||||||||
| Purchase price - total | 225,854 | 344,556 | 208,377 | 185,024 | 279,482 | ||||||||||
| Number of portfolios - total | 139 | 128 | 136 | 139 | 142 | ||||||||||
| ESTIMATED REMAINING COLLECTIONS (in thousands) | |||||||||||||||
| Estimated remaining collections - Americas core | $ | 2,558,529 | $ | 2,421,506 | $ | 2,384,698 | $ | 2,370,086 | $ | 2,229,403 | |||||
| Estimated remaining collections - Americas insolvency | 448,652 | 474,097 | 529,892 | 577,319 | 642,552 | ||||||||||
| Estimated remaining collections - Europe core | 1,964,763 | 1,903,226 | 1,685,694 | 1,619,454 | 1,478,738 | ||||||||||
| Estimated remaining collections - Europe insolvency | 34,878 | 30,081 | 26,807 | 24,838 | 15,021 | ||||||||||
| Estimated remaining collections - total | 5,006,822 | 4,828,910 | 4,627,091 | 4,591,697 | 4,365,714 | ||||||||||
| Adjusted estimated remaining collections (7) | 5,114,923 | 4,945,609 | 4,747,552 | 4,716,230 | 4,437,264 | ||||||||||
| SHARE DATA (share amounts in thousands) | |||||||||||||||
| Net income per common share - diluted | $ | 0.86 | $ | 0.36 | $ | 1.06 | $ | 1.19 | $ | 0.93 | |||||
| Weighted average number of shares outstanding - diluted | 47,539 | 48,498 | 48,529 | 49,052 | 50,444 | ||||||||||
| Shares repurchased | 2,072 | 133 | - | 1,478 | 574 | ||||||||||
| Average price paid per share repurchased (including acquisitions costs) | $ | 38.60 | $ | 58.08 | $ | - | $ | 52.65 | $ | 57.79 | |||||
| Closing market price | $ | 34.69 | $ | 52.92 | $ | 62.31 | $ | 54.32 | $ | 57.93 | |||||
| RATIOS AND OTHER DATA (dollars in thousands) | |||||||||||||||
| Return on average equity (1) | 19.8 | % | 7.8 | % | 23.5 | % | 30.1 | % | 20.2 | % | |||||
| Return on revenue (2) | 17.8 | % | 7.7 | % | 21.7 | % | 23.7 | % | 18.7 | % | |||||
| Return on average assets (3) | 5.5 | % | 2.3 | % | 7.4 | % | 8.7 | % | 6.9 | % | |||||
| Operating margin (4) | 30.9 | % | 23.6 | % | 37.5 | % | 39.2 | % | 43.8 | % | |||||
| Operating expense to cash receipts (5) | 40.9 | % | 44.0 | % | 36.8 | % | 36.1 | % | 35.6 | % | |||||
| Debt to stockholders'equity (6) | 215.3 | % | 191.6 | % | 167.4 | % | 181.0 | % | 164.3 | % | |||||
| Number of collectors | 2,173 | 2,159 | 2,317 | 2,395 | 2,457 | ||||||||||
| Number of full-time equivalent employees | 3,799 | 3,715 | 3,820 | 3,847 | 3,880 | ||||||||||
| Cash receipts (5) | $ | 389,020 | $ | 398,556 | $ | 403,502 | $ | 412,800 | $ | 396,228 | |||||
| Line of credit - unused portion at period end | 446,769 | 393,246 | 547,017 | 323,812 | 352,926 | ||||||||||
| (1) Calculated as annualized net income divided by average equity for the period | |||||||||||||||
| (2) Calculated as net income divided by total revenues | |||||||||||||||
| (3) Calculated as annualized net income divided by average assets for the period | |||||||||||||||
| (4) Calculated as income from operations divided by total revenues | |||||||||||||||
| (5) "Cash receipts" is defined as cash collections plus fee income | |||||||||||||||
| (6) For purposes of this ratio, "debt" equals borrowings | |||||||||||||||
| (7) Equals total estimated remaining collections on our owned finance receivable portfolios plus the estimated remaining collections on certain of our other investments. | |||||||||||||||
Use of Non-GAAP Financial Measures
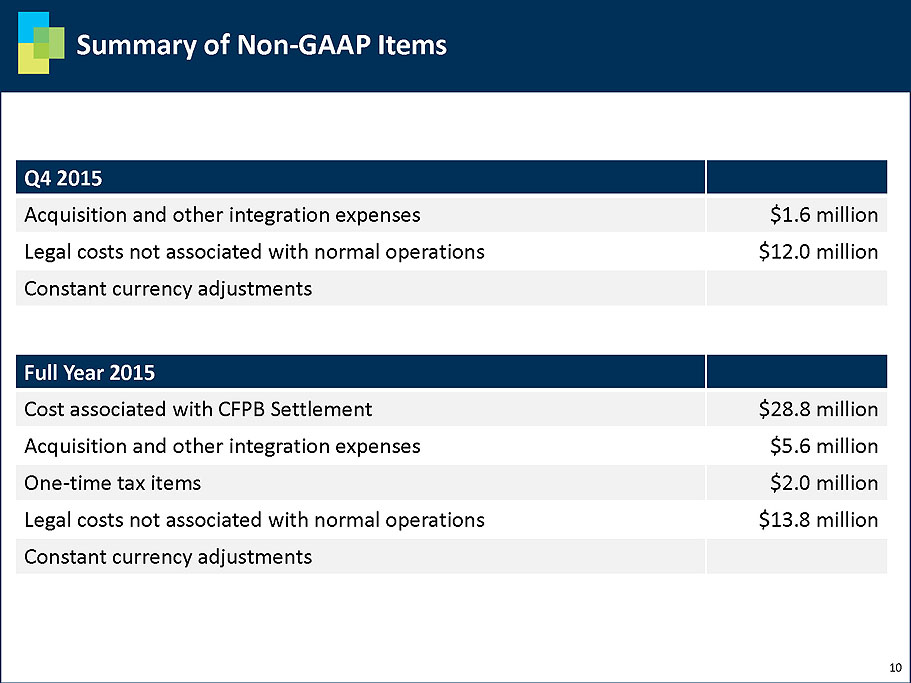
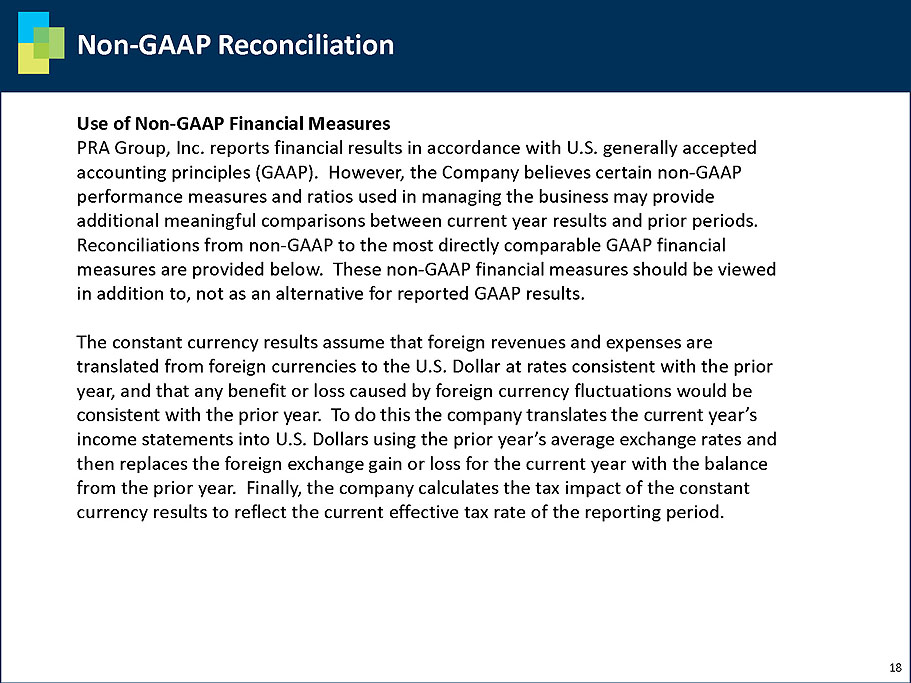
PRA Group, Inc. reports financial results in accordance with U.S. generally accepted accounting principles (GAAP). However, the Company believes certain non-GAAP performance measures and ratios which exclude penalty and fees associated with the CFPB consent order, expenses associated with acquisitions, one-time tax items, legal costs not associated with normal operations, and constant currency adjustments may provide additional meaningful comparisons between current year results and prior periods. Reconciliations from non-GAAP to the most directly comparable GAAP financial measures are provided below. These non-GAAP financial measures should be viewed in addition to, not as an alternative for reported GAAP results.
The constant currency results assume that foreign revenues and expenses are translated from foreign currencies to the U.S. Dollar at rates consistent with the prior year, and that any benefit or loss caused by foreign currency fluctuations would be consistent with the prior year. To do this the company translates the current year’s income statements into U.S. Dollars using the prior year’s average exchange rates and then replaces the foreign exchange gain or loss for the current year with the balance from the prior year. Finally, the company calculates the tax impact of the constant currency results to reflect the current effective tax rate of the reporting period.
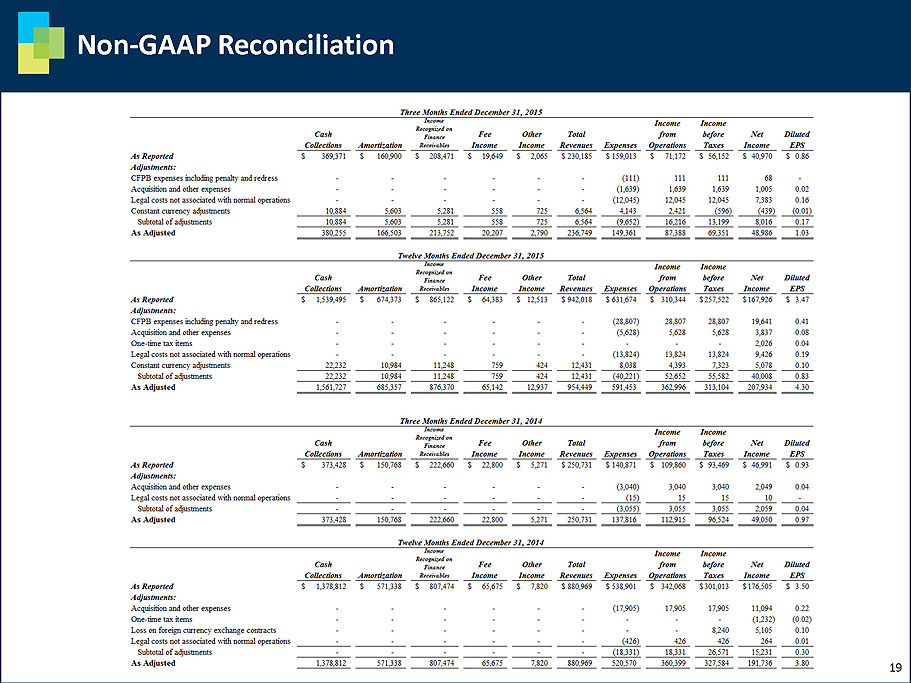
| Three Months Ended December 31, 2015 | |||||||||||||||||||||||||||||||||
| Cash Collections | Amortization | Income Recognized on Finance Receivables | Fee Income | Other Income | Total Revenues | Expenses | Income from Operations | Income before Taxes | Net Income | Diluted EPS | |||||||||||||||||||||||
| As Reported | $ | 369,371 | $ | 160,900 | $ | 208,471 | $ | 19,649 | $ | 2,065 | $ | 230,185 | $ | 159,013 | $ | 71,172 | $ | 56,152 | $ | 40,970 | $ | 0.86 | |||||||||||
| Adjustments: | |||||||||||||||||||||||||||||||||
| CFPB expenses including penalty and redress | - | - | - | - | - | - | (111 | ) | 111 | 111 | 68 | - | |||||||||||||||||||||
| Acquisition and other expenses | - | - | - | - | - | - | (1,639 | ) | 1,639 | 1,639 | 1,005 | 0.02 | |||||||||||||||||||||
| Legal costs not associated with normal operations | - | - | - | - | - | - | (12,045 | ) | 12,045 | 12,045 | 7,383 | 0.16 | |||||||||||||||||||||
| Constant currency adjustments | 10,884 | 5,603 | 5,281 | 558 | 725 | 6,564 | 4,143 | 2,421 | (596 | ) | (439 | ) | (0.01 | ) | |||||||||||||||||||
| Subtotal of adjustments | 10,884 | 5,603 | 5,281 | 558 | 725 | 6,564 | (9,652 | ) | 16,216 | 13,199 | 8,016 | 0.17 | |||||||||||||||||||||
| As Adjusted | 380,255 | 166,503 | 213,752 | 20,207 | 2,790 | 236,749 | 149,361 | 87,388 | 69,351 | 48,986 | 1.03 | ||||||||||||||||||||||
| Twelve Months Ended December 31, 2015 | |||||||||||||||||||||||||||||||||
| Cash Collections | Amortization | Income Recognized on Finance Receivables | Fee Income | Other Income | Total Revenues | Expenses | Income from Operations | Income before Taxes | Net Income | Diluted EPS | |||||||||||||||||||||||
| As Reported | $ | 1,539,495 | $ | 674,373 | $ | 865,122 | $ | 64,383 | $ | 12,513 | $ | 942,018 | $ | 631,674 | $ | 310,344 | $ | 257,522 | $ | 167,926 | $ | 3.47 | |||||||||||
| Adjustments: | |||||||||||||||||||||||||||||||||
| CFPB expenses including penalty and redress | - | - | - | - | - | - | (28,807 | ) | 28,807 | 28,807 | 19,641 | 0.41 | |||||||||||||||||||||
| Acquisition and other expenses | - | - | - | - | - | - | (5,628 | ) | 5,628 | 5,628 | 3,837 | 0.08 | |||||||||||||||||||||
| One-time tax items | - | - | - | - | - | - | - | - | - | 2,026 | 0.04 | ||||||||||||||||||||||
| Legal costs not associated with normal operations | - | - | - | - | - | - | (13,824 | ) | 13,824 | 13,824 | 9,426 | 0.19 | |||||||||||||||||||||
| Constant currency adjustments | 22,232 | 10,984 | 11,248 | 759 | 424 | 12,431 | 8,038 | 4,393 | 7,323 | 5,078 | 0.10 | ||||||||||||||||||||||
| Subtotal of adjustments | 22,232 | 10,984 | 11,248 | 759 | 424 | 12,431 | (40,221 | ) | 52,652 | 55,582 | 40,008 | 0.83 | |||||||||||||||||||||
| As Adjusted | 1,561,727 | 685,357 | 876,370 | 65,142 | 12,937 | 954,449 | 591,453 | 362,996 | 313,104 | 207,934 | 4.30 | ||||||||||||||||||||||
| Three Months Ended December 31, 2014 | |||||||||||||||||||||||||||||||||
| Cash Collections | Amortization | Income Recognized on Finance Receivables | Fee Income | Other Income | Total Revenues | Expenses | Income from Operations | Income before Taxes | Net Income | Diluted EPS | |||||||||||||||||||||||
| As Reported | $ | 373,428 | $ | 150,768 | $ | 222,660 | $ | 22,800 | $ | 5,271 | $ | 250,731 | $ | 140,871 | $ | 109,860 | $ | 93,469 | $ | 46,991 | $ | 0.93 | |||||||||||
| Adjustments: | |||||||||||||||||||||||||||||||||
| Acquisition and other expenses | - | - | - | - | - | - | (3,040 | ) | 3,040 | 3,040 | 2,049 | 0.04 | |||||||||||||||||||||
| Legal costs not associated with normal operations | - | - | - | - | - | - | (15 | ) | 15 | 15 | 10 | - | |||||||||||||||||||||
| Subtotal of adjustments | - | - | - | - | - | - | (3,055 | ) | 3,055 | 3,055 | 2,059 | 0.04 | |||||||||||||||||||||
| As Adjusted | 373,428 | 150,768 | 222,660 | 22,800 | 5,271 | 250,731 | 137,816 | 112,915 | 96,524 | 49,050 | 0.97 | ||||||||||||||||||||||
| Twelve Months Ended December 31, 2014 | |||||||||||||||||||||||||||||||||
| Cash Collections | Amortization | Income Recognized on Finance Receivables | Fee Income | Other Income | Total Revenues | Expenses | Income from Operations | Income before Taxes | Net Income | Diluted EPS | |||||||||||||||||||||||
| As Reported | $ | 1,378,812 | $ | 571,338 | $ | 807,474 | $ | 65,675 | $ | 7,820 | $ | 880,969 | $ | 538,901 | $ | 342,068 | $ | 301,013 | $ | 176,505 | $ | 3.50 | |||||||||||
| Adjustments: | |||||||||||||||||||||||||||||||||
| Acquisition and other expenses | - | - | - | - | - | - | (17,905 | ) | 17,905 | 17,905 | 11,094 | 0.22 | |||||||||||||||||||||
| One-time tax items | - | - | - | - | - | - | - | - | - | (1,232 | ) | (0.02 | ) | ||||||||||||||||||||
| Loss on foreign currency exchange contracts | - | - | - | - | - | - | - | - | 8,240 | 5,105 | 0.10 | ||||||||||||||||||||||
| Legal costs not associated with normal operations | - | - | - | - | - | - | (426 | ) | 426 | 426 | 264 | 0.01 | |||||||||||||||||||||
| Subtotal of adjustments | - | - | - | - | - | - | (18,331 | ) | 18,331 | 26,571 | 15,231 | 0.30 | |||||||||||||||||||||
| As Adjusted | 1,378,812 | 571,338 | 807,474 | 65,675 | 7,820 | 880,969 | 520,570 | 360,399 | 327,584 | 191,736 | 3.80 | ||||||||||||||||||||||
Investor Contact:
Darby Schoenfeld
Director of Investor Relations
(757) 431-7913
DCSchoenfeld@PRAGroup.com
News Media Contact:
Nancy Porter
Vice President, Corporate Communications
(757) 431-7950
NAPorter@PRAGroup.com
EXHIBIT 99.2
0
M9&5S8P 2 WME