Press release issued by the Company
Exhibit 99.1
Provident Financial Services, Inc. Announces Increased Quarterly Earnings and Increases Quarterly Cash Dividend
JERSEY CITY, NJ, April 28, 2011 - Provident Financial Services, Inc. (NYSE:PFS) (the “Company”) reported net income of $12.9 million, or $0.23 per basic and diluted share for the three
months ended March 31, 2011, compared to net income of $11.2 million, or $0.20 per basic and diluted share for the three months ended March 31, 2010.
The improvement in net income for the first quarter of 2011 compared to the prior year period was driven by a $2.7 million increase in net interest income primarily attributable to a lower cost of funds,
and a $1.1 million decline in the provision for loan losses. This was partially offset by an $803,000 decline in net gains on sales of securities and a $609,000 increase in income tax expense.
For the quarter ended March 31, 2011, the Company recorded a $524,000, or $0.01 per share, net of tax, impairment charge arising from the
anticipated sale of its loan center in the second half of 2011. Lending operations have been relocated to the Company’s newly leased administrative offices in Iselin, New Jersey. The carrying value of the existing premises and equipment for the
former loan center was adjusted to reflect its current estimated realizable value, net of selling expenses. The Company expects to realize operational efficiencies and reduced occupancy expense as a result of the relocation of its administrative
office which was effective April 18, 2011.
Christopher Martin, Chairman, President and Chief Executive Officer, commented, “We saw
improvement in our net interest income this quarter as a result of reduced borrowing and deposit costs. Our net interest margin expanded modestly during the quarter, and the near-term outlook for the margin is stable. While outstanding loan balances
increased during the quarter, lending opportunities continued to be constrained by the uncertain economic environment, as many small to medium sized businesses remain cautious about borrowing for working capital or business expansion. The New Jersey
economy continues to struggle and the foreclosure process is forestalling the acquisition and subsequent resolution of non-performing loans. Despite these challenges, we have continued to increase capital levels through improved core earnings. In
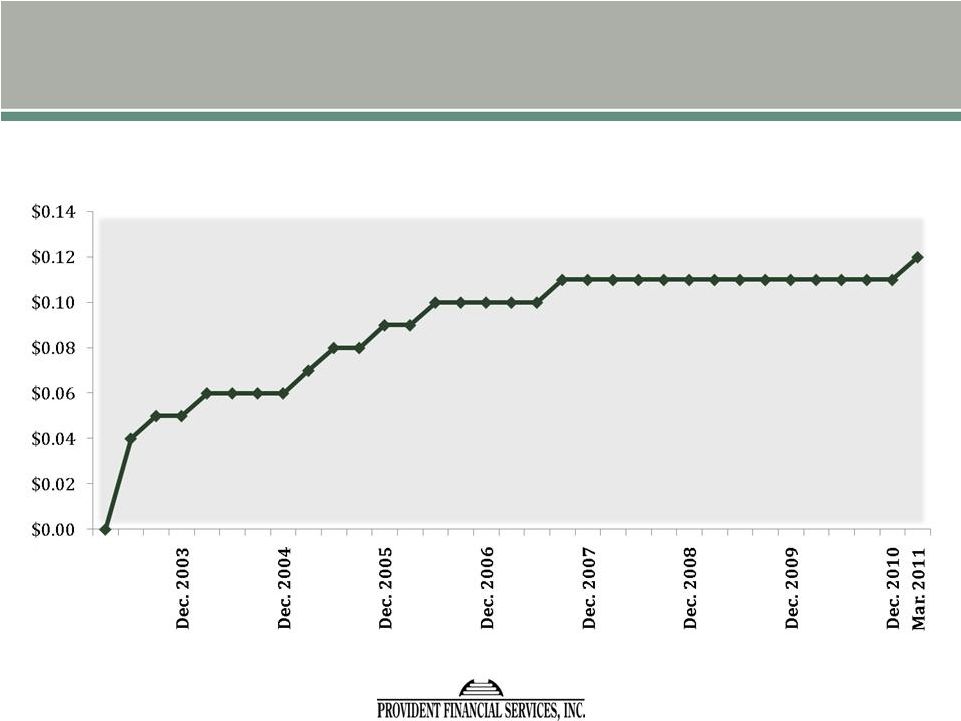
furtherance of our commitment to provide long-term stockholder value, we are pleased to increase our quarterly cash dividend by 9.1% to $0.12 per share.”
Increase in Quarterly Dividend
The Company’s Board of Directors declared a quarterly
cash dividend of $0.12 per common share, an increase of 9.1% from the prior quarter’s cash dividend of $0.11 per share. The dividend is payable on May 31, 2011, to stockholders of record as of the close of business on May 16, 2011.
Balance Sheet Summary
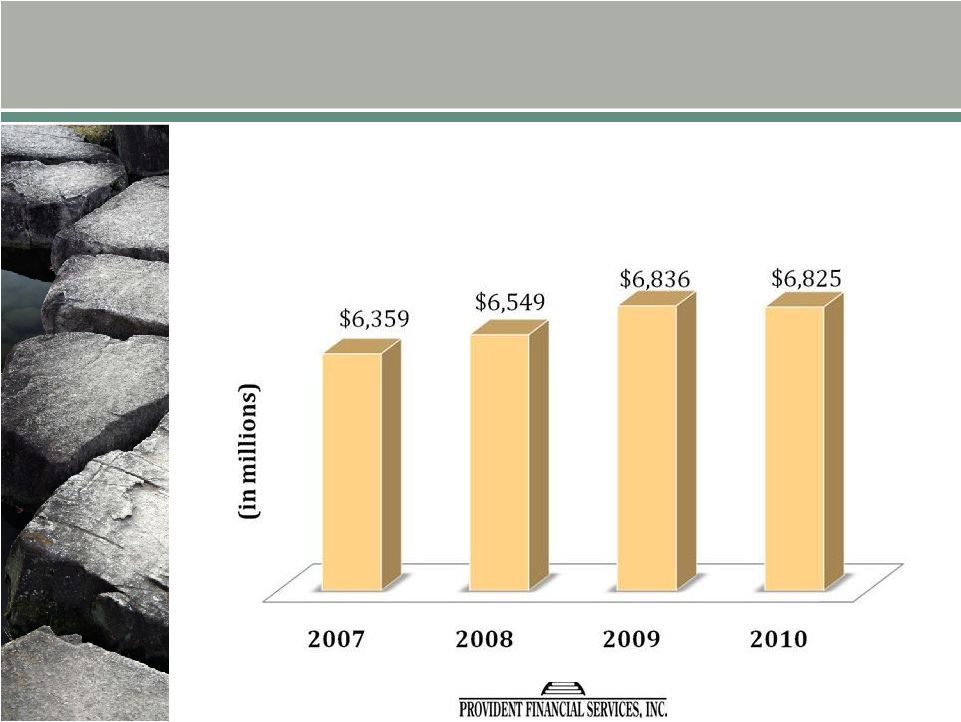
Total
assets decreased $30.5 million, or 0.4%, to $6.79 billion at March 31, 2011, from $6.82 billion at December 31, 2010. The decrease was primarily due to declines in securities available for sale, investment securities held to maturity and
other assets, partially offset by increases in cash and cash equivalents and net loans.
Cash and cash equivalents increased $52.7 million to
$105.0 million at March 31, 2011, from $52.2 million at December 31, 2010. These cash balances will be deployed to fund loan originations and investment purchases.
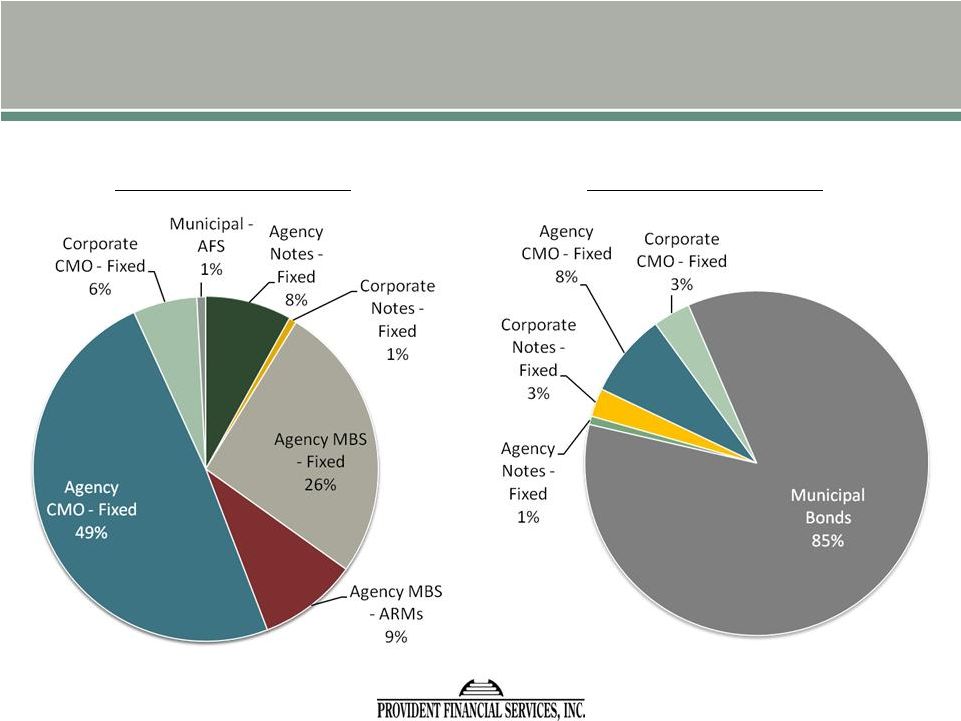
Total investments decreased $123.3 million, or 7.0%, during the three months ended March 31, 2011. The decrease was primarily due to principal repayments on mortgage-backed securities and maturities.
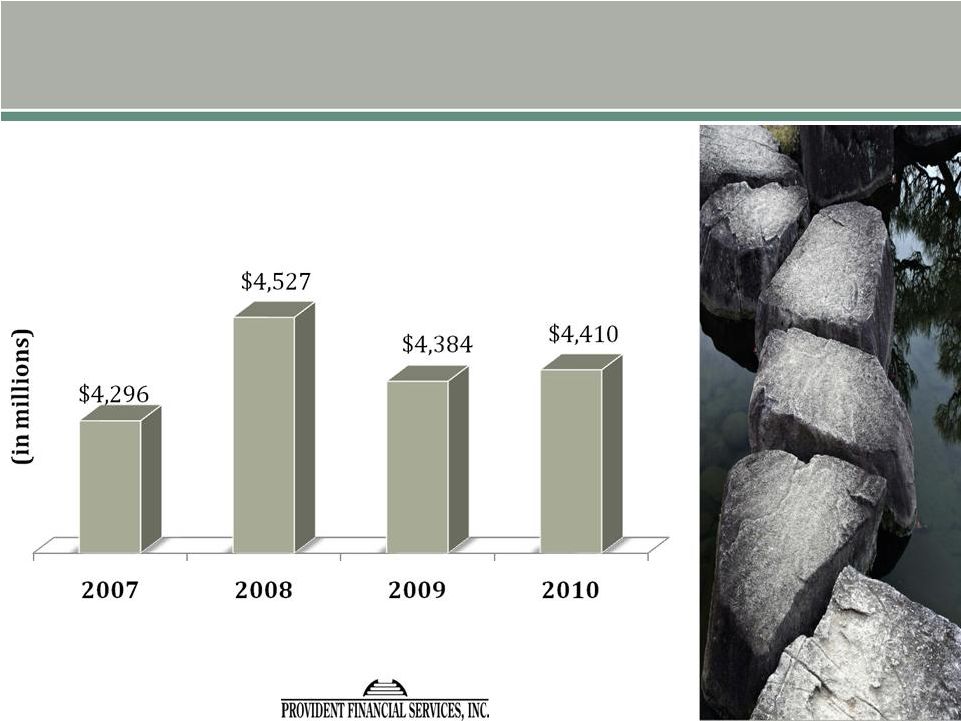
The Company’s net loans increased $43.3 million, or 1.0%, to $4.38 billion at March 31, 2011, from $4.34 billion at
December 31, 2010. Loan originations totaled $295.3 million and loan purchases totaled $48.8 million for the three months ended March 31, 2011. The loan portfolio had net increases of $49.5
1
million in commercial and multi-family mortgage loans, $23.5 million in residential mortgage loans and $4.1 million in commercial loans, which were partially offset by decreases of $19.6 million
in construction loans, and $9.7 million in consumer loans. Commercial real estate, commercial and construction loans represented 55.8% of the loan portfolio at March 31, 2011, compared to 55.6% at December 31, 2010.
At March 31, 2011, the Company’s unfunded loan commitments totaled $723.0 million, including $276.0 million in commercial loan commitments,
$86.5 million in construction loan commitments and $59.6 million in commercial mortgage commitments. Unfunded loan commitments at December 31, 2010 were $732.2 million.
Other assets decreased $2.6 million, or 3.4%, to $72.1 million at March 31, 2011, from $74.6 million at December 31, 2010, primarily due to the amortization of prepaid FDIC insurance and income
tax accruals.
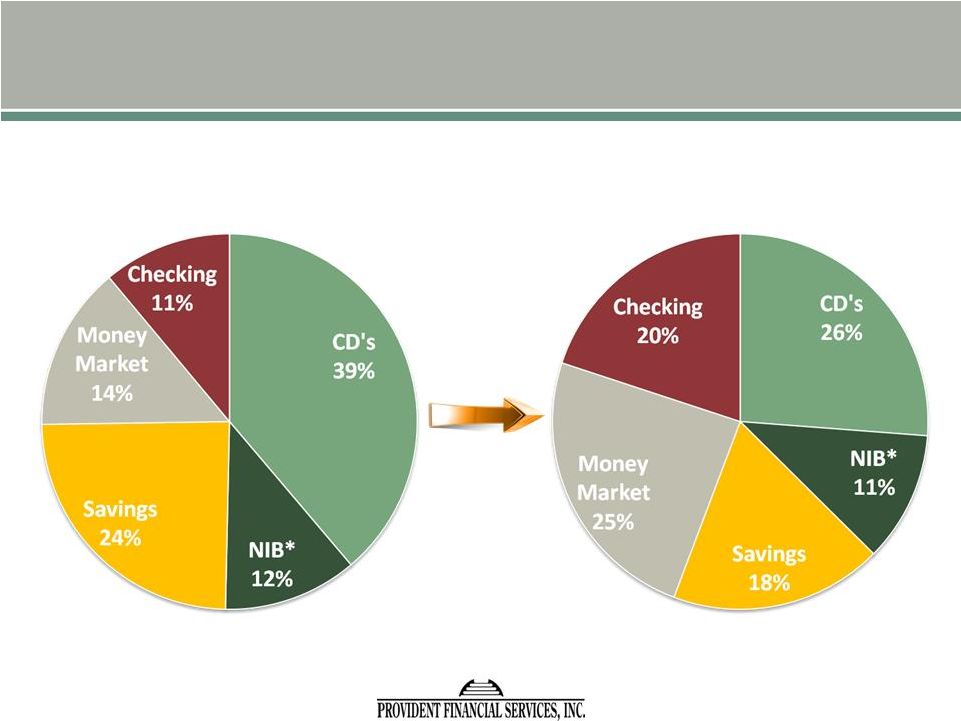
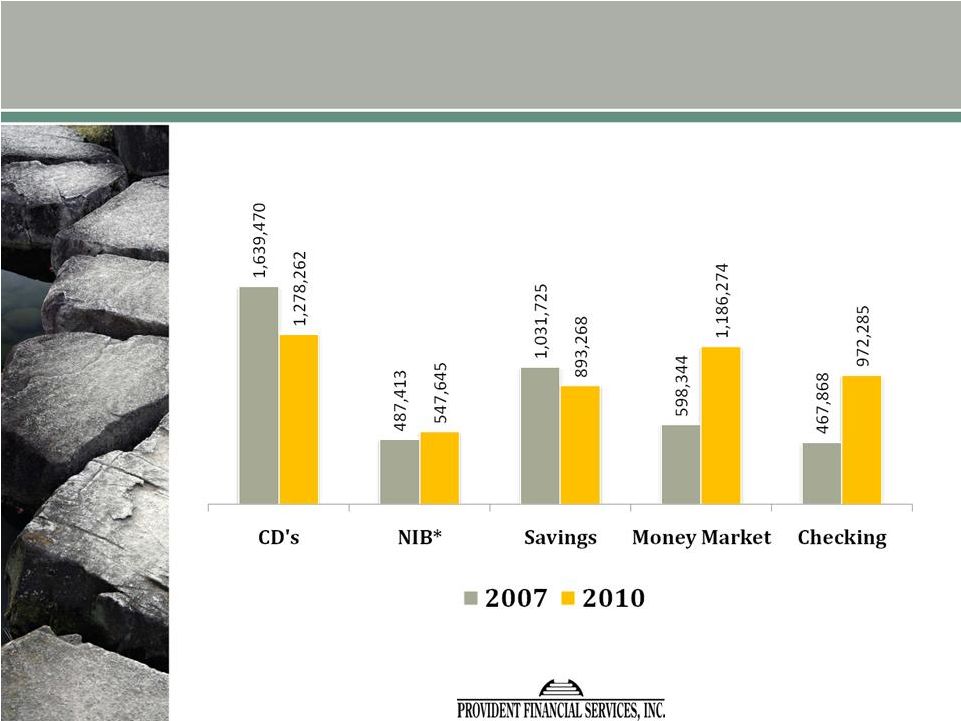
Total deposits increased $10.3 million, or 0.2%, during the three months ended March 31, 2011 to $4.89 billion. Core
deposits, consisting of savings and demand deposit accounts, increased $38.4 million, or 1.1%, to $3.64 billion at March 31, 2011. The majority of the core deposit increase was in commercial and retail checking deposits. Time deposits decreased
$28.1 million, or 2.2%, to $1.25 billion at March 31, 2011, with the majority of the decrease occurring in the 15-month and shorter maturity categories. The Company remains focused on cultivating core deposit relationships, while strategically
permitting the run-off of certain higher-cost, single-service time deposits. Core deposits represented 74.4% of total deposits at March 31, 2011, compared to 73.8% at December 31, 2010.
Borrowed funds were reduced by $46.4 million, or 4.8% during the three months ended March 31, 2011, to $923.3 million, as wholesale funding was
replaced with core deposit growth. Borrowed funds represented 13.6% of total assets at March 31, 2011, a reduction from 14.2% at December 31, 2010.
Common stock repurchases for the three months ended March 31, 2011, totaled 20,399 shares at an average cost of $14.71 per share. At March 31, 2011, 2.1 million shares remained eligible for
repurchase under the current authorization. At March 31, 2011, book value per share and tangible book value per share were $15.43 and $9.54, respectively, compared with $15.38 and $9.47, respectively, at December 31, 2010.
Results of Operations
Net Interest
Margin
The Company’s net interest margin increased 7 basis points to 3.51% for the quarter ended March 31, 2011, from 3.44% for
the quarter ended December 31, 2010. The increase in the net interest margin versus the trailing quarter was primarily attributable to reductions in the weighted average cost of interest-bearing liabilities. The weighted average yield on
interest-earning assets was 4.58% for the quarter ended March 31, 2011, compared with 4.56% for the quarter ended December 31, 2010. The weighted average cost of interest-bearing liabilities was 1.23% for the quarter ended March 31,
2011, compared with 1.29% for the trailing quarter. The average cost of deposits for the quarter ended March 31, 2011 was 0.92%, compared with 0.94% for the trailing quarter. The average cost of borrowed funds for the quarter ended
March 31, 2011 was 2.70%, compared with 2.92% for the quarter ended December 31, 2010.
The net interest margin for the quarter
ended March 31, 2011 increased 16 basis points to 3.51% compared with 3.35% for the quarter ended March 31, 2010. The increase in the net interest margin for the quarter ended March 31, 2011, compared with the same period last year,
was primarily attributable to reductions in the weighted average cost of interest-bearing liabilities. The weighted average cost of interest-bearing liabilities declined 41 basis points to 1.23% for the quarter ended March 31, 2011, compared
with 1.64% for the first quarter of 2010, while the weighted average yield on interest-earning assets declined 22 basis points to 4.58% for the quarter ended March 31, 2011, compared with 4.80% for the quarter ended March 31, 2010. The
average cost of deposits for the quarter ended March 31, 2011
2
was 0.92%, compared with 1.26% for the same period last year. The average cost of borrowed funds for the quarter ended March 31, 2011 was 2.70%, compared with 3.36% for the same period last
year.
Non-Interest Income
Non-interest income totaled $7.2 million for the quarter ended March 31, 2011, a decrease of $837,000, or 10.5%, compared to the same period in 2010.
Net gains on securities transactions decreased $803,000 to $14,000 for the three months ended March 31, 2011, from $817,000 for the same period in 2010. Fee income decreased $140,000 to $5.6 million for the three months ended March 31,
2011, from $5.7 million for the three months ended March 31, 2010, due primarily to decreases in transaction based banking fees. Partially offsetting these decreases, other non-interest income increased $96,000 for the three months ended
March 31, 2011, and income from the appreciation of the cash surrender value of Bank-owned life insurance increased $10,000 for the quarter ended March 31, 2011, compared with the same period in 2010.
Non-Interest Expense
For the three
months ended March 31, 2011, non-interest expense increased $589,000, or 1.7%, to $35.4 million, compared to $34.8 million for the three months ended March 31, 2010. Compensation and benefits increased $944,000 for the quarter ended
March 31, 2011, compared to the quarter ended March 31, 2010, due to higher salaries expense related to annual merit increases, increased stock-based compensation, and increased employee health and medical costs. In the quarter ended
March 31, 2011, the Company recognized an impairment charge of $807,000 related to the anticipated sale and relocation of its loan center. Also, net occupancy expense increased $134,000 for the three months ended March 31, 2011, compared
with the same period in 2010, primarily due to snow removal costs and expenses associated with the relocation of the Company’s administrative offices. Partially offsetting these increases in non-interest expense, other operating expenses
decreased $722,000, or 12.2%, to $5.2 million for the quarter ended March 31, 2011, from $5.9 million for the same period in 2010, due primarily to a $623,000 valuation adjustment related to foreclosed real estate incurred in the quarter ended
March 31, 2010. FDIC insurance expense decreased $219,000, to $1.9 million for the three months ended March 31, 2011, from $2.1 million for the same period in 2010, due to a lower assessment rate charged on deposits. Additionally, the
amortization of intangibles decreased $263,000 for the three months ended March 31, 2011, compared with the same period in 2010, due to scheduled reductions in the amortization of core deposit intangibles.
The Company’s annualized non-interest expense as a percentage of average assets was 2.11% for the quarter ended March 31, 2011, compared to
2.07% for the same period in 2010. The efficiency ratio (non-interest expense divided by the sum of net interest income and non-interest income) was 58.32% for the quarter ended March 31, 2011, compared with 59.14% for the same period in 2010.
Asset Quality
The
Company’s total non-performing loans at March 31, 2011 were $114.6 million, or 2.57% of total loans, compared with $97.3 million, or 2.21% of total loans at December 31, 2010, and $82.6 million, or 1.91% of total loans at
March 31, 2010. At March 31, 2011, impaired loans totaled $67.8 million with related specific reserves of $5.2 million, compared with impaired loans totaling $47.7 million with related specific reserves of $2.3 million at December 31,
2010. The increase in non-performing loans at March 31, 2011, compared with the trailing quarter, was largely due to an $11.3 million increase in non-performing commercial mortgage loans, a $3.7 million increase in non-performing commercial
loans, a $1.4 million increase in non-performing consumer loans and a $1.3 million increase in non-performing residential loans. The increase in non-performing commercial mortgages related to a single loan relationship, consisting of two loans. The
loans are current and secured by a first mortgage on an office building and restaurant with an estimated loan-to-value ratio of 85%, but were placed on non-accrual status because leasing projections on the office building have not been met. The
increase in non-performing commercial loans was primarily due to the addition of a single loan to a home textiles
3
importer and distributor. That loan is secured by a first mortgage on a warehouse building for which the Company has established a specific reserve based on the estimated fair value of the
collateral.
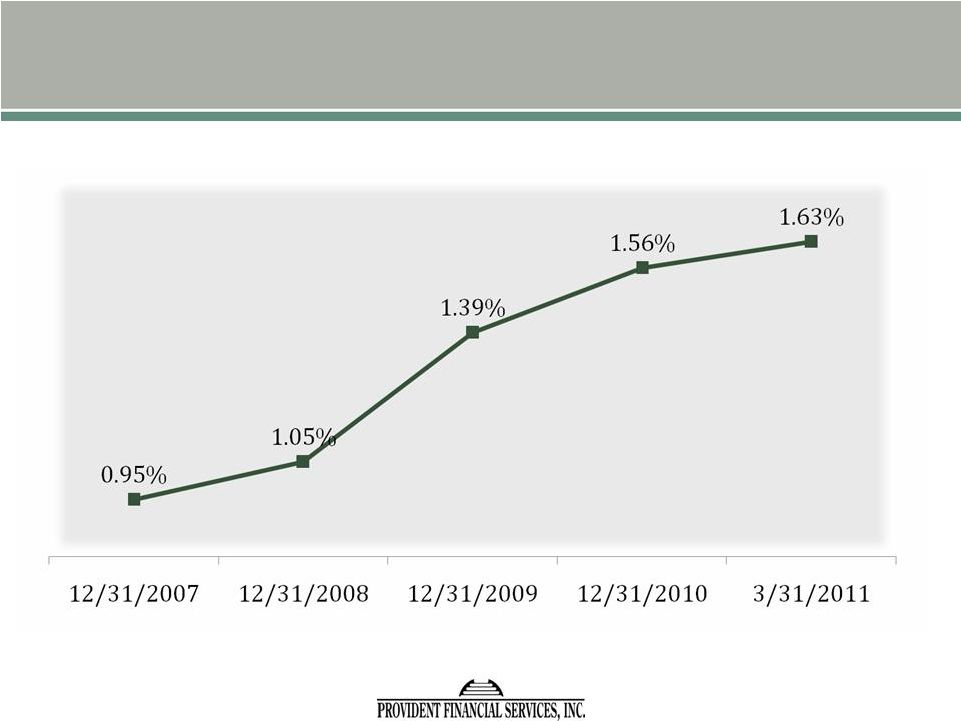
At March 31, 2011, the Company’s allowance for loan losses was 1.63% of total loans, compared with
1.56% of total loans at December 31, 2010, and 1.36% of total loans at March 31, 2010. The Company recorded a provision for loan losses of
$7.9 million for the quarter ended March 31, 2011, compared with a provision of $9.0 million for the quarter ended
March 31, 2010. For the three-month period ended March 31, 2011, the Company had net charge-offs of $3.9 million, compared with net charge-offs of $10.8 million for the same period in 2010.
The allowance for loan losses at March 31, 2011 was $72.7 million, an increase of $4.0 million from $68.7 million at December 31, 2010.
At March 31, 2011, the Company held $2.5 million of foreclosed assets, compared with $2.9 million at December 31, 2010.
Income Tax Expense
For the three months ended March 31, 2011, the Company’s income
tax expense was $4.4 million. This compared with $3.8 million for the same period in 2010. The increase in income tax expense was a function of growth in pre-tax income. The Company’s effective tax rate was unchanged at 25.5% for the three
months ended March 31, 2011 and 2010.
About the Company
Provident Financial Services, Inc. is the holding company for The Provident Bank, a community-oriented bank offering a full range of retail and commercial loan and deposit products. At March 31,
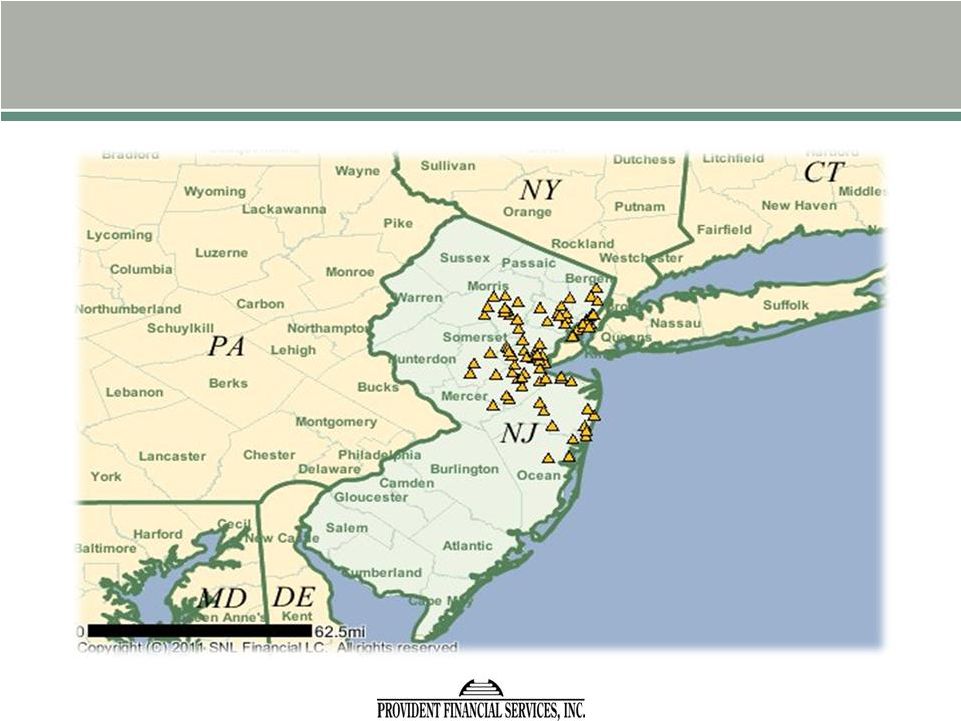
2011, the Bank operated 81 full service branches throughout northern and central New Jersey.
Post Earnings Conference Call
Representatives of the Company will hold a conference call for investors at 10:00 a.m. Eastern Time on April 29, 2011 regarding
highlights of the Company’s first quarter 2011 financial results. The call may be accessed by dialing 1-877-317-6789 (Domestic), 1-866-605-3852 (Canada) or 1-412-317-6789 (International). Internet access to the call is also available (listen
only) at www.providentnj.com by going to Investor Relations and clicking on Webcast.
Forward Looking Statements
Certain statements contained herein are “forward-looking statements” within the meaning of Section 27A of the Securities Act of 1933 and
Section 21E of the Securities Exchange Act of 1934. Such forward-looking statements may be identified by reference to a future period or periods, or by the use of forward-looking terminology, such as “may,” “will,”
“believe,” “expect,” “estimate,” “anticipate,” “continue,” or similar terms or variations on those terms, or the negative of those terms. Forward-looking statements are subject to numerous risks and
uncertainties, including, but not limited to, those related to the economic environment, particularly in the market areas in which the Company operates, competitive products and pricing, fiscal and monetary policies of the U.S. Government, changes
in government regulations affecting financial institutions, including regulatory fees and capital requirements, changes in prevailing interest rates, acquisitions and the integration of acquired businesses, credit risk management, asset-liability
management, the financial and securities markets and the availability of and costs associated with sources of liquidity.
The Company cautions
readers not to place undue reliance on any such forward-looking statements which speak only as of the date made. The Company advises readers that the factors listed above could affect the Company’s financial performance and could cause the
Company’s actual results for future periods to differ materially from any opinions or statements expressed with respect to future periods in any current
4
statements. The Company does not undertake and specifically declines any obligation to publicly release the result of any revisions which may be made to any forward-looking statements to reflect
events or circumstances after the date of such statements or to reflect the occurrence of anticipated or unanticipated events.
5
PROVIDENT FINANCIAL SERVICES, INC. AND SUBSIDIARY
Consolidated Statements of Condition
March 31, 2011 (Unaudited) and December 31, 2010
(Dollars in Thousands)
|
|
|
|
|
|
|
|
|
| |
|
March 31, 2011 |
|
|
December 31, 2010 |
|
| Assets |
|
|
|
|
|
|
|
|
| Cash and due from banks |
|
$ |
103,495 |
|
|
|
51,345 |
|
| Short-term investments |
|
|
1,477 |
|
|
|
884 |
|
|
|
|
|
|
|
|
|
|
| Total cash and cash equivalents |
|
|
104,972 |
|
|
|
52,229 |
|
|
|
|
|
|
|
|
|
|
| Securities available for sale, at fair value |
|
|
1,261,678 |
|
|
|
1,378,927 |
|
| Investment securities held to maturity (fair value of $349,465 at March 31, 2011 (unaudited) and $351,680 at December 31,
2010) |
|
|
341,675 |
|
|
|
346,022 |
|
| Federal Home Loan Bank stock |
|
|
36,627 |
|
|
|
38,283 |
|
| Loans |
|
|
4,457,128 |
|
|
|
4,409,813 |
|
| Less allowance for loan losses |
|
|
72,688 |
|
|
|
68,722 |
|
|
|
|
|
|
|
|
|
|
| Net loans |
|
|
4,384,440 |
|
|
|
4,341,091 |
|
|
|
|
|
|
|
|
|
|
| Foreclosed assets, net |
|
|
2,477 |
|
|
|
2,858 |
|
| Banking premises and equipment, net |
|
|
74,958 |
|
|
|
74,257 |
|
| Accrued interest receivable |
|
|
23,525 |
|
|
|
25,257 |
|
| Intangible assets |
|
|
353,403 |
|
|
|
354,220 |
|
| Bank-owned life insurance |
|
|
138,176 |
|
|
|
136,768 |
|
| Other assets |
|
|
72,061 |
|
|
|
74,616 |
|
|
|
|
|
|
|
|
|
|
| Total assets |
|
$ |
6,793,992 |
|
|
|
6,824,528 |
|
|
|
|
|
|
|
|
|
|
| Liabilities and Stockholders’ Equity |
|
|
|
|
|
|
|
|
| Deposits: |
|
|
|
|
|
|
|
|
| Demand deposits |
|
$ |
2,736,244 |
|
|
|
2,706,204 |
|
| Savings deposits |
|
|
901,634 |
|
|
|
893,268 |
|
| Certificates of deposit of $100,000 or more |
|
|
410,072 |
|
|
|
412,155 |
|
| Other time deposits |
|
|
840,049 |
|
|
|
866,107 |
|
|
|
|
|
|
|
|
|
|
| Total deposits |
|
|
4,887,999 |
|
|
|
4,877,734 |
|
| Mortgage escrow deposits |
|
|
21,463 |
|
|
|
19,558 |
|
| Borrowed funds |
|
|
923,289 |
|
|
|
969,683 |
|
| Other liabilities |
|
|
35,135 |
|
|
|
35,866 |
|
|
|
|
|
|
|
|
|
|
| Total liabilities |
|
|
5,867,886 |
|
|
|
5,902,841 |
|
|
|
|
|
|
|
|
|
|
| Stockholders’ Equity: |
|
|
|
|
|
|
|
|
| Preferred stock, $0.01 par value, 50,000,000 shares authorized, none issued |
|
|
— |
|
|
|
— |
|
| Common stock, $0.01 par value, 200,000,000 shares authorized, 83,209,293 shares issued and 60,034,436 outstanding at March 31,
2011, and 59,921,065 |
|
|
832 |
|
|
|
832 |
|
| outstanding at December 31, 2010 |
|
|
|
|
|
|
|
|
| Additional paid-in capital |
|
|
1,018,220 |
|
|
|
1,017,315 |
|
| Retained earnings |
|
|
338,754 |
|
|
|
332,472 |
|
| Accumulated other comprehensive income |
|
|
11,587 |
|
|
|
14,754 |
|
| Treasury stock |
|
|
(385,391 |
) |
|
|
(385,094 |
) |
| Unallocated common stock held by the Employee Stock Ownership Plan |
|
|
(57,896 |
) |
|
|
(58,592 |
) |
| Common Stock acquired by the Directors’ Deferred Fee Plan |
|
|
(7,459 |
) |
|
|
(7,482 |
) |
| Deferred Compensation - Directors’ Deferred Fee Plan |
|
|
7,459 |
|
|
|
7,482 |
|
|
|
|
|
|
|
|
|
|
| Total stockholders’ equity |
|
|
926,106 |
|
|
|
921,687 |
|
|
|
|
|
|
|
|
|
|
| Total liabilities and stockholders’ equity |
|
$ |
6,793,992 |
|
|
|
6,824,528 |
|
|
|
|
|
|
|
|
|
|
6
PROVIDENT FINANCIAL SERVICES, INC. AND SUBSIDIARY
Consolidated Statements of Income
Three Months Ended March 31, 2011 and 2010 (Unaudited)
(Dollars in Thousands,
except per share data)
|
|
|
|
|
|
|
|
|
| |
|
Three Months Ended |
|
| |
|
March 31, |
|
| |
|
2011 |
|
|
2010 |
|
| Interest income: |
|
|
|
|
|
|
|
|
| Real estate secured loans |
|
$ |
40,290 |
|
|
$ |
39,714 |
|
| Commercial loans |
|
|
10,082 |
|
|
|
10,337 |
|
| Consumer loans |
|
|
6,519 |
|
|
|
7,276 |
|
| Securities available for sale and Federal Home Loan Bank stock |
|
|
9,494 |
|
|
|
11,761 |
|
| Investment securities |
|
|
3,093 |
|
|
|
3,249 |
|
| Deposits, Federal funds sold and other short-term investments |
|
|
9 |
|
|
|
70 |
|
|
|
|
|
|
|
|
|
|
| Total interest income |
|
|
69,487 |
|
|
|
72,407 |
|
|
|
|
|
|
|
|
|
|
| Interest expense: |
|
|
|
|
|
|
|
|
| Deposits |
|
|
9,830 |
|
|
|
13,506 |
|
| Borrowed funds |
|
|
6,210 |
|
|
|
8,133 |
|
|
|
|
|
|
|
|
|
|
| Total interest expense |
|
|
16,040 |
|
|
|
21,639 |
|
|
|
|
|
|
|
|
|
|
| Net interest income |
|
|
53,447 |
|
|
|
50,768 |
|
| Provision for loan losses |
|
|
7,900 |
|
|
|
9,000 |
|
|
|
|
|
|
|
|
|
|
| Net interest income after provision for loan losses |
|
|
45,547 |
|
|
|
41,768 |
|
|
|
|
|
|
|
|
|
|
| Non-interest income: |
|
|
|
|
|
|
|
|
| Fees |
|
|
5,562 |
|
|
|
5,702 |
|
| Bank owned life insurance |
|
|
1,408 |
|
|
|
1,398 |
|
| Net gain on securities transactions |
|
|
14 |
|
|
|
817 |
|
| Other income |
|
|
188 |
|
|
|
92 |
|
|
|
|
|
|
|
|
|
|
| Total non-interest income |
|
|
7,172 |
|
|
|
8,009 |
|
|
|
|
|
|
|
|
|
|
| Non-interest expense: |
|
|
|
|
|
|
|
|
| Compensation and employee benefits |
|
|
18,483 |
|
|
|
17,539 |
|
| Net occupancy expense |
|
|
5,274 |
|
|
|
5,140 |
|
| Data processing expense |
|
|
2,264 |
|
|
|
2,284 |
|
| FDIC Insurance |
|
|
1,880 |
|
|
|
2,099 |
|
| Amortization of intangibles |
|
|
840 |
|
|
|
1,103 |
|
| Impairment of premises and equipment |
|
|
807 |
|
|
|
— |
|
| Advertising and promotion expense |
|
|
598 |
|
|
|
670 |
|
| Other operating expenses |
|
|
5,205 |
|
|
|
5,927 |
|
|
|
|
|
|
|
|
|
|
| Total non-interest expenses |
|
|
35,351 |
|
|
|
34,762 |
|
|
|
|
|
|
|
|
|
|
| Income before income tax expense |
|
$ |
17,368 |
|
|
|
15,015 |
|
| Income tax expense |
|
|
4,437 |
|
|
|
3,828 |
|
|
|
|
|
|
|
|
|
|
| Net income |
|
$ |
12,931 |
|
|
$ |
11,187 |
|
|
|
|
|
|
|
|
|
|
| Basic earnings per share |
|
$ |
0.23 |
|
|
$ |
0.20 |
|
| Average basic shares outstanding |
|
|
56,771,307 |
|
|
|
56,457,544 |
|
| Diluted earnings per share |
|
$ |
0.23 |
|
|
$ |
0.20 |
|
| Average diluted shares outstanding |
|
|
56,771,307 |
|
|
|
56,457,544 |
|
7
PROVIDENT FINANCIAL SERVICES, INC. AND SUBSIDIARY
Consolidated Financial Highlights
(Dollars in Thousands, except share data)(unaudited)
|
|
|
|
|
|
|
|
|
| |
|
At or for the |
|
| |
|
Three Months Ended |
|
| |
|
March 31, |
|
| |
|
2011 |
|
|
2010 |
|
| STATEMENTS OF INCOME: |
|
|
|
|
|
|
|
|
| Net interest income |
|
$ |
53,447 |
|
|
$ |
50,768 |
|
| Provision for loan losses |
|
|
7,900 |
|
|
|
9,000 |
|
| Non-interest income |
|
|
7,172 |
|
|
|
8,009 |
|
| Non-interest expense |
|
|
35,351 |
|
|
|
34,762 |
|
| Income before income tax expense |
|
|
17,368 |
|
|
|
15,015 |
|
| Net income |
|
$ |
12,931 |
|
|
$ |
11,187 |
|
| Basic and diluted earnings per share |
|
$ |
0.23 |
|
|
$ |
0.20 |
|
| Interest rate spread |
|
|
3.35 |
% |
|
|
3.16 |
% |
| Net interest margin |
|
|
3.51 |
% |
|
|
3.35 |
% |
|
|
|
| PROFITABILITY: |
|
|
|
|
|
|
|
|
| Annualized return on average assets |
|
|
0.77 |
% |
|
|
0.67 |
% |
| Annualized return on average equity |
|
|
5.65 |
% |
|
|
5.08 |
% |
| Annualized non-interest expense to average assets |
|
|
2.11 |
% |
|
|
2.07 |
% |
| Efficiency ratio (1) |
|
|
58.32 |
% |
|
|
59.14 |
% |
|
|
|
| ASSET QUALITY: |
|
|
|
|
|
|
|
|
| Non-accrual loans |
|
$ |
114,553 |
|
|
$ |
82,555 |
|
| 90+ and still accruing |
|
|
— |
|
|
|
— |
|
| Non-performing loans |
|
|
114,553 |
|
|
|
82,555 |
|
| Foreclosed assets |
|
|
2,477 |
|
|
|
5,043 |
|
| Non-performing assets |
|
|
117,030 |
|
|
|
87,598 |
|
| Non-performing loans to total loans |
|
|
2.57 |
% |
|
|
1.91 |
% |
| Non-performing assets to total assets |
|
|
1.72 |
% |
|
|
1.29 |
% |
| Allowance for loan losses |
|
$ |
72,688 |
|
|
$ |
58,969 |
|
| Allowance for loan losses to total non-performing loans |
|
|
63.45 |
% |
|
|
71.43 |
% |
| Allowance for loan losses to total loans |
|
|
1.63 |
% |
|
|
1.36 |
% |
|
|
|
| AVERAGE BALANCE SHEET DATA: |
|
|
|
|
|
|
|
|
| Assets |
|
$ |
6,799,124 |
|
|
$ |
6,794,656 |
|
| Loans, net |
|
|
4,353,520 |
|
|
|
4,286,089 |
|
| Earning assets |
|
|
6,083,357 |
|
|
|
6,079,426 |
|
| Core deposits |
|
|
3,619,897 |
|
|
|
3,410,681 |
|
| Borrowings |
|
|
933,654 |
|
|
|
982,012 |
|
| Interest-bearing liabilities |
|
|
5,268,172 |
|
|
|
5,346,271 |
|
| Stockholders’ equity |
|
|
928,279 |
|
|
|
893,873 |
|
| Average yield on interest-earning assets |
|
|
4.58 |
% |
|
|
4.80 |
% |
| Average cost on interest-bearing liabilities |
|
|
1.23 |
% |
|
|
1.64 |
% |
8
Notes:
| (1) |
Efficiency Ratio Calculation |
|
|
|
|
|
|
|
|
|
| |
|
Three Months Ended |
|
| |
|
March 31, |
|
| |
|
2011 |
|
|
2010 |
|
| Net interest income |
|
$ |
53,447 |
|
|
$ |
50,768 |
|
| Non-interest income |
|
|
7,172 |
|
|
|
8,009 |
|
|
|
|
|
|
|
|
|
|
| Total income |
|
$ |
60,619 |
|
|
$ |
58,777 |
|
|
|
|
|
|
|
|
|
|
| Non-interest expense |
|
$ |
35,351 |
|
|
$ |
34,762 |
|
|
|
|
|
|
|
|
|
|
| Expense/income |
|
$ |
58.32 |
% |
|
$ |
59.14 |
% |
|
|
|
|
|
|
|
|
|
9
PROVIDENT FINANCIAL SERVICES, INC. AND SUBSIDIARY
Net Interest Margin Analysis
Quarterly Average Balances
(Unaudited) (Dollars in Thousands)
|
|
|
|
|
|
|
|
|
|
|
|
|
|
|
|
|
|
|
|
|
|
|
|
|
| |
|
March 31, 2011 |
|
|
December 31, 2010 |
|
| |
|
Average |
|
|
|
|
|
Average |
|
|
Average |
|
|
|
|
|
Average |
|
| |
|
Balance |
|
|
Interest |
|
|
Yield |
|
|
Balance |
|
|
Interest |
|
|
Yield |
|
| Interest-Earning Assets: |
|
|
|
|
|
|
|
|
|
|
|
|
|
|
|
|
|
|
|
|
|
|
|
|
| Deposits |
|
$ |
14,633 |
|
|
$ |
9 |
|
|
|
0.25 |
% |
|
$ |
41,255 |
|
|
$ |
25 |
|
|
|
0.25 |
% |
| Federal funds sold and other short-term investments |
|
|
1,341 |
|
|
|
— |
|
|
|
0.01 |
% |
|
|
669 |
|
|
|
— |
|
|
|
0.01 |
% |
| Investment securities (1) |
|
|
342,689 |
|
|
|
3,093 |
|
|
|
3.61 |
% |
|
|
340,165 |
|
|
|
3,145 |
|
|
|
3.70 |
% |
| Securities available for sale |
|
|
1,334,201 |
|
|
|
8,970 |
|
|
|
2.69 |
% |
|
|
1,390,754 |
|
|
|
8,917 |
|
|
|
2.56 |
% |
| Federal Home Loan Bank stock |
|
|
36,973 |
|
|
|
524 |
|
|
|
5.75 |
% |
|
|
35,854 |
|
|
|
577 |
|
|
|
6.38 |
% |
| Net loans (2) |
|
|
. |
|
|
|
|
|
|
|
|
|
|
|
|
|
|
|
|
|
|
|
|
|
| Total mortgage loans |
|
|
3,076,548 |
|
|
|
40,290 |
|
|
|
5.24 |
% |
|
|
3,001,810 |
|
|
|
40,100 |
|
|
|
5.29 |
% |
| Total commercial loans |
|
|
716,603 |
|
|
|
10,082 |
|
|
|
5.66 |
% |
|
|
729,672 |
|
|
|
10,463 |
|
|
|
5.65 |
% |
| Total consumer loans |
|
|
560,369 |
|
|
|
6,519 |
|
|
|
4.72 |
% |
|
|
567,244 |
|
|
|
6,992 |
|
|
|
4.89 |
% |
|
|
|
|
|
|
|
|
|
|
|
|
|
|
|
|
|
|
|
|
|
|
|
|
|
| Total net loans |
|
|
4,353,520 |
|
|
|
56,891 |
|
|
|
5.24 |
% |
|
|
4,298,726 |
|
|
|
57,555 |
|
|
|
5.30 |
% |
|
|
|
|
|
|
|
|
|
|
|
|
|
|
|
|
|
|
|
|
|
|
|
|
|
| Total Interest-Earning Assets |
|
$ |
6,083,357 |
|
|
$ |
69,487 |
|
|
|
4.58 |
% |
|
$ |
6,107,423 |
|
|
$ |
70,218 |
|
|
|
4.56 |
% |
|
|
|
|
|
|
|
|
|
|
|
|
|
|
|
|
|
|
|
|
|
|
|
|
|
|
|
|
|
|
|
|
| Non-Interest Earning Assets: |
|
|
|
|
|
|
|
|
|
|
|
|
|
|
|
|
|
|
|
|
|
|
|
|
| Cash and due from banks |
|
|
65,351 |
|
|
|
|
|
|
|
|
|
|
|
80,409 |
|
|
|
|
|
|
|
|
|
| Other assets |
|
|
650,416 |
|
|
|
|
|
|
|
|
|
|
|
638,105 |
|
|
|
|
|
|
|
|
|
|
|
|
|
|
|
|
|
|
|
|
|
|
|
|
|
|
|
|
|
|
|
|
|
|
| Total Assets |
|
$ |
6,799,124 |
|
|
|
|
|
|
|
|
|
|
$ |
6,825,936 |
|
|
|
|
|
|
|
|
|
|
|
|
|
|
|
|
|
|
|
|
|
|
|
|
|
|
|
|
|
|
|
|
|
|
|
|
|
|
|
|
|
| Interest-Bearing Liabilities: |
|
|
|
|
|
|
|
|
|
|
|
|
|
|
|
|
|
|
|
|
|
|
|
|
| Demand deposits |
|
$ |
2,168,211 |
|
|
$ |
3,998 |
|
|
|
0.75 |
% |
|
$ |
2,192,237 |
|
|
$ |
4,197 |
|
|
|
0.76 |
% |
| Savings deposits |
|
|
896,138 |
|
|
|
866 |
|
|
|
0.39 |
% |
|
|
891,082 |
|
|
|
888 |
|
|
|
0.40 |
% |
| Time deposits |
|
|
1,270,169 |
|
|
|
4,966 |
|
|
|
1.59 |
% |
|
|
1,291,265 |
|
|
|
5,279 |
|
|
|
1.62 |
% |
|
|
|
|
|
|
|
|
|
|
|
|
|
|
|
|
|
|
|
|
|
|
|
|
|
| Total deposits |
|
|
4,334,518 |
|
|
|
9,830 |
|
|
|
0.92 |
% |
|
|
4,374,584 |
|
|
|
10,364 |
|
|
|
0.94 |
% |
|
|
|
|
|
|
|
|
|
|
|
|
|
|
|
|
|
|
|
|
|
|
|
|
|
| Borrowed funds |
|
|
933,654 |
|
|
|
6,210 |
|
|
|
2.70 |
% |
|
|
927,209 |
|
|
|
6,834 |
|
|
|
2.92 |
% |
|
|
|
|
|
|
|
|
|
|
|
|
|
|
|
|
|
|
|
|
|
|
|
|
|
| Total Interest-Bearing Liabilities |
|
$ |
5,268,172 |
|
|
$ |
16,040 |
|
|
|
1.23 |
% |
|
$ |
5,301,793 |
|
|
$ |
17,198 |
|
|
|
1.29 |
% |
|
|
|
|
|
|
|
|
|
|
|
|
|
|
|
|
|
|
|
|
|
|
|
|
|
| Non-Interest Bearing Liabilities |
|
|
602,673 |
|
|
|
|
|
|
|
|
|
|
|
597,704 |
|
|
|
|
|
|
|
|
|
|
|
|
|
|
|
|
|
|
|
|
|
|
|
|
|
|
|
|
|
|
|
|
|
|
| Total Liabilities |
|
|
5,870,845 |
|
|
|
|
|
|
|
|
|
|
|
5,899,497 |
|
|
|
|
|
|
|
|
|
| Stockholders’ equity |
|
|
928,279 |
|
|
|
|
|
|
|
|
|
|
|
926,439 |
|
|
|
|
|
|
|
|
|
|
|
|
|
|
|
|
|
|
|
|
|
|
|
|
|
|
|
|
|
|
|
|
|
|
| Total Liabilities and Stockholders’ Equity |
|
|
6,799,124 |
|
|
|
|
|
|
|
|
|
|
$ |
6,825,936 |
|
|
|
|
|
|
|
|
|
|
|
|
|
|
|
|
|
|
|
|
|
|
|
|
|
|
|
|
|
|
|
|
|
|
| Net interest income |
|
|
|
|
|
$ |
53,447 |
|
|
|
|
|
|
|
|
|
|
$ |
53,020 |
|
|
|
|
|
|
|
|
|
|
|
|
|
|
|
|
|
|
|
|
|
|
|
|
|
|
|
|
|
|
| Net interest rate spread |
|
|
|
|
|
|
|
|
|
|
3.35 |
% |
|
|
|
|
|
|
|
|
|
|
3.27 |
% |
| Net interest-earning assets |
|
$ |
815,185 |
|
|
|
|
|
|
|
|
|
|
$ |
805,630 |
|
|
|
|
|
|
|
|
|
|
|
|
|
|
|
|
|
|
|
|
|
|
|
|
|
|
|
|
|
|
|
|
|
|
| Net interest margin (3) |
|
|
|
|
|
|
|
|
|
|
3.51 |
% |
|
|
|
|
|
|
|
|
|
|
3.44 |
% |
| Ratio of interest-earning assets to total interest-bearing liabilities |
|
|
1.15 |
|
|
|
x |
|
|
|
|
|
|
|
1.15 |
|
|
|
x |
|
|
|
|
|
| (1) |
Average outstanding balance amounts shown are amortized cost. |
| (2) |
Average outstanding balances are net of the allowance for loan losses, deferred loan fees and expenses, loan premiums and discounts and include non-accrual loans.
|
| (3) |
Annualized net interest income divided by average interest-earning assets. |
10
The following table summarizes the quarterly net interest margin for the previous five quarters.
|
|
|
|
|
|
|
|
|
|
|
|
|
|
|
|
|
|
|
|
|
| |
|
3/31/11 |
|
|
12/31/10 |
|
|
9/30/10 |
|
|
6/30/10 |
|
|
3/31/10 |
|
| |
|
1st Qtr. |
|
|
4th Qtr. |
|
|
3rd Qtr. |
|
|
2nd Qtr. |
|
|
1st Qtr. |
|
| Interest-Earning Assets: |
|
|
|
|
|
|
|
|
|
|
|
|
|
|
|
|
|
|
|
|
| Securities |
|
|
2.91 |
% |
|
|
2.80 |
% |
|
|
3.11 |
% |
|
|
3.34 |
% |
|
|
3.37 |
% |
| Net Loans |
|
|
5.24 |
% |
|
|
5.30 |
% |
|
|
5.42 |
% |
|
|
5.41 |
% |
|
|
5.40 |
% |
| Total Interest-Earning Assets |
|
|
4.58 |
% |
|
|
4.56 |
% |
|
|
4.74 |
% |
|
|
4.81 |
% |
|
|
4.80 |
% |
|
|
|
|
|
|
| Interest-Bearing Liabilities: |
|
|
|
|
|
|
|
|
|
|
|
|
|
|
|
|
|
|
|
|
| Total Deposits |
|
|
0.92 |
% |
|
|
0.94 |
% |
|
|
1.05 |
% |
|
|
1.13 |
% |
|
|
1.26 |
% |
| Total Borrowings |
|
|
2.70 |
% |
|
|
2.92 |
% |
|
|
3.15 |
% |
|
|
3.27 |
% |
|
|
3.36 |
% |
| Total Interest-Bearing Liabilities |
|
|
1.23 |
% |
|
|
1.29 |
% |
|
|
1.42 |
% |
|
|
1.51 |
% |
|
|
1.64 |
% |
|
|
|
|
|
|
| Interest Rate Spread |
|
|
3.35 |
% |
|
|
3.27 |
% |
|
|
3.32 |
% |
|
|
3.30 |
% |
|
|
3.16 |
% |
| Net Interest Margin |
|
|
3.51 |
% |
|
|
3.44 |
% |
|
|
3.50 |
% |
|
|
3.48 |
% |
|
|
3.35 |
% |
|
|
|
|
|
|
| Ratio of Interest-Earning Assets to Interest-Bearing Liabilities |
|
|
1.15 |
x |
|
|
1.15 |
x |
|
|
1.15 |
x |
|
|
1.14 |
x |
|
|
1.14 |
x |
11