TRADING SYMBOL: TSX:AGI NYSE:AGI
 | Alamos Gold Inc. | |||||||
Brookfield Place, 181 Bay Street, Suite 3910, P.O. Box #823 | ||||||||
Toronto, Ontario M5J 2T3 | ||||||||
Telephone: (416) 368-9932 or 1 (866) 788-8801 | ||||||||
All amounts are in United States dollars, unless otherwise stated.
Alamos Gold Reports Second Quarter 2022 Results
Toronto, Ontario (July 27, 2022) - Alamos Gold Inc. (TSX:AGI; NYSE:AGI) (“Alamos” or the “Company”) today reported its financial results for the quarter ended June 30, 2022.
“We achieved several key short- and long-term objectives in the second quarter. Production was in-line with guidance and costs well below quarterly guidance reflecting solid performances at our Canadian operations and a strong start from La Yaqui Grande which achieved initial production ahead of schedule. With La Yaqui Grande expected to drive stronger production in the second half of the year, we remain on track to achieve full year guidance,” said John A. McCluskey, President and Chief Executive Officer.
“La Yaqui Grande will be a key contributor to stronger operational and financial results over the shorter term, and as outlined in our Phase 3+ Expansion Study, Island Gold will be the driver of higher production, lower costs and significantly stronger free cash flow generation over the long term. The Phase 3+ expansion will transform Island Gold into one of the largest, lowest cost and most profitable gold mines in Canada. With increasing cash flow from our operations, we can fund this high-return growth internally while generating strong free cash flow over the next several years,” Mr. McCluskey added.
Second Quarter 2022
•Produced 103,900 ounces of gold, a 5% increase from the first quarter and in line with guidance
•Young-Davidson continued its strong operational performance, with mining rates exceeding 8,000 tonnes per day (“tpd”) for the fourth consecutive quarter, driving production of 46,400 ounces and record mine-site free cash flow1 of $30.8 million
•Island Gold produced 37,300 ounces, a 52% increase from the first quarter of 2022 leading to mine-site free cash flow1 of $20.2 million
•Announced the Phase 3+ Expansion of Island Gold to 2,400 tpd outlining a larger, more profitable, and valuable operation with production expected to more than double to an average of 287,000 ounces per year at industry low mine-site all-in sustaining costs of $576 per ounce starting in 2026
•Completed construction of La Yaqui Grande ahead of schedule in June, and produced 5,000 ounces at total cash costs of $451 per ounce. Mining and stacking rates continue to ramp up and are expected to drive stronger consolidated production from the Mulatos District at significantly lower costs in the second half of the year
•Sold 102,164 ounces of gold at an average realized price of $1,871 per ounce for revenues of $191.2 million
•Total cash costs1 of $895 per ounce, and AISC1 of $1,170 per ounce per ounce were significantly lower than the first quarter and consistent with annual guidance, reflecting higher grades mined at Island Gold, the strong start at La Yaqui Grande, and the weaker Canadian dollar
•Realized adjusted net earnings1 for the quarter of $29.3 million, or $0.07 per share1. Adjusted net earnings includes adjustments for a non-cash, after tax inventory net realizable value adjustment at Mulatos of $14.7 million and unrealized foreign exchange losses recorded within both deferred taxes and foreign exchange of $12.5 million, partially offset by other gains totaling $4.3 million
•Reported net earnings of $6.4 million, or $0.02 per share
1 | Alamos Gold Inc
TRADING SYMBOL: TSX:AGI NYSE:AGI
•Cash flow from operating activities was $75.7 million ($85.3 million, or $0.22 per share, before changes in working capital1)
•Free cash flow1 was $6.7 million in the quarter, driven by strong operating results at Young-Davidson and Island Gold. With the completion of construction at La Yaqui Grande, free cash flow is expected to increase in the second half of the year
•Shareholder returns totaled $18.0 million in the quarter. This included the quarterly dividend of $9.8 million, or $0.025 per share (annualized rate of $0.10), as well as the repurchase of 1.1 million shares at a cost of $8.2 million ($7.41 per share) under the Company's Normal Course Issuer Bid ("NCIB")
•Closed the sale of the Esperanza Gold Project to Zacatecas Silver for total consideration of up to $60 million, including up front consideration of $5 million cash, and $10 million of Zacatecas Silver shares
•Ended the quarter with cash and cash equivalents of $121.5 million, equity securities of $22.5 million, and no debt
•Announced a Company-wide target of a 30% reduction in absolute Greenhouse Gas ("GHG") emissions by 2030 which is expected to further improve the Company's industry low GHG emissions intensity
•Recipient of the Casco De Plata safety award by the Mining Chamber of Mexico (CAMIMEX) in recognition of outstanding health and safety performance and governance at Mulatos
.(1) Refer to the “Non-GAAP Measures and Additional GAAP Measures” disclosure at the end of this press release and associated MD&A for a description and calculation of these measures.
2 | Alamos Gold Inc
TRADING SYMBOL: TSX:AGI NYSE:AGI
Highlight Summary
| Three Months Ended June 30, | Six Months Ended June 30, | |||||||||||||
| 2022 | 2021 | 2022 | 2021 | |||||||||||
| Financial Results (in millions) | ||||||||||||||
| Operating revenues | $191.2 | $195.1 | $375.7 | $422.5 | ||||||||||
Cost of sales (1) | $151.9 | $126.9 | $287.4 | $266.2 | ||||||||||
| Earnings (loss) from operations | $25.7 | ($168.5) | $20.0 | ($92.2) | ||||||||||
| Earnings (loss) before income taxes | $30.2 | ($172.7) | $15.9 | ($97.6) | ||||||||||
| Net earnings (loss) | $6.4 | ($172.5) | ($2.1) | ($121.3) | ||||||||||
Adjusted net earnings (2) | $29.3 | $38.7 | $47.3 | $87.8 | ||||||||||
Earnings before interest, depreciation and amortization (2) | $92.0 | $94.4 | $154.9 | $214.0 | ||||||||||
Cash provided by operations before working capital and cash taxes(2) | $85.3 | $97.2 | $156.2 | $216.8 | ||||||||||
| Cash provided by operating activities | $75.7 | $86.7 | $122.2 | $186.0 | ||||||||||
Capital expenditures (sustaining) (2) | $20.1 | $26.7 | $42.7 | $50.3 | ||||||||||
Capital expenditures (growth) (2) (3) (5) | $43.3 | $53.8 | $101.9 | $114.1 | ||||||||||
Capital expenditures (capitalized exploration) (4) | $5.6 | $6.4 | $11.7 | $11.9 | ||||||||||
Free cash flow (2) | $6.7 | ($0.2) | ($34.1) | $9.7 | ||||||||||
| Operating Results | ||||||||||||||
| Gold production (ounces) | 103,900 | 114,200 | 202,800 | 240,000 | ||||||||||
| Gold sales (ounces) | 102,164 | 107,581 | 200,630 | 234,063 | ||||||||||
| Per Ounce Data | ||||||||||||||
| Average realized gold price | $1,871 | $1,814 | $1,873 | $1,805 | ||||||||||
| Average spot gold price (London PM Fix) | $1,871 | $1,816 | $1,874 | $1,805 | ||||||||||
Cost of sales per ounce of gold sold (includes amortization) (1) | $1,487 | $1,180 | $1,432 | $1,137 | ||||||||||
Total cash costs per ounce of gold sold (2) | $895 | $791 | $943 | $773 | ||||||||||
All-in sustaining costs per ounce of gold sold (2) | $1,170 | $1,136 | $1,264 | $1,079 | ||||||||||
| Share Data | ||||||||||||||
| Earnings (Loss) per share, basic and diluted | $0.02 | ($0.44) | ($0.01) | ($0.31) | ||||||||||
Adjusted earnings per share, basic and diluted(2) | $0.07 | $0.10 | $0.12 | $0.22 | ||||||||||
| Weighted average common shares outstanding (basic) (000’s) | 391,761 | 392,759 | 391,837 | 392,762 | ||||||||||
| Financial Position (in millions) | ||||||||||||||
Cash and cash equivalents(6) | $121.5 | $172.5 | ||||||||||||
(1)Cost of sales includes mining and processing costs, royalties, and amortization expense. For the three and six months ended June 30, 2022, cost of sales includes a $22.3 million non-cash inventory net realizable value adjustment at Mulatos District.
(2)Refer to the “Non-GAAP Measures and Additional GAAP Measures” disclosure at the end of this press release and associated MD&A for a description and calculation of these measures.
(3)Includes growth capital from operating sites.
(4)Includes capitalized exploration at Island Gold, Young-Davidson and Mulatos District.
(5)Includes capital advances of nil for the three and six months ended June 30, 2022 ($3.4 million and $20.2 million for the three and six months ended June 30, 2021).
(6)Comparative cash and cash equivalents balance as at December 31, 2021.
3 | Alamos Gold Inc
TRADING SYMBOL: TSX:AGI NYSE:AGI
| Three Months Ended June 30, | Six Months Ended June 30, | |||||||||||||
| 2022 | 2021 | 2022 | 2021 | |||||||||||
| Gold production (ounces) | ||||||||||||||
| Young-Davidson | 46,400 | 45,100 | 98,300 | 93,100 | ||||||||||
| Island Gold | 37,300 | 33,200 | 61,800 | 75,400 | ||||||||||
Mulatos District(7) | 20,200 | 35,900 | 42,700 | 71,500 | ||||||||||
| Gold sales (ounces) | ||||||||||||||
| Young-Davidson | 46,662 | 45,284 | 98,187 | 93,306 | ||||||||||
| Island Gold | 36,797 | 33,632 | 60,165 | 73,514 | ||||||||||
| Mulatos District | 18,705 | 28,665 | 42,278 | 67,243 | ||||||||||
Cost of sales (in millions)(1) | ||||||||||||||
| Young-Davidson | $59.8 | $61.3 | $124.4 | $123.3 | ||||||||||
| Island Gold | $32.0 | $25.6 | $56.2 | $54.7 | ||||||||||
| Mulatos District | $60.1 | $40.0 | $106.8 | $88.2 | ||||||||||
| Cost of sales per ounce of gold sold (includes amortization) | ||||||||||||||
| Young-Davidson | $1,282 | $1,354 | $1,267 | $1,321 | ||||||||||
| Island Gold | $870 | $761 | $934 | $744 | ||||||||||
Mulatos District(1) | $3,213 | $1,395 | $2,526 | $1,312 | ||||||||||
Total cash costs per ounce of gold sold (2) | ||||||||||||||
| Young-Davidson | $866 | $941 | $852 | $906 | ||||||||||
| Island Gold | $590 | $502 | $650 | $483 | ||||||||||
| Mulatos District | $1,566 | $893 | $1,568 | $906 | ||||||||||
Mine-site all-in sustaining costs per ounce of gold sold (2),(3) | ||||||||||||||
| Young-Davidson | $1,087 | $1,157 | $1,064 | $1,115 | ||||||||||
| Island Gold | $848 | $830 | $939 | $777 | ||||||||||
| Mulatos District | $1,636 | $1,144 | $1,717 | $1,084 | ||||||||||
Capital expenditures (sustaining, growth, capitalized exploration and capital advances) (in millions)(2) | ||||||||||||||
Young-Davidson (4) | $13.1 | $19.6 | $35.8 | $41.5 | ||||||||||
Island Gold (5) | $29.3 | $29.2 | $62.7 | $58.7 | ||||||||||
Mulatos District (6) | $21.3 | $31.6 | $47.3 | $65.1 | ||||||||||
| Other | $5.3 | $6.5 | $10.5 | $11.0 | ||||||||||
(1)Cost of sales includes mining and processing costs, royalties, and amortization. For the three and six months ended June 30, 2022, cost of sales at Mulatos District includes $22.3 million non-cash inventory net realizable value adjustment.
(2)Refer to the “Non-GAAP Measures and Additional GAAP Measures” disclosure at the end of this press release and associated MD&A for a description and calculation of these measures.
(3)For the purposes of calculating mine-site all-in sustaining costs, the Company does not include an allocation of corporate and administrative and share based compensation expenses.
(4)Includes capitalized exploration at Young-Davidson of $1.3 million and $2.3 million for the three and six months ended June 30, 2022 ($1.5 million and $2.5 million for the three and six months ended June 30, 2021).
(5)Includes capitalized exploration at Island Gold of $4.1 million and $9.2 million for the three and six months ended June 30, 2022 ($3.9 million and $8.4 million for the three and six months ended June 30, 2021).
(6)Includes capitalized exploration at Mulatos District of $0.2 million for the three and six months ended June 30, 2022 ($1.0 million for the three and six months ended June 30, 2021).
(7)The Mulatos District includes both the Mulatos pit, as well as La Yaqui Grande.
4 | Alamos Gold Inc
TRADING SYMBOL: TSX:AGI NYSE:AGI
Environment, Social and Governance Summary Performance
Health and Safety
•Recordable injury frequency rate1,2 of 1.50, an 8% decrease from the first quarter of 2022
•Lost time injury frequency rate1 of 0.08, an 11% decrease from the first quarter of 2022
•Competed in the Ontario Mine Rescue Competition, with Young-Davidson’s Gary Bennett winning the Individual Technician Competition
During the second quarter of 2022, the recordable injury frequency rate decreased with 18 recordable injuries, consistent with the first quarter of 2022 but with more hours worked. One lost time injury was reported in the quarter, consistent with the first quarter of 2022, though at a lower frequency rate due to additional hours worked. Alamos strives to maintain a safe, healthy working environment for all, with a strong safety culture where everyone is continually reminded of the importance of keeping themselves and their colleagues healthy and injury-free. The Company’s overarching commitment is to have all employees and contractors return Home Safe Every Day.
The World Health Organization declared COVID-19 a pandemic on March 11, 2020. The Company responded rapidly and proactively and implemented several initiatives to help protect the health and safety of our employees, their families and the communities in which we operate. Specifically, each mine site activated established crisis management plans and developed site-specific plans that have enabled them to meet and respond to changing conditions associated with COVID-19. Given the significant precautionary measures taken by the Company, and thanks to the dedication of its employees, contractors and stakeholders, operations remain relatively unaffected by COVID-19.
Environment
•Announced its Company target of a 30% reduction in absolute GHG emissions by 2030 from the 2020/2021 average baseline year
•Zero significant environmental incidents in the second quarter of 2022 and year-to-date
•One minor fine at Mulatos related to a regulatory non-compliance at the mine camp for using an unlicensed contractor for recycling of used cooking oil. This oversight was due to a recent regulation change in Mexico
•Work permits received for Island Gold for the construction of the shaft site access road and creek crossing
•Advanced both federal and provincial permitting for the Lynn Lake Project
19 minor spills occurred during the first quarter, including 16 at Island Gold and 3 at Mulatos. All spills were immediately cleaned and remediated with no anticipated long-term effects. The Company is committed to preserving the long-term health and viability of the natural environment that surround its operations and projects. This includes investing in new initiatives to reduce our environmental footprint with the goal of minimizing the environmental impacts of our activities and offsetting any impacts that cannot be fully mitigated or rehabilitated.
GHG Emissions Reduction Target
In June 2022, the Company released its target of a 30% reduction in absolute GHG emissions by 2030. This target includes scope 1 and scope 2 GHG emissions, inclusive of all GHG emissions covered by the Kyoto Protocol. This is a significant milestone in Alamos’ sustainability journey and considered a credible target by definition of the Carbon Disclosure Project (“CDP”).
Alamos is already an industry leader in GHG emission intensity with an average of 0.38 tCO2e per ounce of gold produced across its three operating mines (base year 2020/2021), 43% lower than the mining industry average of 0.67 tCO2e per ounce of gold. The 30% absolute reduction in GHG emissions will decrease Alamos’ emission intensity by 55%. This includes the development of the Lynn Lake project, which is expected to begin producing within the target period.
5 | Alamos Gold Inc
TRADING SYMBOL: TSX:AGI NYSE:AGI
As part of the Company’s emission reduction strategy, Alamos developed an Energy and Greenhouse Gas Management Standard in support of its Sustainability Performance Management Framework. This included completing Energy and Carbon Management System assessments at its operating sites to develop a baseline for its existing Energy Management programs. Alamos reviewed and costed over 30 different GHG emission reduction opportunities across the organization and utilized a Marginal Abatement Cost Curve to prioritize the projects that will support the achievement of its emission reduction target.
Options investigated included renewable energy and clean grid capacity, green fleet (hybrid or battery electric vehicles), electrification of process, and conversion to cleaner fuels. Electric conveyance systems were installed during the lower mine expansion at the Young-Davidson Mine reducing the Company’s reliance on diesel consumption and the Company is working to connect to grid power at Mulatos to offset diesel power generation. The Company is also considering increasing use of biodiesel vs. conventional diesel at all operations, and replacing propane with compressed natural gas for mine-air heaters at underground operations.
The Company’s target to reduce GHG emissions is in support of Canada’s Paris Accord Commitment and the World Gold Council’s (WGC) commitment for members to adopt the recommendations of the Task Force on Climate-Related Financial Disclosure (TCFD).
Community
•Continued Indigenous community engagement, including the signing of a Community Benefits Agreement with the Michipicoten First Nation for Island Gold on April 4, 2022
•Various community donations across all operations including funding for emergency vehicles and medical equipment to the District of Timiskiming Paramedic Service, the Temiskaming Hospital Foundation, and the municipality of Sahuaripa
•Sponsored a basketball camp with the Kirkland Lake Swamp Donkeys basketball club and the Matachewan and Beaverhouse First Nations
•Installation of solar street lighting in the village of Matarachi, Mexico
•Continued support for local students in Sahuaripa, Matarachi and Hermosillo, with 70 students supported through the Company’s Scholarship Program
Alamos believes that excellence in sustainability provides a net benefit to all stakeholders. The Company continues to engage with local communities to understand local challenges and priorities, and to offer support during the COVID-19 pandemic. Ongoing investments in local infrastructure, health care, education, cultural and community programs have continued through the COVID-19 pandemic, with appropriate health and safety protocols.
Governance and Disclosure
•Published Lynn Lake Gold Project website to increase transparency and disclosure for local stakeholders interested in the project and associated opportunities
•Recipient of the Casco De Plata safety award by the Mining Chamber of Mexico (CAMIMEX) in recognition of outstanding health and safety performance and governance at Mulatos
Alamos maintains the highest standards of corporate governance to ensure that corporate decision-making reflects its values, including the Company’s commitment to sustainable development. During the quarter, the Company continued to advance its implementation of the Responsible Gold Mining Principles, developed by the World Gold Council as a framework that sets clear expectations as to what constitutes responsible gold mining.
(1) Frequency rate is calculated as incidents per 200,000 hours worked.
(2) The classification of medical treatment injuries was updated retroactive to 1 January 2020 to align with OSHA standards, resulting in changes to previously reported recordable injury rates.
6 | Alamos Gold Inc
TRADING SYMBOL: TSX:AGI NYSE:AGI
7 | Alamos Gold Inc
TRADING SYMBOL: TSX:AGI NYSE:AGI
Outlook and Strategy
| 2022 Guidance | |||||||||||||||||
| Young-Davidson | Island Gold | Mulatos | Other (2) | Total | |||||||||||||
Gold production (000’s ounces) | 185 - 200 | 125 - 135 | 130 - 145 | 440 - 480 | |||||||||||||
Cost of sales, including amortization (in millions)(4) | $610 | ||||||||||||||||
Cost of sales, including amortization ($ per ounce)(4) | $1,325 | ||||||||||||||||
Total cash costs ($ per ounce)(1) | $850 - $900 | $550 - $600 | $1,225 - $1,275 | — | $875- $925 | ||||||||||||
All-in sustaining costs ($ per ounce)(1) | $1,190 - $1,240 | ||||||||||||||||
Mine-site all-in sustaining costs ($ per ounce)(1)(3) | $1,125 - $1,175 | $850 - $900 | $1,325 - $1,375 | — | |||||||||||||
Capital expenditures (in millions) | |||||||||||||||||
Sustaining capital(1) | $50 - $55 | $35 - $40 | $5 - $10 | — | $90 - $105 | ||||||||||||
Growth capital(1) | $5 - $10 | $145 - $160 | $50 - $55 | $15 | $215 - $240 | ||||||||||||
Total Sustaining and Growth Capital(1) | $55 - $65 | $180 - $200 | $55 - $65 | $15 | $305 - $345 | ||||||||||||
Capitalized exploration(1) | $4 | $20 | — | $3 | $27 | ||||||||||||
Total capital expenditures and capitalized exploration(1) | $59 - $69 | $200 - $220 | $55 - $65 | $18 | $332 - $372 | ||||||||||||
(1)Refer to the "Non-GAAP Measures and Additional GAAP" disclosure at the end of this press release and associated MD&A for a description and calculation of these measures.
(2)Includes growth capital and capitalized exploration at the Company's development projects (Lynn Lake and Esperanza).
(3)For the purposes of calculating mine-site all-in sustaining costs at individual mine sites, the Company does not include an allocation of corporate and administrative and share based compensation expenses to the mine sites.
(4)Cost of sales includes mining and processing costs, royalties, and amortization expense, and is calculated based on the mid-point of total cash cost guidance.
The Company’s objective is to operate a sustainable business model that can support growing returns to all stakeholders over the long-term through growing production, expanding margins, and increasing profitability. This includes a balanced approach to capital allocation focused on generating strong ongoing free cash flow while re-investing in high-return internal growth opportunities and supporting higher returns to shareholders.
The Company delivered on two key long-term objectives during the second quarter which have solidified its strong outlook. This included achieving initial low-cost production at La Yaqui Grande and announcing the Phase 3+ Expansion of Island Gold, which will create a larger, more profitable and valuable operation.
Construction of La Yaqui Grande was completed in June, ahead of schedule and marking a significant transition for the Mulatos District. La Yaqui Grande is expected to drive Mulatos District costs lower in the second half of the year and generate significant free cash flow over the next five years. La Yaqui Grande represents another in a long line of discoveries and high-return projects developed within the Mulatos District that have continued to extend the mine life. Despite the inflationary environment, the impact of COVID-19, and several scope changes, the total construction cost of $161 million was within 13% of the July 2020 estimate, demonstrating the Company's ability to execute in a challenging environment.
In addition, the Company announced a Phase 3+ Expansion of Island Gold, which will result in a step change in production, with mining rates increasing to 2,400 tpd from the current rate of 1,200 tpd. This is expected to more than double gold production to average 287,000 ounces per year at industry low mine-site all-in sustaining costs of $576 per ounce starting in 2026 upon completion of the shaft. The larger, longer-life operation reflects the significant increase in Mineral Reserve and Resources since the Phase 3 study was completed in 2020, supporting a 43% increase in mineable resources to 4.6 million ounces of gold grading 10.59 g/t Au. Given strong ongoing cash flow from operations, the majority of the Phase 3+ Expansion capital is expected to be self-funded by Island Gold.
The Company provided inaugural three-year production and operating guidance in January 2022, which outlined growing production at significantly lower costs over the 2022 to 2024 period. Refer to the Company’s January 17, 2022 guidance press release for a summary of the key assumptions and related risks associated with the comprehensive 2022 guidance and three-year production, cost and capital outlook.
8 | Alamos Gold Inc
TRADING SYMBOL: TSX:AGI NYSE:AGI
The Company produced 202,800 ounces in the first half of the year, and with stronger production expected in the second half driven by the ramp up of La Yaqui Grande, the Company remains well positioned to meet full year production guidance of between 440,000 and 480,000 ounces. Third quarter production is expected to increase to between 115,000 and 125,000 ounces, with a further increase expected in the fourth quarter. Consistent with full year guidance, total cash costs are expected to decrease in the second half of the year compared to the first half with the ramp up of low-cost production at La Yaqui Grande, higher grades at Island Gold, and the weaker Canadian dollar.
At Young-Davidson, mining rates of 8,160 tpd exceeded targeted rates for the fourth straight quarter, driving strong first half production of 98,300 ounces and mine-site free cash flow of $54.0 million. With the solid performance through the first half of the year, Young-Davidson is on track to achieve full year production and cost guidance. The operation generated a record $100 million in mine-site free cash flow in 2021. With the strong ongoing performance, Young-Davidson is expected to generate similar mine-site free cash flow in 2022 and over the long term.
Island Gold produced 61,800 ounces in the first half of the year, including a 52% increase in second quarter production to 37,300 ounces at significantly lower costs relative to the first quarter reflecting higher grades and tonnes mined and processed. With production expected to be higher in the second half of the year, Island Gold remains on track to achieve full year guidance. Construction activities on the Phase 3+ Expansion are ramping up with shaft site clearing ongoing, and the pre-sink expected to commence in August. Capital spending is expected to also increase in the second half of the year to be consistent with full year guidance of between $180 and $200 million (excluding exploration).
The exploration budget at Island Gold is $22 million in 2022 with the focus on following up on another successful drilling campaign in 2021 that drove an 8% increase in high-grade Mineral Reserves and Resources to 5.1 million ounces of gold. This ongoing growth was incorporated into the Phase 3+ Expansion Study released in June.
Combined production from the Mulatos District totaled 42,700 ounces in the first half of 2022, including 5,000 ounces from the recently completed La Yaqui Grande project. With operations ramping up at La Yaqui Grande in the third quarter and increasing grades from the El Salto portion of the Mulatos pit in the fourth quarter, production from the Mulatos District is expected to increase significantly through the remainder of the year. As previously disclosed, total cash costs and mine-site AISC were well above annual guidance during the first half of 2022, but expected to trend significantly lower during the second half of the year as La Yaqui Grande represents a larger proportion of Mulatos District production.
The total capital budget for Lynn Lake in 2022 is $14 million, including $11 million for development activities and $3 million for exploration. Development activities in 2022 remain focused on environmental work in support of permitting, detailed engineering and other site access upgrades. The approval of the Environmental Impact Statement (“EIS”) for the project is expected in the latter part of 2022, following which the Company expects to release an updated feasibility study.
The Company's liquidity position remains strong, ending the second quarter with $121.5 million of cash and cash equivalents, $22.5 million in equity securities, and no debt. Additionally, the Company has a $500 million undrawn credit facility, providing total liquidity of $621.5 million.
As part of the Company's balanced approach to growth and capital allocation, the current focus is on the Phase 3+ Expansion at Island Gold. With no significant capital expected to be spent on developing Lynn Lake until the Phase 3+ Expansion is well underway, the Company remains well positioned to fund this growth internally while generating strong free cash flow over the next several years. The Company expects significant free cash flow growth in 2025 and beyond as production rates ramp up at Island Gold.
9 | Alamos Gold Inc
TRADING SYMBOL: TSX:AGI NYSE:AGI
Second Quarter 2022 Results
Young-Davidson Financial and Operational Review
| Three Months Ended June 30, | Six Months Ended June 30, | |||||||||||||
| 2022 | 2021 | 2022 | 2021 | |||||||||||
| Gold production (ounces) | 46,400 | 45,100 | 98,300 | 93,100 | ||||||||||
| Gold sales (ounces) | 46,662 | 45,284 | 98,187 | 93,306 | ||||||||||
| Financial Review (in millions) | ||||||||||||||
| Operating Revenues | $87.3 | $82.1 | $184.1 | $168.2 | ||||||||||
Cost of sales (1) | $59.8 | $61.3 | $124.4 | $123.3 | ||||||||||
| Earnings from operations | $25.9 | $20.8 | $56.5 | $44.9 | ||||||||||
| Cash provided by operating activities | $43.9 | $38.3 | $89.8 | $82.5 | ||||||||||
Capital expenditures (sustaining) (2) | $10.2 | $9.8 | $20.6 | $19.3 | ||||||||||
Capital expenditures (growth) (2) | $1.6 | $8.3 | $12.9 | $19.7 | ||||||||||
Capital expenditures (capitalized exploration) (2) | $1.3 | $1.5 | $2.3 | $2.5 | ||||||||||
Mine-site free cash flow (2) | $30.8 | $18.7 | $54.0 | $41.0 | ||||||||||
Cost of sales, including amortization per ounce of gold sold (1) | $1,282 | $1,354 | $1,267 | $1,321 | ||||||||||
Total cash costs per ounce of gold sold (2) | $866 | $941 | $852 | $906 | ||||||||||
Mine-site all-in sustaining costs per ounce of gold sold (2),(3) | $1,087 | $1,157 | $1,064 | $1,115 | ||||||||||
| Underground Operations | ||||||||||||||
| Tonnes of ore mined | 742,516 | 682,857 | 1,478,820 | 1,384,019 | ||||||||||
| Tonnes of ore mined per day | 8,160 | 7,504 | 8,170 | 7,647 | ||||||||||
Average grade of gold (4) | 2.24 | 2.22 | 2.30 | 2.23 | ||||||||||
| Metres developed | 3,097 | 2,868 | 6,344 | 6,220 | ||||||||||
| Mill Operations | ||||||||||||||
| Tonnes of ore processed | 705,014 | 688,127 | 1,442,742 | 1,421,348 | ||||||||||
| Tonnes of ore processed per day | 7,747 | 7,562 | 7,971 | 7,853 | ||||||||||
Average grade of gold (4) | 2.25 | 2.22 | 2.32 | 2.22 | ||||||||||
| Contained ounces milled | 50,975 | 49,134 | 107,445 | 101,670 | ||||||||||
| Average recovery rate | 91% | 92% | 91% | 92% | ||||||||||
(1)Cost of sales includes mining and processing costs, royalties and amortization.
(2)Refer to the “Non-GAAP Measures and Additional GAAP Measures” disclosure at the end of this press release and associated MD&A for a description and calculation of these measures.
(3)For the purposes of calculating mine-site all-in sustaining costs, the Company does not include an allocation of corporate and administrative and share based compensation expenses.
(4)Grams per tonne of gold ("g/t Au").
Young-Davidson produced 46,400 ounces of gold in the second quarter of 2022, a 3% increase from the prior year period reflecting higher tonnes and grades processed. With first half production of 98,300 ounces, the operation is on track to meet full year production guidance.
Underground mining rates continued to outperform, averaging 8,160 tpd in the second quarter and 8,170 tpd in the first half of 2022, representing the fourth consecutive quarter the operation has exceeded the targeted rate of 8,000 tpd. Grades mined averaged 2.24 g/t Au, within annual guidance of between 2.15 and 2.35 g/t Au. Grades mined in the second half of the year are expected to be consistent with the first half.
Mill throughput averaged 7,747 tpd in the second quarter at an average grade of 2.25 g/t Au. Tonnes milled were lower than the first quarter, reflecting a planned liner change in the mill. Mill recoveries averaged 91% in the quarter, in line with guidance and the prior year period.
Financial Review
Second quarter revenues of $87.3 million and year-to date revenues of $184.1 million were 6% and 9% higher, respectively, than the prior year periods driven by more ounces sold and a higher realized gold price.
10 | Alamos Gold Inc
TRADING SYMBOL: TSX:AGI NYSE:AGI
Cost of sales (which includes mining and processing costs, royalties, and amortization expense) of $59.8 million in the second quarter were lower than the prior year period, due to lower unit mining costs. Underground unit mining costs were CAD $48 per tonne in the quarter, an improvement from the prior year driven by economies of scale from higher mining rates. Cost of sales of $124.4 million in the first half of 2022 were slightly higher than the comparable period as lower mining costs were offset by a 7% increase in tonnes mined.
Total cash costs of $866 per ounce in the second quarter were 8% lower than the prior year period driven by higher grades processed and lower mining costs per tonne. Mine-site AISC of $1,087 per ounce in the second quarter were 6% lower than the prior year period, consistent with the lower total cash costs. Given the strong first half performance, Young-Davidson remains well positioned to meet full year total cash cost and mine-site AISC guidance.
Capital expenditures in the quarter included $10.2 million of sustaining capital and $1.6 million of growth capital. In addition, $1.3 million was invested in capitalized exploration in the quarter. Capital expenditures totaled $35.8 million in the first half of 2022, a 14% decrease from the prior year and in line with annual guidance.
Young-Davidson has consistently met or exceeded expectations since transitioning to the lower mine infrastructure in mid-2020, driving production higher, and significant free cash flow growth. This included mine-site free cash flow of $30.8 million in the second quarter of 2022 and $54.0 million for the first half of 2022.
11 | Alamos Gold Inc
TRADING SYMBOL: TSX:AGI NYSE:AGI
Island Gold Financial and Operational Review
| Three Months Ended June 30, | Six Months Ended June 30, | |||||||||||||
| 2022 | 2021 | 2022 | 2021 | |||||||||||
| Gold production (ounces) | 37,300 | 33,200 | 61,800 | 75,400 | ||||||||||
| Gold sales (ounces) | 36,797 | 33,632 | 60,165 | 73,514 | ||||||||||
| Financial Review (in millions) | ||||||||||||||
| Operating Revenues | $68.8 | $61.1 | $112.5 | $132.6 | ||||||||||
Cost of sales (1) | $32.0 | $25.6 | $56.2 | $54.7 | ||||||||||
| Earnings from operations | $34.8 | $33.7 | $53.7 | $75.5 | ||||||||||
| Cash provided by operating activities | $49.5 | $42.9 | $76.9 | $98.4 | ||||||||||
Capital expenditures (sustaining) (2) | $9.5 | $11.0 | $17.3 | $21.6 | ||||||||||
Capital expenditures (growth) (2) (5) | $15.7 | $14.3 | $36.2 | $28.7 | ||||||||||
Capital expenditures (capitalized exploration) (2) | $4.1 | $3.9 | $9.2 | $8.4 | ||||||||||
Mine-site free cash flow (2) | $20.2 | $13.7 | $14.2 | $39.7 | ||||||||||
Cost of sales, including amortization per ounce of gold sold (1) | $870 | $761 | $934 | $744 | ||||||||||
Total cash costs per ounce of gold sold (2) | $590 | $502 | $650 | $483 | ||||||||||
Mine-site all-in sustaining costs per ounce of gold sold (2),(3) | $848 | $830 | $939 | $777 | ||||||||||
| Underground Operations | ||||||||||||||
| Tonnes of ore mined | 112,203 | 117,673 | 215,192 | 220,950 | ||||||||||
| Tonnes of ore mined per day ("tpd") | 1,233 | 1,293 | 1,189 | 1,221 | ||||||||||
Average grade of gold (4) | 10.02 | 8.52 | 9.22 | 10.75 | ||||||||||
| Metres developed | 1,902 | 1,907 | 3,341 | 3,858 | ||||||||||
| Mill Operations | ||||||||||||||
| Tonnes of ore processed | 114,448 | 111,898 | 215,097 | 221,183 | ||||||||||
| Tonnes of ore processed per day | 1,258 | 1,230 | 1,188 | 1,222 | ||||||||||
Average grade of gold (4) | 10.09 | 8.85 | 9.18 | 10.91 | ||||||||||
| Contained ounces milled | 37,132 | 31,835 | 63,459 | 77,619 | ||||||||||
| Average recovery rate | 96% | 97% | 96% | 97% | ||||||||||
(1)Cost of sales includes mining and processing costs, royalties, and amortization.
(2)Refer to the “Non-GAAP Measures and Additional GAAP Measures” disclosure at the end of this press release and associated MD&A for a description and calculation of these measures.
(3)For the purposes of calculating mine-site all-in sustaining costs, the Company does not include an allocation of corporate and administrative and share based compensation expenses.
(4)Grams per tonne of gold ("g/t Au").
(5)Includes capital advances of nil and $1.4 million for the three and six months ended June 30, 2022 ($0.7 million and $2.8 million for the three and six months ended June 30, 2021).
Island Gold produced 37,300 ounces in the second quarter of 2022, a 12% improvement from the prior year period reflecting higher grades mined and processed. Through the first half of 2022, Island Gold produced 61,800 ounces. With grades mined in the second half of the year expected to be consistent with the second quarter, Island Gold remains on track to meet full year production guidance.
Underground mining rates averaged 1,233 tpd in the second quarter, with grades averaging 10.02 g/t Au. Mining rates through the first half of the year averaged 1,189 tpd, in line with guidance of 1,200 tpd. Grades mined in the quarter were in line with full year guidance.
Mill throughput averaged 1,258 tpd, 5% above annual guidance of 1,200 tpd, reflecting high mill availability and the processing of approximately 8,000 tonnes of Island Gold ore at the Young-Davidson mill. Given current permit limits at Island Gold, stockpiled ore is expected be trucked to Young-Davidson for the remainder of the year as capacity is available, boosting production and cash flow. Mill recoveries averaged 96% in the quarter, consistent with annual guidance and the prior year period.
Financial Review
12 | Alamos Gold Inc
TRADING SYMBOL: TSX:AGI NYSE:AGI
Island Gold generated revenues of $68.8 million in the second quarter, a 13% increase compared to the prior year period, reflecting 9% more ounces sold, and a higher realized gold price. For the first half of the year, revenues were $112.5 million, lower than the comparable prior year period as a result of less ounces sold, partially offset by a higher realized gold price.
Cost of sales (includes mining and processing costs, royalties and amortization expense) of $32.0 million in the second quarter were 25% higher than the prior year period, reflecting higher ounces sold, partially offset by lower amortization on a per ounce basis given the increase in Mineral Reserve and Resources in 2022.
Total cash costs of $590 per ounce in the second quarter were higher than the prior year period, due to higher mining and processing costs, partially offset by higher grades processed. Mine-site AISC of $848 per ounce in the second quarter were consistent with the prior year period. Total cash costs and mine-site AISC are expected to be lower in the second half of the year, relative to the first half, reflecting higher grades mined.
Total capital expenditures were $29.3 million in the second quarter, including $4.1 million of capitalized exploration. Spending was focused on lateral development, as well as engineering, shaft site preparation and clearing for the shaft infrastructure, early procurement for the Phase 3+ Expansion, and other surface infrastructure. For the first half of the year, capital spending was $62.7 million, inclusive of capitalized exploration of $9.2 million, consistent with the prior year period. Capital spending is expected to increase in the second half of the year, with the pre-sink expected to commence in the third quarter.
Island Gold generated mine-site free cash flow of $20.2 million in the second quarter and $14.2 million in the first half of 2022, inclusive of all capital spending on the Phase 3+ Expansion and exploration. At current gold prices, Island Gold is expected to largely self-finance the Phase 3+ Expansion capital spending in 2022 and beyond.
13 | Alamos Gold Inc
TRADING SYMBOL: TSX:AGI NYSE:AGI
Mulatos District Financial and Operational Review
| Three Months Ended June 30, | Six Months Ended June 30, | |||||||||||||
| 2022 | 2021 | 2022 | 2021 | |||||||||||
| Gold production (ounces) | 20,200 | 35,900 | 42,700 | 71,500 | ||||||||||
| Gold sales (ounces) | 18,705 | 28,665 | 42,278 | 67,243 | ||||||||||
Financial Review Mulatos District (in millions) | ||||||||||||||
| Operating Revenues | $35.1 | $51.9 | $79.1 | $121.7 | ||||||||||
Cost of sales (1) | $60.1 | $40.0 | $106.8 | $88.2 | ||||||||||
| (Loss) earnings from operations | ($27.8) | $10.4 | ($32.1) | $30.2 | ||||||||||
| Cash (used) provided by operating activities | ($8.7) | $19.3 | ($20.1) | $29.2 | ||||||||||
Capital expenditures (sustaining) (2) | $0.4 | $5.9 | $4.8 | $9.4 | ||||||||||
Capital expenditures (growth) (2) (7) | $20.7 | $24.7 | $42.3 | $54.7 | ||||||||||
Capital expenditures (capitalized exploration) (2) | $0.2 | $1.0 | $0.2 | $1.0 | ||||||||||
Mine-site free cash flow (2) | ($30.0) | ($12.3) | ($67.4) | ($35.9) | ||||||||||
Cost of sales, including amortization per ounce of gold sold (1) | $3,213 | $1,395 | $2,526 | $1,312 | ||||||||||
Total cash costs per ounce of gold sold (2) | $1,566 | $893 | $1,568 | $906 | ||||||||||
Mine site all-in sustaining costs per ounce of gold sold(2),(3) | $1,636 | $1,144 | $1,717 | $1,084 | ||||||||||
| Mulatos Mine | ||||||||||||||
| Open Pit Operations | ||||||||||||||
Tonnes of ore mined - open pit (4) | 1,227,625 | 800,137 | 1,841,438 | 1,711,090 | ||||||||||
Total waste mined - open pit (6) | 1,691,474 | 2,426,047 | 3,664,026 | 4,887,970 | ||||||||||
| Total tonnes mined - open pit | 2,919,099 | 3,226,184 | 5,505,464 | 6,599,060 | ||||||||||
| Waste-to-ore ratio (operating) | 1.38 | 2.03 | 1.45 | 1.53 | ||||||||||
| Crushing and Heap Leach Operations | ||||||||||||||
| Tonnes of ore stacked | 1,526,771 | 1,899,338 | 3,268,254 | 3,733,124 | ||||||||||
Average grade of gold processed (5) | 0.68 | 1.11 | 0.70 | 1.02 | ||||||||||
| Contained ounces stacked | 33,197 | 67,697 | 74,049 | 122,420 | ||||||||||
| Average recovery rate | 46% | 53% | 51% | 58% | ||||||||||
| Ore crushed per day (tonnes) | 16,800 | 20,900 | 18,100 | 20,600 | ||||||||||
| La Yaqui Grande Mine | ||||||||||||||
| Open Pit Operations | ||||||||||||||
Tonnes of ore mined - open pit (4) | 343,884 | — | 496,818 | — | ||||||||||
Total waste mined - open pit (6) | 6,260,883 | — | 12,142,114 | — | ||||||||||
| Total tonnes mined - open pit | 6,604,767 | — | 12,638,932 | — | ||||||||||
| Crushing and Heap Leach Operations | ||||||||||||||
| Tonnes of ore stacked | 333,166 | — | 333,166 | — | ||||||||||
Average grade of gold processed (5) | 1.57 | — | 1.57 | — | ||||||||||
| Contained ounces stacked | 16,777 | — | 16,777 | — | ||||||||||
(1) Cost of sales includes mining and processing costs, royalties, and amortization. Cost of sales per ounce for the three and six months ended June 30, 2022 include the inventory net realizable value adjustment of $22.3 million.
(2) Refer to the “Non-GAAP Measures and Additional GAAP Measures” disclosure at the end of this press release and associated MD&A for a description and calculation of these measures.
(3) For the purposes of calculating mine-site all-in sustaining costs, the Company does not include an allocation of corporate and administrative and share based compensation expenses.
(4) Includes ore stockpiled during the quarter.
(5) Grams per tonne of gold ("g/t Au").
(6) Total waste mined includes operating waste and capitalized stripping.
(7) Includes a drawdown of capital advances of $1.4 million for the three and six months ended June 30, 2022 ($2.7 million and $17.4 million of advances for the three and six months ended June 30, 2021).
Mulatos produced 15,200 ounces in the second quarter (excluding La Yaqui Grande), significantly lower than the prior year period but consistent with first half guidance. With pre-stripping of the El Salto pit completed, all ore mined in the second quarter was from El Salto. Ore stacked in the second quarter was supplemented by surface stockpiles, but at a lower rate than in previous quarters. El Salto ore is expected to comprise the majority of ore stacked at Mulatos the remainder of the year. Mulatos production (excluding La Yaqui Grande) in the second half of
14 | Alamos Gold Inc
TRADING SYMBOL: TSX:AGI NYSE:AGI
the year is expected to remain relatively consistent with the first half of the year, with higher grade portions of El Salto not being accessed until late 2022.
Total crusher throughput in the second quarter averaged 16,800 tpd, for a total of 1,526,771 tonnes stacked at a grade of 0.68 g/t Au, including surface stockpiles. Consistent with the previous quarter, processing the lower recovery stockpiles, combined with stacking on higher lifts of the leach pad, resulted in a longer than anticipated leach cycle which contributed to a lower recovery rate of 46%.
La Yaqui Grande Operational Review
La Yaqui Grande achieved initial gold production in June 2022, following the completion of construction ahead of schedule. La Yaqui Grande is an open pit mine located approximately seven kilometres from the existing Mulatos operation and is adjacent to the past producing La Yaqui Phase I operation. Stacking rates continue to ramp up with higher than planned grades contributing to a strong start with production of 5,000 ounces for the quarter.
During the quarter, 343,884 tonnes of ore were mined bringing total ore mined since the beginning of pre-stripping to approximately 900,000 tonnes. The focus of mining activities in the quarter was on completing pre-stripping to access the main ore body, with 6,260,883 tonnes of waste mined. The majority of these tonnes were capitalized and included in construction capital.
Stacking of ore commenced in June, with 333,166 tonnes placed on the leach pad at an average grade of 1.57 g/t Au. Ore stacked in the period included higher grade ore mined and stockpiled during the construction period.
Financial Review (Mulatos District)
Revenues of $35.1 million in the second quarter, and $79.1 million for the first six months of the year, were lower than the prior year period driven by fewer ounces sold, partially offset by higher realized gold prices.
Cost of sales (includes mining and processing costs, royalties and amortization expense) of $60.1 million in the second quarter were higher than in the comparative period, driven by higher processing costs and an adjustment to the leach pad inventory balance. During the second quarter, the Company reviewed the carrying value of the Mulatos leach pad inventory to assess its recoverability. Given a decline in the gold price at period end, the Company recorded an adjustment to reduce the carrying value of Mulatos leach pad inventory, resulting in a non-cash net realizable value adjustment of $22.3 million ($14.7 million after tax). For the first half of 2022, cost of sales of $106.8 million, were higher than the prior year, primarily due to the inventory adjustment.
Total cash costs for the Mulatos District of $1,566 per ounce were higher than the prior year period as a result of lower tonnes and grades stacked. Additionally the surface stockpiles processed carry a higher cost per ounce given increased reagent consumption driving processing costs higher. Total cash costs for the Mulatos District included initial production from La Yaqui Grande, which had total cash costs and mine-site AISC of $451 per ounce in the quarter given the higher grades stacked in June. Mine-site AISC for the Mulatos District of $1,636 per ounce in the quarter were higher than in the prior year period, consistent with the increase in total cash costs.
Capital spending totaled $21.3 million in the second quarter, which included La Yaqui Grande construction capital, $0.4 million of sustaining capital and capitalized exploration of $0.2 million. During the first half of 2022, capital spending totaled $47.3 million, including $42.3 million of growth capital for the completion of construction at La Yaqui Grande.
La Yaqui Grande construction was completed ahead of schedule, with total capital spending on the project of $161 million, including $7 million recorded within accounts payable at quarter end. Capital spending included pre-stripping of 33 million tonnes of waste rock, as well as a new three-stage crushing circuit, independent leach pad and process ponds, carbon columns, a new camp and new ancillary buildings.
Total capital spending on the project was 13%, or $19 million higher than the initial capital estimate of $142 million from mid-2020, mainly due to scope changes. The Company installed a new crushing circuit rather than refurbishing the El Chanate crushing circuit as originally planned. In addition, the Company constructed a new camp given the
15 | Alamos Gold Inc
TRADING SYMBOL: TSX:AGI NYSE:AGI
challenges posed by COVID-19. Capital spending in the second half of the year is expected to include advancing the power-line upgrade to bring power to site, as well as engineering and construction of a water treatment plant.
The Mulatos District generated negative mine-site free cash flow of $30.0 million in the quarter driven by construction capital spending at La Yaqui Grande. With the completion of construction and commencement of production, La Yaqui Grande is expected to be a strong free cash flow contributor starting in the second half of this year.
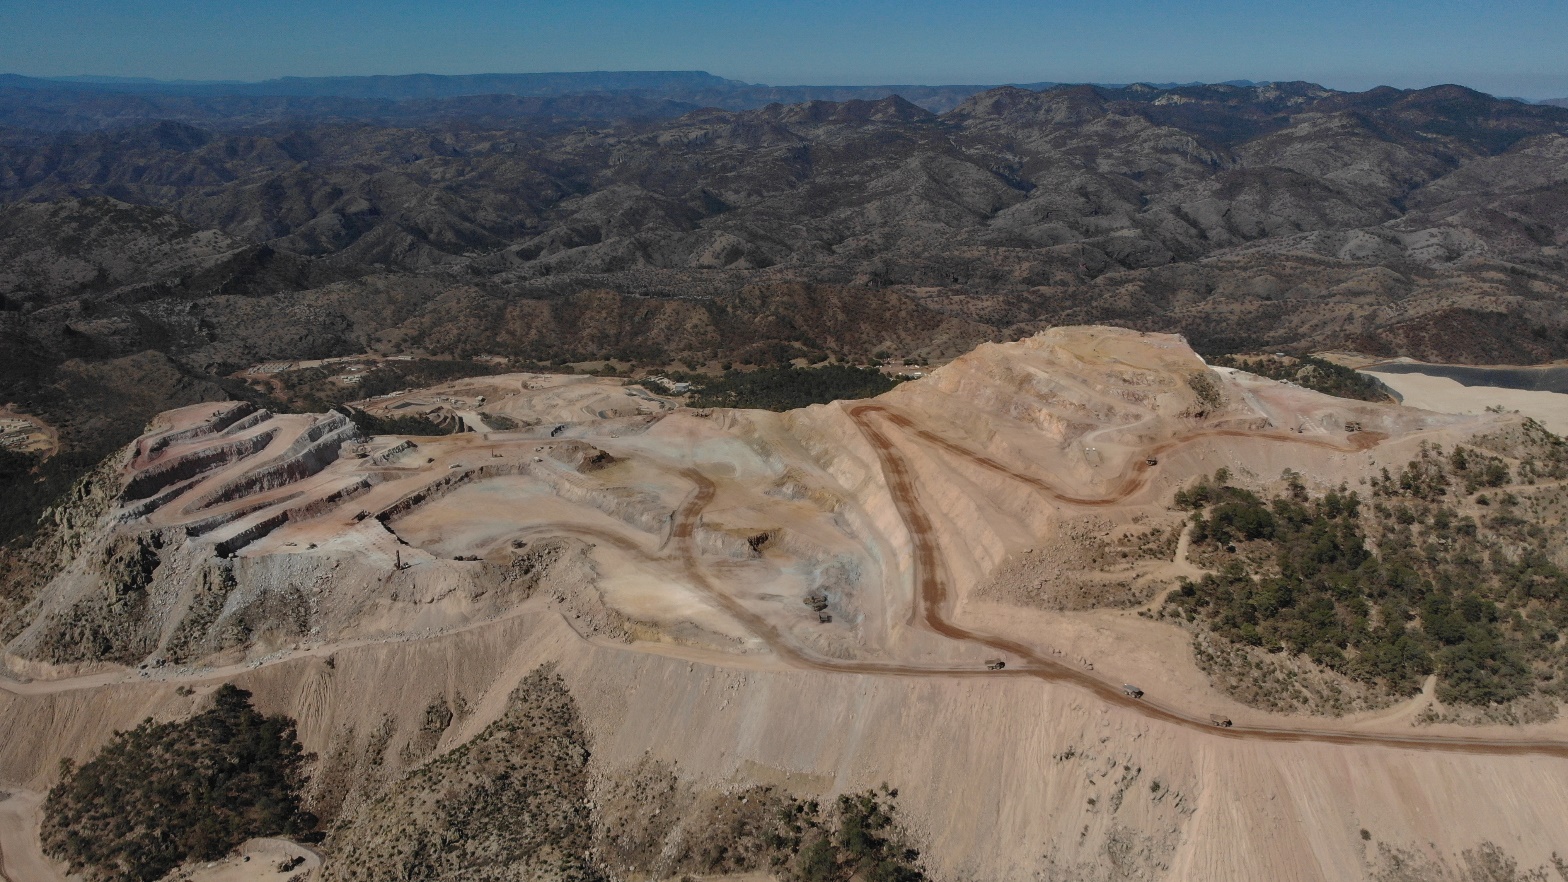
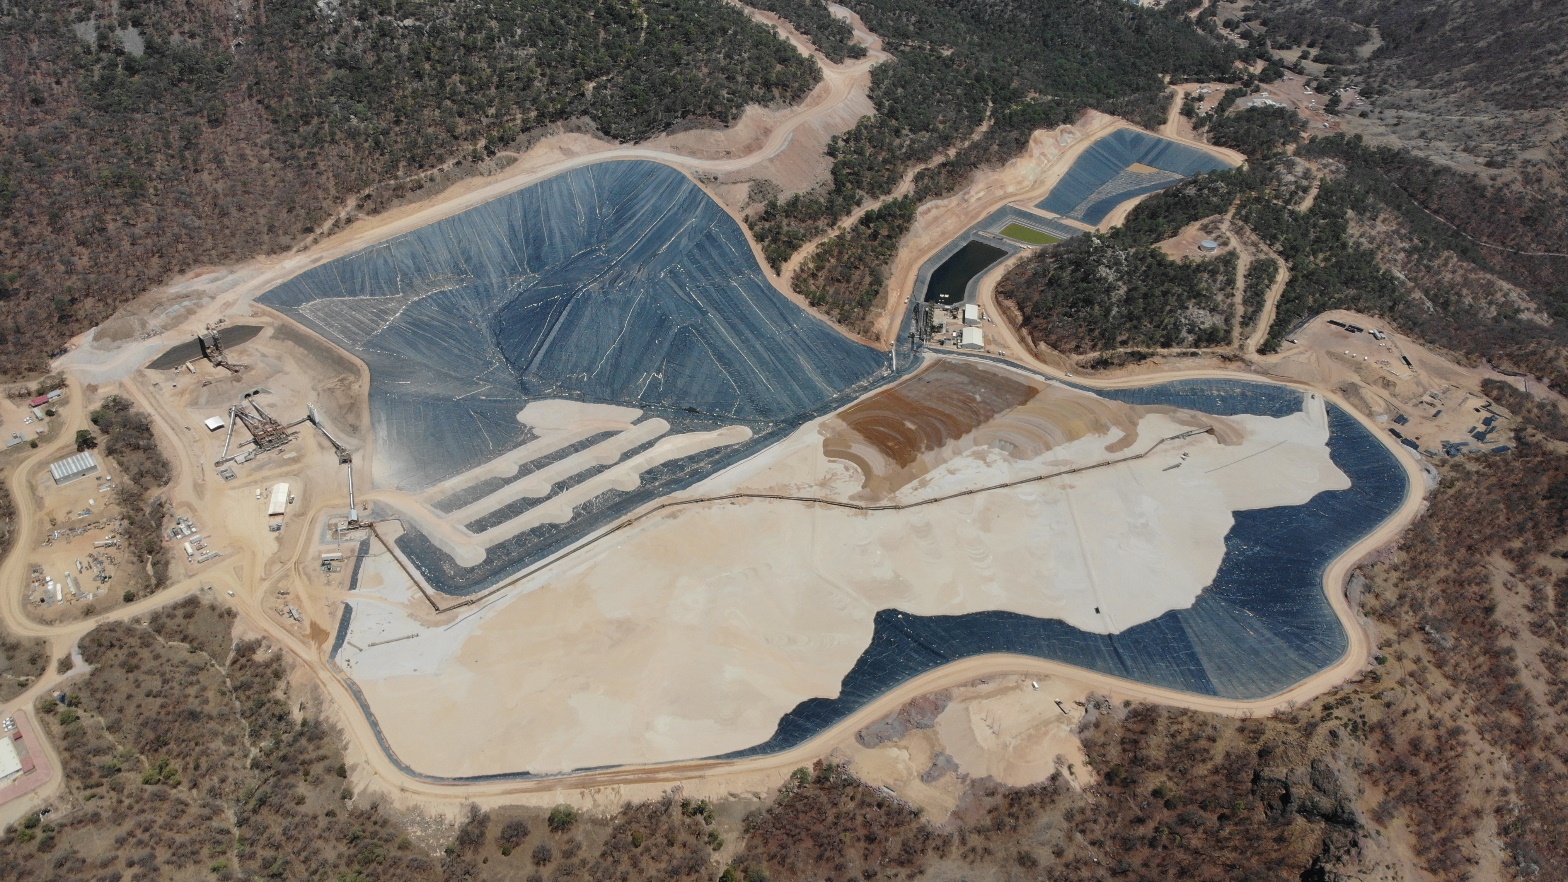
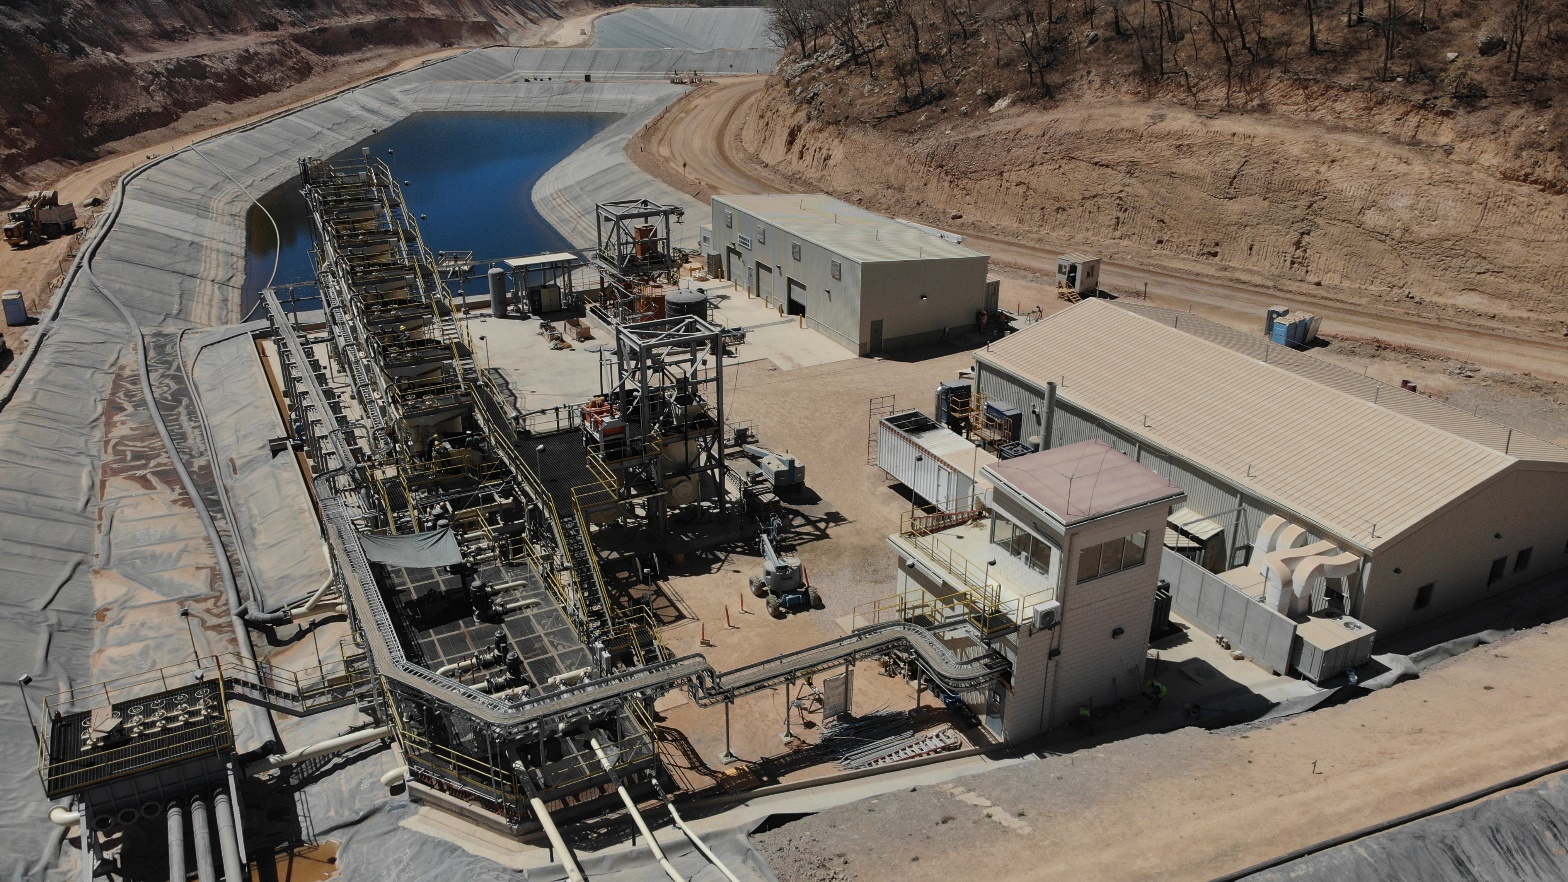
Below are pictures of the recently constructed La Yaqui Grande mine in Mexico:
La Yaqui Grande - Pit
16 | Alamos Gold Inc
TRADING SYMBOL: TSX:AGI NYSE:AGI
La Yaqui Grande - Leach pad and processing circuit
17 | Alamos Gold Inc
TRADING SYMBOL: TSX:AGI NYSE:AGI
Second Quarter 2022 Development Activities
Island Gold (Ontario, Canada)
Phase 3+ Expansion Study
On June 28, 2022, the Company reported results of the Phase 3+ Expansion Study (“P3+ Expansion Study”) conducted on its Island Gold mine, located in Ontario, Canada. The P3+ Expansion Study was an update to the Phase 3 Study ("P3 2000 Study") released on July 14, 2020.
The P3+ Expansion Study was updated to reflect the current costing environment, as well as incorporate the significant growth in high-grade Mineral Reserves and Resources into an optimized mine plan. The P3+ Expansion Study outlines a larger, more profitable, and valuable operation than what was included in the P3 2000 Study released in 2020.
The Phase 3+ Expansion to 2,400 tpd from the current rate of 1,200 tpd will involve various infrastructure investments. These include the installation of a shaft, paste plant, and an expansion of the mill. This infrastructure was all incorporated into the P3 2000 Study with several scope changes to accommodate the 20% increase in production rates to 2,400 tpd including a larger mill expansion and paste plant, as well as accelerated development to support the higher mining rates. The Phase 3+ Expansion also includes 30% more development over the mine life to accommodate the 43% larger mineable resource.
Following the completion of the expansion in 2026, the operation will transition from trucking ore and waste up the ramp to skipping ore and waste to surface through the new shaft infrastructure, driving production higher and costs significantly lower.
Phase 3+ Expansion Study Highlights:
•Higher production: average annual gold production of 287,000 ounces starting in 2026 upon completion of the shaft
•This represents a 22% increase from the P3 2000 Study and a 121% increase from the mid-point of 2022 production guidance of 130,000 ounces
•Industry low costs: consistent cost structure with the P3 2000 Study, with productivity gains and economies of scale offsetting inflation
•Average total cash costs of $432 per ounce (average $425 per ounce from 2026), consistent with the P3 2000 Study and 25% lower than the mid-point of 2022 guidance of $575 per ounce
•Average mine-site all-in sustaining costs of $610 per ounce (average $576 per ounce from 2026), a 30% decrease from the mid-point of 2022 guidance of $875 per ounce
•Larger, longer-life operation supported by significantly increased Mineral Reserve and Resources
•43% increase in mineable resource to 4.6 million ounces of gold grading 10.59 g/t Au
•18 year mine life to 2039, a four year increase from the P3 2000 Study, while operating at 20% higher production rates of 2,400 tpd
•Lower capital intensity: lower total capital per ounce over the life of mine
•Growth capital of $756 million and sustaining capital of $777 million, both up from the P3 2000 Study reflecting the expansion, a larger mineable resource, and industry-wide inflation
•Total capital intensity decreased 4% to $344 per ounce reflecting the larger mineable resource with increased ounces per vertical metre driving the lower capital intensity and contributing to the stronger economics
18 | Alamos Gold Inc
TRADING SYMBOL: TSX:AGI NYSE:AGI
•$100 million of the increase in growth capital compared to the P3 2000 Study reflects sustaining capital that has been brought forward to the expansion period for accelerated underground development and infrastructure to support the higher mining rate
•Expansion significantly de-risked given increased detailed engineering, capital committed, and projects completed to date, including the majority of earthworks
•Stronger economics with expansion and larger mineable resource more than offsetting inflation to create a more valuable operation
•After-tax net present value (“NPV”) (5%) of $1.6 billion, a 25% increase from the P3 2000 Study (base case gold price assumption of $1,650 per ounce and USD/CAD foreign exchange rate of $0.78:1)
•After-tax internal rate of return (“IRR”) of 23%, up from 20% in P3 2000 Study
•After-tax NPV (5%) of $2.0 billion, a 31% increase from the P3 2000 Study, and an after-tax IRR of 25%, at gold prices of $1,850 per ounce
•Industry low Greenhouse Gas (“GHG”) emission intensity
•35% reduction in life of mine GHG emissions relative to the current operation, supporting the company-wide target of a 30% reduction in GHG emissions by 2030
•31% additional reduction in emissions per ounce of gold produced from already industry low levels
•Fully funded, balanced approach to growth: growing free cash flow expected starting in the second half of 2022
•With no significant capital expected to be spent on Lynn Lake until the P3+ Expansion is well underway; the Company is well positioned to fund the expansion internally while generating strong free cash flow over the next several years
•The Company expects significant free cash flow growth in 2025 and beyond as production rates ramp up at Island Gold
During the second quarter, the Company was focused on completion of the Phase 3+ Expansion Study, as well as detailed engineering of the shaft and associated infrastructure, including the hoisting plant and surface civil works, as well as the paste plant. Contract tendering and awarding remains ongoing, with commitments in place for over 30% of the anticipated spend. Third quarter activities will include completion of site clearing and preparation of the shaft area, with the pre-sink of the shaft expected to begin in August 2022.
During the second quarter of 2022, the Company spent $15.7 million on growth capital consisting of surface infrastructure, capital development, and detailed engineering.
19 | Alamos Gold Inc
TRADING SYMBOL: TSX:AGI NYSE:AGI
Shaft site area - clearing and preparation work

Lynn Lake (Manitoba, Canada)
The Company released a positive Feasibility Study on the Lynn Lake project in December 2017 outlining average annual production of 143,000 ounces over a 10 year mine life at average mine-site AISC of $745 per ounce.
The project economics based on the 2017 Feasibility Study at a $1,500 per ounce gold price include an after-tax internal rate of return ("IRR") of 21.5% and an after-tax NPV of $290 million (12.5% IRR at a $1,250 per ounce gold price). The Company filed the Environmental Impact Statement ("EIS") with the federal government in 2020. Approval of the EIS is expected in the latter part of 2022, following which the Company expects to release an updated feasibility study on the project.
As part of the Company's balanced approach to growth and capital allocation, no significant capital is expected to be spent on the development of Lynn Lake until the Phase 3+ Expansion at Island Gold is well underway.
Development spending (excluding exploration) was $2.9 million in the second quarter of 2022 and $6.0 million in the first half to support the ongoing permitting process and engineering.
Kirazlı (Çanakkale, Türkiye)
On October 14, 2019, the Company suspended all construction activities on its Kirazlı project following the Turkish government's failure to grant a routine renewal of the Company’s mining licenses, despite the Company having met all legal and regulatory requirements for their renewal. In October 2020, the Turkish government refused the renewal of the Company’s Forestry Permit. The Company had been granted approval of all permits required to
20 | Alamos Gold Inc
TRADING SYMBOL: TSX:AGI NYSE:AGI
construct Kirazlı including the Environmental Impact Assessment approval, Forestry Permit, and GSM (Business Opening and Operation) permit, and certain key permits for the nearby Ağı Dağı and Çamyurt Gold Mines. These permits were granted by the Turkish government after the project earned the support of the local communities and passed an extensive multi-year environmental review and community consultation process.
On April 20, 2021, the Company announced that its Netherlands wholly-owned subsidiaries Alamos Gold Holdings Coöperatief U.A, and Alamos Gold Holdings B.V. (the “Subsidiaries”) would be filing an investment treaty claim against the Republic of Türkiye for expropriation and unfair and inequitable treatment, among other things, with respect to the Kirazlı, Ağı Dağı and Çamyurt gold development projects in Türkiye. The claim was filed under the Netherlands- Türkiye Bilateral Investment Treaty (the “Treaty”). Alamos Gold Holdings Coöperatief U.A. and Alamos Gold Holdings B.V. had its claim against the Republic of Türkiye registered on June 7, 2021 with the International Centre for Settlement of Investment Disputes (World Bank Group).
Bilateral investment treaties are agreements between countries to assist with the protection of investments. The Treaty establishes legal protections for investment between Türkiye and the Netherlands. The Subsidiaries directly own and control the Company’s Turkish assets. The Subsidiaries invoking their rights pursuant to the Treaty does not mean that they relinquish their rights to the Turkish project, or otherwise cease the Turkish operations. The Company will continue to work towards a constructive resolution with the Republic of Türkiye.
The Company incurred $1.3 million in the second quarter related to ongoing holding costs and legal costs to progress the Treaty claim, which was expensed.
Second Quarter 2022 Exploration Activities
Island Gold (Ontario, Canada)
A total of $22 million has been budgeted for surface and underground exploration at Island Gold in 2022. The exploration focus remains on defining additional near mine Mineral Resources across the Island Gold Main Zone (Island Main, West, and East), as well as advancing and evaluating several regional targets. This includes 30,000 metres (“m”) of surface directional drilling, 27,500 m of underground exploration drilling, and 480 m of underground exploration drift development to extend drill platforms on the 620, 840, and 980-levels.
A regional exploration program including 9,000 m of drilling is also budgeted in 2022. The focus is on evaluating and advancing exploration targets outside the Island Gold Deposit on the 15,524-hectare Island Gold property.
During the second quarter, four diamond drill rigs remained focused on the surface directional exploration program, one focused on the surface regional program, and one underground diamond drill operated.
Surface exploration drilling
A total of 8,414 m of surface directional drilling was completed in 11 holes during the second quarter. Surface directional drilling targeted areas peripheral to the Inferred Mineral Resource block in the Island West, Main, and East areas between 1,400 m and 1,750 m below surface with drill hole spacing ranging from 75 m to 200 m. In addition, a total of 5,629 m of surface regional diamond drilling was completed in seven holes during the second quarter in two target areas.
Underground exploration drilling
During the second quarter of 2022, a total of 5,123 m of standard underground exploration drilling was completed in 33 holes. The objective of the underground drilling is to identify new Mineral Resources close to existing Mineral Resource or Reserve blocks. A total of 88 m of underground exploration drift development was also completed during the second quarter.
Total exploration expenditures during the second quarter were $6.1 million, of which $4.1 million was capitalized. In the first half of 2022, the Company incurred exploration expenditures of $11.8 million, of which $9.2 million was capitalized.
21 | Alamos Gold Inc
TRADING SYMBOL: TSX:AGI NYSE:AGI
Young-Davidson (Ontario, Canada)
A total of $7.5 million has been budgeted for exploration at Young-Davidson in 2022. The focus is on following up on the success in the 2020 and 2021 programs which extended gold mineralization below existing Mineral Reserves and Resources and intersected higher grades in the hanging wall and footwall of the deposit.
The 2022 program includes 21,600 m of underground exploration drilling, and 500 m of underground exploration drift development to extend drill platforms on the 9220, 9095, and 9025-levels. The focus of the underground exploration drilling program will be to expand Mineral Resources in six target areas that have been identified within proximity to existing underground infrastructure. In addition, 10,000 m of surface drilling is planned to test near-surface targets across the 5,720 hectare Young-Davidson Property.
Underground exploration drilling during the second quarter was focused on two targets with 2,912 m completed in three holes. The first target included one hole drilled from the 8960-level exploration drill bay established in the lower mine infrastructure tested to the east and down-plunge of existing Mineral Reserves and Resources. Drilling is targeting syenite-hosted mineralization as well as continuing to test mineralization in the footwall sediments and in the hanging wall mafic-ultramafic stratigraphy. A second underground drill completed two holes from the 9220 West exploration drift testing down-plunge of the existing Mineral Reserves and Resources.
A total of 4,476 m of surface exploration drilling was completed in seven holes, testing several near-surface regional targets.
Exploration spending totaled $2.9 million of which $1.3 million was capitalized in the second quarter 2022. For the first half of 2022, exploration spending totaled $5.5 million of which $2.3 million was capitalized.
Mulatos District (Sonora, Mexico)
The Company has a large exploration package covering 28,972 hectares with the majority of past exploration efforts focused around the Mulatos mine. Exploration continues to follow up on near-mine sulphide opportunities at Puerto del Aire, as well as several earlier stage prospects throughout the wider district.
During the second quarter of 2022, exploration activities continued at Puerto del Aire and the near-mine areas with 2,688 m of drilling completed in 11 holes. Drilling at Puerto del Aire in 2021 was successful in establishing a new underground Mineral Reserve at Mulatos, consisting of 0.4 million ounces of gold (2.8 mt grading 4.67 g/t Au) as at December 31, 2021. The focus in 2022 is on evaluating sulphide opportunities to expand this Mineral Reserve. The higher-grade ore from Puerto del Aire is expected to be processed through the existing mill at Mulatos. Ongoing exploration results will be incorporated into an updated development plan which is expected to be finalized over the next year.
Drilling was completed in the second quarter at the Carricito project with 2,064 m in 11 holes. At Refugio, 672 m of drilling was completed in four holes testing extensions to gold mineralization intersected in drilling completed in 2017. At Bajios, two drill holes were completed totaling 453 m. Drilling also continued at the Halcon West targets with seventeen drill holes completed in the second quarter totaling 4,448 m.
During the second quarter, the Company incurred $3.0 million of exploration spending of which $0.2 million was capitalized. For the first half of 2022, the Company incurred $4.6 million of exploration spending of which $0.2 million was capitalized.
Lynn Lake (Manitoba, Canada)
During the second quarter of 2022, 26 holes totaling 8,019 m were completed at the Gordon and MacLellan deposits, as well as several regional greenfield target areas.
In July, two drill rigs will move to the Tulune target area where Alamos Gold announced a greenfield discovery in 2021. A 3,192 line-km high resolution drone magnetic survey of the Tulune area was completed in the second quarter and the new geophysical information will be used in the design of targets for the third quarter. A summer field program consisting of geological mapping, prospecting and soil sampling that is designed to help advance a
22 | Alamos Gold Inc
TRADING SYMBOL: TSX:AGI NYSE:AGI
pipeline of prospective regional exploration targets to drill-ready stage was initiated in the second quarter, and will be ongoing through the third quarter.
Exploration spending totaled $2.4 million in the second quarter and $4.5 million year-to-date of which all was capitalized.
Review of Second Quarter Financial Results
During the second quarter of 2022, the Company sold 102,164 ounces of gold for revenues of $191.2 million, a 2% decrease from the prior year period driven by less ounces sold, partially offset by higher realized gold prices.
The average realized gold price in the second quarter was $1,871 per ounce, a 3% increase compared to $1,814 per ounce realized in the prior year period. The average realized gold price in the quarter was in line with the London PM Fix price.
Cost of sales (which includes mining and processing costs, royalties, and amortization expense) were $151.9 million in the second quarter, 20% higher than the prior year period.
Mining and processing costs were $89.2 million, 9% higher than the prior year period. The increase was primarily related to higher processing costs at Mulatos related to stockpiled ore.
Consolidated total cash costs of $895 per ounce and AISC of $1,170 per ounce in the quarter were both higher compared to the prior year period due to higher processing costs for stockpiled ore at Mulatos, partially offset by lower unit mining costs at Young-Davidson and a weaker Canadian dollar.
The Company assesses the net realizable value of inventory at each reporting period. Given the decrease in the gold price at the end of the second quarter, and higher costs at the Mulatos, the Company recorded a $22.3 million ($14.7 million after tax) reduction in the value of the heap leach inventory. This included $18.0 million related to mining and processing costs and $4.3 million related to amortization.
Royalty expense was $2.2 million in the quarter, lower than the prior year period of $3.0 million due to lower ounces sold in the period.
Amortization of $38.2 million in the quarter was lower than the prior year period due to less ounces sold. Amortization of $374 per ounce was lower than guidance, and is expected to increase slightly through future quarters.
The Company recognized earnings from operations of $25.7 million in the quarter, a significant increase from the prior year period as a result of the non-cash after-tax impairment charge on the Turkish projects of $213.8 million taken in the second quarter of 2021.
The Company reported net earnings of $6.4 million in the quarter, compared to a net loss of $172.5 million in the prior year period. The increase in net earnings from the prior year period is mainly driven by the non-cash impairment charge related to the Turkish projects in 2021. On an adjusted basis, earnings in the second quarter of 2022 were $29.3 million, or $0.07 per share, reflecting adjustments for the inventory net realizable value charge, as well as foreign exchange losses recorded within deferred taxes.
Associated Documents
This press release should be read in conjunction with the Company’s interim consolidated financial statements for the three-month period ended June 30, 2022 and associated Management’s Discussion and Analysis (“MD&A”), which are available from the Company's website, www.alamosgold.com, in the "Investors" section under "Reports and Financials", and on SEDAR (www.sedar.com) and EDGAR (www.sec.gov).
23 | Alamos Gold Inc
TRADING SYMBOL: TSX:AGI NYSE:AGI
Reminder of Second Quarter 2022 Results Conference Call
The Company's senior management will host a conference call on Thursday, July 28, 2022 at 10:00 am ET to discuss the results. Participants may join the conference call via webcast or through the following dial-in numbers:
Toronto and International: (416) 641-6104
Toll free (Canada and the United States): (800) 952-5114
Participant passcode: 4365144#
Webcast: www.alamosgold.com
A playback will be available until August 28, 2022 by dialling (905) 694-9451 or (800) 408-3053 within Canada and the United States. The pass code is 1053605#. The webcast will be archived at www.alamosgold.com.
Qualified Persons
Chris Bostwick, FAusIMM, Alamos’ Senior Vice President, Technical Services, who is a qualified person within the meaning of National Instrument 43-101 ("Qualified Person"), has reviewed and approved the scientific and technical information contained in this press release.
About Alamos
Alamos is a Canadian-based intermediate gold producer with diversified production from three operating mines in North America. This includes the Young-Davidson and Island Gold mines in northern Ontario, Canada and the Mulatos mine in Sonora State, Mexico. Additionally, the Company has a significant portfolio of development stage projects in Canada, Mexico, Türkiye, and the United States. Alamos employs more than 1,700 people and is committed to the highest standards of sustainable development. The Company’s shares are traded on the TSX and NYSE under the symbol “AGI”.
FOR FURTHER INFORMATION, PLEASE CONTACT:
Scott K. Parsons | |||||
Vice-President, Investor Relations | |||||
(416) 368-9932 x 5439 | |||||
The TSX and NYSE have not reviewed and do not accept responsibility for the adequacy or accuracy of this release.
Cautionary Note Regarding Forward-Looking Statements
This press release or incorporates by reference “forward-looking statements” and “forward-looking information” as defined under applicable Canadian and U.S. securities legislation. All statements, other than statements of historical fact, which address events, results, outcomes or developments that the Company expects to occur are, or may be deemed, to be, forward-looking statements. Forward-looking statements are generally, but not always, identified by the use of forward-looking terminology such as "expect", “assume”, “schedule”, "believe", "anticipate", "intend", "estimate", “potential”, "forecast", "budget", “target”, “on track”, “outlook”, “continue”, “plan” or variations of such words and phrases and similar expressions or statements that certain actions, events or results “may”, “could”, “would”, “might” or “will” be taken, occur or be achieved or the negative connotation of such terms.
Such statements include, but may not be limited to, expectations pertaining to: increases in free cash flow following the
completion of La Yaqui Grande; ramp up of stacking rates at La Yaqui Grande and corresponding increases to production and
decreases to costs; reductions in GHG emissions; increases to production and decreases to costs, including mine-site all-in
sustaining costs, resulting from intended completion of the Phase 3+ expansion at Island Gold; intended infrastructure
investments in, method of funding for, and timing of the completion of, the Phase 3+ expansion; approval of the Environmental
Impact Study for the Lynn Lake Gold Project and the intended release of an updated feasibility study and timing related thereto;
as well as other general information as to strategy, plans or future financial or operating performance, such as the Company’s expansion plans, project timelines, production plans and expected sustainable productivity increases, expected increases in
24 | Alamos Gold Inc
TRADING SYMBOL: TSX:AGI NYSE:AGI
mining activities and corresponding cost efficiencies, expected drilling targets, expected sustaining costs, expected improvements in cash flows and margins, expectations of changes in capital expenditures, forecasted cash shortfalls and the Company’s ability to fund them, cost estimates, projected exploration results, reserve and resource estimates, expected mine life, expected production rates and use of the stockpile inventory, expected recoveries, sufficiency of working capital for future commitments and other statements that express management’s expectations or estimates of future plans and performance.
Alamos cautions that forward-looking statements are necessarily based upon a number of factors and assumptions that, while considered reasonable by the Company at the time of making such statements, are inherently subject to significant business, economic, technical, legal, political and competitive uncertainties and contingencies. Known and unknown factors could cause actual results to differ materially from those projected in the forward-looking statements and undue reliance should not be placed on such statements and information.
Such factors and assumptions underlying the forward-looking statements in this document include, but are not limited to: changes to current estimates of mineral reserves and resources; changes to production estimates (which assume accuracy of projected ore grade, mining rates, recovery timing and recovery rate estimates which may be impacted by unscheduled maintenance, weather issues, labour and contractor availability and other operating or technical difficulties); operations may be exposed to new diseases, epidemics and pandemics, including the effects and potential effects of the global COVID-19 pandemic; the impact of the COVID-19 pandemic on the broader market and the trading price of the Company's shares; provincial and federal orders or mandates (including with respect to mining operations generally or auxiliary businesses or services required for the Company’s operations) in Canada, Mexico, the United States and Turkey; the duration of regulatory responses to the COVID-19 pandemic; government and the Company’s attempts to reduce the spread of COVID-19 which may affect many aspects of the Company's operations including the ability to transport personnel to and from site, contractor and supply availability and the ability to sell or deliver gold doré bars; fluctuations in the price of gold or certain other commodities such as, diesel fuel, natural gas, and electricity; changes in foreign exchange rates (particularly the Canadian Dollar, Mexican Peso, U.S. Dollar and Turkish Lira); the impact of inflation; changes in the Company's credit rating; any decision to declare a quarterly dividend; employee and community relations; litigation and administrative proceedings (including but not limited to the investment treaty claim announced on April 20, 2021 against the Republic of Turkey by the Company’s wholly-owned Netherlands subsidiaries, Alamos Gold Holdings Coöperatief U.A, and Alamos Gold Holdings B.V.); disruptions affecting operations; availability of and increased costs associated with mining inputs and labour; delays with the Phase 3+ expansion project at the Island Gold mine; delays in permitting, construction decisions and any development of the Lynn Lake project; the risk that the Company’s mines may not perform as planned; uncertainty with the Company’s ability to secure additional capital to execute its business plans; the speculative nature of mineral exploration and development, including the risks of obtaining and maintaining necessary licenses and permits, including the necessary licenses, permits, authorizations and/or approvals from the appropriate regulatory authorities for the Company’s development stage and operating assets; labour and contractor availability (and being able to secure the same on favourable terms); contests over title to properties; expropriation or nationalization of property; inherent risks and hazards associated with mining and mineral processing including environmental hazards, industrial hazards, industrial accidents, unusual or unexpected formations, pressures and cave-ins; changes in national and local government legislation (including tax and employment legislation), controls or regulations in Canada, Mexico, Turkey, the United States and other jurisdictions in which the Company does or may carry on business in the future; increased costs and risks related to the potential impact of climate change; failure to comply with environmental and health and safety laws and regulations; disruptions in the maintenance or provision of required infrastructure and information technology systems; risk of loss due to sabotage, protests and other civil disturbances; the impact of global liquidity and credit availability and the values of assets and liabilities based on projected future cash flows; risks arising from holding derivative instruments; and business opportunities that may be pursued by the Company. The litigation against the Republic of Turkey, described above, results from the actions of the Turkish government in respect of the Company’s projects in the Republic of Turkey. Such litigation is a mitigation effort and may not be effective or successful. If unsuccessful, the Company’s projects in Turkey may be subject to resource nationalism and further expropriation; the Company may lose any remaining value of its assets and gold mining projects in Turkey and its ability to operate in Turkey. Even if successful, there is no certainty as to the quantum of any damages award or recovery of all, or any, legal costs. Any resumption of activities in Turkey, or even retaining control of its assets and gold mining projects in Turkey can only result from agreement with the Turkish government. The investment treaty claim described in this press release may have an impact on foreign direct investment in the Republic of Turkey which may result in changes to the Turkish economy, including but not limited to high rates of inflation and fluctuation of the Turkish Lira which may also affect the Company’s relationship with the Turkish government, the Company’s ability to effectively operate in Turkey, and which may have a negative effect on overall anticipated project values.
Additional risk factors and details with respect to risk factors affecting that may affect the Company’s ability to achieve the expectations set forth in the forward-looking statements contained in this press release are set out in the Company's latest 40-F/Annual Information Form for the year ended December 31, 2021 under the heading “Risk Factors”, which is available on the
25 | Alamos Gold Inc
TRADING SYMBOL: TSX:AGI NYSE:AGI
SEDAR website at www.sedar.com or on EDGAR at www.sec.gov. The foregoing should be reviewed in conjunction with the information, risk factors and assumptions found in this press release.
The Company disclaims any intention or obligation to update or revise any forward-looking statements whether as a result of new information, future events or otherwise, except as required by applicable law.
Cautionary Note to U.S. Investors Concerning Measured, Indicated and Inferred Resources
Measured, Indicated and Inferred Resources: All resource and reserve estimates included in this press release or documents referenced in this press release have been prepared in accordance with Canadian National Instrument 43-101 - Standards of Disclosure for Mineral Projects ("NI 43-101") and the Canadian Institute of Mining, Metallurgy and Petroleum (the "CIM") - CIM Definition Standards on Mineral Resources and Mineral Reserves, adopted by the CIM Council, as amended (the "CIM Standards"). NI 43-101 is a rule developed by the Canadian Securities Administrators, which established standards for all public disclosure an issuer makes of scientific and technical information concerning mineral projects. . Mining disclosure in the United States was previously required to comply with SEC Industry Guide 7 (“SEC Industry Guide 7”) under the United States Securities Exchange Act of 1934, as amended. The U.S. Securities and Exchange Commission (the “SEC”) has adopted final rules, to replace SEC Industry Guide 7 with new mining disclosure rules under sub-part 1300 of Regulation S-K of the U.S. Securities Act (“Regulation S-K 1300”) which became mandatory for U.S. reporting companies beginning with the first fiscal year commencing on or after January 1, 2021. Under Regulation S-K 1300, the SEC now recognizes estimates of “Measured Mineral Resources”, “Indicated Mineral Resources” and “Inferred Mineral Resources”. In addition, the SEC has amended its definitions of “Proven Mineral Reserves” and “Probable Mineral Reserves” to be substantially similar to international standards.
Investors are cautioned that while the above terms are “substantially similar” to CIM Definitions, there are differences in the definitions under Regulation S-K 1300 and the CIM Standards. Accordingly, there is no assurance any mineral reserves or mineral resources that the Company may report as “proven mineral reserves”, “probable mineral reserves”, “measured mineral resources”, “indicated mineral resources” and “inferred mineral resources” under NI 43-101 would be the same had the Company prepared the mineral reserve or mineral resource estimates under the standards adopted under Regulation S-K 1300. U.S. investors are also cautioned that while the SEC recognizes “measured mineral resources”, “indicated mineral resources” and “inferred mineral resources” under Regulation S-K 1300, investors should not assume that any part or all of the mineralization in these categories will ever be converted into a higher category of mineral resources or into mineral reserves. Mineralization described using these terms has a greater degree of uncertainty as to its existence and feasibility than mineralization that has been characterized as reserves. Accordingly, investors are cautioned not to assume that any measured mineral resources, indicated mineral resources, or inferred mineral resources that the Company reports are or will be economically or legally mineable.
International Financial Reporting Standards: The condensed consolidated financial statements of the Company have been prepared by management in accordance with International Financial Reporting Standard 34, Interim Financial Reporting, as issued by the International Accounting Standards Board. These accounting principles differ in certain material respects from accounting principles generally accepted in the United States of America. The Company’s reporting currency is the United States dollar unless otherwise noted.
Non-GAAP Measures and Additional GAAP Measures
The Company has included certain non-GAAP financial measures to supplement its Consolidated Financial Statements, which are presented in accordance with IFRS, including the following:
•adjusted net earnings and adjusted earnings per share;
•cash flow from operating activities before changes in working capital and taxes received;
•company-wide free cash flow;
•total mine-site free cash flow;
•mine-site free cash flow;
•net cash;
•total cash cost per ounce of gold sold;
•all-in sustaining cost ("AISC") per ounce of gold sold;
26 | Alamos Gold Inc
•mine-site all-in sustaining cost ("Mine-site AISC") per ounce of gold sold;
•sustaining and non-sustaining capital expenditures; and
•earnings before interest, taxes, depreciation, and amortization
The Company believes that these measures, together with measures determined in accordance with IFRS, provide investors with an improved ability to evaluate the underlying performance of the Company. Non-GAAP financial measures do not have any standardized meaning prescribed under IFRS, and therefore they may not be comparable to similar measures employed by other companies. The data is intended to provide additional information and should not be considered in isolation or as a substitute for measures of performance prepared in accordance with IFRS. Management's determination of the components of non-GAAP and additional measures are evaluated on a periodic basis influenced by new items and transactions, a review of investor uses and new regulations as applicable. Any changes to the measures are dully noted and retrospectively applied as applicable.
Adjusted Net Earnings and Adjusted Earnings per Share
“Adjusted net earnings” and “adjusted earnings per share” are non-GAAP financial measures with no standard meaning under IFRS which exclude the following from net earnings:
•Foreign exchange gain (loss)
•Items included in other gain (loss)
•Certain non-reoccurring items
•Foreign exchange gain (loss) recorded in deferred tax expense
•The income and mining tax impact of items included in other gain (loss)
Net earnings have been adjusted, including the associated tax impact, for the group of costs in “other loss” on the consolidated statement of comprehensive income. Transactions within this grouping are: the fair value changes on non-hedged derivatives; the renunciation of flow-through exploration expenditures; loss on disposal of assets; severance costs related to Turkish Projects; and Turkish Projects holding costs and arbitration costs. The adjusted entries are also impacted for tax to the extent that the underlying entries are impacted for tax in the unadjusted net earnings.
The Company uses adjusted net earnings for its own internal purposes. Management’s internal budgets and forecasts and public guidance do not reflect the items which have been excluded from the determination of adjusted net earnings. Consequently, the presentation of adjusted net earnings enables shareholders to better understand the underlying operating performance of the core mining business through the eyes of management. Management periodically evaluates the components of adjusted net earnings based on an internal assessment of performance measures that are useful for evaluating the operating performance of our business and a review of the non-GAAP measures used by mining industry analysts and other mining companies.
Adjusted net earnings is intended to provide additional information only and does not have any standardized meaning under IFRS and may not be comparable to similar measures presented by other companies. It should not be considered in isolation or as a substitute for measures of performance prepared in accordance with IFRS. The measure is not necessarily indicative of operating profit or cash flows from operations as determined under IFRS. The following table reconciles this non-GAAP measure to the most directly comparable IFRS measure.
| (in millions) | ||||||||||||||
| Three Months Ended June 30, | Six Months Ended June 30, | |||||||||||||
| 2022 | 2021 | 2022 | 2021 | |||||||||||
| Net earnings (loss) | $6.4 | ($172.5) | ($2.1) | ($121.3) | ||||||||||
| Adjustments: | ||||||||||||||
| Inventory net realizable value adjustment, net of taxes | 14.7 | — | 14.7 | — | ||||||||||
| Impairment charge, net of taxes | — | 213.8 | 26.7 | 213.8 | ||||||||||
| Foreign exchange gain | (0.4) | (0.5) | (0.4) | (0.3) | ||||||||||
| Other (gain) loss | (5.4) | 3.7 | 2.0 | 3.7 | ||||||||||
| Unrealized foreign exchange loss (gain) recorded in deferred tax expense | 12.9 | (5.5) | 7.1 | (8.0) | ||||||||||
| Other income tax and mining tax adjustments | 1.1 | (0.3) | (0.7) | (0.1) | ||||||||||
| Adjusted net earnings | $29.3 | $38.7 | $47.3 | $87.8 | ||||||||||
| Adjusted earnings per share - basic and diluted | $0.07 | $0.10 | $0.12 | $0.22 | ||||||||||
27 | Alamos Gold Inc
Cash Flow from Operating Activities before Changes in Working Capital and Cash Taxes
“Cash flow from operating activities before changes in working capital and cash taxes” is a non-GAAP performance measure that could provide an indication of the Company’s ability to generate cash flows from operations, and is calculated by adding back the change in working capital and taxes received to “Cash provided by (used in) operating activities” as presented on the Company’s consolidated statements of cash flows. “Cash flow from operating activities before changes in working capital” is a non-GAAP financial measure with no standard meaning under IFRS.
The following table reconciles the non-GAAP measure to the consolidated statements of cash flows.
| (in millions) | ||||||||||||||
| Three Months Ended June 30, | Six Months Ended June 30, | |||||||||||||
| 2022 | 2021 | 2022 | 2021 | |||||||||||
| Cash flow from operating activities | $75.7 | $86.7 | $122.2 | $186.0 | ||||||||||
| Add: Changes in working capital and cash taxes | 9.6 | 10.5 | 34.0 | 30.8 | ||||||||||
| Cash flow from operating activities before changes in working capital and cash taxes | $85.3 | $97.2 | $156.2 | $216.8 | ||||||||||
Company-wide Free Cash Flow
“Company-wide free cash flow" is a non-GAAP performance measure calculated from the consolidated operating cash flow, less consolidated mineral property, plant and equipment expenditures. The Company believes this to be a useful indicator of our ability to operate without reliance on additional borrowing or usage of existing cash company-wide. Company-wide free cash flow is intended to provide additional information only and does not have any standardized meaning under IFRS and may not be comparable to similar measures of performance presented by other mining companies. Company-wide free cash flow should not be considered in isolation or as a substitute for measures of performance prepared in accordance with IFRS.
| (in millions) | ||||||||||||||
| Three Months Ended June 30, | Six Months Ended June 30, | |||||||||||||
| 2022 | 2021 | 2022 | 2021 | |||||||||||
| Cash flow from operating activities | $75.7 | $86.7 | $122.2 | $186.0 | ||||||||||
| Less: mineral property, plant and equipment expenditures | (69.0) | (83.5) | (156.3) | (156.1) | ||||||||||
| Less: capital advances | — | (3.4) | — | (20.2) | ||||||||||
| Company-wide free cash flow | $6.7 | ($0.2) | ($34.1) | $9.7 | ||||||||||
Mine-site Free Cash Flow
"Mine-site free cash flow" is a non-GAAP financial performance measure calculated as cash flow from mine-site operating activities, less mineral property, plant and equipment expenditures. The Company believes this to be a useful indicator of our ability to operate without reliance on additional borrowing or usage of existing cash. Mine-site free cash flow is intended to provide additional information only and does not have any standardized meaning under IFRS and may not be comparable to similar measures of performance presented by other mining companies. Mine-site free cash flow should not be considered in isolation or as a substitute for measures of performance prepared in accordance with IFRS.
| Total Mine-Site Free Cash Flow | ||||||||||||||
| Three Months Ended June 30, | Six Months Ended June 30, | |||||||||||||
| 2022 | 2021 | 2022 | 2021 | |||||||||||
| (in millions) | ||||||||||||||
| Cash flow from operating activities | $75.7 | $86.7 | $122.2 | $186.0 | ||||||||||
| Add: operating cash flow used by non-mine site activity | 9.0 | 13.8 | 24.4 | 24.1 | ||||||||||
| Cash flow from operating mine-sites | $84.7 | $100.5 | $146.6 | $210.1 | ||||||||||
| Mineral property, plant and equipment expenditure | $69.0 | $83.5 | $156.3 | $156.1 | ||||||||||
| Capital advances | — | 3.4 | — | 20.2 | ||||||||||
| Less: capital expenditures from development projects, and corporate | (5.3) | ($6.5) | (10.5) | (11.0) | ||||||||||
| Capital expenditure and capital advances from mine-sites | $63.7 | $80.4 | $145.8 | $165.3 | ||||||||||
| Total mine-site free cash flow | $21.0 | $20.1 | $0.8 | $44.8 | ||||||||||
28 | Alamos Gold Inc
| Young-Davidson Mine-Site Free Cash Flow | ||||||||||||||
| Three Months Ended June 30, | Six Months Ended June 30, | |||||||||||||
| 2022 | 2021 | 2022 | 2021 | |||||||||||
| (in millions) | ||||||||||||||
| Cash flow from operating activities | $43.9 | $38.3 | $89.8 | $82.5 | ||||||||||
| Mineral property, plant and equipment expenditure | (13.1) | (19.6) | (35.8) | (41.5) | ||||||||||
| Mine-site free cash flow | $30.8 | $18.7 | $54.0 | $41.0 | ||||||||||
| Island Gold Mine-Site Free Cash Flow | ||||||||||||||
| Three Months Ended June 30, | Six Months Ended June 30, | |||||||||||||
| 2022 | 2021 | 2022 | 2021 | |||||||||||
| (in millions) | ||||||||||||||
| Cash flow from operating activities | $49.5 | $42.9 | $76.9 | $98.4 | ||||||||||
| Mineral property, plant and equipment expenditure | (29.3) | (29.2) | (62.7) | (58.7) | ||||||||||
| Mine-site free cash flow | $20.2 | $13.7 | $14.2 | $39.7 | ||||||||||
(1)Includes capital advances of nil and $1.4 million for the three and six months ended June 30, 2022 ($0.7 million and $2.8 million for the three and six months ended June 30, 2021).
| Mulatos District Free Cash Flow | ||||||||||||||
| Three Months Ended June 30, | Six Months Ended June 30, | |||||||||||||
| 2022 | 2021 | 2022 | 2021 | |||||||||||
| (in millions) | ||||||||||||||
| Cash flow from operating activities | ($8.7) | $19.3 | ($20.1) | $29.2 | ||||||||||
| Mineral property, plant and equipment expenditure | (21.3) | (31.6) | (47.3) | (65.1) | ||||||||||
| Mine-site free cash flow | ($30.0) | ($12.3) | ($67.4) | ($35.9) | ||||||||||
(1)Includes a drawdown of capital advances of $1.4 million for the three and six months ended June 30, 2022 ($2.7 million and $17.4 million of advances for the three and six months ended June 30, 2021).
Net Cash
The Company defines net cash as cash and cash equivalents less long-term debt.
Total Cash Costs per ounce
Total cash costs per ounce is a non-GAAP term typically used by gold mining companies to assess the level of gross margin available to the Company by subtracting these costs from the unit price realized during the period. This non-GAAP term is also used to assess the ability of a mining company to generate cash flow from operations. Total cash costs per ounce includes mining and processing costs plus applicable royalties, and net of by-product revenue and net realizable value adjustments. This metric excludes COVID-19 costs incurred in the period. Total cash costs per ounce is exclusive of exploration costs.
Total cash costs per ounce is intended to provide additional information only and does not have any standardized meaning under IFRS and may not be comparable to similar measures presented by other mining companies. It should not be considered in isolation or as a substitute for measures of performance prepared in accordance with IFRS. The measure is not necessarily indicative of cash flow from operations under IFRS or operating costs presented under IFRS.
All-in Sustaining Costs per ounce and Mine-site All-in Sustaining Costs
The Company adopted an “all-in sustaining costs per ounce” non-GAAP performance measure in accordance with the World Gold Council published in June 2013. The Company believes the measure more fully defines the total costs associated with producing gold; however, this performance measure has no standardized meaning. Accordingly, there may be some variation in the method of computation of “all-in sustaining costs per ounce” as determined by the Company compared with other mining companies. In this context, “all-in sustaining costs per ounce” for the consolidated Company reflects total mining and processing costs, corporate and administrative costs, share-based compensation, exploration costs, sustaining capital, and other operating costs.
For the purposes of calculating "mine-site all-in sustaining costs" at the individual mine-sites, the Company does not include an allocation of corporate and administrative costs and share-based compensation, as detailed in the reconciliations below.
29 | Alamos Gold Inc
Sustaining capital expenditures are expenditures that do not increase annual gold ounce production at a mine site and excludes all expenditures at the Company’s development projects as well as certain expenditures at the Company’s operating sites that are deemed expansionary in nature. For each mine-site reconciliation, corporate and administrative costs, and non-site specific costs are not included in the all-in sustaining cost per ounce calculation.
All-in sustaining costs per gold ounce is intended to provide additional information only and does not have any standardized meaning under IFRS and may not be comparable to similar measures presented by other mining companies. It should not be considered in isolation or as a substitute for measures of performance prepared in accordance with IFRS.
The measure is not necessarily indicative of cash flow from operations under IFRS or operating costs presented under IFRS.
Total Cash Costs and All-in Sustaining Costs per Ounce Reconciliation Tables
The following tables reconciles these non-GAAP measures to the most directly comparable IFRS measures on a Company-wide and individual mine-site basis.
| Total Cash Costs and AISC Reconciliation - Company-wide | ||||||||||||||
| Three Months Ended June 30, | Six Months Ended June 30, | |||||||||||||
| 2022 | 2021 | 2022 | 2021 | |||||||||||
| (in millions, except ounces and per ounce figures) | ||||||||||||||
| Mining and processing | $89.2 | $82.1 | $184.6 | $174.8 | ||||||||||
| Royalties | 2.2 | 3.0 | 4.5 | 6.1 | ||||||||||
| Total cash costs | 91.4 | 85.1 | 189.1 | 180.9 | ||||||||||
| Gold ounces sold | 102,164 | 107,581 | 200,630 | 234,063 | ||||||||||
| Total cash costs per ounce | $895 | $791 | $943 | $773 | ||||||||||
| Total cash costs | $91.4 | $85.1 | $189.1 | $180.9 | ||||||||||
Corporate and administrative(1) | 6.2 | 6.3 | 12.3 | 12.4 | ||||||||||
Sustaining capital expenditures(2) | 20.1 | 26.7 | 42.7 | 50.3 | ||||||||||
| Share-based compensation | 0.4 | 2.3 | 6.7 | 5.1 | ||||||||||
| Sustaining exploration | 0.6 | 1.2 | 1.3 | 2.5 | ||||||||||
| Accretion of decommissioning liabilities | 0.8 | 0.6 | 1.4 | 1.3 | ||||||||||
| Total all-in sustaining costs | $119.5 | $122.2 | $253.5 | $252.5 | ||||||||||
| Gold ounces sold | 102,164 | 107,581 | 200,630 | 234,063 | ||||||||||
| All-in sustaining costs per ounce | $1,170 | $1,136 | $1,264 | $1,079 | ||||||||||
(1)Corporate and administrative expenses exclude expenses incurred at development properties.
(2)Sustaining capital expenditures are defined as those expenditures which do not increase annual gold ounce production at a mine site and exclude all expenditures at growth projects and certain expenditures at operating sites which are deemed expansionary in nature. Total sustaining capital for the period is as follows:
Three Months Ended June 30, | Six Months Ended June 30, | |||||||||||||
| 2022 | 2021 | 2022 | 2021 | |||||||||||
| (in millions) | ||||||||||||||
| Capital expenditures per cash flow statement | $69.0 | $83.5 | $156.3 | $156.1 | ||||||||||
| Less: non-sustaining capital expenditures at: | ||||||||||||||
| Young-Davidson | (2.9) | (9.8) | (15.2) | (22.2) | ||||||||||
| Island Gold | (19.8) | (17.5) | (45.4) | (34.3) | ||||||||||
| Mulatos District | (20.9) | (23.0) | (42.5) | (38.3) | ||||||||||
| Corporate and other | (5.3) | (6.5) | (10.5) | (11.0) | ||||||||||
| Sustaining capital expenditures | $20.1 | $26.7 | $42.7 | $50.3 | ||||||||||
30 | Alamos Gold Inc
| Young-Davidson Total Cash Costs and Mine-site AISC Reconciliation | ||||||||||||||
| Three Months Ended June 30, | Six Months Ended June 30, | |||||||||||||
| 2022 | 2021 | 2022 | 2021 | |||||||||||
| (in millions, except ounces and per ounce figures) | ||||||||||||||
| Mining and processing | $39.1 | $41.1 | $80.8 | $81.7 | ||||||||||
| Royalties | 1.3 | 1.5 | 2.9 | 2.8 | ||||||||||
| Total cash costs | $40.4 | $42.6 | $83.7 | $84.5 | ||||||||||
| Gold ounces sold | 46,662 | 45,284 | 98,187 | 93,306 | ||||||||||
| Total cash costs per ounce | $866 | $941 | $852 | $906 | ||||||||||
| Total cash costs | $40.4 | $42.6 | $83.7 | $84.5 | ||||||||||
| Sustaining capital expenditures | 10.2 | 9.8 | 20.6 | 19.3 | ||||||||||
| Accretion of decommissioning liabilities | 0.1 | — | 0.2 | 0.2 | ||||||||||
| Total all-in sustaining costs | $50.7 | $52.4 | $104.5 | $104.0 | ||||||||||
| Gold ounces sold | 46,662 | 45,284 | 98,187 | 93,306 | ||||||||||
| Mine-site all-in sustaining costs per ounce | $1,087 | $1,157 | $1,064 | $1,115 | ||||||||||
| Island Gold Total Cash Costs and Mine-site AISC Reconciliation | ||||||||||||||
| Three Months Ended June 30, | Six Months Ended June 30, | |||||||||||||
| 2022 | 2021 | 2022 | 2021 | |||||||||||
| (in millions, except ounces and per ounce figures) | ||||||||||||||
| Mining and processing | $21.0 | $15.6 | $37.9 | $32.8 | ||||||||||
| Royalties | 0.7 | 1.3 | 1.2 | 2.7 | ||||||||||
| Total cash costs | $21.7 | $16.9 | $39.1 | $35.5 | ||||||||||
| Gold ounces sold | 36,797 | 33,632 | 60,165 | 73,514 | ||||||||||
| Total cash costs per ounce | $590 | $502 | $650 | $483 | ||||||||||
| Total cash costs | $21.7 | $16.9 | $39.1 | $35.5 | ||||||||||
| Sustaining capital expenditures | 9.5 | 11.0 | 17.3 | 21.6 | ||||||||||
| Accretion of decommissioning liabilities | — | — | 0.1 | — | ||||||||||
| Total all-in sustaining costs | $31.2 | $27.9 | $56.5 | $57.1 | ||||||||||
| Gold ounces sold | 36,797 | 33,632 | 60,165 | 73,514 | ||||||||||
| Mine-site all-in sustaining costs per ounce | $848 | $830 | $939 | $777 | ||||||||||
| Mulatos District Total Cash Costs and Mine-site AISC Reconciliation | ||||||||||||||
| Three Months Ended June 30, | Six Months Ended June 30, | |||||||||||||
| 2022 | 2021 | 2022 | 2021 | |||||||||||
| (in millions, except ounces and per ounce figures) | ||||||||||||||
| Mining and processing | $29.1 | $25.4 | $65.9 | $60.3 | ||||||||||
| Royalties | 0.2 | 0.2 | 0.4 | 0.6 | ||||||||||
| Total cash costs | $29.3 | $25.6 | $66.3 | $60.9 | ||||||||||
| Gold ounces sold | 18,705 | 28,665 | 42,278 | 67,243 | ||||||||||
| Total cash costs per ounce | $1,566 | $893 | $1,568 | $906 | ||||||||||
| Total cash costs | $29.3 | $25.6 | $66.3 | $60.9 | ||||||||||
| Sustaining capital expenditures | 0.4 | 5.9 | 4.8 | 9.4 | ||||||||||
| Sustaining exploration | 0.2 | 0.7 | 0.4 | 1.5 | ||||||||||
| Accretion of decommissioning liabilities | 0.7 | 0.6 | 1.1 | 1.1 | ||||||||||
| Total all-in sustaining costs | $30.6 | $32.8 | $72.6 | $72.9 | ||||||||||
| Gold ounces sold | 18,705 | 28,665 | 42,278 | 67,243 | ||||||||||
| Mine-site all-in sustaining costs per ounce | $1,636 | $1,144 | $1,717 | $1,084 | ||||||||||
31 | Alamos Gold Inc
Earnings Before Interest, Taxes, Depreciation, and Amortization (“EBITDA”)
EBITDA represents net earnings before interest, taxes, depreciation, and amortization. EBITDA is an indicator of the Company’s ability to generate liquidity by producing operating cash flow to fund working capital needs, service debt obligations, and fund capital expenditures.
EBITDA does not have any standardized meaning under IFRS and may not be comparable to similar measures presented by other mining companies. It should not be considered in isolation or as a substitute for measures of performance prepared in accordance with IFRS.
The following is a reconciliation of EBITDA to the consolidated financial statements:
| (in millions) | ||||||||||||||
| Three Months Ended June 30, | Six Months Ended June 30, | |||||||||||||
| 2022 | 2021 | 2022 | 2021 | |||||||||||
| Net earnings (loss) | $6.4 | ($172.5) | ($2.1) | ($121.3) | ||||||||||
| Add back: | ||||||||||||||
| Inventory net realizable value adjustment | 22.3 | — | 22.3 | — | ||||||||||
| Impairment charge | — | 224.3 | 38.2 | 224.3 | ||||||||||
| Finance expense | 1.3 | 1.0 | 2.5 | 2.0 | ||||||||||
| Amortization | 38.2 | 41.8 | 76.0 | 85.3 | ||||||||||
| Deferred income tax (recovery) expense | 23.5 | (2.9) | 17.0 | 15.1 | ||||||||||
| Current income tax expense | 0.3 | 2.7 | 1.0 | 8.6 | ||||||||||
| EBITDA | $92.0 | $94.4 | $154.9 | $214.0 | ||||||||||
Additional GAAP Measures
Additional GAAP measures are presented on the face of the Company’s consolidated statements of comprehensive income (loss) and are not meant to be a substitute for other subtotals or totals presented in accordance with IFRS, but rather should be evaluated in conjunction with such IFRS measures. The following additional GAAP measures are used and are intended to provide an indication of the Company’s mine and operating performance:
•Earnings from operations - represents the amount of earnings before net finance income/expense, foreign exchange gain/loss, other income/loss, loss on redemption of senior secured notes and income tax expense
32 | Alamos Gold Inc
Unaudited Consolidated Statements of Financial Position, Comprehensive
Income, and Cash Flow
ALAMOS GOLD INC.
Consolidated Statements of Financial Position
(Unaudited - stated in millions of United States dollars)
| June 30, 2022 | December 31, 2021 | ||||||||||
| A S S E T S | |||||||||||
| Current Assets | |||||||||||
| Cash and cash equivalents | $121.5 | $172.5 | |||||||||
| Equity securities | 22.5 | 23.9 | |||||||||
| Amounts receivable | 24.2 | 31.1 | |||||||||
| Income taxes receivable | 9.3 | 8.7 | |||||||||
| Inventory | 217.3 | 199.0 | |||||||||
| Other current assets | 21.5 | 24.2 | |||||||||
| Total Current Assets | 416.3 | 459.4 | |||||||||
| Non-Current Assets | |||||||||||
| Long-term inventory | 7.3 | 10.6 | |||||||||
| Mineral property, plant and equipment | 3,097.5 | 3,108.5 | |||||||||
| Other non-current assets | 64.7 | 43.0 | |||||||||
| Total Assets | $3,585.8 | $3,621.5 | |||||||||
| L I A B I L I T I E S | |||||||||||
| Current Liabilities | |||||||||||
| Accounts payable and accrued liabilities | $156.0 | $157.4 | |||||||||
| Total Current Liabilities | 156.0 | 157.4 | |||||||||
| Non-Current Liabilities | |||||||||||
| Deferred income taxes | 623.6 | 623.2 | |||||||||
| Decommissioning liabilities | 103.6 | 102.8 | |||||||||
| Other non-current liabilities | 2.5 | 2.5 | |||||||||
| Total Liabilities | 885.7 | 885.9 | |||||||||
| E Q U I T Y | |||||||||||
| Share capital | $3,689.3 | $3,692.9 | |||||||||
| Contributed surplus | 90.1 | 89.5 | |||||||||
| Accumulated other comprehensive income | (11.2) | 1.9 | |||||||||
| Deficit | (1,068.1) | (1,048.7) | |||||||||
| Total Equity | 2,700.1 | 2,735.6 | |||||||||
| Total Liabilities and Equity | $3,585.8 | $3,621.5 | |||||||||
33 | Alamos Gold Inc
ALAMOS GOLD INC.
Consolidated Statements of Comprehensive Income (Loss)
(Unaudited - stated in millions of United States dollars, except share and per share amounts)
| For three months ended | For six months ended | ||||||||||||||||||||||
| June 30, | June 30, | June 30, | June 30, | ||||||||||||||||||||
| 2022 | 2021 | 2022 | 2021 | ||||||||||||||||||||
| OPERATING REVENUES | $191.2 | $195.1 | $375.7 | $422.5 | |||||||||||||||||||
| COST OF SALES | |||||||||||||||||||||||
| Mining and processing | 89.2 | 82.1 | 184.6 | 174.8 | |||||||||||||||||||
| Inventory net realizable value adjustment | 22.3 | — | 22.3 | — | |||||||||||||||||||
| Royalties | 2.2 | 3.0 | 4.5 | 6.1 | |||||||||||||||||||
| Amortization | 38.2 | 41.8 | 76.0 | 85.3 | |||||||||||||||||||
| 151.9 | 126.9 | 287.4 | 266.2 | ||||||||||||||||||||
| EXPENSES | |||||||||||||||||||||||
| Exploration | 7.0 | 3.8 | 11.1 | 6.7 | |||||||||||||||||||
| Corporate and administrative | 6.2 | 6.3 | 12.3 | 12.4 | |||||||||||||||||||
| Share-based compensation | 0.4 | 2.3 | 6.7 | 5.1 | |||||||||||||||||||
| Impairment charge | — | 224.3 | 38.2 | 224.3 | |||||||||||||||||||
| 165.5 | 363.6 | 355.7 | 514.7 | ||||||||||||||||||||
| EARNINGS (LOSS) BEFORE INCOME TAXES | 25.7 | (168.5) | 20.0 | (92.2) | |||||||||||||||||||
| OTHER EXPENSES | |||||||||||||||||||||||
| Finance expense | (1.3) | (1.0) | (2.5) | (2.0) | |||||||||||||||||||
| Foreign exchange gain | 0.4 | 0.5 | 0.4 | 0.3 | |||||||||||||||||||
| Other gain (loss) | 5.4 | (3.7) | (2.0) | (3.7) | |||||||||||||||||||
| EARNINGS (LOSS) FROM OPERATIONS | $30.2 | ($172.7) | $15.9 | ($97.6) | |||||||||||||||||||
| INCOME TAXES | |||||||||||||||||||||||
| Current income tax expense | (0.3) | (2.7) | (1.0) | (8.6) | |||||||||||||||||||
| Deferred income tax expense | (23.5) | 2.9 | (17.0) | (15.1) | |||||||||||||||||||
| NET EARNINGS (LOSS) | $6.4 | ($172.5) | ($2.1) | ($121.3) | |||||||||||||||||||
| Items that may be subsequently reclassified to net earnings: | |||||||||||||||||||||||
| Net change in fair value of currency hedging instruments, net of taxes | 4.3 | (0.6) | (1.1) | (1.7) | |||||||||||||||||||
| Net change in fair value of fuel hedging instruments, net of taxes | 0.1 | 0.2 | 1.0 | 0.4 | |||||||||||||||||||
| Items that will not be reclassified to net earnings: | |||||||||||||||||||||||
| Unrealized loss on equity securities, net of taxes | (10.5) | (0.7) | (13.0) | (0.5) | |||||||||||||||||||
| Total other comprehensive loss | ($6.1) | ($1.1) | ($13.1) | ($1.8) | |||||||||||||||||||
| COMPREHENSIVE INCOME (LOSS) | $0.3 | ($173.6) | ($15.2) | ($123.1) | |||||||||||||||||||
| EARNINGS (LOSS) PER SHARE | |||||||||||||||||||||||
| – basic | $0.02 | ($0.44) | ($0.01) | ($0.31) | |||||||||||||||||||
| – diluted | $0.02 | ($0.44) | ($0.01) | ($0.31) | |||||||||||||||||||
| Weighted average number of common shares outstanding (000's) | |||||||||||||||||||||||
| – basic | 391,761 | 392,759 | 391,837 | 392,762 | |||||||||||||||||||
| – diluted | 394,540 | 392,759 | 391,837 | 392,762 | |||||||||||||||||||
34 | Alamos Gold Inc
ALAMOS GOLD INC.
Consolidated Statements of Cash Flows
(Unaudited - stated in millions of United States dollars)
| For three months ended | For six months ended | ||||||||||||||||||||||
| June 30, | June 30, | June 30, | June 30, | ||||||||||||||||||||
| 2022 | 2021 | 2022 | 2021 | ||||||||||||||||||||
| CASH PROVIDED BY (USED IN): | |||||||||||||||||||||||
| OPERATING ACTIVITIES | |||||||||||||||||||||||
| Net earnings (loss) for the period | $6.4 | ($172.5) | ($2.1) | ($121.3) | |||||||||||||||||||
| Adjustments for items not involving cash: | |||||||||||||||||||||||
| Amortization | 38.2 | 41.8 | 76.0 | 85.3 | |||||||||||||||||||
| Impairment charge | — | 224.3 | 38.2 | 224.3 | |||||||||||||||||||
| Inventory net realizable value adjustment | 22.3 | — | 22.3 | — | |||||||||||||||||||
| Foreign exchange gain | (0.4) | (0.5) | (0.4) | (0.3) | |||||||||||||||||||
| Current income tax expense | 0.3 | 2.7 | 1.0 | 8.6 | |||||||||||||||||||
| Deferred income tax expense (recovery) | 23.5 | (2.9) | 17.0 | 15.1 | |||||||||||||||||||
| Share-based compensation | 0.4 | 2.3 | 6.7 | 5.1 | |||||||||||||||||||
| Finance expense | 1.3 | 1.0 | 2.5 | 2.0 | |||||||||||||||||||
| Other items | (6.7) | 1.0 | (5.0) | (2.0) | |||||||||||||||||||
| Changes in working capital and taxes paid | (9.6) | (10.5) | (34.0) | (30.8) | |||||||||||||||||||
| 75.7 | 86.7 | 122.2 | 186.0 | ||||||||||||||||||||
| INVESTING ACTIVITIES | |||||||||||||||||||||||
| Mineral property, plant and equipment | (69.0) | (83.5) | (156.3) | (156.1) | |||||||||||||||||||
| Capital advances | — | (3.4) | — | (20.2) | |||||||||||||||||||
| Proceeds from sale of Esperanza Project | 5.0 | — | 5.0 | — | |||||||||||||||||||
| Proceeds from disposition of equity securities | — | 5.1 | — | 25.8 | |||||||||||||||||||
| Investment in equity securities | (2.7) | (1.2) | (2.7) | (4.3) | |||||||||||||||||||
| (66.7) | (83.0) | (154.0) | (154.8) | ||||||||||||||||||||
| FINANCING ACTIVITIES | |||||||||||||||||||||||
| Dividends paid | (8.9) | (8.6) | (17.6) | (17.2) | |||||||||||||||||||
| Repurchase and cancellation of common shares | (8.2) | — | (8.2) | (1.5) | |||||||||||||||||||
| Proceeds from issuance of flow-through shares | 5.8 | — | 5.8 | — | |||||||||||||||||||
| Proceeds from the exercise of options | — | 0.2 | 0.7 | 0.2 | |||||||||||||||||||
| Repayment of equipment financing obligations | — | (0.1) | — | (0.1) | |||||||||||||||||||
| (11.3) | (8.5) | (19.3) | (18.6) | ||||||||||||||||||||
| Effect of exchange rates on cash and cash equivalents | (0.4) | 0.5 | 0.1 | 0.8 | |||||||||||||||||||
| Net (decrease) increase in cash and cash equivalents | (2.7) | (4.3) | (51.0) | 13.4 | |||||||||||||||||||
| Cash and cash equivalents - beginning of period | 124.2 | 238.2 | 172.5 | 220.5 | |||||||||||||||||||
| CASH AND CASH EQUIVALENTS - END OF PERIOD | $121.5 | $233.9 | $121.5 | $233.9 | |||||||||||||||||||
35 | Alamos Gold Inc
 ALAMOS GOLD INC.
 ALAMOS GOLD INC.
 3
3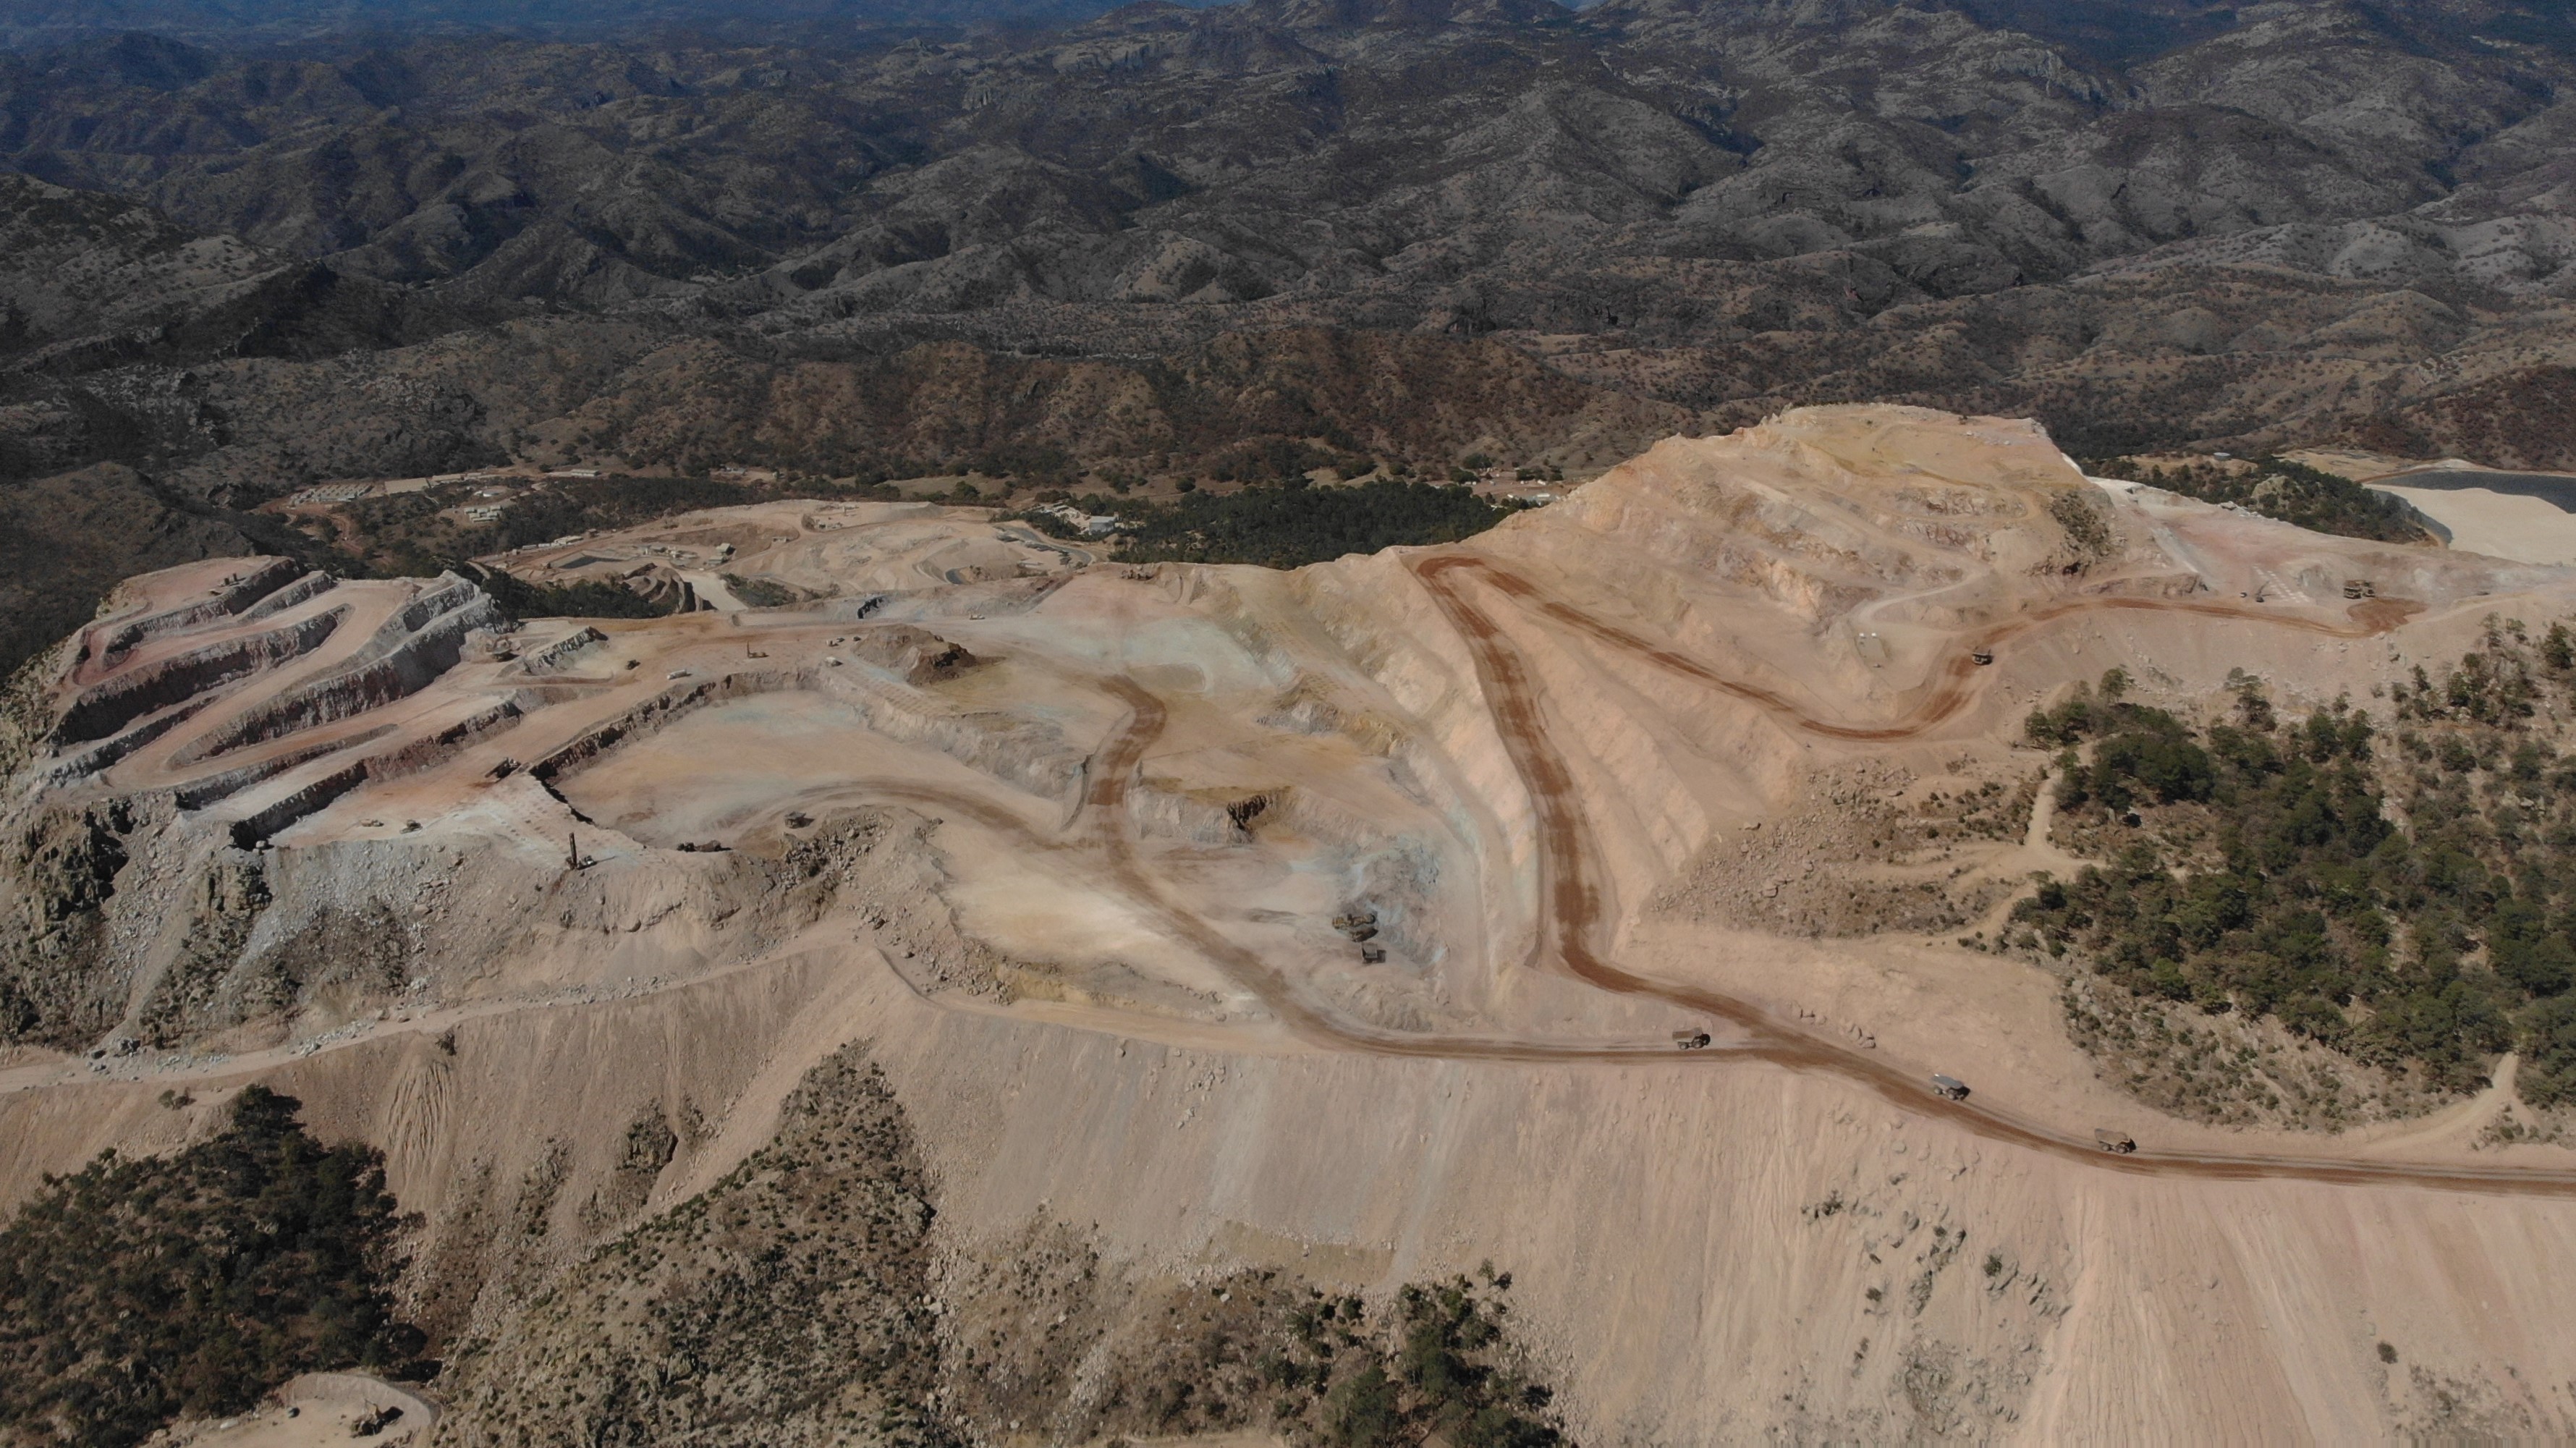
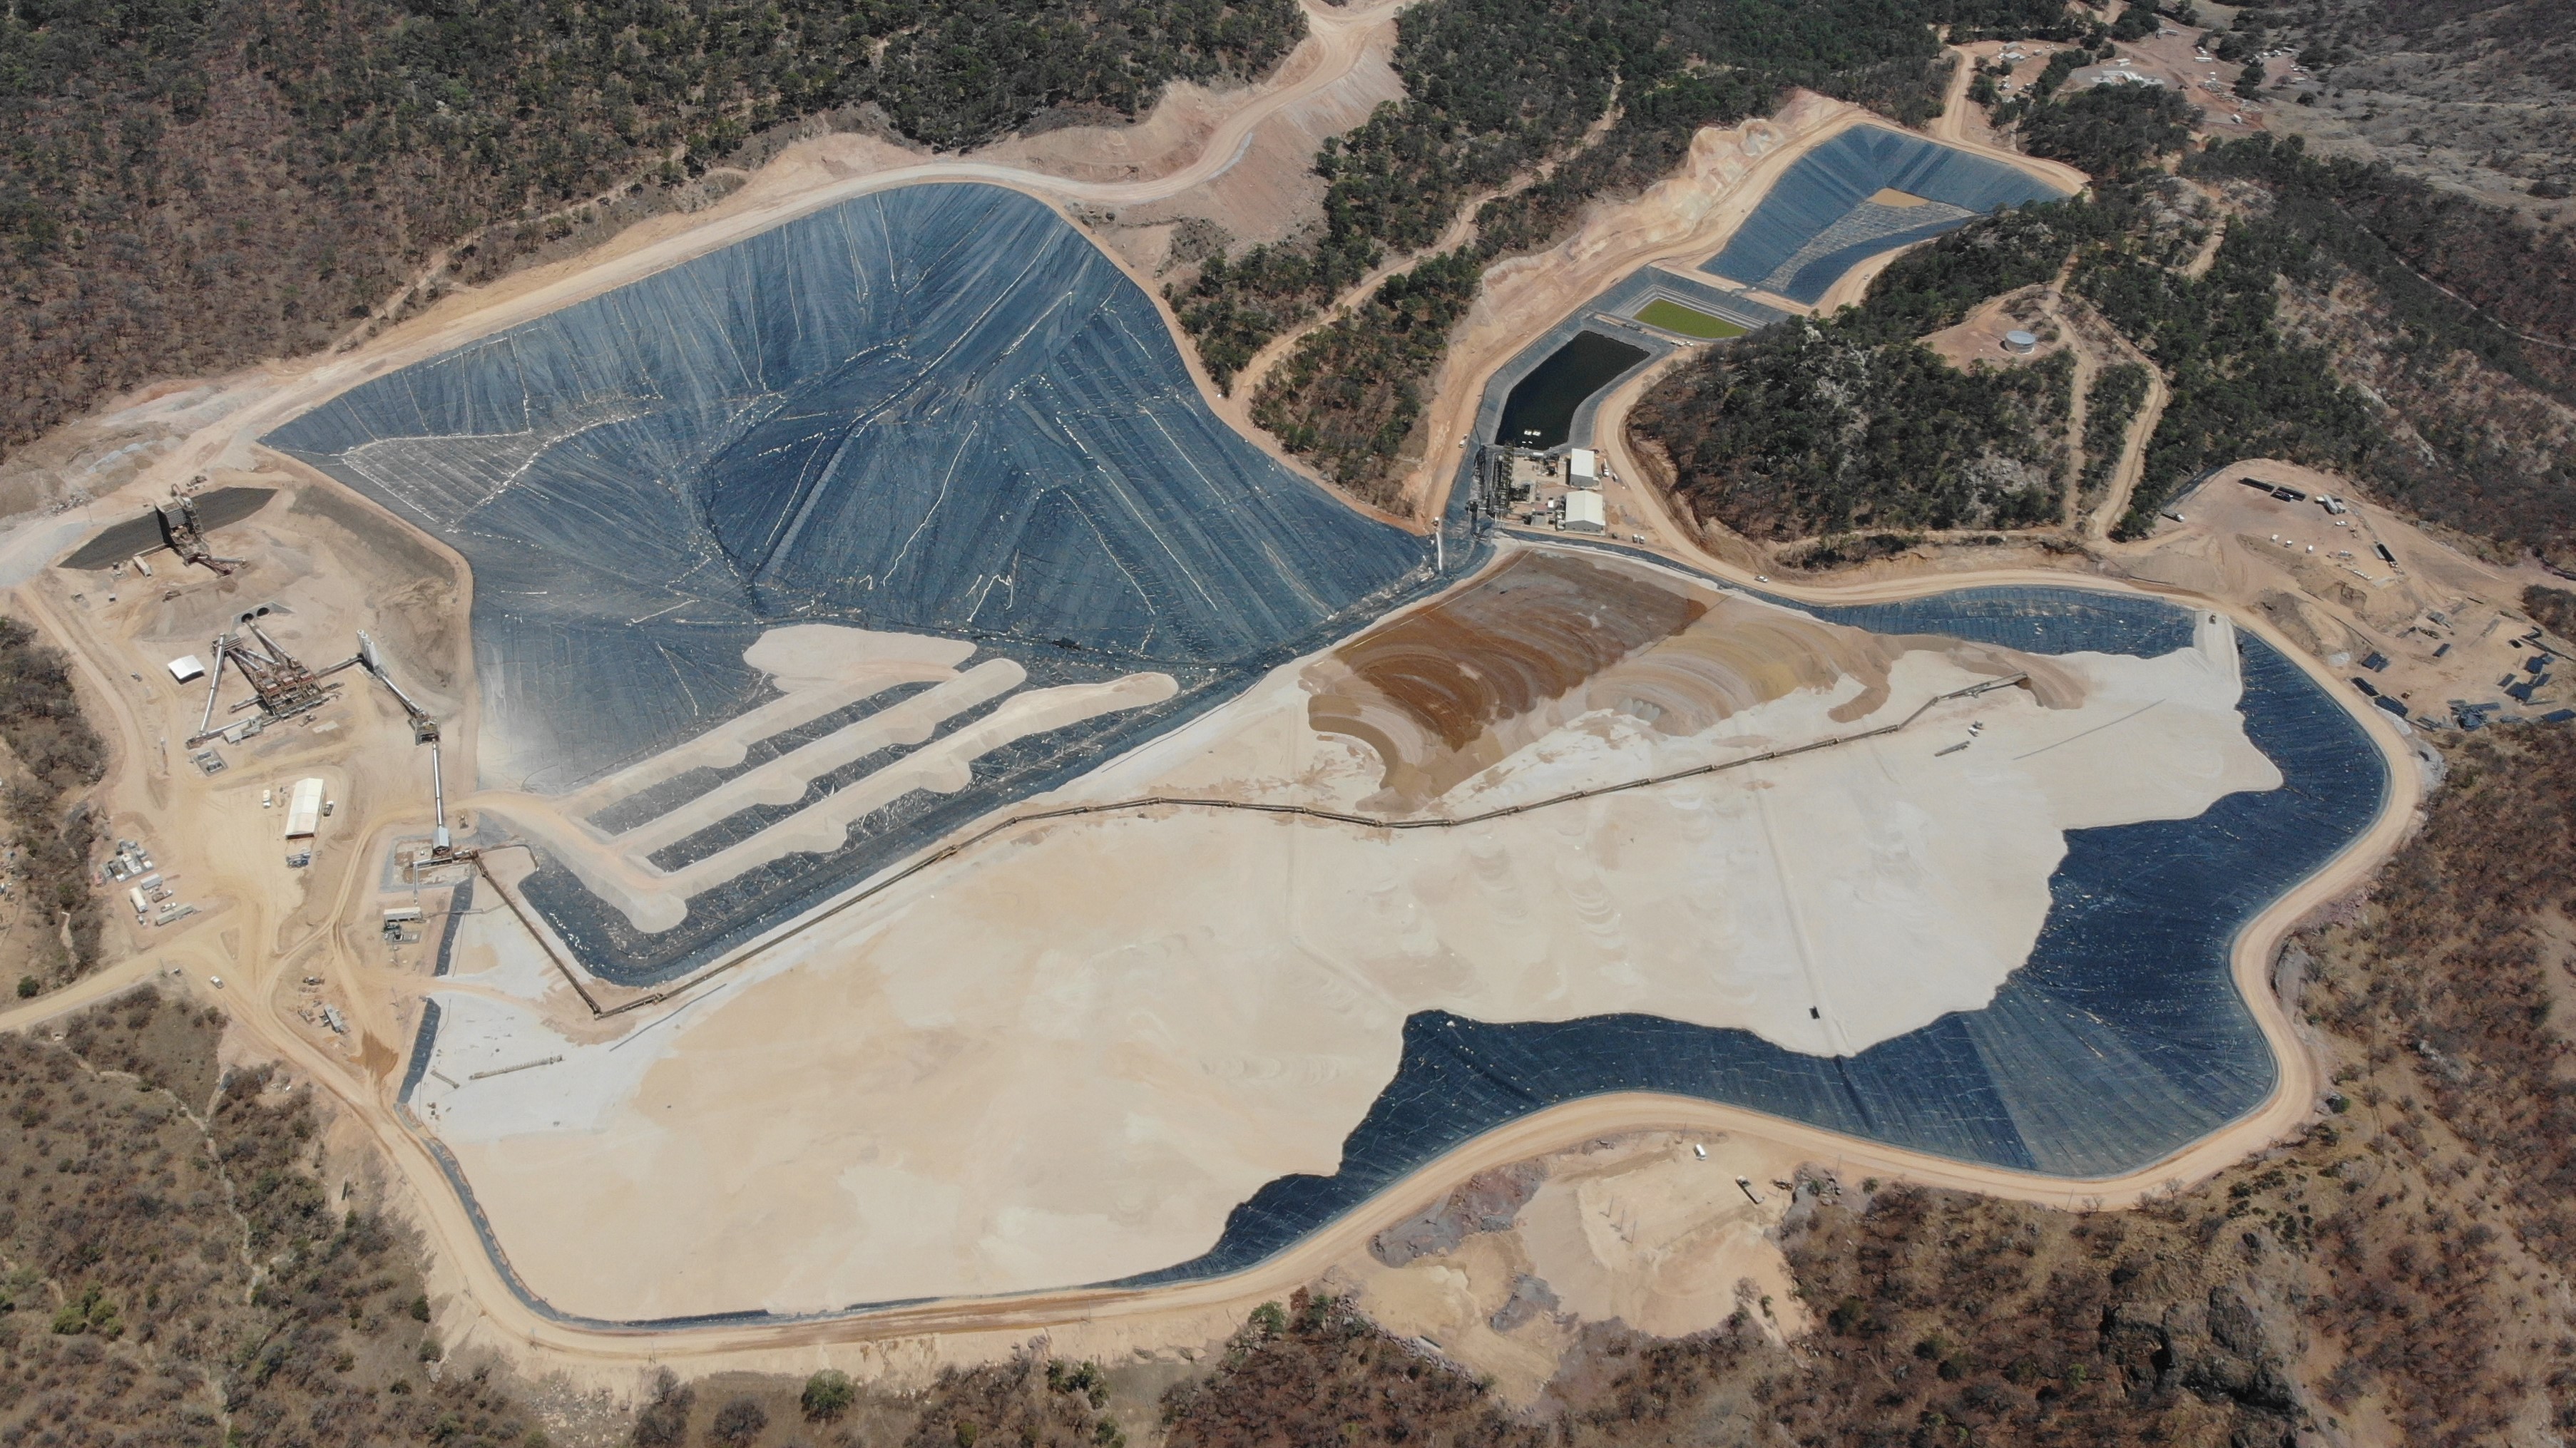

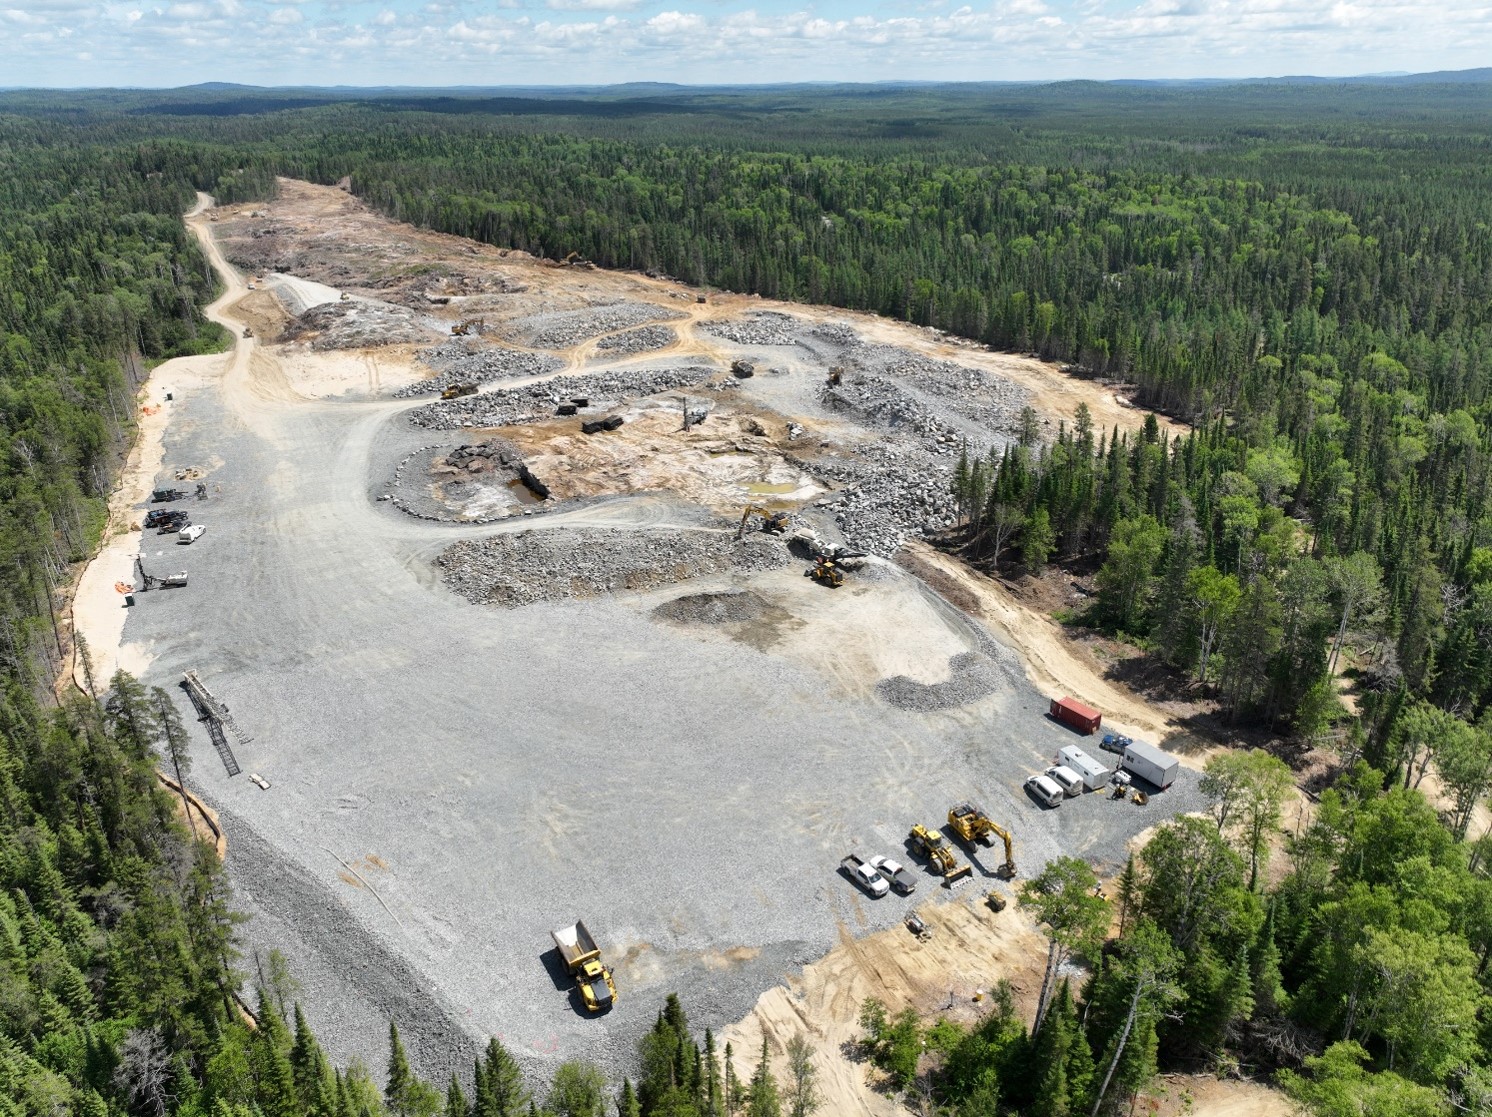
 ALAMOS GOLD INC.