Brookfield Place, 181 Bay Street, Suite 3910
Toronto, Ontario, M5J 2T3
416-368-9932
ANNUAL INFORMATION FORM for the year ended December 31, 2016 |
March 15, 2017
i | ALAMOS GOLD INC.
TABLE OF CONTENTS
PRELIMINARY NOTES | |
GLOSSARY OF TECHNICAL TERMS | |
CORPORATE STRUCTURE | |
Name and Incorporation | |
Intercorporate Relationships | |
GENERAL DEVELOPMENT OF THE BUSINESS | |
Three-Year History | |
Risk Factors | |
Commodity and Currency Risk | |
Financial, Finance and Tax Risks | |
Liquidity Risk | |
Production, Mining and Operating Risks | |
Legal, Permitting, Regulatory, Title and Political Risk | |
Relationships with Key Stakeholders | |
Environmental Risks | |
Climate Change Risks | |
Insurance and Compliance Risks | |
Mining Industry Risks | |
MINERAL PROPERTIES | |
YOUNG-DAVIDSON MINE | |
Summary | |
Property Description, Location and Access | |
History | |
Geological Setting, Mineralization and Deposit Types | |
Exploration | |
Drilling | |
Sampling, Analysis and Data Verification | |
Mineral Processing and Metallurgical Testing | |
Mineral Reserve and Mineral Reserve Estimation | |
Mining Operations | |
Milling Operations | |
Infrastructure, Permitting and Compliance Activities | |
Capital and Operating Costs | |
MULATOS MINE | |
Summary | |
Project Description, Location and Access | |
History | |
Geological Setting, Mineralization and Deposit Types | |
Exploration | |
ii | ALAMOS GOLD INC.
Drilling | |
2017 Exploration Outlook for Mulatos | |
Sampling, Analysis and Data Verification | |
Mineral Processing and Metallurgical Testing | |
Mineral Resource and Mineral Reserve Estimates | |
Mining Operations | |
Processing and Recovery Operations | |
Infrastructure, Permitting and Compliance Activities | |
Capital and Operating Costs | |
OTHER MINERAL PROPERTIES | |
El Chanate (Mexico) | |
Kirazlı, Aği Daği, and Çamyurt (Turkey) | |
Lynn Lake (Manitoba, Canada) | |
December 31, 2016 Reserves and Resources | |
Qualified Person(s) Disclosure | |
Uses of Gold | |
Sales and Refining | |
Employees | |
DIVIDENDS | |
DESCRIPTION OF CAPITAL STRUCTURE | |
MARKET FOR SECURITIES | |
PRIOR SALES | |
DIRECTORS AND OFFICERS | |
AUDIT COMMITTEE | |
INTEREST OF MANAGEMENT AND OTHERS IN MATERIAL TRANSACTIONS | |
TRANSFER AGENT AND REGISTRAR | |
LEGAL PROCEEDINGS | |
MATERIAL CONTRACTS | |
INTERESTS OF EXPERTS | |
ADDITIONAL INFORMATION | |
SCHEDULE “A” | |
iii | ALAMOS GOLD INC.
ANNUAL INFORMATION FORM - 2016
ANNUAL INFORMATION FORM
(“AIF”)
ALAMOS GOLD INC.
(the “Company”)
PRELIMINARY NOTES
Effective Date of Information
The information in this AIF is current as of March 15, 2017, unless otherwise stated herein.
Currency and Exchange Rates
All dollar amounts in this AIF are expressed in United States dollars, unless otherwise indicated (“CAD” denotes Canadian dollars). The following table sets forth the value of the Canadian dollar expressed in United States dollars on December 31 of each year and the average, high and low exchange rates during the year indicated based on the noon rate of exchange as reported by the Bank of Canada:
Canadian Dollars into United States Dollars | 2016 | 2015 | 2014 | ||||||
Closing | $0.745 | $0.723 | $0.862 | ||||||
Average | $0.755 | $0.783 | $0.905 | ||||||
High | $0.797 | $0.862 | $0.942 | ||||||
Low | $0.685 | $0.714 | $0.859 | ||||||
The noon rate of exchange on March 15, 2017, as reported by the Bank of Canada for the conversion of United States dollars into Canadian dollars was USD$0.743 equals CAD$1.00.
Imperial Equivalents
For ease of reference, the following factors for converting metric measurements to imperial equivalents are provided:
To Convert From Metric | To Imperial | Multiply by |
Hectares | Acres | 2.471 |
Metres | Feet (ft.) | 3.281 |
Kilometres (km.) | Miles | 0.621 |
Tonnes | Tons (2000 pounds) | 1.102 |
Grams/tonne | Ounces (troy/ton) | 0.029 |
Forward-Looking Statements
This AIF contains forward-looking statements within the meaning of the United States Securities Exchange Act of 1934, as amended (the “Exchange Act”), and applicable Canadian securities laws, concerning the Company’s plans for its properties and other matters. All statements other than statements of historical fact included in this AIF, including, without limitation, statements regarding forecasted gold production, gold grades, achieving projected recovery rates, anticipated production rates and mine life, operating efficiencies, costs and expenditures, changes in mineral resources and conversion of mineral resources to proven and probable reserves, waste-to-ore ratios, expected project development timelines (including permitting timelines)
1 | ALAMOS GOLD INC.
ANNUAL INFORMATION FORM - 2016
and other information that is based on forecasts of future operational or financial results, estimates of amounts not yet determinable, and assumptions of management.
Exploration results that include geophysics, sampling, and drill results on wide spacing may not be indicative of the occurrence of a mineral deposit. Such results do not provide assurance that further work will establish sufficient grade, continuity, metallurgical characteristics and economic potential to be classed as a category of mineral resource. A mineral resource that is classified as “inferred” or “indicated” has a great amount of uncertainty as to its existence and economic and legal feasibility. It cannot be assumed that any or part of an “indicated mineral resource” or “inferred mineral resource” will ever be upgraded to a higher category of resource. Investors are cautioned not to assume that all or any part of mineral deposits in these categories will ever be converted into proven and probable reserves.
Any statements that express or involve discussions with respect to predictions, expectations, beliefs, plans, projections, objectives, assumptions or future events or performance (often, but not always, using words or phrases such as “expects” or “does not expect”, “is expected”, “anticipates” or “does not anticipate”, “plans”, “estimates” or “intends”, or stating that certain actions, events or results “may”, “could”, “would”, “might” or “will” be taken, occur or be achieved) are not statements of historical fact and may be “forward-looking statements”. Forward-looking statements are subject to a variety of risks and uncertainties that could cause actual events or results to differ from those reflected in the forward-looking statements. There can be no assurance that forward-looking statements will prove to be accurate and actual results and future events could differ materially from those anticipated in such statements. Important factors that could cause actual results to differ materially from the Company’s expectations include risks related to the on-going business of the Company, including risks related to international operations; the actual results of current exploration activities; conclusions of economic evaluations and changes in project parameters as plans continue to be refined as well as future prices of gold and silver, as well as those risk factors described in the section entitled “Risk Factors” in this AIF. Although the Company has attempted to identify important factors that could cause actual results to differ materially, there may be other factors that cause results not to be as anticipated, estimated or intended. There can be no assurance that such statements will prove to be accurate as actual results and future events could differ materially from those anticipated in such statements. Accordingly, readers should not place undue reliance on forward-looking statements.
Mineral Reserve and Resource Estimates
Unless otherwise indicated, all resource and reserve estimates included in this AIF have been prepared in accordance with National Instrument 43-101 - Standards of Disclosure for Mineral Projects (“NI 43-101”) and the Canadian Institute of Mining, Metallurgy and Petroleum (the “CIM”) - CIM Definition Standards on Mineral Resources and Mineral Reserves, adopted by the CIM Council, as amended (the “CIM Standards”). NI 43-101 is a rule developed by the Canadian Securities Administrators, which established standards for all public disclosure an issuer makes of scientific and technical information concerning mineral projects. The terms “mineral reserve”, “proven mineral reserve” and “probable mineral reserve” are Canadian mining terms as defined in accordance with NI 43-101 and the CIM Standards. These definitions differ materially from the definitions in SEC Industry Guide 7 (“SEC Industry Guide 7”) under the United States Securities Exchange Act of 1934, as amended. Under SEC (defined below) Industry Guide 7 standards, a “final” or “bankable” feasibility study is required to report reserves, the three-year historical average price is used in any reserve or cash flow analysis to designate reserves and the primary environmental analysis or report must be filed with the appropriate governmental authority. In addition, the terms “mineral resource”, “measured mineral resource”, “indicated mineral resource” and “inferred mineral resource” are defined in and required to be disclosed by NI 43-101 and the CIM Standards; however, these terms are not defined terms under SEC Industry Guide 7 and are normally not permitted to be used in reports and registration statements filed with the U.S. Securities and Exchange Commission (the “SEC”). Investors are cautioned not to assume that all or any part of mineral deposits in these categories will ever be converted into reserves. “Inferred mineral resources” have a great amount of uncertainty as to their existence, and great uncertainty as to their economic and legal feasibility. It cannot be assumed that all or any part of an inferred mineral resource will ever be upgraded to a higher category. Under Canadian rules, estimates of inferred mineral resources may not form the basis of feasibility or pre–feasibility studies, except in very limited circumstances. Investors are cautioned not to assume that all or any part of an inferred mineral resource exists or is economically or legally mineable. Disclosure of “contained ounces” in a resource is permitted disclosure under Canadian regulations; however, the SEC normally only permits issuers to report mineralization that does not constitute “reserves” by SEC standards as in place tonnage and grade without reference to unit measures.
2 | ALAMOS GOLD INC.
ANNUAL INFORMATION FORM - 2016
Non-GAAP Measures and Additional GAAP Measures
The Company has included certain non-GAAP financial measures to supplement its Consolidated Financial Statements, which are presented in accordance with IFRS, including the following:
• | total cash cost per ounce of gold sold; |
• | mine-site all-in sustaining cost per ounce of gold sold; and |
• | all-in sustaining cost (”AISC”) per ounce of gold sold; |
The Company believes that these measures, together with measures determined in accordance with IFRS, provide investors with an improved ability to evaluate the underlying performance of the Company. Non-GAAP financial measures do not have any standardized meaning prescribed under IFRS, and therefore they may not be comparable to similar measures employed by other companies. The data is intended to provide additional information and should not be considered in isolation or as a substitute for measures of performance prepared in accordance with IFRS. Management's determination of the components of non-GAAP and additional measures are evaluated on a periodic basis influenced by new items and transactions, a review of investor uses and new regulations as applicable. Any changes in to the measures are dully noted and retrospectively applied as applicable.
Total Cash Costs per ounce
Total cash costs per ounce is a non-GAAP term typically used by gold mining companies to assess the level of gross margin available to the Company by subtracting these costs from the unit price realized during the period. This non-GAAP term is also used to assess the ability of a mining company to generate cash flow from operations. Total cash costs per ounce includes mining and processing costs plus applicable royalties, and net of by-product revenue and net realizable value adjustments. Total cash costs per ounce is exclusive of exploration costs.
Total cash costs per ounce is intended to provide additional information only and does not have any standardized meaning under IFRS and may not be comparable to similar measures presented by other mining companies. It should not be considered in isolation or as a substitute for measures of performance prepared in accordance with IFRS. The measure is not necessarily indicative of cash flow from operations under IFRS or operating costs presented under IFRS.
All-in Sustaining Cost per ounce and Mine-site All-in Sustaining Cost
The Company adopted an “all-in sustaining costs per ounce” non-GAAP performance measure in accordance with the World Gold Council published in June 2013. The Company believes the measure more fully defines the total costs associated with producing gold; however, this performance measure has no standardized meaning. Accordingly, there may be some variation in the method of computation of “all-in sustaining costs per ounce” as determined by the Company compared with other mining companies. In this context, “all-in sustaining costs per ounce” for the consolidated Company reflects total mining and processing costs, corporate and administrative costs, share-based compensation, exploration costs, sustaining capital, and other operating costs.
For the purposes of calculating "mine-site all-in sustaining costs" at the individual mine-sites, the Company does not include an allocation of corporate and administrative costs and share-based compensation, as detailed in the reconciliations below.
Sustaining capital expenditures are expenditures that do not increase annual gold ounce production at a mine site and excludes all expenditures at the Company’s development projects as well as certain expenditures at the Company’s operating sites that are deemed expansionary in nature. For each mine-site reconciliation, corporate and administrative costs, and non-site specific costs are not included in the all-in sustaining cost per ounce calculation.
All-in sustaining costs per gold ounce is intended to provide additional information only and does not have any standardized meaning under IFRS and may not be comparable to similar measures presented by other mining companies. It should not be considered in isolation or as a substitute for measures of performance prepared in accordance with IFRS.
The measure is not necessarily indicative of cash flow from operations under IFRS or operating costs presented under IFRS.
3 | ALAMOS GOLD INC.
ANNUAL INFORMATION FORM - 2016
Detailed reconciliations of the non-GAAP measures to measures under IFRS for the years ended December 31, 2016 and 2015 can be found in the Company’s MD&A for the year ended December 31, 2016 on pages 25-30.
GLOSSARY OF TECHNICAL TERMS
In this AIF unless otherwise defined or unless there is something in the subject matter or context inconsistent therewith, the following terms have the meanings set forth herein or therein:
“Ag” | Silver. |
“Au” | Gold. |
“CIM Definition Standards” | Mineral Resources and Mineral Reserves prepared by the CIM Standing Committee on Reserve Definitions adopted by CIM Council on May 10, 2014. |
“Cu” | Copper. |
“dacite” | The extrusive (volcanic) equivalent of quartz-diorite. |
“dome” | An uplift or anticlinal structure, either circular or elliptical in outline, in which the rocks dip gently away in all directions. |
“doré” | Unrefined gold and silver bullion bars, which will be further refined to almost pure metal. |
“grade” | Term used to indicate the concentration of an economically desirable mineral or element in its host rock as a function of its relative mass. With gold, this term may be expressed as grams per tonne (“g/t”) or ounces per tonne (“opt”). |
“g/t Au” | Grams per tonne of gold. |
“HQ diameter” | 2.4 inch diameter drill hole. |
“IFRS” | International financial reporting standards, the accounting principles used by the Company. |
“indicated resource” or “indicated mineral resource” | That part of a mineral resource for which quantity, grade or quality, densities, shape and physical characteristics can be estimated with a level of confidence sufficient to allow the appropriate application of technical and economic parameters, to support mine planning and evaluation of the economic viability of the deposit. The estimate is based on detailed and reliable exploration and testing information gathered through appropriate techniques from locations such as outcrops, trenches, pits, workings and drill holes that are spaced closely enough for geological and grade continuity to be reasonably assumed. |
“inferred resource” or “inferred mineral resource” | That part of a mineral resource for which quantity and grade or quality can be estimated on the basis of geological evidence and limited sampling and reasonably assumed, but not verified, geological and grade continuity. The estimate is based on limited information and sampling gathered through appropriate techniques from locations such as outcrops, trenches, pits, workings and drill holes. |
“km” | Kilometres. |
“leaching” | The separation, selective removal or dissolving-out of soluble constituents from a rock or ore body by the natural actions of percolating solutions. |
“m” | Metres. |
“Mineral Reserve” | The economically mineable part of a measured or indicated mineral resource demonstrated by at least a preliminary feasibility study. The study must include adequate information on mining, processing, metallurgical, economics and other relevant factors that demonstrate, at the time of reporting, that economic extraction can be justified. A mineral reserve includes diluting materials and allowances for losses that occur when the material is mined and processed. |
“measured resource” or “measured mineral resource” | That part of a mineral resource for which quantity, grade or quality, densities, shape, physical characteristics are so well established that they can be estimated with confidence sufficient to allow the appropriate application of technical and economic parameters, to support production planning and evaluation of the economic viability of the deposit. The estimate is based on detailed and reliable exploration, sampling and testing information gathered through appropriate techniques from locations such as outcrops, trenches, pits, workings and drill holes that are spaced closely enough to confirm both geological and grade continuity. |
4 | ALAMOS GOLD INC.
ANNUAL INFORMATION FORM - 2016
“Mineral Resource” | A concentration or occurrence of natural, solid, inorganic or fossilized organic material in or on the earth’s crust in such form and quantity and of such grade or quality that it has reasonable prospects for economic extraction. The location, quantity, grade, geological characteristics and continuity of a mineral resource are known, estimated or interpreted from specific geological evidence and knowledge. The term “mineral resource” covers mineralization and natural material of intrinsic economic interest which has been identified and estimated through exploration and sampling and within which mineral reserves may subsequently be defined by the consideration and application of technical, economic, legal, environmental, socio-economic and governmental factors. The phrase “reasonable prospects for economic extraction” implies a judgment by the Qualified Person in respect of the technical and economic factors likely to influence the prospect of economic extraction. A mineral resource is an inventory of mineralization that under realistically assumed and justifiable technical and economic conditions might become economically extractable. The term “mineral resource” used in this AIF is a Canadian mining term as defined in accordance with NI 43-101 under the guidelines set out in the CIM Standards. |
“Modifying Factors” | Modifying Factors are considerations used to convert Mineral Resources to Mineral Reserves. These include, but are not restricted to, mining, processing, metallurgical, infrastructure, economic, marketing, legal, environmental, social and governmental factors. |
“NSR” | Net smelter return royalty, consisting of a payment made by a producer of metals based on the value of the gross metal production from the property, less deduction of certain limited costs including, but not necessarily limited to, smelting, refining, transportation and insurance costs. |
“NI 43-101” | National Instrument 43-101 – “Standards of Disclosure for Mineral Projects” of the Canadian Securities Administrators”. |
“NQ diameter” | 1.75 inch diameter drill hole. |
“ore” | A natural aggregate of one or more minerals which, at a specified time and place, may be mined and sold at a profit, or from which some part may be profitably separated. |
“ounces” or “oz” | A measure of weight in gold and other precious metals, correctly troy ounces, which weigh 31.2 grams as distinct from an imperial ounce which weighs 28.4 grams. |
“ppm” | Parts per million. |
“ppb” | Parts per billion. |
“PQ diameter” | 3.2-inch drill hole diameter. |
“Probable Mineral Reserve” | A Probable Mineral Reserve is the economically mineable part of an Indicated, and in some circumstances, a Measured Mineral Resource. The confidence in the Modifying Factors applying to a Probable Mineral Reserve is lower than that applying to a Proven Mineral Reserve. |
“Proven Mineral Reserve” | A Proven Mineral Reserve is the economically mineable part of a Measured Mineral Resource. A Proven Mineral Reserve implies a high degree of confidence in the Modifying Factors. |
“QA/QC” | Quality assurance/quality control. |
“Qualified Person” | Has the meaning given to such term in NI 43-101. |
“RQD” | Rock quality designation. |
“tpd” | Tonnes per day. |
CORPORATE STRUCTURE
Name and Incorporation
The name of the Company is Alamos Gold Inc. The Company’s principal place of business and registered office is Brookfield Place, 181 Bay Street, Suite 3910, Toronto, Ontario M5J 2T3.
AuRico Gold Inc. (“AuRico”) amalgamated with Alamos Gold Inc. (“Former Alamos”) under section 182 of the Business Corporations Act (Ontario) (“OBCA”) pursuant to Articles of Arrangement dated July 2, 2015 with the resulting amalgamated company continuing under the name Alamos Gold Inc. (“Alamos” or the “Company”).
Alamos is a public company listed on the Toronto Stock Exchange (“TSX”) and the New York Stock Exchange (“NYSE”) under the symbol “AGI” and has a quoted market value of approximately CAD$3.06 billion as of March 15, 2017.
5 | ALAMOS GOLD INC.
ANNUAL INFORMATION FORM - 2016
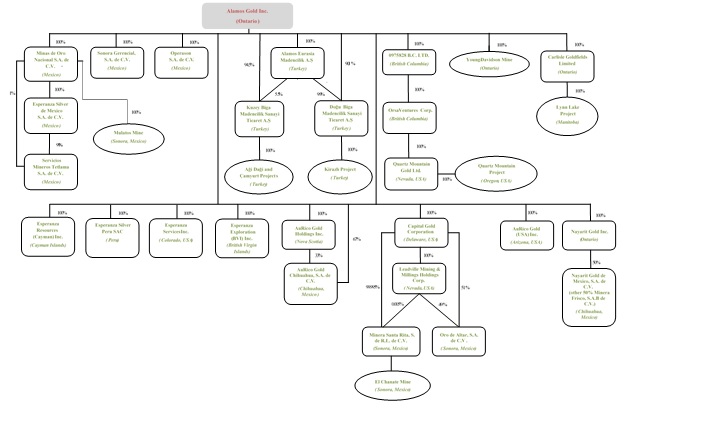
Intercorporate Relationships
In this AIF, unless the context otherwise requires, the terms “we”, “us”, “our”, and similar terms as well as references to “Alamos” or the “Company” refer to Alamos Gold Inc. The following diagram sets forth the Company’s intercorporate relationships with its active subsidiaries including the jurisdiction of incorporation or organization and the Company’s respective percentage ownership of each subsidiary.
GENERAL DEVELOPMENT OF THE BUSINESS
Alamos is a mining company engaged in the mining and extraction of, and exploration for, precious metals, primarily gold. Alamos owns and operates the Young-Davidson mine (the “Young-Davidson Mine”) in Ontario, Canada and the Mulatos mine (the “Mulatos Mine”) and El Chanate (the “El Chanate Mine”) mine in the state of Sonora, Mexico. In 2016, the Young-Davidson Mine produced 170,000 ounces of gold, the Mulatos Mine produced 154,000 ounces of gold and the El Chanate Mine produced 68,000 ounces of gold for total gold production of 392,000 ounces. Alamos also owns the development-stage Ağı Dağı, Kirazlı and Çamyurt Projects in the Biga district of northwestern Turkey (acquired 2010); the Esperanza Gold Project in Morelos State, Mexico (acquired 2013), the Quartz Mountain Property in Oregon, USA (acquired 2013), and the Lynn Lake Gold Project in Lynn Lake, Manitoba (100% interest acquired on January 7, 2016).
Three-Year History
Former Alamos
• | In May 2014, Former Alamos announced an agreement to acquire the surface rights to the Cerro Pelon and La Yaqui satellite gold projects. |
6 | ALAMOS GOLD INC.
ANNUAL INFORMATION FORM - 2016
• | In August 2014, Former Alamos received approval of the Environmental Impact Assessment (“EIA”) for its Ağı Dağı gold project. |
AuRico
• | On March 27, 2014, AuRico completed an offering of $315 million senior secured notes due in 2020. The notes were issued with a coupon of 7.75% and sold at 96.524% of par, resulting in net proceeds to AuRico of $304.1 million. |
• | On April 3, 2014, AuRico paid $173 million to complete the cash tender offer initially announced on March 6, 2014 to redeem all of the outstanding convertible senior notes. The consideration offered and paid was $1,040 per $1,000 note outstanding plus accrued and unpaid interest to the payment date. AuRico received tender offers for $166.4 million of the $167 million principal amount outstanding. |
• | On November 20, 2014, AuRico completed a private placement with Carlisle Goldfields Limited (“Carlisle”) in which AuRico invested CAD$5.6 million in exchange for 19.9% of the outstanding common shares of Carlisle. In conjunction with the private placement, AuRico entered into a joint venture agreement on November 11, 2014 with respect to Carlisle’s Lynn Lake Gold Camp, located in Lynn Lake, Manitoba, pursuant to which AuRico acquired a 25% interest in the project for an initial cash contribution of CAD$5.0 million. |
Alamos
• | On April 13, 2015, AuRico and Former Alamos announced that they had entered into a definitive agreement to combine their respective companies. Under the terms of the merger, holders of Former Alamos shares received, for each share held, 1 Alamos share and USD$0.0001 in cash, and holders of AuRico shares received, for each AuRico share held, 0.5046 Alamos shares. Upon completion of the merger, Former Alamos and AuRico shareholders each owned approximately 50% of Alamos. In addition, a new company named AuRico Metals Inc. (“AuRico Metals”), was created to hold AuRico’s Kemess project, a 1.5% net smelter return royalty (“NSR”) on the Young-Davidson Mine and AuRico’s Fosterville and Stawell royalties, and was capitalized with USD$20 million of cash. Upon completion of the merger, Alamos owned a 4.9% equity interest in AuRico Metals. The remaining shares of AuRico Metals were distributed approximately 50% each to Former Alamos and AuRico shareholders. |
• | AuRico amalgamated with Former Alamos under section 182 of the OBCA pursuant to Articles of Arrangement dated July 2, 2015 with the resulting amalgamated company continuing under the name “Alamos Gold Inc.” |
• | On January 7, 2016 Alamos completed the acquisition of Carlisle, and its 100% ownership of the Lynn Lake Gold Project located in Lynn Lake, Manitoba. Alamos issued approximately 5.5 million shares and issued approximately 5.5 million share purchase warrants in consideration for Carlisle. |
• | On March 22, 2016, the Company amended and restated its existing $150 million senior secured credit facility, extending the maturity from April 26, 2016 to February 29, 2020. The facility consists of a committed $150 million revolving credit facility (the “Facility”), with an option to draw an additional $70 million, subject to commitments from existing and/or new lenders. The terms of the Facility resulted in more favorable pricing and removal of a minimum tangible net worth test and a proven and probable reserves test, compared to the previous facility. The Facility is secured by a first-ranking lien on all present and future material assets, property and undertaking of the Company, with certain exclusions. |
• | On September 12, 2016, the Company reported a significant interim increase in mineral resources for its La Yaqui Project. |
• | On October 6, 2016, Alamos reported it has received final approval of the Environmental Impact Assessment (“EIA”) for Phase I of its La Yaqui Project. |
• | On January 5, 2017, the Company announced the receipt of Forestry Permits for its Kirazlı Project, Turkey. |
• | On January 6, 2017, the Company announced production of 392,000 ounces of gold for the year 2016. |
7 | ALAMOS GOLD INC.
ANNUAL INFORMATION FORM - 2016
• | On February 9, 2017, the Company completed a USD$250 million bought-deal equity financing, along with an announcement that it would use proceeds of the such financing (along with current cash reserves) to retire in full its 7.75% Senior Secured Notes. |
• | In February 2017, the Company announced updated positive studies on each of its Turkish Projects, including feasibility studies on both its Kirazlı and Ağı Dağı Projects; as well, an updated preliminary economic assessment on its Çamyurt Project. |
• | On February 23, 2017, the Company reported its updated mineral reserves and resources as of December 31, 2016. |
Risk Factors
The following is a discussion of risk factors relevant to the Company’s operations and future financial performance. Additional risks not currently known by the Company, or that the Company currently deems immaterial, may also impair the Company’s operations. You should carefully consider the risks and uncertainties described below as well as the other information contained and incorporated by reference in this AIF.
The financing, exploration, development and mining of any of the Company’s properties is subject to a number of risk factors, including, among other things, the price of gold, laws and regulations, political conditions, currency fluctuations, and the ability to hire qualified people and to obtain necessary services in jurisdictions where the Company operates. Before deciding to invest in securities of the Company, investors should consider carefully such risks and uncertainties.
Commodity and Currency Risk
In recent years financial conditions have been characterized by volatility, which in turn has resulted in volatility in commodity prices and foreign exchange rates, tightening of the credit market, increased counterparty risk, and volatility in the prices of publicly traded entities. The volatility in commodity prices and foreign exchange rates directly impacts the Company’s revenues, earnings and cash flow.
The volatility of the price of gold and the price of other metals could have a negative impact on the Company’s future operations.
The value of the Company’s mineral resources and future operating profit and loss is significantly impacted by fluctuations in gold prices, over which the Company has no control. A reduction in the price of gold may prevent the Company’s properties from being economically mined or result in the write-off of assets whose value is impaired as a result of low gold prices. The price of gold may also have a significant influence on the market price of the Company’s common shares. The price of gold is affected by numerous factors beyond the Company’s control, such as the level of inflation, fluctuation of the United States dollar and foreign currencies, global and regional demand, sale of gold by central banks and the political and economic conditions of major gold producing countries throughout the world. The price of gold has decreased significantly in the past several years.
In addition to adversely affecting the Company’s reserve and resource estimates and financial condition, declining metal prices can impact operations by requiring a reassessment of the feasibility of a particular project, and the Company may determine that it is not feasible to continue commercial production at some or all of its current projects. Even if a project is ultimately determined to be economically viable, the need to conduct such a reassessment may cause substantial delays and/or may interrupt operations until the reassessment can be completed, which may have a material adverse effect on the results of operations and financial condition.
From time to time the Company may engage in commodity hedging transactions intended to reduce the risk associated with fluctuations in commodity prices, but there is no assurance that any such commodity-hedging transactions designed to reduce the risk associated with fluctuations in metal prices will be successful. Hedging may not protect adequately against declines in the price of the hedged metal. Furthermore, although hedging may protect the Company from a decline in the price of the metal being hedged, it may also prevent it from benefiting from price increases.
The Company is subject to currency fluctuations that may adversely affect the financial position of the Company.
8 | ALAMOS GOLD INC.
ANNUAL INFORMATION FORM - 2016
The Company is subject to currency risks. The Company’s functional currency is the U.S. dollar, which is exposed to fluctuations against other currencies. The Company’s mining operations are located in Canada and Mexico, with additional development stage assets in Canada, the United States, Mexico and Turkey, and as such many of its expenditures and obligations are denominated in Canadian dollars, Mexican pesos, Turkish lira and Euros. The Company maintains its principal office in Toronto (Canada), maintains cash accounts in U.S. dollars, Mexican pesos, Turkish lira and Canadian dollars and has monetary assets and liabilities in U.S. dollars and Canadian dollars, Mexican pesos and Turkish lira.
The Company’s operating results and cash flow are significantly affected by changes in the U.S./Canadian dollar and U.S./Mexican peso exchange rates. Revenues are denominated in U.S. dollars, while most expenses are currently denominated in Canadian dollars and Mexican pesos. Exchange rate movements can therefore have a significant impact on most of the Company’s costs. The appreciation of non-U.S. dollar currencies against the U.S. dollar can increase the costs of production at Alamos’ mines, making these mines less profitable.
From time to time the Company may engage in foreign exchange hedging transactions intended to reduce the risk associated with fluctuations in foreign exchange rates, but there is no assurance that any such hedging transactions designed to reduce the risk associated with fluctuations in exchange rates will be successful and as such, operating costs and capital expenditures may be adversely impacted.
Financial, Finance and Tax Risks
The Company’s activities expose it to a variety of financial risks including interest rate risk, credit risk and liquidity risk. The Company’s risk management program focuses on the unpredictability of financial markets and seeks to minimize potential adverse effects on the Company’s financial performance. The Company may use derivative financial instruments to hedge certain risk exposures. The Company does not purchase derivative financial instruments for speculative investment purposes.
The Company’s revolving credit facility contains a number of restrictive covenants that impose significant operating and financial restrictions on the Company and may limit its ability to engage in acts that may be in the Company’s long-term best interest.
The Company’s failure to comply with covenants in its revolving credit facility could result in an event of default which, if not cured or waived, could result in a cross-default under other debt instruments and the acceleration of all its debt. The restrictions include, without limitation, restrictions on its ability to:
• | Incur additional indebtedness; |
• | Pay dividends or make other distributions or repurchase or redeem its capital stock; |
• | Prepay, redeem or repurchase certain debt; |
• | Make loans and investments; |
• | Sell, transfer or otherwise dispose of assets; |
• | Incur or permit to exist certain liens; |
• | Enter into transactions with affiliates; |
• | Enter into agreements restricting its subsidiaries’ ability to pay dividends; and |
• | Consolidate, amalgamate, merge or sell all or substantially all of the Company’s assets. |
The Company’s ability to raise funds through the issuance of debt instruments could be adversely impacted by the credit rating of the Company’s existing debt.
The Company’s debt currently has a non-investment grade rating, and any rating assigned could be lowered or withdrawn entirely by a rating agency, if, in that rating agency’s judgment, future circumstances relating to the basis of the rating, such as adverse changes, so warrant. Any future lowering of the Company’s ratings likely would make it more difficult or more expensive for it to obtain additional debt financing.
9 | ALAMOS GOLD INC.
ANNUAL INFORMATION FORM - 2016
Liquidity Risk
Liquidity risk arises through the excess of financial obligations due over available financial assets at any point in time. The Company’s objective in managing liquidity risk is to maintain sufficient readily available cash reserves and credit in order to meet its liquidity requirements at any point in time. The total cost and planned timing of acquisitions and/or other development or construction projects is not currently determinable and it is not currently known whether the Company will require external financing in future periods.
In order to finance future operations, the Company may raise funds through the issuance of shares or the issuance of debt instruments or other securities convertible into shares.
The Company cannot predict the potential need or size of future issuances of common shares or the issuance of debt instruments or other securities convertible into shares or the effect, if any, that this would have on the market price of the Company’s common shares. Any transaction involving the issuance of shares, or securities convertible into shares, could result in dilution, possibly substantial, to present and prospective security holders.
The Company is subject to taxation in multiple jurisdictions and adverse changes to the taxation laws of such jurisdictions could have a material adverse effect on its profitability.
The Company has operations and conducts business in multiple jurisdictions and it is subject to the taxation laws of each such jurisdiction. These taxation laws are complicated and subject to change. The Company may also be subject to review, audit and assessment in the ordinary course. Any such changes in taxation law or reviews and assessments could result in higher taxes being payable or require payment of taxes due from previous years, which could adversely affect the Company’s profitability. Taxes may also adversely affect the Company’s ability to repatriate earnings and otherwise deploy its assets.
The Company may not be able to obtain the external financing necessary to continue its exploration and development activities on its mineral properties.
The ability of the Company to continue the exploration and development of its property interests will be dependent upon its ability to increase revenues from its existing production and planned expansions, and potentially raise significant additional financing thereafter. The sources of external financing that the Company may use for these purposes may include project debt, corporate debt or equity offerings. There is no assurance that the financing alternative chosen by the Company will be available to the Company, on favourable terms or at all. Depending on the alternative chosen, the Company may have less control over the management of its projects. There is no assurance that the Company will successfully increase revenues from existing and expanded production. Should the Company not be able to obtain such financing and increase its revenues, it may become unable to acquire and retain its exploration properties and carry out exploration and development on such properties, and its title interests in such properties may be adversely affected or lost entirely.
Production, Mining and Operating Risks
The Company is, and expects to continue to be, dependent on three mines for all of its commercial production.
The Young-Davidson, Mulatos and El Chanate Mines accounted for all of the Company’s commercial production in 2016 and are expected to continue to account for all of its commercial production in the near term. Any adverse condition affecting mining, processing conditions, expansion plans or ongoing permitting at Young-Davidson, Mulatos or El Chanate could have a material adverse effect on the Company’s financial performance and results of operations.
Forecasts of future production are estimates based on interpretation and assumptions and actual production may be less than estimated.
The Company prepares estimates of future production for its operating mines. The Company cannot give any assurance that it will achieve its production estimates. The failure of the Company to achieve its production estimates could have a material and adverse effect on future cash flows, profitability, results of operations and financial condition. These production estimates are
10 | ALAMOS GOLD INC.
ANNUAL INFORMATION FORM - 2016
dependent on, among other things, the accuracy of mineral reserve estimates, the accuracy of assumptions regarding ore grades and recovery rates, ground conditions, physical characteristics of ores, such as hardness and the presence or absence of particular metallurgical characteristics and the accuracy of estimated rates and costs of mining and processing.
The Company’s actual production may vary from its estimates for a variety of reasons, including: actual ore mined varying from estimates of grade, tonnage, dilution and metallurgical and other characteristics; short-term operating factors such as the need for sequential development of orebodies and the processing of new or different ore grades from those planned; mine failures, slope failures or equipment failures; industrial accidents; natural phenomena such as inclement weather conditions, floods, droughts, rock slides and earthquakes; encountering unusual or unexpected geological conditions; changes in power costs and potential power shortages; shortages of principal supplies needed for operation, including explosives, fuels, chemical reagents, water, equipment parts and lubricants; labour shortages or strikes; civil disobedience and protests; and restrictions or regulations imposed by government agencies or other changes in the regulatory environments. Such occurrences could result in damage to mineral properties, interruptions in production, injury or death to persons, damage to property of the Company or others, monetary losses and legal liabilities. These factors may cause a mineral deposit that has been mined profitably in the past to become unprofitable, forcing the Company to cease production. It is not unusual in new mining operations to experience unexpected problems during the start-up phase. Depending on the price of gold or other minerals, the Company may determine that it is impractical to commence or, if commenced, to continue commercial production at a particular site.
Mining operations and facilities are intensive users of electricity and carbon-based fuels. Energy prices can be affected by numerous factors beyond the Company’s control, including global and regional supply and demand, political and economic conditions, and applicable regulatory regimes. The prices of various sources of energy may increase significantly from current levels. An increase in energy prices for which the Company is not hedged could materially adversely affect the results of operations and financial condition.
The Company’s production costs are also affected by the prices of commodities consumed or used in operations, such as lime, cyanide and explosives. The prices of such commodities are influenced by supply and demand trends affecting the mining industry in general and other factors outside the Company’s control. Increases in the price for materials consumed in mining and production activities could materially adversely affect the Company’s results of operations and financial condition.
Risks and costs relating to development, ongoing construction and changes to existing mining operations and development projects.
The Company’s ability to meet development and production schedules and cost estimates for its development and expansion projects cannot be assured. Without limiting the generality of the foregoing, the Company is in the process of completing a ramp-up and expansion at the Young-Davidson Mine and development at its Cerro Pelon and La Yaqui deposits near the Mulatos Mine in Mexico. In addition, the Company is undertaking permitting efforts with respect to expanded tailings dam facilities at the Young-Davidson Mine. Technical considerations, delays in obtaining governmental approvals, inability to obtain financing or other factors – including specifically to the foregoing - could cause delays in current mining operations or in developing properties. Such delays could materially affect the financial performance of the Company.
The Company prepares estimates of operating costs and/or capital costs for each operation and project. No assurance can be given that such estimates will be achieved. Failure to achieve cost estimates or material increases in costs could have an adverse impact on future cash flows, profitability, results of operations and financial condition.
Development projects are uncertain and it is possible that actual capital and operating costs and economic returns will differ significantly from those estimated for a project prior to production.
Alamos has a number of development stage projects in Canada, Mexico, the United States and Turkey. Mine development projects require significant expenditures during the development phase before production is possible. Development projects are subject to the completion of successful feasibility studies and environmental assessments, issuance of necessary governmental permits and availability of adequate financing. The economic feasibility of development projects is based on many factors such as: estimation of mineral reserves, anticipated metallurgical recoveries, environmental considerations and permitting, future gold prices, and anticipated capital and operating costs of these projects. Our development projects have no operating history upon which to base estimates of future production and cash operating costs. Particularly for development projects, estimates of
11 | ALAMOS GOLD INC.
ANNUAL INFORMATION FORM - 2016
proven and probable mineral reserves and cash operating costs are, to a large extent, based upon the interpretation of geologic data obtained from drill holes and other sampling techniques, and feasibility studies that derive estimates of cash operating costs based upon anticipated tonnage and grades of ore to be mined and processed, the configuration of the ore body, expected recovery rates of gold from the ore, estimated operating costs, anticipated climatic conditions and other factors. As a result, it is possible that actual capital and operating costs and economic returns will differ significantly from those currently estimated for a project prior to production.
Any of the following events, among others, could affect the profitability or economic feasibility of a project: unanticipated changes in grade and tonnes of ore to be mined and processed, unanticipated adverse geological conditions, unanticipated metallurgical recovery problems, incorrect data on which engineering assumptions are made, availability of labour, costs of processing and refining facilities, availability of economic sources of power, adequacy of water supply, availability of surface on which to locate processing and refining facilities, adequate access to the site, unanticipated transportation costs, government regulations (including regulations with respect to the environment, prices, royalties, duties, taxes, permitting, restrictions on production, quotas on exportation of minerals, environmental), fluctuations in gold prices, and accidents, labour actions and force majeure events.
It is not unusual in new mining operations to experience unexpected problems during the start-up phase, and delays can often occur at the start of production. It is likely that actual results for our projects will differ from current estimates and assumptions, and these differences may be material. In addition, experience from actual mining or processing operations may identify new or unexpected conditions that could reduce production below, or increase capital or operating costs above, current estimates. If actual results are less favourable than currently estimated, our business, results of operations, financial condition and liquidity could be materially adversely affected.
The figures for the Company’s reserves and resources are estimates based on interpretation and assumptions and may yield less mineral production under actual conditions than is currently estimated.
The Company must continually replace reserves depleted by production to maintain production levels over the long term. Reserves can be replaced by expanding known orebodies, locating new deposits or making acquisitions. Exploration is highly speculative in nature. Alamos’ exploration projects involve many risks and are frequently unsuccessful. Once a site with mineralization is discovered, it may take several years from the initial phases of drilling until production is possible, during which time the economic feasibility of production may change.
The Company’s mineral reserve and mineral resource estimates are estimates only and no assurance can be given that any particular level of recovery of gold or other minerals from mineral resources or mineral reserves will in fact be realized. There can also be no assurance that an identified mineral deposit will ever qualify as a commercially mineable (or viable) ore body which can be economically exploited. Additionally, no assurance can be given that the anticipated tonnages and grades will be achieved or that the indicated level of recovery will be realized. These estimates may require adjustments or downward revisions based upon further exploration or development work or actual production experience.
Estimates of mineral resources and mineral reserves can also be affected by such factors as environmental permitting regulations and requirements, weather, environmental factors, unforeseen technical difficulties, unusual or unexpected geological formations and work interruptions. In addition, the grade of ore ultimately mined may differ dramatically from that indicated by results of drilling, sampling and other similar examinations. Short term factors relating to mineral resources and mineral reserves, such as the need for orderly development of ore bodies or the processing of new or different grades, may also have an adverse effect on mining operations and on the results of operations.
Material changes in mineral resources and mineral reserves, grades, stripping ratios or recovery rates may affect the economic viability of projects. There is a risk that depletion of reserves will not be offset by discoveries, acquisitions or the conversion of mineral resources into mineral reserves. The mineral base of Alamos’ mines may decline if reserves are mined without adequate replacement and the Company may not be able to sustain production beyond the current mine lives, based on current production rates.
Mineral resources and mineral reserves are reported as general indicators of mine life. Mineral resources and mineral reserves should not be interpreted as assurances of mine life or of the profitability of current or future operations. There is a degree of
12 | ALAMOS GOLD INC.
ANNUAL INFORMATION FORM - 2016
uncertainty attributable to the calculation and estimation of mineral resources and mineral reserves and corresponding grades being mined or dedicated to future production. Until ore is actually mined and processed, mineral reserves and grades must be considered as estimates only.
In addition, the quantity of mineral resources and mineral reserves may vary depending on mineral prices. Extended declines in market prices for gold, silver and copper may render portions of the Company’s mineralization uneconomic and result in reduced reported mineralization. Any material change in mineral resources and mineral reserves, grades or stripping ratios may affect the economic viability of the Company’s projects.
Mineral resources that are not mineral reserves do not have demonstrated economic viability. The SEC does not permit mining companies in their filings with the SEC to disclose estimates other than mineral reserves. However, because the Company prepares its reserve and resource estimates in accordance with Canadian disclosure requirements, it contains resource estimates, which are required by NI 43-101. Mineral resource estimates for properties that have not commenced production are based, in many instances, on limited and widely spaced drill hole information, which is not necessarily indicative of the conditions between and around drill holes. Accordingly, such mineral resource estimates may require revision as more drilling information becomes available or as actual production experience is gained. No assurance can be given that any part or all of mineral resources constitute or will be converted into reserves.
Legal, Permitting, Regulatory, Title and Political Risk
The Company’s operating and development properties are located in jurisdictions that are subject to changes in economic and political conditions and regulations in those countries.
The economics of the mining and extraction of precious metals are affected by many factors, including the costs of mining and processing operations, variations of grade of ore discovered or mined, fluctuations in metal prices, foreign exchange rates and the prices of goods and services, applicable laws and regulations, including regulations relating to royalties, allowable production and importing and exporting goods and services. Depending on the price of minerals, the Company may determine that it is neither profitable nor advisable to acquire or develop properties, or to continue mining activities.
The Company’s mineral properties are located in Canada, Mexico, Turkey and the USA. Economic and political conditions in these countries could adversely affect the business activities of the Company. These conditions are beyond the Company’s control, and there can be no assurances that any mitigating actions by the Company will be effective.
Changing laws and regulations relating to the mining industry or shifts in political conditions may increase the costs related to the Company’s activities including the cost of maintaining its properties. Operations may also be affected to varying degrees by changes in government regulations with respect to restrictions on production, price controls, export controls, income taxes, royalties, expropriation of property, environmental legislation (including specifically legislation enacted to address climate change) and mine safety. The effect of these factors cannot be accurately predicted. Economic instability could result from current global economic conditions and could contribute to currency volatility and potential increases to income tax rates, both of which could significantly impact the Company’s profitability.
The Company’s activities are subject to extensive laws and regulations governing worker health and safety, employment standards, waste disposal, protection of historic and archaeological sites, mine development, protection of endangered and protected species and other matters. Regulators have broad authority to shut down and/or levy fines against facilities that do not comply with regulations or standards.
Risk factors specific to certain jurisdictions are described throughout, including specifically: “Risks related to development stage assets in Turkey”, “Water Management at the Company’s Mining operations”, “Security in Mexico” and “The Company will be unable to undertake its required drilling and other development work on its properties if all necessary permits and licenses are not granted.” The occurrence of the various factors and uncertainties related to economic and political risks of operating in the Company’s jurisdictions cannot be accurately predicted and could have a material adverse effect on our operations or profitability.
13 | ALAMOS GOLD INC.
ANNUAL INFORMATION FORM - 2016
Risk related to development stage assets in Turkey
The Company has development stage mineral properties located in Turkey. Economic and political conditions in Turkey could adversely affect the business activities of the Company.
These conditions are beyond the Company’s control, and there can be no assurances that any mitigating actions by the Company will be effective. In the past year, Turkey has experienced significant political, social, legal and regulatory instability, including an attempted coup. The impact of the change in political climate in Turkey is yet unknown, but may include heightened control of the judiciary, bureaucracy, media and the private business sector. Changes to existing governmental regulations may affect the Company’s ability to conduct business and mineral exploration and mining activities more broadly and the Company’s ability to generate cash flow and profits from operations. Associated risks include, but are not limited to, resource nationalism, terrorism, corruption, extreme fluctuations in currency exchange rates and high rates of inflation.
Changing laws and regulations relating to the mining industry or shifts in political conditions may increase the costs related to the Company’s activities including the cost of maintaining its properties. Operations may also be affected to varying degrees by changes in government regulations with respect to restrictions on production, price controls, export controls, income taxes, royalties, expropriation of property, environmental legislation (including specifically legislation enacted to address climate change) and mine safety. The effect of these factors cannot be accurately predicted. Economic instability could result from current r economic conditions and could contribute to currency volatility and potential increases to income tax rates, both of which could significantly impact the Company’s profitability.
The Company’s activities are subject to extensive laws and regulations governing worker health and safety, employment standards, waste disposal, protection of historic and archaeological sites, mine development, protection of endangered and protected species and other matters. Regulators have broad authority to shut down and/or levy fines against facilities that do not comply with regulations or standards.
Security in Mexico
In recent years, criminal activity and violence has increased in parts of Mexico. The mining sector has not been immune to the impact of criminal activity and violence, including in the form of kidnapping for ransom and extortion by organized crime, as well as direct armed robberies of mining operations. The Company takes measures to protect employees, property and production facilities from these and other security risks. There can be no assurance, however, that security incidents, in the future, will not have a material adverse effect on our operations.
The Company will be unable to undertake its required drilling and other development work on its properties if all necessary permits and licenses are not granted.
A number of approvals, licenses and permits are required for various aspects of exploration, development and expansion projects. The Company is uncertain if all necessary permits will be maintained or obtained on acceptable terms or in a timely manner. Future changes in applicable laws and regulations or changes in their enforcement or regulatory interpretation could negatively impact current or planned exploration and development activities or any other projects with which the Company becomes involved. Any failure to comply with applicable laws and regulations or failure to obtain or maintain permits, even if inadvertent, could result in the interruption of production, exploration or development, or material fines, penalties or other liabilities. It remains uncertain if the Company’s existing permits may be affected in the future or if the Company will have difficulties in obtaining all necessary permits that it requires for its proposed or existing mining activities.
On January 5, 2017, the Company announced that it had received its forestry permit in connection with its Kirazlı Project in Turkey. The Company is pursuing the GSM (Business Opening and Operation) permit which is granted by the Çanakkale Governorship. It remains uncertain if the Company will be able to maintain its existing permits and/or obtain all additional permits that it requires for its proposed mining activities. Although the Company has reason to expect the GSM permit in the first half of 2017, there can be no certainty with respect to permitting timelines.
In order to maintain mining concessions in good standing, concession holders must advance their projects efficiently, including by obtaining the necessary permits prior to stipulated deadlines. The Company has implemented plans to obtain all necessary permits prior to the relevant deadlines. While the Company is confident in its ability to meet all required deadlines or milestones
14 | ALAMOS GOLD INC.
ANNUAL INFORMATION FORM - 2016
so as to maintain its concessions in good standing, there is risk that the relevant permitting and licensing authorities will not respond in a timely manner. If these deadlines are not met, the Company believes that extensions to deadlines for obtaining the required approvals and permits could be negotiated so that the concessions would remain in good standing. However, there is no guarantee that the Company will be able to obtain the approvals and permits as planned or, if unable to meet such deadlines, that negotiations for an extension will be successful in order to maintain its concessions in good standing. If the concessions were to expire, this could have a material adverse impact on the Company and its ability to control and develop its Turkish projects.
Litigation could be brought against the Company and the resolution of legal proceedings or disputes may have a material adverse effect on the Company’s future cash flows, results of operations or financial condition.
The Company could be subject to legal claims and/or complaints and disputes with other parties that result in litigation, including unexpected environmental remediation costs, arising out of the normal course of business. The results of litigation cannot be predicted with certainty. The costs of defending and settling litigation can be significant, even for claims that have no merit. There is a risk that if such claims are determined adversely to the Company, they could have a material adverse effect on the Company’s financial performance, cash flow and results of operations.
Some of the Company’s mineral assets are located outside Canada and are held indirectly through foreign affiliates.
It may be difficult if not impossible to enforce judgments obtained in Canadian courts predicated upon the civil liability provisions of the securities laws of certain provinces against substantially all of the Company’s assets which are located outside Canada.
Failure of the Company to comply with laws and regulations could negatively impact current or planned mining activities and exploration and developmental activities.
The Company’s mining, exploration and development activities are subject to extensive laws and regulations concerning the environment, worker health and safety, employment standards, waste disposal, mine development, mine operation, mine closure and reclamation and other matters. The Company requires permits and approvals from various regulatory authorities for many aspects of mine development, operation, closure and reclamation. In addition to meeting the requirements necessary to obtain such permits and approvals, they may be invalidated if the applicable regulatory authority is legally challenged that it did not lawfully issue such permits and approvals. The ability of the Company to obtain and maintain permits and approvals and to successfully develop and operate mines may be adversely affected by real or perceived impacts associated with its activities that affect the environment and human health and safety at its development projects and operations and in the surrounding communities. The real or perceived impacts of the activities of other mining companies may also adversely affect our ability to obtain and maintain permits and approvals. The Company is uncertain as to whether all necessary permits will be maintained on acceptable terms or in a timely manner. Future changes in applicable laws and regulations or changes in their enforcement or regulatory interpretation could negatively affect current or planned mining, exploration and developmental activities on the projects in which the Company is or may become involved. Any failure to comply with applicable laws and regulations or to obtain or maintain permits, even if inadvertent, could result in the interruption of mining, exploration and developmental operations or in material fines, penalties, clean-up costs, damages and the loss of key permits or approvals. While the Company has taken great care to ensure full compliance with its legal obligations, there can be no assurance that the Company has been or will be in full compliance with all of these laws and regulations, or with all permits and approvals that it is required to have. Environmental and regulatory review has also become a long, complex and uncertain process that can cause potentially significant delays.
The Company cannot guarantee that title to its properties will not be challenged.
The validity of the Company’s mining claims and access rights can be uncertain and may be contested. Although the Company is satisfied it has taken reasonable measures to acquire the rights needed to undertake its operations and activities as currently conducted, some risk exists that some titles and access rights may be defective. No assurance can be given that such claims are not subject to prior unregistered agreements or interests or to undetected or other claims or interests which could be materially adverse to the Company. While the Company has used its best efforts to ensure title to all its properties and secured access to surface rights, these titles or rights may be disputed, which could result in costly litigation or disruption of operations. From time to time, a land possessor may dispute the Company’s surface access rights, and as a result the Company may be barred from its legal occupation rights. Surface access issues have the potential to result in the delay of planned exploration programs,
15 | ALAMOS GOLD INC.
ANNUAL INFORMATION FORM - 2016
and these delays may be significant. The Company expects that it will be able to resolve these issues, however, there can be no assurance that this will be the case.
Additional future property acquisitions, relocation benefits, legal and related costs may be material. The Company cannot currently determine the expected timing, outcome of negotiations or costs associated with the relocation of the remaining property owners and possessors and potential land acquisitions. The Company may need to enter into negotiations with landowners and other groups in the host communities where our projects are located in order to conduct future exploration and development work. There is no assurance that future discussions and negotiations will result in agreements with landowners or other local community groups so as to enable the Company to conduct exploration and development work on these projects.
The Company provides significant economic and social benefits to our host communities and countries, which facilitates broad stakeholder support for our operations and projects. There is no guarantee however that local residents will support our operations or projects.
Relationships with Key Stakeholders
Aboriginal title claims, rights to consultation/accommodation, and the Company’s relationship with local communities may affect the Company’s existing operations and development projects.
Governments in many jurisdictions must consult with aboriginal peoples with respect to grants of mineral rights and the issuance or amendment of project authorizations. Consultation and other rights of Aboriginal people may require accommodations, including undertakings regarding employment, royalty payments and other matters. This may affect the Company’s ability to acquire, within a reasonable time frame, effective mineral titles in these jurisdictions, including in some parts of Canada, in which aboriginal title is claimed, and may affect the timetable and costs of development of mineral properties in these jurisdictions. The risk of unforeseen aboriginal title claims also could affect existing operations as well as development projects. These legal requirements may also affect the Company’s ability to expand or transfer existing operations or to develop new projects.
The Company’s relationship with the communities in which it operates are critical to ensure the future success of its existing operations and the construction and development of its projects. There is an increasing level of public concern relating to the perceived effect of mining activities on the environment and on communities impacted by such activities. Adverse publicity relating to the mining industry generated by non-governmental organizations and others could have an adverse effect on the Company’s reputation or financial condition and may impact its relationship with the communities in which it operates. While the Company is committed to operating in a socially responsible manner, there is no guarantee that the Company’s efforts in this regard will mitigate this potential risk.
The inability of the Company to maintain positive relationships with local communities may result in additional obstacles to permitting, increased legal challenges, or other disruptive operational issues at any of our operating mines, and could have a significant adverse impact on the Company’s ability to generate cash flow, with a corresponding adverse impact to the Company’s share price and financial condition.
The Company’s directors and officers may have interests that conflict with the Company’s interests.
Certain of the Company’s directors and officers serve as directors or officers of other public companies and as such it is possible that a conflict may arise between their duties as the Company’s directors or officers and their duties as directors or officers of these other companies.
Exploration, development and production at the Company’s mining operations are dependent upon the efforts of its key personnel and its relations with its employees and any labor unions that represent employees.
The Company’s success is heavily dependent on its key personnel and on the ability to motivate, retain and attract highly skilled employees.
Relations between the Company and its employees may be affected by changes in the scheme of labour relations that may be introduced by Mexican or Canadian governmental authorities in whose jurisdictions the Company carries on operations. Changes
16 | ALAMOS GOLD INC.
ANNUAL INFORMATION FORM - 2016
in such legislation or in the relationship between the Company and its employees may have a material adverse effect on the Company’s business, results of operations and financial condition.
In addition, the Company anticipates that as it expands its existing production and brings additional properties into production, and as the Company acquires additional mineral rights, the Company may experience significant growth in its operations. This growth may create new positions and responsibilities for management personnel and increase demands on its operating and financial systems, as well as require the hiring of a significant number of additional operations personnel. There can be no assurance that the Company will successfully meet these demands and effectively attract and retain any such additional qualified personnel. The failure to attract and retain such qualified personnel to manage growth effectively could have a material adverse effect on the Company’s business, financial condition or results of operations.
As a result of social media and other web-based applications, companies today are at much greater risk of losing control over how they are perceived.
Damage to the Company’s reputation can be the result of the actual or perceived occurrence of any number of events, and could include any negative publicity, whether true or not. Although the Company places a great emphasis on protecting its image and reputation, it does not ultimately have direct control over how it is perceived by others. Reputation loss may lead to increased challenges in developing and maintaining community relations, decreased investor confidence and act as an impediment to the Company’s overall ability to advance its projects, thereby having a material adverse impact on financial performance, cash flows and growth prospects.
Environmental Risks
The Company’s activities are subject to environmental laws and regulations that may increase its costs of doing business and restrict its operations.
The Company’s exploration and production activities are subject to regulation by governmental agencies under various environmental laws. These laws address noise, emissions, water discharges, waste management, management of hazardous substances, protection of natural resources, antiquities and endangered species and reclamation of lands disturbed by mining operations. Environmental legislation in many countries is evolving and the trend has been towards stricter standards and enforcement, increased fines, penalties and potential for facilities to be shut-down for non- compliance, more stringent environmental assessments of proposed projects and increasing responsibility for companies and their officers, directors and employees. Compliance with environmental laws and regulations may require significant capital outlays on behalf of the Company and may cause material changes or delays in the Company’s intended activities. There can be no assurance that future changes in environmental regulations will not adversely affect the Company’s business, and it is possible that future changes in these laws or regulations could have a significant adverse impact on some portion of the Company’s business, causing the Company to re-evaluate those activities at that time.
Failure to comply with such laws and regulations can have serious consequences, including damage to the Company’s reputation, stopping the Company from proceeding with the development of a project, negatively impacting the operation or further development of a mine, increasing the cost of development or production and litigation and regulatory actions against the Company. The Company cannot give any assurance that, notwithstanding its precautions, breaches of environmental laws (whether inadvertent or not) or environmental pollution will not materially and adversely affect its financial condition and its results from operations. There is no assurance that future changes in environmental regulation, if any, will not adversely affect the Company’s operations. Environmental hazards may exist on the properties on which the Company holds interests which are unknown to the Company at present and which have been caused by previous or existing owners or operators of the properties. The Company may also acquire properties with known or undiscovered environmental risks. Any indemnification from the entity from which the Company has acquired such properties may not be adequate to pay all the fines, penalties and costs (such as clean-up and restoration costs) incurred related to such properties. Some of the Company’s properties also have been used for mining and related operations for many years before acquisition and were acquired as is or with assumed environmental liabilities from previous owners or operators.
The Company’s failure to comply with applicable laws, regulations and permitting requirements may result in enforcement actions, including orders issued by regulatory or judicial authorities causing operations to cease or be curtailed, and may include
17 | ALAMOS GOLD INC.
ANNUAL INFORMATION FORM - 2016
corrective measures requiring capital expenditures, installation of additional equipment, or remedial actions. The Company may be required to compensate those suffering loss or damage by reason of its operations and may have civil or criminal fines or penalties imposed for violations of applicable laws or regulations.
Production at certain of the Company’s mines involves the use of various chemicals, including cyanide, which is a toxic material. Should cyanide or other toxic chemicals leak or otherwise be discharged from the containment system, the Company may become subject to liability for cleanup work that may not be insured. While appropriate steps will be taken to prevent discharges of pollutants into the ground water and the environment, the Company may become subject to liability for hazards that it may not be insured against and such liability could be material.
Actual costs of reclamation are uncertain, and higher than expected costs could negatively impact the results of operations and financial position.
Land reclamation requirements are generally imposed on mineral exploration companies (as well as companies with mining operations) in order to minimize long term effects of land disturbance, and the Company is subject to such requirements at its mineral properties. Decommissioning liabilities include requirements to control dispersion of potentially deleterious effluents; and, reasonably re-establish pre-disturbance land forms and vegetation.
In order to carry out reclamation obligations arising from exploration and potential development activities, the Company must allocate financial resources that might otherwise be spent on further exploration and development programs. Reclamation costs are uncertain and planned expenditures may differ from the actual expenditures required. If the Company is required to carry out unanticipated reclamation work, its financial position could be adversely affected.
Water management at the Company’s mining operations
The water collection, treatment and disposal operations at the Company’s mines are subject to substantial regulation and involve significant environmental risks. If collection or management systems fail, overflow or do not operate properly, untreated water or other contaminants could spill onto nearby properties or into nearby streams and rivers, causing damage to persons or property, injury to aquatic life and economic damages. This risk is most acute at the Mulatos Mine during periods of substantial rainfall or flooding, which can be the main causes of overflow and system failures.
Environmental and regulatory authorities in Mexico and Canada conduct periodic or annual inspections of the Young-Davidson, Mulatos and El Chanate mines. As a result of these inspections, the Company is from time to time required to modify its water management program, complete additional monitoring work or take remedial actions with respect to the Company’s operations as it pertains to water management.
Liabilities resulting from damage, regulatory orders or demands, or similar, could adversely and materially affect the Company’s business, results of operations and financial condition. Moreover, in the event that the Company is deemed liable for any damage caused by overflow, the Company’s losses or consequences of regulatory action might not be covered by insurance policies.
Problems with water sources could have a negative impact on the Company’s exploration programs and future operations.
The Company may not be able to secure the water necessary to conduct its activities as planned. The Company will strive to ensure that its activities do not adversely impact community water sources. Future operations and activities may require that alternate water sources be provided to potentially affected communities at the Company’s expense.
Climate Change Risks
The Company’s mining and processing operations are energy intensive, resulting in a significant carbon footprint. The Company acknowledges climate change as an international and community concern. A number of governments or governmental bodies have introduced or are contemplating regulatory changes in response to the potential impacts of climate change. Where legislation already exists, regulation relating to emission levels and energy efficiency is becoming more stringent. Some of the costs associated with reducing emissions can be offset by increased energy efficiency and technological innovation. We expect that in the long term this may result in increased costs at our Canadian and Mexican operations. While the Company has taken
18 | ALAMOS GOLD INC.
ANNUAL INFORMATION FORM - 2016
measures to manage the use of energy, the inability to achieve required energy efficiencies could have an adverse impact on the Company’s ability to achieve cost guidance.
In addition, the physical risks of climate change may also have an adverse effect on our operations. These may include extreme weather events, changes in rainfall and storm patterns and intensities, water shortages, and changing temperatures. In particular, the Company’s producing assets are located in northwest Mexico and Canada. Extended periods of high rainfall or drought conditions are typical in this part of Mexico. In Canada, cold temperatures and heavy snowfall may impact the Company’s ability to achieve production forecasts, including anticipated recoveries. While the Company has taken measures to mitigate the impact of weather on its operations, severe rainfall or drought conditions could have an adverse impact on the Company’s ability to achieve production forecasts.
Insurance and Compliance Risks
We may not have sufficient insurance coverage.
The mining industry is subject to significant risks that could result in damage to, or destruction of, mineral properties or producing facilities, personal injury or death, environmental damage, delays in mining, monetary losses and possible legal liability.
The Company’s policies of insurance may not provide sufficient coverage for losses related to these or other risks. The Company’s insurance does not cover all risks that may result in loss or damages and may not be adequate to reimburse the Company for all losses sustained. In particular, the Company does not have coverage for certain environmental losses or certain types of earthquake damage. The occurrence of losses or damage not covered by insurance could have a material and adverse effect on the Company’s cash flows, results of operation and financial condition.
The Company’s business involves uninsurable risks.
In the course of exploration, development and production of mineral properties, certain risks and, in particular, unexpected or unusual geological operating conditions including cave-ins, fires, flooding and earthquakes may occur. It is not always possible to fully insure against such risks and the Company may decide not to take out insurance against such risks as a result of high premiums or other reasons. Should such liabilities arise, they could reduce or eliminate any future profitability and result in increasing costs and a decline in the value of the securities of the Company.
The Company may fail to maintain the adequacy of internal control over financial reporting as per the requirements of the Sarbanes-Oxley Act of 2002 (“SOX”).
The Company has documented and tested, during its most recent fiscal year, its internal control procedures in order to satisfy the requirements of Section 404 of SOX. Both SOX and Canadian legislation require an annual assessment by management of the effectiveness of the Company’s internal control over financial reporting.
The Company may fail to maintain the adequacy of its internal control over financial reporting as such standards are modified, supplemented, or amended from time to time, and the Company may not be able to ensure that it can conclude on an ongoing basis that it has effective internal controls over financial reporting. The Company’s failure to satisfy the requirements of Section 404 of SOX and equivalent Canadian legislation on an ongoing, timely basis could result in the loss of investor confidence in the reliability of its financial statements, which in turn could harm the Company’s business and negatively impact the trading price of the Company’s common shares or market value of its other securities. In addition, any failure to implement required new or improved controls, or difficulties encountered in their implementation, could harm the Company’s operating results or cause it to fail to meet its reporting obligations.
The Company may be impacted by Anti-Bribery laws.
The Canadian Corruption of Foreign Public Officials Act and the U.S. Foreign Corrupt Practices Act and anti-bribery laws in other jurisdictions, prohibit companies and their intermediaries from making improper payments for the purposes of obtaining or retaining business or other commercial advantage. The Company’s policies mandate compliance with these anti-bribery laws, which often carry substantial penalties. The Company operates in jurisdictions that have experienced governmental and private sector corruption to some degree, and, in certain circumstances, strict compliance with anti-bribery laws may conflict with certain
19 | ALAMOS GOLD INC.
ANNUAL INFORMATION FORM - 2016
local customs and practices. There can be no assurances that the Company’s internal control policies and procedures will always protect it from reckless or other inappropriate acts committed by the Company’s affiliates, employees or agents. Violations of these laws, or allegations of such violations, could have a material adverse effect on the Company’s business, financial position and results of operations.
Alamos’ critical operating systems may be compromised.
Cyber threats have evolved in severity, frequency and sophistication in recent years, and target entities are no longer primarily from the financial or retail sectors. Individuals engaging in cybercrime may target corruption of systems or data, or theft of sensitive data. While we invest in robust security systems to detect and block inappropriate or illegal access to our key systems, including supervisory control and data acquisition operating systems at our operations, and regularly review policies, procedures and protocols to ensure data and system integrity, there can be no assurance that critical systems will not be not inadvertently or intentionally breached and compromised. This may result in business interruption losses, equipment damage, or loss of critical or sensitive information.
Mining Industry Risks
The Company is in competition with other mining companies that have greater resources and experience.
The Company competes with other mining companies, many of which have greater resources and experience. Competition in the precious metals mining industry is primarily for: mineral rich properties which can be developed and produced economically; the technical expertise to find, develop, and produce such properties; the labour to operate the properties; and the capital for the purpose of financing development of such properties. Many competitors not only explore for and mine precious metals, but conduct refining and marketing operations on a world-wide basis and some of these companies have much greater financial and technical resources than the Company. Such competition may result in the Company being unable to acquire desired properties, recruit or retain qualified employees or acquire the capital necessary to fund its operations and develop its properties. The Company’s inability to successfully compete with other mining companies for these mineral deposits could have a material adverse effect on the Company’s results of operations.
The Company may be unable to identify opportunities to grow its business or replace depleted reserves, and it may be unsuccessful in integrating new businesses and assets that it may acquire in the future.
As part of the Company’s business strategy, it has sought and will continue to seek new operating, development and exploration opportunities in the mining industry. In pursuit of such opportunities, the Company may fail to select appropriate acquisition candidates or negotiate acceptable arrangements, including arrangements to finance acquisitions or integrate the acquired businesses into its business. The Company cannot provide assurance that it can complete any acquisition or business arrangement that it pursues, or is pursuing, on favorable terms, if at all, or that any acquisitions or business arrangements completed will ultimately benefit its business. Further, any acquisition the Company makes will require a significant amount of time and attention of its management, as well as resources that otherwise could be spent on the operation and development of its existing business.
Any future acquisitions would be accompanied by risks, such as a significant decline in the relevant metal price after the Company commits to complete an acquisition on certain terms; the quality of the mineral deposit acquired proving to be lower than expected; the difficulty of assimilating the operations and personnel of any acquired companies; the potential disruption of its ongoing business; the inability of management to realize anticipated synergies and maximize its financial and strategic position; the failure to maintain uniform standards, controls, procedures and policies; and the potential for unknown or unanticipated liabilities associated with acquired assets and businesses, including tax, environmental or other liabilities. There can be no assurance that any business or assets acquired in the future will prove to be profitable, that the Company will be able to integrate the acquired businesses or assets successfully or that the Company will identify all potential liabilities during the course of due diligence. Any of these factors could have a material adverse effect on its business, expansion, results of operations and financial condition.
Mining is inherently dangerous and subject to conditions or events beyond the Company’s control, which could have a material adverse effect on its business and which conditions and events may not be insurable.
20 | ALAMOS GOLD INC.
ANNUAL INFORMATION FORM - 2016
Mining involves various types of risks and hazards, including, but not limited to:
• | Environmental hazards; |
• | Industrial accidents; |
• | Metallurgical and other processing problems; |
• | Unusual or unexpected rock formations; |
• | Rock falls, pit wall failures and cave-ins; |
• | Seismic activity; |
• | Flooding; |
• | Fires; |
• | Periodic interruptions due to inclement or hazardous weather conditions; |
• | Variations in grade, deposit size, continuity and other geological problems; |
• | Mechanical equipment performance problems; |
• | Unavailability of materials and equipment; |
• | Theft of equipment, supplies and bullion; |
• | Labour force disruptions; |
• | Civil strife; and |
• | Unanticipated or significant changes in the costs of supplies. |
Most of these risks are beyond the Company’s control and could result in damage to, or destruction of, mineral properties, production facilities or other properties, personal injury or death, loss of key employees, environmental damage, delays in mining, increased production costs, monetary losses and possible legal liability.
The business of exploration for minerals and mining involves a high degree of risk, as few properties that are explored are ultimately developed into producing mines.
The Company is engaged in exploration, mine development and the mining and production of precious metals, primarily gold, and is exposed to a number of risks and uncertainties that are common to other companies in the same business. Unusual or unexpected ground movements, fires, power outages, labour disruptions, flooding, cave-ins, landslides and the inability to obtain suitable adequate machinery, equipment or labour are risks involved in the operation of mines and the conduct of exploration programs. The Company has relied on and may continue to rely upon consultants and others for mine operating and exploration expertise. Few properties that are explored are ultimately developed into producing mines. Substantial expenditures are required to establish ore reserves through drilling, to develop metallurgical processes to extract the metal from the ore and in the case of new properties, to develop the mining and processing facilities and infrastructure at any site chosen for mining. Although substantial benefits may be derived from the discovery of a major mineral deposit, the Company may not be able to raise sufficient funds for development. The economics of developing mineral properties is affected by many factors including the cost of operations, variations in the grade of ore mined, fluctuations in metal markets, costs of mining and processing equipment and such other factors as government regulations, including regulations relating to royalties, allowable production, importing and exporting of minerals and environmental protection. Where expenditures on a property have not led to the discovery of mineral reserves, spent costs will not usually be recoverable.
The trading price of the Company’s common shares may be subject to large fluctuations and may increase or decrease in response to a number of events and factors.
These factors may include:
• | The price of gold and other metals; |
• | The Company’s operating performance and the performance of competitors and other similar companies; |
• | The public’s reaction to the Company’s press releases, other public announcements and the Company’s filings with the various securities regulatory authorities; |
• | Changes in earnings estimates or recommendations by research analysts who track the Company’s common shares or the shares of other companies in the resource sector; |
21 | ALAMOS GOLD INC.
ANNUAL INFORMATION FORM - 2016
• | Changes in general economic conditions; |
• | The arrival or departure of key personnel; and |
• | Acquisitions, strategic alliances or joint ventures involving the Company or its competitors. |
In addition, the market price of the Company’s shares are affected by many variables not directly related to the Company’s success and are therefore not within the Company’s control, including other developments that affect the market for all resource sector shares, the breadth of the public market for the Company’s shares, and the attractiveness of alternative investments. In addition, securities markets have recently experienced an extreme level of price and volume volatility, and the market price of securities of many companies has experienced wide fluctuations which have not necessarily been related to the operating performance, underlying asset values or prospects of such companies. The effect of these and other factors on the market price of the common shares on the exchanges in which the Company trades has historically made the Company’s share price volatile and suggests that the Company’s share price will continue to be volatile in the future.
MINERAL PROPERTIES
The Company considers its Young-Davidson Mine and Mulatos Mine material mineral projects for purposes of NI 43-101. Set forth below is certain mining and technical information in relation to those mines and certain of the Company’s other mines and projects.
YOUNG-DAVIDSON MINE
Summary
The Young-Davidson Mine is located near the town of Matachewan, approximately 60 kilometres west of Kirkland Lake in Northern Ontario. The property consists of contiguous mineral leases and claims totaling 11,000 acres and is situated on the site of two past producing mines that produced almost one million ounces of gold between 1934 and 1957. The Young-Davidson Mine consists of an underground mine, currently mining at a rate of between 6,500 and 7,500 tonnes per day, a conventional flotation and carbon-in-leach (CIL) mill and associated infrastructure. The mine has been in continuous operation since 2012.
Property Description, Location and Access
The Young-Davidson Mine is located in northern Ontario, Canada, centrally located between Timmins, Kirkland Lake, North Bay and Sudbury, each of which have businesses that service the mining industry. The property is accessed by paved Highway 566, 3 kilometres west of the town of Matachewan.
The Company owns 100% of the mineral rights to all of the mineral resource related claims at the former Young-Davidson Mine and the adjoining Matachewan Consolidated Mines Limited Mine (the “MCM Mine”), which together comprise the modern day Young-Davidson Mine. The Company also holds the mineral rights to 200 tenures from mining leases to exploration claims covering 4,734 hectares surrounding and including the Young-Davidson Mine. The contiguous claim block that covers the Young-Davidson Mine is hereinafter referred to as “Young-Davidson”. These tenures were acquired either through staking, application, or option agreements.
Collectively, Young-Davidson is subject to nine separate agreements with different obligations and royalties for each agreement. Based on the currently defined mineral reserves and resources, the only royalties to apply are:
(i) | a sliding scale royalty held by Matachewan Consolidated Mines Limited that relates to the eastern portion of the open pit and a small portion of the underground resource, which together total approximately 1,000,000 tonnes; |
(ii) | a per ton royalty held by the Welsh Estate that affects almost 424,000 tonnes; and |
(iii) | a 1.5% net smelter return due to AuRico Metals Inc., applicable since July 2015. |
The Company controls sufficient surface rights to cover the sites required for all project buildings and fixed installations for the life of mine. The Company believes it has all of the necessary surface rights to dispose of waste rock and tailings on additional
22 | ALAMOS GOLD INC.
ANNUAL INFORMATION FORM - 2016
areas of the property. Alamos’ land ownership and mineral tenures are registered with the Government of Ontario. All permits required to operate the Young-Davidson Mine are currently in place.
As Young-Davidson was the site of two former producing gold mines there is existing surface disturbance in the form of old workings, building foundations and tailings sites. Although there is no clean up order on these sites, infrastructure was designed to incorporate these sites where possible so that they are remediated as part of the mine closure plan.
Other than as described above, the Company is not aware of any rights, agreements or encumbrances to which Young-Davidson is subject, which would adversely affect the value of the property or Alamos’ ownership.
The daily average mean temperature in nearby Kirkland Lake, Ontario is 1.7°C. The extreme maximum recorded temperature is 38.9°C and the extreme minimum temperature is -47°C. The average annual precipitation is 884 millimetres, comprising 590 millimetres as rainfall and 294 millimetres as snowfall. Given this climate, exploration and mining development activities can be carried out at all times of the year.
The surface rights possessed by the Company are sufficient for planned mining operations, availability of sources of power, water, mining personnel, potential tailings storage areas, and potential waste disposal. Electricity is provided from the provincial grid through a transmission line that was upgraded prior to commercial production.
The property is typical of northern Ontario with forest covered low rolling hills, small lakes and wetlands with numerous gravel roads providing access to all areas of the property. Average elevation on the property is 330 metres above sea level.
History
The initial discovery of gold in the project area was made by prospector Jake Davidson in 1916 on what became the former Young-Davidson Mine. This sparked a staking rush that resulted in a second discovery by Samuel Otisse on what became the MCM Mine property. Surface prospecting, trenching and outcrop stripping continued intermittently for the next seventeen years on both properties. During this time a joint venture was established between Hollinger Corporation and Young-Davidson Mines Limited and underground mine production was initiated in 1934 and continued until 1957, over which time a total of 5.6 million tonnes were mined producing 585,690 ounces of gold (3.22 g/t recovered grade). Production from the MCM Mine property over the period 1934-1954 totaled 3.2 million tonnes, and 378,101 ounces of gold (3.67 g/t recovered grade). Following closure of the mines, the properties remained dormant until 1980 at which time Pamour Mines concluded option/joint venture agreements on both properties with the aim of establishing an open pit operation. Approximately 96,000 tonnes of ore were mined and trucked to the Pamour mill facility east of Timmins.
In 1995, Royal Oak Mines Inc. (“Royal Oak”), a successor company to Pamour Mines, initiated extensive diamond drilling to define an open pit resource, initiated shaft dewatering with a view to underground exploration, conducted shaft rehabilitation as well as engineering studies and environmental assessment studies with a view to re-opening the mines. Following the bankruptcy of Royal Oak, the property was dormant for several years before being acquired by a private company in 2000. This private company undertook limited exploration and, in 2002, vended the asset into Young-Davidson Mines Limited, the same company that had discovered the property. Young-Davidson Mines Limited re-initiated exploration with 9,312 metres of drilling in 58 diamond drill holes.
In late 2005, Northgate Minerals Corporation (“Northgate”) amalgamated with Young-Davidson Mines Limited through a plan of arrangement, and proceeded with surface exploration, particularly diamond drilling, environmental and engineering studies and underground exploration and development.
In 2011, AuRico acquired Northgate, which included Young-Davidson.
In 2015, AuRico and Former Alamos combined to form Alamos.
23 | ALAMOS GOLD INC.
ANNUAL INFORMATION FORM - 2016
Geological Setting, Mineralization and Deposit Types
Young-Davidson is situated within the southwestern part of the Abitibi Greenstone Belt. The Abitibi Greenstone Belt consists of a complex and diverse array of volcanic, sedimentary, and plutonic rocks typically metamorphosed to greenschist facies grade, but locally attaining amphibolite facies grade. Volcanic rocks range in composition from rhyolitic to komatiitic and commonly occur as mafic to felsic volcanic cycles. Sedimentary rocks consist of both chemical and clastic varieties and occur as both intravolcanic sequences and as uncomformably overlying sequences. A wide spectrum of mafic to felsic, pre-tectonic, syn-tectonic and post-tectonic intrusive rocks are present. All lithologies are cut by late, generally northeast-trending proterozoic diabase dikes.
The Abitibi Greenstone Belt rocks have undergone a complex sequence of deformation events ranging from early folding and faulting through later upright folding, faulting and ductile shearing resulting in the development of large, dominantly east-west trending, crustal-scale structures that form a lozenge-like pattern. The regional Larder Lake-Cadillac Fault Zone (“LLCFZ”) cuts across the Young-Davidson Project area. The LLCFZ has a sub-vertical dip and generally strikes east-west. The LLCFZ is characterized by chlorite-talc-carbonate schist and the deformation zone can be followed for over 120 miles from west of Kirkland Lake to Val d’Or, Québec.
There are three important groups of archean sedimentary rocks in the district. The oldest are Pontiac Group quartz greywacke and argillite, which occur as thick assemblages in Québec, while interbedded within the Larder Lake Group volcanic rocks are turbiditic siltstones and greywackes of the Porcupine Group. Uncomformably overlying is Timiskiming Group Conglomerate, turbidite and iron formation with minor interbedded alkalic volcaniclastic units.
Archean intrusive rocks are numerous in the district but are largely manifested as small stocks, dikes and plugs of augite syenite, syenite and feldspar porphyry occurring in close temporal and spatial association with the distribution of Timiskiming Group sediments. The main syenite mass, which hosts most of the gold mineralization on Young-Davidson, measures almost 3,000 ft. east-west by 1,000 ft. north-south.
Huronian proterozoic sedimentary rocks onlap and define the southern limit of the Abitibi in Ontario. In the project area these rocks are correlative to the Gowganda Formation tillite. Post-Archean dike rocks include Matachewan diabase and younger Nipissing diabase, which respectively bracket the Huronian unconformity in the project area.
Essentially all of the historical production at the former Young-Davidson Mine and approximately 60% of the production from the MCM Mine was from syenite-hosted gold mineralization. Most of the current open pit and underground resources are also related to syenite-hosted gold. The syenite-hosted gold mineralization consists of a stockwork of quartz veinlets and narrow quartz veins, rarely greater than a few inches in thickness, situated within a broader halo of disseminated pyrite and potassic alteration. Visible gold is common in the narrower, glassy-textured quartz veinlets. In general, gold grades increase with quartz veinlet abundance, pyrite abundance, and alteration intensity. Mineralized areas are visually distinctive and are characterized by brick red to pink K-feldspar-rich syenite containing two to three percent disseminated pyrite and several orientations of quartz extension veinlets and veins. The quartz veins and veinlets commonly contain accessory carbonate, pyrite, and feldspar.
Exploration
There has been no recent exploration undertaken at Young-Davidson with the exception of the drilling programs outlined in the next section.
Drilling
Since the discovery of gold in the project area until October 14, 2008 a total of 293,774 metres of surface and underground diamond drill holes were completed. With the exception of the holes pre-dating 1980 (324 holes, 20,236 metres), all of the drill logs have been preserved. All holes have been plotted on historic records and these hole traces and assays have now been entered into the database. All holes since 1988 have been surveyed for their collar co-ordinates and it is assumed that all pre-1988 underground hole collars were surveyed as per industry practice at the time of production. Since 1980 all holes have been down
24 | ALAMOS GOLD INC.
ANNUAL INFORMATION FORM - 2016
hole surveyed using a tropari instrument or acid test and since 2006 all drill holes have been surveyed using FLEXIT and/or a gyroscopic instrument in order to measure down hole deviation.
Underground drill holes were AQ core (27 mm diameter) as was the practice of the day, surface holes pre-dating AuRico were, with one exception, BQ core (36.5 mm diameter) and all holes by AuRico (and the one exception) have been NQ core (47.6 mm diameter) except where a reduction to BQ (36.5 mm diameter) has been required to complete the hole in problematic ground conditions. Core recovery and rock quality designations have not been noted in historic drill logs, however in all the holes by AuRico core recovery has been excellent and the rock quality designation (“RQD”) factor has been very high indicating very competent rock.
From 2009 to 2015, a total of 269 surface exploration drill holes were completed for a total of 136,076 metres. No surface exploration was undertaken in 2016.
From 2009 to 2015 a total of four underground exploration drill holes were completed for a total of 918 metres. No underground exploration was undertaken in 2016.
From 2009 to 2016 a total of 1,707 underground infill drill holes were completed for a total of 227,473 metres.
Sampling, Analysis and Data Verification
Drill core is transported directly from the drill rigs to the secure core logging facility. Core is logged with geological information being recorded, including rock type, degree of alteration, estimated percentage of sulfide minerals and vein intensity. Zones of interest are marked out and assigned a sample number and assay tags are stapled into the box as well as being inserted into the sample base. Most of the core has been split with a hydraulic splitter, with a small number of samples cut with a diamond bladed core saw. The majority of the samples are 1.5 metres in core length and most of the historic samples are in five foot lengths. Assay procedures were not well documented prior to 2003, but it is assumed that conventional crushing, pulverizing and classical fire assay techniques were used.
Prior to sample shipment, a number of measures have been implemented which were designed to maintain a high level of security at the core logging facility, at the mine property and while the samples are in transit.
Upon arrival at the ALS Global laboratory, samples were logged into the laboratory tracking system and weighed. Each core sample was entirely crushed to better than 70% -2 millimetre (minus 10 mesh). A 250 gram split of crushed material was taken and pulverized. Certified reference material (“CRM”) and blanks were inserted with samples prior to analysis. Fifty gram aliquots were weighed for fire assay. Fire assay fusion was by lead flux with a silver collector and atomic absorption finish. Each sample was also submitted for a 34 element analysis, aqua-regia acid digestion and ICP-AES. This process quantitatively dissolves base metals for the majority of geological materials. Major rock forming elements and more resistive metals are only partially dissolved. All sample batches were subjected to the laboratory’s internal quality control procedures.
All mine samples, including blasthole, underground channel, and underground drill core are assayed at the on-site laboratory operated the Company. We have been advised by ALS Global that the laboratory is well- equipped, fully ventilated, and staffed by experienced personnel. Samples are prepared and analyzed as described above. The mine laboratory is externally audited on a periodic basis. A check assay program and participation in an international round robin was initiated in 2014.
No information has been compiled that describes the quality control (“QC”) and quality assurance (“QA”) procedures for the pre-2003 drilling, however it is unlikely that blanks and CRMs were used as this did not become standard industry practice until the early 2000’s. The main form of QA/QC would have been periodic re-assaying of anomalous samples with introduction of blanks in the early 1980s and 1990s.
The QA/QC for the 2006, 2007 and 2008 programs is documented in the technical documents filed on SEDAR at www.sedar.com. In essence this data amounted to four percent of the entire population of samples submitted for analysis, including blanks, standards, and duplicates. Additionally, about 15-20% of pulp replicates and 2.5% of reject duplicates were analyzed and incorporated into final assay grade to improve overall precision. The QA/QC data is monitored as the samples are being processed at the laboratories and where analytical problems are identified the laboratory is required to reanalyze the samples.
25 | ALAMOS GOLD INC.
ANNUAL INFORMATION FORM - 2016
Based on this work it was concluded that the data is reliable and suitable for supporting mineral resource and mineral reserve estimation work in the opinion of the Qualified Person.
The project data base has been subject to verification or audit by Micon International Inc. (2004), Scott Wilson Roscoe Postle Associates Inc. (2006), AMEC plc (2008) and Company geologists (2006, 2007 and 2008) who had no direct involvement with the project. Collar co-ordinates, down hole survey tests and assay intervals were verified against a variety of supporting documentation. Where errors have been identified these were corrected and procedures put in place to prevent re-occurrence and to expedite future data verification programs. In each case the third party audit has concluded that the database is valid and acceptable for supporting resource estimation work on the project.
Mineral Processing and Metallurgical Testing
The metallurgical testwork programs considered for feasibility study were completed in 2008 and early 2009 at SGS Lakefield. Results of these tests provided the data used for the design criteria.
The tests were conducted on samples from 32 holes selected across the mineralization from which five zone composites and a master composite were prepared. Flowsheet optimization was conducted on the master composite. Once the metallurgical parameters were optimized, the five zone composite and 32 individual samples were used for variability testing.
The grinding characteristics of the design mineralized material, an equal mixture of Upper Boundary Zone, Lower Boundary Zone and Pit Zone material as combined material for pilot plant feed gives an average Bond Work Index of 15.6 kilowatt hours per tonne (“kWh/t”) at 100 mesh (106 micrometer (“µm”)) of grind. The selected six zone samples work index ranged from 14.7 to 18.3 kWh/t. Most samples tested fell in the medium to hard range of hardness with respect to impact breakage and Bond rod mill/ball mill grindability work indices while there was one waste sample which fell in the very hard range of hardness. All samples have been classified as abrasive or very abrasive.
The gravity recoverable gold was determined to be about 25% of the gold contained in the composite sample tested when cleaning of the primary centrifugal concentrator product on a Mozley table was completed to a target 0.05% weight recovery of the initial feed material.
Mineral Reserve and Mineral Reserve Estimation
Mineral resource and mineral reserve estimates can be found in the section following Other Mineral Properties.
Mining Operations
Open pit mining commenced in November 2011, and ceased in June 2014, upon depletion of the in-situ mineral reserve. While the mining of the open pit has ceased, a sizeable stockpile of open pit ore was established that will be used to augment underground production until the underground mine can provide the entire mill feed. Over the life of the open pit, approximately 20.9 Mt of waste rock was generated by the open pit and placed in the waste dump to the north of the pit.
Commercial production was declared for the Young-Davidson open pit mine and mill effective September 1, 2012. Commercial production was declared once the open pit mine achieved previously established commissioning thresholds. The commissioning thresholds included a 30-day period whereby the mill throughput averaged at least 5,100 tonnes per day (subsequent to the commissioning of the flotation) and the open pit averaged 29,750 tonnes per day of ore and waste mining.
In October 2013, the Company commissioned the mid-shaft loading pocket and shaft hoisting infrastructure, and began hoisting underground ore to surface via the Northgate shaft. Prior to October 2013, ore was being trucked to surface through the exploration ramp. On October 31, 2013, commercial production at the Young-Davidson underground mine was achieved.
The underground deposit is located approximately 210 metres to 1,500 metres below surface. During 2013, AuRico completed the sinking of the Northgate shaft down to the mid-shaft loading pocket, which accesses the first eight years of mine production. The Company continues to work on developing vertical access in the underground mine below that of the mid-shaft loading pocket, to an eventual depth of 1,500 metres. In 2015 the existing MCM #3 shaft was extended to a depth of 1,500 metres to provide for the hoisting of personnel, materials, and ore and waste. Commissioning of the MCM #3 shaft was completed in the
26 | ALAMOS GOLD INC.
ANNUAL INFORMATION FORM - 2016
first half of 2016. The mine is also accessed by a ramp, which is being extended to the bottom of the mine from the existing exploration ramp, currently at a depth of 985 metres below surface. The mine design has taken into consideration the existing MCM #3 and the Young-Davidson shafts and other existing openings for ventilation. Additional ventilation raises to surface have been established and the underground ventilation circuit continues to be upgraded as the mine deepens.
The underground mine has been designed for low operating costs through the use of large modern equipment, gravity movement of ore and waste through raises, shaft hoisting, minimal ore and waste re- handling, high productivity bulk mining methods and paste backfill. The mining method employed is a combination of transverse and longitudinal stoping, followed by paste backfill, on 30 metre sub-levels. Given the significant orebody widths it is expected that approximately 90% of the remaining reserves will be transversely mined. The mine operates scooptrams to load, haul and transfer stope production to the ore pass system from where it is hoisted to the surface via two 18 tonne skips in the Northgate shaft.
At the current design production rates of 2.92 million tonnes per year (8,000 tonnes per day) at full production, the underground will have a mine life of approximately 15 years based on the current mineral reserve. Production from the underground mine will be complemented by stockpiled open pit ore until it can provide the entire mill feed.
Lateral development of the underground mine will average approximately 12,000 metres per year including capital, operating and ore categories for the first 10 years of the underground mine operation. In the last 5 years of the underground mine life, the development requirements drop off sharply as the mine is close to being fully developed.
The average underground mining personnel requirements at 8,000 tonnes per day are estimated to be approximately 350 persons. The mine operates seven days a week with two 10.5 hour shifts per day working a five days on and four days off followed by four days on and five days off schedule. Once at full capacity, the mine will be fully owner operated with only diamond drilling and raising being contracted.
Milling Operations
The metallurgical test programs supported the selection of single stage semi-autogenous grinding circuit with a gravity circuit followed by flotation. The flotation concentrate is further ground and leached in a conventional carbon-in-leach. The flotation tailings are also leached in a carbon-in-leach circuit. The gold is recovered from the carbon followed by electro-winning and pouring doré bars.
The combined leach tailings were used for the cyanide destruction testwork. The Young-Davidson carbon-in-leach tailings are treated with the SO2/Air cyanide destruction method.
In January 2014 a paste backfill plant was commissioned and is capable of supplying paste fill to the underground voids at a rate in excess of 8,000 tonnes per day.
Infrastructure, Permitting and Compliance Activities
Existing infrastructure at the Young-Davidson Mine includes the Northgate and MCM shafts and headframes, the access ramp portal, surface ventilation equipment, an 8,000 tonne per day conventional CIL mill, an 8,000 tpd paste backfill plant, a tailings dam, various office and workshop buildings, and two power lines connected to the provincial grid. Paved highway access exists to the mine site.
The Young-Davidson Mine requires no additional permits for continued operation and the mine is in compliance with all regulatory requirements. The Company has recorded an asset retirement obligation liability of $6.3 million which it expects to settle during the course of mining and on closure.
The Company entered into Impact Benefit Agreements with the Matachewan First Nation on July 2, 2009 and with the Temagami First Nation / Teme Augama Anishnabai on July 14, 2012, as the Young-Davidson Mine is situated within the traditional territory of these two First Nations.
27 | ALAMOS GOLD INC.
ANNUAL INFORMATION FORM - 2016
Capital and Operating Costs
Actual results for 2015 and 2016, and guidance for 2017 production, operating costs and capital are depicted below.
2015 Actual | 2016 Actual | 2017 Guidance | |||||
Gold Production | (ounces) | 160,358 | 170,000 | 200,000 -210,000 | |||
Cost of sales, including amortization | ($/ounce) | 1,162 | 1,087 | 1,050 | |||
Total Cash Costs (1) | ($/ounce) | 683 | 657 | 625 | |||
Mine Site All-in Sustaining Costs (1) | ($/ounce) | 986 | 897 | 775 | |||
Capital | ($ millions) | 108 | 95 | 70 - 80 | |||
(1) Refer to Cautionary Non-GAAP measures and Additional GAAP Measures on page 3. Detailed reconciliations of the non-GAAP measures to measures under IFRS for the years ended December 31, 2016 and 2015 can be found in the Company’s MD&A for the year ended December 31, 2016 on pages 25-30.
2017 Outlook
Gold production at the Young-Davidson Mine is expected to increase approximately 21% in 2017 to between 200,000 and 210,000 ounces. Underground mining rates are expected to increase from an average rate of approximately 6,000 tpd in 2016, to a range of between 6,500 and 7,500 tpd in 2017.
Underground mined grades are expected to be consistent with the mineral reserve grade of 2.69 g/t Au in 2017, though can vary as much as 10% from quarter to quarter. Mill throughput is expected to range between 7,600 and 8,000 tpd with stronger throughput in the second half of the year following the addition of a pebble crusher to the circuit. Milled grades are expected to range between 2.35 and 2.60 g/t Au. Mill recoveries are expected to range between 90 and 92%.
Total cash costs are expected to average $625 per ounce gold sold in 2017. Mine-site all-in sustaining costs are expected to average $775 per ounce, more than a 10% decrease from 2016 levels reflecting higher underground mining rates, ongoing productivity improvements and lower sustaining capital spending.
The Company remains focused on reducing capital spending at the Young-Davidson Mine. Capital is expected to total between $70 and $80 million in 2017, including $30 to $35 million of sustaining capital. This represents a $20 million decrease from approximately $95 million in 2016. Spending in 2017 will be focused on the ongoing development of the upper and lower mine, completion of the MCM waste pass, raise boring of the lower leg of the Northgate shaft and the addition of a pebble crusher. Approximately 60% of the 2017 capital budget is expected to be spent in the first half of the year.
MULATOS MINE
Summary
The Mulatos Mine is located 220 kilometres east of Hermosillo in the state of Sonora in northwest Mexico. The Company owns 100% of the Mulatos Mine and several other prospective exploration targets throughout the district. The mine includes both open pit and underground mines, a crushing and heap leaching facility, a high grade mill, gold processing facilities and related infrastructure. The mine was developed by Former Alamos and has been in continuous operation since 2005.
Project Description, Location and Access
The Mulatos Mine is located in the Sierra Madre Occidental mountain range in the east-central portion of the state of Sonora, Mexico. Alamos controls several large mineral concessions, which are located mostly to the west, southwest and north-northeast of the Mulatos Mine. A total of 28,773 hectares of mineral concessions, in 43 discrete concessions, are controlled by Alamos. The mineral concessions were awarded to Former Alamos by the Mexican Department of Economy (the “Direccion General
28 | ALAMOS GOLD INC.
ANNUAL INFORMATION FORM - 2016
de Minas”). The property is approximately 220 kilometres by air east from the city of Hermosillo, and 300 kilometres south of the United States border. Alamos maintains an administration office in Hermosillo, Mexico which supports the activities and operations of the Mulatos Mine.
The Mulatos group of concessions cover the Mulatos deposit and satellite gold systems known as Cerro Pelon, La Yaqui, El Carricito, El Halcon, Las Carboneras, El Jaspe, Puebla, Los Bajios, and La Dura (the “Mulatos Group of Concessions”). The Mulatos deposit is itself divided into a number of mineralized zones known as Estrella, Mina Vieja, El Salto, Escondida, Gap, El Victor, El Victor North, San Carlos, Puerto del Aire, Puerto del Aire Extension, and East Estrella. Mineral rights for all concessions comprising the Mulatos Group of Concessions are controlled by Minas de Oro Nacional (“MON”), the Mexican subsidiary of Alamos.
Surface rights in the exploitation area are held both privately and by the Mulatos Ejido. In December 2016, the Company and the Ejido Mulatos entered into a new temporary occupation agreement (the “2016 Agreement”). The 2016 Agreement, among other things, provided for the dismissal of several lawsuits related to both the Company’s operations and prior occupation agreements; as well, replaced all prior temporary occupation agreements governing the communal land underlying the Mulatos Mine. The 2016 Agreement provides for both annual rent payments to Ejido Mulatos members (both individually and collectively); as well, additional success fee type payments, better aligning the interest of the Company and the local community.
Pursuant to a royalty agreement dated March 23, 2001 (the “RTE Agreement”), a 5% NSR royalty is payable until such time as the first 2,000,000 ounces of gold have been mined, processed and sold (or deemed sold) from the Mulatos Group of Concessions (the “Placer Kennecott Royalty” or the “Royal Gold Royalty”). Royal Gold, Inc. subsequently acquired the Placer Kennecott Royalty. As at December 31, 2016, the royalty had been paid or accrued on approximately 1.7 million ounces of applicable gold production.
The Mulatos Group of Concessions are accessible via a combination of a paved road (Highway 16) from the city of Hermosillo, Mexico and dirt roads direct to the Mulatos Mine. The driving time from Hermosillo to the Mine is approximately 6 hours. In 2010, Former Alamos built and permitted a new unpaved airstrip within the limits of the mine property.
The town of Mulatos is in the municipality of Sahuaripa and is located approximately 0.5 kilometres northeast of the Estrella Pit. The population of the town of Mulatos is less than 100 people. The Company is currently engaged in a relocation program. Larger towns within 100 kilometres of Mulatos include Yecora with a population of 10,000, located southwest of Mulatos, and Sahuaripa with a population of 7,000, located northwest of Mulatos.
From July to September, the air is humid and hot, typically around 30 degrees Celsius during the day. In this period, over half of the average annual rainfall of 0.8 metres falls. The winter months (November to February) are cooler, generally between 15 and 20 degrees Celsius during the day, with occasional frost occurring at night.
History
Mulatos was known to contain gold dating back to the 1600’s, with sporadic artisanal mining occurring over the years, especially in the area of Mina Vieja. Starting in the mid-1900’s, several companies began to show interest in the claim areas, notably Minera Real de Angeles, Kennecott and Placer, with a substantial amount of exploration work conducted between 1993 and 1999. A preliminary feasibility study was completed on the property in 1998 by Kennecott and Placer who had entered into a joint venture agreement covering the deposit and a portion of the surrounding land.
In 2001, National Gold Corporation acquired a 100% interest in the property for cash and a sliding-scale royalty on the first two million ounces of gold production. In 2003, Alamos Minerals Ltd. acquired an option on the property, and subsequently merged with National Gold Corporation to consolidate 100% ownership.
After completion of a feasibility study in 2004, an open pit operation with crushing and conveying to a heap leach pad at a rate of approximately 10,000 tpd was constructed. The operation commenced production in April 2006. Since 2006, the Mulatos crushing facility has undergone numerous expansions and optimizations to both increase capacity to a nominal 18,500 tpd and provide for a consistent 100% passing -3/8” crush size.
29 | ALAMOS GOLD INC.
ANNUAL INFORMATION FORM - 2016
In addition to the existing heap leach operations at the Mulatos Mine, between 2009 and 2012, Alamos developed the Escondida high-grade zone and constructed a mill to process high-grade ore from Escondida. The high grade Escondida deposit was depleted in the second quarter of 2014. Alamos commenced underground development of the San Carlos high grade underground deposit in 2015 and undertook modifications to the mill to cater to the specific metallurgy of San Carlos.
Geological Setting, Mineralization and Deposit Types
The Mulatos mineral deposits are large epithermal, high-sulfidation, disseminated, gold deposits hosted within a mid-Tertiary dacitic dome complex. Gold mineralization is closely associated with silicic alteration within extensive areas of argillic and advanced argillic alteration. The Mulatos deposit proper is composed of the contiguous Estrella, El Salto, Mina Vieja, and Puerto del Aire resource areas. The Escondida deposit is the faulted extension of the Mina Vieja and El Salto sub-deposits and is believed to be continuous to the northeast with the Gap, El Victor and San Carlos mineralized areas. Although zones are often bounded by post-mineral faults, together they form a trend of 2.7 kilometres of gold mineralization starting at the north end of the Estrella pit to the San Carlos deposit.
Within the larger Mulatos Group of Concessions, and generally within 20 kilometres from the Mulatos deposit, geologically similar high sulfidation gold deposits, occurrences, or prospects are known. The principal ones, some of which are in the process of being evaluated and/or drill-tested, are: Cerro Pelon, La Yaqui, El Carricito, El Halcon, Las Carboneras, El Jaspe, Puebla, Los Bajios, and La Dura.
Gold deposits of the Mulatos district are considered to be high sulphidation-state epithermal systems. Epithermal precious metal systems may be classified as high, intermediate, and low sulphidation styles. They are characterized by the sulphidation state of the hypogene sulphide mineral assemblage, and show general relations in volcano-tectonic setting, precious and base metal content, igneous rock association, proximal hypogene alteration, and sulphide abundance. Ore in all occurrences is of the type formed under epizonal conditions, that is, generally within 2 kilometres of the paleo-surface. Past workers have referred to high sulphidation systems as acid-sulphate, enargite-gold, or alunite-kaolinite systems.
Most high-sulphidation systems are associated with coeval andesite to dacite volcanic arcs, and are hosted by extensive “pre-mineral” advanced argillic lithocaps. The principle ore host is vuggy residual silica, typically developed by intense acidic leaching of a pre-existing porphyritic dacite host rock. Proximal alteration comprises hypogene dickite, alunite (often crystalline), and/or pyrophyllite. Sulphides include enargite, pyrite, and luzonite. Quartz veining is extremely rare, but some deposits are overprinted by late barite and quartz veins. Laterally extensive sheets of intensely silicified rocks occur in many districts, and represent zones of lateral outflow of mixed hydrothermal and meteoritic water. Silica is transported in the acidic hydrothermal water, and on intersection with the paleowater table, undergoes neutralization and deposition of silica forming cryptocrystalline silica sheets. Most high-sulphidation deposits are large, low grade bulk-tonnage systems (“Yanacocha”), though vein-hosted high sulphidation deposits also occur (“El Indio”).
In contrast, low and intermediate sulphidation state systems are typically related to quartz and carbonate veins, near-neutral hydrothermal fluids, and lack proximal advanced argillic alteration and residual vuggy silica. Steam-heated alteration is present above some intermediate and low sulphidation state systems advanced argillic assemblages. However, they usually comprise low-temperature kaolinite, and fine grained alunite. Sulphides are of a low to intermediate sulphidation state. Gold occurs in oxide, mixed oxide/sulphide, and sulphide ore types, with pyrite as the primary sulphide mineral. The deposits are amenable to cyanidation in all ore types, but gold extraction decreases with decreasing levels of oxidation.
Precious metal mineralization at Mulatos is associated with intense silicic alteration (mostly vuggy silica), advanced argillic alteration, and the presence of hydrothermal breccias. The original protolith (dacite porphyry flow/tuff, coarse grained volcaniclastic rocks, breccias), as indicated by surface mapping and core drilling, may have contained in the order of 2-3 percent sulphide as pyrite with various amounts of enargite and tetrahedrite. The principle gold bearing host rock is interpreted as favoured for mineralization due to relatively high primary porosity and its intense fracturing.
Gold mineralization within the Mulatos deposit occurs primarily within areas of pervasive silicic alteration of the volcanic host rocks, and to a lesser extent, within advanced argillic alteration assemblages proximal to silicic alteration. The gold-bearing advanced argillic zones are dominated by pyrophyllite or dickite alteration. Silicic rocks host approximately 80 percent of the contained gold within the deposit. There are three main mineralization assemblages. From oldest to youngest they are: 1) quartz
30 | ALAMOS GOLD INC.
ANNUAL INFORMATION FORM - 2016
+ pyrite + pyrophyllite + gold; 2) quartz + pyrite + kaolinite + gold + enargite; 3) kaolinite + barite + gold. Free gold is commonly found in hematite-filled fractures. Gold also occurs in pyrite, as gold/silver telluride minerals, and possibly as a solid solution in some copper sulphide minerals. Supergene oxidation and perhaps remobilization and secondary enrichment of gold have been ongoing since the post-mineral volcanic cover was removed (in those specific deposits where it has been removed).
Exploration
Substantial drilling programs have been completed by Alamos since its 2004 feasibility study. Including drilling completed in conjunction with the 2004 Feasibility Study, the property has now been subject to over 778,970m of drilling in 4,671 holes. The majority of this drilling was completed in proximity to the Mulatos deposit, however, more recently drilling activities have focused on delineating other deposits in the district such as La Yaqui and Cerro Pelon and testing other regional exploration targets such as El Carricito.
In the second half of 2015 and all through 2016, Alamos exploration focused mainly on the La Yaqui deposit with 46,809m drilled during 2016. Exploration focus has been on a large northwest trending silica ridge that sits to the northeast of previously known mineralization. Since the end of 2015, exploration has been defining new resources along this ridge and exploration there is still underway. Some drilling was also undertaken at Cerro Pelon and adjacent to the Escondida deposit (part of the main Mulatos open pit) in 2016. The main areas under exploration at Cerro Pelon are immediately north-northeast of the previously defined mineral reserve pit, further north under a massive silica cap and to the northwest of the mineral reserve pit over a newly outlined area of favourable alteration and structure.
During 2016, a full and detailed review and ranking of all prospects in the district was undertaken with 1, 2 and 5 year exploration plans outlined. In addition, mapping, sampling and Induced Polarisation geophysics were carried out on the Los Bajios Project that sits approximately 3km to the northwest of Mulatos open pit.
Drilling
Drilling statistics for 2016 and project-to-date are presented below:
2016 Core Drilling
Zone Drilled | Drill Holes Completed (# 2016) | Drill Holes Project (#) | Drilling 2016 (m) | Drilling Project (m) |
La Yaqui | 200 | 249 | 40,393 | 49,469 |
Cerro Pelon | 68 | 157 | 14,172 | 25,207 |
La Escondida (Mulatos Deposit) | 7 | 239 | 1,035 | 21,113 |
Other areas prior to 2016 | 0 | 774 | 0 | 125,317 |
Total | 275 | 1,419 | 55,600 | 221,106 |
31 | ALAMOS GOLD INC.
ANNUAL INFORMATION FORM - 2016
2016 Reverse Circulation Drilling
Zone Drilled | Drill Holes Completed (# 2016) | Drill Holes Project (#) | Drilling 2016 (m) | Drilling Project (m) |
La Yaqui | 30 | 163 | 6,416 | 24,940 |
Cerro Pelon | 22 | 165 | 4,892 | 30,505 |
La Escondida (Mulatos Deposit) | 22 | 366 | 5,934 | 27,425 |
Other areas prior to 2016 | 0 | 2,558 | 0 | 474,993 |
Total | 74 | 3,252 | 17,242 | 557,863 |
Exploration work programs in Mexico are carried out under the guidance of Aoife McGrath, M.Sc., M. AIG., Vice President Exploration, for the Company. Ms. McGrath is a Qualified Persons, as defined by National Instrument 43-101.
Mulatos Main Zone
The Mulatos Main Zone is a continuous zone of mineralisation that comprises the La Estrella, La Escondida, Mina Vieja, El Salto, Puerto del Aire, Gap, El Victor, El Victor North and San Carlos (open pit) deposits. This whole zone shows similar geological characteristics with comparable styles of mineralization. Dacitic and rhyodacitic rocks have undergone intense silica alteration (often vuggy) which is the key host for mineralisation. These zones are often blind, being overlain by a relatively thick sequence of ignimbrite flows. Historically these flows have been referred to as post-mineral but recently acquired data shows portions of it to host vein-style mineralisation. This has been seen at San Carlos and similar potential is currently being investigated in Gap, El Victor and Puerto del Aire. Sets of post-mineral faulting has caused some offset of the mineralisation (to varying extents) throughout this entire zone.
Mineralisation is usually stratiform with some local structural control, especially on high grades and zones of brecciation. This structural control that directly affects higher grades has been identified at La Estrella and Puerto del Aire Deposits and is also likely at Gap. Within the stratiform mineralisation higher grades are sometimes seen along the upper contact of the vuggy silica alteration. Alamos conducted exploration systematically through this zone commencing in 2006 and by the end of 2014 338,470 metres had been drilled.
Limited exploration drilling was conducted on the main zone in 2016 with only 29 holes for 6,969m drilled adjacent to or beneath the whole zone.
Cerro Pelon
During 2008, Alamos announced the discovery of a new gold zone at Cerro Pelon. Cerro Pelon is located approximately 2.5 kilometres southwest of the leach pad area. It was a high-priority target for Alamos and is still today a very important focus for the Company.
Gold at Cerro Pelon is associated with quartz-alunite alteration that is often vuggy in nature. Structural control and hydrothermal brecciation are also key factors associated with mineralisation. The main structural trends are north-northwest and east-northeast. Intrusive rocks, hydrothermal brecciation and mineralisation also follow these trends. Oxidation is very deep along and adjacent to the structures with oxidation and transition / mixed zones extending to 160 metres depth in places. As with all Mulatos exploration, every sample above a cut-off of 0.2 g/t Au is sent for further analysis on cyanide-leachability and these results indicate excellent recoveries (usually greater than 80%) down to the base of the transition / mixed zone.
Drilling was undertaken at Cerro Pelon in 2008 and 2009 with a total of 18,653 metres completed in 142 holes. Geological modelling and 3D modelling was completed in September 2009, followed by a mineral resource estimate in November 2009. The results of the mineral resource calculation were integrated into the global resource & reserve numbers for 2009 and the majority of mineral resources at Cerro Pelon were classified as measured and indicated. Ongoing engineering work and economic
32 | ALAMOS GOLD INC.
ANNUAL INFORMATION FORM - 2016
evaluation initiated in 2009 resulted in an upgrade of a portion of the measured and indicated mineral resources to the reserve category.
In 2014, Alamos executed an agreement to acquire the surface rights to the Cerro Pelon deposit. Closing of the agreement occurred in 2015 and exploration programs re-commenced. A comprehensive mapping and sampling program (742 rock chip samples and 1,850 metres x 1,425 metres covered by mapping and sampling) was undertaken which helped to refine the geological understanding. Full re-logging of the deposit was also undertaken. These programs were followed by exploration (and then infill) drilling with a total of 18,767 metres drilled in 98 holes. These programs have outlined a new zone of high-grade mineralisation about 100m to the north of current pit limits. Excellent drill results were obtained with several intercepts averaging well above the current mineral reserve grade. Some of the best intercepts recorded were 14.47 g/t Au over 50.30 metres (15PEL012), 9.65 g/t Au over 34.60 metres (15PEL020) and 2.46 g/t Au over 94.20 metres and 2.21 g/t Au over 22.60 metres (both from15PEL010).
Exploration in 2016 comprised further detailed mapping and sampling over a new zone to the northwest of the mineral reserve pit. A significant area of favourable silica and argillic alteration was outlined along with numerous north-south trending structures. Mineralisation in the reserve pit (to the southeast) has a strong association with approximately north-south trending structures and silica alteration. Scout drilling commenced over this target in the fourth quarter and wide zones of vuggy silica and anomalous grades have been intersected in the sulphide zone. Multi-element geochemistry is being used to help vector towards higher temperature mineralization and grades are improving as drilling progresses. This program will be ongoing through 2017. In addition to drilling on the northwest zone, scout holes were also drilled beneath the massive silica cap to the north of the reserve pit. This is a large zone that will be systematically explored through 2017. Late in 2016 drilling also re-commenced immediately to the north and along strike from the high-grade shoot discovered in 2015. Mineralisation in this area is strongly controlled by approximately north-south trending structures and drilling through 2017 is planned to further test these structures along strike. Totals of 19,064 metres in 90 holes were drilled at Cerro Pelon in 2016.
La Yaqui
The La Yaqui Project is located approximately 9.5 kilometres southwest of the Mulatos Main Zone. After successful negotiation in 2007 Alamos gained exploration access to La Yaqui for the first time since 1997. Exploration drilling commenced shortly after and continued into 2008 with 11,514 metres drilled in 84 holes.
The results of drilling were incorporated into Alamos’ Measured and Indicated mineral resource statement as of December 31, 2008. In 2009, Alamos completed engineering work and an economic evaluation and reported its first probable mineral reserve in December 31, 2009. Access once again became an issue until 2014, when Alamos executed an agreement to acquire the surface rights. On closing of this agreement Alamos commenced work towards permitting and construction on this project.
Exploration programs began immediately with a detailed mapping and sampling program undertaken in late 2014 and early 2015. A total of 556 rock chip samples were taken and an area of 1,950 metres x 2,210 metres was covered by mapping and sampling. Infill, geotechnical and metallurgical drilling was carried out concurrently with mapping and sampling while exploration drilling commenced afterwards. In 2015 a total of 17,517 metres were drilled on the project in 105 holes.
This drilling intersected ore-grade mineralisation over a one kilometre strike length along the ridge-top to the northeast of in-pit reserves. Mineralisation is associated with quartz-alunite altered dacitic rocks and usually sits below a barren massive silica cap. The drilling carried out in 2015 was widely spaced and purely exploratory in nature. Drill results received in 2015 include 1.36 g/t Au over 117.40 metres (15YAQ058), 1.34 g/t Au over 64.00 metres (15YAQ064) and 2.03 g/t Au over 32.00 metre (15YAQ068).
The main focus of exploration at the Mulatos Mine in 2016 was following up on the excellent results obtained in the 2015 scout drilling at La Yaqui. Drilling in 2015 had outlined 3 potential zones of mineralization; Zones 1 – 3. Zone 1 sits at the southeast end of the northwest trending silica ridge with Zone 2 further to the northwest and Zone 3 located further northwest again. Gold mineralisation in Zone 1 is associated with a north-south trending structural corridor and as a result is more linear in morphology. Zone 2 is more stratiform in nature and dips to the northeast at approximately 35-40 degrees (sub-parallel to topography). While the main control on mineralisation in Zone 2 appears to be lithological, a higher grade section may be associated with structural intersections. The main focus of drilling in 2016 was to delineate and define both of these zones along with scout drilling of
33 | ALAMOS GOLD INC.
ANNUAL INFORMATION FORM - 2016
Zone 3. A total of 46,809 metres of drilling was carried out at La Yaqui in 2016 in 230 holes. Drill results received in 2016 include 4.37 g/t Au over 76.00 metres (16YAQ135), 3.79 g/t Au over 47.3 metres (16YAQ051), 2.20 g/t Au over 30.9 metres and 2.63 g/t Au over 35.6 metres (16YAQ027). 2.91 g/t Au over 43.3 metres (16YAQ033), 3.23 g/t Au over 65.5 metres (16YAQ096), 3.17 g/t Au over 76.80 metres (16YAQ129), 8.42 g/t Au over 19.80 metres (16YAQ117). 6.31 g/t Au over 32.60 metres (15YAQ228), 3.27 g/t Au over 63.00 metres (16YAQ196) and 6.35 g/t Au over 21.90 metres (16YAQ207).
An interim resource statement was calculated for La Yaqui in September 2016. This included 27,201m of drilling from Zones 1 and 2 only.
2017 Exploration Outlook for Mulatos
Alamos plans to continue its aggressive exploration program in 2017 with 60,000 metres of drilling budgeted. The primary exploration drilling focus in 2017 will be on La Yaqui with infill and extension drill programs planned for all zones, scout drill programs planned to the northeast of Zone 1, on the silica rib that extends to the southeast of Zone 1 and on the Yaqui Norte to Halcon corridor. Another main drill focus will be Cerro Pelon with the aims of following up and delineating the northwest zone, the zone under the silica cap and the zone immediately to the north and along strike from the reserve mineralisation. In 2017 scout drilling will also be conducted on other prospects in the district including Los Bajios and El Refugio. In addition, mapping, sampling and geophysics will be conducted on the El Refugio, El Carricito and El Halcon prospects.
Sampling, Analysis and Data Verification
The drilling methods utilized at Mulatos are reverse circulation (“RC”) using a center return bit, oriented diamond drilling using HQ and NQ diameter rods, and underground diamond drilling using NQ thin-wall core (for certain areas such as El Victor and Escondida).
Logging, sampling, and analysis procedures were historically established by previous operators and are still being used today apart from refinements and adjustments necessary to comply with current QA/QC procedures and NI 43-101 requirements. Logging and sampling methodologies and procedures are documented, routinely updated, and maintained by the Company’s exploration department.
Geologists log drill core holes onsite at Mulatos. Core is logged on a hole by hole basis with data entered directly into the Company’s Corporate Data Management System. RC holes are logged from chip trays containing representative samples collected from each 1.5 metre sample interval. After completion of geological and geotechnical logging and collection of additional information such as specific gravity, geologists define and label the intervals to be sampled, ranging from 0.25 to 1.5 metres, depending on geological characteristics.
Drill core is cut and sampled onsite at Mulatos while RC samples are collected directly at the drill site. For RC drill holes, a sub-set of the sample cuttings is bagged, inventoried, prepared and shipped to Hermosillo for analysis. For core drill holes, half-core samples are prepared using a diamond core saw, with 1.0 m intervals as standard sample lengths in rock types presenting similar geological characteristics. Where geological or mineralization differences are noted, drill core can be selectively sampled to a minimum length of 0.25 m. The samples are bagged, tagged, sealed and shipped in batches to the assaying laboratory. Metallurgical and geotechnical drill holes are logged at site in a similar manner to other core drill holes. Geologic logging and sample interval definition are completed by geologists; geotechnical logging including Rock Quality Designation (“RQD”), core recovery and specific gravity measurements are usually done by geological technicians. When applicable, underground channel sampling was supervised by a geologist, and consisted of 1.5 metre channels approximately 12 centimetres wide and 7.5 centimetres deep.
Laboratory sample preparation and analysis is in accordance with strict and industry recognized protocols and procedures. For RC samples, an approximate 5 kilogram sub-sample is sent to the lab. After drying, a 1 kg sub-set is crushed, riffle spilt, and pulverized to a 250g sample. A one assay-ton (30 grams) sample is then collected for precious metal analysis by fire assay with atomic absorption finish (“FA-AA”). For sample assaying above 5 g/t Au under FA-AA, a fire assay with gravimetric finish (“FA-GR”) is also performed. A smaller pulverized sub-sample (0.25 grams) is also taken for multi-element ICP analysis. Samples with gold assay results above 0.2 g/t are assayed by the hot-cyanide method (Au and Cu) to help assess the Au recovery potential; the results of these tests are also used for the recovery model. For core samples, the entire half of the core sample
34 | ALAMOS GOLD INC.
ANNUAL INFORMATION FORM - 2016
received at the lab is crushed; a 250 gram split is collected, pulverized and assayed using the methodology described above. Samples are now sent to ACME labs in Hermosillo, Mexico for sample preparation and fire assay analysis and to ACME’s Vancouver lab for multi-element analysis. Other labs, including ALS Chemex, Inspectorate and others, were used in the past with documentation available in individual drill logs. Check assay work was usually performed at Skyline Labs in Tucson, Arizona.
QA/QC procedures are performed systematically the Mulatos Mine. Blind, standard and blank samples are systematically inserted on a regular sample batch interval, generally every 25-30 samples, and are routinely evaluated when results are received. Field Core Duplicates (1/4 core) are taken every 20 samples and Preparation Duplicate samples are selected at regular intervals, with the duplicate retrieved by the assaying laboratory personnel after the sample has been crushed, basically representing a separate split. Check assays of pulverized pulps are performed by a second lab and generally represent 5-10% of the entire sample database. Comparisons and reconciliation between original and check assays are done routinely during drilling, and systematically before any resource estimation exercise.
Sample custody is ensured on-site by continuous inventorying and monitoring of the RC cuttings and drill core. Once samples are prepared, using the methodologies described above, they are inventoried, individually bagged, tagged and sealed in larger bags for transport to the assay lab. The laboratories used for analysis are certified and follow strict, industry recognized, QA/QC protocols. Audits of the assaying labs are performed occasionally.
For disclosure purposes, a 0.3 g/t Au cut-off grade is used for calculation of composite intervals, with only a single 1.5 m interval of sub-0.3 g/t Au material allowed within a composite interval; assay results are generally presented uncut.
Mineral Processing and Metallurgical Testing
The Mulatos deposit and surrounding deposits are amenable to cyanidation and heap leaching, as determined by lab scale testing conducted prior to project construction. The testwork indicated that mineralized material varies from pure oxide to pure sulphide, with gold recovery typically varying from 55% to 90% as material grades from sulphide to oxide. The average recovery was estimated to be between 72% and 74% for the Estrella Pit. Actual recoveries experienced early in project life were below this as run-of-mine un-crushed material, coarse crushed material and an area of low-recovery material were stacked on the leach pad at various times since mine commissioning. The Company has completed a number of operational initiatives that have improved leach pad percolation and resulted in higher gold recoveries, including conveying and stacking ore on the leach pad, implementing a drum agglomeration process and closing the crushing circuit to reduce the crusher discharge size to as close to 100% passing 3/8 of an inch as possible. As a result, recoveries have improved significantly.
Mineral Resource and Mineral Reserve Estimates
Mineral resource and mineral reserve estimates can be found in the section following “Other Mineral Properties”.
Mining Operations
Mining operations at the Mulatos Mine consists of the Mulatos open pit and the San Carlos underground. Mining in the open pit started in 2005. The open pit is a standard loader and truck operation running 24 hours per day, seven days per week. Mining is currently undertaken by a contractor and prior to 2014 mining was undertaken by MON personnel. It is anticipated that the contractor will remain for the life of the open pit. The current Mulatos open pit complex consists of the main Mulatos pit and the adjacent Victor and San Carlos pits. Based on mineral reserves as of December 31, 2016 (including stockpiled ore) the Mulatos open pit complex has a remaining life of five years.
It is expected that an additional open pit will be started at La Yaqui in 2017. It is anticipated that a contractor will be used to operate La Yaqui. The La Yaqui open pit will have its own crushing and leaching facilities and loaded carbon will be transported to the main Mulatos ADR for further processing.
Development for the San Carlos underground was initiated in early 2014 and production stoping commenced in late 2014. Mining is at a nominal rate of approximately 450 tonnes per day of ore. Mining is carried out by longhole transverse mining and mined out stopes are filled with cemented rock fill. Mining is undertaken by a local contractor and engineering, geology and planning functions are carried out by MON staff. Access to the mine is via a ramp system and ore is hauled from the mine
35 | ALAMOS GOLD INC.
ANNUAL INFORMATION FORM - 2016
and placed on a pad adjacent to the ramp portal. Ore is loaded and hauled by the open pit contractor from the pad to the high grade mill located adjacent to the Mulatos heap leach crushing plant, a distance of approximately 5.4 kilometres.
Processing and Recovery Operations
The Mulatos processing facilities consist of a heap leach pad with an associated crushing plant, and a high grade mill.
Run of mine heap leach ore from the open pit is crushed in a four stage plant to 100% passing -3/8”. A run of mine stockpile is in front of the primary crusher and additional surge capacity is situated between the secondary and tertiary crushing plants, and after the quaternary crusher. Following quaternary crushing, the ore is transported via a 1.7 kilometre overland conveyor to the leach pad. At the leach pad, cement is added via two agglomerators and the ore is then transported via grasshopper portable conveyors to a stacker where it is stacked in 7 metre lifts.
Cyanide leach solution is applied to each lift for approximately 90 days, and the gold bearing solution then reports to one of two “pregnant” solution ponds via gravity. Inter-lift liners are installed on the leach pad every three lifts giving a height between inter-lift liners of 21 metres. Pregnant solution is pumped to the ADR where gold is recovered through the carbon absorption columns, carbon stripping and electrowinning to produce doré bars of gold and silver in the refinery.
In the process of mining the current oxide and mixed ores being sent the leach pad, the Mulatos Mine also mines significant quantities of sulphide material. This sulphide material is segregated and placed in long term stockpiles. It is planned to process this material when the open pit mine is depleted.
The high grade mill takes underground ore crushed from the primary and secondary crushing plants and now recovers gold via flotation concentrate which is sold on the international market.
The heap leach pads and processing facilities will continue to run for approximately three years after the main Mulatos pit is depleted, as long term stockpiles are processed.
Infrastructure, Permitting and Compliance Activities
Due to its distance from large population centers the Mulatos Mine maintains a camp including accommodation, kitchen, medical and recreational facilities. The camp facility is maintained by an outside contractor. Employees are bussed to the mine site from Hermosillo and work a nominal 14 day on 7 day off rotation.
There are currently two power plants in operation at the Mulatos Mine. The first power plant is a generating plant consisting of four-1,100 kilowatt and two-2,000 kilowatt, 1,200 rpm diesel electrical generating sets which supply electrical power for all mine site usage. The second power plant was constructed for the closed crushing circuit and future expansion and consists of five-1,750 kilowatt generating sets and is expandable to host up to six generating sets. Total usage is approximately 70,000 kilowatt hours per day.
The Company is permitted to mine its reserves at the Mulatos pits and has obtained the required surface rights to carry on mining, processing and exploration activities at these areas. In 2014, Former Alamos completed negotiations to acquire additional land surface rights covering and surrounding the La Yaqui and Cerro Pelon satellite deposits. From time to time, the Company acquires additional permanent and temporary surface rights to explore additional targets within the Mulatos Group of Concessions.
The feasibility study identified the potential for acid rock drainage. Measures to prevent acid rock drainage were incorporated into construction of the Mulatos Mine. Standard mining and construction practices in Mexico and guidelines issued by the World Bank were followed in the development and construction of the Mulatos Mine.
The Company complies with all environmental obligations set out in its mining plan, including eventual reclamation of mine and exploration roads, drill set-up, dumps and the heap leach pad. The Company has recorded an asset retirement obligation liability of $26.6 million which it expects to settle during the course of mining and on closure. The Mulatos Mine undertakes ongoing reclamation of waste dumps and leach pads.
36 | ALAMOS GOLD INC.
ANNUAL INFORMATION FORM - 2016
The company is in receipt of all permits to operate its existing mines and facilities.
The nearby town of Mulatos is largely protected from noise, dust, vibration and fly rock by the Mina Vieja outcrop. The Company proactively monitors noise, dust and vibration levels to ensure that they are within acceptable limits and the Company takes every precaution to minimize the impact of its mining operations on the local community. The Company also provides medical and educational assistance to the town of Mulatos as well as employment opportunities.
Capital and Operating Costs
Actual results for 2015 and 2016, and guidance for 2017 production, operating costs and capital are depicted below.
2015 Actual | 2016 Actual | 2017 Guidance | ||
Gold Production | (ounces) | 140,330 | 154,000 | 150,000 – 160,000 |
Cost of sales, including amortization | ($/ounce) | 1,128 | 1,088 | 1,015 |
Total Cash Costs(1) | ($/ounce) | 869 | 838 | 815 |
Mine Site All-in Sustaining Costs(1) | ($/ounce) | 1,047 | 916 | 890 |
Capital | ($ millions) | 47 | 33 | 47 - 54 |
(1) Refer to Cautionary Non-GAAP measures and Additional GAAP Measures on page 3. Detailed reconciliations of the non-GAAP measures to measures under IFRS for the years ended December 31, 2016 and 2015 can be found in the Company’s MD&A for the year ended December 31, 2016 on pages 25-30.
2017 Outlook
The Mulatos Mine is expected to produce 150,000 to 160,000 ounces of gold in 2017, a slight increase from 2016 production of 154,000 ounces. Mine-site all-in sustaining costs are expected to decrease to $890 per ounce of gold sold from of $916 per ounce in 2016. Total cash costs are expected to average $815 per ounce of gold sold.
Open pit grades mined and stacked on the heap leach pad are expected to range between 0.79 and 0.88 grams of gold per tonne in 2017. The waste to ore ratio is expected to range between 0.7 and 0.9:1, down from approximately 1.2:1 in 2016. Milled grades are expected to average 8 grams of gold per tonne in 2017. The mill is expected to operate at a rate of approximately 400 tonnes per day. Based on existing stockpiles and the current mine plan, mill production is expected to continue into the fourth quarter of 2017; however, there is potential to extend the mine life at San Carlos with additional ore continuing to be mined outside of existing reserves. Total crusher throughput (excluding mill throughput) is expected to increase to an average 18,500 tonnes per day in 2017. The combined recovery ratio is expected to increase to an average of 73% in 2017, reflecting higher recoveries from the mill following the transition to concentrate production.
Low-cost production growth from the La Yaqui pit, starting in the second half of 2017, is expected to drive costs lower. This trend is expected to continue beyond 2017 as La Yaqui evolves into a larger operation and with the 5% net smelter royalty at the Mulatos Mine expected to be eliminated within the next two years. Only 0.3 million ounces of production remain subject to the royalty, after which costs will decrease by $60 per ounce (assuming a gold price of $1,200 per ounce).
Capital spending at the Mulatos Mine in 2017 is expected to total $33 million to $40 million, which includes $12 million for the development of Phase I of the La Yaqui Project and $8 million to $10 million of sustaining capital. Exploration spending at the Mulatos Mine in 2017 is expected to total $17 million. The majority of the exploration will be focused on the La Yaqui and Cerro Pelon deposits and scout drilling Los Bajios and El Refugio and other targets within the Mulatos district.
OTHER MINERAL PROPERTIES
El Chanate (Mexico)
The El Chanate Mine is expected to produce 50,000 to 60,000 ounces of gold in 2017, a decrease from 68,000 ounces produced in 2016, reflecting lower grades and throughput rates. Total crushed and run of mine ore is expected to decrease in 2017 to an average 16,500 tonnes per day. The processed grade (run of mine and crushed ore) is expected to average 0.53 grams of gold
37 | ALAMOS GOLD INC.
ANNUAL INFORMATION FORM - 2016
per tonne. The waste-to-ore ratio is expected to average 3.4:1, consistent with 2016; however, it is expected to be sharply higher in the first half of 2017 as a pushback is completed.
Mine-site all-in sustaining costs are expected to average $1,200 per ounce of gold sold in 2017 with significant variability through the year. Total cash costs are expected to be in a similar range as the Company expects to expense all waste stripping costs in 2017. In light of the higher cost structure at the El Chanate Mine, the Company has hedged approximately 75% of its expected 2017 gold production through gold collar contracts which ensure a minimum gold price of $1,225 per ounce and participation up to a price of $1,450 per ounce.
The operation has approximately two years of mining remaining, after which the Company expects to residual leach the heap leach pad for approximately three years.
Kirazlı, Aği Daği, and Çamyurt (Turkey)
The Company’s 2017 general and administrative budget for Turkey is $4 million which includes spending associated with completing the permitting process at Kirazlı in addition to community and government relations and general administration. With the Environmental Impact Study and forestry permits for the Kirazlı Project approved by the federal government, the Company is pursuing the GSM (Business Opening and Operation) permit which is granted by the Çanakkale Governorship.
During the first quarter of 2017, the Company reported results from the positive feasibility studies conducted on the Kirazlı and Aği Daği gold projects, located in the Çanakkale Province in northwestern Turkey. The studies were an update to the pre-feasibility studies completed on the projects in 2012.
Kirazlı Feasibility Study Highlights
• | Declaration of an initial Proven and Probable mineral reserve of 26.1 million tonnes grading 0.79 g/t Au and 12.0 grams per tonne of silver (“g/t Ag”), containing 0.67 million ounces of gold and 10.1 million ounces of silver; |
• | Average annual gold production of 104,000 ounces over five years with total life of mine production of 540,000 ounces; |
• | Life of mine total cash costs of $339 per ounce of gold and mine-site all-in sustaining costs of $373 per ounce; |
• | Initial capital estimate of $152 million and total life of mine capital, including sustaining capital and closure costs, of $180 million; |
• | After-tax net present value (“NPV”) of $187 million at an 8% discount rate ($223 million at a 5% discount rate) and an after-tax internal rate of return (“IRR”) of 44%, representing a 1.4 year payback using base case gold and silver price assumptions of $1,250 and $16.00 per ounce, respectively; and |
• | Applying the same base case gold and silver price assumptions to the 2012 pre- feasibility study, the after-tax NPV (8%) more than doubles from $82 million to $187 million and the after-tax IRR improves from 26% to 44%, highlighting a significant improvement in the project economics. |
Aği Daği Feasibility Study Highlights
• | Declaration of an initial Proven and Probable mineral reserve of 54.4 million tonnes grading 0.67 grams per tonne of gold (“g/t Au”) and 5.4 grams per tonne of silver (“g/t Ag”), containing 1.17 million ounces of gold and 9.5 million ounces of silver; |
• | Average annual gold production of 177,600 ounces over five years with total life of mine production of 937,300 ounces; |
• | Life of mine total cash costs of $374 per ounce of gold and mine-site all-in sustaining costs of $411 per ounce; |
• | Initial capital estimate of $250 million and total life of mine capital, including sustaining capital and closure costs, of $313 million; |
• | After-tax NPV of $298 million at an 8% discount rate ($360 million at a 5% discount rate) and an after-tax IRR of 39%, representing a 1.9 year payback using base case gold and silver price assumptions of $1,250 and $16.00 per ounce, respectively; and |
38 | ALAMOS GOLD INC.
ANNUAL INFORMATION FORM - 2016
• | After-tax NPV (8%) has increased 240% to $298 million and after-tax IRR has more than doubled to 39%, from $88 million and 15%, respectively in the 2012 prefeasibility study when applying the same base case gold and silver price assumptions, highlighting the significant improvement in project economics. |
The Company also reported results from a positive preliminary economic assessment (“PEA”) completed on its Çamyurt gold project, located approximately 4 km from Aği Daği.
Çamyurt Preliminary Economic Assessment Highlights.
• | Average annual production of 93,200 ounces of gold and 403,000 ounces of silver over four years with total life of mine production of 373,200 ounces of gold and 1,612,600 ounces of silver; |
• | Initial capital estimate of $10 million and total life of mine capital, including sustaining capital and closure costs, of $26 million. The low capital reflects no infrastructure requirements with ore from Çamyurt to be trucked and processed through the nearby Aği Daği infrastructure; |
• | Life of mine total cash costs of $604 per ounce of gold and mine-site all-in sustaining costs of $645 per ounce, reflecting longer haul distances to the Aği Daği processing facilities; |
• | After-tax NPV of $86 million at an 8% discount rate ($111 million at a 5% discount rate) and an after-tax IRR of 253%, representing a 1.4 year payback using base case gold and silver price assumptions of $1,250 and $16.00 per ounce, respectively; and |
• | The PEA assumes ore from Çamyurt is sequenced after Aği Daği has been depleted in order to utilize the infrastructure at Aği Daği resulting in a combined mine life of nearly 10 years between the two projects. |
Lynn Lake (Manitoba, Canada)
The Company’s 2017 capital budget for Lynn Lake is $13 million, comprised of $9 million for development activities and $4 million for exploration. Development spending will be focused on baseline work in support of the project description, initiation of the permitting process and completion of a feasibility study, expected to be completed in the third quarter of 2017. Lynn Lake remains one of the Company’s top development priorities.
December 31, 2016 Reserves and Resources
At December 31, 2016, Alamos’ total proven and probable gold mineral reserves were 7.7 million gold ounces, a 1.8 million ounce increase from 2015. This increase in proven and probable mineral reserves is attributable to the conversion of mineral resources to mineral reserves at the Company’s Ağı Dağı, Kirazlı and La Yaqui Projects, partially offset by depletion at the Company’s operating mines. The Company’s mineral reserve and mineral resource estimates have been estimated as at December 31, 2016 in accordance with definitions adopted by the Canadian Institute of Mining, Metallurgy and Petroleum and incorporated into NI 43-101. Readers should refer to the note to investors concerning Mineral Reserve and Resource Estimates on page 2 of this AIF and the risk factors on page 9 and elsewhere.
The Company’s normal data verification procedures have been employed in connection with the calculations contained herein. Sampling, analytical and test data underlying the stated mineral resources and reserves have been verified by employees of Alamos or its joint venture partners, as applicable, under the supervision of qualified persons, and/or independent qualified persons. Verification procedures include industry standard quality control practices. For details of data verification and quality control practices at each material property please see “Mineral Properties”. Although the Company has carefully prepared and verified the mineral reserve figures presented below and elsewhere in this AIF, such figures are estimates, which are, in part, based on forward-looking information and certain assumptions, and no assurance can be given that the indicated level of mineral will be produced. Estimated reserves may have to be recalculated based on actual production experience. Market price fluctuations of gold, as well as increased production costs or reduced recovery rates and other factors, may render the present proven and probable reserves unprofitable to develop at a particular site or sites. See “Risk Factors” and “Forward-Looking Information” for additional details concerning factors and risks that could cause actual results to differ from those set out below.
39 | ALAMOS GOLD INC.
ANNUAL INFORMATION FORM - 2016
The following tables set forth the estimated mineral reserves and mineral resources attributable to interests held by Alamos for each of its material and non-material properties as at December 31, 2016:
PROVEN AND PROBABLE GOLD RESERVES (as at December 31, 2016)
Proven Reserves | Probable Reserves | Total Proven and Probable | |||||||||
Tonnes | Grade | Ounces | Tonnes | Grade | Ounces | Tonnes | Grade | Ounces | |||
(000’s) | (g/t Au) | (000’s) | (000’s) | (g/t Au) | (000’s) | (000’s) | (g/t Au) | (000’s) | |||
Young-Davidson - Surface | 1,165 | 0.91 | 34 | 0 | 0.00 | 0 | 1,165 | 0.91 | 34 | ||
Young-Davidson - Underground | 14,851 | 2.80 | 1,336 | 27,203 | 2.65 | 2,317 | 42,054 | 2.70 | 3,653 | ||
Total Young-Davidson | 16,016 | 2.66 | 1,370 | 27,203 | 2.65 | 2,317 | 43,220 | 2.65 | 3,687 | ||
Mulatos Main Pits | 4,173 | 1.02 | 137 | 21,847 | 0.87 | 613 | 26,020 | 0.90 | 750 | ||
San Carlos Underground | 72 | 13.06 | 30 | 34 | 8.64 | 9 | 106 | 11.65 | 40 | ||
Stockpiles | 7,129 | 1.38 | 317 | 0 | 0.00 | 0 | 7,129 | 1.38 | 317 | ||
La Yaqui | 470 | 1.48 | 22 | 1,469 | 1.37 | 65 | 1,939 | 1.40 | 87 | ||
La Yaqui Grande | 0 | 0.00 | 0 | 11,548 | 1.40 | 521 | 11,548 | 1.40 | 521 | ||
Cerro Pelon | 960 | 1.70 | 53 | 2,293 | 1.59 | 117 | 3,253 | 1.63 | 170 | ||
Total Mulatos | 12,804 | 1.36 | 559 | 37,191 | 1.11 | 1,325 | 49,995 | 1.17 | 1,885 | ||
El Chanate - Open Pit | 7,008 | 0.51 | 114 | 3,804 | 0.65 | 79 | 10,812 | 0.56 | 193 | ||
El Chanate - Leach Pad Inv. | 100 | 100 | |||||||||
Total El Chanate | 7,008 | 0.95 | 214 | 3,804 | 0.65 | 79 | 10,812 | 0.84 | 293 | ||
Ağı Dağı | 1,450 | 0.76 | 36 | 52,911 | 0.66 | 1,130 | 54,361 | 0.67 | 1,166 | ||
Kirazlı | 700 | 1.25 | 28 | 25,404 | 0.78 | 637 | 26,104 | 0.79 | 665 | ||
Total Turkey | 2,150 | 0.93 | 64 | 78,315 | 0.70 | 1,767 | 80,465 | 0.71 | 1,831 | ||
Alamos - Total | 37,979 | 1.81 | 2,208 | 146,513 | 1.17 | 5,488 | 184,492 | 1.30 | 7,696 | ||
40 | ALAMOS GOLD INC.
ANNUAL INFORMATION FORM - 2016
MEASURED AND INDICATED GOLD MINERAL RESOURCES (as at Dec 31, 2016)
Measured Resources | Indicated Resources | Total Measured and Indicated | |||||||
Tonnes | Grade | Ounces | Tonnes | Grade | Ounces | Tonnes | Grade | Ounces | |
(000’s) | (g/t Au) | (000’s) | (000’s) | (g/t Au) | (000’s) | (000’s) | (g/t Au) | (000’s) | |
Young-Davidson - Surface | 496 | 1.13 | 18 | 1,242 | 1.28 | 51 | 1,739 | 1.24 | 69 |
Young-Davidson - Underground | 5,876 | 3.33 | 629 | 4,916 | 3.47 | 548 | 10,792 | 3.39 | 1,177 |
Total Young-Davidson | 6,373 | 3.16 | 647 | 6,158 | 3.03 | 599 | 12,531 | 3.09 | 1,246 |
Mulatos | 8,270 | 1.24 | 330 | 64,221 | 1.08 | 2,224 | 72,491 | 1.10 | 2,554 |
San Carlos UG | 196 | 6.11 | 39 | 362 | 4.70 | 55 | 558 | 5.20 | 93 |
La Yaqui Grande | 0 | - | 0 | 1,108 | 1.91 | 68 | 1,108 | 1.91 | 68 |
Cerro Pelon | 117 | 2.75 | 10 | 455 | 2.52 | 37 | 572 | 2.56 | 47 |
Carricito | 58 | 0.82 | 2 | 1,297 | 0.82 | 34 | 1,355 | 0.83 | 36 |
Total Mulatos | 8,641 | 1.37 | 381 | 67,443 | 1.12 | 2,418 | 76,084 | 1.14 | 2,798 |
El Chanate | 1,092 | 0.55 | 19 | 3,323 | 0.69 | 74 | 4,415 | 0.66 | 93 |
MacLellan | 15,010 | 1.99 | 960 | 17,374 | 1.75 | 976 | 32,384 | 1.86 | 1,936 |
Gordon | 0 | - | 0 | 5,914 | 3.21 | 610 | 5,914 | 3.21 | 610 |
Burnt Timber | 0 | - | 0 | 1,021 | 1.40 | 46 | 1,021 | 1.40 | 46 |
Linkwood | 0 | - | 0 | 984 | 1.16 | 37 | 984 | 1.17 | 37 |
Total Lynn Lake | 15,010 | 1.99 | 960 | 25,293 | 2.05 | 1,669 | 40,303 | 2.03 | 2,629 |
Esperanza | 19,226 | 1.01 | 622 | 15,126 | 0.95 | 462 | 34,352 | 0.98 | 1,083 |
Ağı Dağı | 553 | 0.44 | 8 | 34,334 | 0.46 | 510 | 34,887 | 0.46 | 518 |
Kirazlı | 118 | 0.50 | 2 | 5,848 | 0.43 | 80 | 5,966 | 0.43 | 82 |
Çamyurt | 513 | 1.00 | 16 | 17,208 | 0.89 | 492 | 17,721 | 0.89 | 508 |
Total Turkey | 1,184 | 0.68 | 26 | 57,390 | 0.59 | 1,082 | 58,574 | 0.59 | 1,108 |
Quartz Mountain | 214 | 0.95 | 7 | 11,942 | 0.87 | 333 | 12,156 | 0.87 | 339 |
Alamos - Total | 51,740 | 1.60 | 2,661 | 186,675 | 1.11 | 6,637 | 238,415 | 1.21 | 9,298 |
41 | ALAMOS GOLD INC.
ANNUAL INFORMATION FORM - 2016
INFERRED GOLD MINERAL RESOURCES (as at Dec 31, 2016)
Tonnes | Grade | Ounces | |
(000’s) | (g/t Au) | (000’s) | |
Young-Davidson - Surface | 31 | 0.99 | 1 |
Young-Davidson - Underground | 3,524 | 2.76 | 313 |
Total Young-Davidson | 3,555 | 2.75 | 314 |
Mulatos | 8,935 | 0.92 | 265 |
San Carlos UG | 162 | 4.93 | 26 |
La Yaqui Grande | 174 | 1.39 | 8 |
Cerro Pelon | 109 | 1.23 | 4 |
Carricito | 900 | 0.74 | 22 |
Total Mulatos | 10,280 | 0.98 | 325 |
El Chanate | 112 | 0.71 | 3 |
MacLellan | 1,898 | 2.01 | 123 |
Gordon | 4,364 | 2.87 | 403 |
Burnt Timber | 23,438 | 1.04 | 781 |
Linkwood | 21,004 | 1.16 | 783 |
Total Lynn Lake | 50,704 | 1.28 | 2,089 |
Esperanza | 718 | 0.80 | 18 |
Ağı Dağı | 16,760 | 0.46 | 245 |
Kirazlı | 5,689 | 0.59 | 108 |
Çamyurt | 2,791 | 0.95 | 85 |
Total Turkey | 25,240 | 0.54 | 438 |
Quartz Mountain | 39,205 | 0.91 | 1,147 |
Alamos - Total | 129,815 | 1.04 | 4,334 |
PROVEN AND PROBABLE SILVER MINERAL RESERVES (as at Dec 31, 2016)
Proven Reserves | Probable Reserves | Total Proven and probable | |||||||
Tonnes | Grade | Ounces | Tonnes | Grade | Ounces | Tonnes | Grade | Ounces | |
(000’s) | (g/t Ag) | (000’s) | (000’s) | (g/t Ag) | (000’s) | (000’s) | (g/t Ag) | (000’s) | |
La Yaqui | 470 | 7.40 | 112 | 1,469 | 7.19 | 340 | 1,939 | 7.25 | 452 |
La Yaqui Grande | 0 | 0.00 | 0 | 11,548 | 19.94 | 7,403 | 11,548 | 19.94 | 7,403 |
Ağı Dağı | 1,450 | 6.22 | 290 | 52,911 | 5.39 | 9,169 | 54,361 | 5.41 | 9,459 |
Kirazlı | 700 | 15.90 | 358 | 25,404 | 11.90 | 9,720 | 26,104 | 12.01 | 10,078 |
Alamos - Total | 2,620 | 9.02 | 760 | 91,332 | 9.07 | 26,632 | 93,952 | 9.07 | 27,392 |
MEASURED AND INDICATED SILVER MINERAL RESOURCES (as at Dec 31, 2016)
Measured Resources | Indicated Resources | Total Measured and Indicated | |||||||
Tonnes | Grade | Ounces | Tonnes | Grade | Ounces | Tonnes | Grade | Ounces | |
(000’s) | (g/t Ag) | (000’s) | (000’s) | (g/t Ag) | (000’s) | (000’s) | (g/t Ag) | (000’s) | |
La Yaqui Grande | 0 | 0.00 | 0 | 1,108 | 14.68 | 523 | 1,108 | 14.68 | 523 |
Esperanza | 19,226 | 7.25 | 4,482 | 15,126 | 9.16 | 4,455 | 34,352 | 8.09 | 8,936 |
Ağı Dağı | 553 | 1.59 | 28 | 34,334 | 2.19 | 2,417 | 34,887 | 2.18 | 2,445 |
Kirazlı | 118 | 2.73 | 10 | 5,848 | 2.17 | 408 | 5,966 | 2.18 | 418 |
Çamyurt | 513 | 5.63 | 93 | 17,208 | 6.15 | 3,404 | 17,721 | 6.14 | 3,497 |
Alamos - Total | 20,410 | 7.03 | 4,613 | 73,624 | 4.73 | 11,207 | 94,034 | 5.23 | 15,819 |
42 | ALAMOS GOLD INC.
ANNUAL INFORMATION FORM - 2016
INFERRED SILVER MINERAL RESOURCES (as at Dec 31, 2016)
Tonnes | Grade | Ounces | |
(000’s) | (g/t Ag) | (000’s) | |
La Yaqui Grande | 174 | 5.55 | 31 |
Esperanza | 718 | 15.04 | 347 |
Ağı Dağı | 16,760 | 2.85 | 1,534 |
Kirazlı | 5,689 | 8.96 | 1,638 |
Çamyurt | 2,791 | 5.77 | 518 |
Alamos - Total | 26,132 | 4.84 | 4,068 |
Notes to Mineral Reserve and Mineral Resource estimates:
• | The Company’s Mineral Reserves and Mineral Resource as at December 31, 2016 are classified in accordance with the Canadian Institute of Mining Metallurgy and Petroleum’s “CIM Standards on Mineral Resources and Reserves, Definition and Guidelines” as per Canadian Securities Administrator’s NI 43-101 requirements. |
• | Mineral Resources are not Mineral Reserves and do not have demonstrated economic viability. |
• | Mineral Resources are exclusive of Mineral Reserves. |
• | Mineral Reserve cut-off grade for the Mulatos Mine, the Cerro Pelon Pit, the La Yaqui Pit, the La Yaqui Grande Pit, the Kirazlı Pit and the Ağı Dağı Pit are determined as a net of process value of $0.10 per tonne for each model block |
• | All Measured, Indicated and Inferred Mineral Resources are pit constrained with the exception of those outside the Mulatos Main Pits on the Mulatos property which have no economic restrictions and are tabulated by gold cut-off grade. |
• | Mineral Reserve estimates assumed a gold price of $1,250 per ounce and Mineral Resource estimates assumed a gold price of $1,400 per ounce, except as follows: Lynn Lake Mineral Resources assumed a gold price of $1,550 per ounce with an assumption of the Canadian dollar at parity with the United States dollar. Metal prices, cutoff grades and metallurgical recoveries are set out in the table below. |
• | El Chanate reserve ounces include a December 31, 2016 inventory of 99,900 recoverable ounces in the heap leach pad. |
Resources | Reserves | |||||||||
Gold Price | Cutoff | Gold Price | Cutoff | Met Recovery | ||||||
Mulatos: | ||||||||||
Mulatos Main Open Pit | $1,400 | 0.5 | $1,250 | see notes | >50% | |||||
San Carlos Underground | $1,400 | 2.5 | $1,250 | 3.27 | 70 | % | ||||
Cerro Pelon | $1,400 | 0.3 | $1,250 | see notes | 75 | % | ||||
La Yaqui & La Yaqui Grande | $1,400 | 0.3 | $1,250 | see notes | 75 | % | ||||
Carricito | $1,400 | 0.3 | n/a | n/a | >50% | |||||
Young-Davidson - Surface | $1,400 | 0.5 | $1,250 | 0.5 | 91 | % | ||||
Young-Davidson - Underground | $1,400 | 1.3 | $1,250 | 1.9 | 91 | % | ||||
El Chanate | $1,400 | 0.15 | $1,250 | 0.15 | 30-65% | |||||
Lynn Lake | $1,555 | 0.4 | n/a | n/a | 89-92% | |||||
Esperanza | $1,400 | 0.4 | n/a | n/a | 60-72% | |||||
Ağı Dağı | $1,400 | 0.2 | $1,250 | see notes | 80 | % | ||||
Kirazlı | $1,400 | 0.2 | $1,250 | see notes | 81 | % | ||||
Çamyurt | $1,400 | 0.2 | n/a | n/a | 78 | % | ||||
Quartz Mountain | $1,400 | 0.21 Oxide, 0.6 Sulfide | n/a | n/a | 65-80% | |||||
43 | ALAMOS GOLD INC.
ANNUAL INFORMATION FORM - 2016
The following table presents a year-over-year reconciliation of Mineral Reserves based on contained gold:
Mineral Reserves 31-Dec-15 | Processed in 2016 | Increase / (Decrease) after Depletion | Mineral Reserves 31-Dec-16 | |
Young-Davidson | 3,874 | 185 | (2) | 3,687 |
Mulatos | 1,543 | 219 | 561 | 1,885 |
El Chanate | 463 | 122 | (48) | 293 |
Turkey | 0 | 0 | 1,831 | 1,831 |
Total Alamos | 5,880 | 526 | 2,342 | 7,696 |
Qualified Person(s) Disclosure
The following tables sets forth the Qualified Persons who supervised the preparation of Alamos’ December 31, 2016 mineral reserve and mineral resource estimate. All are recognized as Qualified Persons according to the requirements of NI 43-101.
Project | Resources | Reserves |
Young-Davidson - Surface | Jeffrey Volk | Chris Bostwick |
Young-Davidson - Underground | Jeffrey Volk | Chris Bostwick |
Mulatos: | ||
Mulatos Main Open Pit | Marc Jutras | Herb Welhener |
San Carlos Underground | Jeffrey Volk | Chris Bostwick |
Cerro Pelon | Marc Jutras | Herb Welhener |
La Yaqui | Marc Jutras | Herb Welhener |
Carricito | Marc Jutras | n/a |
El Chanate | Jeffrey Volk | Chris Bostwick |
Lynn Lake | Jeffrey Volk | n/a |
Esperanza | Marc Jutras | n/a |
Ağı Dağı | Marc Jutras | Herb Welhener |
Kirazlı | Marc Jutras | Herb Welhener |
Çamyurt | Marc Jutras | n/a |
Quartz Mountain | Marc Jutras | n/a |
QP | Qualification | Company |
Chris Bostwick | FAusIMM | VP Technical Services, Alamos Gold Inc. |
Marc Jutras | P.Eng | Principal, Ginto Consulting Inc. |
Jeffrey Volk | CPG, FAusIMM | Director - Reserves and Resource, Alamos Gold Inc. |
Herb Welhener | SME-QP | VP, Independent Mining Consultants Inc. |
Global exploration programs are overseen by Aoife McGrath, M.Sc., M.AIG, Vice President, Exploration for Alamos Gold Inc. Ms. McGrath is a Qualified Person within the meaning of Canadian Securities Administrator’s National Instrument 43-101.
The scientific and technical information in this AIF has been reviewed and approved by Chris Bostwick, FAusIMM, Vice President, Technical Services for Alamos Gold Inc. Mr. Bostwick is a Qualified Person within the meaning of Canadian Securities Administrator’s National Instrument 43-101.
44 | ALAMOS GOLD INC.
ANNUAL INFORMATION FORM - 2016
Uses of Gold
The two principal uses of gold are bullion investment and product fabrication. Within the fabrication category there are a wide variety of end uses, the largest of which is the manufacture of jewelry. Other fabrication purposes include official coins, electronics, dentistry, medallions and other industrial and decorative uses.
Sales and Refining
Gold can be readily sold on numerous markets throughout the world and its market price can be readily ascertained at any time. Because there are a large number of available gold purchasers, the Company is not dependent upon the sale of gold to any one customer.
The Company’s gold production is currently refined to market delivery standards by third-party refineries. The Company believes that, because of the availability of alternate refiners, the inability of the Company’s refiners to process the Company’s product would not have a material adverse effect on the Company.
Employees
As of December 31, 2016, the Company had 40 full-time employees reporting to its Toronto corporate head office. Each of these corporate head office employees is employed under a contract for services directly with the Company.
At the Company’s Young-Davidson Mine, which is based in Matachewan, Ontario, there are 600 full-time employees and 104 contractors as at December 31, 2016.
In addition, the Company has Mexican subsidiaries which provide labour-related services for operations at the administrative offices of Minas de Oro Nacional in Hermosillo, Mexico and the administrative offices of Minera Santa Rita, S de R.L. de C.V., in Caborca, Mexico. As of December 31, 2016, the Company’s Mexican subsidiaries had 671 full-time employees. The Company has sourced most of its labour pool, including skilled mining personnel, from the state of Sonora in Mexico.
In addition, the Company has 9 full-time administrative, engineering and exploration personnel in Turkey and 3 full-time personnel at the Esperanza Gold Project in Morelos State, Mexico and 1 employee at the Quartz Mountain Property in Oregon, U.S.A.
As at December 31, 2016, the Company had 3 full-time employees at the Lynn Lake Project in Manitoba. There are 7 contract employees at site providing geology and logging services.
The Company is committed to providing and maintaining a safe and healthy working environment at all of its operations and development projects. The Company has designed practices and policies at each location to ensure a safe and healthy work environment. The Company has invested heavily in this area, and the primary goal is to achieve zero accidents in the workplace.
The nature of the Company’s business requires specialized skills and knowledge. The Company operates large mining operations in Canada and Mexico which requires technical expertise in the areas of geology, engineering, mine planning, metallurgical processing, mine operations, and environmental compliance. Despite generally good labour relations, competition for skilled workers in the resource sector results in employee turnover at the Company’s operations and a need to constantly recruit and train new employees. This competition for qualified employees occasionally results in workforce shortages, which can often be supplemented with more costly contract labour.
45 | ALAMOS GOLD INC.
ANNUAL INFORMATION FORM - 2016
DIVIDENDS
Alamos Gold Inc.
In the fiscal year ended December 31, 2016, Alamos paid a total of $5 million in dividends to its shareholders. Since the merger Alamos has returned a total of $8 million in dividends to shareholders between July 2, 2015 and December 31, 2016. The Company does not have a formal dividend policy.
Dividends | Year ended Dec 31, 2016 | Period ended Dec 31, 2015 | ||||
Declared and Paid | $5,305,050 | $11,290,812 | ||||
Weighted Average number of common shares outstanding | 265,234,000 | 194,121,000 | ||||
Dividend per share | $0.020 | $0.058 | ||||
Former Alamos Gold Inc.
In the fiscal year January 1, 2015 to July 1, 2015, Former Alamos paid a total of $4 million in dividends to its shareholders. Former Alamos returned a total of $106 million in dividends and share buybacks to shareholders since initiating its dividend program in 2010.
On April 21, 2015, the Company’s Board of Directors approved a dividend of $0.03 per share, which was paid on May 29, 2015 to shareholders of record at the close of business on May 15, 2015.
Dividends | Period ended July 1, 2015 | Year ended Dec 31, 2014 | ||||
Declared and Paid | $3,821,000 | $25,471,000 | ||||
Weighted Average number of common shares outstanding | 127,364,000 | 127,388,000 | ||||
Dividend per share | $0.030 | $0.200 | ||||
AuRico Gold Inc.
On February 19, 2015, the Company’s Board of Directors approved a dividend of $0.023 per share, payable to shareholders of record on March 2, 2015, and paid on March 16, 2015.
On May 6, 2015, the Company’s Board of Directors approved a dividend of $0.01 per share, payable to shareholders of record on May 19, 2015, and paid on June 2, 2015.
Dividends | Period ended July 1, 2015 | Year ended Dec 31, 2014 | ||||
Declared and Paid | $8,732,000 | $6,568,000 | ||||
Weighted Average number of common shares outstanding | 264,939,000 | 248,890,000 | ||||
Dividend per share | $0.033 | $0.026 | ||||
DESCRIPTION OF CAPITAL STRUCTURE
46 | ALAMOS GOLD INC.
ANNUAL INFORMATION FORM - 2016
Common Shares
The Company’s authorized capital consists of one class of Class A common shares without par value (the “common shares”). The Company is authorized to issue an unlimited number of common shares. Each common share is entitled to one vote. As at December 31, 2016 a total of 267,076,495 common shares were issued and outstanding and as at March 15, 2017, a total of 298,819,214 common shares were issued and outstanding.
All of the Company’s common shares are of the same class and rank equally as to voting rights, dividends and participation in assets of the Company on wind-up or dissolution. There are no pre-emptive rights or conversion rights, and no provisions for redemption or purchase for cancellation, surrender, or sinking or purchase funds, however the Company’s articles provide that the Company may, if authorized by a resolution of the directors, purchase or otherwise acquire any of its shares at the price and upon the terms specified in such resolution and subject to the OBCA. Provisions as to creation, modification, amendment or variation of such rights or such provisions are contained in the OBCA.
Share Purchase Warrants
On August 30, 2013, Former Alamos completed the acquisition of Esperanza Resources Corp. In conjunction with the acquisition, Former Alamos issued an aggregate of 7.2 million share purchase warrants in total consideration for acquiring Esperanza Resources Corp. The share purchase warrants have a strike price of CAD$28.46 and a term of five years, expiring August 30, 2018.
On January 7, 2016, the Company completed the acquisition of Carlisle. In conjunction with the acquisition, the Company issued an aggregate of 5.5 million share purchase warrants in total consideration for acquiring Carlisle. The share purchase warrants have a strike price of CAD$10.00 and a term of 3 years, expiring January 7, 2019. These warrants are listed and trade on the TSX.
In addition to those mentioned above, there are currently 511,131 of warrants of former Carlisle outstanding with an average exercise price of $5.36, convertible into 511,131 of common shares of Alamos and 511,131 warrants to acquire additional Alamos shares.
Ratings
The following table sets out the ratings of the Company’s corporate debt by the rating agencies indicated as of March 15, 2017:
Standard & Poor’s | Moody’s Investors Services | |
Senior Note Rating | BB- | B3/ LGD4 |
Corporate Rating | + | B2 |
Recovery Rating | 2H | - |
Outlook | Stable | Stable |
Standard & Poor’s Ratings Services (“S&P”) credit ratings for long-term debt are on a rating scale ranging from AAA to D, which represents the range from highest to lowest quality. The ratings from AA to CCC may be modified by the addition of a plus (+) or minus (–) sign to show relative standing within the major rating categories. S&P’s rating is a forward looking opinion about credit risk and assesses the credit quality of the individual debt issue and the relative likelihood that the issuer may default. If S&P anticipates that a credit rating may change in the next six to 24 months, it may issue an updated ratings outlook indicating whether the possible change is likely to be “positive”, “negative”, “stable” or “developing”. However, a rating outlook does not mean that a rating change is inevitable.
The B+ rating is ranked sixth out of S&P’s ten major rating categories. According to the S&P rating system, debt securities rated B+ are more vulnerable to adverse business, financial and economic conditions but currently the Company has the capacity to meet financial commitments. In addition, S&P uses a scale of 1+ to 6 for recovery ratings, which focuses solely, from high to low, on expected recovery in the event of a payment default of a specific debt issue. A “2” recovery rating ranks third out of
47 | ALAMOS GOLD INC.
ANNUAL INFORMATION FORM - 2016
S&P’s seven recovery rating categories and indicates S&P’s expectation of meaningful (70% -90%) recovery in the event of default.
Moody’s Investors Service (“Moody’s”) credit ratings are on a rating scale that ranges from Aaa to C, which represents the range from highest to lowest quality of such securities rated. According to Moody’s, a rating of B is the sixth highest of nine major categories. Obligations rated in the B category are considered speculative and are subject to high credit risk. Moody’s applies numerical modifiers 1, 2, and 3 to each generic rating classification from Aa through Caa in its long-term rating scale. The modifier 1 indicates that the obligation ranks in the higher end of its generic rating category; the modifier 2 indicates a mid-range ranking; and the modifier 3 indicates a ranking in the lower end of that generic category. Moody’s also issues a rating outlook opinion regarding the likely rating direction over the medium term. Rating outlooks fall into four categories: positive, negative, stable, and developing. A stable outlook indicates a low likelihood of a rating change over the medium term. A negative, positive or developing outlook indicates a higher likelihood of a rating change over the medium term. A designation of “Under Review” indicates that a rating is under consideration for a change in the near term. A rating can be placed on review for upgrade, downgrade, or more rarely with direction uncertain.
In addition, Moody’s Loss Given Default (“LGD”) assessments are opinions about expected loss given default expressed as a percent of principal and accrued interest at the resolution of the default based on a scale of 1 to 6. A LGD4 ranks fourth out of Moody’s six LGD assessment categories, and indicates a ≥50% and <70% difference between value received at default resolution and principal outstanding and accrued interest due at resolution of the default.
The Company understands that the rating agencies ratings are based on, among other things, information furnished to the above ratings agencies by the Company and information obtained by the ratings agencies from publicly available sources. The credit ratings are not recommendations to buy, sell or hold securities since such ratings do not comment as to market price or suitability for a particular investor. Credit ratings are intended to provide investors with an independent measure of the credit quality of an individual debt issue; an indication of the likelihood of repayment for an issue of securities; and an indication of the capacity and willingness of the issuer to meet its financial obligations in accordance with the terms of those securities. Credit ratings are not intended as guarantees of credit quality or exact measures of the probability of default. Credit ratings assigned to Alamos’ corporate debt may not reflect the potential impact of all risks on the value of debt instruments, including risks related to market or other factors discussed in this Annual Information Form. See also “Risk Factors”.
MARKET FOR SECURITIES
The Company’s common shares are listed on the TSX under the ticker symbol “AGI”. In addition, the Company has 7.2 million share purchase warrants outstanding and traded on the TSX under the ticker symbol “AGI.WT”.
Alamos Gold Inc. - Trading Price and Volume
The following table sets out the monthly low and high trading prices and the monthly volume of trading of the common shares of the Company on the TSX for January 1, 2016 to December 31, 2016:
48 | ALAMOS GOLD INC.
ANNUAL INFORMATION FORM - 2016
2016 | Low (CAD$) | High (CAD$) | Volume | ||||
January | $3.27 | $5.28 | 17,318,057 | ||||
February | $4.37 | $6.20 | 28,340,241 | ||||
March | $5.89 | $7.66 | 23,952,456 | ||||
April | $6.68 | $9.05 | 21,149,698 | ||||
May | $7.68 | $9.73 | 22,724,758 | ||||
June | $8.05 | $11.41 | 20,865,176 | ||||
July | $11.07 | $13.65 | 19,747,148 | ||||
August | $9.14 | $12.70 | 16,348,498 | ||||
September | $8.99 | $11.65 | 19,351,043 | ||||
October | $9.13 | $11.86 | 21,038,160 | ||||
November | $8.20 | $11.15 | 21,703,712 | ||||
December | $7.86 | $10.07 | 20,881,925 | ||||
The following table sets out the monthly low and high trading prices and the monthly volume of trading of the common shares of the Company on the NYSE for January 1, 2016 to December 31, 2016:
2016 | Low (USD$) | High (USD$) | Volume | ||||
January | $2.27 | $3.75 | 26,158,592 | ||||
February | $3.11 | $4.59 | 35,302,230 | ||||
March | $4.39 | $5.75 | 43,694,215 | ||||
April | $5.10 | $7.22 | 42,619,615 | ||||
May | $5.85 | $7.53 | 51,322,559 | ||||
June | $6.15 | $8.79 | 71,162,812 | ||||
July | $8.35 | $10.41 | 38,204,951 | ||||
August | $6.95 | $9.72 | 35,540,726 | ||||
September | $6.84 | $8.94 | 51,282,474 | ||||
October | $6.89 | $8.88 | 43,524,865 | ||||
November | $6.04 | $8.33 | 47,618,446 | ||||
December | $5.95 | $7.50 | 59,154,578 | ||||
49 | ALAMOS GOLD INC.
ANNUAL INFORMATION FORM - 2016
The following table sets out the monthly low and high trading prices and the monthly volume of trading of the Esperanza common share purchase warrants of the Company on the TSX for January 1, 2016 to December 31, 2016:
2016 | Low (CAD$) | High (CAD$) | Volume | ||||
January | $0.07 | $0.16 | 140,924 | ||||
February | $0.10 | $0.25 | 375,167 | ||||
March | $0.14 | $0.22 | 329,274 | ||||
April | $0.17 | $0.32 | 186,558 | ||||
May | $0.18 | $0.29 | 136,594 | ||||
June | $0.24 | $0.50 | 324,135 | ||||
July | $0.50 | $1.00 | 347,831 | ||||
August | $0.50 | $0.98 | 216,450 | ||||
September | $0.50 | $0.75 | 79,482 | ||||
October | $0.50 | $0.65 | 88,130 | ||||
November | $0.30 | $0.66 | 319,687 | ||||
December | $0.26 | $0.42 | 182,038 | ||||
The following table sets out the monthly low and high trading prices and the monthly volume of trading of the Carlisle common share purchase warrants of the Company on the TSX for January 1, 2016 to December 31, 2016:
2016 | Low (CAD$) | High (CAD$) | Volume | ||||
January | $0.20 | $0.90 | 170,204 | ||||
February | $0.68 | $1.55 | 291,700 | ||||
March | $1.12 | $1.98 | 218,080 | ||||
April | $1.32 | $2.00 | 138,611 | ||||
May | $1.70 | $2.47 | 202,916 | ||||
June | $2.04 | $3.95 | 259,084 | ||||
July | $3.70 | $5.50 | 213,626 | ||||
August | $2.81 | $5.08 | 175,272 | ||||
September | $2.66 | $4.25 | 112,702 | ||||
October | $2.75 | $4.30 | 90,175 | ||||
November | $2.01 | $4.19 | 103,465 | ||||
December | $2.00 | $3.00 | 75,061 | ||||
PRIOR SALES
During the 12 month period preceding the date hereof, the Company has made the following distributions of Common Shares, or securities convertible or exchangeable into Common Shares, as follows.
Date of Issuance | Number of Securities Issued | Price per Security (CAD$) | Type of Security | ||
February 4, 2016 | 23,820 | $4.44 | Common Shares(1) | ||
February 11, 2016 | 1,276,666 | $5.48 | Common Shares (3) | ||
February 18, 2016 | 7,246 | $4.14 | Common Shares(2) | ||
50 | ALAMOS GOLD INC.
ANNUAL INFORMATION FORM - 2016
Date of Issuance | Number of Securities Issued | Price per Security (CAD$) | Type of Security | ||
February 18, 2016 | 3,261 | $4.14 | Common Shares(2) | ||
February 26, 2016 | 12,034 | $5.61 | Common Shares(1) | ||
March 4, 2016 | 4,348 | $3.45 | Common Shares(1) | ||
March 8, 2016 | 2,174 | $3.45 | Common Shares(1) | ||
April 6, 2016 | 2,113 | $4.44 | Common Shares(1) | ||
April 11, 2016 | 2,901 | $6.73 | Common Shares(1) | ||
April 12, 2016 | 6,434 | $4.14 | Common Shares(2) | ||
April 12, 2016 | 14,130 | $5.52 | Common Shares(1) | ||
April 15, 2016 | 47,937 | $7.69 | Common Shares(1) | ||
April 18, 2016 | 2,898 | $4.14 | Common Shares(2) | ||
April 19, 2016 | 10,956 | $4.45 | Common Shares(2) | ||
April 22, 2016 | 1,811 | $6.90 | Common Shares(2) | ||
April 25, 2016 | 841 | $7.76 | Common Shares(1) | ||
April 26, 2016 | 1,449 | $6.90 | Common Shares(2) | ||
April 28, 2016 | 7,246 | $5.18 | Common Shares(2) | ||
May 2, 2016 | 24,152 | $6.90 | Common Shares(2) | ||
May 3, 2016 | 5,046 | $7.75 | Common Shares(1) | ||
April 3, 2016 | 56,737 | $5.18 | Common Shares(2) | ||
May 4, 2016 | 60,551 | $7.75 | Common Shares(1) | ||
May 5, 2016 | 8,410 | $7.76 | Common Shares(1) | ||
May 5, 2016 | 4,710 | $5.52 | Common Shares(1) | ||
May 6, 2016 | 3,364 | $7.76 | Common Shares(1) | ||
May 6, 2016 | 1,128,932 | $8.86 | Common Shares (3) | ||
May 9, 2016 | 7,246 | $6.90 | Common Shares(2) | ||
May 10, 2016 | 5,797 | $5.18 | Common Shares(2) | ||
May 11, 2016 | 841 | $7.76 | Common Shares(1) | ||
May 16, 2016 | 5,046 | $7.74 | Common Shares(1) | ||
May 17, 2016 | 18,694 | $5.18 | Common Shares(2) | ||
May 19, 2016 | 59,290 | $7.74 | Common Shares(1) | ||
May 20, 2016 | 24,389 | $7.75 | Common Shares(1) | ||
May 24, 2016 | 32,412 | $7.75 | Common Shares(1) | ||
May 25, 2016 | 56,120 | $5.18 | Common Shares(2) | ||
May 31, 2016 | 12,077 | $6.90 | Common Shares(2) | ||
June 1, 2016 | 18,743 | $5.79 | Common Shares(2) | ||
June 6, 2016 | 86,773 | $8.19 | Common Shares(1) | ||
June 7, 2016 | 2,898 | $6.90 | Common Shares(2) | ||
June 8, 2016 | 17,246 | $4.14 | Common Shares(2) | ||
June 10, 2016 | 5,046 | $7.74 | Common Shares(1) | ||
June 13, 2016 | 46,691 | $7.75 | Common Shares(1) | ||
June 14, 2016 | 14,297 | $7.75 | Common Shares(1) | ||
June 15, 2016 | 841 | $7.74 | Common Shares(1) | ||
June 16, 2016 | 2,898 | $4.14 | Common Shares(2) | ||
June 17, 2016 | 12,295 | $5.05 | Common Shares(2) | ||
June 20, 2016 | 2,341 | $7.76 | Common Shares(1) | ||
51 | ALAMOS GOLD INC.
ANNUAL INFORMATION FORM - 2016
Date of Issuance | Number of Securities Issued | Price per Security (CAD$) | Type of Security | ||
June 20, 2016 | 39,370 | $6.36 | Common Shares(2) | ||
June 20, 2016 | 14,492 | $6.90 | Common Shares(2) | ||
June 21, 2016 | 23,292 | $7.65 | Common Shares(1) | ||
June 22, 2016 | 28,067 | $7.28 | Common Shares(1) | ||
June 23, 2016 | 21,600 | $7.28 | Common Shares(1) | ||
June 27, 2016 | 5,218 | $6.90 | Common Shares(2) | ||
June 28, 2016 | 3,695 | $6.90 | Common Shares(1) | ||
June 29, 2016 | 2,898 | $5.18 | Common Shares(2) | ||
June 30, 2016 | 12,615 | $7.74 | Common Shares(2) | ||
June 30, 2016 | 922,790 | $10.84 | Common Shares (3) | ||
July 5, 2016 | 15,320 | $7.76 | Common Shares(1) | ||
July 5, 2016 | 31,800 | $7.28 | Common Shares(1) | ||
July 6, 2016 | 47,354 | $7.74 | Common Shares(1) | ||
July 6, 2016 | 27,478 | $4.59 | Common Shares(2) | ||
July 7, 2016 | 150,069 | $7.71 | Common Shares(1) | ||
July 7, 2016 | 2,900 | $8.19 | Common Shares(1) | ||
July 8, 2016 | 165,319 | $7.76 | Common Shares(1) | ||
July 8, 2016 | 53,334 | $8.32 | Common Shares(1) | ||
July 8, 2016 | 144 | $10.00 | Common Shares(2) | ||
July 11, 2016 | 3,927 | $5.16 | Common Shares(2) | ||
July 11, 2016 | 2,746 | $6.90 | Common Shares(1) | ||
July 11, 2016 | 56,698 | $8.03 | Common Shares(1) | ||
July 13, 2016 | 59,075 | $7.75 | Common Shares(1) | ||
July 14, 2016 | 28,230 | $7.76 | Common Shares(1) | ||
July 14, 2016 | 1,912 | $6.90 | Common Shares(2) | ||
July 14, 2016 | 3,000 | $6.90 | Common Shares(1) | ||
July 15, 2016 | 6,500 | $7.76 | Common Shares(1) | ||
July 20, 2016 | 1,800 | $3.45 | Common Shares(1) | ||
July 21, 2016 | 841 | $7.76 | Common Shares(1) | ||
July 21, 2016 | 19,745 | $5.57 | Common Shares(1) | ||
July 25, 2016 | 36,230 | $6.90 | Common Shares(2) | ||
August 3, 2016 | 109 | $6.90 | Common Shares(2) | ||
August 5, 2016 | 8,695 | $5.46 | Common Shares(2) | ||
August 5, 2016 | 5,322 | $7.76 | Common Shares(1) | ||
August 12, 2016 | 2,523 | $8.69 | Common Shares(1) | ||
August 30, 2016 | 4,348 | $6.90 | Common Shares(1) | ||
September 8, 2016 | 5,046 | $7.74 | Common Shares(1) | ||
September 28, 2016 | 2,000 | $6.90 | Common Shares(1) | ||
September 30, 2016 | 2,900 | $10.93 | Common Shares(1) | ||
October 20, 2016 | 2,500 | $6.90 | Common Shares(1) | ||
October 26, 2016 | 841 | $7.76 | Common Shares(1) | ||
November 22, 2016 | 2,903 | $9.39 | Common Shares(1) | ||
December 15, 2016 | 841 | $7.76 | Common Shares(1) | ||
December 15, 2016 | 2,899 | $4.14 | Common Shares(2) | ||
52 | ALAMOS GOLD INC.
ANNUAL INFORMATION FORM - 2016
Date of Issuance | Number of Securities Issued | Price per Security (CAD$) | Type of Security | ||
December 19, 2016 | 841 | $7.76 | Common Shares(1) | ||
December 20, 2016 | 1,682 | $7.76 | Common Shares(1) | ||
December 22, 2016 | 1,821 | $8.15 | Common Shares(1) | ||
January 9, 2017 | 6,364 | $7.76 | Common Shares(2) | ||
January 10, 2017 | 16,820 | $7.75 | Common Shares(2) | ||
January 10, 2017 | 5,370 | $8.26 | Common Shares(2) | ||
January 10, 2017 | 1,459 | $8.17 | Common Shares(2) | ||
January 11, 2017 | 916 | $9.54 | Common Shares(2) | ||
January 12, 2017 | 4,565 | $7.75 | Common Shares(2) | ||
January 13, 2017 | 11,292 | $7.76 | Common Shares(2) | ||
January 16, 2017 | 23,548 | $7.75 | Common Shares(2) | ||
January 16, 2017 | 2,536 | $6.90 | Common Shares (3) | ||
January 17, 2017 | 43,794 | $7.75 | Common Shares(2) | ||
January 20, 2017 | 8,410 | $7.76 | Common Shares(2) | ||
January 23, 2017 | 21,025 | $7.75 | Common Shares(2) | ||
January 26, 2017 | 6,728 | $7.76 | Common Shares(2) | ||
January 27, 2017 | 3,364 | $7.75 | Common Shares(2) | ||
February 2, 2017 | 841 | $7.76 | Common Shares(2) | ||
February 8, 2017 | 1 | $28.47 | Common Shares (3) | ||
February 8, 2017 | 7,246 | $6.90 | Common Shares (3) | ||
February 9, 2017 | 31,450,000 | USD$7.95 | Common Shares (4) | ||
February 13, 2017 | 94 | $10.00 | Common Shares (3) | ||
February 13, 2017 | 2,523 | $7.74 | Common Shares(2) | ||
February 14, 2017 | 28,622 | $6.48 | Common Shares (3) | ||
February 15, 2017 | 841 | $7.76 | Common Shares(2) | ||
February 15, 2017 | 5,000 | $6.90 | Common Shares(2) | ||
February 16, 2017 | 3,884 | $4.14 | Common Shares (3) | ||
February 22, 2017 | 2,133 | $7.76 | Common Shares(2) | ||
February 22, 2017 | 3,485 | $6.90 | Common Shares(2) | ||
February 16, 2017 | 72,461 | $4.97 | Common Shares (3) | ||
March 3, 2017 | 9,397 | $10.44 | Common Shares(2) | ||
(1) Issued pursuant to the Company’s long-term compensation plans.
(2) Issued pursuant to the exercise of outstanding warrants.
(3) Issued as flow-through shares under the Income Tax Act.
(4) Issued in connection with a prospectus offering.
DIRECTORS AND OFFICERS
The name, province or state and country of residence, positions held within the Company and principal occupation of each director and executive officer of the Company during the five preceding years from the date of this AIF are as follows:
53 | ALAMOS GOLD INC.
ANNUAL INFORMATION FORM - 2016
NAME, POSITION PROVINCE OR STATE AND COUNTRY OF RESIDENCE(1) | PRINCIPAL OCCUPATIONS DURING THE PAST 5 YEARS(1) | Term as a Director |
PAUL MURPHY, B.Comm., FCPA, CA Chairman, Director Ontario, Canada | Chief Financial Officer and Executive Vice-President, Guyana Goldfields Inc. since April 2010 and Chief Financial Officer of GPM Metals Inc. since May 2012. Director of Continental Gold Ltd. Prior thereto, Partner and National Mining Leader, PricewaterhouseCoopers LLP from 2004 to 2010 and Partner, PricewaterhouseCoopers LLP from 1981 to 2010. Formerly a Director of Century Iron Mines Corporation. Previously the Chair and a Director of Former Alamos. Mr. Murphy holds the FCPA, CA designation. | Since July 2, 2015 |
JOHN A. McCLUSKEY President, Chief Executive Officer and Director Ontario, Canada | Chief Executive Officer, President and Director of the Company. Prior thereto, Chief Executive Officer, President and Director of Former Alamos. | Since July 2, 2015 |
MARK DANIEL, Ph.D.(3) (4) Director Ontario, Canada | Mr. Daniel has more than 35 years of international experience. Most recently, Mr. Daniel was Vice President, Human Resources for Vale Canada (formerly Inco Limited). Prior to that, he worked with the Bank of Canada and a number of other federal agencies before joining the Conference Board of Canada. Previously a Director of AuRico. Mr. Daniel holds a PhD in Economics. He is also a Director of Klondex Mines where he chairs the Human Resources Committee. | Since July 2, 2015 |
PATRICK DOWNEY, B.Comm., CPA, CP, ICD.D(2) (3) Director Ontario, Canada | Previously a Director of AuRico and an executive and director for several public resource companies and the Chief Financial Officer of Northgate Minerals Corporation for four years, retiring as President and CEO in 1994. Currently a Director of Minco Plc. Previously a Director of AuRico. Mr. Downey is certified by the Institute of Corporate Directors and holds a CPA, CA designation. Mr. Downey is certified by the Institute of Corporate Directors. | Since July 2, 2015 |
DAVID FLECK , B.A., MBA, ICD.D(2) (4) Director Ontario, Canada | Senior Vice President, Partner of Delaney Capital Management. Previously President and Chief Executive Officer of Macquarie Capital Markets Canada from 2011-2013. President of Mapleridge Capital Corp from 2009-2011. Currently a Director of Yappn Corp. and Kew Media Group. Previously a Director of Former Alamos. Mr. Fleck is certified by the Institute of Corporate Directors. | Since July 2, 2015 |
DAVID GOWER, M.Sc., P.GEO(3) (5) Director Ontario, Canada | Principal, Gower Exploration Consulting Inc. and President of Brazil Potash Corporation, which is a private company since 2009. Previously President and CEO of Castillian Resources Corporation from 2006-2010 and CEO of Apogee Silver from 2007-2012. Director of Apogee Silver Ltd., Aguia Resources Limited and Emerita Resources Corp. Previously a Director of Former Alamos, Coastal Gold Corp. and Castillian Resources Corporation. Mr. Gower is a Professional Geoscientist. | Since July 2, 2015 |
CLAIRE KENNEDY, B.A.Sc., LL.B, P.Eng, ICD.D(4) (5) Director Ontario, Canada | Lawyer and Partner in the Toronto office of Bennett Jones LLP. Ms. Kennedy is a director of the Bank of Canada and a government appointee to the University of Toronto’s Governing Council. Ms. Kennedy is also a member of the Dean’s Advisory Committee at Rotman School of Management. Previously a director of Neo Material Technologies Inc. Ms. Kennedy is certified by the Institute of Corporate Directors and a licensed Professional Engineer in Ontario. | Since November 10, 2015 |
RONALD SMITH, BBA, FCA, FCPA, ICD.D (2) (4) Director Nova Scotia, Canada | Previously a Director of AuRico, Senior Vice President and CFO of Emera Incorporated and CFO of Maritime Tel and Tel Limited. Currently the Chair of the Public Service Superannuation Plan Trustee Inc., Trustee of Pro Real Estate Investment Trust and Director of Nova Scotia Business Inc. Mr. Smith was formerly a Partner of Ernst & Young. Mr. Smith is certified by the Institute of Corporate Directors. | Since July 2, 2015 |
KENNETH STOWE, B.Sc., M.Sc. (3) (5) Director Ontario, Canada | Director of HudBay Minerals since 2010 and Director of Zenyatta Ventures since August 2014. Previously President, Chief Executive Officer and Director of Northgate Minerals Corporation from September 1999 to July 2011. Formerly a Director of Klondex Mines Ltd., Fire River Gold Corp. and Former Alamos. | Since July 2, 2015 |
54 | ALAMOS GOLD INC.
ANNUAL INFORMATION FORM - 2016
NAME, POSITION PROVINCE OR STATE AND COUNTRY OF RESIDENCE(1) | PRINCIPAL OCCUPATIONS DURING THE PAST 5 YEARS(1) | Term as a Director |
JAMES R. PORTER, B.A.Sc., CPA, CA, CPA (Illinois) Chief Financial Officer Ontario, Canada | Chief Financial Officer (“CFO”) of the Company from July 2015 to present. Previously CFO of Former Alamos from June 2011 to July 2015. Vice-President of Finance of Former Alamos from July 2008 to June 2011. Controller of Former Alamos from October 2005 to July 2008. From 2009 to 2016, Mr. Porter was a Director of Canadian Feed the Children, a registered charity. Mr. Porter holds a CPA, CA designation and a CPA designation in the United States, and a Bachelor of Administrative and Commercial Studies from the University of Western Ontario. | N/A |
PETER MACPHAIL, B.A.Sc., P.Eng Chief Operating Officer Ontario, Canada | Chief Operating Officer of the Company from July 2015 to present. Prior thereto Chief Operating Officer of AuRico from 2011- July 2015. Chief Operating Officer of Northgate Minerals Corporation from 2003-2011. Prior thereto Mr. MacPhail held increasingly senior roles at Noranda Inc., Teck Resources Limited, Homestake Resource Corporation and Barrick Gold Corporation. He holds a Bachelor of Applied Science degree in Mineral Engineering from the University of Toronto, and is a licensed professional engineer in Ontario. | N/A |
CHRISTINE BARWELL, CHRL, CCP, GRP Vice-President, Human Resources Ontario, Canada | Christine Barwell was appointed Vice President, Human Resources in April 2010. Prior to joining Alamos, Ms. Barwell held the position of Manager, International Assignments, at Kinross Gold Corporation from September 2009 to April 2010, and prior thereto, held several progressive HR positions at PricewaterhouseCoopers LLP from January 1999 to August 2009. Ms. Barwell holds several professional certifications, including Certified Human Resources Leader (CHRL), Certified Compensation Professional (CCP), and Global Remuneration Professional (GRP). | N/A |
CHRISTOPHER BOSTWICK, B.Sc. Vice-President, Technical Services Ontario, Canada | Vice-President, Technical Services of the Company from July 2015 to present. Previously Senior Vice-President, Technical Services of AuRico from January 2009 to July 2015. Mr. Bostwick holds over 30 years of experience in the global mining industry, 19 of which were spent with Barrick Gold Corporation in various roles. Mr. Bostwick has a Bachelor of Science degree in Mining Engineering from Queen’s University. | N/A |
LUIS M. CHAVEZ, B.A., M.Sc., Ph.D. Senior Vice President, Mexico San Luis Potosi, Mexico | Senior Vice-President, Mexico of the Company from July 2015 to present. Previously Senior Vice-President, Mexico of AuRico from 2012 to July 2015, Director, Mexican Operations from 2007 to 2012 and a member of AuRico’s Board of Directors from 2007 until 2014. Prior thereto General Director of the Mexican Geological Survey from 1994 to 2000, Energy and Mines Director, Coahuila State from 2001 to 2006, Secretary General for the States Mexican Mining Directors from 2001 to 2006 and President of the Mexican Institute for Environmental Management from 2006 to 2007. Dr. Chavez holds a Master of Science degree in Mineral Economics (1978) from Penn State University, a PhD in Energy and Mineral Economics (1982) from the University of Arizona, and a Business Administration degree (1989) from the Pan- American Business Institute in Monterrey, Mexico. | N/A |
ANDREW CORMIER, B. Eng. P.Eng Vice-President, Development and Construction Ontario, Canada | Vice-President of Development and Construction of the Company from July 2015 to present. Prior thereto Vice-President of Development and Construction of Former Alamos from February 2013 to July 2015. Previously, Project Manager of AuRico and, prior to its acquisition by AuRico, Northgate Minerals Corporation. Mr. Cormier graduated with a B.Eng. degree in Extractive Metallurgical Engineering from Laurentian University and received a Diploma in Technology, Management & Entrepreneurship from the University of New Brunswick. | N/A |
NILS ENGELSTAD, BA, LL.B, LL.M Vice-President, General Counsel Ontario, Canada | Vice-President, General Counsel of the Company from January 2016 to present. Prior thereto General Counsel of the Company from July 2015 to January 2016 and General Counsel of Former Alamos from April 2015 to July 2015. Previously Mr. Engelstad served as Vice President, General Counsel and Corporate Secretary to McEwen Mining Inc. and its predecessors. Mr. Engelstad holds a BA from the University of Toronto, an LL.B from the University of Windsor and a Master of Laws from the University of Toronto. He is a member of the Law Society of Upper Canada. | N/A |
55 | ALAMOS GOLD INC.
ANNUAL INFORMATION FORM - 2016
NAME, POSITION PROVINCE OR STATE AND COUNTRY OF RESIDENCE(1) | PRINCIPAL OCCUPATIONS DURING THE PAST 5 YEARS(1) | Term as a Director |
GREGORY FISHER, B.Comm, CPA, CA Vice-President, Finance Ontario, Canada | Vice-President, Finance of the Company from July 2015 to present. Prior thereto Vice-President, Finance of Former Alamos from June 2011 to July 2015; Controller of Former Alamos from April 2010 to June 2011. Previously Senior Manager at KPMG from September 2002 to March 2010. Mr. Fisher graduated with an Honours Bachelor of Commerce from McMaster University and holds a CPA, CA designation. | N/A |
AOIFE MCGRATH, B.Sc., M.Sc., M.AIG. Vice-President, Exploration Ontario, Canada | Vice-President, Exploration of the Company from July 2015 to present. Prior thereto Vice-President, Exploration of Former Alamos from June 2015 to July 2015, Director of Exploration and Corporate Development of Former Alamos from February 2013 to June 2015. Previously, Executive Director of Exploration at Carbine Resources Limited, Exploration Manager at Red Back Mining Inc., and Senior Exploration Geologist at AngloGold Ashanti Limited. Ms. McGrath holds a Bachelor of Science in Geology from University College Dublin, a Masters of Science in Mineral Exploration from the University of Leicester, and a Masters of Science in Engineering Geology from Imperial College London. | N/A |
SCOTT PARSONS, BBA, CFA Vice-President, Investor Relations Ontario, Canada | Vice-President, Investor Relations of the Company from July 2015 to present. Prior thereto Vice-President, Investor Relations of Former Alamos June 2015 to July 2015, Director of Investor Relations of Former Alamos January 2014 to June 2015 and Manager of Investor Relations of Former Alamos March 2013 to January 2014. Previously an Equity Research Associate and Analyst in the mining group at TD Securities. Mr. Parsons graduated with an Honours Bachelor of Business Administration from Brock University and is a CFA Charterholder. | N/A |
COLIN WEBSTER, B.Sc., P.Eng Vice President, Sustainability and External Affairs Ontario, Canada | Vice President, Sustainability and External Affairs of the Company from January 2016 to present. Prior thereto, Vice President of Sustainability at Noront Resources Ltd., Director of Aboriginal, Government and Community Relations at Goldcorp Inc., for the Canada & USA Region from 2009 to 2014 and founding partner at Blue Heron Solutions for Environmental Management (2004 to 2009). Mr. Webster has a degree in Mining Engineering from Queen’s University, a diploma in Environmental Technology from Fanshawe College. | N/A |
(1) | The information as to province or state of residence and principal occupation, has been furnished by the respective directors and executive officers individually. |
(2) Member of Audit Committee. Mr. Smith is the chair of this Committee.
(3) Member of Human Resources Committee. Mr. Daniel is the chair of this Committee.
(4) Member of Corporate Governance and Nominating Committee. Mr. Fleck is the chair of this Committee.
(5) Member of the Technical and Sustainability Committee. Mr. Stowe is the chair of this Committee.
The term of office of each of the current directors expires at the next annual general meeting of shareholders of the Company.
As at the date of this AIF, the Company’s directors and executive officers, as a group, beneficially own, directly or indirectly, or exercise control or direction over a total of 1,074,174 common shares, directly or indirectly, representing approximately 0.36% of the issued and outstanding common shares of the Company.
Cease Trade Orders or Bankruptcies
Except as described below, no director or executive officer of the Company is, as at the date of this AIF, or was within 10 years before the date of this AIF, a director, chief executive officer or chief financial officer of any company (including the Company), that:
1. | was subject to a cease trade order, an order similar to a cease trade order or an order that denied the relevant company access to any exemption under securities legislation, for a period of more than 30 consecutive days, that was issued while the director or executive officer was acting in the capacity as director, chief executive officer or chief financial officer; or |
2. | was subject to a cease trade order, an order similar to a cease trade order or an order that denied the relevant company access to any exemption under securities legislation, for a period of more than 30 consecutive days, that was issued |
56 | ALAMOS GOLD INC.
ANNUAL INFORMATION FORM - 2016
after the director or executive officer ceased to be a director, chief executive officer or chief financial officer and which resulted from an event that occurred while that person was acting in the capacity as director, chief executive officer or chief financial officer.
Except as described below, no director or executive officer of the Company, and no shareholder holding a sufficient number of securities of the Company to affect materially the control of the Company:
1. | is, as at the date of this AIF, or has been within the 10 years before the date of this AIF, a director or executive officer of any company (including the Company) that, while that person was acting in that capacity, or within a year of that person ceasing to act in that capacity, became bankrupt, made a proposal under any legislation relating to bankruptcy or insolvency or was subject to or instituted any proceedings, arrangement or compromise with creditors or had a receiver, receiver manager or trustee appointed to hold its assets; or |
2. | has, within 10 years before the date of this AIF, become bankrupt, made a proposal under any legislation relating to bankruptcy or insolvency, or become subject to or instituted any proceedings, arrangement or compromise with creditors, or had a receiver, receiver manager or trustee appointed to hold the assets of the director, executive officer or shareholder. |
In October of 2013, Fire River Gold Corp. entered into a compromise with its creditors after defaulting on its lending facility. Mr. Ken Stowe had ceased to be a director of that company in March of 2013.
Penalties or Sanctions
No director or executive officer of the Company or a shareholder holding a sufficient number of common shares of the Company to affect materially the control of the Company has been subject to:
(a) | any penalties or sanctions imposed by a court relating to securities legislation or by a securities regulatory authority or has entered into a settlement agreement with a securities regulatory authority; or |
(b) | any other penalties or sanctions imposed by a court or regulatory body that would likely be considered important to a reasonable investor in making an investment decision. |
The foregoing, not being within the knowledge of the Company, has been furnished by the respective directors, executive officers and shareholders holding a sufficient number of securities of the Company to affect materially the control of the Company.
Conflicts of Interest
Certain directors and officers of the Company are also directors, officers or shareholders of other companies that are similarly engaged in the business of acquiring, developing and exploiting natural resource properties. The directors and officers of the Company are also directors of other companies that are similarly engaged in the business of acquiring, developing and exploiting natural resource properties. These associations with other public companies in the resource sector may give rise to conflicts of interest from time to time. The directors and officers of the Company are required by law to act honestly and in good faith with a view to the best interests of the Company and to disclose any interest that they may have in a contract or transaction if the contract or transaction is material to the Company, the Company has entered, or proposes to enter, into the contract or transaction, and either the director or officer has a material interest in the contract or transaction or the director or officer is a director or officer of, or has a material interest in, a corporation that has a material interest in the contract or transaction. If a conflict of interest arises at a meeting of the board of directors, any director in a conflict is required to disclose his interest and abstain from voting on such matter. In determining whether the Company will participate in any project or opportunity, the directors will primarily consider the degree of risk to which the Company may be exposed and its financial position at the time.
Alamos currently holds 15,040,581 common shares of AuRico Metals, representing approximately 9.52% of the issued and outstanding common shares of AuRico Metals as of March 15, 2017. John A. McCluskey is a Director of AuRico Metals.
On November 20, 2014, AuRico completed a private placement with Carlisle in which the Company invested CAD$5.6 million in exchange for 19.9% of the outstanding common shares of Carlisle. In conjunction with the private placement, the Company
57 | ALAMOS GOLD INC.
ANNUAL INFORMATION FORM - 2016
entered into a joint venture agreement on November 11, 2014 with respect to Carlisle’s Lynn Lake Gold Camp, located in Lynn Lake, Manitoba, pursuant to which the Company acquired a 25% interest in the project for an initial cash contribution of CAD$5.0 million. Peter MacPhail and James R. Porter are Directors of Carlisle. On January 7, 2016 the Company reported the completion of the previously announced acquisition of all of the issued and outstanding common shares of Carlisle.
AUDIT COMMITTEE
Pursuant to the provisions of section 158(1) of the Business Corporations Act (Ontario), the Company is required to have an Audit Committee. The Company must also, pursuant to the provisions of National Instrument 52-110 Audit Committees (“NI 52-110”), have a written charter that sets out the duties and responsibilities of its audit committee. The Company’s audit committee charter is attached hereto as Schedule “A”.
Composition of the Audit Committee
The Audit Committee is comprised of Ronald Smith (Chair), David Fleck and Patrick Downey. Each member is financially literate and all members of the Audit Committee are independent directors.
Relevant Education and Experience
Mr. Smith is a Chartered Professional Accountant with over 30 years of practical financial and management experience, primarily in the financial, telecommunications and energy sectors. Mr. Fleck has more than 30 years of capital markets experience, including as former President and Chief Executive Officer of Macquarie Capital Markets Canada and holds a B.A. in Economics from the University of Western Ontario and MBA from INSEAD School of Business. Mr. Downey is a member of the Canadian Institute of Chartered Professional Accountants. He has been involved in the gold and copper mining industry throughout most of his career. Each member has a significant understanding of the mineral exploration and mining business in which the Company is engaged in and has an appreciation for the relevant accounting principles for this business. Each member has been certified by and is a member of the Institute of Corporate Directors.
Reliance on Certain Exemptions
At no time since the commencement of the Company’s most recently completed financial year has the Company relied on the exemptions in section 2.4 (De Minimis Non-audit Services), section 3.2 (Initial Public Offerings), section 3.4 (Events Outside Control of Member), section 3.5 (Death, Disability or Resignation of Audit Committee Member) or Part 8 (Exemptions) of National Instrument 52-110 – Audit Committees (“NI 52-110”).
Reliance on the Exemption in Subsection 3.3(2) or Section 3.6
At no time since the commencement of the Company’s most recently completed financial year has the Company relied on the exemption in subsection 3.3(2) (Controlled Companies) or section 3.6 (Temporary Exemption for Limited and Exceptional Circumstances) of NI 52-110.
Reliance on Section 3.8
At no time since the commencement of the Company’s most recently completed financial year has the Company relied on section 3.8 (Acquisition of Financial Literacy) of NI 52-110.
Audit Committee Oversight
At no time since the commencement of the Company’s most recently completed financial year was a recommendation of the Audit Committee to nominate or compensate an external auditor not adopted by the Board of Directors.
Pre-approval Policies and Procedures
58 | ALAMOS GOLD INC.
ANNUAL INFORMATION FORM - 2016
The Audit Committee shall pre-approve all audit and non-audit services provided by the independent auditors and not engage the independent auditors to perform the specific non-audit services prohibited by law or regulation.
External Auditor Service Fees (By Category)
Fiscal Year End(1) | Audit Fees(2) | Audit Related Fees(3) | Tax Fees(4) | All Other Fees(5) | ||||||
2015 | $758,727 | $54,810 | $104,922 | $196,533 | ||||||
2016 | $554,000 | $11,500 | $129,150 | $Nil | ||||||
(1) | All fees in USD. |
(2) | Fees charged for the annual financial statement audit, quarterly reviews. In 2015, fees include audits with respect to carve-out financial statements for the transaction between Former Alamos and AuRico and consent procedures for securities documents. |
(3) | Fees charged for assurance and related services reasonably related to the performance of an audit, and not included under “Audit Fees”. |
(4) | Fees charged for tax compliance, tax advice and tax planning services. |
(5) | Fees for services other than disclosed in any other column. In 2015 includes, assistance provided in respect of post-merger integration. |
INTEREST OF MANAGEMENT AND OTHERS IN MATERIAL TRANSACTIONS
Other than as set forth herein and other than transactions carried out in the ordinary course of business of the Company or any of its subsidiaries, none of the directors or executive officers of the Company, any shareholder directly or indirectly beneficially owning, or exercising control or direction over, shares carrying more than 10% of the voting rights attached to the shares of the Company, nor an associate or affiliate of any of the foregoing persons has since January 1, 2014 (being the commencement of the Company’s third most recently completed financial year) any material interest, direct or indirect, in any transactions that materially affected or would materially affect the Company or any of its subsidiaries.
TRANSFER AGENT AND REGISTRAR
The Company’s registrar and transfer agent, Computershare Trust Company of Canada, is located at 66 Wellington Street West, Suite 5210, PO Box 240, TD Centre, Toronto, Ontario M5K 1J3.
LEGAL PROCEEDINGS
As at March 15, 2017, there are no material legal proceedings to which the Company is a party.
MATERIAL CONTRACTS
Other than as otherwise set out in this Annual Information Form, the following is the only material contract, other than contracts entered into in the ordinary course of business not otherwise required to be disclosed, that we have entered into within the most recently completed fiscal year or before the most recently completed fiscal year but still in effect.
In December 2013, the Company entered into a mining services agreement with Grupo Desarrollo Infraestructura S.A de C.V (“GDI”), expiring in December 2022, pursuant to which GDI will perform essentially all of the open-pit mining operations at the Mulatos Mine, at a cost of approximately $214 million over the term of the contract (based on current pricing).
INTERESTS OF EXPERTS
KPMG LLP are the auditors of the Company and have confirmed that they are independent within the meaning of the relevant rules and related interpretations prescribed by the relevant professional bodies in Canada and any applicable legislation or regulations and also that they are independent accountants with respect to the Company under all relevant U.S. professional and regulatory standards.
59 | ALAMOS GOLD INC.
ANNUAL INFORMATION FORM - 2016
The individuals who are qualified persons for the purposes of NI 43-101 are listed under the section of this AIF entitled “Technical information”. As a group, they beneficially own, directly or indirectly, less than 1% of any class of the outstanding securities of the Company and our associates and affiliates.
ADDITIONAL INFORMATION
Additional information relating to the Company is available under the Company’s profile on the SEDAR website at www.sedar.com. Financial information relating to the Company is provided in the Company’s comparative consolidated financial statements and management’s discussion and analysis for the most recent fiscal year.
Additional information, including director and officer remuneration and indebtedness, principal holders of the Company’s securities and securities authorized for issuance under equity compensation plans, if applicable, is contained in the Company’s joint information circular dated April 1, 2016 for its special meeting of shareholders which was held on May 13, 2016.
60 | ALAMOS GOLD INC.
ANNUAL INFORMATION FORM - 2016
SCHEDULE “A”
ALAMOS GOLD INC.
AUDIT COMMITTEE CHARTER
Audit Committee Charter
This charter governs the operations of the Audit Committee (the “Committee”) of Alamos Gold Inc. (the “Company”). The purpose, composition, responsibilities, and authority of the Committee are set out in this Charter.
This Charter and the Articles of the Company and such other procedures, not inconsistent therewith, as the Committee may adopt from time to time, shall govern the meetings and procedures of the Committee.
1. Purpose
The Committee shall provide assistance to the Board of Directors of the Company (the “Board”) in fulfilling their oversight responsibility to the shareholders, potential shareholders, the investment community, and others relating to:
(a) the integrity of the Company’s financial statements;
(b) the financial reporting process;
(c) the systems of internal accounting and financial controls;
(d) financial risk management;
(e) the performance of the Company’s internal audit function (if applicable) and independent auditors;
(f) the independent auditors’ qualifications and independence; and
(g) the Company’s compliance with ethics policies and legal and regulatory requirements.
2. Composition
The Committee shall be composed of at least three (3) directors of the Company (the “Members”), each of whom is “independent” as defined by applicable Canadian and US laws and regulations as well as the rules of relevant stock exchanges, all as set out in the Company’s Director Independence Policy.
All Members shall be “financially literate” as defined in National Instrument 52-110 Audit Committees or any successor policy, meaning that the director has the ability to read and understand a set of financial statements that present the breadth and level of complexity of accounting issues that can reasonably be expected to be raised by the Company’s financial statements.
At least one member of the Committee shall be a ‘financial expert’ within the meaning of Applicable Laws. The financial expert should have the following competencies:
• | An understanding of financial statements and accounting principles used by the Company to prepare its financial statements; |
• | The ability to assess the general application of such accounting principles in connection with the accounting for estimates, accruals and reserves; |
61 | ALAMOS GOLD INC.
ANNUAL INFORMATION FORM - 2016
• | Experience preparing, auditing, analyzing or evaluating financial statements that present a breadth and level of complexity comparable to the Company’s financial statements, or experience actively supervising one or more persons engaged in such activities; |
• | An understanding of internal controls and procedures for financial reporting; and |
• | An understanding of audit committee functions. |
Members shall be appointed by the Board and shall serve until they resign, cease to be a director, or are removed or replaced by the Board.
3. Authority
The Committee is authorized to carry out its responsibilities as set out in this Charter, and to make recommendations to the Board arising therefrom.
In discharging its oversight role, the Committee is empowered to investigate any matter brought to its attention with full access to all books, records, facilities, and personnel of the Company and the authority to engage, and to set and pay the compensation of, independent accountants, legal counsel and other advisers as it determines necessary to carry out its duties.
The Committee may also communicate directly with the auditors, legal and other advisors, management and employees of the Company to carry out its responsibilities and duties set out in this Charter.
The Company shall pay directly or reimburse the Committee for the expenses incurred by the Committee in carrying out its responsibilities.
4. Responsibilities
The primary responsibility of the Committee is to oversee the Company’s financial reporting process on behalf of the Board and report the results of their activities to the Board. While the Committee has the responsibilities and powers set forth in this Charter, it is not the duty of the Committee to plan or conduct audits or to determine that the Company’s financial statements are complete and accurate and are in accordance with generally accepted accounting principles. Management is responsible for the preparation, presentation, and integrity of the Company’s financial statements and for the appropriateness of the accounting principles and reporting policies that are used by the Company. The independent auditors are responsible for auditing the Company’s financial statements and for reviewing the Company’s unaudited interim financial statements.
The Committee, in carrying out its responsibilities, believes its policies and procedures should remain flexible, in order to best react to changing conditions and circumstances. The Committee should take appropriate actions to set the overall corporate “tone” for quality financial reporting, sound business risk practices, and ethical behaviour. The following shall be the principal direct responsibilities of the Committee:
(a) | Appointment and termination (subject, if applicable, to shareholder ratification), compensation, and oversight of the work of the independent auditors, including resolution of disagreements between management and the auditors regarding financial reporting. The Committee shall arrange for the independent auditors to report directly to the Committee. |
(b) | Pre-approve all audit and non-audit services provided by the independent auditors and not engage the independent auditors to perform the specific non-audit services prohibited by law or regulation. The Committee may delegate pre-approval authority to a member of the Committee. The decisions of any Committee member to whom pre-approval authority is delegated must be presented to the full Committee at its next scheduled meeting. |
(c) At least annually, obtain and review a report by the independent auditors describing:
(i) The firm’s internal control procedures.
62 | ALAMOS GOLD INC.
ANNUAL INFORMATION FORM - 2016
(ii) Any material issues raised by the most recent internal control review, or peer review, of the firm, or by any inquiry or investigation by governmental or professional authorities, within the preceding five years, respecting one or more independent audits carried out by the firm, and any steps taken to deal with any such issues.
(iii) All relationships between the independent auditor and the Company (to assess the auditor’s independence).
(d) | Establish clear hiring policies for employees, partners, former employees and former partners of the current and former independent auditors of the Company that meet the requirements of applicable securities laws and stock exchange rules. |
(e) | Discuss with the auditors, the overall scope and plans for audits of the Company’s financial statements, including the adequacy of staffing and compensation. Ensure there is rotation of the audit partner having primary responsibility for the independent audit of the Company at such intervals as may be required. |
(f) | Discuss with management and the auditors the adequacy and effectiveness of the accounting and financial controls, including the Company’s policies and procedures to assess, monitor, and manage business risk, and legal and ethical compliance programs (e.g. Company’s Code of Business Conduct and Ethics). |
(g) | Periodically meet separately with management and the auditors to discuss issues and concerns warranting Committee attention. The Committee shall provide sufficient opportunity for the auditors to meet privately with the members of the Committee, which shall at minimum include an in camera meeting following each quarterly meeting. The Committee shall review with the auditor any audit problems or difficulties and management’s response. |
The processes set forth represent a guide with the understanding that the Committee may supplement them as appropriate.
5. Chair Responsibilities
The Chair of the Committee shall provide leadership to the Committee to enhance the Committee’s effectiveness and ensure adherence to this Charter:
(a) | Convene and preside over Committee meetings and ensure they are conducted in an efficient, effective and focused manner that promotes meaningful discussion; |
(b) | Assist management with the preparation of an agenda and ensure that meeting materials are prepared and disseminated in a timely manner and is appropriate in terms of relevance, efficient format and detail; and |
(c) | Adopting procedures to ensure that the Committee can conduct its work effectively and efficiently, including committee structure and composition and management of meetings; |
(d) | Ensure that the Committee has sufficient time and information to make informed decisions; and |
(e) | Provide leadership to the Committee and management with respect to matters covered by this mandate. |
The Committee shall designate one of its Members as chair of the Committee (the “Chair”).
The Corporate Secretary of the Company, or the individual designated as fulfilling the function of Secretary of the Company, will be the secretary of all meetings and will maintain minutes of all meetings and deliberations of the Committee. In the absence of the Corporate Secretary at any meeting, the Committee will appoint another person who may, but need not, be a Member to be the secretary of that meeting.
6. Specifically Delegated Duties
For purposes of this Charter, specific accounting, financial and treasury related duties delegated to the Committee by the Company’s Board of Directors include:
63 | ALAMOS GOLD INC.
ANNUAL INFORMATION FORM - 2016
Accounting and Financial
(a) | Receive regular reports from the independent auditor on the critical policies and practices of the Company, and all alternative treatments of financial information within generally accepted accounting principles that have been discussed with management. |
(b) | Where applicable, review management’s assertion on its assessment of the effectiveness of internal controls as of the end of the most recent fiscal year and the independent auditor’s report on management’s assertion. |
(c) | Review and discuss annual and interim earnings press releases before the Company publicly discloses this information. |
(d) | Review and approve the interim quarterly unaudited financial statements and disclosures under Management’s Discussion and Analysis of Financial Condition and Results of Operations with management and, where applicable, the independent auditors prior to the filing of the Company’s Quarterly Report or their inclusion in any filing with regulatory authorities. Also, the Committee shall discuss the results of the quarterly review, if any, and any other matters required to be communicated to the Committee by the independent auditors under generally accepted auditing standards. |
(e) | Review with management and the independent auditors the financial statements and disclosures under Management’s Discussion and Analysis of Financial Condition and Results of Operations to be included in the Company’s Annual Report to shareholders and any other filing with regulatory authorities, including their judgment about the quality, not just the acceptability of accounting principles, the reasonableness of significant judgments, and the clarity of the disclosures in the financial statements. |
(f) | The Committee shall discuss any matters required to be communicated to the Committee by the independent auditors under generally accepted auditing standards and shall specifically review with the independent auditors, upon completion of their audit: |
(i) the contents of their report;
(ii) the scope and quality of the audit work performed;
(iii) the adequacy of the Company’s financial and auditing personnel;
(iv) co-operation received from the Company’s personnel during the audit;
(v) significant transactions outside of the normal business of the Company; and
(vi) significant proposed adjustments and recommendations for improving internal accounting controls, accounting principles or management systems.
(g) | Establish procedures for the review of the public disclosure of financial information extracted from the financial statements of the Company. |
(h) | Establish procedures for the receipt, retention, and treatment of complaints received by the Company regarding accounting, internal accounting controls, or auditing matters, and the confidential, anonymous submission by employees of the Company of concerns regarding questionable accounting or auditing matters. |
Treasury Related
(a) | Monitor and review risk management strategies as they pertain to the Company’s general insurance programs, and foreign exchange and commodity hedging programs, and make recommendations to the Board with respect to such strategies. |
Approve investment policies and appoint investment managers, where appropriate, for the Company’s retirement and other funded benefit plans.
Perform such other duties in respect of financial matters as, in the opinion of the Board, should be performed by the Committee.
7. Meetings and Proceedings
64 | ALAMOS GOLD INC.
ANNUAL INFORMATION FORM - 2016
The Committee shall meet as frequently as required, but not less than four times each year. Any Member or the independent auditors of the Company may call a meeting of the Committee.
The agenda of each meeting of the Committee will include input from the independent auditors, directors, officers and employees of the Company as appropriate. Meetings will include presentations by management, or professional advisers and consultants when appropriate, and will allow sufficient time to permit a full and open discussion of agenda items.
Forty-eight (48) hours advance notice of each meeting will be given to each Member verbally, by telephone or email, unless all Members are present and waive notice, or if those absent waive notice before or after a meeting. Members may attend all meetings either in person or by conference call. Any Member may call a meeting of the Committee.
The independent auditors of the Company are entitled to attend and be heard at meetings of the Committee where there is approval of the financial statements and disclosures under Management’s Discussion and Analysis of Financial Condition and Results of Operations to be included in the Company’s Annual Report to shareholders and any other filing with regulatory authorities. For certainty, the independent auditors of the Company may still be requested by the Committee to attend other meetings of the Committee, from time to time.
The quorum for each meeting of the Committee is a majority of the Members. The Chair of the Committee shall chair each meeting. In the absence of the Chair, the other Members may appoint one of their number as chair of a meeting. The chair of a meeting shall not have a second or casting vote.
The Chair of the Committee or his delegate shall report to the Board following each meeting of the Committee.
The Secretary or his delegate shall keep minutes of all meetings of the Committee, including all resolutions passed by the Committee. Minutes of meetings shall be distributed to the Members and the other directors of the Company after preliminary approval thereof by the Chair of the Committee.
The Committee shall meet regularly, at a minimum quarterly, alone to facilitate full communication.
8. Self-Assessment
The Committee and the Board shall annually assess the effectiveness of the Committee with a view to ensuring that the performance of the Committee accords with best practices.
The Committee shall review and reassess this Charter at least annually and obtain the approval of the Company’s Board for any changes.
65 | ALAMOS GOLD INC.
 ALAMOS GOLD INC.
 ALAMOS GOLD INC.
 3
3 ALAMOS GOLD INC.