false2023Q300011700102/280.500.50350,000,000350,000,000158,019,398161,053,983158,019,398161,053,9831,585,2711,437,548491,047433,03024.850000011700102022-03-012022-11-3000011700102023-01-04xbrli:shares0001170010kmx:UsedVehiclesMember2022-09-012022-11-30iso4217:USD0001170010kmx:UsedVehiclesMemberkmx:NetSalesAndOperatingRevenuesMember2022-09-012022-11-30xbrli:pure0001170010kmx:UsedVehiclesMember2021-09-012021-11-300001170010kmx:UsedVehiclesMemberkmx:NetSalesAndOperatingRevenuesMember2021-09-012021-11-300001170010kmx:UsedVehiclesMember2022-03-012022-11-300001170010kmx:UsedVehiclesMemberkmx:NetSalesAndOperatingRevenuesMember2022-03-012022-11-300001170010kmx:UsedVehiclesMember2021-03-012021-11-300001170010kmx:UsedVehiclesMemberkmx:NetSalesAndOperatingRevenuesMember2021-03-012021-11-300001170010kmx:WholesaleVehiclesMember2022-09-012022-11-300001170010kmx:WholesaleVehiclesMemberkmx:NetSalesAndOperatingRevenuesMember2022-09-012022-11-300001170010kmx:WholesaleVehiclesMember2021-09-012021-11-300001170010kmx:WholesaleVehiclesMemberkmx:NetSalesAndOperatingRevenuesMember2021-09-012021-11-300001170010kmx:WholesaleVehiclesMember2022-03-012022-11-300001170010kmx:WholesaleVehiclesMemberkmx:NetSalesAndOperatingRevenuesMember2022-03-012022-11-300001170010kmx:WholesaleVehiclesMember2021-03-012021-11-300001170010kmx:WholesaleVehiclesMemberkmx:NetSalesAndOperatingRevenuesMember2021-03-012021-11-300001170010kmx:OtherMember2022-09-012022-11-300001170010kmx:OtherMemberkmx:NetSalesAndOperatingRevenuesMember2022-09-012022-11-300001170010kmx:OtherMember2021-09-012021-11-300001170010kmx:OtherMemberkmx:NetSalesAndOperatingRevenuesMember2021-09-012021-11-300001170010kmx:OtherMember2022-03-012022-11-300001170010kmx:OtherMemberkmx:NetSalesAndOperatingRevenuesMember2022-03-012022-11-300001170010kmx:OtherMember2021-03-012021-11-300001170010kmx:OtherMemberkmx:NetSalesAndOperatingRevenuesMember2021-03-012021-11-3000011700102022-09-012022-11-300001170010kmx:NetSalesAndOperatingRevenuesMember2022-09-012022-11-3000011700102021-09-012021-11-300001170010kmx:NetSalesAndOperatingRevenuesMember2021-09-012021-11-300001170010kmx:NetSalesAndOperatingRevenuesMember2022-03-012022-11-3000011700102021-03-012021-11-300001170010kmx:NetSalesAndOperatingRevenuesMember2021-03-012021-11-300001170010kmx:UsedVehiclesMemberus-gaap:CostOfSalesMember2022-09-012022-11-300001170010kmx:UsedVehiclesMemberus-gaap:CostOfSalesMember2021-09-012021-11-300001170010kmx:UsedVehiclesMemberus-gaap:CostOfSalesMember2022-03-012022-11-300001170010kmx:UsedVehiclesMemberus-gaap:CostOfSalesMember2021-03-012021-11-300001170010kmx:WholesaleVehiclesMemberus-gaap:CostOfSalesMember2022-09-012022-11-300001170010kmx:WholesaleVehiclesMemberus-gaap:CostOfSalesMember2021-09-012021-11-300001170010kmx:WholesaleVehiclesMemberus-gaap:CostOfSalesMember2022-03-012022-11-300001170010kmx:WholesaleVehiclesMemberus-gaap:CostOfSalesMember2021-03-012021-11-300001170010kmx:OtherMemberus-gaap:CostOfSalesMember2022-09-012022-11-300001170010kmx:OtherMemberus-gaap:CostOfSalesMember2021-09-012021-11-300001170010kmx:OtherMemberus-gaap:CostOfSalesMember2022-03-012022-11-300001170010kmx:OtherMemberus-gaap:CostOfSalesMember2021-03-012021-11-300001170010us-gaap:CostOfSalesMember2022-09-012022-11-300001170010us-gaap:CostOfSalesMember2021-09-012021-11-300001170010us-gaap:CostOfSalesMember2022-03-012022-11-300001170010us-gaap:CostOfSalesMember2021-03-012021-11-300001170010kmx:GrossProfitMember2022-09-012022-11-300001170010kmx:GrossProfitMember2021-09-012021-11-300001170010kmx:GrossProfitMember2022-03-012022-11-300001170010kmx:GrossProfitMember2021-03-012021-11-300001170010kmx:NetIncomeLossFromFinancingMember2022-09-012022-11-300001170010kmx:NetIncomeLossFromFinancingMember2021-09-012021-11-300001170010kmx:NetIncomeLossFromFinancingMember2022-03-012022-11-300001170010kmx:NetIncomeLossFromFinancingMember2021-03-012021-11-300001170010us-gaap:SellingGeneralAndAdministrativeExpensesMember2022-09-012022-11-300001170010us-gaap:SellingGeneralAndAdministrativeExpensesMember2021-09-012021-11-300001170010us-gaap:SellingGeneralAndAdministrativeExpensesMember2022-03-012022-11-300001170010us-gaap:SellingGeneralAndAdministrativeExpensesMember2021-03-012021-11-300001170010kmx:DepreciationAndAmortizationMember2022-09-012022-11-300001170010kmx:DepreciationAndAmortizationMember2021-09-012021-11-300001170010kmx:DepreciationAndAmortizationMember2022-03-012022-11-300001170010kmx:DepreciationAndAmortizationMember2021-03-012021-11-300001170010us-gaap:InterestExpenseMember2022-09-012022-11-300001170010us-gaap:InterestExpenseMember2021-09-012021-11-300001170010us-gaap:InterestExpenseMember2022-03-012022-11-300001170010us-gaap:InterestExpenseMember2021-03-012021-11-300001170010us-gaap:NonoperatingIncomeExpenseMember2022-09-012022-11-300001170010us-gaap:NonoperatingIncomeExpenseMember2021-09-012021-11-300001170010us-gaap:NonoperatingIncomeExpenseMember2022-03-012022-11-300001170010us-gaap:NonoperatingIncomeExpenseMember2021-03-012021-11-300001170010kmx:EarningsBeforeIncomeTaxesMember2022-09-012022-11-300001170010kmx:EarningsBeforeIncomeTaxesMember2021-09-012021-11-300001170010kmx:EarningsBeforeIncomeTaxesMember2022-03-012022-11-300001170010kmx:EarningsBeforeIncomeTaxesMember2021-03-012021-11-300001170010kmx:IncomeTaxProvisionMember2022-09-012022-11-300001170010kmx:IncomeTaxProvisionMember2021-09-012021-11-300001170010kmx:IncomeTaxProvisionMember2022-03-012022-11-300001170010kmx:IncomeTaxProvisionMember2021-03-012021-11-300001170010kmx:NetEarningsMember2022-09-012022-11-300001170010kmx:NetEarningsMember2021-09-012021-11-300001170010kmx:NetEarningsMember2022-03-012022-11-300001170010kmx:NetEarningsMember2021-03-012021-11-30iso4217:USDxbrli:shares00011700102022-11-3000011700102022-02-2800011700102021-02-2800011700102021-11-300001170010us-gaap:CommonStockMember2022-02-280001170010us-gaap:AdditionalPaidInCapitalMember2022-02-280001170010us-gaap:RetainedEarningsMember2022-02-280001170010us-gaap:AccumulatedOtherComprehensiveIncomeMember2022-02-280001170010us-gaap:RetainedEarningsMember2022-03-012022-05-3100011700102022-03-012022-05-310001170010us-gaap:AccumulatedOtherComprehensiveIncomeMember2022-03-012022-05-310001170010us-gaap:AdditionalPaidInCapitalMember2022-03-012022-05-310001170010us-gaap:CommonStockMember2022-03-012022-05-310001170010us-gaap:CommonStockMember2022-05-310001170010us-gaap:AdditionalPaidInCapitalMember2022-05-310001170010us-gaap:RetainedEarningsMember2022-05-310001170010us-gaap:AccumulatedOtherComprehensiveIncomeMember2022-05-3100011700102022-05-310001170010us-gaap:RetainedEarningsMember2022-06-012022-08-3100011700102022-06-012022-08-310001170010us-gaap:AccumulatedOtherComprehensiveIncomeMember2022-06-012022-08-310001170010us-gaap:AdditionalPaidInCapitalMember2022-06-012022-08-310001170010us-gaap:CommonStockMember2022-06-012022-08-310001170010us-gaap:CommonStockMember2022-08-310001170010us-gaap:AdditionalPaidInCapitalMember2022-08-310001170010us-gaap:RetainedEarningsMember2022-08-310001170010us-gaap:AccumulatedOtherComprehensiveIncomeMember2022-08-3100011700102022-08-310001170010us-gaap:RetainedEarningsMember2022-09-012022-11-300001170010us-gaap:AccumulatedOtherComprehensiveIncomeMember2022-09-012022-11-300001170010us-gaap:AdditionalPaidInCapitalMember2022-09-012022-11-300001170010us-gaap:CommonStockMember2022-09-012022-11-300001170010us-gaap:CommonStockMember2022-11-300001170010us-gaap:AdditionalPaidInCapitalMember2022-11-300001170010us-gaap:RetainedEarningsMember2022-11-300001170010us-gaap:AccumulatedOtherComprehensiveIncomeMember2022-11-300001170010us-gaap:CommonStockMember2021-02-280001170010us-gaap:AdditionalPaidInCapitalMember2021-02-280001170010us-gaap:RetainedEarningsMember2021-02-280001170010us-gaap:AccumulatedOtherComprehensiveIncomeMember2021-02-280001170010us-gaap:RetainedEarningsMember2021-03-012021-05-3100011700102021-03-012021-05-310001170010us-gaap:AccumulatedOtherComprehensiveIncomeMember2021-03-012021-05-310001170010us-gaap:AdditionalPaidInCapitalMember2021-03-012021-05-310001170010us-gaap:CommonStockMember2021-03-012021-05-310001170010us-gaap:CommonStockMember2021-05-310001170010us-gaap:AdditionalPaidInCapitalMember2021-05-310001170010us-gaap:RetainedEarningsMember2021-05-310001170010us-gaap:AccumulatedOtherComprehensiveIncomeMember2021-05-3100011700102021-05-310001170010us-gaap:RetainedEarningsMember2021-06-012021-08-3100011700102021-06-012021-08-310001170010us-gaap:AccumulatedOtherComprehensiveIncomeMember2021-06-012021-08-310001170010us-gaap:AdditionalPaidInCapitalMember2021-06-012021-08-310001170010us-gaap:CommonStockMember2021-06-012021-08-310001170010us-gaap:CommonStockMember2021-08-310001170010us-gaap:AdditionalPaidInCapitalMember2021-08-310001170010us-gaap:RetainedEarningsMember2021-08-310001170010us-gaap:AccumulatedOtherComprehensiveIncomeMember2021-08-3100011700102021-08-310001170010us-gaap:RetainedEarningsMember2021-09-012021-11-300001170010us-gaap:AccumulatedOtherComprehensiveIncomeMember2021-09-012021-11-300001170010us-gaap:AdditionalPaidInCapitalMember2021-09-012021-11-300001170010us-gaap:CommonStockMember2021-09-012021-11-300001170010us-gaap:CommonStockMember2021-11-300001170010us-gaap:AdditionalPaidInCapitalMember2021-11-300001170010us-gaap:RetainedEarningsMember2021-11-300001170010us-gaap:AccumulatedOtherComprehensiveIncomeMember2021-11-30kmx:segment00011700102021-06-0100011700102021-06-012021-06-010001170010kmx:EdmundsMember2021-06-012021-06-010001170010kmx:EdmundsMember2021-06-010001170010us-gaap:TradeNamesMember2021-06-012021-06-010001170010kmx:InternallyDevelopedSoftwareMember2021-06-012021-06-010001170010us-gaap:CustomerRelationshipsMember2021-06-012021-06-010001170010kmx:UsedVehiclesMember2022-09-012022-11-300001170010kmx:UsedVehiclesMember2021-09-012021-11-300001170010kmx:UsedVehiclesMember2022-03-012022-11-300001170010kmx:UsedVehiclesMember2021-03-012021-11-300001170010kmx:WholesaleVehiclesMember2022-09-012022-11-300001170010kmx:WholesaleVehiclesMember2021-09-012021-11-300001170010kmx:WholesaleVehiclesMember2022-03-012022-11-300001170010kmx:WholesaleVehiclesMember2021-03-012021-11-300001170010kmx:ExtendedprotectionplanDomain2022-09-012022-11-300001170010kmx:ExtendedprotectionplanDomain2021-09-012021-11-300001170010kmx:ExtendedprotectionplanDomain2022-03-012022-11-300001170010kmx:ExtendedprotectionplanDomain2021-03-012021-11-300001170010kmx:ThirdpartyfinancefeesDomain2022-09-012022-11-300001170010kmx:ThirdpartyfinancefeesDomain2021-09-012021-11-300001170010kmx:ThirdpartyfinancefeesDomain2022-03-012022-11-300001170010kmx:ThirdpartyfinancefeesDomain2021-03-012021-11-300001170010kmx:AdvertisingSubscriptionRevenuesDomain2022-09-012022-11-300001170010kmx:AdvertisingSubscriptionRevenuesDomain2021-09-012021-11-300001170010kmx:AdvertisingSubscriptionRevenuesDomain2022-03-012022-11-300001170010kmx:AdvertisingSubscriptionRevenuesDomain2021-03-012021-11-300001170010kmx:ServiceDomain2022-09-012022-11-300001170010kmx:ServiceDomain2021-09-012021-11-300001170010kmx:ServiceDomain2022-03-012022-11-300001170010kmx:ServiceDomain2021-03-012021-11-300001170010kmx:OtherDomain2022-09-012022-11-300001170010kmx:OtherDomain2021-09-012021-11-300001170010kmx:OtherDomain2022-03-012022-11-300001170010kmx:OtherDomain2021-03-012021-11-300001170010kmx:OtherMember2022-09-012022-11-300001170010kmx:OtherMember2021-09-012021-11-300001170010kmx:OtherMember2022-03-012022-11-300001170010kmx:OtherMember2021-03-012021-11-300001170010kmx:InterestAndFeeIncomeMember2022-09-012022-11-300001170010kmx:InterestAndFeeIncomeMember2021-09-012021-11-300001170010kmx:InterestAndFeeIncomeMember2022-03-012022-11-300001170010kmx:InterestAndFeeIncomeMember2021-03-012021-11-300001170010kmx:InterestIncomeExpenseNetMember2022-09-012022-11-300001170010kmx:InterestIncomeExpenseNetMember2021-09-012021-11-300001170010kmx:InterestIncomeExpenseNetMember2022-03-012022-11-300001170010kmx:InterestIncomeExpenseNetMember2021-03-012021-11-300001170010kmx:ProvisionForLoanLossesMember2022-09-012022-11-300001170010kmx:ProvisionForLoanLossesMember2021-09-012021-11-300001170010kmx:ProvisionForLoanLossesMember2022-03-012022-11-300001170010kmx:ProvisionForLoanLossesMember2021-03-012021-11-300001170010kmx:TotalInterestMarginAfterProvisionForLoanLossesMember2022-09-012022-11-300001170010kmx:TotalInterestMarginAfterProvisionForLoanLossesMember2021-09-012021-11-300001170010kmx:TotalInterestMarginAfterProvisionForLoanLossesMember2022-03-012022-11-300001170010kmx:TotalInterestMarginAfterProvisionForLoanLossesMember2021-03-012021-11-300001170010kmx:PayrollAndFringeBenefitExpenseMember2022-09-012022-11-300001170010kmx:PayrollAndFringeBenefitExpenseMember2021-09-012021-11-300001170010kmx:PayrollAndFringeBenefitExpenseMember2022-03-012022-11-300001170010kmx:PayrollAndFringeBenefitExpenseMember2021-03-012021-11-300001170010kmx:OtherDirectExpensesMember2022-09-012022-11-300001170010kmx:OtherDirectExpensesMember2021-09-012021-11-300001170010kmx:OtherDirectExpensesMember2022-03-012022-11-300001170010kmx:OtherDirectExpensesMember2021-03-012021-11-300001170010kmx:TotalDirectExpensesMember2022-09-012022-11-300001170010kmx:TotalDirectExpensesMember2021-09-012021-11-300001170010kmx:TotalDirectExpensesMember2022-03-012022-11-300001170010kmx:TotalDirectExpensesMember2021-03-012021-11-300001170010kmx:CarmaxAutoFinanceIncomeMember2022-09-012022-11-300001170010kmx:CarmaxAutoFinanceIncomeMember2021-09-012021-11-300001170010kmx:CarmaxAutoFinanceIncomeMember2022-03-012022-11-300001170010kmx:CarmaxAutoFinanceIncomeMember2021-03-012021-11-300001170010kmx:TermSecuritizationsMember2022-11-300001170010kmx:TermSecuritizationsMember2022-02-280001170010kmx:WarehouseFacilitiesReceivablesMember2022-11-300001170010kmx:WarehouseFacilitiesReceivablesMember2022-02-280001170010kmx:ExcessCollateralMember2022-11-300001170010kmx:ExcessCollateralMember2022-02-280001170010kmx:OtherReceivablesMember2022-11-300001170010kmx:OtherReceivablesMember2022-02-280001170010kmx:CreditGradeAMemberkmx:CoreManagedReceivablesMember2022-11-300001170010kmx:CreditGradeBMemberkmx:CoreManagedReceivablesMember2022-11-300001170010kmx:CreditGradeCAndOtherMemberkmx:CoreManagedReceivablesMember2022-11-300001170010kmx:CoreManagedReceivablesMember2022-11-300001170010kmx:CreditGradeCAndOtherMemberkmx:OtherManagedReceivablesMember2022-11-300001170010kmx:CreditGradeAMemberkmx:CoreManagedReceivablesMember2022-02-280001170010kmx:CreditGradeBMemberkmx:CoreManagedReceivablesMember2022-02-280001170010kmx:CreditGradeCAndOtherMemberkmx:CoreManagedReceivablesMember2022-02-280001170010kmx:CoreManagedReceivablesMember2022-02-280001170010kmx:CreditGradeCAndOtherMemberkmx:OtherManagedReceivablesMember2022-02-280001170010kmx:CoreManagedReceivablesMember2022-08-310001170010kmx:OtherManagedReceivablesMember2022-08-310001170010us-gaap:AllowanceForLoanAndLeaseLossesMember2022-08-310001170010kmx:CoreManagedReceivablesMember2022-09-012022-11-300001170010kmx:OtherManagedReceivablesMember2022-09-012022-11-300001170010kmx:OtherManagedReceivablesMember2022-11-300001170010us-gaap:AllowanceForLoanAndLeaseLossesMember2022-11-300001170010kmx:CoreManagedReceivablesMember2021-08-310001170010kmx:OtherManagedReceivablesMember2021-08-310001170010us-gaap:AllowanceForLoanAndLeaseLossesMember2021-08-310001170010kmx:CoreManagedReceivablesMember2021-09-012021-11-300001170010kmx:OtherManagedReceivablesMember2021-09-012021-11-300001170010kmx:CoreManagedReceivablesMember2021-11-300001170010kmx:OtherManagedReceivablesMember2021-11-300001170010us-gaap:AllowanceForLoanAndLeaseLossesMember2021-11-300001170010kmx:OtherManagedReceivablesMember2022-02-280001170010us-gaap:AllowanceForLoanAndLeaseLossesMember2022-02-280001170010kmx:CoreManagedReceivablesMember2022-03-012022-11-300001170010kmx:OtherManagedReceivablesMember2022-03-012022-11-300001170010kmx:CoreManagedReceivablesMember2021-02-280001170010kmx:OtherManagedReceivablesMember2021-02-280001170010us-gaap:AllowanceForLoanAndLeaseLossesMember2021-02-280001170010kmx:CoreManagedReceivablesMember2021-03-012021-11-300001170010kmx:OtherManagedReceivablesMember2021-03-012021-11-300001170010kmx:OneToThirtyDaysPastDueMember2022-11-300001170010kmx:CreditGradeAMemberkmx:CoreManagedReceivablesMemberkmx:ThirtyOneToSixtyDaysPastDueMember2022-11-300001170010kmx:CreditGradeBMemberkmx:CoreManagedReceivablesMemberkmx:ThirtyOneToSixtyDaysPastDueMember2022-11-300001170010kmx:CreditGradeCAndOtherMemberkmx:CoreManagedReceivablesMemberkmx:ThirtyOneToSixtyDaysPastDueMember2022-11-300001170010kmx:CoreManagedReceivablesMemberkmx:ThirtyOneToSixtyDaysPastDueMember2022-11-300001170010kmx:CreditGradeCAndOtherMemberkmx:ThirtyOneToSixtyDaysPastDueMemberkmx:OtherManagedReceivablesMember2022-11-300001170010kmx:ThirtyOneToSixtyDaysPastDueMember2022-11-300001170010kmx:SixtyOneToNinetyDaysPastDueMemberkmx:CreditGradeAMemberkmx:CoreManagedReceivablesMember2022-11-300001170010kmx:SixtyOneToNinetyDaysPastDueMemberkmx:CreditGradeBMemberkmx:CoreManagedReceivablesMember2022-11-300001170010kmx:SixtyOneToNinetyDaysPastDueMemberkmx:CreditGradeCAndOtherMemberkmx:CoreManagedReceivablesMember2022-11-300001170010kmx:SixtyOneToNinetyDaysPastDueMemberkmx:CoreManagedReceivablesMember2022-11-300001170010kmx:SixtyOneToNinetyDaysPastDueMemberkmx:CreditGradeCAndOtherMemberkmx:OtherManagedReceivablesMember2022-11-300001170010kmx:SixtyOneToNinetyDaysPastDueMember2022-11-300001170010kmx:CreditGradeAMemberkmx:CoreManagedReceivablesMemberkmx:GreaterThanNinetyDaysPastDueMember2022-11-300001170010kmx:CreditGradeBMemberkmx:CoreManagedReceivablesMemberkmx:GreaterThanNinetyDaysPastDueMember2022-11-300001170010kmx:CreditGradeCAndOtherMemberkmx:CoreManagedReceivablesMemberkmx:GreaterThanNinetyDaysPastDueMember2022-11-300001170010kmx:CoreManagedReceivablesMemberkmx:GreaterThanNinetyDaysPastDueMember2022-11-300001170010kmx:CreditGradeCAndOtherMemberkmx:GreaterThanNinetyDaysPastDueMemberkmx:OtherManagedReceivablesMember2022-11-300001170010kmx:GreaterThanNinetyDaysPastDueMember2022-11-300001170010kmx:OneToThirtyDaysPastDueMember2022-02-280001170010kmx:CreditGradeAMemberkmx:CoreManagedReceivablesMemberkmx:ThirtyOneToSixtyDaysPastDueMember2022-02-280001170010kmx:CreditGradeBMemberkmx:CoreManagedReceivablesMemberkmx:ThirtyOneToSixtyDaysPastDueMember2022-02-280001170010kmx:CreditGradeCAndOtherMemberkmx:CoreManagedReceivablesMemberkmx:ThirtyOneToSixtyDaysPastDueMember2022-02-280001170010kmx:CoreManagedReceivablesMemberkmx:ThirtyOneToSixtyDaysPastDueMember2022-02-280001170010kmx:CreditGradeCAndOtherMemberkmx:ThirtyOneToSixtyDaysPastDueMemberkmx:OtherManagedReceivablesMember2022-02-280001170010kmx:ThirtyOneToSixtyDaysPastDueMember2022-02-280001170010kmx:SixtyOneToNinetyDaysPastDueMemberkmx:CreditGradeAMemberkmx:CoreManagedReceivablesMember2022-02-280001170010kmx:SixtyOneToNinetyDaysPastDueMemberkmx:CreditGradeBMemberkmx:CoreManagedReceivablesMember2022-02-280001170010kmx:SixtyOneToNinetyDaysPastDueMemberkmx:CreditGradeCAndOtherMemberkmx:CoreManagedReceivablesMember2022-02-280001170010kmx:SixtyOneToNinetyDaysPastDueMemberkmx:CoreManagedReceivablesMember2022-02-280001170010kmx:SixtyOneToNinetyDaysPastDueMemberkmx:CreditGradeCAndOtherMemberkmx:OtherManagedReceivablesMember2022-02-280001170010kmx:SixtyOneToNinetyDaysPastDueMember2022-02-280001170010kmx:CreditGradeAMemberkmx:CoreManagedReceivablesMemberkmx:GreaterThanNinetyDaysPastDueMember2022-02-280001170010kmx:CreditGradeBMemberkmx:CoreManagedReceivablesMemberkmx:GreaterThanNinetyDaysPastDueMember2022-02-280001170010kmx:CreditGradeCAndOtherMemberkmx:CoreManagedReceivablesMemberkmx:GreaterThanNinetyDaysPastDueMember2022-02-280001170010kmx:CoreManagedReceivablesMemberkmx:GreaterThanNinetyDaysPastDueMember2022-02-280001170010kmx:CreditGradeCAndOtherMemberkmx:GreaterThanNinetyDaysPastDueMemberkmx:OtherManagedReceivablesMember2022-02-280001170010kmx:GreaterThanNinetyDaysPastDueMember2022-02-280001170010us-gaap:DesignatedAsHedgingInstrumentMemberus-gaap:InterestRateSwapMemberus-gaap:CashFlowHedgingMember2022-03-012022-11-300001170010us-gaap:NondesignatedMemberus-gaap:InterestRateSwapMemberus-gaap:CashFlowHedgingMember2022-09-012022-11-300001170010us-gaap:NondesignatedMemberus-gaap:InterestRateSwapMemberus-gaap:CashFlowHedgingMember2022-03-012022-11-300001170010us-gaap:DesignatedAsHedgingInstrumentMemberus-gaap:InterestRateSwapMemberus-gaap:CashFlowHedgingMember2022-11-300001170010us-gaap:DesignatedAsHedgingInstrumentMemberus-gaap:InterestRateSwapMemberus-gaap:CashFlowHedgingMember2022-02-280001170010us-gaap:NondesignatedMemberus-gaap:InterestRateSwapMemberus-gaap:CashFlowHedgingMember2022-11-300001170010us-gaap:NondesignatedMemberus-gaap:InterestRateSwapMemberus-gaap:CashFlowHedgingMember2022-02-280001170010us-gaap:FairValueInputsLevel1Member2022-11-300001170010us-gaap:FairValueInputsLevel2Member2022-11-300001170010us-gaap:DesignatedAsHedgingInstrumentMemberus-gaap:FairValueInputsLevel1Member2022-11-300001170010us-gaap:DesignatedAsHedgingInstrumentMemberus-gaap:FairValueInputsLevel2Member2022-11-300001170010us-gaap:DesignatedAsHedgingInstrumentMember2022-11-300001170010us-gaap:NondesignatedMemberus-gaap:FairValueInputsLevel1Member2022-11-300001170010us-gaap:NondesignatedMemberus-gaap:FairValueInputsLevel2Member2022-11-300001170010us-gaap:NondesignatedMember2022-11-300001170010us-gaap:FairValueInputsLevel1Member2022-02-280001170010us-gaap:FairValueInputsLevel2Member2022-02-280001170010us-gaap:DesignatedAsHedgingInstrumentMemberus-gaap:FairValueInputsLevel1Member2022-02-280001170010us-gaap:DesignatedAsHedgingInstrumentMemberus-gaap:FairValueInputsLevel2Member2022-02-280001170010us-gaap:DesignatedAsHedgingInstrumentMember2022-02-280001170010us-gaap:NondesignatedMemberus-gaap:FairValueInputsLevel1Member2022-02-280001170010us-gaap:NondesignatedMemberus-gaap:FairValueInputsLevel2Member2022-02-280001170010us-gaap:NondesignatedMember2022-02-280001170010us-gaap:RevolvingCreditFacilityMember2022-11-300001170010us-gaap:RevolvingCreditFacilityMember2022-02-280001170010kmx:TermLoanMember2022-11-300001170010kmx:TermLoanMember2022-02-280001170010kmx:October2021TermLoanMember2022-11-300001170010kmx:October2021TermLoanMember2022-02-280001170010kmx:A3.86seniornotesdues2023Member2022-11-300001170010kmx:A3.86seniornotesdues2023Member2022-02-280001170010kmx:A4.17seniornotesdue2026Member2022-11-300001170010kmx:A4.17seniornotesdue2026Member2022-02-280001170010kmx:A4.27seniornotesdue2028Member2022-11-300001170010kmx:A4.27seniornotesdue2028Member2022-02-280001170010us-gaap:LineOfCreditMember2022-11-300001170010kmx:TermLoanMember2022-11-300001170010kmx:October2021TermLoanMember2022-11-300001170010us-gaap:SeniorNotesMember2022-11-300001170010kmx:FinancingObligationMembersrt:MinimumMember2022-03-012022-11-300001170010srt:MaximumMemberkmx:FinancingObligationMember2022-03-012022-11-300001170010kmx:WarehouseFacilityThreeMember2022-11-300001170010kmx:WarehouseFacilityTwoMember2022-11-300001170010kmx:WarehouseFacilityOneMember2022-11-300001170010kmx:WarehouseFacilitiesMember2022-11-300001170010kmx:TermSecuritizationsDebtMember2022-11-300001170010kmx:ShareRepurchaseProgramMember2022-11-300001170010kmx:ShareRepurchaseProgramMember2022-09-012022-11-300001170010kmx:ShareRepurchaseProgramMember2021-09-012021-11-300001170010kmx:ShareRepurchaseProgramMember2022-03-012022-11-300001170010kmx:ShareRepurchaseProgramMember2021-03-012021-11-300001170010kmx:ShareRepurchaseProgramMember2021-11-300001170010us-gaap:CostOfSalesMember2022-09-012022-11-300001170010us-gaap:CostOfSalesMember2021-09-012021-11-300001170010us-gaap:CostOfSalesMember2022-03-012022-11-300001170010us-gaap:CostOfSalesMember2021-03-012021-11-300001170010kmx:CarmaxAutoFinanceIncomeMember2022-09-012022-11-300001170010kmx:CarmaxAutoFinanceIncomeMember2021-09-012021-11-300001170010kmx:CarmaxAutoFinanceIncomeMember2022-03-012022-11-300001170010kmx:CarmaxAutoFinanceIncomeMember2021-03-012021-11-300001170010us-gaap:SellingGeneralAndAdministrativeExpensesMember2022-09-012022-11-300001170010us-gaap:SellingGeneralAndAdministrativeExpensesMember2021-09-012021-11-300001170010us-gaap:SellingGeneralAndAdministrativeExpensesMember2022-03-012022-11-300001170010us-gaap:SellingGeneralAndAdministrativeExpensesMember2021-03-012021-11-300001170010us-gaap:EmployeeStockOptionMember2022-09-012022-11-300001170010us-gaap:EmployeeStockOptionMember2021-09-012021-11-300001170010us-gaap:EmployeeStockOptionMember2022-03-012022-11-300001170010us-gaap:EmployeeStockOptionMember2021-03-012021-11-300001170010kmx:CashSettledRestrictedStockUnitsMember2022-09-012022-11-300001170010kmx:CashSettledRestrictedStockUnitsMember2021-09-012021-11-300001170010kmx:CashSettledRestrictedStockUnitsMember2022-03-012022-11-300001170010kmx:CashSettledRestrictedStockUnitsMember2021-03-012021-11-300001170010kmx:StockSettledRestrictedStockUnitsMember2022-09-012022-11-300001170010kmx:StockSettledRestrictedStockUnitsMember2021-09-012021-11-300001170010kmx:StockSettledRestrictedStockUnitsMember2022-03-012022-11-300001170010kmx:StockSettledRestrictedStockUnitsMember2021-03-012021-11-300001170010us-gaap:PerformanceSharesMember2022-09-012022-11-300001170010us-gaap:PerformanceSharesMember2021-09-012021-11-300001170010us-gaap:PerformanceSharesMember2022-03-012022-11-300001170010us-gaap:PerformanceSharesMember2021-03-012021-11-300001170010us-gaap:RestrictedStockMember2022-09-012022-11-300001170010us-gaap:RestrictedStockMember2021-09-012021-11-300001170010us-gaap:RestrictedStockMember2022-03-012022-11-300001170010us-gaap:RestrictedStockMember2021-03-012021-11-300001170010kmx:DeferredStockUnitsMember2022-09-012022-11-300001170010kmx:DeferredStockUnitsMember2021-09-012021-11-300001170010kmx:DeferredStockUnitsMember2022-03-012022-11-300001170010kmx:DeferredStockUnitsMember2021-03-012021-11-300001170010us-gaap:EmployeeStockMember2022-09-012022-11-300001170010us-gaap:EmployeeStockMember2021-09-012021-11-300001170010us-gaap:EmployeeStockMember2022-03-012022-11-300001170010us-gaap:EmployeeStockMember2021-03-012021-11-300001170010kmx:OthersharebasedincentivesMember2022-09-012022-11-300001170010kmx:OthersharebasedincentivesMember2021-09-012021-11-300001170010kmx:OthersharebasedincentivesMember2022-03-012022-11-300001170010kmx:OthersharebasedincentivesMember2021-03-012021-11-300001170010kmx:StockSettledRestrictedStockUnitsMember2022-02-280001170010kmx:OthersharebasedincentivesMember2022-02-280001170010kmx:CashSettledRestrictedStockUnitsMember2022-02-280001170010kmx:StockSettledRestrictedStockUnitsMember2022-11-300001170010kmx:OthersharebasedincentivesMember2022-11-300001170010kmx:CashSettledRestrictedStockUnitsMember2022-11-300001170010us-gaap:EmployeeStockOptionMember2022-09-012022-11-300001170010us-gaap:EmployeeStockOptionMember2021-09-012021-11-300001170010us-gaap:EmployeeStockOptionMember2022-03-012022-11-300001170010us-gaap:EmployeeStockOptionMember2021-03-012021-11-300001170010kmx:StockSettledStockUnitsAndAwardsMember2022-09-012022-11-300001170010kmx:StockSettledStockUnitsAndAwardsMember2021-09-012021-11-300001170010kmx:StockSettledStockUnitsAndAwardsMember2022-03-012022-11-300001170010kmx:StockSettledStockUnitsAndAwardsMember2021-03-012021-11-300001170010kmx:UnrecognizedActuarialLossesMember2022-02-280001170010kmx:UnrecognizedHedgeLossesMember2022-02-280001170010kmx:UnrecognizedActuarialLossesMember2022-03-012022-11-300001170010kmx:UnrecognizedHedgeLossesMember2022-03-012022-11-300001170010kmx:UnrecognizedActuarialLossesMember2022-11-300001170010kmx:UnrecognizedHedgeLossesMember2022-11-300001170010kmx:CarmaxAutoFinanceMember2022-09-012022-11-300001170010kmx:CarmaxAutoFinanceMember2021-09-012021-11-300001170010kmx:CarmaxAutoFinanceMember2022-03-012022-11-300001170010kmx:CarmaxAutoFinanceMember2021-03-012021-11-300001170010srt:MinimumMember2022-03-012022-11-300001170010srt:MaximumMember2022-03-012022-11-30utr:Rate0001170010kmx:CarMaxSalesOperationsMember2022-09-012022-11-300001170010us-gaap:AllOtherSegmentsMember2022-09-012022-11-300001170010us-gaap:IntersegmentEliminationMemberus-gaap:AllOtherSegmentsMember2022-09-012022-11-300001170010us-gaap:IntersegmentEliminationMember2022-09-012022-11-300001170010us-gaap:OperatingSegmentsMemberkmx:CarMaxSalesOperationsMember2022-09-012022-11-300001170010us-gaap:AllOtherSegmentsMemberus-gaap:OperatingSegmentsMember2022-09-012022-11-300001170010us-gaap:CostOfSalesMemberkmx:CarMaxSalesOperationsMember2022-09-012022-11-300001170010us-gaap:CostOfSalesMemberus-gaap:AllOtherSegmentsMember2022-09-012022-11-300001170010kmx:CarMaxSalesOperationsMember2022-03-012022-11-300001170010us-gaap:AllOtherSegmentsMember2022-03-012022-11-300001170010us-gaap:IntersegmentEliminationMemberus-gaap:AllOtherSegmentsMember2022-03-012022-11-300001170010us-gaap:IntersegmentEliminationMember2022-03-012022-11-300001170010us-gaap:OperatingSegmentsMemberkmx:CarMaxSalesOperationsMember2022-03-012022-11-300001170010us-gaap:AllOtherSegmentsMemberus-gaap:OperatingSegmentsMember2022-03-012022-11-300001170010us-gaap:CostOfSalesMemberkmx:CarMaxSalesOperationsMember2022-03-012022-11-300001170010us-gaap:CostOfSalesMemberus-gaap:AllOtherSegmentsMember2022-03-012022-11-30
UNITED STATES
SECURITIES AND EXCHANGE COMMISSION
WASHINGTON, D.C. 20549
FORM 10-Q
| | | | | |
| ☒ | QUARTERLY REPORT PURSUANT TO SECTION 13 OR 15(d) OF THE SECURITIES EXCHANGE ACT OF 1934 |
For the Quarterly Period Ended November 30, 2022
OR
| | | | | |
| ☐ | TRANSITION REPORT PURSUANT TO SECTION 13 OR 15(d) OF THE SECURITIES EXCHANGE ACT OF 1934 |
Commission File Number: 1-31420
CARMAX, INC.
(Exact name of registrant as specified in its charter)
| | | | | | | | | | | |
Virginia | | 54-1821055 |
(State or other jurisdiction of incorporation) | | (I.R.S. Employer Identification No.) |
| |
12800 Tuckahoe Creek Parkway | | 23238 |
Richmond, | Virginia | | |
(Address of Principal Executive Offices) | | (Zip Code) |
(804) 747-0422
(Registrant’s telephone number, including area code)
N/A
(Former name, former address and former fiscal year, if changed since last report)
Securities registered pursuant to Section 12(b) of the Act:
| | | | | | | | |
Title of each class | Trading Symbol(s) | Name of each exchange on which registered |
Common Stock | KMX | New York Stock Exchange |
Indicate by check mark whether the registrant (1) has filed all reports required to be filed by Section 13 or 15(d) of the Securities Exchange Act of 1934 during the preceding 12 months (or for such shorter period that the registrant was required to file such reports), and (2) has been subject to such filing requirements for the past 90 days. Yes ☒ No ☐
Indicate by check mark whether the registrant has submitted electronically every Interactive Data File required to be submitted pursuant to Rule 405 of Regulation S-T during the preceding 12 months (or for such shorter period that the registrant was required to submit such files). Yes ☒ No ☐
Indicate by check mark whether the registrant is a large accelerated filer, an accelerated filer, a non-accelerated filer, a smaller reporting company, or an emerging growth company. See the definitions of “large accelerated filer,” “accelerated filer,” “smaller reporting company,” and “emerging growth company” in Rule 12b-2 of the Exchange Act.
| | | | | | | | | | | |
| Large accelerated filer | ☒ | Accelerated filer | ☐ |
| Non-accelerated filer | ☐ | Smaller reporting company | ☐ |
| | Emerging growth company | ☐ |
If an emerging growth company, indicate by check mark if the registrant has elected not to use the extended transition period for complying with any new or revised financial accounting standards provided pursuant to Section 13(a) of the Exchange Act. ☐
Indicate by check mark whether the registrant is a shell company (as defined in Rule 12b-2 of the Exchange Act). Yes ☐ No ☒
Indicate the number of shares outstanding of each of the issuer’s classes of common stock, as of the latest practicable date.
| | | | | | | | |
| Class | | Outstanding as of January 4, 2023 |
| Common Stock, par value $0.50 | | 158,023,499 |
CARMAX, INC. AND SUBSIDIARIES
TABLE OF CONTENTS
| | | | | | | | | | | |
| | Page No. |
| PART I. | FINANCIAL INFORMATION | |
| | | |
| | Item 1. | Financial Statements: | |
| | | |
| | | Consolidated Statements of Earnings (Unaudited) – | |
| | | Three and Nine Months Ended November 30, 2022 and 2021 | |
| | | | |
| | | Consolidated Statements of Comprehensive Income (Unaudited) – | |
| | | Three and Nine Months Ended November 30, 2022 and 2021 | |
| | | | |
| | | Consolidated Balance Sheets (Unaudited) – | |
| | | November 30, 2022 and February 28, 2022 | |
| | | | |
| | | Consolidated Statements of Cash Flows (Unaudited) – | |
| | | Nine Months Ended November 30, 2022 and 2021 | |
| | | | |
| | Consolidated Statements of Shareholders’ Equity (Unaudited) – | |
| | Three and Nine Months Ended November 30, 2022 and 2021 | |
| | | |
| | | Notes to Consolidated Financial Statements (Unaudited) | |
| | | |
| Item 2. | Management’s Discussion and Analysis of Financial Condition and | |
| | | Results of Operations | |
| | | |
| | Item 3. | Quantitative and Qualitative Disclosures About Market Risk | |
| | | |
| | Item 4. | Controls and Procedures | |
| | | |
| PART II. | OTHER INFORMATION | |
| | | |
| | Item 1. | Legal Proceedings | |
| | | |
| | Item 1A. | Risk Factors | |
| | | |
| | Item 2. | Unregistered Sales of Equity Securities and Use of Proceeds | |
| | | |
| | Item 6. | Exhibits | |
| | | |
| SIGNATURES | |
| |
PART I. FINANCIAL INFORMATION
ITEM 1. FINANCIAL STATEMENTS
CARMAX, INC. AND SUBSIDIARIES
Consolidated Statements of Earnings
(Unaudited)
| | | | | | | | | | | | | | | | | | | | | | | | | | | | | | | | | | | |
| | Three Months Ended November 30 | | Nine Months Ended November 30 |
| (In thousands except per share data) | 2022 | %(1) | | 2021 | %(1) | | 2022 | %(1) | | 2021 | %(1) |
| SALES AND OPERATING REVENUES: | | | | | | | | | | | |
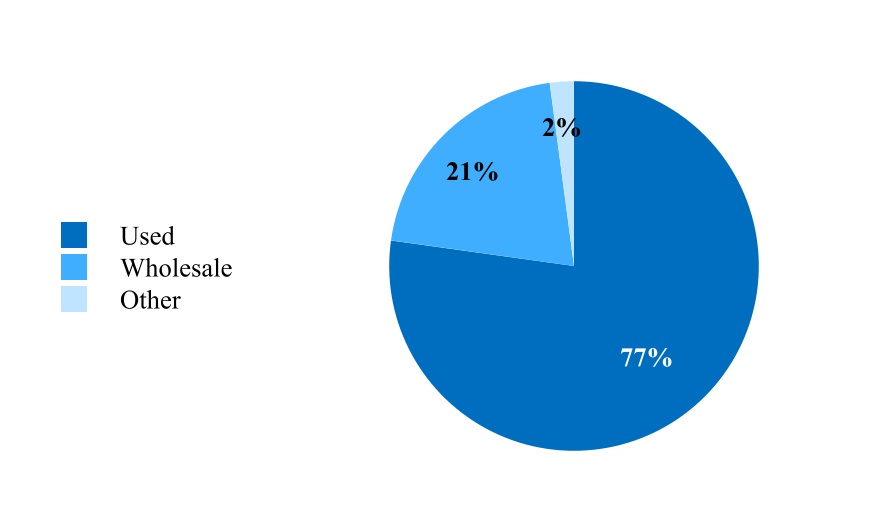
| Used vehicle sales | $ | 5,204,584 | | 80.0 | | | $ | 6,435,590 | | 75.5 | | | $ | 18,503,159 | | 77.2 | | | $ | 18,697,300 | | 77.2 | |
| Wholesale vehicle sales | 1,152,207 | | 17.7 | | | 1,922,283 | | 22.5 | | | 4,959,050 | | 20.7 | | | 4,998,212 | | 20.6 | |
| Other sales and revenues | 149,165 | | 2.3 | | | 169,886 | | 2.0 | | | 500,171 | | 2.1 | | | 518,205 | | 2.1 | |
| NET SALES AND OPERATING REVENUES | 6,505,956 | | 100.0 | | | 8,527,759 | | 100.0 | | | 23,962,380 | | 100.0 | | | 24,213,717 | | 100.0 | |
| COST OF SALES: | | | | | | | | | | | |
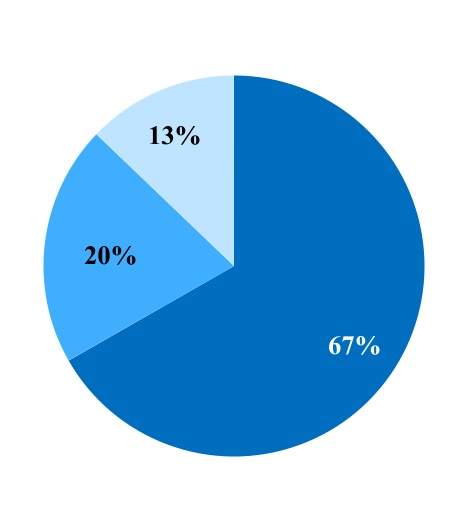
| Used vehicle cost of sales | 4,801,790 | | 73.8 | | | 5,927,237 | | 69.5 | | | 17,041,898 | | 71.1 | | | 17,085,416 | | 70.6 | |
| Wholesale vehicle cost of sales | 1,037,534 | | 15.9 | | | 1,710,103 | | 20.1 | | | 4,512,053 | | 18.8 | | | 4,411,175 | | 18.2 | |
| Other cost of sales | 89,944 | | 1.4 | | | 53,859 | | 0.6 | | | 219,205 | | 0.9 | | | 140,573 | | 0.6 | |
| TOTAL COST OF SALES | 5,929,268 | | 91.1 | | | 7,691,199 | | 90.2 | | | 21,773,156 | | 90.9 | | | 21,637,164 | | 89.4 | |
| GROSS PROFIT | 576,688 | | 8.9 | | | 836,560 | | 9.8 | | | 2,189,224 | | 9.1 | | | 2,576,553 | | 10.6 | |
| CARMAX AUTO FINANCE INCOME | 152,196 | | 2.3 | | | 165,968 | | 1.9 | | | 539,538 | | 2.3 | | | 607,732 | | 2.5 | |
| Selling, general and administrative expenses | 591,727 | | 9.1 | | | 575,930 | | 6.8 | | | 1,914,508 | | 8.0 | | | 1,704,285 | | 7.0 | |
| Depreciation and amortization | 57,377 | | 0.9 | | | 54,428 | | 0.6 | | | 170,717 | | 0.7 | | | 157,107 | | 0.6 | |
| Interest expense | 30,150 | | 0.5 | | | 24,303 | | 0.3 | | | 91,670 | | 0.4 | | | 67,247 | | 0.3 | |
| Other income | (363) | | — | | | (8,094) | | (0.1) | | | (2,303) | | — | | | (35,453) | | (0.1) | |
| Earnings before income taxes | 49,993 | | 0.8 | | | 355,961 | | 4.2 | | | 554,170 | | 2.3 | | | 1,291,099 | | 5.3 | |
| Income tax provision | 12,413 | | 0.2 | | | 86,523 | | 1.0 | | | 138,420 | | 0.6 | | | 299,638 | | 1.2 | |
| NET EARNINGS | $ | 37,580 | | 0.6 | | | $ | 269,438 | | 3.2 | | | $ | 415,750 | | 1.7 | | | $ | 991,461 | | 4.1 | |
| WEIGHTED AVERAGE COMMON SHARES: | | | | | | | | | | | |
| Basic | 158,003 | | | | 162,006 | | | | 159,044 | | | | 162,710 | | |
| Diluted | 158,536 | | | | 164,873 | | | | 160,195 | | | | 165,606 | | |
| NET EARNINGS PER SHARE: | | | | | | | | | | | |
| Basic | $ | 0.24 | | | | $ | 1.66 | | | | $ | 2.61 | | | | $ | 6.09 | | |
| Diluted | $ | 0.24 | | | | $ | 1.63 | | | | $ | 2.60 | | | | $ | 5.99 | | |
(1) Percents are calculated as a percentage of net sales and operating revenues and may not total due to rounding.
See accompanying notes to consolidated financial statements.
CARMAX, INC. AND SUBSIDIARIES
Consolidated Statements of Comprehensive Income
(Unaudited)
| | | | | | | | | | | | | | | | | | | | | | | |
| | Three Months Ended November 30 | | Nine Months Ended November 30 |
| (In thousands) | 2022 | | 2021 | | 2022 | | 2021 |
| NET EARNINGS | $ | 37,580 | | | $ | 269,438 | | | $ | 415,750 | | | $ | 991,461 | |
| Other comprehensive income, net of taxes: | | | | | | | |
| Net change in retirement benefit plan unrecognized actuarial losses | 482 | | | 659 | | | 1,444 | | | 1,976 | |
| Net change in cash flow hedge unrecognized gains | 24,939 | | | 11,383 | | | 102,398 | | | 16,414 | |
| Other comprehensive income, net of taxes | 25,421 | | | 12,042 | | | 103,842 | | | 18,390 | |
| TOTAL COMPREHENSIVE INCOME | $ | 63,001 | | | $ | 281,480 | | | $ | 519,592 | | | $ | 1,009,851 | |
See accompanying notes to consolidated financial statements.
CARMAX, INC. AND SUBSIDIARIES
Consolidated Balance Sheets
(Unaudited)
| | | | | | | | | | | |
| | As of November 30 | | As of February 28 |
| (In thousands except share data) | 2022 | | 2022 |
| ASSETS | | | |
| CURRENT ASSETS: | | | |
| Cash and cash equivalents | $ | 688,618 | | | $ | 102,716 | |
| Restricted cash from collections on auto loans receivable | 466,525 | | | 548,099 | |
| Accounts receivable, net | 246,794 | | | 560,984 | |
| Inventory | 3,414,937 | | | 5,124,569 | |
| Other current assets | 167,143 | | | 212,922 | |
| TOTAL CURRENT ASSETS | 4,984,017 | | | 6,549,290 | |
| Auto loans receivable, net of allowance for loan losses of $491,047 and $433,030 as of November 30, 2022 and February 28, 2022, respectively | 16,240,832 | | | 15,289,701 | |
| Property and equipment, net of accumulated depreciation of $1,585,271 and $1,437,548 as of November 30, 2022 and February 28, 2022, respectively | 3,375,001 | | | 3,209,068 | |
| Deferred income taxes | 87,262 | | | 120,931 | |
| Operating lease assets | 529,781 | | | 537,357 | |
| Goodwill | 141,258 | | | 141,258 | |
| Other assets | 580,790 | | | 490,659 | |
| TOTAL ASSETS | $ | 25,938,941 | | | $ | 26,338,264 | |
| | | |
| LIABILITIES AND SHAREHOLDERS’ EQUITY | | | |
| CURRENT LIABILITIES: | | | |
| Accounts payable | $ | 802,780 | | | $ | 937,717 | |
| Accrued expenses and other current liabilities | 496,202 | | | 533,271 | |
| | | |
| Current portion of operating lease liabilities | 51,215 | | | 44,197 | |
| | | |
| Current portion of long-term debt | 112,708 | | | 11,203 | |
| Current portion of non-recourse notes payable | 474,147 | | | 521,069 | |
| TOTAL CURRENT LIABILITIES | 1,937,052 | | | 2,047,457 | |
| Long-term debt, excluding current portion | 1,903,223 | | | 3,255,304 | |
| Non-recourse notes payable, excluding current portion | 15,737,459 | | | 14,919,715 | |
| Operating lease liabilities, excluding current portion | 509,106 | | | 523,269 | |
| Other liabilities | 364,528 | | | 357,080 | |
| TOTAL LIABILITIES | 20,451,368 | | | 21,102,825 | |
| | | |
| Commitments and contingent liabilities | | | |
| SHAREHOLDERS’ EQUITY: | | | |
| Common stock, $0.50 par value; 350,000,000 shares authorized; 158,019,398 and 161,053,983 shares issued and outstanding as of November 30, 2022 and February 28, 2022, respectively | 79,010 | | | 80,527 | |
| Capital in excess of par value | 1,697,062 | | | 1,677,268 | |
| Accumulated other comprehensive income (loss) | 57,420 | | | (46,422) | |
| Retained earnings | 3,654,081 | | | 3,524,066 | |
| TOTAL SHAREHOLDERS’ EQUITY | 5,487,573 | | | 5,235,439 | |
| TOTAL LIABILITIES AND SHAREHOLDERS’ EQUITY | $ | 25,938,941 | | | $ | 26,338,264 | |
See accompanying notes to consolidated financial statements.
CARMAX, INC. AND SUBSIDIARIES
Consolidated Statements of Cash Flows
(Unaudited)
| | | | | | | | | | | |
| | Nine Months Ended November 30 |
| (In thousands) | 2022 | | 2021 |
| OPERATING ACTIVITIES: | | | |
| Net earnings | $ | 415,750 | | | $ | 991,461 | |
| Adjustments to reconcile net earnings to net cash provided by (used in) operating activities: | | | |
| Depreciation and amortization | 202,655 | | | 200,819 | |
| Share-based compensation expense | 64,974 | | | 108,962 | |
| Provision for loan losses | 218,967 | | | 87,342 | |
| Provision for cancellation reserves | 79,924 | | | 91,607 | |
| Deferred income tax (benefit) provision | (2,178) | | | 19,564 | |
| Other | 8,879 | | | (26,808) | |
| Net decrease (increase) in: | | | |
| Accounts receivable, net | 314,190 | | | (290,346) | |
| Inventory | 1,709,632 | | | (1,502,323) | |
| Other current assets | 149,777 | | | (13,615) | |
| Auto loans receivable, net | (1,170,098) | | | (1,764,693) | |
| Other assets | (43,502) | | | (18,309) | |
| Net (decrease) increase in: | | | |
| Accounts payable, accrued expenses and other | | | |
| current liabilities and accrued income taxes | (195,154) | | | 170,474 | |
| Other liabilities | (91,739) | | | (136,780) | |
| NET CASH PROVIDED BY (USED IN) OPERATING ACTIVITIES | 1,662,077 | | | (2,082,645) | |
| INVESTING ACTIVITIES: | | | |
| Capital expenditures | (319,486) | | | (226,903) | |
| Proceeds from disposal of property and equipment | 3,806 | | | 260 | |
| Proceeds from sale of business | — | | | 12,284 | |
| Purchases of investments | (6,460) | | | (13,676) | |
| Sales and returns of investments | 3,486 | | | 36,915 | |
| Business acquisition, net of cash acquired | — | | | (241,563) | |
| NET CASH USED IN INVESTING ACTIVITIES | (318,654) | | | (432,683) | |
| FINANCING ACTIVITIES: | | | |
| | | |
| Proceeds from issuances of long-term debt | 2,863,500 | | | 5,804,200 | |
| Payments on long-term debt | (4,116,775) | | | (4,524,973) | |
| Cash paid for debt issuance costs | (13,987) | | | (14,473) | |
| Payments on finance lease obligations | (10,056) | | | (8,822) | |
| Issuances of non-recourse notes payable | 11,351,696 | | | 11,217,298 | |
| Payments on non-recourse notes payable | (10,581,076) | | | (9,565,649) | |
| Repurchase and retirement of common stock | (333,814) | | | (475,950) | |
| Equity issuances | 13,504 | | | 76,310 | |
| NET CASH (USED IN) PROVIDED BY FINANCING ACTIVITIES | (827,008) | | | 2,507,941 | |
| Increase (decrease) in cash, cash equivalents, and restricted cash | 516,415 | | | (7,387) | |
| Cash, cash equivalents, and restricted cash at beginning of year | 803,618 | | | 771,947 | |
| CASH, CASH EQUIVALENTS, AND RESTRICTED CASH AT END OF PERIOD | $ | 1,320,033 | | | $ | 764,560 | |
| | | |
| RECONCILIATION OF CASH, CASH EQUIVALENTS AND RESTRICTED CASH TO THE CONSOLIDATED BALANCE SHEETS: |
| Cash and cash equivalents | $ | 688,618 | | | $ | 62,598 | |
| Restricted cash from collections on auto loans receivable | 466,525 | | | 552,487 | |
| Restricted cash included in other assets | 164,890 | | | 149,475 | |
| CASH, CASH EQUIVALENTS, AND RESTRICTED CASH AT END OF PERIOD | $ | 1,320,033 | | | $ | 764,560 | |
See accompanying notes to consolidated financial statements.
CARMAX, INC. AND SUBSIDIARIES
Consolidated Statements of Shareholders’ Equity
(Unaudited)
| | | | | | | | | | | | | | | | | | | | | | | | | | | | | | | | | | | |
| Nine Months Ended November 30, 2022 |
| | | | | | | | | | Accumulated | | |
| | Common | | | | Capital in | | | | Other | | |
| | Shares | | Common | | Excess of | | Retained | | Comprehensive | | |
| (In thousands) | Outstanding | | Stock | | Par Value | | Earnings | | Income (Loss) | | Total |
| Balance as of February 28, 2022 | 161,054 | | | $ | 80,527 | | | $ | 1,677,268 | | | $ | 3,524,066 | | | $ | (46,422) | | | $ | 5,235,439 | |
| Net earnings | — | | | — | | | — | | | 252,265 | | | — | | | 252,265 | |
| Other comprehensive income | — | | | — | | | — | | | — | | | 52,314 | | | 52,314 | |
| Share-based compensation expense | — | | | — | | | 21,594 | | | — | | | — | | | 21,594 | |
| Repurchases of common stock | (1,644) | | | (822) | | | (17,207) | | | (139,565) | | | — | | | (157,594) | |
| Exercise of common stock options | 49 | | | 24 | | | 3,418 | | | — | | | — | | | 3,442 | |
| Stock incentive plans, net shares issued | 155 | | | 78 | | | (6,901) | | | — | | | — | | | (6,823) | |
| | | | | | | | | | | |
| Balance as of May 31, 2022 | 159,614 | | | $ | 79,807 | | | $ | 1,678,172 | | | $ | 3,636,766 | | | $ | 5,892 | | | $ | 5,400,637 | |
| Net earnings | — | | | — | | | — | | | 125,905 | | | — | | | 125,905 | |
| Other comprehensive income | — | | | — | | | — | | | — | | | 26,107 | | | 26,107 | |
| Share-based compensation expense | — | | | — | | | 15,062 | | | — | | | — | | | 15,062 | |
| Repurchases of common stock | (1,730) | | | (865) | | | (18,279) | | | (143,873) | | | — | | | (163,017) | |
| Exercise of common stock options | 155 | | | 78 | | | 9,762 | | | — | | | — | | | 9,840 | |
| Stock incentive plans, net shares issued | 5 | | | 2 | | | (309) | | | — | | | — | | | (307) | |
| Balance as of August 31, 2022 | 158,044 | | | $ | 79,022 | | | $ | 1,684,408 | | | $ | 3,618,798 | | | $ | 31,999 | | | $ | 5,414,227 | |
| Net earnings | — | | | — | | | — | | | 37,580 | | | — | | | 37,580 | |
| Other comprehensive income | — | | | — | | | — | | | — | | | 25,421 | | | 25,421 | |
| Share-based compensation expense | — | | | — | | | 12,797 | | | — | | | — | | | 12,797 | |
| Repurchases of common stock | (30) | | | (15) | | | (320) | | | (2,297) | | | — | | | (2,632) | |
| Exercise of common stock options | 4 | | | 2 | | | 218 | | | — | | | — | | | 220 | |
| Stock incentive plans, net shares issued | 1 | | | 1 | | | (41) | | | — | | | — | | | (40) | |
| | | | | | | | | | | |
| Balance as of November 30, 2022 | 158,019 | | | $ | 79,010 | | | $ | 1,697,062 | | | $ | 3,654,081 | | | $ | 57,420 | | | $ | 5,487,573 | |
See accompanying notes to consolidated financial statements.
CARMAX, INC. AND SUBSIDIARIES
Consolidated Statements of Shareholders’ Equity
(Unaudited)
| | | | | | | | | | | | | | | | | | | | | | | | | | | | | | | | | | | |
| Nine Months Ended November 30, 2021 |
| | | | | | | | | | Accumulated | | |
| | Common | | | | Capital in | | | | Other | | |
| | Shares | | Common | | Excess of | | Retained | | Comprehensive | | |
| (In thousands) | Outstanding | | Stock | | Par Value | | Earnings | | Loss | | Total |
| Balance as of February 28, 2021 | 163,172 | | | $ | 81,586 | | | $ | 1,513,821 | | | $ | 2,887,897 | | | $ | (118,691) | | | $ | 4,364,613 | |
| Net earnings | — | | | — | | | — | | | 436,756 | | | — | | | 436,756 | |
| Other comprehensive income | — | | | — | | | — | | | — | | | 2,937 | | | 2,937 | |
| Share-based compensation expense | — | | | — | | | 20,102 | | | — | | | — | | | 20,102 | |
| Repurchases of common stock | (998) | | | (499) | | | (9,348) | | | (114,695) | | | — | | | (124,542) | |
| Exercise of common stock options | 375 | | | 187 | | | 21,403 | | | — | | | — | | | 21,590 | |
| Stock incentive plans, net shares issued | 254 | | | 127 | | | (18,102) | | | — | | | — | | | (17,975) | |
| Balance as of May 31, 2021 | 162,803 | | | $ | 81,401 | | | $ | 1,527,876 | | | $ | 3,209,958 | | | $ | (115,754) | | | $ | 4,703,481 | |
| Net earnings | — | | | — | | | — | | | 285,267 | | | — | | | 285,267 | |
| Other comprehensive income | — | | | — | | | — | | | — | | | 3,411 | | | 3,411 | |
| Share-based compensation expense | — | | | — | | | 14,116 | | | — | | | — | | | 14,116 | |
| Shares issued for acquisition | 776 | | | 388 | | | 90,183 | | | — | | | — | | | 90,571 | |
| Repurchases of common stock | (1,754) | | | (877) | | | (17,164) | | | (202,004) | | | — | | | (220,045) | |
| Exercise of common stock options | 621 | | | 311 | | | 38,185 | | | — | | | — | | | 38,496 | |
| Stock incentive plans, net shares issued | 24 | | | 12 | | | (130) | | | — | | | — | | | (118) | |
| | | | | | | | | | | |
| Balance as of August 31, 2021 | 162,470 | | | $ | 81,235 | | | $ | 1,653,066 | | | $ | 3,293,221 | | | $ | (112,343) | | | $ | 4,915,179 | |
| Net earnings | — | | | — | | | — | | | 269,438 | | | — | | | 269,438 | |
| Other comprehensive income | — | | | — | | | — | | | — | | | 12,042 | | | 12,042 | |
| Share-based compensation expense | — | | | — | | | 12,347 | | | — | | | — | | | 12,347 | |
| Repurchases of common stock | (851) | | | (425) | | | (8,695) | | | (106,226) | | | — | | | (115,346) | |
| Exercise of common stock options | 253 | | | 126 | | | 16,097 | | | — | | | — | | | 16,223 | |
| Stock incentive plans, net shares issued | — | | | — | | | (87) | | | — | | | — | | | (87) | |
| | | | | | | | | | | |
| Balance as of November 30, 2021 | 161,872 | | | $ | 80,936 | | | $ | 1,672,728 | | | $ | 3,456,433 | | | $ | (100,301) | | | $ | 5,109,796 | |
See accompanying notes to consolidated financial statements.
CARMAX, INC. AND SUBSIDIARIES
Notes to Consolidated Financial Statements
(Unaudited)
1.Background
Business. CarMax, Inc. (“we,” “our,” “us,” “CarMax” and “the company”), including its wholly owned subsidiaries, is the nation’s largest retailer of used vehicles. We operate in two reportable segments: CarMax Sales Operations and CarMax Auto Finance (“CAF”). Our CarMax Sales Operations segment consists of all aspects of our auto merchandising and service operations, excluding financing provided by CAF. Our CAF segment consists solely of our own finance operation that provides financing to customers buying retail vehicles from CarMax. On June 1, 2021, we completed the acquisition of Edmunds Holding Company (“Edmunds”), which does not meet the quantitative thresholds to be considered a reportable segment. See Note 17 for additional information on our reportable segments and Note 2 for additional information regarding our acquisition of Edmunds.
We deliver an unrivaled customer experience by offering a broad selection of quality used vehicles and related products and services at competitive, no-haggle prices using a customer-friendly sales process. Our omni-channel platform, which gives us the largest addressable market in the used car industry, empowers our retail customers to buy a car on their terms – online, in-store or an integrated combination of both. We offer customers a range of related products and services, including the appraisal and purchase of vehicles directly from consumers; the financing of retail vehicle purchases through CAF and third-party finance providers; the sale of extended protection plan (“EPP”) products, which include extended service plans (“ESPs”) and guaranteed asset protection (“GAP”); and vehicle repair service. Vehicles purchased through the appraisal process that do not meet our retail standards are sold to licensed dealers through on-site or virtual wholesale auctions.
Basis of Presentation and Use of Estimates. The accompanying interim unaudited consolidated financial statements include the accounts of CarMax and our wholly owned subsidiaries. All significant intercompany balances and transactions have been eliminated in consolidation. These interim unaudited consolidated financial statements have been prepared in conformity with U.S. generally accepted accounting principles (“GAAP”) for interim financial information. Accordingly, they do not include all of the information and footnotes required by U.S. GAAP for complete financial statements. In the opinion of management, such interim consolidated financial statements reflect all normal recurring adjustments considered necessary to present fairly the financial position and the results of operations and cash flows for the interim periods presented. The results of operations for the interim periods are not necessarily indicative of the results to be expected for the full fiscal year.
The accounting policies followed in the presentation of our interim financial results are consistent with those included in the company’s Annual Report on Form 10-K for the fiscal year ended February 28, 2022 (the “2022 Annual Report”), with the exception of those related to recent accounting pronouncements adopted in the current fiscal year. These interim unaudited consolidated financial statements should be read in conjunction with the audited consolidated financial statements and footnotes included in our 2022 Annual Report.
The preparation of financial statements in conformity with U.S. GAAP requires management to make estimates and assumptions that affect the reported amounts of assets, liabilities, revenues and expenses and the disclosure of contingent assets and liabilities. Actual results could differ from those estimates. In particular, the novel coronavirus (“COVID-19”) pandemic and the resulting adverse impacts to global economic conditions, as well as our operations, may impact future estimates including, but not limited to, our allowance for loan losses, inventory valuations, fair value measurements, downward adjustments to investments in equity securities, asset impairment charges, the effectiveness of the company’s hedging instruments, deferred tax valuation allowances, cancellation reserves, actuarial losses on our retirement benefit plans and discount rate assumptions. Certain prior year amounts have been reclassified to conform to the current year’s presentation. Amounts and percentages may not total due to rounding.
Recent Accounting Pronouncements.
Effective in Future Periods
In September 2022, the Financial Accounting Standards Board (“FASB”) issued an accounting pronouncement (ASU 2022-04) related to disclosure requirements for buyers in supplier finance programs. The amendments in the update require that buyers disclose qualitative and quantitative information about their supplier finance programs. Interim and annual requirements include disclosure of outstanding amounts under the obligations as of the end of the reporting period, and annual requirements include a rollforward of those obligations for the annual reporting period, as well as a description of payment and other key terms of the programs. This update is effective for annual periods beginning after December 15, 2022, and interim periods within those fiscal years, except for the requirement to disclose rollforward information, which is effective for fiscal years beginning after December 15, 2023. We plan to adopt this pronouncement for our fiscal year beginning March 1, 2023, and we do not expect it to have a material effect on our consolidated financial statements.
2. Acquisition of Edmunds
On June 1, 2021, we completed the acquisition of Edmunds Holding Company, one of the most well established and trusted online guides for automotive information and a recognized leader in digital car shopping innovations. With this acquisition, CarMax has enhanced its digital capabilities and further strengthened its role and reach across the used auto ecosystem while adding exceptional technology and creative talent. Edmunds continues to operate independently and remains focused on delivering confidence to consumers and excellent value to its dealer and Original Equipment Manufacturer (“OEM”) clients. Additionally, this acquisition allows both businesses to accelerate their respective capabilities to deliver an enhanced digital experience to their customers by leveraging Edmunds’ compelling content and technology, CarMax’s unparalleled national scale and infrastructure, and the combined talent of both businesses.
The acquisition was accounted for in accordance with Accounting Standards Codification (“ASC”) Topic 805, Business Combinations, and, accordingly, Edmunds’ results of operations have been consolidated in our financial statements since the date of acquisition. We recorded a preliminary allocation of the purchase price to assets acquired and liabilities assumed based on their estimated fair values as of June 1, 2021. The transaction costs associated with the acquisition were approximately $8.0 million and were expensed as incurred within selling, general and administrative expenses.
The following table summarizes the total purchase consideration:
| | | | | |
| (In thousands) | |
| Total cash consideration for outstanding shares | $ | 251,047 | |
Fair value of common stock (1) | 90,571 | |
| Fair value of preexisting relationship | 60,200 | |
| Total | $ | 401,818 | |
(1) Represents the issuance of 776,097 shares of CarMax common stock to Edmunds equity holders, the fair value of which was based on the market value of CarMax common stock as of market close on the acquisition date (June 1, 2021).
In January 2020, we acquired a minority stake in Edmunds for $50 million. The noncontrolling equity investment in Edmunds was remeasured at a fair value of $60.2 million prior to the acquisition of the remaining ownership stake on June 1, 2021, which resulted in the recognition of a gain of $8.7 million. The gain was included in other income in the consolidated statements of earnings for the second quarter of fiscal 2022.
The following table summarizes the estimated fair values of the assets acquired and liabilities assumed at the date of the acquisition:
| | | | | |
| (In thousands) | Fair Value |
| Cash | $ | 9,484 | |
| Accounts receivable, net | 33,719 | |
| Other current assets | 2,397 | |
| Property and equipment, net | 20,741 | |
Goodwill (1) | 141,258 | |
| Intangible assets | 218,000 | |
| Operating lease assets | 97,250 | |
| Other assets | 191 | |
| Total assets acquired | 523,040 | |
| |
| Accounts payable | 5,063 | |
| Accrued expenses and other current liabilities | 11,277 | |
| Current portion of operating lease liabilities | 12,795 | |
Deferred income taxes (1) | 3,823 | |
| Operating lease liabilities, excluding current portion | 88,264 | |
| Total liabilities assumed | 121,222 | |
| Net assets acquired | $ | 401,818 | |
(1) During the third quarter of fiscal 2022, we obtained new information about facts and circumstances that existed as of the acquisition date, which resulted in a change in the fair value of assets and liabilities recognized. The adjustments were primarily related to research and development tax credits, which resulted in a decrease in goodwill and a decrease in deferred income taxes of $8.4 million.
The excess of purchase consideration over the fair value of net identifiable assets acquired and liabilities assumed was recorded as goodwill, which was primarily attributed to expected synergies and the assembled workforce of the acquired business and was not deductible for tax purposes. The fair values assigned to the net identifiable assets and liabilities assumed were based on management’s estimates and assumptions.
Identifiable intangible assets were recognized at their estimated acquisition date fair values. The fair value of identifiable intangible assets was determined by using certain estimates and assumptions that were not observable in the market. The fair values of the trade name asset and the internally developed software asset were determined using the relief-from-royalty method, and the fair value of the customer relationships asset was determined using the excess earnings method. These income-based approaches included significant assumptions such as the amount and timing of projected cash flows, growth rates, customer attrition rates, discount rates, and the assessment of the asset’s life cycle. The estimated fair value and estimated remaining useful lives of identifiable intangible assets as of the acquisition date were as follows:
| | | | | | | | |
| (In thousands) | Useful Life (Years) | Fair Value |
| Trade name | Indefinite | $ | 31,900 | |
| Internally developed software | 7 | 52,900 | |
| Customer relationships | 17 | 133,200 | |
| Identifiable intangible assets | | $ | 218,000 | |
The operating results of Edmunds have been included in our consolidated financial statements since the date of the acquisition. Net sales and operating revenues and net earnings attributable to Edmunds were not material for the reporting periods presented. Our pro forma results as if the acquisition had taken place on the first day of fiscal 2021 would not be materially different from the amounts reflected in the accompanying consolidated financial statements, and therefore were not presented.
3. Revenue
We recognize revenue when control of the good or service has been transferred to the customer, generally either at the time of sale or upon delivery to a customer. Our contracts have a fixed contract price and revenue is measured as the amount of consideration we expect to receive in exchange for transferring goods or providing services. We collect sales taxes and other taxes from customers on behalf of governmental authorities at the time of sale. These taxes are accounted for on a net basis and are not included in net sales and operating revenues or cost of sales. We generally expense sales commissions when incurred because the amortization period would have been less than one year. These costs are recorded within selling, general and administrative expenses. We do not have any significant payment terms as payment is received at or shortly after the point of sale.
Disaggregation of Revenue
| | | | | | | | | | | | | | | | | | | | | | | |
| Three Months Ended November 30 | | Nine Months Ended November 30 |
| (In millions) | 2022 | | 2021 | | 2022 | | 2021 |
| Used vehicle sales | $ | 5,204.6 | | | $ | 6,435.6 | | | $ | 18,503.2 | | | $ | 18,697.3 | |
| Wholesale vehicle sales | 1,152.2 | | | 1,922.3 | | | 4,959.1 | | | 4,998.2 | |
| Other sales and revenues: | | | | | | | |
| Extended protection plan revenues | 91.8 | | | 106.6 | | | 318.1 | | | 353.8 | |
| Third-party finance income/(fees), net | 1.0 | | | 1.6 | | | 7.1 | | | (0.3) | |
Advertising & subscription revenues (1) | 33.3 | | | 33.3 | | | 101.9 | | | 67.9 | |
| Service revenues | 19.6 | | | 19.7 | | | 60.8 | | | 62.9 | |
| Other | 3.5 | | | 8.7 | | | 12.3 | | | 33.9 | |
| Total other sales and revenues | 149.2 | | | 169.9 | | | 500.2 | | | 518.2 | |
| Total net sales and operating revenues | $ | 6,506.0 | | | $ | 8,527.8 | | | $ | 23,962.4 | | | $ | 24,213.7 | |
(1) Excludes intersegment sales and operating revenues that have been eliminated in consolidation. See Note 17 for further details.
Used Vehicle Sales. Revenue from the sale of used vehicles is recognized upon transfer of control of the vehicle to the customer. As part of our customer service strategy, we guarantee the retail vehicles we sell with a 30-day/1,500 mile, money-back guarantee. We record a reserve for estimated returns based on historical experience and trends. The reserve for estimated returns is presented gross on the consolidated balance sheets, with a return asset recorded in other current assets and a refund liability recorded in accrued expenses and other current liabilities. We also guarantee the used vehicles we sell with a 90-day/4,000-mile limited warranty. These warranties are deemed assurance-type warranties and are accounted for as warranty obligations. See Note 16 for additional information on this warranty and its related obligation.
Wholesale Vehicle Sales. Wholesale vehicles are sold at our auctions, and revenue from the sale of these vehicles is recognized upon transfer of control of the vehicle to the customer. Dealers also pay a fee to us based on the sale price of the vehicles they purchase. This fee is recognized as revenue at the time of sale. While we provide condition disclosures on each wholesale vehicle sold, the vehicles are subject to a limited right of return. We record a reserve for estimated returns based on historical experience and trends. The reserve for estimated returns is presented gross on the consolidated balance sheets, with a return asset recorded in other current assets and a refund liability recorded in accrued expenses and other current liabilities.
EPP Revenues. We also sell ESP and GAP products on behalf of unrelated third parties, who are primarily responsible for fulfilling the contract, to customers who purchase a retail vehicle. The ESPs we currently offer on all used vehicles provide coverage up to 60 months (subject to mileage limitations), while GAP covers the customer for the term of their finance contract. We recognize revenue, on a net basis, at the time of sale. We also record a reserve, or refund liability, for estimated contract cancellations. The reserve for cancellations is evaluated for each product and is based on forecasted forward cancellation curves utilizing historical experience, recent trends and credit mix of the customer base. Our risk related to contract cancellations is limited to the revenue that we receive. Cancellations fluctuate depending on the volume of EPP sales, customer financing default or prepayment rates, and shifts in customer behavior, including those related to changes in the coverage or term of the product. The current portion of estimated cancellation reserves is recognized as a component of accrued expenses and other current liabilities with the remaining amount recognized in other liabilities. See Note 8 for additional information on cancellation reserves.
We are contractually entitled to receive profit-sharing revenues based on the performance of the ESPs administered by third parties. These revenues are a form of variable consideration included in EPP revenues to the extent that it is probable that it
will not result in a significant revenue reversal. An estimate of the amount to which we expect to be entitled, subject to various constraints, is recognized upon satisfying the performance obligation of selling the ESP. These constraints include factors that are outside of the company’s influence or control and the length of time until settlement. We apply the expected value method, utilizing historical claims and cancellation data from CarMax customers, as well as external data and other qualitative assumptions. This estimate is reassessed each reporting period with changes reflected in other sales and revenues on our consolidated statements of earnings and other assets on our consolidated balance sheets. As of November 30, 2022 and February 28, 2022, no current or long-term contract asset was recognized related to cumulative profit-sharing payments to which we expect to be entitled.
Third-Party Finance Income/(Fees). Customers applying for financing who are not approved or are conditionally approved by CAF are generally evaluated by other third-party finance providers. These providers generally either pay us or are paid a fixed, pre-negotiated fee per contract. We recognize these fees at the time of sale.
Advertising and Subscription Revenues. Advertising and subscription revenues consist of revenues earned by our Edmunds business. Advertising revenues are derived from advertising contracts with automotive manufacturers based on fixed fees per impression and fees for certain activities completed by customers on the manufacturers' websites. These fees are recognized in the period the impressions are delivered or certain activities occurred. Subscription revenues are derived from packages sold to automotive dealers that include car leads, inventory listings and enhanced placement in Edmunds' dealer locator and are recognized over the period that the services are made available to the dealers. Subscription revenues also include a digital marketing subscription service, which allows dealers to gain exposure on third party partner websites. Revenues for this service are recognized on a net basis.
Service Revenues. Service revenue consists of labor and parts income related to vehicle repair service, including repairs of vehicles covered under an ESP we sell or warranty program. Service revenue is recognized at the time the work is completed.
Other Revenues. Other revenues consist primarily of new vehicle sales and sales of accessories. Revenue in this category is recognized upon transfer of control to the customer.
4. CarMax Auto Finance
CAF provides financing to qualified retail customers purchasing vehicles from CarMax. CAF provides us the opportunity to capture additional profits, cash flows and sales while managing our reliance on third-party finance sources. Management regularly analyzes CAF’s operating results by assessing profitability, the performance of the auto loans receivable, including trends in credit losses and delinquencies, and CAF direct expenses. This information is used to assess CAF’s performance and make operating decisions, including resource allocation.
We typically use securitizations or other funding arrangements to fund loans originated by CAF. CAF income primarily reflects the interest and fee income generated by the auto loans receivable less the interest expense associated with the debt issued to fund these receivables, a provision for estimated loan losses and direct CAF expenses.
CAF income does not include any allocation of indirect costs. Although CAF benefits from certain indirect overhead expenditures, we have not allocated indirect costs to CAF to avoid making subjective allocation decisions. Examples of indirect costs not allocated to CAF include retail store expenses and corporate expenses. In addition, except for auto loans receivable, which are disclosed in Note 5, CAF assets are not separately reported nor do we allocate assets to CAF because such allocation would not be useful to management in making operating decisions.
Components of CAF Income
| | | | | | | | | | | | | | | | | | | | | | | | | | | | | | | | | | | | | | | | | | | | | | | |
| Three Months Ended November 30 | | Nine Months Ended November 30 |
| (In millions) | 2022 | | % (1) | | 2021 | | % (1) | | 2022 | | % (1) | | 2021 | | % (1) |
| Interest margin: | | | | | | | | | | | | | | | |
| Interest and fee income | $ | 365.4 | | | 8.8 | | | $ | 330.0 | | | 8.6 | | | $ | 1,069.3 | | | 8.8 | | | $ | 964.4 | | | 8.7 | |
| Interest expense | (88.8) | | | (2.1) | | | (53.6) | | | (1.4) | | | (200.1) | | | (1.6) | | | (180.0) | | | (1.6) | |
| Total interest margin | 276.6 | | | 6.7 | | | 276.4 | | | 7.2 | | | 869.2 | | | 7.2 | | | 784.4 | | | 7.1 | |
| Provision for loan losses | (85.7) | | | (2.1) | | | (76.2) | | | (2.0) | | | (219.0) | | | (1.8) | | | (87.3) | | | (0.8) | |
| | | | | | | | | | | | | | | |
| Total interest margin after provision for loan losses | 190.9 | | | 4.6 | | | 200.2 | | | 5.2 | | | 650.2 | | | 5.4 | | | 697.1 | | | 6.3 | |
| | | | | | | | | | | | | | | |
| | | | | | | | | | | | | | | |
| | | | | | | | | | | | | | | |
| Direct expenses: | | | | | | | | | | | | | | | |
| Payroll and fringe benefit expense | (16.1) | | | (0.4) | | | (12.7) | | | (0.3) | | | (46.7) | | | (0.4) | | | (37.7) | | | (0.3) | |
| Depreciation and amortization | (4.0) | | | (0.1) | | | (2.4) | | | (0.1) | | | (11.6) | | | (0.1) | | | (2.8) | | | — | |
| Other direct expenses | (18.7) | | | (0.5) | | | (19.2) | | | (0.5) | | | (52.4) | | | (0.4) | | | (48.9) | | | (0.4) | |
| Total direct expenses | (38.8) | | | (0.9) | | | (34.3) | | | (0.9) | | | (110.7) | | | (0.9) | | | (89.4) | | | (0.8) | |
| CarMax Auto Finance income | $ | 152.2 | | | 3.7 | | | $ | 166.0 | | | 4.3 | | | $ | 539.5 | | | 4.4 | | | $ | 607.7 | | | 5.5 | |
| | | | | | | | | | | | | | | |
| Total average managed receivables | $ | 16,540.2 | | | | | $ | 15,288.8 | | | | | $ | 16,177.8 | | | | | $ | 14,706.9 | | | |
(1) Annualized percentage of total average managed receivables.
5. Auto Loans Receivable
Auto loans receivable include amounts due from customers related to retail vehicle sales financed through CAF and are presented net of an allowance for estimated loan losses. These auto loans represent a large group of smaller-balance homogeneous loans, which we consider to be part of one class of financing receivable and one portfolio segment for purposes of determining our allowance for loan losses. We generally use warehouse facilities to fund auto loans receivable originated by CAF until we elect to fund them through an asset-backed term funding transaction, such as a term securitization or alternative funding arrangement. We recognize transfers of auto loans receivable into the warehouse facilities and asset-backed term funding transactions (together, “non-recourse funding vehicles”) as secured borrowings, which result in recording the auto loans receivable and the related non-recourse notes payable on our consolidated balance sheets. The majority of the auto loans receivable serve as collateral for the related non-recourse notes payable of $16.24 billion as of November 30, 2022, and $15.47 billion as of February 28, 2022. See Note 10 for additional information on securitizations and non-recourse notes payable.
Interest income and expenses related to auto loans are included in CAF income. Interest income on auto loans receivable is recognized when earned based on contractual loan terms. All loans continue to accrue interest until repayment or charge-off. When a charge-off occurs, accrued interest is written off by reversing interest income. Direct costs associated with loan originations are not considered material, and thus, are expensed as incurred. See Note 4 for additional information on CAF income.
Auto Loans Receivable, Net
| | | | | | | | | | | |
| | As of November 30 | | As of February 28 |
| (In millions) | 2022 | | 2022 |
| Asset-backed term funding | $ | 12,342.0 | | | $ | 11,653.8 | |
| Warehouse facilities | 3,420.9 | | | 3,291.9 | |
Overcollateralization (1) | 688.1 | | | 489.1 | |
Other managed receivables (2) | 201.7 | | | 217.5 | |
| Total ending managed receivables | 16,652.7 | | | 15,652.3 | |
| Accrued interest and fees | 83.3 | | | 67.3 | |
| Other | (4.2) | | | 3.1 | |
| Less: allowance for loan losses | (491.0) | | | (433.0) | |
| Auto loans receivable, net | $ | 16,240.8 | | | $ | 15,289.7 | |
(1) Represents receivables restricted as excess collateral for the non-recourse funding vehicles.
(2) Other managed receivables includes receivables not funded through the non-recourse funding vehicles.
Credit Quality. When customers apply for financing, CAF’s proprietary scoring models utilize the customers’ credit history and certain application information to evaluate and rank their risk. We obtain credit histories and other credit data that includes information such as number, age, type of and payment history for prior or existing credit accounts. The application information that is used includes income, collateral value and down payment. The scoring models yield credit grades that represent the relative likelihood of repayment. Customers with the highest probability of repayment are A-grade customers. Customers assigned a lower grade are determined to have a lower probability of repayment. For loans that are approved, the credit grade influences the terms of the agreement, such as the required loan-to-value ratio and interest rate. After origination, credit grades are generally not updated.
CAF uses a combination of the initial credit grades and historical performance to monitor the credit quality of the auto loans receivable on an ongoing basis. We validate the accuracy of the scoring models periodically. Loan performance is reviewed on a recurring basis to identify whether the assigned grades adequately reflect the customers’ likelihood of repayment.
Ending Managed Receivables by Major Credit Grade
| | | | | | | | | | | | | | | | | | | | | | | | | | | | | | | | | | | | | | | | | | | | | | | |
| As of November 30, 2022 |
| Fiscal Year of Origination (1) | | | | |
| (In millions) | 2023 | | 2022 | | 2021 | | 2020 | | 2019 | | Prior to 2019 | | Total | | % (2) |
Core managed receivables (3): | | | | | | | | | | | | | | | |
| A | $ | 3,154.3 | | | $ | 2,815.6 | | | $ | 1,252.9 | | | $ | 800.6 | | | $ | 290.0 | | | $ | 63.4 | | | $ | 8,376.8 | | | 50.3 | |
| B | 2,079.9 | | | 2,020.1 | | | 907.2 | | | 564.1 | | | 268.0 | | | 87.4 | | | 5,926.7 | | | 35.6 | |
| C and other | 595.5 | | | 667.8 | | | 350.1 | | | 194.4 | | | 90.7 | | | 38.3 | | | 1,936.8 | | | 11.6 | |
| Total core managed receivables | 5,829.7 | | | 5,503.5 | | | 2,510.2 | | | 1,559.1 | | | 648.7 | | | 189.1 | | | 16,240.3 | | | 97.5 | |
Other managed receivables (4): | | | | | | | | | | | | | | | |
| C and other | 222.4 | | | 127.2 | | | 16.9 | | | 23.8 | | | 15.5 | | | 6.6 | | | 412.4 | | | 2.5 | |
| Total ending managed receivables | $ | 6,052.1 | | | $ | 5,630.7 | | | $ | 2,527.1 | | | $ | 1,582.9 | | | $ | 664.2 | | | $ | 195.7 | | | $ | 16,652.7 | | | 100.0 | |
| | | | | | | | | | | | | | | | | | | | | | | | | | | | | | | | | | | | | | | | | | | | | | | |
| As of February 28, 2022 |
| Fiscal Year of Origination (1) | | | | |
| (In millions) | 2022 | | 2021 | | 2020 | | 2019 | | 2018 | | Prior to 2018 | | Total | | % (2) |
Core managed receivables (3): | | | | | | | | | | | | | | | |
| A | $ | 3,885.5 | | | $ | 1,788.3 | | | $ | 1,266.1 | | | $ | 574.1 | | | $ | 203.4 | | | $ | 32.3 | | | $ | 7,749.7 | | | 49.5 | |
| B | 2,795.2 | | | 1,288.5 | | | 857.7 | | | 473.1 | | | 205.2 | | | 50.4 | | | 5,670.1 | | | 36.2 | |
| C and other | 919.1 | | | 496.2 | | | 294.8 | | | 156.7 | | | 73.8 | | | 29.6 | | | 1,970.2 | | | 12.6 | |
| Total core managed receivables | 7,599.8 | | | 3,573.0 | | | 2,418.6 | | | 1,203.9 | | | 482.4 | | | 112.3 | | | 15,390.0 | | | 98.3 | |
Other managed receivables (4): | | | | | | | | | | | | | | | |
| C and other | 165.2 | | | 23.9 | | | 34.7 | | | 23.8 | | | 10.0 | | | 4.7 | | | 262.3 | | | 1.7 | |
| Total ending managed receivables | $ | 7,765.0 | | | $ | 3,596.9 | | | $ | 2,453.3 | | | $ | 1,227.7 | | | $ | 492.4 | | | $ | 117.0 | | | $ | 15,652.3 | | | 100.0 | |
(1) Classified based on credit grade assigned when customers were initially approved for financing.
(2) Percent of total ending managed receivables.
(3) Represents CAF's Tier 1 originations.
(4) Represents CAF's Tier 2 and Tier 3 originations.
Allowance for Loan Losses. The allowance for loan losses at November 30, 2022 represents the net credit losses expected over the remaining contractual life of our managed receivables. The allowance for loan losses is determined using a net loss timing curve, primarily based on the composition of the portfolio of managed receivables and historical gross loss and recovery trends. Due to the fact that losses for receivables with less than 18 months of performance history can be volatile, our net loss estimate weights both historical losses by credit grade at origination and actual loss data on the receivables to-date, along with forward loss curves, in estimating future performance. Once the receivables have 18 months of performance history, the net loss estimate reflects actual loss experience of those receivables to date, along with forward loss curves, to predict future performance. The forward loss curves are constructed using historical performance data and show the average timing of losses over the course of a receivable’s life. The net loss estimate is calculated by applying the loss rates developed using the methods described above to the amortized cost basis of the managed receivables at inception of the loan.
The output of the net loss timing curve is adjusted to take into account reasonable and supportable forecasts about the future. Specifically, the change in U.S. unemployment rates and the National Automobile Dealers Association used vehicle price index are used to predict changes in gross loss and recovery rates, respectively. An economic adjustment factor, based upon a single macroeconomic scenario, is developed to capture the relationship between changes in these forecasts and changes in gross loss and recovery rates. This factor is applied to the output of the net loss timing curve for the reasonable and supportable forecast period of two years. After the end of this two-year period, we revert to historical experience on a straight-line basis over a period of 12 months. We periodically consider whether the use of alternative metrics would result in improved model performance and revise the models when appropriate. We also consider whether qualitative adjustments are necessary for factors that are not reflected in the quantitative methods but impact the measurement of estimated credit losses. Such adjustments include the uncertainty of the impacts of recent economic trends on customer behavior. The change in the allowance for loan losses is recognized through an adjustment to the provision for loan losses.
Allowance for Loan Losses
| | | | | | | | | | | | | | | | | | | | | | | |
| Three Months Ended November 30, 2022 |
| (In millions) | Core | | Other | | Total | | % (1) |
| Balance as of beginning of period | $ | 396.1 | | | $ | 81.4 | | | $ | 477.5 | | | 2.92 | |
| Charge-offs | (96.3) | | | (16.3) | | | (112.6) | | | |
| Recoveries | 35.7 | | | 4.7 | | | 40.4 | | | |
| Provision for loan losses | 60.9 | | | 24.8 | | | 85.7 | | | |
| Balance as of end of period | $ | 396.4 | | | $ | 94.6 | | | $ | 491.0 | | | 2.95 | |
| | | | | | | | | | | | | | | | | | | | | | | |
| Three Months Ended November 30, 2021 |
| (In millions) | Core | | Other | | Total | | % (1) |
| Balance as of beginning of period | $ | 360.0 | | | $ | 38.1 | | | $ | 398.1 | | | 2.66 | |
| Charge-offs | (61.6) | | | (6.6) | | | (68.2) | | | |
| Recoveries | 18.8 | | | 1.6 | | | 20.4 | | | |
| Provision for loan losses | 68.5 | | | 7.7 | | | 76.2 | | | |
| Balance as of end of period | $ | 385.7 | | | $ | 40.8 | | | $ | 426.5 | | | 2.75 | |
| | | | | | | | | | | | | | | | | | | | | | | |
| Nine Months Ended November 30, 2022 |
| (In millions) | Core | | Other | | Total | | % (1) |
| Balance as of beginning of period | $ | 377.5 | | | $ | 55.5 | | | $ | 433.0 | | | 2.77 | |
| Charge-offs | (241.9) | | | (35.0) | | | (276.9) | | | |
| Recoveries | 104.7 | | | 11.2 | | | 115.9 | | | |
| Provision for loan losses | 156.1 | | | 62.9 | | | 219.0 | | | |
| Balance as of end of period | $ | 396.4 | | | $ | 94.6 | | | $ | 491.0 | | | 2.95 | |
| | | | | | | | | | | | | | | | | | | | | | | |
| Nine Months Ended November 30, 2021 |
| (In millions) | Core | | Other | | Total | | % (1) |
| Balance as of beginning of period | $ | 379.4 | | | $ | 31.7 | | | $ | 411.1 | | | 2.97 | |
| Charge-offs | (140.6) | | | (13.1) | | | (153.7) | | | |
| Recoveries | 76.1 | | | 5.7 | | | 81.8 | | | |
| Provision for loan losses | 70.8 | | | 16.5 | | | 87.3 | | | |
| Balance as of end of period | $ | 385.7 | | | $ | 40.8 | | | $ | 426.5 | | | 2.75 | |
(1) Percent of total ending managed receivables.
(2) Net of costs incurred to recover vehicle.
During the first nine months of fiscal 2023, the allowance for loan losses increased $58.0 million, primarily reflecting growth in receivables. The increase in the allowance as a percent of total ending managed receivables was primarily driven by the previously disclosed expansion of our Tier 2 and Tier 3 originations within CAF's portfolio. While loss performance was unfavorable compared to the prior year period, the prior year performance fluctuated outside normal expectations. The allowance for loan losses as of November 30, 2022 reflects the historical loss performance experienced prior to the pandemic as well as increases for our Tier 3 expansion and growing Tier 2 portfolio.
Past Due Receivables. An account is considered delinquent when the related customer fails to make a substantial portion of a scheduled payment on or before the due date. In general, accounts are charged-off on the last business day of the month during which the earliest of the following occurs: the receivable is 120 days or more delinquent as of the last business day of the month, the related vehicle is repossessed and liquidated, or the receivable is otherwise deemed uncollectible. For purposes of
determining impairment, auto loans are evaluated collectively, as they represent a large group of smaller-balance homogeneous loans, and therefore, are not individually evaluated for impairment.
Past Due Receivables
| | | | | | | | | | | | | | | | | | | | | | | | | | | | | | | | | | | | | | | | | |
| As of November 30, 2022 |
| Core Receivables | | Other Receivables | | Total |
| (In millions) | A | | B | | C & Other | | Total | | C & Other | | $ | | % (1) |
| Current | $ | 8,340.4 | | | $ | 5,570.5 | | | $ | 1,605.2 | | | $ | 15,516.1 | | | $ | 304.8 | | | $ | 15,820.9 | | | 95.01 | |
| Delinquent loans: | | | | | | | | | | | | | |
| 31-60 days past due | 21.7 | | | 211.9 | | | 183.2 | | | 416.8 | | | 57.3 | | | 474.1 | | | 2.85 | |
| 61-90 days past due | 11.6 | | | 116.4 | | | 122.7 | | | 250.7 | | | 41.4 | | | 292.1 | | | 1.75 | |
| Greater than 90 days past due | 3.1 | | | 27.9 | | | 25.7 | | | 56.7 | | | 8.9 | | | 65.6 | | | 0.39 | |
| Total past due | 36.4 | | | 356.2 | | | 331.6 | | | 724.2 | | | 107.6 | | | 831.8 | | | 4.99 | |
| Total ending managed receivables | $ | 8,376.8 | | | $ | 5,926.7 | | | $ | 1,936.8 | | | $ | 16,240.3 | | | $ | 412.4 | | | $ | 16,652.7 | | | 100.00 | |
| | | | | | | | | | | | | | | | | | | | | | | | | | | | | | | | | | | | | | | | | |
| As of February 28, 2022 |
| Core Receivables | | Other Receivables | | Total |
| (In millions) | A | | B | | C & Other | | Total | | C & Other | | $ | | % (1) |
| Current | $ | 7,711.9 | | | $ | 5,401.3 | | | $ | 1,702.7 | | | $ | 14,815.9 | | | $ | 206.4 | | | $ | 15,022.3 | | | 95.98 | |
| Delinquent loans: | | | | | | | | | | | | | |
| 31-60 days past due | 25.4 | | | 173.3 | | | 160.4 | | | 359.1 | | | 33.0 | | | 392.1 | | | 2.50 | |
| 61-90 days past due | 9.2 | | | 75.6 | | | 85.2 | | | 170.0 | | | 19.1 | | | 189.1 | | | 1.21 | |
| Greater than 90 days past due | 3.2 | | | 19.9 | | | 21.9 | | | 45.0 | | | 3.8 | | | 48.8 | | | 0.31 | |
| Total past due | 37.8 | | | 268.8 | | | 267.5 | | | 574.1 | | | 55.9 | | | 630.0 | | | 4.02 | |
| Total ending managed receivables | $ | 7,749.7 | | | $ | 5,670.1 | | | $ | 1,970.2 | | | $ | 15,390.0 | | | $ | 262.3 | | | $ | 15,652.3 | | | 100.00 | |
(1) Percent of total ending managed receivables.
6. Derivative Instruments and Hedging Activities
We use derivatives to manage certain risks arising from both our business operations and economic conditions, particularly with regard to issuances of debt. Primary exposures include LIBOR and other rates used as benchmarks in our securitizations and other debt financing. We enter into derivative instruments to manage exposures related to the future known receipt or payment of uncertain cash amounts, the values of which are impacted by interest rates, and generally designate these derivative instruments as cash flow hedges for accounting purposes. In certain cases, we may choose not to designate a derivative instrument as a cash flow hedge for accounting purposes due to uncertainty around the probability that future hedged transactions will occur. Our derivative instruments are used to manage (i) differences in the amount of our known or expected cash receipts and our known or expected cash payments principally related to the funding of our auto loans receivable, and (ii) exposure to variable interest rates associated with our term loans.
For the derivatives associated with our non-recourse funding vehicles that are designated as cash flow hedges, the changes in fair value are initially recorded in accumulated other comprehensive income (loss) (“AOCI”). For the majority of these derivatives, the amounts are subsequently reclassified into CAF income in the period that the hedged forecasted transaction affects earnings, which occurs as interest expense is recognized on those future issuances of debt. During the next 12 months, we estimate that an additional $47.2 million will be reclassified from AOCI as an increase to CAF income. Changes in fair value related to derivatives that have not been designated as cash flow hedges for accounting purposes are recognized in the income statement in the period in which the change occurs. For the three and nine months ended November 30, 2022, we recognized income of $5.0 million and $23.6 million, respectively, in CAF income representing these changes in fair value.
As of November 30, 2022 and February 28, 2022, we had interest rate swaps outstanding with a combined notional amount of $4.68 billion and $3.64 billion, respectively, that were designated as cash flow hedges of interest rate risk. As of November 30,
2022 and February 28, 2022, we had interest rate swaps with a combined notional amount of $1.11 billion and $578.3 million, respectively, outstanding that were not designated as cash flow hedges for accounting purposes.
See Note 7 for discussion of fair values of financial instruments and Note 13 for the effect on comprehensive income.
7. Fair Value Measurements
Fair value is defined as the price that would be received to sell an asset or paid to transfer a liability in an orderly transaction between market participants in the principal market or, if none exists, the most advantageous market, for the specific asset or liability at the measurement date (referred to as the “exit price”). The fair value should be based on assumptions that market participants would use, including a consideration of nonperformance risk.
We assess the inputs used to measure fair value using the three-tier hierarchy. The hierarchy indicates the extent to which inputs used in measuring fair value are observable in the market.
Level 1 Inputs include unadjusted quoted prices in active markets for identical assets or liabilities that we can access at the measurement date.
Level 2 Inputs other than quoted prices included within Level 1 that are observable for the asset or liability, either directly or indirectly, including quoted prices for similar assets in active markets, quoted prices from identical or similar assets in inactive markets, observable inputs, such as interest rates and yield curves, and assumptions about risk.
Level 3 Inputs that are significant to the measurement that are not observable in the market and include management’s judgments about the assumptions market participants would use in pricing the asset or liability (including assumptions about risk).
Our fair value processes include controls that are designed to ensure that fair values are appropriate. Such controls include model validation, review of key model inputs, analysis of period-over-period fluctuations and reviews by senior management.
Valuation Methodologies
Money Market Securities. Money market securities are cash equivalents, which are included in cash and cash equivalents, restricted cash from collections on auto loans receivable and other assets. They consist of highly liquid investments with original maturities of three months or less and are classified as Level 1.
Mutual Fund Investments. Mutual fund investments consist of publicly traded mutual funds that primarily include diversified equity investments in large-, mid- and small-cap domestic and international companies or investment grade debt securities. The investments, which are included in other assets, are held in a rabbi trust established to fund informally our executive deferred compensation plan and are classified as Level 1.
Derivative Instruments. The fair values of our derivative instruments are included in either other current assets, other assets, accounts payable or other liabilities. Our derivatives are not exchange-traded and are over-the-counter customized derivative instruments. All of our derivative exposures are with highly rated bank counterparties.
We measure derivative fair values assuming that the unit of account is an individual derivative instrument and that derivatives are sold or transferred on a stand-alone basis. We estimate the fair value of our derivatives using quotes determined by the derivative counterparties and third-party valuation services. Quotes from third-party valuation services and quotes received from bank counterparties project future cash flows and discount the future amounts to a present value using market-based expectations for interest rates and the contractual terms of the derivative instruments. The models do not require significant judgment and model inputs can typically be observed in a liquid market; however, because the models include inputs other than quoted prices in active markets, all derivatives are classified as Level 2.
Our derivative fair value measurements consider assumptions about counterparty and our own nonperformance risk. We monitor counterparty and our own nonperformance risk and, in the event that we determine that a party is unlikely to perform under terms of the contract, we would adjust the derivative fair value to reflect the nonperformance risk.
Items Measured at Fair Value on a Recurring Basis
| | | | | | | | | | | | | | | | | |
| | As of November 30, 2022 |
| (In thousands) | Level 1 | | Level 2 | | Total |
| Assets: | | | | | |
| Money market securities | $ | 1,261,183 | | | $ | — | | | $ | 1,261,183 | |
| Mutual fund investments | 21,485 | | | — | | | 21,485 | |
| | | | | |
| Derivative instruments designated as hedges | — | | | 89,485 | | | 89,485 | |
| Derivative instruments not designated as hedges | — | | | 32,923 | | | 32,923 | |
| Total assets at fair value | $ | 1,282,668 | | | $ | 122,408 | | | $ | 1,405,076 | |
| | | | | |
| Percent of total assets at fair value | 91.3 | % | | 8.7 | % | | 100.0 | % |
| Percent of total assets | 4.9 | % | | 0.5 | % | | 5.4 | % |
| | | | | |
| Liabilities: | | | | | |
| Derivative instruments designated as hedges | $ | — | | | $ | (3,599) | | | $ | (3,599) | |
| | | | | |
| | | | | |
| Total liabilities at fair value | $ | — | | | $ | (3,599) | | | $ | (3,599) | |
| | | | | |
| Percent of total liabilities | — | % | | — | % | | — | % |
| | | | | | | | | | | | | | | | | |
| | As of February 28, 2022 |
| (In thousands) | Level 1 | | Level 2 | | Total |
| Assets: | | | | | |
| Money market securities | $ | 701,865 | | | $ | — | | | $ | 701,865 | |
| Mutual fund investments | 24,022 | | | — | | | 24,022 | |
| Derivative instruments designated as hedges | — | | | 39,452 | | | 39,452 | |
| Derivative instruments not designated as hedges | — | | | 9,339 | | | 9,339 | |
| Total assets at fair value | $ | 725,887 | | | $ | 48,791 | | | $ | 774,678 | |
| | | | | |
| Percent of total assets at fair value | 93.7 | % | | 6.3 | % | | 100.0 | % |
| Percent of total assets | 2.8 | % | | 0.2 | % | | 2.9 | % |
| | | | | |
| Liabilities: | | | | | |
| Derivative instruments designated as hedges | $ | — | | | $ | (1,379) | | | $ | (1,379) | |
| Total liabilities at fair value | $ | — | | | $ | (1,379) | | | $ | (1,379) | |
| | | | | |
| Percent of total liabilities | — | % | | — | % | | — | % |
Fair Value of Financial Instruments
The carrying value of our cash and cash equivalents, accounts receivable, other restricted cash deposits and accounts payable approximates fair value due to the short-term nature and/or variable rates associated with these financial instruments. Auto loans receivable are presented net of an allowance for estimated loan losses, which we believe approximates fair value. We believe that the carrying value of our revolving credit facility and term loans approximates fair value due to the variable rates associated with these obligations. The fair value of our senior unsecured notes, which are not carried at fair value on our consolidated balance sheets, was determined using Level 2 inputs based on quoted market prices. The carrying value and fair value of the senior unsecured notes as of November 30, 2022 and February 28, 2022, respectively, are as follows:
| | | | | | | | | | | |
| (In thousands) | As of November 30, 2022 | | As of February 28, 2022 |
| Carrying value | $ | 500,000 | | | $ | 500,000 | |
| Fair value | $ | 474,771 | | | $ | 517,396 | |
8. Cancellation Reserves
We recognize revenue for EPP products, on a net basis, at the time of sale. We also record a reserve, or refund liability, for estimated contract cancellations. Cancellations of these services may result from early termination by the customer, or default or prepayment on the finance contract. The reserve for cancellations is evaluated for each product and is based on forecasted forward cancellation curves utilizing historical experience, recent trends and credit mix of the customer base.
Cancellation Reserves
| | | | | | | | | | | | | | | | | | | | | | | |
| | Three Months Ended November 30 | | Nine Months Ended November 30 |
| (In millions) | 2022 | | 2021 | | 2022 | | 2021 |
| Balance as of beginning of period | $ | 148.8 | | | $ | 144.3 | | | $ | 144.7 | | | $ | 124.5 | |
| Cancellations | (25.2) | | | (25.2) | | | (80.3) | | | (68.3) | |
| Provision for future cancellations | 20.7 | | | 28.7 | | | 79.9 | | | 91.6 | |
| Balance as of end of period | $ | 144.3 | | | $ | 147.8 | | | $ | 144.3 | | | $ | 147.8 | |
The current portion of estimated cancellation reserves is recognized as a component of accrued expenses and other current liabilities with the remaining amount recognized in other liabilities. As of November 30, 2022 and February 28, 2022, the current portion of cancellation reserves was $80.4 million and $78.7 million, respectively.
9. Income Taxes
We had $26.7 million of gross unrecognized tax benefits as of November 30, 2022, and $24.8 million as of February 28, 2022. There were no significant changes to the gross unrecognized tax benefits as reported for the fiscal year ended February 28, 2022.
On August 16, 2022, federal legislation commonly referred to as the Inflation Reduction Act of 2022 (“IRA”), was enacted. We have evaluated the tax provisions of the IRA, the most significant of which are the corporate alternative minimum tax and the share repurchase tax. We do not expect the legislation to have a material impact on our results of operations. As the IRS issues additional guidance related to the IRA, we will evaluate any impact to our consolidated financial statements.
10. Debt
| | | | | | | | | | | | | | |
| (In thousands) | | As of November 30 | | As of February 28 |
Debt Description (1) | Maturity Date | 2022 | | 2022 |
Revolving credit facility (2) | June 2024 | $ | — | | | $ | 1,243,500 | |
Term loan (2) | June 2024 | 300,000 | | | 300,000 | |
Term loan (2) | October 2026 | 699,458 | | | 699,352 | |
| 3.86% Senior notes | April 2023 | 100,000 | | | 100,000 | |
| 4.17% Senior notes | April 2026 | 200,000 | | | 200,000 | |
| 4.27% Senior notes | April 2028 | 200,000 | | | 200,000 | |
| Financing obligations | Various dates through February 2059 | 517,349 | | | 524,766 | |
| Non-recourse notes payable | Various dates through April 2029 | 16,237,419 | | | 15,466,799 | |
| Total debt | | 18,254,226 | | | 18,734,417 | |
| Less: current portion | | (586,855) | | | (532,272) | |
| Less: unamortized debt issuance costs | | (26,689) | | | (27,126) | |
| Long-term debt, net | | $ | 17,640,682 | | | $ | 18,175,019 | |
(1) Interest is payable monthly, with the exception of our senior notes, which are payable semi-annually.
(2) Borrowings accrue interest at variable rates based on the Eurodollar rate (LIBOR), or the successor benchmark rate, the federal funds rate, or the prime rate, depending on the type of borrowing.
Revolving Credit Facility. Borrowings under our $2.00 billion unsecured revolving credit facility (the “credit facility”) are available for working capital and general corporate purposes. We pay a commitment fee on the unused portions of the available funds. Borrowings under the credit facility are either due “on demand” or at maturity depending on the type of
borrowing. Borrowings with “on demand” repayment terms are presented as short-term debt, while amounts due at maturity are presented as long-term debt. As of November 30, 2022, the unused capacity of $2.00 billion was fully available to us.
Term Loans. Borrowings under our $300 million and $700 million term loans are available for working capital and general corporate purposes. The interest rate on our term loans was 4.67% as of November 30, 2022, and the loans were classified as long-term debt as no repayments are scheduled to be made within the next 12 months.
Senior Notes. Borrowings under our unsecured senior notes totaling $500 million are available for working capital and general corporate purposes. The 3.86% senior note matures in April 2023 and is therefore classified as current. The remaining notes were classified as long-term debt as no repayments are scheduled to be made within the next 12 months.
Financing Obligations. Financing obligations relate to stores subject to sale-leaseback transactions that do not qualify for sale accounting. The financing obligations were structured at varying interest rates and generally have initial lease terms ranging from 15 to 20 years with payments made monthly. We have not entered into any new sale-leaseback transactions since fiscal 2009. In the event the agreements are modified or extended beyond their original term, the related obligation is adjusted based on the present value of the revised future payments, with a corresponding change to the assets subject to these transactions. Upon modification, the amortization of the obligation is reset, resulting in more of the payments being applied to interest expense in the initial years following the modification.
Non-Recourse Notes Payable. The non-recourse notes payable relate to auto loans receivable funded through non-recourse funding vehicles. The timing of principal payments on the non-recourse notes payable is based on the timing of principal collections and defaults on the related auto loans receivable. The current portion of non-recourse notes payable represents principal payments that are due to be distributed in the following period.
Notes payable related to our asset-backed term funding transactions accrue interest predominantly at fixed rates and have scheduled maturities through April 2029, but may mature earlier, depending upon the repayment rate of the underlying auto loans receivable.
Information on our funding vehicles of non-recourse notes payable as of November 30, 2022 are as follows:
| | | | | |
| (In billions) | Capacity |
| Warehouse facilities: | |
| December 2022 expiration | $ | 0.25 | |
| February 2023 expiration | 2.85 | |
| August 2023 expiration | 2.30 | |
| Combined warehouse facility limit | $ | 5.40 | |
| Unused capacity | $ | 1.98 | |
| |
| Non-recourse notes payable outstanding: | |
| Warehouse facilities | $ | 3.42 | |
| Asset-backed term funding transactions | 12.82 | |
| Non-recourse notes payable | $ | 16.24 | |
We generally enter into warehouse facility agreements for one-year terms and typically renew the agreements annually. The return requirements of warehouse facility investors could fluctuate significantly depending on market conditions. At renewal, the cost, structure and capacity of the facilities could change. These changes could have a significant impact on our funding costs.
See Note 5 for additional information on the related auto loans receivable.
Capitalized Interest. We capitalize interest in connection with the construction of certain facilities. For the nine months ended November 30, 2022 and 2021, we capitalized interest of $3.6 million and $5.0 million, respectively.
Financial Covenants. The credit facility, term loans and senior note agreements contain representations and warranties, conditions and covenants. We must also meet financial covenants in conjunction with certain financing obligations. The agreements governing our non-recourse funding vehicles contain representations and warranties, financial covenants and
performance triggers. As of November 30, 2022, we were in compliance with all financial covenants and our non-recourse funding vehicles were in compliance with the related performance triggers.
11. Stock and Stock-Based Incentive Plans
(A)Share Repurchase Program
In April 2022, our board of directors (“board”) increased our share repurchase authorization by $2.0 billion. As of November 30, 2022, a total of $4.0 billion of board authorizations for repurchases of our common stock was outstanding, with no expiration date, of which $2.45 billion remained available for repurchase. Share repurchases were paused during the third quarter of fiscal 2023.
Common Stock Repurchases
| | | | | | | | | | | | | | | | | | | | | | | |
| | Three Months Ended | | Nine Months Ended |
| | November 30 | | November 30 |
| | 2022 | | 2021 | | 2022 | | 2021 |
Number of shares repurchased (in thousands) | 30.0 | | | 851.1 | | | 3,403.9 | | | 3,602.8 | |
| Average cost per share | $ | 87.70 | | | $ | 135.52 | | | $ | 94.95 | | | $ | 127.65 | |
Available for repurchase, as of end of period (in millions) | $ | 2,451.3 | | | $ | 876.2 | | | $ | 2,451.3 | | | $ | 876.2 | |
(B)Share-Based Compensation
Composition of Share-Based Compensation Expense
| | | | | | | | | | | | | | | | | | | | | | | |
| | Three Months Ended | | Nine Months Ended |
| | November 30 | | November 30 |
| (In thousands) | 2022 | | 2021 | | 2022 | | 2021 |
| Cost of sales | $ | 333 | | | $ | 1,896 | | | $ | 1,474 | | | $ | 5,719 | |
| CarMax Auto Finance income | 981 | | | 1,560 | | | 1,394 | | | 4,749 | |
| Selling, general and administrative expenses | 17,213 | | | 33,328 | | | 63,983 | | | 100,453 | |
| Share-based compensation expense, before income taxes | $ | 18,527 | | | $ | 36,784 | | | $ | 66,851 | | | $ | 110,921 | |
Composition of Share-Based Compensation Expense – By Grant Type
| | | | | | | | | | | | | | | | | | | | | | | |
| | Three Months Ended | | Nine Months Ended |
| | November 30 | | November 30 |
| (In thousands) | 2022 | | 2021 | | 2022 | | 2021 |
| Nonqualified stock options | $ | 8,968 | | | $ | 7,846 | | | $ | 29,648 | | | $ | 27,375 | |
| Cash-settled restricted stock units (RSUs) | 5,167 | | | 23,836 | | | 15,521 | | | 62,398 | |
| Stock-settled market stock units (MSUs) | 3,358 | | | 3,171 | | | 12,234 | | | 11,260 | |
| Other share-based incentives: | | | | | | | |
| Stock-settled performance stock units (PSUs) | 209 | | | 964 | | | 5,150 | | | 5,334 | |
| Restricted stock (RSAs) | 262 | | | 365 | | | 571 | | | 670 | |
| Stock-settled deferred stock units (DSUs) | — | | | — | | | 1,850 | | | 1,925 | |
| Employee stock purchase plan | 563 | | | 602 | | | 1,877 | | | 1,959 | |
| Total other share-based incentives | $ | 1,034 | | | $ | 1,931 | | | $ | 9,448 | | | $ | 9,888 | |
| Share-based compensation expense, before income taxes | $ | 18,527 | | | $ | 36,784 | | | $ | 66,851 | | | $ | 110,921 | |
(C)Stock Incentive Plan Information
Share/Unit Activity
| | | | | | | | | | | | | | | | | |
| Nine Months Ended November 30, 2022 |
| Equity Classified | | Liability Classified |
| (Shares/units in thousands) | Options | MSUs | Other | | RSUs |
| Outstanding as of February 28, 2022 | 5,796 | | 393 | | 170 | | | 1,163 | |
| Granted | 1,285 | | 137 | | 50 | | | 677 | |
| Exercised or vested and converted | (208) | | (122) | | (80) | | | (748) | |
| Cancelled | (48) | | (6) | | (5) | | | (68) | |
| Outstanding as of November 30, 2022 | 6,825 | | 402 | | 135 | | | 1,024 | |
| | | | | |
| Weighted average grant date fair value per share/unit: | | | | | |
| | | | | |
| Granted | $ | 33.35 | | $ | 126.59 | | $ | 95.58 | | | $ | 91.20 | |
| Ending outstanding | $ | 25.69 | | $ | 120.96 | | $ | 99.04 | | | $ | 97.23 | |
| | | | | |
| | | | | |
| As of November 30, 2022 | | |
Unrecognized compensation (in millions) | $ | 59.0 | | $ | 18.2 | | $ | 2.4 | | | |
12. Net Earnings Per Share
Basic net earnings per share is computed by dividing net earnings available for basic common shares by the weighted average number of shares of common stock outstanding. Diluted net earnings per share is computed by dividing net earnings available for diluted common shares by the sum of weighted average number of shares of common stock outstanding and dilutive potential common stock. Diluted net earnings per share is calculated using the “if-converted” treasury stock method.
Basic and Dilutive Net Earnings Per Share Reconciliations
| | | | | | | | | | | | | | | | | | | | | | | |
| | Three Months Ended | | Nine Months Ended |
| | November 30 | | November 30 |
| (In thousands except per share data) | 2022 | | 2021 | | 2022 | | 2021 |
| Net earnings | $ | 37,580 | | | $ | 269,438 | | | $ | 415,750 | | | $ | 991,461 | |
| | | | | | | |
| Weighted average common shares outstanding | 158,003 | | | 162,006 | | | 159,044 | | | 162,710 | |
| Dilutive potential common shares: | | | | | | | |
| Stock options | 268 | | | 2,373 | | | 857 | | | 2,391 | |
| Stock-settled stock units and awards | 265 | | | 494 | | | 294 | | | 505 | |
| Weighted average common shares and dilutive potential common shares | 158,536 | | | 164,873 | | | 160,195 | | | 165,606 | |
| | | | | | | |
| Basic net earnings per share | $ | 0.24 | | | $ | 1.66 | | | $ | 2.61 | | | $ | 6.09 | |
| Diluted net earnings per share | $ | 0.24 | | | $ | 1.63 | | | $ | 2.60 | | | $ | 5.99 | |
Certain options to purchase shares of common stock were outstanding and not included in the calculation of diluted net earnings per share because their inclusion would have been antidilutive. On a weighted average basis, for the three months ended November 30, 2022 and 2021, options to purchase 4,934,554 shares and 776,853 shares of common stock, respectively, were not included. For the nine months ended November 30, 2022 and 2021, options to purchase 1,917,727 shares and 701,970 shares of common stock, respectively, were not included.
13. Accumulated Other Comprehensive Income (Loss)
Changes in Accumulated Other Comprehensive Income (Loss) By Component
| | | | | | | | | | | | | | | | | |
| | | | | | Total |
| | Net | | Net | | Accumulated |
| | Unrecognized | | Unrecognized | | Other |
| | Actuarial | | Hedge | | Comprehensive |
| (In thousands, net of income taxes) | Losses | | Gains | | Income (Loss) |
| Balance as of February 28, 2022 | $ | (73,001) | | | $ | 26,579 | | | $ | (46,422) | |
| Other comprehensive income before reclassifications | — | | | 113,510 | | | 113,510 | |
| Amounts reclassified from accumulated other comprehensive income (loss) | 1,444 | | | (11,112) | | | (9,668) | |
| Other comprehensive income | 1,444 | | | 102,398 | | | 103,842 | |
| Balance as of November 30, 2022 | $ | (71,557) | | | $ | 128,977 | | | $ | 57,420 | |
Changes In and Reclassifications Out of Accumulated Other Comprehensive Income (Loss)
| | | | | | | | | | | | | | | | | | | | | | | |
| | Three Months Ended November 30 | | Nine Months Ended November 30 |
| (In thousands) | 2022 | | 2021 | | 2022 | | 2021 |
| Retirement Benefit Plans: | | | | | | | |
| Actuarial loss amortization reclassifications recognized in net pension expense: | | | | | | | |
| Cost of sales | $ | 272 | | | $ | 367 | | | $ | 810 | | | $ | 1,083 | |
| CarMax Auto Finance income | 19 | | | 21 | | | 51 | | | 64 | |
| Selling, general and administrative expenses | 346 | | | 481 | | | 1,048 | | | 1,458 | |
| Total amortization reclassifications recognized in net pension expense | 637 | | | 869 | | | 1,909 | | | 2,605 | |
| Tax expense | (155) | | | (210) | | | (465) | | | (629) | |
| Amortization reclassifications recognized in net pension expense, net of tax | 482 | | | 659 | | | 1,444 | | | 1,976 | |
| Net change in retirement benefit plan unrecognized actuarial losses, net of tax | 482 | | | 659 | | | 1,444 | | | 1,976 | |
| | | | | | | |
| Cash Flow Hedges (Note 6): | | | | | | | |
| Changes in fair value | 42,521 | | | 11,339 | | | 152,731 | | | 8,668 | |
| Tax expense | (10,919) | | | (2,985) | | | (39,221) | | | (2,282) | |
| Changes in fair value, net of tax | 31,602 | | | 8,354 | | | 113,510 | | | 6,386 | |
| Reclassifications to CarMax Auto Finance income | (8,965) | | | 4,111 | | | (14,951) | | | 13,610 | |
| Tax benefit (expense) | 2,302 | | | (1,082) | | | 3,839 | | | (3,582) | |
| Reclassification of hedge (gains) losses, net of tax | (6,663) | | | 3,029 | | | (11,112) | | | 10,028 | |
| Net change in cash flow hedge unrecognized gains, net of tax | 24,939 | | | 11,383 | | | 102,398 | | | 16,414 | |
| Total other comprehensive income, net of tax | $ | 25,421 | | | $ | 12,042 | | | $ | 103,842 | | | $ | 18,390 | |
Changes in the funded status of our retirement plans and changes in the fair value of derivatives that are designated and qualify as cash flow hedges are recognized in accumulated other comprehensive income (loss). The cumulative balances are net of deferred taxes of $21.7 million as of November 30, 2022 and $14.2 million as of February 28, 2022.
14. Leases
Our leases primarily consist of operating and finance leases related to retail stores, office space, land and equipment. We also have stores subject to sale-leaseback transactions that do not qualify for sale accounting and are accounted for as financing obligations. For more information on these financing obligations see Note 10.
The initial term for real property leases is typically 5 to 20 years. For equipment leases, the initial term generally ranges from 3 to 8 years. Most leases include one or more options to renew, with renewal terms that can extend the lease term from 1 to 20 years or more. We include options to renew (or terminate) in our lease term, and as part of our right-of-use (“ROU”) assets and lease liabilities, when it is reasonably certain that we will exercise that option.
ROU assets and the related lease liabilities are initially measured at the present value of future lease payments over the lease term. As most of our leases do not provide an implicit rate, we use our collateralized incremental borrowing rate based on the information available at the commencement date in determining the present value of future payments. We include variable lease payments in the initial measurement of ROU assets and lease liabilities only to the extent they depend on an index or rate. Changes in such indices or rates are accounted for in the period the change occurs, and do not result in the remeasurement of the ROU asset or liability. We are also responsible for payment of certain real estate taxes, insurance and other expenses on our leases. These amounts are generally considered to be variable and are not included in the measurement of the ROU asset and lease liability. We generally account for non-lease components, such as maintenance, separately from lease components. For certain equipment leases, we apply a portfolio approach to account for the lease assets and liabilities.
Our lease agreements do not contain any material residual value guarantees or material restricted covenants. Leases with a term of 12 months or less are not recorded on the balance sheet; we recognize lease expense for these leases on a straight-line basis over the lease term.
The components of lease expense were as follows:
| | | | | | | | | | | | | | | | | | | | | | | |
| Three Months Ended November 30 | | Nine Months Ended November 30 |
| (In thousands) | 2022 | | 2021 | | 2022 | | 2021 |
Operating lease cost (1) | $ | 22,450 | | | $ | 20,581 | | | $ | 68,381 | | | $ | 53,631 | |
| Finance lease cost: | | | | | | | |
| Depreciation of lease assets | 4,178 | | | 3,383 | | | 11,701 | | | 9,784 | |
| Interest on lease liabilities | 5,728 | | | 4,257 | | | 16,129 | | | 12,531 | |
| Total finance lease cost | 9,906 | | | 7,640 | | | 27,830 | | | 22,315 | |
| Total lease cost | $ | 32,356 | | | $ | 28,221 | | | $ | 96,211 | | | $ | 75,946 | |
(1) Includes short-term leases and variable lease costs, which are immaterial.
Supplemental balance sheet information related to leases was as follows:
| | | | | | | | | | | | | | |
| | As of November 30 | | As of February 28 |
| (In thousands) | Classification | 2022 | | 2022 |
| Assets: | | | | |
| Operating lease assets | Operating lease assets | $ | 529,781 | | | $ | 537,357 | |
| Finance lease assets | Property and equipment, net (1) | 146,826 | | | 127,183 | |
| Total lease assets | | $ | 676,607 | | | $ | 664,540 | |
| Liabilities: | | | | |
| Current: | | | | |
| Operating leases | Current portion of operating lease liabilities | $ | 51,215 | | | $ | 44,197 | |
| Finance leases | Accrued expenses and other current liabilities | 18,152 | | | 10,290 | |
| Long-term: | | | | |
| Operating leases | Operating lease liabilities, excluding current portion | 509,106 | | | 523,269 | |
| Finance leases | Other liabilities | 162,264 | | | 145,179 | |
| Total lease liabilities | | $ | 740,737 | | | $ | 722,935 | |
(1) Finance lease assets are recorded net of accumulated depreciation of $42.4 million as of November 30, 2022 and $30.7 million as of February 28, 2022.
Lease term and discount rate information related to leases was as follows:
| | | | | | | | | | | |
| As of November 30 | | As of February 28 |
| Lease Term and Discount Rate | 2022 | | 2022 |
Weighted Average Remaining Lease Term (in years) | | | |
| Operating leases | 16.68 | | 17.31 |
| Finance leases | 11.02 | | 12.42 |
| | | |
| Weighted Average Discount Rate | | | |
| Operating leases | 4.84 | % | | 4.80 | % |
| Finance leases | 19.50 | % | | 14.35 | % |
Supplemental cash flow information related to leases was as follows:
| | | | | | | | | | | |
| Nine Months Ended November 30 |
| (In thousands) | 2022 | | 2021 |
| Cash paid for amounts included in the measurement of lease liabilities: | | | |
| Operating cash flows from operating leases | $ | 67,675 | | | $ | 51,527 | |
| Operating cash flows from finance leases | $ | 12,747 | | | $ | 8,086 | |
| Financing cash flows from finance leases | $ | 10,056 | | | $ | 8,822 | |
| | | |
| Lease assets obtained in exchange for lease obligations: | | |
| Operating leases | $ | 29,027 | | | $ | 45,491 | |
| Finance leases | $ | 31,344 | | | $ | 24,772 | |
Maturities of lease liabilities were as follows:
| | | | | | | | | | | |
| As of November 30, 2022 |
| (In thousands) | Operating Leases (1) | | Finance Leases (1) |
| Fiscal 2023, remaining | $ | 18,699 | | | $ | 8,729 | |
| Fiscal 2024 | 76,168 | | | 40,620 | |
| Fiscal 2025 | 74,353 | | | 37,764 | |
| Fiscal 2026 | 68,771 | | | 38,901 | |
| Fiscal 2027 | 62,201 | | | 34,811 | |
| Thereafter | 578,907 | | | 219,889 | |
| Total lease payments | 879,099 | | | 380,714 | |
| Less: interest | (318,778) | | | (200,298) | |
| Present value of lease liabilities | $ | 560,321 | | | $ | 180,416 | |
(1) Lease payments exclude $31.3 million of legally binding minimum lease payments for leases signed but not yet commenced.
15. Supplemental Cash Flow Information
Supplemental disclosures of cash flow information:
| | | | | | | | | | | |
| Nine Months Ended November 30 |
| (In thousands) | 2022 | | 2021 |
| Non-cash investing and financing activities: | | | |
| Increase in accrued capital expenditures | $ | 3,123 | | | $ | 9,933 | |
| | | |
| | | |
See Note 14 for supplemental cash flow information related to leases.
16. Contingent Liabilities
Litigation. CarMax entities are defendants in a proceeding asserting wage and hour claims with respect to non-exempt CarMax employees in California. The asserted claims include failure to provide meal periods and rest breaks; pay statutory or contractual wages; reimburse for work-related expenses; and Private Attorneys General Act (“PAGA”) claims. On July 9, 2021, Daniel Bendure v. CarMax Auto Superstores California, LLC et al., a putative class action, was filed in the Superior Court of California, County of San Bernardino. The Bendure lawsuit seeks civil penalties for violation of the Labor Code, attorneys’ fees, costs, restitution of unpaid wages, interest, injunctive and equitable relief, general damages, and special damages. Bendure subsequently decided not to proceed with an individual or putative class claim, but rather filed and served a PAGA-only complaint in the Superior Court of California for the County of San Bernardino on December 7, 2021, based on the same allegations pled in the original complaint. CarMax filed a motion to compel arbitration. The Court has stayed all discovery until after it rules on CarMax’s motion to compel arbitration.
On June 15, 2022, the United States Supreme Court issued its decision in Viking River Cruises v. Moriana, holding that an individual who signs an arbitration agreement cannot circumvent that agreement by filing a related PAGA claim in court. The U.S. Supreme Court further held that, based on California law, an individual who pursues his PAGA claim in arbitration does not have standing to pursue a representative PAGA claim. However, the U.S. Supreme Court indicated that the issue of whether an individual has standing to pursue a representative PAGA claim is a question of state law. The California Supreme Court has agreed to hear a new case, Adolph v. Uber, to address this issue of state law, which is expected to be decided in 2023.
In light of the Viking River decision, CarMax filed a motion to compel arbitration of the individual Bendure claim and to dismiss Bendure’s representative PAGA claims. On November 29, 2022, the Court granted the motion to compel arbitration of the Bendure individual PAGA claims and stayed the motion to dismiss any representative PAGA claims pending the Adolph v. Uber decision.
We are unable to make a reasonable estimate of the amount or range of loss that could result from an unfavorable outcome in this matter.
We are involved in various other legal proceedings in the normal course of business. Based upon our evaluation of information currently available, we believe that the ultimate resolution of any such proceedings will not have a material adverse effect, either individually or in the aggregate, on our financial condition, results of operations or cash flows.
Other Matters. In accordance with the terms of real estate lease agreements, we generally agree to indemnify the lessor from certain liabilities arising as a result of the use of the leased premises, including environmental liabilities and repairs to leased property upon termination of the lease. Additionally, in accordance with the terms of agreements entered into for the sale of properties, we generally agree to indemnify the buyer from certain liabilities and costs arising subsequent to the date of the sale, including environmental liabilities and liabilities resulting from the breach of representations or warranties made in accordance with the agreements. We do not have any known material environmental commitments, contingencies or other indemnification issues arising from these arrangements.
As part of our customer service strategy, we guarantee the used vehicles we retail with a 90-day/4,000 mile limited warranty. A vehicle in need of repair within this period will be repaired free of charge. As a result, each vehicle sold has an implied liability associated with it. Accordingly, based on historical trends, we record a provision for estimated future repairs during the guarantee period for each vehicle sold. The liability for this guarantee was $26.0 million as of November 30, 2022, and $18.5 million as of February 28, 2022, and is included in accrued expenses and other current liabilities.
17. Segment Information
We operate in two reportable segments: CarMax Sales Operations and CAF. Our CarMax Sales Operations segment consists of all aspects of our auto merchandising and service operations, excluding financing provided by CAF. Our CAF segment consists solely of our own finance operation that provides financing to customers buying retail vehicles from CarMax.
We also have a non-reportable operating segment related to our recently acquired Edmunds business, which is reflected as “Other” in the segment tables below. Revenue generated by Edmunds primarily represents advertising and subscription revenues as discussed in Note 3. Edmunds also generates intersegment revenue as a result of transactions between Edmunds and CarMax Sales Operations, which represent arm’s length transactions at prevailing market prices. Such amounts are eliminated in consolidation.
The performance of our CarMax Sales Operations segment is reviewed by our chief operating decision maker at the gross profit level, the components of which are presented in the tables below. Required segment information related to our CAF segment is presented in Note 4. Additionally, asset information by segment is not utilized for purposes of assessing performance or allocating resources and, as a result, such information has not been presented.
Segment Information
| | | | | | | | | | | | | | |
| Three Months Ended November 30, 2022 |
| (In thousands) | CarMax Sales Operations | Other | Eliminations | Total |
| Sales and operating revenues | $ | 6,472,702 | | $ | 33,254 | | $ | — | | $ | 6,505,956 | |
| Intersegment sales and operating revenues | — | | 5,549 | | (5,549) | | — | |
| Total sales and operating revenues | $ | 6,472,702 | | $ | 38,803 | | $ | (5,549) | | $ | 6,505,956 | |
Depreciation and amortization (1) | $ | 404 | | $ | 3,735 | | $ | — | | $ | 4,139 | |
| Gross profit | $ | 554,057 | | $ | 23,780 | | $ | (1,149) | | $ | 576,688 | |
Reconciliation to Consolidated Earnings Before Taxes: | | | |
| CAF Income | | | | 152,196 | |
| Selling, general and administrative expenses | | | | (591,727) | |
Depreciation and amortization (2) | | | | (57,377) | |
| Interest expense | | | | (30,150) | |
| Other income (expense) | | | | 363 | |
| Earnings before income taxes | | | | $ | 49,993 | |
| | | | | | | | | | | | | | |
| Nine Months Ended November 30, 2022 |
| (In thousands) | CarMax Sales Operations | Other | Eliminations | Total |
| Sales and operating revenues | $ | 23,860,462 | | $ | 101,918 | | $ | — | | $ | 23,962,380 | |
| Intersegment sales and operating revenues | — | | 20,219 | | (20,219) | | — | |
| Total sales and operating revenues | $ | 23,860,462 | | $ | 122,137 | | $ | (20,219) | | $ | 23,962,380 | |
Depreciation and amortization (1) | $ | 1,092 | | $ | 10,199 | | $ | — | | $ | 11,291 | |
| Gross profit | $ | 2,115,631 | | $ | 77,869 | | $ | (4,276) | | $ | 2,189,224 | |
| Reconciliation to Consolidated Earnings Before Taxes: |
| CAF Income | | | | 539,538 | |
| Selling, general and administrative expenses | | | | (1,914,508) | |
Depreciation and amortization (2) | | | | (170,717) | |
| Interest expense | | | | (91,670) | |
| Other income (expense) | | | | 2,303 | |
| Earnings before income taxes | | | | $ | 554,170 | |
(1) Represents only the portion of depreciation and amortization recorded within Cost of sales, and thus included in the calculation of Gross profit.
(2) Exclusive of depreciation and amortization recorded within Cost of sales.
ITEM 2.
MANAGEMENT’S DISCUSSION AND ANALYSIS
OF FINANCIAL CONDITION AND RESULTS OF OPERATIONS
The following Management’s Discussion and Analysis of Financial Condition and Results of Operations (“MD&A”) is provided as a supplement to, and should be read in conjunction with, our audited consolidated financial statements, the accompanying notes and the MD&A included in our Annual Report on Form 10-K for the fiscal year ended February 28, 2022 (“fiscal 2022”), as well as our unaudited interim consolidated financial statements and the accompanying notes included in Item 1 of this Form 10-Q. Note references are to the notes to unaudited interim consolidated financial statements included in Item 1. All references to net earnings per share are to diluted net earnings per share. Certain prior year amounts have been reclassified to conform to the current year’s presentation. Amounts and percentages may not total due to rounding.
OVERVIEW
CarMax is the nation’s largest retailer of used vehicles. We operate in two reportable segments: CarMax Sales Operations and CarMax Auto Finance (“CAF”). Our CarMax Sales Operations segment consists of all aspects of our auto merchandising and service operations, excluding financing provided by CAF. Our CAF segment consists solely of our own finance operation that provides financing to customers buying retail vehicles from CarMax. Our consolidated financial statements include the financial results related to our Edmunds Holding Company (“Edmunds”) business, which does not meet the definition of a reportable segment. For purposes of our MD&A discussion, amounts related to that business are discussed in combination with our CarMax Sales Operations segment. Separate discussion of these amounts is not considered meaningful for the purpose of gaining an understanding of our business, as the significant drivers of these operations in total are consistent with those of our CarMax Sales Operations segment. Where appropriate, specific amounts related to non-reportable segments have been disclosed for informational purposes.
CarMax Sales Operations
Our sales operations segment consists of retail sales of used vehicles and related products and services, such as wholesale vehicle sales; the sale of extended protection plan (“EPP”) products, which include extended service plans (“ESPs”) and guaranteed asset protection (“GAP”); and vehicle repair service. We offer competitive, no-haggle prices; a broad selection of CarMax Quality Certified used vehicles; value-added EPP products; and superior customer service. Our omni-channel platform, which gives us the largest addressable market in the used car industry, empowers our retail customers to buy a car on their terms – online, in-store or an integrated combination of both.
Our customers finance the majority of the retail vehicles purchased from us, and availability of on-the-spot financing is a critical component of the sales process. We provide financing to qualified retail customers through CAF and our arrangements with industry-leading third-party finance providers. All of the finance offers, whether by CAF or our third-party providers, are backed by a 3-day payoff option.
As of November 30, 2022, we operated 235 used car stores in 108 U.S. television markets. As of that date, wholesale auctions previously held at many of our used car stores were being conducted virtually.
CarMax Auto Finance
In addition to third-party finance providers, we provide vehicle financing through CAF, which offers financing solely to customers buying retail vehicles from CarMax. CAF allows us to manage our reliance on third-party finance providers and to leverage knowledge of our business to provide qualifying customers a competitive financing option. As a result, we believe CAF enables us to capture additional profits, cash flows and sales. CAF income primarily reflects the interest and fee income generated by the auto loans receivable less the interest expense associated with the debt issued to fund these receivables, a provision for estimated loan losses and direct expenses. CAF income does not include any allocation of indirect costs. After the effect of 3-day payoffs and vehicle returns, CAF financed 41.4% of our retail used vehicle unit sales in the first nine months of fiscal 2023. As of November 30, 2022, CAF serviced approximately 1.1 million customer accounts in its $16.65 billion portfolio of managed receivables.
Management regularly analyzes CAF’s operating results by assessing the competitiveness of our consumer offer, profitability, the performance of the auto loans receivable, including trends in credit losses and delinquencies, and CAF direct expenses.
Revenues and Profitability
The sources of revenue and gross profit from the CarMax Sales Operations segment and other non-reportable segments for the first nine months of fiscal 2023 are as follows:
| | | | | | | | |
| Net Sales and
Operating Revenues | Gross Profit |
A high-level summary of our financial results for the third quarter and first nine months of fiscal 2023 as compared to the third quarter and first nine months of fiscal 2022 is as follows (1):
| | | | | | | | | | | | | | | | | | | | | | | |
| (Dollars in millions except per share or per unit data) | Three Months Ended November 30, 2022 | | Change from Three Months Ended November 30, 2021 | | Nine Months Ended November 30, 2022 | | Change from Nine Months Ended November 30, 2021 |
| Income statement information | | | | | | | |
| Net sales and operating revenues | $ | 6,506.0 | | | (23.7) | % | | $ | 23,962.4 | | | (1.0) | % |
| Gross profit | $ | 576.7 | | | (31.1) | % | | $ | 2,189.2 | | | (15.0) | % |
| CAF income | $ | 152.2 | | | (8.3) | % | | $ | 539.5 | | | (11.2) | % |
| Selling, general and administrative expenses | $ | 591.7 | | | 2.7 | % | | $ | 1,914.5 | | | 12.3 | % |
| Net earnings | $ | 37.6 | | | (86.1) | % | | $ | 415.8 | | | (58.1) | % |
| Unit sales information | | | | | | | |
| Used unit sales | 180,050 | | | (20.8) | % | | 637,939 | | | (12.6) | % |
| Change in used unit sales in comparable stores | (22.4) | % | | N/A | | (14.3) | % | | N/A |
| Wholesale unit sales | 118,757 | | | (36.7) | % | | 464,741 | | | (16.6) | % |
| Per unit information | | | | | | | |
| Used gross profit per unit | $ | 2,237 | | | 0.1 | % | | $ | 2,291 | | | 3.8 | % |
| Wholesale gross profit per unit | $ | 966 | | | (14.6) | % | | $ | 962 | | | (8.7) | % |
| SG&A as a % of gross profit | 102.6 | % | | 33.8 | % | | 87.5 | % | | 21.4 | % |
| Per share information | | | | | | | |
| Net earnings per diluted share | $ | 0.24 | | | (85.3) | % | | $ | 2.60 | | | (56.6) | % |
| Online sales metrics | | | | | | | |
Online retail sales (2) | 12 | % | | 3 | % | | 11 | % | | 2 | % |
Omni sales (3) | 52 | % | | (5) | % | | 53 | % | | (3) | % |
Revenue from online transactions (4) | 28 | % | | (2) | % | | 30 | % | | 3 | % |
(1) Where applicable, amounts are net of intercompany eliminations.
(2) An online retail sale is defined as a sale where the customer completes all four of the following activities remotely: reserving the vehicle; financing the vehicle, if needed; trading-in or opting out of a trade-in; and creating an online sales order.
(3) An omni sale is defined as a sale where customers complete at least one of the four activities listed above online.
(4) Revenue from online transactions is defined as revenue from retail sales that qualify as an online retail sale, as well as any related EPP and third-party finance contribution, wholesale sales where the winning bid was taken from an online bid and all revenue earned by Edmunds.
Refer to “Results of Operations” for further details on our revenues and profitability.
Liquidity
Our primary ongoing sources of liquidity include funds provided by operations, proceeds from non-recourse funding vehicles, and borrowings under our revolving credit facility or through other financing sources. In addition to funding our operations, this liquidity was used to fund the repurchase of common stock under our share repurchase program, our store growth and the Edmunds acquisition, which was completed during the second quarter of fiscal 2022.
Our current capital allocation strategy is to focus on our core business. Given our recent performance and continued market uncertainties, we are taking a conservative approach to our capital structure in order to maintain the flexibility that allows us to efficiently access the capital markets for both CAF and CarMax as a whole. We have taken steps to better align our expenses to sales, as well as paused our share repurchases and slowed the rate of our store growth and capital expenditures. We believe we have the appropriate liquidity, access to capital and financial strength to support our operations and continue investing in our strategic initiatives for the foreseeable future.
Strategic Update and Future Outlook
Our omni-channel experience provides a common platform across all of CarMax that leverages our scale, nationwide footprint and infrastructure and empowers our customers to buy a vehicle on their terms. Customers are seeking personalization, convenience and safety in how they shop for and buy a vehicle more than ever. Our omni-channel platform empowers customers to buy a car on their own terms, whether completely from home, in-store or through an integrated combination of online and in-store experiences. Our diversified business model, combined with our omni-channel experience, is a unique advantage in the used car industry that firmly positions us to continue growing our market share while creating shareholder value over the long-term.
During the first quarter of fiscal 2023, we enabled online self-progression for all of our retail customers. All customers are now eligible to complete an online retail sale independently if they choose. In the third quarter of fiscal 2023, online retail sales accounted for 12% of retail unit sales, up from 11% in the previous quarter and 9% in the prior year quarter. Omni sales represented approximately 52% of retail sales, down slightly from the previous quarter as well as the prior year quarter. Online, omni and in-person sales can vary from quarter to quarter depending on consumer preferences and how they choose to interact with us. While we expect our online and omni sales to grow over time, our goal is to provide the best experience whether in-store, online or a combination of the two.
Revenue from online transactions was $1.8 billion, or approximately 28% of net revenues in the third quarter of fiscal 2023, down from 30% in the previous quarter as well as the prior year quarter.
We purchased approximately 238,000 vehicles from consumers and dealers during the third quarter of fiscal 2023, down 40% from the prior year quarter and up approximately 19% from the third quarter of fiscal 2021. Approximately 14,000 vehicles were purchased through MaxOffer, our digital appraisal product for dealers, down 32% from the prior quarter but up 16% from the prior year quarter. We leverage the Edmunds sales team to open new markets and sign up new dealers for MaxOffer. For the third quarter of fiscal 2023, our self-sufficiency rate remained above 70%. The success of our online instant appraisal offer continues to strengthen our leadership position as the largest used vehicle buyer from consumers.
Our investments in the near term will focus on initiatives that unlock operational efficiencies and create better experiences for our associates and customers. Examples of these initiatives include:
•Making it simple for customers to choose the express pick-up option through self-progression, which provides customers the ability to complete their transaction at one of our stores in as little as 30 minutes.
•Enhancing online features to help customers feel more confident in completing key transaction steps on their own and to make it easier to go back and forth between assisted help and self-progression.
•Integrating our finance-based shopping capability into our stores and CECs so that all consumers can utilize this product, as well as adding additional third-party finance providers to the finance-based shopping platform.
While we have slowed the pace of these investments, we continue to selectively invest in initiatives that have the potential to activate new capabilities while lowering our costs, including the following:
•Leveraging technology to enhance our transportation logistics capabilities, which will enable us to consolidate loads, increase our mix of full loads and reduce the truck volume in and out of our stores.
•Upgrading our auction experience by deploying a modernized vehicle detail page that is mobile friendly and efficiently displays the most relevant information dealers need to preview our wholesale inventory, similar to how customers shop our retail inventory.
•Updating the MaxOffer product to provide a fully digital, instant offer experience to dealers.
We are also focused on ensuring we are efficient in our spend, actively taking steps to further align our expenses to our sales levels. This included reducing staffing in our stores and CECs through attrition, limiting hiring and contractor utilization in our corporate offices and better aligning marketing spend to sales. Other steps we have taken to support our business for both the short- and long-term include slowing buys in light of steep market depreciation, reducing total inventory while maintaining saleable inventory levels, raising CAF's consumer rates, slowing our planned store growth and pausing share repurchases to provide more capital flexibility.
As a result of these actions, we expect SG&A expenses in the fourth quarter of fiscal 2023 to decrease from the prior year quarter. While SG&A as a percent of gross profit can fluctuate from quarter to quarter depending on variability in gross profit, our first step on the way to strengthening our SG&A to gross profit leverage over time is to achieve a rate in the mid-70% range on an annual basis. Achieving this will require both efficiency gains in our operating model and gross profit growth.
We expect our diversified model, the scale of our operations, our investments and omni-channel strategy to provide a solid foundation for further growth. As a result, we have set the following long-term targets, which were disclosed in our Annual Report on Form 10-K for fiscal 2022:
•Sell between 2 million and 2.4 million vehicles through our combined retail and wholesale channels by fiscal 2026.
•Generate between $33 billion and $45 billion in revenue by fiscal 2026.
•Grow our nationwide share of the age 0- to 10 used vehicle market to more than 5% by the end of calendar 2025.
These ranges include our assessment of macroeconomic factors that could result in ongoing volatility in consumer demand.
In calendar 2021, we estimate we sold approximately 4.0% of the age 0- to 10-year old vehicles sold on a nationwide basis, an increase from 3.5% in calendar 2020. We estimate we sold approximately 4.9% of the age 0- to 10-year old vehicles sold in the current comparable store markets in which we operate in calendar 2021, an increase from 4.3% in 2020. Based on external data, we gained market share on a year-to-date basis through October, with some recent loss of market share, as we saw competitors lower prices and margins to move inventory. We believe these are transitory competitive responses to the current environment. We believe we are well positioned to deliver profitable market share gains in any environment. Our strategy to increase our market share includes focusing on:
•Delivering a customer-driven, omni-channel buying and selling experience that is a unique and powerful integration of our in-store and online capabilities.
•Opening stores in new markets and expanding our presence in existing markets.
•Hiring, developing and retaining an engaged and skilled workforce.
•Improving efficiency in our stores and CECs and our logistics operations to reduce waste.
•Leveraging data and advanced analytics to continuously improve the customer experience as well as our processes and systems.
•Utilizing advertising to drive customer growth, educate customers about our omni-channel platform and to differentiate and elevate our brand.
As of November 30, 2022, we had used car stores located in 108 U.S. television markets, which covered approximately 86% of the U.S. population. The format and operating models utilized in our stores are continuously evaluated and may change or evolve over time based upon market and consumer expectations. During the first nine months of fiscal 2023, we opened five stores, and during the remainder of the fiscal year we plan to open an additional five stores.
While we execute both our short- and long-term strategy, there are trends and factors that could impact our strategic approach or our results in the short and medium term. For additional information about risks and uncertainties facing our company, see “Risk Factors,” included in Part I. Item 1A of the Annual Report on Form 10-K for the fiscal year ended February 28, 2022.
CRITICAL ACCOUNTING ESTIMATES
For information on critical accounting policies, see "Critical Accounting Estimates" in the MD&A included in Item 7 of the Annual Report on Form 10-K for the fiscal year ended February 28, 2022.
RESULTS OF OPERATIONS – CARMAX SALES OPERATIONS AND OTHER NON-REPORTABLE SEGMENTS
NET SALES AND OPERATING REVENUES
| | | | | | | | | | | | | | | | | | | | | | | | | | | | | | | | | | | |
| | Three Months Ended November 30 | | Nine Months Ended November 30 |
| (In millions) | 2022 | | 2021 | | Change | | 2022 | | 2021 | | Change |
| Used vehicle sales | $ | 5,204.6 | | | $ | 6,435.6 | | | (19.1) | % | | $ | 18,503.2 | | | $ | 18,697.3 | | | (1.0) | % |
| Wholesale vehicle sales | 1,152.2 | | | 1,922.3 | | | (40.1) | % | | 4,959.1 | | | 4,998.2 | | | (0.8) | % |
| Other sales and revenues: | | | | | | | | | | | |
| Extended protection plan revenues | 91.8 | | | 106.6 | | | (13.9) | % | | 318.1 | | | 353.8 | | | (10.1) | % |
| Third-party finance income/(fees), net | 1.0 | | | 1.6 | | | (38.2) | % | | 7.1 | | | (0.3) | | | 2,825.4 | % |
Advertising & subscription revenues (1) | 33.3 | | | 33.3 | | | (0.2) | % | | 101.9 | | | 67.9 | | | 50.2 | % |
| Other | 23.1 | | | 28.4 | | | (18.6) | % | | 73.1 | | | 96.8 | | | (24.4) | % |
| Total other sales and revenues | 149.2 | | | 169.9 | | | (12.2) | % | | 500.2 | | | 518.2 | | | (3.5) | % |
| Total net sales and operating revenues | $ | 6,506.0 | | | $ | 8,527.8 | | | (23.7) | % | | $ | 23,962.4 | | | $ | 24,213.7 | | | (1.0) | % |
(1) Excludes intersegment sales and operating revenues that have been eliminated in consolidation. See Note 17 for further details.
UNIT SALES
| | | | | | | | | | | | | | | | | | | | | | | | | | | | | | | | | | | |
| | Three Months Ended November 30 | | Nine Months Ended November 30 |
| | 2022 | | 2021 | | Change | | 2022 | | 2021 | | Change |
| Used vehicles | 180,050 | | | 227,424 | | | (20.8) | % | | 637,939 | | | 730,020 | | | (12.6) | % |
| Wholesale vehicles | 118,757 | | | 187,630 | | | (36.7) | % | | 464,741 | | | 557,117 | | | (16.6) | % |
AVERAGE SELLING PRICES
| | | | | | | | | | | | | | | | | | | | | | | | | | | | | | | | | | | |
| | Three Months Ended November 30 | | Nine Months Ended November 30 |
| | 2022 | | 2021 | | Change | | 2022 | | 2021 | | Change |
| Used vehicles | $ | 28,530 | | | $ | 27,995 | | | 1.9 | % | | $ | 28,692 | | | $ | 25,380 | | | 13.0 | % |
| Wholesale vehicles | $ | 9,294 | | | $ | 9,890 | | | (6.0) | % | | $ | 10,280 | | | $ | 8,634 | | | 19.1 | % |
COMPARABLE STORE USED VEHICLE SALES CHANGES
| | | | | | | | | | | | | | | | | | | | | | | |
| | Three Months Ended November 30 (1) | | Nine Months Ended November 30 (1) |
| | 2022 | | 2021 | | 2022 | | 2021 |
| Used vehicle units | (22.4) | % | | 15.8 | % | | (14.3) | % | | 32.5 | % |
| Used vehicle revenues | (21.0) | % | | 51.4 | % | | (3.2) | % | | 63.4 | % |
(1) Stores are added to the comparable store base beginning in their fourteenth full month of operation. We do not remove renovated stores from our comparable store base. Comparable store calculations include results for a set of stores that were included in our comparable store base in both the current and corresponding prior year periods.
VEHICLE SALES CHANGES
| | | | | | | | | | | | | | | | | | | | | | | |
| | Three Months Ended November 30 | | Nine Months Ended November 30 |
| | 2022 | | 2021 | | 2022 | | 2021 |
| Used vehicle units | (20.8) | % | | 16.9 | % | | (12.6) | % | | 33.5 | % |
| Used vehicle revenues | (19.1) | % | | 52.9 | % | | (1.0) | % | | 64.2 | % |
| | | | | | | |
| Wholesale vehicle units | (36.7) | % | | 48.5 | % | | (16.6) | % | | 72.7 | % |
| Wholesale vehicle revenues | (40.1) | % | | 132.1 | % | | (0.8) | % | | 151.1 | % |
USED VEHICLE FINANCING PENETRATION BY CHANNEL (BEFORE THE IMPACT OF 3-DAY PAYOFFS)
| | | | | | | | | | | | | | | | | | | | | | | |
| Three Months Ended November 30 (1) | | Nine Months Ended November 30 (1) |
| 2022 | | 2021 | | 2022 | | 2021 |
CAF (2) | 47.3 | % | | 46.1 | % | | 44.9 | % | | 46.6 | % |
Tier 2 (3) | 20.5 | % | | 22.2 | % | | 22.6 | % | | 22.2 | % |
Tier 3 (4) | 6.1 | % | | 6.5 | % | | 6.4 | % | | 8.0 | % |
Other (5) | 26.1 | % | | 25.2 | % | | 26.1 | % | | 23.2 | % |
| Total | 100.0 | % | | 100.0 | % | | 100.0 | % | | 100.0 | % |
(1) Calculated as used vehicle units financed for respective channel as a percentage of total used units sold.
(2) Includes CAF’s Tier 2 and Tier 3 loan originations, which represent approximately 1% of total used units sold.
(3) Third-party finance providers who generally pay us a fee or to whom no fee is paid.
(4) Third-party finance providers to whom we pay a fee.
(5) Represents customers arranging their own financing and customers that do not require financing.
CHANGE IN USED CAR STORE BASE
| | | | | | | | | | | | | | | | | | | | | | | |
| | Three Months Ended November 30 | | Nine Months Ended November 30 |
| | 2022 | | 2021 | | 2022 | | 2021 |
| Used car stores, beginning of period | 234 | | | 225 | | | 230 | | | 220 | |
| Store openings | 1 | | | 1 | | | 5 | | | 6 | |
| Used car stores, end of period | 235 | | | 226 | | | 235 | | | 226 | |
During the first nine months of fiscal 2023, we opened five stores, including our entry into the New York metro market (Edison, NJ; Stockton, CA; Wayne, NJ; East Meadow, NY; and Oceanside, CA).
Used Vehicle Sales. The 19.1% decrease in used vehicle revenues in the third quarter of fiscal 2023 was primarily driven by a 20.8% decrease in used unit sales, partially offset by a 1.9% increase in average retail selling price. The decrease in used units included a 22.4% decrease in comparable store used unit sales. For the first nine months of fiscal 2023, used vehicle revenues decreased 1.0%, driven by a 12.6% decrease in used unit sales, partially offset by a 13.0% increase in average selling price. The decrease in used units included a 14.3% decrease in comparable store used unit sales. Online retail sales, as defined previously, accounted for 12% and 11% of used unit sales for the third quarter and first nine months of fiscal 2023, respectively, compared with 9% for both the third quarter and first nine months of fiscal 2022.
During the third quarter and first nine months of fiscal 2023, we believe a number of macroeconomic factors impacted our used unit sales performance, including challenges to vehicle affordability that stem from broad inflation, rising interest rates and low consumer confidence. We believe our performance was also impacted by transitory competitive responses to the current environment as we saw competitors lower prices and margins to move inventory. Comparable store used unit sales declined sequentially during the quarter and December results were relatively consistent with the third quarter.
The increase in average retail selling price in both the third quarter and first nine months of fiscal 2023 reflected higher vehicle acquisition costs. This was partially offset by shifts in the mix of our sales by vehicle age during the third quarter. We expect average retail selling price to decrease in the fourth quarter of fiscal 2023.
Wholesale Vehicle Sales. Vehicles sold at our wholesale auctions are, on average, approximately 10 years old with more than 100,000 miles and are primarily comprised of vehicles purchased through our appraisal process that do not meet our retail standards. Our wholesale auction prices usually reflect trends in the general wholesale market for the types of vehicles we sell, although they can also be affected by changes in vehicle mix or the average age, mileage or condition of the vehicles being sold. During fiscal 2021, our wholesale auctions were moved to an online format and continue to operate completely online.
The 40.1% decrease in wholesale vehicle revenues in the third quarter of fiscal 2023 was primarily due to a 36.7% decrease in unit sales and a 6.0% decrease in average selling price. For the first nine months of fiscal 2023, wholesale vehicle revenues decreased 0.8%, driven by a 16.6% decrease in unit sales, partially offset by a 19.1% increase in average selling price. Wholesale volume was negatively impacted by our decision to shift some units from wholesale to retail to meet consumer demand for lower priced vehicles. Wholesale performance was also negatively impacted by rapidly changing market conditions, including depreciation of approximately $2,000 during the third quarter, which was incremental to depreciation of approximately $2,500 during the second quarter.
The decrease in average selling price during the third quarter of fiscal 2023 represents steep depreciation resulting from rapidly changing market conditions. The net increase in average selling price in the first nine months of fiscal 2023 was primarily due to increased acquisition costs resulting from strong industry valuations in the beginning of fiscal 2023, which continued from the prior fiscal year, offsetting recent depreciation.
Other Sales and Revenues. Other sales and revenues include revenue from the sale of ESPs and GAP (collectively reported in EPP revenues, net of a reserve for estimated contract cancellations), net third-party finance income/(fees), advertising and subscription revenues earned by our Edmunds business, and other revenues, which are predominantly comprised of service department sales. The fees we pay to the Tier 3 providers are reflected as an offset to finance fee revenues received from the Tier 2 providers. The mix of our retail vehicles financed by CAF, Tier 2 and Tier 3 providers, or customers that arrange their own financing, may vary from quarter to quarter depending on several factors, including the credit quality of applicants, changes in providers’ credit decisioning and external market conditions. Changes in originations by one tier of credit providers may also affect the originations made by providers in other tiers.
Other sales and revenues decreased 12.2% in the third quarter of fiscal 2023, reflecting the decline in EPP revenues. EPP revenues decreased 13.9%, largely reflecting the combined effects of the decline in our retail unit sales, increased margins, a favorable year-over-year return reserve adjustment and stable penetration.
Other sales and revenues decreased 3.5% in the first nine months of fiscal 2023, reflecting the decrease in EPP revenue and a decline in new vehicle sales, partially offset by the addition of Edmunds' revenue and an improvement in net third-party finance income. EPP revenues decreased 10.1%, reflecting the combined effects of the decline in our retail unit volume, stable penetration and increased margins. The decline in new car sales was driven by the divestiture of our remaining new car franchise in the third quarter of fiscal 2022. Net third-party finance income improved as a result of lower Tier 3 originations.
Seasonality. Historically, our business has been seasonal. Our stores typically experience their strongest traffic and sales in the spring and summer, with an increase in traffic and sales in February and March, coinciding with federal income tax refund season. Sales are typically slowest in the fall.
GROSS PROFIT
| | | | | | | | | | | | | | | | | | | | | | | | | | | | | | | | | | | |
| | Three Months Ended November 30 (1) | | Nine Months Ended November 30 (1) |
| (In millions) | 2022 | | 2021 | | Change | | 2022 | | 2021 | | Change |
| Used vehicle gross profit | $ | 402.8 | | | $ | 508.4 | | | (20.8) | % | | $ | 1,461.3 | | | $ | 1,611.9 | | | (9.3) | % |
| Wholesale vehicle gross profit | 114.7 | | | 212.2 | | | (46.0) | % | | 447.0 | | | 587.0 | | | (23.9) | % |
| Other gross profit | 59.2 | | | 116.0 | | | (49.0) | % | | 280.9 | | | 377.7 | | | (25.6) | % |
| Total | $ | 576.7 | | | $ | 836.6 | | | (31.1) | % | | $ | 2,189.2 | | | $ | 2,576.6 | | | (15.0) | % |
(1) Amounts are net of intercompany eliminations.
GROSS PROFIT PER UNIT
| | | | | | | | | | | | | | | | | | | | | | | | | | | | | | | | | | | | | | | | | | | | | | | |
| | Three Months Ended November 30 (1) | | Nine Months Ended November 30 (1) |
| | 2022 | | 2021 | | 2022 | | 2021 |
| | $ per unit(2) | | %(3) | | $ per unit(2) | | %(3) | | $ per unit(2) | | %(3) | | $ per unit(2) | | %(3) |
| Used vehicle gross profit | $ | 2,237 | | | 7.7 | | | $ | 2,235 | | | 7.9 | | | $ | 2,291 | | | 7.9 | | | $ | 2,208 | | | 8.6 | |
| Wholesale vehicle gross profit | $ | 966 | | | 10.0 | | | $ | 1,131 | | | 11.0 | | | $ | 962 | | | 9.0 | | | $ | 1,054 | | | 11.7 | |
| Other gross profit | $ | 329 | | | 39.7 | | | $ | 510 | | | 68.3 | | | $ | 440 | | | 56.2 | | | $ | 517 | | | 72.9 | |
(1) Amounts are net of intercompany eliminations. Those eliminations had the effect of increasing used vehicle gross profit per unit and wholesale vehicle gross profit per unit and decreasing other gross profit per unit by immaterial amounts.
(2) Calculated as category gross profit divided by its respective units sold, except the other category, which is divided by total used units sold.
(3) Calculated as a percentage of its respective sales or revenue.
Used Vehicle Gross Profit. We target a dollar range of gross profit per used unit sold. The gross profit dollar target for an individual vehicle is based on a variety of factors, including its probability of sale and its mileage relative to its age; however, it is not primarily based on the vehicle’s selling price. Our ability to quickly adjust appraisal offers to be consistent with the broader market trade-in trends and the pace of our inventory turns reduce our exposure to the inherent continual fluctuation in used vehicle values and contribute to our ability to manage gross profit dollars per unit. Gross profit per used unit is consistent across our omni-channel platform.
We systematically adjust individual vehicle prices based on proprietary pricing algorithms in order to appropriately balance sales trends, inventory turns and gross profit achievement. Other factors that may influence gross profit include the wholesale and retail vehicle pricing environments, vehicle reconditioning and logistics costs, and the percentage of vehicles sourced directly from consumers through our appraisal process. Vehicles purchased directly from consumers generally have a lower cost per unit compared with vehicles purchased at auction or through other channels, which may generate more gross profit per unit. In any given period, our gross profit may also be impacted by the age mix of vehicles sold, as older vehicles are generally more profitable. We monitor macroeconomic factors and pricing elasticity and adjust our pricing accordingly to optimize unit sales and profitability while also maintaining a competitively priced inventory.
Used vehicle gross profit decreased 20.8% in the third quarter of fiscal 2023, driven by the 20.8% decrease in total used unit sales, while used vehicle gross profit per unit remained consistent with the prior year quarter. Used vehicle gross profit decreased 9.3% in the first nine months of fiscal 2023, driven by the 12.6% decrease in total used unit sales, partially offset by the $83 increase in used vehicle gross profit per unit. We continue to focus on striking the right balance between covering cost increases, maintaining margin and passing along efficiencies to consumers to support vehicle affordability.
Wholesale Vehicle Gross Profit. Our wholesale gross profit per unit reflects the demand for older, higher mileage vehicles, which are the mainstay of our auctions, as well as strong dealer attendance and resulting high dealer-to-car ratios at our auctions. The frequency of our auctions, which are generally held weekly or bi-weekly, minimizes the depreciation risk on these vehicles. Our ability to adjust appraisal offers in response to the wholesale pricing environment is a key factor that influences wholesale gross profit.
Wholesale vehicle gross profit decreased 46.0% in the third quarter of fiscal 2023, primarily driven by the 36.7% decrease in wholesale unit sales as well as the $165 decrease in wholesale vehicle gross profit per unit. Wholesale vehicle gross profit decreased 23.9% in the first nine months of fiscal 2023, primarily driven by the 16.6% decrease in wholesale unit sales as well as the $92 decrease in wholesale vehicle gross profit per unit. Our decision to source a higher mix of older vehicles for retail sale also impacted wholesale vehicle gross profit per unit. When those vehicles cannot be reconditioned to our standards for consumer sales, we shift them to wholesale, which often sell at lower margins. Wholesale gross profit per unit was also impacted by steep market depreciation, which began in the prior quarter and continued through the third quarter.
Other Gross Profit. Other gross profit includes profits related to EPP revenues, net third-party finance income/(fees), advertising and subscription profits earned by our Edmunds business, and other revenues. Other revenues are predominantly comprised of service department operations, including used vehicle reconditioning. We have no cost of sales related to EPP revenues or net third-party finance income/(fees), as these represent revenues paid to us by certain third-party providers. Third-party finance income is reported net of the fees we pay to third-party Tier 3 finance providers. Accordingly, changes in the relative mix of the components of other gross profit can affect the composition and amount of other gross profit.
Other gross profit decreased 49.0% in the third quarter of fiscal 2023, primarily driven by a $37.3 million decline in service department margins as well as a decrease in EPP revenues, as discussed above. The decline in service department profits was driven by deleverage resulting from lower retail unit sales as well as our decision to maintain technician staffing.
Other gross profit decreased 25.6% in the first nine months of fiscal 2023, primarily driven by an $80.7 million decline in service department margins as well as a decrease in EPP revenues, as discussed above, partially offset by the inclusion of nine months of Edmunds' margin in fiscal 2023 compared with six months of Edmunds' margin in fiscal 2022. The decline in service department profits was driven by deleverage resulting from lower retail unit sales, inflationary pressure and our decision to maintain technician staffing.
SG&A Expenses
COMPONENTS OF SG&A EXPENSES AS A PERCENTAGE OF TOTAL SG&A EXPENSES
Three Months Ended November 30, 2022 Nine Months Ended November 30, 2022
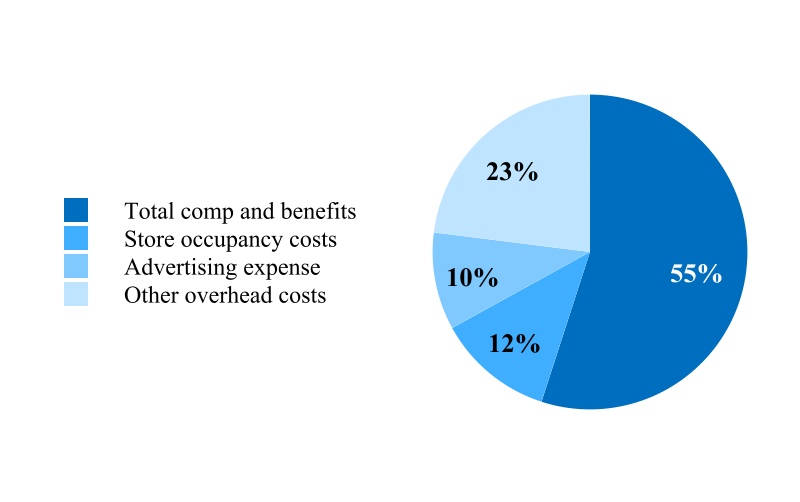
 COMPONENTS OF SG&A EXPENSES COMPARED WITH PRIOR PERIOD (1)
 | | | | | | | | | | | | | | | | | | | | | | | | | | | | | | | | | | | |
| | Three Months Ended November 30 | | Nine Months Ended November 30 |
| (In millions except per unit data) | 2022 | | 2021 | | Change | | 2022 | | 2021 | | Change |
| Compensation and benefits: | | | | | | | | | | | |
| Compensation and benefits, excluding share-based compensation expense | $ | 306.2 | | | $ | 308.3 | | | (0.7) | % | | $ | 985.2 | | | $ | 891.8 | | | 10.5 | % |
| Share-based compensation expense | 17.2 | | | 33.3 | | | (48.4) | % | | 64.0 | | | 100.5 | | | (36.3) | % |
Total compensation and benefits (2) | $ | 323.4 | | | $ | 341.6 | | | (5.3) | % | | $ | 1,049.2 | | | $ | 992.3 | | | 5.7 | % |
| Occupancy costs | 70.1 | | | 59.3 | | | 18.2 | % | | 204.8 | | | 165.0 | | | 24.2 | % |
| Advertising expense | 58.7 | | | 76.1 | | | (22.9) | % | | 230.5 | | | 233.6 | | | (1.3) | % |
Other overhead costs (3) | 139.5 | | | 98.9 | | | 41.0 | % | | 430.0 | | | 313.4 | | | 37.2 | % |
| Total SG&A expenses | $ | 591.7 | | | $ | 575.9 | | | 2.7 | % | | $ | 1,914.5 | | | $ | 1,704.3 | | | 12.3 | % |
| SG&A as % of gross profit | 102.6 | % | | 68.8 | % | | 33.8 | % | | 87.5 | % | | 66.1 | % | | 21.4 | % |
(1) Amounts are net of intercompany eliminations.
(2) Excludes compensation and benefits related to reconditioning and vehicle repair service, which are included in cost of sales. See Note 11 for details of share-based compensation expense by grant type.
(3) Includes IT expenses, non-CAF bad debt, preopening and relocation costs, insurance, charitable contributions, travel and other administrative expenses.
SG&A expenses increased 2.7% in the third quarter of fiscal 2023. Factors contributing to the net increase include the following:
•$40.6 million increase in other overhead costs, which included a $22.6 million one-time benefit in the prior year quarter related to the receipt of settlement proceeds in a class action lawsuit. The remaining increase was driven by investments to advance our technology platforms and support our strategic and growth initiatives.
•$10.8 million increase in store occupancy costs driven by the 4.4% increase in our store base since the beginning of last year's third quarter as well as other growth- and capacity-related costs.
•$17.4 million decrease in advertising expense driven by our deliberate efforts to reduce marketing spend to align with sales.
•$16.1 million decrease in stock-based compensation expense, primarily related to cash-settled restricted stock units, as the expense associated with these units was primarily driven by the change in the company's stock price during the relevant periods.
Adjusting for the settlement proceeds of $22.6 million received in the prior year quarter, as discussed above, SG&A expenses would have declined 1.1% versus the prior year quarter. Similarly, we expect SG&A expenses in the fourth quarter of fiscal 2023 to decrease from the prior year quarter.
SG&A expenses increased 12.3% in the first nine months of fiscal 2023. Factors contributing to the net increase include the following:
•$116.6 million increase in other overhead costs, driven by investments to advance our technology platforms and support our strategic and growth initiatives. The increase also included a $22.6 million one-time benefit in the prior year related to the receipt of settlement proceeds in a class action lawsuit. Other overhead costs were also negatively impacted by a year-over-year increase in non-CAF uncollectible receivables. This increase reflects several factors including, but not limited to, ongoing DMV processing delays, costs associated with our Love Your Car Guarantee program and field execution opportunities stemming from the dynamic operating environment.
•$93.4 million increase in compensation and benefits expense, excluding share-based compensation expense, driven by increased staffing and wage pressures as well as the inclusion of Edmunds for nine months in the current year compared to six months in the prior year, partially offset by a $14.4 million decrease in bonus compensation expense.
•$39.8 million increase in store occupancy costs driven by the 6.8% increase in our store base since the beginning of the last fiscal year as well as other growth- and capacity-related costs.
•$36.5 million decrease in stock-based compensation expense, primarily related to cash-settled restricted stock units, as the expense associated with these units was primarily driven by the change in the company's stock price during the relevant periods.
Interest Expense. Interest expense includes the interest related to short- and long-term debt, financing obligations and finance lease obligations. It does not include interest on the non-recourse notes payable, which is reflected within CAF income.
Interest expense increased to $30.2 million and $91.7 million in the third quarter and first nine months of fiscal 2023, respectively, compared with $24.3 million and $67.2 million in the third quarter and first nine months of fiscal 2022, respectively. The increase for the quarter primarily reflected higher interest rates. The increase for the nine month period primarily reflected higher outstanding debt balances in the current fiscal year, including the $700 million term loan issued in October 2021, as well as higher interest rates.
Other Income. Other income was $0.4 million and $2.3 million in the third quarter and first nine months of fiscal 2023, respectively, compared with $8.1 million and $35.5 million in the third quarter and first nine months of fiscal 2022, respectively. The decrease for the quarter was primarily due to a gain recorded from the sale of our last new car franchise during the prior year quarter. The decrease for the nine month period was primarily due to net gains on an equity investment recorded during fiscal 2022.
Income Taxes. The effective income tax rate was 24.8% in the third quarter of fiscal 2023 and 25.0% in the first nine months of fiscal 2023 versus 24.3% in the third quarter of fiscal 2022 and 23.2% in the first nine months of fiscal 2022. The increase in the effective income tax rate for the nine month period was primarily driven by the difference in excess tax benefit related to settlements of share-based awards.
RESULTS OF OPERATIONS – CARMAX AUTO FINANCE
CAF income primarily reflects interest and fee income generated by CAF’s portfolio of auto loans receivable less the interest expense associated with the debt issued to fund these receivables, a provision for estimated loan losses and direct CAF expenses. Total interest margin reflects the spread between interest and fees charged to consumers and our funding costs. Changes in the interest margin on new originations affect CAF income over time. Increases in interest rates, which affect CAF’s funding costs, or other competitive pressures on consumer rates, could result in compression in the interest margin on new originations. Changes in the allowance for loan losses as a percentage of ending managed receivables reflect the effect of changes in loss and delinquency experience and economic factors on our outlook for net losses expected to occur over the remaining contractual life of the loans receivable.
CAF’s managed portfolio is composed primarily of loans originated over the past several years. Trends in receivable growth and interest margins primarily reflect the cumulative effect of changes in the business over a multi-year period. Historically, we have sought to originate loans in our core portfolio, which excludes Tier 2 and Tier 3 origination, with an underlying risk profile that we believe will, in the aggregate result in cumulative net losses in the 2% to 2.5% range (excluding CECL-required recovery costs) over the life of the loans. Actual loss performance of the loans may fall outside of this range based on various factors, including intentional changes in the risk profile of originations, economic conditions (including the effects of COVID-19) and wholesale recovery rates. Current period originations reflect current trends in both our retail sales and the CAF business, including the volume of loans originated, current interest rates charged to consumers, loan terms and average credit scores. Loans originated in a given fiscal period impact CAF income over time, as we recognize income over the life of the underlying auto loan.
CAF also originates a small portion of auto loans to customers who typically would be financed by our Tier 3 finance providers, in order to better understand the performance of these loans, mitigate risk and add incremental profits. Historically, CAF targeted originating approximately 5% of the total Tier 3 loan volume. During the first quarter of fiscal 2022, we increased our Tier 3 loan volume beyond our target of 5% of total Tier 3 loan volume to 10% by the end of the first quarter of fiscal 2022. Additionally, in the second quarter of fiscal 2022, CAF began to originate loans in the Tier 2 space on a test basis. Any future adjustments in Tier 2 and Tier 3 will consider the broader lending environment along with the long-term sustainability of the change. These loans have higher loss and delinquency rates than the remainder of the CAF portfolio, as well as higher contract rates.
CAF income does not include any allocation of indirect costs. Although CAF benefits from certain indirect overhead expenditures, we have not allocated indirect costs to CAF to avoid making subjective allocation decisions. Examples of indirect costs not allocated to CAF include retail store expenses and corporate expenses.
See Note 4 for additional information on CAF income and Note 5 for information on auto loans receivable, including credit quality.
SELECTED CAF FINANCIAL INFORMATION
| | | | | | | | | | | | | | | | | | | | | | | | | | | | | | | | | | | | | | | | | | | | | | | |
| | Three Months Ended November 30 | | Nine Months Ended November 30 |
| (In millions) | 2022 | | % (1) | | 2021 | | % (1) | | 2022 | | % (1) | | 2021 | | % (1) |
| Interest margin: | | | | | | | | | | | | | | | |
| Interest and fee income | $ | 365.4 | | | 8.8 | | | $ | 330.0 | | | 8.6 | | | $ | 1,069.3 | | | 8.8 | | | $ | 964.4 | | | 8.7 | |
| Interest expense | (88.8) | | | (2.1) | | | (53.6) | | | (1.4) | | | (200.1) | | | (1.6) | | | (180.0) | | | (1.6) | |
| Total interest margin | $ | 276.6 | | | 6.7 | | | $ | 276.4 | | | 7.2 | | | $ | 869.2 | | | 7.2 | | | $ | 784.4 | | | 7.1 | |
| Provision for loan losses | $ | (85.7) | | | (2.1) | | | $ | (76.2) | | | (2.0) | | | $ | (219.0) | | | (1.8) | | | $ | (87.3) | | | (0.8) | |
| CarMax Auto Finance income | $ | 152.2 | | | 3.7 | | | $ | 166.0 | | | 4.3 | | | $ | 539.5 | | | 4.4 | | | $ | 607.7 | | | 5.5 | |
(1) Annualized percentage of total average managed receivables.
CAF ORIGINATION INFORMATION (AFTER THE IMPACT OF 3-DAY PAYOFFS)
| | | | | | | | | | | | | | | | | | | | | | | |
| | Three Months Ended November 30 | | Nine Months Ended November 30 |
| | 2022 | | 2021 | | 2022 | | 2021 |
Net loans originated (in millions) | $ | 2,147.2 | | | $ | 2,420.3 | | | $ | 6,928.0 | | | $ | 7,276.1 | |
| Vehicle units financed | 79,967 | | | 95,997 | | | 264,073 | | | 314,031 | |
Net penetration rate (1) | 44.4 | % | | 42.2 | % | | 41.4 | % | | 43.0 | % |
| Weighted average contract rate | 9.8 | % | | 8.3 | % | | 9.4 | % | | 8.6 | % |
Weighted average credit score (2) | 712 | | | 706 | | | 708 | | | 702 | |
Weighted average loan-to-value (LTV) (3) | 88.9 | % | | 88.0 | % | | 88.1 | % | | 89.2 | % |
Weighted average term (in months) | 66.1 | | | 66.0 | | | 66.3 | | | 66.5 | |
(1) Vehicle units financed as a percentage of total used units sold.
(2) The credit scores represent FICO® scores and reflect only receivables with obligors that have a FICO® score at the time of application. The FICO® score with respect to any receivable with co-obligors is calculated as the average of each obligor’s FICO® score at the time of application. FICO® scores are not a significant factor in our primary scoring model, which relies on information from credit bureaus and other application information as discussed in Note 5. FICO® is a federally registered servicemark of Fair Isaac Corporation.
(3) LTV represents the ratio of the amount financed to the total collateral value, which is measured as the vehicle selling price plus applicable taxes, title and fees.
LOAN PERFORMANCE INFORMATION
| | | | | | | | | | | | | | | | | | | | | | | |
| | As of and for the Three Months Ended November 30 | | As of and for the Nine Months Ended November 30 |
| (In millions) | 2022 | | 2021 | | 2022 | | 2021 |
| Total ending managed receivables | $ | 16,652.7 | | | $ | 15,524.0 | | | $ | 16,652.7 | | | $ | 15,524.0 | |
| Total average managed receivables | $ | 16,540.2 | | | $ | 15,288.8 | | | $ | 16,177.8 | | | $ | 14,706.9 | |
| Allowance for loan losses | $ | 491.0 | | | $ | 426.5 | | | $ | 491.0 | | | $ | 426.5 | |
| Allowance for loan losses as a percentage of ending managed receivables | 2.95 | % | | 2.75 | % | | 2.95 | % | | 2.75 | % |
| Net credit losses on managed receivables | $ | 72.2 | | | $ | 47.8 | | | $ | 161.0 | | | $ | 71.9 | |
| Annualized net credit losses as a percentage of total average managed receivables | 1.74 | % | | 1.25 | % | | 1.33 | % | | 0.65 | % |
| Past due accounts as a percentage of ending managed receivables | 4.99 | % | | 3.83 | % | | 4.99 | % | | 3.83 | % |
Average recovery rate (1) | 61.3 | % | | 71.9 | % | | 66.7 | % | | 67.3 | % |
(1) The average recovery rate represents the average percentage of the outstanding principal balance we receive when a vehicle is repossessed and liquidated, generally at our wholesale auctions. While in any individual period conditions may vary, over the past 10 fiscal years, the annual recovery rate has ranged from a low of 46% to a high of 71%, and it is primarily affected by the wholesale market environment.
•CAF Income (Decrease of $13.8 million, or 8.3%, and decrease of $68.2 million, or 11.2%, in the third quarter and first nine months of fiscal 2023, respectively)
◦The decrease in CAF income for the third quarter of fiscal 2023 reflects a decrease in the net interest margin percentage and an increase in the provision for loan losses, as discussed below, partially offset by an increase in average managed receivables.
◦The decrease in CAF income for the first nine months of fiscal 2023 reflects a year-over-year swing in the provision for loan losses, as discussed below, partially offset by an increase in average managed receivables.
•Provision for Loan Losses
◦The provision for loan losses resulted in expense of $85.7 million and $219.0 million in the third quarter and first nine months of fiscal 2023, respectively, compared with expense of $76.2 million and $87.3 million in the third quarter and first nine months of fiscal 2022, respectively.
◦The increase in the provision for both the third quarter and nine month period was primarily the result of the previously disclosed expansion of Tier 2 and Tier 3 originations within CAF’s portfolio. The nine month period was also impacted by a reduced provision coming out of the pandemic in the prior year period.
◦The allowance for loan losses as a percentage of ending managed receivables was 2.95% as of November 30, 2022, compared with 2.75% as of November 30, 2021 and 2.77% as of February 28, 2022. The increase in the allowance percentage from February primarily reflected the effect of the previously disclosed expansion of Tier 2 and Tier 3 originations within CAF’s portfolio.
•Total Interest Margin (Decreased to 6.7% and increased to 7.2% in the third quarter and first nine months of fiscal 2023, respectively, from 7.2% and 7.1% in the third quarter and first nine months of fiscal 2022)
◦The decrease in the total interest margin percentage for the third quarter was primarily driven by higher funding costs, partially offset by higher customer rates.
◦The increase in the total interest margin percentage for the first nine months of fiscal 2023 was primarily the result of higher interest and fees from consumers, partially offset by higher funding costs, as well as a $20.4 million benefit related to swaps not designated as hedges for accounting purposes.
•Loan Origination and Performance
◦The decrease in net loan originations in the third quarter of fiscal 2023 resulted from a decrease in used unit sales, partially offset by an increase in the average amount financed and an increase in the net penetration rate.
◦The decrease in net loan originations in the first nine months of fiscal 2023 resulted from a decrease in used unit sales and the net penetration rate, partially offset by an increase in the average amount financed.
◦CAF net penetration increased in the third quarter and declined in the first nine months of fiscal 2023 compared to the prior year periods, largely reflecting shifts in the mix of customers utilizing outside financing.
◦The weighted average contract rate increased to 9.8% in the third quarter of fiscal 2023, compared with 8.3% in the prior year quarter. The weighted average contract rate increased to 9.4% in the first nine months of fiscal 2023, compared with 8.6% in the prior year period. The increases for both periods were primarily due to higher rates charged to customers in response to the current interest rate environment.
◦The year-over-year increase in past due accounts as a percentage of ending managed receivables in the third quarter and first nine months of fiscal 2023 reflects an increase in delinquencies as well as our previously disclosed expansion of Tier 2 and Tier 3 originations within CAF's portfolio. The increase in delinquencies primarily reflects customer hardship in the current economic environment.
PLANNED FUTURE ACTIVITIES
We anticipate opening a total of ten stores in fiscal 2023. During fiscal 2023, we entered the New York City metro market by opening three stores. We anticipate opening two more stores in this market in the next fiscal year. For fiscal 2024, we have slowed our planned store growth to five stores while maintaining the ability to open more locations if market conditions change. We currently estimate capital expenditures will total approximately $450 million in fiscal 2023, an increase from $308.5 million in fiscal 2022. The increase in planned capital spending in fiscal 2023 largely reflects long-term growth capacity initiatives for our auction, sales and production facilities in addition to continued investments in technology. We expect approximately 25% of our capital expenditures in fiscal 2023 will be focused on investments in technology.
FINANCIAL CONDITION
Liquidity and Capital Resources
Our primary ongoing cash requirements are to fund our existing operations, store expansion and improvement, CAF and strategic growth initiatives. Since fiscal 2013, we have also elected to use cash for our share repurchase program. Our primary ongoing sources of liquidity include funds provided by operations, proceeds from non-recourse funding vehicles and borrowings under our revolving credit facility or through other financing sources.
Our current capital allocation strategy is to focus on our core business. Given our recent performance and continued market uncertainties, we are taking a conservative approach to our capital structure in order to maintain the flexibility that allows us to efficiently access the capital markets for both CAF and CarMax as a whole. We have taken steps to better align our expenses to sales, as well as paused our share repurchases and slowed the rate of our store growth and capital expenditures. We believe we have the appropriate liquidity, access to capital and financial strength to support our operations and continue investing in our strategic initiatives for the foreseeable future.
We currently target an adjusted debt-to-total capital ratio in a range of 35% to 45%. Our adjusted debt to capital ratio, net of cash on hand, was below our targeted range for the third quarter of fiscal 2023. In calculating this ratio, we utilize total debt excluding non-recourse notes payable, finance lease liabilities, a multiple of eight times rent expense and total shareholders’ equity. Generally, we expect to use our revolving credit facility and other financing sources, together with stock repurchases, to
maintain this targeted ratio; however, in any period, we may be outside this range due to seasonal, market, strategic or other factors.
Operating Activities. During the first nine months of fiscal 2023, net cash provided by operating activities totaled $1.66 billion, compared with cash used in operating activities of $2.08 billion in the prior year period. Our operating cash flows are significantly impacted by changes in auto loans receivable, which increased $1.17 billion in the current year period compared with $1.76 billion in the prior year period.
The majority of the changes in auto loans receivable are accompanied by changes in non-recourse notes payable, which are issued to fund auto loans originated by CAF. Net issuances of non-recourse notes payable were $770.6 million in the current year period compared with $1.65 billion in the prior year period and are separately reflected as cash from financing activities. Due to the presentation differences between auto loans receivable and non-recourse notes payable on the consolidated statements of cash flows, fluctuations in these amounts can have a significant impact on our operating and financing cash flows without affecting our overall liquidity, working capital or cash flows.
As of November 30, 2022, total inventory was $3.41 billion, representing a decrease of $1.71 billion compared with the balance as of the start of the fiscal year. The decrease was primarily due to a decrease in vehicle units reflecting lower sales volume and the seasonal pattern in inventory levels.
The change in net cash provided by (used in) operating activities for the first nine months of the current fiscal year compared with the prior year period reflected the changes in inventory and auto loans receivable, as discussed above, as well as the net impact of volume and timing-related changes in accounts receivable and accounts payable, partially offset by a decrease in net earnings when excluding non-cash expenses, which include depreciation and amortization, share-based compensation expense and the provisions for loan losses and cancellation reserves.
Investing Activities. During the first nine months of fiscal 2023, net cash used in investing activities totaled $318.7 million compared with $432.7 million in fiscal 2022. Capital expenditures were $319.5 million in the current year period versus $226.9 million in the prior year period. Capital expenditures primarily included store construction costs as well as investments in growth capacity initiatives and technology. We maintain a multi-year pipeline of sites to support our store growth, so portions of capital spending in one year may relate to stores that we open in subsequent fiscal years.
As of November 30, 2022, 153 of our 235 used car stores were located on owned sites and 82 were located on leased sites, including 26 land-only leases and 56 land and building leases.
Financing Activities. During the first nine months of fiscal 2023, net cash used in financing activities totaled $827.0 million compared with net cash provided by financing activities of $2.51 billion in the prior year period. Included in these amounts were net issuances of non-recourse notes payable of $770.6 million compared with $1.65 billion in the prior year period. Non-recourse notes payable are typically used to fund changes in auto loans receivable (see “Operating Activities”).
During the first nine months of fiscal 2023, cash used in financing activities was impacted by stock repurchases of $333.8 million as well as net payments on our long-term debt of $1.25 billion. During the first nine months of fiscal 2022, cash provided by financing activities was impacted by stock repurchases of $476.0 million as well as net proceeds on our long-term debt of $1.28 billion.
TOTAL DEBT AND CASH AND CASH EQUIVALENTS
| | | | | | | | | | | |
| (In thousands) | | As of November 30 | As of February 28 |
Debt Description (1) | Maturity Date | 2022 | 2022 |
Revolving credit facility (2) | June 2024 | $ | — | | $ | 1,243,500 | |
Term loan (2) | June 2024 | 300,000 | | 300,000 | |
Term loan (2) | October 2026 | 699,458 | | 699,352 | |
| 3.86% Senior notes | April 2023 | 100,000 | | 100,000 | |
| 4.17% Senior notes | April 2026 | 200,000 | | 200,000 | |
| 4.27% Senior notes | April 2028 | 200,000 | | 200,000 | |
| Financing obligations | Various dates through February 2059 | 517,349 | | 524,766 | |
| Non-recourse notes payable | Various dates through April 2029 | 16,237,419 | | 15,466,799 | |
Total debt (3) | | $ | 18,254,226 | | $ | 18,734,417 | |
| Cash and cash equivalents | | $ | 688,618 | | $ | 102,716 | |
(1) Interest is payable monthly, with the exception of our senior notes, which are payable semi-annually.
(2) Borrowings accrue interest at variable rates based on the Eurodollar rate (LIBOR), or successor benchmark rate, the federal funds rate, or the prime rate, depending on the type of borrowing.
(3) Total debt excludes unamortized debt issuance costs. See Note 10 for additional information.
Borrowings under our $2.00 billion unsecured revolving credit facility are available for working capital and general corporate purposes, and the unused portion is fully available to us. The credit facility, term loans and senior note agreements contain representations and warranties, conditions and covenants. If these requirements are not met, all amounts outstanding or otherwise owed could become due and payable immediately and other limitations could be placed on our ability to use any available borrowing capacity. As of November 30, 2022, we were in compliance with these financial covenants.
See Note 10 for additional information on our revolving credit facility, term loans, senior notes and financing obligations.
CAF auto loans receivable are primarily funded through our warehouse facilities and asset-backed term funding transactions. These non-recourse funding vehicles are structured to legally isolate the auto loans receivable, and we would not expect to be able to access the assets of our non-recourse funding vehicles, even in insolvency, receivership or conservatorship proceedings. Similarly, the investors in the non-recourse notes payable have no recourse to our assets beyond the related receivables, the amounts on deposit in reserve accounts and the restricted cash from collections on auto loans receivable. We do, however, continue to have the rights associated with the interest we retain in these non-recourse funding vehicles.
As of November 30, 2022, $12.82 billion and $3.42 billion of non-recourse notes payable were outstanding related to asset-backed term funding transactions and our warehouse facilities, respectively. During the first nine months of fiscal 2023, we funded a total of $4.54 billion in asset-backed term funding transactions. As of November 30, 2022, we had $1.98 billion of unused capacity in our warehouse facilities.
We have periodically increased our warehouse facility limit over time, as our store base, sales and CAF loan originations have grown. See Note 10 for additional information on the warehouse facilities.
We generally repurchase the receivables funded through our warehouse facilities when we enter into an asset-backed term funding transaction. If our counterparties were to refuse to permit these repurchases it could impact our ability to execute on our funding program. Additionally, the agreements related to the warehouse facilities include various representations and warranties, covenants and performance triggers. If these requirements are not met, we could be unable to continue to fund receivables through the warehouse facilities. In addition, warehouse facility investors could charge us a higher rate of interest and could have us replaced as servicer. Further, we could be required to deposit collections on the related receivables with the warehouse facility agents on a daily basis and deliver executed lockbox agreements to the warehouse facility agents.
The timing and amount of stock repurchases are determined based on stock price, market conditions, legal requirements and other factors. Shares repurchased are deemed authorized but unissued shares of common stock. In April 2022, our board of directors increased our share repurchase authorization by $2 billion. As of November 30, 2022, a total of $4 billion of board authorizations for repurchases was outstanding, with no expiration date, of which $2.45 billion remained available for repurchase. We paused the repurchase of our common stock during the third quarter of fiscal 2023 but may resume share
repurchases at any time in the future depending on market conditions and our capital needs, among other factors. See Note 11 for more information on share repurchase activity.
Fair Value Measurements
We recognize money market securities, mutual fund investments, certain equity investments and derivative instruments at fair value. See Note 7 for more information on fair value measurements.
FORWARD-LOOKING STATEMENTS
We caution readers that the statements contained in this report that are not statements of historical fact, including statements about our future business plans, operations, capital structure, opportunities, or prospects, including without limitation any statements or factors regarding expected operating capacity, sales, inventory, market share, online purchases of vehicles from consumers, gross profit per used unit, revenue, margins, expenditures, liquidity, loan originations, CAF income, stock repurchases, indebtedness, earnings, market conditions or expectations with regards to the continued impact of the COVID-19 pandemic, are forward-looking statements made pursuant to the safe harbor provisions of the Private Securities Litigation Reform Act of 1995. You can identify these forward-looking statements by the use of words such as “anticipate,” “believe,” “could,” “estimate,” “expect,” “intend,” “may,” “outlook,” “plan,” “positioned,” “predict,” “target,” “should,” “will” and other similar expressions, whether in the negative or affirmative. Such forward-looking statements are based upon management’s current knowledge, expectations and assumptions and involve risks and uncertainties and assumptions about future events and involve risks and uncertainties that could cause actual results to differ materially from anticipated results. We disclaim any intent or obligation to update these statements. Among the factors that could cause actual results and outcomes to differ materially from those contained in the forward-looking statements are the following:
•The effect and consequences of the Coronavirus public health crisis on matters including U.S. and local economies; our business operations and continuity; the availability of corporate and consumer financing; the health and productivity of our associates; the ability of third-party providers to continue uninterrupted service; and the regulatory environment in which we operate.
•Changes in general or regional U.S. economic conditions, including inflationary pressures, climbing interest rates and the potential impact of Russia's invasion of Ukraine.
•Changes in the availability or cost of capital and working capital financing, including changes related to the asset-backed securitization market.
•Changes in the competitive landscape and/or our failure to successfully adjust to such changes.
•Events that damage our reputation or harm the perception of the quality of our brand.
•Our inability to realize the benefits associated with our omni-channel initiatives and strategic investments.
•Our inability to recruit, develop and retain associates and maintain positive associate relations.
•The loss of key associates from our store, regional or corporate management teams or a significant increase in labor costs.
•Security breaches or other events that result in the misappropriation, loss or other unauthorized disclosure of confidential customer, associate or corporate information.
•Significant changes in prices of new and used vehicles.
•Changes in economic conditions or other factors that result in greater credit losses for CAF’s portfolio of auto loans receivable than anticipated.
•A reduction in the availability of or access to sources of inventory or a failure to expeditiously liquidate inventory.
•Changes in consumer credit availability provided by our third-party finance providers.
•Changes in the availability of extended protection plan products from third-party providers.
•Factors related to the regulatory and legislative environment in which we operate.
•Factors related to geographic and sales growth, including the inability to effectively manage our growth.
•The failure of or inability to sufficiently enhance key information systems.
•The performance of the third-party vendors we rely on for key components of our business.
•The effect of various litigation matters.
•Adverse conditions affecting one or more automotive manufacturers, and manufacturer recalls.
•The failure or inability to realize the benefits associated with our strategic transactions.
•The inaccuracy of estimates and assumptions used in the preparation of our financial statements, or the effect of new accounting requirements or changes to U.S. generally accepted accounting principles.
•The volatility in the market price for our common stock.
•The failure or inability to adequately protect our intellectual property.
•The occurrence of severe weather events.
•Factors related to the geographic concentration of our stores.
For more details on factors that could affect expectations, see Part II, Item 1A, “Risk Factors” on Page 49 of this report, our Annual Report on Form 10-K for the fiscal year ended February 28, 2022, and our quarterly or current reports as filed with or furnished to the U.S. Securities and Exchange Commission (“SEC”). Our filings are publicly available on our investor information home page at investors.carmax.com. Requests for information may also be made to our Investor Relations Department by email to investor_relations@carmax.com or by calling 1-804-747-0422, ext. 7865. We undertake no obligation to update or revise any forward-looking statements after the date they are made, whether as a result of new information, future events or otherwise.
Item 3. Quantitative and Qualitative Disclosures about Market Risk
There have been no material changes to our market risk since February 28, 2022. For information on our exposure to market risk, refer to Part II, Item 7A, “Quantitative and Qualitative Disclosures about Market Risk,” contained in our Annual Report on Form 10-K for the fiscal year ended February 28, 2022.
Item 4. Controls and Procedures
Disclosure. We maintain disclosure controls and procedures (as defined in Rule 13a-15(e) under the Securities Exchange Act of 1934 (“Exchange Act”)) that are designed to ensure that information required to be disclosed in our reports filed under the Exchange Act is recorded, processed, summarized and reported within the time periods specified in the SEC’s rules and forms. Our disclosure controls and procedures are also designed to ensure that this information is accumulated and communicated to management, including the chief executive officer (“CEO”) and the chief financial officer (“CFO”), as appropriate to allow timely decisions regarding required disclosure.
As of the end of the period covered by this report, with the participation of the CEO and CFO, we evaluated the effectiveness of our disclosure controls and procedures. Based upon that evaluation, the CEO and CFO concluded that our disclosure controls and procedures were effective as of the end of the period.
Internal Control over Financial Reporting. There was no change in our internal control over financial reporting (as defined in Rule 13a-15(f) under the Exchange Act) that occurred during the quarter ended November 30, 2022, that has materially affected, or is reasonably likely to materially affect, our internal control over financial reporting.
PART II. OTHER INFORMATION
Item 1. Legal Proceedings
For a discussion of certain legal proceedings, see Note 16 to the consolidated financial statements included in Part I, Item 1 of this Quarterly Report on Form 10-Q.
Item 1A. Risk Factors
In connection with information set forth in this Form 10-Q, the factors discussed under “Risk Factors” in our Form 10-K for fiscal year ended February 28, 2022, should be considered. These risks could materially and adversely affect our business, financial condition, and results of operations. There have been no material changes to the factors discussed in our Form 10‑K.
Item 2. Unregistered Sales of Equity Securities and Use of Proceeds
On October 23, 2018, the board authorized the repurchase of up to $2 billion of our common stock with no expiration date. In April 2022, the board increased our share repurchase authorization by $2 billion. Purchases may be made in open market or privately negotiated transactions at management's discretion and the timing and amount of repurchases are determined based on stock price, market conditions, legal requirements and other factors. Shares repurchased are deemed authorized but unissued shares of common stock.
The following table provides information relating to the company's repurchase of common stock for the third quarter of fiscal 2023. The table does not include transactions related to employee equity awards or exercise of employee stock options. We paused the repurchase of our common stock during the third quarter of fiscal 2023 but may resume share repurchases at any time in the future depending on market conditions and our capital needs, among other factors.
| | | | | | | | | | | | | | | | | | | | | | | | | | |
| | | | | | | | Approximate |
| | | | | | | | Dollar Value |
| | | | | | Total Number | | of Shares that |
| | Total Number | | Average | | of Shares Purchased | | May Yet Be |
| | of Shares | | Price Paid | | as Part of Publicly | | Purchased Under |
| Period | | Purchased | | per Share | | Announced Program | | the Program |
| September 1 - 30, 2022 | | 30,000 | | | $ | 87.70 | | | 30,000 | | | $ | 2,451,306,850 | |
| October 1 - 31, 2022 | | — | | | $ | — | | | — | | | $ | 2,451,306,850 | |
| November 1 - 30, 2022 | | — | | | $ | — | | | — | | | $ | 2,451,306,850 | |
| Total | | 30,000 | | | | | 30,000 | | | |
Item 6. Exhibits
| | | | | |
| Severance Agreement, dated November 1, 2017, between CarMax, Inc. and Charles J. Wilson, filed herewith.* |
| |
| Certification of the Chief Executive Officer Pursuant to Rule 13a-14(a), filed herewith. |
| |
| Certification of the Chief Financial Officer Pursuant to Rule 13a-14(a), filed herewith. |
| |
| Certification of the Chief Executive Officer Pursuant to 18 U.S.C. Section 1350, filed herewith. |
| |
| Certification of the Chief Financial Officer Pursuant to 18 U.S.C. Section 1350, filed herewith. |
| |
| 101.INS | XBRL Instance Document - the instance document does not appear in the Interactive Data File because its XBRL tags are embedded within the Inline XBRL document. |
| |
| 101.SCH | XBRL Taxonomy Extension Schema Document |
| |
| 101.CAL | XBRL Taxonomy Extension Calculation Linkbase Document |
| |
| 101.DEF | XBRL Taxonomy Extension Definition Linkbase Document |
| |
| 101.LAB | XBRL Taxonomy Extension Label Linkbase Document |
| |
| 101.PRE | XBRL Taxonomy Extension Presentation Linkbase Document |
| |
| 104 | Cover Page Interactive Data File - the cover page XBRL tags are embedded within the Inline XBRL document. |
* Indicates management contract, compensatory plan or arrangement of the company required to be filed as an exhibit.
SIGNATURES
Pursuant to the requirements of the Securities Exchange Act of 1934, the registrant has duly caused this report to be signed on its behalf by the undersigned thereunto duly authorized.
| | | | | |
| | |
| CARMAX, INC. |
| | |
| | |
| By: | /s/ William D. Nash |
| | William D. Nash |
| | President and |
| | Chief Executive Officer |
| | |
| | |
| By: | /s/ Enrique N. Mayor-Mora |
| | Enrique N. Mayor-Mora |
| | Executive Vice President and |
| | Chief Financial Officer |
January 6, 2023