UNITED STATES
SECURITIES AND EXCHANGE COMMISSION
Washington, D.C. 20549
FORM 10-K
(Mark One)
ANNUAL REPORT PURSUANT TO SECTION 13 OR 15(d) OF THE SECURITIES EXCHANGE ACT OF 1934 | |
For the fiscal year ended February 29, 2020
OR
TRANSITION REPORT PURSUANT TO SECTION 13 OR 15(d) OF THE SECURITIES EXCHANGE ACT OF 1934 | |
For the transition period from ____ to ____
Commission file number 001-31420
(Exact name of registrant as specified in its charter)
(State or other jurisdiction of incorporation) | (I.R.S. Employer Identification No.) | ||
(Address of Principal Executive Offices) | (Zip Code) | ||
(804 ) 747-0422
Registrant's telephone number, including area code
Securities registered pursuant to Section 12(b) of the Act:
Title of each class | Trading Symbol(s) | Name of each exchange on which registered |
Securities registered pursuant to section 12(g) of the Act: None
Indicate by check mark if the registrant is a well-known seasoned issuer, as defined in Rule 405 of the Securities Act.
Indicate by check mark if the registrant is not required to file reports pursuant to Section 13 or Section 15(d) of the Act.
Yes ☐ No ☒
Indicate by check mark whether the registrant: (1) has filed all reports required to be filed by Section 13 or 15(d) of the Securities Exchange Act of 1934 during the preceding 12 months (or for such shorter period that the registrant was required to file such reports); and (2) has been subject to such filing requirements for the past 90 days.
Indicate by check mark whether the registrant has submitted electronically and posted on its corporate web site, if any, every Interactive Data File required to be submitted and posted pursuant to Rule 405 of Regulation S-T (§232.405 of this chapter) during the preceding 12 months (or for such shorter period that the registrant was required to submit and post such files).
Indicate by check mark whether the registrant is a large accelerated filer, an accelerated filer, a non-accelerated filer, or a smaller reporting company. See the definitions of “large accelerated filer,” “accelerated filer” and “smaller reporting company” in Rule 12b-2 of the Exchange Act. (Check one):
☒ | Accelerated filer | ☐ | |
Non-accelerated filer | ☐ | Smaller reporting company | |
Emerging growth company | |||
If an emerging growth company, indicate by check mark if the registrant has elected not to use the extended transition period for complying with any new or revised financial accounting standards provided pursuant to Section 13(a) of the Exchange Act. ☐
Indicate by check mark whether the registrant is a shell company (as defined in Rule 12b-2 of the Act). Yes ☐ No ☒
The aggregate market value of the registrant’s common stock held by non-affiliates as of August 31, 2019, computed by reference to the closing price of the registrant’s common stock on the New York Stock Exchange on that date, was $13,731,676,765 .
On March 31, 2020, there were 162,574,714 outstanding shares of CarMax, Inc. common stock.
DOCUMENTS INCORPORATED BY REFERENCE
Portions of the CarMax, Inc. Notice of 2020 Annual Meeting of Shareholders and Proxy Statement are incorporated by reference in Part III of this Form 10-K.
CARMAX, INC.
FORM 10-K
FOR FISCAL YEAR ENDED FEBRUARY 29, 2020
TABLE OF CONTENTS
Page No. | ||||
PART I | ||||
Item 1. | Business | |||
Item 1A. | Risk Factors | |||
Item 1B. | Unresolved Staff Comments | |||
Item 2. | Properties | |||
Item 3. | Legal Proceedings | |||
Item 4. | Mine Safety Disclosures | |||
Executive Officers of the Company | ||||
PART II | ||||
Item 5. | Market for the Registrant’s Common Equity, Related Stockholder Matters and Issuer Purchases of Equity Securities | |||
Item 6. | Selected Financial Data | |||
Item 7. | Management’s Discussion and Analysis of Financial Condition and Results of Operations | |||
Item 7A. | Quantitative and Qualitative Disclosures about Market Risk | |||
Item 8. | Consolidated Financial Statements and Supplementary Data | |||
Item 9. | Changes in and Disagreements with Accountants on Accounting and Financial Disclosure | |||
Item 9A. | Controls and Procedures | |||
Item 9B. | Other Information | |||
PART III | ||||
Item 10. | Directors, Executive Officers and Corporate Governance | |||
Item 11. | Executive Compensation | |||
Item 12. | Security Ownership of Certain Beneficial Owners and Management and Related Stockholder Matters | |||
Item 13. | Certain Relationships and Related Transactions and Director Independence | |||
Item 14. | Principal Accountant Fees and Services | |||
PART IV | ||||
Item 15. | Exhibits and Financial Statement Schedules | |||
Item 16. | Form 10-K Summary | |||
Signatures | ||||
3
PART I
In this document, “we,” “our,” “us,” “CarMax” and “the company” refer to CarMax, Inc. and its wholly owned subsidiaries, unless the context requires otherwise.
FORWARD-LOOKING AND CAUTIONARY STATEMENTS
This Annual Report on Form 10-K and, in particular, the description of our business set forth in Item 1 and our Management’s Discussion and Analysis of Financial Condition and Results of Operations set forth in Item 7 contain forward-looking statements within the meaning of Section 27A of the Securities Act of 1933, as amended (“Securities Act”), and Section 21E of the Securities Exchange Act of 1934, as amended (“Exchange Act”), including statements regarding:
• | The effect and consequences of the novel coronavirus (“COVID-19”) public health crisis on matters including U.S. and local economies; our business operations and continuity; the availability of corporate and consumer financing; the health and productivity of our associates; the ability of third-party providers to continue uninterrupted service; and the regulatory environment in which we operate. |
• | Our projected future sales growth, comparable store sales growth, margins, tax rates, earnings, CarMax Auto Finance income and earnings per share. |
• | Our business strategies. |
• | Our expectations of factors that could affect CarMax Auto Finance income. |
• | Our expected future expenditures, cash needs, and financing sources. |
• | Our expected capital structure, stock repurchases and indebtedness. |
• | The projected number, timing and cost of new store openings. |
• | Our gross profit margin, inventory levels and ability to leverage selling, general and administrative and other fixed costs. |
• | Our sales and marketing plans. |
• | The capabilities of our proprietary information technology systems and other systems. |
• | Our assessment of the potential outcome and financial impact of litigation and the potential impact of unasserted claims. |
• | Our assessment of competitors and potential competitors. |
• | Our expectations for growth in our markets and in the used vehicle retail sector. |
• | Our assessment of the effect of recent legislation and accounting pronouncements. |
In addition, any statements contained in or incorporated by reference into this report that are not statements of historical fact should be considered forward-looking statements. You can identify these forward-looking statements by the use of words such as “anticipate,” “believe,” “could,” “estimate,” “expect,” “intend,” “may,” “outlook,” “plan,” “predict,” “should,” “will” and other similar expressions, whether in the negative or affirmative. We cannot guarantee that we will achieve the plans, intentions or expectations disclosed in the forward-looking statements. There are a number of important risks and uncertainties that could cause actual results to differ materially from those indicated by our forward-looking statements. These risks and uncertainties include, without limitation, those set forth in Item 1A under the heading “Risk Factors.” We caution investors not to place undue reliance on any forward-looking statements as these statements speak only as of the date when made. We disclaim any intent or obligation to update any forward-looking statements made in this report.
4
Item 1. Business.
BUSINESS OVERVIEW
CarMax Background
CarMax, Inc. delivers an unrivaled customer experience by offering a broad selection of quality used vehicles and related products and services at competitive, no-haggle prices. We are the nation’s largest retailer of used cars, and we sold 832,640 used vehicles at retail during the fiscal year ended February 29, 2020. We are also one of the nation’s largest operators of wholesale vehicle auctions, with 466,177 vehicles sold during fiscal 2020, and one of the nation’s largest providers of used vehicle financing, servicing approximately 1,036,000 customer accounts in our $13.62 billion portfolio of managed receivables as of February 29, 2020.
By the end of fiscal 2020, more than 60% of customers had access to our omni-channel experience, which provides them the option to buy or sell a car on their terms—from home, in-store or in a seamless combination of online and in-store experiences. Our omni-channel experience provides multiple options for customers to interact with us throughout their car buying journey including our mobile apps; carmax.com; over the phone or online with a centralized customer experience consultant; or, in-person at one of our attractive, modern sales facilities. Through these new capabilities, a customer can also have a car or test drive delivered right to their home or enjoy express, or curbside, pick up of their vehicle at the store closest to them.
CarMax was incorporated under the laws of the Commonwealth of Virginia in 1996. CarMax, Inc. is a holding company and our operations are conducted through our subsidiaries. Under the ownership of Circuit City Stores, Inc. (“Circuit City”), we began operations in 1993 with the opening of our first CarMax store in Richmond, Virginia. On October 1, 2002, the CarMax business was separated from Circuit City through a tax-free transaction, becoming an independent, publicly traded company. As of February 29, 2020, we operated 216 used car stores in 106 U.S. television markets. Our home office is located at 12800 Tuckahoe Creek Parkway, Richmond, Virginia.
Impact of COVID-19
In March 2020, the World Health Organization declared the outbreak of COVID-19 as a global pandemic, and, in the following weeks, many U.S. states and localities issued lockdown orders impacting the operations of our stores and consumer demand. Since then, the COVID-19 situation within the U.S. has rapidly escalated and approximately half of our stores have been closed or have run under limited operations. Based upon the fluidity of the current environment, we expect that stores will continue to re-open or close in accordance with government mandates or public health concerns. Consumer demand has deteriorated, and sales have dropped significantly; most of our stores that remain open are selling 50% or less of what they sold last year, a trend that continued into April 2020. In April 2020, we announced approximately 15,500 associates have been placed on furlough, effective April 18, 2020. The majority of furloughed associates are employed at stores that are currently closed due to government mandates. We have taken other measures, subsequent to the end of our fiscal year, to enhance our liquidity position and provide additional financial flexibility, including drawing down additional funds on our revolving credit facility, halting our stock repurchase program, pausing our store expansion strategy and remodels and actively aligning operating expenses to the current state of the business. We continue to monitor the situation closely and it is possible that we will implement further measures.
We had intended to complete our omni-channel rollout in fiscal 2021, but in light of the evolving COVID-19 outbreak, we have pivoted to focus on rolling out the most pertinent parts of the experience, such as online self-progression and curbside or express pick up, as quickly and broadly as possible in our remaining markets given current customer needs.
CarMax Business
We operate in two reportable segments: CarMax Sales Operations and CarMax Auto Finance (“CAF”). Our CarMax Sales Operations segment consists of all aspects of our auto merchandising and service operations, excluding financing provided by CAF. Our CAF segment consists solely of our own finance operation that provides financing to customers buying retail vehicles from CarMax.
CarMax Sales Operations. Our CarMax Sales Operations segment sells used vehicles, purchases used vehicles from customers and other sources, sells related products and services, and arranges financing options for customers, all for fixed, no-haggle prices. We enable our customers to separately evaluate each component of the sales process based on comprehensive information about the terms and associated prices of each component. Customers can accept or decline any individual element of the offer without affecting the price or terms of any other component of the offer.
Purchasing a Vehicle:
The vehicle purchase process at CarMax differs fundamentally from the traditional auto retail experience. Our no-haggle pricing removes a frequent customer frustration with the purchase process and allows customers to shop for vehicles the same way they
5
shop for other consumer products. Our new omni-channel experience further empowers our customers to buy a car on their own terms, either completely from home, in-store, or in a combination of online and in-store experiences.
Our new omni-channel experience provides multiple ways for our customers to interact with us. A customer may interact with our customer experience consultants when communicating with us via phone or text messages. These employees are paid a fixed hourly rate and receive incentive bonuses based on their ability to effectively progress the customer through their car buying journey. Customers may also interact in-person with our sales consultants who are generally paid commissions on a fixed dollars-per-unit standard, thereby earning the same commission regardless of the vehicle being sold, the amount a customer finances or the related interest rate. These pay structures align our associates’ interests with those of our customers, in contrast to other dealerships where sales and finance personnel may receive higher commissions for negotiating higher prices and interest rates, or steering customers to vehicles with higher gross profits.
We recondition every used vehicle we retail to meet our CarMax Quality Certified standards, and each vehicle must pass an inspection before being offered for sale. We stand behind every used vehicle we sell with a 7-day, money-back guarantee and a 90-day/4,000-mile limited warranty. Our CarMax Quality Certified standards were developed internally by CarMax and are not affiliated with any third party or original equipment manufacturer program.
We maximize customer choice by offering a large selection of inventory on our lots and by making our nationwide inventory of approximately 80,000 retail vehicles as of February 29, 2020, available for viewing on carmax.com, as well as our mobile apps. Upon request by a customer, we will transfer virtually any used vehicle in our inventory. This gives CarMax customers access to a much larger selection of vehicles than any traditional auto retailer. In fiscal 2020, approximately 34% of our vehicles sold were transferred at customer request.
In addition to retailing used vehicles, we sell new vehicles at two locations under franchise agreements.
Selling us a Vehicle:
We have separated the practice of trading in a used vehicle in conjunction with the purchase of another vehicle into two distinct and independent transactions. We will appraise a customer’s vehicle free of charge and make a written, guaranteed offer to buy that vehicle regardless of whether the owner is purchasing a vehicle from us. This no-haggle offer is good for seven days.
Based on age, mileage or condition, fewer than half of the vehicles acquired through our appraisal process meet our retail standards. Those vehicles that do not meet our retail standards are sold to licensed dealers through our wholesale auctions. Unlike many other auto auctions, we own all the vehicles that we sell in our auctions, which allows us to maintain a high auction sales rate. This high sales rate, combined with dealer-friendly practices, makes our auctions an attractive source of vehicles for licensed dealers. As of February 29, 2020, we conducted wholesale auctions at 74 of our 216 stores with an average auction sales rate of approximately 95%.
Financing a Vehicle:
The availability of on-the-spot financing is a critical component of the vehicle purchase process, and having an array of finance sources increases approvals, expands finance opportunities for our customers and mitigates risk to CarMax. Our finance program provides access to credit for customers across a wide range of the credit spectrum through both CAF and third-party providers. We believe that our processes and systems, transparency of pricing, and vehicle quality, as well as the integrity of the information collected at the time the customer applies for credit, allow CAF and our third-party providers to make underwriting decisions in a unique and advantageous environment distinct from the traditional auto retail environment. All finance offers, whether from CAF or our third-party providers, are backed by a 3-day payoff option, which allows customers to refinance their loan with another finance provider within three business days at no charge.
Related Products and Services:
We provide customers with a range of other related products and services, including extended protection plan (“EPP”) products and vehicle repair service. EPP products include extended service plans (“ESPs”) and guaranteed asset protection (“GAP”), which is designed to cover the unpaid balance on an auto loan in the event of a total loss of the vehicle or unrecovered theft. Our ESP customers have access to vehicle repair service at each CarMax store and at thousands of independent and franchised service providers. We believe that the broad scope of our ESPs helps promote customer satisfaction and loyalty, and thus increases the likelihood of repeat and referral business. In fiscal 2020, approximately 61% of the customers who purchased a retail used vehicle also purchased an ESP and approximately 19% purchased GAP.
CarMax Auto Finance. CAF provides financing solely to customers buying retail vehicles from CarMax. CAF allows us to manage our reliance on third-party finance providers and to leverage knowledge of our business to provide qualifying customers a competitive financing option. CAF utilizes proprietary scoring models based upon the credit history and other credit data of the
6
customer along with CAF’s historical experience to predict the likelihood of customer repayment. Because CAF offers financing solely to CarMax customers, our scoring models are optimized for the CarMax channel. We believe CAF enables us to capture additional profits, cash flows and sales. After the effect of 3-day payoffs and vehicle returns, CAF financed 42.5% of our retail used vehicle unit sales in fiscal 2020.
CAF also services all auto loans it originates and is responsible for providing billing statements, collecting payments, maintaining contact with delinquent customers, and arranging for the repossession of vehicles securing defaulted loans.
Competition
CarMax Sales Operations. The U.S. used car marketplace is highly fragmented, and we face competition from franchised dealers, who sell both new and used vehicles; online sellers; independent used car dealers; and private parties. According to industry sources, as of December 31, 2019, there were approximately 18,000 franchised dealers in the U.S., who we consider to be our primary retail competitors, as they sell the majority of late-model used vehicles. Competition in our industry has evolved with the adoption of online platforms and marketing tools, all of which facilitate increased competition.
Based on industry data, there were approximately 41 million used cars sold in the U.S. in calendar 2019, of which approximately 23 million were estimated to be age 0- to 10-year old vehicles. While we are the largest retailer of used vehicles in the U.S., in calendar 2019, we estimate we sold approximately 4.7% of the age 0- to 10-year old vehicles sold in the current comparable store markets in which we operate, a 4.2% increase in these markets from approximately 4.4% in calendar 2018. Our market share is generally the highest in markets in which we have been established for many years. Entering new markets could have a dampening effect on our market share given that our initial market share in new markets is generally much lower than our average. On a nationwide basis, we estimate we sold approximately 3.5% of the age 0- to 10-year old vehicles sold in calendar year 2019.
We believe that our principal competitive advantages in used vehicle retailing include our ability to provide a high degree of customer satisfaction with the car-buying experience by virtue of our competitive, no-haggle prices and our customer-friendly sales process; our breadth of selection of the most popular makes and models available on site and via carmax.com and our mobile apps; the quality of our vehicles; our proprietary information systems; the transparency and availability of CAF and third-party financing; the locations of our retail stores; and our commitment to evolving our car-buying experience to meet customers’ changing expectations. We believe our omni-channel experience reinforces our competitive advantages, and we are currently pivoting to focus on rolling out the most pertinent parts of the experience as quickly and broadly as possible given current customer needs. In addition, we believe our willingness to appraise and purchase a customer’s vehicle, whether or not the customer is buying a car from us, provides a competitive sourcing advantage for retail vehicles. Our high volume of appraisal purchases supplies not only a large portion of our retail inventory, but also provides the scale that enables us to conduct our own wholesale auctions to dispose of vehicles that do not meet our retail standards.
Our wholesale auctions compete with other automotive auction houses. In contrast to the highly fragmented used vehicle retail market, the automotive auction market has two primary competitors: Manheim, a subsidiary of Cox Enterprises, and KAR Auction Services, Inc., which together represent an estimated 70% of the North American wholesale car auction market. These competitors auction vehicles of all ages, while CarMax’s auctions predominantly sell older, higher mileage vehicles. In response to the impacts of COVID-19 subsequent to the end of fiscal 2020, we have been able to quickly move our wholesale auctions to an online platform. We believe our ability to move our auctions online, when necessary, provides us an additional competitive advantage.
CarMax Auto Finance. CAF operates and is a significant participant in the auto finance sector of the consumer finance market. This sector is primarily comprised of banks, captive finance divisions of new car manufacturers, credit unions and independent finance companies. According to industry sources, this sector represented more than $1 trillion in outstanding receivables as of December 31, 2019. CAF’s primary competitors are banks and credit unions that offer direct financing to customers purchasing used cars.
We believe that CAF’s principal competitive advantage is its strategic position as the primary finance source for CarMax customers, and that CAF’s primary driver for growth is the growth in CarMax’s retail used unit sales. We periodically test different credit offers and closely monitor acceptance rates and the effect on sales to assess market competitiveness. We also monitor 3-day payoffs, as the percentage of customers exercising this option can be an indication of the competitiveness of our offer.
Products and Services
Retail Merchandising. We offer customers a broad selection of makes and models of used vehicles, including domestic, imported and luxury vehicles, at competitive prices. Our focus is vehicles that are 0 to 10 years old; these vehicles generally range in price from $11,000 to $36,000. The mix of our used vehicle inventory by make, model and age will vary from time to time, depending on consumer preferences, seasonality and market pricing and availability.
7
Wholesale Auctions. The typical vehicle sold at our wholesale auctions is approximately 10 years old and has more than 100,000 miles. We provide condition disclosures on each vehicle, including those for vehicles with major mechanical issues, possible frame or flood damage, branded titles, salvage history and unknown true mileage. Professional, licensed auctioneers conduct our auctions. Dealers pay a fee to us based on the sales price of the vehicles they purchase. Our auctions are generally held on a weekly or bi-weekly basis.
Extended Protection Plans. In conjunction with the sale of a vehicle, we offer customers EPP products. We receive revenue for selling these plans on behalf of unrelated third parties, who are the primary obligors. We have no contractual liability to customers for claims under these agreements. The ESPs we currently offer on all used retail vehicles provide coverage up to 60 months (subject to mileage limitations). GAP covers the customer for the term of their finance contract. The EPPs that we sell (other than manufacturer programs on new car sales) have been designed to our specifications and are administered by the third parties through private-label arrangements. Periodically, we may receive profit-sharing revenues based upon the performance of the ESP policies administered by third parties. As of February 29, 2020, our third-party ESP providers included Assurant, Inc., CNA National Warranty Corporation and Fidelity Warranty Services, Inc. Our third-party GAP provider as of February 29, 2020 was Safe-Guard Products International LLC.
Reconditioning and Service. An integral part of our used car consumer offer is the reconditioning process designed to make sure every car meets our internal standards before it can become a CarMax Quality Certified vehicle. This process includes an inspection of the engine and all major systems. Based on this inspection, we determine the reconditioning necessary to bring the vehicle up to our internal quality standards. Many of our stores depend upon nearby, typically larger, CarMax stores for reconditioning, which increases efficiency and reduces overhead. We perform most routine mechanical and minor body repairs in-house; however, for some reconditioning services, including, but not limited to, services related to manufacturer’s warranties, we engage third parties specializing in those services. CarMax does not have manufacturer authorization to complete recall-related repairs, and some vehicles CarMax sells may have unrepaired safety recalls. However, safety recall information, as reported by the National Highway Traffic Safety Administration, is available on our website, and we review any unrepaired safety recall information with our used vehicle customers before purchase.
All CarMax used car stores provide vehicle repair service, including repairs of vehicles covered by the ESPs we sell. Additionally, we have partnered with third-party providers of auto service and repair. Through these partnerships, we can provide our customers with access to a nationwide network of trusted, quality and fair-priced service and repair locations.
Customer Credit. We offer financing alternatives for retail customers across a wide range of the credit spectrum through CAF and arrangements with several financial institutions. Vehicles are financed using retail installment contracts secured by the vehicle. As of February 29, 2020, our third-party finance providers included Ally Financial, American Credit Acceptance, Capital One Auto Finance, Chase Auto Finance, Exeter Finance Corp., Santander Consumer USA, Wells Fargo Dealer Services and Westlake Financial Services. We have no recourse liability for credit losses on retail installment contracts arranged and held by third-party providers, and we periodically test additional third-party providers.
Generally, credit applications submitted by customers to CarMax are initially reviewed by CAF using our proprietary underwriting standards. Based on that review, CAF makes financing offers designed to create a loan portfolio that meets our targeted risk profile in the aggregate. Applications that CAF declines or approves with conditions are generally evaluated by other third-party finance providers. Third-party providers generally either pay us or are paid a fixed, pre-negotiated fee per contract. We refer to the providers who generally pay us a fee or to whom no fee is paid as Tier 2 providers and we refer to providers to whom we pay a fee as Tier 3 providers. We are willing to pay a fee to Tier 3 providers because we believe their participation provides us with incremental sales by enabling customers to secure financing that they may not otherwise be able to obtain. All fees either received or paid are pre-negotiated at a fixed amount and do not vary based on the amount financed, the interest rate, the term of the loan or the loan-to-value ratio. CAF also provides financing for a small percentage of customers who would typically be financed by a Tier 3 provider; however, subsequent to the end of fiscal 2020, we paused our Tier 3 lending in response to the COVID-19 situation.
We do not offer financing to dealers purchasing vehicles at our wholesale auctions. However, we have made arrangements to have third-party financing available to our auction customers.
Suppliers for Used Vehicles
We acquire a significant percentage of our retail used vehicle inventory directly from consumers through our appraisal process, as well as through local, regional and online auctions. While in any individual period conditions may vary, over the past 5 fiscal years, 36% to 41% of our retail inventory has been acquired through our appraisal process annually. We also acquire used vehicle inventory from wholesalers, franchised and independent dealers and fleet owners, such as leasing companies and rental
8
companies. The used vehicle inventory we acquire directly from consumers through our appraisal process helps provide an inventory of makes and models that reflects consumer preferences in each market.
The supply of late-model used vehicles is influenced by a variety of factors, including the total number of vehicles in operation; the volume of new vehicle sales, which in turn generate used car trade-ins; and the number of used vehicles sold or remarketed through retail channels, wholesale transactions and at automotive auctions. According to industry sources, there were approximately 280 million light vehicles in operation in the U.S. as of December 31, 2019. During calendar year 2019, it is estimated that approximately 17 million new cars and 41 million used cars were sold at retail, many of which were accompanied by trade-ins, and more than 20 million wholesale vehicles were sold at auctions and through other channels.
Based on the large number of vehicles remarketed each year, consumer acceptance of our appraisal process, our experience and success in acquiring vehicles from auctions and other sources, and the large size of the U.S. auction market relative to our needs, we believe that sources of used vehicles will continue to be sufficient to meet our current and future needs.
Seasonality
Historically, our business has been seasonal. Our stores typically experience their strongest traffic and sales in the spring and summer, with an increase in traffic and sales in February and March, coinciding with federal income tax refunds. Sales are typically slowest in the fall.
Technology
We leverage a combination of cloud-based and proprietary technologies. Our teams use a “test and learn” approach to iterate and deploy new technology-enabled solutions to our associates and customers. CarMax also has been developing advanced data science and machine learning capabilities to optimize our business as well as customer experience. Our business is supported by digital and mobile technologies that provide enhanced customer experience while enabling highly integrated automation of all operating functions, including credit processing and supply chain management. Buyers and sales consultants are equipped with mobile and centralized tools that allow them to access real-time information to better serve our customers. Our proprietary store technology provides our management with real-time information about many aspects of store operations, such as inventory management, pricing, vehicle transfers, wholesale auctions and sales consultant productivity.
Our proprietary centralized inventory management and pricing system tracks each vehicle throughout the sales process and allows us to buy the mix of makes, models, age, mileage and price points tailored to customer buying preferences at each CarMax location. Leveraging our more than twenty-five years of experience buying and selling millions of used vehicles, our system generates recommended initial retail price points, as well as retail price markdowns for specific vehicles based on algorithms that take into account factors that include sales history, consumer interest and seasonal patterns. We believe this systematic approach to vehicle pricing allows us to optimize inventory turns, which reduces the depreciation risk inherent in used cars and helps us to achieve our targeted gross profit dollars per unit. Because of the pricing discipline afforded by our inventory management and pricing system, generally more than 99% of our entire used car inventory offered at retail is sold at retail.
Marketing and Advertising
Our marketing strategies are focused on developing awareness of the advantages of shopping at our stores and on carmax.com and on attracting customers who are already considering buying or selling a vehicle. These strategies are implemented through a broad range of media types including, but not limited to, traditional broadcast, digital, search, video on demand and social. Our website and related mobile apps received an average of 25 million monthly visits during fiscal 2020 and are marketing tools for communicating the CarMax consumer offer in detail. They are also sophisticated search engines for finding the right vehicle and sales channels for customers who prefer to conduct part of the shopping and sales process online. Our website and mobile apps also include a variety of other customer service features, including the ability to initiate vehicle transfers, schedule appointments and apply for financing pre-approval. Information on the thousands of cars available in our nationwide inventory is updated near real-time. Our survey data indicates that during fiscal 2020, approximately 93% of customers who purchased a vehicle from us had first visited us online.
In 2019 we introduced a new advertising campaign - The Way It Should Be - highlighting the human element that CarMax provides to the car buying and selling experiences.
Associates
On February 29, 2020, we had a total of 27,050 full- and part-time associates, including 22,272 hourly and salaried associates and 4,778 sales associates, who predominantly worked on a commission basis. We employ additional associates during peak selling seasons. We believe we have created a unique corporate culture and maintain good employee relations. No associate is subject to a collective bargaining agreement. We focus on developing our associates and providing them with the information and resources
9
they need to offer exceptional customer service and have been recognized for the success of our efforts by a number of external organizations.
In April 2020, in response to the COVID-19 situation, we announced approximately 15,500 associates have been placed on furlough, effective April 18, 2020. The majority of furloughed associates are employed at stores that are currently closed due to government mandates.
Intellectual Property
Our brand image is a critical element of our business strategy. We rely on trademarks, domain names, copyrights, trade secrets and patents to protect our intellectual property.
Laws and Regulations
Vehicle Dealer and Other Laws and Regulations. We operate in a highly regulated industry. In every state in which we operate, we must obtain licenses and permits to conduct business, including dealer, service, sales and finance licenses issued by state and local regulatory authorities. A wide range of federal, state and local laws and regulations govern the manner in which we conduct business, including advertising, sales, financing and employment practices. These laws include consumer protection laws and privacy laws, as well as other laws and regulations applicable to motor vehicle dealers. These laws also include federal and state wage-hour, anti-discrimination and other employment practices laws. Our financing activities with customers are subject to federal truth-in-lending, consumer leasing, equal credit opportunity and fair credit reporting laws and regulations, as well as state and local motor vehicle finance, collection, repossession and installment finance laws. Our activities are subject to enforcement by the Federal Trade Commission and other federal and state regulators, and our financing activities are also subject to enforcement by the Consumer Financial Protection Bureau (“CFPB”).
The CFPB has supervisory authority over large nonbank auto finance companies, including CarMax’s CAF segment. The CFPB can use this authority to conduct supervisory examinations to ensure compliance with various federal consumer protection laws.
Claims arising out of actual or alleged violations of law could be asserted against us by individuals or governmental authorities and could expose us to significant damages or other penalties, including revocation or suspension of the licenses necessary to conduct business and fines.
Additionally, we are subject to laws, regulations, and other governmental actions instituted in response to the COVID-19 outbreak. Among other things, these actions require, in many localities, the closing of stores and wholesale auctions.
Environmental Laws and Regulations. We are subject to a variety of federal, state and local laws and regulations that pertain to the environment. Our business involves the use, handling and disposal of hazardous materials and wastes, including motor oil, gasoline, solvents, lubricants, paints and other substances. We are subject to compliance with regulations concerning, among other things, the operation of underground and above-ground gasoline storage tanks, gasoline dispensing equipment, above-ground oil tanks and automotive paint booths.
AVAILABILITY OF REPORTS AND OTHER INFORMATION
The following items are available free of charge on our website through the “Corporate Governance” link on our investor information home page at investors.carmax.com, shortly after we file them with, or furnish them to, the U.S. Securities and Exchange Commission (the “SEC”): annual reports on Form 10-K, quarterly reports on Form 10-Q, current reports on Form 8-K, proxy statements on Schedule 14A, and any amendments to those reports. The following documents are also available free of charge on our website: Corporate Governance Guidelines, Code of Business Conduct, and the charters of the Audit, Nominating and Governance, and Compensation and Personnel Committees. We publish any changes to these documents on our website. We also promptly disclose reportable waivers of the Code of Business Conduct on our website. The contents of our website are not, however, part of this report.
Printed copies of these documents are also available to any shareholder, without charge, upon written request to our corporate secretary at the address set forth on the cover page of this report.
Item 1A. Risk Factors.
We are subject to a variety of risks, the most significant of which are described below. Our business, sales, results of operations and financial condition could be materially adversely affected by any of these risks.
10
The recent outbreak of COVID-19 will likely have a significant negative impact on our business, sales, results of operations and financial condition.
The global outbreak of COVID-19 has led to severe disruptions in general economic activities, particularly retail operations, as businesses and federal, state, and local governments take increasingly broad actions to mitigate this public health crisis. We have experienced significant disruption to our business, both in terms of disruption of our operations and the adverse effect on overall economic conditions. We have closed or limited operations at many of our retail and wholesale locations since the beginning of the outbreak and the ultimate scope and duration of these closures is not known. For stores that remain open, consumer demand has deteriorated. These conditions will significantly negatively impact all aspects of our business, including used vehicle sales operations, wholesale vehicle auctions, used vehicle financing, extended protection plan sales, inventory acquisition, and retail service. The unexpected deterioration in economic conditions may also lead to future credit losses in our portfolio of auto loans receivable that are not incorporated in the existing allowance for loan losses. Our business is also dependent on the continued health and productivity of our associates, including store, region and corporate management teams, throughout this crisis. Individually and collectively, the consequences of the COVID-19 outbreak could have a material adverse effect on our business, sales, results of operations and financial condition.
Additionally, our liquidity could be negatively impacted if these conditions continue for a significant period of time and we may be required to pursue additional sources of financing to obtain working capital, maintain appropriate inventory levels, support the origination of auto loans receivable, and meet our financial obligations. Currently capital and credit markets have been disrupted by the crisis and our ability to obtain any required financing is not guaranteed and largely dependent upon evolving market conditions and other factors. Depending on the continued impact of the crisis, further actions may be required to improve the Company's cash position and capital structure.
The extent to which the COVID-19 outbreak ultimately impacts our business, sales, results of operations and financial condition will depend on future developments, which are highly uncertain and cannot be predicted, including, but not limited to, the duration and spread of the outbreak, its severity, the actions to contain the virus or treat its impact, and how quickly and to what extent normal economic and operating conditions can resume. Even after the COVID-19 outbreak has subsided, we may continue to experience significant impacts to our business as a result of its global economic impact, including any economic downturn or recession that has occurred or may occur in the future.
The automotive retail industry in general and our business in particular are sensitive to economic conditions. These conditions could adversely affect our business, sales, results of operations and financial condition.
We are subject to national and regional U.S. economic conditions. These conditions include, but are not limited to, recession, inflation, interest rates, unemployment levels, the state of the housing market, gasoline prices, consumer credit availability, consumer credit delinquency and loss rates, personal discretionary spending levels, and consumer sentiment about the economy in general. These conditions and the economy in general could be affected by significant national or international events such as a global health crisis, like COVID-19, and acts of terrorism. When these economic conditions worsen or stagnate, it can have a material adverse effect on consumer demand for vehicles generally, demand from particular consumer categories or demand for particular vehicle types. It can also negatively impact availability of credit to finance vehicle purchases for all or certain categories of consumers. This could result in lower sales, decreased margins on units sold, and decreased profits for our CAF segment. Worsening or stagnating economic conditions can also have a material adverse effect on the supply of late-model used vehicles, as automotive manufacturers produce fewer new vehicles and consumers retain their current vehicles for longer periods of time. This could result in increased costs to acquire used vehicle inventory and decreased margins on units sold.
Any significant change or deterioration in economic conditions could have a material adverse effect on our business, sales, results of operations and financial condition.
Our business is dependent upon capital to operate, fund growth and support the activities of our CAF segment. Changes in capital and credit markets could adversely affect our business, sales, results of operations and financial condition.
Changes in the availability or cost of capital and working capital financing, including the long-term financing to support the expansion of our store base and sales growth in existing stores, could adversely affect sales, operating strategies and store growth. Although, in recent years, internally generated cash flows have been sufficient to maintain our operations and fund our growth, there can be no assurance that we will continue to generate sufficient cash for these purposes. Failure to do so—or our decision to put our cash to other uses—would make us more dependent on external sources of financing to fund our growth.
Changes in the availability or cost of the long-term financing to support the origination of auto loans receivable through CAF could adversely affect sales and results of operations. We use a securitization program to fund the majority of the auto loans
11
receivable originated by CAF. Changes in the condition of the asset-backed securitization market could lead us to incur higher costs to access funds in this market or require us to seek alternative means to finance CAF’s loan originations. In the event that this market ceased to exist and there were no immediate alternative funding sources available, we might be forced to curtail our lending practices for some period of time. The impact of reducing or curtailing CAF’s loan originations could have a material adverse effect on our business, sales and results of operations.
Our revolving credit facility, term loan, senior unsecured notes and certain securitization and sale-leaseback agreements contain covenants and performance triggers. Any failure to comply with these covenants or performance triggers could have a material adverse effect on our business, results of operations and financial condition.
Disruptions in the capital and credit markets could adversely affect our ability to draw on our revolving credit facility. If our ability to secure funds from the facility were significantly impaired, our access to working capital would be impacted, our ability to maintain appropriate inventory levels could be affected and these conditions—especially if coupled with a failure to generate significant cash flows—could have a material adverse effect on our business, sales, results of operations and financial condition.
We operate in a highly competitive industry. Failure to develop and execute strategies to remain the nation’s preferred retailer of used vehicles and to adapt to the increasing use of the internet to market, buy, sell and finance used vehicles could adversely affect our business, sales and results of operations.
Automotive retailing is a highly competitive and highly fragmented business. Our competition includes publicly and privately owned new and used car dealers and online and mobile sales platforms, as well as millions of private individuals. Competitors buy and sell the same or similar makes of vehicles that we offer in the same or similar markets at competitive prices. New car dealers leverage their franchise relationships with automotive manufacturers to brand certain used cars as “certified pre-owned,” which could provide those competitors with an advantage over CarMax.
Retail Competition. Some of our competitors have replicated or attempted to replicate portions of the consumer offer that we pioneered when we opened our first used car store in 1993, including our use of competitive, no-haggle prices and our commitment to buy a customer’s vehicle even if they do not purchase one from us.
Competitors using online focused business models, both for direct sales and consumer-to-consumer facilitation, could materially impact our business model. The online availability of used vehicle information, including pricing information, could make it more difficult for us to differentiate our customer offering from competitors’ offerings, could result in lower-than-expected retail margins, and could have a material adverse effect on our business, sales and results of operations. If we fail to respond effectively to our retail competitors, it could have a material adverse effect on our business, sales and results of operations.
Online Facilitation. In addition, our competitive standing is affected by companies, including search engines and online classified sites, that are not direct competitors but that may direct online traffic to the websites of competing automotive retailers. The increasing activities of these companies could make it more difficult for carmax.com to attract traffic. These companies could also make it more difficult for CarMax to otherwise market its vehicles online.
The increasing use of the internet to facilitate consumers’ sales or trade-ins of their current vehicles could have a material adverse effect on our ability to source vehicles through our appraisal process, which in turn could have a material adverse effect on our vehicle acquisition costs and results of operations. For example, online appraisal tools are available to consumers that generate offers and facilitate purchases by dealers other than CarMax.
In addition, there are companies that sell software and data solutions to new and used car dealers to enable those dealers to, among other things, more efficiently source and price inventory. Although these companies do not compete with CarMax, the increasing use of such products by dealers who compete with CarMax could reduce the relative competitive advantage of CarMax’s internally developed proprietary systems.
If we fail to respond effectively to competitive pressures or to changes in the used vehicle marketplace, it could have a material adverse effect on our business, sales and results of operations.
CAF Competition. Our CAF segment is subject to competition from various financial institutions, including banks and credit unions, which provide vehicle financing to consumers. If we were unable to continue providing competitive finance offers to our customers through CAF, it could result in a greater percentage of sales financed through our third-party finance providers, which are generally less profitable to CarMax, or through other outside financing sources. Moreover, if CAF competitors are able to attract potential customers before they visit CarMax, whether through competitive finance offers or ease of customer experience, they may be directed to retail options other than CarMax. Accordingly, if CAF was unable to continue making competitive finance
12
offers to our customers, or our finance competitors are able to successfully attract and redirect a disproportionate number of our potential customers, it could have a material adverse effect on our business, sales and results of operations.
Evolving Marketplace. The marketplace for used vehicles may be impacted by the significant, and likely accelerating, changes to the broader automotive industry. Technological changes, including the development of autonomous vehicles, new products and services, new business models and new methods of travel could reduce automotive retail demand or disrupt our current business model. If we fail to respond effectively to the evolving marketplace, it could have a material adverse effect on our business, sales and results of operations.
CarMax was founded on the fundamental principle of integrity. Failure to maintain a reputation of integrity and to otherwise maintain and enhance our brand could adversely affect our business, sales and results of operations.
Our reputation as a company that is founded on the fundamental principle of integrity is critical to our success. Our reputation as a retailer offering competitive, no-haggle prices, a broad selection of CarMax Quality Certified used vehicles and superior customer service is also critical to our success. If we fail to maintain the high standards on which our reputation is built, or if an event occurs that damages this reputation, it could adversely affect consumer demand and have a material adverse effect on our business, sales and results of operations. Such an event could include an isolated incident at a single store, particularly if such incident results in adverse publicity, governmental investigations, or litigation and could involve, among other things, our sales process, our provision of financing, our reconditioning process, or our treatment of customers. Even the perception of a decrease in the quality of our brand could impact results.
The use of social media increases the speed with which information and opinions can be shared and thus the speed with which reputation can be affected. We monitor social media and attempt to address customer concerns, provide accurate information and protect our reputation, but there can be no guarantee that our efforts will succeed. If we fail to correct or mitigate misinformation or negative information, including information spread through social media or traditional media channels, about the vehicles we offer, our customer experience, or any aspect of our brand, it could have a material adverse effect on our business, sales and results of operations.
Our failure to realize the benefits associated with our omni-channel initiatives could have a material adverse effect on our business, sales and results of operations.
We announced the rollout of a new omni-channel experience in December 2018, and by the end of fiscal 2020, our omni-channel experience was available to more than 60% of customers. For our remaining markets, we are pivoting to focus on rolling out the most pertinent parts of the experience as quickly and broadly as possible given current customer needs. If we fail to complete this rollout, if we are inefficient in implementing this rollout or if we are unable to capture the benefits that we expect from this rollout, it could have a material adverse effect on our business, sales and results of operations. We must anticipate and meet our customers’ expectations in an evolving retail industry. Our business, sales and results of operations may be negatively affected if we fail to provide a high quality and consistent customer experience, regardless of sales channel, if our omni-channel experience does not meet customer expectations, or if we are unable to attract, retain and manage the personnel at various levels who have the necessary skills and experience we need to implement our omni-channel initiatives.
Our success depends upon the continued contributions of our associates.
In April 2020, in response to the COVID-19 situation, we announced approximately 15,500 associates have been placed on furlough, effective April 18, 2020. Our associates are the driving force behind our success. We believe that one of the things that sets CarMax apart is a culture centered on valuing all associates. If we fail to maintain our culture while responding to the COVID-19 situation or in the aftermath of recovery and reintegration of furloughed associates, it could have a material adverse effect on our business, sales and results of operations.
In addition, our response to COVID-19 as well as our strategic initiatives require management, employees and contractors to adapt and learn new skills and capabilities. Our failure to maintain this culture or to continue developing and retaining the associates that drive our success could have a material adverse effect on our business, sales and results of operations.
In response to COVID-19, we have instituted a hiring freeze. Once that freeze is lifted, we will need to recruit new associates and our ability to recruit associates while controlling related costs is subject to numerous external and internal factors, including unemployment levels, prevailing wage rates, our growth plans, changes in employment legislation, and competition for qualified employees in the industry and regions in which we operate and for service technicians in particular. Our ability to recruit associates while controlling related costs is also subject to our ability to maintain positive associate relations. If we are unable to do so, or
13
if, despite our efforts, we become subject to successful unionization efforts, it could increase costs, limit our ability to respond to competitive threats and have a material adverse effect on our business, sales and results of operations.
Our response to COVID-19 and our ongoing success also depend upon the continued contributions of our store, region and corporate management teams. Consequently, the loss of the services of any of these associates could have a material adverse effect on our business, sales and results of operations. In addition, an inability to build our management bench strength to support store growth could have a material adverse effect on our business, sales and results of operations.
We collect sensitive confidential information from our customers. A breach of this confidentiality, whether due to a cybersecurity or other incident, could result in harm to our customers and damage to our brand.
We collect, process and retain sensitive and confidential customer information in the normal course of business and may share that information with our third-party service providers. This information includes the information customers provide when purchasing a vehicle and applying for vehicle financing. We also collect, process and retain sensitive and confidential associate information in the normal course of business and may share that information with our third-party service providers. Although we have taken measures designed to safeguard such information and have received assurances from our third-party providers, our facilities and systems, and those of third-party providers, could be vulnerable to external or internal security breaches, acts of vandalism, computer viruses, misplaced or lost data, programming or human errors or other similar events. Numerous national retailers have disclosed security breaches involving sophisticated cyber-attacks that were not recognized or detected until after such retailers had been affected, notwithstanding the preventive measures such retailers had in place. Any security breach involving the misappropriation, loss or other unauthorized disclosure of confidential customer or associate information, whether experienced by us or by our third-party service providers, and whether due to an external cybersecurity incident, a programming error, or other cause, could damage our reputation, expose us to mitigation costs and the risks of private litigation and government enforcement, disrupt our business and otherwise have a material adverse effect on our business, sales and results of operations. In addition, our failure to respond quickly and appropriately to such a security breach could exacerbate the consequences of the breach.
Our business is sensitive to changes in the prices of new and used vehicles.
Any significant changes in retail prices for new and used vehicles could have a material adverse effect on our sales and results of operations. For example, if retail prices for used vehicles rise relative to retail prices for new vehicles, it could make buying a new vehicle more attractive to our customers than buying a used vehicle, which could have a material adverse effect on sales and results of operations and could result in decreased used margins. Manufacturer incentives could contribute to narrowing this price gap. In addition, any significant changes in wholesale prices for used vehicles could have a material adverse effect on our results of operations by reducing wholesale margins.
We may experience greater credit losses in CAF’s portfolio of auto loans receivable than anticipated.
We are exposed to the risk that our customers who finance their purchases through CAF will be unable or unwilling to repay their loans according to their terms and that the vehicle collateral securing the payment of their loans may not be sufficient to ensure full repayment. Credit losses are inherent in CAF’s business and could have a material adverse effect on our results of operations.
We make various assumptions and judgments about CAF’s portfolio of auto loans receivable and provide an allowance for loan losses based on a number of factors. Although management will establish an allowance for loan losses it believes is appropriate, this allowance may not be adequate. For example, when economic conditions deteriorate unexpectedly, such as in connection with the COVID-19 outbreak, additional loan losses not incorporated in the existing allowance for loan losses may occur. Losses in excess of the existing allowance for loan losses could have a material adverse effect on our business, results of operations and financial condition.
Our business is dependent upon access to vehicle inventory. A failure to expeditiously liquidate that inventory—or obstacles to acquiring inventory—whether because of supply, competition, or other factors could have a material adverse effect on our business, sales and results of operations.
Used vehicle inventory is subject to depreciation risk. Accordingly, if we develop excess inventory, the inability to liquidate such inventory at prices that allow us to meet margin targets or to recover our costs could have a material adverse effect on our results of operations.
A reduction in the availability of, or access to, sources of inventory could have a material adverse effect on our business, sales and results of operations.
14
We source a significant percentage of our vehicles though our appraisal process and these vehicles are generally more profitable for CarMax. Accordingly, if we fail to adjust appraisal offers to stay in line with broader market trade-in offer trends, or fail to recognize those trends, it could adversely affect our ability to acquire inventory. It could also force us to purchase a greater percentage of our inventory from third-party auctions, which is generally less profitable for CarMax. Our ability to source vehicles through our appraisal process could also be affected by competition, both from new and used car dealers directly and through third parties driving appraisal traffic to those dealers. See the risk factor above titled “We operate in a highly competitive industry” for discussion of this risk. Our ability to source vehicles from third-party auctions could be affected by an increase in the number of closed auctions that are open only to new car dealers who have franchise relationships with automotive manufacturers.
We rely on third-party finance providers to finance a significant portion of our customers’ vehicle purchases. Accordingly, our sales and results of operations are partially dependent on the actions of these third parties.
We provide financing to qualified customers through CAF and a number of third-party finance providers. If one or more of these third-party providers cease to provide financing to our customers, provide financing to fewer customers or no longer provide financing on competitive terms, it could have a material adverse effect on our business, sales and results of operations. Additionally, if we were unable to replace the current third-party providers upon the occurrence of one or more of the foregoing events, it could also have a material adverse effect on our business, sales and results of operations.
We rely on third-party providers to supply EPP products to our customers. Accordingly, our sales and results of operations are partially dependent on the actions of these third-parties.
We receive revenue for selling EPP products on behalf of unrelated third-parties, who are the primary obligors. If one or more of these third-party providers cease to provide EPP products, make changes to their products or no longer provide their products on competitive terms, it could have a material adverse effect on our business, sales and results of operations. Additionally, if we were unable to replace the current third-party providers upon the occurrence of one or more of the foregoing events, it could also have a material adverse effect on our business, sales and results of operations.
We operate in a highly regulated industry and are subject to a wide range of federal, state and local laws and regulations. Changes in these laws and regulations, or our failure to comply, could have a material adverse effect on our business, sales, results of operations and financial condition.
We are subject to a wide range of federal, state and local laws and regulations, as well as changes in these laws and regulations and the manner in which they are interpreted or applied. Our sale of used vehicles is subject to state and local licensing requirements, federal and state laws regulating vehicle advertising, and state laws regulating vehicle sales and service. Our provision of vehicle financing is subject to federal and state laws regulating the provision of consumer finance. Our facilities and business operations are subject to laws and regulations relating to environmental protection and health and safety. In addition to these laws and regulations that apply specifically to our business, we are also subject to laws and regulations affecting public companies and large employers generally, including privacy laws and federal employment practices, securities and tax laws. For additional discussion of these laws and regulations, see the section of this Form 10-K titled “Business – Laws and Regulations.”
The violation of any of these laws or regulations could result in administrative, civil or criminal penalties or in a cease-and-desist order against our business operations, any of which could damage our reputation and have a material adverse effect on our business, sales and results of operations. We have incurred and will continue to incur capital and operating expenses and other costs to comply with these laws and regulations.
Our failure to manage our growth and the related challenges could have a material adverse effect on our business, sales and results of operations.
Our growth is dependent on the success of our omni-channel experience as well as on opening stores in new and existing markets and continued sales growth in our existing stores. The omni-channel rollout and the expansion of our store base places significant demands on our management team, our associates and our information systems. If we fail to effectively or efficiently manage our growth, it could have a material adverse effect on our business, sales and results of operations. Sales growth in our existing stores requires that we continue to effectively execute our business strategies and implement new and ongoing initiatives to elevate the experience of our customers. See the risk factor above titled “Our failure to realize the benefits associated with our omni-channel initiatives could have a material adverse effect on our business, sales and results of operations” for more discussion of this risk. The expansion of our store base and implementation of new initiatives also requires us to recruit and retain the associates necessary to support that expansion. See the risk factor above titled “Our success depends upon the continued contributions of our associates” for discussion of this risk. The expansion of our store base also requires real estate. Our inability to acquire or lease suitable real estate at favorable terms could limit our expansion and could have a material adverse effect on our business and results of operations.
15
Subsequent to the end of fiscal 2020, we paused our store expansion strategy and the implementation of certain of our customer experience initiatives in recognition of the potential impact of the COVID-19 health crisis on our business and financial condition. While the ultimate duration and impact of this pause is unknown, it could have a material adverse effect on our business, sales and results of operations.
We rely on sophisticated information systems to run our business. The failure of these systems, or the inability to enhance our capabilities, could have a material adverse effect on our business, sales and results of operations.
Our business is dependent upon the integrity and efficient operation of our information systems. In particular, we rely on our information systems to manage sales, inventory, our customer-facing websites and applications (carmax.com, CarMax mobile apps, and carmaxauctions.com), consumer financing and customer information. The failure of these systems to perform as designed, the failure to maintain or update these systems as necessary, or the inability to enhance our information technology capabilities, could disrupt our business operations and have a material adverse effect on our sales and results of operations.
Despite our ongoing efforts to maintain and enhance the integrity and security of these systems, we could be subjected to attacks by hackers, including denial-of-service attacks directed at our websites or other system breaches or malfunctions due to associate error or misconduct or other disruptions. Such incidents could disrupt our business and have a material adverse effect on sales and results of operations. See the risk factor above titled “We collect sensitive confidential information from our customers” for the risks associated with a breach of confidential customer or associate information.
In addition, COVID-19 may have an adverse impact on our information technology systems, including telecommuting issues associated with certain associates working remotely or an increase in online transactions due to disruptions or closures of our retail store operations that overburdens our existing information technology systems.
We rely on third-party vendors for key components of our business.
Many components of our business, including data management, key operational processes and critical customer systems are provided by third parties. We carefully select our third-party vendors, but we do not control their actions. If our vendors fail to perform as we expect, our operations and reputation could suffer if the failure harms the vendors’ ability to serve us and our customers. One or more of these third-party vendors may experience financial distress, staffing shortages or liquidity challenges, file for bankruptcy protection, go out of business, or suffer disruptions in their business due to the COVID-19 outbreak. The use of third-party vendors represents an unavoidable inherent risk to our company that could have a material adverse effect on our business, sales and results of operations.
We are subject to various legal proceedings. If the outcomes of these proceedings are adverse to CarMax, it could have a material adverse effect on our business, results of operations and financial condition.
We are subject to various litigation matters from time to time, which could have a material adverse effect on our business, results of operations and financial condition. Claims arising out of actual or alleged violations of law could be asserted against us by individuals, either individually or through class actions, or by governmental entities in civil or criminal investigations and proceedings. These claims could be asserted under a variety of laws including, but not limited to, consumer finance laws, consumer protection laws, intellectual property laws, privacy laws, labor and employment laws, securities laws and employee benefit laws. These actions could expose us to adverse publicity and to substantial monetary damages and legal defense costs, injunctive relief and criminal and civil fines and penalties including, but not limited to, suspension or revocation of licenses to conduct business.
Our business is sensitive to conditions affecting automotive manufacturers, including manufacturer recalls.
Adverse conditions affecting one or more automotive manufacturers could have a material adverse effect on our sales and results of operations and could impact the supply of vehicles, including the supply of late-model used vehicles. In addition, manufacturer recalls are a common occurrence. Because we do not have manufacturer authorization to complete recall-related repairs, some vehicles we sell may have unrepaired safety recalls. Such recalls, and our lack of authorization to make recall-related repairs, could adversely affect used vehicle sales or valuations, could cause us to temporarily remove vehicles from inventory, could force us to incur increased costs and could expose us to litigation and adverse publicity related to the sale of recalled vehicles, which could have a material adverse effect on our business, sales and results of operations.
16
Our failure to realize the benefits associated with our strategic investments could have a material adverse effect on our business, sales and results of operations and we may incur impairment losses on our strategic investments in equity securities.
From time to time, CarMax makes strategic investments and we currently hold non-controlling investments in the equity securities of a number of companies. For example, in January 2020, we announced that we were partnering with, and investing $50 million in Edmunds for a minority stake in the company. We may encounter difficulties in managing strategic investments and in assimilating new capabilities to meet the future needs of our business. Furthermore, we may not realize all of the anticipated benefits of these investments, or the realized benefits may be significantly delayed. While our evaluation of any potential transaction includes business, legal, and financial due diligence with the goal of identifying and evaluating the material risks involved, our due diligence reviews may not identify all of the issues necessary to accurately estimate the cost and potential benefits and risks of a particular investment.
Additionally, under GAAP, if any investment’s fair value declines below its carrying value, we will need to record an impairment loss in the applicable fiscal period. As a result, we may incur expenses related to the impairment of existing or future equity investments. Any such impairment charge could have a material adverse effect on our business, financial condition and results of operations.
Our results of operations and financial condition are subject to management’s accounting judgments and estimates, as well as changes in accounting policies.
The preparation of our financial statements requires us to make estimates and assumptions affecting the reported amounts of CarMax’s assets, liabilities, revenues, expenses and earnings. If these estimates or assumptions are incorrect, it could have a material adverse effect on our results of operations or financial condition. We have identified several accounting policies as being “critical” to the fair presentation of our financial condition and results of operations because they involve major aspects of our business and require us to make judgments about matters that are inherently uncertain. These policies are described in Item 7. Management’s Discussion and Analysis of Financial Condition and Results of Operations, and the notes to consolidated financial statements included in Item 8. Consolidated Financial Statements and Supplementary Data.
The implementation of new accounting requirements or other changes to U.S. generally accepted accounting principles could have a material adverse effect on our reported results of operations and financial condition.
The market price of our common stock may be volatile and could expose us to securities class action litigation.
The price of our common stock may be subject to wide fluctuations based upon our operating results, general economic and market conditions, general trends and prospects for our industry, announcements by our competitors and other factors. In addition, the market price of our common stock may also be affected by whether we meet analysts’ expectations. Failure to meet such expectations could have a material adverse effect on the price of our common stock. Following periods of volatility in the market price of a company’s securities, securities class action litigation may be initiated. If similar litigation were instituted against us, it could result in substantial costs and a diversion of our attention and resources, which could have a material adverse effect on our business.
We may not be able to adequately protect our intellectual property, which could adversely affect our business, sales, results of operations and financial condition.
Protecting our intellectual property (including patents, trademarks, copyrights, confidential information and trade secrets) is integral to our business. The failure to protect our intellectual property, including from unauthorized uses, can erode consumer trust and our brand value and have a material adverse effect on our business.
Our business is sensitive to weather events.
The occurrence of severe weather events, such as rain, hail, snow, wind, storms, hurricanes, extended periods of unusually cold weather or natural disasters, could cause store closures or affect the timing of consumer demand, either of which could adversely affect consumer traffic and could have a material adverse effect on our sales and results of operations in a given period.
We are subject to local conditions in the geographic areas in which we are concentrated.
Our performance is subject to local economic, competitive and other conditions prevailing in geographic areas where we operate. Since a large portion of our sales is generated in the Southeastern U.S., California, Texas and Washington, D.C./Baltimore, our results of operations depend substantially on general economic conditions and consumer spending habits in these markets. In
17
the event that any of these geographic areas experience a downturn in economic conditions, it could have a material adverse effect on our business, sales and results of operations.
Item 1B. Unresolved Staff Comments.
None.
Item 2. Properties.
We conduct our retail vehicle operations primarily in two formats – production and non-production stores. Production stores are those locations at which vehicle reconditioning is performed. Production stores have more service bays and require additional space for reconditioning activities and, therefore, are generally larger than non-production stores. In determining whether to construct a production or a non-production store on a given site, we take several factors into account, including the anticipated long-term regional reconditioning needs and the available acreage of the sites in that market. As a result, some stores that are constructed to accommodate reconditioning activities may initially be operated as non-production stores until we expand our presence in that market. We also have production and non-production stores that operate in Metropolitan Statistical Areas (“MSAs”) of less than 600,000 people, which we define as small markets. Some of these stores also have a smaller footprint compared with our stores in larger markets.
USED CAR STORES BY FORMAT AS OF FEBRUARY 29, 2020
Production Stores | Non-production Stores | |
Store count | 102 | 114 |
Store location size | generally 10 - 25 acres | generally 4 - 12 acres |
Stores located in small MSAs | 11 | 41 |
As of February 29, 2020, we operated 74 wholesale auctions, most of which were located at production stores. Stores at which auctions are conducted generally have additional space to store wholesale inventory.
18
USED CAR STORES BY STATE AS OF FEBRUARY 29, 2020
State | Count | State | Count | |||
Alabama | 5 | Missouri | 3 | |||
Arizona | 4 | Nebraska | 1 | |||
California | 27 | Nevada | 4 | |||
Colorado | 6 | New Hampshire | 1 | |||
Connecticut | 3 | New Jersey | 2 | |||
Delaware | 1 | New Mexico | 2 | |||
Florida | 19 | New York | 3 | |||
Georgia | 11 | North Carolina | 11 | |||
Idaho | 1 | Ohio | 5 | |||
Illinois | 9 | Oklahoma | 3 | |||
Indiana | 3 | Oregon | 3 | |||
Iowa | 1 | Pennsylvania | 4 | |||
Kansas | 2 | Rhode Island | 1 | |||
Kentucky | 2 | South Carolina | 4 | |||
Louisiana | 4 | Tennessee | 10 | |||
Maine | 1 | Texas | 23 | |||
Maryland | 7 | Utah | 1 | |||
Massachusetts | 4 | Virginia | 10 | |||
Michigan | 1 | Washington | 5 | |||
Minnesota | 2 | Wisconsin | 4 | |||
Mississippi | 3 | Total | 216 | |||
Of the 216 used car stores open as of February 29, 2020, 138 were located on owned sites and 78 were located on leased sites. The leases are classified as follows:
Land-only leases | 22 | |
Land and building leases | 56 | |
Total leased sites | 78 | |
As of February 29, 2020, we leased our CAF office buildings in Atlanta, Georgia, as well as office buildings for our customer experience centers in Atlanta, Georgia; Kansas City, Missouri; and Phoenix, Arizona. We also lease other ancillary properties to support our corporate and store operations. We own our home office building in Richmond, Virginia and land associated with planned future store openings.
Item 3. Legal Proceedings.
Information in response to this Item is included in Note 17 to the Consolidated Financial Statements included in Item 8 of this Annual Report on Form 10-K and is incorporated herein by reference.
Item 4. Mine Safety Disclosures.
None.
19
INFORMATION ABOUT OUR EXECUTIVE OFFICERS
The following table identifies our current executive officers. We are not aware of any family relationships among any of our executive officers or between any of our executive officers and any directors. All executive officers are elected annually and serve for one year or until their successors are elected and qualify. The next election of officers will occur in June 2020.
Name | Age | Office | ||
William D. Nash………………………..….……........... | 50 | President, Chief Executive Officer and Director | ||
Thomas W. Reedy……………………….…..…............. | 56 | Executive Vice President, Finance | ||
Edwin J. Hill……………………....……………............ | 60 | Executive Vice President and Chief Operating Officer | ||
James Lyski………………….……..…………….......... | 57 | Executive Vice President and Chief Marketing Officer | ||
Eric M. Margolin………………….……..……….......... | 67 | Executive Vice President, General Counsel and Corporate Secretary | ||
Diane L. Cafritz……………………....……………....... | 49 | Senior Vice President and Chief Human Resources Officer | ||
Jon G. Daniels………………….……..…………........... | 48 | Senior Vice President, CarMax Auto Finance | ||
Enrique Mayor-Mora...................................................... | 51 | Senior Vice President and Chief Financial Officer | ||
Shamim Mohammad………………….……..…...…..... | 51 | Senior Vice President and Chief Information and Technology Officer | ||
Darren C. Newberry......................................................... | 50 | Senior Vice President, Store Operations | ||
C. Joseph Wilson............................................................. | 47 | Senior Vice President, Store Strategy and Logistics | ||
Mr. Nash joined CarMax in 1997 as auction manager. In 2007, he was promoted to vice president and later, senior vice president of merchandising, a position he held until 2011, when he was named senior vice president, human resources and administrative services. In 2012, he was promoted to executive vice president, human resources and administrative services. In February 2016, he was promoted to president, and in September 2016, he was promoted to chief executive officer and named to the board of directors. Prior to joining CarMax, Mr. Nash worked at Circuit City.
Mr. Reedy joined CarMax in 2003 as its vice president and treasurer and, in January 2010, was promoted to senior vice president, finance. In October 2010, Mr. Reedy was promoted to senior vice president and chief financial officer. In 2012, he was promoted to executive vice president and chief financial officer. In 2019, he was named executive vice president, finance. Prior to joining CarMax, Mr. Reedy was vice president, corporate development and treasurer of Gateway, Inc., a technology retail company.
Mr. Hill joined CarMax in 1995 as director of service operations and, in 2000, was promoted to assistant vice president, service operations. In 2001, Mr. Hill was promoted to vice president, service operations, a position he held until 2010, when he was promoted to senior vice president of service operations. In 2013, Mr. Hill was promoted to senior vice president, strategy and transformation and in 2016, he was promoted to executive vice president, strategy and business transformation. Mr. Hill was promoted to executive vice president and chief operating officer in August 2018.
Mr. Lyski joined CarMax in August 2014 as senior vice president and chief marketing officer. In 2017, he was promoted to executive vice president and chief marketing officer. Prior to joining CarMax, he served as chief marketing officer of The Scotts Miracle-Gro Company from 2011 to 2014 and as chief marketing officer at Nationwide Mutual Insurance Company from 2006 to 2010. In addition, Mr. Lyski has held marketing leadership positions at Cigna Healthcare Inc. and FedEx Corporation.
Mr. Margolin joined CarMax in 2007 as senior vice president, general counsel and corporate secretary. In 2016, Mr. Margolin was promoted to executive vice president, general counsel and corporate secretary. Prior to joining CarMax, he was senior vice president, general counsel and corporate secretary with Advance Auto Parts, Inc. and, before that, vice president, general counsel and corporate secretary with Tire Kingdom, Inc.
Ms. Cafritz joined CarMax in 2003 as assistant general counsel. She was promoted to associate general counsel, director in 2005, deputy general counsel, assistant vice president in 2010, and vice president in 2014. During her tenure in the CarMax legal department, Ms. Cafritz managed commercial and consumer litigation, was responsible for operational regulatory guidance and led CarMax’s government affairs program. In 2017, Ms. Cafritz was named senior vice president and chief human resources officer. Prior to joining CarMax, Ms. Cafritz was a partner at McDermott, Will & Emery.
Mr. Daniels joined CarMax in 2008 as vice president, risk and analytics. In 2014, he was promoted to senior vice president, CarMax Auto Finance. Prior to joining CarMax, Mr. Daniels served as group director, credit risk management of HSBC and vice president of Metris.
20
Mr. Mayor-Mora joined CarMax in 2011 as vice president, finance before assuming the role of vice president and treasurer in 2016. Mr. Mayor-Mora was promoted to senior vice president and chief financial officer in October 2019. Prior to joining CarMax, he served as vice president of financial planning and analysis and investor relations at Denny’s Corporation from 2005 to 2011. He also served in financial positions of increasing responsibility at Gap, Inc. from 2001 to 2005.
Mr. Mohammad joined CarMax in 2012 as vice president of application development and IT planning. In 2014, he was promoted to senior vice president and chief information officer. In 2018, he was named senior vice president and chief information and technology officer. Prior to joining CarMax, Mr. Mohammad was vice president of information technology at BJ’s Wholesale Club from 2006 to 2012 and held various positions at Blockbuster and TravelCLICK.
Mr. Newberry joined CarMax in March 2004 as location general manager-in-training in the Los Angeles region and was promoted to location general manager of the Duarte, California store in 2006. He was subsequently promoted to positions of increasing responsibility, including regional vice president general manager in 2013 and vice president, regional sales in 2016. In 2017, he was promoted to senior vice president, store operations. Prior to joining CarMax, Mr. Newberry served as store manager and area manager for Bed, Bath and Beyond from 1994 to 2004.
Mr. Wilson joined CarMax in 1995 as a buyer-in-training at the Raleigh, North Carolina store, where he was subsequently promoted to buyer and then senior buyer. Mr. Wilson later served as purchasing manager at two CarMax stores in southern Florida before being promoted to regional vice president of merchandising. He was promoted to assistant vice president, auction services and merchandising development in 2008, vice president, auction services and merchandising development in 2013, and then vice president, merchandising operations in 2016. In 2017, Mr. Wilson was promoted to senior vice president, store strategy and logistics.
21
PART II
Item 5. Market for the Registrant’s Common Equity, Related Stockholder Matters and Issuer Purchases of Equity Securities.
Our common stock is listed and traded on the New York Stock Exchange under the ticker symbol KMX. We are authorized to issue up to 350,000,000 shares of common stock and up to 20,000,000 shares of preferred stock. As of February 29, 2020, there were 163,081,376 shares of CarMax common stock outstanding and we had approximately 3,000 shareholders of record. As of that date, there were no preferred shares outstanding.
We have not paid any dividends on our common stock and do not plan to pay dividends on our common stock for the foreseeable future.
During the fourth quarter of fiscal 2020, we sold no CarMax equity securities that were not registered under the Securities Act.
Issuer Purchases of Equity Securities
The following table provides information relating to the company’s repurchase of common stock during the fourth quarter of fiscal 2020. The table does not include transactions related to employee equity awards or the exercise of employee stock options.
Approximate | ||||||||||||||
Dollar Value | ||||||||||||||
Total Number | of Shares that | |||||||||||||
Total Number | Average | of Shares Purchased | May Yet Be | |||||||||||
of Shares | Price Paid | as Part of Publicly | Purchased Under | |||||||||||
Period | Purchased | per Share | Announced Programs | the Programs (1) | ||||||||||
December 1-31, 2019 | 430,093 | $ | 92.54 | 430,093 | $ | 1,626,158,768 | ||||||||
January 1-31, 2020 | 267,955 | $ | 87.76 | 267,955 | $ | 1,602,642,182 | ||||||||
February 1-29, 2020 | 524,200 | $ | 95.96 | 524,200 | $ | 1,552,337,370 | ||||||||
Total | 1,222,248 | 1,222,248 | ||||||||||||
(1) | On October 23, 2018, the board authorized the repurchase of up to $2 billion of our common stock with no expiration date. Purchases may be made in open market or privately negotiated transactions at management’s discretion and the timing and amount of repurchases are determined based on share price, market conditions, legal requirements and other factors. Shares repurchased are deemed authorized but unissued shares of common stock. |
22
Performance Graph
The following graph compares the cumulative total shareholder return (stock price appreciation plus dividends, as applicable) on our common stock for the last five fiscal years with the cumulative total return of the S&P 500 Index and the S&P 500 Retailing Index. The graph assumes an original investment of $100 in CarMax common stock and in each index on February 28, 2015, and the reinvestment of all dividends, as applicable.
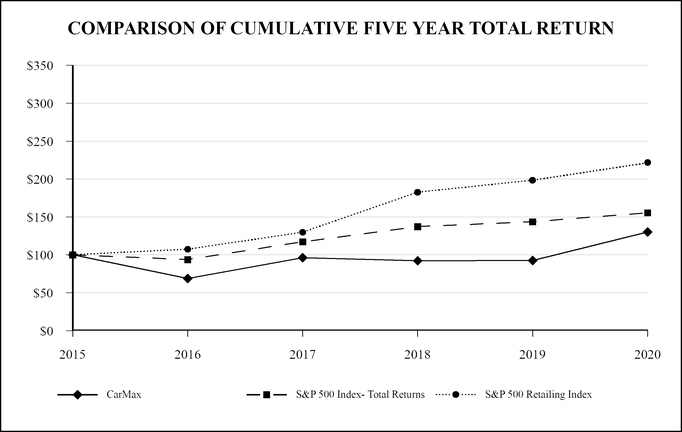
As of February 28 or 29 | |||||||||||||||||||||||
2015 | 2016 | 2017 | 2018 | 2019 | 2020 | ||||||||||||||||||
CarMax | $ | 100.00 | $ | 68.93 | $ | 96.17 | $ | 92.27 | $ | 92.53 | $ | 130.10 | |||||||||||
S&P 500 Index | $ | 100.00 | $ | 93.81 | $ | 117.24 | $ | 137.29 | $ | 143.71 | $ | 155.49 | |||||||||||
S&P 500 Retailing Index | $ | 100.00 | $ | 107.24 | $ | 129.78 | $ | 182.48 | $ | 198.27 | $ | 221.61 | |||||||||||
23
Item 6. Selected Financial Data.
(Dollars and shares in millions, except per share or per unit data) | FY20 | FY19 | FY18 | FY17 | FY16 | ||||||||||||||
Income statement information | |||||||||||||||||||
Used vehicle sales | $ | 17,169.5 | $ | 15,172.8 | $ | 14,392.4 | $ | 13,270.7 | $ | 12,439.4 | |||||||||
Wholesale vehicle sales | 2,500.0 | 2,393.0 | 2,181.2 | 2,082.5 | 2,188.3 | ||||||||||||||
Net sales and operating revenues | 20,320.0 | 18,173.1 | 17,120.2 | 15,875.1 | 15,149.7 | ||||||||||||||
Gross profit | 2,722.3 | 2,480.6 | 2,328.9 | 2,183.3 | 2,018.8 | ||||||||||||||
CarMax Auto Finance income | 456.0 | 438.7 | 421.2 | 369.0 | 392.0 | ||||||||||||||
Selling, general and administrative expenses | 1,940.1 | 1,730.3 | 1,617.1 | 1,488.5 | 1,351.9 | ||||||||||||||
Interest expense | 83.0 | 75.8 | 70.7 | 56.4 | 36.4 | ||||||||||||||
Net earnings | 888.4 | 842.4 | 664.1 | 627.0 | 623.4 | ||||||||||||||
Share and per share information | |||||||||||||||||||
Weighted average diluted shares outstanding | 166.8 | 175.9 | 184.5 | 192.2 | 205.5 | ||||||||||||||
Diluted net earnings per share | $ | 5.33 | $ | 4.79 | $ | 3.60 | $ | 3.26 | $ | 3.03 | |||||||||
Balance sheet information | |||||||||||||||||||
Auto loans receivable, net | $ | 13,551.7 | $ | 12,428.5 | $ | 11,535.7 | $ | 10,596.1 | $ | 9,536.9 | |||||||||
Total assets | 21,082.2 | 18,717.9 | 17,486.3 | 16,279.4 | 14,459.9 | ||||||||||||||
Total current liabilities | 1,534.7 | 1,311.5 | 1,174.1 | 1,105.8 | 1,005.2 | ||||||||||||||
Total notes payable and other debt: | |||||||||||||||||||
Non-recourse notes payable | 13,589.5 | 12,512.3 | 11,622.4 | 10,720.9 | 9,507.2 | ||||||||||||||
Other (1) | 1,788.0 | 1,660.5 | 1,481.9 | 1,436.0 | 1,127.1 | ||||||||||||||
Unit sales information | |||||||||||||||||||
Used vehicle units sold | 832,640 | 748,961 | 721,512 | 671,294 | 619,936 | ||||||||||||||
Wholesale vehicle units sold | 466,177 | 447,491 | 408,509 | 391,686 | 394,437 | ||||||||||||||
Per unit information | |||||||||||||||||||
Used vehicle gross profit | $ | 2,186 | $ | 2,175 | $ | 2,173 | $ | 2,163 | $ | 2,159 | |||||||||
Wholesale vehicle gross profit | 975 | 963 | 961 | 926 | 984 | ||||||||||||||
SG&A per used unit | 2,330 | 2,310 | 2,241 | 2,217 | 2,181 | ||||||||||||||
Percent changes in | |||||||||||||||||||
Comparable store used vehicle unit sales | 7.7 | % | 0.3 | % | 2.0 | % | 4.3 | % | 2.4 | % | |||||||||
Total used vehicle unit sales | 11.2 | 3.8 | 7.5 | 8.3 | 6.5 | ||||||||||||||
Wholesale vehicle unit sales | 4.2 | 9.5 | 4.3 | (0.7 | ) | 4.9 | |||||||||||||
CarMax Auto Finance information | |||||||||||||||||||
CAF total interest margin (2) | 5.7 | % | 5.6 | % | 5.7 | % | 5.8 | % | 6.1 | % | |||||||||
Other information | |||||||||||||||||||
Used car stores | 216 | 203 | 188 | 173 | 158 | ||||||||||||||
Associates | 27,050 | 25,946 | 25,110 | 24,344 | 22,429 | ||||||||||||||
(1) | In connection with our adoption of Accounting Standards Update (“ASU”) 2016-02, Leases (“ASC 842”) during the current fiscal year, certain prior period amounts have been reclassified to conform to the current year’s presentation. |
(2) | Represents CAF total interest margin (which reflects the spread between interest and fees charged to consumers and our funding costs) as a percentage of total average managed receivables. |
24
Item 7. Management’s Discussion and Analysis of Financial Condition and Results of Operations.
The following Management’s Discussion and Analysis of Financial Condition and Results of Operations (“MD&A”) is provided as a supplement to, and should be read in conjunction with, our audited consolidated financial statements and the accompanying notes presented in Item 8. Consolidated Financial Statements and Supplementary Data. Note references are to the notes to consolidated financial statements included in Item 8. Certain prior year amounts have been reclassified to conform to the current year’s presentation. All references to net earnings per share are to diluted net earnings per share. Amounts and percentages may not total due to rounding.
OVERVIEW
See Part I, Item 1 for a detailed description and discussion of the company’s business.
CarMax is the nation’s largest retailer of used vehicles. We operate in two reportable segments: CarMax Sales Operations and CarMax Auto Finance (“CAF”). Our CarMax Sales Operations segment consists of all aspects of our auto merchandising and service operations, excluding financing provided by CAF. Our CAF segment consists solely of our own finance operation that provides financing to customers buying retail vehicles from CarMax.
CarMax Sales Operations
Our sales operations segment consists of retail sales of used vehicles and related products and services, such as wholesale vehicle sales; the sale of extended protection plan (“EPP”) products, which include extended service plans (“ESPs”) and guaranteed asset protection (“GAP”); and vehicle repair service. We offer competitive, no-haggle prices; a broad selection of CarMax Quality Certified used vehicles; value-added EPP products; and superior customer service. Our website and related mobile apps are tools for communicating the CarMax consumer offer in detail; sophisticated search engines for finding the right vehicle; and sales channels for customers who prefer to conduct all or part of the shopping and sales process online.
Our customers finance the majority of the retail vehicles purchased from us, and availability of on-the-spot financing is a critical component of the sales process. We provide financing to qualified retail customers through CAF and our arrangements with industry-leading third-party finance providers. All of the finance offers, whether by CAF or our third-party providers, are backed by a 3-day payoff option.
As of February 29, 2020, we operated 216 used car stores in 106 U.S. television markets. As of that date, we also conducted wholesale auctions at 74 used car stores and we operated 2 new car franchises.
CarMax Auto Finance
In addition to third-party finance providers, we provide vehicle financing through CAF, which offers financing solely to customers buying retail vehicles from CarMax. CAF allows us to manage our reliance on third-party finance providers and to leverage knowledge of our business to provide qualifying customers a competitive financing option. As a result, we believe CAF enables us to capture additional profits, cash flows and sales. CAF income primarily reflects the interest and fee income generated by the auto loans receivable less the interest expense associated with the debt issued to fund these receivables, a provision for estimated loan losses and direct expenses. CAF income does not include any allocation of indirect costs. After the effect of 3-day payoffs and vehicle returns, CAF financed 42.5% of our retail used vehicle unit sales in fiscal 2020. As of February 29, 2020, CAF serviced approximately 1,036,000 customer accounts in its $13.62 billion portfolio of managed receivables.
Management regularly analyzes CAF’s operating results by assessing the competitiveness of our consumer offer, profitability, the performance of the auto loans receivable, including trends in credit losses and delinquencies, and CAF direct expenses.
25
Revenues and Profitability
Our primary sources of revenue and gross profit from CarMax Sales Operations for fiscal 2020 are as follows:
Net Sales and Operating Revenues | Gross Profit | |
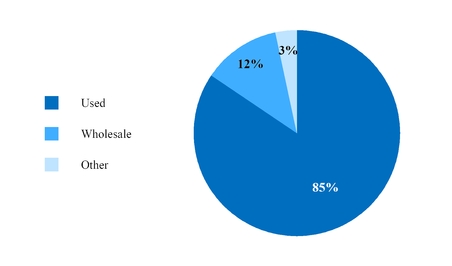
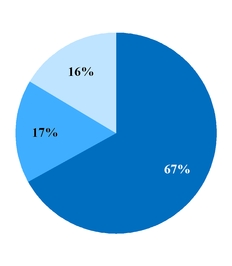
A high-level summary of our financial results from fiscal 2020 compared with fiscal 2019 is as follows:
(Dollars in millions except per share or per unit data) | 2020 | Change from 2019 | ||||
Income statement information | ||||||
Net sales and operating revenues | $ | 20,320.0 | 11.8 | % | ||
Gross profit | $ | 2,722.3 | 9.7 | % | ||
CAF income | $ | 456.0 | 4.0 | % | ||
Selling, general and administrative expenses | $ | 1,940.1 | 12.1 | % | ||
Net earnings | $ | 888.4 | 5.5 | % | ||
Unit sales information | ||||||
Used unit sales | 832,640 | 11.2 | % | |||
Change in used unit sales in comparable stores | 7.7 | % | N/A | |||
Wholesale unit sales | 466,177 | 4.2 | % | |||
Per unit information | ||||||
Used gross profit per unit | $ | 2,186 | 0.5 | % | ||
Wholesale gross profit per unit | $ | 975 | 1.2 | % | ||
SG&A per used vehicle unit | $ | 2,330 | 0.9 | % | ||
Per share information | ||||||
Net earnings per diluted share | $ | 5.33 | 11.3 | % | ||
Refer to “Results of Operations” for further details on our revenues and profitability. A discussion regarding Results of Operations and Financial Condition for fiscal 2019 as compared to fiscal 2018 is included in Part II, Item 7 of our Annual Report on Form 10-K for the fiscal year ended February 28, 2019, filed with the SEC on April 19, 2019.
Impact of COVID-19
In March 2020, the World Health Organization declared the outbreak of COVID-19 as a global pandemic, and, in the following weeks, many U.S. states and localities issued lockdown orders impacting the operations of our stores and consumer demand. We are following the mandates from public health officials and government agencies, including implementation of enhanced cleaning measures, social distancing guidelines and, in many localities, the closing of stores and wholesale auctions. We continue to monitor the situation closely and it is possible that we will implement further measures.
26
The positive sales momentum experienced in fiscal 2020 carried into the beginning of March, with robust comparable store used unit sales through the first week of the month. Since then, the COVID-19 situation within the U.S. has rapidly escalated and approximately half of our stores have been closed or have run under limited operations. Based upon the fluidity of the current environment, we expect that stores will continue to re-open or close in accordance with government mandates or public health concerns. Consumer demand has deteriorated and sales have dropped significantly; most of our stores that remain open are selling 50% or less of what they sold last year, a trend that continued into April 2020. For wholesale, we have moved many of our auctions to an online platform as a number of our auction locations are closed. We expect our sales to continue to be impacted during fiscal 2021, but the extent and duration of those impacts remains uncertain at this time. We also anticipate pressure on our gross profit per unit in the near-term as we attempt to right-size our inventory levels in light of the current environment.
CAF loan origination volume has been consistent with our sales performance noted above. During the second half of March and continuing into April 2020, we have seen an increase in delinquencies and greater demand for payment extensions. We expect our loan portfolio to continue to be negatively impacted during fiscal 2021, but the extent and duration of those impacts remains uncertain at this time. Similarly, while we anticipate some unfavorable loss experience as a result of the COVID-19 situation, we are unable to determine the impact on our future results at this time.
At CAF, we have begun to implement a variety of measures to support our customers through this difficult time and enhance long-term collectability for the portfolio. This includes suspending repossessions, waiving late fees, and providing loan payment extensions where appropriate. We have also mobilized our associates to work remotely while responding to the increasing demands of our customers. Given the current economic outlook, we have also paused our in-house Tier 3 lending. We have made no changes to our core lending standards but are monitoring trends in customer demographics and credit mix and will adjust accordingly.
We have taken certain measures in response to the COVID-19 situation, subsequent to the end of our fiscal year, to enhance our liquidity position and provide additional financial flexibility, including drawing down additional funds on our revolving credit facility. During March 2020, we made net borrowings under this facility of approximately $675 million, following which more than $300 million in unused borrowing capacity remained. As of March 31, 2020, we had approximately $700 million of cash and cash equivalents on hand and more than $2.5 billion of inventory. We also owned real estate and buildings at more than 140 locations across the country, with a net book value in excess of $1.8 billion.
In addition, we halted our stock repurchase program, although the repurchase authorization remains effective, and temporarily paused our store expansion strategy and remodels.
In order to best position ourselves to emerge in strong financial health after the COVID-19 situation stabilizes, we have begun reducing inventory levels and aligning operating expenses to the state of the business. This includes implementing a hiring freeze, reducing advertising spending and reducing labor hours.
In April 2020, we announced approximately 15,500 associates have been placed on furlough, effective April 18, 2020. The majority of furloughed associates are employed at stores that are currently closed due to government mandates. Prior to the effective date of any furlough, we provided transition pay to each impacted associate. In addition, for furloughed associates enrolled in our medical plan, we are paying the current cost of the associate’s portion of the medical plan, plus the employer portion, until further notice. We are also providing resources to help associates understand the changes and take advantage of the assistance available under the new CARES Act, which should provide significant financial support for most furloughed employees. Additionally, our president and CEO is forgoing 50% of his salary, each member of our senior leadership team is taking a reduction in pay until further notice and our board of directors has unanimously determined to forgo their cash retainer indefinitely.
Due to the uncertainty as to the severity and duration of the pandemic, the full impact on our revenues, profitability, financial position and liquidity is uncertain at this time, though it is important to note that the impacts on our fiscal 2020 results, as described herein, were not significant.
Liquidity
Our primary ongoing sources of liquidity include funds provided by operations, proceeds from non-recourse funding vehicles, and borrowings under our revolving credit facility or through other financing sources. During fiscal 2020, net cash used in operations totaled $236.6 million. This amount, combined with $1.08 billion of net issuances of non-recourse notes payable, resulted in $841.3 million of adjusted net cash provided by operating activities, a non-GAAP measure. This liquidity was primarily used to fund the 7.0 million common shares repurchased under our share repurchase program, our store growth and strategic initiatives.
When considering cash from operating activities, management does not include increases in auto loans receivable that have been funded with non-recourse notes payable, which are separately reflected as cash provided by financing activities. For a reconciliation of adjusted net cash provided by operating activities to net cash (used in) provided by operating activities, the most directly
27
comparable GAAP financial measure, see “Reconciliation of Adjusted Net Cash from Operating Activities” included in “FINANCIAL CONDITION – Liquidity and Capital Resources.”
As noted above, in response to the COVID-19 situation, we have taken certain measures, subsequent to the end of our fiscal year, to enhance our liquidity position and provide additional financial flexibility, including drawing down additional funds on our revolving credit facility, halting our stock repurchase program, pausing our store expansion strategy and remodels and actively aligning operating expenses to the current state of the business, including our recently announced furlough of approximately 15,500 associates in April 2020. Our current capital allocation strategy is to prioritize navigating the near-term challenges that COVID-19 presents and continuing to fund operating activities.
Future Outlook
The COVID-19 situation has created an unprecedented and challenging time. Our current focus is on positioning the company for a strong recovery when this crisis is over. As discussed above, we have taken several steps to enhance our liquidity position and provide additional financial flexibility. We have also taken steps to begin reducing our inventory and align our operating expenses to the state of the business. We plan to continue to keep our stores open where permitted to support our customers’ needs for reliable vehicles and to provide as many jobs as possible for our associates. As noted above, approximately 15,500 associates were placed on furlough effective April 18, 2020. Any ongoing furlough determinations are subject to change due to future government mandates, as well as future business conditions. We will continue to monitor the COVID-19 situation and look for ways to preserve cash and reduce our operating expenses as we are able. In the near-term, we are pivoting the roll-out of our omni experience and implementing the most pertinent parts of the experience, such as online self-progression and curbside or express pick up, as quickly and broadly as possible given the current needs of our customers.
Our long-term strategy continues to be focused on completing the rollout of our retail concept, including our omni-channel experience, and to increase our share of used vehicle unit sales in each of the markets in which we operate. Our omni-channel experience empowers customers to buy a car on their own terms, whether completely from home, in-store or through a seamlessly integrated combination of online and in-store experiences. We believe that, over the long term, used vehicle unit sales are the primary driver for earnings growth. We also believe that increased used vehicle unit sales will drive increased sales of wholesale vehicles and ancillary products and, over time, increased CAF income.
In calendar 2019, we estimate we sold approximately 4.7% of the age 0- to 10-year old vehicles sold in the current comparable store markets in which we operate and approximately 3.5% of the age 0- to 10-year old vehicles sold on a nationwide basis. Our strategy to increase our market share includes focusing on:
• | Opening stores in new markets and expanding our presence in existing markets. |
• | Delivering a customer-driven, omni-channel buying and selling experience that is a unique and powerful integration of our in-store and online capabilities. |
• | Hiring and developing an engaged and skilled workforce. |
• | Improving efficiency in our stores and our logistics operations to drive out waste. |
• | Leveraging data and advanced analytics to continuously improve the customer experience as well as our processes and systems. |
In order to execute our long-term strategy, we have invested in various strategic initiatives to increase innovation, specifically with regards to customer facing and customer-enabling technologies. We continue to make improvements to our website and enhance customer experiences, such as finance pre-approval, home delivery, online appraisal and express, or curbside, pick-up. We are also developing and implementing tools that help our associates be more efficient and effective. Additionally, we have centralized customer support in our customer experience centers (“CEC”), which we believe provides a more seamless integration between the online and in-store experience for our customers. Our use of data is a core component of these initiatives and continues to be a strategic asset for us as we leverage data to enhance the customer experience and increase operational efficiencies.
In December 2018, we launched our omni-channel car buying experience in the Atlanta market. During fiscal 2020, we continued this roll-out to additional markets, making the omni-channel experience available to more than 60% of our customers. For our remaining markets, in response to the COVID-19 health crisis, we are pivoting and implementing the most relevant parts of the omni experience given the current needs of our customers.
As of February 29, 2020, we had used car stores located in 106 television markets, which covered approximately 78% of the U.S. population. The format and operating models utilized in stores are continuously evaluated and may evolve over time based upon market and consumer expectations. We opened 13 stores in fiscal 2020, 1 store in March of fiscal 2021 and 1 store under limited operations in April of fiscal 2021. Prior to the recent COVID-19 situation in the U.S., it was our intent to open 13 stores during
28
fiscal 2021 and a similar number of stores in fiscal 2022. Given the current environment, we have paused our store expansion strategy until the COVID-19 situation stabilizes.
While we execute both our short- and long-term strategy, there are trends and factors that could impact our strategic approach or our results in the short and medium term. For additional information about risks and uncertainties facing our company, see “Risk Factors,” included in Part I, Item 1A of this Form 10-K.
CRITICAL ACCOUNTING POLICIES
Our results of operations and financial condition as reflected in the consolidated financial statements have been prepared in accordance with U.S. generally accepted accounting principles. Preparation of financial statements requires management to make estimates and assumptions affecting the reported amounts of assets, liabilities, revenues, expenses and the disclosures of contingent assets and liabilities. We use our historical experience and other relevant factors when developing our estimates and assumptions. We regularly evaluate these estimates and assumptions. Note 1 includes a discussion of significant accounting policies. The accounting policies discussed below are the ones we consider critical to an understanding of our consolidated financial statements because their application places the most significant demands on our judgment. Our financial results might have been different if different assumptions had been used or other conditions had prevailed. Additionally, we expect that the COVID-19 outbreak in March 2020 will impact future assumptions and estimates made related to the critical accounting policies listed below, though the extent of those impacts is uncertain at this time.
Financing and Securitization Transactions
We maintain a revolving funding program composed of three warehouse facilities (“warehouse facilities”) that we use to fund auto loans receivable originated by CAF. We typically elect to fund these receivables through an asset-backed term funding transaction, such as a term securitization or alternative funding arrangement, at a later date. We recognize transfers of auto loans receivable into the warehouse facilities and asset-backed term funding transactions, including term securitizations (together, “non-recourse funding vehicles”), as secured borrowings, which result in recording the auto loans receivable and the related non-recourse notes payable on our consolidated balance sheets. CAF income included in the consolidated statements of earnings primarily reflects the interest and fee income generated by the auto loans receivable less the interest expense associated with the debt issued to fund these receivables, a provision for estimated loan losses and direct CAF expenses.
See Notes 1(F), 1(H) and 4 for additional information on securitizations and auto loans receivable.
Allowance for Loan Losses
The allowance for loan losses represents an estimate of the amount of net losses inherent in our portfolio of managed receivables as of the applicable reporting date. Such losses are expected to become evident during the following 12 months. Because net loss performance can vary substantially over time, estimating net losses requires assumptions about matters that are uncertain.
The allowance for loan losses is estimated using a combination of analytical models and management judgment. These models are primarily based on the composition of the portfolio of managed receivables (including month of origination and actual prior performance of the receivables), historical observation periods and net loss data, the period of time between the loss event inherent in the portfolio and the charge-off date and forecasted forward loss curves. For receivables that have less than 18 months of performance history, the estimate also takes into account the credit grades of the receivables and historical losses by credit grade to supplement actual loss data in estimating future performance, subsequent to which the estimate reflects actual loss experience of those receivables to date along with forward loss curves to predict future performance. The forward loss curves are constructed using historical performance data and show the average timing of losses over the course of a receivable’s life.
Estimates from these models rely on historical performance information and may not fully reflect losses inherent in the present portfolio. Therefore, management also considers recent trends in delinquencies and defaults, recovery rates and the economic environment in assessing the models used in estimating the allowance for loan losses, and may adjust the allowance for loan losses to reflect factors that may not be captured in the models. In addition, management periodically considers whether the use of additional metrics would result in improved model performance and revises the models when appropriate.
Determining the appropriateness of the allowance for loan losses requires management to exercise judgment about matters that are inherently uncertain, including the timing and distribution of net losses that could materially affect the allowance for loan losses and, therefore, net earnings. To the extent that actual performance differs from our estimates, additional provision for credit losses may be required that would reduce net earnings. A 10% change in the estimated loss rates would have changed the allowance for loan losses by approximately $15.8 million as of February 29, 2020.
See Notes 1(H) and 4 for additional information on the allowance for loan losses.
29
Revenue Recognition
We recognize revenue when the earnings process is complete, generally either at the time of sale to a customer or upon delivery to a customer. As part of our customer service strategy, we guarantee the retail vehicles we sell with a 7‑day, money-back guarantee. We record a reserve for estimated returns based on historical experience and trends, and results could be affected if future vehicle returns differ from historical averages.
We also sell ESPs and GAP on behalf of unrelated third parties, who are the primary obligors, to customers who purchase a retail vehicle. The ESPs we currently offer on all used vehicles provide coverage up to 60 months (subject to mileage limitations), while GAP covers the customer for the term of their retail installment contract. We recognize revenue, on a net basis, at the time of sale. We also record a reserve, or refund liability, for estimated contract cancellations. The reserve for cancellations is evaluated for each product and is based on forecasted forward cancellation curves utilizing historical experience, recent trends and credit mix of the customer base. Our risk related to contract cancellations is limited to the revenue that we receive. Cancellations fluctuate depending on the volume of EPP sales, customer financing default or prepayment rates, and shifts in customer behavior related to changes in the coverage or term of the product. Results could be affected if actual events differ from our estimates. A 10% change in the estimated cancellation rates would have changed cancellation reserves by approximately $11.8 million as of February 29, 2020. See Note 8 for additional information on cancellation reserves.
We are contractually entitled to receive profit-sharing revenues based on the performance of the ESPs administered by third parties. These revenues are a form of variable consideration included in EPP revenues to the extent that it is probable that it will not result in a significant revenue reversal. An estimate of the amount to which we expect to be entitled, subject to various constraints, is recognized upon satisfying the performance obligation of selling the ESP. These constraints include factors that are outside of the company’s influence or control and the length of time until settlement. We apply the expected value method, utilizing historical claims and cancellation data from CarMax customers, as well as external data and other qualitative assumptions. This estimate is reassessed each reporting period with changes reflected in other sales and revenues on our consolidated statements of earnings and other assets on our consolidated balance sheets.
Customers applying for financing who are not approved or are conditionally approved by CAF are generally evaluated by other third-party finance providers. These providers generally either pay us or are paid a fixed, pre-negotiated fee per contract. We recognize these fees at the time of sale.
We collect sales taxes and other taxes from customers on behalf of governmental authorities at the time of sale. These taxes are accounted for on a net basis and are not included in net sales and operating revenues or cost of sales.
See Note 2 for additional information on revenue recognition.
RESULTS OF OPERATIONS – CARMAX SALES OPERATIONS
NET SALES AND OPERATING REVENUES
Years Ended February 29 or 28 | |||||||||||||||||
(In millions) | 2020 | Change | 2019 | Change | 2018 | ||||||||||||
Used vehicle sales | $ | 17,169.5 | 13.2 | % | $ | 15,172.8 | 5.4 | % | $ | 14,392.4 | |||||||
Wholesale vehicle sales | 2,500.0 | 4.5 | % | 2,393.0 | 9.7 | % | 2,181.2 | ||||||||||
Other sales and revenues: | |||||||||||||||||
Extended protection plan revenues | 437.4 | 14.4 | % | 382.5 | 13.7 | % | 336.4 | ||||||||||
Third-party finance fees, net | (45.8 | ) | (5.6 | )% | (43.4 | ) | 13.0 | % | (49.9 | ) | |||||||
Other | 258.9 | (3.5 | )% | 268.2 | 3.1 | % | 260.2 | ||||||||||
Total other sales and revenues | 650.5 | 7.1 | % | 607.3 | 11.1 | % | 546.7 | ||||||||||
Total net sales and operating revenues | $ | 20,320.0 | 11.8 | % | $ | 18,173.1 | 6.1 | % | $ | 17,120.2 | |||||||
UNIT SALES
Years Ended February 29 or 28 | ||||||||||||||
2020 | Change | 2019 | Change | 2018 | ||||||||||
Used vehicles | 832,640 | 11.2 | % | 748,961 | 3.8 | % | 721,512 | |||||||
Wholesale vehicles | 466,177 | 4.2 | % | 447,491 | 9.5 | % | 408,509 | |||||||
30
AVERAGE SELLING PRICES
Years Ended February 29 or 28 | |||||||||||||||||
2020 | Change | 2019 | Change | 2018 | |||||||||||||
Used vehicles | $ | 20,418 | 1.7 | % | $ | 20,077 | 1.6 | % | $ | 19,757 | |||||||
Wholesale vehicles | $ | 5,089 | (0.2 | )% | $ | 5,098 | (0.1 | )% | $ | 5,102 | |||||||
COMPARABLE STORE USED VEHICLE SALES CHANGES
Years Ended February 29 or 28 | ||||||||
2020 | 2019 | 2018 | ||||||
Used vehicle units | 7.7 | % | 0.3 | % | 2.0 | % | ||
Used vehicle dollars | 9.7 | % | 1.9 | % | 2.9 | % | ||
Stores are added to the comparable store base beginning in their fourteenth full month of operation. We do not remove renovated stores from our comparable store base. Comparable store calculations include results for a set of stores that were included in our comparable store base in both the current and corresponding prior year periods.
VEHICLE SALES CHANGES
Years Ended February 29 or 28 | ||||||||
2020 | 2019 | 2018 | ||||||
Used vehicle units | 11.2 | % | 3.8 | % | 7.5 | % | ||
Used vehicle revenues | 13.2 | % | 5.4 | % | 8.5 | % | ||
Wholesale vehicle units | 4.2 | % | 9.5 | % | 4.3 | % | ||
Wholesale vehicle revenues | 4.5 | % | 9.7 | % | 4.7 | % | ||
USED VEHICLE FINANCING PENETRATION BY CHANNEL (BEFORE THE IMPACT OF 3-DAY PAYOFFS)
Years Ended February 29 or 28 (1) | ||||||||
2020 | 2019 | 2018 | ||||||
CAF (2) | 46.7 | % | 48.4 | % | 48.4 | % | ||
Tier 2 (3) | 20.2 | 17.9 | 16.6 | |||||
Tier 3 (4) | 10.2 | 9.9 | 10.5 | |||||
Other (5) | 22.9 | 23.8 | 24.5 | |||||
Total | 100.0 | % | 100.0 | % | 100.0 | % | ||
(1) | Calculated as used vehicle units financed for respective channel as a percentage of total used units sold. |
(2) | Includes CAF’s Tier 3 loan originations, which represent less than 1% of total used units sold. |
(3) | Third-party finance providers who generally pay us a fee or to whom no fee is paid. |
(4) | Third-party finance providers to whom we pay a fee. |
(5) | Represents customers arranging their own financing and customers that do not require financing. |
CHANGE IN USED CAR STORE BASE
Years Ended February 29 or 28 | ||||||||
2020 | 2019 | 2018 | ||||||
Used car stores, beginning of year | 203 | 188 | 173 | |||||
Store openings | 13 | 15 | 15 | |||||
Used car stores, end of year | 216 | 203 | 188 | |||||
31
During fiscal 2020, we opened 13 stores, including six stores in new television markets (Waco, TX; McAllen, TX; Lubbock, TX; Palm Springs, CA; Gulfport, MS; and Ft. Wayne, IN) and seven stores in existing television markets (Memphis, TN; San Francisco, CA; Phoenix, AZ; Dallas, TX; Atlanta, GA; Portland, OR; and Nashville, TN).
Used Vehicle Sales
Fiscal 2020 Versus Fiscal 2019. The 13.2% increase in used vehicle revenues in fiscal 2020 was primarily due to an 11.2% increase in unit sales. The increase in used unit sales included a 7.7% increase in comparable store used unit sales and sales from newer stores not yet included in the comparable store base. The comparable store used unit sales performance reflected strong conversion, which was aided by continued support from our third-party lending partners and growth in selling opportunities (e.g., web and phone leads), which we believe benefited from both our national marketing campaign and the favorable response to our consumer initiatives. We believe that solid execution in operations, finance, customer progression and marketing, in addition to an overall favorable used car sales environment, also contributed to our sales growth. Our data indicates that our share of the age 0- to 10-year old used vehicles in our current comparable store markets increased approximately 4.2% to 4.7% in calendar 2019.
The increase in used unit comparable sales in fiscal 2020 was slightly stronger in markets offering a full omni-channel experience. Additionally, many of our omni-channel related digital initiatives, including improved customer lead management tools, finance self-service tools and digital merchandising, have been rolled out nationwide. We believe these initiatives supported our strong used unit comparable sales performance in markets both with and without the full omni-channel experience. We also believe all stores benefited from our national marketing campaign launched in October.
The increase in average retail selling price reflected higher vehicle acquisition costs as well as shifts in the mix of our sales by both vehicle age and class.
Wholesale Vehicle Sales
Vehicles sold at our wholesale auctions are, on average, approximately 10 years old with more than 100,000 miles and are primarily comprised of vehicles purchased through our appraisal process that do not meet our retail standards. Our wholesale auction prices usually reflect the trends in the general wholesale market for the types of vehicles we sell, although they can also be affected by changes in vehicle mix or the average age, mileage or condition of the vehicles being sold.
Fiscal 2020 Versus Fiscal 2019. The 4.5% increase in wholesale vehicle revenues in fiscal 2020 was primarily due to a 4.2% increase in wholesale unit sales. The wholesale unit growth was primarily driven by an increase in our appraisal buy rate and the growth in our store base, partially offset by lower appraisal traffic. We achieved a record buy rate in fiscal 2020. Wholesale vehicle average selling price for fiscal 2020 remained consistent with the prior year.
Other Sales and Revenues
Other sales and revenues include revenue from the sale of ESPs and GAP (collectively reported in EPP revenues, net of a reserve for estimated contract cancellations), net third-party finance fees, and other revenues, which are predominantly comprised of service department and new vehicle sales. The fees we pay to the Tier 3 providers are reflected as an offset to finance fee revenues received from the Tier 2 providers. The mix of our retail vehicles financed by CAF, Tier 2 and Tier 3 providers, or customers that arrange their own financing, may vary from quarter to quarter depending on several factors including the credit quality of applicants, changes in providers’ credit decisioning and external market conditions. Changes in originations by one tier of credit providers may also affect the originations made by providers in other tiers.
Fiscal 2020 Versus Fiscal 2019. Other sales and revenues increased 7.1% in fiscal 2020, driven by the 14.4% increase in EPP revenues. The increase in EPP revenues reflected the combined effects of our used unit growth, increased margins and increased profit-sharing revenues. These increases were partially offset by the net effects of a $15.2 million favorable adjustment to cancellation reserves during fiscal 2019 and a $2.3 million unfavorable adjustment in fiscal 2020. We recognized $20.3 million in profit-sharing revenue during fiscal 2020, an increase of $11.9 million over the prior year. We received payments of $46.0 million in the fourth quarter of fiscal 2020, representing the profit-sharing accrued during fiscal 2019 and fiscal 2020, which was based on claims experience from calendar years 2016 through 2019. In future years, we expect EPP profit-sharing revenue will be less material, as it will reflect only a single incremental year versus four years of activity.
32
GROSS PROFIT
Years Ended February 29 or 28 | |||||||||||||||||
(In millions) | 2020 | Change | 2019 | Change | 2018 | ||||||||||||
Used vehicle gross profit | $ | 1,820.1 | 11.7 | % | $ | 1,628.7 | 3.9 | % | $ | 1,567.6 | |||||||
Wholesale vehicle gross profit | 454.4 | 5.4 | % | 431.0 | 9.8 | % | 392.5 | ||||||||||
Other gross profit | 447.8 | 6.4 | % | 420.9 | 14.1 | % | 368.8 | ||||||||||
Total | $ | 2,722.3 | 9.7 | % | $ | 2,480.6 | 6.5 | % | $ | 2,328.9 | |||||||
GROSS PROFIT PER UNIT
Years Ended February 29 or 28 | |||||||||||||||||
2020 | 2019 | 2018 | |||||||||||||||
$ per unit (1) | % (2) | $ per unit (1) | % (2) | $ per unit (1) | % (2) | ||||||||||||
Used vehicle gross profit | $ | 2,186 | 10.6 | $ | 2,175 | 10.7 | $ | 2,173 | 10.9 | ||||||||
Wholesale vehicle gross profit | $ | 975 | 18.2 | $ | 963 | 18.0 | $ | 961 | 18.0 | ||||||||
Other gross profit | $ | 538 | 68.9 | $ | 562 | 69.3 | $ | 511 | 67.5 | ||||||||
Total gross profit | $ | 3,270 | 13.4 | $ | 3,312 | 13.6 | $ | 3,228 | 13.6 | ||||||||
(1) | Calculated as category gross profit divided by its respective units sold, except the other and total categories, which are divided by total used units sold. |
(2) | Calculated as a percentage of its respective sales or revenue. |
Used Vehicle Gross Profit
We target a dollar range of gross profit per used unit sold. The gross profit dollar target for an individual vehicle is based on a variety of factors, including its probability of sale and its mileage relative to its age; however, it is not primarily based on the vehicle’s selling price. Our ability to quickly adjust appraisal offers to be consistent with the broader market trade-in trends and the pace of our inventory turns reduce our exposure to the inherent continual fluctuation in used vehicle values and contribute to our ability to manage gross profit dollars per unit.
We systematically adjust individual vehicle prices based on proprietary pricing algorithms in order to appropriately balance sales trends, inventory turns and gross profit achievement. Other factors that may influence gross profit include the wholesale and retail vehicle pricing environments, vehicle reconditioning and logistics costs, and the percentage of vehicles sourced directly from consumers through our appraisal process. Vehicles purchased directly from consumers typically generate more gross profit per unit compared with vehicles purchased at auction or through other channels.
Fiscal 2020 Versus Fiscal 2019. The 11.7% increase in used vehicle gross profit in fiscal 2020 was primarily driven by the 11.2% growth in total used unit sales. Our used vehicle gross profit per unit remained consistent with fiscal 2019. We believe we can manage to a targeted gross profit per unit dollar range, subject to future changes to our business, pricing strategy or external market conditions.
Wholesale Vehicle Gross Profit
Our wholesale gross profit per unit reflects the demand for older, higher mileage vehicles, which are the mainstay of our auctions, as well as strong dealer attendance and resulting high dealer-to-car ratios at our auctions. The frequency of our auctions, which are generally held weekly or bi-weekly, minimizes the depreciation risk on these vehicles. Our ability to adjust appraisal offers in response to the wholesale pricing environment is a key factor that influences wholesale gross profit.
Fiscal 2020 Versus Fiscal 2019. The 5.4% increase in wholesale vehicle gross profit in fiscal 2020 was driven by both the 4.2% increase in wholesale unit sales and a slight increase in wholesale gross profit per unit.
Other Gross Profit
Other gross profit includes profits related to EPP revenues, net third-party finance fees and other revenues, which are predominantly comprised of service department operations, including used vehicle reconditioning, and new vehicle sales. We have no cost of sales related to EPP revenues or net third-party finance fees, as these represent revenues paid to us by certain third-party providers. Third-party finance fees are reported net of the fees we pay to third-party Tier 3 finance providers. Accordingly, changes in the relative mix of the components of other gross profit can affect the composition and amount of other gross profit.
33
Fiscal 2020 Versus Fiscal 2019. Other gross profit rose 6.4% in fiscal 2020, primarily reflecting the growth in EPP revenues discussed above, offset by a decline in service department profits of $25.4 million. Service profits were adversely affected by a recent increase in our post-sale warranty period from 30 to 90 days and near-term inefficiencies resulting from our recent ramp in technician hiring.
Impact of Inflation
Historically, inflation has not had a significant impact on results. Profitability is primarily affected by our ability to achieve targeted unit sales and gross profit dollars per vehicle rather than by changes in average retail prices. However, we believe higher vehicle acquisition prices have adversely impacted, and could impact in the future, our comparable store used unit sales growth. Changes in average vehicle selling prices also impact CAF income, to the extent the average amount financed also changes.
SG&A Expenses
COMPONENTS OF SG&A EXPENSES AS A PERCENTAGE OF TOTAL SG&A EXPENSES
Fiscal Year 2020
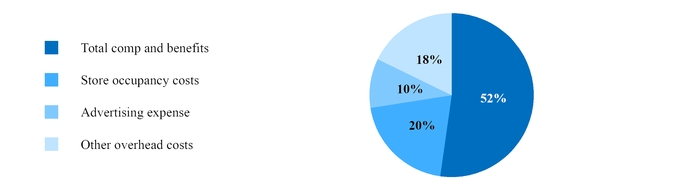
COMPONENTS OF SG&A EXPENSES COMPARED WITH PRIOR PERIODS
Years Ended February 29 or 28 | |||||||||||||||||||
(In millions except per unit data) | 2020 | Change | 2019 | Change | 2018 | ||||||||||||||
Compensation and benefits: | |||||||||||||||||||
Compensation and benefits, excluding share-based compensation expense | $ | 913.2 | 9.4 | % | $ | 835.0 | 3.7 | % | $ | 805.5 | |||||||||
Share-based compensation expense | 99.4 | 42.2 | % | 69.9 | 21.2 | % | 57.7 | ||||||||||||
Total compensation and benefits (1) | $ | 1,012.6 | 11.9 | % | $ | 904.9 | 4.8 | % | $ | 863.2 | |||||||||
Store occupancy costs | 393.4 | 9.6 | % | 359.1 | 6.5 | % | 337.3 | ||||||||||||
Advertising expense | 191.3 | 15.0 | % | 166.4 | 5.5 | % | 157.7 | ||||||||||||
Other overhead costs (2) | 342.8 | 14.3 | % | 299.9 | 15.8 | % | 258.9 | ||||||||||||
Total SG&A expenses | $ | 1,940.1 | 12.1 | % | $ | 1,730.3 | 7.0 | % | $ | 1,617.1 | |||||||||
SG&A per used vehicle unit (3) | $ | 2,330 | $ | 20 | $ | 2,310 | $ | 69 | $ | 2,241 | |||||||||
(1) | Excludes compensation and benefits related to reconditioning and vehicle repair service, which are included in cost of sales. See Note 12 for details of stock-based compensation expense by grant type. |
(2) | Includes IT expenses, preopening and relocation costs, insurance, non-CAF bad debt, travel, charitable contributions and other administrative expenses. |
(3) | Calculated as total SG&A expenses divided by total used vehicle units. |
Fiscal 2020 Versus Fiscal 2019 (Increase of $209.8 million or 12.1%). In addition to the 6% growth in our store base during fiscal 2020 (representing the addition of 13 stores), higher costs associated with our comparable store unit growth and continued spending to advance our technology platforms and support our core and omni-channel initiatives, the net increase also reflected the following:
• | $29.5 million increase in share-based compensation expense, which increased SG&A per unit by $26. The increase in share-based compensation expense was largely related to cash-settled restricted stock units, as the expense associated with these units was primarily driven by the change in the company's stock price during the relevant periods. |
34
• | $24.9 million increase in advertising expense due to our new advertising campaign launched in October 2020 and incremental marketing to support our omni-channel roll out. Advertising spend per retail unit rose modestly to $230 versus $222 in fiscal 2019. |
Interest Expense
Interest expense includes the interest related to short- and long-term debt, financing obligations and finance lease obligations. It does not include interest on the non-recourse notes payable, which is reflected within CAF income.
Fiscal 2020 Versus Fiscal 2019. Interest expense increased to $83.0 million in fiscal 2020 versus $75.8 million in fiscal 2019. The increase primarily reflected higher outstanding debt levels and an increase in finance lease obligations in fiscal 2020.
Income Taxes
The effective income tax rate was consistent with the prior year at 23.5% in fiscal 2020 versus 24.3% in fiscal 2019.
RESULTS OF OPERATIONS – CARMAX AUTO FINANCE
CAF income primarily reflects interest and fee income generated by CAF’s portfolio of auto loans receivable less the interest expense associated with the debt issued to fund these receivables, a provision for estimated loan losses and direct CAF expenses. Total interest margin reflects the spread between interest and fees charged to consumers and our funding costs. Changes in the interest margin on new originations affect CAF income over time. Increases in interest rates, which affect CAF’s funding costs, or other competitive pressures on consumer rates, could result in compression in the interest margin on new originations. Changes in the allowance for loan losses as a percentage of ending managed receivables reflect the effect of the change in loss and delinquency experience on our outlook for net losses expected to occur over the next 12 months.
CAF’s managed portfolio is composed primarily of loans originated over the past several years. Trends in receivable growth and interest margins primarily reflect the cumulative effect of changes in the business over a multi-year period. We strive to originate loans with an underlying risk profile that we believe will, in the aggregate and excluding CAF’s Tier 3 originations, result in cumulative net losses in the 2% to 2.5% range over the life of the loans. Actual loss performance of the loans may fall outside of this range based on various factors, including intentional changes in the risk profile of originations, economic conditions (including the possible effects of the COVID-19 outbreak) and wholesale recovery rates. Current period originations reflect current trends in both our retail sales and the CAF business, including the volume of loans originated, current interest rates charged to consumers, loan terms and average credit scores. Because we recognize CAF income over the life of the underlying auto loan, loans originated in a given fiscal period generally do not have a significant effect on that period’s financial results.
CAF income does not include any allocation of indirect costs. Although CAF benefits from certain indirect overhead expenditures, we have not allocated indirect costs to CAF to avoid making subjective allocation decisions. Examples of indirect costs not allocated to CAF include retail store expenses and corporate expenses.
See Note 3 for additional information on CAF income and Note 4 for information on auto loans receivable, including credit quality.
SELECTED CAF FINANCIAL INFORMATION
Years Ended February 29 or 28 | ||||||||||||||||||||
(In millions) | 2020 | % (1) | 2019 | % (1) | 2018 | % (1) | ||||||||||||||
Interest margin: | ||||||||||||||||||||
Interest and fee income | $ | 1,104.1 | 8.4 | $ | 972.9 | 8.0 | $ | 856.6 | 7.6 | |||||||||||
Interest expense | (358.1 | ) | (2.7 | ) | (289.3 | ) | (2.4 | ) | (215.0 | ) | (1.9 | ) | ||||||||
Total interest margin | $ | 746.0 | 5.7 | $ | 683.6 | 5.6 | $ | 641.6 | 5.7 | |||||||||||
Provision for loan losses | $ | (185.7 | ) | (1.4 | ) | $ | (153.8 | ) | (1.3 | ) | $ | (137.6 | ) | (1.2 | ) | |||||
CarMax Auto Finance income | $ | 456.0 | 3.5 | $ | 438.7 | 3.6 | $ | 421.2 | 3.8 | |||||||||||
(1) | Percent of total average managed receivables. |
35
CAF ORIGINATION INFORMATION (AFTER THE IMPACT OF 3-DAY PAYOFFS)
Years Ended February 29 or 28 | |||||||||||
2020 | 2019 | 2018 | |||||||||
Net loans originated (in millions) | $ | 7,089.7 | $ | 6,330.1 | $ | 5,962.2 | |||||
Vehicle units financed | 353,654 | 323,864 | 310,739 | ||||||||
Net penetration rate (1) | 42.5 | % | 43.2 | % | 43.1 | % | |||||
Weighted average contract rate | 8.4 | % | 8.5 | % | 7.8 | % | |||||
Weighted average credit score (2) | 710 | 706 | 707 | ||||||||
Weighted average loan-to-value (LTV) (3) | 94.2 | % | 94.8 | % | 95.0 | % | |||||
Weighted average term (in months) | 66.1 | 66.0 | 65.8 | ||||||||
(1) | Vehicle units financed as a percentage of total used units sold. |
(2) | The credit scores represent FICO® scores and reflect only receivables with obligors that have a FICO® score at the time of application. The FICO® score with respect to any receivable with co-obligors is calculated as the average of each obligor’s FICO® score at the time of application. FICO® scores are not a significant factor in our primary scoring model, which relies on information from credit bureaus and other application information as discussed in Note 4. FICO® is a federally registered servicemark of Fair Isaac Corporation. |
(3) | LTV represents the ratio of the amount financed to the total collateral value, which is measured as the vehicle selling price plus applicable taxes, title and fees. |
LOAN PERFORMANCE INFORMATION
As of and for the Years Ended February 29 or 28 | |||||||||||
(In millions) | 2020 | 2019 | 2018 | ||||||||
Total ending managed receivables | $ | 13,617.8 | $ | 12,510.2 | $ | 11,618.9 | |||||
Total average managed receivables | $ | 13,105.1 | $ | 12,150.2 | $ | 11,210.8 | |||||
Allowance for loan losses (1) | $ | 157.8 | $ | 138.2 | $ | 128.6 | |||||
Allowance for loan losses as a percentage of ending managed receivables | 1.16 | % | 1.10 | % | 1.11 | % | |||||
Net credit losses on managed receivables | $ | 166.1 | $ | 144.2 | $ | 132.6 | |||||
Net credit losses as a percentage of total average managed receivables | 1.27 | % | 1.19 | % | 1.18 | % | |||||
Past due accounts as a percentage of ending managed receivables | 3.44 | % | 3.61 | % | 3.38 | % | |||||
Average recovery rate (2) | 48.1 | % | 47.7 | % | 46.1 | % | |||||
(1) | The allowance for loan losses represents an estimate of the amount of net losses inherent in our portfolio of managed receivables as of the applicable reporting date and anticipated to occur during the following 12 months. |
(2) | The average recovery rate represents the average percentage of the outstanding principal balance we receive when a vehicle is repossessed and liquidated, generally at our wholesale auctions. While in any individual period conditions may vary, over the past 10 fiscal years, the annual recovery rate has ranged from a low of 46% to a high of 60%, and it is primarily affected by changes in the wholesale market pricing environment. |
Fiscal 2020 Versus Fiscal 2019.
• | CAF Income (Increase of $17.3 million or 4.0%) |
◦ | The increase in CAF income reflects an increase in the average managed receivables, partially offset by an increase in the provision for loan losses. |
◦ | Average managed receivables grew 7.9% to $13.11 billion in fiscal 2020 driven primarily by the rise in CAF loan originations in recent years. |
◦ | The growth in net loan originations in fiscal 2020 was largely due to our used vehicle sales growth as well as an increase in the average amount financed, partially offset by a decline in CAF’s penetration rate. |
• | Provision for Loan Losses (Increased to $185.7 million from $153.8 million) |
◦ | The increase in the provision for loan losses was primarily due to the growth in average managed receivables as well as a modest increase in losses. |
◦ | The allowance for loan losses as a percentage of ending managed receivables was 1.16% as of February 29, 2020 compared with 1.10% as of February 28, 2019. |
◦ | Net losses for fiscal 2020 remained well within our long-term targeted performance range. |
36
• | Total interest margin increased slightly as a percentage of average managed receivables to 5.7% in fiscal 2020 compared with 5.6% in fiscal 2019. |
Tier 3 Loan Originations. CAF also originates a small portion of auto loans to customers who typically would be financed by our Tier 3 finance providers, in order to better understand the performance of these loans, mitigate risk and add incremental profits. Historically, CAF has targeted originating approximately 5% of the total Tier 3 loan volume; however, this rate may vary over time based on market conditions. A total of $167.5 million and $162.4 million in CAF Tier 3 receivables were outstanding as of February 29, 2020 and February 28, 2019, respectively. These loans have higher loss and delinquency rates than the remainder of the CAF portfolio, as well as higher contract rates. As of February 29, 2020 and February 28, 2019, approximately 10% of the total allowance for loan losses related to the outstanding CAF Tier 3 loan balances. Subsequent to the end of fiscal 2020, we paused our CAF Tier 3 lending given the current economic outlook and uncertainty surrounding the COVID-19 outbreak.
PLANNED FUTURE ACTIVITIES
In March 2020, we opened one store in an existing market (Tampa, FL). In April 2020, we opened one store under limited operations in an existing market (Philadelphia, PA). Previously, it was our intent to open 13 stores in fiscal 2021 and a similar number of stores in fiscal 2022. While we remain committed to executing our store growth plan for the long-term benefit of customers and shareholders, we have decided to pause our store expansion and remodel strategy until the COVID-19 situation stabilizes.
RECENT ACCOUNTING PRONOUNCEMENTS
See Note 1(X) to the consolidated financial statements for information on recent accounting pronouncements applicable to CarMax.
FINANCIAL CONDITION
Liquidity and Capital Resources
Our primary ongoing cash requirements are to fund our existing operations, store expansion and improvement and CAF. Since fiscal 2013, we have also elected to use cash for our share repurchase program. Our primary ongoing sources of liquidity include funds provided by operations, proceeds from non-recourse funding vehicles and borrowings under our revolving credit facility or through other financing sources.
We currently target an adjusted debt to capital ratio in a range of 35% to 45%. At the end of fiscal 2020, our adjusted debt to capital ratio was at the lower end of our targeted range. In calculating this ratio, we utilize total debt, excluding non-recourse notes payable, finance lease liabilities, a multiple of eight times rent expense and total shareholders’ equity. Generally, we expect to use our revolving credit facility and other financing sources, together with stock repurchases, to maintain this targeted ratio; however, in any period, we may be outside this range due to seasonal, market, strategic or other factors.
We ended fiscal 2020 with a healthy liquidity position. In response to the COVID-19 crisis, we are taking immediate and proactive measures to bolster our liquidity position and provide additional financial flexibility to improve our ability to meet our short-term liquidity needs. These measures include drawing down additional funds on our revolving credit facility, halting our stock repurchase program, pausing our store expansion strategy and actively aligning operating expenses to the current state of the business, including our recently announced furlough of approximately 15,500 associates in April 2020. Our current capital allocation strategy is to prioritize navigating the near-term challenges that COVID-19 presents and continuing to fund operating activities.
Operating Activities. During fiscal 2020, net cash used in operating activities totaled $236.6 million compared with net cash provided by operating activities of $163.0 million in fiscal 2019, which included increases in auto loans receivable of $1.31 billion in fiscal 2020 and $1.05 billion in fiscal 2019. The majority of the increases in auto loans receivable are accompanied by increases in non-recourse notes payable, which are separately reflected as cash provided by financing activities.
As of February 29, 2020, total inventory was $2.85 billion, representing an increase of $327.0 million, or 13.0%, compared with the balance as of the start of the fiscal year. The increase primarily reflected the addition of inventory to support our comparable store sales growth, including seasonal sales opportunities, and new store openings in fiscal 2020. The increase also reflects a higher average carrying cost of inventory due to changes in our vehicle mix.
When considering cash from operating activities, management uses an adjusted measure of net cash from operating activities that offsets the changes in auto loans receivable with the corresponding changes in non-recourse notes payable. This is achieved by adding back the cash provided from the net issuances of non-recourse notes payable, which represents the increase in auto loans receivable that were funded through the issuance of non-recourse notes payable during the year. The resulting financial measure, adjusted net cash from operating activities, is a non-GAAP financial measure. We believe adjusted net cash from operating activities
37
is a meaningful metric for investors because it provides better visibility into the cash generated from operations. Including the increases in non-recourse notes payable, net cash provided by operating activities would have been as follows:
RECONCILIATION OF ADJUSTED NET CASH FROM OPERATING ACTIVITIES
Years Ended February 29 or 28 | |||||||||||
(In millions) | 2020 | 2019 | 2018 | ||||||||
Net cash (used in) provided by operating activities | $ | (236.6 | ) | $ | 163.0 | $ | (80.6 | ) | |||
Add: Net issuances of non-recourse notes payable (1) | 1,077.9 | 890.8 | 902.2 | ||||||||
Adjusted net cash provided by operating activities | $ | 841.3 | $ | 1,053.8 | $ | 821.6 | |||||
(1) | Calculated using the gross issuances less payments on non-recourse notes payable as disclosed on the consolidated statements of cash flows. |
Compared with fiscal 2019, the decrease in fiscal 2020 adjusted net cash provided by operating activities reflected the changes in inventory discussed above, timing and use of non-recourse funding vehicles in relation to originations of auto loans receivable, and timing-related changes to accounts receivable and other current assets, partially offset by an increase in net earnings when excluding non-cash expenses, which include depreciation and amortization, share-based compensation expense and the provisions for loan losses and cancellation reserves.
Investing Activities. Net cash used in investing activities totaled $389.4 million in fiscal 2020 and $308.5 million in fiscal 2019. Investing activities primarily consist of capital expenditures, which totaled $331.9 million in fiscal 2020 and $304.6 million in fiscal 2019. Capital expenditures primarily include store construction costs, real estate acquisitions for planned future store openings and store remodeling expenses. We maintain a multi-year pipeline of sites to support our store growth, so portions of capital spending in one year may relate to stores that we open in subsequent fiscal years. We opened 13 stores in fiscal 2020 and 15 stores in fiscal 2019.
Financing Activities. Net cash provided by financing activities totaled $687.0 million in fiscal 2020 and $186.0 million in fiscal 2019. Included in these amounts were net increases in total non-recourse notes payable of $1.08 billion and $890.8 million, respectively, which were used to provide the financing for the majority of the increases of $1.31 billion and $1.05 billion, respectively, in auto loans receivable (see Operating Activities). During fiscal 2020, we increased net borrowings under the revolving credit facility by $86.2 million, compared with increased net borrowings of $168.9 million during fiscal 2019. Net cash provided by financing activities was reduced by stock repurchases of $567.7 million in fiscal 2020 and $904.7 million in fiscal 2019.
TOTAL DEBT AND CASH AND CASH EQUIVALENTS
(In thousands) | As of February 29 or 28 | |||||||
Debt Description (1) | Maturity Date | 2020 | 2019 | |||||
Revolving credit facility (2) (4) | June 2024 | $ | 452,740 | $ | 366,529 | |||
Term loan (2) | June 2024 | 300,000 | 300,000 | |||||
3.86% Senior notes | April 2023 | 100,000 | 100,000 | |||||
4.17% Senior notes | April 2026 | 200,000 | 200,000 | |||||
4.27% Senior notes | April 2028 | 200,000 | 200,000 | |||||
Financing obligations | Various dates through February 2059 | 536,739 | 495,626 | |||||
Non-recourse notes payable | Various dates through July 2026 | 13,613,272 | 12,535,405 | |||||
Total debt (3) | $ | 15,402,751 | $ | 14,197,560 | ||||
Cash and cash equivalents | $ | 58,211 | $ | 46,938 | ||||
(1) | Interest is payable monthly, with the exception of our senior notes, which are payable semi-annually. |
(2) | Borrowings accrue interest at variable rates based on LIBOR, the federal funds rate, or the prime rate, depending on the type of borrowing. |
(3) | Total debt excludes unamortized debt issuance costs. See Note 11 for additional information. |
(4) | During March 2020, we made net borrowings under this facility of approximately $675 million, following which more than $300 million in unused borrowing capacity remained. |
Borrowings under our $1.45 billion unsecured revolving credit facility are available for working capital and general corporate purposes, and the unused portion is fully available to us. The credit facility, term loan and senior note agreements contain
38
representations and warranties, conditions and covenants. If these requirements are not met, all amounts outstanding or otherwise owed could become due and payable immediately and other limitations could be placed on our ability to use any available borrowing capacity. As of February 29, 2020, we were in compliance with these financial covenants. As of that date, our performance under these covenants could degrade such that, if the covenant ratios were to double, we would still remain in compliance.
See Note 11 for additional information on our revolving credit facility, term loan, senior notes and financing obligations.
CAF auto loans receivable are primarily funded through our warehouse facilities and asset-backed term funding transactions. These non-recourse funding vehicles are structured to legally isolate the auto loans receivable, and we would not expect to be able to access the assets of our non-recourse funding vehicles, even in insolvency, receivership or conservatorship proceedings. Similarly, the investors in the non-recourse notes payable have no recourse to our assets beyond the related receivables, the amounts on deposit in reserve accounts and the restricted cash from collections on auto loans receivable. We do, however, continue to have the rights associated with the interest we retain in these non-recourse funding vehicles.
As of February 29, 2020, $11.43 billion and $2.18 billion of non-recourse notes payable were outstanding related to asset-backed term funding transactions and our warehouse facilities, respectively. During fiscal 2020, we funded a total of $6.11 billion in asset-backed term funding transactions.
We have periodically increased our warehouse facility limit over time, as our store base, sales and CAF loan originations have grown. See Notes 1(F) and 11 for additional information on the warehouse facilities.
We generally repurchase the receivables funded through our warehouse facilities when we enter into an asset-backed term funding transaction. If our counterparties were to refuse to permit these repurchases it could impact our ability to execute on our funding program. Additionally, the agreements related to the warehouse facilities include various representations and warranties, covenants and performance triggers. If these requirements are not met, we could be unable to continue to fund receivables through the warehouse facilities. In addition, warehouse facility investors could charge us a higher rate of interest and could have us replaced as servicer. Further, we could be required to deposit collections on the related receivables with the warehouse facility agents on a daily basis and deliver executed lockbox agreements to the warehouse facility agents.
Currently, the asset-backed term funding market has been disrupted by the effects of the COVID-19 outbreak. As of February 29, 2020, we had $1.32 billion of unused capacity in our warehouse facilities. While we believe this capacity is sufficient to support CAF activity for several months, particularly in the current sales environment, we are actively assessing alternatives in the event that the asset-backed securities market remains disrupted for an extended period of time.
The timing and amount of stock repurchases are determined based on stock price, market conditions, legal requirements and other factors. Shares repurchased are deemed authorized but unissued shares of common stock. As of February 29, 2020, a total of $2 billion of board authorizations for repurchases were outstanding, with no expiration date. At that date, $1.55 billion remained available for repurchase. Subsequent to the end of the fiscal year, we halted our stock repurchase program, although the repurchase authorization remains effective. See Note 12 for more information on share repurchase activity.
Fair Value Measurements. We recognize money market securities, mutual fund investments and derivative instruments at fair value. See Note 6 for more information on fair value measurements.
39
CONTRACTUAL OBLIGATIONS (1)
As of February 29, 2020 | |||||||||||||||||||||||
Less Than | 1 to 3 | 3 to 5 | More Than | ||||||||||||||||||||
(In millions) | Total | 1 Year | Years | Years | 5 Years | Other | |||||||||||||||||
Short-term debt | $ | — | $ | — | $ | — | $ | — | $ | — | $ | — | |||||||||||
Long-term debt | 1,252.7 | — | — | 852.7 | 400.0 | — | |||||||||||||||||
Interest on debt (2) | 140.3 | 20.7 | 41.5 | 35.7 | 42.4 | — | |||||||||||||||||
Financing obligations | 1,156.1 | 52.5 | 108.0 | 107.9 | 887.7 | — | |||||||||||||||||
Operating and finance leases (3) | 979.5 | 67.6 | 127.4 | 123.1 | 661.4 | — | |||||||||||||||||
Purchase obligations (4) | 197.5 | 65.3 | 78.4 | 39.4 | 14.4 | — | |||||||||||||||||
Defined benefit retirement plans (5) | 142.1 | 0.6 | — | — | — | 141.5 | |||||||||||||||||
Unrecognized tax benefits (6) | 28.3 | — | — | — | — | 28.3 | |||||||||||||||||
Total | $ | 3,896.5 | $ | 206.7 | $ | 355.3 | $ | 1,158.8 | $ | 2,005.9 | $ | 169.8 | |||||||||||
(1) | This table excludes the non-recourse notes payable that relate to auto loans receivable funded through asset-backed term funding transactions and our warehouse facilities. These receivables can only be used as collateral to settle obligations of these vehicles. In addition, the investors in the non-recourse notes payable have no recourse to our assets beyond the related receivables, the amounts on deposit in reserve accounts and the restricted cash from collections on auto loans receivable. See Note 1(F) and 11. |
(2) | Represents interest payments to be made on our fixed-rate senior notes. Due to the uncertainty of forecasting expected variable interest rate payments associated with our revolving credit facility and term loan, such amounts are not included in the table. See Note 11. |
(3) | Lease obligations exclude $36.9 million of legally binding minimum lease payments for leases signed but not yet commenced. See Note 15. |
(4) | Includes certain enforceable and legally binding obligations related to real estate purchases, third-party outsourcing services and advertising. Purchase obligations exclude agreements that are cancellable at any time without penalty. See Note 17(B). |
(5) | Represents the recognized funded status of our retirement plans, of which $141.5 million has no contractual payment schedule and we expect payments to occur beyond 12 months from February 29, 2020. See Note 10. |
(6) | Represents the net unrecognized tax benefits related to uncertain tax positions. The timing of payments associated with these tax benefits could not be estimated as of February 29, 2020. See Note 9. |
Additionally, we had $997.3 million in unused capacity on our revolving credit facility as of February 29, 2020. During March 2020, we made net borrowings under this facility of approximately $675 million, following which more than $300 million in unused borrowing capacity remained.
40
Item 7A. Quantitative and Qualitative Disclosures about Market Risk.
Interest Rate Exposure - Non-Recourse Notes Payable
As of February 29, 2020 and February 28, 2019, all loans in our portfolio of managed receivables were fixed-rate installment contracts. Financing for these receivables was achieved primarily through non-recourse funding vehicles that, in turn, issued both fixed- and variable-rate notes. Non-recourse funding vehicles include warehouse facilities and asset-backed term funding transactions.
Borrowings under our warehouse facilities are variable-rate debt and are secured by auto loans receivable. The receivables are funded through the warehouse facilities until we elect to fund them through an asset-backed term funding transaction, which issue notes payable that accrue interest predominantly at fixed rates.
Interest rate risk related to variable-rate debt is primarily mitigated by entering into derivative instruments. Our derivative instruments are used to manage differences in the amount of our known or expected cash receipts and our known or expected cash payments principally related to the funding of our auto loans receivable. Disruptions in the credit markets or unexpected changes in prepayment activity could impact the effectiveness of our hedging strategies. Generally, changes in interest rates associated with underlying swaps will not have a material impact on earnings; however, they could have a material impact on cash and cash flows.
Absent any additional actions by the company to further mitigate risk, a 100-basis point increase in market interest rates associated with non-recourse funding vehicles would have decreased our fiscal 2020 net earnings per share by approximately $0.10.
Credit risk is the exposure to nonperformance of another party to an agreement. We mitigate credit risk by dealing with highly rated bank counterparties. The market and credit risks associated with derivative instruments are similar to those relating to other types of financial instruments. See Notes 5 and 6 for additional information on derivative instruments and hedging activities.
COMPOSITION OF NON-RECOURSE NOTES PAYABLE
As of February 29 or 28 | |||||||
(In millions) | 2020 | 2019 | |||||
Fixed-rate | $ | 10,853.4 | $ | 10,153.2 | |||
Variable-rate (1) | 2,759.9 | 2,382.2 | |||||
Total | $ | 13,613.3 | $ | 12,535.4 | |||
(1) | Variable-rate debt includes borrowings under our warehouse facilities as well as the variable portion of borrowings under our asset-backed term funding transactions. See Note 11. |
Interest Rate Exposure - Other Debt
We have interest rate risk from changing interest rates related to borrowings under our revolving credit facility. We also have interest rate risk from changing interest rates related to borrowings under our term loan; however, a portion of the variable-rate risk is mitigated by a derivative instrument. Substantially all of these borrowings are variable-rate debt based on LIBOR. A 100-basis point increase in market interest rates would have decreased our fiscal 2020 net earnings per share by approximately $0.02.
Other Market Exposures
Our pension plan has interest rate risk related to its projected benefit obligation (“PBO”). Due to the relatively young overall age of the plan’s participants, a 100-basis point change in the discount rate has approximately a 20% effect on the PBO balance. A 100-basis point decrease in the discount rate would have decreased our fiscal 2020 net earnings per share by less than $0.01. See Note 10 for more information on our benefit plans.
As our cash-settled restricted stock units are liability awards, the related compensation expense is sensitive to changes in the company’s stock price. The mark-to-market effect on the liability depends on each award’s grant price and previously recognized expense. At February 29, 2020, a 10% change in the company’s stock price would have affected fiscal 2020 net earnings per share by approximately $0.04.
41
Item 8. Consolidated Financial Statements and Supplementary Data.
MANAGEMENT’S ANNUAL REPORT ON INTERNAL CONTROL |
OVER FINANCIAL REPORTING |
Management is responsible for establishing and maintaining adequate internal control over financial reporting for the company. Because of its inherent limitations, internal control over financial reporting may not prevent or detect misstatements. Accordingly, even effective internal control over financial reporting can provide only reasonable assurance regarding the reliability of financial reporting and the preparation of financial statements for external purposes in accordance with U.S. generally accepted accounting principles.
Management conducted an evaluation of the effectiveness of our internal control over financial reporting based on the framework and criteria established in Internal Control—Integrated Framework (2013), issued by the Committee of Sponsoring Organizations of the Treadway Commission. Based on this evaluation, our management has concluded that our internal control over financial reporting was effective as of February 29, 2020.
KPMG LLP, the company’s independent registered public accounting firm, has issued a report on our internal control over financial reporting. Their report is included herein.

WILLIAM D. NASH
PRESIDENT AND CHIEF EXECUTIVE OFFICER

ENRIQUE N. MAYOR-MORA
SENIOR VICE PRESIDENT AND
CHIEF FINANCIAL OFFICER
42
REPORT OF INDEPENDENT REGISTERED |
PUBLIC ACCOUNTING FIRM |
To the Shareholders and Board of Directors
CarMax, Inc.:
Opinions on the Consolidated Financial Statements and Internal Control Over Financial Reporting
We have audited the accompanying consolidated balance sheets of CarMax, Inc. and subsidiaries (the Company) as of February 29, 2020 and February 28, 2019, the related consolidated statements of earnings, comprehensive income, shareholders’ equity, and cash flows for each of the years in the three-year period ended February 29, 2020 and the related notes (collectively, the consolidated financial statements). We also have audited the Company’s internal control over financial reporting as of February 29, 2020 based on criteria established in Internal Control - Integrated Framework (2013) issued by the Committee of Sponsoring Organizations of the Treadway Commission.
In our opinion, the consolidated financial statements referred to above present fairly, in all material respects, the financial position of the Company as of February 29, 2020 and February 28, 2019, and the results of its operations and its cash flows for each of the years in the three-year period ended February 29, 2020, in conformity with U.S. generally accepted accounting principles. Also in our opinion, the Company maintained, in all material respects, effective internal control over financial reporting as of February 29, 2020, based on criteria established in Internal Control - Integrated Framework (2013) issued by the Committee of Sponsoring Organizations of the Treadway Commission.
Basis for Opinions
The Company’s management is responsible for these consolidated financial statements, for maintaining effective internal control over financial reporting, and for its assessment of the effectiveness of internal control over financial reporting, included in the accompanying Management’s Annual Report on Internal Control Over Financial Reporting. Our responsibility is to express an opinion on the Company’s consolidated financial statements and an opinion on the Company’s internal control over financial reporting based on our audits. We are a public accounting firm registered with the Public Company Accounting Oversight Board (United States) (PCAOB) and are required to be independent with respect to the Company in accordance with the U.S. federal securities laws and the applicable rules and regulations of the Securities and Exchange Commission and the PCAOB.
We conducted our audits in accordance with the standards of the PCAOB. Those standards require that we plan and perform the audits to obtain reasonable assurance about whether the consolidated financial statements are free of material misstatement, whether due to error or fraud, and whether effective internal control over financial reporting was maintained in all material respects.
Our audits of the consolidated financial statements included performing procedures to assess the risks of material misstatement of the consolidated financial statements, whether due to error or fraud, and performing procedures that respond to those risks. Such procedures included examining, on a test basis, evidence regarding the amounts and disclosures in the consolidated financial statements. Our audits also included evaluating the accounting principles used and significant estimates made by management, as well as evaluating the overall presentation of the consolidated financial statements. Our audit of internal control over financial reporting included obtaining an understanding of internal control over financial reporting, assessing the risk that a material weakness exists, and testing and evaluating the design and operating effectiveness of internal control based on the assessed risk. Our audits also included performing such other procedures as we considered necessary in the circumstances. We believe that our audits provide a reasonable basis for our opinions.
Definition and Limitations of Internal Control Over Financial Reporting
A company’s internal control over financial reporting is a process designed to provide reasonable assurance regarding the reliability of financial reporting and the preparation of financial statements for external purposes in accordance with generally accepted accounting principles. A company’s internal control over financial reporting includes those policies and procedures that (1) pertain to the maintenance of records that, in reasonable detail, accurately and fairly reflect the transactions and dispositions of the assets of the company; (2) provide reasonable assurance that transactions are recorded as necessary to permit preparation of financial statements in accordance with generally accepted accounting principles, and that receipts and expenditures of the company are being made only in accordance with authorizations of management and directors of the company; and (3) provide reasonable assurance regarding prevention or timely detection of unauthorized acquisition, use, or disposition of the company’s assets that could have a material effect on the financial statements.
43
Because of its inherent limitations, internal control over financial reporting may not prevent or detect misstatements. Also, projections of any evaluation of effectiveness to future periods are subject to the risk that controls may become inadequate because of changes in conditions, or that the degree of compliance with the policies or procedures may deteriorate.
Critical Audit Matters
The critical audit matters communicated below are matters arising from the current period audit of the consolidated financial statements that were communicated or required to be communicated to the audit committee and that: (1) relate to accounts or disclosures that are material to the consolidated financial statements and (2) involved our especially challenging, subjective, or complex judgments. The communication of critical audit matters does not alter in any way our opinion on the consolidated financial statements, taken as a whole, and we are not, by communicating the critical audit matters below, providing separate opinions on the critical audit matters or on the accounts or disclosures to which they relate.
Assessment of the allowance for loan losses
As discussed in Notes 1(H) and 4 to the consolidated financial statements, the allowance for loan losses is maintained by the Company at a level estimated to provide for probable net loan losses inherent in the portfolio. The balance of the allowance for loan losses at February 29, 2020 was $157.8 million or 1.16% of ending managed receivables. The Company estimates the allowance for loan loss using analytical models based on the composition of the portfolio of managed receivables, historical loss trends, and forecasted forward loss curves. In addition, the Company assesses the need to make adjustments to the results of the analytical models based on consideration of recent trends in delinquencies and defaults, recovery rates, and the economic environment.
We identified the assessment of the allowance for loan losses as a critical audit matter because it involved significant measurement uncertainty requiring complex auditor judgment, and knowledge and experience in the industry. The assessment involved evaluating the allowance for loan losses methodology and the analytical models, including the models’ key inputs and assumptions, which consisted of the historical observation periods and net loss data, the period of time between loss event inherent in the portfolio and the charge-off date, forecasted forward loss curves, the weighting factor of actual loss data versus historical credit grade performance used for receivables with less than 18 months of performance history, and the segmentation of receivables based on credit grade. Given the complexity of the analytical models, we also evaluated the design and mathematical accuracy of the analytical models. Performing procedures to address this critical audit matter involved significant audit effort.
The primary procedures we performed to address the critical audit matter included the following. We tested certain internal controls over the 1) development and approval of the allowance for loan losses methodology and the analytical models, including the models’ key inputs and assumptions and 2) design and mathematical accuracy of the analytical models. We tested the key inputs and assumptions used in the analytical models by considering their relevance and reliability, as well as considering additional factors or alternative assumptions which could have been utilized. We involved credit risk professionals with specialized skills and knowledge, who assisted in:
• | evaluating the allowance for loan losses methodology and analytical models for compliance with U.S. generally accepted accounting principles, |
• | evaluating the design and mathematical accuracy of the analytical models, and |
• | assessing the key inputs and assumptions used in the analytical models compared to historical loss data and the related risk of loss within the portfolio. |
We performed a lookback analysis to test how predictive the model has been over time as compared to actual loss history.
Assessment of cancellation reserves
As discussed in Notes 2 and 8 to the consolidated financial statements, the Company records reserves, or refund liabilities, for estimated extended protection plan products contract cancellations. The balance of the cancellation reserves at February 29, 2020 was $117.8 million. The Company estimates the cancellation reserves with analytical models based on forecasted forward cancellation curves utilizing historical experience, recent trends and credit mix of the customer base.
We identified the assessment of cancellation reserves as a critical audit matter because of the complexity of the analytical models, the reliance of the models on multiple data elements, and the inherent estimation uncertainty. The assessment involved evaluating key inputs of the forecasted forward cancellation curves utilizing historical experience, recent cancellation trends and the credit mix of the customer base. Given the complexity of the analytical models, we also evaluated the design and mathematical accuracy. Performing procedures to address this critical audit matter involved significant audit effort.
The primary procedures we performed to address the critical audit matter included the following. We tested certain internal controls over the 1) development and approval of the cancellation reserve methodology and the analytical models, including the models’
44
key inputs and assumptions and 2) design and mathematical accuracy of the analytical models. We tested the inputs and assumptions used in the analytical models by considering their relevance and reliability, as well as considering additional factors or alternative assumptions which could have been utilized. We involved credit risk professionals with specialized skills and knowledge, who assisted in:
• | evaluating the cancellation reserve methodology and analytical models for compliance with U.S. generally accepted accounting principles, |
• | evaluating the design and mathematical accuracy of the analytical models, and |
• | assessing the key inputs and assumptions used in the analytical models compared to historical contract cancellation data and the credit mix within the customer base. |
We performed a lookback analysis to test how predictive the models have been over time as compared to actual history of contract cancellations.

We have served as the Company’s auditor since 1996.
Richmond, Virginia
April 21, 2020
45
CONSOLIDATED STATEMENTS OF EARNINGS |
Years Ended February 29 or 28 | |||||||||||||||||||
(In thousands except per share data) | 2020 | % (1) | 2019 | % (1) | 2018 | % (1) | |||||||||||||
SALES AND OPERATING REVENUES: | |||||||||||||||||||
Used vehicle sales | $ | $ | $ | ||||||||||||||||
Wholesale vehicle sales | |||||||||||||||||||
Other sales and revenues | |||||||||||||||||||
NET SALES AND OPERATING REVENUES | |||||||||||||||||||
COST OF SALES: | |||||||||||||||||||
Used vehicle cost of sales | |||||||||||||||||||
Wholesale vehicle cost of sales | |||||||||||||||||||
Other cost of sales | |||||||||||||||||||
TOTAL COST OF SALES | |||||||||||||||||||
GROSS PROFIT | |||||||||||||||||||
CARMAX AUTO FINANCE INCOME | |||||||||||||||||||
Selling, general and administrative expenses | |||||||||||||||||||
Interest expense | |||||||||||||||||||
Other (income) expense | ( | ) | ( | ) | |||||||||||||||
Earnings before income taxes | |||||||||||||||||||
Income tax provision | |||||||||||||||||||
NET EARNINGS | $ | $ | $ | ||||||||||||||||
WEIGHTED AVERAGE COMMON SHARES: | |||||||||||||||||||
Basic | |||||||||||||||||||
Diluted | |||||||||||||||||||
NET EARNINGS PER SHARE: | |||||||||||||||||||
Basic | $ | $ | $ | ||||||||||||||||
Diluted | $ | $ | $ | ||||||||||||||||
(1) Percents are calculated as a percentage of net sales and operating revenues and may not total due to rounding.
See accompanying notes to consolidated financial statements.
46
CONSOLIDATED STATEMENTS OF COMPREHENSIVE INCOME |
Years Ended February 29 or 28 | |||||||||||
(In thousands) | 2020 | 2019 | 2018 | ||||||||
NET EARNINGS | $ | $ | $ | ||||||||
Other comprehensive (loss) income, net of taxes: | |||||||||||
Net change in retirement benefit plan unrecognized actuarial losses | ( | ) | ( | ) | ( | ) | |||||
Net change in cash flow hedge unrecognized losses | ( | ) | ( | ) | |||||||
Other comprehensive (loss) income, net of taxes | ( | ) | ( | ) | |||||||
TOTAL COMPREHENSIVE INCOME | $ | $ | $ | ||||||||
See accompanying notes to consolidated financial statements.
47
CONSOLIDATED BALANCE SHEETS |
As of February 29 or 28 | |||||||
(In thousands except share data) | 2020 | 2019 | |||||
ASSETS | |||||||
CURRENT ASSETS: | |||||||
Cash and cash equivalents | $ | $ | |||||
Restricted cash from collections on auto loans receivable | |||||||
Accounts receivable, net | |||||||
Inventory | |||||||
Other current assets | |||||||
TOTAL CURRENT ASSETS | |||||||
Auto loans receivable, net | |||||||
Property and equipment, net | |||||||
Deferred income taxes | |||||||
Operating lease assets | |||||||
Other assets | |||||||
TOTAL ASSETS | $ | $ | |||||
LIABILITIES AND SHAREHOLDERS’ EQUITY | |||||||
CURRENT LIABILITIES: | |||||||
Accounts payable | $ | $ | |||||
Accrued expenses and other current liabilities | |||||||
Accrued income taxes | |||||||
Current portion of operating lease liabilities | |||||||
Short-term debt | |||||||
Current portion of long-term debt | |||||||
Current portion of non-recourse notes payable | |||||||
TOTAL CURRENT LIABILITIES | |||||||
Long-term debt, excluding current portion | |||||||
Non-recourse notes payable, excluding current portion | |||||||
Operating lease liabilities, excluding current portion | |||||||
Other liabilities | |||||||
TOTAL LIABILITIES | |||||||
Commitments and contingent liabilities | |||||||
SHAREHOLDERS’ EQUITY: | |||||||
Common stock, $0.50 par value; 350,000,000 shares authorized; 163,081,376 and 167,478,924 shares issued and outstanding as of February 29, 2020 and February 28, 2019, respectively | |||||||
Capital in excess of par value | |||||||
Accumulated other comprehensive loss | ( | ) | ( | ) | |||
Retained earnings | |||||||
TOTAL SHAREHOLDERS’ EQUITY | |||||||
TOTAL LIABILITIES AND SHAREHOLDERS’ EQUITY | $ | $ | |||||
See accompanying notes to consolidated financial statements.
48
CONSOLIDATED STATEMENTS OF CASH FLOWS |
Years Ended February 29 or 28 | |||||||||||
(In thousands) | 2020 | 2019 | 2018 | ||||||||
OPERATING ACTIVITIES: | |||||||||||
Net earnings | $ | $ | $ | ||||||||
Adjustments to reconcile net earnings to net cash (used in) provided by operating activities: | |||||||||||
Depreciation and amortization | |||||||||||
Share-based compensation expense | |||||||||||
Provision for loan losses | |||||||||||
Provision for cancellation reserves | |||||||||||
Deferred income tax (benefit) provision | ( | ) | |||||||||
Other | |||||||||||
Net (increase) decrease in: | |||||||||||
Accounts receivable, net | ( | ) | ( | ) | |||||||
Inventory | ( | ) | ( | ) | ( | ) | |||||
Other current assets | ( | ) | ( | ) | |||||||
Auto loans receivable, net | ( | ) | ( | ) | ( | ) | |||||
Other assets | ( | ) | ( | ) | |||||||
Net increase (decrease) in: | |||||||||||
Accounts payable, accrued expenses and other | |||||||||||
current liabilities and accrued income taxes | |||||||||||
Other liabilities | ( | ) | ( | ) | ( | ) | |||||
NET CASH (USED IN) PROVIDED BY OPERATING ACTIVITIES | ( | ) | ( | ) | |||||||
INVESTING ACTIVITIES: | |||||||||||
Capital expenditures | ( | ) | ( | ) | ( | ) | |||||
Proceeds from disposal of property and equipment | |||||||||||
Purchases of investments | ( | ) | ( | ) | ( | ) | |||||
Sales of investments | |||||||||||
NET CASH USED IN INVESTING ACTIVITIES | ( | ) | ( | ) | ( | ) | |||||
FINANCING ACTIVITIES: | |||||||||||
(Decrease) increase in short-term debt, net | ( | ) | |||||||||
Proceeds from issuances of long-term debt | |||||||||||
Payments on long-term debt | ( | ) | ( | ) | ( | ) | |||||
Cash paid for debt issuance costs | ( | ) | ( | ) | ( | ) | |||||
Payments on finance lease obligations | ( | ) | ( | ) | ( | ) | |||||
Issuances of non-recourse notes payable | |||||||||||
Payments on non-recourse notes payable | ( | ) | ( | ) | ( | ) | |||||
Repurchase and retirement of common stock | ( | ) | ( | ) | ( | ) | |||||
Equity issuances | |||||||||||
NET CASH PROVIDED BY FINANCING ACTIVITIES | |||||||||||
Increase in cash, cash equivalents, and restricted cash | |||||||||||
Cash, cash equivalents, and restricted cash at beginning of year | |||||||||||
CASH, CASH EQUIVALENTS, AND RESTRICTED CASH AT END OF YEAR | $ | $ | $ | ||||||||
RECONCILIATION OF CASH, CASH EQUIVALENTS AND RESTRICTED CASH TO THE CONSOLIDATED BALANCE SHEETS | |||||||||||
Cash and cash equivalents | $ | $ | $ | ||||||||
Restricted cash from collections on auto loans receivable | |||||||||||
Restricted cash included in other assets | |||||||||||
CASH, CASH EQUIVALENTS AND RESTRICTED CASH AT END OF YEAR | $ | $ | $ | ||||||||
See accompanying notes to consolidated financial statements.
49
CONSOLIDATED STATEMENTS OF SHAREHOLDERS’ EQUITY |
Accumulated | ||||||||||||||||||||||
Common | Capital in | Other | ||||||||||||||||||||
Shares | Common | Excess of | Retained | Comprehensive | ||||||||||||||||||
(In thousands) | Outstanding | Stock | Par Value | Earnings | Loss | Total | ||||||||||||||||
Balance as of February 28, 2017 | $ | $ | $ | $ | ( | ) | $ | |||||||||||||||
Net earnings | — | — | — | — | ||||||||||||||||||
Other comprehensive income | — | — | — | — | ||||||||||||||||||
Share-based compensation expense | — | — | — | — | ||||||||||||||||||
Repurchases of common stock | ( | ) | ( | ) | ( | ) | ( | ) | — | ( | ) | |||||||||||
Exercise of common stock options | — | — | ||||||||||||||||||||
Stock incentive plans, net shares issued | ( | ) | — | — | ( | ) | ||||||||||||||||
Adoption of ASU 2018-02 | — | — | — | ( | ) | |||||||||||||||||
Balance as of February 28, 2018 | ( | ) | ||||||||||||||||||||
Net earnings | — | — | — | — | ||||||||||||||||||
Other comprehensive loss | — | — | — | — | ( | ) | ( | ) | ||||||||||||||
Share-based compensation expense | — | — | — | — | ||||||||||||||||||
Repurchases of common stock | ( | ) | ( | ) | ( | ) | ( | ) | — | ( | ) | |||||||||||
Exercise of common stock options | — | — | ||||||||||||||||||||
Stock incentive plans, net shares issued | ( | ) | — | — | ( | ) | ||||||||||||||||
Adoption of ASU 2014-09 | — | — | — | — | ||||||||||||||||||
Balance as of February 28, 2019 | ( | ) | ||||||||||||||||||||
Net earnings | — | — | — | — | ||||||||||||||||||
Other comprehensive loss | — | — | — | — | ( | ) | ( | ) | ||||||||||||||
Share-based compensation expense | — | — | — | — | ||||||||||||||||||
Repurchases of common stock | ( | ) | ( | ) | ( | ) | ( | ) | — | ( | ) | |||||||||||
Exercise of common stock options | — | — | ||||||||||||||||||||
Stock incentive plans, net shares issued | ( | ) | — | — | ( | ) | ||||||||||||||||
Balance as of February 29, 2020 | $ | $ | $ | $ | ( | ) | $ | |||||||||||||||
See accompanying notes to consolidated financial statements.
50
NOTES TO CONSOLIDATED FINANCIAL STATEMENTS |
1. | NATURE OF OPERATIONS AND SUMMARY OF SIGNIFICANT ACCOUNTING POLICIES |
(A) | Business and Background |
CarMax, Inc. (“we,” “our,” “us,” “CarMax” and “the company”), including its wholly owned subsidiaries, is the nation’s largest retailer of used vehicles. We operate in two reportable segments: CarMax Sales Operations and CarMax Auto Finance (“CAF”). Our CarMax Sales Operations segment consists of all aspects of our auto merchandising and service operations, excluding financing provided by CAF. Our CAF segment consists solely of our own finance operation that provides financing to customers buying retail vehicles from CarMax.
(B) | Basis of Presentation and Use of Estimates |
The consolidated financial statements include the accounts of CarMax and our wholly owned subsidiaries. All significant intercompany balances and transactions have been eliminated in consolidation. The preparation of financial statements in conformity with U.S. generally accepted accounting principles (“GAAP”) requires management to make estimates and assumptions that affect the reported amounts of assets, liabilities, revenues and expenses and the disclosure of contingent assets and liabilities. Actual results could differ from those estimates. In particular, the novel coronavirus (“COVID-19”) pandemic and the resulting adverse impacts to global economic conditions, as well as our operations, may impact future estimates including, but not limited to, our allowance for loan losses, inventory valuations, fair value measurements, downward adjustments to investments in equity securities, asset impairment charges, the effectiveness of the company’s hedging instruments, deferred tax valuation allowances, cancellation reserves, actuarial losses on our retirement benefit plans and discount rate assumptions. Certain prior year amounts have been reclassified to conform to the current year’s presentation. Amounts and percentages may not total due to rounding.
In connection with our adoption of Accounting Standards Update (“ASU”) 2016-02, Leases (“ASC 842”) during the current fiscal year, certain prior period amounts have been reclassified to conform to the current period’s presentation. In the consolidated balance sheets, financing obligations have been reclassified to current portion of long-term debt and long-term debt, excluding current portion. Also, capital lease obligations have been reclassified to accrued expenses and other current liabilities and other liabilities. In the consolidated statements of cash flows, payments on financing obligations have been reclassified to payments on long-term debt. See Notes 11 and 15 for additional information on financing obligations and leases, respectively.
(C) | Cash and Cash Equivalents |
Cash equivalents consist of highly liquid investments with original maturities of three months or less and are not significant to the consolidated balance sheets as of February 29, 2020 and February 28, 2019.
(D) | Restricted Cash from Collections on Auto Loans Receivable |
Cash equivalents totaling $481.0 million as of February 29, 2020, and $440.7 million as of February 28, 2019, consisted of collections of principal, interest and fee payments on auto loans receivable that are restricted for payment to holders of non-recourse notes payable pursuant to the applicable agreements.
(E) | Accounts Receivable, Net |
Accounts receivable, net of an allowance for doubtful accounts, includes certain amounts due from third-party finance providers and customers, and other miscellaneous receivables. The allowance for doubtful accounts is estimated based on historical experience and trends.
(F) | Financing and Securitization Transactions |
We maintain a revolving funding program composed of three warehouse facilities (“warehouse facilities”) that we use to fund auto loans receivable originated by CAF. We typically elect to fund these receivables through an asset-backed term funding
51
transaction, such as a term securitization or alternative funding arrangement, at a later date. We sell the auto loans receivable to one of three wholly owned, bankruptcy-remote, special purpose entities that transfer an undivided percentage ownership interest in the receivables, but not the receivables themselves, to entities formed by third-party investors. These entities issue asset-backed commercial paper or utilize other funding sources supported by the transferred receivables, and the proceeds are used to finance the related receivables.
We typically use term securitizations to provide long-term funding for most of the auto loans receivable initially funded through the warehouse facilities. In these transactions, a pool of auto loans receivable is sold to a bankruptcy-remote, special purpose entity that, in turn, transfers the receivables to a special purpose securitization trust. The securitization trust issues asset-backed securities, secured or otherwise supported by the transferred receivables, and the proceeds from the sale of the asset-backed securities are used to finance the securitized receivables.
We are required to evaluate term securitization trusts for consolidation. In our capacity as servicer, we have the power to direct the activities of the trusts that most significantly impact the economic performance of the trusts. In addition, we have the obligation to absorb losses (subject to limitations) and the rights to receive any returns of the trusts, which could be significant. Accordingly, we are the primary beneficiary of the trusts and are required to consolidate them.
We recognize transfers of auto loans receivable into the warehouse facilities and asset-backed term funding transactions, including term securitizations (together, “non-recourse funding vehicles”), as secured borrowings, which result in recording the auto loans receivable and the related non-recourse notes payable on our consolidated balance sheets.
These receivables can only be used as collateral to settle obligations of the related non-recourse funding vehicles. The non-recourse funding vehicles and investors have no recourse to our assets beyond the related receivables, the amounts on deposit in reserve accounts and the restricted cash from collections on auto loans receivable. We have not provided financial or other support to the non-recourse funding vehicles that was not previously contractually required, and there are no additional arrangements, guarantees or other commitments that could require us to provide financial support to the non-recourse funding vehicles.
See Notes 4 and 11 for additional information on auto loans receivable and non-recourse notes payable.
(G) | Inventory |
Inventory is primarily comprised of vehicles held for sale or currently undergoing reconditioning and is stated at the lower of cost or net realizable value (“NRV”). Vehicle inventory cost is determined by specific identification. Parts, labor and overhead costs associated with reconditioning vehicles, as well as transportation and other incremental expenses associated with acquiring and reconditioning vehicles, are included in inventory.
(H) | Auto Loans Receivable, Net |
Auto loans receivable include amounts due from customers related to retail vehicle sales financed through CAF and are presented net of an allowance for estimated loan losses. The allowance for loan losses represents an estimate of the amount of net losses inherent in our portfolio of managed receivables as of the applicable reporting date and expected to become evident during the following 12 months. The allowance for loan losses is primarily based on the composition of the portfolio of managed receivables, historical observation periods and net loss data, the period of time between the loss event inherent in the portfolio and the charge-off date and forecasted forward loss curves. For receivables that have less than 18 months of performance history, the estimate also takes into account the credit grades of the receivables and historical losses by credit grade to supplement actual loss data in estimating future performance, subsequent to which the estimate reflects actual loss experience of those receivables to date along with forward loss curves to predict future performance. The forward loss curves are constructed using historical performance data and show the average timing of losses over the course of a receivable’s life.
We also consider recent trends in delinquencies and defaults, recovery rates and the economic environment in assessing the models used in estimating the allowance for loan losses, and may adjust the allowance for loan losses to reflect factors that may not be captured in the models. In addition, we periodically consider whether the use of additional metrics would result in improved model performance and revise the models when appropriate. The provision for loan losses is the periodic expense of maintaining an adequate allowance.
An account is considered delinquent when the related customer fails to make a substantial portion of a scheduled payment on or before the due date. In general, accounts are charged-off on the last business day of the month during which the earliest of the following occurs: the receivable is 120 days or more delinquent as of the last business day of the month, the related vehicle is repossessed and liquidated, or the receivable is otherwise deemed uncollectible. For purposes of determining impairment, auto loans are evaluated collectively, as they represent a large group of smaller-balance homogeneous loans, and therefore, are not individually evaluated for impairment. See Note 4 for additional information on auto loans receivable.
52
Interest income and expenses related to auto loans are included in CAF income. Interest income on auto loans receivable is recognized when earned based on contractual loan terms. All loans continue to accrue interest until repayment or charge-off. Direct costs associated with loan originations are not considered material, and thus, are expensed as incurred. See Note 3 for additional information on CAF income.
(I) | Property and Equipment |
Property and equipment is stated at cost less accumulated depreciation and amortization. Depreciation and amortization are calculated using the straight-line method over the shorter of the asset’s estimated useful life or the lease term, if applicable. Costs incurred during new store construction are capitalized as construction-in-progress and reclassified to the appropriate fixed asset categories when the store is completed.
Estimated Useful Lives
Life | |
Buildings | |
Leasehold improvements | |
Furniture, fixtures and equipment | 3 – 15 years |
We review long-lived assets for impairment when events or changes in circumstances indicate the carrying amount of an asset may not be recoverable. We recognize impairment when the sum of undiscounted estimated future cash flows expected to result from the use of the asset is less than the carrying value of the asset. See Note 7 for additional information on property and equipment.
(J) | Other Assets |
Restricted Cash on Deposit in Reserve Accounts. The restricted cash on deposit in reserve accounts is for the benefit of holders of non-recourse notes payable, and these funds are not expected to be available to the company or its creditors. In the event that the cash generated by the related receivables in a given period was insufficient to pay the interest, principal and other required payments, the balances on deposit in the reserve accounts would be used to pay those amounts. Restricted cash on deposit in reserve accounts is invested in money market securities or bank deposit accounts and was $67.8 million as of February 29, 2020 and $61.1 million as of February 28, 2019.
Other Investments. Other investments includes restricted money market securities primarily held to satisfy certain insurance program requirements, investments held in a rabbi trust established to fund informally our executive deferred compensation plan and investments in equity securities. Money market securities and mutual funds are reported at fair value, and investments in equity securities are reported at cost less any impairment and adjusted for any observable changes in price. Gains and losses on these securities are reflected as a component of other (income) expense. Other investments totaled $156.7 million as of February 29, 2020 and $83.7 million as of February 28, 2019.
(K) | Financing Obligations |
We generally account for sale-leaseback transactions as financing obligations. Accordingly, we record certain of the assets subject to these transactions on our consolidated balance sheets in property and equipment and the related sales proceeds as financing obligations in long-term debt. Depreciation is recognized on the assets over their estimated useful lives, generally 25 years. A portion of the periodic lease payments is recognized as interest expense and the remainder reduces the obligation. In the event the sale-leasebacks are modified or extended beyond their original term, the related obligation is increased based on the present value of the revised future minimum lease payments on the date of the modification, with a corresponding increase to the net carrying amount of the assets subject to these transactions. See Note 11 for additional information on financing obligations.
(L) | Accrued Expenses |
53
(M) | Defined Benefit Plan Obligations |
The recognized funded status of defined benefit retirement plan obligations is included both in accrued expenses and other current liabilities and in other liabilities. The current portion represents benefits expected to be paid from our benefit restoration plan over the next 12 months. The defined benefit retirement plan obligations are determined using a number of actuarial assumptions. Key assumptions used in measuring the plan obligations include the discount rate, rate of return on plan assets and mortality rate. See Note 10 for additional information on our benefit plans.
(N) | Insurance Liabilities |
Insurance liabilities are included in accrued expenses and other current liabilities. We use a combination of insurance and self-insurance for a number of risks including workers’ compensation, general liability and employee-related health care costs, a portion of which is paid by associates. Estimated insurance liabilities are determined by considering historical claims experience, demographic factors and other actuarial assumptions.
(O) | Revenue Recognition |
Our revenue consists primarily of used and wholesale vehicle sales, as well as sales from EPP products and vehicle repair service. See Note 2 for additional information on our significant accounting policies related to revenue recognition.
(P) | Cost of Sales |
Cost of sales includes the cost to acquire vehicles and the reconditioning and transportation costs associated with preparing the vehicles for resale. It also includes payroll, fringe benefits, and parts, labor and overhead costs associated with reconditioning and vehicle repair services. The gross profit earned by our service department for used vehicle reconditioning service is a reduction of cost of sales. We maintain a reserve to eliminate the internal profit on vehicles that have not been sold.
(Q) | Selling, General and Administrative Expenses |
Selling, general and administrative (“SG&A”) expenses primarily include compensation and benefits, other than payroll related to reconditioning and vehicle repair services; depreciation, rent and other occupancy costs; advertising; and IT expenses, preopening and relocation costs, insurance, bad debt, travel, charitable contributions and other administrative expenses.
(R) | Advertising Expenses |
Advertising costs are expensed as incurred and substantially all are included in SG&A expenses. Total advertising expenses were $191.8 million in fiscal 2020, $167.0 million in fiscal 2019 and $158.6 million in fiscal 2018.
(S) | Store Opening Expenses |
Costs related to store openings, including preopening costs, are expensed as incurred and are included in SG&A expenses.
(T) | Share-Based Compensation |
Share-based compensation represents the cost related to share-based awards granted to employees and non-employee directors. We measure share-based compensation cost at the grant date, based on the estimated fair value of the award, and we recognize the cost on a straight-line basis, net of estimated forfeitures, over the grantee’s requisite service period, which is generally the vesting period of the award. We estimate the fair value of stock options using a binomial valuation model. Key assumptions used in estimating the fair value of options are dividend yield, expected volatility, risk-free interest rate and expected term. The fair values of restricted stock, stock-settled performance stock units and stock-settled deferred stock units are based on the volume-weighted average market value on the date of the grant. The fair value of stock-settled market stock units is determined using a Monte-Carlo simulation based on the expected market price of our common stock on the vesting date and the expected number of converted common shares. Cash-settled restricted stock units are liability awards with fair value measurement based on the volume-weighted average market price of CarMax common stock as of the end of each reporting period. Share-based compensation expense is recorded in either cost of sales, CAF income or SG&A expenses based on the recipients’ respective function.
We record deferred tax assets for awards that result in deductions on our income tax returns, based on the amount of compensation expense recognized and the statutory tax rate in the jurisdiction in which we will receive a deduction. Differences between the deferred tax assets recognized for financial reporting purposes and the actual tax deduction reported on the income tax return are recorded in income tax expense. See Note 12 for additional information on stock-based compensation.
(U) | Derivative Instruments and Hedging Activities |
We enter into derivative instruments to manage certain risks arising from both our business operations and economic conditions that result in the future known receipt or payment of uncertain cash amounts, the values of which are impacted by interest rates. We recognize the derivatives at fair value on the consolidated balance sheets, and where applicable, such contracts covered by master netting agreements are reported net. Gross positive fair values are netted with gross negative fair values by counterparty. The accounting for changes in the fair value of derivatives depends on the intended use of the derivative, whether we have elected to
54
designate a derivative in a hedging relationship and apply hedge accounting and whether the hedging relationship has satisfied the criteria necessary to apply hedge accounting. We may enter into derivative contracts that are intended to economically hedge certain risks, even though hedge accounting may not apply or we do not elect to apply hedge accounting. See Note 5 for additional information on derivative instruments and hedging activities.
(V) | Income Taxes |
We file a consolidated federal income tax return for a majority of our subsidiaries. Certain subsidiaries are required to file separate partnership or corporate federal income tax returns. Deferred income taxes reflect the impact of temporary differences between the amounts of assets and liabilities recognized for financial reporting purposes and the amounts recognized for income tax purposes, measured by applying currently enacted tax laws. A deferred tax asset is recognized if it is more likely than not that a benefit will be realized. Changes in tax laws and tax rates are reflected in the income tax provision in the period in which the changes are enacted. We evaluate the need to record valuation allowances that would reduce deferred tax assets to the amount that will more likely than not be realized. When assessing the need for valuation allowances, we consider available loss carrybacks, tax planning strategies, future reversals of existing temporary differences and future taxable income.
We recognize uncertain tax liabilities when, despite our belief that our tax return positions are supportable, we believe that the tax positions may not be fully sustained upon review by tax authorities. Benefits from tax positions are measured at the highest tax benefit that is greater than 50% likely of being realized upon settlement. The current portion of these tax liabilities is included in accrued income taxes and any noncurrent portion is included in other liabilities. To the extent that the final tax outcome of these matters is different from the amounts recorded, the differences impact income tax expense in the period in which the determination is made. Interest and penalties related to income tax matters are included in SG&A expenses. See Note 9 for additional information on income taxes.
(W) | Net Earnings Per Share |
(X) | Recent Accounting Pronouncements |
Adopted in the Current Period.
In February 2016, the Financial Accounting Standards Board (“FASB”) issued ASC 842, Leases. This standard, along with subsequent ASUs issued to clarify certain provisions of ASU 2016-02, requires lessees to record most leases on their balance sheet and disclose key information about those lease arrangements. Under the new guidance, lease classification as either a finance lease or an operating lease will affect the pattern and classification of expense recognition in the income statement. The classification criteria to distinguish between finance and operating leases is generally consistent with the classification criteria to distinguish between capital and operating leases under previous lease accounting guidance, Leases (“ASC 840”). This standard is effective for fiscal years, and for interim periods within those fiscal years, beginning after December 15, 2018.
We adopted ASC 842 for our fiscal year beginning March 1, 2019 using the modified retrospective transition approach applied at the beginning of the period of adoption, which did not result in a cumulative-effect adjustment to retained earnings. Comparative periods presented in the financial statements continue to be presented in accordance with ASC 840. As permitted under the standard, we have elected the package of practical expedients, under which we did not reassess our prior conclusions regarding lease identification, lease classification or initial direct costs for contracts existing as of the transition date. We have also elected the practical expedient to not assess whether existing or expired land easements not previously accounted for as leases are or contain a lease under ASC 842. We have not elected the hindsight practical expedient.
The adoption of ASC 842 resulted in the recognition of $452 million of operating lease assets, which included an adjustment for deferred rent, and $474 million of operating lease liabilities on our opening consolidated balance sheet. We did not subsequently remeasure any leases based on changes in assessment of the lease term due to adoption of the standard. The adoption of the new standard did not have a material impact on our sale-leaseback transactions previously accounted for as financing obligations, nor did it have a material effect on our expense recognition pattern or, in turn, our consolidated statements of operations. The new standard does not impact our compliance with current debt covenants. As an accounting policy, we separate lease and nonlease components when accounting for all leases commencing, modified or reassessed subsequent to adoption of the new standard. Additionally, we elected the short-term lease exemption for all qualifying leases. We have implemented new business processes, accounting policies, systems and internal controls as part of adopting the new standard. See Note 15 for additional information on leases.
55
In August 2017, the FASB issued an accounting pronouncement (FASB ASU 2017-12) related to the accounting for derivatives and hedging. The pronouncement expands and refines hedge accounting for both nonfinancial and financial risk components and aligns the recognition and presentation of the effects of the hedging instrument and the hedged item in the financial statements. It also includes certain targeted improvements to simplify the application of current guidance related to hedge accounting. We prospectively adopted this pronouncement for our fiscal year beginning March 1, 2019, and it did not have a material effect on our consolidated financial statements.
In June 2018, the FASB issued an accounting pronouncement (FASB ASU 2018-07) to expand the scope of Compensation - Stock Compensation (Topic 718), to include share-based payment transactions for acquiring goods and services from nonemployees. We adopted this pronouncement for our fiscal year beginning March 1, 2019, and it did not have a material effect on our consolidated financial statements.
In August 2018, the FASB issued an accounting pronouncement (FASB ASU 2018-13) related to disclosure requirements for fair value measurements. The pronouncement eliminates, modifies and adds disclosure requirements for fair value measurements. The pronouncement is effective for fiscal years, and for interim periods within those fiscal years, beginning after December 15, 2019, with early adoption permitted. We early adopted this pronouncement during the second quarter of fiscal 2020, and it did not have a material effect on our consolidated financial statements.
In August 2018, the FASB issued an accounting pronouncement (FASB ASU 2018-15) related to a customer’s accounting for implementation costs incurred in a cloud computing arrangement that is considered a service contract. This pronouncement aligns the requirements for capitalizing implementation costs in such arrangements with the requirements for capitalizing implementation costs incurred to develop or obtain internal-use software. This pronouncement is effective for fiscal years, and for interim periods within those fiscal years, beginning after December 15, 2019. We early adopted this pronouncement for our fiscal year beginning March 1, 2019, prospectively for all implementation costs incurred after the date of adoption. As a result of the adoption, we began capitalizing certain implementation costs that were previously expensed as incurred. Such amounts were immaterial to our consolidated financial statements.
In October 2018, the FASB issued an accounting pronouncement (FASB ASU 2018-16) to permit the use of the Overnight Index Swap Rate based on the Secured Overnight Financing Rate as a U.S. benchmark interest rate for hedge accounting purposes under Derivatives and Hedging (Topic 815). For entities that have not already adopted ASU 2017-12, the amendments in this pronouncement are required to be adopted concurrently with the amendments in ASU 2017-12. We adopted this pronouncement for our fiscal year beginning March 1, 2019, concurrently with the adoption of ASU 2017-12, and it did not have a material effect on our consolidated financial statements.
Effective in Future Periods.
In June 2016, the FASB issued an accounting pronouncement (FASB ASU 2016-13) related to the measurement of credit losses on financial instruments. This pronouncement, along with subsequent ASUs issued to clarify certain provisions of ASU 2016-13, changes the impairment model for most financial assets and will require the use of an “expected loss” model for instruments measured at amortized cost. Under this model, entities will be required to estimate the lifetime expected credit loss on such instruments and record an allowance to offset the amortized cost basis of the financial asset, resulting in a net presentation of the amount expected to be collected on the financial asset. In developing the estimate for lifetime expected credit loss, entities must incorporate historical experience, current conditions, and reasonable and supportable forecasts. This pronouncement is effective for fiscal years, and for interim periods within those fiscal years, beginning after December 15, 2019.
We have designed an allowance for loan loss methodology to comply with these new requirements, which will be adopted for our fiscal year beginning March 1, 2020. We expect to record a $200 million to $250 million increase in the allowance for loan losses on our opening consolidated balance sheet as of March 1, 2020, with a corresponding net-of-tax adjustment to retained earnings. The expected increase in the allowance for loan losses is primarily the result of extending the loan loss forecast period from 12 months to the entire lifetime of the loan portfolio. The final adoption impact could vary based on the company’s continuing analysis of macroeconomic developments. We expect this new methodology could increase volatility in our quarterly provision for loan losses. This volatility is driven by estimating loan losses over a longer forecast period and the incorporation of economic adjustment factors, including changes in unemployment rates, and such volatility could be significant. We are finalizing testing of the effectiveness of our new allowance for loan loss methodology, as well as designing the relevant controls and governance structure.
In August 2018, the FASB issued an accounting pronouncement (FASB ASU 2018-14) related to disclosure requirements for defined benefit plans. The pronouncement eliminates, modifies and adds disclosure requirements for defined benefit plans. The pronouncement is effective for fiscal years ending after December 15, 2020, and we do not expect it to have a material effect on our consolidated financial statements.
56
In October 2018, the FASB issued an accounting pronouncement (FASB ASU 2018-17) related to related party guidance for variable interest entities. The amendments in this pronouncement are effective for fiscal years beginning after December 15, 2019 and early adoption is permitted. We plan to adopt this pronouncement for our fiscal year beginning March 1, 2020, and we do not expect it to have a material effect on our consolidated financial statements.
In December 2019, the FASB issued an accounting pronouncement (FASB ASU 2019-12) related to simplifying the accounting for income taxes. The pronouncement is effective for fiscal years, and for interim periods within those fiscal years, beginning after December 15, 2020, with early adoption permitted. We do not expect it to have a material effect on our consolidated financial statements.
In March 2020, the FASB issued an accounting pronouncement (FASB ASU 2020-04) related to reference rate reform. The pronouncement provides optional guidance for a limited period of time to ease the potential burden of accounting for reference rate reform. This guidance is effective for all entities as of March 12, 2020 through December 31, 2022. We expect to utilize this optional guidance but do not expect it to have a material effect on our consolidated financial statements.
2. | REVENUE |
We recognize revenue when control of the good or service has been transferred to the customer, generally either at the time of sale or upon delivery to a customer. Our contracts have a fixed contract price and revenue is measured as the amount of consideration we expect to receive in exchange for transferring goods or providing services. We collect sales taxes and other taxes from customers on behalf of governmental authorities at the time of sale. These taxes are accounted for on a net basis and are not included in net sales and operating revenues or cost of sales. We generally expense sales commissions when incurred because the amortization period would have been less than one year. These costs are recorded within SG&A. We do not have any significant payment terms as payment is received at or shortly after the point of sale.
Disaggregation of Revenue
Years Ended February 29 or 28 | |||||||||||
(In millions) | 2020 | 2019 | 2018 | ||||||||
Used vehicle sales | $ | $ | $ | ||||||||
Wholesale vehicle sales | |||||||||||
Other sales and revenues: | |||||||||||
Extended protection plan revenues | |||||||||||
Third-party finance fees, net | ( | ) | ( | ) | ( | ) | |||||
Service revenues | |||||||||||
Other | |||||||||||
Total other sales and revenues | |||||||||||
Total net sales and operating revenues | $ | $ | $ | ||||||||
Used Vehicle Sales. Revenue from the sale of used vehicles is recognized upon transfer of control of the vehicle to the customer. As part of our customer service strategy, we guarantee the retail vehicles we sell with a 7-day, money-back guarantee. We record a reserve for estimated returns based on historical experience and trends. The reserve for estimated returns is presented gross on the consolidated balance sheets, with a return asset recorded in other current assets and a refund liability recorded in accrued expenses and other current liabilities. We also guarantee the used vehicles we sell with a 90-day/4,000-mile limited warranty. These warranties are deemed assurance-type warranties and accounted for as warranty obligations. See Note 17 for additional information on this warranty and its related obligation.
Wholesale Vehicle Sales. Wholesale vehicles are sold at our auctions, and revenue from the sale of these vehicles is recognized upon transfer of control of the vehicle to the customer. Dealers also pay a fee to us based on the sale price of the vehicles they purchase. This fee is recognized as revenue at the time of sale. While we provide condition disclosures on each wholesale vehicle sold, the vehicles are subject to a limited right of return. We record a reserve for estimated returns based on historical experience and trends. The reserve for estimated returns is presented gross on the consolidated balance sheets, with a return asset recorded in other current assets and a refund liability recorded in accrued expenses and other current liabilities.
57
EPP Revenues. We also sell ESP and GAP products on behalf of unrelated third parties, who are primarily responsible for fulfilling the contract, to customers who purchase a retail vehicle. The ESPs we currently offer on all used vehicles provide coverage up to 60 months (subject to mileage limitations), while GAP covers the customer for the term of their finance contract. We recognize revenue, on a net basis, at the time of sale. We also record a reserve, or refund liability, for estimated contract cancellations. The reserve for cancellations is evaluated for each product and is based on forecasted forward cancellation curves utilizing historical experience, recent trends and credit mix of the customer base. Our risk related to contract cancellations is limited to the revenue that we receive. Cancellations fluctuate depending on the volume of EPP sales, customer financing default or prepayment rates, and shifts in customer behavior, including those related to changes in the coverage or term of the product. The current portion of estimated cancellation reserves is recognized as a component of accrued expenses and other current liabilities with the remaining amount recognized in other liabilities. See Note 8 for additional information on cancellation reserves.
We are contractually entitled to receive profit-sharing revenues based on the performance of the ESPs administered by third parties. These revenues are a form of variable consideration included in EPP revenues to the extent that it is probable that it will not result in a significant revenue reversal. An estimate of the amount to which we expect to be entitled, subject to various constraints, is recognized upon satisfying the performance obligation of selling the ESP. These constraints include factors that are outside of the company’s influence or control and the length of time until settlement. We apply the expected value method, utilizing historical claims and cancellation data from CarMax customers, as well as external data and other qualitative assumptions. This estimate is reassessed each reporting period with changes reflected in other sales and revenues on our consolidated statements of earnings and other assets on our consolidated balance sheets. As of February 28, 2019, we had recognized a long-term contract asset of $25.7 million related to cumulative profit-sharing payments to which we expect to be entitled. There was no contract asset recognized as of February 29, 2020. In the fourth quarter of fiscal 2020, we received payments of $46.0 million, representing the profit-sharing accrued during fiscal 2019 and fiscal 2020, which was based on claims experience in calendar years 2016 through 2019. In future years, we expect EPP profit-sharing revenue will be less material, as it will reflect only a single incremental year versus four years of activity.
Third-Party Finance Fees. Customers applying for financing who are not approved or are conditionally approved by CAF are generally evaluated by other third-party finance providers. These providers generally either pay us or are paid a fixed, pre-negotiated fee per contract. We recognize these fees at the time of sale.
Service Revenues. Service revenue consists of labor and parts income related to vehicle repair service, including repairs of vehicles covered under an ESP we sell or warranty program. Service revenue is recognized at the time the work is completed.
3. | CARMAX AUTO FINANCE |
CAF provides financing to qualified retail customers purchasing vehicles from CarMax. CAF provides us the opportunity to capture additional profits, cash flows and sales while managing our reliance on third-party finance sources. Management regularly analyzes CAF’s operating results by assessing profitability, the performance of the auto loans receivable including trends in credit losses and delinquencies, and CAF direct expenses. This information is used to assess CAF’s performance and make operating decisions including resource allocation.
We typically use securitizations or other funding arrangements to fund loans originated by CAF, as discussed in Note 1(F). CAF income primarily reflects the interest and fee income generated by the auto loans receivable less the interest expense associated with the debt issued to fund these receivables, a provision for estimated loan losses and direct CAF expenses.
CAF income does not include any allocation of indirect costs. Although CAF benefits from certain indirect overhead expenditures, we have not allocated indirect costs to CAF to avoid making subjective allocation decisions. Examples of indirect costs not allocated to CAF include retail store expenses and corporate expenses. In addition, except for auto loans receivable, which are disclosed in Note 4, CAF assets are not separately reported nor do we allocate assets to CAF because such allocation would not be useful to management in making operating decisions.
58
Components of CAF Income
Years Ended February 29 or 28 | ||||||||||||||||||||
(In millions) | 2020 | % (1) | 2019 | % (1) | 2018 | % (1) | ||||||||||||||
Interest margin: | ||||||||||||||||||||
Interest and fee income | $ | $ | $ | |||||||||||||||||
Interest expense | ( | ) | ( | ) | ( | ) | ( | ) | ( | ) | ( | ) | ||||||||
Total interest margin | ||||||||||||||||||||
Provision for loan losses | ( | ) | ( | ) | ( | ) | ( | ) | ( | ) | ( | ) | ||||||||
Total interest margin after | ||||||||||||||||||||
provision for loan losses | ||||||||||||||||||||
Total other (expense) income | ( | ) | ||||||||||||||||||
Direct expenses: | ||||||||||||||||||||
Payroll and fringe benefit expense | ( | ) | ( | ) | ( | ) | ( | ) | ( | ) | ( | ) | ||||||||
Other direct expenses | ( | ) | ( | ) | ( | ) | ( | ) | ( | ) | ( | ) | ||||||||
Total direct expenses | ( | ) | ( | ) | ( | ) | ( | ) | ( | ) | ( | ) | ||||||||
CarMax Auto Finance income | $ | $ | $ | |||||||||||||||||
Total average managed receivables | $ | $ | $ | |||||||||||||||||
(1) | Percent of total average managed receivables. |
4. | AUTO LOANS RECEIVABLE |
Auto loans receivable include amounts due from customers related to retail vehicle sales financed through CAF and are presented net of an allowance for estimated loan losses. We generally use warehouse facilities to fund auto loans receivable originated by CAF until we elect to fund them through an asset-backed term funding transaction. The majority of the auto loans receivable serve as collateral for the related non-recourse notes payable of $13.61 billion as of February 29, 2020, and $12.54 billion as of February 28, 2019. See Notes 1(F) and 11 for additional information on securitizations and non-recourse notes payable.
Auto Loans Receivable, Net
As of February 29 or 28 | |||||||
(In millions) | 2020 | 2019 | |||||
Asset-backed term funding | $ | $ | |||||
Warehouse facilities | |||||||
Overcollateralization (1) | |||||||
Other managed receivables (2) | |||||||
Total ending managed receivables | |||||||
Accrued interest and fees | |||||||
Other | |||||||
Less: allowance for loan losses | ( | ) | ( | ) | |||
Auto loans receivable, net | $ | $ | |||||
(1) | Represents receivables restricted as excess collateral for the non-recourse funding vehicles. |
(2) | Other managed receivables includes receivables not funded through the non-recourse funding vehicles. |
Credit Quality. When customers apply for financing, CAF’s proprietary scoring models rely on the customers’ credit history and certain application information to evaluate and rank their risk. We obtain credit histories and other credit data that includes information such as number, age, type of and payment history for prior or existing credit accounts. The application information that is used includes income, collateral value and down payment. The scoring models yield credit grades that represent the relative likelihood of repayment. Customers assigned a grade of “A” are determined to have the highest probability of repayment, and customers assigned a lower grade are determined to have a lower probability of repayment. For loans that are approved, the credit grade influences the terms of the agreement, such as the required loan-to-value ratio and interest rate.
59
CAF uses a combination of the initial credit grades and historical performance to monitor the credit quality of the auto loans receivable on an ongoing basis. We validate the accuracy of the scoring models periodically. Loan performance is reviewed on a recurring basis to identify whether the assigned grades adequately reflect the customers’ likelihood of repayment.
Ending Managed Receivables by Major Credit Grade
As of February 29 or 28 | |||||||||||
(In millions) | 2020 (1) | % (2) | 2019 (1) | % (2) | |||||||
A | $ | $ | |||||||||
B | |||||||||||
C and other | |||||||||||
Total ending managed receivables | $ | $ | |||||||||
(1) | Classified based on credit grade assigned when customers were initially approved for financing. |
(2) | Percent of total ending managed receivables. |
Allowance for Loan Losses
As of February 29 or 28 | |||||||||||
(In millions) | 2020 | % (1) | 2019 | % (1) | |||||||
Balance as of beginning of year | $ | $ | |||||||||
Charge-offs | ( | ) | ( | ) | |||||||
Recoveries | |||||||||||
Provision for loan losses | |||||||||||
Balance as of end of year | $ | $ | |||||||||
(1) | Percent of total ending managed receivables. |
The allowance for loan losses represents an estimate of the amount of net losses inherent in our portfolio of managed receivables as of the applicable reporting date and expected to become evident during the following 12 months. The allowance is primarily based on the composition of the portfolio of managed receivables, historical loss trends and forecasted forward loss curves. We also take into account recent trends in delinquencies and defaults, recovery rates and the economic environment. The provision for loan losses is the periodic expense of maintaining an adequate allowance.
Past Due Receivables
As of February 29 or 28 | |||||||||||
(In millions) | 2020 | % (1) | 2019 | % (1) | |||||||
Total ending managed receivables | $ | $ | |||||||||
Delinquent loans: | |||||||||||
31-60 days past due | $ | $ | |||||||||
61-90 days past due | |||||||||||
Greater than 90 days past due | |||||||||||
Total past due | $ | $ | |||||||||
(1) | Percent of total ending managed receivables. |
60
5. | DERIVATIVE INSTRUMENTS AND HEDGING ACTIVITIES |
We use derivatives to manage certain risks arising from both our business operations and economic conditions, particularly with regard to issuances of debt. Primary exposures include LIBOR and other rates used as benchmarks in our securitizations and other debt financing. We enter into derivative instruments to manage exposures related to the future known receipt or payment of uncertain cash amounts, the values of which are impacted by interest rates, and generally designate these derivative instruments as cash flow hedges for accounting purposes. In certain cases, we may choose not to designate a derivative instrument as a cash flow hedge for accounting purposes due to uncertainty around the probability that future hedged transactions will occur. Our derivative instruments are used to manage (i) differences in the amount of our known or expected cash receipts and our known or expected cash payments principally related to the funding of our auto loans receivable, and (ii) exposure to variable interest rates associated with our term loan.
For the derivatives associated with our non-recourse funding vehicles that are designated as cash flow hedges, the changes in fair value are initially recorded in accumulated other comprehensive loss (“AOCL”). For the majority of these derivatives, the amounts are subsequently reclassified into CAF income in the period that the hedged forecasted transaction affects earnings, which occurs as interest expense is recognized on those future issuances of debt. During the next 12 months, we estimate that an additional $13.6 million will be reclassified from AOCL as a decrease to CAF income. Changes in fair value related to derivatives that have not been designated as cash flow hedges for accounting purposes are recognized in the income statement in the period in which the change occurs.
As of February 29, 2020 and February 28, 2019, we had interest rate swaps outstanding with a combined notional amount of $2.62 billion and $2.23 billion, respectively, that were designated as cash flow hedges of interest rate risk.
See Note 6 for discussion of fair values of financial instruments and Note 14 for the effect on comprehensive income.
6. | FAIR VALUE MEASUREMENTS |
Fair value is defined as the price that would be received to sell an asset or paid to transfer a liability in an orderly transaction between market participants in the principal market or, if none exists, the most advantageous market, for the specific asset or liability at the measurement date (referred to as the “exit price”). The fair value should be based on assumptions that market participants would use, including a consideration of nonperformance risk.
We assess the inputs used to measure fair value using the three-tier hierarchy. The hierarchy indicates the extent to which inputs used in measuring fair value are observable in the market.
Level 1 | Inputs include unadjusted quoted prices in active markets for identical assets or liabilities that we can access at the measurement date. |
Level 2 | Inputs other than quoted prices included within Level 1 that are observable for the asset or liability, either directly or indirectly, including quoted prices for similar assets in active markets, quoted prices from identical or similar assets in inactive markets and observable inputs such as interest rates and yield curves. |
Level 3 | Inputs that are significant to the measurement that are not observable in the market and include management’s judgments about the assumptions market participants would use in pricing the asset or liability (including assumptions about risk). |
Our fair value processes include controls that are designed to ensure that fair values are appropriate. Such controls include model validation, review of key model inputs, analysis of period-over-period fluctuations and reviews by senior management.
Valuation Methodologies
Money Market Securities. Money market securities are cash equivalents, which are included in cash and cash equivalents, restricted cash from collections on auto loans receivable and other assets. They consist of highly liquid investments with original maturities of three months or less and are classified as Level 1.
Mutual Fund Investments. Mutual fund investments consist of publicly traded mutual funds that primarily include diversified equity investments in large-, mid- and small-cap domestic and international companies or investment grade debt securities. The investments, which are included in other assets, are held in a rabbi trust established to fund informally our executive deferred compensation plan and are classified as Level 1.
61
Derivative Instruments. The fair values of our derivative instruments are included in either other current assets, other assets, accounts payable or other liabilities. Our derivatives are not exchange-traded and are over-the-counter customized derivative instruments. All of our derivative exposures are with highly rated bank counterparties.
We measure derivative fair values assuming that the unit of account is an individual derivative instrument and that derivatives are sold or transferred on a stand-alone basis. We estimate the fair value of our derivatives using quotes determined by the derivative counterparties and third-party valuation services. Quotes from third-party valuation services and quotes received from bank counterparties project future cash flows and discount the future amounts to a present value using market-based expectations for interest rates and the contractual terms of the derivative instruments. The models do not require significant judgment and model inputs can typically be observed in a liquid market; however, because the models include inputs other than quoted prices in active markets, all derivatives are classified as Level 2.
Our derivative fair value measurements consider assumptions about counterparty and our own nonperformance risk. We monitor counterparty and our own nonperformance risk and, in the event that we determine that a party is unlikely to perform under terms of the contract, we would adjust the derivative fair value to reflect the nonperformance risk.
Items Measured at Fair Value on a Recurring Basis
As of February 29, 2020 | |||||||||||
(In thousands) | Level 1 | Level 2 | Total | ||||||||
Assets: | |||||||||||
Money market securities | $ | $ | $ | ||||||||
Mutual fund investments | |||||||||||
Derivative instruments | |||||||||||
Total assets at fair value | $ | $ | $ | ||||||||
Percent of total assets at fair value | % | % | % | ||||||||
Percent of total assets | % | % | % | ||||||||
Liabilities: | |||||||||||
Derivative instruments | $ | $ | ( | ) | $ | ( | ) | ||||
Total liabilities at fair value | $ | $ | ( | ) | $ | ( | ) | ||||
Percent of total liabilities | % | % | % | ||||||||
As of February 28, 2019 | |||||||||||
(In thousands) | Level 1 | Level 2 | Total | ||||||||
Assets: | |||||||||||
Money market securities | $ | $ | $ | ||||||||
Mutual fund investments | |||||||||||
Derivative instruments | |||||||||||
Total assets at fair value | $ | $ | $ | ||||||||
Percent of total assets at fair value | % | % | % | ||||||||
Percent of total assets | % | % | % | ||||||||
Liabilities: | |||||||||||
Derivative instruments | $ | $ | ( | ) | $ | ( | ) | ||||
Total liabilities at fair value | $ | $ | ( | ) | $ | ( | ) | ||||
Percent of total liabilities | % | % | % | ||||||||
62
Fair Value of Financial Instruments
The carrying value of our cash and cash equivalents, accounts receivable, other restricted cash deposits and accounts payable approximates fair value due to the short-term nature and/or variable rates associated with these financial instruments. Auto loans receivable are presented net of an allowance for estimated loan losses. We believe that the carrying value of our revolving credit facility and term loan approximates fair value due to the variable rates associated with these obligations. The fair value of our senior unsecured notes, which are not carried at fair value on our consolidated balance sheets, was determined using Level 2 inputs based on quoted market prices. The carrying value and fair value of the senior unsecured notes as of February 29, 2020 and February 28, 2019, respectively, are as follows:
(In thousands) | As of February 29, 2020 | As of February 28, 2019 | |||||
Carrying value | $ | $ | |||||
Fair value | $ | $ | |||||
7. | PROPERTY AND EQUIPMENT |
As of February 29 or 28 | |||||||
(In thousands) | 2020 | 2019 | |||||
Land | $ | $ | |||||
Land held for development (1) | |||||||
Buildings | |||||||
Leasehold improvements | |||||||
Furniture, fixtures and equipment | |||||||
Construction in progress | |||||||
Total property and equipment | |||||||
Less: accumulated depreciation and amortization | ( | ) | ( | ) | |||
Property and equipment, net | $ | $ | |||||
(1) | Land held for development represents land owned for potential store growth. |
Depreciation expense was $190.6 million in fiscal 2020, $169.8 million in fiscal 2019 and $158.6 million in fiscal 2018.
8. | CANCELLATION RESERVES |
We recognize revenue for EPP products, on a net basis, at the time of sale. We also record a reserve, or refund liability, for estimated contract cancellations. Cancellations of these services may result from early termination by the customer, or default or prepayment on the finance contract. The reserve for cancellations is evaluated for each product and is based on forecasted forward cancellation curves utilizing historical experience, recent trends and credit mix of the customer base.
Cancellation Reserves
As of February 29 or 28 | |||||||
(In millions) | 2020 | 2019 | |||||
Balance as of beginning of year | $ | $ | |||||
Cancellations | ( | ) | ( | ) | |||
Provision for future cancellations | |||||||
Balance as of end of year | $ | $ | |||||
The current portion of estimated cancellation reserves is recognized as a component of accrued expenses and other current liabilities with the remaining amount recognized in other liabilities. As of February 29, 2020 and February 28, 2019, the current portion of cancellation reserves was $63.5 million and $55.6 million, respectively.
63
9. | INCOME TAXES |
Tax Reform. The Tax Cuts and Jobs Act of 2017 (the “2017 Tax Act”) was enacted on December 22, 2017, and, among other changes, reduced the federal statutory tax rate from 35.0% to 21.0%. In accordance with U.S. GAAP for income taxes, as well as SEC Staff Accounting Bulletin No. 118 (“SAB 118”), the company made a reasonable estimate of the impacts of the 2017 Tax Act and recorded this estimate in its results for the year ended February 28, 2018. SAB 118 allows for a measurement period of up to one year, from the date of enactment, to complete the company’s accounting for the impacts of the 2017 Tax Act. As of February 28, 2019, our analysis under SAB 118 was completed and resulted in no material adjustments to the provisional amounts recorded as of February 28, 2018.
The provision for income taxes and effective tax rate for fiscal 2018 included a $32.7 million increase in tax expense related to the revaluation of our net deferred tax asset at the lower federal statutory tax rate. This increase was partially offset by a $20.8 million benefit from the reduction in the federal statutory tax rate in the fourth quarter of fiscal 2018.
Income Tax Provision
Years Ended February 29 or 28 | |||||||||||
(In thousands) | 2020 | 2019 | 2018 | ||||||||
Current: | |||||||||||
Federal | $ | $ | $ | ||||||||
State | |||||||||||
Total | |||||||||||
Deferred: | |||||||||||
Federal | |||||||||||
State | ( | ) | ( | ) | ( | ) | |||||
Total | ( | ) | |||||||||
Income tax provision | $ | $ | $ | ||||||||
Effective Income Tax Rate Reconciliation
Years Ended February 29 or 28 | ||||||||
2020 | 2019 | 2018 | ||||||
Federal statutory income tax rate | % | % | % | |||||
State and local income taxes, net of federal benefit | ||||||||
2017 Tax Act | ( | ) | ||||||
Share-based compensation | ( | ) | ( | ) | ( | ) | ||
Nondeductible and other items | ||||||||
Credits | ( | ) | ( | ) | ( | ) | ||
Effective income tax rate | % | % | % | |||||
The 2017 Tax Act above includes the following impacts for fiscal 2018:
• | Revaluation of deferred taxes that existed on December 22, 2017, the enactment date of the 2017 Tax Act. |
• | Deferred taxes that were created after December 22, 2017. These items were recognized in fiscal 2018 at the federal statutory tax rate of |
64
Temporary Differences Resulting in Deferred Tax Assets and Liabilities
As of February 29 or 28 | |||||||
(In thousands) | 2020 | 2019 | |||||
Deferred tax assets: | |||||||
Accrued expenses and other | $ | $ | |||||
Partnership basis | |||||||
Operating lease liabilities | |||||||
Share-based compensation | |||||||
Derivatives | |||||||
Capital loss carry forward | |||||||
Total deferred tax assets | |||||||
Less: valuation allowance | ( | ) | ( | ) | |||
Total deferred tax assets after valuation allowance | |||||||
Deferred tax liabilities: | |||||||
Prepaid expenses | |||||||
Property and equipment | |||||||
Operating lease assets | |||||||
Inventory | |||||||
Profit-sharing revenues | |||||||
Derivatives | |||||||
Total deferred tax liabilities | |||||||
Net deferred tax asset | $ | $ | |||||
Except for amounts for which a valuation allowance has been provided, we believe it is more likely than not that the results of future operations and the reversals of existing deferred taxable temporary differences will generate sufficient taxable income to realize the deferred tax assets. The valuation allowance as of February 29, 2020, relates to capital loss carryforwards that are not more likely than not to be utilized prior to their expiration.
Reconciliation of Unrecognized Tax Benefits
Years Ended February 29 or 28 | |||||||||||
(In thousands) | 2020 | 2019 | 2018 | ||||||||
Balance at beginning of year | $ | $ | $ | ||||||||
Increases for tax positions of prior years | |||||||||||
Decreases for tax positions of prior years | ( | ) | ( | ) | ( | ) | |||||
Increases based on tax positions related to the current year | |||||||||||
Settlements | ( | ) | ( | ) | ( | ) | |||||
Lapse of statute | ( | ) | ( | ) | ( | ) | |||||
Balance at end of year | $ | $ | $ | ||||||||
As of February 29, 2020, we had $30.9 million of gross unrecognized tax benefits, $9.2 million of which, if recognized, would affect our effective tax rate. It is reasonably possible that the amount of the unrecognized tax benefit will increase or decrease during the next 12 months; however, we do not expect the change to have a significant effect on our results of operations, financial condition or cash flows. As of February 28, 2019, we had $30.3 million of gross unrecognized tax benefits, $10.7 million of which, if recognized, would affect our effective tax rate. As of February 28, 2018, we had $28.7 million of gross unrecognized tax benefits, $9.6 million of which, if recognized, would affect our effective tax rate.
Our continuing practice is to recognize interest and penalties related to income tax matters in SG&A expenses. Our accrual for interest and penalties was $4.0 million, $3.2 million and $2.8 million as of February 29, 2020 and February 28, 2019 and 2018, respectively.
65
10. | BENEFIT PLANS |
(A) | Retirement Benefit Plans |
We have two frozen noncontributory defined benefit plans: our pension plan (the “pension plan”) and our unfunded, nonqualified plan (the “restoration plan”), which restores retirement benefits for certain associates who are affected by Internal Revenue Code limitations on benefits provided under the pension plan. No additional benefits have accrued under these plans since they were frozen; however, we have a continuing obligation to fund the pension plan and will continue to recognize net periodic pension expense for both plans for benefits earned prior to being frozen. We use a fiscal year end measurement date for both the pension plan and the restoration plan.
Benefit Plan Information
As of February 29 or 28 | |||||||||||||||||||||||
Pension Plan | Restoration Plan | Total | |||||||||||||||||||||
(In thousands) | 2020 | 2019 | 2020 | 2019 | 2020 | 2019 | |||||||||||||||||
Plan assets | $ | $ | $ | $ | $ | $ | |||||||||||||||||
Projected benefit obligation | |||||||||||||||||||||||
Funded status recognized | $ | ( | ) | $ | ( | ) | $ | ( | ) | $ | ( | ) | $ | ( | ) | $ | ( | ) | |||||
Amounts recognized in the consolidated balance sheets: | |||||||||||||||||||||||
Current liability | $ | $ | $ | ( | ) | $ | ( | ) | $ | ( | ) | $ | ( | ) | |||||||||
Noncurrent liability | ( | ) | ( | ) | ( | ) | ( | ) | ( | ) | ( | ) | |||||||||||
Net amount recognized | $ | ( | ) | $ | ( | ) | $ | ( | ) | $ | ( | ) | $ | ( | ) | $ | ( | ) | |||||
Pension Plan | Restoration Plan | Total | |||||||||||||||||||||||
(In thousands) | 2020 | 2019 | 2018 | 2020 | 2019 | 2018 | 2020 | 2019 | 2018 | ||||||||||||||||
Total net pension (benefit) expense | ( | ( | ) | ( | ) | ( | ) | ||||||||||||||||||
Total net actuarial loss (1) | |||||||||||||||||||||||||
(1) |
The projected benefit obligation (“PBO”) will change primarily due to interest cost and total net actuarial (gain) loss, and plan assets will change primarily as a result of the actual return on plan assets. Benefit payments, which reduce the PBO and plan assets, were not material in fiscal 2020 or 2019. Employer contributions, which increase plan assets, were $10.3 million in fiscal 2019; there were no employer contributions in fiscal 2020. The net actuarial (gain) loss in a fiscal year is recognized in accumulated other comprehensive loss and may later be recognized as a component of future pension expense. In fiscal 2021, we anticipate that $3.8 million in estimated actuarial losses of the pension plan will be amortized from accumulated other comprehensive loss. Estimated actuarial losses to be amortized from accumulated other comprehensive loss for the restoration plan are not expected to be significant.
Benefit Obligations. The accumulated benefit obligation (“ABO”) and PBO represent the obligations of the benefit plans for past service as of the measurement date. ABO is the present value of benefits earned to date with benefits computed based on current service and compensation levels. PBO is ABO increased to reflect expected future service and increased compensation levels. As a result of the freeze of plan benefits under our pension and restoration plans, the ABO and PBO balances are equal to one another at all subsequent dates.
Funding Policy. For the pension plan, we contribute amounts sufficient to meet minimum funding requirements as set forth in the employee benefit and tax laws, plus any additional amounts as we may determine to be appropriate. We expect to make contributions of $5.7 million to the pension plan in fiscal 2021. We expect the pension plan to make benefit payments of
66
approximately $5.2 million for each of the next three fiscal years, and $6.3 million for each of the subsequent two fiscal years. For the non-funded restoration plan, we contribute an amount equal to the benefit payments, which we expect to be approximately $0.6 million for each of the next five fiscal years.
Assumptions Used to Determine Benefit Obligations
As of February 29 or 28 | |||||||||||
Pension Plan | Restoration Plan | ||||||||||
2020 | 2019 | 2020 | 2019 | ||||||||
Discount rate | % | % | % | % | |||||||
Assumptions Used to Determine Net Pension Expense
Years Ended February 29 or 28 | |||||||||||||||||
Pension Plan | Restoration Plan | ||||||||||||||||
2020 | 2019 | 2018 | 2020 | 2019 | 2018 | ||||||||||||
Discount rate | % | % | % | % | % | % | |||||||||||
Expected rate of return on plan assets | % | % | % | % | % | % | |||||||||||
Assumptions. Underlying both the calculation of the PBO and the net pension expense are actuarial calculations of each plan’s liability. These calculations use participant-specific information such as salary, age and years of service, as well as certain assumptions, the most significant being the discount rate, rate of return on plan assets and mortality rate. We evaluate these assumptions at least once a year and make changes as necessary.
The discount rate used for retirement benefit plan accounting reflects the yields available on high-quality, fixed income debt instruments. For our plans, we review high quality corporate bond indices in addition to a hypothetical portfolio of corporate bonds with maturities that approximate the expected timing of the anticipated benefit payments.
To determine the expected long-term return on plan assets, we consider the current and anticipated asset allocations, as well as historical and estimated returns on various categories of plan assets. We apply the estimated rate of return to a market-related value of assets, which reduces the underlying variability in the asset values. The use of expected long-term rates of return on pension plan assets could result in recognized asset returns that are greater or less than the actual returns of those pension plan assets in any given year. Over time, however, the expected long-term returns are anticipated to approximate the actual long-term returns, and therefore, result in a pattern of income and expense recognition that more closely matches the pattern of the services provided by the employees. Differences between actual and expected returns, which are a component of unrecognized actuarial gains/losses, are recognized over the average life expectancy of all plan participants.
Fair Value of Plan Assets
As of February 29 or 28 | |||||||
(In thousands) | 2020 | 2019 | |||||
Mutual funds (Level 1): | |||||||
Equity securities | $ | $ | |||||
Equity securities – international | |||||||
Fixed income securities | |||||||
Collective funds (NAV): | |||||||
Short-term investments | |||||||
Equity securities | |||||||
Fixed income securities | |||||||
Investment payables, net | ( | ) | |||||
Total | $ | $ | |||||
Plan Assets. Our pension plan assets are held in trust and a fiduciary committee sets the investment policies and strategies. Long-term strategic investment objectives include achieving reasonable returns while prudently balancing risk and return, and controlling costs. We target allocating approximately 75 % of plan assets to equity and equity-related instruments and approximately 25 % to
67
fixed income securities. Equity securities are currently composed of both collective funds and mutual funds that include highly diversified investments in large-, mid- and small-cap companies located in the United States and internationally. The fixed income securities are currently composed of collective funds that include investments in debt securities, corporate bonds, mortgage-backed securities and other debt obligations primarily in the United States. We do not expect any plan assets to be returned to us during fiscal 2021.
The fair values of the plan’s assets are provided by the plan’s trustee and the investment managers. Within the fair value hierarchy (see Note 6), the mutual funds are classified as Level 1 as quoted active market prices for identical assets are used to measure fair value. The collective funds are public investment vehicles valued using a net asset value (“NAV”) and, therefore, are outside of the fair value hierarchy. The collective funds may be liquidated with minimal restrictions.
(B) | Retirement Savings 401(k) Plan |
We sponsor a 401(k) plan for all associates meeting certain eligibility criteria. The plan contains a company matching contribution as well as an additional discretionary company-funded contribution to those associates meeting certain age and service requirements. The total cost for company contributions was $47.4 million in fiscal 2020, $42.3 million in fiscal 2019 and $39.7 million in fiscal 2018.
(C) | Retirement Restoration Plan |
We sponsor a non-qualified retirement plan for certain senior executives who are affected by Internal Revenue Code limitations on benefits provided under the Retirement Savings 401(k) Plan. Under this plan, these associates may continue to defer portions of their compensation for retirement savings. We match the associates’ contributions at the same rate provided under the 401(k) plan, and also may provide an annual discretionary company-funded contribution under the same terms of the 401(k) plan. This plan is unfunded with lump sum payments to be made upon the associate’s retirement. The total cost for this plan was not significant in fiscal 2020, fiscal 2019 and fiscal 2018.
(D) | Executive Deferred Compensation Plan |
We sponsor an unfunded nonqualified deferred compensation plan to permit certain eligible associates to defer receipt of a portion of their compensation to a future date. This plan also includes a restorative company contribution designed to compensate the plan participants for any loss of company contributions under the Retirement Savings 401(k) Plan and the Retirement Restoration Plan due to a reduction in their eligible compensation resulting from deferrals into the Executive Deferred Compensation Plan. The total cost for this plan was not significant in fiscal 2020, fiscal 2019 and fiscal 2018.
11. | DEBT |
(In thousands) | As of February 29 or 28 | |||||||
Debt Description (1) | Maturity Date | 2020 | 2019 | |||||
Revolving credit facility (2) (3) | June 2024 | $ | $ | |||||
Term loan (2) | June 2024 | |||||||
3.86% Senior notes | April 2023 | |||||||
4.17% Senior notes | April 2026 | |||||||
4.27% Senior notes | April 2028 | |||||||
Financing obligations | Various dates through February 2059 | |||||||
Non-recourse notes payable | Various dates through July 2026 | |||||||
Total debt | ||||||||
Less: current portion | ( | ) | ( | ) | ||||
Less: unamortized debt issuance costs | ( | ) | ( | ) | ||||
Long-term debt, net | $ | $ | ||||||
(1) | Interest is payable monthly, with the exception of our senior notes, which are payable semi-annually. |
(2) | Borrowings accrue interest at variable rates based on LIBOR, the federal funds rate, or the prime rate, depending on the type of borrowing. |
(3) | During March 2020, we made net borrowings under this facility of approximately $ |
Revolving Credit Facility. Borrowings under our $1.45 billion unsecured revolving credit facility (the “credit facility”) are available for working capital and general corporate purposes. We pay a commitment fee on the unused portions of the available funds. Borrowings under the credit facility are either due “on demand” or at maturity depending on the type of
68
borrowing. Borrowings with “on demand” repayment terms are presented as short-term debt while amounts due at maturity are presented as long-term debt as no repayments are expected to be made within the next 12 months. As of February 29, 2020, the unused capacity of $997.3 million was fully available to us.
The weighted average interest rate on outstanding short-term and long-term debt was 3.23 % in fiscal 2020, 3.50 % in fiscal 2019 and 2.49 % in fiscal 2018.
Term Loan. Borrowings under our $300 million term loan are available for working capital and general corporate purposes. The interest rate on our term loan was 2.56 % as of February 29, 2020, and the loan was classified as long-term debt as no repayments are scheduled to be made within the next 12 months.
Senior Notes. Borrowings under our unsecured senior notes totaling $500 million are available for working capital and general corporate purposes. These notes were classified as long-term debt as no repayments are scheduled to be made within the next 12 months.
Financing Obligations. Financing obligations relate to stores subject to sale-leaseback transactions that did not qualify for sale accounting. The financing obligations were structured at varying interest rates and generally have initial lease terms ranging from 15 to 20 years with payments made monthly. We have not entered into any new sale-leaseback transactions since fiscal 2009. In the event the agreements are modified or extended beyond their original term, the related obligation is adjusted based on the present value of the revised future payments, with a corresponding change to the assets subject to these transactions. Upon modification, the amortization of the obligation is reset, resulting in more of the payments being applied to interest expense in the initial years following the modification.
Future maturities of financing obligations were as follows:
(In thousands) | As of February 29, 2020 | ||
Fiscal 2021 | $ | ||
Fiscal 2022 | |||
Fiscal 2023 | |||
Fiscal 2024 | |||
Fiscal 2025 | |||
Thereafter | |||
Total payments | |||
Less: interest | ( | ) | |
Present value of financing obligations | $ | ||
Non-Recourse Notes Payable. The non-recourse notes payable relate to auto loans receivable funded through non-recourse funding vehicles. The timing of principal payments on the non-recourse notes payable is based on the timing of principal collections and defaults on the related auto loans receivable. The current portion of non-recourse notes payable represents principal payments that are due to be distributed in the following period.
Notes payable related to our asset-backed term funding transactions accrue interest predominantly at fixed rates and have scheduled maturities through July 2026, but may mature earlier, depending upon repayment rate of the underlying auto loans receivable.
69
Information on our funding vehicles of non-recourse notes payable as of February 29, 2020 are as follows:
(in billions) | Capacity | ||
Warehouse facilities | |||
August 2020 expiration | $ | ||
September 2020 expiration | |||
February 2021 expiration | |||
Combined warehouse facility limit | $ | ||
Unused capacity | $ | ||
Non-recourse notes payable outstanding: | |||
Warehouse facilities | $ | ||
Asset-backed term funding transactions | |||
Non-recourse notes payable | $ | ||
We enter into warehouse facility agreements for one-year terms and generally renew the agreements annually. The return requirements of warehouse facility investors could fluctuate significantly depending on market conditions. At renewal, the cost, structure and capacity of the facilities could change. These changes could have a significant impact on our funding costs. While we believe the unused capacity in our warehouse facilities could support CAF activity for several months, particularly in the current sales environment, we are actively assessing alternatives in the event the market for asset-backed securities remains disrupted for an extended period of time.
See Notes 1(F) and 4 for additional information on the related auto loans receivable.
Capitalized Interest. We capitalize interest in connection with the construction of certain facilities. For fiscal 2020, fiscal 2019 and fiscal 2018, we capitalized interest of $7.0 million, $6.4 million, and $6.9 million, respectively.
Financial Covenants. The credit facility, term loan and senior note agreements contain representations and warranties, conditions and covenants. We must also meet financial covenants in conjunction with certain financing obligations. The agreements governing our non-recourse funding vehicles contain representations and warranties, financial covenants and performance triggers. As of February 29, 2020, we were in compliance with all financial covenants and our non-recourse funding vehicles were in compliance with the related performance triggers. As of that date, our performance under these covenants could degrade such that, if the covenant ratios were to double, we would still remain in compliance.
12. | STOCK AND STOCK-BASED INCENTIVE PLANS |
(A) | Preferred Stock |
Under the terms of our Articles of Incorporation, the board of directors may determine the rights, preferences and terms of our authorized but unissued shares of preferred stock. We have authorized 20,000,000 shares of preferred stock, $20 par value. No shares of preferred stock are currently outstanding.
(B) | Share Repurchase Program |
As of February 29, 2020, a total of $2 billion of board authorizations for repurchases of our common stock was outstanding, with no expiration date, of which $1.55 billion remained available for repurchase. Subsequent to the end of the fiscal year, our current stock repurchase program was suspended, although the repurchase authorization remains effective.
Years Ended February 29 or 28 | |||||||||||
2020 | 2019 | 2018 | |||||||||
Number of shares repurchased (in thousands) | |||||||||||
Average cost per share | $ | $ | $ | ||||||||
Available for repurchase, as of end of year (in millions) | $ | $ | $ | ||||||||
70
(C) | Stock Incentive Plans |
We maintain long-term incentive plans for management, certain employees and the nonemployee members of our board of directors. The plans allow for the granting of equity-based compensation awards, including nonqualified stock options, incentive stock options, stock appreciation rights, restricted stock awards, stock- and cash-settled restricted stock units, stock grants or a combination of awards. To date, we have not awarded any incentive stock options.
As of February 29, 2020, a total of 59,350,000 shares of our common stock had been authorized to be issued under the long-term incentive plans. The number of unissued common shares reserved for future grants under the long-term incentive plans was 7,972,743 as of that date.
The majority of associates who receive share-based compensation awards primarily receive cash-settled restricted stock units. Senior management and other key associates receive awards of nonqualified stock options, stock-settled restricted stock units and/or restricted stock awards. Nonemployee directors receive awards of nonqualified stock options, stock grants, stock-settled restricted stock units and/or restricted stock awards. Excluding stock grants and stock-settled deferred stock units, all share-based compensation awards, including any associated dividend rights, are subject to forfeiture.
Nonqualified Stock Options. Nonqualified stock options are awards that allow the recipient to purchase shares of our common stock at a fixed price. Stock options are granted at an exercise price equal to the fair market value of our common stock on the grant date. The stock options generally vest annually in equal amounts over 4 years. These options expire 7 years after the date of the grant.
Cash-Settled Restricted Stock Units. Also referred to as restricted stock units, or RSUs, these are awards that entitle the holder to a cash payment equal to the fair market value of a share of our common stock for each unit granted. Conversion generally occurs at the end of a three-year vesting period. However, the cash payment per RSU will not be greater than 200 % or less than 75 % of the fair market value of a share of our common stock on the grant date. The initial grant date fair values are based on the volume-weighted average prices of our common stock on the grant dates. RSUs are liability awards and do not have voting rights.
Stock-Settled Market Stock Units. Also referred to as market stock units, or MSUs, these are restricted stock unit awards with market conditions granted to eligible key associates that are converted into between zero and two shares of common stock for each unit granted. Conversion generally occurs at the end of a three-year vesting period. The conversion ratio is calculated by dividing the average closing price of our stock during the final 40 trading days of the three-year vesting period by our stock price on the grant date, with the resulting quotient capped at two . This quotient is then multiplied by the number of MSUs granted to yield the number of shares awarded. The grant date fair values are determined using a Monte-Carlo simulation and are based on the expected market price of our common stock on the vesting date and the expected number of converted common shares. MSUs do not have voting rights.
Other Share-Based Incentives
Stock-Settled Performance Stock Units. Also referred to as performance stock units, or PSUs, these are restricted stock unit awards with performance conditions granted to eligible key associates that are converted into between zero and two shares of common stock for each unit granted. Conversion generally occurs at the end of a three-year vesting period. For the fiscal 2018 grants, the conversion ratio is based on the company reaching certain target levels set by the board of directors for cumulative three-year pretax diluted earnings per share at the end of the three-year period, with the resulting quotient subject to meeting a minimum 25 % threshold and capped at 200 %. For the fiscal 2020 grants, the conversion ratio is based on the company reaching certain target levels set by the board of directors for annual pretax diluted earnings per share excluding any unrealized gains or losses on equity investments in private companies at the end of each one-year period for one-third of the granted units, with the resulting quotients subject to meeting a minimum 25 % threshold and capped at 200 %. These quotients are then multiplied by the number of PSUs granted to yield the number of shares awarded. The grant date fair values are based on the volume-weighted average prices of our common stock on the grant dates. PSUs do not have voting rights. As of February 29, 2020, 128,487 units were outstanding at a weighted average grant date fair value per share of $68.32 .
Stock-Settled Deferred Stock Units. Also referred to as deferred stock units, or DSUs, these are restricted stock unit awards granted to non-employee members of our board of directors that are converted into one share of common stock for each unit granted. Conversion occurs at the end of the one-year vesting period unless the director has exercised the option to defer conversion until separation of service to the company. The grant date fair values are based on the volume-weighted average prices of our common stock on the grant dates. DSUs have no voting rights. As of February 29, 2020, 38,730 units were outstanding at a weighted average grant date fair value of $80.19 .
71
Restricted Stock Awards. Restricted stock awards, or RSAs, are awards of our common stock that are subject to specified restrictions that generally lapse after a one- to three-year period from the date of the grant. The grant date fair values are based on the volume-weighted average prices of our common stock on the grant dates. Participants holding restricted stock are entitled to vote on matters submitted to holders of our common stock for a vote. As of February 29, 2020, there were 4,517 shares outstanding at a grant date value of $88.54 .
Employee Stock Purchase Plan. We sponsor an employee stock purchase plan for all associates meeting certain eligibility criteria. We have authorized up to 8,000,000 shares of common stock with a total of 2,628,021 shares remaining available for issuance under the plan as of February 29, 2020. Associate contributions are limited to 10 % of eligible compensation, up to a maximum that was increased in January 2020 from $7,500 per year to $10,000 per year. For each $1.00 contributed to the plan by associates, we match $0.15 . Shares are acquired through open-market purchases. We purchased 174,325 shares at an average price per share of $85.64 during fiscal 2020, 185,856 shares at an average price per share of $67.66 during fiscal 2019 and 177,433 shares at an average price per share of $65.11 during fiscal 2018.
(D) | Share-Based Compensation |
Composition of Share-Based Compensation Expense
Years Ended February 29 or 28 | |||||||||||
(In thousands) | 2020 | 2019 | 2018 | ||||||||
Cost of sales | $ | $ | $ | ||||||||
CarMax Auto Finance income | |||||||||||
Selling, general and administrative expenses | |||||||||||
Share-based compensation expense, before income taxes | $ | $ | $ | ||||||||
Composition of Share-Based Compensation Expense – By Grant Type
Years Ended February 29 or 28 | |||||||||||
(In thousands) | 2020 | 2019 | 2018 | ||||||||
Nonqualified stock options | $ | $ | $ | ||||||||
Cash-settled restricted stock units (RSUs) | |||||||||||
Stock-settled market stock units (MSUs) | |||||||||||
Other share-based incentives: | |||||||||||
Stock-settled performance stock units (PSUs) | |||||||||||
Stock-settled deferred stock units (DSUs) | |||||||||||
Restricted stock (RSAs) | |||||||||||
Employee stock purchase plan | |||||||||||
Total other share-based incentives | |||||||||||
Share-based compensation expense, before income taxes | $ | $ | $ | ||||||||
72
Unrecognized Share-Based Compensation Expense – By Grant Type
As of February 29, 2020 | ||||||
Weighted Average | ||||||
Unrecognized | Remaining | |||||
Compensation | Recognition Life | |||||
(Costs in millions) | Costs | (Years) | ||||
Nonqualified stock options | $ | |||||
Stock-settled market stock units | ||||||
Other share-based incentives: | ||||||
Stock-settled performance stock units | ||||||
Stock-settled deferred stock units | — | |||||
Restricted stock | ||||||
Total other share-based incentives | ||||||
Total | $ | |||||
We recognize compensation expense for stock options, MSUs, PSUs, DSUs and RSAs on a straight-line basis (net of estimated forfeitures) over the requisite service period, which is generally the vesting period of the award. The PSU expense is adjusted for any change in management’s assessment of the performance target level that is probable of being achieved. The variable expense associated with RSUs is recognized over their vesting period (net of estimated forfeitures) and is calculated based on the volume-weighted average price of our common stock on the last trading day of each reporting period.
The total costs for matching contributions for our employee stock purchase plan are included in share-based compensation expense. There were no capitalized share-based compensation costs as of or for the years ended February 29, 2020, February 28, 2019 or February 28, 2018.
Stock Option Activity
Weighted | ||||||||||||
Weighted | Average | |||||||||||
Average | Remaining | Aggregate | ||||||||||
Number of | Exercise | Contractual | Intrinsic | |||||||||
(Shares and intrinsic value in thousands) | Shares | Price | Life (Years) | Value | ||||||||
Outstanding as of February 28, 2019 | $ | |||||||||||
Options granted | ||||||||||||
Options exercised | ( | ) | ||||||||||
Options forfeited or expired | ( | ) | ||||||||||
Outstanding as of February 29, 2020 | $ | $ | ||||||||||
Exercisable as of February 29, 2020 | $ | $ | ||||||||||
Stock Option Information
Years Ended February 29 or 28 | |||||||||||
2020 | 2019 | 2018 | |||||||||
Options granted | |||||||||||
Weighted average grant date fair value per share | $ | $ | $ | ||||||||
Cash received from options exercised (in millions) | $ | $ | $ | ||||||||
Intrinsic value of options exercised (in millions) | $ | $ | $ | ||||||||
Realized tax benefits (in millions) | $ | $ | $ | ||||||||
For stock options, the fair value of each award is estimated as of the date of grant using a binomial valuation model. In computing the value of the option, the binomial model considers characteristics of fair-value option pricing that are not available for
73
consideration under a closed-form valuation model (for example, the Black-Scholes model), such as the contractual term of the option, the probability that the option will be exercised prior to the end of its contractual life and the probability of termination or retirement of the option holder. For this reason, we believe that the binomial model provides a fair value that is more representative of actual experience and future expected experience than the value calculated using a closed-form model. Estimates of fair value are not intended to predict actual future events or the value ultimately realized by the recipients of share-based awards.
Assumptions Used to Estimate Option Values
Years Ended February 29 or 28 | |||||||||||||||||
2020 | 2019 | 2018 | |||||||||||||||
Dividend yield | % | % | % | ||||||||||||||
Expected volatility factor (1) | % | - | % | % | - | % | % | - | % | ||||||||
Weighted average expected volatility | % | % | % | ||||||||||||||
Risk-free interest rate (2) | % | - | % | % | - | % | % | - | % | ||||||||
Expected term (in years) (3) | |||||||||||||||||
(1) | Measured using historical daily price changes of our stock for a period corresponding to the term of the options and the implied volatility derived from the market prices of traded options on our stock. |
(2) | Based on the U.S. Treasury yield curve at the time of grant. |
(3) | Represents the estimated number of years that options will be outstanding prior to exercise. |
Cash-Settled Restricted Stock Unit Activity
Weighted | ||||||
Average | ||||||
Number of | Grant Date | |||||
(Units in thousands) | Units | Fair Value | ||||
Outstanding as of February 28, 2019 | $ | |||||
Stock units granted | $ | |||||
Stock units vested and converted | ( | ) | $ | |||
Stock units cancelled | ( | ) | $ | |||
Outstanding as of February 29, 2020 | $ | |||||
Cash-Settled Restricted Stock Unit Information
Years Ended February 29 or 28 | |||||||||||
2020 | 2019 | 2018 | |||||||||
Stock units granted | |||||||||||
Initial weighted average grant date fair value per share | $ | $ | $ | ||||||||
Payments (before payroll tax withholdings) upon | |||||||||||
vesting (in millions) | $ | $ | $ | ||||||||
Realized tax benefits (in millions) | $ | $ | $ | ||||||||
Expected Cash Settlement Range Upon Restricted Stock Unit Vesting
As of February 29, 2020 | |||||||
(In thousands) | Minimum (1) | Maximum (1) | |||||
Fiscal 2021 | $ | $ | |||||
Fiscal 2022 | |||||||
Fiscal 2023 | |||||||
Total expected cash settlements | $ | $ | |||||
(1) | Net of estimated forfeitures. |
74
Stock-Settled Market Stock Unit Activity
Weighted | ||||||
Average | ||||||
Number of | Grant Date | |||||
(Units in thousands) | Units | Fair Value | ||||
Outstanding as of February 28, 2019 | $ | |||||
Stock units granted | $ | |||||
Stock units vested and converted | ( | ) | $ | |||
Stock units cancelled | ( | ) | $ | |||
Outstanding as of February 29, 2020 | $ | |||||
Stock-Settled Market Stock Unit Information
Years Ended February 29 or 28 | |||||||||||
2020 | 2019 | 2018 | |||||||||
Stock units granted | |||||||||||
Weighted average grant date fair value per share | $ | $ | $ | ||||||||
Realized tax benefits (in millions) | $ | $ | $ | ||||||||
13. | NET EARNINGS PER SHARE |
Basic and Dilutive Net Earnings Per Share Reconciliations
Years Ended February 29 or 28 | |||||||||||
(In thousands except per share data) | 2020 | 2019 | 2018 | ||||||||
Net earnings | $ | $ | $ | ||||||||
Weighted average common shares outstanding | |||||||||||
Dilutive potential common shares: | |||||||||||
Stock options | |||||||||||
Stock-settled restricted stock units | |||||||||||
Weighted average common shares and dilutive | |||||||||||
potential common shares | |||||||||||
Basic net earnings per share | $ | $ | $ | ||||||||
Diluted net earnings per share | $ | $ | $ | ||||||||
Certain options to purchase shares of common stock were outstanding and not included in the calculation of diluted net earnings per share because their inclusion would have been antidilutive. On a weighted average basis, for fiscal 2020, fiscal 2019 and fiscal 2018, options to purchase 1,355,679 shares, 4,009,566 shares and 2,993,200 shares of common stock, respectively, were not included.
75
14. | ACCUMULATED OTHER COMPREHENSIVE LOSS |
Changes in Accumulated Other Comprehensive Loss By Component
Total | |||||||||||
Net | Net | Accumulated | |||||||||
Unrecognized | Unrecognized | Other | |||||||||
Actuarial | Hedge Gains | Comprehensive | |||||||||
(In thousands, net of income taxes) | Losses | (Losses) | Loss | ||||||||
Balance as of February 28, 2017 | $ | ( | ) | $ | ( | ) | $ | ( | ) | ||
Other comprehensive (loss) income before reclassifications | ( | ) | |||||||||
Amounts reclassified from accumulated other | |||||||||||
comprehensive loss | |||||||||||
Other comprehensive (loss) income | ( | ) | |||||||||
Amounts transferred from accumulated other | |||||||||||
comprehensive loss to retained earnings (1) | ( | ) | ( | ) | |||||||
Balance as of February 28, 2018 | ( | ) | ( | ) | |||||||
Other comprehensive loss before reclassifications | ( | ) | ( | ) | ( | ) | |||||
Amounts reclassified from accumulated other | |||||||||||
comprehensive loss | ( | ) | ( | ) | |||||||
Other comprehensive loss | ( | ) | ( | ) | ( | ) | |||||
Balance as of February 28, 2019 | ( | ) | ( | ) | |||||||
Other comprehensive loss before reclassifications | ( | ) | ( | ) | ( | ) | |||||
Amounts reclassified from accumulated other | |||||||||||
comprehensive loss | |||||||||||
Other comprehensive loss | ( | ) | ( | ) | ( | ) | |||||
Balance as of February 29, 2020 | $ | ( | ) | $ | ( | ) | $ | ( | ) | ||
(1) | Reclassification due to the adoption of ASU 2018-02 in fiscal 2018. |
76
Changes In and Reclassifications Out of Accumulated Other Comprehensive Loss
Years Ended February 29 or 28 | |||||||||||
(In thousands) | 2020 | 2019 | 2018 | ||||||||
Retirement Benefit Plans (Note 10): | |||||||||||
Actuarial loss arising during the year | $ | ( | ) | $ | ( | ) | $ | ( | ) | ||
Tax benefit | |||||||||||
Actuarial loss arising during the year, net of tax | ( | ) | ( | ) | ( | ) | |||||
Actuarial loss amortization reclassifications recognized in net pension expense: | |||||||||||
Cost of sales | |||||||||||
CarMax Auto Finance income | |||||||||||
Selling, general and administrative expenses | |||||||||||
Total amortization reclassifications recognized in net pension expense | |||||||||||
Tax expense | ( | ) | ( | ) | ( | ) | |||||
Amortization reclassifications recognized in net | |||||||||||
pension expense, net of tax | |||||||||||
Net change in retirement benefit plan unrecognized | |||||||||||
actuarial losses, net of tax | ( | ) | ( | ) | ( | ) | |||||
Cash Flow Hedges (Note 5): | |||||||||||
Changes in fair value | ( | ) | ( | ) | |||||||
Tax benefit (loss) | ( | ) | |||||||||
Changes in fair value, net of tax | ( | ) | ( | ) | |||||||
Reclassifications to CarMax Auto Finance income | ( | ) | |||||||||
Tax (expense) benefit | ( | ) | ( | ) | |||||||
Reclassification of hedge losses (gains), net of tax | ( | ) | |||||||||
Net change in cash flow hedge unrecognized losses, net of tax | ( | ) | ( | ) | |||||||
Total other comprehensive (loss) income, net of tax | $ | ( | ) | $ | ( | ) | $ | ||||
Changes in the funded status of our retirement plans and changes in the fair value of derivatives that are designated and qualify as cash flow hedges are recognized in accumulated other comprehensive loss. The cumulative balances are net of deferred taxes of $48.8 million as of February 29, 2020 and $21.4 million as of February 28, 2019.
15. | LEASE COMMITMENTS |
Our leases primarily consist of operating and finance leases related to retail stores, office space, land and equipment. We also have stores subject to sale-leaseback transactions that did not qualify for sale accounting and are accounted for as financing obligations. For more information on these financing obligations see Note 11.
The initial term for real property leases is typically 5 to 20 years. For equipment leases, the initial term generally ranges from 3 to 8 years. Most leases include one or more options to renew, with renewal terms that can extend the lease term from 1 to 20 years or more. We include options to renew (or terminate) in our lease term, and as part of our right-of-use ("ROU") assets and lease liabilities, when it is reasonably certain that we will exercise that option.
ROU assets and the related lease liabilities are initially measured at the present value of future lease payments over the lease term. As most of our leases do not provide an implicit rate, we use our collateralized incremental borrowing rate based on the information available at the commencement date in determining the present value of future payments. We include variable lease payments in the initial measurement of ROU assets and lease liabilities only to the extent they depend on an index or rate. Changes in such indices or rates are accounted for in the period the change occurs, and do not result in the remeasurement of the ROU asset or liability. We are also responsible for payment of certain real estate taxes, insurance and other expenses on our leases. These amounts are generally considered to be variable and are not included in the measurement of the ROU asset and lease liability. We generally account for non-lease components, such as maintenance, separately from lease components. For certain equipment leases, we apply a portfolio approach to account for the lease assets and liabilities.
77
Our lease agreements do not contain any material residual value guarantees or material restricted covenants. Leases with a term of 12 months or less are not recorded on the balance sheet; we recognize lease expense for these leases on a straight-line basis over the lease term.
The components of lease expense were as follows:
(In thousands) | Year Ended February 29, 2020 | ||
Operating lease cost (1) | $ | ||
Finance lease cost: | |||
Depreciation of lease assets | |||
Interest on lease liabilities | |||
Total finance lease cost | |||
Total lease cost | $ | ||
(1) Includes short-term leases and variable lease costs, which are immaterial.
Supplemental balance sheet information related to leases was as follows:
(In thousands) | Classification | As of February 29, 2020 | ||
Assets: | ||||
Operating lease assets | Operating lease assets | $ | ||
Finance lease assets | Property and equipment, net (1) | |||
Total lease assets | $ | |||
Liabilities: | ||||
Current: | ||||
Operating leases | Current portion of operating lease liabilities | $ | ||
Finance leases | Accrued expenses and other current liabilities | |||
Long-term: | ||||
Operating leases | Operating lease liabilities, excluding current portion | |||
Finance leases | Other liabilities | |||
Total lease liabilities | $ | |||
(1) Finance lease assets are recorded net of accumulated depreciation of $9.1 million as of February 29, 2020 .
Lease term and discount rate information related to leases was as follows:
Lease Term and Discount Rate | As of February 29, 2020 | |
Weighted Average Remaining Lease Term (in years) | ||
Operating leases | ||
Finance leases | ||
Weighted Average Discount Rate | ||
Operating leases | % | |
Finance leases | % | |
78
Supplemental cash flow information related to leases was as follows:
(In thousands) | Year Ended February 29, 2020 | ||
Cash paid for amounts included in the measurement of lease liabilities: | |||
Operating cash flows from operating leases | $ | ||
Operating cash flows from finance leases | $ | ||
Financing cash flows from finance leases | $ | ||
Lease assets obtained in exchange for lease obligations: | |||
Operating leases | $ | ||
Finance leases | $ | ||
Maturities of lease liabilities were as follows:
As of February 29, 2020 | |||||||
(In thousands) | Operating Leases (1) | Finance Leases (1) | |||||
Fiscal 2021 | $ | $ | |||||
Fiscal 2022 | |||||||
Fiscal 2023 | |||||||
Fiscal 2024 | |||||||
Fiscal 2025 | |||||||
Thereafter | |||||||
Total lease payments | |||||||
Less: interest | ( | ) | ( | ) | |||
Present value of lease liabilities | $ | $ | |||||
(1) Lease payments exclude $36.9 million of legally binding minimum lease payments for leases signed but not yet commenced.
As previously disclosed in our 2019 Annual Report and under the previous lease accounting standard, future minimum lease obligations were as follows:
As of February 28, 2019 | |||||||
Capital | Operating Lease | ||||||
(In thousands) | Leases (1) | Commitments (1) | |||||
Fiscal 2020 | $ | $ | |||||
Fiscal 2021 | |||||||
Fiscal 2022 | |||||||
Fiscal 2023 | |||||||
Fiscal 2024 | |||||||
Fiscal 2025 and thereafter | |||||||
Total minimum lease payments | $ | ||||||
Less amounts representing interest | ( | ) | |||||
Present value of net minimum lease payments | $ | ||||||
(1) Excludes taxes, insurance and other costs payable directly by us. These costs vary from year to year and are incurred in the ordinary course of business.
As previously disclosed in our 2019 Annual Report and under the previous lease accounting standard, rent expense for all operating leases was $56.9 million in fiscal 2019 and $52.4 million in fiscal 2018.
79
16. | SUPPLEMENTAL CASH FLOW INFORMATION |
Supplemental disclosures of cash flow information:
Years Ended February 29 or 28 | |||||||||||
(In thousands) | 2020 | 2019 | 2018 | ||||||||
Cash paid for interest | $ | $ | $ | ||||||||
Cash paid for income taxes | $ | $ | $ | ||||||||
Non-cash investing and financing activities: | |||||||||||
Increase (decrease) in accrued capital expenditures | $ | $ | ( | ) | $ | ||||||
Increase in financing obligations | $ | $ | $ | ||||||||
See Note 15 for supplemental cash flow information related to leases.
17. | COMMITMENTS AND CONTINGENCIES |
(A) | Litigation |
CarMax entities are defendants in four proceedings asserting wage and hour claims with respect to CarMax sales consultants and non-exempt employees in California. The asserted claims include failure to pay minimum wage, provide meal periods and rest breaks, pay statutory/contractual wages, reimburse for work-related expenses and provide accurate itemized wage statements; unfair competition; and Private Attorney General Act claims. On September 4, 2015, Craig Weiss et al., v. CarMax Auto Superstores California, LLC, and CarMax Auto Superstores West Coast, Inc., a putative class action, was filed in the Superior Court of California, County of Placer. The Weiss lawsuit seeks civil penalties, fines, cost of suit, and the recovery of attorneys’ fees. On June 29, 2016, Ryan Gomez et al. v. CarMax Auto Superstores California, LLC, and CarMax Auto Superstores West Coast, Inc., a putative class action, was filed in the Superior Court of the State of California, Los Angeles. The Gomez lawsuit seeks declaratory relief, unspecified damages, restitution, statutory penalties, interest, cost and attorneys’ fees. On October 31, 2017, Joshua Sabanovich v. CarMax Superstores California, LLC et. al., a putative class action, was filed in the Superior Court of California, County of Stanislaus. The Sabanovich lawsuit seeks unspecified damages, restitution, statutory penalties, interest, cost and attorneys’ fees. On November 21, 2018, Derek McElhannon et al v. CarMax Auto Superstores California, LLC and CarMax Auto Superstores West Coast, Inc., a putative class action, was filed in Superior Court of California, County of Alameda. On February 1, 2019, the McElhannon lawsuit was removed to the U.S. District Court, Northern District of California, San Francisco Division. The lawsuit was remanded back to the Superior Court of California, County of Alameda on June 4, 2019. The McElhannon lawsuit seeks unspecified damages, restitution, statutory and/or civil penalties, interest, cost and attorneys’ fees.
CarMax has reached a memorandum of understanding and expects to finalize a global agreement settling the Weiss, Gomez and McElhannon lawsuits on a class basis. Once final, the settlement agreement will be submitted for approval to the Superior Court of California, County of Placer as part of the Weiss lawsuit. In anticipation of the consolidation of claims under the global settlement agreement, on March 11, 2020, the Gomez and McElhannon lawsuits were dismissed as the claims of the plaintiffs will be addressed in the global settlement. The monetary settlement under this agreement is for an immaterial amount that has been fully accrued.
The Sabanovich lawsuit is not included in the global settlement agreement. Based upon our evaluation of information currently available, we believe that the ultimate resolution of the foregoing proceedings will not have a material adverse effect, either individually or in the aggregate, on our financial condition, results of operations or cash flows.
As previously reported, the company has cooperated with representatives from multiple California municipality district attorney offices in an inquiry by those offices into the handling, storage and disposal of certain types of hazardous waste at our store locations in those municipalities. CarMax and the district attorney offices have reached a settlement agreement, filed a Stipulation for Entry of Final Judgement and Permanent Injunction with the Superior Court of California, County of Orange on February 27, 2020, and await final entry of the settlement by the court. The settlement includes an immaterial monetary payment covering penalties, costs, and supplemental environmental projects as well as certain injunctive relief.
We are involved in various other legal proceedings in the normal course of business. Based upon our evaluation of information currently available, we believe that the ultimate resolution of any such proceedings will not have a material adverse effect, either individually or in the aggregate, on our financial condition, results of operations or cash flows.
Gain Contingency. The company is a class member in a consolidated and settled class action lawsuit (In re: Takata Airbag Product Liability Litigation (U.S. District Court, Southern District of Florida)) against Toyota, Mazda, Subaru, BMW, Honda, Nissan and Ford related to the economic loss associated with defective Takata airbags installed as original equipment in certain model vehicles from model years 2000-2018. On April 10, 2020, we were informed that CarMax will receive $40.3 million in net recoveries
80
from the Toyota, Mazda, Subaru, BMW, Honda and Nissan settlement funds. On April 15, 2020, we received that amount in settlement of this matter and recorded the gain at the time of receipt. CarMax remains a class member for the Ford settlement fund. We are unable to make a reasonable estimate of the amount or range of gain that could result from CarMax’s participation in the Ford settlement fund.
(B) | Other Matters |
In accordance with the terms of real estate lease agreements, we generally agree to indemnify the lessor from certain liabilities arising as a result of the use of the leased premises, including environmental liabilities and repairs to leased property upon termination of the lease. Additionally, in accordance with the terms of agreements entered into for the sale of properties, we generally agree to indemnify the buyer from certain liabilities and costs arising subsequent to the date of the sale, including environmental liabilities and liabilities resulting from the breach of representations or warranties made in accordance with the agreements. We do not have any known material environmental commitments, contingencies or other indemnification issues arising from these arrangements.
As part of our customer service strategy, we guarantee the used vehicles we sell at retail with a 90-day/4,000-mile limited warranty. A vehicle in need of repair within this period will be repaired free of charge. As a result, each vehicle sold has an implied liability associated with it. Accordingly, based on historical trends, we record a provision for estimated future repairs during the guarantee period for each vehicle sold. The liability for this guarantee was $10.5 million as of February 29, 2020 and $7.4 million as of February 28, 2019, and is included in accrued expenses and other current liabilities.
At various times we may have certain purchase obligations that are enforceable and legally binding primarily related to real estate purchases, advertising and third-party outsourcing services. As of February 29, 2020, we have material purchase obligations of $197.5 million, of which $65.3 million are expected to be fulfilled in fiscal 2021.
18. | SELECTED QUARTERLY FINANCIAL DATA (UNAUDITED) |
1st Quarter | 2nd Quarter | 3rd Quarter | 4th Quarter | Fiscal Year | |||||||||||||||
(In thousands, except per share data) | 2020 | 2020 | 2020 | 2020 | 2020 | ||||||||||||||
Net sales and operating revenues | $ | $ | $ | $ | $ | ||||||||||||||
Gross profit | $ | $ | $ | $ | $ | ||||||||||||||
CarMax Auto Finance income | $ | $ | $ | $ | $ | ||||||||||||||
Selling, general and administrative | |||||||||||||||||||
expenses | $ | $ | $ | $ | $ | ||||||||||||||
Net earnings | $ | $ | $ | $ | $ | ||||||||||||||
Net earnings per share: | |||||||||||||||||||
Basic | $ | $ | $ | $ | $ | ||||||||||||||
Diluted | $ | $ | $ | $ | $ | ||||||||||||||
1st Quarter | 2nd Quarter | 3rd Quarter | 4th Quarter | Fiscal Year | |||||||||||||||
(In thousands, except per share data) | 2019 | 2019 | 2019 | 2019 | 2019 | ||||||||||||||
Net sales and operating revenues | $ | $ | $ | $ | $ | ||||||||||||||
Gross profit | $ | $ | $ | $ | $ | ||||||||||||||
CarMax Auto Finance income | $ | $ | $ | $ | $ | ||||||||||||||
Selling, general and administrative | |||||||||||||||||||
expenses | $ | $ | $ | $ | $ | ||||||||||||||
Net earnings | $ | $ | $ | $ | $ | ||||||||||||||
Net earnings per share: | |||||||||||||||||||
Basic | $ | $ | $ | $ | $ | ||||||||||||||
Diluted | $ | $ | $ | $ | $ | ||||||||||||||
19. | SUBSEQUENT EVENTS |
On March 11, 2020, the World Health Organization declared the outbreak of COVID-19 a global pandemic and recommended containment and mitigation measures worldwide. In the following weeks, several U.S. states and localities issued lockdown orders impacting the operations of our stores and consumer demand. Since then, the COVID-19 situation within the U.S. has rapidly
81
escalated and approximately half of our stores have been closed or have run under limited operations. Based upon the fluidity of the current environment, we expect that stores will continue to re-open or close in accordance with government mandates or public health concerns. Consumer demand has deteriorated and sales have dropped significantly; most of our stores that remain open are selling 50% or less of what they sold last year, a trend that continued into April 2020. While we cannot reasonably estimate the duration or severity of this pandemic, we expect it to have a material impact on the company’s business, results of operations, financial position and liquidity.
During March 2020, we made net borrowings of approximately $675 million under our revolving credit facility to further bolster our liquidity position and provide additional financial flexibility in light of the uncertainty surrounding COVID-19. As of the date of this filing, more than $300 million in unused borrowing capacity remained. In addition, we halted our stock repurchase program, although the repurchase authorization remains effective. We have also decided to temporarily pause our store expansion strategy and our remodels until the COVID-19 situation stabilizes.
82
Item 9. Changes in and Disagreements with Accountants on Accounting and Financial Disclosure.
None.
Item 9A. Controls and Procedures.
Evaluation of Disclosure Controls and Procedures
We maintain disclosure controls and procedures (“disclosure controls”) that are designed to ensure that information required to be disclosed in our reports filed under the Exchange Act is recorded, processed, summarized and reported within the time periods specified in the SEC’s rules and forms. Disclosure controls are also designed to ensure that this information is accumulated and communicated to management, including the chief executive officer (“CEO”) and the chief financial officer (“CFO”), as appropriate, to allow timely decisions regarding required disclosure.
As of the end of the period covered by this report, we evaluated the effectiveness of the design and operation of our disclosure controls. This evaluation was performed under the supervision and with the participation of management, including the CEO and CFO. Based upon that evaluation, the CEO and CFO concluded that our disclosure controls were effective as of the end of the period.
Changes in Internal Control over Financial Reporting
There was no change in our internal control over financial reporting that occurred during the quarter ended February 29, 2020 that has materially affected, or is reasonably likely to materially affect, our internal control over financial reporting.
Management’s Report on Internal Control over Financial Reporting
Management’s annual report on internal control over financial reporting is included in Item 8. Consolidated Financial Statements and Supplementary Data, of this Form 10-K and is incorporated herein by reference.
Item 9B. Other Information.
None.
PART III
With the exception of the information incorporated by reference from our 2020 Proxy Statement in Items 10, 11, 12, 13 and 14 of Part III of this Annual Report on Form 10-K, our 2020 Proxy Statement is not to be deemed filed as a part of this Form 10-K.
Item 10. Directors, Executive Officers and Corporate Governance.
The information concerning our executive officers required by this Item is incorporated by reference to the section titled “Executive Officers of the Company” included in Part I of this Annual Report on Form 10-K.
The information concerning our directors required by this Item is incorporated by reference to the section titled “Proposal One: Election of Directors” in our 2020 Proxy Statement.
The information concerning the audit committee of our board of directors and the audit committee financial expert required by this Item is incorporated by reference to the information included in the sub-section titled “Corporate Governance – Board Committees” in our 2020 Proxy Statement.
The information concerning compliance with Section 16(a) of the Exchange Act required by this Item is incorporated by reference to the sub-section titled “CarMax Share Ownership – Delinquent Section 16(a) Reports” in our 2020 Proxy Statement.
The information concerning our code of ethics (“Code of Business Conduct”) for senior management required by this Item is incorporated by reference to the sub-section titled “Corporate Governance – Overview” in our 2020 Proxy Statement.
83
Item 11. Executive Compensation.
The information required by this Item is incorporated by reference to the sections titled “Compensation Discussion and Analysis,” “Compensation and Personnel Committee Report” and “Compensation Tables” in our 2020 Proxy Statement. Additional information required by this Item is incorporated by reference to the section titled “Director Compensation” in our 2020 Proxy Statement.
Item 12. Security Ownership of Certain Beneficial Owners and Management and Related Stockholder Matters.
The information required by this Item concerning equity compensation plans is incorporated by reference to the subsection titled “Proposal Four: Approval of the Amended and Restated CarMax, Inc. 2002 Stock Incentive Plan - Equity Compensation Plan Information” in our 2019 Proxy Statement.
The information required by this Item concerning security ownership of certain beneficial owners and management is incorporated by reference to the section titled “CarMax Share Ownership” in our 2020 Proxy Statement.
Item 13. Certain Relationships and Related Transactions and Director Independence.
The information required by this Item is incorporated by reference to the sub-section titled “Corporate Governance – Related Person Transactions” in our 2020 Proxy Statement.
The information required by this Item concerning director independence is incorporated by reference to the sub‑section titled “Corporate Governance – Independence” in our 2020 Proxy Statement.
Item 14. Principal Accountant Fees and Services.
The information required by this Item is incorporated by reference to the section titled “Auditor Fees and Pre-Approval Policy” in our 2020 Proxy Statement.
PART IV
Item 15. Exhibits and Financial Statement Schedules.
The following documents are filed as part of this report:
1. | Financial Statements. All financial statements as set forth under Item 8 of this Form 10-K. |
2. | Financial Statement Schedules. Schedules have been omitted because they are not applicable, are not required or the information required to be set forth therein is included in the Consolidated Financial Statements and Notes thereto. |
3. | Exhibits: |
CarMax, Inc. Amended and Restated Articles of Incorporation, effective June 24, 2013, filed as Exhibit 3.1 to CarMax’s Current Report on Form 8-K, filed June 28, 2013 (File No. 1-31420), is incorporated by this reference. | ||
CarMax, Inc. Bylaws, as amended and restated January 28, 2020, filed as Exhibit 3.1 to CarMax’s Current Report on Form 8-K, filed February 3, 2020 (File No. 1-31420), is incorporated by this reference. | ||
Description of Securities Registered Pursuant to Section 12 of the Securities Exchange Act of 1934, filed herewith. | ||
CarMax, Inc. Severance Agreement for Executive Officer, dated September 1, 2016, between CarMax, Inc. and William D. Nash, filed as Exhibit 10.1 to CarMax’s Current Report on Form 8-K, filed September 1, 2016 (File No. 1-31420) is incorporated by this reference. * | ||
CarMax, Inc. Severance Agreement for Executive Officer, dated January 6, 2015, between CarMax, Inc. and Thomas J. Folliard, filed as Exhibit 10.2 to CarMax’s Quarterly Report on Form 10-Q, filed January 8, 2015 (File No. 1-31420) is incorporated by this reference. * | ||
84
CarMax, Inc. Amendment to Severance Agreement for Executive Officer, dated August 31, 2016, between CarMax, Inc. and Thomas J. Folliard, filed as Exhibit 10.2 to CarMax’s Current Report on Form 8-K, filed September 1, 2016 (File No. 1-31420) is incorporated by this reference. * | ||
CarMax, Inc. Severance Agreement for Executive Officer, dated January 3, 2017, between CarMax, Inc. and Thomas W. Reedy, filed as Exhibit 10.2 to CarMax’s Quarterly Report on Form 10-Q, filed January 6, 2017 (File No. 1-31420) is incorporated by this reference. * | ||
CarMax, Inc. Severance Agreement for Executive Officer, dated January 3, 2017, between CarMax, Inc. and William C. Wood, Jr., filed as Exhibit 10.3 to CarMax’s Quarterly Report on Form 10-Q, filed January 6, 2017 (File No. 1-31420) is incorporated by this reference. * | ||
CarMax, Inc. Severance Agreement for Executive Officer, dated January 3, 2017, between CarMax, Inc. and Edwin J. Hill, filed as Exhibit 10.4 to CarMax’s Quarterly Report on Form 10-Q, filed January 6, 2017 (File No. 1-31420) is incorporated by this reference. * | ||
CarMax, Inc. Severance Agreement for Executive Officer, dated January 6, 2015, between CarMax, Inc. and Eric M. Margolin, filed as Exhibit 10.6 to CarMax’s Quarterly Report on Form 10-Q, filed January 8, 2015 (File No. 1-31420) is incorporated by this reference. * | ||
CarMax, Inc. Benefit Restoration Plan, as amended and restated, effective June 30, 2011, filed as Exhibit 10.1 to CarMax’s Current Report on Form 8-K, filed June 30, 2011 (File No. 1-31420), is incorporated by this reference. * | ||
CarMax, Inc. Retirement Restoration Plan, as amended and restated, effective January 1, 2017, filed as Exhibit 10.6 to CarMax’s Quarterly Report on Form 10-Q, filed July 7, 2016 (File No. 1-31420), is incorporated by this reference. * | ||
CarMax, Inc. Executive Deferred Compensation Plan, as amended and restated, effective June 30, 2011, filed as Exhibit 10.3 to CarMax’s Current Report on Form 8-K, filed June 30, 2011 (File No. 1-31420), is incorporated by this reference. * | ||
CarMax, Inc. Non-Employee Directors Stock Incentive Plan, as amended and restated June 24, 2008, filed as Exhibit 10.1 to CarMax’s Quarterly Report on Form 10-Q, filed July 10, 2008 (File No. 1‑31420), is incorporated by this reference. * | ||
CarMax, Inc. 2002 Stock Incentive Plan, as amended and restated June 28, 2016, filed as Exhibit 10.1 to CarMax’s Current Report on Form 8-K, filed July 1, 2016 (File No. 1-31420), is incorporated by this reference. * | ||
CarMax, Inc. Annual Performance-Based Bonus Plan, as amended and restated June 25, 2012, filed as Exhibit 10.2 to CarMax’s Current Report on Form 8-K, filed June 29, 2012 (File No. 1-31420), is incorporated by this reference. * | ||
CarMax, Inc. 2002 Employee Stock Purchase Plan, as amended and restated January 1, 2020, filed as Exhibit 10.2 to CarMax’s Quarterly Report on Form 10-Q, filed January 7, 2020 (File No. 1-31420), is incorporated by this reference. | ||
Credit Agreement, dated August 24, 2015, among CarMax Auto Superstores, Inc., CarMax, Inc., certain subsidiaries of CarMax named therein, Bank of America, N.A., as a lender and as administrative agent, and the other lending institutions named therein, filed as Exhibit 10.1 to CarMax’s Current Report on Form 8-K, filed August 26, 2015 (File No. 1-31420), is incorporated by this reference. | ||
Amended Notice of Stock Option Grant between CarMax, Inc. and Thomas J. Folliard, dated August 31, 2016, filed as Exhibit 10.3 to CarMax’s Current Report on Form 8-K, filed September 1, 2016 (File No. 1-31420), is incorporated by reference. * | ||
Amended Notice of Stock Option Grant between CarMax, Inc. and Thomas J. Folliard, dated August 31, 2016, filed as Exhibit 10.4 to CarMax’s Current Report on Form 8-K, filed September 1, 2016 (File No. 1-31420), is incorporated by reference. * | ||
Amended Notice of Market Stock Unit Grant between CarMax, Inc. and Thomas J. Folliard, dated August 31, 2016, filed as Exhibit 10.5 to CarMax’s Current Report on Form 8-K, filed September 1, 2016 (File No. 1-31420), is incorporated by reference. * | ||
Amended Notice of Stock Option Grant between CarMax, Inc. and Thomas J. Folliard, dated August 31, 2016, filed as Exhibit 10.6 to CarMax’s Current Report on Form 8-K, filed September 1, 2016 (File No. 1-31420), is incorporated by reference. * | ||
85
Amended Notice of Performance Stock Unit Grant between CarMax, Inc. and Thomas J. Folliard, dated August 31, 2016, filed as Exhibit 10.7 to CarMax’s Current Report on Form 8-K, filed September 1, 2016 (File No. 1-31420), is incorporated by reference. * | ||
Form of Notice of Restricted Stock Grant between CarMax, Inc. and certain executive officers effective March 24, 2016, filed as Exhibit 10.1 to CarMax’s Current Report on Form 8-K, filed March 25, 2016 (File No. 1-31420), is incorporated by this reference. * | ||
Form of Notice of Cash-Settled Restricted Stock Unit Grant between CarMax Inc. and certain named and other executive officers, effective March 24, 2016, filed as Exhibit 10.2 to CarMax’s Current Report on Form 8-K, filed March 25, 2016 (File No. 1-31420), is incorporated by reference. * | ||
Form of Notice of Stock Option Grant between CarMax, Inc. and certain named and other executive officers, effective March 24, 2016, filed as Exhibit 10.3 to CarMax’s Current Report on Form 8-K, filed March 25, 2016 (File No. 1-31420), is incorporated by reference. * | ||
Form of Notice of Performance Stock Unit Grant between CarMax, Inc. and certain named and other executive officers, effective March 24, 2016, filed as Exhibit 10.4 to CarMax’s Current Report on Form 8-K, filed March 25, 2016 (File No. 1-31420), is incorporated by reference. * | ||
Form of Notice of Stock Option Grant between CarMax, Inc. and certain named and other executive officers, effective January 26, 2015, filed as Exhibit 10.1 to CarMax’s Current Report on Form 8-K, filed February 13, 2015 (File No. 1-31420), is incorporated by reference. * | ||
Form of Notice of Market Stock Unit Grant between CarMax, Inc. and certain named and other executive officers, effective January 26, 2015, filed as Exhibit 10.2 to CarMax’s Current Report on Form 8-K, filed February 13, 2015 (File No. 1-31420), is incorporated by reference. * | ||
Form of Notice of Performance Stock Unit Grant between CarMax, Inc. and certain named and other executive officers, effective January 26, 2015, filed as Exhibit 10.3 to CarMax’s Current Report on Form 8-K, filed February 13, 2015 (File No. 1-31420), is incorporated by reference. * | ||
Form of Notice of Restricted Stock Grant between CarMax, Inc. and certain non-employee directors of the CarMax, Inc. board of directors, filed as Exhibit 10.1 to CarMax’s Quarterly Report on Form 10-Q, filed October 8, 2014 (File No. 1-31420), is incorporated by this reference. * | ||
Form of Notice of Stock Option Grant between CarMax, Inc. and certain named and other executive officers, effective January 27, 2014, filed as Exhibit 10.1 to CarMax’s Current Report on Form 8-K, filed January 31, 2014 (File No. 1-31420), is incorporated by reference. * | ||
Form of Notice of Market Stock Unit Grant between CarMax, Inc. and certain named and other executive officers, effective January 27, 2014, filed as Exhibit 10.2 to CarMax’s Current Report on Form 8-K, filed January 31, 2014 (File No. 1-31420), is incorporated by reference. * | ||
Form of Notice of Stock Option Grant between CarMax, Inc. and certain named and other executive officers, effective December 21, 2011, filed as Exhibit 10.1 to CarMax’s Current Report on Form 8-K, filed December 23, 2011 (File No. 1-31420), is incorporated by reference. * | ||
Form of Notice of Market Stock Unit Grant between CarMax, Inc. and certain named and other executive officers, effective December 21, 2011, filed as Exhibit 10.2 to CarMax’s Current Report on Form 8-K, filed December 23, 2011 (File No. 1-31420), is incorporated by reference. * | ||
Form of Notice of Restricted Stock Unit Grant between CarMax Inc. and certain named and other executive officers, effective December 21, 2011, filed as Exhibit 10.3 to CarMax’s Current Report on Form 8-K, filed December 23, 2011 (File No. 1-31420), is incorporated by reference. * | ||
Form of Notice of Stock Option Grant between CarMax, Inc. and certain named and other executive officers, effective October 18, 2010, filed as Exhibit 10.1 to CarMax’s Current Report on Form 8-K, filed October 22, 2010 (File No. 1-31420), is incorporated by this reference. * | ||
Form of Notice of Market Stock Unit Grant between CarMax, Inc. and certain named and other executive officers, effective October 18, 2010, filed as Exhibit 10.2 to CarMax’s Current Report on Form 8-K, filed October 22, 2010 (File No. 1-31420), is incorporated by this reference. * | ||
Form of Notice of Stock Option Grant between CarMax, Inc. and certain named and other executive officers, effective January 1, 2009, filed as Exhibit 10.1 to CarMax’s Quarterly Report on Form 10-Q, filed January 8, 2009 (File No. 1-31420), is incorporated by this reference. * | ||
Form of Directors Stock Option Grant Agreement between CarMax, Inc. and certain non-employee directors of the CarMax, Inc. board of directors, filed as Exhibit 10.3 to CarMax’s Quarterly Report on Form 10-Q, filed July 10, 2008 (File No. 1-31420), is incorporated by this reference. * | ||
86
Form of Notice of Stock Option Grant between CarMax, Inc. and certain named and other executive officers, filed as Exhibit 10.18 to CarMax’s Annual Report on Form 10-K, filed April 25, 2008 (File No. 1-31420), is incorporated by this reference. * | ||
Form of Notice of Stock Option Grant between CarMax, Inc. and certain named and other executive officers, filed as Exhibit 10.2 to CarMax’s Current Report on Form 8-K, filed October 20, 2006 (File No. 1-31420), is incorporated by this reference. * | ||
Form of Directors Stock Option Grant Agreement between CarMax, Inc. and certain non-employee directors of the CarMax, Inc. board of directors, filed as Exhibit 10.5 to CarMax’s Current Report on Form 8-K, filed April 28, 2006 (File No. 1-31420), is incorporated by this reference. * | ||
Form of Incentive Award Agreement between CarMax, Inc. and certain named executive officers, filed as Exhibit 10.16 to CarMax’s Annual Report on Form 10-K, filed May 13, 2005 (File No. 1-31420), is incorporated by this reference. * | ||
Form of Incentive Award Agreement between CarMax, Inc. and certain executive officers, filed as Exhibit 10.17 to CarMax’s Annual Report on Form 10-K, filed May 13, 2005 (File No. 1-31420), is incorporated by this reference. * | ||
Form of Incentive Award Agreement between CarMax, Inc. and certain non-employee directors of the CarMax, Inc. board of directors, filed as Exhibit 10.18 to CarMax’s Annual Report on Form 10-K, filed May 13, 2005 (File No. 1-31420), is incorporated by this reference. * | ||
Form of Amendment to Incentive Award Agreement between CarMax, Inc. and certain non-employee directors of the CarMax, Inc. board of directors, filed as Exhibit 10.19 to CarMax’s Annual Report on Form 10-K, filed May 13, 2005 (File No. 1-31420), is incorporated by this reference. * | ||
Form of Stock Grant Notice Letter from CarMax, Inc. to certain non-employee directors of the CarMax, Inc. board of directors, filed as Exhibit 10.20 to CarMax’s Annual Report on Form 10-K, filed May 13, 2005 (File No. 1-31420), is incorporated by this reference. * | ||
CarMax, Inc. Annual Performance-Based Bonus Plan, dated April 24, 2018, filed as Exhibit 10.46 to CarMax’s Annual Report on Form 10-K, filed April 24, 2018 (File No. 1-31420), is incorporated by this reference. * | ||
Form of Notice of Restricted Stock Unit Grant between CarMax, Inc. and certain non-employee directors of the CarMax, Inc. board of directors, filed as Exhibit 10.47 to CarMax’s Annual Report on Form 10-K filed April 24, 2018 (File No. 1-31420), is incorporated by this reference. * | ||
Form of Notice of Restricted Stock Unit Grant between CarMax, Inc. and certain non-employee directors of the CarMax, Inc. board of directors, filed as Exhibit 10.1 to CarMax’s Quarterly Report on Form 10-Q filed January 8, 2019 (File No. 1-31420), is incorporated by this reference. * | ||
Consulting Agreement, dated June 27, 2018, between CarMax, Inc. and William C. Wood Jr., filed as Exhibit 10.1 to CarMax’s Current Report on Form 8-K, filed June 29, 2018 (File No. 1-31420), is incorporated by this reference.* | ||
Form of Notice of Performance Stock Unit Grant between CarMax, Inc. and certain named and other executive officers, filed as Exhibit 10.50 to CarMax’s Annual Report on Form 10-K filed April 19, 2019 (File No. 1-31420), is incorporated by this reference. * | ||
CarMax, Inc. Severance Agreement for Executive Officer, dated April 23, 2017, between CarMax, Inc. and James Lyski, filed as Exhibit 10.51 to CarMax’s Annual Report on Form 10-K filed April 19, 2019 (File No. 1-31420), is incorporated by this reference. * | ||
CarMax, Inc. Severance Agreement, effective October 25, 2019, between CarMax, Inc. and Enrique N. Mayor-Mora, filed as Exhibit 10.1 to CarMax’s Current Report on Form 8-K, filed October 24, 2019 (File No. 1-31420), is incorporated by this reference. * | ||
CarMax, Inc. 2002 Stock Incentive Plan, as amended and restated June 25, 2019, filed as Exhibit 10.1 to CarMax's Current Report on Form 8-K, filed June 26, 2019 (File No. 1-31420), is incorporated by this reference. * | ||
Credit Agreement, dated as of June 7, 2019, among CarMax Auto Superstores, Inc., CarMax, Inc., certain subsidiaries of CarMax named therein, Bank of America, N.A., as a lender and as administrative agent, and the other lending institutions named therein, filed as Exhibit 10.1 to CarMax's Current Report on Form 8-K, filed June 11, 2019 (File No. 1-31420), is incorporated by this reference. | ||
Form of Notice of Market Stock Unit Grant between CarMax, Inc. and certain named and other executive officers, effective March 27, 2020, filed herewith. * | ||
87
Form of Notice of Cash-Settled Restricted Stock Unit Grant between CarMax Inc. and certain named and other executive officers, effective March 27, 2020, filed herewith. * | ||
CarMax, Inc. Subsidiaries, filed herewith. | ||
Consent of KPMG LLP, filed herewith. | ||
Powers of Attorney, filed herewith. | ||
Certification of the Chief Executive Officer Pursuant to Rule 13a-14(a), filed herewith. | ||
Certification of the Chief Financial Officer Pursuant to Rule 13a-14(a), filed herewith | ||
Certification of the Chief Executive Officer Pursuant to 18 U.S.C. Section 1350, filed herewith. | ||
Certification of the Chief Financial Officer Pursuant to 18 U.S.C. Section 1350, filed herewith. | ||
101.INS | XBRL Instance Document. | |
101.SCH | XBRL Taxonomy Extension Schema Document. | |
101.SCH | XBRL Taxonomy Extension Schema Document. | |
101.DEF | XBRL Taxonomy Extension Definition Linkbase Document. | |
101.LAB | XBRL Taxonomy Extension Label Linkbase Document. | |
101.PRE | XBRL Taxonomy Extension Presentation Linkbase Document. | |
104 | Cover Page Interactive File. | |
* Indicates management contract, compensatory plan or arrangement of the company required to be filed as an exhibit.
Certain instruments defining rights of holders of long-term debt of the company are omitted pursuant to Item 601(b)(4)(iii) of Regulation S-K. Upon request, the company agrees to furnish to the SEC copies of such instruments.
Item 16. Form 10-K Summary.
None.
88
Signatures
Pursuant to the requirements of Section 13 or 15(d) of the Securities Exchange Act of 1934, the registrant has duly caused this report to be signed on its behalf by the undersigned, thereunto duly authorized.
CarMax, Inc.
By: | /s/ WILLIAM D. NASH | By: | /s/ ENRIQUE N. MAYOR-MORA | |
William D. Nash | Enrique N. Mayor-Mora | |||
President and Chief Executive Officer | Senior Vice President and Chief Financial Officer | |||
April 21, 2020 | April 21, 2020 | |||
Pursuant to the requirements of the Securities Exchange Act of 1934, this report has been signed by the following persons on behalf of the registrant and in the capacities and on the dates indicated:
/s/ WILLIAM D. NASH | /s/ SHIRA GOODMAN * | |
William D. Nash | Shira Goodman | |
President, Chief Executive Officer and Director | Director | |
April 21, 2020 | April 21, 2020 | |
/s/ ENRIQUE N. MAYOR-MORA | /s/ ROBERT J. HOMBACH * | |
Enrique N. Mayor-Mora | Robert J. Hombach | |
Senior Vice President and Chief Financial Officer | Director | |
April 21, 2020 | April 21, 2020 | |
/s/ JILL A. LIVESAY | /s/ DAVID W. MCCREIGHT * | |
Jill A. Livesay | David W. McCreight | |
Vice President and Chief Accounting Officer | Director | |
April 21, 2020 | April 21, 2020 | |
/s/ PETER J. BENSEN * | /s/ MARK F. O’NEIL * | |
Peter J. Bensen | Mark F. O’Neil | |
Director | Director | |
April 21, 2020 | April 21, 2020 | |
/s/ RONALD E. BLAYLOCK * | /s/ PIETRO SATRIANO * | |
Ronald E. Blaylock | Pietro Satriano | |
Director | Director | |
April 21, 2020 | April 21, 2020 | |
/s/ SONA CHAWLA * | /s/ MARCELLA SHINDER * | |
Sona Chawla | Marcella Shinder | |
Director | Director | |
April 21, 2020 | April 21, 2020 | |
/s/ THOMAS J. FOLLIARD * | /s/ MITCHELL D. STEENROD * | |
Thomas J. Folliard | Mitchell D. Steenrod | |
Director | Director | |
April 21, 2020 | April 21, 2020 | |
*By: | /s/ ENRIQUE N. MAYOR-MORA |
Enrique N. Mayor-Mora | |
Attorney-In-Fact | |
The original powers of attorney authorizing William D. Nash and Enrique N. Mayor-Mora, or either of them, to sign this annual report on behalf of certain directors and officers of the company are included as Exhibit 24.1.
89