UNITED STATES
SECURITIES AND EXCHANGE COMMISSION
Washington, D.C. 20549
Form 10-K
(Mark One) | ||
ANNUAL REPORT PURSUANT TO SECTION 13 OR 15(d) OF THE SECURITIES EXCHANGE ACT OF 1934 | ||
For the fiscal year ended | ||
OR | ||
TRANSITION REPORT PURSUANT TO SECTION 13 OR 15(d) OF THE SECURITIES EXCHANGE ACT OF 1934 | ||
For the transition period from _______________ to _______________ | ||
Commission file number 001-31446
(Exact name of registrant as specified in its charter)
(State or other jurisdiction of incorporation or organization) | (I.R.S. Employer Identification No.) | ||||
(Address of principal executive offices) | (Zip Code) | ||||
(303 ) 295-3995
(Registrant’s telephone number)
Securities registered pursuant to Section 12(b) of the Act:
Title of each class | Trading Symbol(s) | Name of each exchange on which registered | ||
Securities Registered Pursuant to Section 12(g) of the Act: None
Indicate by check mark if the registrant is a well-known seasoned issuer, as defined in Rule 405 of the Securities Act.
Indicate by check mark if the registrant is not required to file reports pursuant to Section 13 or Section 15(d) of the Act. Yes ☐ No ☒
Indicate by check mark whether the registrant (1) has filed all reports required to be filed by Section 13 or 15(d) of the Securities Exchange Act of 1934 during the preceding 12 months (or for such shorter period that the registrant was required to file such reports), and (2) has been subject to such filing requirements for the past 90 days. Yes ☒ No ☐
Indicate by check mark whether the registrant has submitted electronically every Interactive Data File required to be submitted pursuant to Rule 405 of Regulation S-T (§ 232.405 of this chapter) during the preceding 12 months (or for such shorter period that the registrant was required to submit such files). Yes ☒ No ☐
Indicate by check mark whether the registrant is a large accelerated filer, an accelerated filer, a non-accelerated filer, a smaller reporting company, or an emerging growth company. See the definitions of “large accelerated filer,” “accelerated filer,” “smaller reporting company,” and “emerging growth company” in Rule 12b-2 of the Exchange Act.
☒ | Accelerated filer | ☐ | Non-accelerated filer | ☐ | Smaller reporting company | ||
Emerging Growth Company | |||||||
If an emerging growth company, indicate by check mark if the registrant has elected not to use the extended transition period for complying with any new or revised financial accounting standards provided pursuant to Section 13(a) of the Exchange Act. ☐
Indicate by check mark whether the registrant is a shell company (as defined in Rule 12b-2 of the Act). Yes ☐ No ☒
Aggregate market value of the voting stock held by non-affiliates of Cimarex Energy Co. as of June 30, 2019 was approximately $5.92 billion.
Number of shares of Cimarex Energy Co. common stock outstanding as of January 31, 2020 was 102,135,577 .
Documents Incorporated by Reference: Portions of the Registrant’s Proxy Statement for its 2020 Annual Meeting of Stockholders are incorporated by reference into Part III of this Form 10-K.
TABLE OF CONTENTS
DESCRIPTION
Item | Page | ||
2
GLOSSARY
Bbls—Barrels (of oil or natural gas liquids)
Bcf—Billion cubic feet (of natural gas)
BOE—Barrels of oil equivalent
GAAP—Generally accepted accounting principles in the U.S.
Gross Acres or Gross Wells—The total acres or wells, as the case may be, in which a working interest is owned.
MBbls—Thousand barrels
MBOE—Thousand barrels of oil equivalent
Mcf—Thousand cubic feet
MMBbls—Million barrels
MMBtu—Million British thermal units
MMBOE—Million barrels of oil equivalent
MMcf—Million cubic feet
Net Acres or Net Wells—The sum of the fractional working interest owned in gross acres or gross wells expressed in whole numbers and fractions of whole numbers.
Net Production—Gross production multiplied by net revenue interest
NGL or NGLs—Natural gas liquids
PUD—Proved undeveloped
Tcf—Trillion cubic feet
Energy equivalent is determined using the ratio of one barrel of crude oil, condensate, or NGL to six Mcf of natural gas.
3
PART I
CAUTIONARY INFORMATION ABOUT FORWARD-LOOKING STATEMENTS
Throughout this Form 10-K, we make statements that may be deemed “forward-looking” statements within the meaning of Section 27A of the Securities Act of 1933 and Section 21E of the Securities Exchange Act of 1934. In particular, in our Management’s Discussion and Analysis of Financial Condition and Results of Operations, we provide projections of our 2020 capital expenditures. All statements, other than statements of historical facts, that address activities, events, outcomes, and other matters that Cimarex plans, expects, intends, assumes, believes, budgets, predicts, forecasts, projects, estimates, or anticipates (and other similar expressions) will, should, or may occur in the future are forward-looking statements. These forward-looking statements are based on management’s current belief, based on currently available information, as to the outcome and timing of future events. When considering forward-looking statements, you should keep in mind the risk factors and other cautionary statements in this Form 10-K. Forward-looking statements include statements with respect to, among other things:
• | Fluctuations in the price we receive for our oil, gas, and NGL production, including local market price differentials; |
• | Operating costs and other expenses; |
• | Timing and amount of future production of oil, gas, and NGLs; |
• | Reductions in the quantity of oil, gas, and NGLs sold and prices received due to decreased industrywide demand and/or curtailments in production from specific properties or areas due to mechanical, transportation, marketing, weather, or other problems; |
• | Estimates of proved reserves, exploitation potential, or exploration prospect size; |
• | Our ability to successfully integrate the business acquired from Resolute Energy Corporation (“Resolute”); |
• | Unknown liabilities related to Resolute; |
• | Our hedging activities and viability of hedge counterparties; |
• | The effectiveness of our internal control over financial reporting and our ability to remediate a material weakness in our internal control over financial reporting; |
• | Cash flow and anticipated liquidity; |
• | Amount, nature, and timing of capital expenditures; |
• | Availability of financing and access to capital markets; |
• | Administrative, legislative, and regulatory changes; |
• | Operating and capital expenditures that are either significantly higher or lower than anticipated because the actual cost of identified projects varied from original estimates and/or from the number of exploration and development opportunities being greater or fewer than currently anticipated; |
• | Exploration and development opportunities that we pursue may not result in economic, productive oil and gas properties; |
4
• | Drilling of wells; |
• | Increased financing costs due to a significant increase in interest rates; |
• | Proving up undeveloped acreage; and |
• | Full cost ceiling test impairments to the carrying values of our oil and gas properties. |
We caution you that these forward-looking statements are subject to all of the risks and uncertainties, many of which are beyond our control, incident to the exploration for and development, production, and sale of oil, gas, and NGLs.
These risks include, but are not limited to, commodity price volatility, inflation, lack of availability of goods and services, environmental risks, drilling and other operating risks, regulatory changes, the uncertainty inherent in estimating proved oil and natural gas reserves and in projecting future rates of production, production type curves, well spacing, timing of development expenditures, and other risks described herein.
Reserve engineering is a subjective process of estimating underground accumulations of oil and natural gas that cannot be measured in an exact way. The accuracy of any reserve estimate depends on the quality of available data and the interpretation of such data by our engineers. As a result, estimates made by different engineers often vary from one another. In addition, the results of drilling, testing, and production activities may justify revisions of estimates that were made previously. If significant, such revisions could change the timing of future production and development drilling. Accordingly, reserve estimates are generally different from the quantities of oil and natural gas that are ultimately recovered.
Risk factors related to our acquisition of Resolute include, among others: the risk that problems may arise in successfully integrating the businesses of the companies, which may result in the combined company not operating as effectively and efficiently as expected, the risk that the combined company may be unable to achieve synergies or other anticipated benefits of the transaction or it may take longer than expected to achieve those synergies or benefits, and other important factors, such as expenses related to integration, that could cause actual results to differ materially from those projected.
Should one or more of the risks or uncertainties described above or elsewhere in this Form 10-K cause our underlying assumptions to be incorrect, our actual results and plans could differ materially from those expressed in any forward-looking statements.
All forward-looking statements, express or implied, included in this Form 10-K and attributable to Cimarex are qualified in their entirety by this cautionary statement. This cautionary statement should also be considered in connection with any subsequent written or oral forward-looking statements that Cimarex or persons acting on its behalf may issue. Cimarex does not undertake any obligation to update any forward-looking statements to reflect events or circumstances after the date of filing this Form 10-K with the Securities and Exchange Commission, except as required by law.
5
ITEMS 1 AND 2. BUSINESS AND PROPERTIES
General
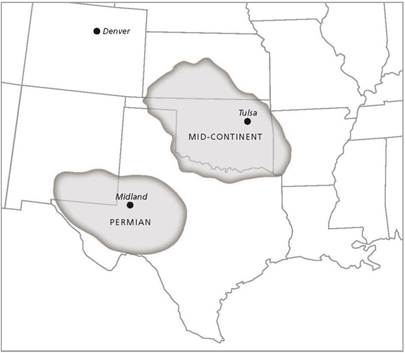
Cimarex Energy Co., a Delaware corporation formed in 2002, is an independent oil and gas exploration and production company. Our operations are located mainly in Texas, New Mexico, and Oklahoma. Currently our operations are focused in two main areas: the Permian Basin and the Mid-Continent. Our Permian Basin region encompasses west Texas and southeast New Mexico. Our Mid-Continent region consists of Oklahoma and the Texas Panhandle. On our website — www.cimarex.com — you will find our annual reports, proxy statements, and all of our Securities and Exchange Commission (“SEC”) filings, which we make available free of charge. Information contained on our website is not incorporated by reference into this Annual Report. Throughout this Form 10-K we use the terms “Cimarex,” “company,” “we,” “our,” and “us” to refer to Cimarex Energy Co. and its subsidiaries.
Our principal business objective is to increase shareholder value through the profitable long-term growth of our proved reserves and production while seeking to minimize our impact on the communities in which we operate for the long-term. Our strategy centers on maximizing cash flow from producing properties so that we can reinvest in exploration and development opportunities and provide cash returns to shareholders through dividends. We consider merger and acquisition opportunities that enhance our competitive position and we occasionally divest non-strategic assets. Key elements to our approach include:
• | Maintaining a strong financial position; |
• | Investing in a diversified portfolio of drilling opportunities; |
• | Evaluating projects based on rate-of-return and rank investment decisions; |
• | Tracking predicted versus actual results in a centralized exploration management system to provide feedback to improve results; |
• | Attracting quality employees and maintaining integrated teams of geoscientists, landmen, and engineers; and |
• | Maximizing profitability. |
Conservative use of leverage has long been the key to our financial strategy. We believe that low leverage coupled with strong full-cycle returns enables us to better withstand volatility in commodity prices and provide competitive returns and growth to shareholders. See Item 5 Market for Registrant’s Common Equity, Related Stockholder Matters and Issuer Purchases of Equity Securities — Stock Performance Graph and Item 6 Selected Financial Data for additional financial and operating information for fiscal years 2015 - 2019.
6
Proved Oil and Gas Reserves
Our December 31, 2019 total proved reserves grew 5% from prior year-end. Proved undeveloped reserves as a percentage of total proved reserves decreased to 14% from 15% a year ago. We added 119.3 MMBOE of new reserves through extensions and discoveries. Net negative revisions totaled 50.7 MMBOE, which consisted primarily of 47.2 MMBOE in downward price revisions. The change in our proved reserves is as follows:
Proved Reserves (MBOE) | ||
Reserves at December 31, 2018 | 591,195 | |
Revisions of previous estimates | (50,661 | ) |
Extensions and discoveries | 119,261 | |
Purchases of reserves | 63,019 | |
Production | (101,645 | ) |
Sales of reserves | (1,574 | ) |
Reserves at December 31, 2019 | 619,595 | |
A breakdown by commodity of our proved oil and gas reserves follows:
December 31, | ||||||||
2019 | 2018 | 2017 | ||||||
Proved reserves: | ||||||||
Gas (MMcf) | 1,532,145 | 1,591,321 | 1,607,635 | |||||
Oil (MBbls) | 169,770 | 146,538 | 137,238 | |||||
NGL (MBbls) | 194,468 | 179,436 | 153,860 | |||||
Total (MBOE) | 619,595 | 591,195 | 559,037 | |||||
Percent developed | 86 | % | 85 | % | 83 | % | ||
The following table summarizes our estimated proved oil and gas reserves by region as of December 31, 2019.
Gas (MMcf) | Oil (MBbls) | NGL (MBbls) | Total (MBOE) | % of Total Proved Reserves | ||||||||||
Mid-Continent | 660,161 | 21,848 | 64,377 | 196,252 | 32 | % | ||||||||
Permian Basin | 870,208 | 147,662 | 130,007 | 422,703 | 68 | % | ||||||||
Other | 1,776 | 260 | 84 | 640 | — | % | ||||||||
1,532,145 | 169,770 | 194,468 | 619,595 | 100 | % | |||||||||
See SUPPLEMENTAL INFORMATION ON OIL AND GAS PRODUCING ACTIVITIES (UNAUDITED) in Item 8 for further information regarding our reserves.
7
Production Volumes, Prices, and Costs
All of our oil and gas assets are located in the United States. We have varying levels of ownership interests in our properties consisting of working, royalty, and overriding royalty interests. Operated wells account for approximately 87% of our proved reserves.
Our 2019 production volumes totaled 278.5 MBOE per day, a 25% increase from 2018, and were comprised of 41% gas, 31% oil, and 28% NGLs. The following table presents our total and average daily production volumes by region.
Total Production Volumes | Average Daily Production Volumes | |||||||||||||||||||||||
Years Ended December 31, | Gas (MMcf) | Oil (MBbls) | NGL (MBbls) | Total (MBOE) | Gas (MMcf) | Oil (MBbls) | NGL (MBbls) | Total (MBOE) | ||||||||||||||||
2019 | ||||||||||||||||||||||||
Permian Basin | 145,612 | 26,376 | 18,973 | 69,618 | 398.9 | 72.3 | 52.0 | 190.8 | ||||||||||||||||
Mid-Continent | 105,515 | 5,033 | 9,263 | 31,882 | 289.1 | 13.8 | 25.4 | 87.3 | ||||||||||||||||
Other | 440 | 54 | 18 | 145 | 1.2 | 0.1 | — | 0.4 | ||||||||||||||||
Total company | 251,567 | 31,463 | 28,254 | 101,645 | 689.2 | 86.2 | 77.4 | 278.5 | ||||||||||||||||
2018 | ||||||||||||||||||||||||
Permian Basin | 92,593 | 19,104 | 11,499 | 46,035 | 253.7 | 52.3 | 31.5 | 126.1 | ||||||||||||||||
Mid-Continent | 112,697 | 5,530 | 10,474 | 34,787 | 308.8 | 15.2 | 28.7 | 95.3 | ||||||||||||||||
Other | 547 | 76 | 21 | 188 | 1.4 | 0.2 | 0.1 | 0.5 | ||||||||||||||||
Total company | 205,837 | 24,710 | 21,994 | 81,010 | 563.9 | 67.7 | 60.3 | 221.9 | ||||||||||||||||
2017 | ||||||||||||||||||||||||
Permian Basin | 79,521 | 16,271 | 8,858 | 38,382 | 217.9 | 44.6 | 24.3 | 105.2 | ||||||||||||||||
Mid-Continent | 107,463 | 4,547 | 8,503 | 30,960 | 294.4 | 12.5 | 23.3 | 84.8 | ||||||||||||||||
Other | 484 | 43 | 13 | 137 | 1.3 | 0.1 | — | 0.4 | ||||||||||||||||
Total company | 187,468 | 20,861 | 17,374 | 69,479 | 513.6 | 57.2 | 47.6 | 190.4 | ||||||||||||||||
8
At December 31, 2019, we had three fields that contained 15% or more of our total proved reserves. These fields are: (i) Watonga-Chickasha in the Cana area of the Mid-Continent, which contained approximately 29% of our total proved reserves; (ii) Dixieland in the Permian Basin in Reeves County Texas, which contained approximately 21% of our total proved reserves; and (iii) Ford West in the Permian Basin in Culberson County Texas, which contained approximately 17% of our total proved reserves. At December 31, 2018, we had two fields that contained 15% or more of our total proved reserves, Watonga-Chickasha and Ford West. At December 31, 2017, the only field that contained 15% or more of our total proved reserves was Watonga-Chickasha. Production for these fields is presented in the following table.
Total Production Volumes | Average Daily Production Volumes | |||||||||||||||||||||||
Years Ended December 31, | Gas (MMcf) | Oil (MBbls) | NGL (MBbls) | Total (MBOE) | Gas (MMcf) | Oil (MBbls) | NGL (MBbls) | Total (MBOE) | ||||||||||||||||
2019 | ||||||||||||||||||||||||
Watonga-Chickasha | 89,564 | 4,588 | 8,688 | 28,203 | 245.4 | 12.6 | 23.8 | 77.3 | ||||||||||||||||
Dixieland | 42,570 | 8,890 | 5,911 | 21,897 | 116.6 | 24.4 | 16.2 | 60.0 | ||||||||||||||||
Ford West | 40,843 | 5,006 | 5,180 | 16,993 | 111.9 | 13.7 | 14.2 | 46.6 | ||||||||||||||||
2018 | ||||||||||||||||||||||||
Watonga-Chickasha | 96,373 | 5,094 | 9,774 | 30,930 | 264.0 | 14.0 | 26.8 | 84.7 | ||||||||||||||||
Dixieland | 10,285 | 2,510 | 1,328 | 5,552 | 28.2 | 6.9 | 3.6 | 15.2 | ||||||||||||||||
Ford West | 30,958 | 3,748 | 3,804 | 12,711 | 84.8 | 10.3 | 10.4 | 34.8 | ||||||||||||||||
2017 | ||||||||||||||||||||||||
Watonga-Chickasha | 88,557 | 4,156 | 7,829 | 26,744 | 242.6 | 11.4 | 21.4 | 73.3 | ||||||||||||||||
Dixieland | 9,668 | 2,279 | 1,032 | 4,922 | 26.5 | 6.2 | 2.8 | 13.5 | ||||||||||||||||
Ford West | 26,405 | 3,370 | 2,883 | 10,654 | 72.3 | 9.2 | 7.9 | 29.2 | ||||||||||||||||
9
The following table presents the average commodity prices received and production cost per unit of production by region.
Average Realized Price | Production Cost (per BOE) | |||||||||||||||
Years Ended December 31, | Gas (per Mcf) | Oil (per Bbl) | NGL (per Bbl) | |||||||||||||
2019 | ||||||||||||||||
Permian Basin | $ | 0.49 | $ | 52.55 | $ | 12.62 | $ | 3.47 | ||||||||
Mid-Continent | $ | 1.95 | $ | 53.89 | $ | 15.47 | $ | 3.04 | ||||||||
Other | $ | 2.44 | $ | 56.52 | $ | 15.70 | $ | 9.59 | ||||||||
Total Company | $ | 1.11 | $ | 52.77 | $ | 13.55 | $ | 3.34 | ||||||||
2018 | ||||||||||||||||
Permian Basin | $ | 1.69 | $ | 54.95 | $ | 22.84 | $ | 4.37 | ||||||||
Mid-Continent | $ | 2.23 | $ | 62.31 | $ | 21.67 | $ | 2.69 | ||||||||
Other | $ | 2.97 | $ | 58.40 | $ | 26.46 | $ | 7.63 | ||||||||
Total Company | $ | 1.99 | $ | 56.61 | $ | 22.28 | $ | 3.66 | ||||||||
2017 | ||||||||||||||||
Permian Basin | $ | 2.72 | $ | 46.96 | $ | 20.25 | $ | 4.73 | ||||||||
Mid-Continent | $ | 2.78 | $ | 47.42 | $ | 23.02 | $ | 2.60 | ||||||||
Other | $ | 2.74 | $ | 46.53 | $ | 23.11 | $ | 9.03 | ||||||||
Total Company | $ | 2.76 | $ | 47.06 | $ | 21.61 | $ | 3.79 | ||||||||
Acquisitions and Divestitures
We consider property acquisitions, divestitures, and occasional mergers to enhance our competitive position. Moreover, sales of non-strategic assets are a source of liquidity that we can use to supplement funding of capital expenditures and acquisitions of strategic assets.
On March 1, 2019, we completed the acquisition of Resolute Energy Corporation (“Resolute”), an independent oil and gas company focused on the acquisition and development of unconventional oil and gas properties in the Delaware Basin area of the Permian Basin of west Texas. This acquisition expanded our footprint in Reeves County, Texas on acreage complementary to our existing Reeves County position. The principal factors considered by management in making this acquisition included: (i) our expectation that Resolute’s assets’ attractive returns are competitive with those in our existing portfolio, (ii) the opportunity to apply our experience and learnings from already operating in this area to generating productivity gains from Resolute’s properties, (iii) the ability to increase our acreage position in the Delaware Basin, and (iv) the expectation that the acquisition will be financially accretive. We paid $325.7 million in cash and issued common and preferred stock valued at an aggregate of $494.6 million, for total consideration transferred of $820.3 million. In addition, we assumed $870.0 million of Resolute’s long-term debt, which we immediately repaid. See Note 13 to the Consolidated Financial Statements for further information.
In 2019, we sold interests in various non-strategic oil and gas properties for cash proceeds totaling $29 million.
10
Exploration and Development Overview
Cimarex has one reportable segment, exploration and production (“E&P”). Our E&P activities take place primarily in two areas: the Permian Basin and the Mid-Continent region. Almost all of our exploration and development (“E&D”) capital is allocated between these two areas.
A summary of our 2019 exploration and development activity by region is as follows:
E&D Capital | Gross Wells Completed | Net Wells Completed | |||||||
(in millions) | |||||||||
Permian Basin | $ | 1,048 | 131 | 75.5 | |||||
Mid-Continent | 193 | 160 | 16.6 | ||||||
Other | 1 | — | — | ||||||
$ | 1,242 | 291 | 92.1 | ||||||
The Permian Basin encompasses west Texas and southeast New Mexico. Cimarex’s Permian Basin efforts are located in the western half of the Permian Basin known as the Delaware Basin. In 2019, we began infill development of our Wolfcamp shale assets in the Delaware Basin. Development was focused on the oil-rich Upper Wolfcamp shale in Culberson and Reeves Counties in Texas. The Upper Wolfcamp is being developed with horizontal wells using primarily two-mile laterals.
The Permian Basin produced 190.8 MBOE per day in 2019, which was 68% of our total company production. Total production from the region increased 51% in 2019 over 2018. In 2019, we invested $1.05 billion, or 84% of our total E&D investment, in the Permian Basin and acquired Resolute, as discussed above in Acquisitions and Divestitures.
Our Mid-Continent region consists of Oklahoma and the Texas Panhandle. Our activity in 2019 in the Mid-Continent was focused in the Woodford shale and the Meramec horizon, both in Oklahoma. We focused our efforts on oil development and we continued to refine well completion and spacing in these formations.
11
During 2019, production from the Mid-Continent averaged 87.3 MBOE per day, or 31% of total company production. Total production from the region decreased 8% in 2019 as compared to 2018. In 2019, we invested $193 million, or 16% of our total E&D investment, in the Mid-Continent.
Drilling Activity
In 2019, we completed or participated in the completion of 291 gross (92.1 net) wells, of which we operated 119 gross (85.3 net) wells. At year-end, we were in the process of drilling or participating in 15 gross (5.3 net) wells and there were 95 gross (32.4 net) wells waiting on completion.
We completed the following number of developmental wells in the years indicated in the table below. During these years, we completed no exploratory wells.
Wells Completed | |||||||||||||||||
2019 | 2018 | 2017 | |||||||||||||||
Gross | Net | Gross | Net | Gross | Net | ||||||||||||
Developmental | |||||||||||||||||
Productive | 289 | 90.2 | 349 | 122.1 | 314 | 96.4 | |||||||||||
Dry | 2 | 1.9 | — | — | 5 | 1.6 | |||||||||||
Total | 291 | 92.1 | 349 | 122.1 | 319 | 98.0 | |||||||||||
At December 31, 2019, we owned an interest in 9,864 gross (2,782 net) productive oil and gas wells. We had working interests in the following number of productive wells by region as of December 31, 2019:
Gas | Oil | ||||||||||
Gross | Net | Gross | Net | ||||||||
Mid-Continent | 3,792 | 1,435 | 729 | 186 | |||||||
Permian Basin | 745 | 331 | 4,469 | 823 | |||||||
Other | 112 | 5 | 17 | 2 | |||||||
4,649 | 1,771 | 5,215 | 1,011 | ||||||||
12
Acreage
The following table sets forth the gross and net acres of both developed and undeveloped leases held by Cimarex as of December 31, 2019. Gross acres are the total number of acres in which we own a working interest. Net acres are the gross acres multiplied by our working interest.
Acreage | |||||||||||||||||
Undeveloped | Developed | Total | |||||||||||||||
Gross | Net | Gross | Net | Gross | Net | ||||||||||||
Mid-Continent | |||||||||||||||||
Kansas | 18,231 | 18,191 | — | — | 18,231 | 18,191 | |||||||||||
Oklahoma | 90,502 | 60,611 | 653,827 | 304,570 | 744,329 | 365,181 | |||||||||||
Texas | 14,272 | 9,356 | 123,135 | 51,338 | 137,407 | 60,694 | |||||||||||
123,005 | 88,158 | 776,962 | 355,908 | 899,967 | 444,066 | ||||||||||||
Permian Basin | |||||||||||||||||
New Mexico | 68,103 | 50,296 | 174,320 | 119,318 | 242,423 | 169,614 | |||||||||||
Texas | 58,632 | 39,496 | 193,932 | 135,636 | 252,564 | 175,132 | |||||||||||
126,735 | 89,792 | 368,252 | 254,954 | 494,987 | 344,746 | ||||||||||||
Other | |||||||||||||||||
Arizona | 2,097,841 | 2,097,841 | — | — | 2,097,841 | 2,097,841 | |||||||||||
California | 383,487 | 383,487 | — | — | 383,487 | 383,487 | |||||||||||
Colorado | 30,346 | 18,867 | 8,950 | 1,642 | 39,296 | 20,509 | |||||||||||
Gulf of Mexico | 20,000 | 11,000 | 18,853 | 6,381 | 38,853 | 17,381 | |||||||||||
Louisiana | 132,808 | 129,759 | 2,868 | 168 | 135,676 | 129,927 | |||||||||||
Michigan | 234 | 156 | 587 | 587 | 821 | 743 | |||||||||||
Montana | 29,359 | 7,698 | 7,004 | 1,037 | 36,363 | 8,735 | |||||||||||
Nevada | 1,007,167 | 1,007,167 | 440 | 1 | 1,007,607 | 1,007,168 | |||||||||||
New Mexico | 1,640,646 | 1,633,819 | 14,282 | 2,436 | 1,654,928 | 1,636,255 | |||||||||||
Texas | 8,800 | 2,695 | 23,375 | 4,784 | 32,175 | 7,479 | |||||||||||
Utah | 79,947 | 59,473 | 17,078 | 1,485 | 97,025 | 60,958 | |||||||||||
Wyoming | 90,586 | 11,923 | 24,447 | 4,711 | 115,033 | 16,634 | |||||||||||
Other | 100,839 | 84,484 | 7,362 | 3,408 | 108,201 | 87,892 | |||||||||||
5,622,060 | 5,448,369 | 125,246 | 26,640 | 5,747,306 | 5,475,009 | ||||||||||||
Total | 5,871,800 | 5,626,319 | 1,270,460 | 637,502 | 7,142,260 | 6,263,821 | |||||||||||
13
The table below summarizes by year and region our undeveloped acreage expirations in the next five years. In most cases, the drilling of a commercial well will hold the acreage beyond the expiration.
Acreage | |||||||||||||||||||||||||||||
2020 | 2021 | 2022 | 2023 | 2024 | |||||||||||||||||||||||||
Gross | Net | Gross | Net | Gross | Net | Gross | Net | Gross | Net | ||||||||||||||||||||
Mid-Continent | 10,939 | 10,902 | 6,235 | 6,235 | 1,860 | 1,860 | 284 | 284 | — | — | |||||||||||||||||||
Permian Basin | 5,732 | 5,732 | 4,136 | 4,136 | 1,641 | 1,641 | 960 | 960 | 40 | 40 | |||||||||||||||||||
Other | 149,623 | 149,593 | 10,935 | 10,855 | 32,977 | 31,956 | 5,709 | 5,594 | 904 | 648 | |||||||||||||||||||
166,294 | 166,227 | 21,306 | 21,226 | 36,478 | 35,457 | 6,953 | 6,838 | 944 | 688 | ||||||||||||||||||||
% of undeveloped acreage | 2.8 | 3.0 | 0.4 | 0.4 | 0.6 | 0.6 | 0.1 | 0.1 | — | — | |||||||||||||||||||
At December 31, 2019, we had no proved undeveloped reserves booked on undeveloped acreage that were scheduled for development beyond the expiration dates of the undeveloped acreage.
Marketing
Our oil and gas production is sold under short-term arrangements at market-responsive prices. We sell our oil at prices tied directly or indirectly to field postings. Our gas is sold under price mechanisms related to either monthly or daily index prices on pipelines where we deliver our gas. We sell our NGLs at prices tied to monthly index prices where we deliver our NGLs.
We sell our oil, gas, and NGLs to a broad portfolio of customers, including major energy companies, pipeline companies, local distribution companies, and other end-users. In 2019, we made sales to two customers that each amounted to 10% or more of our consolidated revenues for 2019. Sales to those two customers accounted for 29% and 25%, respectively, of our consolidated revenues for 2019. If any one of our major customers were to stop purchasing our production, we believe there are a number of other purchasers to whom we could sell our production with some delay. If multiple significant customers were to discontinue purchasing our production, we believe there would be challenges initially, but ample markets to handle the disruption.
We regularly monitor the credit worthiness of all our customers and may require parent company guarantees, letters of credit, or prepayments when deemed necessary. Historically, losses associated with uncollectible receivables have not been significant.
Corporate Headquarters and Employees
Our corporate headquarters is located at 1700 Lincoln St., Suite 3700, Denver, Colorado 80203. On December 31, 2019 and 2018, Cimarex had 987 and 955 employees, respectively. None of our employees are subject to collective bargaining agreements.
Competition
The oil and gas industry is highly competitive, particularly for prospective undeveloped leases and purchases of proved reserves. There is also competition for rigs and related equipment used to drill for and produce oil and gas, however, to a lesser extent in the current market environment. Our competitive position also is highly dependent on our ability to recruit and retain geological, geophysical, and engineering expertise. We compete for prospects, proved reserves, oil-field services, and qualified oil and gas professionals with major and diversified energy companies and other independent operators that have larger financial, human, and technological resources than we do.
14
We compete with integrated, independent, and other energy companies for the sale and transportation of our oil, gas, and NGLs to marketing companies and end users. The oil and gas industry competes with other energy industries that supply fuel and power to industrial, commercial, and residential consumers. Many of these competitors have greater financial and human resources than we do. The effect of these competitive factors cannot be predicted.
Proved Reserves Estimation Procedures
Proved oil and gas reserve quantities are based on estimates prepared by Cimarex in accordance with the SEC’s rules for reporting oil and gas reserves. Our reserve definitions conform with definitions of Rule 4-10(a) (1)-(32) of Regulation S-X of the SEC. All of our reserve estimates are maintained by our internal Corporate Reservoir Engineering group, which is comprised of engineers and engineering technicians. The objectives and management of this group are separate from and independent of the exploration and production functions of the company. The primary objective of our Corporate Reservoir Engineering group is to maintain accurate forecasts on all properties of the company through ongoing monitoring and timely updates of operating and economic parameters (production forecasts, prices and regional differentials, operating expenses, ownership, etc.) in accordance with guidelines established by the SEC. This separation of function and responsibility is a key internal control.
Cimarex engineers are responsible for estimates of proved reserves. Corporate engineers interact with the exploration and production departments to ensure all available engineering and geologic data is taken into account prior to establishing or revising an estimate. After preparing the reserves update, the corporate engineers review their recommendations with the Vice President of Corporate Engineering. After approval from the Vice President of Corporate Engineering, the revisions are entered into our reserves database by the engineering technician.
During the course of the year, the Vice President of Corporate Engineering presents summary reserves information to senior management and to our Board of Directors for their review. From time to time, the Vice President of Corporate Engineering also will confer with the Vice President of Exploration, Chief Operating Officer, and the Chief Executive Officer regarding specific reserves-related issues. In addition, Corporate Reservoir Engineering maintains a set of basic guidelines and procedures to ensure that critical checks and reviews of the reserves database are performed on a regular basis.
Together, these internal controls are designed to promote a comprehensive, objective, and accurate reserves estimation process. As an additional confirmation of the reasonableness of our internal estimates, DeGolyer and MacNaughton, an independent petroleum engineering consulting firm, performed an independent evaluation of our estimated net reserves representing greater than 80% of the total future net revenue discounted at 10% attributable to the total interests owned by Cimarex as of December 31, 2019. The individual primarily responsible for overseeing the review is a Senior Vice President with DeGolyer and MacNaughton and a Registered Professional Engineer in the State of Texas with over 35 years of experience in oil and gas reservoir studies and reserves evaluations.
The technical employee primarily responsible for overseeing the oil and gas reserves estimation process is Cimarex’s Vice President of Corporate Engineering. This individual graduated from the Colorado School of Mines with a Bachelor of Science degree in Engineering and has more than 25 years of practical experience in oil and gas reservoir evaluation. He has been directly involved in the annual reserves reporting process of Cimarex since 2002 and has served in his current role for the past 15 years.
Title to Oil and Gas Properties
We undertake title examination and perform curative work at the time we lease undeveloped acreage, prepare for the drilling of a prospect, or acquire proved properties. We believe title to our properties is good and defensible, and is in accordance with industry standards. Nevertheless, we are involved in title disputes from time to time that result in litigation. Our oil and gas properties are subject to customary royalty interests, liens incidental to operating agreements, tax liens, and other burdens and minor encumbrances, easements, and restrictions.
15
Government Regulation
Oil and gas production and transportation is subject to extensive federal, state, and local laws and regulations. Compliance with existing laws often is difficult and costly, but has not had a significant adverse effect on our operations or financial condition. In recent years, we have been most directly impacted by federal and state environmental regulations and energy conservation rules. We are also impacted by federal and state regulation of pipelines and other oil and gas transportation systems.
The states in which we conduct operations establish requirements for drilling permits, the method of developing fields, the size of well spacing units, drilling density within productive formations and the unitization or pooling of properties. In addition, state conservation laws include requirements for waste prevention, establish limits on the maximum rate of production from wells, generally prohibit the venting or flaring of natural gas, and impose certain requirements regarding the ratability of production.
Environmental Regulation. Various federal, state, and local laws regulating the discharge of materials into the environment, or otherwise relating to the protection of the environment, directly impact oil and gas exploration, development, and production operations, which consequently impact our operations and costs. These laws and regulations govern, among other things, emissions into the atmosphere, discharges of pollutants into waters, underground injection of waste water, the generation, storage, transportation, and disposal of waste materials, and protection of public health, natural resources, and wildlife. These laws and regulations may impose substantial liabilities for noncompliance and for any contamination resulting from our operations and may require the suspension or cessation of operations in affected areas.
Cimarex is committed to environmental protection and believes we are in material compliance with applicable environmental laws and regulations. We obtain permits for our facilities and operations in accordance with the applicable laws and regulations. There are no known issues that have a significant adverse effect on the permitting process or permit compliance status of any of our facilities or operations. Expenditures are required to comply with environmental regulations. These costs are a normal, recurring expense of operations and not an extraordinary cost of compliance with current government regulations.
We do not anticipate that we will be required under current environmental laws and regulations to expend amounts that will have a material adverse effect on our financial position or operations. However, due to continuing changes in these laws and regulations, we are unable to predict with any reasonable degree of certainty any potential delays in development plans that could arise, or our future costs of complying with governmental requirements. We maintain levels of insurance customary in the industry to limit our financial exposure in the event of a substantial environmental claim resulting from sudden, unanticipated and accidental discharges of oil, produced water, or other substances as well as additional coverage for certain other pollution events.
Gas Gathering and Transportation. The Federal Energy Regulatory Commission (“FERC”) requires interstate gas pipelines to provide open access transportation. FERC also enforces the prohibition of market manipulation by any entity, and the facilitation of the sale or transportation of natural gas in interstate commerce. Interstate pipelines have implemented these requirements, providing us with additional market access and more fairly applied transportation services and rates. FERC continues to review and modify its open access and other regulations applicable to interstate pipelines.
Under the Natural Gas Policy Act (“NGPA”), natural gas gathering facilities are expressly exempt from FERC jurisdiction. What constitutes “gathering” under the NGPA has evolved through FERC decisions and judicial review of such decisions. We believe that our gathering systems meet the test for non-jurisdictional “gathering” systems under the NGPA and that our facilities are not subject to federal regulations. Although exempt from FERC oversight, our natural gas gathering systems and services may receive regulatory scrutiny by state and federal agencies regarding the safety and operating aspects of the transportation and storage activities of these facilities.
16
In addition to using our own gathering facilities, we may use third-party gathering services or interstate transmission facilities (owned and operated by interstate pipelines) to ship our gas to markets.
Additional proposals and proceedings that might affect the oil and gas industry are pending before the U.S. Congress, FERC, Bureau of Land Management (“BLM”), U.S. Environmental Protection Agency (“EPA”), state legislatures, state agencies, local governments, and the courts. We cannot predict when or whether any such proposals may become effective and what effect they will have on our operations. We do not anticipate that compliance with existing federal, state, and local laws, rules, or regulations will have a material adverse effect upon our capital expenditures, earnings, or competitive position.
Federal and State Income and Other Local Taxation
Cimarex and the petroleum industry in general are affected by both federal and state income tax laws, as well as other local tax regulations involving ad valorem, personal property, franchise, severance, and other excise taxes. We have considered the effects of these provisions on our operations and do not anticipate that they will cause any material undisclosed impact on our capital expenditures, earnings, or competitive position.
Executive Officers of the Registrant
See Part III, Item 10, Directors, Executive Officers and Corporate Governance for information regarding our executive officers as of February 26, 2020.
ITEM 1A. RISK FACTORS
The following risks and uncertainties, together with other information set forth in this Form 10-K, should be carefully considered by current and future investors in our securities. These risks and uncertainties are not the only ones we face. Additional risks and uncertainties presently unknown to us or currently deemed immaterial also may impair our business operations. The occurrence of one or more of these risks or uncertainties could materially and adversely affect our business, financial condition, and results of operations, which in turn could negatively impact the value of our securities.
Risks Concerning Cimarex and its Operations
Oil, gas, and NGL prices fluctuate due to a number of factors beyond our control, creating a component of uncertainty in our development plans and overall operations. Declines in prices adversely affect our financial results and rate of growth in proved reserves and production.
Oil and gas markets are volatile. We cannot predict future prices. The prices we receive for our production heavily influence our revenue, profitability, access to capital, and future rate of growth. The prices we receive depend on numerous factors beyond our control. These factors include, but are not limited to, changes in domestic and global supply and demand for oil and gas, the level of domestic and global oil and gas exploration and production activity, pipeline capacity constraints limiting takeaway and increasing basis differentials, geopolitical instability, the actions of the Organization of Petroleum Exporting Countries, weather conditions, technological advances affecting energy consumption, governmental regulations and taxes, and the price and technological advancement of alternative fuels.
Our proved oil and gas reserves and production volumes will decrease unless those reserves are replaced with new discoveries or acquisitions. Accordingly, for the foreseeable future, we expect to make substantial capital investments for the exploration and development of new oil and gas reserves. Historically, we have paid for these types of capital expenditures with cash flow provided by our production operations, our revolving credit facility, and proceeds from the sale of senior notes or equity. Low prices reduce our cash flow and the amount of oil and gas that we can economically produce and may cause us to curtail, delay, or defer certain exploration and development projects.
17
Moreover, low prices may impact our abilities to borrow under our revolving credit facility and to raise additional debt or equity capital to fund acquisitions.
If prices decrease, we may be required to take write-downs of the carrying values of our oil and gas properties and/or our goodwill.
Accounting rules require that we periodically review the carrying value of our oil and gas properties and goodwill for possible impairment.
In 2019, we recognized a ceiling test impairment of $618.7 million. The impairment resulted primarily from the impact of decreases in the trailing twelve-month average prices for oil, gas, and NGLs utilized in determining the estimated future net cash flows from proved reserves. We did not recognize any ceiling test impairments in 2018 or 2017 because the calculated value of the ceiling limitation exceeded the carrying value of our oil and gas properties subject to the test. Because the ceiling calculation uses trailing twelve-month average commodity prices, the effect of increases and decreases in period-over-period prices can significantly impact the ceiling limitation calculation. Impairment charges do not affect cash flow from operating activities, but do adversely affect our net income and various components of our balance sheet.
We evaluate our goodwill for impairment annually and whenever events or changes in circumstances indicate the possibility that goodwill may be impaired. We have had no goodwill impairments during the years ended December 31, 2019, 2018, and 2017.
Ineffective internal controls could impact our business and financial results.
Our internal control over financial reporting may not prevent or detect misstatements because of its inherent limitations, including the possibility of human error, the circumvention or overriding of controls, or fraud. Even effective internal controls can provide only reasonable assurance with respect to the preparation and fair presentation of financial statements. If we fail to maintain the adequacy of our internal controls, including any failure to implement required new or improved controls, or if we experience difficulties in their implementation, our business and financial results could be harmed and we could fail to meet our financial reporting obligations. For example, at December 31, 2016, management concluded that a deficiency in the design of our internal controls related to the full cost ceiling test calculation represented a material weakness in our internal control over financial reporting and, therefore, that we did not maintain effective internal control over financial reporting as of December 31, 2016, as reported in our Form 10-K/A for that period. We have since remediated this material weakness. However, in connection with the preparation of this Form 10-K, management evaluated the effectiveness of our internal control over financial reporting as of December 31, 2019 and concluded that we did not have an effective process and control in place to periodically evaluate the quantitative effect associated with the inclusion or exclusion of certain inputs, such as skim oil and drip liquids, in the Company’s oil and gas reserve database used in the ceiling test impairment calculations, depletion calculations, and the preparation of the related disclosures included in the supplemental information on oil and gas producing activities (unaudited), which represents a material weakness in our internal control over financial reporting and, therefore, that we did not maintain effective internal control over financial reporting as of December 31, 2019. For a description of the material weakness identified by management and the remediation efforts being implemented for that material weakness, see “Part II, Item 9A — Controls and Procedures.” If the new controls implemented to address the material weakness and to strengthen the overall internal control related to the reserve reporting process are not designed or do not operate effectively, if we are unsuccessful in implementing or following these new controls, or we are otherwise unable to remediate this material weakness, this may result in untimely or inaccurate reporting of our financial statements.
U.S. or global financial markets may impact our business and financial condition.
A credit crisis or other turmoil in the U.S. or global financial system may have a negative impact on our business and our financial condition. Our ability to access the capital markets may be restricted at a time when we would like, or need, to raise financing. This could have an impact on our flexibility to react to changing economic and
18
business conditions. Deteriorating economic conditions could have a negative impact on our lenders, the purchasers of our oil and gas production, and the working interest owners in properties we operate, causing them to fail to meet their obligations to us.
Failure to economically replace oil and gas reserves could negatively affect our financial results and future rate of growth; exploration and development involves numerous risks.
In order to replace the reserves depleted by production and to maintain or increase our total proved reserves and overall production levels, we must either locate and develop new oil and gas reserves or acquire proved reserves from others. This requires significant capital expenditures and can impose reinvestment risk for us, as we may not be able to continue to replace our reserves economically. While we occasionally may seek to acquire proved reserves, our main business strategy is to grow through exploration and drilling. Without successful exploration and development, our reserves, production, and revenues could decline rapidly, which would negatively impact the results of our operations.
Exploration and development involves numerous risks, including new governmental regulations and the risk that we will not discover any commercially productive oil or gas reservoirs. Additionally, it can be unprofitable, not only from drilling dry holes but also from drilling productive wells that do not return a profit because of insufficient reserves or declines in commodity prices.
Our drilling operations may be curtailed, delayed, or canceled for many reasons. Factors such as unforeseen poor drilling conditions, title problems, unexpected pressure irregularities, equipment failures, accidents, adverse weather conditions, compliance with environmental and other governmental requirements, bans, moratoria, or other restrictions implemented by local governments and the cost of, or shortages or delays in the availability of, drilling and completion services could negatively impact our drilling operations.
Our proved reserve estimates may be inaccurate and future net cash flows are uncertain.
Estimates of total proved oil and gas reserves (consisting of proved developed and proved undeveloped reserves) and associated future net cash flow depend on a number of variables and assumptions. Refer to CAUTIONARY INFORMATION ABOUT FORWARD-LOOKING STATEMENTS in Part I of this report. Among others, changes in any of the following factors may cause actual results to vary considerably from our estimates:
• | oil, gas, and NGL prices; |
• | timing of development expenditures; |
• | amount of required capital expenditures and associated economics; |
• | recovery efficiencies, decline rates, drainage areas, and reservoir limits; |
• | anticipated reservoir and production characteristics and interpretations of geologic and geophysical data; |
• | production rates, reservoir pressure, unexpected water encroachment, and other subsurface conditions; |
• | governmental regulation; |
• | access to assets restricted by local government action; |
• | operating costs; |
• | property, severance, excise, and other taxes incidental to oil and gas operations; |
19
• | workover and remediation costs; and |
• | federal and state income taxes. |
Our proved oil and gas reserve estimates are prepared by Cimarex engineers in accordance with guidelines established by the SEC. DeGolyer and MacNaughton, an independent petroleum engineering consulting firm, performed an independent evaluation of our estimated net reserves representing greater than 80% of the total future net revenue discounted at 10%, as of December 31, 2019.
The cash flow amounts referred to in this filing should not be construed as the current market value of our proved reserves. In accordance with SEC guidelines, the estimated discounted net cash flow from proved reserves is based on the average of the previous twelve months’ first-day-of-the-month prices and costs as of the date of the estimate, whereas actual future prices and costs may be materially different.
Our business depends on oil and gas pipeline and transportation facilities, some of which are owned by others.
In addition to the existence of adequate markets, our oil and gas production depends in large part on the proximity and capacity of pipeline systems, as well as storage, transportation, processing and fractionation facilities, most of which are owned by third parties. The inability to transport one commodity, such as gas, could also impair our ability to produce and sell other commodities, such as oil and NGLs, produced from the same wells. The lack of availability or the lack of capacity on these systems and facilities could result in the curtailment of production or the delay or discontinuance of drilling plans. This is more likely in remote areas with less established infrastructure, such as our Delaware Basin area where we and competitors have significant development activities. The lack of availability of or capacity in these facilities or the loss of these facilities due to construction delays, weather, fire, or other reasons, for an extended period of time could negatively affect our revenues.
Commodity price derivative transactions may limit our potential gains and involve other risks.
To limit our exposure to price risk, we enter into derivative agreements from time to time. Commodity price derivatives limit volatility and increase the predictability of a portion of our cash flow. These transactions also limit our potential gains when oil and gas prices exceed the prices established by the derivatives.
In certain circumstances, derivative transactions may expose us to the risk of financial loss, including instances in which:
• | the counterparties to our derivative agreements fail to perform; |
• | there is a sudden unexpected event that materially increases oil and gas prices; or |
• | there is a widening of price basis differentials between delivery points for our production and the delivery point assumed in the derivative agreement. |
Because we account for derivative contracts under mark-to-market accounting, during periods we have derivative transactions in place we expect continued volatility in derivative gains and losses on our statement of operations as changes occur in the relevant price indexes.
20
We have been an early entrant into new or emerging resource plays. As a result, our drilling results in these areas are uncertain. The value of our undeveloped acreage may decline and we may incur impairment charges if drilling results are unsuccessful.
New or emerging oil and gas resource plays have limited or no production history. Consequently, in those areas it is difficult to predict our future drilling costs and results. Therefore, our cost of drilling, completing, and operating wells in these areas may be higher than initially expected. Similarly, our production may be lower than initially expected, and the value of our undeveloped acreage may decline if our results are unsuccessful. As a result, we may be required to impair the carrying value of our undeveloped acreage in new or emerging plays.
Furthermore, unless production is established during the primary term of certain of our undeveloped oil and gas leases, the leases will expire, and we will lose our right to develop those properties.
Competition in our industry is intense and many of our competitors have greater financial and technological resources.
We operate in the competitive area of oil and gas exploration and production. Many of our competitors are large, well-established companies that have larger operating staffs and greater capital resources. These competitors may be willing to pay more for exploratory prospects and productive oil and gas properties. They may also be able to define, evaluate, bid for, and purchase a greater number of properties and prospects than our financial or human resources permit.
Because our activity is also concentrated in areas of heavy industry competition, there is heightened demand for personnel, equipment, power, services, facilities, and resources, resulting in higher costs than in other areas. Such intense competition also could result in delays in securing, or the inability to secure, the personnel, equipment, power, services, resources, or facilities necessary for our development activities, which could negatively impact our production volumes. We also face higher costs in remote areas where vendors can charge higher rates due to that remoteness and the inability to attract employees to those areas, as well as the vendors’ ability to deploy their resources in easier-to-access areas.
We are subject to complex laws and regulations that can adversely affect the cost, manner, and feasibility of doing business.
Exploration, production, and the sale of oil and gas are subject to extensive laws and regulations, including those implemented to protect the environment, human health and safety, and wildlife. Federal, state, and local regulatory agencies frequently require permitting and impose conditions on our activities. During the permitting process, these regulatory agencies often exercise considerable discretion in both the timing and scope of the permits, and the public, including special interest groups, often has an opportunity to influence the timing and outcome of the process. The requirements or conditions imposed by these agencies can be costly and can delay the commencement of our operations. In addition, a number of initiatives were put forth by the Obama administration in the form of Presidential or Secretarial Memoranda, which are still in effect, and have the potential to impact the cost of doing business or could result in substantial delays in permitting, drilling, and other oil and gas activities.
Failing to comply with any of the applicable laws and regulations, or Presidential initiatives, could result in the suspension or termination of our operations and subject us to administrative, civil, and criminal liabilities and penalties. Such costs could have a material adverse effect on both our financial condition and operations.
Environmental matters and costs can be significant.
As an owner, lessee, or operator of oil and gas properties, we are subject to various complex, stringent, and constantly evolving environmental laws and regulations. Our operations inherently create the risk of environmental liability to the government and private parties stemming from our use, generation, handling, and disposal of water and
21
waste materials, as well as the release of hydrocarbons or other substances into the air, soil, or water. The environmental laws and regulations to which we are subject impose numerous obligations applicable to our operations, including: the acquisition of permits before conducting regulated activities associated with drilling for and producing oil and gas; the restriction of types, quantities, and concentration of materials that can be released into the environment; the limitation or prohibition of drilling activities on certain lands lying within wilderness, wetlands, waters of the United States, and other protected areas; the application of specific health and safety criteria addressing worker protection; and the imposition of substantial liabilities for pollution resulting from our operations. Numerous governmental authorities, such as the EPA and analogous state agencies have the power to enforce compliance with these laws and regulations and the permits issued under them. Such enforcement actions often involve taking difficult and costly compliance measures or corrective actions. Failure to comply with these laws and regulations may result in the assessment of sanctions, including administrative, civil, or criminal penalties, the imposition of investigatory or remedial obligations, and the issuance of orders limiting or prohibiting some or all of our operations. In addition, we may experience delays in obtaining, or be unable to obtain, required permits, which may delay or interrupt our operations and limit our growth and revenue.
Liabilities under certain environmental laws can be joint and several and may in some cases be imposed regardless of fault on our part such as where we own a working interest in a property operated by another party. We also could be held liable for damages or remediating lands or facilities previously owned or operated by others regardless of whether such contamination resulted from our own actions and regardless if we were in compliance with all applicable law at the time. Further, claims for damages to persons or property, including natural resources, may result from the environmental, health, and safety impacts of our operations. Because these environmental risks generally are not fully insurable and can result in substantial costs, such liabilities could have a material adverse effect on both our financial condition and operations.
Our financial condition and results of operations may be materially adversely affected if we incur costs and liabilities due to a failure to comply with environmental regulations or a release of hazardous substances into the environment.
Our operations are subject to environmental laws and regulations relating to the management and release of hazardous substances, pollutants, solid and hazardous wastes, and petroleum hydrocarbons. These laws generally regulate the generation, storage, treatment, discharge, transportation, and disposal of pollutants and solid and hazardous waste and may impose strict and, in some cases, joint and several liability for the investigation and remediation of affected areas where hazardous substances may have been released or disposed. The most significant of these environmental laws are as follows:
• | The Comprehensive Environmental Response, Compensation, and Liability Act, as amended, referred to as CERCLA or the Superfund law, and comparable state laws, which imposes liability on generators, transporters, and arrangers of hazardous substances at sites where hazardous substance releases have occurred or are threatening to occur; |
• | The Oil Pollution Act of 1990 (“OPA”), under which owners and operators of onshore facilities and pipelines, lessees or permittees of an area in which an offshore facility is located, and owners and operators of vessels are liable for removal costs and damages that result from a discharge of oil into navigable waters of the United States; |
• | The Resource Conservation and Recovery Act (“RCRA”), as amended, and comparable state statutes, which governs the treatment, storage, and disposal of solid waste; |
• | The Federal Water Pollution Control Act, as amended, also known as the Clean Water Act (“CWA”), which governs the discharge of pollutants, including natural gas wastes, into federal and state waters; |
• | The Safe Drinking Water Act (“SDWA”), which governs the disposal of wastewater in underground injection wells; and |
22
• | The Clean Air Act (“CAA”) which governs the emission of pollutants into the air. |
We believe we are in substantial compliance with the requirements of CERCLA, OPA, RCRA, CWA, SDWA, CAA and related state and local laws and regulations. We also believe we hold all necessary and up-to-date permits, registrations, and other authorizations required under such laws and regulations. Although the current costs of managing our wastes as they presently are classified are reflected in our budget, any legislative or regulatory reclassification of oil and gas exploration and production wastes could increase our costs to manage and dispose of such wastes and have a material adverse effect on our financial condition and operations.
Federal regulatory initiatives relating to the protection of threatened or endangered species could result in increased costs and additional operating restrictions or delays.
The Federal Endangered Species Act (“ESA”) was established to protect endangered and threatened species. Pursuant to the ESA, if a species is listed as threatened or endangered, restrictions may be imposed on activities adversely affecting that species’ habitat. The U.S. Fish and Wildlife Service (“FWS”) may designate critical habitat and suitable habitat areas it believes are necessary for survival of a threatened or endangered species. A critical habitat or suitable habitat designation could result in further material restrictions to federal land use and may materially delay or prohibit land access for oil and gas development. Similar protections are offered to migratory birds under the Migratory Bird Treaty Act. We conduct operations on federal oil and gas leases in areas where certain species are currently listed as threatened or endangered, or could be listed as such, under the ESA. Operations in areas where threatened or endangered species or their habitat are known to exist may require us to incur increased costs to implement mitigation or protective measures and also may restrict or preclude our drilling activities in those areas or during certain seasons, such as breeding and nesting seasons. On March 27, 2014, the FWS announced the listing of the lesser prairie chicken, whose habitat is over a five-state region, including Texas, New Mexico, and Oklahoma, where we conduct operations, as a threatened species under the ESA. Listing of the lesser prairie chicken as a threatened species imposes restrictions on disturbances to critical habitat by landowners and drilling companies that would harass, harm, or otherwise result in a “taking” of this species. However, the FWS also announced a final rule that will limit regulatory impacts on landowners and businesses from the listing if those landowners and businesses have entered into certain range-wide conservation planning agreements, such as those developed by the Western Association of Fish and Wildlife Agencies (“WAFWA”), pursuant to which such parties agreed to take steps to protect the lesser prairie chicken’s habitat and to pay a mitigation fee if its actions harm the lesser prairie chicken’s habitat. We entered into a voluntary Candidate Conservation Agreement (“CCA”) with the WAFWA, whereby we agreed to take certain actions and limit certain activities, such as limiting drilling on certain portions of our acreage during nesting seasons, in an effort to protect the lesser prairie chicken. On February 9, 2018, the FWS announced the listing of the Texas Hornshell, a fresh water mussel species in areas including New Mexico and Texas where we operate in the Permian Basin, as an endangered species. In March 2018, we entered into a CCA concerning voluntary conservation actions with respect to the Texas Hornshell. Participating in CCAs could result in increased costs to us from species protection measures, time delays or limitations on drilling activities, which costs, delays or limitations may be significant. Listing petitions continue to be filed with the FWS which could impact our operations. Many non-governmental organizations (“NGOs”) work closely with the FWS regarding the listing of many species, including species with broad and even nationwide ranges. The recent listing of the Mexican Long Nosed bat, whose habitat includes the Permian Basin where we operate, and the Dunes Sagebrush Lizard in the Permian Basin, are examples of the NGOs’ influence on ESA listing decisions. The increase in endangered species listings may impact our ability to explore for or produce oil and gas in certain areas and increase our costs.
Our hydraulic fracturing activities are subject to risks that could negatively impact our operations and profitability.
We use hydraulic fracturing for the completion of almost all of our wells. Hydraulic fracturing is a process that involves pumping fluid and proppant at high pressure into a hydrocarbon bearing formation to create and hold open fractures. Those fractures enable gas or oil to move through the formation’s pores to the well bore. Typically, the fluid used in this process is primarily water. In plays where hydraulic fracturing is necessary for successful development, the demand for water may exceed the supply. A lack of readily available water or a significant increase in the cost of water could cause delays or increased completion costs.
23
Certain federal agencies have asserted regulatory authority over aspects of the hydraulic fracturing process. The EPA, for example, has issued regulations under the federal Clean Air Act establishing performance standards for oil and gas activities, including standards for the capture of air emissions released during hydraulic fracturing. In 2016, the EPA finalized regulations that prohibit the discharge of wastewater from hydraulic fracturing operations to publicly owned wastewater treatment plants and issued a report finding that certain aspects of hydraulic fracturing, such as water withdrawals and wastewater management practices, could impact water resources. The BLM previously finalized regulations to regulate hydraulic fracturing on federal lands but subsequently issued a repeal of those regulations in 2017. States in which we operate also have adopted, or stated intentions to adopt, laws or regulations that mandate further restrictions on hydraulic fracturing, such as imposing more stringent permitting, disclosure and well-construction requirements on hydraulic fracturing operations and establishing standards for the capture of air emissions released during hydraulic fracturing. In addition to state laws, local land use restrictions, such as city ordinances, may restrict drilling in general or hydraulic fracturing in particular.
Moreover, policy makers, regulatory agencies and political candidates at the federal, state and local levels have proposed implementing stricter restrictions on hydraulic fracturing, including banning the process outright. For example, certain 2020 candidates for President of the United States have pledged to impose a ban on hydraulic fracturing. It is possible such restrictions could target industry activity on federal lands, which could adversely impact our operations in the Delaware Basin, as well as other areas where we operate under federal leases. As of December 31, 2019, approximately 3% of our total net leasehold resides on federal lands, and approximately 43% of our total net leasehold in the Delaware Basin is located on federal lands. Although it is not possible at this time to predict the outcome of these or other proposals, any new restrictions on hydraulic fracturing that may be imposed in areas in which we conduct business could potentially result in increased compliance costs, delays or cessation in development or other restrictions on our operations.
Any of the above factors could have a material adverse effect on our financial position, results of operations, or cash flows and could make it more difficult, costly or impossible for us to perform hydraulic fracturing to stimulate production from future wells. Restrictions on hydraulic fracturing also could reduce the amount of oil and gas that we are ultimately able to produce from our reserves.
The adoption of climate change legislation or regulations restricting emission of greenhouse gases, investor pressure concerning climate-related disclosures, and lawsuits could result in increased operating costs and reduced demand for the oil and gas we produce as well as reductions in the availability of capital.
Studies have found that emission of certain gases, commonly referred to as greenhouse gases (“GHGs”), impact the earth’s climate. Methane, a primary component of natural gas, and carbon dioxide, also present in natural gas as a secondary product, sometimes considered an impurity or a by-product of the burning of oil and natural gas, are examples of GHGs. The U.S. Congress and various states have been evaluating, and in some cases implementing, climate-related legislation and other regulatory initiatives that restrict emissions of GHGs. In December 2009, the EPA published its findings that emissions of GHGs present an endangerment to public health and the environment because emissions of such gases are contributing to the warming of the earth’s atmosphere and other climatic changes. Based on these findings, the EPA adopted regulations under existing provisions of the Federal Clean Air Act that establish Prevention of Significant Deterioration (“PSD”) and Title V permit reviews for GHG emissions from certain large stationary sources. Facilities required to obtain PSD and/or Title V permits under EPA’s GHG Tailoring Rule for their GHG emissions also may be required to meet “Best Available Control Technology” standards that will be established by the states or, in some cases, by the EPA on a case-by-case basis. The EPA has also adopted rules requiring the monitoring and reporting of GHG emissions from specified sources in the United States, including, among others, certain oil and gas production facilities on an annual basis, which includes certain of our operations. In recent proposed rulemaking, EPA is widening the scope of annual GHG reporting to include not only activities associated with completion and workover of gas wells with hydraulic fracturing and activities associated with oil and gas production operations, but also completions and workovers of oil wells with hydraulic fracturing, gathering and boosting systems, and transmission pipelines.
24
While Congress has from time to time considered legislation to reduce emissions of GHGs, there has not been significant activity in the form of adopted legislation to reduce GHG emissions at the federal level in recent years. In the absence of such federal climate legislation, a number of state and regional efforts have emerged that are aimed at tracking and/or reducing GHG emissions by means of cap and trade programs that typically require major sources of GHG emissions, such as electric power plants, to acquire and surrender emission allowances in return for emitting those GHGs. While we expect new legislation and regulations to increase the cost of business, at this time it is not possible to quantify the impact on our business. Any such future laws and final regulations that require reporting of GHGs or otherwise limit emissions of GHGs from our equipment and operations could require us to incur costs to develop and implement best management practices aimed at reducing GHG emissions, install and maintain emissions control technologies, as well as monitor and report on GHG emissions associated with our operations, which would increase our operating costs, and such requirements also could adversely affect demand for the oil and gas that we produce.
With respect to more comprehensive regulation, policy makers and political candidates have made, or expressed support for, a variety of proposals, such as the development of cap-and-trade or carbon tax programs, as well as the more sweeping “green new deal” resolutions introduced in Congress in early 2019. As generally proposed, a cap-and-trade program would cap overall greenhouse gas emissions on an economy-wide basis and require major sources of greenhouse gas emissions or major fuel producers to acquire and surrender emission allowances, while a carbon tax could impose taxes based on emissions from our operations and downstream uses of our products. The “green new deal” resolutions call for a 10-year national mobilization effort to, among other things, transition 100% of power demand in the U.S. to zero-emission sources and overhaul transportation systems in the U.S. to remove greenhouse gas emissions as much as is technologically feasible.
The following is a summary of potential climate-related risks that could adversely affect Cimarex:
Transition Risks. Transition risks are risks related to the transition to a lower-carbon economy and include policy, legal, technology, and market risks.
Policy and Legal Risks. Policy risks include policy actions that attempt to contract actions that contribute to adverse effects of climate change or policy actions that seek to promote adaptation to climate change. Examples include implementing carbon-pricing mechanisms to reduce GHG emissions (which would increase the costs of our doing business), shifting energy use toward lower emission sources (which could lower demand for our oil and gas production, resulting in lower prices and lower revenues), adopting energy-efficiency solutions (which also could lower demand for our oil and gas production, resulting in lower prices and lower revenues), encouraging greater water efficiency measures (which would increase our costs of production), and promoting more sustainable land-use practices (which also would increase our costs of production and could impact our ability to operate in certain areas). Policy actions also may include restrictions or bans on oil and gas activities, including bans on hydraulic fracturing proposed by Democratic presidential candidates, which could lead to write-downs or impairments of our assets. Legal and litigation risks include potential lawsuits claiming failure to mitigate impacts of climate change, failure to adapt to climate change, and the insufficiency of disclosure around material financial risks.
Technology Risk. Technological improvements or innovations that support the transition to a lower-carbon, more energy efficient economic system may have a significant impact on Cimarex. The development and use of emerging technologies such as renewable energy, battery storage, and energy efficiency may lower demand for oil and gas, resulting in lower prices and revenues, and increase our costs.
Market Risk. Markets could be affected by climate change through shifts in supply and demand for certain commodities, especially carbon-intensive commodities such as oil and gas and other products dependent on oil and gas, as climate-related risks and opportunities are increasingly taken into account. This could lower demand for our oil and gas production, resulting in lower prices and lower revenues. Market risk also may take the form of limited access to capital as investors shift investments to less carbon-intensive industries and alternative energy industries. In
25
addition, there have also been efforts in recent years to influence the investment community, including investment advisers and certain sovereign wealth, pension, and endowment funds promoting divestment of fossil fuel equities and pressuring lenders to limit funding to companies engaged in the extraction of fossil fuel reserves. Such environmental activism and initiatives aimed at limiting climate change and reducing air pollution could interfere with our business activities, operations, and ability to access capital. Furthermore, claims have been made against certain energy companies alleging that GHG emissions from oil, NGL, and gas operations constitute a public nuisance under federal and/or state common law. As a result, private individuals or public entities may seek to enforce environmental laws and regulations against us and could allege personal injury, property damages, or other liabilities. While we are currently not a party to any such litigation, we could be named in actions making similar allegations. An unfavorable ruling in any such case could significantly impact our operations and could have an adverse impact on our financial condition.
Reputation Risk. Climate change has been identified as a potential source of reputational risk tied to changing customer or community perceptions of an organization’s contribution to or detraction from the transition to a lower-carbon economy. This could lower demand for our oil and gas production, resulting in lower prices and lower revenues as consumers avoid carbon-intensive industries. This may also put pressure on investment managers to shift investments to less carbon-intensive industries and alternative energy industries, limiting our access to capital.
Physical Risks. Potential physical risks resulting from climate change may be event driven (including increased severity of extreme weather events, such as hurricanes or floods) or longer-term shifts in climate patterns that may cause sea level rise or chronic heat waves. Potential physical risks may cause direct damage to assets and indirect impacts such as supply chain disruption. Potential physical risks also include changes in water availability, sourcing, and quality, which could impact drilling and completions operations. These physical risks could cause increased costs, production disruptions, and lower revenues, and also could substantially increase the cost or limit the availability of insurance.
Legislation or regulatory initiatives intended to address seismic activity could restrict our ability to engage in hydraulic fracturing during completion operations and to dispose of saltwater produced in connection with our oil and gas production, which could limit our ability to produce oil and gas economically and have a material adverse effect on our business.
We dispose of large volumes of saltwater produced in connection with our drilling and production operations pursuant to permits issued to us or third-party operators of disposal wells by governmental authorities overseeing produced water disposal activities. While these permits are issued pursuant to existing laws and regulations, these legal requirements are subject to change, which could result in the imposition of more stringent operating constraints or new monitoring and reporting requirements, owing to, among other things, concerns of the public or governmental authorities regarding such gathering or disposal activities.
There exists a growing concern that hydraulic fracturing during well completion operations and the injection of produced water into underground disposal wells triggers seismic activity in certain areas, including Oklahoma and Texas, where we operate. In response to these concerns, regulators in some states are pursuing initiatives designed to impose additional requirements in connection with hydraulic fracturing and in the permitting of saltwater disposal wells or otherwise to assess any relationship between seismicity and these oil and gas operations. For example, in 2014, the Oklahoma Corporation Commission (“OCC”) began adopting rules for operators of saltwater disposal wells in certain seismically-active areas, or Areas of Interest, in the Arbuckle formation, requiring operators to monitor and record well pressure and discharge volume on a daily basis and further requiring operators of wells permitted for disposal of 20,000 barrels per day or more of saltwater to conduct mechanical integrity testing. Throughout 2015 and 2016, the Oklahoma Corporation Commission’s Oil and Gas Conservation Division (“OGCD”), issued a series of directives, expanding the areas of interest for induced seismicity and enhanced disposal restrictions and limiting the depths at which produced water could be injected or, in the alternative, reducing disposal volumes. Additional regulations and restrictions are possible as more is understood about this issue. In addition to and separate from induced seismicity associated with injection, the OGCD has issued guidelines to operators to follow when engaged in well stimulation activities, which some studies now seem to correlate with a small number of low intensity seismic events, and the OCC required operators
26
of saltwater injection wells, including Cimarex, that were within 10 miles of saltwater disposal wells operated by third parties that were experiencing leaks to be shut in until the leaks in the third party wells were repaired or those third party wells were plugged. Shutting in our saltwater disposal wells increased our disposal costs.
In addition, in 2014 the Texas Railroad Commission, or TRC, published a new rule governing permitting or re-permitting of disposal wells in Texas that would require, among other things, the submission of information on seismic events occurring within a specified radius of the disposal well location, as well as logs, geologic cross sections, and structure maps relating to the disposal area in question. If a permittee or a prospective permittee fails to demonstrate that the saltwater or other fluids are confined to the disposal zone or if scientific data indicates such a disposal well is likely to be or determined to be contributing to seismic activity, then the TRC may deny, modify, suspend, or terminate the permit application or existing operating permit for that well.
The adoption and implementation of any new laws, regulations, or directives that restrict our ability to stimulate wells or to dispose of produced water, by changing the depths of disposal wells, reducing the volume of oil and gas wastewater disposed in such wells, restricting disposal well locations or otherwise, or by requiring us or third parties who dispose of our saltwater to shut down disposal wells, could increase disposal costs or require us to shut in a substantial number of our oil and gas wells or otherwise have a material adverse effect on our ability to produce oil and gas economically and, accordingly, could materially and adversely affect our business, financial condition, and results of operations. We could also face lawsuits alleging that seismic activity occurred as a result of completions or water disposal activities, resulting in damage to persons and property.
A substantial portion of our producing properties are located in limited geographic areas, making us vulnerable to risks associated with having geographically concentrated operations.
A substantial portion of our producing properties are geographically concentrated in the Permian Basin in Texas and New Mexico and our Cana area in the Mid-Continent region in Oklahoma, with these two areas comprising approximately 68% and 31%, respectively, of our oil, gas, and NGL production and approximately 73% and 27%, respectively, of our oil, gas, and NGL revenues for the year ended December 31, 2019. Approximately 68% and 32% of our estimated proved reserves were located in the Permian Basin and the Mid-Continent region, respectively, as of December 31, 2019.
Because of this concentration in limited geographic areas, the success and profitability of our operations may be disproportionately exposed to regional factors relative to our competitors that have more geographically dispersed operations. These factors include, among others: (i) the prices of oil and gas produced from wells in the regions and other regional supply and demand factors, including gathering, pipeline, and rail transportation capacity constraints; (ii) the availability of rigs, equipment, oil field services, supplies, and labor; (iii) the availability of processing and refining facilities; and (iv) infrastructure capacity. In addition, our operations in the Permian Basin and Mid-Continent region, as well as other areas, may be adversely affected by severe weather events such as floods, lightning, ice and other storms, and tornadoes, which can intensify competition for the items described above during months when drilling is possible and may result in periodic shortages. The concentration of our operations in limited geographic areas also increases our exposure to changes in local laws and regulations including concerning hydraulic fracturing and wastewater disposal as discussed above in “Legislation or regulatory initiatives intended to address seismic activity could restrict our ability to engage in hydraulic fracturing during completion operations and to dispose of saltwater produced in connection with our oil and gas production, which could limit our ability to produce oil and gas economically and have a material adverse effect on our business”, certain lease stipulations designed to protect wildlife, and unexpected events that may occur in the regions such as natural disasters, seismic events, industrial accidents, or labor difficulties. Any one of these events has the potential to cause producing wells to be shut-in, delay operations, decrease cash flows, increase operating and capital costs and prevent development of lease inventory before expiration. Any of the risks described above could have a material adverse effect on our financial condition, results of operations, and cash flows.
27
We use some of the latest available horizontal drilling and completion techniques, which involve risk and uncertainty in their application.
Our horizontal drilling operations utilize some of the latest drilling and completion techniques. The risks of such techniques include, but are not limited to, the following:
• | landing the wellbore in the desired drilling zone; |
• | staying in the desired drilling zone while drilling horizontally through the formation; |
• | running casing the entire length of the wellbore; |
• | being able to run tools and other equipment consistently through the horizontal wellbore; |
• | the ability to fracture stimulate the planned number of stages; |
• | the ability to run tools the entire length of the wellbore during completion operations; and |
• | the ability to successfully clean out the wellbore after completion of the final fracture stimulation stage. |
Any of the above factors could have a material adverse effect on our financial position, results of operations, or cash flows.
Many of our properties are in areas that may have been partially depleted or drained by offset wells and certain of our wells may be adversely affected by actions other operators may take when drilling, completing, or operating wells that they own.
Many of our properties are in areas that may have already been partially depleted or drained by earlier offset drilling. The owners of leasehold interests adjoining any of our properties could take actions, such as drilling and completing additional wells, which could adversely affect our operations. When a new well is completed and produced, the pressure differential in the vicinity of the well causes the migration of reservoir fluids toward the new wellbore (and potentially away from existing wellbores). As a result, the drilling and production of these potential locations could cause a depletion of our proved reserves and may inhibit our ability to further develop our proved reserves. In addition, completion operations and other activities conducted on adjacent or nearby wells could cause production from our wells to be shut in for indefinite periods of time, could result in increased lease operating expenses and could adversely affect the production and reserves from our wells after they re-commence production. We have no control over the operations or activities of offsetting operators.
We may be subject to information technology system failures, network disruptions, and breaches in data security and our business, financial position, results of operations, and cash flows could be negatively affected by such security threats and disruptions.
As an oil and gas producer, we face various security threats, including cybersecurity threats such as attempts to gain unauthorized access to sensitive information or to render data or systems unusable; threats to the security of our facilities and infrastructure or third-party facilities and infrastructure, such as gathering and processing facilities, pipelines and refineries; and threats from terrorist acts. Cybersecurity attacks are becoming more sophisticated and include, but are not limited to, malicious software, attempts to gain unauthorized access to data and systems, and other electronic security breaches that could lead to disruptions in critical systems, unauthorized release of confidential or otherwise protected information, and corruption of data, and “ransomware” attacks where data is locked unless a payment is made, any of which could have an adverse effect on our reputation, business, financial condition, results of operations, or cash flows. While we have not suffered any material losses relating to such attacks, there can be no assurance that we will not suffer such losses in the future.
28
We rely heavily on our information systems, and the availability and integrity of these systems are essential for us to conduct our business and operations. In addition to cybersecurity and data security threats, other information system failures and network disruptions could have a material adverse effect on our ability to conduct our business. We could experience system failures due to power or telecommunications failures, human error, natural disasters, fire, sabotage, hardware or software malfunction or defects, computer viruses, intentional acts of vandalism or terrorism and similar acts or occurrences. Such system failures could result in the unanticipated disruption of our operations, communications, or processing of transactions, as well as loss of, or damage to, sensitive information, facilities, infrastructure and systems essential to our business and operations, the failure to meet regulatory standards and the reporting of our financial results, and other disruptions to our operations, which, in turn, could have a material adverse effect on our business, financial position, results of operations, and cash flows.
A cyber attack involving our information systems and related infrastructure, or those of our business associates, could disrupt our business and negatively impact our operations in a variety of ways, including but not limited to:
• | unauthorized access to seismic data, reserves information, strategic information, or other sensitive or proprietary information could have a negative impact on our ability to compete for oil and gas resources; |
• | data corruption or operational disruption of production-related infrastructure could result in a loss of production, or accidental discharge; |
• | a cyber attack on a vendor or service provider could result in supply chain disruptions, which could delay or halt our major development projects; |
• | a cyber attack on third-party gathering, pipeline, or rail transportation systems could delay or prevent us from transporting and marketing our production, resulting in a loss of revenues; and |
• | a cyber attack on our accounting or accounts payable systems could expose us to liability to employees and third parties if their personal identifying information is obtained. |
These events could damage our reputation and lead to financial losses from remedial actions, loss of business, or potential liability, which could have a material adverse effect on our financial condition, results of operations, or cash flows.
While management has taken steps to address these concerns by implementing network security and internal control measures to monitor and mitigate security threats and to increase security for our information, facilities, and infrastructure, our implementation of such procedures and controls may result in increased costs, and there can be no assurance that a system failure or data security breach will not occur and have a material adverse effect on our business, financial condition, and results of operations. In addition, as cybersecurity threats continue to evolve, we may be required to expend additional resources to continue to modify or enhance our protective measures or to investigate or remediate any cybersecurity or information technology infrastructure vulnerabilities.
Our limited ability to influence operations and associated costs on non-operated properties could result in economic losses that are partially beyond our control.
For the year ended December 31, 2019, other companies operated approximately 13% of our net production. Our success in properties operated by others depends upon a number of factors outside of our control. These factors include timing and amount of capital expenditures, the operator’s expertise and financial resources, approval of other participants in drilling wells, selection of technology, and maintenance of safety and environmental standards. Our dependence on the operator and other working interest owners for these projects could prevent the realization of our targeted returns on capital in drilling or acquisition activities.
29
Our business involves many operating risks that may result in substantial losses for which insurance may be unavailable or inadequate.
Our operations are subject to hazards and risks inherent in drilling for oil and gas, such as fires, natural disasters, explosions, formations with abnormal pressures, casing collapses, uncontrollable flows of underground gas, blowouts, surface cratering, pipeline ruptures, or cement failures. Other such risks include theft, vandalism, and environmental hazards such as gas leaks, oil spills, and discharges of toxic gases. Any of these risks can cause substantial losses resulting from:
• | injury or loss of life; |
• | damage to, loss of or destruction of, property, natural resources and equipment; |
• | pollution and other environmental damages; |
• | regulatory investigations, civil litigation, and penalties; |
• | damage to our reputation; |
• | suspension of our operations; and |
• | costs related to repair and remediation. |
In addition, our liability for environmental hazards may include conditions created by the previous owners of properties that we purchase or lease.
We maintain insurance coverage against some, but not all, potential losses. We do not believe that insurance coverage for all environmental damages that could occur is available at a reasonable cost. Losses could occur for uninsurable or uninsured risks, or in amounts in excess of existing insurance coverage. The occurrence of an event that is not fully covered by insurance could harm our financial condition and results of operation. The cost of insurance may increase, and the availability of insurance may decrease, as a result of climate change.
We may not be able to generate enough cash flow to meet our debt obligations.
At December 31, 2019, our long-term debt consisted of $750 million of 4.375% senior notes due in 2024, $750 million of 3.90% senior notes due in 2027, and $500 million of 4.375% senior notes due in 2029. In addition to interest expense and principal on our long-term debt, we have demands on our cash resources including, among others, capital expenditures, operating expenses, and contractual commitments.
Our ability to pay the principal and interest on our long-term debt and to satisfy our other liabilities will depend upon future performance and our ability to repay or refinance our debt as it becomes due. Our future operating performance and ability to refinance will be affected by economic and capital market conditions, results of operations, and other factors, many of which are beyond our control. Our ability to meet our debt service obligations also may be impacted by changes in prevailing interest rates, as borrowing under our existing revolving credit facility bears interest at floating rates.
30
We may not generate sufficient cash flow from operations. Without sufficient cash flow, there may not be adequate future sources of capital to enable us to service our indebtedness or to fund our other liquidity needs. If we are unable to service our indebtedness and fund our operating costs, we will be forced to adopt alternative strategies that may include:
• | reducing or delaying capital expenditures; |
• | seeking additional debt financing or equity capital; |
• | selling assets; or |
• | restructuring or refinancing debt. |
We may be unable to complete any such strategies on satisfactory terms, if at all. Our inability to generate sufficient cash flows to satisfy our debt obligations or contractual commitments, or to refinance our indebtedness on commercially reasonable terms, would materially and adversely affect our financial condition and results of operations.
The instruments governing our indebtedness contain various covenants limiting the discretion of our management in operating our business.
The indenture governing our senior notes and our credit agreement contain various restrictive covenants that may limit management’s discretion in certain respects. In particular, these agreements limit Cimarex’s and its subsidiaries’ ability to, among other things:
• | create certain liens; |
• | consolidate, merge, or transfer all, or substantially all, of our assets and our restricted subsidiaries; or |
• | enter into sale and leaseback transactions. |
In addition, our revolving credit agreement requires us to maintain a total debt to capitalization ratio (as defined in the credit agreement) of not more than 65%. See Note 3 to the Consolidated Financial Statements for further information.
If we fail to comply with the restrictions in the indenture governing our senior notes or the agreement governing our credit facility or any other subsequent financing agreements, a default may allow the creditors, if the agreements so provide, to accelerate the related indebtedness as well as any other indebtedness to which a cross-acceleration or cross-default provision applies. In addition, lenders may be able to terminate any commitments they had made to make available further funds.
Our acquisition activities may not be successful, which may hinder our replacement of reserves and adversely affect our results of operations.
The successful acquisition of properties requires an assessment of several factors, including:
• | geological risks and recoverable reserves; |
• | future oil and gas prices and their appropriate market differentials; |
• | operating costs; and |
• | potential environmental risks and other liabilities. |
31
The accuracy of these assessments is inherently uncertain. In connection with these assessments, we perform a review of the subject properties we believe to be generally consistent with industry practices. Our review will not reveal all existing or potential problems nor will it permit us to become sufficiently familiar with the properties to fully assess their deficiencies and capabilities. Inspections will not likely be performed on every well or facility, and structural and environmental problems are not necessarily observable even when an inspection is undertaken. Furthermore, the seller may be unwilling or unable, such as in a corporate acquisition such as our acquisition of Resolute, to provide effective contractual protection against all or part of the identified problems.
On March 1, 2019, we completed the acquisition of Resolute. There can be no assurance that we will be able to successfully integrate Resolute’s assets or otherwise realize the expected benefits of the acquisition of Resolute. In addition, our business may be negatively impacted if we are unable to effectively manage our expanded operations going forward. The integration has required and will continue to require significant time and focus from management and could disrupt current plans and operations, which could delay the achievement of our strategic objectives.
For additional risks related to our acquisition of Resolute, see below “Risks Concerning Cimarex’s Merger with Resolute Energy Corporation”.
We may lose leases if production is not established within the time periods specified in the leases.
Unless production is established within the spacing units covering the undeveloped acres on which some of the locations are identified, the leases for such acreage will expire and the amounts spent for those leases will be lost. The combined net acreage expiring in the next three years represents approximately 4.0% of our total net undeveloped acreage at December 31, 2019. At that date, we had leases representing 166,227 net acres expiring in 2020, 21,226 net acres expiring in 2021, and 35,457 net acres expiring in 2022. Our actual drilling activities may materially differ from those presently identified, which could adversely affect our business.
Our disposition activities may be subject to factors beyond our control, and in certain cases we may retain unforeseen liabilities for certain matters.
We regularly sell non-strategic assets in order to increase capital resources available for other strategic assets and to create organizational and operational efficiencies. We also occasionally sell interests in strategic assets for the purpose of accelerating the development of and increasing efficiencies in such strategic assets. Various factors could materially affect our ability to dispose of such assets, including the approvals of governmental agencies or third parties, and the availability of purchasers willing to acquire the assets with terms we deem acceptable.
Sellers at times retain certain liabilities or agree to indemnify buyers for certain matters related to the sold assets. The magnitude of any such retained liability or indemnification obligation is difficult to quantify at the time of the transaction and ultimately could be material. Also, as is typical in divestiture transactions, third parties may be unwilling to release the company from guarantees or other credit support provided prior to the sale of the divested assets. As a result, after a divestiture, the company may remain secondarily liable for the obligations guaranteed or supported to the extent that the buyer of the assets fails to perform these obligations. In addition, with respect to offshore assets, if purchasers declare bankruptcy, the United States Department of Interior may pursue former owners for decommissioning expenses, which can be substantial. See Note 8 to the Consolidated Financial Statements for further discussion regarding our asset retirement obligations.
Competition for experienced technical personnel may negatively impact our operations.
Our exploratory and development drilling success depends, in part, on our ability to attract and retain experienced professional personnel. The loss of any key executives or other key personnel could have a material adverse effect on our operations. As we continue to develop our asset base and the scope of our operations, our future profitability will depend on our ability to attract and retain qualified personnel, particularly individuals with a strong background in geology, geophysics, engineering, and operations.
32
We are involved in various legal proceedings, the outcome of which could have an adverse effect on our liquidity.
In the normal course of business, we are involved with various lawsuits and related disputed claims, including but not limited to claims concerning title, royalty payments, environmental issues, personal injuries, and contractual issues. Although we currently believe the resolution of these lawsuits and claims, individually or in the aggregate, would not have a material adverse effect on our financial condition or results of operations, our assessment of our current litigation and other legal proceedings could change in light of the discovery of facts with respect to legal actions or other proceedings pending against us not presently known to us or determinations by judges, juries, or other finders of fact that are not in accord with our evaluation of the possible liability or outcome of such proceedings. Therefore, there can be no assurance that outcomes of future legal proceedings would not have an adverse effect on our liquidity and capital resources.
Certain federal income tax deductions currently available with respect to oil and gas exploration and development may be limited or eliminated as a result of recently enacted or future legislation.
On December 22, 2017, the United States enacted H.R.1, commonly referred to as the Tax Cuts and Jobs Act or U.S. Tax Reform. H.R.1, among other things, includes changes to U.S. federal tax rates, imposes new limitations on the utilization of net operating losses and the deductibility of interest and executive compensation, temporarily allows for the expensing of capital expenditures, and eliminates the corporate Alternative Minimum Tax. Various proposed regulations have been issued regarding H.R.1. Until final regulations are issued the full impact of changes to the company is not known at this time. From time to time, various proposals are made recommending the elimination of certain key U.S. federal income tax incentives currently available to oil and gas exploration and production companies. Future legislation may be introduced in Congress which would implement many of these proposals. These changes include, but are not limited to: (i) the repeal of the percentage depletion allowance for oil and gas properties; (ii) the elimination of current deductions for intangible drilling and development costs; and (iii) an extension of the amortization period for certain geological and geophysical expenditures. It is unclear, however, whether any such changes will be enacted or how soon such changes could be effective.
The passage of this legislation or any other similar change in U.S. federal income tax law could eliminate or postpone certain tax deductions that are currently available with respect to oil and gas exploration and development, and any such change could have an adverse effect on our financial position, results of operations, and cash flows, including the payment of cash taxes earlier than expected.
Risks Concerning Cimarex’s Merger with Resolute Energy Corporation
Cimarex’s merger with Resolute may not achieve its intended results, and Cimarex and Resolute may be unable to successfully integrate their operations.
Cimarex and Resolute entered into the merger agreement with the expectation that the merger will result in various benefits, including, among other things, expanding Cimarex’s asset base and creating synergies. Achieving the anticipated benefits of the merger is subject to a number of uncertainties, including whether the businesses of Cimarex and Resolute can be integrated in an efficient and effective manner.
The combined company’s results of operations could also be adversely affected by any issues attributable to either company’s operations that arise from or are based on events or actions that occurred prior to the closing of the merger, including unknown liabilities of Resolute or its subsidiaries or liabilities of Resolute or its subsidiaries related to properties sold by Resolute prior to the merger. The integration process is subject to a number of uncertainties, and no assurance can be given whether anticipated benefits will be realized or, if realized, the timing of their realization. Failure to achieve these anticipated benefits could result in increased costs or decreases in the amount of expected revenues and could adversely affect the combined company’s future business, financial condition, operating results, and prospects.
33
ITEM 1B. UNRESOLVED STAFF COMMENTS
None.
ITEM 3. LEGAL PROCEEDINGS
The information set forth under the heading “Litigation” in Note 10 to the Consolidated Financial Statements included in Part II, Item 8 of this Form 10-K, is incorporated by reference in response to this item.
ITEM 4. MINE SAFETY DISCLOSURES
Not applicable.
34
PART II
ITEM 5. MARKET FOR REGISTRANT’S COMMON EQUITY, RELATED STOCKHOLDER MATTERS AND ISSUER PURCHASES OF EQUITY SECURITIES
Our $0.01 par value common stock trades on the New York Stock Exchange (“NYSE”) under the symbol XEC. A cash dividend was paid to our common stockholders in each quarter of 2019. Future dividend payments will depend on the company’s level of earnings, financial requirements, and other factors considered relevant by the Board of Directors.
The closing price of Cimarex stock as reported on the NYSE on January 31, 2020, was $43.89. At January 31, 2020, Cimarex’s 102,135,577 shares of outstanding common stock were held by approximately 1,388 stockholders of record.
Issuer Purchases of Equity Securities
The following table sets forth information regarding repurchases of our common stock during the year ended December 31, 2019. The shares repurchased represent shares of our common stock that employees elected to surrender to satisfy their tax withholding obligations upon the vesting of shares of restricted stock. Cimarex does not consider this a share buyback program.
Period | Total number of shares purchased | Average price paid per share | Total number of shares purchased as part of publicly announced plans or programs | Maximum number of shares that may yet be purchased under the plans or programs | |||||||||
January 1-31, 2019 | 1,162 | $ | 70.46 | — | — | ||||||||
February 1-28, 2019 | — | — | — | — | |||||||||
March 1-31, 2019 | 8,393 | 68.16 | — | — | |||||||||
April 1-30, 2019 | — | — | — | — | |||||||||
May 1-31, 2019 | — | — | — | — | |||||||||
June 1-30, 2019 | — | — | — | — | |||||||||
July 1-31, 2019 | 34,607 | 50.67 | — | — | |||||||||
August 1-31, 2019 | — | — | — | — | |||||||||
September 1-30, 2019 | — | — | — | — | |||||||||
October 1-31, 2019 | — | — | — | — | |||||||||
November 1-30, 2019 | — | — | — | — | |||||||||
December 1-31, 2019 | 61,374 | 45.97 | — | — | |||||||||
Total | 105,536 | $ | 49.55 | — | — | ||||||||
35
Stock Performance Graph
The following graph shows the cumulative five-year total return on Cimarex Energy Co.’s common stock relative to the cumulative total returns of the S&P 500 index, the Dow Jones US Exploration & Production index, and the S&P Oil & Gas Exploration & Production index. The graph tracks the performance of a $100 investment in our common stock and in each of the indexes (with the reinvestment of all dividends) from December 31, 2014 to December 31, 2019. The stock price performance included in this graph is not necessarily indicative of future stock price performance.
COMPARISON OF FIVE-YEAR CUMULATIVE TOTAL RETURN*
Among Cimarex Energy Co., the S&P 500 Index,
the Dow Jones US Exploration & Production Index, and the S&P Oil & Gas Exploration & Production Index
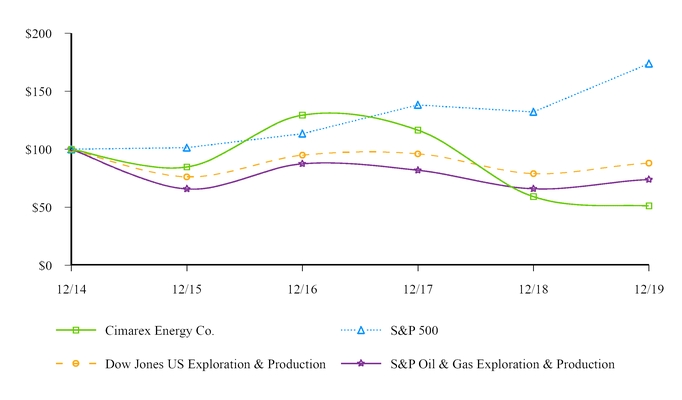
* $100 invested on 12/31/14 in stock or index, including reinvestment of dividends. Fiscal year ending December 31.
A tabular presentation of the data in the above graph is provided below.
2014 | 2015 | 2016 | 2017 | 2018 | 2019 | ||||||||||||||||||
Cimarex Energy Co. | $ | 100.00 | $ | 84.79 | $ | 129.42 | $ | 116.52 | $ | 59.25 | $ | 51.21 | |||||||||||
S&P 500 | $ | 100.00 | $ | 101.38 | $ | 113.51 | $ | 138.29 | $ | 132.23 | $ | 173.86 | |||||||||||
Dow Jones US Exploration & Production | $ | 100.00 | $ | 76.27 | $ | 94.94 | $ | 96.18 | $ | 79.09 | $ | 88.10 | |||||||||||
S&P Oil & Gas Exploration & Production | $ | 100.00 | $ | 65.85 | $ | 87.48 | $ | 81.96 | $ | 65.98 | $ | 73.91 | |||||||||||
36
ITEM 6. SELECTED FINANCIAL DATA
The selected financial data set forth below should be read in conjunction with the Consolidated Financial Statements and accompanying notes thereto provided in Item 8 of this report.
Years Ended December 31, | |||||||||||||||||||
2019 | 2018 | 2017 | 2016 | 2015 | |||||||||||||||
(in thousands, except per share amounts) | |||||||||||||||||||
Operating results: | |||||||||||||||||||
Oil, gas, and NGL sales | $ | 2,321,921 | $ | 2,297,645 | $ | 1,874,003 | $ | 1,221,218 | $ | 1,417,538 | |||||||||
Total revenues (1) | $ | 2,362,969 | $ | 2,339,017 | $ | 1,918,249 | $ | 1,257,345 | $ | 1,452,619 | |||||||||
Net (loss) income (2) | $ | (124,619 | ) | $ | 791,851 | $ | 494,329 | $ | (408,803 | ) | $ | (2,579,604 | ) | ||||||
Earnings (loss) per common share: | |||||||||||||||||||
Basic | $ | (1.33 | ) | $ | 8.32 | $ | 5.19 | $ | (4.38 | ) | $ | (27.75 | ) | ||||||
Diluted | $ | (1.33 | ) | $ | 8.32 | $ | 5.19 | $ | (4.38 | ) | $ | (27.75 | ) | ||||||
Cash dividends declared per common share | $ | 0.80 | $ | 0.68 | $ | 0.32 | $ | 0.32 | $ | 0.64 | |||||||||
Cash flow data: | |||||||||||||||||||
Net cash provided by operating activities | $ | 1,343,966 | $ | 1,550,994 | $ | 1,096,564 | $ | 625,849 | $ | 725,728 | |||||||||
Net cash used by investing activities | $ | (1,577,882 | ) | $ | (1,085,618 | ) | $ | (1,265,897 | ) | $ | (692,410 | ) | $ | (1,008,605 | ) | ||||
Net cash (used) provided by financing activities | $ | (472,028 | ) | $ | (65,244 | ) | $ | (83,009 | ) | $ | (59,945 | ) | $ | 656,397 | |||||
December 31, | |||||||||||||||||||
2019 | 2018 | 2017 | 2016 | 2015 | |||||||||||||||
(in thousands, except proved reserves amounts) | |||||||||||||||||||
Balance sheet data: | |||||||||||||||||||
Cash and cash equivalents (3) | $ | 94,722 | $ | 800,666 | $ | 400,534 | $ | 652,876 | $ | 779,382 | |||||||||
Oil and gas properties, net (2) (3) | $ | 5,210,698 | $ | 3,715,330 | $ | 3,241,530 | $ | 2,354,267 | $ | 2,741,282 | |||||||||
Goodwill (3) | $ | 716,865 | $ | 620,232 | $ | 620,232 | $ | 620,232 | $ | 620,232 | |||||||||
Total assets (2) | $ | 7,140,029 | $ | 6,062,084 | $ | 5,042,639 | $ | 4,237,724 | $ | 4,708,422 | |||||||||
Deferred income tax liability (asset) | $ | 338,424 | $ | 334,473 | $ | 101,618 | $ | (55,835 | ) | $ | 157,162 | ||||||||
Long-term obligations: | |||||||||||||||||||
Long-term debt (principal) (4) | $ | 2,000,000 | $ | 1,500,000 | $ | 1,500,000 | $ | 1,500,000 | $ | 1,500,000 | |||||||||
Operating and finance leases (5) | $ | 202,921 | $ | — | $ | — | $ | — | $ | — | |||||||||
Other | $ | 197,056 | $ | 200,564 | $ | 206,249 | $ | 184,444 | $ | 197,216 | |||||||||
Redeemable preferred stock (3) | $ | 81,620 | $ | — | $ | — | $ | — | $ | — | |||||||||
Stockholders’ equity | $ | 3,576,141 | $ | 3,329,786 | $ | 2,568,278 | $ | 2,042,989 | $ | 2,458,357 | |||||||||
Proved Reserves: | |||||||||||||||||||
Oil (MBbls) | 169,770 | 146,538 | 137,238 | 105,878 | 107,798 | ||||||||||||||
Gas (Bcf) | 1,532 | 1,591 | 1,608 | 1,471 | 1,517 | ||||||||||||||
NGL (MBbls) | 194,468 | 179,436 | 153,860 | 130,633 | 124,277 | ||||||||||||||
Total (MBOE) | 619,595 | 591,195 | 559,037 | 481,748 | 484,901 | ||||||||||||||
37
________________________________________
(1) | Effective January 1, 2018, we adopted the provisions of Accounting Standards Codification 606, Revenue from Contracts with Customers (“ASC 606”), utilizing the modified retrospective approach. Because we utilized the modified retrospective approach, there was no impact to prior periods’ reported amounts. Application of ASC 606 has no impact on our net income or cash flows from operations; however, certain costs classified as Transportation, processing, and other operating in the Consolidated Statements of Operations and Comprehensive Income (Loss) under prior accounting standards are now reflected as deductions from revenue. |
(2) | During 2019, 2016, and 2015, we recorded non-cash full cost ceiling test impairments of our oil and gas properties totaling $618.7 million, $757.7 million, and $4.03 billion, respectively. |
(3) | We acquired Resolute Energy Corporation on March 1, 2019. Consideration for this acquisition included $284.4 million in cash, net of cash acquired, and $81.6 million in redeemable preferred stock. The preliminary purchase price allocation included $1.72 billion to oil and gas properties and $96.6 million to goodwill. See Notes 2 and 13 to the Consolidated Financial Statements for further information regarding the redeemable preferred stock and acquisition. |
(4) | On March 8, 2019, we issued $500.0 million aggregate principal amount of 4.375% senior unsecured notes due March 15, 2029 at 99.862% of par to yield 4.392% per annum. See Note 3 to the Consolidated Financial Statements for further information regarding our debt. |
(5) | Effective January 1, 2019, we began accounting for leases in accordance with Accounting Standards Update 2016-02, Leases (“Topic 842”), which requires lessees to recognize lease liabilities and right-of-use assets on the balance sheet for contracts that provide lessees with the right to control the use of identified assets for periods of greater than 12 months. Prior to January 1, 2019, we accounted for leases in accordance with ASC Topic 840, Leases, under which operating leases were not recorded on the balance sheet. See Note 10 to the Consolidated Financial Statements for further information regarding our adoption of Topic 842. |
ITEM 7. MANAGEMENT’S DISCUSSION AND ANALYSIS OF FINANCIAL CONDITION AND RESULTS OF OPERATIONS
The following discussion and analysis should be read in conjunction with our Consolidated Financial Statements included in Item 8 of this report and also with RISK FACTORS in Item 1A of this report. This discussion also includes forward-looking statements. Refer to CAUTIONARY INFORMATION ABOUT FORWARD-LOOKING STATEMENTS in Part I of this report for important information about these types of statements. Discussion and analysis regarding 2019 and 2018 is provided below. For discussion and analysis regarding 2017, see Management’s Discussion and Analysis of Financial Condition and Results of Operations in our Annual Report on Form 10-K for the year ended December 31, 2018 as previously filed with the SEC.
OVERVIEW
Cimarex is an independent oil and gas exploration and production company. Our operations are entirely located in the United States, mainly in Texas, New Mexico, and Oklahoma. Currently our operations are focused in two main areas: the Permian Basin and the Mid-Continent. Our Permian Basin region encompasses west Texas and southeast New Mexico. Our Mid-Continent region consists of Oklahoma and the Texas Panhandle.
Our principal business objective is to increase shareholder value through the profitable long-term growth of our proved reserves and production while seeking to minimize our impact on the communities in which we operate for the long-term. Our strategy centers on maximizing cash flow from producing properties so that we can reinvest in exploration and development opportunities and provide cash returns to shareholders through dividends. We consider merger and acquisition opportunities that enhance our competitive position and we occasionally divest non-strategic assets.
On March 1, 2019, we completed the acquisition of Resolute Energy Corporation (“Resolute”), an independent oil and gas company focused on the acquisition and development of unconventional oil and gas properties in the Delaware Basin area of the Permian Basin of west Texas. The principal factors considered by management in making
38
this acquisition included: (i) our expectation that Resolute’s assets’ attractive returns are competitive with those in our existing portfolio, (ii) the opportunity to apply our experience and learnings from already operating in this area to generating productivity gains from Resolute’s properties, (iii) the ability to increase our acreage position in the Delaware Basin, and (iv) the expectation that the acquisition will be financially accretive. The acquisition date fair value of the consideration transferred totaled $820.3 million, which consisted of cash, common stock, and preferred stock (see Note 13 to the Consolidated Financial Statements for more information on the acquisition).
We believe that detailed technical analysis, operational focus, and a disciplined capital investment process mitigate risk and position us to continue to achieve profitable increases in proved reserves and production. Our drilling inventory and limited long-term commitments provide the flexibility to respond quickly to industry volatility. Our investments are generally funded with cash flow provided by operating activities together with cash on hand, bank borrowings, sales of non-strategic assets, and, from time to time, public financing based on our monitoring of capital markets and our balance sheet.
Market Conditions
The oil and gas industry is cyclical and commodity prices can fluctuate significantly. We expect this volatility to persist. Commodity prices are affected by many factors outside of our control, including changes in market supply and demand, inventory storage levels, weather conditions, and other factors. Local market prices for oil and gas can be impacted by pipeline capacity constraints limiting takeaway and increasing basis differentials.
As demonstrated in the table below, our company-wide average realized prices for 2019 as compared to 2018 have declined for all products. In the case of oil sales, these decreases result from a combination of declining NYMEX prices, partially offset by improving differentials. In the case of gas sales, these decreases are driven by declining NYMEX prices and widening differentials.
Years Ended December 31, | Variance Between 2019 / 2018 | |||||||||
2019 | 2018 | |||||||||
Average NYMEX price | ||||||||||
Oil — per barrel | $ | 57.03 | $ | 64.77 | (12)% | |||||
Gas — per Mcf | $ | 2.63 | $ | 3.09 | (15)% | |||||
Average realized price | ||||||||||
Oil — per barrel | $ | 52.77 | $ | 56.61 | (7)% | |||||
Gas — per Mcf | $ | 1.11 | $ | 1.99 | (44)% | |||||
NGL — per barrel | $ | 13.55 | $ | 22.28 | (39)% | |||||
Average price differential | ||||||||||
Oil — per barrel | $ | (4.26 | ) | $ | (8.16 | ) | 48% | |||
Gas — per Mcf | $ | (1.52 | ) | $ | (1.10 | ) | (38)% | |||
39
The average price differentials that we realized in our two primary areas of operation are shown in the table below for the periods indicated.
Average Price Differentials | ||||||||||||||||||||
Year | Fourth Quarter | Third Quarter | Second Quarter | First Quarter | ||||||||||||||||
2019 | ||||||||||||||||||||
Oil | ||||||||||||||||||||
Permian Basin | $ | (4.48 | ) | $ | (2.18 | ) | $ | (3.76 | ) | $ | (5.80 | ) | $ | (6.90 | ) | |||||
Mid-Continent | $ | (3.14 | ) | $ | (2.05 | ) | $ | (3.72 | ) | $ | (4.39 | ) | $ | (2.17 | ) | |||||
Total Company | $ | (4.26 | ) | $ | (2.16 | ) | $ | (3.74 | ) | $ | (5.58 | ) | $ | (6.03 | ) | |||||
Gas | ||||||||||||||||||||
Permian Basin | $ | (2.14 | ) | $ | (1.67 | ) | $ | (1.83 | ) | $ | (3.10 | ) | $ | (1.91 | ) | |||||
Mid-Continent | $ | (0.68 | ) | $ | (0.74 | ) | $ | (0.66 | ) | $ | (0.86 | ) | $ | (0.46 | ) | |||||
Total Company | $ | (1.52 | ) | $ | (1.31 | ) | $ | (1.35 | ) | $ | (2.14 | ) | $ | (1.24 | ) | |||||
2018 | ||||||||||||||||||||
Oil | ||||||||||||||||||||
Permian Basin | $ | (9.82 | ) | $ | (11.64 | ) | $ | (14.34 | ) | $ | (8.05 | ) | $ | (3.12 | ) | |||||
Mid-Continent | $ | (2.46 | ) | $ | (2.33 | ) | $ | (1.08 | ) | $ | (2.18 | ) | $ | (2.34 | ) | |||||
Total Company | $ | (8.16 | ) | $ | (9.51 | ) | $ | (11.25 | ) | $ | (6.89 | ) | $ | (2.94 | ) | |||||
Gas | ||||||||||||||||||||
Permian Basin | $ | (1.40 | ) | $ | (2.21 | ) | $ | (1.25 | ) | $ | (1.31 | ) | $ | (0.78 | ) | |||||
Mid-Continent | $ | (0.86 | ) | $ | (0.83 | ) | $ | (0.94 | ) | $ | (1.03 | ) | $ | (0.70 | ) | |||||
Total Company | $ | (1.10 | ) | $ | (1.49 | ) | $ | (1.07 | ) | $ | (1.15 | ) | $ | (0.73 | ) | |||||
Pipeline expansion projects in the Permian Basin are expected to ease capacity constraints as they come online over the next few years, which is reflected in the current futures markets that show narrowing differentials. However, if pipeline constraints remain because expansion projects are delayed or canceled, production increases faster than capacity increases, pipeline disruptions, or other reasons, higher differentials will persist or potentially worsen. Our revenue, profitability, and future growth are highly dependent on the prices we receive for our oil and gas production and can be adversely affected by realized price decreases. See RESULTS OF OPERATIONS Revenues below for further information regarding our realized commodity prices.
40
Summary of Operating and Financial Results for the year ended December 31, 2019 as compared to the year ended December 31, 2018
• | Completed the acquisition of Resolute Energy Corporation. Resolute’s results are included in our financial statements since the March 1, 2019 closing date. |
• | Total daily production volumes increased 25% to 278.5 MBOE per day. |
• | Oil volumes increased 27% to 86.2 MBbls per day. |
• | Gas volumes increased 22% to 689.2 MMcf per day. |
• | NGL volumes increased 28% to 77.4 MBbls per day. |
• | Total production revenue increased 1% to $2.32 billion. |
• | Year-end proved reserves increased 5% to 619.6 MMBOE, as compared to 591.2 MMBOE at year-end 2018. |
• | Exploration and development capital investments were $1.24 billion, as compared to $1.57 billion in 2018. |
• | Cash flow provided by operating activities decreased 13% to $1.34 billion. |
• | Generated a net loss of $124.6 million ($1.33 per diluted share) as compared to net income of $791.9 million ($8.32 per diluted share) in 2018. |
Further discussion of these results is provided below.
Proved Reserves
Our proved reserves by region at December 31, 2019 and 2018 were as follows:
December 31, 2019 | |||||||||||
Gas (MMcf) | Oil (MBbls) | NGL (MBbls) | Total (MBOE) | ||||||||
Permian Basin | 870,208 | 147,662 | 130,007 | 422,703 | |||||||
Mid-Continent | 660,161 | 21,848 | 64,377 | 196,252 | |||||||
Other | 1,776 | 260 | 84 | 640 | |||||||
Total | 1,532,145 | 169,770 | 194,468 | 619,595 | |||||||
December 31, 2018 | |||||||||||
Gas (MMcf) | Oil (MBbls) | NGL (MBbls) | Total (MBOE) | ||||||||
Permian Basin | 727,985 | 116,378 | 96,533 | 334,241 | |||||||
Mid-Continent | 861,440 | 29,908 | 82,826 | 256,307 | |||||||
Other | 1,896 | 252 | 77 | 647 | |||||||
Total | 1,591,321 | 146,538 | 179,436 | 591,195 | |||||||
41
Year-end 2019 proved reserves increased approximately 5% to 619.6 MMBOE, compared to 591.2 MMBOE at year-end 2018. Proved gas reserves were 1.53 Tcf, proved oil reserves were 169.8 MMBbls, and proved NGL reserves were 194.5 MMBbls. Reserves in the Permian Basin accounted for 68% of our total proved reserves with nearly all of the remainder in our Mid-Continent region. See SUPPLEMENTAL INFORMATION ON OIL AND GAS PRODUCING ACTIVITIES (UNAUDITED) in Item 8 for a more detailed discussion regarding year-over-year changes in our proved reserves.
The process of estimating quantities of oil, gas, and NGL reserves is complex. Significant decisions are required in the evaluation of all available geological, geophysical, engineering, and economic data. Although every reasonable effort is made to ensure that our reserve estimates represent the most accurate assessments possible, subjective decisions and available data for our various fields make these estimates generally less precise than other estimates included in financial statement disclosures. See Proved Reserves Estimation Procedures in Items 1 and 2 for a discussion of our reserve estimation process and Item 1A RISK FACTORS, which includes a discussion of factors that affect our proved reserves estimates.
RESULTS OF OPERATIONS
Revenues
Our revenues are derived from sales of our oil, gas, and NGL production. Increases or decreases in our revenues, profitability, and future production growth are highly dependent on the commodity prices we receive. Prices are market driven and we expect that future prices will continue to fluctuate due to supply and demand factors, availability of transportation, seasonality, geopolitical, and economic factors. See Item 7A QUANTITATIVE AND QUALITATIVE DISCLOSURES ABOUT MARKET RISK for more information regarding the sensitivity of our revenues to price fluctuations.
Production volumes were higher for all products during the year ended December 31, 2019 as compared to the year ended December 31, 2018, while realized prices were lower. Our acquisition of Resolute and ongoing completion of new wells have increased our volumes. Lower market prices, which are out of our control, have negatively impacted our realized prices. The increase in production volumes, as well as the increase in our fourth quarter 2019 realized oil prices due to narrowing basis differentials, was enough to overcome the lower annual realized prices, particularly gas and NGL prices, to cause our overall production revenues to increase by $24.3 million, or 1%, from prior year. The following table shows our production revenues for 2019 and 2018 as well as the change in revenues due to changes in prices and volumes.
Years Ended December 31, | Price / Volume Variance | ||||||||||||||||||||||||||
Production Revenue (in thousands) | 2019 | 2018 | Variance Between 2019 / 2018 | Price | Volume | Total | |||||||||||||||||||||
Oil sales | $ | 1,660,210 | $ | 1,398,813 | $ | 261,397 | 19 | % | $ | (120,819 | ) | $ | 382,216 | $ | 261,397 | ||||||||||||
Gas sales | 278,776 | 408,751 | (129,975 | ) | (32 | )% | (221,379 | ) | 91,404 | (129,975 | ) | ||||||||||||||||
NGL sales | 382,935 | 490,081 | (107,146 | ) | (22 | )% | (246,658 | ) | 139,512 | (107,146 | ) | ||||||||||||||||
$ | 2,321,921 | $ | 2,297,645 | $ | 24,276 | 1 | % | $ | (588,856 | ) | $ | 613,132 | $ | 24,276 | |||||||||||||
42
The table below presents our production volumes by commodity, our average realized commodity prices, and certain major U.S. index prices. The sale of our Permian Basin oil production is typically tied to the WTI Midland benchmark price and the sale of our Mid-Continent oil production is typically tied to the WTI Cushing benchmark price. During 2019 and 2018, 84% and 77%, respectively, of our oil production was in the Permian Basin with the majority of the remainder in the Mid-Continent region. Our realized prices do not include settlements of commodity derivative contracts.
Years Ended December 31, | Variance Between 2019 / 2018 | ||||||||||||||
2019 | 2018 | ||||||||||||||
Oil | |||||||||||||||
Total volume — MBbls | 31,463 | 24,710 | 6,753 | 27 | % | ||||||||||
Total volume — MBbls per day | 86.2 | 67.7 | 18.5 | 27 | % | ||||||||||
Percentage of total production | 31 | % | 31 | % | |||||||||||
Average realized price — per barrel | $ | 52.77 | $ | 56.61 | $ | (3.84 | ) | (7 | )% | ||||||
Average WTI Midland price — per barrel | $ | 55.53 | $ | 58.31 | $ | (2.78 | ) | (5 | )% | ||||||
Average WTI Cushing price — per barrel | $ | 57.03 | $ | 64.77 | $ | (7.74 | ) | (12 | )% | ||||||
Gas | |||||||||||||||
Total volume — MMcf | 251,567 | 205,837 | 45,730 | 22 | % | ||||||||||
Total volume — MMcf per day | 689.2 | 563.9 | 125.3 | 22 | % | ||||||||||
Percentage of total production | 41 | % | 42 | % | |||||||||||
Average realized price — per Mcf | $ | 1.11 | $ | 1.99 | $ | (0.88 | ) | (44 | )% | ||||||
Average Henry Hub price — per Mcf | $ | 2.63 | $ | 3.09 | $ | (0.46 | ) | (15 | )% | ||||||
NGL | |||||||||||||||
Total volume — MBbls | 28,254 | 21,994 | 6,260 | 28 | % | ||||||||||
Total volume — MBbls per day | 77.4 | 60.3 | 17.1 | 28 | % | ||||||||||
Percentage of total production | 28 | % | 27 | % | |||||||||||
Average realized price — per barrel | $ | 13.55 | $ | 22.28 | $ | (8.73 | ) | (39 | )% | ||||||
Total | |||||||||||||||
Total production — MBOE | 101,645 | 81,010 | 20,635 | 25 | % | ||||||||||
Total production — MBOE per day | 278.5 | 221.9 | 56.6 | 25 | % | ||||||||||
Average realized price — per BOE | $ | 22.84 | $ | 28.36 | $ | (5.52 | ) | (19 | )% | ||||||
Our 2019 daily production volumes were 278.5 MBOE, a 25% increase from 2018. This increase is the result of the Resolute acquisition as well as drilling and completion activity during 2019. See Production Volumes, Prices, and Costs and Exploration and Development Overview in Items 1 and 2 of this report for production information by region and a discussion of our drilling activities.
43
Other Revenues
We transport, process, and market some third-party gas that is associated with our equity gas. We market and sell gas for other working interest owners under short term agreements and may earn a fee for such services. The table below reflects revenues from third-party gas gathering and processing and our net marketing margin for marketing third-party gas.
Years Ended December 31, | Variance Between 2019 / 2018 | |||||||||||
Gas Gathering and Marketing Revenues (in thousands): | 2019 | 2018 | ||||||||||
Gas gathering and other | $ | 42,454 | $ | 41,180 | $ | 1,274 | ||||||
Gas marketing | $ | (1,406 | ) | $ | 192 | $ | (1,598 | ) | ||||
Fluctuations in revenues from gas gathering and gas marketing activities are a function of increases and decreases in volumes, commodity prices, and gathering rate charges.
Operating Costs and Expenses
Costs associated with producing oil and gas are substantial. Among other factors, some of these costs vary with commodity prices, some trend with the volume of production, some are a function of the number of wells we own, some depend on the prices charged by service companies, and some fluctuate based on a combination of the foregoing.
Total operating costs and expenses of $2.48 billion in 2019 were 92% higher than the $1.29 billion incurred in 2018. The primary reasons for the increase were : (i) the $618.7 million ceiling test impairment incurred in 2019, (ii) the $291.7 million increase in depreciation, depletion, and amortization, and (iii) the $162.8 million increase in losses on derivative instruments. The following table shows our operating costs and expenses for the years indicated and a discussion of year-over-year differences follows.
Years Ended December 31, | Variance Between 2019 / 2018 | Per BOE | ||||||||||||||||||
Operating Costs and Expenses (in thousands, except per BOE) | 2019 | 2018 | 2019 | 2018 | ||||||||||||||||
Impairment of oil and gas properties | $ | 618,693 | $ | — | $ | 618,693 | N/A | N/A | ||||||||||||
Depreciation, depletion, and amortization | 882,173 | 590,473 | 291,700 | $ | 8.68 | $ | 7.29 | |||||||||||||
Asset retirement obligation | 8,586 | 7,142 | 1,444 | $ | 0.08 | $ | 0.09 | |||||||||||||
Production (1) | 339,941 | 296,189 | 43,752 | $ | 3.34 | $ | 3.66 | |||||||||||||
Transportation, processing, and other operating (1) | 238,259 | 211,463 | 26,796 | $ | 2.34 | $ | 2.61 | |||||||||||||
Gas gathering and other (1) | 23,294 | 28,327 | (5,033 | ) | $ | 0.23 | $ | 0.35 | ||||||||||||
Taxes other than income | 148,953 | 125,169 | 23,784 | $ | 1.47 | $ | 1.55 | |||||||||||||
General and administrative | 95,843 | 77,843 | 18,000 | $ | 0.94 | $ | 0.96 | |||||||||||||
Stock compensation | 26,398 | 22,895 | 3,503 | $ | 0.26 | $ | 0.28 | |||||||||||||
Loss (gain) on derivative instruments, net | 76,850 | (85,959 | ) | 162,809 | N/A | N/A | ||||||||||||||
Other operating expense, net | 19,305 | 18,507 | 798 | N/A | N/A | |||||||||||||||
$ | 2,478,295 | $ | 1,292,049 | $ | 1,186,246 | |||||||||||||||
________________________________________
(1) | In order to conform with the 2019 presentation, the 2018 amount presented reflects the reclassification of certain Gas gathering and other expenses to Transportation, processing, and other operating expenses and Production expense. These reclassifications were made to reflect an allocation of the costs incurred to operate our gas gathering facilities as a cost to transport our equity share of gas produced and operate our wells. See Note 1 to the Consolidated Financial Statements for further information regarding these prior year reclassifications. |
44
Impairment of Oil and Gas Properties
We use the full cost method of accounting for our oil and gas operations. Under this method, we are required to perform quarterly ceiling test calculations to test our oil and gas properties for possible impairment. If the net capitalized cost of our oil and gas properties, as adjusted for income taxes, exceeds the ceiling limitation, the excess is charged to expense. The ceiling limitation is equal to the sum of: (i) the present value discounted at 10% of estimated future net revenues from proved reserves, (ii) the cost of properties not being amortized, and (iii) the lower of cost or estimated fair value of unproven properties included in the costs being amortized, as adjusted for income taxes. We currently do not have any unproven properties that are being amortized. Estimated future net revenues are determined based on trailing twelve-month average commodity prices and estimated proved reserve quantities, operating costs, and capital expenditures.
The quarterly ceiling test is primarily impacted by commodity prices, changes in estimated reserve quantities, reserves produced, overall exploration and development costs, depletion expense, and deferred taxes. If pricing conditions decline, or if there is a negative impact on one or more of the other components of the calculation, we may incur a full cost ceiling test impairment. The calculated ceiling limitation is not intended to be indicative of the fair market value of our proved reserves or future results. Impairment charges do not affect cash flow from operating activities, but do adversely affect our net income and various components of our balance sheet. Any impairment of oil and gas properties is not reversible at a later date.
During 2019, we recognized a ceiling test impairment of $618.7 million. The impairment resulted primarily from the impact of decreases in the 12-month average trailing prices for oil, natural gas, and NGLs as well as significant basis differentials utilized in determining the estimated future net cash flows from proved reserves. It is likely that we will incur another ceiling test impairment in the first quarter 2020 and we may recognize additional ceiling test impairments in the future.
Depreciation, Depletion, and Amortization
Depletion of our producing properties is computed using the units-of-production method. The economic life of each producing well depends upon the estimated proved reserves for that well, which in turn depend upon the assumed realized sales price for future production. Therefore, fluctuations in oil and gas prices will impact the level of proved reserves used in the calculation. Higher prices generally have the effect of increasing reserves, which reduces depletion expense. Conversely, lower prices generally have the effect of decreasing reserves, which increases depletion expense. The cost of replacing production also impacts our depletion expense. In addition, changes in estimates of reserve quantities, estimates of operating and future development costs, reclassifications of properties from unproved to proved, and impairments of oil and gas properties will also impact depletion expense. Our net proved properties, production, and reserves have increased during 2019 as compared to 2018 due to our ongoing exploration and development activities as well as due to our acquisition of Resolute. The increase in net properties and production resulted in an overall increase in depletion expense, while the increase in reserves partially offset the increased expense.
45
Fixed assets consist primarily of gathering and plant facilities, vehicles, airplanes, office furniture, and computer equipment and software. These items are recorded at cost and are depreciated on the straight-line method based on expected lives of the individual assets, which range from 3 to 30 years. Additionally, with the adoption of Topic 842, we depreciate our right-of-use assets, with the depreciation of our finance lease gathering system right-of-use asset being included in our depreciation expense. The increase in depreciation expense during 2019 as compared to 2018 is primarily due to: (i) increased depreciation on our gathering and plant facilities due to ongoing expenditures on this infrastructure and (ii) the depreciation on our gathering system right-of-use asset. Depreciation, depletion, and amortization (“DD&A”) consisted of the following for the periods indicated:
Years Ended December 31, | Variance Between 2019 / 2018 | Per BOE | ||||||||||||||||||
DD&A Expense (in thousands, except per BOE) | 2019 | 2018 | 2019 | 2018 | ||||||||||||||||
Depletion | $ | 817,099 | $ | 538,919 | $ | 278,180 | $ | 8.04 | $ | 6.65 | ||||||||||
Depreciation | 65,074 | 51,554 | 13,520 | 0.64 | 0.64 | |||||||||||||||
$ | 882,173 | $ | 590,473 | $ | 291,700 | $ | 8.68 | $ | 7.29 | |||||||||||
Asset Retirement Obligation
Asset retirement obligation expense is typically primarily comprised of accretion expense. In periods subsequent to the initial measurement of an asset retirement obligation liability at present value, a period-to-period increase in the carrying amount of the liability is recognized as accretion expense, which represents the effect of the passage of time on the amount of the liability. An equivalent amount is added to the carrying amount of the liability. Also included in asset retirement obligation expense are gains and losses recognized on the settlement of asset retirement obligation liabilities.
Production
Production expense generally consists of costs for labor, equipment, maintenance, saltwater disposal, compression, power, treating, and miscellaneous other costs (lease operating expense). Production expense also includes well workover activity necessary to maintain production from existing wells. Production expense consisted of lease operating expense and workover expense as follows:
Years Ended December 31, | Variance Between 2019 / 2018 | Per BOE | ||||||||||||||||||
Production Expense (in thousands, except per BOE) | 2019 | 2018 | 2019 | 2018 | ||||||||||||||||
Lease operating expense | $ | 273,092 | $ | 244,861 | $ | 28,231 | $ | 2.68 | $ | 3.03 | ||||||||||
Workover expense | 66,849 | 51,328 | 15,521 | 0.66 | 0.63 | |||||||||||||||
$ | 339,941 | $ | 296,189 | $ | 43,752 | $ | 3.34 | $ | 3.66 | |||||||||||
On an absolute dollar basis, lease operating expense increased 12%, or $28.2 million, in 2019 compared to 2018. The increases have primarily stemmed from the Resolute acquisition and the addition of new wells as a result of our ongoing exploration and development activities. These increases were partially offset by expense reductions related to the sale of non-strategic properties principally located in Ward County, Texas in August 2018. The majority of the increase in lease operating expense is due to increases in water disposal and electricity costs. On a per BOE basis, lease operating expense decreased 12% as a result of our production growing at a faster rate than increases in our lease operating expense.
Workover expense increased 30%, or $15.5 million, during 2019 as compared to 2018. We had an increased number of workover projects contributing to our workover expense during 2019 as compared to 2018. The following types of expenses have been the primary drivers of increased expense in 2019 as compared to 2018: (i) surface equipment maintenance and repair, (ii) lift, which includes changing lift types or repairing/replacing lift equipment, and (iii) major
46
well work, which can include replacing tubing, casing repair, cleanouts, and fishing. During 2018, our workover expense was reduced due to receiving approximately $4.0 million in insurance proceeds related to the remediation and repairs incurred as a result of a 2015 flooding event.
Transportation, Processing, and Other Operating
Transportation, processing, and other operating costs principally consist of expenditures to prepare and transport production from the wellhead, including gathering, fuel, compression, and processing costs. Costs vary by region and will fluctuate with increases or decreases in production volumes, contractual fees, and changes in fuel and compression costs.
If the sales contract transfers control of the product at the wellhead, transportation and processing costs are included as a reduction in the revenue we record and are not included in transportation, processing, and other operating costs. The largest sales contract that we acquired with Resolute is structured this way and sales volumes under legacy Cimarex contracts structured this way have increased, therefore, our transportation and processing costs have not increased commensurate with production volume increases. Transportation, processing, and other operating costs in 2019 were 13%, or $26.8 million, higher than in 2018; however, on a per BOE basis, such costs have decreased 10% to $2.34 in 2019 from $2.61 in 2018.
Gas Gathering and Other
Gas gathering and other includes costs associated with operating our gas gathering and processing infrastructure, including product costs and operating and maintenance expenses. A portion of these costs are reclassified to Transportation, processing, and other expense and Production expense in order to reflect an allocation of the costs incurred to operate our gas gathering facilities as a cost of transporting our equity share of gas produced and operating our wells. Gas gathering and other in 2019 was 18%, or $5.0 million, lower than in 2018. The decrease was primarily due to an increase in compression costs in 2019 offset by a lower amount reclassified to Transportation, processing, and other expense in 2018.
Taxes Other than Income
Taxes other than income consist of production (or severance) taxes, ad valorem taxes, and other taxes. State and local taxing authorities assess these taxes, with production taxes being based on the volume or value of production and ad valorem taxes being based on the value of properties.
Years Ended December 31, | Variance Between 2019 / 2018 | |||||||||||
Taxes Other than Income (in thousands) | 2019 | 2018 | ||||||||||
Production | $ | 111,819 | $ | 105,014 | $ | 6,805 | ||||||
Ad valorem | 36,291 | 19,459 | 16,832 | |||||||||
Other | 843 | 696 | 147 | |||||||||
$ | 148,953 | $ | 125,169 | $ | 23,784 | |||||||
Taxes other than income as a percentage of production revenue | 6.4 | % | 5.4 | % | ||||||||
Taxes other than income increased 19%, or $23.8 million, in 2019 as compared to 2018. Production taxes make up the majority of our taxes other than income and they increased primarily due to: (i) decreased refunds, which are generally for high-cost gas wells in Texas, but also include marketing cost deduction refunds and (ii) increased production volumes. The largest increase in our taxes other than income was due to increased ad valorem taxes primarily as a result of the Resolute acquisition and increased assessed values. Other taxes other than income are comprised of franchise and consumer use and sales taxes.
47
General and Administrative
General and administrative (“G&A”) expense consists primarily of salaries and related benefits, office rent, legal and consulting fees, systems costs, and other administrative costs incurred. Our G&A expense is reported net of amounts reimbursed to us by working interest owners of the oil and gas properties we operate and net of amounts capitalized pursuant to the full cost method of accounting. The amount of expense capitalized varies and depends on whether the cost incurred can be directly identified with acquisition, exploration, and development activities. The percentage of gross G&A capitalized was 44% and 48% during 2019 and 2018, respectively. The table below shows our G&A costs.
Years Ended December 31, | Variance Between 2019 / 2018 | |||||||||||
General and Administrative Expense (in thousands): | 2019 | 2018 | ||||||||||
Gross G&A | $ | 170,757 | $ | 149,820 | $ | 20,937 | ||||||
Less amounts capitalized to oil and gas properties | (74,914 | ) | (71,977 | ) | (2,937 | ) | ||||||
G&A expense | $ | 95,843 | $ | 77,843 | $ | 18,000 | ||||||
G&A expense increased 23%, or $18.0 million, in 2019 as compared to 2018 primarily due to increased employee-related costs such as salaries and wages, other compensation, and benefits. Included in 2019 was $3.1 million of severance expense related to former Resolute employees who performed transition work at Cimarex and were subsequently terminated. During the first quarter of 2020, we accepted volunteers to participate in an early retirement incentive program. As a result of this program, we expect to incur an aggregate of approximately $10.5 million in severance expense over the course of 2020 into early 2021. Going forward, these departures are expected to result in lower employee-related G&A costs.
Stock Compensation
Stock compensation expense consists of non-cash charges resulting from the amortization of the cost of restricted stock and stock option awards, net of amounts capitalized to oil and gas properties. We have recognized stock-based compensation cost as follows:
Years Ended December 31, | Variance Between 2019 / 2018 | |||||||||||
Stock Compensation Expense (in thousands): | 2019 | 2018 | ||||||||||
Restricted stock awards: | ||||||||||||
Performance stock awards | $ | 21,590 | $ | 23,083 | $ | (1,493 | ) | |||||
Service-based stock awards | 25,611 | 20,385 | 5,226 | |||||||||
47,201 | 43,468 | 3,733 | ||||||||||
Stock option awards | 1,903 | 2,456 | (553 | ) | ||||||||
Total stock compensation cost | 49,104 | 45,924 | 3,180 | |||||||||
Less amounts capitalized to oil and gas properties | (22,706 | ) | (23,029 | ) | 323 | |||||||
Stock compensation expense | $ | 26,398 | $ | 22,895 | $ | 3,503 | ||||||
Periodic stock compensation expense will fluctuate based on the grant date fair value of awards, the number of awards, the requisite service period of the awards, employee forfeitures, and the timing of the awards. The increase in total stock compensation cost in 2019 as compared to 2018 is primarily due to performance stock award forfeitures that occurred during 2018 as well as due to expense on awards granted during the periods more than offsetting the expense on awards that vested during the periods. Our accounting policy is to account for forfeitures in compensation cost when they occur, therefore, all the previously recognized expense on the forfeited award is reversed at the time of forfeiture. During the first quarter of 2020, we accepted volunteers to participate in an early retirement incentive
48
program, which includes the cash settlement of certain service-based stock awards and accelerated vesting of certain stock option awards. At this time, the effect of this program on future stock compensation expense is not determinable.
Loss (Gain) on Derivative Instruments, Net
Net gains and losses on our derivative instruments are a function of fluctuations in the underlying commodity index prices as compared to the contracted prices and the monthly cash settlements (if any) of the instruments. We have elected not to designate our derivatives as hedging instruments for accounting purposes and, therefore, we do not apply hedge accounting treatment to our derivative instruments. Consequently, changes in the fair value of our derivative instruments and cash settlements on the instruments are included as a component of operating costs and expenses as either a net gain or loss on derivative instruments. Cash settlements of our contracts are included in cash flows from operating activities in our statements of cash flows. The following table presents the components of Loss (gain) on derivative instruments, net for the years indicated. See Note 4 to the Consolidated Financial Statements for additional information regarding our derivative instruments.
Years Ended December 31, | Variance Between 2019 / 2018 | |||||||||||
Loss (Gain) on Derivative Instruments, Net (in thousands): | 2019 | 2018 | ||||||||||
Decrease (increase) in fair value of derivative instruments, net: | ||||||||||||
Gas contracts | $ | (13,114 | ) | $ | 15,742 | $ | (28,856 | ) | ||||
Oil contracts | 76,833 | (126,130 | ) | 202,963 | ||||||||
63,719 | (110,388 | ) | 174,107 | |||||||||
Cash payments (receipts) on derivative instruments, net: | ||||||||||||
Gas contracts | (40,114 | ) | (13,794 | ) | (26,320 | ) | ||||||
Oil contracts | 53,245 | 38,223 | 15,022 | |||||||||
13,131 | 24,429 | (11,298 | ) | |||||||||
Loss (gain) on derivative instruments, net | $ | 76,850 | $ | (85,959 | ) | $ | 162,809 | |||||
Other Operating Expense, Net
Other operating expense, net increased $0.8 million in 2019 as compared to 2018. This expense is comprised primarily of litigation settlements, acquisition-related costs, and allowance for doubtful accounts adjustments. Other operating expense, net in 2019 and 2018 included $10.0 million and $14.9 million, respectively in litigation settlements. Other operating expense, net in 2019 and 2018 included $8.4 million and $3.0 million, respectively, in acquisition-related costs incurred to effect the Resolute acquisition. The acquisition-related costs consisted primarily of advisory and legal fees.
49
Other Income and Expense
Years Ended December 31, | Variance Between 2019 / 2018 | |||||||||||
Other Income and Expense (in thousands): | 2019 | 2018 | ||||||||||
Interest expense | $ | 93,386 | $ | 68,224 | $ | 25,162 | ||||||
Capitalized interest | (56,232 | ) | (20,855 | ) | (35,377 | ) | ||||||
Loss on early extinguishment of debt | 4,250 | — | 4,250 | |||||||||
Other, net | (5,741 | ) | (22,908 | ) | 17,167 | |||||||
$ | 35,663 | $ | 24,461 | $ | 11,202 | |||||||
The majority of our interest expense relates to interest on our senior unsecured notes. Also included in interest expense is interest expense on our Credit Facility borrowings, the amortization of debt issuance costs and discounts, and miscellaneous interest expense. See LIQUIDITY AND CAPITAL RESOURCES Long-Term Debt below for further information regarding our debt. The increase in interest expense in 2019 as compared to 2018 is primarily due to (i) the March 8, 2019 issuance of $500 million aggregate principal amount of 4.375% senior unsecured notes due March 15, 2029 at 99.862% of par to yield 4.392% per annum, (ii) borrowings on our Credit Facility in 2019 to help fund the Resolute acquisition and thereafter to meet cash requirements as needed (we did not borrow on our Credit Facility in 2018), (iii) miscellaneous interest expense (primarily interest on revenues released from suspense), and (iv) interest expense on our finance lease. The $4.3 million loss on early extinguishment of debt incurred during 2019 was associated with the $600 million of 8.5% senior notes we acquired with Resolute and elected to immediately repay. The maturity date of the Resolute notes was May 1, 2020.
We capitalize interest on non-producing leasehold costs, the in-progress costs of drilling and completing wells, and constructing midstream assets. Capitalized interest will fluctuate based primarily on the amount of costs subject to interest capitalization and based on the rates applicable to borrowings outstanding during the period. The amount of costs subject to interest capitalization was higher in 2019 as compared to 2018, primarily due to the Resolute acquisition. Included in the preliminary purchase price allocation of the Resolute acquisition was non-producing leasehold costs of $1.02 billion.
Other, net includes interest income of $3.3 million and $11.1 million in 2019 and 2018, respectively. The decrease in interest income in 2019 is primarily due to the cash expended for the Resolute acquisition, which included $325.7 million in cash consideration and the repayment of $870.0 million in principal amount of Resolute’s long-term debt existing at the acquisition date. This decreased our investable cash balance post-acquisition, thus lowering our interest income. Other components of Other, net include miscellaneous income and expense items that vary from period to period, including gain or loss related to the sale or value of oil and gas well equipment and supplies, gain or loss on miscellaneous fixed asset sales, and income and expense associated with other non-operating activities.
50
Income Tax (Benefit) Expense
The components of our provision for income taxes and our combined federal and state effective income tax rates were as follows:
Years Ended December 31, | Variance Between 2019 / 2018 | |||||||||||
Income Tax (Benefit) Expense (in thousands): | 2019 | 2018 | ||||||||||
Current tax expense (benefit) | $ | 532 | $ | (2,624 | ) | $ | 3,156 | |||||
Deferred tax (benefit) expense | (26,902 | ) | 233,280 | (260,182 | ) | |||||||
$ | (26,370 | ) | $ | 230,656 | $ | (257,026 | ) | |||||
Combined federal and state effective income tax rate | 17.5 | % | 22.6 | % | ||||||||
Our combined federal and state effective tax rates, as shown above, differ from the statutory rate primarily due to state income taxes and non-deductible expenses. See Note 9 to the Consolidated Financial Statements for further information regarding our income taxes.
LIQUIDITY AND CAPITAL RESOURCES
Overview
We strive to maintain an adequate liquidity level to address volatility and risk. Sources of liquidity include our cash flow from operations, cash on hand, available borrowing capacity under our revolving credit facility, proceeds from sales of non-strategic assets, and, from time to time, public financings based on our monitoring of capital markets and our balance sheet.
Our liquidity is highly dependent on prices we receive for the oil, gas, and NGLs we produce. Prices we receive are determined by prevailing market conditions and greatly influence our revenue, cash flow, profitability, access to capital, and future rate of growth. See RESULTS OF OPERATIONS Revenues above for further information regarding the impact realized prices have had on our 2019 earnings.
We address volatility in commodity prices primarily by maintaining flexibility in our capital investment program. We have a balanced and abundant drilling inventory and limited long-term commitments, which enables us to respond quickly to industry volatility. Based on current economic conditions, our 2020 total capital expenditures are projected to range from $1.25 billion to $1.35 billion. See Capital Expenditures below for information regarding our 2019 capital expenditures and our projected 2020 expenditures.
We periodically use derivative instruments to mitigate volatility in commodity prices. At December 31, 2019, we had derivative contracts covering a portion of our 2020 and 2021 production. Depending on changes in oil and gas futures markets and management’s view of underlying supply and demand trends, we may increase or decrease our derivative positions from current levels. See Note 4 to the Consolidated Financial Statements for information regarding our derivative instruments.
Cash and cash equivalents at December 31, 2019 were $94.7 million. At December 31, 2019, our long-term debt consisted of $2.00 billion of senior unsecured notes, with $750 million 4.375% notes due in 2024, $750 million 3.90% notes due in 2027, and $500 million 4.375% due in 2029. At December 31, 2019, we had no borrowings and $2.5 million in letters of credit outstanding under our credit facility, leaving an unused borrowing availability of $1.248 billion. See Long-Term Debt below for more information regarding our debt.
51
Our debt to total capitalization ratio at December 31, 2019 was 37%, up from 31% at December 31, 2018. This ratio is calculated by dividing the sum of (i) the principal amount of long-term debt and (ii) redeemable preferred stock by the sum of (i) the principal amount of long-term debt, (ii) redeemable preferred stock, and (iii) total stockholders’ equity, with all numbers coming directly from the Consolidated Balance Sheet. Management uses this ratio as one indicator of our financial condition and believes professional research analysts and rating agencies use this ratio for this purpose and to compare our financial condition to other companies’ financial conditions.
We may, from time to time, seek to repurchase our outstanding redeemable preferred stock through cash repurchases and/or exchanges for equity securities, privately negotiated transactions, or otherwise. Such activities, if any, will depend on prevailing market conditions, our liquidity requirements, contractual restrictions, and other factors. See Note 2 to the Consolidated Financial Statements for information regarding our redeemable preferred stock.
We expect our operating cash flow and other capital resources to be adequate to meet our needs for planned capital expenditures, working capital, debt service, and dividends declared for the next twelve months.
Analysis of Cash Flow Changes
The following table presents the totals of the major cash flow classification categories from our Consolidated Statements of Cash Flows for the periods indicated.
Years Ended December 31, | ||||||||
(in thousands) | 2019 | 2018 | ||||||
Net cash provided by operating activities | $ | 1,343,966 | $ | 1,550,994 | ||||
Net cash used by investing activities | $ | (1,577,882 | ) | $ | (1,085,618 | ) | ||
Net cash used by financing activities | $ | (472,028 | ) | $ | (65,244 | ) | ||
Net cash provided by operating activities in 2019 was $1.34 billion, down $207.0 million, or 13%, from $1.55 billion in 2018. The decrease resulted primarily from an increased investment in working capital, primarily related to the repayment of liabilities assumed from Resolute, and increased operating expenses in 2019 as compared to 2018. Partially offsetting this decrease in operating cash flows was an increase due to increased revenues, primarily due to increased production volumes, and a decrease in cash outflows for settlements of derivative instruments. See RESULTS OF OPERATIONS above for more information regarding the changes in revenue and operating expenses.
Net cash used by investing activities was $1.58 billion and $1.09 billion in 2019 and 2018, respectively. The majority of our cash flows used by investing activities are for oil and gas capital expenditures, which, as reflected in the statements of cash flows, were $1.25 billion and $1.57 billion in 2019 and 2018, respectively. Net cash used by investing activities in 2019 included the $325.7 million cash portion of the consideration paid for the Resolute acquisition, net of the $41.2 million in cash acquired with Resolute. Net cash used by investing activities in 2018 included $534.6 million in net cash proceeds from the sale of oil and gas properties principally located in Ward County, Texas. Net cash proceeds from other asset sales in 2019 and 2018 totaled $30.0 million and $49.9 million, respectively. These asset sales are primarily for the divestiture of non-strategic oil and gas properties. Our other capital expenditures, which are primarily for our midstream assets, were $73.7 million and $103.5 million in 2019 and 2018, respectively.
Net cash used by financing activities was $472.0 million and $65.2 million in 2019 and 2018, respectively. During 2019, we issued $500 million aggregate principal amount of 4.375% senior unsecured notes due March 15, 2029 at 99.862% of par for proceeds of $499.3 million, paying $4.6 million in underwriting fees and financing costs. Additionally, we borrowed and repaid an aggregate of $2.12 billion on our credit facility during 2019 to assist in funding the Resolute acquisition and thereafter to meet cash requirements as needed. In connection with the acquisition of Resolute, we assumed $870.0 million in principal amount of long-term debt that we immediately repaid, incurring a redemption fee of $4.3 million. During 2019, we amended our credit facility, paying $3.0 million in financing costs.
52
We had no long-term debt-related financing cash flows during 2018. Net cash used by financing activities during both years included: (i) the payment of dividends, (ii) the payment of income tax withholdings made on behalf of our employees upon the net settlement of employee stock awards, and (iii) the receipt of proceeds from exercises of stock options. During 2019 and 2018, we declared cash dividends on our common stock quarterly, paying them in the quarter following declaration. Additionally, during 2019, we declared cash dividends on our preferred stock quarterly, also paying them in the quarter following declaration. During 2019, we paid one $0.18 per common share dividend, three $0.20 per common share dividends, and three $20.3125 per preferred share dividends, totaling $81.7 million. During 2018, we paid one $0.08 per common share dividend, two $0.16 per common share dividends, and one $0.18 per common share dividend, totaling $55.2 million. Future dividend payments will depend on our level of earnings, financial requirements, and other factors considered relevant by our Board of Directors. We paid employee income tax withholdings on the net settlement of stock awards totaling $5.2 million and $12.1 million, in 2019 and 2018, respectively. Cash proceeds received from stock option exercises were $1.3 million and $2.2 million in 2019 and 2018, respectively.
Capital Expenditures
The following table presents capitalized expenditures for oil and gas acquisition, exploration, and development activities. The table also presents the amounts removed from our oil and gas properties balance, net of applicable purchase price adjustments, due to property sales.
Years Ended December 31, | ||||||||
(in thousands) | 2019 | 2018 | ||||||
Acquisitions: | ||||||||
Proved | $ | 695,450 | $ | 62 | ||||
Unproved | 1,025,376 | 26,216 | ||||||
1,720,826 | 26,278 | |||||||
Exploration and development: | ||||||||
Land and seismic | 60,175 | 82,791 | ||||||
Exploration and development | 1,181,605 | 1,487,453 | ||||||
1,241,780 | 1,570,244 | |||||||
Property sales | (35,320 | ) | (581,799 | ) | ||||
$ | 2,927,286 | $ | 1,014,723 | |||||
Amounts in the table above are presented on an accrual basis. Oil and gas capital expenditures and sales of oil and gas assets in the Consolidated Statements of Cash Flows reflect capital expenditures and proceeds from property sales on a cash basis, when payments are made and proceeds received.
On March 1, 2019, we completed the acquisition of Resolute Energy Corporation, an independent oil and gas company focused on the acquisition and development of unconventional oil and gas properties in the Delaware Basin area of the Permian Basin of west Texas. The fair value of the proved and unproved properties recorded in the preliminary purchase price allocation for this acquisition was $692.6 million and $1.02 billion, respectively.
We decreased our 2019 E&D expenditures 21% to $1.24 billion compared to $1.57 billion in 2018. Approximately 84% of our 2019 E&D expenditures were in the Permian Basin and 16% were in the Mid-Continent. During 2019, we completed or participated in the completion of 291 gross (92.1 net) wells, of which we operated 119 gross (85.3 net) wells. See Items 1 and 2 of this report for further information regarding our oil and gas properties.
53
Based on current economic conditions, our 2020 total capital expenditures are projected to range from $1.25 billion to $1.35 billion. This includes drilling and completion capital of approximately $950 million to $1.05 billion, investments in midstream and water infrastructure of approximately $100 million, and investments in other, including capitalized G&A and non-producing leasehold, of approximately $200 million. Approximately 90% of our planned 2020 drilling and completion capital investment is expected to be invested in the Permian Basin, with the remainder in the Mid-Continent. As has been our historical practice, we regularly review our capital expenditures throughout the year and will adjust our investments based on increases or decreases in commodity prices, service costs, and drilling success. We have the flexibility to adjust our capital expenditures based upon market conditions. We intend to fund our 2020 capital investment program with cash flow from our operating activities, cash on hand, and borrowings under our credit facility. Sales of non-strategic assets and possible capital markets transactions may also be used to supplement funding of capital expenditures and acquisitions. The timing of capital expenditures and the receipt of cash flows do not necessarily match, which may cause us to borrow and repay funds under our credit facility from time-to-time. See Long-Term Debt—Bank Debt below for further information regarding our credit facility.
We have made, and will continue to make, expenditures to comply with environmental and safety regulations and requirements. These costs are considered a normal recurring cost of our ongoing operations. While we expect current pending legislation or regulations to increase the cost of business, we do not anticipate that we will be required to expend amounts that will have a material adverse effect on our financial position or operations, nor are we aware of any pending regulatory changes that would have a material impact, based on current laws and regulations. However, compliance with new legislation or regulations could increase our costs or adversely affect demand for oil or gas and result in a material adverse effect on our financial position or operations. See Item 1A RISK FACTORS for a description of risks related to current and potential future environmental and safety regulations and requirements that could adversely affect our operations and financial condition.
Long-Term Debt
Long-term debt at December 31, 2019 and 2018 consisted of the following:
December 31, 2019 | December 31, 2018 | |||||||||||||||||||||||
(in thousands) | Principal | Unamortized Debt Issuance Costs and Discounts (1) | Long-term Debt, net | Principal | Unamortized Debt Issuance Costs and Discount (1) | Long-term Debt, net | ||||||||||||||||||
4.375% notes due 2024 | $ | 750,000 | $ | (3,535 | ) | $ | 746,465 | $ | 750,000 | $ | (4,439 | ) | $ | 745,561 | ||||||||||
3.90% notes due 2027 | 750,000 | (6,289 | ) | 743,711 | 750,000 | (7,007 | ) | 742,993 | ||||||||||||||||
4.375% notes due 2029 | 500,000 | (4,930 | ) | 495,070 | — | — | — | |||||||||||||||||
Total long-term debt | $ | 2,000,000 | $ | (14,754 | ) | $ | 1,985,246 | $ | 1,500,000 | $ | (11,446 | ) | $ | 1,488,554 | ||||||||||
________________________________________
(1) | The 4.375% notes due 2024 were issued at par, therefore, the amounts shown in the table are for unamortized debt issuance costs only. At December 31, 2019, the unamortized debt issuance costs and discount related to the 3.90% notes were $4.8 million and $1.5 million, respectively. At December 31, 2019, the unamortized debt issuance costs and discount related to the 4.375% notes due 2029 were $4.3 million and $0.6 million, respectively. At December 31, 2018, the unamortized debt issuance costs and discount related to the 3.90% notes were $5.4 million and $1.6 million, respectively. |
54
Bank Debt
On February 5, 2019, we entered into an Amended and Restated Credit Agreement for our senior unsecured revolving credit facility (“Credit Facility”). Among other things, the amended and restated credit facility increased the aggregate commitments to $1.25 billion with an option for us to increase the aggregate commitments to $1.5 billion, and extended the maturity date to February 5, 2024. There is no borrowing base subject to the discretion of the lenders based on the value of our proved reserves under the Credit Facility. As of December 31, 2019, we had no bank borrowings outstanding under the Credit Facility, but did have letters of credit of $2.5 million outstanding, leaving an unused borrowing availability of $1.248 billion. During the year ended December 31, 2019, we borrowed and repaid an aggregate of $2.12 billion, on the Credit Facility to meet cash requirements as needed.
At our option, borrowings under the Credit Facility may bear interest at either (a) LIBOR (or an alternate rate determined by the administrative agent for the Credit Facility in accordance with the Credit Facility when LIBOR is no longer available) plus 1.125 - 2.0% based on the credit rating for our senior unsecured long-term debt, or (b) a base rate (as defined in the credit agreement) plus 0.125 - 1.0%, based on the credit rating for our senior unsecured long-term debt. Unused borrowings are subject to a commitment fee of 0.125 - 0.35%, based on the credit rating for our senior unsecured long-term debt.
The Credit Facility contains representations, warranties, covenants, and events of default that are customary for investment grade, senior unsecured bank credit agreements, including a financial covenant for the maintenance of a defined total debt-to-capital ratio of no greater than 65%. As of December 31, 2019, we were in compliance with all of the financial and non-financial covenants.
At December 31, 2019 and 2018, we had $4.0 million and $2.2 million, respectively, of unamortized debt issuance costs associated with our Credit Facility, which were recorded as assets and included in “Other assets” in our balance sheets. The costs are being amortized to interest expense ratably over the life of the Credit Facility. We incurred $3.0 million in additional debt issuance costs in amending our Credit Facility.
Senior Notes
On March 8, 2019, we issued $500.0 million aggregate principal amount of 4.375% senior unsecured notes due March 15, 2029 at 99.862% of par to yield 4.392% per annum. We received $494.7 million in net cash proceeds, after deducting underwriters’ fees, discount, and debt issuance costs. The notes bear an annual interest rate of 4.375% and interest is payable semiannually on March 15 and September 15, with the first payment made on September 15, 2019. We used the net proceeds to repay borrowings under our Credit Facility that were used to help fund the Resolute acquisition on March 1, 2019. The effective interest rate on these notes, including the amortization of debt issuance costs and discount, is 4.50%.
In April 2017, we issued $750 million aggregate principal amount of 3.90% senior unsecured at 99.748% of par to yield 3.93% per annum. These notes are due May 15, 2027 and interest is payable semiannually on May 15 and November 15. The effective interest rate on these notes, including the amortization of debt issuance costs and discount, is 4.01%.
In June 2014, we issued $750 million aggregate principal amount of 4.375% senior unsecured notes at par. These notes are due June 1, 2024 and interest is payable semiannually on June 1 and December 1. The effective interest rate on these notes, including the amortization of debt issuance costs, is 4.50%.
Each of our senior unsecured notes is governed by an indenture containing certain covenants, events of default, and other restrictive provisions with which we were in compliance as of December 31, 2019.
55
Working Capital Analysis
At December 31, 2019, we had a working capital deficit of $137.1 million, a decrease of $852.6 million, or 119% from a working capital surplus of $715.4 million at December 31, 2018. Our working capital decreased primarily due to the decrease in Cash and cash equivalents of $705.9 million, which was a result of cash consideration paid for our acquisition of Resolute and subsequent repayment of long-term debt and other liabilities acquired with Resolute. See Note 13 to the Consolidated Financial Statements for more information regarding the acquisition. In addition to the decrease in cash, other significant changes to working capital consisted primarily of the following:
• | Our net current asset derivative instrument position decreased by $73.0 million. The fair value of derivative instruments fluctuates based on changes in the underlying price indices as compared to the contracted prices included in the derivative instruments. |
• | The January 1, 2019 adoption of Topic 842 increased our current liabilities by $73.3 million at December 31, 2019. This amount represents the estimated current future lease payments, primarily for office space, well-head compressors, pipeline compressors, and artificial lift mechanisms. See Note 10 to the Consolidated Financial Statements for more information regarding our lease liabilities and the adoption of Topic 842. |
Accounts receivable are a major component of our working capital and include amounts due from a diverse group of companies comprised of major energy companies, pipeline companies, local distribution companies, and other end-users. Historically, losses associated with uncollectible receivables have not been significant.
Dividends
A quarterly cash dividend has been paid on our common stock every quarter since the first quarter of 2006. During 2019, our Board of Directors declared four $0.20 per common share cash dividends, totaling $81.4 million. In March 2019, in conjunction with the Resolute acquisition, we issued 62.5 thousand shares of 8.125% Series A Cumulative Perpetual Convertible Preferred Stock, par value $0.01 per share. During 2019, our Board of Directors declared four cash dividends of $20.3125 per preferred share, totaling $5.1 million. Future dividend payments will depend on our level of earnings, financial requirements, and other factors considered relevant by our Board of Directors. See Note 2 to the Consolidated Financial Statements for further information regarding our stock and Note 13 to the Consolidated Financial Statements for further information regarding the Resolute acquisition.
Off-Balance Sheet Arrangements
We may enter into off-balance sheet arrangements and transactions that can give rise to material off-balance sheet obligations. As of December 31, 2019, our material off-balance sheet arrangements consisted of operating lease agreements with lease terms at commencement of 12 months or less. As an accounting policy, we have elected not to apply the recognition requirements of Topic 842 to these leases. As such, we have not recorded any lease liabilities associated with these leases.
56
Contractual Obligations and Material Commitments
At December 31, 2019, we had the following contractual obligations and material commitments:
Payments Due by Period | |||||||||||||||||||||
Contractual obligations (in thousands): | Total | 1/1/20 - 12/31/20 | 1/1/21 - 12/31/22 | 1/1/23 - 12/31/24 | 1/1/25 and Thereafter | ||||||||||||||||
Long-term debt-principal (1) | $ | 2,000,000 | $ | — | $ | — | $ | 750,000 | $ | 1,250,000 | |||||||||||
Long-term debt-interest (1) | 574,905 | 81,868 | 167,875 | 151,469 | 173,693 | ||||||||||||||||
Operating leases (2) | 108,451 | 26,950 | 32,488 | 24,708 | 24,305 | ||||||||||||||||
Unconditional purchase obligations (3) | 84,436 | 21,567 | 21,381 | 18,542 | 22,946 | ||||||||||||||||
Derivative liabilities | 17,699 | 16,681 | 1,018 | — | — | ||||||||||||||||
Asset retirement obligation (4) | 181,869 | 27,824 | — | (4) | — | (4) | — | (4) | |||||||||||||
Other long-term liabilities (5) | 42,493 | 1,564 | 5,862 | 2,991 | 32,076 | ||||||||||||||||
$ | 3,009,853 | $ | 176,454 | $ | 228,624 | $ | 947,710 | $ | 1,503,020 | ||||||||||||
________________________________________
(1) | The interest payments presented above include the accrued interest payable on our long-term debt as of December 31, 2019 as well as future payments calculated using the long-term debt’s fixed rates, stated maturity dates, and principal amounts outstanding as of December 31, 2019. See Note 3 to the Consolidated Financial Statements for additional information regarding our debt. |
(2) | Operating leases include the estimated remaining contractual payments under lease agreements as of December 31, 2019. These lease agreements are primarily comprised of leases for commercial real estate, which consists primarily of office space, and compressor equipment. |
(3) | Of the total unconditional purchase obligations, $20.2 million represents obligations for the purchase of sand for well completions and $64.0 million represents obligations for firm transportation agreements for gas and oil pipeline capacity. |
(4) | We have excluded the presentation of the timing of the cash flows associated with our long-term asset retirement obligations because we cannot make a reasonably reliable estimate of the future period of cash settlement. The long-term asset retirement obligation is included in the total asset retirement obligation presented. |
(5) | Other long-term liabilities include contractual obligations associated with our employee supplemental savings plan, gas balancing liabilities, and other miscellaneous liabilities. All of these liabilities are accrued on our Consolidated Balance Sheet. The current portion associated with these long-term liabilities is also presented in the table above. |
The following discusses various commercial commitments that we have made that may include potential future cash payments if we fail to meet various performance obligations. These are not reflected in the table above, unless otherwise noted.
At December 31, 2019, we had estimated commitments of approximately: (i) $321.7 million to finish drilling, completing, or performing other work on wells and various other infrastructure projects in progress and (ii) $6.6 million to finish gathering system construction in progress.
At December 31, 2019, we had firm sales contracts to deliver approximately 703.7 Bcf of gas over the next 11.5 years. If we do not deliver this gas, our estimated financial commitment, calculated using the January 2020 index prices, would be approximately $1.03 billion. The value of this commitment will fluctuate due to price volatility and actual volumes delivered. However, we believe no financial commitment will be due based on our current proved reserves and production levels from which we can fulfill these volumetric obligations.
57
In connection with gas gathering and processing agreements, we have volume commitments over the next 9.0 years. If we do not deliver the committed gas or NGLs, as the case may be, the estimated maximum amount that would be payable under these commitments, calculated as of December 31, 2019, would be approximately $697.2 million. However, we believe no financial commitment will be due based on our current proved reserves and production levels from which we can fulfill these volumetric obligations.
We have minimum volume delivery commitments associated with agreements to reimburse connection costs to various pipelines. If we do not deliver this gas, or oil, as the case may be, the estimated maximum amount that would be payable under these commitments, calculated as of December 31, 2019, would be approximately $117.6 million. Of this total, we have accrued a liability of $4.5 million representing the estimated amount we will have to pay due to insufficient forecasted volumes at particular connection points. This accrual is reflected in the table above in Other long-term liabilities.
All of the noted commitments were routine and made in the ordinary course of our business.
Taking into account current commodity prices and anticipated levels of production, we believe that our net cash flow generated from operations and our other capital resources will be adequate to meet future obligations.
CRITICAL ACCOUNTING POLICIES AND ESTIMATES
Discussion and analysis of our financial condition and results of operation are based on our Consolidated Financial Statements, which have been prepared in accordance with accounting principles generally accepted in the United States of America. The preparation of these financial statements requires us to make estimates and judgments that affect the reported amounts of assets, liabilities, revenues, and expenses. We analyze and base our estimates on historical experience and various other assumptions that we believe to be reasonable under the circumstances. Changes in facts and circumstances or additional information may result in revised estimates, and actual results may differ from these estimates.
Our significant accounting policies are described in Note 1 to our Consolidated Financial Statements. We have identified the following policies as being of particular importance to the portrayal of our financial position and results of operations and which require the application of significant judgment by management.
Oil and Gas Reserves
The process of estimating quantities of oil and gas reserves is complex, requiring significant decisions in the evaluation of all available geological, geophysical, engineering and economic data. The data for a given field may also change substantially over time due to numerous factors including, but not limited to, additional development activity, evolving production history and continual reassessment of the viability of production under varying economic conditions. As a result, material revisions to existing reserve estimates may occur from time to time. Although every reasonable effort is made to ensure that our reserve estimates represent the most accurate assessments possible, subjective decisions and available data for our various fields make these estimates generally less precise than other estimates included in financial statement disclosures.
At year-end 2019, 14% of our total proved reserves are categorized as proved undeveloped reserves. Our engineers review and revise these reserve estimates regularly, as new information becomes available.
We use the units-of-production method to amortize the cost associated with our oil and gas properties. Changes in estimates of reserve quantities and commodity prices will cause corresponding changes in depletion expense, or in some cases, a full cost ceiling impairment charge in the period of the revision. See Full Cost Accounting below for further information regarding the ceiling limitation calculation. See SUPPLEMENTAL INFORMATION ON OIL AND GAS PRODUCING ACTIVITIES (UNAUDITED) in Item 8 for additional reserve data.
58
Full Cost Accounting
We use the full cost method of accounting for our oil and gas operations. All costs associated with property acquisition, exploration, and development activities are capitalized. Exploration and development costs include dry hole costs, geological and geophysical costs, direct overhead related to exploration and development activities, and other costs incurred for the purpose of finding oil and gas reserves. Salaries and benefits paid to employees directly involved in the acquisition, exploration, and development of properties, as well as other internal costs that can be directly identified with acquisition, exploration, and development activities, are also capitalized. Under the full cost method of accounting, no gain or loss is recognized upon the disposition of oil and gas properties unless such disposition would significantly alter the relationship between capitalized costs and proved reserves. Expenditures for maintenance and repairs are charged to production expense in the period incurred.
Under the full cost method of accounting, we are required to perform quarterly ceiling test calculations to test our oil and gas properties for possible impairment. If the net capitalized cost of our oil and gas properties, as adjusted for income taxes, exceeds the ceiling limitation, the excess is charged to expense. The ceiling limitation is equal to the sum of: (i) the present value discounted at 10% of estimated future net revenues from proved reserves, (ii) the cost of properties not being amortized, and (iii) the lower of cost or estimated fair value of unproven properties included in the costs being amortized, as adjusted for income taxes. We currently do not have any unproven properties that are being amortized. Estimated future net revenues are determined based on trailing twelve-month average commodity prices and estimated proved reserve quantities, operating costs, and capital expenditures.
The quarterly ceiling test is primarily impacted by commodity prices, changes in estimated reserve quantities, reserves produced, overall exploration and development costs, depletion expense, and deferred taxes. If pricing conditions decline, or if there is a negative impact on one or more of the other components of the calculation, we may incur a full cost ceiling test impairment. The calculated ceiling limitation is not intended to be indicative of the fair market value of our proved reserves or future results. Impairment charges do not affect cash flow from operating activities, but do adversely affect our net income and various components of our balance sheet. Any impairment of oil and gas properties is not reversible at a later date.
Depletion of proved oil and gas properties is computed on the units-of-production method, whereby capitalized costs, including future development costs and asset retirement costs, are amortized over total estimated proved reserves. Changes in our estimate of proved reserve quantities and impairment of oil and gas properties will cause corresponding changes in depletion expense in periods subsequent to these changes.
The capitalized costs of unproved properties, including those in wells in progress, are excluded from the costs being amortized. We do not have major development projects that are excluded from costs being amortized. On a quarterly basis, we evaluate excluded costs for inclusion in the costs to be amortized. Significant unproved properties are evaluated individually. Unproved properties that are not considered individually significant are aggregated for evaluation purposes and related costs are transferred to the costs to be amortized quarterly based on the application of historical factors.
Income Taxes
Our oil and gas exploration and production operations are subject to taxation on income in numerous jurisdictions. We record deferred tax assets and liabilities to account for the expected future tax consequences of events that have been recognized in our financial statements and our tax returns. We routinely assess the realizability of our deferred tax assets. Numerous judgments and assumptions are inherent in this assessment, including the determination of future taxable income, which is affected by factors such as future operating conditions (particularly as related to prevailing oil and gas prices) and changing tax laws. If we conclude that it is more likely than not that some portion or all of the deferred tax assets will not be realized, the tax asset would be reduced by a valuation allowance.
59
We regularly assess and, if required, establish accruals for tax contingencies that could result from assessments of additional tax by taxing jurisdictions where the company operates. See Note 9 to the Consolidated Financial Statements for additional information regarding our income taxes.
ITEM 7A. QUANTITATIVE AND QUALITATIVE DISCLOSURES ABOUT MARKET RISK
We are exposed to market risk including the risk of loss arising from adverse changes in commodity prices and interest rates.
Price Fluctuations
Our major market risk is pricing applicable to our oil, gas, and NGL production. The prices we receive for our production are based on prevailing market conditions and are influenced by many factors that are beyond our control. Pricing for oil, gas, and NGL production has been volatile and unpredictable. During 2019, our total production revenue was comprised of 72% oil sales, 12% gas sales, and 16% NGL sales. The following table shows how hypothetical changes in the realized prices we receive for our commodity sales may have impacted revenue for the periods indicated. See MANAGEMENT’S DISCUSSION AND ANALYSIS OF FINANCIAL CONDITION AND RESULTS OF OPERATIONS—Market Conditions for further information regarding prices.
Impact on Revenue | ||||
Change in Realized Price | Year Ended December 31, 2019 | |||
(in thousands) | ||||
Oil | ± $1.00 | per barrel | ± $31,463 | |
Gas | ± $0.10 | per Mcf | ± $25,157 | |
NGL | ± $1.00 | per barrel | ± $28,254 | |
± $84,874 | ||||
We periodically enter into derivative contracts to hedge a portion of our price risk associated with our future oil and gas production. At December 31, 2019, we had oil and gas derivatives covering a portion of our 2020 and 2021 production, which were recorded as current and non-current assets and liabilities. At December 31, 2019, our oil and gas derivatives had a gross asset fair value of $18.5 million and a gross liability fair value of $17.7 million. See Note 4 to the Consolidated Financial Statements for additional information regarding our derivative instruments.
While these contracts limit the downside risk of adverse price movements, they may also limit future cash flow from favorable price movements. The following table shows how hypothetical changes in the forward prices used to calculate the fair value of our derivatives may have impacted the fair value as of December 31, 2019.
Impact on Fair Value | ||||||
Change in Forward Price | December 31, 2019 | |||||
(in thousands) | ||||||
Oil | -$1.00 | $ | 7,726 | |||
Oil | +$1.00 | $ | (8,115 | ) | ||
Gas | -$0.10 | $ | 3,276 | |||
Gas | +$0.10 | $ | (3,118 | ) | ||
60
Interest Rate Risk
At December 31, 2019, our long-term debt consisted of $750 million of 4.375% senior unsecured notes that mature on June 1, 2024, $750 million of 3.90% senior unsecured notes that mature on May 15, 2027, and $500 million of 4.375% that mature on March 15, 2029. Because all of our outstanding long-term debt is at a fixed rate, we consider our interest rate exposure to be minimal. See Note 3 and Note 5 to the Consolidated Financial Statements for additional information regarding our debt.
61
ITEM 8. FINANCIAL STATEMENTS AND SUPPLEMENTARY DATA
CIMAREX ENERGY CO.
INDEX TO FINANCIAL STATEMENTS AND SUPPLEMENTAL SCHEDULES
Page | |
All other supplemental information and schedules have been omitted because they are not applicable or the information required is shown in the consolidated financial statements or related notes thereto.
62
Report of Independent Registered Public Accounting Firm
To the Stockholders and Board of Directors
Cimarex Energy Co.:
Opinion on the Consolidated Financial Statements
We have audited the accompanying consolidated balance sheets of Cimarex Energy Co. and subsidiaries (the Company) as of December 31, 2019 and 2018, the related consolidated statements of operations and comprehensive income (loss), stockholders’ equity, and cash flows for each of the years in the three‑year period ended December 31, 2019, and the related notes (collectively, the consolidated financial statements). In our opinion, the consolidated financial statements present fairly, in all material respects, the financial position of the Company as of December 31, 2019 and 2018, and the results of its operations and its cash flows for each of the years in the three‑year period ended December 31, 2019, in conformity with U.S. generally accepted accounting principles.
We also have audited, in accordance with the standards of the Public Company Accounting Oversight Board (United States) (PCAOB), the Company’s internal control over financial reporting as of December 31, 2019, based on criteria established in Internal Control - Integrated Framework (2013) issued by the Committee of Sponsoring Organizations of the Treadway Commission, and our report dated February 26, 2020 expressed an adverse opinion on the effectiveness of the Company’s internal control over financial reporting.
Change in Accounting Principle
As discussed in Note 1 to the consolidated financial statements, the Company has changed its method of accounting for leases as of January 1, 2019 due to the adoption of Financial Accounting Standards Board Accounting Standards Codification Topic 842, Leases.
Basis for Opinion
These consolidated financial statements are the responsibility of the Company’s management. Our responsibility is to express an opinion on these consolidated financial statements based on our audits. We are a public accounting firm registered with the PCAOB and are required to be independent with respect to the Company in accordance with the U.S. federal securities laws and the applicable rules and regulations of the Securities and Exchange Commission and the PCAOB.
We conducted our audits in accordance with the standards of the PCAOB. Those standards require that we plan and perform the audit to obtain reasonable assurance about whether the consolidated financial statements are free of material misstatement, whether due to error or fraud. Our audits included performing procedures to assess the risks of material misstatement of the consolidated financial statements, whether due to error or fraud, and performing procedures that respond to those risks. Such procedures included examining, on a test basis, evidence regarding the amounts and disclosures in the consolidated financial statements. Our audits also included evaluating the accounting principles used and significant estimates made by management, as well as evaluating the overall presentation of the consolidated financial statements. We believe that our audits provide a reasonable basis for our opinion.
Critical Audit Matters
The critical audit matters communicated below are matters arising from the current period audit of the consolidated financial statements that were communicated or required to be communicated to the audit committee and that: (1) relate to accounts or disclosures that are material to the consolidated financial statements and (2) involved our especially challenging, subjective, or complex judgments. The communication of critical audit matters does not alter in any way our opinion on the consolidated financial statements, taken as a whole, and we are not, by communicating the critical audit matters below, providing separate opinions on the critical audit matters or on the accounts or disclosures to which they relate.
63
Assessment of the effect of estimated oil and gas reserves related to proved oil and gas properties on depletion expense and the ceiling test calculation
As discussed in Note 1 to the consolidated financial statements, the Company calculates depletion expense related to proved oil and gas properties using the units-of-production method. Under such method, capitalized costs, including future estimated development costs and asset retirement costs, are amortized over total estimated proved oil and gas reserves. For the year ended December 31, 2019, the Company recorded depletion expense related to proved oil and gas properties of $817.1 million. The Company recorded a ceiling test impairment of $618.7 million for the year ended December 31, 2019 due to the net capitalized cost of the oil and gas properties exceeding the ceiling limitation. The Company is required to perform a ceiling test calculation on a quarterly basis, and the applicable ceiling limitation is equal to the sum of: (1) the present value discounted at 10% of estimated future net revenues from proved reserves, (2) the cost of properties not being amortized, and (3) the lower of cost or estimated fair value of unproven properties included in the costs being amortized. The Company’s internal Corporate Reservoir Engineering group estimates proved oil and gas reserves. The Company also engages an independent petroleum engineering consulting firm to perform an independent evaluation of a portion of those proved oil and gas reserve estimates.
We identified the assessment of the effect of estimated oil and gas reserves related to proved oil and gas properties on both depletion expense and the ceiling test calculation as a critical audit matter. Complex auditor judgment was required in evaluating the Company’s estimate of proved oil and gas reserves. Auditor judgment was also required to evaluate the assumptions used by the Company related to forecasted production, estimated future operating costs, and oil and gas prices inclusive of market differentials because changes to these assumptions could have a significant impact on the estimated oil and gas reserves.
The primary procedures we performed to address this critical audit matter included the following. We tested certain internal controls over the Company’s depletion calculation and ceiling test calculation processes, including certain controls related to the estimation of proved oil and gas reserves used in the respective calculations. We evaluated the competence, capabilities, and objectivity of the Corporate Reservoir Engineering personnel who estimated the proved oil and gas reserves and the independent petroleum engineering consulting firm engaged by the Company. We assessed the methodology used by the Company’s internal Corporate Reservoir Engineering group to estimate proved oil and gas reserves and the methodology used by the independent petroleum engineering consulting firm to evaluate those reserve estimates for compliance with industry and regulatory standards. We evaluated the forecasted production and estimated future operating costs assumptions used by the Company’s internal Corporate Reservoir Engineering group by comparing them to the Company’s historical and current actual results. We evaluated the oil and gas prices used by the Company’s internal Corporate Reservoir Engineering group by comparing them to publicly available prices and tested the relevant market differentials. We read and considered the report of the Company’s independent petroleum engineering consulting firm in connection with our evaluation of the Company’s reserve estimates. We analyzed the depletion expense calculation for compliance with regulatory standards and recalculated it. We also analyzed the ceiling test calculation for compliance with regulatory standards, and recalculated it.
Evaluation of the fair value of oil and gas properties acquired in the Resolute business combination
As discussed in Note 13 to the consolidated financial statements, on March 1, 2019, the Company acquired Resolute Energy Corporation (Resolute) in a business combination. As a result of the transaction, the Company acquired both proved and unproved oil and gas properties. The acquisition-date fair value for the oil and gas properties acquired was $1.7 billion.
We identified the evaluation of the fair value of the oil and gas properties acquired in the Resolute business combination as a critical audit matter. Complex auditor judgment was required in evaluating the results of the discounted cash flow model used to determine the fair value of the proved oil and gas properties. The discounted cash flow model included the following significant assumptions: estimated future oil and gas prices, reserve category risk adjustment factors, forecasted production, estimated future operating costs and weighted-average cost of capital (WACC). In addition, complex auditor judgment was required in evaluating the results of the market based transactions used to determine the fair value of the unproved oil and gas properties.
64
The primary procedures we performed to address this critical audit matter included the following. We tested certain internal controls over the Company’s acquisition-date valuation process to determine the fair value of the acquired oil and gas properties, including controls over the development of the significant assumptions used in the discounted cash flow model for proved oil and gas properties and the assessment of market based transaction for unproved oil and gas properties. We evaluated the Company’s estimated future oil and gas prices by comparing them to relevant publicly available market price forecasts. We evaluated reserve category risk adjustment factors by comparing them against publicly available industry information. We evaluated the Company’s forecasted production and estimated future operating costs by comparing them to historical actual results of similar Cimarex oil and gas properties. In addition, we involved valuation professionals with specialized skills and knowledge, who assisted in evaluating the Company’s fair value as it relates to proved oil and gas properties by comparing the WACC to a range of WACCs of comparable peers that were independently developed using publicly available market information. As it relates to unproved oil and gas properties, the valuation professionals compared the Company’s estimated fair values by asset group to a range of indicated values of recent similar market transactions that were independently developed using publicly available market information.
KPMG LLP
We have served as the Company’s auditor since 2002.
Denver, Colorado
February 26, 2020
65
CIMAREX ENERGY CO.
CONSOLIDATED BALANCE SHEETS
(in thousands, except share and per share information)
December 31, | |||||||
2019 | 2018 | ||||||
Assets | |||||||
Current assets: | |||||||
Cash and cash equivalents | $ | $ | |||||
Accounts receivable, net of allowance: | |||||||
Trade | |||||||
Oil and gas sales | |||||||
Gas gathering, processing, and marketing | |||||||
Oil and gas well equipment and supplies | |||||||
Derivative instruments | |||||||
Prepaid expenses | |||||||
Other current assets | |||||||
Total current assets | |||||||
Oil and gas properties at cost, using the full cost method of accounting: | |||||||
Proved properties | |||||||
Unproved properties and properties under development, not being amortized | |||||||
Less—accumulated depreciation, depletion, amortization, and impairment | ( | ) | ( | ) | |||
Net oil and gas properties | |||||||
Fixed assets, net of accumulated depreciation of $389,458 and $324,631, respectively | |||||||
Goodwill | |||||||
Derivative instruments | |||||||
Other assets | |||||||
$ | $ | ||||||
Liabilities, Redeemable Preferred Stock, and Stockholders’ Equity | |||||||
Current liabilities: | |||||||
Accounts payable: | |||||||
Trade | $ | $ | |||||
Gas gathering, processing, and marketing | |||||||
Accrued liabilities: | |||||||
Exploration and development | |||||||
Taxes other than income | |||||||
Other | |||||||
Derivative instruments | |||||||
Revenue payable | |||||||
Operating leases | |||||||
Total current liabilities | |||||||
Long-term debt: | |||||||
Principal | |||||||
Less—unamortized debt issuance costs and discounts | ( | ) | ( | ) | |||
Long-term debt, net | |||||||
Deferred income taxes | |||||||
Asset retirement obligation | |||||||
Derivative instruments | |||||||
Operating leases | |||||||
Other liabilities | |||||||
Total liabilities | |||||||
Commitments and contingencies (Note 10) | |||||||
Redeemable preferred stock - 8.125% Series A Cumulative Perpetual Convertible Preferred Stock, $0.01 par value, 62,500 shares authorized and issued and no shares authorized and issued, respectively (Note 2) | |||||||
Stockholders’ equity: | |||||||
Common stock, $0.01 par value, 200,000,000 shares authorized, 102,144,577 and 95,755,797 shares issued, respectively | |||||||
Additional paid-in capital | |||||||
Retained earnings | |||||||
Accumulated other comprehensive income | |||||||
Total stockholders’ equity | |||||||
$ | $ | ||||||
See accompanying notes to Consolidated Financial Statements.
66
CIMAREX ENERGY CO.
CONSOLIDATED STATEMENTS OF OPERATIONS AND COMPREHENSIVE INCOME (LOSS)
(in thousands, except per share information)
Years Ended December 31, | |||||||||||
2019 | 2018 | 2017 | |||||||||
Revenues: | |||||||||||
Oil sales | $ | $ | $ | ||||||||
Gas and NGL sales | |||||||||||
Gas gathering and other | |||||||||||
Gas marketing | ( | ) | |||||||||
Costs and expenses: | |||||||||||
Impairment of oil and gas properties | |||||||||||
Depreciation, depletion, and amortization | |||||||||||
Asset retirement obligation | |||||||||||
Production | |||||||||||
Transportation, processing, and other operating | |||||||||||
Gas gathering and other | |||||||||||
Taxes other than income | |||||||||||
General and administrative | |||||||||||
Stock compensation | |||||||||||
Loss (gain) on derivative instruments, net | ( | ) | ( | ) | |||||||
Other operating expense, net | |||||||||||
Operating (loss) income | ( | ) | |||||||||
Other (income) and expense: | |||||||||||
Interest expense | |||||||||||
Capitalized interest | ( | ) | ( | ) | ( | ) | |||||
Loss on early extinguishment of debt | |||||||||||
Other, net | ( | ) | ( | ) | ( | ) | |||||
(Loss) income before income tax | ( | ) | |||||||||
Income tax (benefit) expense | ( | ) | |||||||||
Net (loss) income | $ | ( | ) | $ | $ | ||||||
Earnings (loss) per share to common stockholders: | |||||||||||
Basic | $ | ( | ) | $ | $ | ||||||
Diluted | $ | ( | ) | $ | $ | ||||||
Comprehensive (loss) income: | |||||||||||
Net (loss) income | $ | ( | ) | $ | $ | ||||||
Other comprehensive (loss) income: | |||||||||||
Change in fair value of investments, net of tax of $(222), $(425), and $106, respectively | ( | ) | ( | ) | |||||||
Total comprehensive (loss) income | $ | ( | ) | $ | $ | ||||||
See accompanying notes to Consolidated Financial Statements.
67
CIMAREX ENERGY CO.
CONSOLIDATED STATEMENTS OF CASH FLOWS
(in thousands)
Years Ended December 31, | |||||||||||
2019 | 2018 | 2017 | |||||||||
Cash flows from operating activities: | |||||||||||
Net (loss) income | $ | ( | ) | $ | $ | ||||||
Adjustments to reconcile net (loss) income to net cash provided by operating activities: | |||||||||||
Impairment of oil and gas properties | |||||||||||
Depreciation, depletion, and amortization | |||||||||||
Asset retirement obligation | |||||||||||
Deferred income taxes | ( | ) | |||||||||
Stock compensation | |||||||||||
Loss (gain) on derivative instruments, net | ( | ) | ( | ) | |||||||
Settlements on derivative instruments | ( | ) | ( | ) | ( | ) | |||||
Loss on early extinguishment of debt | |||||||||||
Changes in non-current assets and liabilities | ( | ) | ( | ) | |||||||
Other, net | |||||||||||
Changes in operating assets and liabilities: | |||||||||||
Accounts receivable | ( | ) | |||||||||
Other current assets | ( | ) | ( | ) | ( | ) | |||||
Accounts payable and other current liabilities | ( | ) | |||||||||
Net cash provided by operating activities | |||||||||||
Cash flows from investing activities: | |||||||||||
Oil and gas capital expenditures | ( | ) | ( | ) | ( | ) | |||||
Acquisition of Resolute Energy, net of cash acquired (Note 13) | ( | ) | |||||||||
Other capital expenditures | ( | ) | ( | ) | ( | ) | |||||
Sales of oil and gas assets | |||||||||||
Sales of other assets | |||||||||||
Net cash used by investing activities | ( | ) | ( | ) | ( | ) | |||||
Cash flows from financing activities: | |||||||||||
Borrowings of long-term debt | |||||||||||
Repayments of long-term debt | ( | ) | ( | ) | |||||||
Financing, underwriting, and debt redemption fees | ( | ) | ( | ) | ( | ) | |||||
Finance lease payments | ( | ) | |||||||||
Dividends paid | ( | ) | ( | ) | ( | ) | |||||
Employee withholding taxes paid upon the net settlement of equity-classified stock awards | ( | ) | ( | ) | ( | ) | |||||
Proceeds from exercise of stock options | |||||||||||
Net cash used by financing activities | ( | ) | ( | ) | ( | ) | |||||
Net change in cash and cash equivalents | ( | ) | ( | ) | |||||||
Cash and cash equivalents at beginning of period | |||||||||||
Cash and cash equivalents at end of period | $ | $ | $ | ||||||||
See accompanying notes to Consolidated Financial Statements.
68
CIMAREX ENERGY CO.
CONSOLIDATED STATEMENTS OF STOCKHOLDERS’ EQUITY
(in thousands, except per share information)
Retained Earnings (Accumulated Deficit) | Accumulated Other Comprehensive Income (Loss) | Total Stockholders’ Equity | ||||||||||||||||||||
Common Stock | Additional Paid-in Capital | |||||||||||||||||||||
Shares | Amount | |||||||||||||||||||||
Balance, December 31, 2016 | $ | $ | $ | ( | ) | $ | $ | |||||||||||||||
Dividends paid on stock awards subsequently forfeited | — | — | — | |||||||||||||||||||
Dividends declared ($0.32 per share) | — | — | ( | ) | — | — | ( | ) | ||||||||||||||
Net income | — | — | — | — | ||||||||||||||||||
Unrealized change in fair value of investments, net of tax | — | — | — | — | ||||||||||||||||||
Issuance of restricted stock awards | ( | ) | — | — | ||||||||||||||||||
Common stock reacquired and retired | ( | ) | ( | ) | ( | ) | — | — | ( | ) | ||||||||||||
Restricted stock forfeited and retired | ( | ) | — | — | — | — | ||||||||||||||||
Exercise of stock options | — | — | — | |||||||||||||||||||
Stock-based compensation | — | — | — | — | ||||||||||||||||||
Cumulative effect adjustment of adopting ASU 2016-09 (Note 6) | — | — | — | |||||||||||||||||||
Other | — | — | ( | ) | — | — | ( | ) | ||||||||||||||
Balance, December 31, 2017 | ( | ) | ||||||||||||||||||||
Dividends paid on stock awards subsequently forfeited | — | — | — | |||||||||||||||||||
Dividends declared ($0.68 per share) | — | — | ( | ) | ( | ) | — | ( | ) | |||||||||||||
Net income | — | — | — | — | ||||||||||||||||||
Unrealized change in fair value of investments, net of tax | — | — | — | — | ( | ) | ( | ) | ||||||||||||||
Issuance of restricted stock awards | ( | ) | — | — | ||||||||||||||||||
Common stock reacquired and retired | ( | ) | — | ( | ) | — | — | ( | ) | |||||||||||||
Restricted stock forfeited or canceled and retired | ( | ) | ( | ) | — | — | ||||||||||||||||
Exercise of stock options | — | — | — | |||||||||||||||||||
Stock-based compensation | — | — | — | — | ||||||||||||||||||
Balance, December 31, 2018 | ||||||||||||||||||||||
Dividends paid on stock awards subsequently forfeited | — | — | — | |||||||||||||||||||
Dividends declared on common stock ($0.80 per share) | — | — | ( | ) | — | ( | ) | |||||||||||||||
Dividends declared on redeemable preferred stock ($81.25 per share) | — | — | — | ( | ) | — | ( | ) | ||||||||||||||
Net loss | — | — | — | ( | ) | — | ( | ) | ||||||||||||||
Issuance of stock for Resolute Energy acquisition (Note 13) | — | — | ||||||||||||||||||||
Unrealized change in fair value of investments, net of tax | — | — | — | — | ( | ) | ( | ) | ||||||||||||||
Issuance of restricted stock awards | ( | ) | — | — | ||||||||||||||||||
Common stock reacquired and retired | ( | ) | ( | ) | ( | ) | — | — | ( | ) | ||||||||||||
Restricted stock forfeited or canceled and retired | ( | ) | ( | ) | — | — | ||||||||||||||||
Exercise of stock options | — | — | — | |||||||||||||||||||
Stock-based compensation | — | — | — | — | ||||||||||||||||||
Balance, December 31, 2019 | $ | $ | $ | $ | $ | |||||||||||||||||
See accompanying notes to Consolidated Financial Statements.
69
1. BASIS OF PRESENTATION AND SUMMARY OF SIGNIFICANT ACCOUNTING POLICIES
Cimarex Energy Co., a Delaware corporation, is an independent oil and gas exploration and production company. Our operations are mainly located in Texas, Oklahoma, and New Mexico.
Basis of Presentation
Our Consolidated Financial Statements have been prepared in accordance with accounting principles generally accepted in the United States of America, or GAAP. Our significant accounting policies are discussed below. The accounts of Cimarex and its subsidiaries are presented in the accompanying Consolidated Financial Statements. All intercompany accounts and transactions were eliminated in consolidation.
Segment Information
We have determined that our business is comprised of only one segment because our gathering, processing, and marketing activities are ancillary to our oil and gas production operations.
Use of Estimates
The preparation of our financial statements in conformity with GAAP requires us to make estimates and judgments that affect the reported amounts of assets, liabilities, revenues, and expenses. Areas of significance requiring the use of management’s judgments include the estimation of proved oil and gas reserves used in calculating depletion, the estimation of future net revenues used in computing ceiling test limitations, the estimation of future abandonment obligations used in recording asset retirement obligations, and the assessment of goodwill. Estimates and judgments also are required in determining allowances for doubtful accounts, impairments of unproved properties and other assets, valuation of deferred tax assets, fair value measurements, lease liabilities, and contingencies. We analyze our estimates and base them on historical experience and various other assumptions that we believe to be reasonable under the circumstances. Actual results may differ from these estimates under different assumptions or conditions.
The process of estimating quantities of oil and gas reserves is complex, requiring significant decisions in the evaluation of all available geological, geophysical, engineering, and economic data. The data for a given field may also change substantially over time as a result of numerous factors including, but not limited to, additional development activity, evolving production history, and continual reassessment of the viability of production under varying economic conditions. As a result, material revisions to existing reserve estimates may occur from time to time. Although every reasonable effort is made to ensure that our reserve estimates represent the most accurate assessments possible, subjective decisions, and available data for our various fields make these estimates generally less precise than other estimates included in financial statement disclosures.
70
Prior Year Reclassifications
Certain amounts in the prior year financial statements have been reclassified to conform to the 2019 financial statement presentation. These reclassifications include reclassifying certain Gas gathering and other expenses to Transportation, processing, and other operating expense and Production expense. These reclassifications were made to reflect an allocation of the costs incurred to operate our gas gathering facilities as a cost to transport our equity share of gas produced and operate our wells. The following table shows the reclassifications made:
Years Ended December 31, | ||||||||||||||||||||||||
2018 | 2017 | |||||||||||||||||||||||
(in thousands) | Prior Year Presentation | Current Year Reclassifications | Current Year Presentation | Prior Year Presentation | Current Year Reclassifications | Current Year Presentation | ||||||||||||||||||
Production | $ | $ | $ | $ | $ | $ | ||||||||||||||||||
Transportation, processing, and other operating | $ | $ | $ | $ | ||||||||||||||||||||
Gas gathering and other | $ | ( | ) | $ | $ | ( | ) | $ | ||||||||||||||||
$ | $ | |||||||||||||||||||||||
Cash and Cash Equivalents
Cash and cash equivalents consist of cash in banks and investments readily convertible into cash, which have original maturities of three months or less. Cash equivalents are stated at cost, which approximates market value.
Oil and Gas Well Equipment and Supplies
Our oil and gas well equipment and supplies are valued at the lower of cost and net realizable value, where net realizable value is based on estimated selling prices in the ordinary course of business, less reasonably predictable costs of completion, disposal, and transportation. Declines in the price of oil and gas well equipment and supplies in future periods could cause us to recognize impairments on these assets. An impairment would not affect cash flow from operating activities, but would adversely affect our net income and stockholders’ equity.
Oil and Gas Properties
We use the full cost method of accounting for our oil and gas operations. All costs associated with property acquisition, exploration, and development activities are capitalized. Exploration and development costs include dry hole costs, geological and geophysical costs, direct overhead related to exploration and development activities, and other costs incurred for the purpose of finding oil and gas reserves. Salaries and benefits paid to employees directly involved in the acquisition, exploration, and development of properties, as well as other internal costs that can be directly identified with acquisition, exploration and development activities, are also capitalized. Under the full cost method of accounting, no gain or loss is recognized upon the disposition of oil and gas properties unless such disposition would significantly alter the relationship between capitalized costs and proved reserves. Expenditures for maintenance and repairs are charged to production expense in the period incurred.
Under the full cost method of accounting, we are required to perform quarterly ceiling test calculations to test our oil and gas properties for possible impairment. If the net capitalized cost of our oil and gas properties, as adjusted for income taxes, exceeds the ceiling limitation, the excess is charged to expense. The ceiling limitation is equal to the sum of: (i) the present value discounted at 10 % of estimated future net revenues from proved reserves, (ii) the cost of properties not being amortized, and (iii) the lower of cost or estimated fair value of unproven properties included in the costs being amortized, as adjusted for income taxes. We currently do not have any unproven properties that are
71
being amortized. Estimated future net revenues are determined based on trailing twelve-month average commodity prices and estimated proved reserve quantities, operating costs, and capital expenditures.
For the year ended December 31, 2019, we recognized a ceiling test impairment of $618.7 million, all of which was recognized in the fourth quarter. The impairment resulted primarily from the impact of decreases in the 12-month average trailing prices for oil, natural gas, and NGLs as well as significant basis differentials utilized in determining the estimated future net cash flows from proved reserves. We did not recognize a ceiling test impairment during the years ended December 31, 2018 and 2017 because the net capitalized cost of our oil and gas properties, as adjusted for income taxes, did not exceed the ceiling limitation. The quarterly ceiling test is primarily impacted by commodity prices, changes in estimated reserve quantities, reserves produced, overall exploration and development costs, depletion expense, and deferred taxes. If pricing conditions decline, or if there is a negative impact on one or more of the other components of the calculation, we may incur full cost ceiling test impairments in future quarters. The calculated ceiling limitation is not intended to be indicative of the fair market value of our proved reserves or future results. Impairment charges do not affect cash flow from operating activities, but do adversely affect our net income and various components of our balance sheet. Any impairment of oil and gas properties is not reversible at a later date.
Depletion of proved oil and gas properties is computed on the units-of-production method, whereby capitalized costs, including future development costs and asset retirement costs, are amortized over total estimated proved reserves. Changes in our estimate of proved reserve quantities and impairment of oil and gas properties will cause corresponding changes in depletion expense in periods subsequent to these changes.
The capitalized costs of unproved properties, including those in wells in progress, are excluded from the costs being amortized. We do not have major development projects that are excluded from costs being amortized. On a quarterly basis, we evaluate excluded costs for inclusion in the costs to be amortized. Significant unproved properties are evaluated individually. Unproved properties that are not considered individually significant are aggregated for evaluation purposes and related costs are transferred to the costs to be amortized quarterly based on the application of historical factors.
Fixed Assets
Goodwill
Goodwill represents the excess of the purchase price of business combinations over the fair value of the net assets acquired and is tested for impairment at least annually. In performing the goodwill test, we compare the fair value of our reporting unit with its carrying amount. If the carrying amount of the reporting unit were to exceed its fair value, an impairment charge would be recognized in the amount of this excess, limited to the total amount of goodwill allocated to that reporting unit. We evaluate our goodwill for impairment in the fourth quarter of each year and whenever events or changes in circumstances indicate the possibility that goodwill may be impaired. Based upon our assessment as of October 31, 2019, goodwill was not impaired. It is possible that goodwill could become impaired in the future if commodity prices or other economic factors become unfavorable.
72
Revenue Recognition
Oil, Gas, and NGL Sales
Effective January 1, 2018, we adopted the provisions of Accounting Standards Codification 606, Revenue from Contracts with Customers (“Topic 606”), utilizing the modified retrospective approach, which we applied to contracts that were not completed as of that date. Because we utilized the modified retrospective approach, there was no impact to prior periods’ reported amounts. Application of Topic 606 has no impact on our net income or cash flows from operations; however, certain costs classified as Transportation, processing, and other operating in the Consolidated Statements of Operations and Comprehensive Income (Loss) under prior accounting standards are now reflected as deductions from revenue under Topic 606.
Revenue is recognized from the sales of oil, gas, and NGLs when the customer obtains control of the product, when we have no further obligations to perform related to the sale, and when collectability is probable. All of our sales of oil, gas, and NGLs are made under contracts with customers, which typically include variable consideration based on monthly pricing tied to local indices and monthly volumes delivered. The nature of our contracts with customers does not require us to constrain that variable consideration or to estimate the amount of transaction price attributable to future performance obligations for accounting purposes. As of December 31, 2019, we had open contracts with customers with terms of one month to multiple years, as well as “evergreen” contracts that renew on a periodic basis if not canceled by us or the customer. Performance obligations under our contracts with customers are typically satisfied at a point-in-time through monthly delivery of oil, gas, and/or NGLs. Our contracts with customers typically require payment within one month of delivery.
Our gas and NGLs are sold under a limited number of contract structure types common in our industry. Under these contracts the gas and its components, including NGLs, may be sold to a single purchaser or the residue gas and NGLs may be sold to separate purchasers. Regardless of the contract structure type, the terms of these contracts compensate us for the value of the residue gas and NGLs at current market prices for each product. However, depending on the contract structure type, certain transportation, processing, and other charges may be deducted against the prices received for the product. Our oil typically is sold at specific delivery points under contract terms that also are common in our industry.
Gas Gathering
When we transport and/or process third-party gas associated with our equity gas, we recognize revenue for the fees charged to third-parties for such services.
Gas Marketing
When we market and sell gas for working interest owners, we act as agent under short-term sales and supply agreements and may earn a fee for such services. Revenues from such services are recognized as gas is delivered.
Gas Imbalances
Revenue from the sale of gas is recorded on the basis of gas actually sold by us. If our aggregate sales volumes for a well are greater (or less) than our proportionate share of production from the well, a liability (or receivable) is established to the extent there are insufficient proved reserves available to make-up the overproduced (or underproduced) imbalance. Imbalances have not been significant in the periods presented.
73
General and Administrative Expenses
General and administrative expenses are reported net of amounts reimbursed by working interest owners of the oil and gas properties operated by Cimarex and net of amounts capitalized pursuant to the full cost method of accounting.
Derivatives
Our derivative contracts are recorded on the balance sheet at fair value. Our firm sales contracts qualify for the normal purchase and normal sale exception. Contracts that qualify for this treatment do not require mark-to-market accounting treatment. See Note 4 for additional information regarding our derivative instruments.
Income Taxes
We record deferred tax assets and liabilities to account for the expected future tax consequences of events that have been recognized in the financial statements and tax returns. We classify all deferred tax assets and liabilities as non-current. We routinely assess the realizability of our deferred tax assets. Numerous judgments and assumptions are inherent in this assessment, including the determination of future taxable income, which is affected by factors such as future operating conditions (particularly as related to prevailing oil and gas prices) and changing tax laws. If we conclude that it is more likely than not that some or all of the deferred tax assets will not be realized, the tax asset is reduced by a valuation allowance. We regularly assess and, if required, establish accruals for tax contingencies that could result from assessments of additional tax by taxing jurisdictions where the company operates. See Note 9 for additional information regarding our income taxes.
Contingencies
A provision for contingencies is charged to expense when the loss is probable and the cost can be reasonably estimated. Determining when expenses should be recorded for these contingencies and the appropriate amounts for accrual is a complex estimation process that includes subjective judgment. In many cases, this judgment is based on interpretation of laws and regulations, which can be interpreted differently by regulators and/or courts of law. We closely monitor known and potential legal, environmental, and other contingencies and determine when we should record losses for these items based on information available to us. See Note 10 for additional information regarding our contingencies.
Asset Retirement Obligations
We recognize the present value of the fair value of liabilities for retirement obligations associated with tangible long-lived assets in the period in which there is a legal obligation associated with the retirement of such assets and the amount can be reasonably estimated. The associated asset retirement costs are capitalized as part of the carrying amount of the long-lived asset. This liability includes costs related to the abandonment of wells, the removal of facilities and equipment, and site restorations. In periods subsequent to the initial measurement of an asset retirement obligation at present value, a period-to-period increase in the carrying amount of the liability is recognized as accretion expense, which represents the effect of the passage of time on the amount of the liability. An equivalent amount is added to the carrying amount of the liability. If the fair value of a recorded asset retirement obligation changes, a revision is recorded to both the asset retirement obligation and the asset retirement capitalized cost. Capitalized costs are included as a component of the DD&A calculations. The current portion of our asset retirement obligations is recorded in “Accrued liabilities — Other” in the accompanying Consolidated Balance Sheets and cash payments for settlements of retirement obligations are classified as cash used in operating activities in the accompanying Consolidated Statements of Cash Flows. See Note 8 for additional information regarding our asset retirement obligations.
74
Stock-based Compensation
We recognize compensation cost related to all stock-based awards in the financial statements based on their estimated grant date fair value. We grant various types of stock-based awards including stock options, restricted stock (including awards with service-based vesting and market condition-based vesting provisions), and restricted stock units. The grant date fair value of stock option awards is determined using the Black-Scholes option pricing model. Service-based restricted stock and units are valued using the market price of our common stock on the grant date. The grant date fair value of the market condition-based restricted stock incorporates the effect of the market condition using valuation techniques that take into consideration various share-price paths. Compensation cost is recognized ratably over the applicable vesting period. To the extent compensation cost relates to employees directly involved in oil and gas acquisition, exploration, and development activities, such amounts are capitalized to oil and gas properties. Amounts not capitalized to oil and gas properties are recognized as stock compensation expense. See Note 6 for additional information regarding our stock-based compensation.
Earnings (Loss) per Share
We calculate earnings (loss) per share recognizing that unvested share-based payment awards that contain non-forfeitable rights to dividends or dividend equivalents are “participating securities” and, therefore, should be included in computing earnings per share using the two-class earnings allocation method. The two-class method is an earnings allocation formula that determines earnings per share for each class of common stock and participating security according to dividends declared (or accumulated) and participation rights in undistributed earnings. Our unvested share-based payment awards, consisting of restricted stock and units, qualify as participating securities. See Note 7 for additional information regarding our earnings per share.
Lease Accounting
In February 2016, the Financial Accounting Standards Board (“FASB”) issued Accounting Standards Update (“ASU”) 2016-02, Leases (“Topic 842”). The FASB subsequently issued various ASUs that provided additional implementation guidance. Topic 842 requires lessees to recognize lease liabilities and right-of-use assets on the balance sheet for contracts that provide lessees with the right to control the use of identified assets for a period of time. The scope of Topic 842 excludes leases to explore for or use minerals, oil, natural gas, and similar nonregenerative resources. We adopted Topic 842 effective January 1, 2019, using the modified retrospective method applied to all leases that existed on that date, which resulted in the recognition of lease liabilities of $276.9 million and right-of-use assets of $265.0 million. In connection with adoption we made use of the following practical expedients, which are provided in Topic 842:
• | a package of practical expedients to not reassess: 1) whether expired or existing contracts are or contain a lease, 2) lease classification for expired or existing leases, and 3) initial direct costs for existing leases; |
• | an election not to apply the recognition requirements in Topic 842 to short-term leases (a lease that at commencement date has a lease term of 12 months or less and does not contain a purchase option that the company is reasonably certain to exercise); |
• | a practical expedient that permits combining lease and nonlease components in a contract and accounting for the combination as a lease (elected by asset class); and |
• | a practical expedient to not reassess certain land easements in existence prior to January 1, 2019. |
75
2. CAPITAL STOCK
Authorized capital stock consists of 200 million shares of common stock and 15 million shares of preferred stock. At December 31, 2019, there were 102.1 million shares of common stock and 62.5 thousand shares of preferred stock outstanding.
Redeemable Preferred Stocks
In February 2019, our Board of Directors created a new series of preferred stock, par value $0.01 per share, designated as 8.125 % Series A Cumulative Perpetual Convertible Preferred Stock (the “Convertible Preferred Stock”) and authorized 62.5 thousand shares. In March 2019, in conjunction with the Resolute acquisition (see Note 13), we issued all of these shares of Convertible Preferred Stock. Prior to this issuance, we had not issued any preferred stock. Holders of the Convertible Preferred Stock are entitled to receive, when, as, and if declared by the Board out of funds of Cimarex legally available for payment, cumulative cash dividends at the annual rate of 8.125 % of each share’s liquidation preference of $1,000 . Dividends on the preferred stock are payable quarterly in arrears and accumulate from the most recent date as to which dividends have been paid. In the event of any liquidation, winding up, or dissolution of Cimarex, whether voluntary or involuntary, each holder will be entitled to receive in respect of its shares and to be paid out of the assets of Cimarex legally available for distribution to its stockholders, after satisfaction of liabilities to Cimarex’s creditors and any senior stock (of which there is currently none) and before any payment or distribution is made to holders of junior stock (including common stock), the liquidation preference of $1,000 per share, with the total liquidation preference being $62.5 million in the aggregate. Each holder has the right at any time, at its option, to convert any or all of such holder’s shares of Convertible Preferred Stock at an initial conversion rate of 8.0421 shares of fully paid and nonassessable shares of our common stock and $471.40 in cash per share of Convertible Preferred Stock. The initial conversion rate of 8.0421 adjusts upon the occurrence of certain events, including the payment of cash dividends to common shareholders, and is 8.13828 as of December 31, 2019. Additionally, at any time on or after October 15, 2021, we shall have the right, at our option, if the closing sale price of our common stock meets certain criteria, to elect to cause all, and not part, of the outstanding shares of Convertible Preferred Stock to be automatically converted into that number of shares of Cimarex common stock for each share of Convertible Preferred Stock equal to the conversion rate in effect on the mandatory conversion date as such terms are defined in the Certificate of Designations for the Convertible Preferred Stock and $471.40 in cash per share of Convertible Preferred Stock. As a result of the cash redemption features included in the Convertible Preferred Stock conversion option, with such conversion not solely within our control, the instruments are classified as Redeemable preferred stock in temporary equity on the Consolidated Balance Sheet.
Dividends
Common Stock
A quarterly cash dividend has been paid on our common stock every quarter since the first quarter of 2006. In each quarter of 2019 a $0.20 per common share dividend was declared. A dividend of $0.18 per common share was declared in both the third and fourth quarters of 2018 while a dividend of $0.16 per common share was declared in the first and second quarters of 2018. In each quarter of 2017 an $0.08 per common share dividend was declared. We typically declare dividends in one quarter and pay them in the following quarter. At December 31, 2019, we had dividends payable to common stock of $20.5 million that was included in “Accrued liabilities — Other”. Dividends declared are recorded as a reduction of retained earnings to the extent retained earnings are available at the close of the period prior to the date of the declared dividend. Dividends in excess of retained earnings are recorded as a reduction of additional paid-in capital. All dividends declared during 2019 were recorded as a reduction of retained earnings. During 2018, the dividend declared during the first quarter was recorded as a reduction of additional paid-in capital, while the remaining three dividends declared were recorded as a reduction of retained earnings. All dividends declared during 2017 were recorded as a reduction of additional paid-in capital. Nonforfeitable dividends paid on stock awards that subsequently forfeit are reclassified out of retained earnings or additional paid-in capital, as applicable, to compensation expense in the period in which the forfeitures occur. Dividends accrued and unpaid on performance
76
stock awards that are canceled upon completion of the vesting period due to the performance criteria not being met, are reversed out of retained earnings or additional paid-in capital, as applicable, in the period in which the cancellations occur. Future dividend payments will depend on our level of earnings, financial requirements, and other factors considered relevant by our Board of Directors.
Preferred Stock
In each quarter of 2019 our Board of Directors declared a cash dividend of $20.3125 per share of Convertible Preferred Stock. All dividends declared during 2019 were recorded as a reduction of retained earnings. At December 31, 2019, we had dividends payable to preferred stock of $1.3 million that was included in “Accrued liabilities — Other”.
3. LONG-TERM DEBT
Long-term debt at December 31, 2019 and 2018 consisted of the following:
December 31, 2019 | December 31, 2018 | |||||||||||||||||||||||
(in thousands) | Principal | Unamortized Debt Issuance Costs and Discounts (1) | Long-term Debt, net | Principal | Unamortized Debt Issuance Costs and Discount (1) | Long-term Debt, net | ||||||||||||||||||
4.375% notes due 2024 | $ | $ | ( | ) | $ | $ | $ | ( | ) | $ | ||||||||||||||
3.90% notes due 2027 | ( | ) | ( | ) | ||||||||||||||||||||
4.375% notes due 2029 | ( | ) | ||||||||||||||||||||||
Total long-term debt | $ | $ | ( | ) | $ | $ | $ | ( | ) | $ | ||||||||||||||
________________________________________
(1) | The |
Bank Debt
On February 5, 2019, we entered into an Amended and Restated Credit Agreement for our senior unsecured revolving credit facility (“Credit Facility”). Among other things, the amended and restated credit facility increased the aggregate commitments to $1.25 billion with an option for us to increase the aggregate commitments to $1.5 billion, and extended the maturity date to February 5, 2024. There is no borrowing base subject to the discretion of the lenders based on the value of our proved reserves under the Credit Facility. As of December 31, 2019, we had no bank borrowings outstanding under the Credit Facility, but did have letters of credit of $2.5 million outstanding, leaving an unused borrowing availability of $1.248 billion. During the year ended December 31, 2019, we borrowed and repaid an aggregate of $2.12 billion, on the Credit Facility to meet cash requirements as needed.
At our option, borrowings under the Credit Facility may bear interest at either (a) LIBOR (or an alternate rate determined by the administrative agent for the Credit Facility in accordance with the Credit Facility when LIBOR is no longer available) plus 1.125 - 2.0 % based on the credit rating for our senior unsecured long-term debt, or (b) a base rate (as defined in the credit agreement) plus 0.125 - 1.0 %, based on the credit rating for our senior unsecured long-term debt. Unused borrowings are subject to a commitment fee of 0.125 - 0.35 %, based on the credit rating for our senior unsecured long-term debt.
77
The Credit Facility contains representations, warranties, covenants, and events of default that are customary for investment grade, senior unsecured bank credit agreements, including a financial covenant for the maintenance of a defined total debt-to-capital ratio of no greater than 65 %. As of December 31, 2019, we were in compliance with all of the financial covenants.
At December 31, 2019 and 2018, we had $4.0 million and $2.2 million, respectively, of unamortized debt issuance costs associated with our Credit Facility, which were recorded as assets and included in “Other assets” in our balance sheets. The costs are being amortized to interest expense ratably over the life of the Credit Facility. We incurred $3.0 million in additional debt issuance costs in amending our Credit Facility.
Senior Notes
On March 8, 2019, we issued $500.0 million aggregate principal amount of 4.375 % senior unsecured notes due March 15, 2029 at 99.862 % of par to yield 4.392 % per annum. We received $494.7 million in net cash proceeds, after deducting underwriters’ fees, discount, and debt issuance costs. The notes bear an annual interest rate of 4.375 % and interest is payable semiannually on March 15 and September 15, with the first payment made on September 15, 2019. We used the net proceeds to repay borrowings under our Credit Facility that were used to help fund the Resolute acquisition on March 1, 2019. The effective interest rate on these notes, including the amortization of debt issuance costs and discount, is 4.50 %.
On April 10, 2017, we issued $750 million aggregate principal amount of 3.90 % senior unsecured notes due May 15, 2027 at 99.748 % of par to yield 3.93 % per annum. We received $741.8 million in net cash proceeds, after deducting underwriters’ fees, discount, and debt issuance costs. The notes bear an annual interest rate of 3.90 % and interest is payable semiannually on May 15 and November 15. The effective interest rate on these notes, including the amortization of debt issuance costs and discount, is 4.01 %. Along with cash on hand, we used the proceeds to fund the early extinguishment of $750 million aggregate principal amount of 5.875 % notes whose original maturity date was May 1, 2022. During the year ended December 31, 2017, we recognized a loss on early extinguishment of debt related to these transactions of $28.2 million, composed primarily of tender and redemption premiums of $22.6 million and the write-off of $5.3 million of unamortized debt issuance costs.
In June 2014, we issued $750 million aggregate principal amount of 4.375 % senior unsecured notes at par. These notes are due June 1, 2024 and interest is payable semiannually on June 1 and December 1. The effective interest rate on these notes, including the amortization of debt issuance costs, is 4.50 %.
Each of our senior unsecured notes is governed by an indenture containing certain covenants, events of default, and other restrictive provisions with which we were in compliance as of December 31, 2019. At December 31, 2019, we had accrued interest related to our notes of $12.8 million that was included in “Accrued liabilities — Other”.
78
4. DERIVATIVE INSTRUMENTS
We periodically use derivative instruments to mitigate volatility in commodity prices. While the use of these instruments limits the downside risk of adverse price changes, their use may also limit future cash flow from favorable price changes. Depending on changes in oil and gas futures markets and management’s view of underlying supply and demand trends, we may increase or decrease our derivative positions from current levels.
As of December 31, 2019, we have entered into oil and gas collars and oil basis swaps. Under our collars, we receive the difference between the published index price and a floor price if the index price is below the floor price or we pay the difference between the ceiling price and the index price if the index price is above the ceiling price. No amounts are paid or received if the index price is between the floor and the ceiling prices. By using a collar, we have fixed the minimum and maximum prices we can receive on the underlying production. Our basis swaps are settled based on the difference between a published index price plus a fixed differential and the applicable local index price under which the underlying production is sold. By using a basis swap, we have fixed the differential between the published index price and certain of our physical pricing points. For our Permian oil production, the basis swaps fix the price differential between the WTI NYMEX (Cushing Oklahoma) price and the WTI Midland price. For our Permian and Mid-Continent gas production, the contract prices in our collars are consistent with the index prices used to sell our production. The following tables summarize our outstanding derivative contracts as of December 31, 2019:
Oil Collars | First Quarter | Second Quarter | Third Quarter | Fourth Quarter | Total | |||||||||||||||
2020: | ||||||||||||||||||||
WTI (1) | ||||||||||||||||||||
Volume (Bbls) | ||||||||||||||||||||
Weighted Avg Price - Floor | $ | $ | $ | $ | $ | |||||||||||||||
Weighted Avg Price - Ceiling | $ | $ | $ | $ | $ | |||||||||||||||
2021: | ||||||||||||||||||||
WTI (1) | ||||||||||||||||||||
Volume (Bbls) | ||||||||||||||||||||
Weighted Avg Price - Floor | $ | $ | $ | $ | $ | |||||||||||||||
Weighted Avg Price - Ceiling | $ | $ | $ | $ | $ | |||||||||||||||
________________________________________
(1) | The index price for these collars is West Texas Intermediate (“WTI”) as quoted on the New York Mercantile Exchange (“NYMEX”). |
79
Gas Collars | First Quarter | Second Quarter | Third Quarter | Fourth Quarter | Total | |||||||||||||||
2020: | ||||||||||||||||||||
PEPL (1) | ||||||||||||||||||||
Volume (MMBtu) | ||||||||||||||||||||
Weighted Avg Price - Floor | $ | $ | $ | $ | $ | |||||||||||||||
Weighted Avg Price - Ceiling | $ | $ | $ | $ | $ | |||||||||||||||
Perm EP (2) | ||||||||||||||||||||
Volume (MMBtu) | ||||||||||||||||||||
Weighted Avg Price - Floor | $ | $ | $ | $ | $ | |||||||||||||||
Weighted Avg Price - Ceiling | $ | $ | $ | $ | $ | |||||||||||||||
Waha (3) | ||||||||||||||||||||
Volume (MMBtu) | ||||||||||||||||||||
Weighted Avg Price - Floor | $ | $ | $ | $ | $ | |||||||||||||||
Weighted Avg Price - Ceiling | $ | $ | $ | $ | $ | |||||||||||||||
2021: | ||||||||||||||||||||
PEPL (1) | ||||||||||||||||||||
Volume (MMBtu) | ||||||||||||||||||||
Weighted Avg Price - Floor | $ | $ | $ | $ | $ | |||||||||||||||
Weighted Avg Price - Ceiling | $ | $ | $ | $ | $ | |||||||||||||||
________________________________________
(1) | The index price for these collars is Panhandle Eastern Pipe Line, Tex/OK Mid-Continent Index (“PEPL”) as quoted in Platt’s Inside FERC. |
(2) | The index price for these collars is El Paso Natural Gas Company, Permian Basin Index (“Perm EP”) as quoted in Platt’s Inside FERC. |
(3) | The index price for these collars is Waha West Texas Natural Gas Index (“Waha”) as quoted in Platt’s Inside FERC. |
Oil Basis Swaps | First Quarter | Second Quarter | Third Quarter | Fourth Quarter | Total | |||||||||||||||
2020: | ||||||||||||||||||||
WTI Midland (1) | ||||||||||||||||||||
Volume (Bbls) | ||||||||||||||||||||
Weighted Avg Differential (2) | $ | $ | $ | $ | $ | |||||||||||||||
2021: | ||||||||||||||||||||
WTI Midland (1) | ||||||||||||||||||||
Volume (Bbls) | ||||||||||||||||||||
Weighted Avg Differential (2) | $ | $ | $ | $ | $ | |||||||||||||||
________________________________________
(1) | The index price we pay under these basis swaps is WTI Midland as quoted by Argus Americas Crude. |
(2) | The index price we receive under these basis swaps is WTI as quoted on the NYMEX plus the weighted average differential shown in the table. |
80
The following table summarizes our derivative contracts entered into subsequent to December 31, 2019 through February 19, 2020:
Oil Basis Swaps | First Quarter | Second Quarter | Third Quarter | Fourth Quarter | Total | |||||||||||||||
2020: | ||||||||||||||||||||
WTI Midland (1) | ||||||||||||||||||||
Volume (Bbls) | ||||||||||||||||||||
Weighted Avg Differential (2) | $ | $ | $ | $ | $ | |||||||||||||||
2021: | ||||||||||||||||||||
WTI Midland (1) | ||||||||||||||||||||
Volume (Bbls) | ||||||||||||||||||||
Weighted Avg Differential (2) | $ | $ | $ | $ | $ | |||||||||||||||
________________________________________
(1) | The index price we pay under these basis swaps is WTI Midland as quoted by Argus Americas Crude. |
(2) | The index price we receive under these basis swaps is WTI as quoted on the NYMEX less the weighted average differential shown in the table. |
Derivative Gains and Losses
Net gains and losses on our derivative instruments are a function of fluctuations in the underlying commodity index prices as compared to the contracted prices and the monthly cash settlements (if any) of the instruments. We have elected not to designate our derivatives as hedging instruments for accounting purposes and, therefore, we do not apply hedge accounting treatment to our derivative instruments. Consequently, changes in the fair value of our derivative instruments and cash settlements on the instruments are included as a component of operating costs and expenses as either a net gain or loss on derivative instruments. Cash settlements of our contracts are included in cash flows from operating activities in our statements of cash flows. The following table presents the components of Loss (gain) on derivative instruments, net for the periods indicated.
Years Ended December 31, | ||||||||||||
(in thousands) | 2019 | 2018 | 2017 | |||||||||
Decrease (increase) in fair value of derivative instruments, net: | ||||||||||||
Gas contracts | $ | ( | ) | $ | $ | ( | ) | |||||
Oil contracts | ( | ) | ||||||||||
( | ) | ( | ) | |||||||||
Cash payments (receipts) on derivative instruments, net: | ||||||||||||
Gas contracts | ( | ) | ( | ) | ( | ) | ||||||
Oil contracts | ||||||||||||
Loss (gain) on derivative instruments, net | $ | $ | ( | ) | $ | ( | ) | |||||
81
Derivative Fair Value
Our derivative contracts are carried at their fair value on our balance sheet using Level 2 inputs and are subject to master netting arrangements, which allow us to offset recognized asset and liability fair value amounts on contracts with the same counterparty. Our accounting policy is to not offset asset and liability positions in our balance sheets.
The following tables present the amounts and classifications of our derivative assets and liabilities as of December 31, 2019 and 2018, as well as the potential effect of netting arrangements on our recognized derivative asset and liability amounts.
December 31, 2019 | ||||||||||
(in thousands) | Balance Sheet Location | Asset | Liability | |||||||
Oil contracts | Current assets — Derivative instruments | $ | $ | |||||||
Gas contracts | Current assets — Derivative instruments | |||||||||
Oil contracts | Non-current assets — Derivative instruments | |||||||||
Oil contracts | Current liabilities — Derivative instruments | |||||||||
Oil contracts | Non-current liabilities — Derivative instruments | |||||||||
Gas contracts | Non-current liabilities — Derivative instruments | |||||||||
Total gross amounts presented in the balance sheet | ||||||||||
Less: gross amounts not offset in the balance sheet | ( | ) | ( | ) | ||||||
Net amount | $ | $ | ||||||||
December 31, 2018 | ||||||||||
(in thousands) | Balance Sheet Location | Asset | Liability | |||||||
Oil contracts | Current assets — Derivative instruments | $ | $ | |||||||
Gas contracts | Current assets — Derivative instruments | |||||||||
Oil contracts | Non-current assets — Derivative instruments | |||||||||
Oil contracts | Current liabilities — Derivative instruments | |||||||||
Gas contracts | Current liabilities — Derivative instruments | |||||||||
Oil contracts | Non-current liabilities — Derivative instruments | |||||||||
Gas contracts | Non-current liabilities — Derivative instruments | |||||||||
Total gross amounts presented in the balance sheet | ||||||||||
Less: gross amounts not offset in the balance sheet | ( | ) | ( | ) | ||||||
Net amount | $ | $ | ||||||||
We are exposed to financial risks associated with our derivative contracts from non-performance by our counterparties. We mitigate our exposure to any single counterparty by contracting with a number of financial institutions, each of which has a high credit rating and is a member of our bank credit facility. Our member banks do not require us to post collateral for our derivative liability positions, nor do we require our counterparties to post collateral for our benefit. In the future we may enter into derivative instruments with counterparties outside our bank group to obtain competitive terms and to spread counterparty risk.
82
5. FAIR VALUE MEASUREMENTS
Fair value is the price that would be received to sell an asset or paid to transfer a liability in an orderly transaction between market participants at the measurement date. The FASB has established a fair value hierarchy that prioritizes the inputs to valuation techniques used to measure fair value. This hierarchy consists of three broad levels. Level 1 inputs are the highest priority and consist of unadjusted quoted prices in active markets for identical assets and liabilities. Level 2 are inputs other than quoted prices that are observable for the asset or liability, either directly or indirectly. Level 3 are unobservable inputs for an asset or liability.
The following table provides fair value measurement information for certain assets and liabilities as of December 31, 2019 and 2018.
December 31, 2019 | December 31, 2018 | |||||||||||||||
(in thousands) | Book Value | Fair Value | Book Value | Fair Value | ||||||||||||
Financial Assets (Liabilities): | ||||||||||||||||
4.375% Notes due 2024 | $ | ( | ) | $ | ( | ) | $ | ( | ) | $ | ( | ) | ||||
3.90% Notes due 2027 | $ | ( | ) | $ | ( | ) | $ | ( | ) | $ | ( | ) | ||||
4.375% Notes due 2029 | $ | ( | ) | $ | ( | ) | $ | $ | ||||||||
Derivative instruments — assets | $ | $ | $ | $ | ||||||||||||
Derivative instruments — liabilities | $ | ( | ) | $ | ( | ) | $ | ( | ) | $ | ( | ) | ||||
Assessing the significance of a particular input to the fair value measurement requires judgment, including the consideration of factors specific to the asset or liability. The fair value (Level 1) of our fixed rate notes was based on quoted market prices. The fair value of our derivative instruments (Level 2) was estimated using discounted cash flow and option pricing models. These models use certain observable variables including forward prices, volatility curves, interest rates, and credit ratings and spreads. The fair value estimates are adjusted relative to non-performance risk as appropriate. See Note 4 for further information on the fair value of our derivative instruments.
Other Financial Instruments
The carrying amounts of our cash, cash equivalents, accounts receivable, accounts payable, and accrued liabilities approximate fair value because of the short-term maturities and/or liquid nature of these assets and liabilities. Included in “Accrued liabilities — Other” at December 31, 2019 are: (i) accrued operating expenses (e.g. production, transportation, and gathering expenses) of approximately $74.7 million and (ii) accrued general and administrative, primarily payroll-related, costs of approximately $43.3 million. Included in “Accrued liabilities — Other” at December 31, 2018 are: (i) accrued operating expenses (e.g. production, transportation, and gathering expenses) of approximately $69.1 million, (ii) accrued general and administrative, primarily payroll-related, costs of approximately $47.4 million, and (iii) an accrual of approximately $35.8 million representing the amount by which checks issued, but not yet presented to our banks, exceeded balances in applicable bank accounts.
Most of our accounts receivable balances are uncollateralized and result from transactions with other companies in the oil and gas industry. Concentration of customers may impact our overall credit risk because our customers may be similarly affected by changes in economic or other conditions within the industry.
We conduct credit analyses prior to making any sales to new customers or increasing credit for existing customers and may require parent company guarantees, letters of credit, or prepayments when deemed necessary.
We routinely assess the recoverability of all material accounts receivable to determine their collectability. We accrue a reserve to the allowance for doubtful accounts when it is probable that a receivable will not be collected and
83
the amount of the reserve may be reasonably estimated. At December 31, 2019 and 2018, the allowance for doubtful accounts totaled $3.6 million and $2.7 million, respectively.
Major Customers
In each of the years ended December 31, 2019, 2018, and 2017, we made sales to two customers that each amounted to 10% or more of our consolidated revenues for the respective year. Sales to those two customers accounted for 29 % and 25 %, respectively, of our consolidated revenues in 2019, 21 % and 23 %, respectively, of our consolidated revenues in 2018, and 13 % and 21 %, respectively, of our consolidated revenues in 2017.
If any one of our major customers was to stop purchasing our production, we believe there are a number of other purchasers to whom we could sell our production with some delay. If multiple significant customers were to discontinue purchasing our production, we believe there would be challenges initially, but ample markets to handle the disruption.
6. STOCK-BASED AND OTHER COMPENSATION
Equity Incentive Plan
Our 2019 Equity Incentive Plan (the “2019 Plan”) was approved by stockholders in May 2019 and no awards will be made under our previous plans. Outstanding awards under the previous plans were not impacted. A total of 6.3 million shares of common stock may be issued under the 2019 Plan, including shares available from the previous plans. The 2019 Plan provides for grants of options, stock appreciation rights, restricted stock, restricted stock units, performance stock units, cash awards, and other stock-based awards.
Stock-based Compensation Cost
We have recognized non-cash stock-based compensation cost as shown below. Historical amounts may not be representative of future amounts as the value of future awards may vary from historical amounts.
Years Ended December 31, | ||||||||||||
(in thousands) | 2019 | 2018 | 2017 | |||||||||
Restricted stock awards: | ||||||||||||
Performance stock awards | $ | $ | $ | |||||||||
Service-based stock awards | ||||||||||||
Stock option awards | ||||||||||||
Total stock compensation cost | ||||||||||||
Less amounts capitalized to oil and gas properties | ( | ) | ( | ) | ( | ) | ||||||
Stock compensation expense | $ | $ | $ | |||||||||
Periodic stock compensation expense will fluctuate based on the grant date fair value of awards, the number of awards, the requisite service period of the awards, employee forfeitures, and the timing of the awards. The increase in total stock compensation cost in 2019 as compared to 2018 is primarily due to performance stock award forfeitures that occurred during 2018 as well as due to expense on awards granted during the periods more than offsetting the expense on awards that vested during the periods. Our accounting policy is to account for forfeitures in compensation cost when they occur.
84
We adopted Accounting Standards Update 2016-09, Improvements to Employee Share-Based Payment Accounting (“ASU 2016-09”) on January 1, 2017. The amendments within ASU 2016-09 related to the timing of when excess tax benefits and tax benefits on dividends on nonvested equity shares are recognized and accounting for forfeitures were adopted using a modified retrospective method. In accordance with this method, we recorded a cumulative-effect adjustment that increased beginning deferred income tax assets by $33.1 million, reduced beginning accumulated deficit by $28.7 million, and increased beginning additional paid-in capital by $4.4 million.
Restricted Stock
The following table provides information about restricted stock awards granted during the last three years.
Years Ended December 31, | ||||||||||||||||||||
2019 | 2018 | 2017 | ||||||||||||||||||
Number of Shares | Weighted Average Grant Date Fair Value | Number of Shares | Weighted Average Grant Date Fair Value | Number of Shares | Weighted Average Grant Date Fair Value | |||||||||||||||
Performance stock awards | $ | $ | $ | |||||||||||||||||
Service-based stock awards | $ | $ | $ | |||||||||||||||||
Total restricted stock awards | $ | $ | $ | |||||||||||||||||
Performance stock awards are granted to eligible executives and are subject to service and market condition-based vesting determined by our stock price performance relative to defined peer groups’ stock price performance. For awards granted prior to 2018, after three years of continued service, an executive will be entitled to vest in 50 % to 100 % of the award depending on the stock price performance. For awards granted in 2018 and 2019, after three years of continued service, an executive will be entitled to vest in 0 % to 200 % of the award depending on the stock price performance. In accordance with Internal Revenue Code Section 162(m), certain of the amounts awarded may not be deductible for tax purposes. Service-based stock awards are granted to eligible employees and non-employee directors and have vesting schedules ranging from one to five years . The majority of our service-based stock awards cliff vest five years from the grant date.
Compensation cost for the performance stock awards is based on the grant date fair value of the award utilizing a Monte Carlo simulation model. Compensation cost for the service-based stock awards is based upon the grant date market value of the award. Such costs are recognized ratably over the applicable vesting period.
The following table provides information on restricted stock activity during the year.
Service-based | Performance (subject to market conditions) | ||||||||||||
Number of Shares | Weighted Average Grant Date Fair Value | Number of Shares | Weighted Average Grant Date Fair Value | ||||||||||
Outstanding as of January 1, 2019 | $ | $ | |||||||||||
Vested | ( | ) | $ | ( | ) | $ | |||||||
Granted | $ | $ | |||||||||||
Canceled (1) | $ | ( | ) | $ | |||||||||
Forfeited | ( | ) | $ | $ | |||||||||
Outstanding as of December 31, 2019 | $ | $ | |||||||||||
85
________________________________________
(1) | These performance shares were canceled since the market condition was not satisfied as of the end of the performance period. |
The total vest date market value of restricted stock that vested during the years ended December 31, 2019, 2018, and 2017 was $15.1 million, $34.1 million, and $54.4 million, respectively.
Unrecognized compensation cost related to unvested restricted stock at December 31, 2019 was $96.9 million. We expect to recognize that cost over a weighted average period of 2.6 years.
Restricted Units
As of December 31, 2019 and 2018, we had 8,838 restricted units outstanding. These represent restricted units held by a non-employee director who has elected to defer payment of common stock represented by the units until termination of his service on the Board of Directors.
Stock Options
Options outstanding as of December 31, 2019 expire seven to ten years from the grant date and have service-based vesting whereby the awards vest in increments of one-third on each of the first three anniversary dates of the grant. The exercise price for an option under the 2019 Plan and the plan in effect immediately prior to the 2019 Plan, is at least equal to the closing price of our common stock as reported by the New York Stock Exchange (“NYSE”) on the date of grant. The previous plans provided that all grants have an exercise price of the average of the high and low prices of our common stock as reported by the NYSE on the date of grant.
Compensation cost related to stock options is based on the grant date fair value of the award and is recognized ratably over the applicable vesting period. We estimate the fair value using the Black-Scholes option-pricing model. Expected volatilities are based on the historical volatility of our common stock. We also use historical data to estimate the expected years until exercise. We use U.S. Treasury bond rates in effect at the grant date for our risk-free interest rates.
The following summarizes information regarding options granted, including the assumptions used to determine the fair value of those options.
Years Ended December 31, | |||||||||||
2019 | 2018 | 2017 | |||||||||
Options granted | |||||||||||
Weighted average grant date fair value | $ | $ | $ | ||||||||
Weighted average exercise price | $ | $ | $ | ||||||||
Total fair value (in thousands) | $ | $ | $ | ||||||||
Expected years until exercise | |||||||||||
Expected stock volatility | % | % | % | ||||||||
Dividend yield | % | % | % | ||||||||
Risk-free interest rate | % | % | % | ||||||||
86
Information about outstanding stock options is summarized below.
Number of Options | Weighted Average Exercise Price | Weighted Average Remaining Term | Aggregate Intrinsic Value (in thousands) | |||||||||
Outstanding as of January 1, 2019 | $ | |||||||||||
Exercised | ( | ) | $ | |||||||||
Granted | $ | |||||||||||
Canceled | ( | ) | $ | |||||||||
Forfeited | ( | ) | $ | |||||||||
Outstanding as of December 31, 2019 | $ | $ | ||||||||||
Exercisable as of December 31, 2019 | $ | $ | ||||||||||
The following table provides information regarding options exercised and the grant date fair value of options vested.
Years Ended December 31, | ||||||||||||
(in thousands) | 2019 | 2018 | 2017 | |||||||||
Cash received from option exercises | $ | $ | $ | |||||||||
Intrinsic value of options exercised | $ | $ | $ | |||||||||
Grant date fair value of options vested | $ | $ | $ | |||||||||
The following summary reflects the status of non-vested stock options as of December 31, 2019 and changes during the year.
Number of Options | Weighted Average Grant Date Fair Value | Weighted Average Exercise Price | ||||||||
Non-vested as of January 1, 2019 | $ | $ | ||||||||
Vested | ( | ) | $ | $ | ||||||
Granted | $ | $ | ||||||||
Forfeited | ( | ) | $ | $ | ||||||
Non-vested as of December 31, 2019 | $ | $ | ||||||||
As of December 31, 2019, there was $2.8 million of unrecognized compensation cost related to non-vested stock options. We expect to recognize that cost over a weighted average period of 2.1 years.
Other Compensation
We maintain and sponsor a contributory 401(k) plan for our employees. Employer contributions related to the plan were $8.7 million, $13.1 million, and $10.4 million for 2019, 2018, and 2017, respectively. Included in the 2018 and 2017 amounts were accrued employer discretionary contributions. No such employer discretionary contributions were accrued for 2019.
87
7. EARNINGS (LOSS) PER SHARE
The calculations of basic and diluted net earnings (loss) per common share under the two-class method are presented below. Earnings (loss) per share are based on actual figures rather than the rounded figures presented.
Year Ended December 31, 2019 | |||||||||||
(in thousands, except per share information) | Income (Numerator) | Shares (Denominator) | Per-Share Amount | ||||||||
Net loss | $ | ( | ) | ||||||||
Less: dividends attributable to participating securities (1) | ( | ) | |||||||||
Less: preferred stock dividends | ( | ) | |||||||||
Basic loss per share | |||||||||||
Loss available to common stockholders | ( | ) | $ | ( | ) | ||||||
Effects of dilutive securities | |||||||||||
Options (2) | |||||||||||
Diluted loss per share | |||||||||||
Loss available to common stockholders and assumed conversions | $ | ( | ) | $ | ( | ) | |||||
Year Ended December 31, 2018 | |||||||||||
(in thousands, except per share information) | Income (Numerator) | Shares (Denominator) | Per-Share Amount | ||||||||
Net income | $ | ||||||||||
Less: dividends and net income attributable to participating securities | ( | ) | |||||||||
Basic earnings per share | |||||||||||
Income available to common stockholders | $ | ||||||||||
Effects of dilutive securities | |||||||||||
Options (2) | |||||||||||
Diluted earnings per share | |||||||||||
Income available to common stockholders and assumed conversions | $ | $ | |||||||||
Year Ended December 31, 2017 | |||||||||||
(in thousands, except per share information) | Income (Numerator) | Shares (Denominator) | Per-Share Amount | ||||||||
Net income | $ | ||||||||||
Less: dividends and net income attributable to participating securities | ( | ) | |||||||||
Basic earnings per share | |||||||||||
Income available to common stockholders | $ | ||||||||||
Effects of dilutive securities | |||||||||||
Options (2) | |||||||||||
Diluted earnings per share | |||||||||||
Income available to common stockholders and assumed conversions | $ | $ | |||||||||
88
________________________________________
(1) | Participating securities do not have a contractual obligation to share in the losses of the entity, therefore, net losses are not attributable to participating securities. |
(2) |
8. ASSET RETIREMENT OBLIGATIONS
The following table reflects the components of the change in the carrying amount of the asset retirement obligation for the years ended December 31, 2019 and 2018.
(in thousands) | 2019 | 2018 | ||||||
Asset retirement obligation at January 1, | $ | $ | ||||||
Liabilities incurred | ||||||||
Liability settlements and disposals | ( | ) | ( | ) | ||||
Accretion expense | ||||||||
Revisions of estimated liabilities | ||||||||
Asset retirement obligation at December 31, | ||||||||
Less current obligation | ||||||||
Long-term asset retirement obligation | $ | $ | ||||||
For the year ended December 31, 2019, liabilities incurred included $9.4 million for the Resolute acquisition. For the years ended, December 31, 2019 and 2018, the liability settlements and disposals included $9.3 million and $13.7 million, respectively, related to properties that were sold.
89
9. INCOME TAXES
The components of the provision for income taxes are as follows:
Years Ended December 31, | ||||||||||||
(in thousands) | 2019 | 2018 | 2017 | |||||||||
Current taxes: | ||||||||||||
Federal benefit | $ | $ | ( | ) | $ | ( | ) | |||||
State expense (benefit) | ( | ) | ||||||||||
( | ) | ( | ) | |||||||||
Deferred taxes: | ||||||||||||
Federal (benefit) expense | ( | ) | ||||||||||
State (benefit) expense | ( | ) | ||||||||||
( | ) | |||||||||||
$ | ( | ) | $ | $ | ||||||||
Federal income tax expense (benefit) for the years presented differs from the amounts that would be provided by applying the U.S. federal income tax rate, primarily due to the effect of state income taxes, non-deductible expenses, and changes in tax laws and tax rates enacted in the period. Reconciliations of the income tax expense (benefit) calculated at the federal statutory rate of 21% for 2019 and 2018 and 35% for 2017 to the total income tax expense (benefit) are as follows:
Years Ended December 31, | ||||||||||||
(in thousands) | 2019 | 2018 | 2017 | |||||||||
Provision at statutory rate | $ | ( | ) | $ | $ | |||||||
Effect of state taxes | ( | ) | ||||||||||
Acquisition-related costs | ||||||||||||
Tax credits and other permanent differences | ||||||||||||
Change in valuation allowance, net | ( | ) | ||||||||||
Stock-based compensation | ( | ) | ( | ) | ||||||||
Impact of reduction in federal statutory rate | ( | ) | ||||||||||
Income tax (benefit) expense | $ | ( | ) | $ | $ | |||||||
90
As a result of the enactment of H.R.1 (Public Law 115-97) on December 22, 2017, we remeasured our deferred tax assets and liabilities as of December 31, 2017 to reflect the reduction in the U.S. income tax rate from 35% to 21% for years after 2017. As a result of this remeasurement, we recorded an income tax benefit of $61.1 million and a corresponding $61.1 million decrease in net deferred tax liabilities as of December 31, 2017.
The components of net deferred taxes are as follows:
December 31, | ||||||||
(in thousands) | 2019 | 2018 | ||||||
Assets: | ||||||||
Stock compensation and other accrued amounts | $ | $ | ||||||
Net operating loss and other carryforwards, net of valuation allowance | ||||||||
Credit carryforward, net of valuation allowance | ||||||||
Liabilities: | ||||||||
Property, plant and equipment | ( | ) | ( | ) | ||||
Net deferred tax liabilities | $ | ( | ) | $ | ( | ) | ||
On March 1, 2019, we completed the acquisition of Resolute. For federal income tax purposes, the acquisition was a tax-free merger whereby Cimarex acquired carryover tax basis in Resolute’s tax assets and liabilities. As of December 31, 2019, we recorded a net deferred tax liability of $31.1 million to reflect the difference between the fair value of Resolute’s assets and liabilities recorded in the acquisition and the income tax basis of the assets and liabilities assumed. See Note 13 for more information regarding the preliminary purchase price allocation and subsequent adjustments made to it. The deferred tax liability includes certain deferred tax assets net of valuation allowances.
Because the acquisition resulted in a greater than 50 % ownership change in Resolute, the tax attributes Cimarex acquired from Resolute are subject to limitation pursuant to Section 382 of the Internal Revenue Code. Our ability to use the Resolute net operating losses (“NOLs”) and credits acquired is limited to an annual amount plus any built-in gains recognized within five years of the ownership change. The annual limitation amount is $19.6 million and the net unrealized built-in gain is projected to be $253.9 million. The acquired Resolute federal NOLs of $746.3 million have been reduced by a $57.6 million valuation allowance. Additionally, a full valuation allowance was recorded on an acquired capital loss carryforward of $67.7 million and enhanced oil recovery credit carryforwards of $4.0 million to reflect the expected tax effect of the Section 382 limitation. The Resolute federal NOLs will begin to expire in 2032.
At December 31, 2019, we had a U.S. net tax operating loss carryforward (including Resolute) of approximately $1.93 billion, which would expire in years 2032 through 2039. We believe that the carryforward, net of valuation allowance, will be utilized before it expires. We recorded a $9.7 million increase to the net operating loss carryforward at December 31, 2019 and a corresponding $9.7 million increase to the valuation allowance related to state net operating losses. The total valuation allowance on state net operating losses at December 31, 2019 was $119.0 million since it is not more likely than not that these additional state net operating losses will be utilized before they expire. We also had enhanced oil recovery and marginal well credits of $3.9 million at December 31, 2019.
At December 31, 2019 and 2018, we had no unrecognized tax benefits that would impact our effective rate and we have made no provisions for interest or penalties related to uncertain tax positions. The tax years 2016 through 2018 remain open to examination by the Internal Revenue Service of the United States. We file tax returns with various state taxing authorities which remain open to examination for tax years 2015 through 2018. We do not anticipate the need for any significant income tax payments in the near term.
91
10. COMMITMENTS AND CONTINGENCIES
Lease Commitments
Effective January 1, 2019, we began accounting for leases in accordance with Topic 842, which requires lessees to recognize lease liabilities and right-of-use assets on the balance sheet for contracts that provide lessees with the right to control the use of identified assets for periods of greater than 12 months. Prior to January 1, 2019, we accounted for leases in accordance with ASC Topic 840, Leases, under which operating leases were not recorded on the balance sheet.
Real Estate Leases
We have operating leases for office space in various locations that provide us the right to control the use of the specified office space over the term of the contract. These leases require us to make monthly “base rent” payments, as well as “additional payments” for our share of operating expenses and taxes incurred by the landlord. At our option, the terms of these leases can be renewed for varying periods, and in some cases may be terminated early at our option. As of December 31, 2019, these leases had remaining lease terms ranging from 4.4 to 6.7 years. These leases do not contain residual value guarantees, options to purchase the underlying office space, or terms or covenants that impose restrictions on our ability to pay dividends, incur debt, or enter into additional leases. We have no subleases of office space.
Lease liabilities associated with our real estate leases were recorded at the present value of the estimated future lease payments, after considering the following:
• | “Base rent” payments are considered fixed lease payments, while “additional payments” are considered variable lease payments. |
• | At commencement of each real estate lease we were not reasonably certain to exercise the option to renew or terminate such lease. |
• | The discount rate used to calculate each lease liability was based on our incremental borrowing rate, which was estimated utilizing trading metrics for our senior unsecured notes as adjusted using relevant market factors to develop a synthetic secured yield curve. |
• | As an accounting policy we have elected not to separate nonlease components from lease components for our real estate class of assets. |
• | Where applicable, we determined that the effect of accounting for the right to use land separately from other lease components would be insignificant. |
Production-Related Leases
We have operating leases for equipment used in connection with our oil and gas production operations, including well-head compressors, pipeline compressors, and artificial lift mechanisms. These leases provide us the right to control the use of explicitly or implicitly identified equipment during the term of the contract. These leases often include an “evergreen” provision that allows the contract term to continue on a month-to-month basis following expiration of the initial term stated in the contract. As of December 31, 2019, these leases had remaining lease terms ranging from one month to 10.6 years. These leases require us to make monthly payments of fixed amounts, which cover the cost of renting the equipment and, in some cases, the cost of maintaining the leased equipment. These leases do not typically require us to make variable lease payments. These leases do not contain residual value guarantees, options to purchase the underlying equipment, or terms or covenants that impose restrictions on our ability to pay dividends, incur debt, or enter into additional leases. We have no subleases of production-related equipment.
92
Lease liabilities associated with our production-related operating leases were recorded at the present value of the estimated future lease payments, after considering the following:
• | For leases with an evergreen provision, the term of the lease was determined to be the noncancellable period in the contract plus the period beyond the noncancellable period that we believe it is reasonably certain we will need the equipment for operational purposes, limited to the point in time at which both we and the lessor each have the right to terminate the lease without permission from the other party with no more than an insignificant penalty. |
• | The discount rate used to calculate each lease liability was based on our incremental borrowing rate, which was estimated utilizing trading metrics for our senior unsecured notes as adjusted using relevant market factors to develop a synthetic secured yield curve. |
• | As an accounting policy, we have elected not to separate nonlease components from lease components for our production-related class of assets. |
We have one finance lease, which results from a gathering agreement (the “Gathering Agreement”) on a gathering system. Under terms of the Gathering Agreement, we have the option to acquire a portion of the underlying gathering system upon termination of the Gathering Agreement. We make monthly payments under the Gathering Agreement based on the volume of oil gathered and a gathering rate per barrel, which is adjusted periodically. As of December 31, 2019, this lease had a remaining term of 5.9 years.
Exploration and Development-Related Leases
We have operating leases for equipment used in connection with our exploration and development activities, including drilling rigs, pressure pumping equipment, directional drilling tools, well-control devices, and various pieces of support equipment. These leases provide us the right to control the use of explicitly or implicitly identified equipment during the term of the contract. As of December 31, 2019, these leases had remaining lease terms of 12 months or less. These leases typically require us to make payments in amounts based on the usage of the underlying equipment. These leases do not contain residual value guarantees, options to purchase the underlying equipment, or terms or covenants that impose restrictions on our ability to pay dividends, incur debt, or enter into additional leases. We have no subleases of exploration and development-related equipment.
As an accounting policy, we have elected not to apply the recognition requirements of Topic 842 to our exploration and development-related class of assets with lease terms at commencement of 12 months or less. As such, we have not recorded any lease liabilities associated with our exploration and development-related leases. In addition, as an accounting policy we have elected not to separate nonlease components from lease components for our exploration and development-related class of assets.
93
Balance Sheet Presentation
The following tables present the amounts and classifications of our right-of-use assets and estimated lease liabilities as of December 31, 2019:
(in thousands) | Balance Sheet Location | December 31, 2019 | ||||
Operating lease right-of-use assets | Non-current assets — Fixed assets, net | $ | ||||
Finance lease right-of-use asset | Non-current assets — Other assets | |||||
Total right-of-use assets | $ | |||||
(in thousands) | Balance Sheet Location | December 31, 2019 | ||
Operating lease liabilities — current | Current liabilities — Operating leases | $ | ||
Operating lease liabilities — non-current | Non-current liabilities — Operating leases | |||
Finance lease liability — current | Current liabilities — Accrued liabilities-Other | |||
Finance lease liability — non-current | Non-current liabilities — Other liabilities | |||
Total lease liabilities | $ | |||
Lease Cost and Cash Flows
The following table summarizes estimated total lease cost, which includes amounts recognized in income and amounts capitalized for the indicated period:
(in thousands) | Year Ended December 31, 2019 | |||
Finance lease cost: | ||||
Amortization of right-of-use asset | $ | |||
Interest on lease liability | ||||
Operating lease cost: (1) | ||||
Production expense | ||||
Transportation, processing, and other operating | ||||
Gas gathering and other expense | ||||
General and administrative expense (2) | ||||
Short-term lease cost (3) | ||||
Total lease cost | $ | |||
________________________________________
(1) | Operating lease cost in the table above is composed of costs incurred under real estate and production-related leases. These costs are included in the indicated captions on the Consolidated Statements of Operations and Comprehensive Income (Loss). |
(2) | Includes variable lease costs of $ |
(3) | Short-term lease cost in the table above is composed of costs incurred under leases with terms of 12 months or less for right-of-use assets used in exploration and development activities. Payments under such leases are typically based on usage of the underlying right-of-use asset and, therefore, are also variable lease payments. These costs are capitalized as part of proved properties on the Consolidated Balance Sheet. |
94
The following table summarizes estimated cash paid for our leases for the indicated period:
(in thousands) | Year Ended December 31, 2019 | |||
Cash paid for amounts included in the measurement of lease liabilities: | ||||
Financing cash outflows from finance lease | $ | |||
Operating cash outflows from operating leases | $ | |||
Cash paid for short-term leases and variable lease payments: | ||||
Operating cash outflows from operating leases | $ | |||
Investing cash outflows from operating leases | $ | |||
During the year ended December 31, 2019, we recognized $91.7 million in right-of-use assets in connection with new operating leases entered into during the period.
Lease Liability Maturity Analysis
The following table presents the weighted-average remaining lease terms and discount rates of our leases as of the indicated date:
December 31, 2019 | |||
Weighted-average remaining lease term (in years): | |||
Finance lease | |||
Operating leases | |||
Weighted-average discount rate: | |||
Finance lease | % | ||
Operating leases | % | ||
The following table reflects the undiscounted future cash flows utilized in the calculation of the lease liabilities recorded at December 31, 2019:
December 31, 2019 | ||||||||
(in thousands) | Operating Leases | Finance Lease | ||||||
January 1, 2020 — December 31, 2020 | $ | $ | ||||||
January 1, 2021 — December 31, 2021 | ||||||||
January 1, 2022 — December 31, 2022 | ||||||||
January 1, 2023 — December 31, 2023 | ||||||||
January 1, 2024 — December 31, 2024 | ||||||||
Remaining periods | ||||||||
Total undiscounted future cash flows | ||||||||
Less effects of discounting | ( | ) | ( | ) | ||||
Lease liabilities recognized | $ | $ | ||||||
95
As of December 31, 2018, the following future minimum cash payments were required under leases for office space:
(in thousands) | December 31, 2018 | |||
2019 | $ | |||
2020 | ||||
2021 | ||||
2022 | ||||
2023 | ||||
Remaining periods | ||||
Total future minimum lease payments | $ | |||
In addition, as of December 31, 2018, we had various contractual commitments for compressor equipment under operating lease arrangements totaling $34.8 million with lease terms expiring from 1 - 35 months after December 31, 2018.
Other Commitments
At December 31, 2019, we had estimated commitments of approximately: (i) $321.7 million to finish drilling, completing, or performing other work on wells and various other infrastructure projects in progress and (ii) $6.6 million to finish gathering system construction in progress.
At December 31, 2019, we had firm sales contracts to deliver approximately 703.7 Bcf of gas over the next 11.5 years. If we do not deliver this gas, our estimated financial commitment, calculated using the January 2020 index price, would be approximately $1.03 billion. The value of this commitment will fluctuate due to price volatility and actual volumes delivered. However, we believe no financial commitment will be due based on our current proved reserves and production levels from which we can fulfill these volumetric obligations.
In connection with gas gathering and processing agreements, we have volume commitments over the next 9.0 years. If we do not deliver the committed gas or NGLs, as the case may be, the estimated maximum amount that would be payable under these commitments, calculated as of December 31, 2019, would be approximately $697.2 million. However, we believe no financial commitment will be due based on our current proved reserves and production levels from which we can fulfill these volumetric obligations.
We have minimum volume delivery commitments associated with agreements to reimburse connection costs to various pipelines. If we do not deliver this gas, or oil, as the case may be, the estimated maximum amount that would be payable under these commitments, calculated as of December 31, 2019, would be approximately $117.6 million. Of this total, we have accrued a liability of $4.5 million representing the estimated amount we will have to pay due to insufficient forecasted volumes at particular connection points.
At December 31, 2019, we have various firm transportation agreements for gas and oil pipeline capacity with end dates ranging from 2020 - 2028 under which we will have to pay an estimated $64.0 million over the remaining terms of the agreements. These agreements were entered into to support our residue gas and oil marketing efforts, and we believe we have sufficient reserves that will utilize this firm transportation.
All of the noted commitments were routine and made in the ordinary course of our business.
96
Litigation
In the ordinary course of business, we are involved with various litigation matters. When a loss contingency exists, we assess whether it is probable that an asset has been impaired or a liability has been incurred and, if so, we determine if the amount of loss can be reasonably estimated, all in accordance with guidance established by the FASB, and adjust our accruals accordingly. Though some of the related claims may be significant, the resolution of them, we believe, individually or in the aggregate, would not have a material adverse effect on our financial condition or results of operations after consideration of current accruals.
11. RELATED PARTY TRANSACTIONS
Helmerich & Payne, Inc. (“H&P”) provides contract drilling services to Cimarex. Cimarex incurred drilling costs of approximately $72.8 million, $80.1 million, and $52.6 million related to these services during the years ended December 31, 2019, 2018, and 2017, respectively. The amount incurred in 2019 is included in the short-term lease costs disclosed in Note 10. Hans Helmerich, a director of Cimarex, is Chairman of the Board of Directors of H&P.
12. SUPPLEMENTAL CASH FLOW INFORMATION
Years Ended December 31, | ||||||||||||
(in thousands) | 2019 | 2018 | 2017 | |||||||||
Cash paid during the period for: | ||||||||||||
Interest expense (net of capitalized amounts of $49,944, $19,969, and $23,113, respectively) (1) | $ | $ | $ | |||||||||
Income taxes | $ | $ | $ | |||||||||
Cash received for income tax refunds | $ | $ | $ | |||||||||
________________________________________
(1) | The year ended December 31, 2019 includes $ |
97
13. ACQUISITIONS AND DIVESTITURES
On August 31, 2018, we closed on the divestiture of oil and gas properties principally located in Ward County, Texas for which we received $534.6 million in net cash proceeds in 2018 as adjusted for customary closing adjustments to reflect an effective date of April 1, 2018 and transaction costs. This divestiture did not significantly alter the relationship between capitalized costs and proved reserves, therefore, in accordance with the full cost method of accounting, no gain or loss was recognized.
On March 1, 2019, we completed the acquisition of Resolute Energy Corporation, an independent oil and gas company focused on the acquisition and development of unconventional oil and gas properties in the Delaware Basin area of the Permian Basin of west Texas. The principal factors considered by management in making this acquisition included: (i) our expectation that Resolute’s assets’ attractive returns are competitive with those in our existing portfolio, (ii) the opportunity to apply our experience and learnings from already operating in this area to generating productivity gains from Resolute’s properties, (iii) the ability to increase our acreage position in the Delaware Basin, and (iv) the expectation that the acquisition will be financially accretive.
We acquired 100 % of the outstanding common shares and voting interests of Resolute in a cash and stock transaction. The acquisition date fair value of the consideration transferred totaled $820.3 million, which consisted of cash, common stock, and a newly created series of preferred stock (see Note 5 for more information on the preferred stock) as follows:
(in thousands) | Fair Value of Consideration Transferred | |||
Cash | $ | |||
Common stock (5,652 shares issued) | ||||
Preferred stock (63 shares issued) | ||||
$ | ||||
The fair value of the common stock issued as part of the consideration was determined on the basis of the closing market price of Cimarex common stock on the acquisition date. The fair value of the preferred stock issued as part of the consideration was determined using a multiple probability simulation model.
Preliminary Purchase Price Allocation
The Resolute acquisition has been accounted for as a business combination, using the acquisition method. The following table presents the preliminary allocation of the Resolute purchase price to the identifiable assets acquired and liabilities assumed based on the fair values at the acquisition date, with any excess of the purchase price over the estimated fair value of the identifiable net assets acquired recorded to goodwill. The table also presents the adjustments to the preliminary purchase price allocation recorded through December 31, 2019. The most significant adjustment was made to reduce the fair value of the unproved oil and gas properties acquired by $30.3 million based on the finalization of the quantity of acres acquired. The tax effect of this adjustment reduced the related deferred tax liability by $6.9 million. The completion of the final Resolute tax returns provided the underlying tax basis of Resolute’s assets and liabilities and net operating losses and resulted in a reduction of the deferred tax liability of $24.4 million. The remaining adjustments were related to finalization of some working capital balances. The offset to all of the adjustments is goodwill. The purchase price allocation remains preliminary as certain data necessary to finalize pre-acquisition working capital balances is not yet available. We expect to complete the purchase price allocation during the 12 -month period following the acquisition date, during which time the value of the assets and liabilities may be revised as appropriate.
98
The following table sets forth the preliminary purchase price allocation:
(in thousands) | March 1, 2019 | Adjustments | December 31, 2019 | |||||||||
Cash | $ | $ | $ | |||||||||
Accounts receivable | ||||||||||||
Other current assets | ( | ) | ||||||||||
Proved oil and gas properties | ||||||||||||
Unproved oil and gas properties | ( | ) | ||||||||||
Fixed assets | ( | ) | ||||||||||
Goodwill | ( | ) | ||||||||||
Other assets | ||||||||||||
Current liabilities | ( | ) | ( | ) | ( | ) | ||||||
Long-term debt | ( | ) | ( | ) | ||||||||
Deferred income taxes | ( | ) | ( | ) | ||||||||
Asset retirement obligation | ( | ) | ( | ) | ||||||||
Total identifiable net assets | $ | $ | $ | |||||||||
In connection with the acquisition, we assumed, and immediately repaid, $870.0 million principal amount of long-term debt consisting of $600.0 million of senior notes and $270.0 million of credit facility borrowings. On March 1, 2019, we repaid Resolute’s credit facility borrowings, delivered a notice of optional redemption of Resolute’s senior notes for an April 1, 2019 redemption date, and irrevocably deposited with a trustee the full amount of funds to repay the aggregate outstanding senior notes principal balance plus accrued and unpaid interest, incurring a $4.3 million loss on early extinguishment of debt. The cash consideration transferred and the repayment of Resolute’s long-term debt was funded using cash on hand and borrowings on our Credit Facility. We subsequently repaid the borrowings on our Credit Facility using the net proceeds from the March 8, 2019 issuance of $500.0 million aggregate principal amount of 4.375 % senior unsecured notes (see Note 3 for more information on our debt issuance).
Goodwill of $96.6 million has been recognized principally as a result of recording net deferred tax liabilities arising from the difference between the tax basis and the purchase price allocated to Resolute’s assets and liabilities, and anticipated opportunities for cost savings through administrative and operational synergies. Goodwill is not expected to be deductible for tax purposes.
Acquisition-related costs incurred were $11.4 million, with $8.4 million expensed in 2019 and $3.0 million expensed in 2018. These costs, which were comprised primarily of advisory and legal fees, are included in the Other operating expense, net line item on our Consolidated Statements of Operations and Comprehensive Income (Loss).
The results of Resolute’s operations have been included in our consolidated financial statements since the March 1, 2019 acquisition date. The amount of revenue and direct operating expenses resulting from the acquisition included in our Consolidated Statements of Operations and Comprehensive Income (Loss) from March 1, 2019 through December 31, 2019 is $203.6 million and $51.0 million, respectively.
99
Pro Forma Financial Information (Unaudited)
The following supplemental pro forma information for the years ended December 31, 2019 and 2018 has been prepared to give effect to the Resolute acquisition as if it had occurred on January 1, 2018. The information below reflects pro forma adjustments based on available information and certain assumptions that we believe are reasonable, including (i) the depletion of the combined company’s proved oil and gas properties, (ii) the capitalization of interest expense, and (iii) the estimated tax impacts of the pro forma adjustments. Additionally, pro forma earnings were adjusted to exclude acquisition-related costs incurred by Cimarex of $11.4 million and transaction-related costs incurred by Resolute of $66.6 million. The pro forma results of operations do not include any cost savings or other synergies that may result from the acquisition or any estimated costs that have been or will be incurred by Cimarex to integrate the Resolute assets. The pro forma financial data has not been adjusted to reflect any other acquisitions or dispositions made during the periods presented as their results were not deemed material.
The pro forma information is not necessarily indicative of the results that might have occurred had the transaction actually taken place on January 1, 2018 and is not intended to be a projection of future results. Future results may vary significantly from the results reflected in the following pro forma information because of normal production declines, changes in commodity prices, future acquisitions and divestitures, future development and exploration activities, and other factors.
Years Ended December 31, | ||||||||
(in thousands, except per share information) | 2019 | 2018 | ||||||
Revenue | $ | $ | ||||||
Net (loss) income | $ | ( | ) | $ | ||||
Net (loss) income per common share: | ||||||||
Basic | $ | ( | ) | $ | ||||
Diluted | $ | ( | ) | $ | ||||
100
CIMAREX ENERGY CO.
SUPPLEMENTAL INFORMATION ON OIL AND GAS PRODUCING ACTIVITIES (UNAUDITED)
Oil and Gas Reserve Information—Proved reserve quantities are based on estimates prepared by Cimarex in accordance with guidelines established by the Securities and Exchange Commission (“SEC”).
Reserve definitions comply with definitions of Rule 4-10(a) (1)-(32) of Regulation S-X of the SEC. All of our reserve estimates are maintained by our internal Corporate Reservoir Engineering group, which is comprised of engineers and engineering technicians. The objectives and management of this group are separate from and independent of the exploration and production functions of our company. The technical employee primarily responsible for overseeing the reserve estimation process is our Vice President of Corporate Engineering. This individual graduated from the Colorado School of Mines with a Bachelor of Science degree in Engineering and has more than 25 years of practical experience in reserve evaluation. He has been directly involved in the annual reserve reporting process of Cimarex since 2002 and has served in his current role for the past 15 years.
DeGolyer and MacNaughton, an independent petroleum engineering consulting firm, performed an independent evaluation of our estimated net reserves representing greater than 80% of the total future net revenue discounted at 10% attributable to the total interests owned by Cimarex as of December 31, 2019. The individual primarily responsible for overseeing the evaluation is a Senior Vice President with DeGolyer and MacNaughton and a Registered Professional Engineer in the State of Texas with over 35 years of experience in oil and gas reservoir studies and reserves evaluations.
Proved reserves are those quantities of oil, gas, and NGLs which, by analysis of geosciences and engineering data, can be estimated with reasonable certainty to be economically producible—from a given date forward, from known reservoirs, and under existing economic conditions, operating methods, and government regulations—prior to the time at which contracts providing the right to operate expire, unless evidence indicates that renewal is reasonably certain, regardless of whether deterministic or probabilistic methods are used for the estimation. The project to extract the hydrocarbons must have commenced or the operator must be reasonably certain that it will commence the project within a reasonable time.
There are numerous uncertainties inherent in estimating quantities of proved reserves and projecting future rates of production and the timing of development expenditures. The estimation of our proved reserves employs one or more of the following: production trend extrapolation, analogy, volumetric assessment, and material balance analysis. Techniques including review of production and pressure histories, analysis of electric logs and fluid tests, and interpretations of geologic and geophysical data are also involved in this estimation process.
The following table summarizes the trailing twelve-month index prices used in the reserves estimates for 2019, 2018, and 2017. These prices are prior to adjustments for fixed and determinable amounts under provisions in existing contracts, location, grade, and quality.
December 31, | |||||||||||
2019 | 2018 | 2017 | |||||||||
Gas price per Mcf | $ | 2.58 | $ | 3.10 | $ | 2.98 | |||||
Oil price per Bbl | $ | 55.67 | $ | 65.56 | $ | 51.34 | |||||
NGL price per Bbl | $ | 13.27 | $ | 21.03 | $ | 19.09 | |||||
101
CIMAREX ENERGY CO.
SUPPLEMENTAL INFORMATION ON OIL AND GAS PRODUCING ACTIVITIES (UNAUDITED)
The following table sets forth our estimates of our proved, proved developed, and proved undeveloped oil, gas, and NGL reserves as of December 31, 2019, 2018, 2017, and 2016 and changes in our proved reserves for the years ended December 31, 2019, 2018, and 2017. All of our proved reserves are located entirely within the U.S.
Gas (MMcf) | Oil (MBbls) | NGL (MBbls) | Total (MBOE) | ||||||||
Total proved reserves: | |||||||||||
December 31, 2016 | 1,471,420 | 105,878 | 130,633 | 481,748 | |||||||
Revisions of previous estimates | (39,749 | ) | (1,225 | ) | (2,099 | ) | (9,951 | ) | |||
Extensions and discoveries | 363,774 | 53,464 | 42,692 | 156,786 | |||||||
Purchases of reserves | 642 | 42 | 78 | 227 | |||||||
Production | (187,468 | ) | (20,861 | ) | (17,374 | ) | (69,479 | ) | |||
Sales of reserves | (984 | ) | (60 | ) | (70 | ) | (294 | ) | |||
December 31, 2017 | 1,607,635 | 137,238 | 153,860 | 559,037 | |||||||
Revisions of previous estimates | (132,577 | ) | (4,348 | ) | 3,777 | (22,667 | ) | ||||
Extensions and discoveries | 342,810 | 53,763 | 47,614 | 158,512 | |||||||
Purchases of reserves | 3 | — | — | 1 | |||||||
Production | (205,837 | ) | (24,710 | ) | (21,994 | ) | (81,010 | ) | |||
Sales of reserves | (20,713 | ) | (15,405 | ) | (3,821 | ) | (22,678 | ) | |||
December 31, 2018 | 1,591,321 | 146,538 | 179,436 | 591,195 | |||||||
Revisions of previous estimates | (180,632 | ) | (8,516 | ) | (12,038 | ) | (50,661 | ) | |||
Extensions and discoveries | 247,406 | 41,193 | 36,834 | 119,261 | |||||||
Purchases of reserves | 129,435 | 22,628 | 18,818 | 63,019 | |||||||
Production | (251,567 | ) | (31,463 | ) | (28,254 | ) | (101,645 | ) | |||
Sales of reserves | (3,818 | ) | (610 | ) | (328 | ) | (1,574 | ) | |||
December 31, 2019 | 1,532,145 | 169,770 | 194,468 | 619,595 | |||||||
Proved developed reserves: | |||||||||||
December 31, 2016 | 1,144,720 | 92,032 | 99,176 | 381,994 | |||||||
December 31, 2017 | 1,334,510 | 114,116 | 126,227 | 462,761 | |||||||
December 31, 2018 | 1,398,729 | 116,339 | 151,566 | 501,027 | |||||||
December 31, 2019 | 1,358,329 | 138,783 | 166,552 | 531,722 | |||||||
Proved undeveloped reserves: | |||||||||||
December 31, 2016 | 326,700 | 13,846 | 31,457 | 99,754 | |||||||
December 31, 2017 | 273,125 | 23,122 | 27,633 | 96,276 | |||||||
December 31, 2018 | 192,592 | 30,199 | 27,870 | 90,168 | |||||||
December 31, 2019 | 173,816 | 30,987 | 27,916 | 87,873 | |||||||
Year-end 2019 proved reserves increased approximately 5% from year-end 2018 proved reserves, to 619.6 MMBOE. Proved gas reserves were 1.53 Tcf, proved oil reserves were 169.8 MMBbls, and proved NGL reserves were 194.5 MMBbls. Our reserves in the Permian Basin accounted for 68% of total proved reserves, with nearly all of the remainder in the Mid-Continent.
During 2019, we added 119.3 MMBOE of proved reserves through extensions and discoveries, primarily in the Permian Basin where we added 99.9 MMBOE, with the remaining 19.4 MMBOE in additions being in the Mid-Continent. Additionally, we added 63.0 MMBOE from purchases of reserves, primarily through the Resolute acquisition (see Note 13 to the Consolidated Financial Statements for further information on the acquisition). We had net negative
102
CIMAREX ENERGY CO.
SUPPLEMENTAL INFORMATION ON OIL AND GAS PRODUCING ACTIVITIES (UNAUDITED)
revisions of 50.7 MMBOE, which consisted of 47.2 MMBOE in downward price revisions and 7.0 MMBOE related to increases in operating expenses. In addition, 13.6 MMBOE was associated with the removal of PUD reserves whose development will likely be delayed beyond five years of initial disclosure. These negative revisions were partially offset by net positive technical revisions of 17.1 MMBOE primarily related to better than expected performance from wells with initial production in late 2018 and positive adjustments to PUD reserves converted to proved developed reserves during 2019.
During 2018, we added 158.5 MMBOE of proved reserves through extensions and discoveries, primarily in Permian Basin and Mid-Continent where we added 120.3 MMBOE and 38.0 MMBOE, respectively. In addition, we had net negative revisions of 22.7 MMBOE. The revisions included decreases of 38.6 MMBOE for the removal of PUD reserves whose development will likely be delayed beyond five years of initial disclosure and 7.7 MMBOE related to increases in operating expenses. These decreases were partially offset by increases of 2.7 MMBOE in price-related revisions and 20.9 MMBOE of net technical revisions. The majority of the technical revisions were related to better than expected performance from wells with initial production in late 2017 and positive adjustments to PUD reserves converted to proved developed reserves during 2018.
During 2017, we added 156.8 MMBOE of proved reserves through extensions and discoveries, primarily in Permian Basin and Mid-Continent where we added 109.6 MMBOE and 47.2 MMBOE, respectively. In addition, we had net negative revisions of 10.0 MMBOE. The revisions included decreases of 41.5 MMBOE for the removal of PUD reserves whose development will likely be delayed beyond five years of initial disclosure and 7.3 MMBOE related to increases in operating expenses. These decreases were partially offset by increases of 31.2 MMBOE in price-related revisions and 7.6 MMBOE of net technical revisions related primarily to better than expected performance from wells with initial production in late 2016.
At December 31, 2019, we had PUD reserves of 87.9 MMBOE, down 2.3 MMBOE, or 3%, from 90.2 MMBOE of PUD reserves at December 31, 2018. Changes in our PUD reserves during 2019 are summarized in the table below.
PUD Reserves (MMBOE) | ||
PUD reserves at December 31, 2018 | 90.2 | |
Converted to developed | (59.2 | ) |
Additions | 71.0 | |
Net revisions | (14.1 | ) |
PUD reserves at December 31, 2019 | 87.9 | |
During 2019, we invested $399.5 million to develop and convert 66% of our 2018 PUD reserves to proved developed reserves. During 2018, we invested $264.5 million to develop and convert 30% of our 2017 PUD reserves to proved developed reserves. During 2017, we invested $69.5 million to develop and convert 10% of our 2016 PUD reserves to proved developed reserves.
During 2019, all of our 71.0 MMBOE of PUD reserve additions occurred in the Permian Basin. At December 31, 2019, 92% of our PUD reserves were in the Permian Basin, while the remainder were in our western Oklahoma Cana area. During 2019, we had net negative PUD reserve revisions of 14.1 MMBOE. Of this total, 13.6 MMBOE was for the removal of PUD reserves whose development will likely be delayed beyond five years of initial disclosure. We have no PUD reserves that have remained undeveloped for five years or more after initial disclosure and we have no PUD reserves whose scheduled development is beyond five years of initial disclosure.
103
CIMAREX ENERGY CO.
SUPPLEMENTAL INFORMATION ON OIL AND GAS PRODUCING ACTIVITIES (UNAUDITED)
Costs Incurred—The following table sets forth the capitalized costs incurred in our oil and gas production, exploration, and development activities.
Years Ended December 31, | ||||||||||||
(in thousands) | 2019 | 2018 | 2017 | |||||||||
Costs incurred during the year: | ||||||||||||
Acquisition of properties | ||||||||||||
Proved | $ | 695,450 | $ | 62 | $ | 938 | ||||||
Unproved | 1,083,230 | 102,666 | 135,565 | |||||||||
Exploration | 2,321 | 6,341 | 11,804 | |||||||||
Development | 1,181,605 | 1,487,453 | 1,140,548 | |||||||||
Oil and gas expenditures | 2,962,606 | 1,596,522 | 1,288,855 | |||||||||
Property sales | (35,320 | ) | (581,799 | ) | (11,680 | ) | ||||||
2,927,286 | 1,014,723 | 1,277,175 | ||||||||||
Asset retirement obligation, net | 3,874 | (2,004 | ) | 9,416 | ||||||||
$ | 2,931,160 | $ | 1,012,719 | $ | 1,286,591 | |||||||
Aggregate Capitalized Costs—The table below reflects the aggregate capitalized costs relating to our oil and gas producing activities at December 31, 2019.
(in thousands) | December 31, 2019 | |||
Proved properties | $ | 20,678,334 | ||
Unproved properties and properties under development, not being amortized | 1,255,908 | |||
21,934,242 | ||||
Less-accumulated depreciation, depletion, amortization, and impairments | (16,723,544 | ) | ||
Net oil and gas properties | $ | 5,210,698 | ||
Costs Not Being Amortized—The following table summarizes oil and gas property costs not being amortized at December 31, 2019, by year that the costs were incurred.
(in thousands) | December 31, 2019 | |||
2019 | $ | 1,019,651 | ||
2018 | 74,923 | |||
2017 | 76,491 | |||
2016 and prior | 84,843 | |||
$ | 1,255,908 | |||
Of the costs not being amortized, $158.6 million (13%) relates to unevaluated wells in progress and $69.2 million (5%) is capitalized interest. The remaining $1.03 billion (82%) is for land and seismic expenditures, most of which were for costs invested in Permian Basin ($970.9 million) and Mid-Continent ($48.0 million). The majority of the Permian Basin balance stems from the Resolute acquisition. On a quarterly basis, we evaluate excluded costs for inclusion in the costs to be amortized. Significant unproved properties are evaluated individually. Unproved properties that are not considered individually significant are aggregated for evaluation purposes and related costs are transferred to the costs to be amortized quarterly based on the application of historical factors. We expect to include these costs in the amortization computation as we continue with our exploration and development plans.
104
CIMAREX ENERGY CO.
SUPPLEMENTAL INFORMATION ON OIL AND GAS PRODUCING ACTIVITIES (UNAUDITED)
Oil and Gas Operations—The following table contains direct revenue and cost information relating to our oil and gas exploration and production activities for the periods indicated. We have no long-term supply or purchase agreements with governments or authorities in which we act as producer. Income tax expense related to our oil and gas operations is computed using the effective tax rate for the period, with the 2017 effective tax rate adjusted to remove the impact of the reduction in the federal statutory rate.
Years Ended December 31, | ||||||||||||
(in thousands, except per BOE) | 2019 | 2018 | 2017 | |||||||||
Oil, gas, and NGL revenues from production | $ | 2,321,921 | $ | 2,297,645 | $ | 1,874,003 | ||||||
Less operating costs and income taxes: | ||||||||||||
Impairment of oil and gas properties | 618,693 | — | — | |||||||||
Depletion | 817,099 | 538,919 | 399,328 | |||||||||
Asset retirement obligation | 8,586 | 7,142 | 15,624 | |||||||||
Production | 339,941 | 296,189 | 263,349 | |||||||||
Transportation, processing, and other operating | 238,259 | 211,463 | 248,124 | |||||||||
Taxes other than income | 148,953 | 125,169 | 89,864 | |||||||||
Income tax expense | 26,318 | 252,840 | 313,066 | |||||||||
2,197,849 | 1,431,722 | 1,329,355 | ||||||||||
Results of operations from oil and gas producing activities | $ | 124,072 | $ | 865,923 | $ | 544,648 | ||||||
Depletion rate per BOE | $ | 8.04 | $ | 6.65 | $ | 5.75 | ||||||
Standardized Measure of Future Net Cash Flows—The Standardized Measure of Discounted Future Net Cash Flows Relating to Proved Oil and Gas Reserves (“Standardized Measure”) is calculated in accordance with guidance provided by the FASB. The Standardized Measure does not purport, nor should it be interpreted, to present the fair value of a company’s proved oil and gas reserves. Fair value would require, among other things, consideration of expected future economic and operating conditions, varying price and cost assumptions, and risks inherent in reserve estimates.
Under the Standardized Measure, future cash inflows are based upon the forecasted future production of year-end proved reserves. Future cash inflows are then reduced by estimated future production and development costs to determine net pre-tax cash flow. Future income taxes are computed by applying the statutory tax rate to the excess of pre-tax cash flow over our tax basis in the associated oil and gas properties. Tax credits and permanent differences are also considered in the future income tax calculation. Future net cash flow after income taxes is discounted using a 10% annual discount rate to arrive at the Standardized Measure.
The following summary sets forth our Standardized Measure.
December 31, | ||||||||||||
(in thousands) | 2019 | 2018 | 2017 | |||||||||
Future cash inflows | $ | 11,726,488 | $ | 14,050,367 | $ | 11,967,325 | ||||||
Future production costs | (4,619,438 | ) | (4,889,601 | ) | (4,360,599 | ) | ||||||
Future development costs | (814,397 | ) | (1,017,318 | ) | (948,735 | ) | ||||||
Future income tax expenses | (578,675 | ) | (1,303,762 | ) | (882,519 | ) | ||||||
Future net cash flows | 5,713,978 | 6,839,686 | 5,775,472 | |||||||||
10% annual discount for estimated timing of cash flows | (2,084,952 | ) | (2,824,499 | ) | (2,490,471 | ) | ||||||
Standardized measure of discounted future net cash flows | $ | 3,629,026 | $ | 4,015,187 | $ | 3,285,001 | ||||||
105
CIMAREX ENERGY CO.
SUPPLEMENTAL INFORMATION ON OIL AND GAS PRODUCING ACTIVITIES (UNAUDITED)
The estimates of cash flows shown above are based upon the unweighted trailing twelve-month average first-day-of-the-month benchmark prices. See table above under Oil and Gas Reserve Information for prices used in determining the Standardized Measure. Prices are market driven and will fluctuate due to supply and demand factors, seasonality, and geopolitical and economic factors.
The following are the principal sources of change in the Standardized Measure.
Years Ended December 31, | ||||||||||||
(in thousands) | 2019 | 2018 | 2017 | |||||||||
Standardized Measure, beginning of period | $ | 4,015,187 | $ | 3,285,001 | $ | 1,892,618 | ||||||
Sales, net of production costs | (1,594,768 | ) | (1,660,649 | ) | (1,267,229 | ) | ||||||
Net change in sales prices and in production costs related to future production | (1,267,223 | ) | 377,178 | 855,024 | ||||||||
Extensions and discoveries, net of future production and development costs | 758,685 | 1,738,993 | 1,443,577 | |||||||||
Changes in estimated future development costs | 35,940 | 194,523 | 298,819 | |||||||||
Previously estimated development costs incurred during the period | 640,292 | 335,954 | 78,398 | |||||||||
Revisions of quantity estimates | (304,217 | ) | 96,783 | (65,376 | ) | |||||||
Accretion of discount | 473,919 | 372,482 | 212,192 | |||||||||
Change in income taxes | 404,681 | (284,186 | ) | (210,519 | ) | |||||||
Purchases of reserves in place | 568,897 | — | 2,255 | |||||||||
Sales of reserves in place | (18,330 | ) | (300,592 | ) | (1,666 | ) | ||||||
Change in production rates and other | (84,037 | ) | (140,300 | ) | 46,908 | |||||||
Standardized Measure, end of period | $ | 3,629,026 | $ | 4,015,187 | $ | 3,285,001 | ||||||
106
The tables below summarize our quarterly financial data for 2019 and 2018. The sum of the individual quarterly earnings (loss) per common share amounts may not agree with year-to-date earnings (loss) per common share amounts because each quarter’s computation is based on the number of shares outstanding at the end of the applicable quarter using the two-class method.
Quarter | ||||||||||||||||
2019 | First | Second | Third | Fourth | ||||||||||||
(in thousands, except per share data) | ||||||||||||||||
Revenues | $ | 576,957 | $ | 546,463 | $ | 582,305 | $ | 657,244 | ||||||||
Expenses, net | 550,641 | 437,154 | 458,458 | 1,041,335 | ||||||||||||
Net income (loss) | $ | 26,316 | $ | 109,309 | $ | 123,847 | $ | (384,091 | ) | |||||||
Earnings (loss) per share to common stockholders: | ||||||||||||||||
Basic | $ | 0.26 | $ | 1.07 | $ | 1.21 | $ | (3.87 | ) | |||||||
Diluted | $ | 0.26 | $ | 1.07 | $ | 1.21 | $ | (3.87 | ) | |||||||
In the course of preparing our year-end 2019 oil and gas reserve report, we determined that the September 30, 2019 present value of estimated future net cash flows from proved oil and gas reserves discounted at 10% should have included the cash flows from reserve volumes associated with skim oil and drip liquids produced from our wells and recovered from saltwater disposal facilities and gathering systems at that date. This error caused us to incorrectly report an impairment of oil and gas properties at September 30, 2019.
Expenses, net, Net income (loss), and Earnings (loss) per share to common stockholders for the third quarter 2019 in the table above have been revised from amounts previously reported in our September 30, 2019 Form 10-Q. The revised amounts in the table above reflect the elimination of a full cost ceiling impairment of $108.9 million originally recorded in the third quarter 2019. We recognized a full cost ceiling impairment of $618.7 million in the fourth quarter 2019.
After considering the guidance in Staff Accounting Bulletin (“SAB”) No. 99, Materiality, and Accounting Standards Codification 250, Accounting Changes and Error Corrections, we evaluated the materiality of this amount quantitatively and qualitatively and concluded that the error was not material to the company’s third quarter 2019 interim period financial statements. The unaudited interim period consolidated financial statements as of and for the three and nine-months ended September 30, 2019, will be revised in accordance with SAB No. 108, Considering the Effects of Prior Year Misstatements when Quantifying Misstatements in Current Year Financial Statements, in order to reflect this correction when the company files its third quarter 2020 Form 10-Q.
Quarter | ||||||||||||||||
2018 | First | Second | Third | Fourth | ||||||||||||
(in thousands, except per share data) | ||||||||||||||||
Revenues | $ | 567,134 | $ | 556,274 | $ | 591,488 | $ | 624,121 | ||||||||
Expenses, net | 380,816 | 415,277 | 443,134 | 307,939 | ||||||||||||
Net income | $ | 186,318 | $ | 140,997 | $ | 148,354 | $ | 316,182 | ||||||||
Earnings per share to common stockholders: | ||||||||||||||||
Basic | $ | 1.96 | $ | 1.48 | $ | 1.56 | $ | 3.32 | ||||||||
Diluted | $ | 1.96 | $ | 1.48 | $ | 1.56 | $ | 3.32 | ||||||||
107
ITEM 9. CHANGES IN AND DISAGREEMENTS WITH ACCOUNTANTS ON ACCOUNTING AND FINANCIAL DISCLOSURE
None.
ITEM 9A. CONTROLS AND PROCEDURES
EVALUATION OF DISCLOSURE CONTROLS AND PROCEDURES
Cimarex’s management, under the supervision and with the participation of the Chief Executive Officer (“CEO”) and Chief Financial Officer (“CFO”), have evaluated the effectiveness of Cimarex’s disclosure controls and procedures (as defined in Rule 13a-15(e) under the Securities Exchange Act of 1934, as amended (Exchange Act)) as of December 31, 2019. Disclosure controls and procedures are designed to provide reasonable assurance that information required to be disclosed in reports filed or submitted under the Exchange Act is recorded, processed, summarized, and reported within the time periods required by the U.S. Securities and Exchange Commission’s rules and forms and that such information is accumulated and communicated to management, including the CEO and CFO, to allow timely decisions regarding required disclosures. Based on this evaluation, Cimarex’s CEO and CFO concluded that due to the material weakness in our internal control over financial reporting described below, the Company’s disclosure controls and procedures were not effective as of December 31, 2019.
MANAGEMENT’S REPORT ON INTERNAL CONTROL OVER FINANCIAL REPORTING
Cimarex’s management is responsible for establishing and maintaining adequate internal control over financial reporting (as defined in Rule 13a-15(f) under the Exchange Act). The Company’s internal control over financial reporting is designed to provide reasonable assurance regarding the reliability of financial reporting and the preparation of financial statements for external purposes in accordance with accounting principles generally accepted in the United States of America. The Company’s internal control over financial reporting also includes those policies and procedures that:
(1) | pertain to the maintenance of records that, in reasonable detail, accurately and fairly reflect transactions and dispositions of assets; |
(2) | provide reasonable assurance that transactions are recorded as necessary to permit preparation of consolidated financial statements for external purposes in accordance with generally accepted accounting principles, and that receipts and expenditures are being made only in accordance with authorizations of management and directors; and |
(3) | provide reasonable assurance regarding prevention or timely detection of unauthorized acquisition, use, or disposition of assets that could have a material effect on the consolidated financial statements. |
Because of inherent limitations, internal control over financial reporting may not prevent or detect misstatements. Also, projections of any evaluation of the effectiveness to future periods are subject to the risk that controls may become inadequate because of changes in conditions, or that the degree of compliance with the policies or procedures may deteriorate.
A material weakness is a deficiency, or combination of deficiencies in internal control over financial reporting, such that there is a reasonable possibility that a material misstatement of the annual or interim financial statements will not be prevented or detected on a timely basis.
108
As of December 31, 2019, Cimarex’s management assessed the effectiveness of internal control over financial reporting based on the criteria set forth in Internal Control - Integrated Framework (2013) issued by the Committee of Sponsoring Organizations of the Treadway Commission (COSO). Based on this assessment, the Company’s CEO and CFO have concluded that a material weakness in internal control over financial reporting existed as of December 31, 2019 as described below:
The Company did not have an effective process and control in place to periodically evaluate the quantitative effect associated with the inclusion or exclusion of certain inputs, such as skim oil and drip liquids, in the Company’s oil and gas reserve database used in the ceiling test impairment calculations, depletion calculations, and the preparation of the related disclosures included in the supplemental information on oil and gas producing activities (unaudited). The material weakness resulted from an ineffective risk assessment process to identify and assess changes in the Company’s operations and their impact on the Company’s processes and controls governing preparation of the oil and gas reserve database.
This resulted in the correction of an immaterial misstatement to previously reported impairment expense, and the related balance sheet accounts as described in the supplemental quarterly financial data (unaudited) to the consolidated financial statements as of and for the three year period ended December 31, 2019 in this Form 10-K. However, this control deficiency created a reasonable possibility that a material misstatement to the consolidated financial statements would not have been prevented or detected on a timely basis, and therefore the Company concluded that the deficiency represented a material weakness in internal control over financial reporting and that internal control over financial reporting was not effective as of December 31, 2019.
The Company’s independent registered public accounting firm, KPMG LLP, has audited the effectiveness of internal control over financial reporting and has issued an adverse report on the effectiveness of our internal control over financial reporting as of December 31, 2019. KPMG LLP’s report is included later in this Item 9A in this Form 10-K.
MANAGEMENT’S REMEDIATION PLAN
In response to the material weakness identified in Management’s Report on Internal Control over Financial Reporting, we have developed a plan with oversight from the Audit Committee of the Board of Directors to remediate the material weakness. The remediation efforts being implemented include the following:
• | Performance of a quarterly evaluation of the quantitative effect associated with the inclusion or exclusion of certain inputs in the Company’s oil and gas reserve database. |
• | Revision and communication of controls, policies and procedures relating to identifying and assessing changes that could potentially impact the system of internal control governing preparation of the oil and gas reserve database. |
CHANGES IN INTERNAL CONTROL OVER FINANCIAL REPORTING
Other than the identification of the material weakness described above, there was no change in our internal control over financial reporting that occurred during our most recent fiscal quarter ended December 31, 2019 that has materially affected, or is reasonably likely to materially affect, our internal control over financial reporting.
109
Report of Independent Registered Public Accounting Firm
To the Stockholders and Board of Directors
Cimarex Energy Co.:
Opinion on Internal Control Over Financial Reporting
We have audited Cimarex Energy Co. and subsidiaries’ (the Company) internal control over financial reporting as of December 31, 2019, based on criteria established in Internal Control - Integrated Framework (2013) issued by the Committee of Sponsoring Organizations of the Treadway Commission.
In our opinion, because of the effect of the material weakness, described below, on the achievement of the objectives of the control criteria, the Company has not maintained effective internal control over financial reporting as of December 31, 2019, based on criteria established in Internal Control - Integrated Framework (2013) issued by the Committee of Sponsoring Organizations of the Treadway Commission.
We also have audited, in accordance with the standards of the Public Company Accounting Oversight Board (United States) (PCAOB), the consolidated balance sheets of the Company as of December 31, 2019 and 2018, the related consolidated statements of operations and comprehensive income (loss), stockholders’ equity, and cash flows for each of the years in the three-year period ended December 31, 2019, and the related notes (collectively, the consolidated financial statements), and our report dated February 26, 2020 expressed an unqualified opinion on those consolidated financial statements.
A material weakness is a deficiency, or a combination of deficiencies, in internal control over financial reporting, such that there is a reasonable possibility that a material misstatement of the company’s annual or interim financial statements will not be prevented or detected on a timely basis. A material weakness related to an ineffective process and control to periodically evaluate the quantitative effect associated with the inclusion or exclusion of certain inputs, such as skim oil and drip liquids, in the Company’s oil and gas reserve database used in the ceiling test impairment calculations, depletion calculations, and the preparation of the related disclosures included in the supplemental information on oil and gas producing activities (unaudited) resulting from an ineffective risk assessment process to identify and assess changes in the Company’s operations and their impact on the Company’s processes and controls governing preparation of the oil and gas reserve database has been identified and included in management’s assessment. The material weakness was considered in determining the nature, timing, and extent of audit tests applied in our audit of the 2019 consolidated financial statements, and this report does not affect our report on those consolidated financial statements.
Basis for Opinion
The Company’s management is responsible for maintaining effective internal control over financial reporting and for its assessment of the effectiveness of internal control over financial reporting, included in the accompanying Management’s Report on Internal Control Over Financial Reporting. Our responsibility is to express an opinion on the Company’s internal control over financial reporting based on our audit. We are a public accounting firm registered with the PCAOB and are required to be independent with respect to the Company in accordance with the U.S. federal securities laws and the applicable rules and regulations of the Securities and Exchange Commission and the PCAOB.
We conducted our audit in accordance with the standards of the PCAOB. Those standards require that we plan and perform the audit to obtain reasonable assurance about whether effective internal control over financial reporting was maintained in all material respects. Our audit of internal control over financial reporting included obtaining an understanding of internal control over financial reporting, assessing the risk that a material weakness exists, and testing and evaluating the design and operating effectiveness of internal control based on the assessed risk. Our audit also included performing such other procedures as we considered necessary in the circumstances. We believe that our audit provides a reasonable basis for our opinion.
Definition and Limitations of Internal Control Over Financial Reporting
A company’s internal control over financial reporting is a process designed to provide reasonable assurance regarding the reliability of financial reporting and the preparation of financial statements for external purposes in accordance with generally accepted accounting principles. A company’s internal control over financial reporting includes those policies and procedures that (1) pertain to the maintenance of records that, in reasonable detail, accurately and fairly reflect the transactions and dispositions of the assets of the company; (2) provide reasonable assurance that transactions are recorded as necessary to permit preparation of financial statements in accordance with generally accepted accounting principles, and that receipts and expenditures of the company are being made only in accordance with authorizations of management and directors of the company; and (3) provide reasonable assurance regarding prevention or timely detection of unauthorized acquisition, use, or disposition of the company’s assets that could have a material effect on the financial statements.
Because of its inherent limitations, internal control over financial reporting may not prevent or detect misstatements. Also, projections of any evaluation of effectiveness to future periods are subject to the risk that controls may become inadequate because of changes in conditions, or that the degree of compliance with the policies or procedures may deteriorate.
KPMG LLP
Denver, Colorado
February 26, 2020
110
ITEM 9B. OTHER INFORMATION
None.
111
PART III
ITEM 10. DIRECTORS, EXECUTIVE OFFICERS AND CORPORATE GOVERNANCE
Information concerning the directors of Cimarex required under this item is incorporated by reference from the Cimarex Energy Co. definitive Proxy Statement for the May 6, 2020 Annual Meeting of Shareholders. The Proxy Statement will be filed with the Securities and Exchange Commission no later than 120 days subsequent to December 31, 2019. The executive officers of Cimarex as of February 26, 2020 were:
Name | Age | Office | ||
Thomas E. Jorden | 62 | Chairman of the Board, Chief Executive Officer and President | ||
Joseph R. Albi | 61 | Executive Vice President — Operations, Chief Operating Officer | ||
Stephen P. Bell | 65 | Executive Vice President — Business Development | ||
G. Mark Burford | 52 | Senior Vice President and Chief Financial Officer | ||
Francis B. Barron | 57 | Senior Vice President — General Counsel | ||
John A. Lambuth | 57 | Senior Vice President — Exploration | ||
Christopher H. Clason | 53 | Vice President and Chief Human Resources Officer | ||
Gary R. Abbott | 47 | Vice President — Corporate Engineering | ||
Timothy A. Ficker | 52 | Vice President — Controller, Chief Accounting Officer, and Assistant Secretary | ||
There are no family relationships by blood, marriage, or adoption among any of the above executive officers. All executive officers are elected annually by the board of directors to serve for one year or until a successor is elected and qualified. There is no arrangement or understanding between any of the officers and any other person pursuant to which he or she was selected as an executive officer.
THOMAS E. JORDEN was elected Chairman of the Board effective August 14, 2012 after being named President and Chief Executive Officer effective September 30, 2011. Since December 8, 2003, Mr. Jorden served as Executive Vice President of Exploration and had served in a similar capacity since September 30, 2002. Prior to September 2002, Mr. Jorden was with Key Production Company, Inc., where he served as Vice President of Exploration (October 1999 to September 2002) and Chief Geophysicist (November 1993 to September 1999). Prior to joining Key, Mr. Jorden was with Union Pacific Resources.
JOSEPH R. ALBI was named Executive Vice President and Chief Operating Officer effective September 30, 2011. Mr. Albi served as Executive Vice President of Operations since March 1, 2005. Since December 8, 2003, Mr. Albi served as Senior Vice President of Corporate Engineering. From September 30, 2002 to December 8, 2003, he served as Vice President of Engineering. From June 1994 to September 2002, Mr. Albi was with Key Production Company, Inc. where he served as Vice President of Engineering and Manager of Engineering.
STEPHEN P. BELL was named Executive Vice President, Business Development effective September 13, 2012. Since September 2002, Mr. Bell served as Senior Vice President of Business Development and Land. Prior to its merger with Cimarex, Mr. Bell was with Key Production Company, Inc. since February 1994. In September 1999, he was appointed Senior Vice President, Business Development and Land. From February 1994 to September 1999, he served as Vice President, Land.
G. MARK BURFORD was named Senior Vice President and Chief Financial Officer in March 2019. Mr. Burford was appointed Vice President and Chief Financial Officer in September 2015 and Vice President, Capital Markets and Planning in December 2010. Mr. Burford joined Cimarex in April 2005 as Director of Capital Markets. Prior to joining Cimarex, he was Director of Investor Relations for Whiting Petroleum and Tom Brown. His experience also includes equity research with Petrie Parkman & Co., an investment banking firm and public accounting.
112
FRANCIS B. BARRON joined Cimarex as Senior Vice President, General Counsel in July 2013. From February 2004 until July 2013, Mr. Barron served in various capacities at Bill Barrett Corporation, a publicly traded, Denver-based oil and gas exploration and development company, including as Executive Vice President, General Counsel, and Secretary. He also served as Chief Financial Officer from November 2006 until March 2007. Prior to February 2004, Mr. Barron was a partner at the Denver, Colorado office of the law firm of Patton Boggs LLP as well as a partner at Bearman Talesnick & Clowdus Professional Corporation. Mr. Barron’s practice included corporate, securities, and business law for publicly traded oil and gas companies.
JOHN A. LAMBUTH was named Senior Vice President of Exploration in December 2015. Prior to his promotion, he served as the Company’s Vice President of Exploration since September 2012 and Chief Geophysicist, a position he held since joining Cimarex in 2004. Mr. Lambuth began his career in 1985 with Shell Oil Co., where he held various positions in exploration and in research and development. Immediately prior to joining Cimarex, he spent three years as onshore Exploration Manager of El Paso Energy Company.
CHRISTOPHER H. CLASON joined Cimarex as Vice President and Chief Human Resources Officer in April 2019. From February 2016 until April 2019, Mr. Clason was Director of MBA Career Management and Employer Relations at the Marriott School of Business at Brigham Young University. Prior to his work in higher education, he was Senior Vice President and Chief Human Resources Officer at ProBuild LLC, a Devonshire Investors company. From 2001 until 2014, Mr. Clason held various global HR executive leadership roles at Honeywell International, including Vice President Human Resources and Communications at Honeywell Aerospace. His background includes extensive international experience at Citigroup and early career work at Chevron.
GARY R. ABBOTT was named Vice President of Corporate Engineering March 1, 2005. Since January 2002, Mr. Abbott served as manager, Corporate Reservoir Engineering. From April 1999 to January 2002, Mr. Abbott was a senior engineer with Key Production Company, Inc.
TIMOTHY A. FICKER was appointed Vice President, Controller, Chief Accounting Officer, and Assistant Secretary in December 2016 to be effective in February 2017 and previously served as the Company’s Controller since September 2016. Prior to joining Cimarex, he was the Chief Financial Officer of Alcova Management LLC, Venoco, Inc., and Infinity Energy Resources Inc. Mr. Ficker previously served as an audit partner in KPMG LLP’s energy audit practice in Denver and as an audit partner for Arthur Andersen LLP, where he served clients primarily in the energy industry.
113
ITEM 11. EXECUTIVE COMPENSATION
Information required under this item is incorporated by reference from the Cimarex Energy Co. definitive Proxy Statement for the May 6, 2020 Annual Meeting of Shareholders. The Proxy Statement will be filed with the Securities and Exchange Commission no later than 120 days subsequent to December 31, 2019.
ITEM 12. SECURITY OWNERSHIP OF CERTAIN BENEFICIAL OWNERS AND MANAGEMENT AND RELATED STOCKHOLDER MATTERS
The following table sets forth information with respect to the equity compensation plans available to directors, officers, and employees of the company at December 31, 2019:
Plan Category | (a) Number of securities to be issued upon exercise of outstanding options, warrants, and rights | (b) Weighted-average exercise price of outstanding options, warrants, and rights | (c) Number of securities remaining available for future issuance under equity compensation plans (excluding securities reflected in column (a)) | |||||||
Equity compensation plans approved by security holders | 495,538 | $ | 87.17 | 3,744,357 | ||||||
Equity compensation plans not approved by security holders | — | — | — | |||||||
Total | 495,538 | $ | 87.17 | 3,744,357 | ||||||
The remaining information required under this item is incorporated by reference from the Cimarex Energy Co. definitive Proxy Statement for the May 6, 2020 Annual Meeting of Shareholders. The Proxy Statement will be filed with the Securities and Exchange Commission no later than 120 days subsequent to December 31, 2019.
ITEM 13. CERTAIN RELATIONSHIPS AND RELATED TRANSACTIONS, AND DIRECTOR INDEPENDENCE
Information required under this item is incorporated by reference from the Cimarex Energy Co. definitive Proxy Statement for the May 6, 2020 Annual Meeting of Shareholders. The Proxy Statement will be filed with the Securities and Exchange Commission no later than 120 days subsequent to December 31, 2019.
ITEM 14. PRINCIPAL ACCOUNTING FEES AND SERVICES
Information required under this item is incorporated by reference from the Cimarex Energy Co. definitive Proxy Statement for the May 6, 2020 Annual Meeting of Shareholders. The Proxy Statement will be filed with the Securities and Exchange Commission no later than 120 days subsequent to December 31, 2019.
114
PART IV
ITEM 15. EXHIBITS, FINANCIAL STATEMENT SCHEDULES
Page | |||
(a) (1) | The following financial statements are included in Item 8 to this 10-K: | ||
(2 | ) | ||
(3 | ) | ||
Exhibits not incorporated by reference to a prior filing are designated by an asterisk (*) and are filed herewith; all exhibits not so designated are incorporated by reference to a prior SEC filing as indicated. All management contracts or compensatory plans or arrangements are designated by a plus sign (+).
Exhibit | Title | ||
115
Exhibit | Title | ||
116
Exhibit | Title | ||
117
Exhibit | Title | ||
118
Exhibit | Title | ||
119
Exhibit | Title | ||
120
Exhibit | Title | ||
101.INS | XBRL Instance Document - the instance document does not appear in the Interactive Data File because its XBRL tags are embedded within the Inline XBRL document. | ||
101.SCH | Inline XBRL Taxonomy Extension Schema Document. | ||
101.CAL | Inline XBRL Taxonomy Extension Calculation Linkbase Document. | ||
101.LAB | Inline XBRL Taxonomy Extension Label Linkbase Document. | ||
101.PRE | Inline XBRL Taxonomy Extension Presentation Linkbase Document. | ||
101.DEF | Inline XBRL Taxonomy Extension Definition Linkbase Document. | ||
104 | Cover Page Interactive Data File (formatted as Inline XBRL and contained in Exhibit 101) | ||
ITEM 16. FORM 10-K SUMMARY
None.
121
SIGNATURE
Pursuant to the requirements of Section 13 or 15(d) of the Securities Exchange Act of 1934, the registrant has duly caused this report to be signed on its behalf by the undersigned, thereunto duly authorized.
Date: February 26, 2020
CIMAREX ENERGY CO. | ||
By: | /s/ Thomas E. Jorden | |
Thomas E. Jorden Chairman of the Board, Chief Executive Officer, and President | ||
Pursuant to the requirements of the Securities Exchange Act of 1934, this report has been signed below by the following persons on behalf of the registrant and in the capacities and on the dates indicated.
Signature | Title | Date | |||
/s/ Thomas E. Jorden | Chairman of the Board, Director, Chief Executive Officer, | ||||
Thomas E. Jorden | and President (Principal Executive Officer) | February 26, 2020 | |||
* | Director, Executive Vice President — Operations, | ||||
Attorney-in-Fact | Chief Operating Officer | February 26, 2020 | |||
Joseph R. Albi | |||||
/s/ G. Mark Burford | Senior Vice President and Chief Financial Officer | ||||
G. Mark Burford | (Principal Financial Officer) | February 26, 2020 | |||
/s/ Timothy A. Ficker | Vice President, Controller, Chief Accounting Officer | ||||
Timothy A. Ficker | (Principal Accounting Officer) | February 26, 2020 | |||
* | |||||
Attorney-in-Fact | Director | February 26, 2020 | |||
Paul N. Eckley | |||||
* | |||||
Attorney-in-Fact | Director | February 26, 2020 | |||
Hans Helmerich | |||||
* | |||||
Attorney-in-Fact | Director | February 26, 2020 | |||
Harold R. Logan, Jr. | |||||
* | |||||
Attorney-in-Fact | Director | February 26, 2020 | |||
Kathleen A. Hogenson | |||||
* | |||||
Attorney-in-Fact | Director | February 26, 2020 | |||
Floyd R. Price | |||||
* | |||||
Attorney-in-Fact | Director | February 26, 2020 | |||
Monroe W. Robertson | |||||
* | |||||
Attorney-in-Fact | Director | February 26, 2020 | |||
Lisa A. Stewart | |||||
* | |||||
Attorney-in-Fact | Director | February 26, 2020 | |||
Frances M. Vallejo | |||||
*By: | /s/ G. Mark Burford | Senior Vice President and Chief Financial Officer | |||
G. Mark Burford Attorney-in-Fact | (Principal Financial Officer) | February 26, 2020 | |||
122