Exhibit 99.1
 |
NEWS RELEASE |
Nabors Announces Fourth Quarter 2023 Results
HAMILTON, Bermuda, February 6, 2024 /PRNewswire/ - Nabors Industries Ltd. (“Nabors” or the “Company”) (NYSE: NBR) today reported fourth quarter 2023 operating revenues of $726 million, compared to operating revenues of $734 million in the third quarter. The net loss attributable to Nabors shareholders for the quarter was $17 million, compared to a net loss of $49 million in the third quarter. This equates to a loss of $2.70 per diluted share, compared to a loss per diluted share of $6.26 in the third quarter. The fourth quarter results included a gain, related to mark-to-market treatment of Nabors warrants, of $10 million, or $1.14 per diluted share, compared to a charge of $8 million, or $0.86 per diluted share, in the third quarter. Fourth quarter adjusted EBITDA was $230 million, compared to $210 million in the previous quarter.
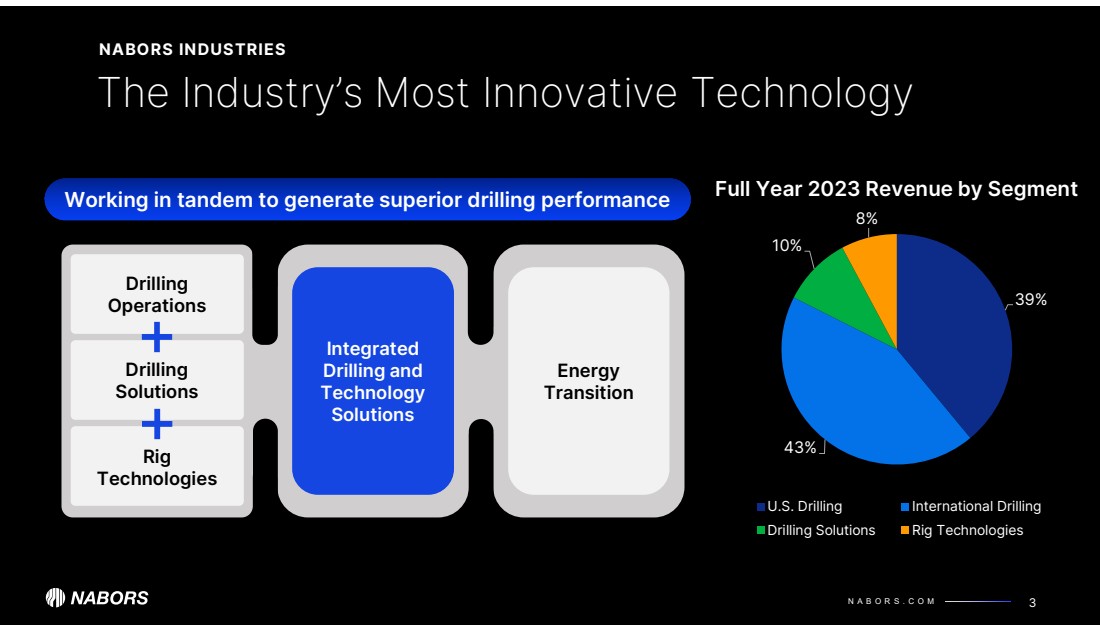
Full-year 2023 operating revenues were $3.0 billion, compared to $2.7 billion in the prior year. This 13% overall increase was driven by growth in all company segments. Nabors Drilling Solutions and Rig Technologies both expanded by 24%. U.S. Drilling revenue increased by 10%, while International Drilling was 12% higher than in 2022.
For the full year 2023, the net loss attributable to Nabors shareholders was $11.8 million, compared to a loss of $350.3 million in 2022. Adjusted operating income improved to $269.9 million from $44.3 million. Adjusted EBITDA for 2023 was $915 million, compared to $709 million in the prior year, which translates into 29% year-on-year growth.
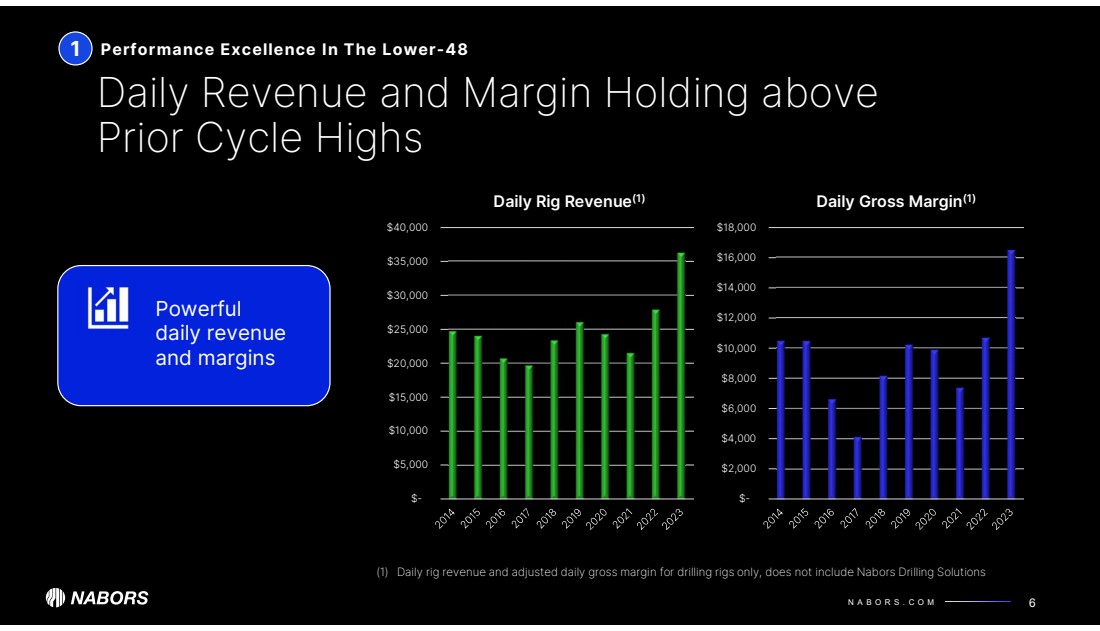
Anthony G. Petrello, Nabors Chairman, CEO and President, commented, “Our fourth quarter operating results exceeded our expectations across all of our segments. In the U.S., daily rig margins in the Lower 48 increased sequentially, as daily revenue expanded and daily expenses were lower. Similarly, daily margins in our International business widened.
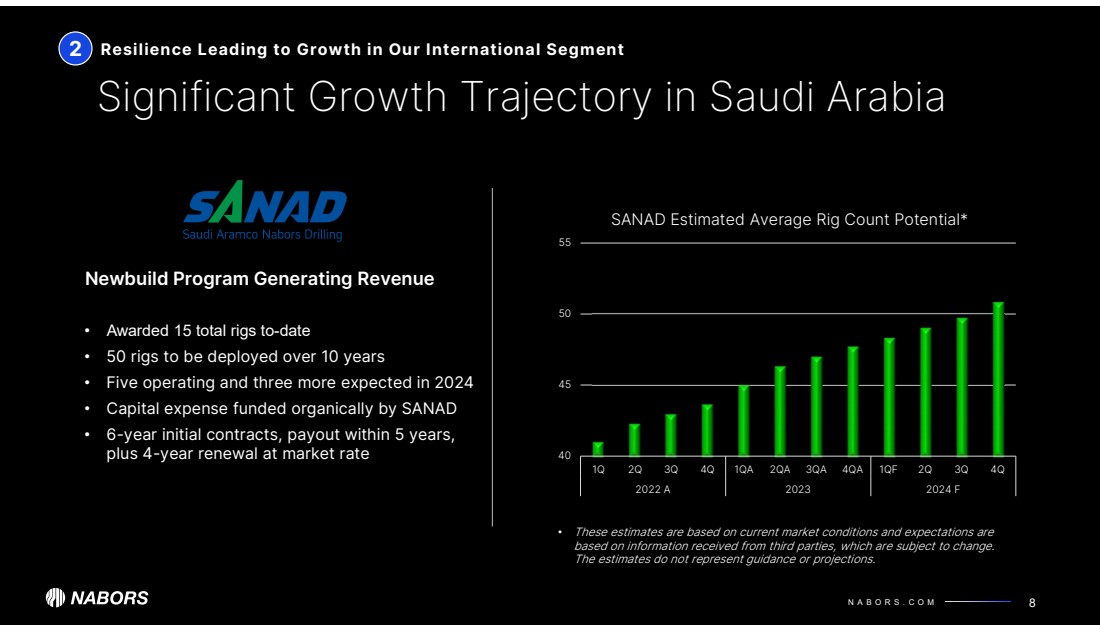
Pricing in the Lower 48 market held firm, as utilization of the highest specification rigs remained high. Average rig count was slightly below our estimates, as several rigs started later in the quarter than anticipated. In our International segment, rig count increased as deployments in Saudi Arabia and Colombia contributed. The International daily margin expanded, driven by better overall operating performance, and specifically by the newbuild deployments in Saudi Arabia. The improvement in our Drilling Solutions segment largely reflected growth from the third party and international markets. Rig Technologies benefitted from higher volumes in both capital equipment and the aftermarket.”
1
|
NEWS RELEASE |
Highlights
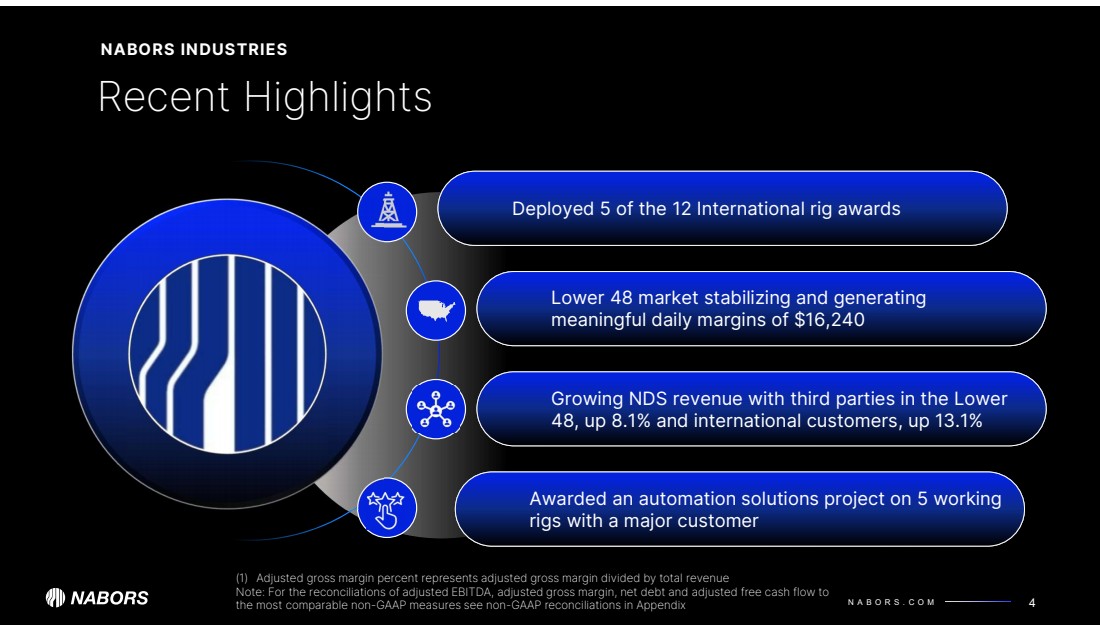
| o | Nabors Drilling Solutions was selected by a major operator in the Middle East to deploy NDS’s rig automation technology. Initially, the award covers five working rigs, with the potential for significant expansion. |
| o | ExxonMobil has selected Nabors to support its lithium production project in Arkansas. Nabors has commenced operations on this project with one of its high-specification PACE®-X rigs. |
| o | One of the largest Lower 48 operators named a Nabors PACE®-X rig its Rig of the Year, for the second consecutive year, based on its performance against rigs from six other drilling contractors. This award recognizes the Nabors crew and rig technology for their accomplishments. |
| o | Nabors was selected to provide technical and operational support to a local drilling contractor in Libya, under a Technical Services Agreement. Earlier in the year, this same contractor purchased two rigs from Nabors, which are now being deployed in Libya. |
| o | Nabors and SLB (NYSE: SLB) jointly announced a collaboration to scale automated drilling solutions for operators and drilling contractors. This integration of both companies’ platforms expands the breadth of drilling automation technologies available to customers, and increases their flexibility to utilize existing rig control systems from either Nabors or SLB. The announcement follows technology agreements earlier in 2023 with Corva and with Halliburton (NYSE: HAL). |
| o | Nabors Energy Transition Corporation, the special purpose acquisition company sponsored by Nabors, and Vast Renewables Limited completed their previously announced business combination. |
Segment Results
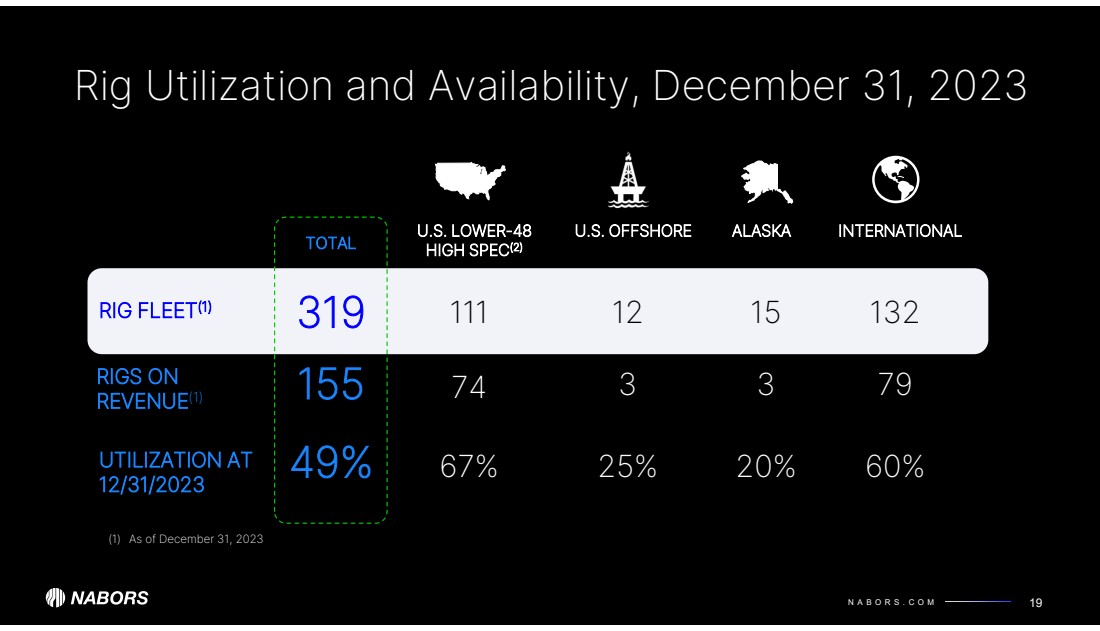
The U.S. Drilling segment reported fourth quarter adjusted EBITDA of $118.4 million, compared to $117.4 million in the third quarter. Nabors exited the year with 74 rigs on revenue in the Lower 48 market, while the fourth quarter average rig count totaled 70. Daily adjusted gross margin in the Lower 48 market averaged $16,240, an increase of $385 sequentially. This improvement reflected slightly higher daily revenue and reduced operating expenses. For the full year, EBITDA margins for U.S. Drilling increased by 600 basis points to 44.2%.
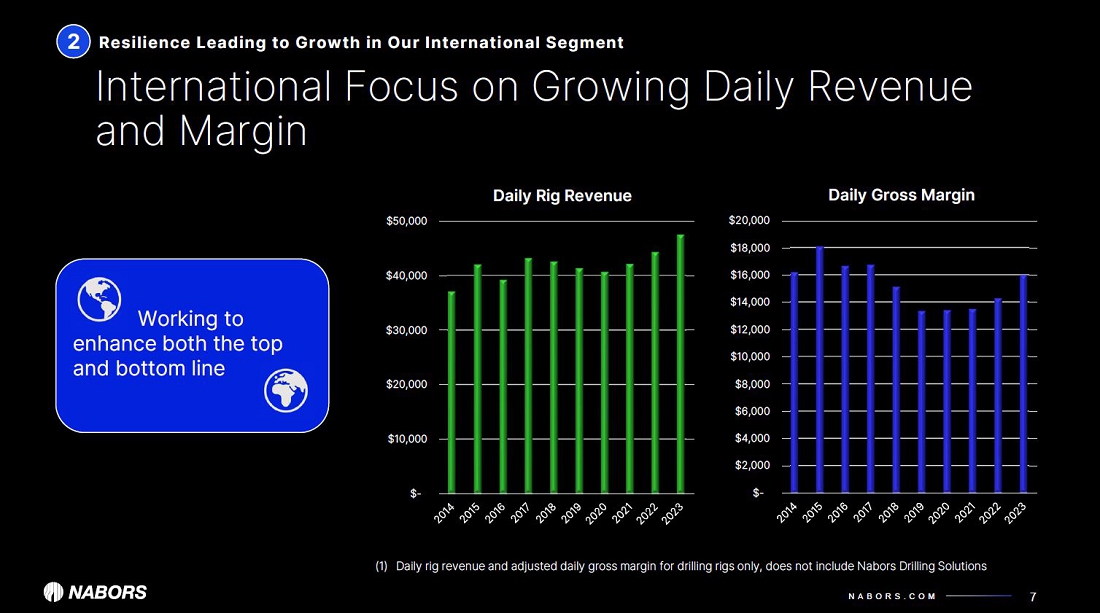
International Drilling adjusted EBITDA totaled $105.5 million, compared to $96.2 million in the third quarter. The additional rigs in Saudi Arabia and Colombia drove the increase. International rig count averaged 80, up from 77 in the previous quarter. Daily adjusted gross margin for the fourth quarter averaged $16,651, up approximately 6% from the third quarter, on improved operational performance.
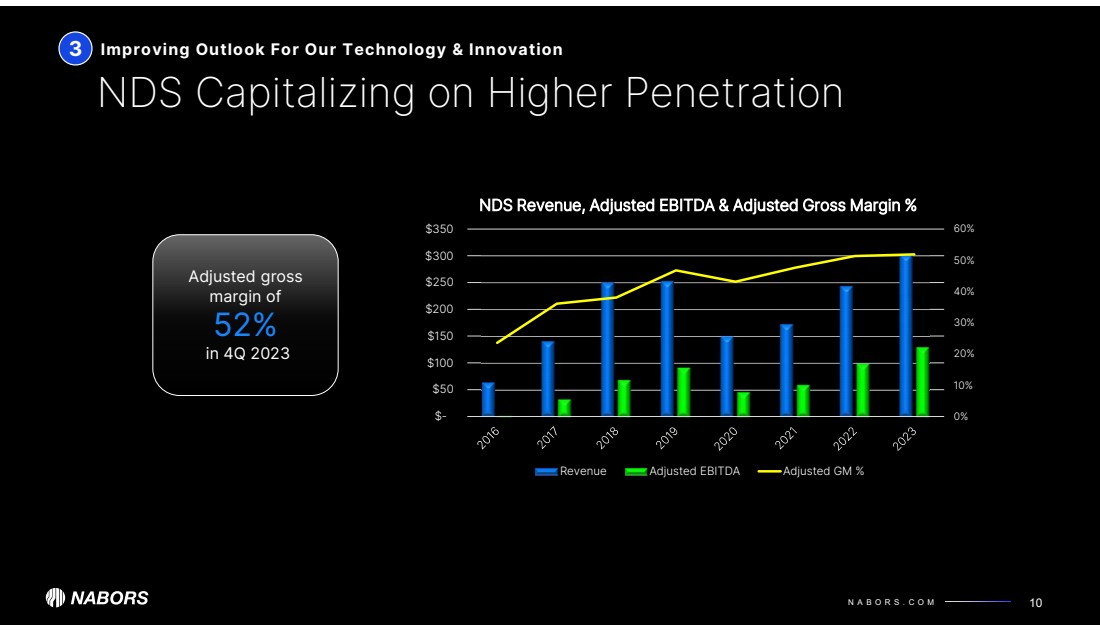
Drilling Solutions adjusted EBITDA increased sequentially by approximately $4.1 million, to $34.5 million. Revenue growth of 6% was led by a 13% expansion in international operations. Drilling Solutions gross margin increased by 120 basis points to 52.4%.
In Rig Technologies, adjusted EBITDA reached $8.8 million, a 22% sequential improvement. Seasonal increases in third-party equipment revenue and higher aftermarket sales led to wider margins.
2
|
NEWS RELEASE |
Adjusted Free Cash Flow
Adjusted free cash flow was $52 million in the fourth quarter, a $57 million improvement versus the prior period. Capital expenditures totaled $124 million, which included $43 million for the newbuilds in Saudi Arabia. This compares to $157 million in the third quarter, including $52 million supporting the newbuilds.
William Restrepo, Nabors CFO, stated, “Results across our operations were impressive. EBITDA rebounded close to the levels of the first half and was significantly above our projections. In the Lower 48, we were able to add the expected number of rigs, albeit later in the quarter than we originally envisioned. Our revenue per day and daily gross margin improved sequentially. Market pricing for rigs was stable, and our efforts to reduce costs paid off. Looking ahead to the first quarter, we expect a high level of rig churn to keep our average rig count essentially in line with the fourth quarter exit rate. As operating rigs continue to reprice to the current market, we expect some erosion in daily margin.
“Internationally we deployed rigs at attractive pricing. Reduced operating expenses and improved execution, particularly in Saudi Arabia, drove higher daily gross margins. In the first quarter, we expect newbuilds in Saudi Arabia and the initial startups in Algeria to increase our rig count.
“Drilling Solutions and Rig Technologies fourth quarter results benefitted from strong performance software and casing running revenue, as well as higher seasonal capital equipment shipments.
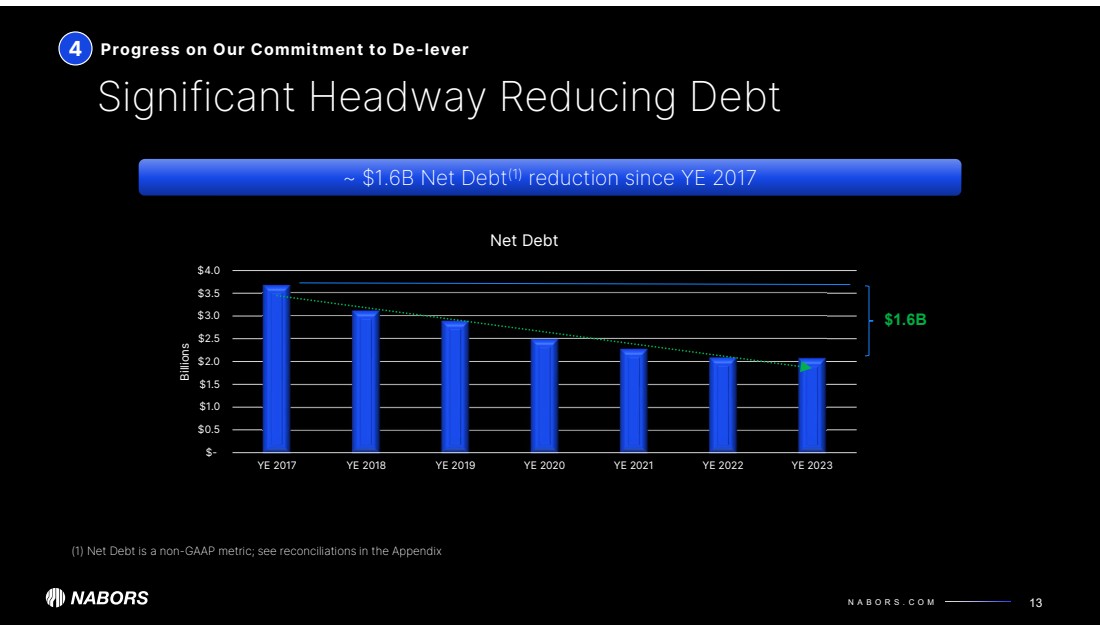
“During the fourth quarter, we completed a $650 million senior note offering due in 2030. With the proceeds, we have already retired both of our nearest pending maturities: the convertibles due in January 2024 and the senior notes due in 2025. Our next maturity is in 2026.
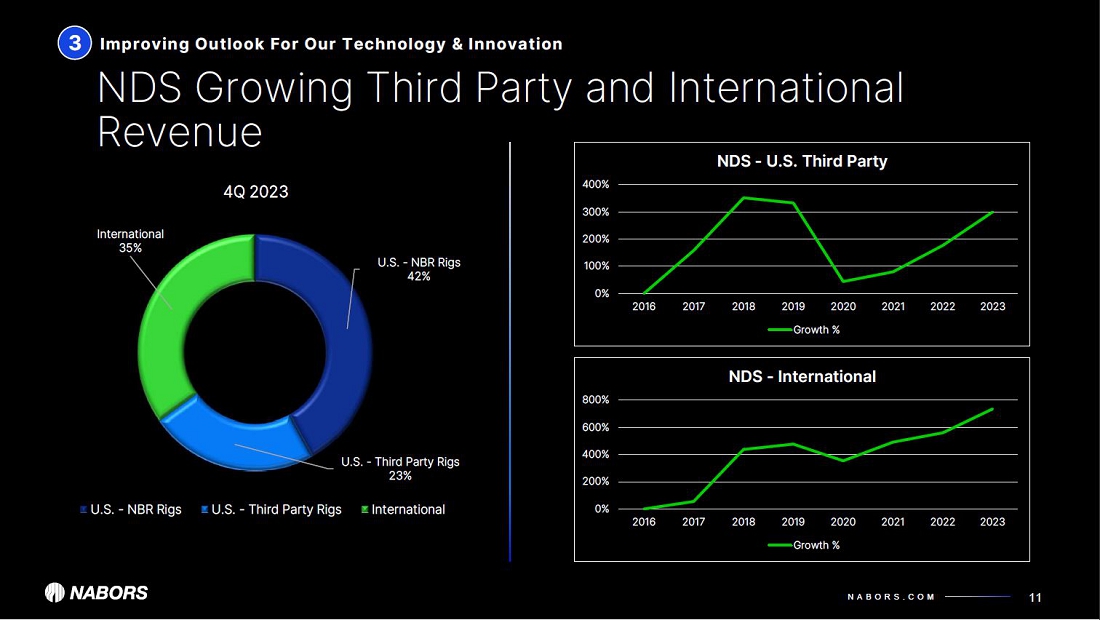
“As we enter 2024, we expect to build on our 2023 results. In the U.S., our annual average rig count for 2024 should approach the prior year’s level. We have a robust international deployment schedule in 2024, and the number of incremental opportunities continues to grow. Adoption of the NDS portfolio is still expanding, particularly on third party rigs and in international markets. Increased global drilling activity should benefit Rig Technologies. Additionally, increasing client focus on improving their operating efficiencies should drive demand for our automation solutions, while their goal to simultaneously reduce their environmental impact should drive demand for our energy transition offering.
“We still have a number of open international tenders and potential upside in activity level for the Lower 48. While it is still early in the year, we do expect to deliver a significant improvement in adjusted free cash flow, compared to the level of 2023. We plan to allocate the 2024 cash flow generation to reducing our net debt.”
3
|
NEWS RELEASE |
Outlook
Nabors expects the following metrics for the first quarter of 2024:
U.S. Drilling
| o | Lower 48 average rig count of 73 - 75 rigs |
| o | Lower 48 daily adjusted gross margin of approximately $15,300 |
| o | Alaska and Gulf of Mexico adjusted EBITDA up by $1.5 to $2.0 million |
International
| o | Average rig count up by approximately two rigs versus the fourth quarter average |
| o | Daily adjusted gross margin of approximately $16,100 - $16,300 |
Drilling Solutions
| o | Adjusted EBITDA of $30 - $31 million |
Rig Technologies
| o | Adjusted EBITDA of $5 - $6 million |
Capital Expenditures
| o | Capital expenditures of $170 - $180 million, with approximately $50 million for the newbuilds in Saudi Arabia |
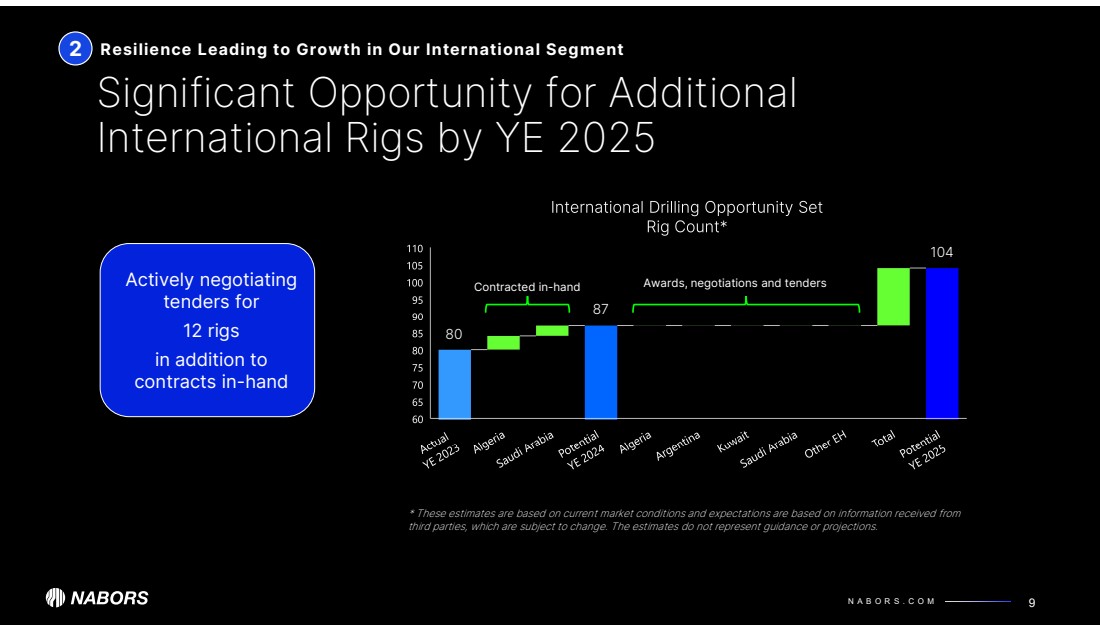
Mr. Petrello concluded, “As we look to 2024, we expect our financial performance to accelerate. International rig awards already in hand should drive growth this year. We are currently in negotiations and tendering for a significant number of additional international rigs. Assuming we are successful, those would provide further growth into and through 2025. At the same time, demand for our advanced technology solutions is expanding across the global customer set. With these drivers, I am optimistic we are on the right path.”
About Nabors Industries
Nabors Industries (NYSE: NBR) is a leading provider of advanced technology for the energy industry. With presence in more than 20 countries, Nabors has established a global network of people, technology and equipment to deploy solutions that deliver safe, efficient and responsible energy production. By leveraging its core competencies, particularly in drilling, engineering, automation, data science and manufacturing, Nabors aims to innovate the future of energy and enable the transition to a lower-carbon world. Learn more about Nabors and its energy technology leadership: www.nabors.com.
Forward-looking Statements
The information included in this press release includes forward-looking statements within the meaning of the Securities Act of 1933 and the Securities Exchange Act of 1934. Such forward-looking statements are subject to a number of risks and uncertainties, as disclosed by Nabors from time to time in its filings with the Securities and Exchange Commission. As a result of these factors, Nabors' actual results may differ materially from those indicated or implied by such forward-looking statements. The forward-looking statements contained in this press release reflect management's estimates and beliefs as of the date of this press release. Nabors does not undertake to update these forward-looking statements.
4
|
NEWS RELEASE |
Non-GAAP Disclaimer
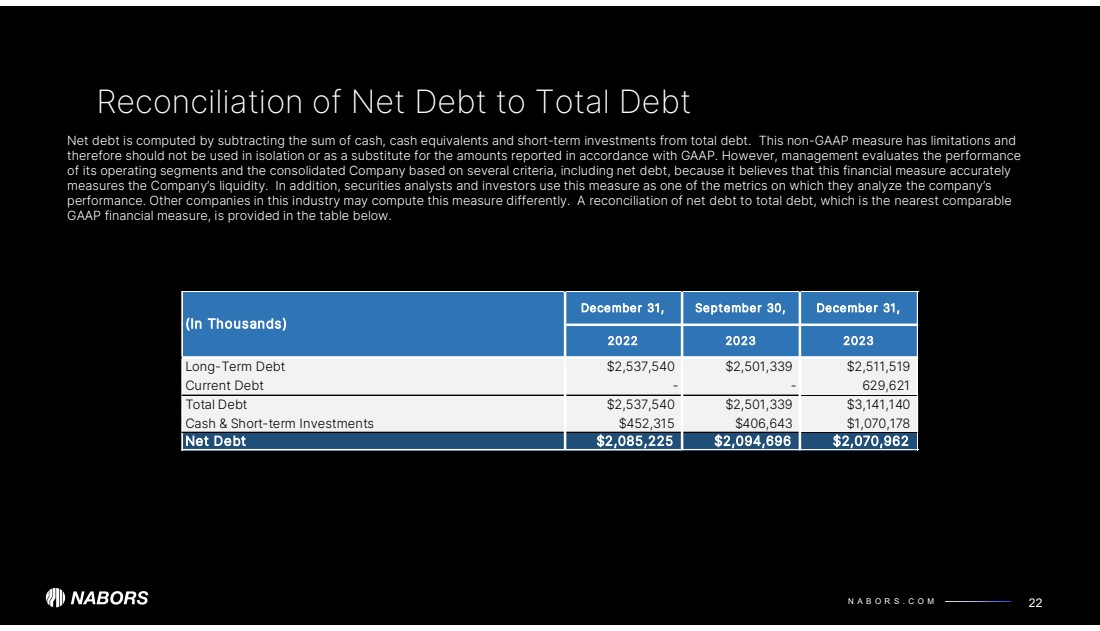
This press release presents certain “non-GAAP” financial measures. The components of these non-GAAP measures are computed by using amounts that are determined in accordance with accounting principles generally accepted in the United States of America (“GAAP”). Adjusted operating income (loss) represents income (loss) from continuing operations before income taxes, interest expense, investment income (loss), and other, net. Adjusted EBITDA is computed similarly, but also excludes depreciation and amortization expenses. In addition, adjusted EBITDA and adjusted operating income (loss) exclude certain cash expenses that the Company is obligated to make. Net debt is calculated as total debt minus the sum of cash, cash equivalents and short-term investments.
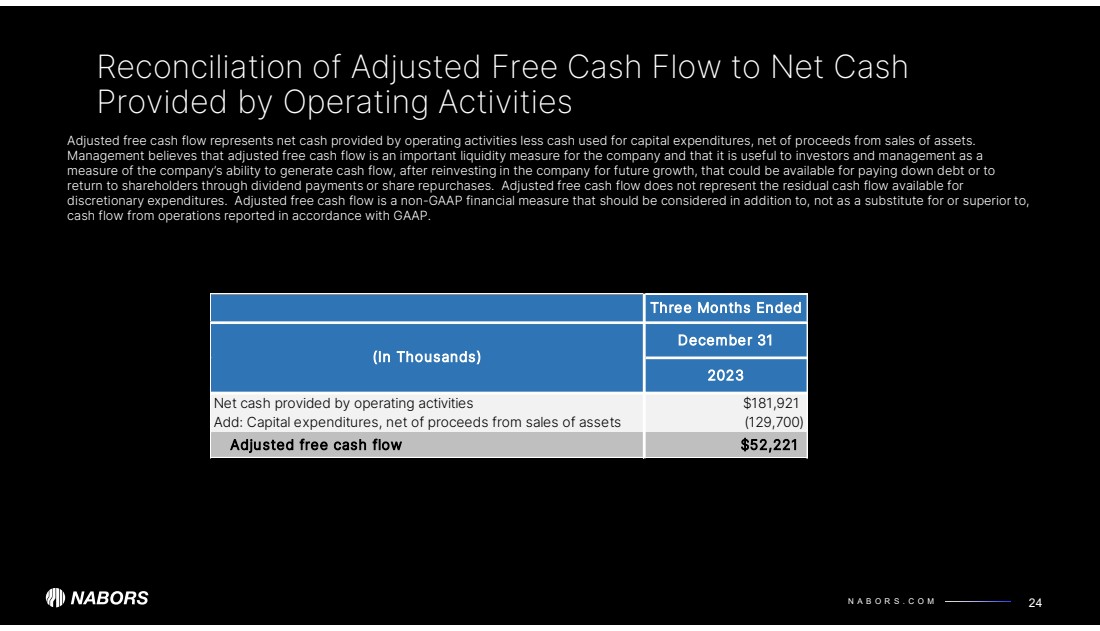
Adjusted free cash flow represents net cash provided by operating activities less cash used for capital expenditures, net of proceeds from sales of assets. Management believes that adjusted free cash flow is an important liquidity measure for the company and that it is useful to investors and management as a measure of the company’s ability to generate cash flow, after reinvesting in the company for future growth, that could be available for paying down debt or other financing cash flows, such as dividends to shareholders. Management believes that this non-GAAP measure is useful information to investors when comparing our cash flows with the cash flows of other companies.
Each of these non-GAAP measures has limitations and therefore should not be used in isolation or as a substitute for the amounts reported in accordance with GAAP. However, management evaluates the performance of its operating segments and the consolidated Company based on several criteria, including Adjusted EBITDA, adjusted operating income (loss), net debt, and adjusted free cash flow, because it believes that these financial measures accurately reflect the Company’s ongoing profitability and performance. Securities analysts and investors also use these measures as some of the metrics on which they analyze the Company’s performance. Other companies in this industry may compute these measures differently. Reconciliations of consolidated adjusted EBITDA and adjusted operating income (loss) to income (loss) from continuing operations before income taxes, net debt to total debt, and adjusted free cash flow to net cash provided by operations, which are their nearest comparable GAAP financial measures, are included in the tables at the end of this press release. We do not provide a forward-looking reconciliation of our outlook for Segment Adjusted EBITDA, Segment Gross Margin or Adjusted Free Cash Flow, as the amount and significance of items required to develop meaningful comparable GAAP financial measures cannot be estimated at this time without unreasonable efforts. These special items could be meaningful.
Investor Contacts: William C. Conroy, CFA, Vice President of Corporate Development & Investor Relations, +1 281-775-2423 or via e-mail william.conroy@nabors.com, or Kara Peak, Director of Corporate Development & Investor Relations, +1 281-775-4954 or via email kara.peak@nabors.com. To request investor materials, contact Nabors' corporate headquarters in Hamilton, Bermuda at +441-292-1510 or via e-mail mark.andrews@nabors.com
5
NABORS INDUSTRIES LTD. AND SUBSIDIARIES
CONDENSED CONSOLIDATED STATEMENTS OF INCOME (LOSS)
(Unaudited)
| Three Months Ended | Year Ended | |||||||||||||||||||
| December 31, | September 30, | December 31, | ||||||||||||||||||
| (In thousands, except per share amounts) | 2023 | 2022 | 2023 | 2023 | 2022 | |||||||||||||||
| Revenues and other income: | ||||||||||||||||||||
| Operating revenues | $ | 725,801 | $ | 760,148 | $ | 733,974 | $ | 3,005,981 | $ | 2,653,766 | ||||||||||
| Investment income (loss) | 12,042 | 9,194 | 10,169 | 43,820 | 14,992 | |||||||||||||||
| Total revenues and other income | 737,843 | 769,342 | 744,143 | 3,049,801 | 2,668,758 | |||||||||||||||
| Costs and other deductions: | ||||||||||||||||||||
| Direct costs | 424,769 | 457,184 | 447,751 | 1,790,380 | 1,666,004 | |||||||||||||||
| General and administrative expenses | 57,003 | 59,031 | 62,182 | 244,147 | 228,431 | |||||||||||||||
| Research and engineering | 13,926 | 13,911 | 14,016 | 56,297 | 49,939 | |||||||||||||||
| Depreciation and amortization | 161,228 | 168,841 | 161,337 | 645,294 | 665,072 | |||||||||||||||
| Interest expense | 49,938 | 44,245 | 44,042 | 185,285 | 177,895 | |||||||||||||||
| Other, net | 7,878 | 58,124 | 35,546 | (726 | ) | 127,099 | ||||||||||||||
| Total costs and other deductions | 714,742 | 801,336 | 764,874 | 2,920,677 | 2,914,440 | |||||||||||||||
| Income (loss) before income taxes | 23,101 | (31,994 | ) | (20,731 | ) | 129,124 | (245,682 | ) | ||||||||||||
| Income tax expense (benefit) | 19,244 | 26,161 | 10,513 | 79,220 | 61,536 | |||||||||||||||
| Net income (loss) | 3,857 | (58,155 | ) | (31,244 | ) | 49,904 | (307,218 | ) | ||||||||||||
| Less: Net (income) loss attributable to noncontrolling interest | (20,560 | ) | (10,911 | ) | (17,672 | ) | (61,688 | ) | (43,043 | ) | ||||||||||
| Net income (loss) attributable to Nabors | $ | (16,703 | ) | $ | (69,066 | ) | $ | (48,916 | ) | $ | (11,784 | ) | $ | (350,261 | ) | |||||
| Earnings (losses) per share: | ||||||||||||||||||||
| Basic | $ | (2.70 | ) | $ | (7.87 | ) | $ | (6.26 | ) | $ | (5.49 | ) | $ | (40.52 | ) | |||||
| Diluted | $ | (2.70 | ) | $ | (7.87 | ) | $ | (6.26 | ) | $ | (5.49 | ) | $ | (40.52 | ) | |||||
| Weighted-average number of common shares outstanding: | ||||||||||||||||||||
| Basic | 9,133 | 9,101 | 9,148 | 9,159 | 8,898 | |||||||||||||||
| Diluted | 9,133 | 9,101 | 9,148 | 9,159 | 8,898 | |||||||||||||||
| Adjusted EBITDA | $ | 230,103 | $ | 230,022 | $ | 210,025 | $ | 915,157 | $ | 709,392 | ||||||||||
| Adjusted operating income (loss) | $ | 68,875 | $ | 61,181 | $ | 48,688 | $ | 269,863 | $ | 44,320 | ||||||||||
1-1
NABORS INDUSTRIES LTD. AND SUBSIDIARIES
CONDENSED CONSOLIDATED BALANCE SHEETS
(Unaudited)
| December 31, | September 30, | December 31, | ||||||||||
| (In thousands) | 2023 | 2023 | 2022 | |||||||||
| ASSETS | ||||||||||||
| Current assets: | ||||||||||||
| Cash and short-term investments | $ | 1,070,178 | $ | 406,643 | $ | 452,315 | ||||||
| Accounts receivable, net | 347,837 | 324,970 | 327,397 | |||||||||
| Other current assets | 227,663 | 228,941 | 220,911 | |||||||||
| Total current assets | 1,645,678 | 960,554 | 1,000,623 | |||||||||
| Property, plant and equipment, net | 2,898,728 | 2,945,964 | 3,026,100 | |||||||||
| Other long-term assets | 733,559 | 820,332 | 703,131 | |||||||||
| Total assets | $ | 5,277,965 | $ | 4,726,850 | $ | 4,729,854 | ||||||
| LIABILITIES AND EQUITY | ||||||||||||
| Current liabilities: | ||||||||||||
| Current debt | $ | 629,621 | $ | - | $ | - | ||||||
| Trade accounts payable | 294,442 | 287,228 | 314,041 | |||||||||
| Other current liabilities | 289,918 | 241,475 | 282,349 | |||||||||
| Total current liabilities | 1,213,981 | 528,703 | 596,390 | |||||||||
| Long-term debt | 2,511,519 | 2,501,339 | 2,537,540 | |||||||||
| Other long-term liabilities | 271,380 | 314,441 | 380,529 | |||||||||
| Total liabilities | 3,996,880 | 3,344,483 | 3,514,459 | |||||||||
| Redeemable noncontrolling interest in subsidiary | 739,075 | 834,195 | 678,604 | |||||||||
| Equity: | ||||||||||||
| Shareholders' equity | 326,614 | 348,234 | 368,956 | |||||||||
| Noncontrolling interest | 215,396 | 199,938 | 167,835 | |||||||||
| Total equity | 542,010 | 548,172 | 536,791 | |||||||||
| Total liabilities and equity | $ | 5,277,965 | $ | 4,726,850 | $ | 4,729,854 | ||||||
1-2
NABORS INDUSTRIES LTD. AND SUBSIDIARIES
SEGMENT REPORTING
(Unaudited)
The following tables set forth certain information with respect to our reportable segments and rig activity:
| Three Months Ended | Year Ended | |||||||||||||||||||
| December 31, | September 30, | December 31, | ||||||||||||||||||
| (In thousands, except rig activity) | 2023 | 2022 | 2023 | 2023 | 2022 | |||||||||||||||
| Operating revenues: | ||||||||||||||||||||
| U.S. Drilling | $ | 265,762 | $ | 332,845 | $ | 276,385 | $ | 1,207,629 | $ | 1,100,614 | ||||||||||
| International Drilling | 342,771 | 317,577 | 344,780 | 1,345,249 | 1,199,282 | |||||||||||||||
| Drilling Solutions | 77,028 | 71,307 | 72,831 | 301,757 | 243,349 | |||||||||||||||
| Rig Technologies (1) | 59,287 | 62,803 | 61,437 | 242,768 | 195,129 | |||||||||||||||
| Other reconciling items (2) | (19,047 | ) | (24,384 | ) | (21,459 | ) | (91,422 | ) | (84,608 | ) | ||||||||||
| Total operating revenues | $ | 725,801 | $ | 760,148 | $ | 733,974 | $ | 3,005,981 | $ | 2,653,766 | ||||||||||
| Adjusted EBITDA: (3) | ||||||||||||||||||||
| U.S. Drilling | $ | 118,371 | $ | 144,142 | $ | 117,357 | $ | 533,663 | $ | 420,264 | ||||||||||
| International Drilling | 105,540 | 88,838 | 96,175 | 388,654 | 328,454 | |||||||||||||||
| Drilling Solutions | 34,502 | 30,336 | 30,419 | 129,591 | 98,699 | |||||||||||||||
| Rig Technologies (1) | 8,811 | 7,561 | 7,221 | 27,394 | 14,699 | |||||||||||||||
| Other reconciling items (4) | (37,121 | ) | (40,855 | ) | (41,147 | ) | (164,145 | ) | (152,724 | ) | ||||||||||
| Total adjusted EBITDA | $ | 230,103 | $ | 230,022 | $ | 210,025 | $ | 915,157 | $ | 709,392 | ||||||||||
| Adjusted operating income (loss): (5) | ||||||||||||||||||||
| U.S. Drilling | $ | 51,494 | $ | 68,293 | $ | 49,582 | $ | 262,353 | $ | 108,506 | ||||||||||
| International Drilling | 18,642 | 1,750 | 9,862 | 40,868 | (879 | ) | ||||||||||||||
| Drilling Solutions | 30,127 | 24,800 | 25,341 | 110,957 | 77,868 | |||||||||||||||
| Rig Technologies (1) | 5,788 | 6,118 | 4,995 | 19,529 | 8,906 | |||||||||||||||
| Other reconciling items (4) | (37,176 | ) | (39,780 | ) | (41,092 | ) | (163,844 | ) | (150,081 | ) | ||||||||||
| Total adjusted operating income (loss) | $ | 68,875 | $ | 61,181 | $ | 48,688 | $ | 269,863 | $ | 44,320 | ||||||||||
| Rig activity: | ||||||||||||||||||||
| Average Rigs Working: (7) | ||||||||||||||||||||
| Lower 48 | 70.3 | 95.1 | 73.7 | 79.6 | 90.0 | |||||||||||||||
| Other US | 6.0 | 7.0 | 6.7 | 6.7 | 7.2 | |||||||||||||||
| U.S. Drilling | 76.3 | 102.1 | 80.4 | 86.3 | 97.2 | |||||||||||||||
| International Drilling | 79.6 | 75.7 | 77.2 | 77.6 | 74.2 | |||||||||||||||
| Total average rigs working | 155.9 | 177.8 | 157.6 | 163.9 | 171.4 | |||||||||||||||
| Daily Rig Revenue: (6),(8) | ||||||||||||||||||||
| Lower 48 | $ | 35,776 | $ | 32,719 | $ | 35,697 | $ | 36,202 | $ | 27,836 | ||||||||||
| Other US | 62,346 | 72,497 | 56,163 | 63,866 | 71,333 | |||||||||||||||
| U.S. Drilling (10) | 37,865 | 35,447 | 37,397 | 38,338 | 31,037 | |||||||||||||||
| International Drilling | 46,782 | 45,616 | 48,528 | 47,484 | 44,311 | |||||||||||||||
| Daily Adjusted Gross Margin: (6),(9) | ||||||||||||||||||||
| Lower 48 | $ | 16,240 | $ | 14,599 | $ | 15,855 | $ | 16,446 | $ | 10,678 | ||||||||||
| Other US | 34,641 | 36,592 | 27,631 | 33,850 | 37,062 | |||||||||||||||
| U.S. Drilling (10) | 17,687 | 16,107 | 16,833 | 17,790 | 12,625 | |||||||||||||||
| International Drilling | 16,651 | 14,902 | 15,778 | 15,992 | 14,257 | |||||||||||||||
1-3
| (1) | Includes our oilfield equipment manufacturing activities. | ||||||
| (2) | Represents the elimination of inter-segment transactions related to our Rig Technologies operating segment. | ||||||
| (3) | Adjusted EBITDA represents net income (loss) before income tax expense (benefit), investment income (loss), interest expense, other, net and depreciation and amortization. Adjusted EBITDA is a non-GAAP financial measure and should not be used in isolation or as a substitute for the amounts reported in accordance with GAAP. In addition, adjusted EBITDA excludes certain cash expenses that the Company is obligated to make. However, management evaluates the performance of its operating segments and the consolidated Company based on several criteria, including adjusted EBITDA and adjusted operating income (loss), because it believes that these financial measures accurately reflect the Company’s ongoing profitability and performance. Securities analysts and investors use this measure as one of the metrics on which they analyze the Company’s performance. Other companies in this industry may compute these measures differently. A reconciliation of this non-GAAP measure to net income (loss), which is the most closely comparable GAAP measure, is provided in the table set forth immediately following the heading "Reconciliation of Non-GAAP Financial Measures to Net Income (Loss)". | ||||||
| (4) | Represents the elimination of inter-segment transactions and unallocated corporate expenses. | ||||||
| (5) | Adjusted operating income (loss) represents net income (loss) before income tax expense (benefit), investment income (loss), interest expense and other, net. Adjusted operating income (loss) is a non-GAAP financial measure and should not be used in isolation or as a substitute for the amounts reported in accordance with GAAP. In addition, adjusted operating income (loss) excludes certain cash expenses that the Company is obligated to make. However, management evaluates the performance of its operating segments and the consolidated Company based on several criteria, including adjusted EBITDA and adjusted operating income (loss), because it believes that these financial measures accurately reflect the Company’s ongoing profitability and performance. Securities analysts and investors use this measure as one of the metrics on which they analyze the Company’s performance. Other companies in this industry may compute these measures differently. A reconciliation of this non-GAAP measure to net income (loss), which is the most closely comparable GAAP measure, is provided in the table set forth immediately following the heading "Reconciliation of Non-GAAP Financial Measures to Net Income (Loss)". | ||||||
| (6) | Rig revenue days represents the number of days the Company's rigs are contracted and performing under a contract during the period. These would typically include days in which operating, standby and move revenue is earned. | ||||||
| (7) | Average rigs working represents a measure of the average number of rigs operating during a given period. For example, one rig operating 45 days during a quarter represents approximately 0.5 average rigs working for the quarter. On an annual period, one rig operating 182.5 days represents approximately 0.5 average rigs working for the year. Average rigs working can also be calculated as rig revenue days during the period divided by the number of calendar days in the period. | ||||||
| (8) | Daily rig revenue represents operating revenue, divided by the total number of revenue days during the quarter. | ||||||
| (9) | Daily adjusted gross margin represents operating revenue less direct costs, divided by the total number of rig revenue days during the quarter. | ||||||
| (10) | The U.S. Drilling segment includes the Lower 48, Alaska, and Gulf of Mexico operating areas. | ||||||
1-4
NABORS INDUSTRIES LTD. AND SUBSIDIARIES
Reconciliation of Earnings per Share
(Unaudited)
| Three Months Ended | Year Ended | |||||||||||||||||||
| December 31, | September 30, | December 31, | ||||||||||||||||||
| (in thousands, except per share amounts) | 2023 | 2022 | 2023 | 2023 | 2022 | |||||||||||||||
| BASIC EPS: | ||||||||||||||||||||
| Net income (loss) (numerator): | ||||||||||||||||||||
| Income (loss), net of tax | $ | 3,857 | $ | (58,155 | ) | $ | (31,244 | ) | $ | 49,904 | $ | (307,218 | ) | |||||||
| Less: net (income) loss attributable to noncontrolling interest | (20,560 | ) | (10,911 | ) | (17,672 | ) | (61,688 | ) | (43,043 | ) | ||||||||||
| Less: deemed dividends to SPAC public shareholders | (458 | ) | — | (823 | ) | (8,638 | ) | — | ||||||||||||
| Less: accrued distribution on redeemable noncontrolling interest in subsidiary | (7,517 | ) | (2,602 | ) | (7,517 | ) | (29,824 | ) | (10,324 | ) | ||||||||||
| Numerator for basic earnings per share: | ||||||||||||||||||||
| Adjusted income (loss), net of tax - basic | $ | (24,678 | ) | $ | (71,668 | ) | $ | (57,256 | ) | $ | (50,246 | ) | $ | (360,585 | ) | |||||
| Weighted-average number of shares outstanding - basic | 9,133 | 9,101 | 9,148 | 9,159 | 8,898 | |||||||||||||||
| Earnings (losses) per share: | ||||||||||||||||||||
| Total Basic | $ | (2.70 | ) | $ | (7.87 | ) | $ | (6.26 | ) | $ | (5.49 | ) | $ | (40.52 | ) | |||||
| DILUTED EPS: | ||||||||||||||||||||
| Adjusted income (loss), net of tax - diluted | $ | (24,678 | ) | $ | (71,668 | ) | $ | (57,256 | ) | $ | (50,246 | ) | $ | (360,585 | ) | |||||
| Weighted-average number of shares outstanding - diluted | 9,133 | 9,101 | 9,148 | 9,159 | 8,898 | |||||||||||||||
| Earnings (losses) per share: | ||||||||||||||||||||
| Total Diluted | $ | (2.70 | ) | $ | (7.87 | ) | $ | (6.26 | ) | $ | (5.49 | ) | $ | (40.52 | ) | |||||
1-5
NABORS INDUSTRIES LTD. AND SUBSIDIARIES
NON-GAAP FINANCIAL MEASURES
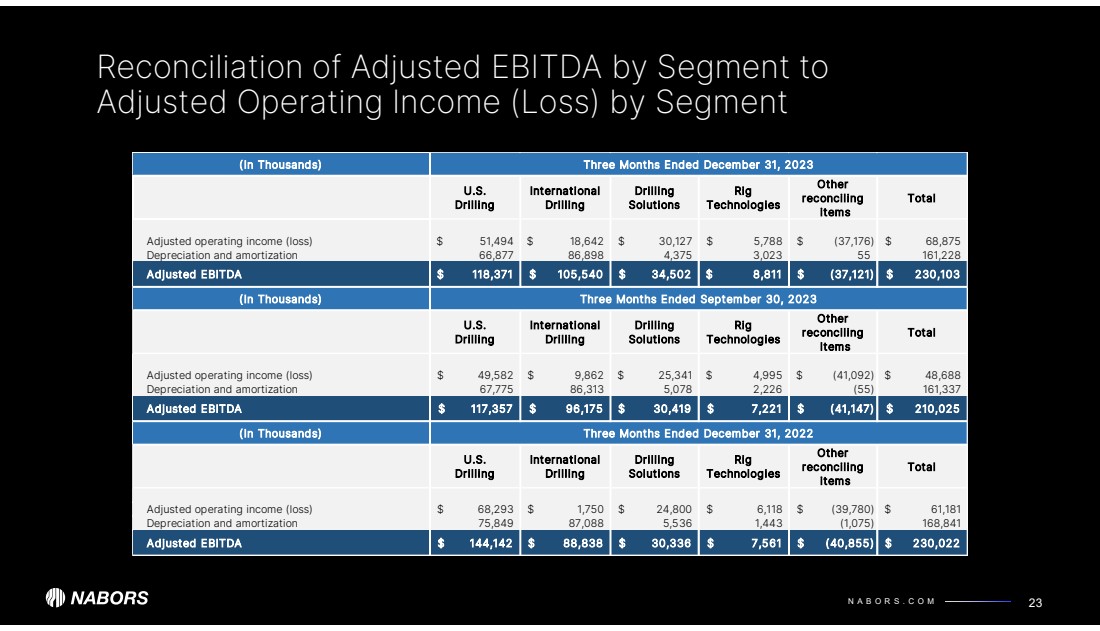
RECONCILIATION OF ADJUSTED EBITDA BY SEGMENT TO ADJUSTED OPERATING INCOME (LOSS) BY SEGMENT
(Unaudited)
| Three Months Ended December 30, 2023 | ||||||||||||||||||||||||
| (In thousands) | U.S. Drilling | International Drilling | Drilling Solutions | Rig Technologies | Other reconciling items | Total | ||||||||||||||||||
| Adjusted operating income (loss) | $ | 51,494 | $ | 18,642 | $ | 30,127 | $ | 5,788 | $ | (37,176 | ) | $ | 68,875 | |||||||||||
| Depreciation and amortization | 66,877 | 86,898 | 4,375 | 3,023 | 55 | 161,228 | ||||||||||||||||||
| Adjusted EBITDA | $ | 118,371 | $ | 105,540 | $ | 34,502 | $ | 8,811 | $ | (37,121 | ) | $ | 230,103 | |||||||||||
| Three Months Ended December 30, 2022 | ||||||||||||||||||||||||
| U.S. Drilling | International Drilling | Drilling Solutions | Rig Technologies | Other reconciling items | Total | |||||||||||||||||||
| Adjusted operating income (loss) | $ | 68,293 | $ | 1,750 | $ | 24,800 | $ | 6,118 | $ | (39,780 | ) | $ | 61,181 | |||||||||||
| Depreciation and amortization | 75,849 | 87,088 | 5,536 | 1,443 | (1,075 | ) | 168,841 | |||||||||||||||||
| Adjusted EBITDA | $ | 144,142 | $ | 88,838 | $ | 30,336 | $ | 7,561 | $ | (40,855 | ) | $ | 230,022 | |||||||||||
| Three Months Ended September 30, 2023 | ||||||||||||||||||||||||
| U.S. Drilling | International Drilling | Drilling Solutions | Rig Technologies | Other reconciling items | Total | |||||||||||||||||||
| Adjusted operating income (loss) | $ | 49,582 | $ | 9,862 | $ | 25,341 | $ | 4,995 | $ | (41,092 | ) | $ | 48,688 | |||||||||||
| Depreciation and amortization | 67,775 | 86,313 | 5,078 | 2,226 | (55 | ) | 161,337 | |||||||||||||||||
| Adjusted EBITDA | $ | 117,357 | $ | 96,175 | $ | 30,419 | $ | 7,221 | $ | (41,147 | ) | $ | 210,025 | |||||||||||
| Year Ended December 31, 2023 | ||||||||||||||||||||||||
| U.S. Drilling | International Drilling | Drilling Solutions | Rig Technologies | Other reconciling items | Total | |||||||||||||||||||
| Adjusted operating income (loss) | $ | 262,353 | $ | 40,868 | $ | 110,957 | $ | 19,529 | $ | (163,844 | ) | $ | 269,863 | |||||||||||
| Depreciation and amortization | 271,310 | 347,786 | 18,634 | 7,865 | (301 | ) | 645,294 | |||||||||||||||||
| Adjusted EBITDA | $ | 533,663 | $ | 388,654 | $ | 129,591 | $ | 27,394 | $ | (164,145 | ) | $ | 915,157 | |||||||||||
| Year Ended December 31, 2022 | ||||||||||||||||||||||||
| U.S. Drilling | International Drilling | Drilling Solutions | Rig Technologies | Other reconciling items | Total | |||||||||||||||||||
| Adjusted operating income (loss) | $ | 108,506 | $ | (879 | ) | $ | 77,868 | $ | 8,906 | $ | (150,081 | ) | $ | 44,320 | ||||||||||
| Depreciation and amortization | 311,758 | 329,333 | 20,831 | 5,793 | (2,643 | ) | 665,072 | |||||||||||||||||
| Adjusted EBITDA | $ | 420,264 | $ | 328,454 | $ | 98,699 | $ | 14,699 | $ | (152,724 | ) | $ | 709,392 | |||||||||||
1-6
NABORS INDUSTRIES LTD. AND SUBSIDIARIES
NON-GAAP FINANCIAL MEASURES
RECONCILIATION OF ADJUSTED GROSS MARGIN BY SEGMENT TO ADJUSTED OPERATING INCOME (LOSS) BY SEGMENT
(Unaudited)
| Three Months Ended | Year Ended | |||||||||||||||||||
| December 31, | September 30, | December 31, | ||||||||||||||||||
| (In thousands) | 2023 | 2022 | 2023 | 2023 | 2022 | |||||||||||||||
| Lower 48 - U.S. Drilling | ||||||||||||||||||||
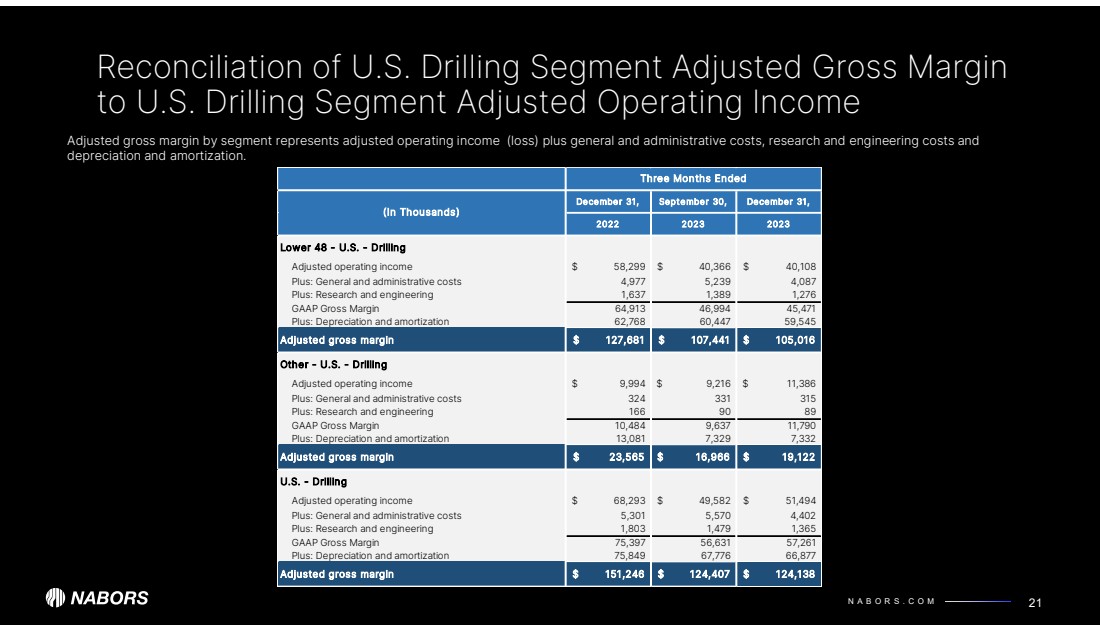
| Adjusted operating income (loss) | $ | 40,108 | $ | 58,299 | $ | 40,366 | $ | 215,041 | $ | 68,317 | ||||||||||
| Plus: General and administrative costs | 4,087 | 4,977 | 5,239 | 19,590 | 18,960 | |||||||||||||||
| Plus: Research and engineering | 1,276 | 1,637 | 1,389 | 5,373 | 6,539 | |||||||||||||||
| GAAP Gross Margin | 45,471 | 64,913 | 46,994 | 240,004 | 93,816 | |||||||||||||||
| Plus: Depreciation and amortization | 59,545 | 62,768 | 60,447 | 238,033 | 256,907 | |||||||||||||||
| Adjusted gross margin | $ | 105,016 | $ | 127,681 | $ | 107,441 | $ | 478,037 | $ | 350,723 | ||||||||||
| Other - U.S. Drilling | ||||||||||||||||||||
| Adjusted operating income (loss) | $ | 11,386 | $ | 9,994 | $ | 9,216 | $ | 47,312 | $ | 40,189 | ||||||||||
| Plus: General and administrative costs | 315 | 324 | 331 | 1,314 | 1,357 | |||||||||||||||
| Plus: Research and engineering | 89 | 166 | 90 | 438 | 594 | |||||||||||||||
| GAAP Gross Margin | 11,790 | 10,484 | 9,637 | 49,064 | 42,140 | |||||||||||||||
| Plus: Depreciation and amortization | 7,332 | 13,081 | 7,329 | 33,277 | 54,852 | |||||||||||||||
| Adjusted gross margin | $ | 19,122 | $ | 23,565 | $ | 16,966 | $ | 82,341 | $ | 96,992 | ||||||||||
| U.S. Drilling | ||||||||||||||||||||
| Adjusted operating income (loss) | $ | 51,494 | $ | 68,293 | $ | 49,582 | $ | 262,353 | $ | 108,506 | ||||||||||
| Plus: General and administrative costs | 4,402 | 5,301 | 5,570 | 20,904 | 20,317 | |||||||||||||||
| Plus: Research and engineering | 1,365 | 1,803 | 1,479 | 5,811 | 7,133 | |||||||||||||||
| GAAP Gross Margin | 57,261 | 75,397 | 56,631 | 289,068 | 135,956 | |||||||||||||||
| Plus: Depreciation and amortization | 66,877 | 75,849 | 67,776 | 271,310 | 311,759 | |||||||||||||||
| Adjusted gross margin | $ | 124,138 | $ | 151,246 | $ | 124,407 | $ | 560,378 | $ | 447,715 | ||||||||||
| International Drilling | ||||||||||||||||||||
| Adjusted operating income (loss) | $ | 18,642 | $ | 1,750 | $ | 9,862 | $ | 40,868 | $ | (879 | ) | |||||||||
| Plus: General and administrative costs | 14,899 | 13,368 | 14,300 | 57,624 | 51,505 | |||||||||||||||
| Plus: Research and engineering | 1,560 | 1,542 | 1,622 | 6,789 | 5,903 | |||||||||||||||
| GAAP Gross Margin | 35,101 | 16,660 | 25,784 | 105,281 | 56,529 | |||||||||||||||
| Plus: Depreciation and amortization | 86,899 | 87,089 | 86,313 | 347,786 | 329,335 | |||||||||||||||
| Adjusted gross margin | $ | 122,000 | $ | 103,749 | $ | 112,097 | $ | 453,067 | $ | 385,864 | ||||||||||
Adjusted gross margin by segment represents adjusted operating income (loss) plus general and administrative costs, research and engineering costs and depreciation and amortization.
1-7
NABORS INDUSTRIES LTD. AND SUBSIDIARIES
RECONCILIATION OF NON-GAAP FINANCIAL MEASURES TO NET INCOME (LOSS)
(Unaudited)
| Three Months Ended | Year Ended | |||||||||||||||||||
| December 31, | September 30, | December 31, | ||||||||||||||||||
| (In thousands) | 2023 | 2022 | 2023 | 2023 | 2022 | |||||||||||||||
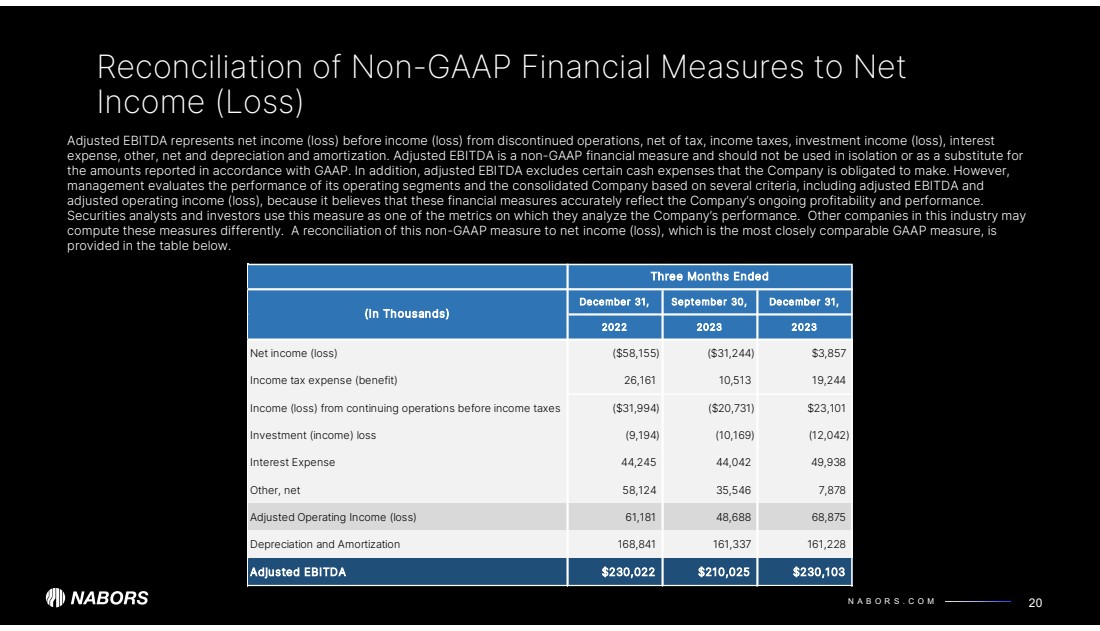
| Net income (loss) | $ | 3,857 | $ | (58,155 | ) | $ | (31,244 | ) | $ | 49,904 | $ | (307,218 | ) | |||||||
| Income tax expense (benefit) | 19,244 | 26,161 | 10,513 | 79,220 | 61,536 | |||||||||||||||
| Income (loss) from continuing operations before income taxes | 23,101 | (31,994 | ) | (20,731 | ) | 129,124 | (245,682 | ) | ||||||||||||
| Investment (income) loss | (12,042 | ) | (9,194 | ) | (10,169 | ) | (43,820 | ) | (14,992 | ) | ||||||||||
| Interest expense | 49,938 | 44,245 | 44,042 | 185,285 | 177,895 | |||||||||||||||
| Other, net | 7,878 | 58,124 | 35,546 | (726 | ) | 127,099 | ||||||||||||||
| Adjusted operating income (loss) (1) | 68,875 | 61,181 | 48,688 | 269,863 | 44,320 | |||||||||||||||
| Depreciation and amortization | 161,228 | 168,841 | 161,337 | 645,294 | 665,072 | |||||||||||||||
| Adjusted EBITDA (2) | $ | 230,103 | $ | 230,022 | $ | 210,025 | $ | 915,157 | $ | 709,392 | ||||||||||
(1) Adjusted operating income (loss) represents net income (loss) before income tax expense (benefit), investment income (loss), interest expense, and other, net. Adjusted operating income (loss) is a non-GAAP financial measure and should not be used in isolation or as a substitute for the amounts reported in accordance with GAAP. In addition, adjusted operating income (loss) excludes certain cash expenses that the Company is obligated to make. However, management evaluates the performance of its operating segments and the consolidated Company based on several criteria, including adjusted EBITDA and adjusted operating income (loss), because it believes that these financial measures accurately reflect the Company’s ongoing profitability and performance. Securities analysts and investors use this measure as one of the metrics on which they analyze the Company’s performance. Other companies in this industry may compute these measures differently.
(2) Adjusted EBITDA represents net income (loss) before income tax expense (benefit), investment income (loss), interest expense, other, net and depreciation and amortization. Adjusted EBITDA is a non-GAAP financial measure and should not be used in isolation or as a substitute for the amounts reported in accordance with GAAP. In addition, adjusted EBITDA excludes certain cash expenses that the Company is obligated to make. However, management evaluates the performance of its operating segments and the consolidated Company based on several criteria, including adjusted EBITDA and adjusted operating income (loss), because it believes that these financial measures accurately reflect the Company’s ongoing profitability and performance. Securities analysts and investors use this measure as one of the metrics on which they analyze the Company’s performance. Other companies in this industry may compute these measures differently.
1-8
NABORS INDUSTRIES LTD. AND SUBSIDIARIES
RECONCILIATION OF NET DEBT TO TOTAL DEBT
(Unaudited)
| December 31, | September 30, | December 31, | ||||||||||
| (In thousands) | 2023 | 2023 | 2022 | |||||||||
| Current debt | $ | 629,621 | $ | - | $ | - | ||||||
| Long-term debt | 2,511,519 | 2,501,339 | 2,537,540 | |||||||||
| Total Debt | 3,141,140 | 2,501,339 | 2,537,540 | |||||||||
| Less: Cash and short-term investments | 1,070,178 | 406,643 | 452,315 | |||||||||
| Net Debt | $ | 2,070,962 | $ | 2,094,696 | $ | 2,085,225 | ||||||
1-9
NABORS INDUSTRIES LTD. AND SUBSIDIARIES
RECONCILIATION OF ADJUSTED FREE CASH FLOW TO
NET CASH PROVIDED BY OPERATING ACTIVITIES
(Unaudited)
| Three Months Ended | Year Ended | |||||||||||
| December 31, | September 30, | December 31, | ||||||||||
| (In thousands) | 2023 | 2023 | 2023 | |||||||||
| Net cash provided by operating activities | $ | 181,921 | $ | 133,425 | $ | 637,862 | ||||||
| Add: Capital expenditures, net of proceeds from sales of assets | (129,700 | ) | (138,583 | ) | (526,718 | ) | ||||||
| Adjusted free cash flow | $ | 52,221 | $ | (5,158 | ) | $ | 111,144 | |||||
Adjusted free cash flow represents net cash provided by operating activities less cash used for capital expenditures, net of proceeds from sales of assets. Management believes that adjusted free cash flow is an important liquidity measure for the company and that it is useful to investors and management as a measure of the company’s ability to generate cash flow, after reinvesting in the company for future growth, that could be available for paying down debt or other financing cash flows, such as dividends to shareholders. Adjusted free cash flow does not represent the residual cash flow available for discretionary expenditures. Adjusted free cash flow is a non-GAAP financial measure that should be considered in addition to, not as a substitute for or superior to, cash flow from operations reported in accordance with GAAP.
1-10