Exhibit 99.1
| NABORS INDUSTRIES LTD. September 2021 Investor Presentation NABORS |
| Forward Looking Statements • our ability to complete, and realize the expected benefits, of strategic transactions; • changes in tax laws and the possibility of changes in other laws and regulation; • the possibility of political or economic instability, civil disturbance, war or acts of terrorism in any of the countries in which we do business; • the possibility of changes to U.S. trade policies and regulations including the imposition of trade embargoes or sanctions; and • general economic conditions, including the capital and credit markets. Our businesses depend, to a large degree, on the level of spending by oil and gas companies for exploration, development and production activities. Therefore, sustained lower oil or natural gas prices that have a material impact on exploration, development or production activities could also materially affect our financial position, results of operations and cash flows. The above description of risks and uncertainties is by no means all-inclusive, but is designed to highlight what we believe are important factors to consider. For a discussion of these factors and other risks and uncertainties, please refer to our filings with the Securities and Exchange Commission ("SEC"), including those contained in our Annual Reports on Form 10-K and Quarterly Reports on Form 10-Q, which are available at the SEC's website at www.sec.gov. Non-GAAP Financial Measures This presentation refers to certain “non-GAAP” financial measures, such as adjusted EBITDA, net debt and free cash flow. The components of these non-GAAP measures are computed by using amounts that are determined in accordance with accounting principles generally accepted in the United States of America (“GAAP”). A reconciliation of adjusted EBITDA to income (loss) from continuing operations before income taxes, net debt to total debt, and freecashflowtonetcash provided by operating activities, which are their nearest comparable GAAP financial measures, as provided in the Appendix at the end of this presentation. We often discuss expectations regarding our future markets, demand for our products and services, and our performance in our annual, quarterly, and current reports, press releases, and other written and oral statements. Such statements, including statements in this document that relate to matters that are not historical facts, are “forward-looking statements” within the meaning of the safe harbor provisions of Section 27A of the U.S. Securities Act of 1933 and Section 21E of the U.S. Securities Exchange Act of 1934. These “forward-looking statements” are based on our analysis of currently available competitive, financial and economic data and our operating plans. They are inherently uncertain, and investors should recognize that events and actual results could turn out to be significantly different from our expectations. Factors to consider when evaluating these forward-looking statements include, but are not limited to: • the Covid-19 pandemic and its impact on oil and gas markets and prices; • fluctuations and volatility in worldwide prices of and demand for oil and natural gas; • fluctuations in levels of oil and natural gas exploration and development activities; • fluctuations in the demand for our services; • competitive and technological changes and other developments in the oil and gas and oilfield services industries; • our ability to renew customer contracts in order to maintain competitiveness; • the existence of operating risks inherent in the oil and gas and oilfield services industries; • the possibility of the loss of one or a number of our large customers; • the impact of long-term indebtedness and other financial commitments on our financial and operating flexibility; • our access to and the cost of capital, including the impact of a further downgrade in our credit rating, covenant restrictions, availability under our unsecured revolving credit facility, and future issuances of debt or equity securities; • our dependence on our operating subsidiaries and investments to meet our financial obligations; our ability to retain skilled employees; 2 |
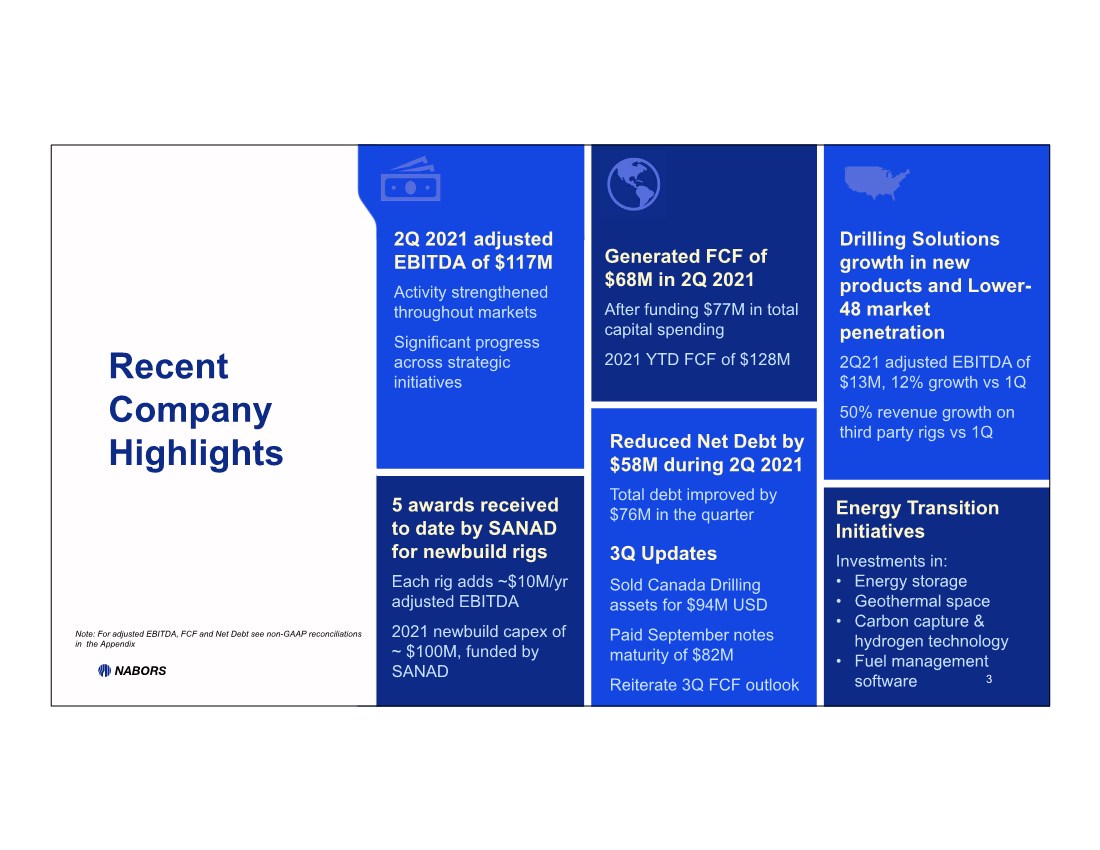
| Recent Company Highlights Generated FCF of $68M in 2Q 2021 After funding $77M in total capital spending 2021 YTD FCF of $128M Reduced Net Debt by $58M during 2Q 2021 Total debt improved by $76M in the quarter 2Q 2021 adjusted EBITDA of $117M Activity strengthened throughout markets Significant progress across strategic initiatives Drilling Solutions growth in new products and Lower- 48 market penetration 2Q21 adjusted EBITDA of $13M, 12% growth vs 1Q 50% revenue growth on third party rigs vs 1Q 5 awards received to date by SANAD for newbuild rigs Each rig adds ~$10M/yr adjusted EBITDA 2021 newbuild capex of ~ $100M, funded by SANAD Energy Transition Initiatives Investments in: • Energy storage • Geothermal space • Carbon capture & hydrogen technology • Fuel management software 3 Note: For adjusted EBITDA, FCF and Net Debt see non-GAAP reconciliations in the Appendix 3 3Q Updates Sold Canada Drilling assets for $94M USD Paid September notes maturity of $82M Reiterate 3Q FCF outlook |
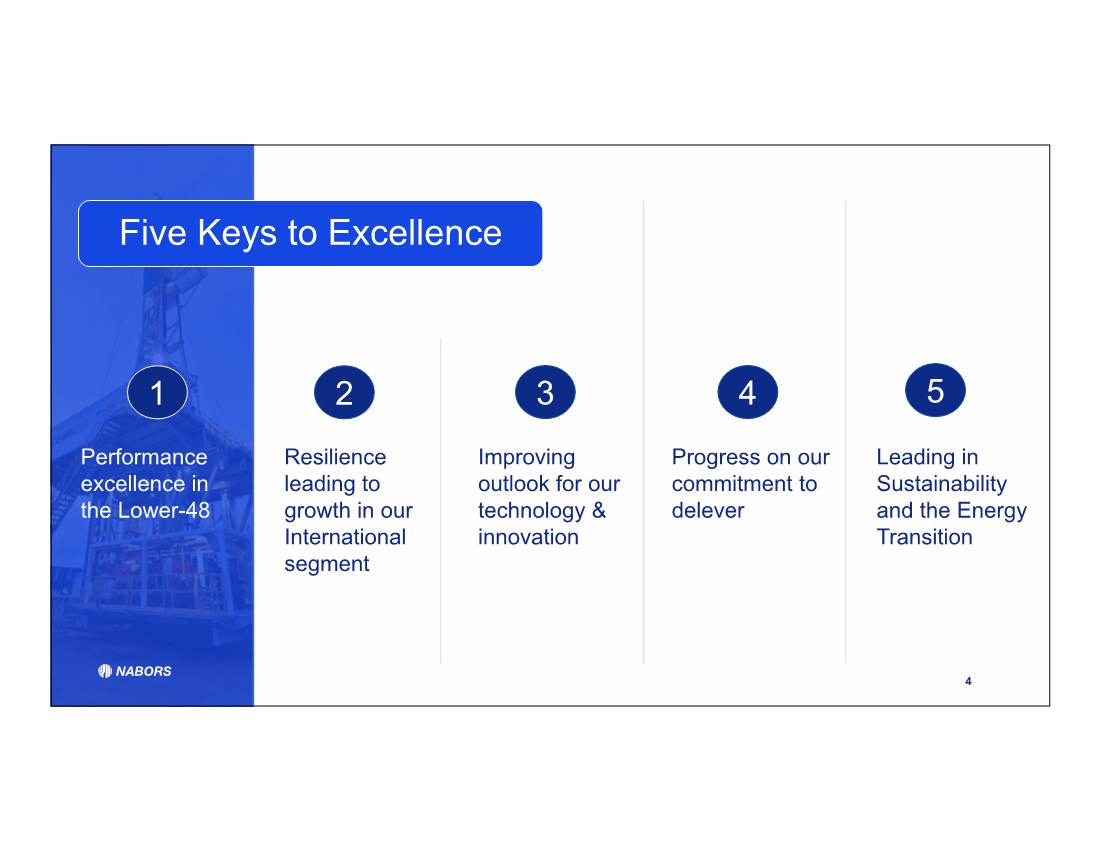
| Performance excellence in the Lower-48 Resilience leading to growth in our International segment Improving outlook for our technology & innovation Progress on our commitment to delever Leading in Sustainability and the Energy Transition 4 Five Keys to Excellence 1 4 3 2 5 |
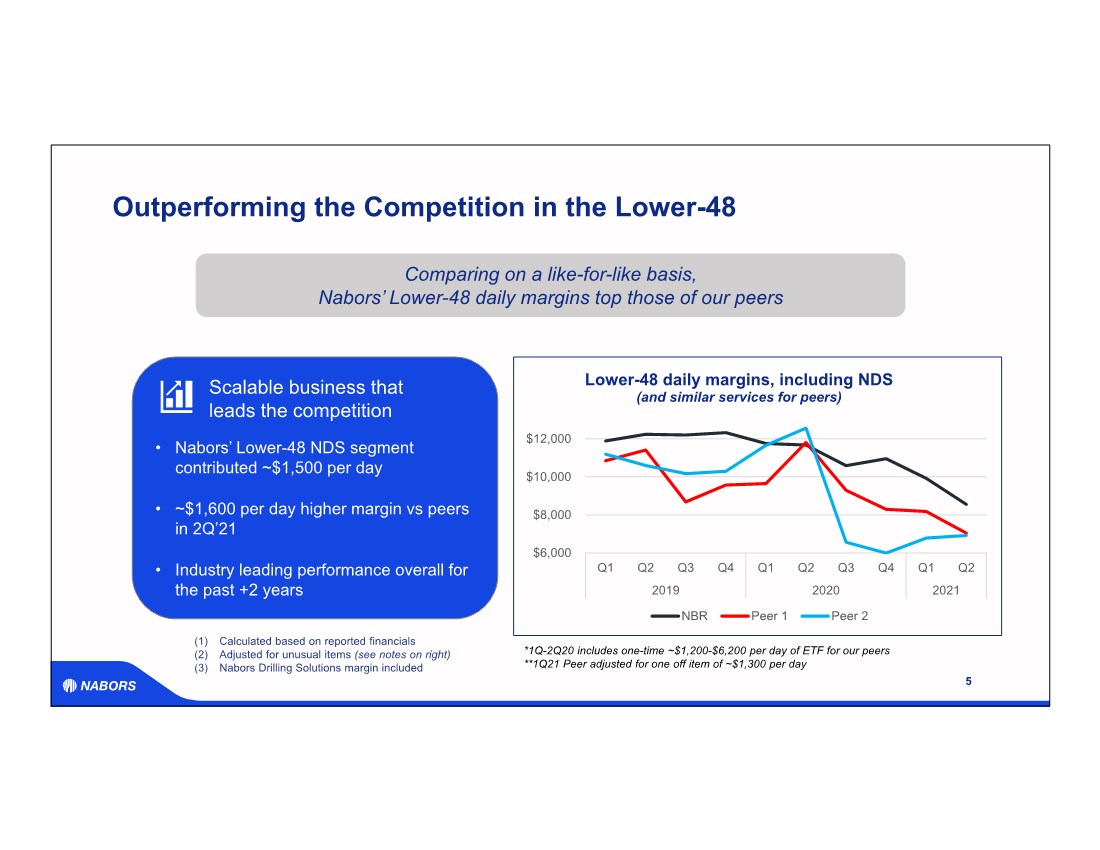
| Outperforming the Competition in the Lower-48 5 Comparing on a like-for-like basis, Nabors’ Lower-48 daily margins top those of our peers (1) Calculated based on reported financials (2) Adjusted for unusual items (see notes on right) (3) Nabors Drilling Solutions margin included $6,000 $8,000 $10,000 $12,000 Q1 Q2 Q3 Q4 Q1 Q2 Q3 Q4 Q1 Q2 2019 2020 2021 Lower-48 daily margins, including NDS (and similar services for peers) NBR Peer 1 Peer 2 Scalable business that leads the competition • Nabors’ Lower-48 NDS segment contributed ~$1,500 per day • ~$1,600 per day higher margin vs peers in 2Q’21 • Industry leading performance overall for the past +2 years *1Q-2Q20 includes one-time ~$1,200-$6,200 per day of ETF for our peers **1Q21 Peer adjusted for one off item of ~$1,300 per day |
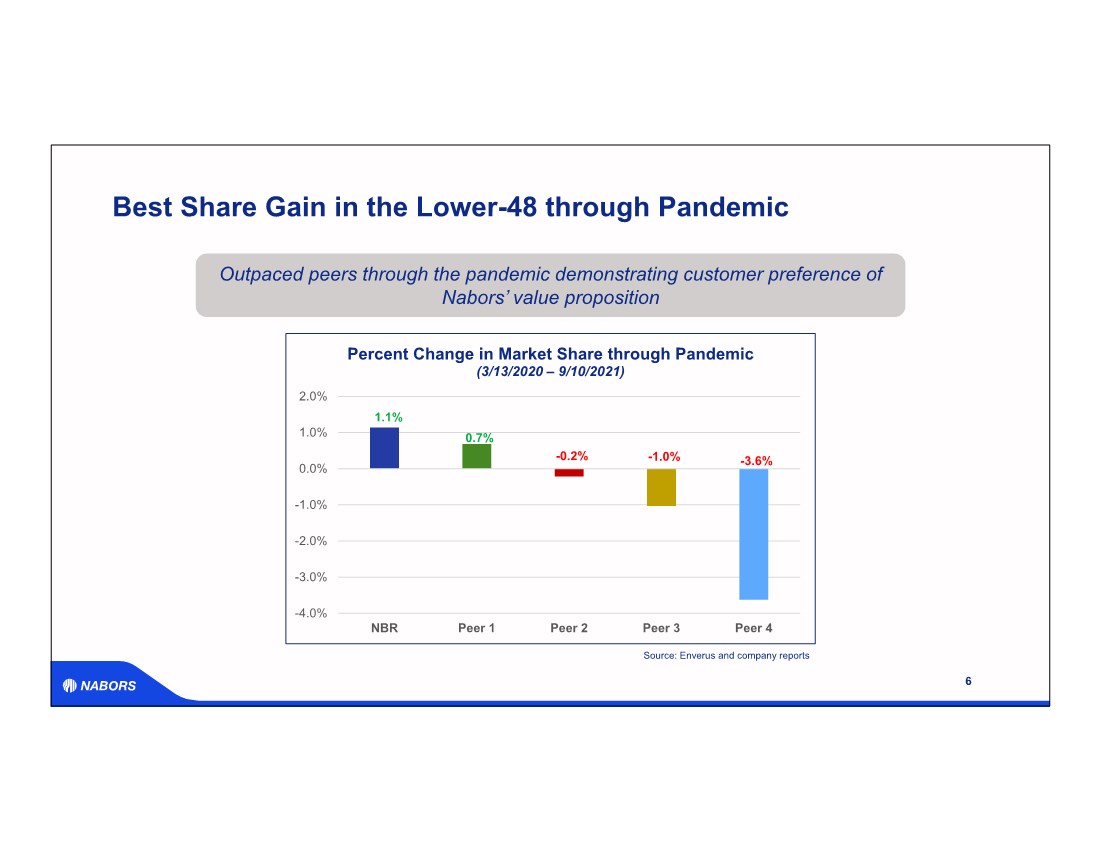
| Best Share Gain in the Lower-48 through Pandemic 6 1.1% 0.7% -0.2% -1.0% -3.6% -4.0% -3.0% -2.0% -1.0% 0.0% 1.0% 2.0% NBR Peer 1 Peer 2 Peer 3 Peer 4 Percent Change in Market Share through Pandemic (3/13/2020 – 9/10/2021) Outpaced peers through the pandemic demonstrating customer preference of Nabors’ value proposition Source: Enverus and company reports |
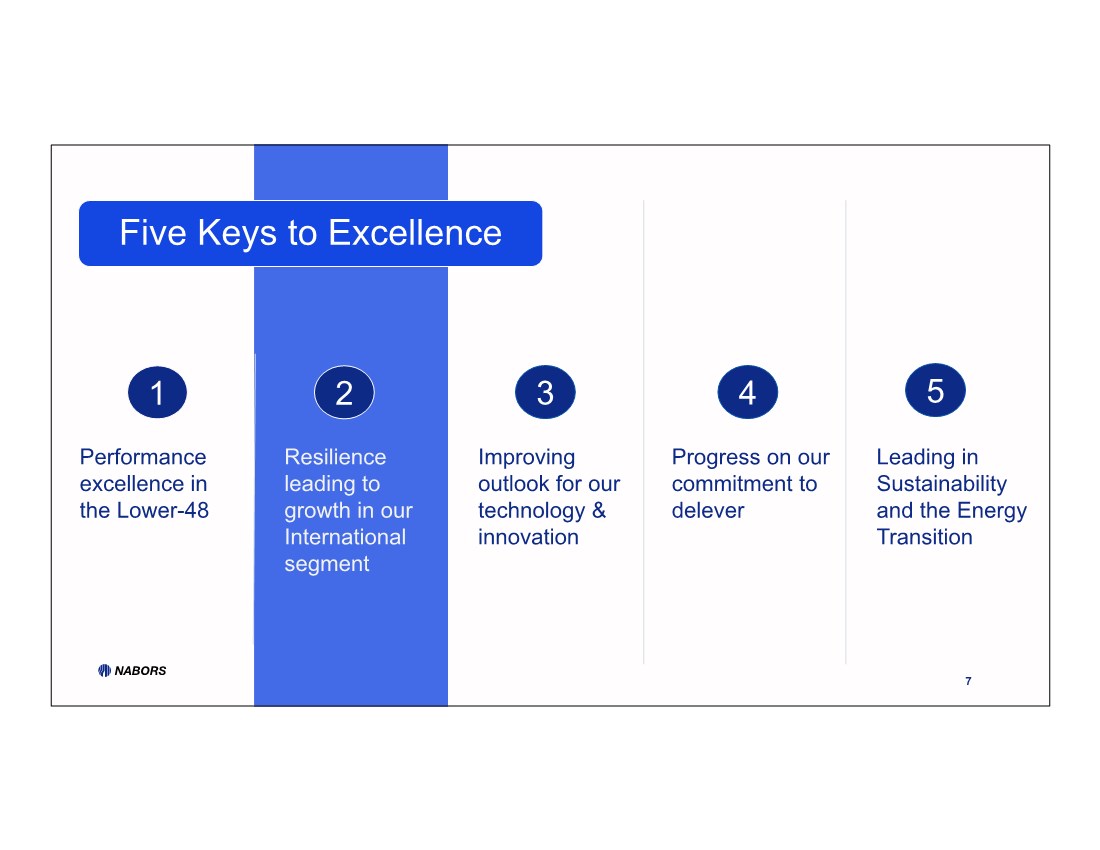
| Performance excellence in the Lower-48 Resilience leading to growth in our International segment Improving outlook for our technology & innovation Progress on our commitment to delever Leading in Sustainability and the Energy Transition 7 1 4 3 2 5 Five Keys to Excellence |
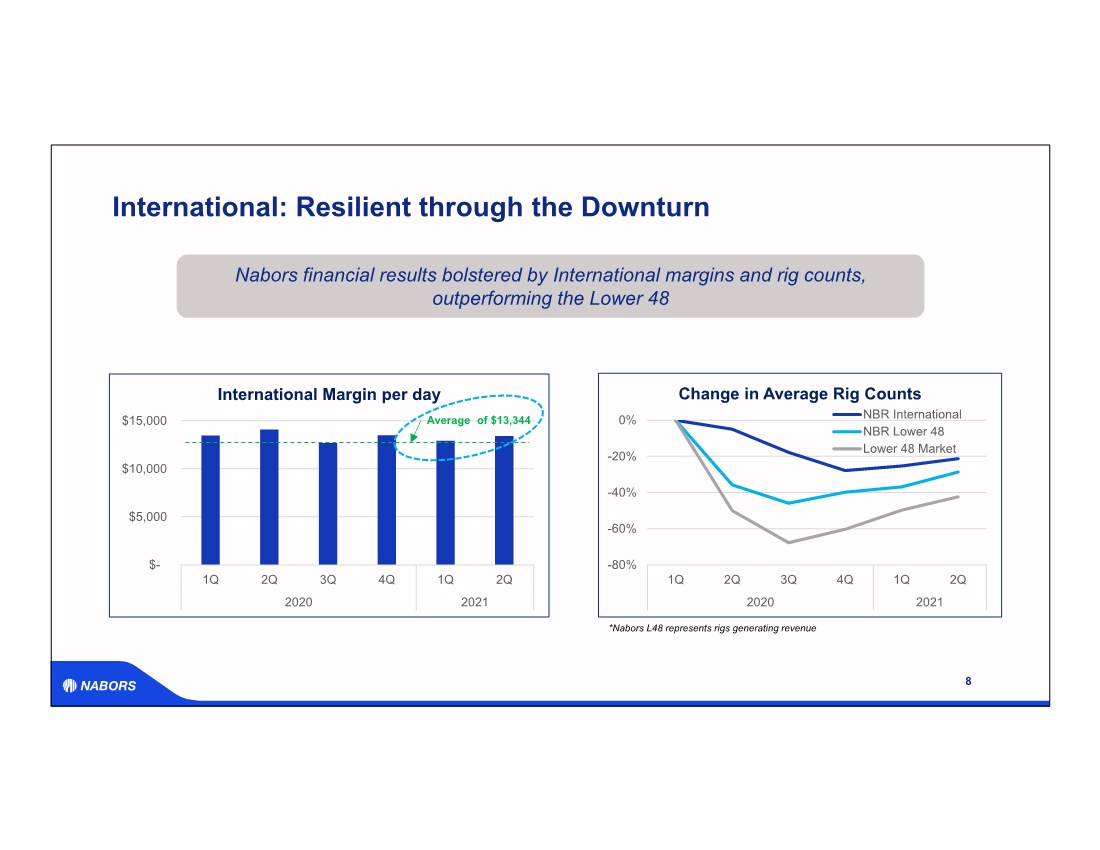
| -80% -60% -40% -20% 0% 1Q 2Q 3Q 4Q 1Q 2Q 2020 2021 Change in Average Rig Counts NBR International NBR Lower 48 Lower 48 Market $- $5,000 $10,000 $15,000 1Q 2Q 3Q 4Q 1Q 2Q 2020 2021 International Margin per day International: Resilient through the Downturn 8 Nabors financial results bolstered by International margins and rig counts, outperforming the Lower 48 Average of $13,344 *Nabors L48 represents rigs generating revenue |
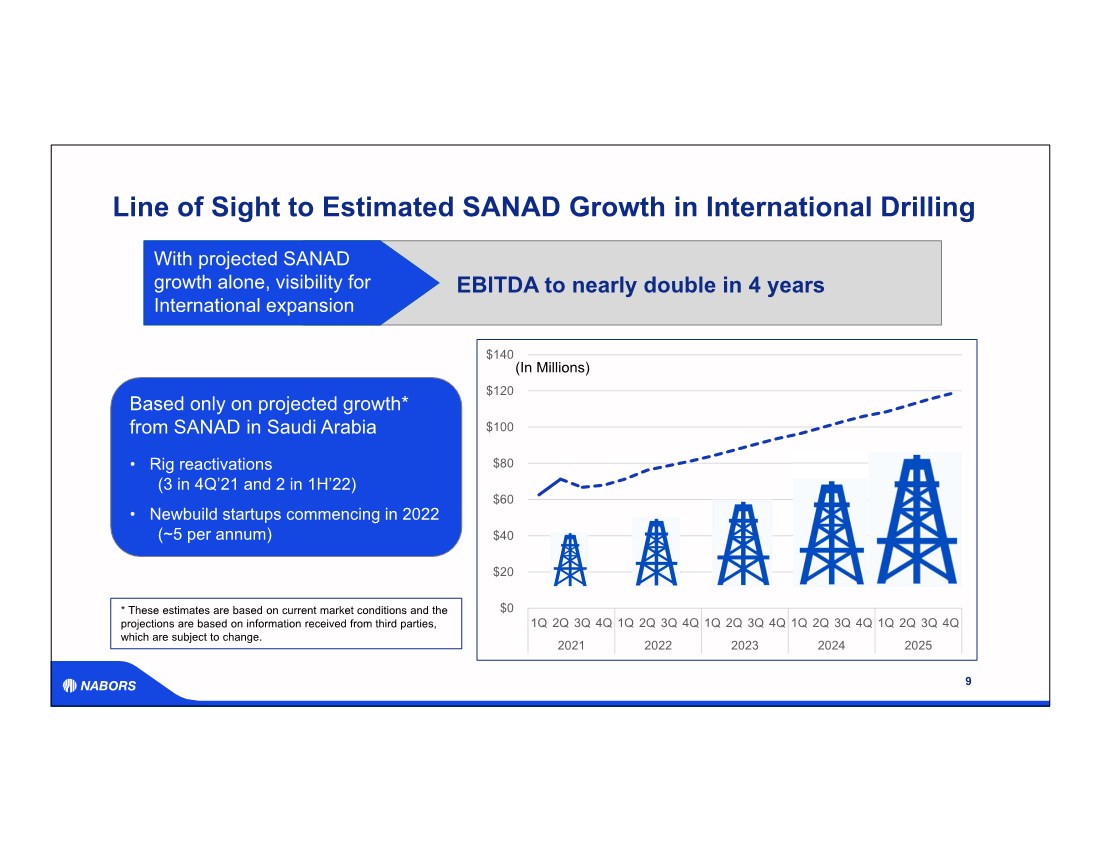
| Line of Sight to Estimated SANAD Growth in International Drilling 9 $0 $20 $40 $60 $80 $100 $120 $140 1Q 2Q 3Q 4Q 1Q 2Q 3Q 4Q 1Q 2Q 3Q 4Q 1Q 2Q 3Q 4Q 1Q 2Q 3Q 4Q 2021 2022 2023 2024 2025 EBITDA to nearly double in 4 years With projected SANAD growth alone, visibility for International expansion (In Millions) Based only on projected growth* from SANAD in Saudi Arabia • Rig reactivations (3 in 4Q’21 and 2 in 1H’22) • Newbuild startups commencing in 2022 (~5 per annum) * These estimates are based on current market conditions and the projections are based on information received from third parties, which are subject to change. |
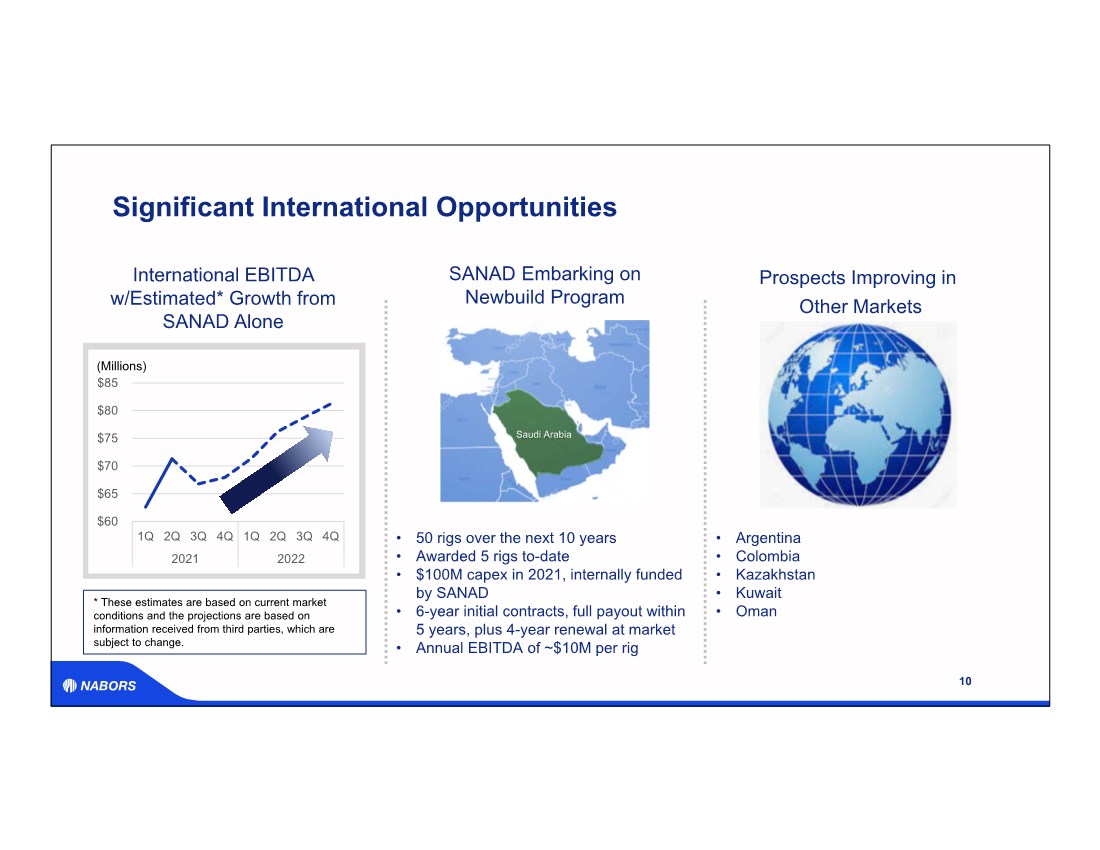
| Significant International Opportunities 10 • 50 rigs over the next 10 years • Awarded 5 rigs to-date • $100M capex in 2021, internally funded by SANAD • 6-year initial contracts, full payout within 5 years, plus 4-year renewal at market • Annual EBITDA of ~$10M per rig $60 $65 $70 $75 $80 $85 1Q 2Q 3Q 4Q 1Q 2Q 3Q 4Q 2021 2022 SANAD Embarking on Newbuild Program Prospects Improving in Other Markets (Millions) • Argentina • Colombia • Kazakhstan • Kuwait •Oman International EBITDA w/Estimated* Growth from SANAD Alone Saudi Arabia * These estimates are based on current market conditions and the projections are based on information received from third parties, which are subject to change. |
| Performance excellence in the Lower-48 Resilience leading to growth in our International segment Improving outlook for our technology & innovation Progress on our commitment to delever Leading in Sustainability and the Energy Transition 11 1 4 3 2 5 Five Keys to Excellence |
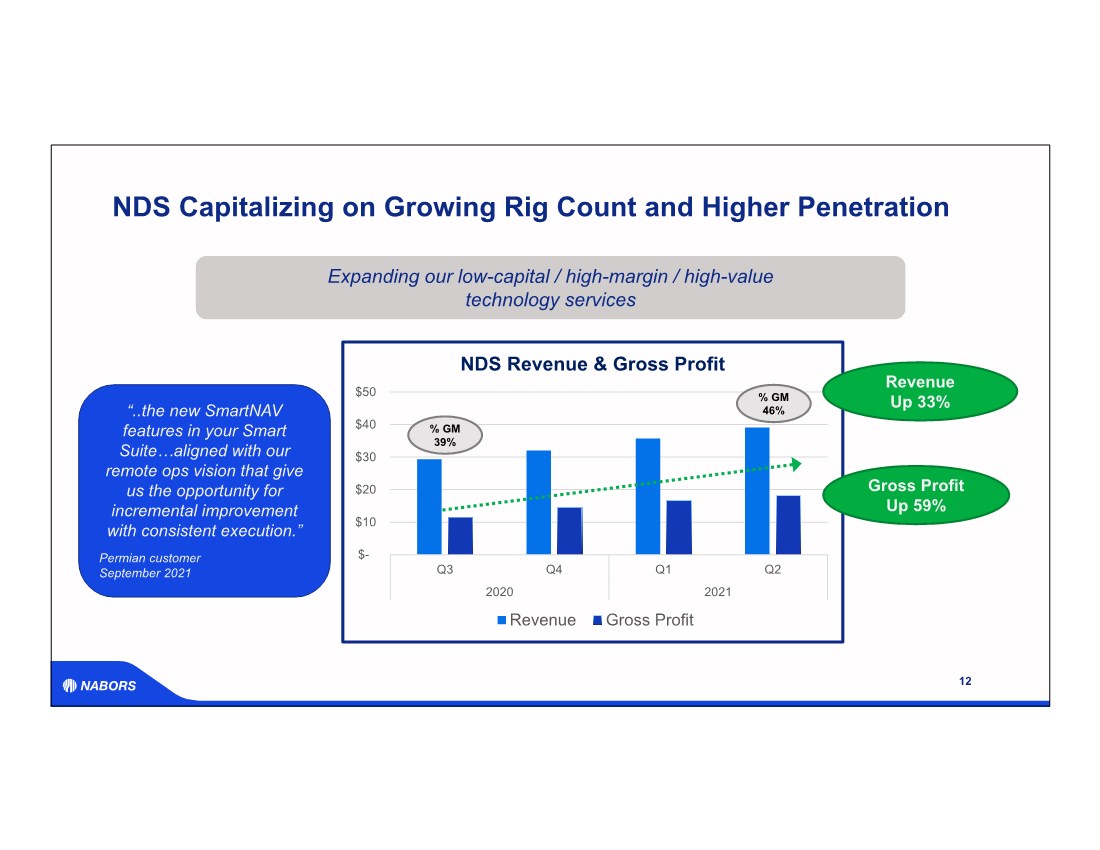
| $- $10 $20 $30 $40 $50 Q3 Q4 Q1 Q2 2020 2021 NDS Revenue & Gross Profit Revenue Gross Profit NDS Capitalizing on Growing Rig Count and Higher Penetration 12 Revenue Up 33% Gross Profit Up 59% % GM 39% % GM 46% Expanding our low-capital / high-margin / high-value technology services “..the new SmartNAV features in your Smart Suite…aligned with our remote ops vision that give us the opportunity for incremental improvement with consistent execution.” Permian customer September 2021 |
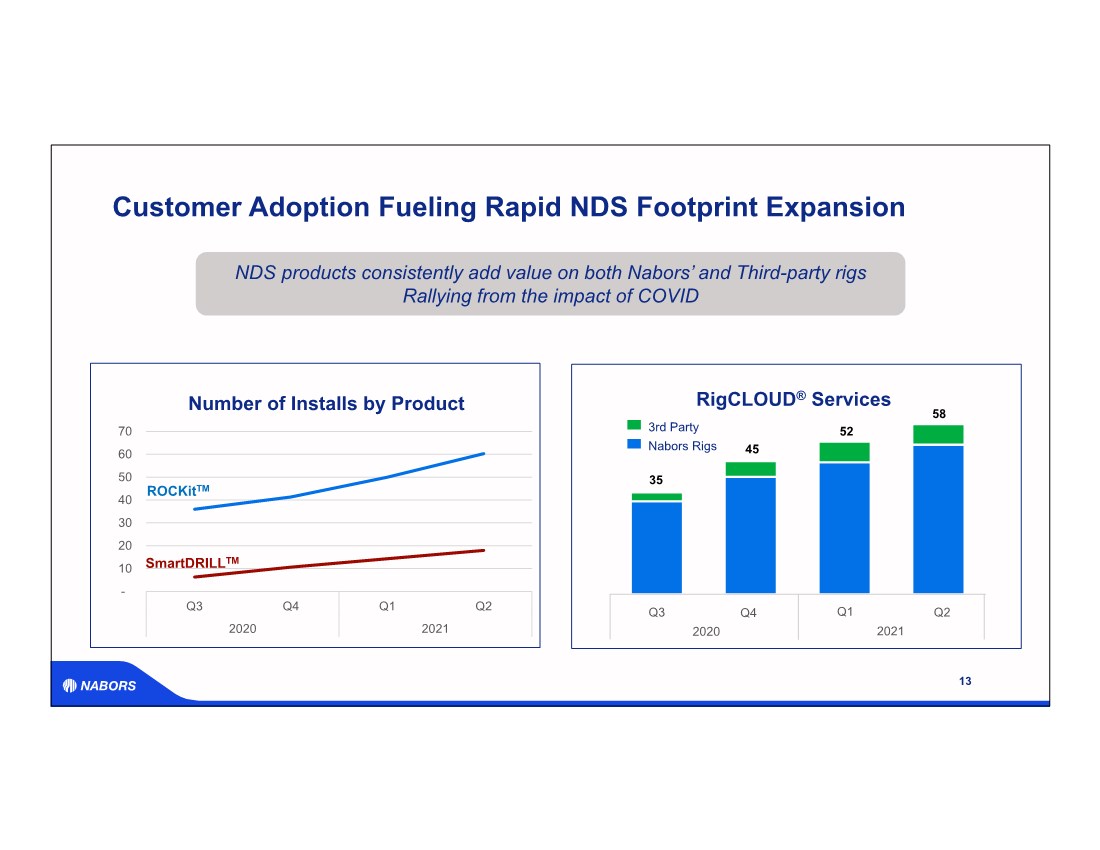
| Customer Adoption Fueling Rapid NDS Footprint Expansion 13 Q2 Q3 Q4 Q1 35 52 45 58 3rd Party Nabors Rigs RigCLOUD® Services - 10 20 30 40 50 60 70 Q3 Q4 Q1 Q2 2020 2021 Number of Installs by Product ROCKitTM SmartDRILLTM NDS products consistently add value on both Nabors’ and Third-party rigs Rallying from the impact of COVID 2020 2021 |
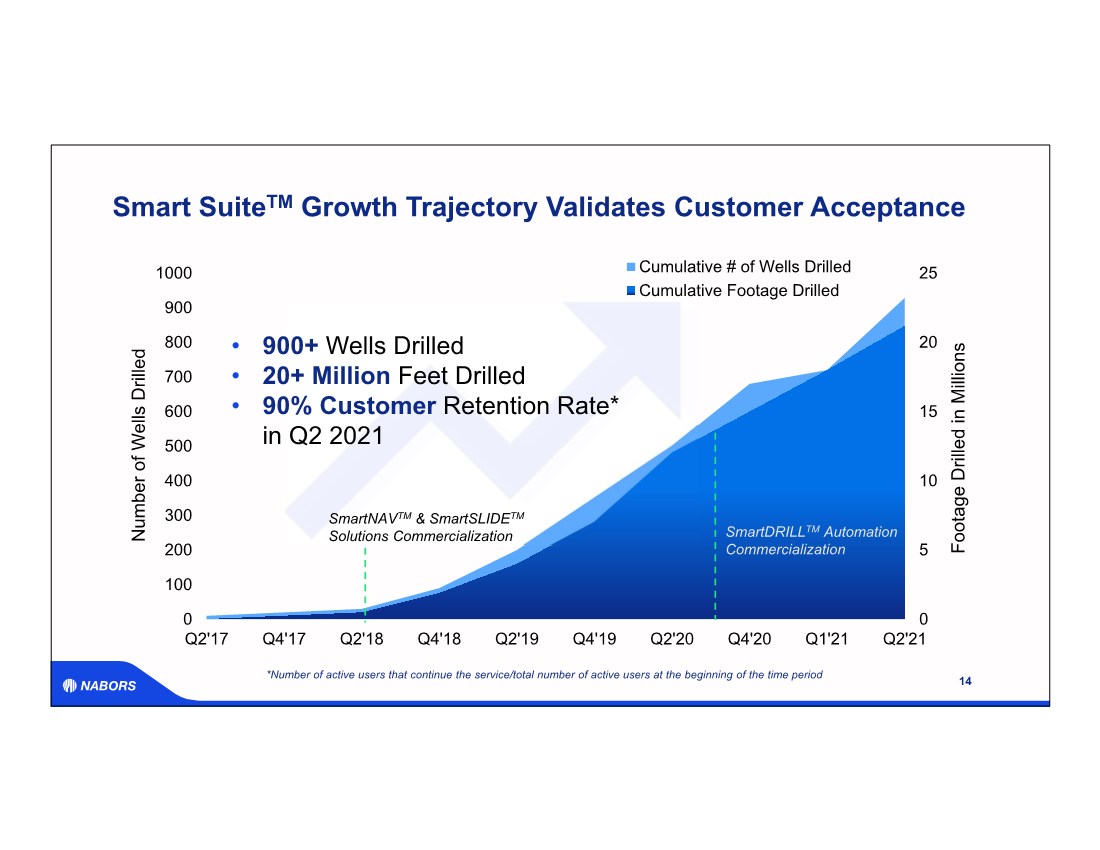
| 0 5 10 15 20 25 0 100 200 300 400 500 600 700 800 900 1000 Q2'17 Q4'17 Q2'18 Q4'18 Q2'19 Q4'19 Q2'20 Q4'20 Q1'21 Q2'21 Footage Drilled in Millions Number of Wells Drilled Cumulative # of Wells Drilled Cumulative Footage Drilled • 900+ Wells Drilled • 20+ Million Feet Drilled • 90% Customer Retention Rate* in Q2 2021 SmartDRILLTM Automation Commercialization SmartNAVTM & SmartSLIDETM Solutions Commercialization *Number of active users that continue the service/total number of active users at the beginning of the time period Smart SuiteTM Growth Trajectory Validates Customer Acceptance 14 |
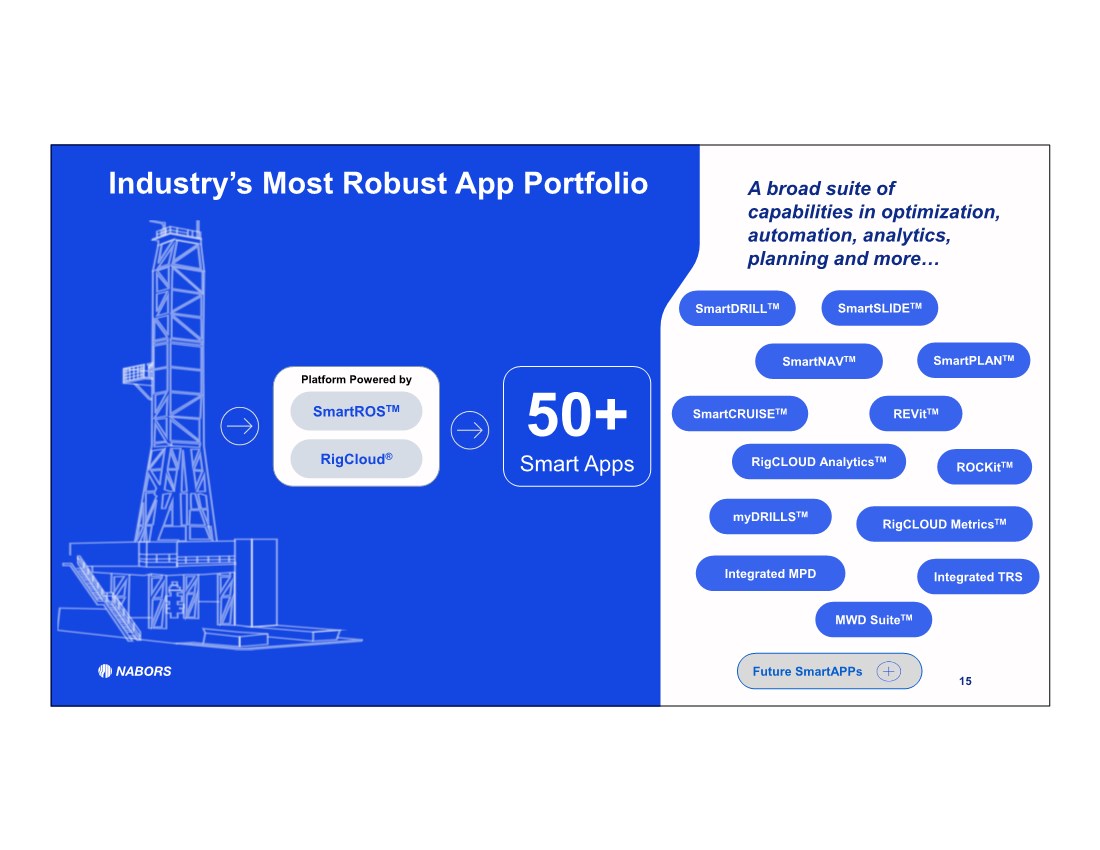
| Platform Powered by SmartROSTM 15 RigCloud® Industry’s Most Robust App Portfolio 50+ Smart Apps SmartNAVTM SmartSLIDETM SmartPLANTM SmartDRILLTM SmartCRUISETM RigCLOUD AnalyticsTM myDRILLSTM MWD SuiteTM REVitTM ROCKitTM RigCLOUD MetricsTM Integrated TRS Integrated MPD A broad suite of capabilities in optimization, automation, analytics, planning and more… Future SmartAPPs |
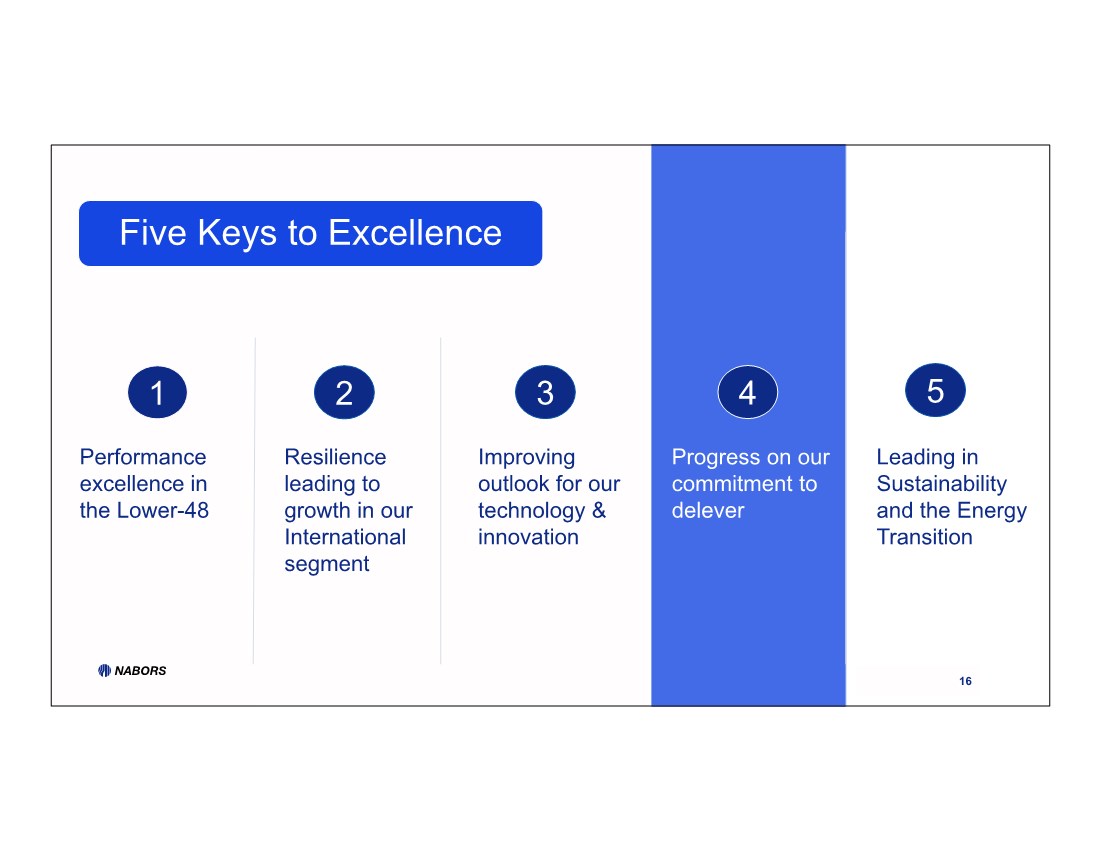
| Performance excellence in the Lower-48 Resilience leading to growth in our International segment Improving outlook for our technology & innovation Progress on our commitment to delever Leading in Sustainability and the Energy Transition 16 1 4 3 2 5 Five Keys to Excellence |
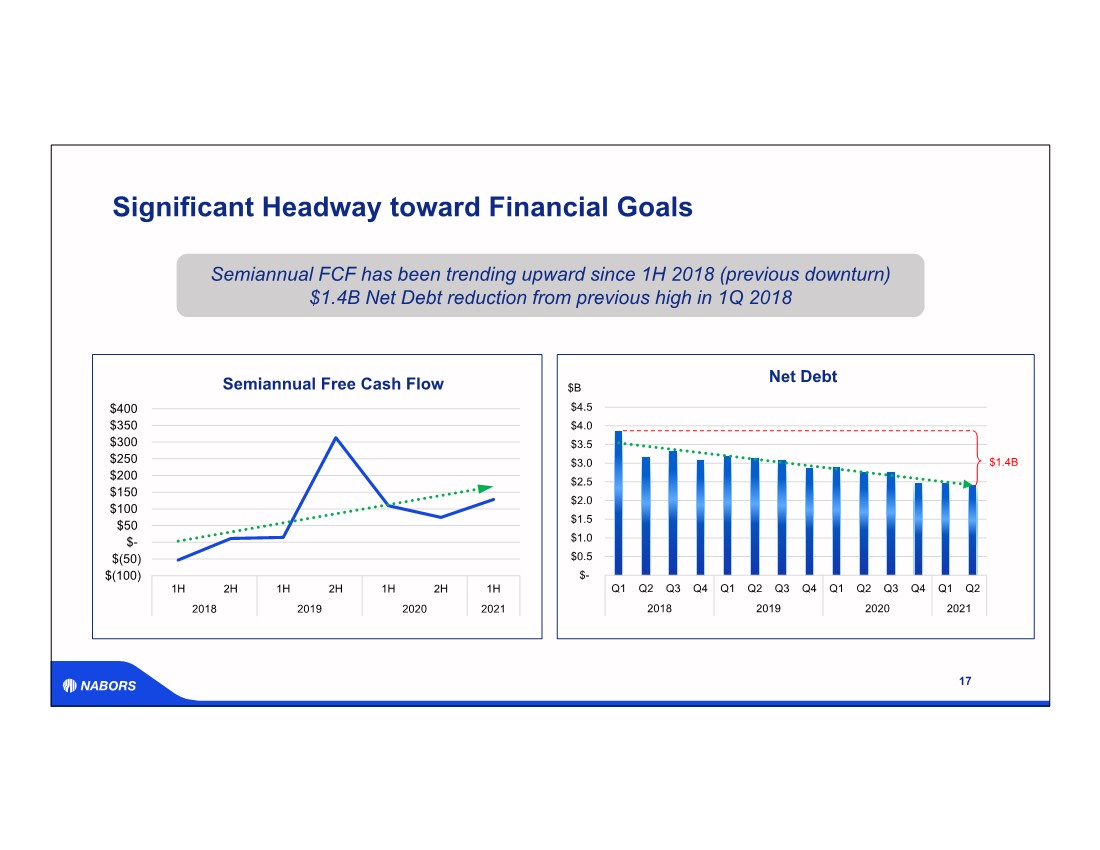
| $(100) $(50) $- $50 $100 $150 $200 $250 $300 $350 $400 1H 2H 1H 2H 1H 2H 1H 2018 2019 2020 2021 Significant Headway toward Financial Goals 17 Semiannual Free Cash Flow $- $0.5 $1.0 $1.5 $2.0 $2.5 $3.0 $3.5 $4.0 $4.5 Q1 Q2 Q3 Q4 Q1 Q2 Q3 Q4 Q1 Q2 Q3 Q4 Q1 Q2 2018 2019 2020 2021 $B Net Debt $1.4B Semiannual FCF has been trending upward since 1H 2018 (previous downturn) $1.4B Net Debt reduction from previous high in 1Q 2018 |
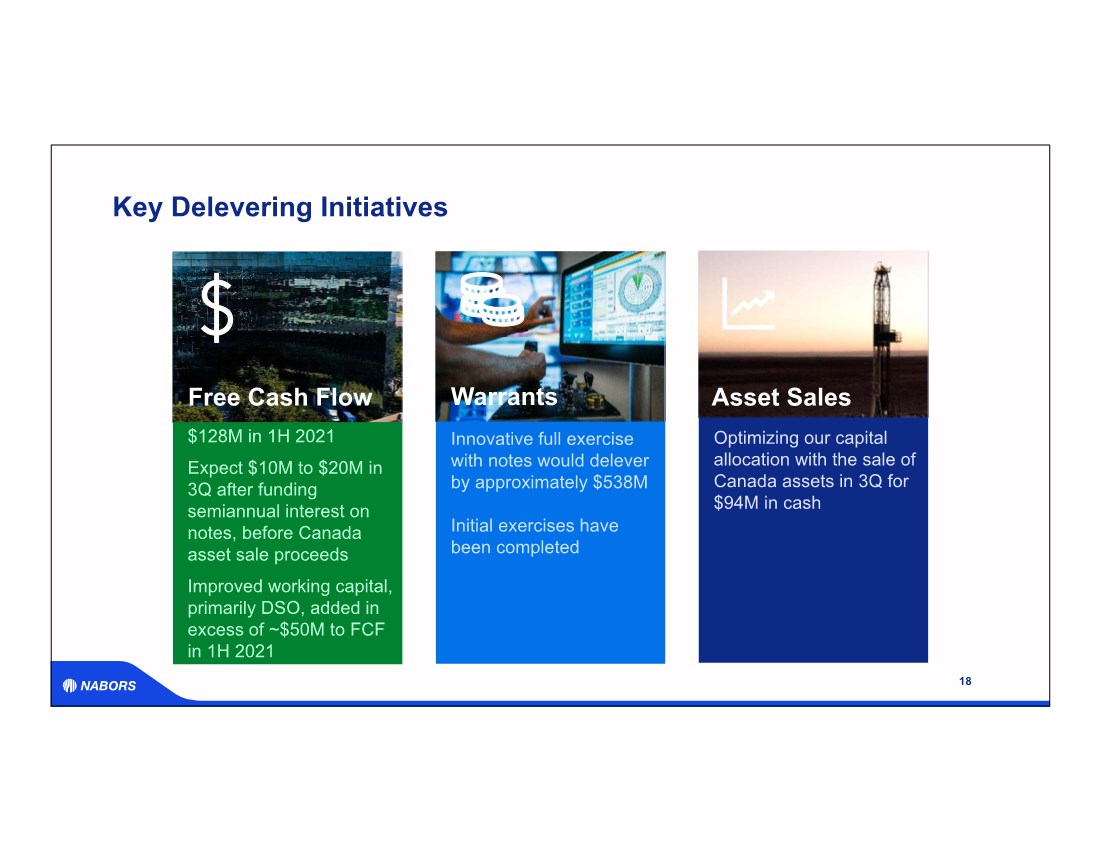
| Optimizing our capital allocation with the sale of Canada assets in 3Q for $94M in cash $128M in 1H 2021 Expect $10M to $20M in 3Q after funding semiannual interest on notes, before Canada asset sale proceeds Improved working capital, primarily DSO, added in excess of ~$50M to FCF in 1H 2021 Free Cash Flow Key Delevering Initiatives 18 Asset Sales Innovative full exercise with notes would delever by approximately $538M Initial exercises have been completed Warrants |
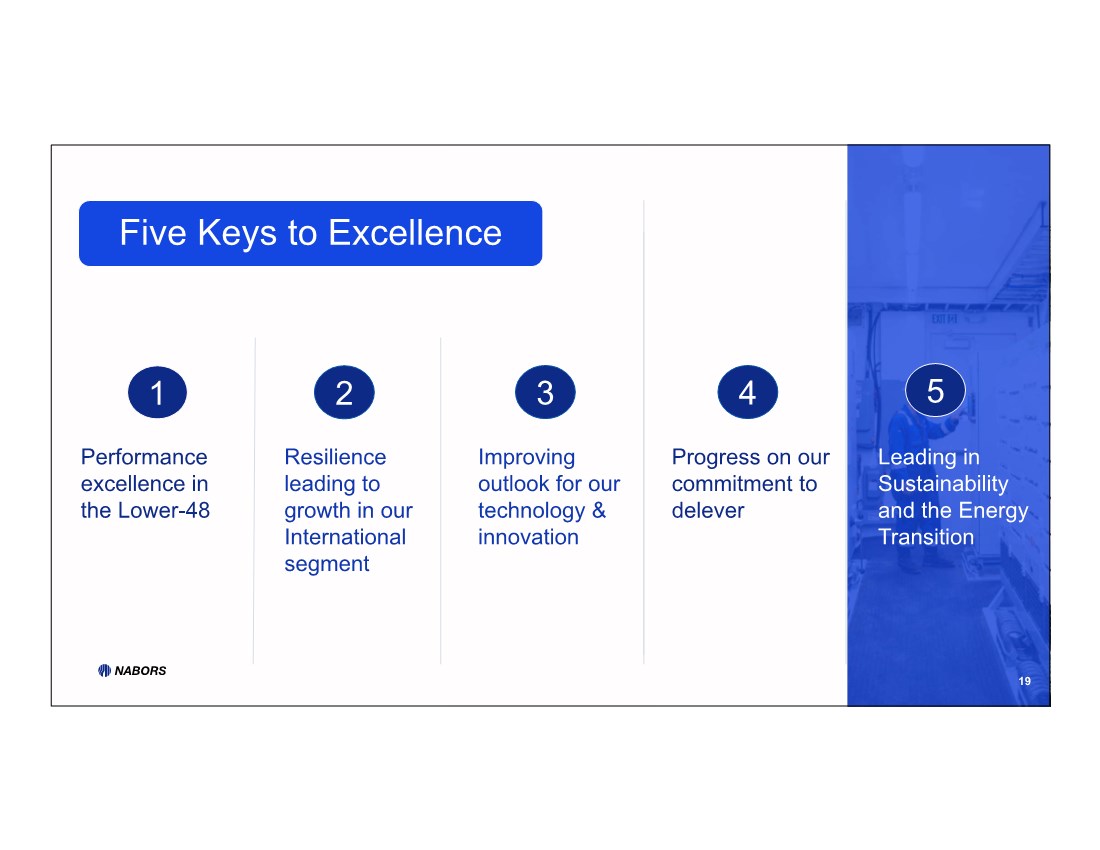
| Improving outlook for our technology & innovation Performance excellence in the Lower-48 Resilience leading to growth in our International segment Progress on our commitment to delever Leading in Sustainability and the Energy Transition 19 1 4 3 2 5 Five Keys to Excellence |
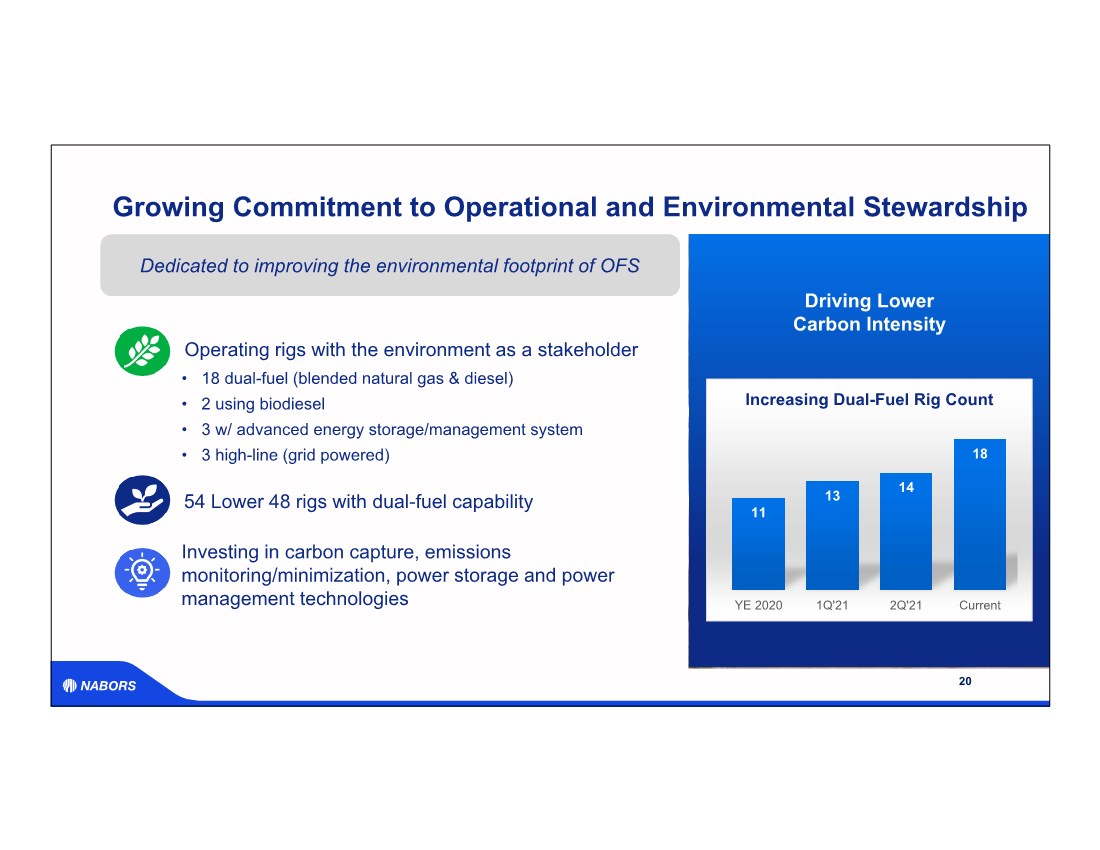
| Growing Commitment to Operational and Environmental Stewardship 20 11 13 14 18 YE 2020 1Q'21 2Q'21 Current Increasing Dual-Fuel Rig Count 54 Lower 48 rigs with dual-fuel capability • 18 dual-fuel (blended natural gas & diesel) • 2 using biodiesel • 3 w/ advanced energy storage/management system • 3 high-line (grid powered) Operating rigs with the environment as a stakeholder Dedicated to improving the environmental footprint of OFS Driving Lower Carbon Intensity Investing in carbon capture, emissions monitoring/minimization, power storage and power management technologies |
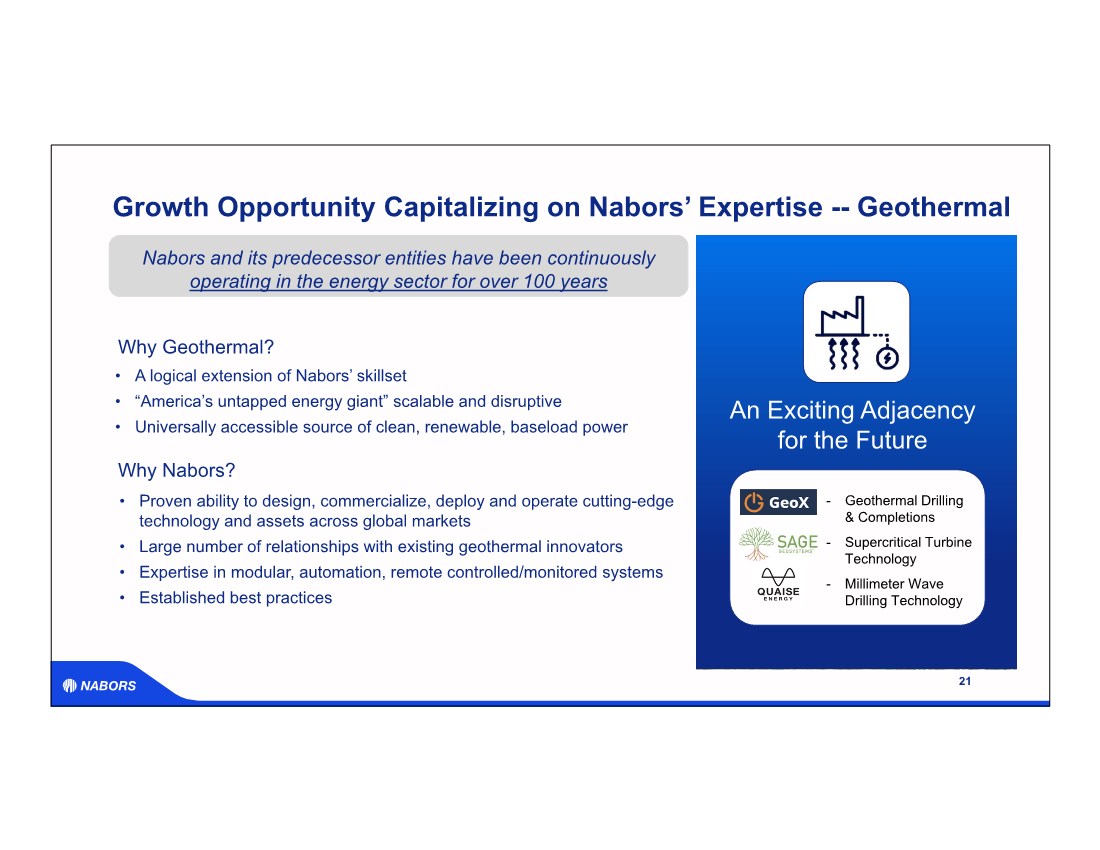
| Growth Opportunity Capitalizing on Nabors’ Expertise -- Geothermal 21 An Exciting Adjacency for the Future Nabors and its predecessor entities have been continuously operating in the energy sector for over 100 years • Proven ability to design, commercialize, deploy and operate cutting-edge technology and assets across global markets • Large number of relationships with existing geothermal innovators • Expertise in modular, automation, remote controlled/monitored systems • Established best practices - Geothermal Drilling & Completions - Supercritical Turbine Technology - Millimeter Wave Drilling Technology Why Nabors? • A logical extension of Nabors’ skillset • “America’s untapped energy giant” scalable and disruptive • Universally accessible source of clean, renewable, baseload power Why Geothermal? |
| 22 Investment Thesis Driving the evolution of energy production technology with the leading position in automation and digitalization, largest international footprint, and commitment to advancing the energy transition NABORS |
| Appendix 23 |
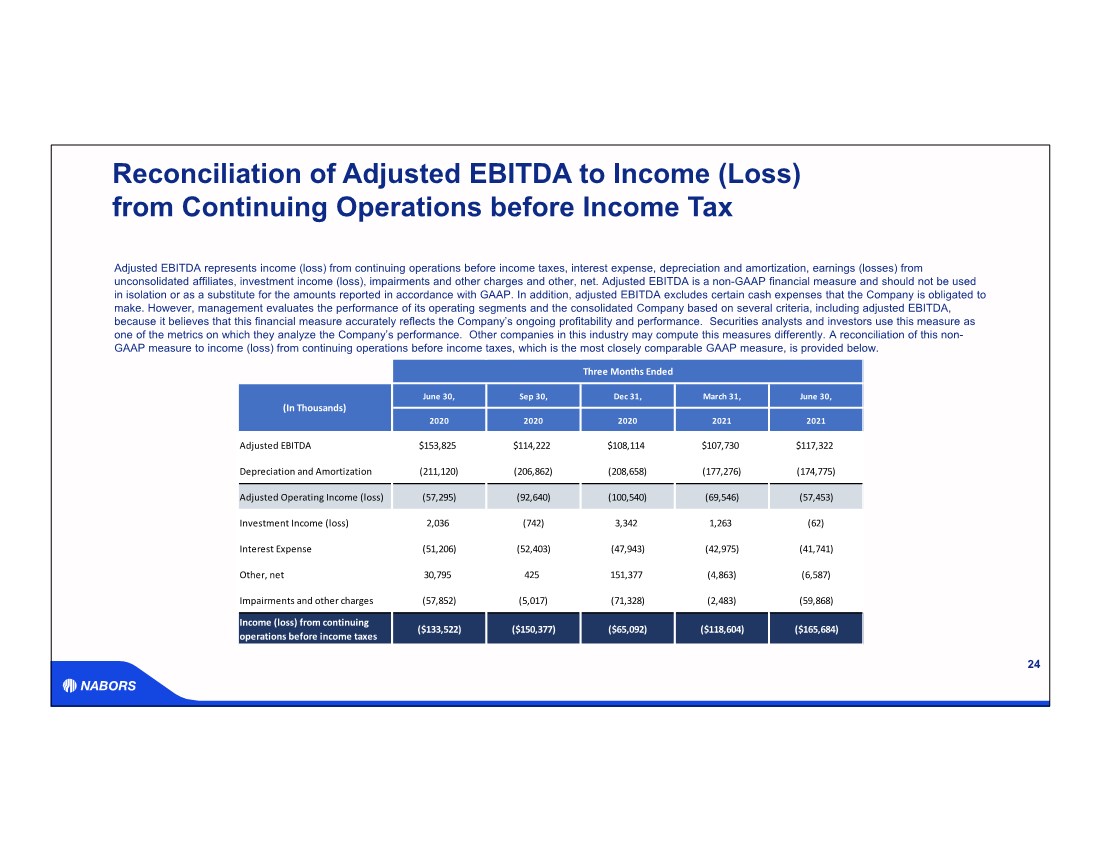
| Three Months Ended June 30, Sep 30, Dec 31, March 31, June 30, 2020 2020 2020 2021 2021 Adjusted EBITDA $153,825 $114,222 $108,114 $107,730 $117,322 Depreciation and Amortization (211,120) (206,862) (208,658) (177,276) (174,775) Adjusted Operating Income (loss) (57,295) (92,640) (100,540) (69,546) (57,453) Investment Income (loss) 2,036 (742) 3,342 1,263 (62) Interest Expense (51,206) (52,403) (47,943) (42,975) (41,741) Other, net 30,795 425 151,377 (4,863) (6,587) Impairments and other charges (57,852) (5,017) (71,328) (2,483) (59,868) Income (loss) from continuing operations before income taxes ($133,522) ($150,377) ($65,092) ($118,604) ($165,684) (In Thousands) Reconciliation of Adjusted EBITDA to Income (Loss) from Continuing Operations before Income Tax 24 Adjusted EBITDA represents income (loss) from continuing operations before income taxes, interest expense, depreciation and amortization, earnings (losses) from unconsolidated affiliates, investment income (loss), impairments and other charges and other, net. Adjusted EBITDA is a non-GAAP financial measure and should not be used in isolation or as a substitute for the amounts reported in accordance with GAAP. In addition, adjusted EBITDA excludes certain cash expenses that the Company is obligated to make. However, management evaluates the performance of its operating segments and the consolidated Company based on several criteria, including adjusted EBITDA, because it believes that this financial measure accurately reflects the Company’s ongoing profitability and performance. Securities analysts and investors use this measure as one of the metrics on which they analyze the Company’s performance. Other companies in this industry may compute this measures differently. A reconciliation of this non- GAAP measure to income (loss) from continuing operations before income taxes, which is the most closely comparable GAAP measure, is provided below. |
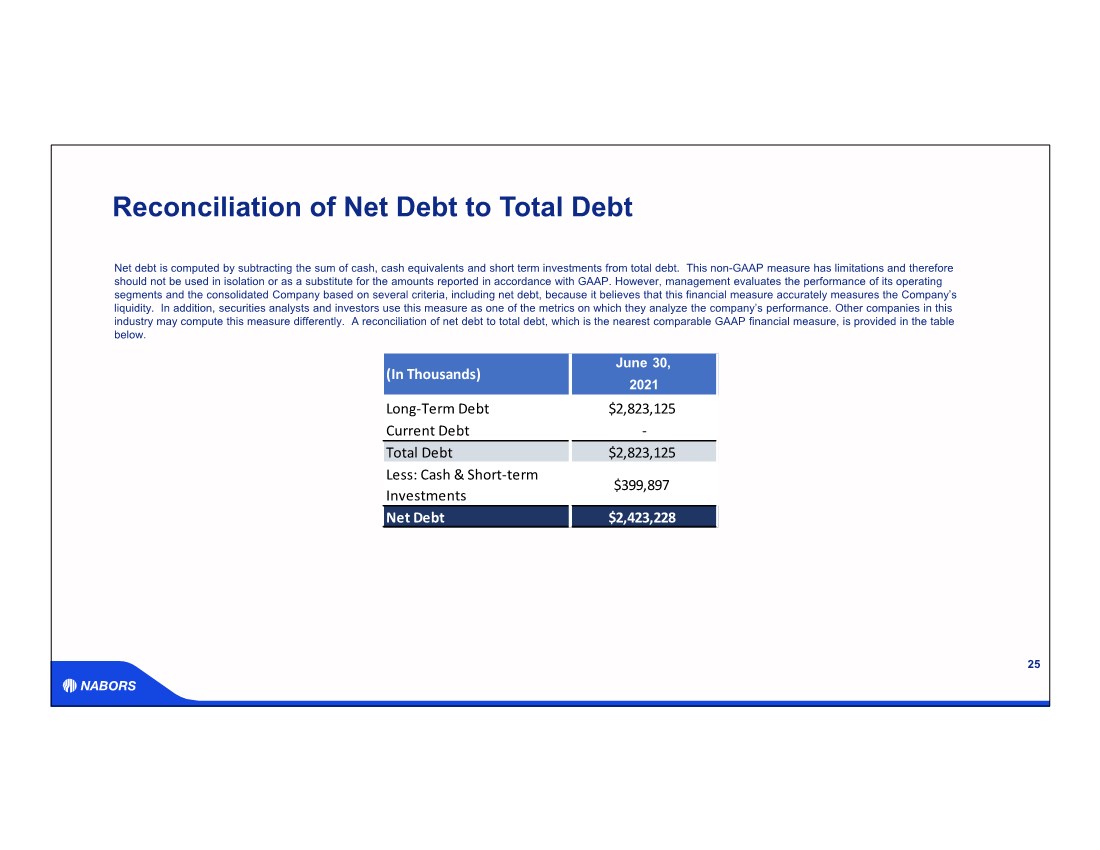
| June 30, 2021 Long‐Term Debt $2,823,125 Current Debt ‐ Total Debt $2,823,125 Less: Cash & Short‐term Investments $399,897 Net Debt $2,423,228 (In Thousands) Reconciliation of Net Debt to Total Debt 25 Net debt is computed by subtracting the sum of cash, cash equivalents and short term investments from total debt. This non-GAAP measure has limitations and therefore should not be used in isolation or as a substitute for the amounts reported in accordance with GAAP. However, management evaluates the performance of its operating segments and the consolidated Company based on several criteria, including net debt, because it believes that this financial measure accurately measures the Company’s liquidity. In addition, securities analysts and investors use this measure as one of the metrics on which they analyze the company’s performance. Other companies in this industry may compute this measure differently. A reconciliation of net debt to total debt, which is the nearest comparable GAAP financial measure, is provided in the table below. |
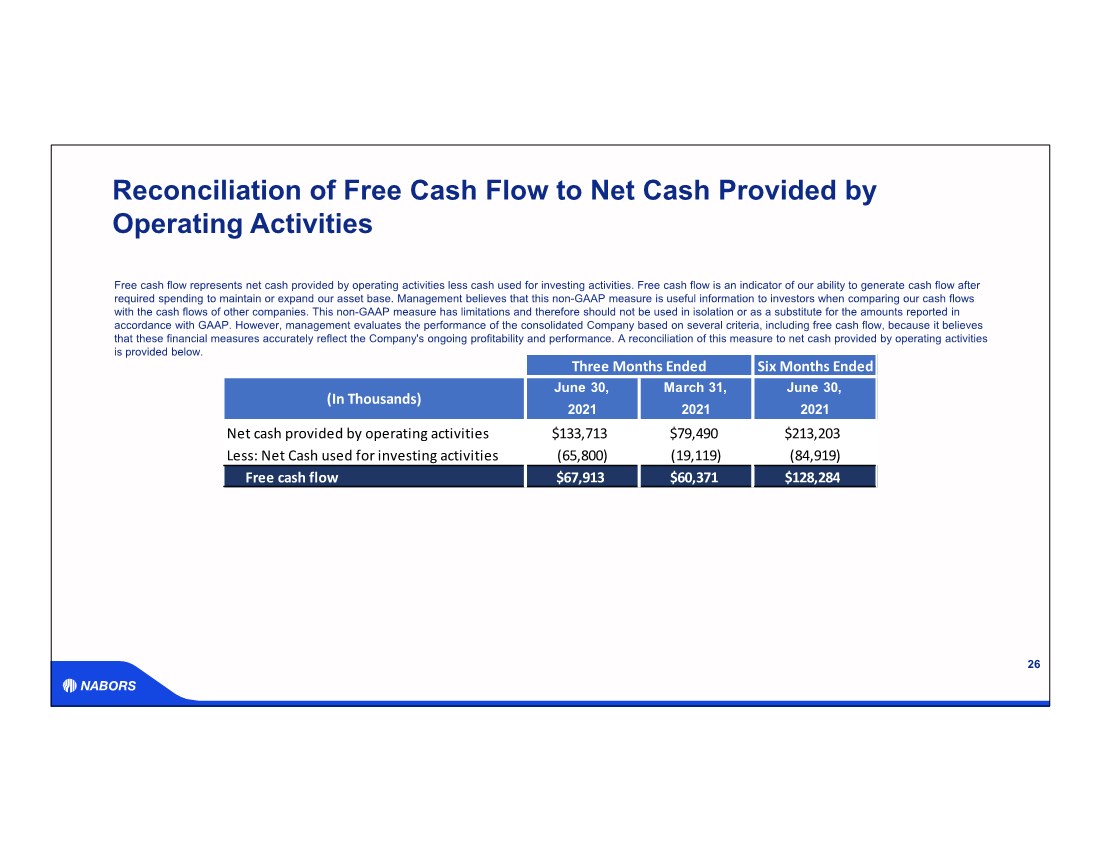
| Three Months Ended Six Months Ended June 30, March 31, June 30, 2021 2021 2021 Net cash provided by operating activities $133,713 $79,490 $213,203 Less: Net Cash used for investing activities (65,800) (19,119) (84,919) Free cash flow $67,91 3 $60,371 $128,284 (In Thousands) Reconciliation of Free Cash Flow to Net Cash Provided by Operating Activities 26 Free cash flow represents net cash provided by operating activities less cash used for investing activities. Free cash flow is an indicator of our ability to generate cash flow after required spending to maintain or expand our asset base. Management believes that this non-GAAP measure is useful information to investors when comparing our cash flows with the cash flows of other companies. This non-GAAP measure has limitations and therefore should not be used in isolation or as a substitute for the amounts reported in accordance with GAAP. However, management evaluates the performance of the consolidated Company based on several criteria, including free cash flow, because it believes that these financial measures accurately reflect the Company's ongoing profitability and performance. A reconciliation of this measure to net cash provided by operating activities is provided below. |
| NABORS.COM NABORS CORPORATE SERVICES 515 W. Greens Road Suite 1200 Houston, TX 77067-4525 Contact Us: William C. Conroy VP - Corporate Development and Investor Relations William.Conroy@nabors.com Kara K. Peak Director - Corporate Development and Investor Relations Kara.Peak@nabors.com NABORS.COM |