|
|
|
As filed with the Securities and Exchange Commission on 16 March 2012 |
|
|
|
UNITED STATES |
|
SECURITIES AND EXCHANGE COMMISSION |
|
Washington, D.C. 20549 |
|
FORM 20-F |
|
|
|
o REGISTRATION STATEMENT PURSUANT TO SECTION 12(b) OR 12(g) OF THE SECURITIES EXCHANGE ACT OF 1934 |
|
|
|
OR |
|
|
|
x ANNUAL REPORT PURSUANT TO SECTION 13 OR 15(d) OF THE SECURITIES EXCHANGE ACT OF 1934 |
|
For the fiscal year ended 31 December 2011 |
|
|
|
OR |
|
|
|
o TRANSITION REPORT PURSUANT TO SECTION 13 OR 15(d) OF THE SECURITIES EXCHANGE ACT OF 1934 |
|
|
|
OR |
|
|
|
o SHELL COMPANY REPORT PURSUANT TO SECTION 13 OR 15(d) OF THE SECURITIES EXCHANGE ACT OF 1934 |
|
|
|
Commission file number 001-15246 |
|
LLOYDS BANKING GROUP plc |
|
(previously Lloyds TSB Group plc) |
|
(Exact name of Registrant as Specified in Its Charter) |
|
|
|
Scotland |
|
(Jurisdiction of Incorporation or Organization) |
|
|
|
25 Gresham Street |
|
London EC2V 7HN |
|
United Kingdom |
|
(Address of Principal Executive Offices) |
|
|
|
Harry Baines, Group Secretary |
|
Tel +44 (0) 207 356 1400, Fax +44 (0) 207 356 3506 |
|
25 Gresham Street |
|
London EC2V 7HN |
|
United Kingdom |
|
(Name, telephone, e-mail and/or facsimile number and address of Company contact person) |
|
|
|
Securities registered or to be registered pursuant to Section 12(b) of the Act: |
|
|
|
|
Title of each class |
Name of each exchange on which registered |
|
Ordinary shares of nominal value 10 pence each, represented by American Depositary Shares |
The New York Stock Exchange |
|
7.75% Public Income Notes due 2050 |
The New York Stock Exchange |
|
4.875% Senior Notes due 2016 |
The New York Stock Exchange |
|
6.375% Senior Notes due 2021 |
The New York Stock Exchange |
|
Floating Rate Notes due 2014 |
The New York Stock Exchange |
Securities registered or to be registered pursuant to Section 12(g) of the Act:
None
Securities for which there is a reporting obligation pursuant to Section 15(d) of the Act:
None
The number of outstanding shares of each of Lloyds Banking Group plc’s classes of capital or common stock as of 31 December 2011 was:
|
|
|
|
|
Ordinary shares, nominal value 10 pence each |
|
68,726,627,112 |
|
Limited voting shares, nominal value 10 pence each |
|
80,921,051 |
|
Preference shares, nominal value 25 pence each |
|
412,215,065 |
|
Preference shares, nominal value 25 cents each |
|
1,917,280 |
|
Preference shares, nominal value 25 euro cents each |
|
173,350 |
Indicate by check mark if the registrant is a well-known seasoned issuer, as defined in Rule 405 of the Securities Act.
Yes x No o
If this report is an annual or transition report, indicate by check mark if the registrant is not required to file reports pursuant to Section 13 or 15(d) of the Securities Exchange Act of 1934
Yes o No x
Note – Checking the box above will not relieve any registrant required to file reports pursuant to Section 13 or 15(d) of the Securities Exchange Act of 1934 from their obligations under those Sections.
Indicate by check mark whether the registrant: (1) has filed all reports required to be filed by Section 13 or 15(d) of the Securities Exchange Act of 1934 during the preceding 12 months (or for such shorter period that the registrant was required to file such reports) and (2) has been subject to such filing requirements for the past 90 days.
Yes x No o
Indicate by check mark whether the registrant has submitted electronically and posted on its corporate Web site, if any, every Interactive Data File required to be submitted and posted pursuant to Rule 405 of Regulation S-T (§232.405 of this chapter) during the preceding 12 months (or for such shorter period that the registrant was required to submit and post such files).
Yes o No o
Indicate by check mark whether the registrant
is a large accelerated filer, an accelerated filer, or a non-accelerated filer.
See definition of “accelerated filer and large accelerated filer” in Rule 12b-2
of the Exchange Act. (Check one):
Large accelerated filer x Accelerated filer o Non-Accelerated filer o
Indicate by check mark which basis of
accounting the registrant has used to prepare the financial statements
including in this filing:
U.S. GAAP o International Financial Reporting Standards
as issued by the International Accounting Standards Board x Other o
If ‘Other’ has been checked in response to the previous question, indicate by check mark which financial statement item the registrant has elected to follow:
Item 17 o Item 18 o
If this is an annual report, indicate by check mark whether the registrant is a shell company (as defined in Rule 12b-2 of the Exchange Act).
Yes o No x
TABLE OF CONTENTS
|
|
|
|
1 |
|
|
2 |
|
|
3 |
|
|
4 |
|
|
4 |
|
|
13 |
|
|
137 |
|
|
140 |
|
|
156 |
|
|
167 |
|
|
170 |
|
|
172 |
|
|
175 |
|
|
Memorandum and articles of association of Lloyds Banking Group plc |
176 |
|
176 |
|
|
177 |
|
|
180 |
|
|
180 |
|
|
181 |
|
|
192 |
|
|
193 |
|
|
F-1 |
|
|
194 |
|
|
196 |
|
|
198 |
|
|
199 |
In this annual report, references to the ‘Company’ are to Lloyds Banking Group plc; references to ‘Lloyds Banking Group’, ‘Lloyds’ or the ‘Group’ are to Lloyds Banking Group plc and its subsidiary and associated undertakings; references to ‘Lloyds TSB Bank’ are to Lloyds TSB Bank plc; and references to the ‘consolidated financial statements’ or ‘financial statements’ are to Lloyds Banking Group’s consolidated financial statements included in this annual report. References to the ‘Financial Services Authority’ or ‘FSA’ are to the United Kingdom (the UK) Financial Services Authority.
On 16 January 2009 the Company acquired 100 per cent of the ordinary share capital of HBOS plc and changed the Company’s name to Lloyds Banking Group plc. Accordingly, where this annual report provides information for dates prior to 16 January 2009, unless otherwise indicated, such information relates to the Lloyds Banking Group prior to the acquisition of HBOS plc. References to ‘HBOS’ or the ‘HBOS Group’ are to HBOS plc and its subsidiary and associated undertakings.
The consolidated financial statements have been prepared in accordance with International Financial Reporting Standards (IFRS) as issued by the International Accounting Standards Board (IASB).
In this annual report, amounts described as ‘statutory’ refer to amounts included within the Group’s consolidated financial statements.
Lloyds Banking Group publishes its consolidated financial statements expressed in British pounds (‘pounds sterling’, ‘sterling’ or ‘£’), the lawful currency of the UK. In this annual report, references to ‘pence’ and ‘p’ are to one-hundredth of one pound sterling; references to ‘US dollars’, ‘US$’ or ‘$’ are to the lawful currency of the United States (the US); references to ‘cent’ or ‘c’ are to one-hundredth of one US dollar; references to ‘euro’ or ‘e’ are to the lawful currency of the member states of the European Union that have adopted a single currency in accordance with the Treaty establishing the European Communities, as amended by the Treaty of European Union; references to ‘euro cent’ are to one-hundredth of one euro; and references to ‘Japanese yen’, ‘Japanese ¥’ or ‘¥’ are to the lawful currency of Japan. Solely for the convenience of the reader, this annual report contains translations of certain pounds sterling amounts into US dollars at specified rates. These translations should not be construed as representations by Lloyds Banking Group that the pounds sterling amounts actually represent such US dollar amounts or could be converted into US dollars at the rate indicated or at any other rate. Unless otherwise stated, the translations of pounds sterling into US dollars have been made at the noon buying rate in New York City for cable transfers in pounds sterling as certified for customs purposes by the Federal Reserve Bank of New York (the Noon Buying Rate) in effect on 31 December 2011, which was $1.5537 = £1.00. The Noon Buying Rate on 31 December 2011 differs from certain of the actual rates used in the preparation of the consolidated financial statements, which are expressed in pounds sterling, and therefore US dollar amounts appearing in this annual report may differ significantly from actual US dollar amounts which were translated into pounds sterling in the preparation of the consolidated financial statements in accordance with IFRS.
1
Lloyds Banking Group is a leading UK based financial services group
providing a wide range of banking and financial services, primarily in the UK,
to personal and corporate customers. At 31 December 2011, total Lloyds Banking
Group assets were £970,546 million and Lloyds Banking Group had some
98,538 employees (on a full-time equivalent basis). Lloyds Banking Group plc’s
market capitalisation at that date was some £17,825 million. The Group reported
a loss before tax for the 12 months to 31 December 2011 of £342 million, and
the capital ratios as at that date were 15.6 per cent for total capital, 12.5
per cent for tier 1 capital and 10.8 per cent for core tier 1 capital.
Set out
below is the Group’s summarised income statement for the last three years:
|
|
|
|
|
|
|
|
|
|
|
|
|
|
|
|
2011 |
|
|
2010 |
|
|
2009 |
|
|
Net interest income |
|
|
12,698 |
|
|
12,546 |
|
|
9,026 |
|
|
Other income |
|
|
14,114 |
|
|
31,498 |
|
|
36,745 |
|
|
Total income |
|
|
26,812 |
|
|
44,044 |
|
|
45,771 |
|
|
Insurance claims |
|
|
(6,041 |
) |
|
(19,088 |
) |
|
(22,493 |
) |
|
Total income, net of insurance claims |
|
|
20,771 |
|
|
24,956 |
|
|
23,278 |
|
|
Operating expenses |
|
|
(13,050 |
) |
|
(16,470 |
) |
|
(15,984 |
) |
|
Trading surplus |
|
|
7,721 |
|
|
8,486 |
|
|
7,294 |
|
|
Impairment |
|
|
(8,094 |
) |
|
(10,952 |
) |
|
(16,673 |
) |
|
Share of results of joint ventures and associates |
|
|
31 |
|
|
(88 |
) |
|
(752 |
) |
|
Gain on acquisition |
|
|
— |
|
|
— |
|
|
11,173 |
|
|
Loss on disposal of businesses |
|
|
— |
|
|
(365 |
) |
|
— |
|
|
(Loss) profit before tax |
|
|
(342 |
) |
|
(2,919 |
) |
|
1,042 |
|
Lloyds Banking Group’s main business activities are retail, commercial and corporate banking, general insurance, and life, pensions and investment provision. Services are offered through a number of well recognised brands including Lloyds TSB, Halifax, Bank of Scotland and Scottish Widows, and a range of distribution channels including the largest banking branch network in the UK.
The Group has five primary operating divisions, which constitute the Group’s reporting segments: Retail, Wholesale, Commercial, Wealth and International, and Insurance. Retail provides banking, mortgages and other financial services to personal customers in the UK. Wholesale provides banking and related services for major UK and multinational corporates and financial institutions, with a turnover in excess of £15 million. Commercial services the needs of small and medium-size enterprises and community organisations with a turnover of up to £15 million. Wealth and International provides private banking and asset management in the UK and overseas and operates the Group’s international business. Insurance offers life assurance, pensions and investment products in the UK and Europe and provides general insurance to personal customers in the UK.
The acquisition of HBOS plc on 16 January 2009 had a significant effect on the comparability of the Group’s financial position and results with prior periods. Profit before tax is analysed further on pages 18 to 29 on a statutory basis and, in order to provide a more comparable representation of business performance of the Group’s segments, on pages 32 to 51 on a combined businesses basis. The key principles adopted in the preparation of the combined businesses basis of reporting are described on page 32. The Group Executive Committee, which is the chief operating decision maker for the Group, reviews the Group’s internal reporting based around these segments (which reflect the Group’s organisational and management structures) in order to assess performance and allocate resources; this reporting is on a combined businesses basis, which the Group Executive Committee feel best represents the underlying performance of the Group. These combined businesses segmental results for 2011, 2010 and 2009 are therefore presented in compliance with IFRS 8 but the aggregated total of the combined businesses segmental profits and losses before tax constitutes a non-GAAP measure and a reconciliation of this aggregated total to the Group’s statutory profit before tax is therefore provided on page 33. The following table shows the results of Lloyds Banking Group’s Retail, Wholesale, Commercial, Wealth and International, and Insurance segments and Group Operations and Central items in the last three fiscal years, and their aggregation.
|
|
|
|
|
|
|
|
|
|
|
|
|
|
|
|
|
|
|
2011 |
|
|
|
2010 |
|
|
|
2009 |
|
|
|
Retail |
|
|
3,636 |
|
|
|
3,986 |
|
|
|
955 |
|
|
|
Wholesale |
|
|
828 |
|
|
|
2,514 |
|
|
|
(4,682 |
) |
|
|
Commercial |
|
|
499 |
|
|
|
291 |
|
|
|
(200 |
) |
|
|
Wealth and International |
|
|
(3,936 |
) |
|
|
(4,950 |
) |
|
|
(2,433 |
) |
|
|
Insurance |
|
|
1,422 |
|
|
|
1,326 |
|
|
|
1,203 |
|
|
|
Group Operations and Central items: |
|
|
|
|
|
|
|
|
|
|
|
|
|
|
Group Operations |
|
|
(56 |
) |
|
|
(52 |
) |
|
|
(143 |
) |
|
|
Central items |
|
|
292 |
|
|
|
(903 |
) |
|
|
(1,000 |
) |
|
|
|
|
|
236 |
|
|
|
(955 |
) |
|
|
(1,143 |
) |
|
|
Profit (loss) before tax – Combined businesses basis |
|
|
2,685 |
|
|
|
2,212 |
|
|
|
(6,300 |
) |
|
Lloyds Banking Group plc was incorporated as a public limited company and registered in Scotland under the UK Companies Act 1985 on 21 October 1985 with the registered number 95000. Lloyds Banking Group plc’s registered office is The Mound, Edinburgh EH1 1YZ, Scotland, and its principal executive offices in the UK are located at 25 Gresham Street, London EC2V 7HN, United Kingdom, telephone number + 44 (0) 20 7626 1500.
2
SELECTED CONSOLIDATED FINANCIAL DATA
The financial information set out in the tables below has been derived from the annual reports and accounts of Lloyds Banking Group plc for each of the past five years adjusted for subsequent changes in accounting policy and presentation. The financial statements for each of the years shown have been audited by PricewaterhouseCoopers LLP, an independent registered public accounting firm.
|
|
|
|
|
|
|
|
|
|
|
|
|
|
|
|
|
|
|
|
|
2011 |
|
2010 |
|
2009 |
|
2008 |
1 |
2007 |
1 |
|||||
|
Income statement data for the year ended 31 December (£m) |
|
|
|
|
|
|
|
|
|
|
|
|
|
|
|
|
|
Total income, net of insurance claims |
|
|
20,771 |
|
|
24,956 |
|
|
23,278 |
|
|
9,868 |
|
|
10,696 |
|
|
Operating expenses |
|
|
(13,050 |
) |
|
(16,470 |
) |
|
(15,984 |
) |
|
(6,100 |
) |
|
(5,568 |
) |
|
Trading surplus |
|
|
7,721 |
|
|
8,486 |
|
|
7,294 |
|
|
3,768 |
|
|
5,128 |
|
|
Impairment losses |
|
|
(8,094 |
) |
|
(10,952 |
) |
|
(16,673 |
) |
|
(3,012 |
) |
|
(1,796 |
) |
|
Gain on acquisition |
|
|
— |
|
|
— |
|
|
11,173 |
|
|
— |
|
|
— |
|
|
(Loss) profit before tax |
|
|
(342 |
) |
|
(2,919 |
) |
|
1,042 |
|
|
760 |
|
|
3,999 |
|
|
(Loss) profit for the year |
|
|
(378 |
) |
|
(2,594 |
) |
|
2,953 |
|
|
798 |
|
|
3,320 |
|
|
(Loss) profit for the year attributable to equity shareholders |
|
|
(451 |
) |
|
(2,656 |
) |
|
2,827 |
|
|
772 |
|
|
3,288 |
|
|
Total dividend for the year2 |
|
|
— |
|
|
— |
|
|
— |
|
|
648 |
|
|
2,026 |
|
|
Balance sheet data at 31 December (£m) |
|
|
|
|
|
|
|
|
|
|
|
|
|
|
|
|
|
Share capital |
|
|
6,881 |
|
|
6,815 |
|
|
10,472 |
|
|
1,513 |
|
|
1,432 |
|
|
Shareholders’ equity |
|
|
45,920 |
|
|
43,725 |
|
|
43,278 |
|
|
9,393 |
|
|
12,141 |
|
|
Customer deposits |
|
|
413,906 |
|
|
393,633 |
|
|
406,741 |
|
|
170,938 |
|
|
156,555 |
|
|
Subordinated liabilities |
|
|
35,089 |
|
|
36,232 |
|
|
34,727 |
|
|
17,256 |
|
|
11,958 |
|
|
Loans and advances to customers |
|
|
565,638 |
|
|
592,597 |
|
|
626,969 |
|
|
240,344 |
|
|
209,814 |
|
|
Total assets |
|
|
970,546 |
|
|
992,438 |
|
|
1,027,255 |
|
|
436,033 |
|
|
353,346 |
|
|
Share information |
|
|
|
|
|
|
|
|
|
|
|
|
|
|
|
|
|
Basic earnings per ordinary share3 |
|
|
(0.7)p |
|
|
(4.0)p |
|
|
7.5p |
|
|
6.7p |
|
|
28.9p |
|
|
Diluted earnings per ordinary share3 |
|
|
(0.7)p |
|
|
(4.0)p |
|
|
7.5p |
|
|
6.6p |
|
|
28.7p |
|
|
Net asset value per ordinary share |
|
|
67p |
|
|
64p |
|
|
68p |
|
|
155p |
|
|
212p |
|
|
Total dividend per ordinary share2 |
|
|
— |
|
|
— |
|
|
— |
|
|
11.4p |
|
|
35.9p |
|
|
Equivalent cents per share2,4 |
|
|
— |
|
|
— |
|
|
— |
|
|
20.3c |
|
|
71.0c |
|
|
Market price per ordinary share (year end) |
|
|
25.9p |
|
|
65.7p |
|
|
50.7p |
|
|
126.0p |
|
|
472.0p |
|
|
Number of shareholders (thousands) |
|
|
2,770 |
|
|
2,798 |
|
|
2,834 |
|
|
824 |
|
|
814 |
|
|
Number of ordinary shares in issue (millions)5 |
|
|
68,727 |
|
|
68,074 |
|
|
63,775 |
|
|
5,973 |
|
|
5,648 |
|
|
Financial ratios (%)6 |
|
|
|
|
|
|
|
|
|
|
|
|
|
|
|
|
|
Dividend payout ratio |
|
|
— |
|
|
— |
|
|
— |
|
|
83.9 |
|
|
61.6 |
|
|
Post-tax return on average shareholders’ equity |
|
|
(1.0 |
) |
|
(5.8 |
) |
|
8.8 |
|
|
7.0 |
|
|
28.1 |
|
|
Post-tax return on average assets |
|
|
(0.04 |
) |
|
(0.26 |
) |
|
0.28 |
|
|
0.21 |
|
|
0.94 |
|
|
Average shareholders’ equity to average assets |
|
|
4.5 |
|
|
4.6 |
|
|
3.1 |
|
|
2.9 |
|
|
3.3 |
|
|
Cost:income ratio7 |
|
|
62.8 |
|
|
66.0 |
|
|
68.7 |
|
|
61.8 |
|
|
52.1 |
|
|
Capital ratios (%)8,9 |
|
|
|
|
|
|
|
|
|
|
|
|
|
|
|
|
|
Total capital |
|
|
15.6 |
|
|
14.5 |
|
|
12.4 |
|
|
11.1 |
|
|
11.0 |
|
|
Tier 1 capital |
|
|
12.5 |
|
|
11.0 |
|
|
9.6 |
|
|
7.9 |
|
|
8.1 |
|
|
Core tier 1 capital |
|
|
10.8 |
|
|
9.6 |
|
|
8.1 |
|
|
5.5 |
|
|
7.4 |
|
|
|
|
|
1 |
Restated in 2009 for IFRS 2 (Revised). |
|
|
|
|
2 |
Annual dividends comprise both interim and final dividend payments. The total dividend for the year represents the interim dividend paid during the year and the final dividend, which is paid and accounted for in the following year. |
|
|
|
|
3 |
Earnings per share calculations for 2008 and earlier years have also been restated for the impact of the bonus element of the share issues in 2009. |
|
|
|
|
4 |
Translated into US dollars at the Noon Buying Rate on the date each payment was made. |
|
|
|
|
5 |
This figure excludes the limited voting ordinary shares owned by the Lloyds TSB Foundations. |
|
|
|
|
6 |
Averages are calculated on a monthly basis from the consolidated financial data of Lloyds Banking Group. |
|
|
|
|
7 |
The cost:income ratio is calculated as total operating expenses as a percentage of total income (net of insurance claims). |
|
|
|
|
8 |
Capital ratios are in accordance with Basel II requirements other than the ratios for 2007 which reflect Basel I. |
|
|
|
|
9 |
Capital ratios for 2008 and 2009 were restated in 2010 to reflect a prior year adjustment to available-for-sale revaluation reserves. |
3
In this annual report, unless otherwise indicated, all amounts are expressed in pounds sterling. For the months shown the US dollar high and low Noon Buying Rates per pound sterling were:
|
|
|
|
|
|
|
|
|
|
|
|
|
|
|
|
|
|
|
|
|
|
|
|
2012 |
|
2012 |
|
2011 |
|
2011 |
|
2011 |
|
2011 |
|
||||||
|
US dollars per pound sterling: |
|
|
|
|
|
|
|
|
|
|
|
|
|
|
|
|
|
|
|
|
High |
|
|
1.60 |
|
|
1.58 |
|
|
1.57 |
|
|
1.61 |
|
|
1.61 |
|
|
1.62 |
|
|
Low |
|
|
1.57 |
|
|
1.53 |
|
|
1.54 |
|
|
1.55 |
|
|
1.54 |
|
|
1.54 |
|
For each of the years shown, the average of the US dollar Noon Buying Rates per pound sterling based on the last day of each month was:
|
|
|
|
|
|
|
|
|
|
|
|
|
|
|
|
|
|
|
|
|
|
2011 |
|
|
2010 |
|
|
2009 |
|
|
2008 |
|
|
2007 |
|
|
US dollars per pound sterling: |
|
|
|
|
|
|
|
|
|
|
|
|
|
|
|
|
|
Average |
|
|
1.61 |
|
|
1.54 |
|
|
1.57 |
|
|
1.84 |
|
|
2.01 |
|
On 9 March 2012, the latest practicable date, the US dollar Noon Buying Rate was $1.5677 = £1.00. Lloyds Banking Group makes no representation that amounts in pounds sterling have been, could have been or could be converted into US dollars at that rate or at any of the above rates.
HISTORY AND DEVELOPMENT OF LLOYDS BANKING GROUP
The history of the Group can be traced back to the 18th century when the banking partnership of Taylors and Lloyds was established in Birmingham, England. Lloyds Bank Plc was incorporated in 1865 and during the late 19th and early 20th centuries entered into a number of acquisitions and mergers, significantly increasing the number of banking offices in the UK. In 1995, it continued to expand with the acquisition of the Cheltenham and Gloucester Building Society (C&G).
TSB Group plc became operational in 1986 when, following UK Government legislation, the operations of four Trustee Savings Banks and other related companies were transferred to TSB Group plc and its new banking subsidiaries. By 1995, the TSB Group had, either through organic growth or acquisition, developed life and general insurance operations, investment management activities, and a motor vehicle hire purchase and leasing operation to supplement its retail banking activities.
In 1995, TSB Group plc merged with Lloyds Bank Plc. Under the terms of the merger, the TSB and Lloyds Bank groups were combined under TSB Group plc, which was re-named Lloyds TSB Group plc, with Lloyds Bank Plc, which was subsequently re-named Lloyds TSB Bank plc, the principal subsidiary. In 1999, the businesses, assets and liabilities of TSB Bank plc, the principal banking subsidiary of the TSB Group prior to the merger, and its subsidiary Hill Samuel Bank Limited were vested in Lloyds TSB Bank plc, and in 2000, Lloyds TSB Group acquired Scottish Widows. In addition to already being one of the leading providers of banking services in the UK, this transaction also positioned Lloyds TSB Group as one of the leading suppliers of long-term savings and protection products in the UK.
On 18 September 2008, with the support of the UK Government, the boards of Lloyds TSB Group plc and HBOS plc announced that they had reached agreement on the terms of a recommended acquisition by Lloyds TSB Group plc of HBOS plc. The shareholders of Lloyds TSB Group plc approved the acquisition at the Company’s general meeting on 19 November 2008. On 16 January 2009, the acquisition was completed and Lloyds TSB Group plc changed its name to Lloyds Banking Group plc.
Pursuant to two placing and open offers which were completed by the Company in January and June 2009 and the Rights Issue completed in December 2009, the UK Government acquired 43.4 per cent of the Company’s issued ordinary share capital. Following further issues of ordinary shares, the UK Government’s holding has been reduced to approximately 40.1 per cent at 9 March 2012.
STRATEGY OF LLOYDS BANKING GROUP
The Group is a well diversified UK financial services group providing a wide range of banking and financial services to personal, commercial and corporate customers. The main focus of the Group remains the financial services markets in the UK and the Group has leading positions in many of the markets in which it participates, a comprehensive distribution capability, well recognised brands and a large customer base.
The Group’s corporate strategy is built around becoming the best bank for individual, commercial and corporate customers across the UK and creating value by investing in areas that make a real difference to these customers. Customer leadership driven by superior customer insight, tailored products, better service and relationship focus is the overriding priority. There are a number of other key elements to the strategy announced in June 2011, including simplifying the business, improving its agility and efficiency, whilst focusing on core markets which offer strong returns and attractive growth, maintaining a prudent approach to risk and further strengthening the Group’s balance sheet.
The four key elements of the action plan to deliver the strategy are:
RESHAPE THE BUSINESS PORTFOLIO TO FIT THE GROUP’S ASSETS, CAPABILITIES AND RISK APPETITE
The Group will invest in core areas which offer strong returns and attractive growth: these are businesses which are capital and liquidity efficient, with sustainable competitive advantages, and which are central to its core customer strategy.
In reshaping its business the Group is focusing on the continued reduction of assets outside of its risk appetite, the continued application of a conservative approach to, and a prudent appetite for, risk and the streamlining of its international presence.
4
BUSINESS
SIMPLIFY THE GROUP TO IMPROVE AGILITY AND EFFICIENCY
The HBOS integration programme was substantially completed in 2011, delivering a single IT platform and a run-rate of £2 billion per annum in cost synergies and other operating efficiencies. The Group is now targeting a further £1.7 billion of cost savings in 2014 through a series of simplification initiatives.
Savings will be released through a fundamental review of operations and processes, the creation of a more efficient distribution platform and increased use of digital channels, optimising sourcing and creating a more agile organisation through delayering the management structure, centralising control functions and simplifying the legal structures.
INVEST TO BE THE BEST BANK FOR CUSTOMERS
The Group intends to increase the investment in its business with a focus on becoming the best bank for customers, becoming the best through the cycle partner for its business customers and maintaining Bancassurance as a core element of this proposition.
STRENGTHEN THE GROUP’S BALANCE SHEET AND LIQUIDITY POSITION
The Group aims to continue to strengthen its balance sheet and liquidity position through:
|
|
|
|
– |
Targeting a core tier 1 capital ratio prudently in excess of 10 per cent |
|
|
|
|
– |
Exceeding regulatory liquidity requirements |
|
|
|
|
– |
Maintaining a stable funding base |
|
|
|
|
– |
Improving the Group’s loan to deposit ratio to 130 per cent or below by end 2014, although it now expects to attain this in 2012. |
SUMMARY
The Group is looking to create a simpler, more agile, efficient and responsive organisation with a real focus on operating sustainably and responsibly. Whilst focusing on core markets, which offer strong returns and attractive growth, the Group will maintain a prudent approach to risk and further strengthen its balance sheet.
The Group believes that the successful execution of its strategy to be the best bank for customers will enable delivery of strong and sustainable returns for shareholders.
BUSINESS AND ACTIVITIES OF LLOYDS BANKING GROUP
The Group is organised into five segments: Retail; Wholesale; Commercial; Wealth and International; and Insurance; see note 4 to the consolidated financial statements.
Further information on the Group’s segments is set out on pages 32 to 51.
MATERIAL CONTRACTS
The Company and its subsidiaries are party to various contracts in the ordinary course of business.
For information relating to the Company’s relationship with the UK Government see Major Shareholders and Related Party Transactions – Information about the Lloyds Banking Group’s relationship with the UK Government.
5
BUSINESS
ENVIRONMENTAL MATTERS
ENVIRONMENTAL RESPONSIBILITY
In 2011, the Group introduced a set of market leading long-term environmental targets under its Environmental Action programme to significantly reduce its environmental footprint. The Group aims to reduce paper, water and business travel by 20 per cent; ensure that less than 20 per cent of waste is sent to landfill; and reduce energy use by 30 per cent by 2020. The Group publishes a standalone, data-driven Climate and Environment Report on an annual basis which details progress it has made against its targets, and this is available from the Lloyds Banking Group website. Last year, the Group achieved the Carbon Trust Standard for its entire UK operations, which recognises its robust approach to measuring, managing and reducing its carbon emissions. The Group also reduced its use of energy by 1 per cent, its use of water by 3 per cent and paper use by 7 per cent in 2011 compared with 2010. Its overall carbon footprint reduced by 1 per cent in 2011 compared with 2010.
Over the last year the Group has been the UK’s most active provider of finance to renewable energy projects, having lent over £413 million across 13 renewable energy projects in the UK, Germany and the US. The Group’s approach to environmental risk management is covered on pages 123 and 124.
The Group is also encouraging businesses that bank with it to take action to address climate change. The Group has trained over 650 staff on its Business & Environment programme, to enable them to guide and support its customers in recognising environmental risks and seizing the opportunities. The Group is the only major UK bank to provide this kind of support to its business customers.
The Group recognises that its influence extends well beyond the size of its organisation. Its asset management business, Scottish Widows Investment Partnership (SWIP), has over £136 billion invested around the world and is committed to using its influence to encourage best practice in corporate governance and management of sustainability risks. SWIP has also launched a new sustainability strategy across its entire £8 billion property portfolio, including a target to reduce its energy consumption by 10 per cent by 2012 compared with 2009.
|
|
|
|
|
|
|
|
|
|
CO2 Emissions
(tonnes) |
|
|
|
|
|
|
|
|
|
|
|
2011 |
|
|
2010 |
|
|
Total UK CO2 emissions |
|
|
421,568 |
|
|
425,996 |
|
|
Scope 1 emissions |
|
|
52,179 |
|
|
60,302 |
|
|
Scope 2 emissions |
|
|
321,698 |
|
|
324,007 |
|
|
Scope 3 emissions |
|
|
42,691 |
|
|
41,687 |
|
The Group has improved the accuracy of energy data for the 2010 reporting years, replacing estimates with actual data. The Group has also changed its method for reporting car travel data in 2011 and have applied this method to historical data.
TRACKING PROGRESS
Independent consultants verify the Group’s performance every year. The Group also measures its performance against its peers through external benchmarks. In 2011, the Group was re-selected for the Dow Jones Sustainability Index. The Group was also ranked top UK bank in the FTSE4Good Index and was re-selected for the Carbon Disclosure Leadership Index. The Group has a Platinum ranking in Business in the Community’s Corporate Responsibility Index and was awarded Business in the Community’s CommunityMark, the national standard that publicly recognises excellence in community investment.
PROPERTIES
As at 31 December 2011, Lloyds Banking Group occupied 3,144 properties in the UK. Of these, 898 were held as freeholds and 2,246 as long-term leaseholds. The majority of these properties are retail branches, widely distributed throughout England, Scotland, Wales and Northern Ireland. Other buildings include the Lloyds Banking Group’s head office in the City of London with other customer service and support centres located to suit business needs but clustered largely in eight core geographic conurbations – London, Edinburgh, Glasgow, Midlands (Birmingham), Northwest (Chester and Manchester), West Yorkshire (Halifax and Leeds), South (Brighton and Andover) and Southwest (Bristol and Cardiff).
In addition, there are 423 properties which are either sub-let or vacant. There are also a number of ATM units situated throughout the UK, the majority of which are held as leasehold. The Group also has business operations elsewhere in the world, primarily holding property on a leasehold basis, principally in North America, Europe and Asia.
LEGAL ACTIONS AND REGULATORY MATTERS
During the ordinary course of business the Group is subject to threatened or actual legal proceedings and regulatory challenge both in the UK and overseas.
INTERCHANGE FEES
The European Commission has adopted a formal decision finding that an infringement of European Commission competition laws has arisen from arrangements whereby MasterCard set a uniform Multilateral Interchange Fee (MIF) in respect of cross-border transactions in relation to the use of a MasterCard or Maestro branded payment card. The European Commission has required that the MIF be reduced to zero for relevant cross-border transactions within the European Economic Area. This decision has been appealed to the General Court of the European Union (the General Court). Lloyds TSB Bank plc and Bank of Scotland plc (along with certain other MasterCard issuers) have successfully applied to intervene in the appeal in support of MasterCard’s position that the arrangements for the charging of the MIF are compatible with European Union competition laws. The UK Government has also intervened in the General Court appeal supporting the European Commission position. An oral hearing took place on 8 July 2011 and the judgement is expected on 24 May 2012. MasterCard has reached an understanding with the European Commission on a new methodology for calculating intra-European Economic Area MIF on an interim basis pending the outcome of the appeal.
Meanwhile, the European Commission is pursuing an investigation with a view to deciding whether arrangements adopted by visa for the levying of the MIF in respect of cross-border payment transactions also infringe European Union competition laws. In this regard visa reached an agreement with the European Commission to reduce the level of interchange for cross-border debit card transactions to the interim levels agreed by
6
BUSINESS
MasterCard. The UK’s Office of Fair Trading has also commenced similar investigations relating to the MIF in respect of domestic transactions in relation to both the MasterCard and visa payment schemes. The ultimate impact of the investigations on the Group can only be known at the conclusion of these investigations and any relevant appeal proceedings.
PAYMENT PROTECTION INSURANCE
There has been extensive scrutiny of the Payment Protection Insurance (PPI) market in recent years.
In October 2010, the UK Competition Commission confirmed its decision to prohibit the active sale of PPI by a distributor to a customer within seven days of a sale of credit. This followed the completion of its formal investigation into the supply of PPI services (other than store card PPI) to non-business customers in the UK in January 2009 and a referral of the proposed prohibition to the Competition Appeal Tribunal. The Competition Commission consulted on the wording of a draft Order to implement its findings from October 2010, and published the final Order on 24 March 2011 which became effective on 6 April 2011. Following an earlier decision to stop selling single premium PPI products, the Group ceased to offer PPI products to its customers in July 2010.
On 29 September 2009 the FSA announced that several firms had agreed to carry out reviews of past sales of single premium loan protection insurance. Lloyds Banking Group agreed in principle that it would undertake a review in relation to sales of single premium loan protection insurance made through its branch network since 1 July 2007. That review now forms part of the ongoing PPI work referred to below.
On 1 July 2008, the Financial Ombudsman Service (FOS) referred concerns regarding the handling of PPI complaints to the Financial Services Authority (FSA) as an issue of wider implication. On 29 September 2009 and 9 March 2010, the FSA issued consultation papers on PPI complaints handling. The FSA published its Policy Statement on 10 August 2010, setting out evidential provisions and guidance on the fair assessment of a complaint and the calculation of redress, as well as a requirement for firms to reassess historically rejected complaints which had to be implemented by 1 December 2010.
On 8 October 2010, the British Bankers’ Association (BBA), the principal trade association for the UK banking and financial services sector, filed an application for permission to seek judicial review against the FSA and the FOS. The BBA sought an order quashing the FSA Policy Statement and an order quashing the decision of the FOS to determine PPI sales in accordance with the guidance published on its website in November 2008.
The Judicial Review hearing was held in late January 2011 and on 20 April 2011 judgment was handed down by the High Court dismissing the BBA’s application. On 9 May 2011, the BBA confirmed that the banks and the BBA did not intend to appeal the judgment.
After publication of the judgment, the Group entered into discussions with the FSA with a view to seeking clarity around the detailed implementation of the Policy Statement. As a result, and given the initial analysis that the Group has conducted of compliance with applicable sales standards, which is continuing, the Group concluded that there are certain circumstances where customer contact and/or redress will be appropriate. Accordingly the Group made a provision in its financial statements for the year ended 31 December 2010 of £3,200 million in respect of the anticipated costs of such contact and/or redress, including administration expenses. During 2011, the Group made redress payments of £1,045 million to customers. However, there are still a number of uncertainties as to the eventual costs from any such contact and/or redress given the inherent difficulties of assessing the impact of the detailed implementation of the Policy Statement for all PPI complaints, uncertainties around the ultimate emergence period for complaints, the availability of supporting evidence and the activities of claims management companies, all of which will significantly affect complaints volumes, uphold rates and redress costs.
INTERBANK OFFERED RATE SETTING INVESTIGATIONS
Several government agencies in the UK, US and overseas, including the US Commodity Futures Trading Commission, the US SEC, the US Department of Justice and the FSA, as well as the European Commission, are conducting investigations into submissions made by panel members to the bodies that set various interbank offered rates. The Group, and/or its subsidiaries, were (at the relevant time) and remain members of various panels that submit data to these bodies in a number of jurisdictions. The Group has received requests from some government agencies for information and is co-operating with their investigations. In addition the Group has been named in private purported class action suits in the US with regard to the setting of London interbank offered rates (LIBOR). It is currently not possible to predict the scope and ultimate outcome of the various regulatory investigations or private lawsuits, including the timing and scale of the potential impact of any investigations and lawsuits on the Group.
LITIGATION IN RELATION TO INSURANCE BRANCH BUSINESS IN GERMANY
Clerical Medical Investment Group Limited (CMIG) has received a number of claims in the German courts, relating to policies issued by CMIG but sold by independent intermediaries in Germany, principally during the late 1990s and early 2000s. CMIG has won the majority of decisions to date, although a small number of regional district and appeal courts have found against CMIG on specific grounds. CMIG’s strategy includes defending claims robustly and appealing against adverse judgments. The ultimate financial effect, which could be significant, will only be known once all relevant claims have been resolved. However, consistent with this strategy, and having regard to the costs involved in managing these claims, and the inherent risks of litigation, the Group has recognised a provision of £175 million. Management believes this represents the most appropriate estimate of the financial impact, based upon a series of assumptions, including the number of claims received, the proportion upheld, and resulting legal and administration costs.
SHAREHOLDER COMPLAINTS
The Group and two former members of the Group’s Board of Directors have been named as defendants in a purported securities class action pending in the United States District Court for the Southern District of New York. The complaint, dated 23 November 2011, asserts claims under the Securities Exchange Act of 1934 in connection with alleged material omissions from statements made in 2008 in connection with the acquisition of HBOS. No quantum is specified.
In addition, a UK-based shareholder action group has threatened multi-claimant claims on a similar basis against the Group and two former directors in the UK. No claim has yet been issued.
The Group considers that the claims are without merit and will defend them vigorously. The claims have not been quantified and it is not possible to estimate the ultimate financial impact on the Group at this early stage.
EMPLOYEE DISPUTES
The Group is aware that a union representing a number of the Group’s employees is seeking to challenge the cap on pensionable pay introduced by the Group in 2011 on the grounds that it is unlawful. This challenge is at a very early stage. The Group will resist the challenge should it be pursued.
7
BUSINESS
The Group also faces a number of other threats of legal action from employees in relation to terms of employment including pay and bonuses. The Group considers that the complaints are without merit and, should proceedings be issued, they will be vigorously defended.
It is not possible to estimate the ultimate financial impact on the Group at this stage.
FSA INVESTIGATION INTO BANK OF SCOTLAND
In 2009 the FSA commenced a supervisory review into HBOS. The supervisory review was superseded when the FSA commenced an enforcement investigation into Bank of Scotland plc in relation to its Corporate Division between 2006 and 2008. These proceedings have now concluded. The FSA published its Final Notice on 9 March 2012. No financial penalty has been imposed on the Group or Bank of Scotland plc.
REGULATORY MATTERS
In the course of its business, the Group is engaged in discussions with the FSA in relation to a range of conduct of business matters including complaints handling, packaged bank accounts, savings accounts, product terms and conditions, interest only mortgages, sales processes and remuneration schemes. The Group is keen to ensure that any regulatory concerns are understood and addressed. The ultimate impact on the Group of these discussions can only be known at the conclusion of such discussions.
OTHER LEGAL ACTIONS AND REGULATORY MATTERS
In addition, during the ordinary course of business the Group is subject to other threatened and actual legal proceedings (which may include class action lawsuits brought on behalf of customers, shareholders or other third parties), regulatory investigations, regulatory challenges and enforcement actions, both in the UK and overseas. All such material matters are periodically reassessed, with the assistance of external professional advisers where appropriate, to determine the likelihood of the Group incurring a liability. In those instances where it is concluded that it is more likely than not that a payment will be made, a provision is established to management’s best estimate of the amount required to settle the obligation at the relevant balance sheet date. In some cases it will not be possible to form a view, either because the facts are unclear or because further time is needed to assess properly the merits of the case and no provisions are held against such matters. However, the Group does not currently expect the final outcome of any such matter to have a material adverse effect on its financial position.
COMPETITIVE ENVIRONMENT
The Group provides financial services to personal and corporate customers, predominantly in the UK but also overseas. The main business activities of the Group are retail, commercial and corporate banking, general insurance, and life, pensions and investment provision.
In the retail banking market, the Group competes with banks and building societies, major retailers and internet-only providers. In the mortgage market, competitors include the traditional banks and building societies and specialist mortgage providers. The Group competes with both UK and foreign financial institutions in the wholesale banking markets and with bancassurance, life assurance and general insurance companies in the UK insurance market.
In the competitive open market in which the Group operates there is an increasing range of products and services available to customers and with the current public scrutiny of banks the expectations and demands of customers continue to increase.
See Risk Factors – Competition Related Risks – The Independent Commission on Banking and the UK Treasury Select Committee have reviewed competition in the UK retail banking industry. The potential impact of the recommendations is inherently uncertain and could have a material adverse effect on the interests of the Group and Business and Economic Risks – The Group’s businesses are conducted in highly competitive environments and the Group’s financial performance depends upon management’s ability to respond effectively to competitive pressures.
8
BUSINESS
RECENT DEVELOPMENTS
PAYMENT OF ACCUMULATED INTEREST ON UPPER TIER TWO HYBRID CAPITAL SECURITIES ISSUED BY LLOYDS BANKING GROUP COMPANIES
The Group made the following announcement on 19 January 2012
Since 31 January 2010, the Group has been prohibited under the terms of an agreement with the European Commission from paying discretionary coupons and dividends on hybrid capital securities issued by the Company and certain of its subsidiaries. This prohibition ends on 31 January 2012.
The Group now confirms that it intends to pay on the upper tier two securities set out below which have cumulative deferrable coupon terms the relevant amount of Arrears of Interest (as defined therein).
|
|
|
|
|
|
|
ISIN |
|
ISSUER |
|
SECURITY |
|
XS0083932144 |
|
Bank of Scotland plc |
|
7.375% Subordinated Undated Instruments |
|
GB0000395102 |
|
Bank of Scotland plc |
|
8.750% Perpetual Subordinated Bonds |
|
GB0000395094 |
|
Bank of Scotland plc |
|
12.00% Perpetual Subordinated Bonds |
|
GB0005242879 |
|
Bank of Scotland plc |
|
9.375% Perpetual Subordinated Bonds |
|
GB0000765403 |
|
Bank of Scotland plc |
|
Undated Floating Rate Primary Capital Notes |
|
XS0046690961 |
|
Bank of Scotland plc |
|
8.625% Perpetual Subordinated Notes |
|
XS0059171230 |
|
Bank of Scotland plc |
|
10.25% Subordinated Undated Instruments |
|
GB0000394915 |
|
Bank of Scotland plc |
|
13.625% Perpetual Subordinated Bonds |
|
XS0063730203 |
|
Bank of Scotland plc |
|
Subordinated Undated Instruments due 2016 |
|
XS0188201536 |
|
HBOS plc |
|
4.875% Undated Subordinated Fixed to Floating Rate Instruments |
|
XS0188201619 |
|
HBOS plc |
|
Floating Rate Undated Subordinated Instruments |
|
US4041A3AF96 / US4041A2AG96 |
|
HBOS plc |
|
5.375% Undated Fixed to Floating Rate Subordinated Notes |
|
XS0177955381 |
|
HBOS plc |
|
5.125% Undated Subordinated Fixed to Floating Rate Notes |
|
XS0205326290 |
|
HBOS plc |
|
5.625% Cumulative Callable Fixed to Floating Rate Undated Subordinated Notes |
|
XS0145407507 |
|
Lloyds Banking Group plc |
|
6.00% Undated Subordinated Guaranteed Bonds |
|
GB0005224307 |
|
Lloyds TSB Bank plc |
|
Primary Capital Undated Floating Rate Notes (Series 1) |
|
XS0099508698 |
|
Lloyds TSB Bank plc |
|
4.648% Undated Subordinated Step-up Notes |
|
XS0099507534 |
|
Lloyds TSB Bank plc |
|
6.50% Undated Subordinated Step-up Notes |
|
XS0099507963 |
|
Lloyds TSB Bank plc |
|
6.50% Undated Subordinated Step-up Notes |
|
XS0079927850 |
|
Lloyds TSB Bank plc |
|
8% Undated Subordinated Step-up Notes |
|
GB0005232391 |
|
Lloyds TSB Bank plc |
|
Primary Capital Undated Floating Rate Notes (Series 3) |
|
GB0005205751 |
|
Lloyds TSB Bank plc |
|
Primary Capital Undated Floating Rate Notes (Series 2) |
|
XS0169667119 |
|
Lloyds TSB Bank plc |
|
5.125% Upper Tier 2 Callable Perpetual Subordinated Notes |
|
XS0056390007 |
|
Lloyds TSB Bank plc |
|
5.57% Undated Subordinated Step Up Coupon Notes 2015 |
Such amounts will be calculated in accordance with the terms of such securities and will be paid on 9 February 2012 subject to, and in accordance with, the terms of those securities.
LLOYDS BANKING GROUP ANNOUNCES CHANGES TO ITS GROUP BOARD AND THE MANAGEMENT TEAM
The Group made the following announcement on 1 February 2012
Lloyds Banking Group has today announced changes to its Group Board and the management team.
The changes to the Board and the senior management organisational structure mean that there will be five business lines reporting directly to the Group Chief Executive as follows:
Alison Brittain will undertake the newly created role of Group Director of Retail with responsibility for our multi channel and multi brand strategy including Lloyds TSB, the Bank of Scotland and Halifax, retail products and marketing, as well as telephony and digital banking.
Antonio Lorenzo, Group Director of Strategy and Wealth and International, will also undertake responsibility for Asset Finance which had formerly been a part of the Wholesale business.
Truett Tate, Group Executive Director for Wholesale has decided to retire from the Group during February and will not seek re-election at the Group’s Annual General Meeting in May. As a result of Truett’s departure Andrew Géczy, CEO of Wholesale Banking and Markets, will report on an interim basis to Group Chief Executive, António Horta-Osório.
The Group has begun a search internally and externally for a permanent Director of the Group’s Wholesale Division.
John Maltby remains as Director of Commercial continuing with his responsibility for our SME businesses.
Toby Strauss’ role also remains unchanged as Director of the Group’s Insurance division.
Further to the centralisation of all control functions as part of the Group Strategic Review in 2011 there will now be five control and support functions as follows:
|
|
|
|
• |
Risk – led by our Chief Risk Officer Juan Colombas. |
9
BUSINESS
|
|
|
|
• |
Finance – led by our Group Finance Director, George Culmer when he joins the Group. |
|
|
|
|
• |
Operations – led by our Director of Group Operations, Mark Fisher. |
|
|
|
|
• |
Corporate Affairs – led by our Group Corporate Affairs Director, Matt Young. |
|
|
|
|
• |
Group Corporate Functions – Human Resources, Legal and Secretariat and Group Audit will now report to a newly-created position of Group Corporate Functions Director. The Group Corporate Functions Director will be a member of the Group Executive Committee and the Group is currently recruiting for the role. |
LLOYDS BANKING GROUP: CHANGES TO BOARD
The Group made the following announcement on 1 February 2012
Lloyds Banking Group is pleased to announce the appointment of Sara Weller as a non-executive director. Ms Weller will join the Board with effect from 1 February 2012 and will serve as a member of the Remuneration and the Risk Committees.
Sir Julian Horn-Smith has informed the Group of his intention to retire from the Board at the Annual General Meeting in May 2012 and will therefore not stand for re-election as a Director.
Truett Tate, Executive Director for Wholesale, has decided to retire from the Group at the Annual General Meeting in May 2012 and will therefore not seek re-election.
LLOYDS BANKING GROUP PLC – RESIGNATION OF DIRECTOR
The Group made the following announcement on 6 February 2012
Further to the Group’s announcement on 1 February 2012, Truett Tate, Executive Director, Wholesale, has resigned from the Board of Lloyds Banking Group plc with immediate effect.
LLOYDS BANKING GROUP PLC – MANAGEMENT CHANGE
The Group made the following announcement on 24 February 2012
Further to the Group’s announcement on 19 September 2011, Tim Tookey, Group Finance Director, will stand down from the Board of Lloyds Banking Group at close of business today, 24 February 2012.
LLOYDS BANKING GROUP ANNOUNCES BOARD CHANGES
The Group made the following announcement on 27 February 2012
The Board of Lloyds Banking Group plc announces that Glen Moreno, its Deputy Chairman and Senior Independent Director, intends not to seek re-election at the Annual General Meeting on 17 May 2012 and will retire from the Board on that date.
The Board has decided to appoint Anthony Watson, Chairman of the Remuneration Committee, as its Senior Independent Director and David Roberts, Chairman of the Risk Committee, as Deputy Chairman both with effect from 17 May 2012.
LLOYDS BANKING GROUP PLC – MANAGEMENT CHANGE
The Group made the following announcement on 1 March 2012
Lloyds Banking Group plc announces that George Culmer will be appointed as Group Finance Director of Lloyds Banking Group with effect from 16 May 2012.
George Culmer has been Chief Financial Officer of RSA Insurance Group plc since May 2004.
Biographical details of George Culmer
Between 2004 and 2012, George was a director and Chief Financial Officer of RSA Insurance Group plc. His previous roles included Head of Capital Management of Zurich Financial Services and Chief Financial Officer of its UK operations. Prior to that he held various senior management positions at Prudential. George began his career at Coopers & Lybrand in London and New Zealand and read History at Cambridge. Age 49.
Key compensation notes
Compensation arrangements include an annual salary of £720,000 and a discretionary annual bonus up to a maximum of 200 per cent of salary. It is intended to award a long term performance-based share incentive of up to 225 per cent of salary for 2012 which will only vest in full in three years if stretching performance targets are exceeded. Mr Culmer will receive an allowance to fund personal pension arrangements amounting to 25 per cent of his salary.
Mr Culmer has deferred awards and a cash bonus from RSA Insurance Group plc, which he forfeits as a result of leaving RSA Insurance Group plc. He will therefore be partially compensated in respect of these by receiving shares in Lloyds Banking Group worth £1.9 million which will vest in 2013 and 2014. The extent to which Mr Culmer will receive future awards depends on the performance of Lloyds Banking Group in the short, medium and longer term against stretching performance measures.
LLOYDS BANKING GROUP PLC (“GROUP”) – NOTIFICATION OF TRANSACTIONS BY PERSONS DISCHARGING MANAGERIAL RESPONSIBILITIES IN ORDINARY SHARES OF THE GROUP OF 10P EACH (“SHARES”)
The Group made the following announcement on 9 March 2012
The following announcement sets out details of awards made today, 9 March 2012, under the Group’s share plans to the Group Chief Executive and members of the Group Executive Committee.
Deferred bonus awards for 2011 performance
Conditional awards of shares were made today in respect of bonus awards for 2011 performance. Part of the 2011 bonus awards will be made in June 2012 based on the prevailing share price. These shares will be notified at that time. Awards vesting over the period September 2012 to
10
BUSINESS
September 2015 are based on a share price of 34.786 pence and are detailed below. Bonus awards are subject to performance adjustment in full or in part if the performance that generated the award is found not to be sustainable.
|
|
|
|
|
|
|
Name |
|
Maximum number |
|
|
|
A Brittain |
|
|
2,414,764 |
|
|
J Colombás |
|
|
1,782,326 |
|
|
M Fisher |
|
|
2,069,798 |
|
|
A Lorenzo |
|
|
1,782,326 |
|
|
J Maltby |
|
|
728,741 |
|
|
D Nicholson |
|
|
436,957 |
|
|
A Risley |
|
|
577,818 |
|
|
T Strauss |
|
|
451,330 |
|
|
M Young |
|
|
929,971 |
|
Long term incentive plan – 2012 awards
Conditional share awards were made today under the Group’s Long Term Incentive Plan as detailed below. The shares under the awards will only vest in 2015 subject to the satisfaction of stretching performance conditions over a three year period. The awards are based on a share price of 34.786 pence.
|
|
|
|
|
|
|
Name |
|
Maximum number |
|
|
|
A Horta-Osório |
|
|
9,644,684 |
|
|
A Brittain |
|
|
4,527,683 |
|
|
J Colombás |
|
|
4,146,064 |
|
|
M Fisher |
|
|
4,876,961 |
|
|
A Lorenzo |
|
|
4,243,086 |
|
|
J Maltby |
|
|
2,910,653 |
|
|
D Nicholson |
|
|
2,587,247 |
|
|
A Risley |
|
|
2,587,247 |
|
|
T Strauss |
|
|
3,395,762 |
|
|
M Young |
|
|
2,587,247 |
|
Emoluments of the eight highest paid senior executives
The following table sets out the Emoluments of the eight highest paid senior executives in respect of the 2011 performance year. The disclosure is made on the same basis as the five highest paid senior executives for the 2010 performance year, as shown in the Annual Report and Accounts 2010.
|
|
|
|
|
|
|
|
|
|
|
|
|
|
|
|
|
|
|
|
|
|
|
|
|
|
|
|
|
|
|
|
|
|
|
|
|
|
Employee |
|
||||||||||||||||||||||||||||||
|
Fixed |
|
8 |
|
|
7 |
|
|
6 |
|
|
5 |
|
|
4 |
|
|
3 |
|
|
2 |
|
|
1 |
|
|||||||||
|
Cash based |
|
|
342 |
|
|
|
480 |
|
|
|
310 |
|
|
|
233 |
|
|
|
754 |
|
|
|
941 |
|
|
|
956 |
|
|
|
500 |
|
|
|
Total fixed |
|
|
342 |
|
|
|
480 |
|
|
|
310 |
|
|
|
233 |
|
|
|
754 |
|
|
|
941 |
|
|
|
956 |
|
|
|
500 |
|
|
|
Variable1 |
|
|
|
|
|
|
|
|
|
|
|
|
|
|
|
|
|
|
|
|
|
|
|
|
|
|
|
|
|
|
|
|
|
|
Upfront cash |
|
|
2 |
|
|
|
2 |
|
|
|
2 |
|
|
|
2 |
|
|
|
2 |
|
|
|
2 |
|
|
|
2 |
|
|
|
2 |
|
|
|
Deferred cash |
|
|
0 |
|
|
|
0 |
|
|
|
0 |
|
|
|
0 |
|
|
|
0 |
|
|
|
0 |
|
|
|
0 |
|
|
|
0 |
|
|
|
Upfront shares2 |
|
|
20 |
|
|
|
0 |
|
|
|
0 |
|
|
|
332 |
|
|
|
0 |
|
|
|
205 |
|
|
|
320 |
|
|
|
0 |
|
|
|
Deferred shares |
|
|
478 |
|
|
|
498 |
|
|
|
793 |
|
|
|
1,048 |
|
|
|
898 |
|
|
|
773 |
|
|
|
773 |
|
|
|
1,998 |
|
|
|
Long term incentive plan3 |
|
|
270 |
|
|
|
144 |
|
|
|
199 |
|
|
|
473 |
|
|
|
509 |
|
|
|
433 |
|
|
|
443 |
|
|
|
150 |
|
|
|
Total variable pay |
|
|
770 |
|
|
|
644 |
|
|
|
994 |
|
|
|
1,855 |
|
|
|
1,409 |
|
|
|
1,413 |
|
|
|
1,538 |
|
|
|
2,150 |
|
|
|
Pension cost4 |
|
|
85 |
|
|
|
120 |
|
|
|
44 |
|
|
|
58 |
|
|
|
189 |
|
|
|
160 |
|
|
|
164 |
|
|
|
125 |
|
|
|
Total remuneration |
|
|
1,197 |
|
|
|
1,244 |
|
|
|
1,348 |
|
|
|
2,146 |
|
|
|
2,352 |
|
|
|
2,514 |
|
|
|
2,658 |
|
|
|
2,775 |
|
|
|
|
|
|
1 |
Variable pay in respect of performance year 2011. |
|
|
|
|
2 |
Award to compensate for loss of variable remuneration from previous employer which vested in 2011. |
|
|
|
|
3 |
LTIP values shown are on an expected value basis. |
|
|
|
|
4 |
Pension cost based on an average pension cost of 25 per cent of salary. |
11
LLOYDS BANKING GROUP PLC (“GROUP”) - NOTIFICATION OF TRANSACTIONS BY PERSONS DISCHARGING MANAGERIAL RESPONSIBILITIES IN ORDINARY SHARES OF THE GROUP OF 10P EACH (“SHARES”)
The Group made the following announcement on 15 March 2012
The Group announces that today, following the successful delivery of the integration programme, the 2009 LTIP Integration Awards vested for the individuals listed in the table below. They have received the number of Shares as set out by their name, after the appropriate number of Shares had been withheld to cover tax and national insurance contributions. The Shares were acquired for nil consideration.
| Name | Shares |
| M Fisher | 748,008 |
| J Maltby | 480,862 |
| D Nicholson | 400,717 |
| A Risley | 400,718 |
The Group further announces that today Mr Fisher exercised an option over 1,984,093 Shares under the Lloyds Banking Group plc Executive Share Plan 2003. The Shares were acquired for nil consideration.
Mr Fisher sold 2,482,101 Shares today at 35.6711 pence per Share, inclusive of the appropriate number of Shares to cover tax and national insurance contributions due on the exercise of his option. Following the above transactions, Mr Fisher’s shareholding in the Group increased by 250,000 Shares bringing his total shareholding to 519,738 Shares.
12
OPERATING AND FINANCIAL REVIEW AND PROSPECTS
The results discussed below are not necessarily indicative of Lloyds Banking Group’s results in future periods. The following information contains certain forward looking statements. For a discussion of certain cautionary statements relating to forward looking statements, see Forward looking statements.
The following discussion is based on and should be read in conjunction with the consolidated financial statements and the related notes thereto included elsewhere in this annual report. For a discussion of the accounting policies used in the preparation of the consolidated financial statements, see Accounting policies in note 2 to the consolidated financial statements.
TABLE OF CONTENTS
|
|
|
|
|
|
14 |
|
|
|
17 |
|
|
|
17 |
|
|
|
18 |
|
|
|
31 |
|
|
|
31 |
|
|
|
32 |
|
|
|
52 |
|
|
|
57 |
|
|
|
58 |
|
|
|
70 |
|
|
|
87 |
|
|
|
110 |
|
|
|
118 |
|
|
|
125 |
|
|
|
128 |
|
|
|
130 |
|
|
|
131 |
13
OPERATING AND FINANCIAL REVIEW AND PROSPECTS
OVERVIEW AND TREND INFORMATION
The external macro economic and regulatory environment in which the Group operates remains uncertain but the Group has endeavoured to outline below some of the key regulatory, economic and social factors impacting its markets.
REGULATION
The quantum of regulatory change remains high and the regulatory environment remains challenging but the Group is starting to see greater clarity in a number of areas. There are however a number of different issues that are likely to have a fundamental impact on the business going forward including the recommendations arising from the Independent Commission on Banking, future capital and liquidity requirements, and the changes to the UK banking supervisory structure:
|
|
|
|
– |
Stringent UK capital and liquidity standards |
|
|
|
|
– |
More focus on consumer protection and transparency |
|
|
|
|
– |
Recovery and resolution mechanisms and Retail ring-fencing |
|
|
|
|
– |
Independent Commission on Banking final recommendations |
Independent Commission on Banking (ICB)
In 2010 the
UK Government appointed an ICB to review possible structural measures to reform
the banking system and promote stability and competition. The ICB published its
final report on 12 September 2011 putting forward proposals that would require
ring-fencing some of the retail and SME activities of banks from their
investment banking activities and additional capital requirements beyond those
required under Basel III.
On 19 December 2011 the Chancellor delivered the UK Government’s
first formal response to the ICB’s Final Report of 12 September. The response
endorsed many of the key recommendations contained in the ICB’s Final Report,
including the ring-fencing of commercial and retail operations, higher capital
requirements and a 7-day current account switching service. Importantly for the
Group, the Government also supported the principle of a ‘flexible’ ring fence,
which allows banks to choose where to place some (but not all) services.
While the
Group welcomes the increased clarity provided by the Government’s initial
response, significant uncertainty remains over key elements of the reforms,
including what activities could be allowed inside the ‘ring-fenced bank’, the
extent of depositor preference of other creditors and measures that could see
some categories of wholesale funding ‘bailed-in’ in the instance of resolution.
The Government has announced that it will be producing a formal White Paper in
the spring and the Group would anticipate that this paper will provide
additional clarity, while still leaving some issues open to consultation. The
Group continues to work to assess the impact that the reforms may have on its
business and continues to play a constructive role in the debate with the
Government and other stakeholders.
Capital Requirements Directive IV
Evolving capital and liquidity requirements continue to be a priority for the Group. Separate to the capital recommendations laid out by the ICB, the Basel Committee on Banking Supervision has put forward proposals for a reform package which changes regulatory capital and liquidity standards, the definition of ‘capital’, introduces new definitions for the calculation of counterparty credit risk and leverage ratios, additional capital buffers and development of a global liquidity standard. Implementation of these changes is expected to be phased in between 2013 and 2018 and the fourth round of changes to the European Capital Requirements Directive IV is currently in draft form and progressing through the European legal framework towards finalisation.
UK Banking Supervisory Structure
The recent ongoing difficulties in global financial markets have prompted a review and alteration to the banking supervisory structure in the UK. In April 2011, the FSA commenced an internal reorganisation as a first step in a process towards the formal transition of regulatory and supervisory powers from the FSA to the new Financial Conduct Authority (FCA) and Prudential Regulatory Authority (PRA) in 2012. Until this time the responsibility for regulating and supervising the activities of the Lloyds Banking Group and its subsidiaries will remain with the FSA. However, the reorganisation could lead to changes in how the Group is regulated and supervised on a day-to-day basis. In addition, the European Banking Authority, the European Insurance and Occupational Pensions Authority and the European Securities and Markets Authority as new EU Supervisory Authorities are likely to have greater influence on regulatory approaches across the EU.
14
OPERATING AND FINANCIAL REVIEW AND PROSPECTS
THE ECONOMY
The global economy was split in 2011 between relatively strong growth in emerging markets, and economies struggling to recover from recession in much of the Western world. Indeed, the extent of the UK economic recovery has now fallen behind even the weak recovery after the late 1970’s recession.
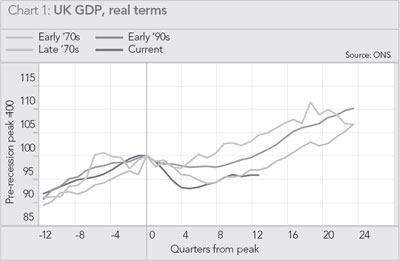
The stark difference is due to the high levels of indebtedness that many developed economies accumulated prior to 2008, which are holding back economic growth through deleveraging of initially the private sector, but now governments too. In the Eurozone, countries with particularly high government debt or deficit levels have lost market confidence as they struggled to achieve the necessary fiscal tightening to bring their public finances onto a sustainable trajectory without damaging economic growth prospects too severely. Ireland, Portugal and Greece have received further IMF and EU financial support in return for accepting even more stringent austerity programmes, and at the time of writing it looks likely that private creditors will suffer effective haircuts of significantly more than 50 per cent on their Greek debt. Italy and Spain have also tightened public budgets further, and given their much greater size this is dragging down Eurozone economic growth more significantly. In the US, public finance concerns are less immediate, but the unsustainable long term trajectory of debt on current policies has led to political stalemate, raising the risk of sudden fiscal tightening as previous loosening measures expire, and in turn hurting businesses’ and consumers’ confidence. Global growth was also hampered in 2011 by natural disasters, including the floods in Australia and Thailand and the earthquake and tsunami in Japan, the latter causing significant disruption to global manufacturing supply chains.
First estimates suggest the UK economy grew by 0.9 per cent in 2011, well below the long term average of 2.3 per cent. The economy is currently estimated to have shrunk slightly in the final quarter of the year as consumers’ and businesses’ confidence fell, the result of relatively high inflation reducing consumers’ spending power, a faster than expected reduction in public sector employment, and the worsening outlook for the Eurozone which caused companies to postpone investment spending and recruitment. Unemployment rose from 7.7 per cent in the first quarter of 2011 to 8.4 per cent by December. Company failures in England and Wales rose from a low point of 3,973 in the final quarter of 2010 to 4,260 by the fourth quarter of 2011, although the failure rate remained steady over that period at just 0.7 per cent of companies, close to its pre-recession trough. Property prices were broadly flat through the year, however – house prices on average fell marginally by 2 per cent in the year to December 2011, and commercial property prices rose on average by just 1 per cent.
Based on data for the first three quarters of 2011, the Irish economy appears to have grown in 2011 for the first time since 2007, and the unemployment rate appears to be stabilising. Strict austerity measures in recent years targeted at improving international competitiveness are beginning to pay off – falling domestic demand is now being more than offset by increasing net exports. Property markets remain very weak, however; house prices fell by over 16 per cent in 2011 and CRE prices by 11 per cent. Despite the large fall in prices already, an overhang of vacant property continues to weigh on market prices.
Future economic developments in the UK and Ireland are highly contingent on how successful political leaders are at stemming the Eurozone crisis, to what extent the private sector can offset shrinking of the public sector, and how the implementation of new regulation on banks impacts their ability to supply credit whilst meeting tighter capital and liquidity criteria. The recent weakening in the Eurozone economy and the balance of risks make double-dip recession there in 2012 the most likely scenario – indeed this is now the consensus view (Chart 2).
15
OPERATING AND FINANCIAL REVIEW AND PROSPECTS
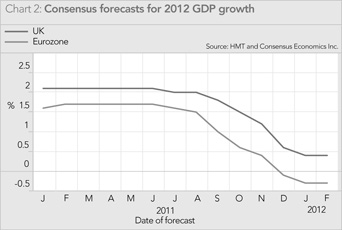
The current consensus view for 2012 UK GDP growth is not yet that weak, at 0.4 per cent. The low level of imbalances in the economy relative to the 2008 position suggest that weak growth should not deteriorate into significant recession provided the Eurozone moves quickly towards a solution to the sovereign debt crisis. Bank Rate is likely to stay at or close to current low levels for some time, and property prices are expected to be broadly stable. Unemployment is likely to rise further, however, as estimates of public sector job cuts have increased. The current consensus view for 2012 Irish GDP growth is broadly flat, and the unemployment rate there is expected to be stable. Property prices are expected to fall further, but by less than in 2011.
However, whilst a definitive solution to the Eurozone crisis remains lacking there continues to be a risk that ongoing uncertainty around the Eurozone economic outlook, the survival of the Euro currency and the availability of credit could cause a significant recession in the UK and Ireland. Such a scenario would likely result in higher UK corporate failures, a second leg of falling property prices, albeit by less than during the 2008-9 recession, and rising commercial tenant defaults. Irish property prices would also fall by more than currently expected. In turn, this would have a negative impact on the Group’s income, funding costs and impairment charges.
THE IMPACT ON THE GROUP’S MARKETS
The weak economic recovery has kept growth in the Group’s markets subdued. With the economy expected to grow very slowly in 2012, the Group’s central expectation is that growth in its markets will remain weak in 2012.
For the market as a whole, net new mortgage lending has amounted to just 0.7 per cent of outstanding balances during 2011, very similar to 2010. Consumers made net repayments of unsecured debt (excluding student loans) of around 2 per cent of outstanding balances for the third consecutive year in 2011. Household deposits rose by 2.6 per cent in 2011 similar to the rate of increase in the previous two years but well down from the 8-9 per cent growth per year pre-recession.
Similarly, companies have been focussed on paying down existing debt, for the third successive year in 2011. Non-financial companies made net repayments of 3.7 per cent of sterling lending from banks and building societies in 2011, after repayments of 3.5 per cent in 2010 and 2.2 per cent in 2009. Company deposits with UK banks rose by 1.1 per cent in 2011, slower than the 1.8 per cent rise in 2010 and the 4.5 per cent increase in 2009. Although companies have held back investment spending and prioritised cashflow, much of this has fed into lower borrowing rather than higher deposits.
In Ireland, continued falls in house prices, despite the already steep reductions prior to 2011, have kept impairments high and the Group expects property prices to remain subdued.
The Group expects that another weak year for the UK economy in 2012 will be accompanied by weak customer deposit growth and a continued period of declining demand for borrowing, particularly from companies. The continuation of low interest rates, and the substantial adjustments that many companies and households have already made to their indebtedness, is likely to minimise any deterioration in arrears. The Group’s central expectation of broadly flat property prices in the UK in 2012 is consistent with the subdued market expected.
CUSTOMER DRIVERS, INCLUDING COMPETITION
|
|
|
|
– |
Want simplicity and transparency |
|
|
|
|
– |
Demand a quality, multi-channel customer service experience |
|
|
|
|
– |
Growing demand for advice to plan/save for retirement |
|
|
|
|
– |
Increasingly demand better value for their money |
In the competitive open market in which the Group operates there is an increasing range of products and services available to customers, and with the current public scrutiny of banks the expectations and demands of customers continue to increase.
Access to convenient branches remains important for many customers but demand for a quality multi-channel banking proposition is now more prevalent and the provision of effective telephone, digital and mobile channels is increasingly important. Service remains one of the key drivers of customer satisfaction and customers are less accepting of poor service given the competitive nature of the market.
In the current low interest environment many customers are demanding better value for money but security and reputation remain important factors. Customers want clear and transparent products delivered with good service and access to helpful, relevant, expert advice when they need it. Customers are demanding basic banking services to be delivered well but there is also an increasing demand for advice in more complex areas such as help in planning and saving for retirement. Product innovation is also important for some whereas longstanding relationships remain important for others.
16
OPERATING AND FINANCIAL REVIEW AND PROSPECTS
As highlighted above, there are some clear customer trends emerging but the Group recognises that every customer, whether they be retail or corporate, has their own personal needs and has to be treated individually. It is clear that different customer segments have different demands and the opportunity exists to differentiate service for varied segments but fundamentally the customer has a choice and will select the provider that can most effectively service their personal needs.
The financial services market remains competitive. The Group is seeing a number of new entrants including virgin Money and Metro Bank looking to make inroads into the market and the disposal of the verde branches along with the improved switching process will further enhance competition.
The Group’s strategy, as outlined on pages 4 and 5, reflects the market conditions and the changing needs of customers. Above all it recognises that the Group operates in a competitive market where additional challengers continue to emerge and the only way of ensuring success is by focusing on the changing needs of every customer.
The preparation of financial statements requires management to make estimates and assumptions that affect amounts reported therein. Due to the inherent uncertainty involved in making estimates, actual results reported in future periods may be based upon amounts which differ from those estimates.
The accounting policies that are deemed critical to the Group’s results and financial position, based upon materiality and significant judgements and estimates, are discussed in note 3 to the consolidated financial statements.
FUTURE ACCOUNTING DEVELOPMENTS
Future developments in relation to the Group’s IFRS reporting are discussed in note 58 to the consolidated financial statements.
17
OPERATING AND FINANCIAL REVIEW AND PROSPECTS
RESULTS OF OPERATIONS – 2011, 2010 AND 2009
SUMMARY
|
|
|
|
|
|
|
|
|
|
|
|
|
|
|
2011 |
|
2010 |
|
2009 |
|
|||
|
Net interest income |
|
|
12,698 |
|
|
12,546 |
|
|
9,026 |
|
|
Other income |
|
|
14,114 |
|
|
31,498 |
|
|
36,745 |
|
|
Total income |
|
|
26,812 |
|
|
44,044 |
|
|
45,771 |
|
|
Insurance claims |
|
|
(6,041 |
) |
|
(19,088 |
) |
|
(22,493 |
) |
|
Total income, net of insurance claims |
|
|
20,771 |
|
|
24,956 |
|
|
23,278 |
|
|
Operating expenses |
|
|
(13,050 |
) |
|
(16,470 |
) |
|
(15,984 |
) |
|
Trading surplus |
|
|
7,721 |
|
|
8,486 |
|
|
7,294 |
|
|
Impairment |
|
|
(8,094 |
) |
|
(10,952 |
) |
|
(16,673 |
) |
|
Share of results of joint ventures and associates |
|
|
31 |
|
|
(88 |
) |
|
(752 |
) |
|
Gain on acquisition |
|
|
— |
|
|
— |
|
|
11,173 |
|
|
Loss on disposal of businesses |
|
|
— |
|
|
(365 |
) |
|
— |
|
|
(Loss) profit before tax |
|
|
(342 |
) |
|
(2,919 |
) |
|
1,042 |
|
|
Taxation |
|
|
(36 |
) |
|
325 |
|
|
1,911 |
|
|
(Loss) profit for the year |
|
|
(378 |
) |
|
(2,594 |
) |
|
2,953 |
|
|
|
|
|
|
|
|
|
|
|
|
|
|
Profit attributable to non-controlling interests |
|
|
73 |
|
|
62 |
|
|
126 |
|
|
(Loss) profit attributable to equity shareholders |
|
|
(451 |
) |
|
(2,656 |
) |
|
2,827 |
|
|
(Loss) profit for the year |
|
|
(378 |
) |
|
(2,594 |
) |
|
2,953 |
|
2011 COMPARED WITH 2010
For the year ended 31 December 2011, the Group recorded a loss before tax of £342 million compared with a loss before tax in 2010 of £2,919 million, which had been driven by the £3,200 million payment protection insurance provision (see page 27) although this had been partly offset by a pension curtailment gain in the same year of £910 million.
Total income decreased by £17,232 million to £26,812 million in 2011 compared with £44,044 million in 2010, comprising a £17,384 million reduction in other income only marginally offset by an increase of £152 million in net interest income.
Net interest income was £12,698 million in 2011; an increase of £152 million, or 1 per cent compared to £12,546 million in 2010. There was a credit of £696 million in 2011 arising from liability management gains (see page 21) and a benefit of £1,117 million from a reduction in the amounts payable to unitholders in those Open-Ended Investment Companies included in the consolidated results of the Group. However, net interest income in the Group’s banking businesses fell as a result of both a reduction in average interest earning banking assets in the year and a reduction in the net interest margin. The decline in the net interest margin reflected higher wholesale funding costs, higher deposit rates and the effect of refinancing a significant amount of government and central bank facilities, partially offset by an improvement in customer margins and funding mix.
Other income was £17,384 million, or 55 per cent, lower at £14,114 million in 2011 compared to £31,498 million in 2010. Fee and commission income was £57 million, or 1 per cent, lower at £4,935 million compared to £4,992 million in 2010. Fee and commission expense decreased by £291 million or 17 per cent to £1,391 million compared with £1,682 million in 2010. Net trading income decreased by £16,092 million to a deficit of £368 million in 2011 compared to a surplus of £15,724 million in 2010; this decrease included a reduction of £14,267 million in gains on policyholder investments held within the insurance business, offset by a similar decrease in the related claims expense, see below. Insurance premium income was largely unchanged at £8,170 million in 2011 compared with £8,148 million in 2010; an increase of £22 million. During 2011 the Group exchanged certain existing subordinated debt securities for new securities; these exchanges resulted in a gain on extinguishment of the existing securities of £599 million, being the difference between the carrying amount of the securities extinguished and the fair value of the new securities issued together with related fees and costs; this gain was £176 million, or 42 per cent higher than the liability management gains recognised in 2010. Excluding the liability management gains, other operating income was £1,724 million, or 44 per cent, lower at £2,169 million in 2011 compared to £3,893 million in 2010; this largely reflected an adverse variance of £1,411 million in the income arising from the movement in value of in-force insurance business.
Insurance claims expense was £13,047 million or 68 per cent, lower at £6,041 million in 2011 compared to £19,088 million in 2010. The insurance claims expense in respect of life and pensions business was £12,851 million, or 69 per cent lower at £5,698 million in 2011 compared to £18,549 million in 2010; this decrease in claims was matched by a similar reduction in net trading income, reflecting the performance of policyholder investments. Insurance claims in respect of general insurance business were £196 million, or 36 per cent, lower at £343 million compared to £539 million in 2010.
Operating expenses decreased by £3,420 million, or 21 per cent to £13,050 million in 2011 compared with £16,470 million in 2010; the main reasons for the reduction being the £3,200 million payment protection insurance provision and the £500 million customer goodwill payments provision, raised in 2010, partly offset by a pension curtailment gain of £910 million in the same year. Staff costs were £544 million, or 10 per cent higher at £6,166 million in 2011 compared with £5,622 million in 2010. However, excluding the pension curtailment gain in 2010, staff costs were £366 million, or 6 per cent lower at £6,166 million compared with £6,532 million in 2010. Premises and equipment costs were £126 million, or 11 per cent, lower at £1,051 million compared with £1,177 million in 2010. Other expenses, excluding the payment protection insurance provision from 2010, were £244 million, or 6 per cent lower, at £3,593 million in 2011 compared with £3,837 million in 2010. The decrease reflected the £500 million customer goodwill payments provision made in 2010, partly offset by the UK bank levy of £189 million and provision in relation to German insurance business litigation in 2011. Depreciation and amortisation costs were £257 million, or 11 per cent lower at £2,175 million in 2011 compared to £2,432 million in 2010. In 2011 there was a charge of £65 million in relation to the impairment of tangible fixed assets which was £137 million, or 68 per cent lower than the charge of £202 million in 2010.
Impairment losses decreased by £2,858 million, or 26 per cent, to £8,094 million in 2011 compared with £10,952 million in 2010. Impairment losses in respect of loans and advances to customers were £2,707 million, or 25 per cent, lower at £8,020 million compared with £10,727 million in 2010. The lower charges were
18
OPERATING AND FINANCIAL REVIEW AND PROSPECTS
principally due to the continued application of the Group’s prudent risk appetite and strong risk management controls resulting in improved portfolio and new business quality, continued low interest rates, and broadly stable UK property prices, partly offset by weakening UK economic growth and rising unemployment. In Retail there was a higher secured impairment charge, with the increase on 2010 largely reflecting a less certain outlook for house prices, together with a decrease in the unsecured impairment charge, reflecting continued improving new business quality and portfolio trends as a result of the Group’s risk appetite, with a focus on lending to existing customers. In Wholesale there was a decrease in the impairment charge, primarily driven by lower impairment from the corporate real estate and real estate related asset portfolios partly offset by higher impairment on leveraged acquisition finance exposures. The continued low interest rate environment helped to maintain defaults at a reduced level. In Commercial, the impairment charge decreased, reflecting the benefits of the low interest rate environment, which has helped maintain defaults at a lower level. In Wealth and International, impairment charges were also lower. The reduction predominantly reflects lower impairment charges in the Irish portfolio where the rate of impaired loan migration has slowed.
There was no impairment charge in respect of loans and advances to banks in 2011, whereas in 2010 there had been a credit of £13 million following releases in respect of a small number of specific exposures. The impairment charge in respect of debt securities classified as loans and receivables was £8 million, or 14 per cent, lower at £49 million in 2011 compared to £57 million in 2010 and the impairment charge in respect of available-for-sale financial assets was £26 million, or 25 per cent, lower at £80 million in 2011 compared to £106 million in 2010. There was a release of £55 million in respect of other credit provisions in 2011, as a number of commitments have now been drawn down; in 2010 a charge of £75 million resulted from a small number of specific new cases.
The Group’s
share of results of joint ventures and associates was a gain of £31 million in
2011 compared with a net loss of £88 million in 2010.
In 2011, the Group
recorded a tax charge of £36 million compared to a tax credit of £325 million
in 2010. The tax charge of £36 million in 2011 arose on a loss before tax of
£342 million, reflecting the effect on deferred tax of the reduction in the UK
corporation tax rate to 26 per cent with effect from 1 April 2011 and to 25 per
cent with effect from 1 April 2012, offset by the net impact of certain tax
losses where no deferred tax has been recognised and the recognition of other
tax losses that had not previously been recognised.
The Group continues to focus on improving its risk profile and further strengthening its balance sheet, through improving the capital and funding position and making progress on reducing holdings of assets outside of its risk appetite, resulting in a reduction in such assets of £53 billion to £141 billion, against a commitment to decrease these assets to less than £90 billion by the end of 2014. There was a further strengthening of the funding position, with £35 billion of term wholesale funding raised, around £10 billion more than initially targeted. The Group’s new pricing management of savings products and its multi-brand strategy have resulted in customer deposit growth (excluding balances arising from repurchase agreements) of 6 per cent, above market growth. The Group had a particularly strong performance from the Halifax challenger brand as a result of innovative products launched in the year. Deposit growth, progress in funding and the asset reductions facilitated further pay-down of government and central bank facilities from £97 billion at the 2010 year end to £24 billion at the end of 2011 (with nothing outstanding under the UK Special Liquidity Scheme).
The Group’s credit market exposures primarily relate to asset-backed security exposures held in the Wholesale division; on the balance sheet these exposures are classified as loans and receivables, available-for-sale financial assets or trading and other financial assets at fair value through profit or loss depending on the nature of the investment. A detailed analysis of these asset-backed security exposures is provided in note 56 to the consolidated financial statements. The Wholesale division’s total exposure to asset-backed securities has decreased by £19,443 million from £34,724 million at 31 December 2010 to £15,281 million at 31 December 2011 as these investment holdings continue to reduce.
As at 31 December 2011, the Group’s capital ratios had increased with a total capital ratio on a Basel II basis of 15.6 per cent (compared to 14.5 per cent at 31 December 2010); a tier 1 capital ratio of 12.5 per cent (compared to 11.0 per cent at 31 December 2010) and a core tier 1 ratio of 10.8 per cent (compared to 9.6 per cent at 31 December 2010). During 2011 risk-weighted assets had decreased by £54,031 million to £352,341 million at 31 December 2011 compared with £406,372 million at 31 December 2010; this decrease reflected risk-weighted asset reductions across all divisions driven by balance sheet reductions, lower lending balances and stronger management of risk, including a £6,017 million reduction in the Retail division and a £32,398 million reduction in the Wholesale division.
2010 COMPARED WITH 2009
The Group recorded a loss before tax of £2,919 million in 2010 compared to a profit of £1,042 million in 2009 as a result of the £3,200 million payment protection insurance provision (see page 27). The results in 2010 also included a pension curtailment gain of £910 million, largely offset by a customer goodwill payments provision of £500 million (see page 27) and a loss on disposal of businesses of £365 million. The profit in 2009 had included a negative goodwill credit of £11,173 million in relation to the acquisition of HBOS plc by the Group and a fee of £2,500 million paid to the UK Government as part of the agreement for the Group not to enter into the Government Asset Protection Scheme. There were significant post-acquisition impairment losses in respect of the HBOS portfolios in both 2009 and 2010.
Total income decreased by £1,727 million, or 4 per cent, to £44,044 million in 2010 compared to £45,771 million in 2009; with a £3,520 million, or 39 per cent, increase in the Group’s net interest income only partly offsetting a £5,247million, or 14 per cent, decrease in other income.
Net interest income was £3,520 million, or 39 per cent, higher at £12,546 million in 2010 compared to £9,026 million in 2009. Net interest income was increased as the benefit of higher asset pricing more than offset the impact of lower deposit margins. The Group’s net interest margin increased by 61 basis points to 1.69 per cent in 2010 compared to 1.08 per cent in 2009 with increases in Retail, where margins improved as a result of improved asset pricing and decreases in the LIBOR to base rate spread, in Wholesale, again as a result of higher asset pricing to reflect customer risk, and in Commercial. There was, however, a reduced margin in Wealth and International as a result of lower base rates, a very competitive deposit environment and the impact of impaired lending balances.
Other income was £5,247 million, or 14 per cent, lower at £31,498 million in 2010 compared to £36,745 million in 2009. Fee and commission income was £264 million, or 6 per cent, higher at £4,992 million in 2010 compared to £4,728 million in 2009. Fee and commission expense was £165 million, or 11 per cent, higher at £1,682 million in 2010 compared to £1,517 million in 2009. Net trading income was £3,374 million lower at £15,724 million in 2010 compared to £19,098 million in 2009; this included a reduction of £2,551 million in gains on policyholder investments held in the Group’s insurance businesses (although this was largely offset by a decrease in the related claims expense, see below) as a result of relative market conditions over 2010, compared to 2009; in addition, a loss of £620 million, which was £193 million, or 45 per cent, higher than the loss of £427 million in 2009, arose from the change in fair value of the embedded equity conversion feature contained in the Enhanced Capital Notes issued by the Group in 2009. During 2010 the Group exchanged certain existing subordinated debt securities for new securities, these exchanges resulted in a gain on extinguishment of the existing liabilities of £423 million, being the difference between the carrying amount of the securities extinguished and the fair value of the new securities together with related fees and costs; this was £1,075 million, or 72 per cent, lower than the gains of £1,498 million realised on similar transactions in 2009.
Insurance claims were £3,405 million lower at an expense of £19,088 million in 2010 compared to £22,493 million in 2009. The insurance claims expense in respect of life and pensions business was £3,310 million, or 15 per cent, lower at £18,549 million in 2010 compared to £21,859 million in
19
OPERATING AND FINANCIAL REVIEW AND PROSPECTS
2009 as a result of the relative returns on policyholder investments in the long-term insurance business; this movement in claims was broadly matched by a decrease in net trading income reflecting the gains on those policyholder investments. Insurance claims in respect of general insurance business were £95 million, or 15 per cent, lower at £539 million in 2010 compared to £634 million in 2009, this was due primarily to lower payment protection insurance claims related to unemployment.
Operating expenses increased by £486 million, or 3 per cent, to £16,470 million in 2010 compared to £15,984 million in 2009, this increase principally reflected the £3,200 million payment protection insurance provision in 2010, more than offsetting the impact of the non-repetition of the £2,500 million fee paid to the UK Government in 2009 as part of the agreement for the Group not to enter into the Government Asset Protection Scheme. A pension curtailment gain of £910 million in 2010 was offset by a £557 million increase in integration costs and a £500 million customer goodwill payments provision. Staff costs were £1,053 million, or 16 per cent, lower at £5,622 million in 2010 compared to £6,675 million in 2009. Excluding the pension curtailment gain of £910 million in 2010, staff costs were £143 million, or 2 per cent, lower at £6,532 million in 2010 compared to £6,675 million in 2009, as decreased salary costs, reflecting head count reductions, and lower levels of staff restructuring costs were partly offset by increases in other staff costs (reflecting greater use of agency staff in relation to the integration programme). Premises and equipment costs were £21 million, or 2 per cent, higher at £1,177 million in 2010 compared to £1,156 million in 2009. Other expenses, including the payment protection insurance provision, were £4,184 million higher at £7,037 million in 2010 compared to £2,853 million in 2009. This increase reflected the £3,200 million payment protection insurance provision and the £500 million customer goodwill payments provision, both in 2010, and increased communication costs and professional fees in relation to the ongoing integration of the Lloyds TSB and HBOS businesses. Depreciation and amortisation costs were £128 million lower at £2,432 million in 2010 compared to £2,560 million in 2009. In 2010 there was a charge of £202 million in respect of the impairment of tangible fixed assets; and in 2009 there was a charge of £240 million in respect of the impairment of goodwill attributable to the Group’s asset finance business.
Impairment losses decreased by £5,721 million, or 34 per cent, to £10,952 million in 2010 compared to £16,673 million in 2009. Impairment losses in respect of loans and advances to customers were £5,056 million, or 32 per cent, lower at £10,727 million in 2010 compared to £15,783 million in 2009. This reflected improved credit experience in the Retail, Wholesale and Commercial divisions as a result of the improving economic environment in the UK and the US; partly offset by increased charges in the International business, especially in Ireland and Australia. The Group’s ‘through the cycle’ credit policies and procedures, which focus on the development of enduring client relationships, had resulted in higher quality new business being originated across the UK and very little new origination took place outside the UK. The Group’s level of impairment is being managed in the current challenging economic environment by the Wholesale business support units, also covering Commercial and Retail collection and recovery units. The business support model has been expanded from Wholesale across Wealth and International division, with a central team established to manage the Group’s business support activity globally. The Group had also strengthened resources within Retail collections and recoveries to enable more timely engagement with customers experiencing difficulties to drive more effective customer outcomes.
The Group’s share of results of joint ventures and associates was a net loss of £88 million in 2010 compared to a net loss of £752 million in 2009; partly due to reduced losses in the joint venture vehicles and partly reflecting the fact that many of the investments are now substantially written-off.
On 16 January 2009, the Group had acquired 100 per cent of the ordinary share capital of HBOS plc. As the fair value of the identifiable net assets acquired was greater than the total consideration paid, negative goodwill of £11,173 million arose on the acquisition. The negative goodwill was recognised as a ‘Gain on acquisition’ in the income statement for the year ended 31 December 2009. There was no such credit in 2010.
In 2010, the Group incurred a loss on disposal of businesses of £365 million (2009: nil). During 2009, the Group had acquired an oil drilling rig construction business through a previous lending relationship and, in the second half of 2010, the Group reached agreement to dispose of its interests in the two wholly-owned subsidiary companies through which this business operates.
In 2010, the Group recorded a tax credit of £325 million compared to a tax credit of £1,911 million in 2009. The tax credit of £325 million in 2010 arose on a loss before tax of £2,919 million, an effective tax rate of 11 per cent compared to the standard UK corporation tax rate of 28 per cent. This lower rate reflected losses where no deferred tax was recognised together with the impact of the tax charge attributable to UK life insurance policyholders and the Group’s interests in Open Ended Investment Companies (OEICs), which is required to be included within the income tax charge, and a charge resulting from the change in the UK corporation tax rate being largely offset by overseas tax rate differences and other adjustments.
Total assets were £34,817 million lower at £992,438 million at 31 December 2010 compared to £1,027,255 million at 31 December 2009; loans and advances to customers were £34,372 million, or 5 per cent, lower at £592,597 million at 31 December 2010 compared to £626,969 million at 31 December 2009; and customer deposits were £13,108 million, or 3 per cent, lower at £393,633 million at 31 December 2010 compared to £406,741 million at 31 December 2009; total assets had reduced as the Group continued its strategy to reduce assets associated with non-relationship lending and investments, including business which is outside the Group’s current risk appetite. The reduction in total assets was substantially driven by reductions in portfolios of lending which are outside of the Group’s risk appetite across the three banking divisions, continued customer deleveraging and de-risking and subdued demand in lending markets.
The Wholesale division’s total exposure to asset-backed securities decreased by £8,139 million from £42,863 million at 31 December 2009 to £34,724 million at 31 December 2010 as these investments continued to run-off.
Mortgage-backed security exposures were £2,562 million lower at £15,656 million at 31 December 2010 compared to £18,218 million at 31 December 2009. Exposures to Alt-A US residential mortgage-backed securities were £267 million lower at £3,700 million at 31 December 2010 compared to £3,967 million at 31 December 2009; there is no exposure to sub-prime US residential mortgage-backed securities.
Exposures where reliance is placed on monoline insurers were limited to a total of £254 million at 31 December 2010 (31 December 2009: £444 million); all of the exposure at 31 December 2010 was rated AA.
At the end of December 2010, the Group’s capital ratios had increased with a total capital ratio on a Basel II basis of 14.5 per cent (compared to 12.4 per cent at 31 December 2009), a tier 1 ratio of 11.0 per cent (compared to 9.6 per cent at 31 December 2009) and a core tier 1 ratio of 9.6 per cent (compared to 8.1 per cent at 31 December 2009). During 2010, risk-weighted assets had decreased by £86,935 million to £406,372 million at 31 December 2010 compared to £493,307 million at 31 December 2009; this decrease reflected balance sheet reductions across all banking divisions, a revised assessment of the Retail division’s secured lending risk-weighted assets following improvements in the economic outlook and changes introduced as a result of continuing the process of integrating the Lloyds TSB and HBOS regulatory capital approaches which had impacted particularly on the Wholesale division.
20
OPERATING AND FINANCIAL REVIEW AND PROSPECTS
NET INTEREST INCOME
|
|
|
|
|
|
|
|
|
|
|
|
|
|
|
2011 |
|
20101 |
|
20091 |
|
|||
|
Net interest income £m |
|
|
12,698 |
|
|
12,546 |
|
|
9,026 |
|
|
Average interest-earning assets £m |
|
|
736,032 |
|
|
741,883 |
|
|
833,503 |
|
|
Average rates: |
|
|
|
|
|
|
|
|
|
|
|
– Gross yield on interest-earning assets%2 |
|
|
3.58 |
|
|
3.95 |
|
|
3.39 |
|
|
– Interest spread%3 |
|
|
1.62 |
|
|
1.64 |
|
|
1.05 |
|
|
– Net interest margin%4 |
|
|
1.73 |
|
|
1.69 |
|
|
1.08 |
|
|
|
|
|
1 |
During 2011 the Group has revised its treatment of offset accounts; average balances for 2010 and 2009 have been restated accordingly. |
|
|
|
|
2 |
Gross yield is the rate of interest earned on average interest-earning assets. |
|
|
|
|
3 |
Interest spread is the difference between the rate of interest earned on average interest-earning assets and the rate of interest paid on average interest-bearing liabilities. |
|
|
|
|
4 |
The net interest margin represents the interest spread together with the contribution of interest-free liabilities. It is calculated by expressing net interest income as a percentage of average interest-earning assets. |
2011 COMPARED WITH 2010
Net interest income was £12,698 million in 2011; an increase of £152 million, or 1 per cent compared to £12,546 million in 2010. There was a credit of £696 million in 2011 arising from liability management gains (see below) and a benefit of £1,117 million from a reduction in the amounts payable to unitholders in those Open-Ended Investment Companies included in the consolidated results of the Group. However, there were decreases within the Retail division, as a result of higher wholesale funding costs which were not matched by average customer rates, and previous de-risking of the lending portfolio resulting in reduced secured lending balances; and in the Wholesale division reflecting lower interest-earning asset balances and higher funding costs partly offset by improved margins on deposit products.
Average interest-earning assets were £5,851 million, or 1 per cent, lower at £736,032 million in 2011 compared to £741,883 million in 2010. This reduction reflected the run-off of assets which were outside of the Group’s risk appetite from the Group’s balance sheet and subdued lending demand.
Average interest-earning assets in Retail were £10,963 million, or 3 per cent, lower at £362,145 million in 2011 compared to £373,108 million in 2010. Average personal mortgage balances were £7,235 million, or 2 per cent, lower at £335,496 million in 2011 compared with £342,731 million in 2010; Retail’s new mortgage lending continued to be focused on home purchase with 70 per cent of lending being for house purchase rather than re-mortgaging. Average other personal lending balances were £3,728 million, or 12 per cent, lower at £26,649 million in 2011 compared with £30,377 million in 2010 as a result of customers continuing to reduce their personal indebtedness, particularly in unsecured lending.
Average interest-earning assets across the rest of the Group were £5,112 million, or 1 per cent, higher at £373,887 million in 2011 compared to £368,775 million in 2010. Relationship lending and similar average interest-earning assets in Wholesale were £24,787 million, or 16 per cent, lower at £130,209 million in 2011 compared to £154,996 million in 2010, as demand for new corporate lending and refinancing of existing facilities was more than offset by maturities, reflecting a continued trend of subdued corporate demand for lending and customer deleveraging. Balances in Wealth and International were £4,959 million, or 7 per cent, lower at £63,279 million in 2011 compared to £68,238 million in 2010. Average interest-earning assets in Commercial were £241 million, or 1 per cent, higher at £29,753 million in 2011 compared to £29,512 million in 2010. The remainder of the Group’s average interest-earning assets, which include certain non-relationship and treasury-related balances in the Wholesale division and the bank deposits held in the insurance business, were £34,617 million, or 30 per cent, higher at £150,646 million in 2011 compared to £116,029 million in 2010.
The Group’s net interest margin increased by 4 basis points to 1.73 per cent in 2011 compared to 1.69 per cent in 2010. However, net interest income in 2011 included £696 million in relation to the revision in the carrying values of certain debt securities. During December 2011, the Group completed the exchange of certain subordinated debt securities issued by Lloyds TSB Bank plc and HBOS plc for new subordinated debt securities issued by Lloyds TSB Bank plc by undertaking an exchange offer on certain securities which were eligible for call before 31 December 2012. As part of the exchange, the Group announced that all decisions to exercise calls on those original securities that remained outstanding following the exchange offer would be made with reference to the prevailing regulatory, economic and market conditions at the time. These securities will not, therefore, be called at their first available call date which will lead to coupons continuing to be paid until possibly the final redemption date of the securities. Consequently, the Group is required to adjust the carrying amount of these securities to reflect the revised estimated cash flows over their revised life and to recognise this change in carrying value in interest expense. Included within net interest income is a credit of £570 million in respect of the securities that remained outstanding following the exchange offer. In December 2011, the Group decided to defer payment of non-mandatory coupons on certain securities and, instead, settle them using an Alternative Coupon Satisfaction Mechanism (ACSM) on their contractual terms. This change in expected cashflows resulted in a gain of £126 million in net interest income from the recalculation of the carrying value of these securities. Excluding these amounts net interest income was £544 million, or 4 per cent, lower at £12,002 million in 2011 compared to £12,546 million in 2010 and the net interest margin was 6 basis points lower at 1.63 per cent in 2011 compared to 1.69 per cent in 2010. An increase in margin in Commercial was more than offset by reduced margins in Retail, Wholesale and Wealth and International. Margins in Commercial improved as a result of an increase in deposit balances, a consequently larger funding surplus and a more favourable deposit mix. In Retail margins decreased due to muted demand for credit and previous de-risking of the lending portfolios with a resulting reduction in unsecured balances. In Wholesale margins decreased slightly with the impact of higher funding costs almost fully offset by re-pricing activity and increased deposit margins and values. Margins in Wealth and International decreased reflecting the increased strains of lost earnings on higher impaired asset balances and higher funding costs although this was largely offset by stronger deposit margins in the Wealth businesses and higher deposit balances and margins in the Group’s International on-line deposit business.
21
OPERATING AND FINANCIAL REVIEW AND PROSPECTS
2010 COMPARED WITH 2009
Net interest income was £3,520 million, or 39 per cent, higher at £12,546 million in 2010 compared to £9,026 million in 2009. Interest and similar income was £1,102 million, or 4 per cent, higher at £29,340 million in 2010 compared to £28,238 million in 2009; and interest and similar expense was £2,418 million, or 13 per cent, lower at £16,794 million in 2010 compared to £19,212 million in 2009. In the Retail division, this reflected higher asset pricing (partly due to mortgage customers moving onto and staying on standard variable rates and lending being priced to more appropriately reflect risk and rising funding costs), in part offset by the impact on interest expense of lower LIBOR to base rate spreads although there had been a reduction in the more expensive deposit balances. In the Wholesale division, lending was also being re-priced to reflect customer risk profiles resulting in higher customer margins on new business and from re-pricing on renewals. Across the Group, there had been some increase in funding costs as a result of the Group’s improved funding profile but there had been a benefit from a £723 million reduction in the amounts payable to unit holders in those Open-Ended Investment Companies included in the consolidated results of the Group (although, since these are policyholder items, there was no impact on profit attributable to shareholders).
Average interest-earning assets were £91,620 million, or 11 per cent, lower at £741,883 million in 2010 compared to £833,503 million in 2009. This reduction reflected the successful removal of assets which were outside of the Group’s risk appetite from the Group’s balance sheet.
Average interest-earning assets in Retail were £11,175 million, or 3 per cent, lower at £373,108 million in 2010 compared to £384,283 million in 2009. Average personal mortgage balances were £7,141 million, or 2 per cent, lower at £342,731 million in 2010 compared to £349,872 million in 2009, in part reflecting a slight reduction in demand in the UK mortgage market in 2010; Retail had continued to focus on supporting the housing market with 70 per cent of new lending being for house purchases rather than re-mortgages. Average other personal lending balances were £4,034 million, or 12 per cent, lower at £30,377 million in 2010 compared to £34,411 million in 2009 as a result of reduced customer demand for credit and customers continuing to reduce their personal indebtedness, with reductions in both unsecured loan and credit card balances.
Average interest-earning assets across the rest of the Group were £80,445 million, or 18 per cent, lower at £368,775 million in 2010 compared to £449,220 million in 2009. Relationship lending and similar average interest-earning assets in Wholesale were £19,621 million, or 11 per cent, lower at £154,996 million in 2010 compared to £174,617 million in 2009 as demand for new corporate lending and refinancing of existing facilities was more than offset by the level of maturities, reflecting a continuing trend of subdued corporate lending and customer deleveraging. Such balances in Wealth and International were £645 million, or 1 per cent, lower at £68,238 million in 2010 compared to £68,883 million in 2009. Average interest-earning assets in Commercial were £920 million, or 3 per cent, lower at £29,512 million in 2010 compared to £30,432 million in 2009. The remainder of the Group’s average interest-earning assets, which include certain non-relationship and treasury-related balances in the Wholesale division and the bank deposits held in the insurance businesses, were £59,259 million, or 34 per cent, lower at £116,029 million in 2010 compared to £175,288 million in 2009; this reflected planned balance sheet reductions.
The Group’s net interest margin increased by 61 basis points to 1.69 per cent in 2010 compared to 1.08 per cent in 2009 with increases in Retail, Wholesale and Commercial only partly offset by reduced margins in the Wealth and International business. Margins in Retail improved as a result of improved asset pricing and decreases in the LIBOR to base rate spread. In Wholesale margins were also improved, again as result of higher asset pricing to reflect customer risk. Declining margins in Wealth and International reflected reduced base rates, a very competitive deposit environment and the impact of impaired lending balances.
22
OPERATING AND FINANCIAL REVIEW AND PROSPECTS
|
|
|
|
|
|
|
|
|
|
|
|
|
|
|
OTHER INCOME |
|
|
|
|
|
|
|
|
|
|
|
|
|
|
|
|
2011 |
|
|
|
2010 |
|
|
|
2009 |
|
|
|
|
|
£m |
|
|
|
£m |
|
|
|
£m |
|
|
Fee and commission income: |
|
|
|
|
|
|
|
|
|
|
|
|
|
– Current account fees |
|
|
1,053 |
|
|
|
1,086 |
|
|
|
1,088 |
|
|
– Credit and debit card fees |
|
|
877 |
|
|
|
812 |
|
|
|
765 |
|
|
– Other1 |
|
|
3,005 |
|
|
|
3,094 |
|
|
|
2,875 |
|
|
|
|
|
4,935 |
|
|
|
4,992 |
|
|
|
4,728 |
|
|
Fee and commission expense |
|
|
(1,391 |
) |
|
|
(1,682 |
) |
|
|
(1,517 |
) |
|
Net fee and commission income |
|
|
3,544 |
|
|
|
3,310 |
|
|
|
3,211 |
|
|
Net trading income |
|
|
(368 |
) |
|
|
15,724 |
|
|
|
19,098 |
|
|
Insurance premium income |
|
|
8,170 |
|
|
|
8,148 |
|
|
|
8,946 |
|
|
Liability management gains |
|
|
599 |
|
|
|
423 |
|
|
|
1,498 |
|
|
Other |
|
|
2,169 |
|
|
|
3,893 |
|
|
|
3,992 |
|
|
Other operating income |
|
|
2,768 |
|
|
|
4,316 |
|
|
|
5,490 |
|
|
Total other income |
|
|
14,114 |
|
|
|
31,498 |
|
|
|
36,745 |
|
|
|
|
|
1 |
In previous years the Group has included annual management charges on non-participating investment contracts within insurance claims. In light of developing practice, these amounts (2011: £606 million; 2010: £577 million; 2009: £474 million) are now included within net fee and commission income. |
2011 COMPARED WITH 2010
Other income was £17,384 million, or 55 per cent, lower at £14,114 million in 2011 compared to £31,498 million in 2010, as a result of the factors discussed below.
Fee and commission income was little changed at £4,935 million in 2011 compared with £4,992 million at 2010; a reduction of £57 million or 1 per cent. Current account fees were £33 million, or 3 per cent, lower at £1,053 million in 2011 compared to £1,086 million in 2010, following a restructuring of the customer tariff. An increase of £65 million, or 8 per cent, in credit and debit card fees from £812 million in 2010 to £877 million in 2011 resulted from increased customer activity, particularly over the internet. Other fees and commissions were £89 million, or 3 per cent, lower at £3,005 million in 2011 compared with £3,094 million in 2010.
Fee and commission expense was £291 million, or 17 per cent, lower at £1,391 million in 2011 compared to £1,682 million in 2010.
Net trading income was £16,092 million lower at a deficit of £368 million in 2011 compared with a surplus of £15,724 million in 2010. Net trading income within the insurance businesses was a deficit of £518 million in 2011 compared to a surplus of £13,749 million in 2010, which reflected the market performance in 2011, however this decrease along with the increase in long-term insurance premium income were largely offset by the overall decrease in insurance claims expense. A loss of £5 million in 2011, compared with a loss in 2010 of £620 million, arose from the change in fair value of the embedded equity conversion feature contained in the Enhanced Capital Notes issued by the Group. Net trading income within the Group’s banking activities was £2,440 million, or 94 per cent lower at £155 million in 2011 compared with £2,595 million in 2010. This decrease in the banking business reflected poor trading conditions and, in particular a total charge of £718 million for derivative valuation adjustments, compared to £42 million in 2010.
Insurance premium income was largely unchanged at £8,170 million in 2011 compared with £8,148 million in 2010; an increase of £22 million. Earned premiums in respect of the Group’s long-term life and pensions business were £181 million, or 3 per cent, higher at £6,954 million in 2011 compared to £6,773 million in 2010. General insurance earned premiums were £159 million, or 12 per cent, lower at £1,216 million in 2011 compared with £1,375 million in 2010.
During December 2011 the Group completed the exchange of certain existing subordinated debt securities issued by Lloyds TSB Bank plc and HBOS plc for new subordinated debt securities issued by Lloyds TSB Bank plc by undertaking an exchange offer on certain securities which were eligible for call before 31 December 2012. This exchange resulted in a gain on extinguishment of the existing securities of £599 million, compared with £423 million in 2010, being the difference between the carrying value of the securities extinguished and the fair value of the new securities issued together with related fees and costs.
Other operating income, excluding the liability management gains, was £1,724 million, or 44 per cent, lower at £2,169 million in 2011 compared with £3,893 million in 2010; this was mainly driven by a significant decline in the movement in value of in-force business from a profit of £789 million in 2010 to a loss of £622 million in 2011, particularly reflecting non-economic assumption changes and economic variance (see note 30 to the financial statements), along with lower levels of operating lease rentals receivable and lower gains on disposal of available-for-sale financial assets.
23
OPERATING AND FINANCIAL REVIEW AND PROSPECTS
2010 COMPARED WITH 2009
Other income was £5,247 million lower at £31,498 million in 2010 compared to £36,745 million in 2009, as a result of the factors discussed below.
Fee and commission income was £264 million, or 6 per cent, higher at £4,992 million in 2010 compared to £4,728 million in 2009. Current account fees were little changed at £1,086 million in 2010 compared to £1,088 million in 2009 but credit and debit card fees were £47 million, or 6 per cent, higher at £812 million in 2010 compared to £765 million in 2009. Other fee and commission income was £219 million, or 8 per cent, higher at £3,094 million in 2010 compared to £2,875 million in 2009.
Fee and commission expense was £165 million, or 11 per cent, higher at £1,682 million in 2010 compared to £1,517 million in 2009. There had been increases in fees payable related to added-value account packages and higher levels of card fees payable, as well as increased levels of fees payable in respect of the Group’s fund management activities.
Net trading income was £3,374 million lower at £15,724 million in 2010 compared to £19,098 million in 2009. Net trading income within the insurance businesses was £2,551 million, or 16 per cent, lower at £13,749 million in 2010 compared to £16,300 million in 2009 which reflected a more subdued market performance in 2010 (equity market values increased by 9 per cent in 2010 compared to 22 per cent in 2009) although this decrease and the reduction in long-term insurance premium income were largely offset by the decrease in the insurance claims expense. A loss of £620 million, which was £193 million, or 45 per cent, higher than the loss of £427 million in 2009, arose from the change in fair value of the embedded equity conversion feature contained in the Enhanced Capital Notes issued by the Group in 2009. Net trading income within the Group’s banking activities was £630 million, or 20 per cent, lower at £2,595 million in 2010 compared to £3,225 million in 2009 as the Group continued to reduce activities outside of its risk appetite.
Insurance premium income was £798 million, or 9 per cent, lower at £8,148 million in 2010 compared to £8,946 million in 2009. Earned premiums in respect of the Group’s long-term life and pensions business were £687 million, or 9 per cent lower, at £6,773 million in 2010 compared to £7,460 million in 2009, this reflected reduced new business sales, mainly as a result of the withdrawal, during 2009, of certain HBOS legacy products with lower returns. General insurance earned premiums were £111 million lower at £1,375 million in 2010 compared to £1,486 million in 2009; this primarily reflected the Group’s withdrawal from the payment protection insurance market in July 2010.
During 2009 and 2010, as part of the Group’s management of capital, the Group exchanged certain existing subordinated debt securities for new subordinated debt securities and ordinary shares. These exchanges resulted in a gain on extinguishment of the existing liabilities of £423 million (2009: £1,498 million), being the difference between the carrying value of the securities extinguished and the fair value of the new securities issued together with related fees and costs. On 18 February 2010, as part of the Group’s recapitalisation and exit from its proposed participation in the Government Asset Protection Scheme, Lloyds Banking Group plc issued 3,141 million ordinary shares in exchange for certain existing preference shares and preferred securities. This exchange resulted in a gain of £85 million. During March 2010 the Group entered into a bilateral exchange, under which certain Enhanced Capital Notes denominated in Japanese Yen were exchanged for an issue of new Enhanced Capital Notes denominated in US Dollars; the securities subject to the exchange were cancelled and a profit of £20 million arose. In addition, during May and June 2010 the Group completed the exchange of a number of outstanding capital securities issued by Lloyds Banking Group plc and certain of its subsidiaries for ordinary shares in Lloyds Banking Group plc. The securities subject to exchange were cancelled, generating a total profit of £318 million for the Group.
Other operating income, excluding the gains on capital transactions, was £99 million lower at £3,893 million in 2010 compared to £3,992 million in 2009; increased gains on disposal of available-for-sale financial assets were more than offset by lower levels of operating lease rentals receivable and a reduction in the income arising from the movement in value of in-force business.
24
OPERATING AND FINANCIAL REVIEW AND PROSPECTS
|
|
|
|
|
|
|
|
|
|
|
|
|
|
|
|
|
|
OPERATING EXPENSES |
|
|
|
|
|
|
|
|
|
|
|
|
|
|
|
|
|
|
|
2011 |
|
|
|
|
2010 |
1 |
|
|
|
2009 |
|
|
|
|
|
|
£m |
|
|
|
|
£m |
|
|
|
|
£m |
|
|
|
Administrative expenses: |
|
|
|
|
|
|
|
|
|
|
|
|
|
|
|
|
Staff: |
|
|
|
|
|
|
|
|
|
|
|
|
|
|
|
|
– Salaries |
|
|
3,784 |
|
|
|
|
3,787 |
|
|
|
|
3,902 |
|
|
|
– Performance-based compensation |
|
|
361 |
|
|
|
|
533 |
|
|
|
|
491 |
|
|
|
– Social security costs |
|
|
432 |
|
|
|
|
396 |
|
|
|
|
383 |
|
|
|
– Pensions and other post-retirement benefit schemes: |
|
|
|
|
|
|
|
|
|
|
|
|
|
|
|
|
Curtailment gain |
|
|
— |
|
|
|
|
(910 |
) |
|
|
|
— |
|
|
|
Other |
|
|
401 |
|
|
|
|
628 |
|
|
|
|
744 |
|
|
|
|
|
|
401 |
|
|
|
|
(282 |
) |
|
|
|
744 |
|
|
|
– Restructuring costs |
|
|
124 |
|
|
|
|
119 |
|
|
|
|
412 |
|
|
|
– Other staff costs |
|
|
1,064 |
|
|
|
|
1,069 |
|
|
|
|
743 |
|
|
|
|
|
|
6,166 |
|
|
|
|
5,622 |
|
|
|
|
6,675 |
|
|
|
Premises and equipment: |
|
|
|
|
|
|
|
|
|
|
|
|
|
|
|
|
– Rent and rates |
|
|
547 |
|
|
|
|
602 |
|
|
|
|
569 |
|
|
|
– Hire of equipment |
|
|
22 |
|
|
|
|
18 |
|
|
|
|
20 |
|
|
|
– Repairs and maintenance |
|
|
188 |
|
|
|
|
199 |
|
|
|
|
226 |
|
|
|
– Other |
|
|
294 |
|
|
|
|
358 |
|
|
|
|
341 |
|
|
|
|
|
|
1,051 |
|
|
|
|
1,177 |
|
|
|
|
1,156 |
|
|
|
Other expenses: |
|
|
|
|
|
|
|
|
|
|
|
|
|
|
|
|
– Communications and data processing |
|
|
954 |
|
|
|
|
1,126 |
|
|
|
|
668 |
|
|
|
– Advertising and promotion |
|
|
398 |
|
|
|
|
362 |
|
|
|
|
335 |
|
|
|
– Professional fees |
|
|
576 |
|
|
|
|
742 |
|
|
|
|
540 |
|
|
|
– Customer goodwill payments provision |
|
|
— |
|
|
|
|
500 |
|
|
|
|
— |
|
|
|
– Financial services compensation scheme levies |
|
|
179 |
|
|
|
|
46 |
|
|
|
|
73 |
|
|
|
– UK bank levy |
|
|
189 |
|
|
|
|
— |
|
|
|
|
— |
|
|
|
– Provision in relation to German insurance business litigation |
|
|
175 |
|
|
|
|
— |
|
|
|
|
— |
|
|
|
– Other |
|
|
1,122 |
|
|
|
|
1,061 |
|
|
|
|
1,237 |
|
|
|
|
|
|
3,593 |
|
|
|
|
3,837 |
|
|
|
|
2,853 |
|
|
|
Depreciation and amortisation: |
|
|
|
|
|
|
|
|
|
|
|
|
|
|
|
|
– Depreciation of tangible fixed assets |
|
|
1,434 |
|
|
|
|
1,635 |
|
|
|
|
1,716 |
|
|
|
– Amortisation of acquired value of in-force non-participating investment contracts |
|
|
78 |
|
|
|
|
76 |
|
|
|
|
75 |
|
|
|
– Amortisation of other intangible assets |
|
|
663 |
|
|
|
|
721 |
|
|
|
|
769 |
|
|
|
|
|
|
2,175 |
|
|
|
|
2,432 |
|
|
|
|
2,560 |
|
|
|
Impairment of tangible fixed assets2 |
|
|
65 |
|
|
|
|
202 |
|
|
|
|
— |
|
|
|
Goodwill impairment |
|
|
— |
|
|
|
|
— |
|
|
|
|
240 |
|
|
|
Total operating expenses, excluding payment protection insurance provision and Government Asset Protection Scheme fee |
|
|
13,050 |
|
|
|
|
13,270 |
|
|
|
|
13,484 |
|
|
|
Payment protection insurance provision |
|
|
— |
|
|
|
|
3,200 |
|
|
|
|
— |
|
|
|
Government Asset Protection Scheme fee |
|
|
— |
|
|
|
|
— |
|
|
|
|
2,500 |
|
|
|
Total operating expenses |
|
|
13,050 |
|
|
|
|
16,470 |
|
|
|
|
15,984 |
|
|
|
Cost:income ratio (%)3 |
|
|
62.8 |
|
|
|
|
66.0 |
|
|
|
|
68.7 |
|
|
|
|
|
|
1 |
During 2011, the Group has reviewed the analysis of certain cost items and as a result has reclassified some items of expenditure; comparatives for 2010 have been restated accordingly. |
|
|
|
|
2 |
£65 million (2010: £52 million; 2009: nil) of the impairment of tangible fixed assets relates to integration activities. |
|
|
|
|
3 |
Total operating expenses divided by total income, net of insurance claims. |
25
OPERATING AND FINANCIAL REVIEW AND PROSPECTS
2011 COMPARED WITH 2010
Operating expenses decreased by £3,420 million, or 21 per cent, to £13,050 million in 2011 compared with £16,470 million in 2010. This decrease principally reflected the £3,200 million payment protection insurance provision made in 2010.
Staff costs were £544 million, or 10 per cent, higher in 2011 at £6,166 million compared to £5,622 million in 2010. However, excluding the net pension curtailment gain of £910 million in 2010, staff costs were actually lower by £366 million, a decrease of 6 per cent from £6,532 million in 2010. Salaries were largely unchanged at £3,784 million in 2011 compared with £3,787 million in 2010 as the impact of annual pay rises, and some enhancement of benefits following the harmonisation of terms and conditions across the Group, was offset by staff reductions. Pensions costs, excluding the curtailment gain in 2010, were £227 million, or 36 per cent, lower at £401 million in 2011 compared to £628 million in 2010, principally as a result of increased asset levels in the defined benefit schemes at the end of 2010 leading to a higher expected return. Staff bonuses were £172 million, or 32 per cent, lower at £361 million in 2011 compared with £533 million in 2010. variable pay is reflective of the performance of the business and total discretionary bonus awards are approximately 30 per cent lower than last year with bonuses above £2,000 subject to deferral and adjustment. Social security costs were £36 million, or 9 per cent, higher at £432 million in 2011 compared with £396 million in 2010 in part due to an increase in the percentage payable. Staff restructuring costs at £124 million in 2011 compared with £119 million in 2010, and other staff costs, at £1,064 million in 2011 compared with £1,069 million remained largely unchanged.
Premises and equipment costs were £126 million, or 11 per cent, lower at £1,051 million in 2011 compared to £1,177 million in 2010. Rent and rates was £55 million, or 9 per cent, lower at £547 million in 2011 compared to £602 million in 2010, mainly as a result of the closure of operations in Ireland; and other premises and equipment costs decreased by £64 million or 18 per cent, in part due to profits on disposal of operating lease assets and other equipment.
Other expenses (excluding the payment protection insurance provision charge of £3,200 million from 2010) were £244 million, or 6 per cent, lower at £3,593 million in 2011 compared with £3,837 million in 2010. Other expenses in 2010 included a charge of £500 million in respect of the customer goodwill payments provision, which was not repeated in 2011; and in 2011 there was a charge of £175 million in respect of German insurance business litigation, £189 million for the UK bank levy and a total of £179 million for Financial Services Compensation Scheme levies compared to only £46 million in 2010. Excluding these items, other expenses in 2011 were £241 million, or 7 per cent, lower at £3,050 million compared to £3,291 million in 2010. Communications and data processing costs were £172 million, or 15 per cent, lower at £954 million in 2011 compared with £1,126 million in 2010 as a result of increased amounts of software expenditure being suitable for capitalisation as the integration programme has progressed. Professional fees were £166 million, or 22 per cent, lower at £576 million in 2011 compared with £742 million in 2010 following reduced expenditure within the integration programme and on a number of specific projects.
Depreciation and amortisation costs were £257 million, or 11 per cent, lower at £2,175 million in 2011 compared with £2,432 million in 2010. This reflects reductions in the operating lease asset portfolio, certain tranches of equipment now being fully depreciated and some reduction in the charge for the amortisation of acquisition intangibles.
A charge of £65 million arose in respect of impairment of tangible fixed assets, all of which related to integration activities; in 2010, £52 million of the total charge of £202 million related to integration activities with the remainder related to impairment of assets held by an oil drilling rig business.
26
OPERATING AND FINANCIAL REVIEW AND PROSPECTS
2010 COMPARED WITH 2009
Operating expenses increased by £486 million, or 3 per cent, to £16,470 million in 2010 compared to £15,984 million in 2009. This increase principally reflected the £3,200 million payment protection insurance provision in 2010, which more than offset the non-repetition of the £2,500 million fee paid in 2009 to the UK Government as part of the agreement for the Group not to enter into the Government Asset Protection Scheme.
Staff costs were £1,053 million, or 16 per cent, lower at £5,622 million in 2010 compared to £6,675 million in 2009. Staff costs in 2010 were reduced by a curtailment gain related to the Group’s pension schemes. Following changes by the Group to the terms of its UK defined benefit pension schemes, all future increases to pensionable salary will be capped each year at the lower of: Retail Prices Index inflation; each employee’s actual percentage increase in pay; and 2 per cent of pensionable pay. In addition to this, during 2010 there was also a change in commutation factors in certain defined benefit schemes. The combined effect of these changes was a reduction in the Group’s defined benefit obligation of £1,081 million and a reduction in the Group’s unrecognised actuarial losses of £171 million, resulting in a net curtailment gain of £910 million recognised in the income statement in 2010. Excluding the pension curtailment gain of £910 million in 2010, staff costs were £143 million, or 2 per cent, lower at £6,532 million in 2010 compared to £6,675 million in 2009. Salaries were £115 million, or 3 per cent, lower at £3,787 million in 2010 compared to £3,902 million in 2009 as the impact of annual pay rises had been more than offset by staff reductions; performance-based compensation was £42 million, or 9 per cent, higher at £533 million in 2010 compared to £491 million in 2009; pension costs, excluding the curtailment gain, were £116 million, or 16 per cent, lower at £628 million in 2010 compared to £744 million in 2009, principally as a result of increased asset levels in the defined benefit schemes at the end of 2009 which led to a higher expected return; staff restructuring costs were £293 million, or 71 per cent, lower at £119 million in 2010 compared to £412 million in 2009 principally as the significant staff rationalisations as part of the Group integration programme in 2009 were not repeated in 2010; and other staff costs were £324 million, or 44 per cent, higher at £1,069 million in 2010 compared to £743 million in 2009, which largely reflected increased use of agency staff in relation to the integration programme.
Premises and equipment costs were £21 million, or 2 per cent, higher at £1,177 million in 2010 compared to £1,156 million in 2009. Rent and rates were £33 million, or 6 per cent, higher at £602 million in 2010 compared to £569 million in 2009, as a result of rent reviews and integration-related expenditure; and other premises and equipment costs were £17 million, or 5 per cent, higher at £358 million in 2010 compared to £341 million in 2009.
Other expenses were £984 million higher at £3,837 million in 2010 compared to £2,853 million in 2009. These costs in 2010 included a £500 million customer goodwill payments provision. Lloyds Banking Group had been in discussions with the FSA regarding the application of an interest variation clause in certain Bank of Scotland plc variable rate mortgage contracts where the wording in the offer documents received by certain customers had the potential to cause confusion. The relevant mortgages were written between 2004 and 2007 by Bank of Scotland plc under the ‘Halifax’ brand. In February 2011, the Group reached agreement with the FSA in relation to initiating a customer review and contact programme and making goodwill payments to affected customers. In order to make these goodwill payments, Bank of Scotland plc had applied for a voluntary variation of Permission to carry out the customer review and contact programme to bring it within section 404F(7) of the Financial Services and Markets Act 2000 (FSMA).
Excluding the customer goodwill payments provision, other expenses in 2010 were £484 million, or 17 per cent, higher at £3,337 million compared to £2,853 million in 2009. Communications and data processing costs were £458 million, or 69 per cent, higher at £1,126 million in 2010 compared to £668 million in 2009 and professional fees were £202 million, or 37 per cent, higher at £742 million in 2010 compared to £540 million in 2009; in both cases reflecting increased levels of integration-related expenditure.
Depreciation and amortisation costs were £128 million, or 5 per cent, lower at £2,432 million in 2010 compared to £2,560 million in 2009.
A charge of £202 million (2009: nil) arose in respect of the impairment of tangible fixed assets. During 2009, the Group had acquired an oil drilling rig construction business through a previous lending relationship and consolidated the results and net assets of the business from the date that it exercised control; during 2010, as a result of a deteriorating market, the Group impaired the oil drilling rigs under construction held by the business by £150 million to reflect their reduced value in use. A further £52 million impairment charge related to the write-off of certain tangible fixed assets as a result of integration activities.
In 2009, a charge of £240 million had arisen in respect of the impairment of goodwill; there was no impairment charge in respect of goodwill in 2010.
Total operating expenses in 2010 included a £3,200 million payment protection insurance provision. On 8 October 2010, the British Bankers’ Association (BBA), the principal trade association for the UK banking and financial services sector, filed an application for permission to seek judicial review against the FSA and the FOS. The BBA sought an order quashing the FSA Policy Statement and an order quashing the decision of the FOS to determine PPI sales in accordance with the guidance published on its website in November 2008. The Judicial Review was heard in January 2011 and on 20 April 2011 judgment was handed down by the High Court dismissing the BBA’s application. Subsequent to the publication of the judgment, the Group had been in discussions with the FSA with a view to seeking clarity around the detailed implementation of the Policy Statement. As a result, and given the initial analysis that the Group had conducted of compliance with applicable sales standards which was continuing, the Group had concluded that there were certain circumstances where customer contact and/or redress would be appropriate. Accordingly the Group made a provision in its income statement for the year ended 31 December 2010 of £3,200 million in respect of the anticipated costs of such contact and/or redress, including administration expenses.
27
OPERATING AND FINANCIAL REVIEW AND PROSPECTS
|
|
|
|
|
|
|
|
|
|
|
|
|
IMPAIRMENT |
|
|
|
|
|
|
|
|
|
|
|
|
|
|
2011 |
|
|
2010 |
|
|
2009 |
|
|
|
|
|
£m |
|
|
£m |
|
|
£m |
|
|
Impairment losses on loans and receivables: |
|
|
|
|
|
|
|
|
|
|
|
Loans and advances to banks |
|
|
— |
|
|
(13 |
) |
|
(3 |
) |
|
Loans and advances to customers |
|
|
8,020 |
|
|
10,727 |
|
|
15,783 |
|
|
Debt securities classified as loans and receivables |
|
|
49 |
|
|
57 |
|
|
248 |
|
|
Total impairment losses on loans and receivables |
|
|
8,069 |
|
|
10,771 |
|
|
16,028 |
|
|
Impairment of available-for-sale financial assets |
|
|
80 |
|
|
106 |
|
|
602 |
|
|
Other credit risk provisions |
|
|
(55 |
) |
|
75 |
|
|
43 |
|
|
Total impairment charged to the income statement |
|
|
8,094 |
|
|
10,952 |
|
|
16,673 |
|
2011 COMPARED WITH 2010
Impairment losses decreased by £2,858 million, or 26 per cent, to £8,094 million in 2011 compared to £10,952 million in 2010.
The decrease in the Group’s charge was seen across all divisions. These lower charges were principally supported by the continued application of the Group’s prudent risk appetite and strong risk management controls resulting in improved portfolio and new business quality, continued low interest rates, and broadly stable UK property prices, partly offset by weakening UK economic growth and rising unemployment.
The impairment charge in respect of loans and advances to customers was £2,707 million, or 25 per cent, lower at £8,020 million compared to £10,727 million in 2010.
In Retail there was a higher secured impairment charge, with the increase on 2010 largely reflecting a less certain outlook for house prices, and provisioning against existing credit risks which have longer emergence periods due to current low interest rates. These factors were partially offset by an improvement in the quality of the secured portfolio. Secured asset quality remained good and the number of customers entering arrears reduced through 2011 compared to 2010. The stock of properties in repossession remained stable and the sales prices of repossessed properties continued to be at expected values. The proportion of the mortgage portfolio with an indexed loan-to-value of greater than 100 per cent decreased to 12 per cent at 31 December 2011, benefitting from the regional mix of lending. The value of the portfolio with an indexed loan-to-value of greater than 100 per cent and more than three months in arrears was stable at just over £3 billion. There was a decrease in the unsecured impairment charge, reflecting continued improving new business quality and portfolio trends as a result of its conservative risk appetite, with a focus on lending to existing customers.
In Wholesale there was a decrease in the impairment charge, primarily driven by lower impairment from the corporate real estate and real estate related asset portfolios partly offset by higher impairment on leveraged acquisition finance exposures. The continued low interest rate environment helped to maintain defaults at a reduced level. In addition, newly impaired assets, being generally of better quality, require a lower level of provisions once impaired than previously impaired assets.
In Commercial, the impairment charge decreased, reflecting the benefits of the low interest rate environment, which helped maintain defaults at a lower level, and the continued application of the Group’s prudent credit risk appetite.
In Wealth and International, impairment charges were also lower. The reduction predominantly reflects lower impairment charges in the Irish portfolio where the rate of impaired loan migration slowed. The impairment charge as a percentage of average loans and advances to customers improved. Impaired loans increased by £0.4 billion with an increase of £1.9 billion in Ireland partly offset by a reduction in the Australasian book as a result of write-offs and disposals, resulting in 42.8 per cent of the International portfolios (66.0 per cent of the Irish portfolio) being classified as impaired compared with 35.1 per cent in 2010.
There was no impairment charge in respect of loans and advances to banks in 2011, whereas in 2010 there had been a credit of £13 million following releases in respect of a small number of specific exposures. The impairment charge in respect of debt securities classified as loans and receivables was £8 million, or 14 per cent, lower at £49 million in 2011 compared to £57 million in 2010 and the impairment charge in respect of available-for-sale financial assets was £26 million, or 25 per cent, lower at £80 million in 2011 compared to £106 million in 2010.
There was a release of £55 million in respect of other credit provisions in 2011, as a number of commitments have now been drawn down; in 2010 a charge of £75 million resulted from a small number of specific new cases.
28
OPERATING AND FINANCIAL REVIEW AND PROSPECTS
2010 COMPARED WITH 2009
Impairment losses decreased by £5,721 million, or 34 per cent, to £10,952 million in 2010 compared to £16,673 million in 2009.
The reduction in the Group’s impairment charge in 2010 reflected stabilisation of the wholesale portfolios and improved retail affordability and performance. Improvements in Wholesale, Commercial and Retail more than offset increased impairment charges in Ireland and Australia, the latter caused by difficult market conditions. The Group’s ‘through the cycle’ credit policies and procedures, which focus on the development of enduring client relationships, had resulted in higher quality new business being originated across the UK and very little new origination took place outside the UK. The Group’s level of impairment was managed in the challenging economic environment by the Wholesale business support units, also covering Commerial, and Retail collection and recovery units. The business support model was expanded from Wholesale across Wealth and International division, with a central team established to manage the Group’s business support activity globally. The Group had also strengthened resources within Retail collections and recoveries to enable more timely engagement with customers experiencing difficulties to drive more effective customer outcomes. The Group had actively reduced limits to Portugal, Ireland, Italy, Greece and Spain over 2009 and 2010, with the associated country risk profile modest in the context of the Group’s asset base.
The impairment charge in respect of loans and advances to customers was £5,056 million, or 32 per cent, lower at £10,727 million in 2010 compared to £15,783 million in 2009. This improvement reflected reduced impairment charges in Retail, as a result of the improved quality of new business and a slow recovery in the UK economy, Wholesale, where stabilising economic conditions have led to lower impairment charges, particularly in the corporate real estate and real estate-related UK and US portfolios, and Commercial; only partly offset by increased impairment charges in Wealth and International as a result of difficult market conditions in a number of locations abroad, particularly Ireland and Australia, and especially in relation to the commercial real estate portfolios in those locations. The level of losses continued to be dominated by the economic environment in Ireland, and to a lesser extent had also been influenced by the performance of specific areas of the Australian economy.
In Retail, there was a lower secured impairment charge reflecting reduced impaired loan levels and improved arrears in the first half of 2010, although in the second half, and particularly in the last quarter, the Group had seen some signs of strain, with fewer customers returning their accounts to order than was the case six months previously. Although house prices fell slightly over 2010, the proportion of the mortgage portfolio with an indexed loan-to-value of greater than 100 per cent was broadly stable at 13 per cent. The value of the portfolio with an indexed loan-to-value greater than 100 per cent and more than three months in arrears increased by £0.2 billion and at 31 December 2010 was £3.2 billion, representing 0.9 per cent of the portfolio. The number of mortgage customers new to arrears had also remained relatively stable over 2010, and was well below the peak experienced in the second half of 2008. There was a decrease in the unsecured impairment charge, reflecting continued improving portfolio trends resulting from application of the Group’s risk appetite, management actions taken over 2009 and 2010, and stable unemployment. Unsecured impaired loans decreased as a result of fewer cases going into arrears, improved quality of new business and increased write off of impaired loans.
The Wholesale impairment charge decreased as a result of the significant actions which were taken in the first half of 2009 on the heritage HBOS portfolios (including the identification of large impairments subsequent to the HBOS acquisition, especially in corporate real estate, real estate-related and Corporate (UK and US) portfolios), together with the stabilising UK and US economic environment in 2010, with a low interest rate environment helping to maintain defaults at a lower level, and a number of write backs due to asset disposals.
The Commercial impairment charge was lower, again reflecting some stabilisation in the UK economy and the benefit to customers of the low interest rate environment.
The impairment charge in respect of loans and advances to banks improved by £10 million to a credit of £13 million compared to a credit of £3 million in 2009; this reflected releases in respect of a small number of specific exposures. The impairment charge in respect of debt securities classified as loans and receivables decreased by £191 million, or 77 per cent, to £57 million in 2010 compared to £248 million in 2009. Impairment losses in respect of available-for-sale financial assets were £496 million lower at £106 million in 2010 compared to £602 million in 2009. The charge in respect of other credit risk provisions was £32 million, or 74 per cent, higher at £75 million in 2010 compared to £43 million in 2009, as a result of a small number of specific new cases that arose in 2010.
29
OPERATING AND FINANCIAL REVIEW AND PROSPECTS
|
|
|
|
|
|
|
|
|
|
|
|
|
|
|
TAXATION |
|
|
|
|
|
|
|
|
|
|
|
|
|
|
|
|
2011 |
|
|
|
2010 |
|
|
|
2009 |
|
|
|
|
|
£m |
|
|
|
£m |
|
|
|
£m |
|
|
UK corporation tax: |
|
|
|
|
|
|
|
|
|
|
|
|
|
– Current tax on profits for the year |
|
|
(93 |
) |
|
|
(146 |
) |
|
|
(227 |
) |
|
– Adjustments in respect of prior years |
|
|
(146 |
) |
|
|
310 |
|
|
|
(310 |
) |
|
|
|
|
(239 |
) |
|
|
164 |
|
|
|
(537 |
) |
|
Double taxation relief |
|
|
— |
|
|
|
1 |
|
|
|
10 |
|
|
|
|
|
(239 |
) |
|
|
165 |
|
|
|
(527 |
) |
|
Foreign tax: |
|
|
|
|
|
|
|
|
|
|
|
|
|
– Current tax on profits for the year |
|
|
(90 |
) |
|
|
(82 |
) |
|
|
(221 |
) |
|
– Adjustments in respect of prior years |
|
|
36 |
|
|
|
49 |
|
|
|
40 |
|
|
|
|
|
(54 |
) |
|
|
(33 |
) |
|
|
(181 |
) |
|
Current tax credit (charge) |
|
|
(293 |
) |
|
|
132 |
|
|
|
(708 |
) |
|
Deferred tax |
|
|
257 |
|
|
|
193 |
|
|
|
2,619 |
|
|
Taxation (charge) credit |
|
|
(36 |
) |
|
|
325 |
|
|
|
1,911 |
|
2011 COMPARED WITH 2010
The rate of tax is influenced by the geographic and business mix of profits. In 2011, a tax charge of £36 million arose on the loss before tax of £342 million and in 2010 a tax credit of £325 million arose on the loss before tax of £2,919 million. The statutory corporation tax rates were 26.5 per cent for 2011 and 28.0 per cent for 2010. The Group’s tax charge or credit is distorted, in particular, by the requirement to include, within income tax in the income statement, the tax attributable to UK life insurance policyholder earnings and the Group’s interests in Open Ended Investment Companies. The tax attributable to UK life insurance policyholder earnings and the Group’s interest in Open Ended Investment Companies was a credit of £72 million in 2011 and a charge of £315 million in 2010. The changes in UK corporation tax rates lead to an additional charge of £420 million in 2011 (2010: £169 million) and in both years there was an additional charge arising in respect of tax losses where no deferred tax has been recognised (2011: £261 million; 2010: £487 million) but in 2011 this was more than offset by a credit of £332 million from the recognition of tax losses not previously recognised. The Group does not expect the tax rate, excluding the impact of policyholders’ tax and Open Ended Investment Companies, to vary significantly from the average UK corporation tax rate.
2010 COMPARED WITH 2009
In 2010, a tax credit of £325 million arose on a loss before tax of £2,919 million and in 2009 a tax credit of £1,911 million arose on a profit before tax of £1,042 million. The statutory corporation tax rate was 28 per cent in both years. The tax attributable to UK life insurance policyholder earnings and the Group’s interest in Open Ended Investment Companies was a charge of £315 million for 2010 compared to a charge of £410 million in 2009. The tax position in 2009 was also particularly distorted by the gain on acquisition of £11,173 million, which did not attract a tax charge. In both 2010 and 2009, there was also an impact from tax losses, mostly in overseas jurisdictions, where deferred tax assets were not recognised, leading to an additional charge of £487 million in 2010 (2009: £332 million). The remainder of the variation in effective tax rates reflected normal fluctuations in disallowed and non-taxable items.
30
OPERATING AND FINANCIAL REVIEW AND PROSPECTS
INTEGRATION COSTS AND BENEFITS
The Group successfully achieved the Integration programme target of delivering run-rate cost synergies and other operating efficiencies of £2 billion per annum from the programme by the end of 2011.
The sustainable run-rate synergies achieved as at 31 December 2011 totalled £2,054 million, excluding a number of one-off savings. The table below analyses the run-rate synergies as at 31 December 2011 by division.
|
|
|
|
|
|
|
|
|
|
|
|
|
|
|
2011 |
|
|||||||
|
|
|
Synergy |
|
Allocation |
|
Run-rate |
|
|||
|
Retail |
|
|
346 |
|
|
454 |
|
|
800 |
|
|
Wholesale and Commercial |
|
|
324 |
|
|
270 |
|
|
594 |
|
|
Wealth and International |
|
|
273 |
|
|
31 |
|
|
304 |
|
|
Insurance |
|
|
204 |
|
|
59 |
|
|
263 |
|
|
Group Operations |
|
|
857 |
|
|
(857 |
) |
|
— |
|
|
Central items |
|
|
50 |
|
|
43 |
|
|
93 |
|
|
Total |
|
|
2,054 |
|
|
— |
|
|
2,054 |
|
Cost synergies have been delivered through the integration of HBOS operations, processes and IT systems. These synergies have arisen through procurement; property with 83 head office sites vacated; IT cost savings and job reductions.
Integration costs of £1,097 million were incurred in the year and have been excluded from the combined businesses results. This brings the total integration costs since the HBOS acquisition to £3,846 million.
Migrating the business systems to a single platform
2011 saw the single biggest event of the Integration programme with the successful migration of the core business systems to a single IT platform. The Group has moved 30 million customer accounts and transferred 35 billion pieces of data between systems successfully. This has been one of the largest ever financial services IT integrations and at its peak it involved many thousands of colleagues across the organisation.
There were three major components to the system migrations:
|
|
|
|
• |
The Lloyds TSB Branch Counter System (ICS) was introduced to all Halifax and Bank of Scotland branches and 3,800 HBOS Automated Teller Machines (ATMs) and 667 Intelligent Deposit Machines (IDMs) were moved across to the Lloyds Banking Group IT network. |
|
|
|
|
• |
The market leading Mortgage Sales Platform, already in use in Halifax and Bank of Scotland branches, was successfully rolled out to 800 Lloyds TSB mortgage advisors in England and Wales. |
|
|
|
|
• |
In September 2011 30 million HBOS current accounts and savings accounts and Commercial and UK Private Banking accounts, were migrated onto the Lloyds Banking Group IT system. This customer data migration was successfully achieved after five proving cycles, 11 dress rehearsals including two full trial account migrations, over 250,000 business tests and 27,000 colleagues trained totalling 1.5 million hours. |
The vast majority of integration activity is now complete, with a handful of peripheral migrations to be completed in 2012.
SIMPLIFICATION COSTS AND BENEFITS
The successful delivery of the Integration programme has provided a platform and single set of processes that now enables the Group to commence its next transformational journey. A core element of this transformational agenda is the Simplification programme. The programme is structured around four key initiatives:
|
|
|
|
• |
Operations & Processes – getting processes right end-to-end, with the right IT in the right places. |
|
|
|
|
• |
Sourcing – better understanding needs across the Group and getting the right deals from suppliers. |
|
|
|
|
• |
Organisation – focusing on how the Group is structured and the way it works. |
|
|
|
|
• |
Channels and Products – simplifying products whilst continuing to improve and innovate channels. |
The programme is well underway having achieved £178 million of Simplification and other cost savings in 2011, equivalent to an annual run-rate saving of £242 million. The programme is now targeting £1.7 billion of savings by 2014, an increase of £0.2 billion over previous guidance.
Simplification costs of £185 million were incurred in the year and have been excluded from the combined businesses results.
31
OPERATING AND FINANCIAL REVIEW AND PROSPECTS
The requirements for IFRS segmental reporting are set out in IFRS 8 ‘Operating Segments’ which mandates that an entity’s segmental reporting should reflect the way in which its operations are viewed and judged by its chief operating decision maker. As a consequence, the Group’s statutory segmental reporting follows the combined businesses basis as explained below (see also note 4 to the consolidated financial statements).
The Group Executive Committee (GEC) has been determined to be the chief operating decision maker for the Group. The Group’s operating segments reflect its organisational and management structures. GEC reviews the Group’s internal reporting based around these segments in order to assess performance and allocate resources. This assessment includes a consideration of each segment’s net interest revenue and consequently the total interest income and expense for all reportable segments is presented on a net basis. The segments are differentiated by the type of products provided, by whether the customers are individuals or corporate entities and by the geographical location of the customer.
The segmental results and comparatives are presented on the basis reviewed by the chief operating decision maker and as a consequence include the pre-acquisition results of HBOS for the period from 1 January 2009 to 16 January 2009; during 2011 the chief operating decision maker has commenced reviewing the results of the Group’s Commercial business separately to the Wholesale segment. As a consequence, the Group’s activities are now organised into five financial reporting segments: Retail, Wholesale, Commercial, Wealth and International and Insurance.
During the third quarter of 2011, the Group implemented a new approach to its allocation methodologies for funding costs and capital that ensures that the cost of funding is more fully reflected in each segment’s results. The new methodology is designed to ensure that funding costs are allocated to the segments and that the allocation is more directly related to the size and behavioural duration of asset portfolios, with a similar approach applied to recognise the value to the business from the Group’s growing deposit base. Comparative figures have been restated accordingly.
Comparisons of results on a historical consolidated statutory basis are dominated by the impact of the acquisition of HBOS as the 2009 statutory results include the results of HBOS from 16 January 2009, together with the effects of the unwind of fair value adjustments made to the HBOS balance sheet on acquisition. In order to provide more meaningful and relevant comparatives, the results of the Group and divisions are presented on a ‘combined businesses’ basis. The key principles adopted in the preparation of the combined businesses basis of reporting are described below.
|
|
|
|
|
• |
In order to reflect the impact of the acquisition of HBOS, the following adjustments have been made: |
|
|
|
|
|
|
|
– |
the 2009 results assume HBOS had been owned throughout that year; |
|
|
|
|
|
|
– |
the gain on acquisition of HBOS (in 2009) and amortisation of purchased intangible assets have been excluded; and |
|
|
|
|
|
|
– |
the unwind of acquisition-related fair value adjustments is shown as one line in the combined businesses income statements. |
|
|
|
|
|
• |
In order to better present business performance the effects of liability management, volatile items and asset sales are shown on a separate line in the combined businesses income statement and the following items, not related to acquisition accounting, have also been excluded: |
|
|
|
|
|
|
|
– |
integration, simplification and EC mandated retail business disposal costs; |
|
|
|
|
|
|
– |
volatility arising in insurance businesses; |
|
|
|
|
|
|
– |
insurance gross-up; |
|
|
|
|
|
|
– |
goodwill impairment; |
|
|
|
|
|
|
– |
the provision in relation to German insurance business litigation; |
|
|
|
|
|
|
– |
the payment protection insurance provision; |
|
|
|
|
|
|
– |
the customer goodwill payments provision; |
|
|
|
|
|
|
– |
the curtailment gain in 2010 in respect of the Group’s defined benefit pension schemes; |
|
|
|
|
|
|
– |
the loss on disposal of businesses in 2010; and |
|
|
|
|
|
|
– |
the Government Asset Protection Scheme (GAPS) fee paid in December 2009. |
Readers should be aware that the combined businesses basis has been presented for comparative purposes only and is not intended to provide proforma information or show the results of the Group as if the acquisition of HBOS had taken place at an earlier date.
The results of the businesses are set out below:
|
|
|
|
|
|
|
|
|
|
|
|
|
|
|
|
|
|
2011 |
|
|
|
2010 |
1 |
|
|
2009 |
1 |
|
|
|
|
£m |
|
|
|
£m |
|
|
|
£m |
|
|
Retail |
|
|
3,636 |
|
|
|
3,986 |
|
|
|
955 |
|
|
Wholesale |
|
|
828 |
|
|
|
2,514 |
|
|
|
(4,682 |
) |
|
Commercial |
|
|
499 |
|
|
|
291 |
|
|
|
(200 |
) |
|
Wealth and International |
|
|
(3,936 |
) |
|
|
(4,950 |
) |
|
|
(2,433 |
) |
|
Insurance |
|
|
1,422 |
|
|
|
1,326 |
|
|
|
1,203 |
|
|
Group Operations and Central items: |
|
|
|
|
|
|
|
|
|
|
|
|
|
Group Operations |
|
|
(56 |
) |
|
|
(52 |
) |
|
|
(143 |
) |
|
Central items |
|
|
292 |
|
|
|
(903 |
) |
|
|
(1,000 |
) |
|
|
|
|
236 |
|
|
|
(955 |
) |
|
|
(1,143 |
) |
|
Profit (loss) before tax – combined businesses |
|
|
2,685 |
|
|
|
2,212 |
|
|
|
(6,300 |
) |
|
|
|
|
1 |
As discussed above, divisional results for 2010 and 2009 have been restated to reflect new funding cost and capital allocation methodologies. |
32
OPERATING AND FINANCIAL REVIEW AND PROSPECTS
RECONCILIATION OF COMBINED BUSINESSES PROFIT (LOSS) BEFORE TAX TO STATUTORY PROFIT (LOSS) BEFORE TAX FOR THE YEAR
|
|
|
|
|
|
|
|
|
|
|
|
|
|
|
|
|
|
|
Note |
|
|
2011 |
|
|
2010 |
|
|
2009 |
|
|
Profit (loss) before tax – combined businesses |
|
|
|
|
|
2,685 |
|
|
2,212 |
|
|
(6,300 |
) |
|
Integration, simplification and EC mandated retail business disposal costs |
|
|
1 |
|
|
(1,452 |
) |
|
(1,653 |
) |
|
(1,096 |
) |
|
Volatility arising in insurance businesses |
|
|
2 |
|
|
(838 |
) |
|
306 |
|
|
478 |
|
|
Amortisation of purchased intangibles and goodwill impairment |
|
|
4 |
|
|
(562 |
) |
|
(629 |
) |
|
(993 |
) |
|
Provision in relation to German insurance business litigation |
|
|
5 |
|
|
(175 |
) |
|
— |
|
|
— |
|
|
Payment protection insurance provision |
|
|
6 |
|
|
— |
|
|
(3,200 |
) |
|
— |
|
|
Customer goodwill payments provision |
|
|
7 |
|
|
— |
|
|
(500 |
) |
|
— |
|
|
Curtailment gain in respect of defined benefit pension schemes |
|
|
8 |
|
|
— |
|
|
910 |
|
|
— |
|
|
Loss on disposal of businesses |
|
|
9 |
|
|
— |
|
|
(365 |
) |
|
— |
|
|
Pre-acquisition results of HBOS plc |
|
|
11 |
|
|
— |
|
|
— |
|
|
280 |
|
|
Negative goodwill credit |
|
|
12 |
|
|
— |
|
|
— |
|
|
11,173 |
|
|
Government Asset Protection Scheme fee |
|
|
13 |
|
|
— |
|
|
— |
|
|
(2,500 |
) |
|
(Loss) profit before tax – statutory |
|
|
|
|
|
(342 |
) |
|
(2,919 |
) |
|
1,042 |
|
|
|
|
|
1. |
Integration, simplification and EC mandated retail business disposal costs |
Integration and simplification costs of £1,097 million and £185 million respectively were incurred in 2011 compared with integration costs of £1,653 million in 2010 and £1,096 million in 2009; these relate primarily to migrating business systems to a single IT platform, including the single biggest event of the Integration programme. The major components were migrating 30 million HBOS accounts onto the Lloyds Banking Group IT system, introduction of the Lloyds TSB Branch counter system to Halifax and Bank of Scotland branches and roll out of the HBOS mortgage sales platform to Lloyds TSB mortgage advisors. The vast majority of the integration activity is now complete, with a handful of peripheral migrations to be completed in 2012.
As part of the European Commission’s decision approving state aid to the Group, the Group is required to dispose of a retail banking business with at least 600 branches, a 4.6 per cent share of the personal current accounts market in the UK and up to 19.2 per cent of Lloyds Banking Group’s mortgage assets. This business is to be disposed of before the end of November 2013 and consists of the TSB brand, the branches, savings accounts and branch-based mortgages of Cheltenham & Gloucester, the branches and branch-based customers of Lloyds TSB Scotland and a related banking licence, additional Lloyds TSB branches in England and Wales, with branch-based customers and Intelligent Finance. Costs incurred in relation to this disposal in the year ended 31 December 2011 totalled £170 million (2010: £nil; 2009: £nil).
|
|
|
|
2. |
Volatility arising in insurance businesses |
The Group’s statutory result before tax is affected by insurance volatility, caused by movements in financial markets, and policyholder interests volatility, which primarily reflects the gross up of policyholder tax included in the Group tax charge.
In 2011,
the Group’s statutory result before tax included negative insurance and
policyholder interests volatility totalling £838 million compared to positive
volatility of £306 million in 2010 and £478 million in 2009.
Volatility
comprises the following:
|
|
|
|
|
|
|
|
|
|
|
|
|
|
|
|
2011 |
|
|
2010 |
|
|
2009 |
|
|
Insurance volatility |
|
|
(557 |
) |
|
100 |
|
|
237 |
|
|
Policyholder interests volatility |
|
|
(283 |
) |
|
216 |
|
|
298 |
|
|
Insurance hedging arrangements |
|
|
2 |
|
|
(10 |
) |
|
(57 |
) |
|
Total |
|
|
(838 |
) |
|
306 |
|
|
478 |
|
Management believes that excluding volatility from profit before tax on a combined businesses basis provides useful information for investors on the performance of the business as it excludes amounts included within profit before tax which do not accrue to the Group’s equity holders and excludes the impact of changes in market variables which are beyond the control of management.
The most significant limitations associated with excluding volatility from the combined businesses results are:
|
|
|
|
(i) |
Insurance volatility requires an assumption to be made for the normalised return on equities and other investments; and |
|
|
|
|
(ii) |
Insurance volatility impacts on the Group’s regulatory capital position, even though it is not included within profit before tax on a combined businesses basis. |
|
|
|
|
Management compensates for the limitations above by: |
|
|
|
|
|
(i) |
Monitoring closely the assumptions used to calculate the normalised return used within the calculation of insurance volatility; these assumptions are disclosed below; and |
|
|
|
|
(ii) |
Producing separate reports on the Group’s current and forecast capital ratios. |
33
OPERATING AND FINANCIAL REVIEW AND PROSPECTS
Insurance volatility
The Group’s insurance businesses have liability products that are supported by substantial holdings of investments, including equities, property and fixed interest investments, all of which are subject to variations in their value. The value of the liabilities does not move exactly in line with changes in the value of the investments, yet IFRS requires that the changes in the value of both the liabilities and the investments be reflected within the income statement. As these investments are substantial and movements in their value can have a significant impact on the profitability of the Group, management believes that it is appropriate to disclose the results on the basis of an expected return in addition to results based on the actual return.
The expected sterling investment returns used to determine the normalised profit of the business, which are based on prevailing market rates and published research into historical investment return differentials, are set out below:
|
|
|
|
|
|
|
|
|
|
|
|
|
|
|
|
United Kingdom (Sterling) |
|
|
2012 |
|
|
2011 |
|
|
2010 |
|
|
2009 |
|
|
|
|
|
% |
|
|
% |
|
|
% |
|
|
% |
|
|
Gilt yields (gross) |
|
|
2.48 |
|
|
3.99 |
|
|
4.45 |
|
|
3.74 |
|
|
Equity returns (gross) |
|
|
5.48 |
|
|
6.99 |
|
|
7.45 |
|
|
6.74 |
|
|
Dividend yield |
|
|
3.00 |
|
|
3.00 |
|
|
3.00 |
|
|
3.00 |
|
|
Property return (gross) |
|
|
5.48 |
|
|
6.99 |
|
|
7.45 |
|
|
6.74 |
|
|
Corporate bonds in unit-linked and with-profit funds (gross) |
|
|
3.08 |
|
|
4.59 |
|
|
5.05 |
|
|
4.34 |
|
|
Fixed interest investments backing annuity liabilities (gross) |
|
|
3.89 |
|
|
4.78 |
|
|
5.30 |
|
|
5.72 |
|
The impact on the results due to the actual return on these investments differing from the expected return (based upon economic assumptions made at the beginning of the year) is included within insurance volatility. Changes in market variables also affect the realistic valuation of the guarantees and options embedded within the With Profits Funds, the value of the in-force business and the value of shareholders’ funds.
The liabilities in respect of the Group’s UK annuity business are matched by a portfolio of fixed interest securities, including a large proportion of corporate bonds. In accordance with the approach adopted in previous years, the value of in-force business for the UK annuity business has been calculated after taking into account an estimate of the market premium for illiquidity in respect of corporate bond holdings. The illiquidity premium is estimated to be 119 basis points as at 31 December 2011 (31 December 2010: 75 basis points; 31 December 2009: 75 basis points). The insurance businesses experienced negative volatility of £557 million during 2011, compared to positive volatility of £100 million in 2010 and £237 million in 2009. The negative insurance volatility during the year ended 31 December 2011 primarily reflected the underperformance of equity markets in the second half of 2011 and lower cash returns compared to long-term expectations. The positive volatility of £100 million in 2010 was primarily driven by strong performance of equity and property investments relative to the expected return. During 2010, equity market values had increased by 9 per cent and property returns had reached 19 per cent. Partly offsetting this were lower than expected returns on cash and fixed interest assets. This benefit in 2010 was lower than the £237 million positive volatility reported in 2009, as 2009 included significant benefits from reductions in corporate bond spreads, which did not occur in 2010, and greater out-performance of equity markets (during 2009, equities recovered by 22 per cent); these increases in 2009 being only partly offset by a reduction in gilts, reflecting an increase in yields and a reduction in property values of 6.6 per cent.
Policyholder interests volatility
The application of accounting standards results in the introduction of other sources of significant volatility into the pre-tax profits of the life, pensions and investments business. In order to provide a clearer representation of the performance of the business, and consistent with the way in which it is managed, adjustments are made to remove this volatility from the combined businesses results. The effect of these adjustments is separately disclosed as policyholder interests volatility; there is no impact upon profit attributable to equity shareholders over the long term.
The most significant of these additional sources of volatility is policyholder tax. Accounting standards require that tax on policyholder investment returns should be included in the Group’s tax charge rather than being offset against the related income. The impact is, therefore, to either increase or decrease profit before tax with a corresponding change in the tax charge. Over the longer term the charges levied to policyholders to cover policyholder tax on investment returns and the related tax provisions are expected to offset. In practice timing and measurement differences exist between provisions for tax and charges made to policyholders. Consistent with the normalised approach taken in respect of insurance volatility, differences in the expected levels of the policyholder tax provision and policyholder charges are adjusted through policyholder interests volatility. Other sources of volatility include the minorities’ share of the profits earned by investment vehicles which are not wholly owned by the long-term assurance funds.
During the year ended 31 December 2011, the statutory profit before tax included a charge to other income of £283 million which related to the policyholder interests volatility (2010: credits of £216 million in other income; 2009: charge of £298 million in other income). The charge in 2011 included the impact of deferred tax asset impairments due to less optimistic economic forecasts and changes in expected policyholder tax provisions. Policyholder tax liabilities increased during 2011 and led to a tax charge during the period. Strong market conditions in the latter part of 2010 had resulted in increased policyholder tax liabilities and led to a policyholder tax charge of £315 million (2009: charge of £410 million) for the year in the Group’s tax charge. The market recovery in 2009 had increased policyholder tax liabilities and led to a policyholder tax charge during that year in the Group’s tax charge; although this was partly offset by a credit relating to differences in the expected levels of policyholder tax provisions and charges.
Group hedging arrangements
The statutory results for the year ended 31 December 2011 also include a credit in relation to the Group’s insurance hedging arrangements of £2 million (2010: charge of £10 million; 2009: charge of £57 million). To protect against further deterioration in equity market conditions, and the consequent negative impact on the value of in-force business on the Group balance sheet, the Group has been purchasing put option contracts since 2009.
The contracts purchased in 2009 led to a charge of £57 million in the year ended 31 December 2009 and expired in January 2010, resulting in a charge of £7 million in the year ended 31 December 2010. New protection against significant market falls, using option contracts, was acquired by the Group in January 2010, financed by selling some upside potential from equity market movements. There was no initial cost associated with these hedging arrangements. On a mark-to-market basis a loss of £3 million was recognised on these contracts in the year ended 31 December 2010. These contracts expired in January 2011, at which point a further charge of £3 million was recognised in the year ended 31 December 2011; again these contracts were replaced and a mark-to-market gain of £5 million has been recognised for the remainder of 2011.
34
OPERATING AND FINANCIAL REVIEW AND PROSPECTS
|
|
|
|
3. |
Insurance gross-up |
The Group’s insurance businesses’ income statements include income and expenditure which are attributable to the policyholders of the Group’s long-term assurance funds. These items have no impact in total upon the profit attributable to equity shareholders and, in order to provide a clearer representation of the underlying trends within the business, these items are shown net on a separate line. These policyholder amounts relate principally to returns on policyholder investments (within net interest income and net trading income) and insurance premiums receivable, together with a matching amount within the insurance claims expense representing the allocation of these items to policyholders.
|
|
|
|
4. |
Amortisation of purchased intangibles and goodwill impairment |
A total of £4,650 million of customer-related intangibles, brands, core deposit intangibles and purchased credit card relationships were recognised on the acquisition of HBOS in 2009 and these are being amortised over their estimated useful lives, where this has been determined to be finite. This has resulted in a charge of £562 million in the year ended 31 December 2011 (2010: £629 million; 2009: £753 million).
The customer-related intangibles include customer lists and the benefits of customer relationships that generate recurring income. The purchased credit card relationships represent the benefit of recurring income generated from the portfolio of credit cards purchased and the core deposit intangible is the benefit derived from a large stable deposit base that has low interest rates.
The Group reviews goodwill held on its balance sheet for impairment at least annually or when events or changes in economic circumstances indicate that an impairment may have taken place. Goodwill attributable to the Group’s asset finance business was reviewed for impairment in 2009 due to the continuing uncertainties over the short-term macroeconomic environment. As a consequence, the carrying value of the consumer finance cash generating unit within Asset Finance was reassessed resulting in a goodwill impairment charge of £240 million in the year ended 31 December 2009.
|
|
|
|
5. |
Provision in relation to German insurance business litigation |
Clerical Medical Investment Group Limited (CMIG) has received a number of claims in the German courts, relating to policies issued by CMIG but sold by independent intermediaries in Germany, principally during the late 1990s and early 2000s. CMIG has won the majority of decisions to date, although a small number of regional district and appeal courts have found against CMIG on specific grounds. CMIG’s strategy includes defending claims robustly and appealing against adverse judgments. The ultimate financial effect, which could be significant, will only be known once all relevant claims have been resolved. However, consistent with this strategy, and having regard to the costs involved in managing these claims, and the inherent risks of litigation, the Group has recognised a provision of £175 million. Management believes this represents the most appropriate estimate of the financial impact, based upon a series of assumptions, including the number of claims received, the proportion upheld, and resulting legal and administration costs.
|
|
|
|
6. |
Payment protection insurance provision |
There has been intensive scrutiny of the payment protection insurance (PPI) market in recent years. On 8 October 2010, the British Bankers’ Association (BBA), the principal trade association for the UK banking and financial services sector, filed an application for permission to seek judicial review against the FSA and the FOS. The BBA sought an order quashing the FSA Policy Statement and an order quashing the decision of the FOS to determine PPI sales in accordance with the guidance published on its website in November 2008. The Judicial Review hearing was held in January 2011 and on 20 April 2011 judgment was handed down by the High Court dismissing the BBA’s application. After publication of the judgment, the Group entered into discussions with the FSA with a view to seeking clarity around the detailed implementation of the Policy Statement. As a result, and given the initial analysis that the Group conducted of compliance with applicable sales standards, which is continuing, the Group concluded that there are certain circumstances where customer contact and/or redress will be appropriate. Accordingly the Group made a provision in its financial statements for the year ended 31 December 2010 of £3,200 million in respect of the anticipated costs of such contact and/or redress, including administration expenses.
|
|
|
|
7. |
Customer goodwill payments provision |
Following discussions with the FSA regarding the application of an interest rate variation clause in certain Bank of Scotland plc variable rate mortgage contracts, Bank of Scotland plc applied for a Voluntary Variation of Permission (VVOP) in February 2011 and agreed to initiate a customer review and contact programme and to make goodwill payments to affected customers. The Group made a provision of £500 million in respect of this matter during the year ended 31 December 2010. Since that time further information has become available which has resulted in Bank of Scotland plc applying for, and being granted, an amended VVOP by the FSA in November 2011. No additional provision was required during the year ended 31 December 2011.
|
|
|
|
8. |
Curtailment gain in respect of defined benefit pension schemes |
Following changes by the Group to the terms of its UK defined benefit pension schemes, all future increases to pensionable salary will be capped each year at the lower of: Retail Prices Index inflation; each employee’s actual percentage increase in pay; and 2 per cent of pensionable pay. In addition to this, during the second half of 2010 there was a change in commutation factors in certain defined benefit schemes. The combined effect of these changes was a reduction in the Group’s defined benefit obligation of £1,081 million and a reduction in the Group’s unrecognised actuarial losses of £171 million, resulting in a net curtailment gain of £910 million recognised in the income statement in the year ended 31 December 2010 and an equivalent reduction in the balance sheet liability.
|
|
|
|
9. |
Loss on disposal of businesses |
During 2009, the Group acquired an oil drilling rig construction business through a previous lending relationship and consolidated the results and net assets of the business from the date it exercised control. In the first half of 2010, as a result of a deteriorating market, the Group impaired the oil drilling rigs under construction held by the business by £150 million to reflect their reduced value in use. This impairment was recognised in the Wholesale segment. In the second half of 2010, the Group reached agreement to dispose of its interests in the two wholly-owned subsidiary companies through which this business operates; the sale was completed in January 2011. The Group extended vendor financing, on normal commercial terms and negotiated on an arms length basis, to facilitate the acquisition of the rig holding companies. The loan is not contingent on the performance of the oil rigs under construction. Accordingly, as at 31 December 2010, the subsidiaries were derecognised.
35
OPERATING AND FINANCIAL REVIEW AND PROSPECTS
|
|
|
|
10. |
Unwind of acquisition-related fair value adjustments |
The statutory (IFRS) and the combined businesses income statements include the impact of the acquisition-related adjustments arising from the acquisition of HBOS in 2009. On a statutory (IFRS) basis the acquisition-related adjustments affect a number of line items whereas the Group’s combined businesses basis presents the aggregate of the impact of these adjustments on the Group’s income statement.
The principal financial effects of the fair value unwind are to reflect the effective interest rates applicable at the date of acquisition, on assets and liabilities that were acquired at values that differed from their original book value, and to recognise the reversal of credit and liquidity risk adjustments as underlying instruments mature, are disposed of or become impaired. Generally, this leads to: higher interest expense as the value of HBOS’s own debt accretes to par; higher other income arising on sale of debt securities from the pre-acquisition HBOS available-for-sale portfolio, as the gain or loss on sale is not reduced by re-cycling the pre-acquisition negative fair value movements reflected in reserves; and a lower impairment charge reflecting the impact of acquisition balance sheet valuation adjustments.
Further information on the drivers of the fair value unwind is included in the commentary on the segment performance in the Operating and Financial Review.
|
|
|
|
11. |
Pre-acquisition results of HBOS plc |
The acquisition of HBOS plc on 16 January 2009 had a significant effect on the comparability of the Group’s financial position and results, as a consequence, the combined businesses basis results are prepared as if HBOS had been owned by the Group for the full year 2009.
|
|
|
|
12. |
Negative goodwill credit |
On 16 January 2009, the Group acquired 100 per cent of the ordinary share capital of HBOS plc. The consideration for the acquisition of HBOS comprised the issue of 7,776 million ordinary shares in Lloyds Banking Group plc together with the costs of acquisition. In determining the fair value of the consideration, the Company used the share price of its equity securities quoted on the London Stock Exchange, as at the date of completion.
As the fair value of the identifiable net assets acquired was greater than the total consideration paid, negative goodwill of £11,173 million arose on the acquisition. The negative goodwill was recognised as a ‘Gain on acquisition’ in the income statement for the year ended 31 December 2009.
The exercise to fair value the assets and liabilities of HBOS took into account prevailing market conditions at the time of completion and, where appropriate, the Group engaged independent external advisers. As the consideration paid was significantly less than the provisional fair value of the net assets acquired, the results of the fair value calculations were subject to additional challenge in accordance with the requirements of IFRS 3.
On the date that the acquisition was announced (18 September 2008) the implied goodwill was a small positive amount based on the share price of the Company and the originally announced conversion factor of 0.833 Lloyds Banking Group plc shares for each HBOS share. However, a number of factors led to negative goodwill being recognised on completion of the transaction.
By the time of the recommended offer, it had become increasingly difficult for HBOS to raise funds in wholesale markets and HBOS faced an outflow of customer deposits, reflecting reduced investor and depositor confidence. Subsequent to the announcement of the offer, turbulence in the markets continued, fuelled by concerns about credit risk and worsening economic conditions. For HBOS, confidence continued to deteriorate amid ongoing funding difficulties and concerns over the extent of future credit losses. Measures by national authorities and central banks failed to stem this turbulence and the UK Government decided in October 2008 that it would be appropriate for the UK banking sector to increase its level of capitalisation. The capital raising, underwritten by the UK Government, was made available to HBOS on condition that the acquisition by the Company completed. As a consequence of the capital that HBOS was required to issue and the impact of market conditions on the future prospects of the new group, the terms of the final agreed offer were revised down to a ratio of 0.605. Additionally, the share price of the Company fell from 280p at the date of the announcement to 98.4p on 15 January 2009 reflecting both the dilutive impact of the capital that the Company raised and the turmoil in the banking sector and equity markets in general. These factors combined to reduce the value of the consideration for HBOS.
|
|
|
|
13. |
Government Asset Protection Scheme fee |
The Group entered into an agreement in March 2009 relating to its proposed participation in the Government Asset Protection Scheme (GAPS). However, following its rights issue in November 2009, the Group withdrew from its proposed participation and agreed to pay HM Treasury £2,500 million in recognition of the benefits to the Group’s trading operations arising as a result of HM Treasury proposing to make GAPS available to the Group; this fee was paid in December 2009 (see Major Shareholders and Related Party Transactions – Information about the Lloyds Banking Group’s relationship with the UK Government – Other related party transactions with the UK Government – GAPS withdrawal deed).
36
OPERATING AND FINANCIAL REVIEW AND PROSPECTS
RETAIL
Retail operates the largest retail bank in the UK and is a leading provider of current accounts, savings, personal loans, credit cards and mortgages. With its strong stable of brands including Lloyds TSB, Halifax, Bank of Scotland and Cheltenham & Gloucester, it serves over 30 million customers through one of the largest branch and fee free ATM networks in the UK.
Retail is focused on effectively meeting the needs of its customers. The division provides current accounts including packaged accounts and basic and social banking accounts. It is also the largest provider of personal loans in the UK, as well as being the UK’s leading credit card issuer. Retail provides one in five new residential mortgages making it one of the leading UK mortgage lenders and provided over 52,000 mortgages to help first time buyers in 2011. Retail is the largest private sector savings provider in the UK. It is also a major general insurance and Bancassurance distributor, offering a wide range of long-term savings, investment and general insurance products.
|
|
|
|
|
|
|
|
|
|
|
|
|
|
|
|
2011 |
|
|
2010 |
1 |
|
2009 |
1 |
|
|
|
|
£m |
|
|
£m |
|
|
£m |
|
|
Net interest income |
|
|
7,497 |
|
|
8,648 |
|
|
7,543 |
|
|
Other income |
|
|
1,649 |
|
|
1,607 |
|
|
1,804 |
|
|
Effects of liability management, volatile items and asset sales |
|
|
48 |
|
|
— |
|
|
— |
|
|
Total income |
|
|
9,194 |
|
|
10,255 |
|
|
9,347 |
|
|
Operating expenses |
|
|
(4,438 |
) |
|
(4,644 |
) |
|
(4,566 |
) |
|
Trading surplus |
|
|
4,756 |
|
|
5,611 |
|
|
4,781 |
|
|
Impairment |
|
|
(1,970 |
) |
|
(2,747 |
) |
|
(4,227 |
) |
|
Share of results of joint ventures and associates |
|
|
11 |
|
|
17 |
|
|
(6 |
) |
|
Profit before tax and fair value unwind |
|
|
2,797 |
|
|
2,881 |
|
|
548 |
|
|
Fair value unwind |
|
|
839 |
|
|
1,105 |
|
|
407 |
|
|
Profit before tax |
|
|
3,636 |
|
|
3,986 |
|
|
955 |
|
|
|
|
|
1 |
As discussed on page 32, divisional results for 2010 and 2009 have been restated to reflect new funding cost and capital allocation methodologies. |
2011 COMPARED WITH 2010
Profit before tax for Retail in 2011 of £3,636 million was £350 million, or 9 per cent, lower than 2010.
Profit before tax and fair value unwind decreased to £2,797 million, a reduction of 3 per cent compared to 2010, driven by higher funding costs and the muted demand for credit.
Total income decreased by £1,061 million, or 10 per cent, to £9,194 million. This was driven by a reduction in net interest income of £1,151 million, while other income increased by £42 million.
Net interest income reduced by 13 per cent compared to 2010. One of the main drivers was the increase in wholesale funding costs which were not matched by average customer rates. Net interest margin in 2011 decreased by 22 basis points to 2.09 per cent. Income growth was also constrained by muted demand for credit. Previous de-risking of the lending portfolio, with a resulting reduction in unsecured balances, also contributed to the reduction in income albeit with a proportionately greater reduction in impairment. Net interest margin, minus impairment rate, remained stable reflecting progress in de-risking the balance sheet. Finally, increased competition for deposits and strong balance growth resulted in an increase in the average rate paid on customer deposits.
Other income increased by 3 per cent in 2011 to £1,649 million from £1,607 million largely as a result of higher bancassurance income, driven by an increase in the value of protection products sold through the branch network. Total income also includes the gain on the disposal of VISA Inc shares.
Operating expenses and other costs fell by 4 per cent compared to 2010 and the cost:income ratio was 48.3 per cent (2010: 45.3 per cent). Operating expenses benefited from integration activities, the start of the simplification programme, and other day-to-day cost management activities to offset inflation. The Group continues to invest in the Retail business to improve products and services for its customers including digital platforms and branches. During 2011 Retail completed a major milestone in the Integration programme, the consolidation of its main Retail product systems. This now creates a solid platform to deliver the simplification programme.
Credit performance across the business continued to be supported by a conservative approach to risk, a continued focus on existing customers and low interest rates. The impairment charge on loans and advances decreased by £777 million, or 28 per cent, to £1,970 million driven by reductions in the unsecured charge. The unsecured impairment charge reduced to £1,507 million from £2,455 million in 2010, reflecting the impact of the continued conservative approach to risk (resulting in improved new business quality), effective portfolio management and a reduction in unsecured balances. The secured impairment charge increased to £463 million from £292 million in 2010 largely reflecting a less certain outlook on house prices and appropriate provisioning against existing credit risks which have longer emergence periods due to current low interest rates. These factors were partially offset by underlying improvement in the quality of the secured portfolio.
The fair value unwind net credit was £839 million compared with £1,105 million in 2010. This reduction was driven largely by the maturing balances of the pre-acquisition portfolio.
Total customer balances remained stable at £599,900 million as Retail continued to maintain its relationships with customers. The mix of these balances continued to move towards customer deposits as customers continued to reduce their personal indebtedness and Retail continued to make strong progress in attracting savings balances. This change in customer balance composition has additionally supported the Group’s funding although it has also contributed to a reduction in income and profit.
Loans and advances to customers decreased by £10,919 million, or 3 per cent, to £352,812 million, compared to 31 December 2010. This was driven by reduced customer demand for new credit, existing customers continuing to reduce their personal indebtedness, run off of lending outside of the Group’s risk appetite and Retail maintaining a conservative approach to risk. The reduction in lending to customers was in part due to the repayment of unsecured debt where balances reduced by £2,719 million, or 10 per cent. Secured balances reduced by £8,200 million, or 2 per cent. The proportion of mortgages on standard variable rate, or equivalent products, now stands at 56 per cent and is expected to remain broadly stable in 2012.
37
OPERATING AND FINANCIAL REVIEW AND PROSPECTS
Retail’s gross mortgage lending was £27,977 million in 2011 which was equivalent to a market share of 20 per cent. Retail’s new mortgage lending continued to be focused on home purchase with 70 per cent of lending being for house purchase rather than re-mortgaging.
Total customer deposits increased by £11,497 million, or 5 per cent, to £247,088 million in 2011. This increase was largely driven by strong growth in tax free cash ISA balances. Retail continues to perform well in the savings market despite the high levels of competition, with a strong stable of savings brands providing customers with an award winning range of products to meet their savings needs.
2010 COMPARED WITH 2009
Profit before tax from Retail was £3,031 million higher at £3,986 million compared to £955 million in 2009; profit in 2010 included £1,105 million in respect of the unwinding of the fair value adjustments arising on the acquisition of HBOS plc by the Group compared with £407 million in 2009.
Profit before tax and fair value unwind increased by £2,333 million to £2,881 million in 2010 compared to £548 million in 2009. This increase in profit was driven by higher income and a significant reduction in impairment losses, in the context of a stabilising economy, partly offset by an increase in operating expenses.
Total income increased by £908 million, or 10 per cent, to £10,255 million compared with £9,347 million in 2009 reflecting an increase in net interest income of £1,105 million, partially offset by a reduction in other income of £197 million.
Net interest income increased by 15 per cent. The net interest margin was 2.31 per cent compared with 1.95 per cent in 2009. Asset margins expanded in 2010 as a result of decreases in the LIBOR to base rate spread and stable customer interest rates. The asset margin also widened partly as a result of mortgage customers continuing to move onto, and staying on, standard variable rates and assets being priced to more appropriately reflect risk, offset by rising funding costs. The liability margin, on the other hand, has reduced as the effect of lower LIBOR to base rate spreads was partially offset by the reduction of expensive deposit balances.
Lending to customers in Retail, net of impairment provisions and fair value adjustments, was £7,327 million, or 2 per cent, lower at £363,731 million at the end of 2010 compared with £371,058 million at 31 December 2009. This reflected reduced customer demand for credit and customers continuing to reduce their personal indebtedness.
Retail’s gross new mortgage lending was £30,113 million in 2010 representing a market share of 22.1 per cent. New mortgage lending continued to be focused on supporting the housing market, with 70 per cent of the lending being for house purchase rather than re-mortgaging. Retail remained the largest lender to first time buyers in the market helping over 50,000 customers to buy their first home. It also continued to be an industry leader in its support for shared equity and shared ownership schemes. Average loan-to-value on new mortgage lending in 2010 was 60.9 per cent compared with 59.3 per cent in 2009, whilst average indexed loan-to-value on the mortgage portfolio was 55.6 per cent at 31 December 2010 compared with 54.8 per cent at 31 December 2009 and reflected the net fall in house prices in 2010.
Total customer deposits were £11,442 million, or 5 per cent, higher at £235,591 million at 31 December 2010 compared with £224,149 million at the end of 2009. The growth was predominantly from instant access and tax free cash ISA accounts, rather than more expensive term deposits. Retail continued to perform well in the savings market, with a strong stable of savings brands which can be tailored to customer demands.
Other income decreased by 11 per cent in 2010 to £1,607 million from £1,804 million in 2009 largely as a result of changes to current account overdraft charges. Retail continued to focus on having fees and rates that customers understand. It was believed that this will result in stronger customer relationships as well as supporting the deepening of those relationships. An example of this focus is the changes to the overdraft charging structure for Halifax and Bank of Scotland personal current accounts at the end of 2009, which delivered a more suitable product proposition and an improved customer experience and resulted in a reduction in other income of approximately £90 million. Similarly, the changes to the Lloyds TSB current account pricing model, which became effective at the end of 2010, provided a simpler, more sustainable proposition for customers, resulting in an overall reduction in the cost of overdraft usage.
Operating expenses increased by £78 million, or 2 per cent, to £4,644 million compared with £4,566 million in 2009. This was against a background of an increase in total income of 10 per cent and reflected ongoing cost control and synergies from the integration. The cost:income ratio for the year ended 31 December 2010 was 45.3 per cent compared to 48.8 per cent in 2009.
Impairment losses decreased by £1,480 million, or 35 per cent, to £2,747 million in 2010 compared with £4,227 million in 2009. Impairment losses as a percentage of average loans and advances to customers were 0.74 per cent in 2010 compared with 1.11 per cent in 2009. This reduction was driven primarily by the improved quality of new business and effective portfolio management, combined with the continued slow recovery of the economy. Across Retail in 2010, there were fewer cases going into arrears.
Unsecured impairment losses reduced by £983 million to £2,455 million compared with £3,438 million in 2009. This reflected a continuation of the improving portfolio trends resulting from the Group’s prudent risk appetite, with a focus on lending towards existing customers, combined with stable unemployment. Secured impairment losses of £292 million, compared with £789 million in 2009, reflected a reduction in impaired loans and improved arrears in 2010, together with the stabilising economy, more stable house prices, low interest rates and prudent lending criteria.
38
OPERATING AND FINANCIAL REVIEW AND PROSPECTS
Impaired loans in the unsecured portfolio decreased by £838 million to £2,981 million which represented 10.7 per cent of closing loans and advances to customers at 31 December 2010, compared with 11.9 per cent at 31 December 2009. The movement in impaired loans is consistent with the trends seen in both the flow of accounts to arrears and arrears balances, both of which have fallen across all unsecured products during 2010. This is a result of tightening credit policy across the credit lifecycle, including stronger controls on customer affordability, set against a stable economic environment. Retail’s exposure to revolving credit products has been actively managed to ensure that it is appropriate to customers’ changing financial circumstances. The portfolios’ results are supported by pre-recessionary levels of early arrears for accounts acquired in the last two years, highlighting an underlying improvement in the risk profile of the business. Impairment provisions decreased by £606 million, compared with 31 December 2009, to £1,507 million. Impairment provisions, as a percentage of impaired loans, decreased to 50.6 per cent at 31 December 2010 from 55.3 per cent at 31 December 2009, largely driven by more stringent criteria for new and existing unsecured collections repayment plans resulting in highly provided assets being written off.
Impaired loans in the secured portfolio decreased by £427 million to £6,769 million at 31 December 2010 and, as a percentage of closing loans and advances to customers, reduced to 2.0 per cent from 2.1 per cent at 31 December 2009. The reduction in impaired loans reflects the continued ability of customers to afford their mortgage payments in a low interest rate environment. The number of customers going into arrears remained stable throughout 2010. In the second half of 2010 fewer accounts in arrears returned to order, resulting in higher early arrears balances for 31 December 2010 compared to 30 June 2010. As reported at the 2009 year end, Specialist lending remained closed to new business and this book is in run-off.
The fair value unwind was a net credit of £1,105 million compared with a net credit of £407 million in 2009. The net fair value unwind was larger in 2010 than in 2009 and reflected a smaller charge related to the fixed rate mortgage portfolios as mortgages reached the end of their fixed term and borrowers moved to standard variable products. This was partially offset by a reduction in the credit attributed to the fixed rate savings portfolio as fixed rate term deposits, existing prior to acquisition, matured.
39
OPERATING AND FINANCIAL REVIEW AND PROSPECTS
WHOLESALE
The division comprises Wholesale Banking and Markets (WBM), Wholesale Business Support Unit and the Group’s Asset Finance business. The Wholesale Banking and Markets business serves corporates with turnover above £15 million, and financial institutions with a range of relationship focused propositions, segmented according to customer need.
Wholesale Banking and Markets businesses are grouped into three areas, coverage and product, with a support function providing centralised coordination of critical business processes and activities.
Coverage comprises of Corporate Banking, Mid Markets and Sales. Corporate Banking is responsible for the overall management of relationships with major corporate and institutional customers principally in the UK. Similarly Mid Markets manages the relationships with mid market corporates, which operate on a pan-UK basis. Sales provides customers with tailor-made risk management solutions through liability, foreign exchange, commodity and interest rate management products.
Product comprises of Capital Markets, Portfolio Management, Trading, Structured Corporate Finance, Transaction Banking, Structured Transactions Group and Lloyds Development Capital. These product units work alongside the coverage teams to provide specialised lending, access to capital markets and multi product financing solutions to WBM’s customers. In addition, these product units provide access to financial markets in order to meet the Group’s balance sheet management requirements, and provide trading infrastructure to support execution of customer driven risk management transactions.
Wholesale Business Support Unit supports corporate customers that encounter difficulties during economic downturns. Wholesale operates three teams to support customers in such difficulties – Corporate, Specialist Finance and Corporate Real Estate.
Asset Finance consists of a number of leasing and speciality lending businesses including Contract Hire (Lex Autolease) and Consumer Finance (Black Horse Motor and Personal Finance).
|
|
|
|
|
|
|
|
|
|
|
|
|
|
|
|
|
|
2011 |
|
|
|
2010 |
1 |
|
|
2009 |
1 |
|
|
|
|
£m |
|
|
|
£m |
|
|
|
£m |
|
|
Net interest income |
|
|
2,139 |
|
|
|
2,847 |
|
|
|
3,447 |
|
|
Other income |
|
|
3,335 |
|
|
|
3,974 |
|
|
|
3,787 |
|
|
Effects of liability management, volatile items and asset sales |
|
|
(1,415 |
) |
|
|
(295 |
) |
|
|
(77 |
) |
|
Total income |
|
|
4,059 |
|
|
|
6,526 |
|
|
|
7,157 |
|
|
Costs: |
|
|
|
|
|
|
|
|
|
|
|
|
|
– Operating expenses |
|
|
(2,518 |
) |
|
|
(2,752 |
) |
|
|
(3,018 |
) |
|
– Impairment of tangible fixed assets |
|
|
— |
|
|
|
(150 |
) |
|
|
— |
|
|
|
|
|
(2,518 |
) |
|
|
(2,902 |
) |
|
|
(3,018 |
) |
|
Trading surplus |
|
|
1,541 |
|
|
|
3,624 |
|
|
|
4,139 |
|
|
Impairment |
|
|
(2,901 |
) |
|
|
(4,064 |
) |
|
|
(14,861 |
) |
|
Share of results of joint ventures and associates |
|
|
14 |
|
|
|
(95 |
) |
|
|
(720 |
) |
|
Loss before tax and fair value unwind |
|
|
(1,346 |
) |
|
|
(535 |
) |
|
|
(11,442 |
) |
|
Fair value unwind |
|
|
2,174 |
|
|
|
3,049 |
|
|
|
6,760 |
|
|
Profit (loss) before tax |
|
|
828 |
|
|
|
2,514 |
|
|
|
(4,682 |
) |
|
|
|
|
1 |
As discussed on page 32, divisional results for 2010 and 2009 have been restated to reflect new funding cost and capital allocation methodologies. |
2011 COMPARED WITH 2010
Wholesale’s profit before tax decreased by £1,686 million, or 67 per cent, to £828 million in 2011, compared to £2,514 million in 2010. The decrease comprised of £2,467 million lower income, an £875 million fall in fair value unwind, partially offset by £384 million lower costs, a £1,163 million decrease in the impairment charge, and the elimination of losses in joint venture businesses. The profit performance was impacted by the effects of net derivative valuation adjustments and asset disposals net of associated fair value unwind.
Wholesale’s income performance was impacted by lower asset balances, losses on asset disposals in the year to strengthen the balance sheet and net derivative valuation adjustments. Net derivative valuation adjustments of £718 million were driven primarily by a fall in long-term sterling interest rates and higher market credit spreads. Losses on disposal of £697 million were realised from the disposal of assets and were offset by a related fair value unwind. Excluding these items, income reduced by £1,347 million or 20 per cent, primarily as a consequence of economic and market conditions, which resulted in customer deleveraging, higher funding costs, and lower trading revenues.
|
|
|
|
|
|
|
|
|
|
|
|
|
|
|
|
2011 |
|
|
2010 |
|
|
Change |
|
|
|
|
|
£m |
|
|
£m |
|
|
% |
|
|
Total income |
|
|
4,059 |
|
|
6,526 |
|
|
(38 |
) |
|
Adjustments to exclude: |
|
|
|
|
|
|
|
|
|
|
|
Net derivative valuation adjustments |
|
|
718 |
|
|
42 |
|
|
|
|
|
Gains and losses on asset sales |
|
|
697 |
|
|
253 |
|
|
|
|
|
Total income excluding net derivative valuation adjustments and gains and losses on asset sales |
|
|
5,474 |
|
|
6,821 |
|
|
(20 |
) |
40
OPERATING AND FINANCIAL REVIEW AND PROSPECTS
Net interest income decreased by £708 million, or 25 per cent, to £2,139 million in 2011 compared to £2,847 million in 2010. The decrease reflects a continued decrease of interest-earning asset balances in line with the Group’s targeted balance sheet reduction of loans and advances to customers and banks, debt securities and available-for-sale positions. Net interest income was also adversely affected by higher funding costs. This was partially offset by an increase in the liability margin resulting from the increased market value of deposits.
The net banking margin, which excludes trading activity, decreased by three basis points to 1.56 per cent in 2011 compared to 1.59 per cent in 2010. This principally reflects increased wholesale funding costs, partly offset by customer re-pricing and increased deposit margins and volumes. Asset margins decreased as the benefit of higher customer rates was more than offset by funding costs, whilst liability margins improved.
Other income decreased by £639 million, or 16 per cent, to £3,335 million in 2011 compared to £3,974 million in 2010, mainly reflecting lower income in Asset Finance and reduced trading revenues. The effect of losses on asset disposals from the continued focus on balance sheet reductions and net derivative valuations adjustments due to the increased market implied credit risk associated with customer derivative balances resulted in losses of £1,415 million in 2011 compared to £295 million in 2010.
Operating expenses decreased by £234 million, or 9 per cent, to £2,518 million in 2011 compared to £2,752 million in 2010. The decrease reflected further savings from the Integration programme, lower operating lease depreciation, lower bonus accruals and other ongoing cost management actions to mitigate the impact of inflationary increases. This was partially offset by continued investment in customer facing resources and systems.
The impairment charge decreased by £1,163 million, or 29 per cent, to £2,901 million compared to £4,064 million in 2010, reflecting a sustained decrease since the peak in 2009. As a percentage of average loans and advances to customers, the impairment charge improved to 1.95 per cent in 2011 compared to 2.23 per cent in 2010. This reflected risk management initiatives and lower defaults from continued low interest rates despite a subdued economic environment.
The share of results from joint ventures and associates comprised a profit of £14 million, an improvement of £109 million compared to 2010, due to the non-recurrence of losses and impairments taken in 2010.
Fair value unwind decreased £875 million to £2,174 million in 2011 compared to £3,049 million in 2010 due to lower impairments in the loan book, reduced release on the treasury asset book and a risk based approach to release on certain treasury assets given market conditions, partially offset by favourable exchange rate movements.
2010 COMPARED WITH 2009
Profit before tax from Wholesale improved by £7,196 million to a profit of £2,514 million compared to a loss of £4,682 million in 2009. The improvement of £7,196 million includes a credit of £3,049 million in relation to the unwinding of fair value adjustments arising from the acquisition of HBOS plc, which was reduced by £3,711 million compared to £6,760 million in 2009.
Loss before tax and fair value unwind of £535 million improved by £10,907 million from a loss of £11,442 million in 2009. The improvement was driven by a decrease in the impairment charge, a decrease in the negative share of results of joint ventures and associates and a decrease in costs, only partially offset by lower income.
Total income decreased by £631 million, or 9 per cent, to £6,526 million in 2010 due to lower net interest income and the effects of asset sales and net derivative valuation adjustments.
Net interest income was £600 million, or 17 per cent, lower at £2,847 million in 2010 compared to £3,447 million in 2009. The decline in net interest income primarily reflects lower interest-earning asset balances in line with the Group’s targeted balance sheet reduction, mainly in loans and advances to customers, debt securities and available-for-sale positions. Net interest income was affected by higher funding costs and lower lending volumes, partly offset by higher customer margins on new business and from re-pricing on renewals.
Banking net interest income, which excludes trading activity, increased by £155 million, to £2,469 million in 2010 compared to £2,314 million in 2009, with the banking net interest margin increasing by 26 basis points to 1.59 per cent in 2010 compared to 1.33 per cent in 2009.
Other income was £187 million, or 5 per cent, higher at £3,974 million in 2010 compared to £3,787 million in 2009. Other income in 2010 benefited from investment gains in Wholesale Equity as a result of stabilisation in market conditions and improved fund investment performance, strong fee income across structuring and capital markets and more favourable performance in Treasury and Trading; although these benefits were partially offset by a decrease in mark-to-market gains in Wholesale Markets, due to lower levels of market movement compared to 2009, and lower operating lease income. The effects of liability management, volatile items and asset sales was a deficit of £295 million in 2010 compared to a deficit of £77 million in 2009. This deterioration primarily reflected the fact that 2010 experienced losses on sale of assets in targeted balance sheet reductions and adverse derivative valuation adjustments.
Operating expenses decreased by £266 million, or 9 per cent, to £2,752 million in 2010 compared to £3,018 million in 2009. The decrease reflected reduced levels of operating lease depreciation and cost savings attributable to the Integration programme. This was partially offset by additional costs in the Business Support Unit and continued investment in customer facing resources and systems.
The impairment charge decreased by £10,797 million to £4,064 million in 2010 compared to £14,861 million in 2009. The impairment charge on loans and advances as a percentage of average loans and advances to customers improved to 2.23 per cent in 2010 compared to 6.38 per cent in 2009. The decrease reflected reductions, notably in the heritage HBOS corporate real estate and real estate-related portfolios and heritage HBOS Corporate (UK and US) portfolios, and write backs from asset disposals, due to the stabilising economic environment, low interest rates which helped to maintain defaults at reduced levels, the stabilisation of UK real estate prices and provisioning against base case assumptions undertaken on the acquired heritage HBOS portfolios in the first half of 2009.
The share of losses from joint ventures and associates comprised a small loss for the year ended 31 December 2010 of £95 million, a decrease of £625 million. This represented a net reduction in both the value and size of the portfolio compared to the prior year. The majority of the portfolio was valued at nil with a remaining portfolio carrying value of approximately £128 million at 31 December 2010.
Wholesale’s fair value unwind credit of £3,049 million decreased by £3,711 million in 2010 from £6,760 million in 2009 due to lower impairments in 2010 relating to the HBOS assets that were fair valued on acquisition, partially offset by charges relating to the expected losses on acquired debt securities and by fair value releases on sales.
41
OPERATING AND FINANCIAL REVIEW AND PROSPECTS
COMMERCIAL
The Commercial business serves in excess of a million small and medium sized enterprises (SMEs) and community organisations with turnover up to £15 million. Customers range from start-up enterprises to established corporations, with a range of propositions aligned to customer needs. The business comprises Commercial Banking and Commercial Finance, the invoice discounting and factoring business which also offers hire purchase, leasing and supplier finance products.
Commercial supports the trading, investment and protection needs of business customers, principally in the UK. Its vision is to be the relationship bank of choice across the UK for SME customers; committed to supporting the economy and communities through encouraging enterprise, providing access to finance and fair and transparent pricing. As part of this the business is working to meet Lending Commitments, agreed with the UK Government, with a focus on a through the cycle credit policy and a proactive programme of support. Lloyds Banking Group is investing both in Commercial and in other parts of the Group to enhance products and services to SMEs and support the lives and prospects of customers through their business life cycle.
|
|
|
|
|
|
|
|
|
|
|
|
|
|
|
|
2011 |
|
|
2010 |
1 |
|
2009 |
1 |
|
|
|
|
£m |
|
|
£m |
|
|
£m |
|
|
Net interest |
|
|
1,251 |
|
|
1,127 |
|
|
1,084 |
|
|
Other income |
|
|
446 |
|
|
457 |
|
|
489 |
|
|
Total income |
|
|
1,697 |
|
|
1,584 |
|
|
1,573 |
|
|
Operating expenses |
|
|
(948 |
) |
|
(992 |
) |
|
(1,088 |
) |
|
Trading surplus |
|
|
749 |
|
|
592 |
|
|
485 |
|
|
Impairment |
|
|
(303 |
) |
|
(382 |
) |
|
(822 |
) |
|
Profit (loss) before tax and fair value unwind |
|
|
446 |
|
|
210 |
|
|
(337 |
) |
|
Fair value unwind |
|
|
53 |
|
|
81 |
|
|
137 |
|
|
Profit (loss) before tax |
|
|
499 |
|
|
291 |
|
|
(200 |
) |
|
|
|
|
1 |
As discussed on page 32, divisional results for 2010 and 2009 have been restated to reflect new funding cost and capital allocation methodologies. |
2011 COMPARED WITH 2010
Profit before tax increased by £208 million, or 71 per cent, to £499 million in 2011 compared to £291 million in 2010; this was due to higher income, combined with a reduction in impairments and costs.
Total income increased by £113 million, or 7 per cent, to £1,697 milion in 2011 compared to £1,584 million in 2010. Net interest income grew by £124 million, or 11 per cent, to £1,251 million in 2011 compared to £1,127 million in 2010 due largely to the increase in deposit balances, and a higher net interest margin. This deposit balance growth, the beneficial effect of the consequently larger funding surplus, and a more favourable deposit mix were the key drivers behind the 47 basis point increase in banking net interest margin. Other operating income decreased by 2 per cent, reflecting subdued levels of business activity in the early part of the year and reduced levels of money transmission income reflecting the greater use of electronic banking facilities by customers.
Operating expenses reduced by £44 million, or 4 per cent, to £948 million in 2011 compared to £992 million in 2010, primarily as a result of integration cost savings including lower back office staffing requirements.
The impairment charge reduced by £79 million, or 21 per cent, to £303 million in 2011 compared to £382 million in 2010 due to an overall improvement in the credit quality of the portfolio reflected in a reduction in observed default and delinquency rates. This is supported by the success of the specialist relationship support, which helps customers facing difficult business conditions.
Lending to customers in Commercial, net of impairment provisions and fair value adjustments arising from the acquisition of HBOS plc by the Group, was £196 million higher at £28,750 million at 31 December 2011 compared to £28,554 million at the end of 2010. This reflects the continuing support given to small and medium sized businesses, fully offsetting the reduction in assets outside the Group’s risk appetite.
Customer deposits have risen by £796 million, or 3 per cent, from £31,311 million at 31 December 2010 to £32,107 million at 31 December 2011. This increase reflects ongoing success in SME recruitment, combined with targeted support in key customer segments such as the education and legal sectors.
Risk-weighted assets decreased by £1,118 million, or 4 per cent, from £26,552 million at 31 December 2010 to £25,434 million at 31 December 2011, reflecting the improved mix and risk profile of the portfolio.
2010 COMPARED WITH 2009
Profit before tax from Commercial increased by £491 million to a profit of £291 million in 2010 compared to a loss of £200 million in 2009. Profit before tax and fair value unwind increased by £547 million to a profit of £210 million in 2010 compared to a loss of £337 million in 2009, largely as a result of lower impairment charges.
Total income increased by £11 million, or 1 per cent, to £1,584 million in 2010 compared to £1,573 million in 2009.
Lending to customers in Commercial, net of impairment provisions and fair value adjustments arising from the acquisition of HBOS plc by the Group, was £73 million lower at £28,554 million at 31 December 2010 compared to £28,627 million at the end of 2009. Customer deposits were £881 million, or 3 per cent, higher at £31,311 million at 31 December 2010 compared to £30,430 million at the end of 2009.
Net interest income was £43 million, or 4 per cent, higher at £1,127 million in 2010 compared to £1,084 million in 2009. The net interest margin, adjusted to exclude products where either the funding costs or the related revenues are recognised in other income, improved by 29 basis points to 3.74 per cent in 2010 compared to 3.45 per cent in 2009.
Other income was £32 million lower at £457 million in 2010 compared to £489 million in 2009, mainly due to a decline in money transmission fees and commission income.
Operating expenses decreased by £96 million, or 9 per cent, to £992 million in 2010 compared to £1,088 million in 2009 as a result of embedded cost savings programmes across Commercial delivering positive results, leading to an improvement in the cost: income ratio to 62.6 per cent in 2010 from 69.2 per cent in 2009.
Impairment losses decreased by £440 million to £382 million in 2010 compared to £822 million in 2009. Impairment losses on loans and advances as a percentage of average loans and advances to customers were 1.24 per cent in 2010 compared to 2.72 per cent in 2009. There was an overall improvement in the credit quality of the portfolio and a reduction in observed default rates.
42
OPERATING AND FINANCIAL REVIEW AND PROSPECTS
WEALTH AND INTERNATIONAL
The Wealth business comprises private banking, wealth management and asset management. Wealth’s global private banking and wealth management operations cater to the full range of wealth clients from affluent to Ultra High Net Worth within the UK, UK expatriates and others with UK connections. The private banking and wealth management business operates under the Lloyds TSB and Bank of Scotland brands. The asset management business, Scottish Widows Investment Partnership, has a broad client base, managing assets for Lloyds Banking Group customers as well as a wide range of clients including pension funds, charities, local authorities, Discretionary Managers and Financial Advisers. In addition, the Group holds a 60 per cent stake in St James’s Place, the UK’s largest independent listed wealth manager.
The International business comprises the Group’s other international banking businesses outside the UK, with the exception of corporate business in North America which is managed through the Group’s Wholesale division. These largely comprise corporate, commercial and asset finance business in Australia and Continental Europe and retail businesses in Germany and the Netherlands.
|
|
|
|
|
|
|
|
|
|
|
|
|
|
|
|
2011 |
|
|
2010 |
1 |
|
2009 |
1 |
|
|
|
|
£m |
|
|
£m |
|
|
£m |
|
|
Net interest income |
|
|
828 |
|
|
1,050 |
|
|
1,140 |
|
|
Other income |
|
|
1,197 |
|
|
1,123 |
|
|
1,128 |
|
|
Effects of liability management, volatile items and asset sales |
|
|
— |
|
|
37 |
|
|
— |
|
|
Total income |
|
|
2,025 |
|
|
2,210 |
|
|
2,268 |
|
|
Operating expenses |
|
|
(1,548 |
) |
|
(1,536 |
) |
|
(1,544 |
) |
|
Trading surplus |
|
|
477 |
|
|
674 |
|
|
724 |
|
|
Impairment |
|
|
(4,610 |
) |
|
(5,988 |
) |
|
(4,078 |
) |
|
Share of results of joint ventures and associates |
|
|
3 |
|
|
(8 |
) |
|
(21 |
) |
|
Loss before tax and fair value unwind |
|
|
(4,130 |
) |
|
(5,322 |
) |
|
(3,375 |
) |
|
Fair value unwind |
|
|
194 |
|
|
372 |
|
|
942 |
|
|
Loss before tax |
|
|
(3,936 |
) |
|
(4,950 |
) |
|
(2,433 |
) |
|
|
|
|
|
|
|
|
|
|
|
|
|
Wealth |
|
|
189 |
|
|
220 |
|
|
198 |
|
|
International |
|
|
(4,319 |
) |
|
(5,542 |
) |
|
(3,573 |
) |
|
Loss before tax and fair value unwind |
|
|
(4,130 |
) |
|
(5,322 |
) |
|
(3,375 |
) |
|
|
|
|
1 |
As discussed on page 32, divisional results for 2010 and 2009 have been restated to reflect new funding cost and capital allocation methodologies. |
2011 COMPARED WITH 2010
Loss before tax and fair value unwind reduced by £1,192 million, or 22 per cent, to £4,130 million in 2011 compared to £5,322 million in 2010 as a lower impairment charge, predominantly in Ireland, more than offset lower income and higher costs.
Total income decreased by £185 million, or 8 per cent, to £2,025 million in 2011 compared to £2,210 in 2010.
Net interest income decreased by £222 million, or 21 per cent, to £828 million in 2011 compared to £1,050 million in 2010. There was a reduction of 25 per cent in constant currency terms. Higher funding costs and the increased strain of impaired assets, reflected in a reduction in net lending margins together with lower lending volumes impacting net interest income were partially offset by the impact of the stronger Australian dollar in International. Deposit margins increased, reflecting changing product mix predominantly as a result of continued deposit inflows in the on-line deposit business at higher margins together with improving margins across the Wealth businesses.
Other income increased by £74 million, or 7 per cent, to £1,197 million in 2011 compared to £1,123 million in 2010 mainly due to foreign exchange benefits in International. Excluding the impact of foreign exchange, other income decreased by 1 per cent.
Operating expenses and other costs increased by £12 million, or 1 per cent to £1,548 million in 2011 compared to £1,536 million in 2010, due to increased investment in the International deposit business, the impact of the stronger Australian dollar and Swiss franc and additional regulatory costs in Wealth. On a constant currency basis, operating expenses reduced by 1 per cent, reflecting cost saving initiatives.
The impairment charge reduced by £1,378 million or 23 per cent, to £4,610 million in 2011 compared to £5,988 million in 2010. Following increased charges in the last quarter of 2010, driven by the significant deterioration in the economic environment in Ireland, the rate of impaired loan migration has slowed in 2011.
The impairment charge within Wealth increased by £54 million to £100 million in 2011 compared to £46 million in 2010 primarily due to increased charges in the Group’s Spanish mortgage book reflecting deterioration in the local property markets and economic outlook in Spain.
43
OPERATING AND FINANCIAL REVIEW AND PROSPECTS
The
impairment charge in International decreased by £1,432 million, or 24 per cent,
to £4,510 million in 2011 compared to £5,942 million in 2010.
This impairment
charge is analysed by key geography in the following table.
|
|
|
|
|
|
|
|
|
|
|
|
Impairment charges |
|
||||
|
|
|
|
2011 |
|
|
2010 |
|
|
|
|
|
£m |
|
|
£m |
|
|
Ireland |
|
|
3,187 |
|
|
4,264 |
|
|
Australia |
|
|
1,034 |
|
|
1,362 |
|
|
Wholesale Europe |
|
|
204 |
|
|
210 |
|
|
Latin America/Middle East |
|
|
64 |
|
|
97 |
|
|
Netherlands |
|
|
21 |
|
|
9 |
|
|
|
|
|
4,510 |
|
|
5,942 |
|
The impairment charge reduced by £1,432 million, or 24 per cent, to £4,510 million due to reduced impairment charges in Ireland and Australia.
2010 COMPARED WITH 2009
The results of Wealth and International deteriorated by £2,517 million, or 103 per cent, to a loss before tax of £4,950 million in 2010 compared to a loss of £2,433 million in 2009.
Loss before tax and fair value unwind deteriorated by £1,947 million, or 58 per cent, to £5,322 million compared to a loss of £3,375 million in 2009, due, in particular, to a higher impairment charge, predominantly in Ireland. An improvement in profits in the Wealth business was more than offset by the increased losses in the International business.
Net interest income decreased by £90 million, or 8 per cent, to £1,050 million in 2010 compared to £1,140 million in 2009, as a 12 basis points decline in the banking net interest margin more than offset the favourable impact of foreign currency movements, particularly the Australian dollar, and the income on the £7 billion European loan portfolio transferred in from the Wholesale division in the second half of 2009.
Other income was £32 million, or 3 per cent, higher at £1,160 million in 2010 compared to £1,128 million in 2009. This increase reflected favourable foreign exchange movements and restrained growth in the Wealth business, with lower asset management fee income following the sale of the external fund management business of Insight Investment in November 2009.
Operating expenses decreased by £8 million, or 1 per cent, to £1,536 million in 2010 compared to £1,544 million in 2009, with cost savings achieved from integration, particularly in the asset management businesses in Wealth, partly offset by investment in International’s German deposit taking operation, increased risk management resources to manage impaired asset portfolios in Ireland and Australia, costs associated with the closure of the Irish business, and the effect of stronger foreign currency rates.
The impairment charge was £1,910 million, or 47 per cent, higher at £5,988 million in 2010, compared to £4,078 million in 2009, reflecting the material deterioration in the economic environment in Ireland in the last quarter of 2010, that resulted in EU-IMF financial support in late November 2010, and the tightening of liquidity in the second half of 2010 in regional Australian property markets to which the Group is exposed.
The impairment charge is summarised by key geography in the following table.
|
|
|
|
|
|
|
|
|
|
|
|
|
2010 |
|
|
2009 |
|
|
|
|
|
£m |
|
|
£m |
|
|
Ireland |
|
|
4,264 |
|
|
2,949 |
|
|
Australia |
|
|
1,362 |
|
|
849 |
|
|
Wholesale Europe |
|
|
210 |
|
|
129 |
|
|
Latin America/Middle East |
|
|
97 |
|
|
69 |
|
|
Netherlands |
|
|
9 |
|
|
11 |
|
|
International |
|
|
5,942 |
|
|
4,007 |
|
|
Wealth |
|
|
46 |
|
|
71 |
|
|
Wealth and International |
|
|
5,988 |
|
|
4,078 |
|
Loans and advances to customers decreased by £8,191 million, or 13 per cent, to £55,357 million at 31 December 2010 compared to £63,548 million at the end of 2009, reflecting net repayments of some £4.1 billion, and additional impairment provisions in the International businesses, partly offset by foreign exchange movements of some £1.1 billion.
Customer deposits increased by £3,747 million, or 13 per cent, to £32,784 million at 31 December 2010 compared to £29,037 million at the end of 2009, due to strong inflows in UK Private Banking and Bank of Scotland Germany, partly offset by outflows in Ireland following the closure of the Irish retail branch network.
44
OPERATING AND FINANCIAL REVIEW AND PROSPECTS
INSURANCE
The Insurance division provides long-term savings, protection and investment products and general insurance products to customers in the UK and Europe and consists of three elements:
Life, Pensions and Investments UK
The UK Life, Pensions and Investments business is the leading Bancassurance provider in the UK and has one of the largest intermediary channels in the industry. The business provides long-term savings, protection and investment products distributed through the bancassurance, intermediary and direct channels using the Lloyds TSB, Halifax, Bank of Scotland and Scottish Widows brands.
In common with other life assurance companies in the UK, the life and pensions business of each of the life assurance companies in the Lloyds Banking Group is written in a long-term business fund. The main long-term business funds are divided into one or both of With Profit and Non-Profit sub funds.
With-profits life and pensions products are written from the respective With Profit sub-funds in the Group. The benefits accruing from these policies are designed to provide a smoothed return to policyholders who hold their policies to maturity through a mix of annual and final (or terminal) bonuses added to guaranteed basic benefits. The guarantees generally only apply on death or maturity. The actual bonuses declared will reflect the experience of the With Profit sub-fund.
Other life and pensions products are generally written from Non-Profit sub-funds.
Examples include unit-linked policies, annuities, term assurances and health insurance (under which a predetermined amount of benefit is payable in the event of an insured event such as being unable to work through sickness). The benefits provided by linked policies are wholly or partly determined by reference to a specific portfolio of assets known as unit-linked funds.
Life, Pensions and Investments Europe
The European Life, Pensions and Investments business distributes products primarily in the German market under the Heidelberger Leben and Clerical Medical brands.
General Insurance
The General Insurance business is a leading distributor of home insurance in the UK, with products sold through the branch network, direct channels and strategic corporate partners. The business also has brokerage operations for personal and commercial insurances. It operates primarily under the Lloyds TSB, Halifax and Bank of Scotland brands.
|
|
|
|
|
|
|
|
|
|
|
|
|
|
|
|
2011 |
|
|
2010 |
1 |
|
2009 |
1 |
|
Net interest income |
|
|
(67 |
) |
|
(39 |
) |
|
(59 |
) |
|
Other income |
|
|
2,687 |
|
|
2,799 |
|
|
2,944 |
|
|
Effects of liability management, volatile items and asset sales |
|
|
— |
|
|
15 |
|
|
— |
|
|
Total income |
|
|
2,620 |
|
|
2,775 |
|
|
2,885 |
|
|
Insurance claims |
|
|
(343 |
) |
|
(542 |
) |
|
(637 |
) |
|
Total income, net of insurance claims |
|
|
2,277 |
|
|
2,233 |
|
|
2,248 |
|
|
Operating expenses |
|
|
(812 |
) |
|
(854 |
) |
|
(974 |
) |
|
Share of results of joint ventures and associates |
|
|
— |
|
|
(10 |
) |
|
(22 |
) |
|
Profit before tax and fair value unwind |
|
|
1,465 |
|
|
1,369 |
|
|
1,252 |
|
|
Fair value unwind |
|
|
(43 |
) |
|
(43 |
) |
|
(49 |
) |
|
Profit before tax |
|
|
1,422 |
|
|
1,326 |
|
|
1,203 |
|
|
|
|
|
|
|
|
|
|
|
|
|
|
Profit before tax and fair value unwind by business unit |
|
|
|
|
|
|
|
|
|
|
|
Life, Pensions and Investments: |
|
|
|
|
|
|
|
|
|
|
|
UK business |
|
|
886 |
|
|
830 |
|
|
792 |
|
|
European business |
|
|
82 |
|
|
127 |
|
|
95 |
|
|
Total Life, Pensions and Investments |
|
|
968 |
|
|
957 |
|
|
887 |
|
|
General Insurance |
|
|
497 |
|
|
412 |
|
|
365 |
|
|
Profit before tax and fair value unwind |
|
|
1,465 |
|
|
1,369 |
|
|
1,252 |
|
|
|
|
|
1 |
As discussed on page 32, divisional results for 2010 and 2009 have been restated to reflect new funding cost and capital allocation methodologies. |
45
OPERATING AND FINANCIAL REVIEW AND PROSPECTS
2011 COMPARED WITH 2010
Profit before tax from Insurance was £96 million, or 7 per cent higher, at £1,422 million compared to £1,326 million in 2010. In 2010 income was reduced by a non-recurring charge of £70 million in respect of the Group’s decision to cease writing new PPI business. Excluding this charge profit before tax and fair value unwind increased by £26 million, or 2 per cent in 2011.
Total income, net of insurance claims, increased by £44 million, or 2 per cent, to £2,277 million from £2,233 million in 2010. This is attributable to strong sales of corporate pensions through the intermediary channel and the continued change in new business mix within Life, Pensions and Investments UK (LP&I UK) towards a more profitable protection business reflecting a focus on meeting customer needs in an area where there is a general level of under provision in the UK. Improved claims experience within General Insurance which has been offset by lower PPI related income is also a significant contributor to this.
Insurance claims of £343 million were £199 million, or 37 per cent lower, than £542 million in 2010, mainly due to improved claims experience as a result of the run off of the PPI business and lower unemployment claims and lower property claims following the severe weather events that impacted January and December 2010.
Operating expenses and other costs decreased by £42 million, or 5 per cent, from £854 million to £812 million due mainly to a continued focus on cost management and delivery of integration cost savings, partly offset by an additional charge in relation to an industry wide Financial Services Compensation Scheme (FSCS) levy in 2011.
2010 COMPARED WITH 2009
Profit before tax from Insurance was £123 million higher, or 10 per cent, at £1,326 million compared to £1,203 million in 2009. Profit before tax and fair value unwind was £117 million higher, or 9 per cent, at £1,369 million compared to £1,252 million in 2009.
Net interest income was £20 million, or 34 per cent, better at a deficit of £39 million in 2010 compared to a deficit of £59 million in 2009.
Other income decreased by £130 million, or 4 per cent, to £2,814 million in 2010 compared to £2,944 million in 2009 largely resulting from the decrease in PPI income as a result of the Group’s decision to cease writing payment protection business, partially off-set by improved new business income and the higher than expected return from improved investment markets.
Total income, net of insurance claims, decreased by £15 million, or 1 per cent, to £2,233 million in 2010 compared to £2,248 million in 2009, primarily reflecting lower PPI income and claims arising from the freeze events in 2010, which are offset by reduced payment protection insurance claims and improved investment markets.
Insurance claims were £95 million, or 15 per cent, lower at £542 million in 2010 compared to £637 million in 2009 reflecting improved unemployment claims experience. The home book has been particularly affected by the freeze events experienced in January and December 2010. This was partly offset by the benefits of ongoing claims processing improvements and integration.
Operating expenses decreased by £120 million, or 12 per cent, to £854 million in 2010 compared to £974 million in 2009 due to a continued focus on cost management and delivery of integration synergies.
46
OPERATING AND FINANCIAL REVIEW AND PROSPECTS
LIFE, PENSIONS AND INVESTMENTS
UK BUSINESS
|
|
|
|
|
|
|
|
|
|
|
|
|
|
|
|
2011 |
|
|
2010 |
1 |
|
2009 |
1 |
|
Net interest income |
|
|
(62 |
) |
|
(48 |
) |
|
(86 |
) |
|
Other income |
|
|
1,458 |
|
|
1,408 |
|
|
1,474 |
|
|
Total income |
|
|
1,396 |
|
|
1,360 |
|
|
1,388 |
|
|
Operating expenses |
|
|
(510 |
) |
|
(530 |
) |
|
(596 |
) |
|
Profit before tax and fair value unwind |
|
|
886 |
|
|
830 |
|
|
792 |
|
|
|
|
|
|
|
|
|
|
|
|
|
|
Profit before tax and fair value unwind analysis |
|
|
|
|
|
|
|
|
|
|
|
New business profit – insurance business2 |
|
|
382 |
|
|
332 |
|
|
328 |
|
|
– investment business2 |
|
|
(51 |
) |
|
(65 |
) |
|
(196 |
) |
|
Total new business profit |
|
|
331 |
|
|
267 |
|
|
132 |
|
|
Existing business profit3 |
|
|
539 |
|
|
611 |
|
|
606 |
|
|
Experience and assumption changes |
|
|
16 |
|
|
(48 |
) |
|
54 |
|
|
Profit before tax and fair value unwind |
|
|
886 |
|
|
830 |
|
|
792 |
|
|
|
|
|
1 |
As discussed on page 32, divisional results for 2010 and 2009 have been restated to reflect new funding cost and capital allocation methodologies. |
|
|
|
|
2 |
As required under IFRS, products are split between insurance and investment contracts depending on the level of insurance risk contained. For insurance contracts, the new business profit includes the net present value of profits expected to emerge over the lifetime of the contract, including profits anticipated in periods after the year of sale; for investment contracts the figure reflects the profit in the year of sale only, after allowing for the deferral of initial income and expenses. Consequently the recognition of profit for investment contracts is deferred relative to insurance contracts. |
|
|
|
|
3 |
The disclosure of existing business profit has been changed to better reflect the performance of the business. Existing business profit includes the expected return on shareholder’s net assets and experience and assumption changes are disclosed separately. |
2011 COMPARED WITH 2010
Total new business profit increased by £64 million, or 24 per cent, to £331 million. The increase is primarily attributable to strong sales of corporate pensions through the intermediary channel, the continued growth of protection business in the bancassurance channel as the Group helps more customers and address the sizeable protection gap that exists in the UK and reduction in lower margin business following the launch of the integrated bancassurance proposition in June 2010.
Existing business profit has decreased by £72 million, or 12 per cent, to £539 million. The decrease predominantly reflects higher interest payments following capital restructuring initiatives, a reduction in the assumed rate of return, and lower levels of shareholder net assets following capital repatriation initiatives in 2010.
The net impact of experience variances and assumption changes has increased to a credit of £16 million in 2011 from a charge of £48 million in 2010. The benefit mainly reflects the absence of the £70 million charge taken in 2010 from the Group’s decision to cease writing new PPI business.
2010 COMPARED WITH 2009
Profit before tax and fair value unwind increased by £38 million, or 5 per cent, to £830 million in 2010 compared to £792 million in 2009. New business profit increased by £135 million, or 102 per cent, to £267 million. The increase primarily reflects a reduction in initial commission on OEICs sold through the branch network and cost reductions through integration across the sales channels in addition to progress made on product participation choices.
Existing business profit increased by £5 million, or 1 per cent, to £611 million in 2010 compared to £606 million in 2009. This predominantly reflected higher asset values and a higher assumed rate of return following improved market conditions in the second half of 2009.
Profits arising from experience and assumption changes decreased by £102 million to a loss of £48 million mainly reflecting the non-recurrence of benefits recognised in 2009, including a liability management gain of £30 million. During 2010 a review was undertaken into the charging between the funds of Clerical Medical prior to the acquisition of HBOS, giving rise to a charge of £132 million. In addition, assumptions regarding future maintenance expenses within the Clerical Medical business were aligned to reflect the heritage Lloyds TSB approach, giving rise to a charge of £119 million.
These charges relate to pre-acquisition matters and were largely offset by the release of fair value provisions.
47
OPERATING AND FINANCIAL REVIEW AND PROSPECTS
EUROPEAN BUSINESS
2011 COMPARED WITH 2010
Profit before tax and fair value unwind decreased by £45 million, or 35 per cent, to £82 million in 2011 compared to £127 million in 2010. The reduction is driven largely by a non-recurring charge following clarification by the German regulator (BaFin) surrounding the deduction of tax and policy-holder distributions and experience and assumption charges.
2010 COMPARED WITH 2009
Profit before tax and fair value unwind increased by £32 million, or 34 per cent, to £127 million in 2010 compared to £95 million in 2009 driven largely by experience and assumption changes. New business sales reflected difficult economic and market conditions in Germany, the division’s main European market.
NEW BUSINESS
The table below provides an analysis of the present value of new business premiums (PVNBP) for business written by the Insurance division, split between the UK and European Life, Pensions and Investments businesses. PVNBP is the measure of new business premiums for the life and pensions business and OEIC sales that management monitors because it provides an indication of the performance of the business – this is calculated as the value of single premiums plus the discounted present value of future expected regular premiums.
|
|
|
|
|
|
|
|
|
|
|
|
|
|
|
|
|
|
|
|
|
|
|
|
|
|
|
|
|
|
|
|
|
UK |
|
2011 |
|
Total |
|
UK |
|
2010 |
|
Total |
|
UK |
|
2009 |
|
Total |
|
|||||||||
|
Protection |
|
|
708 |
|
|
53 |
|
|
761 |
|
|
574 |
|
|
56 |
|
|
630 |
|
|
519 |
|
|
49 |
|
|
568 |
|
|
Payment protection |
|
|
21 |
|
|
— |
|
|
21 |
|
|
70 |
|
|
— |
|
|
70 |
|
|
153 |
|
|
— |
|
|
153 |
|
|
Savings and investments |
|
|
1,133 |
|
|
246 |
|
|
1,379 |
|
|
1,617 |
|
|
315 |
|
|
1,932 |
|
|
2,689 |
|
|
312 |
|
|
3,001 |
|
|
Individual pensions |
|
|
1,480 |
|
|
144 |
|
|
1,624 |
|
|
1,606 |
|
|
141 |
|
|
1,747 |
|
|
2,275 |
|
|
185 |
|
|
2,460 |
|
|
Corporate and other pensions |
|
|
4,423 |
|
|
— |
|
|
4,423 |
|
|
2,750 |
|
|
— |
|
|
2,750 |
|
|
2,600 |
|
|
— |
|
|
2,600 |
|
|
Retirement income |
|
|
747 |
|
|
— |
|
|
747 |
|
|
889 |
|
|
— |
|
|
889 |
|
|
887 |
|
|
— |
|
|
887 |
|
|
Managed fund business |
|
|
116 |
|
|
— |
|
|
116 |
|
|
177 |
|
|
— |
|
|
177 |
|
|
146 |
|
|
— |
|
|
146 |
|
|
Life and pensions |
|
|
8,628 |
|
|
443 |
|
|
9,071 |
|
|
7,683 |
|
|
512 |
|
|
8,195 |
|
|
9,269 |
|
|
546 |
|
|
9,815 |
|
|
OEICs |
|
|
1,591 |
|
|
— |
|
|
1,591 |
|
|
2,633 |
|
|
— |
|
|
2,633 |
|
|
3,704 |
|
|
— |
|
|
3,704 |
|
|
Total |
|
|
10,219 |
|
|
443 |
|
|
10,662 |
|
|
10,316 |
|
|
512 |
|
|
10,828 |
|
|
12,973 |
|
|
546 |
|
|
13,519 |
|
|
|
|
|
|
|
|
|
|
|
|
|
|
|
|
|
|
|
|
|
|
|
|
|
|
|
|
|
|
|
|
Analysis by channel |
|
|
|
|
|
|
|
|
|
|
|
|
|
|
|
|
|
|
|
|
|
|
|
|
|
|
|
|
|
Intermediary |
|
|
6,415 |
|
|
443 |
|
|
6,858 |
|
|
5,365 |
|
|
512 |
|
|
5,877 |
|
|
5,639 |
|
|
546 |
|
|
6,185 |
|
|
Bancassurance |
|
|
3,216 |
|
|
— |
|
|
3,216 |
|
|
4,432 |
|
|
— |
|
|
4,432 |
|
|
6,997 |
|
|
— |
|
|
6,997 |
|
|
Direct |
|
|
588 |
|
|
— |
|
|
588 |
|
|
519 |
|
|
— |
|
|
519 |
|
|
337 |
|
|
— |
|
|
337 |
|
|
Total |
|
|
10,219 |
|
|
443 |
|
|
10,662 |
|
|
10,316 |
|
|
512 |
|
|
10,828 |
|
|
12,973 |
|
|
546 |
|
|
13,519 |
|
2011 COMPARED WITH 2010
Total sales (PVNBP) have reduced by £166 million, or 2 per cent to £10,662 million in 2011 compared to £10,828 million in 2010. New business margins have improved to 4.0 per cent in 2011 from 3.5 per cent in 2010. This partly reflects the launch of the integrated bancassurance proposition in June 2010 which has resulted in a change in mix away from higher single premium savings products towards lower premium, higher margin, protection business.
Despite the reduction in sales total new business profit within LP&I UK increased by £64 million, or 24 per cent, to £331 million.
Sales (PVNBP), excluding OEICs have increased by 11 per cent, and although OEIC sales have decreased by 40 per cent the new business margin on these sales has increased, reflecting the focus on value over volume.
Within the intermediary channel the increase in sales of £981 million, or 17 per cent, mainly reflects strong sales of corporate pensions in LP&I UK. The increase in sales has been achieved whilst maintaining the new business margin on corporate pension business.
In the bancassurance channel the reduction in sales reflects a change in mix away from savings products which generate a higher PVNBP towards protection business, which although more profitable, generates lower PVNBP. Sales of savings products have been particularly affected by recent stock market turbulence and lower consumer confidence, particularly in the second half of the year. Despite the reduction in PVNBP there was an increase in new business profit largely as a result of the increase in protection sales reflecting success in helping customers address their protection needs.
2010 COMPARED WITH 2009
The present value of new business premiums reduced by £2,691 million, or 20 per cent, to £10,828 million in 2010 compared to £13,519 million in 2009. This largely reflected the withdrawal in 2009 of certain HBOS legacy products with lower returns.
In the Bancassurance channel the reduction reflects the removal from sale of an HBOS guaranteed investment plan sold in 2009 and, since the integrated Bancassurance proposition was launched in June 2010, a change in mix away from savings products towards more profitable protection business in line with the legacy Lloyds TSB strategy. Sales of OEICs have been further adversely affected by a reduction in the volume of capital protected products given improved investment markets. However, sales of protection products have increased by 11 per cent and the aggregate new business margin has increased.
48
OPERATING AND FINANCIAL REVIEW AND PROSPECTS
Within the Intermediary channel the reduction in volumes primarily reflects the withdrawal of low returning HBOS individual pension products, partly offset by an increase in sales of the on-going Retirement Account pension product and strong sales of corporate pensions.
GENERAL INSURANCE
|
|
|
|
|
|
|
|
|
|
|
|
|
|
|
|
2011 |
|
|
2010 |
1 |
|
2009 |
1 |
|
Home insurance |
|
|
857 |
|
|
862 |
|
|
874 |
|
|
Payment protection insurance |
|
|
125 |
|
|
253 |
|
|
349 |
|
|
Other |
|
|
53 |
|
|
70 |
|
|
69 |
|
|
Net operating income |
|
|
1,035 |
|
|
1,185 |
|
|
1,292 |
|
|
Claims paid on insurance contracts (net of reinsurance) |
|
|
(343 |
) |
|
(542 |
) |
|
(637 |
) |
|
Operating income, net of claims |
|
|
692 |
|
|
643 |
|
|
655 |
|
|
Operating expenses |
|
|
(195 |
) |
|
(221 |
) |
|
(268 |
) |
|
Share of results of joint ventures and associates |
|
|
— |
|
|
(10 |
) |
|
(22 |
) |
|
Profit before tax and fair value unwind |
|
|
497 |
|
|
412 |
|
|
365 |
|
|
|
|
|
1 |
As discussed on page 32, divisional results for 2010 and 2009 have been restated to reflect new funding cost and capital allocation methodologies. |
2011 COMPARED WITH 2010
Profit before tax and fair value unwind from General Insurance increased by £85 million, or 21 per cent to £497 million compared to £412 million in 2010. The increase was primarily due to improved PPI claims experience from the run off of this business line, the absence of severe weather related claims as experienced in 2010 and lower expenses.
Total income for home insurance was broadly unchanged from 2010 at £857 million and reflects the maturity and competitiveness of the market.
Claims of £343 million were £199 million, or 37 per cent lower, than £542 million in 2010, mainly due to improved claims experience as a result of the run off of the PPI business and lower unemployment claims and lower property claims following the severe weather events that impacted January and December 2010.
Operating expenses decreased by £26 million, or 12 per cent, to £195 million in 2011 compared to £221 million in 2010 primarily as a result of further delivery of integration savings and a continued focus on cost management.
2010 COMPARED WITH 2009
Profit before tax and fair value unwind from General Insurance increased by £47 million, or 13 per cent, to £412 million in 2010 compared to £365 million in 2009, due primarily to improved unemployment claims experience plus integration synergies, after taking account of lower income resulting from ceasing to write new PPI business and freeze related claims.
Underwriting income for home insurance showed modest growth of £25 million, or 3 per cent, to £922 million in 2010 compared to £897 million in 2009. Home commission payable was adversely affected by the alignment of commission arrangements between the legacy businesses during the year.
PPI underwriting income decreased by £187 million, or 26 per cent, to £544 million in 2010 compared to £731 million in 2009 reflecting the continued impact on new business volumes from the market wide move to monthly premiums in 2009 and the Group’s withdrawal from the payment protection market on 23 July 2010. Changes in commission payable reflected lower volumes of PPI written during the year.
Claims were £95 million, or 15 per cent, lower at £542 million in 2010 compared to £637 million in 2009 reflecting lower unemployment claims experience. The home book has been particularly affected by the freeze events experienced in January and December 2010. This has been partly offset by the benefits of ongoing claims processing improvements and integration.
Operating expenses decreased by £47 million, or 18 per cent, to £221 million in 2010 compared to £268 million in 2009 primarily as a result of the alignment of commission arrangements on home insurance, the delivery of integration savings and a continued focus on cost management.
49
OPERATING AND FINANCIAL REVIEW AND PROSPECTS
GROUP OPERATIONS
|
|
|
|
|
|
|
|
|
|
|
|
|
|
|
|
|
|
2011 |
|
|
|
2010 |
1,2 |
|
|
2009 |
1,2 |
|
Total income |
|
|
42 |
|
|
|
(12 |
) |
|
|
(43 |
) |
|
Direct costs: |
|
|
|
|
|
|
|
|
|
|
|
|
|
Information technology |
|
|
(1,031 |
) |
|
|
(1,204 |
) |
|
|
(1,249 |
) |
|
Operations |
|
|
(596 |
) |
|
|
(656 |
) |
|
|
(704 |
) |
|
Property |
|
|
(909 |
) |
|
|
(966 |
) |
|
|
(981 |
) |
|
Sourcing |
|
|
(56 |
) |
|
|
(58 |
) |
|
|
(60 |
) |
|
Support functions |
|
|
(73 |
) |
|
|
(89 |
) |
|
|
(109 |
) |
|
|
|
|
(2,665 |
) |
|
|
(2,973 |
) |
|
|
(3,103 |
) |
|
Result before recharges to divisions |
|
|
(2,623 |
) |
|
|
(2,985 |
) |
|
|
(3,146 |
) |
|
Total net recharges to divisions |
|
|
2,567 |
|
|
|
2,930 |
|
|
|
2,978 |
|
|
Share of results of joint ventures and associates |
|
|
— |
|
|
|
3 |
|
|
|
3 |
|
|
Loss before tax and fair value unwind |
|
|
(56 |
) |
|
|
(52 |
) |
|
|
(165 |
) |
|
Fair value unwind |
|
|
— |
|
|
|
— |
|
|
|
22 |
|
|
Loss before tax |
|
|
(56 |
) |
|
|
(52 |
) |
|
|
(143 |
) |
|
|
|
|
1 |
As discussed on page 32, divisional results for 2010 and 2009 have been restated to reflect new funding cost and capital allocation methodologies. |
|
|
|
|
2 |
Comparative figures have also been amended to reflect the centralisation of operations across the Group as part of the integration programme. To ensure a fair comparison of 2011 performance, 2010 and 2009 direct costs have been changed with an equivalent offsetting adjustment in recharges to divisions. |
2011 COMPARED WITH 2010
Loss before tax from Group Operations increased by £4 million to £56 million in 2011 compared to £52 million in 2010.
Total income, excluding recharges to divisions, improved by £54 million, to £42 million in 2011 compared to a deficit of £12 million in 2010.
Direct costs were £308 million, or 10 per cent, lower at £2,665 million in 2011 compared to £2,973 million in 2010; this reflected the continued focus on cost management and the delivery of integration synergy savings and Simplification benefits.
Information Technology costs decreased by 14 per cent primarily with integration savings offsetting inflationary savings; Operations costs decreased by 9 per cent through the continuing rationalisation of the major Operations functions; Group Property costs decreased by 6 per cent due to the continuing consolidation of the heritage property portfolios helping to deliver further integration benefits; Group Sourcing costs decreased by 3 per cent and Sourcing has also played a major part in helping to deliver Group wide sourcing synergies.
Support functions costs were £16 million, or 18 per cent, lower at £73 million in 2011 compared to £89 million in 2010.
Recharges to divisions were £363 million lower at £2,567 million in 2011 compared to £2,930 million in 2010.
2010 COMPARED WITH 2009
Loss before tax from Group Operations improved by £91 million to £52 million in 2010 compared to £143 million in 2009. The loss in 2009 included a credit of £22 million in relation to the unwinding of fair value adjustments arising from the acquisition of HBOS plc by the Group. Loss before tax and fair value unwind improved by £113 million to £52 million in 2010 compared to £165 million in 2009.
Total income, excluding recharges to divisions, improved by £31 million, to a deficit of £12 million in 2010 compared to a deficit of £43 million in 2009.
Direct costs were £130 million, or 4 per cent, lower at £2,973 million in 2010 compared to £3,103 million in 2009; this reflected the continued focus on cost management and the delivery of integration savings.
Information Technology costs decreased by 4 per cent primarily due to the further impact of integration benefits; Operations costs decreased by 7 per cent due to the continuing rationalisation of the major Operations functions and lower charges in respect of joint ventures; Group Property costs decreased by 2 per cent due to the continuing consolidation of the heritage property portfolios helping to deliver further integration benefits. Support functions costs were £20 million, or 18 per cent, lower at £89 million in 2010 compared to £109 million in 2009.
Recharges to divisions were £48 million lower at £2,930 million in 2010 compared to £2,978 million in 2009.
50
OPERATING AND FINANCIAL REVIEW AND PROSPECTS
CENTRAL ITEMS
|
|
|
|
|
|
|
|
|
|
|
|
|
|
|
|
2011 |
|
|
2010 |
1 |
|
2009 |
1 |
|
Net interest income (expense) |
|
|
585 |
|
|
571 |
|
|
(26 |
) |
|
Other income |
|
|
(49 |
) |
|
(73 |
) |
|
(79 |
) |
|
Effects of liability management, volatile items and asset sales |
|
|
1,293 |
|
|
150 |
|
|
1,519 |
|
|
Total income |
|
|
1,829 |
|
|
648 |
|
|
1,414 |
|
|
Operating expenses |
|
|
(259 |
) |
|
(107 |
) |
|
(294 |
) |
|
Trading surplus |
|
|
1,570 |
|
|
541 |
|
|
1,120 |
|
|
Impairment |
|
|
(3 |
) |
|
— |
|
|
— |
|
|
Share of results of joint ventures and associates |
|
|
(1 |
) |
|
2 |
|
|
(1 |
) |
|
Profit before tax and fair value unwind |
|
|
1,566 |
|
|
543 |
|
|
1,119 |
|
|
Fair value unwind |
|
|
(1,274 |
) |
|
(1,446 |
) |
|
(2,119 |
) |
|
Profit (loss) before tax |
|
|
292 |
|
|
(903 |
) |
|
(1,000 |
) |
|
|
|
|
1 |
As discussed on page 32, divisional results for 2010 and 2009 have been restated to reflect new funding cost and capital allocation methodologies |
Central items are comprised of three main elements:
|
|
|
|
1 |
The residual net interest position arising from the Group’s processes to allocate the following elements of net interest income to the divisions: |
|
|
|
|
|
– interest on the Group’s equity position; |
|
|
|
|
|
– net interest margin cost resulting from central capital activities, primarily arising on the management of subordinated debt and preference shares; and |
|
|
|
|
|
– cost to the Group of funding wholesale and liquidity balances. |
|
|
|
|
2 |
The charge for payments to the charitable foundations: the four independent Lloyds TSB Foundations and the independent Bank of Scotland Foundation support registered charities throughout the UK that enable people, particularly the disabled and disadvantaged, to play a fuller role in society. |
|
|
|
|
3 |
Other unallocated central items: include the on-going activities of central areas including those of group corporate treasury (including the central hedge function), group internal audit, group risk, group compliance, group finance and group IT and operations. |
2011 COMPARED WITH 2010
Total income increased by £1,181 million to £1,829 million primarily due to an £1,143 million increase in volatility and liability management effects. This included an £872 million increase in liability management gains. In addition, there was a £615 million reduction in the mark-to-market losses arising from the equity conversion feature of the Group’s Enhanced Capital Notes, partly offset by a £344 million adverse movement on banking volatility, which is attributed to ineffectiveness in hedge accounting relationships and banking book derivatives not mitigated through hedge accounting.
Liability management gains arose on transactions undertaken as part of the Group’s management of capital, largely the exchange of certain debt securities for other debt instruments or, for 2010 only, ordinary shares. These transactions resulted in a gain of £1,295 million in 2011, which comprises £696 million recognised in statutory net interest income, reflecting a reduction in the carrying value of certain debt securities as a result of changes in expected cash flows, and £599 million recognised in statutory other income relating to the exchange of existing securities into new securities. The gain in 2010 (£423 million) was recognised in statutory other income.
In 2011, volatile items comprised reductions in fair valuation of the equity conversion feature of the Group’s Enhanced Capital Notes of £5 million (2010: £620 million) and positive banking volatility of £3 million (2010: £347 million). There were no asset sales in either 2011 or 2010 reported in central items.
Operating expenses increased by £152 million to £259 million primarily due to financial services compensation scheme costs of £161 million (Group total: £179 million) and bank levy costs of £189 million, partly offset by lower pension costs held centrally.
Fair value unwind decreased by £172 million to a charge of £1,274 million primarily due to deal maturities leading to reduced amortisation.
2010 COMPARED WITH 2009
Total income decreased by £766 million to £648 million primarily due to a £1,369 million reduction in volatility and liability management effects. This included a £1,045 million reduction in liability management gains. In addition, there was a £193 million increase in the mark-to-market losses arising from the equity conversion feature of the Group’s Enhanced Capital Notes and a £131 million adverse movement in banking volatility, which is attributed to ineffectiveness in hedge accounting relationships and banking book derivatives not mitigated through hedge accounting.
Liability management gains arose on transactions undertaken in both 2009 and 2010 as part of the Group’s management of capital which exchanged certain debt securities for ordinary shares or other debt instruments. These transactions resulted in a gain of £423 million in 2010 compared to a gain of £1,498 million in 2009 (of which £1,468 million was reflected in Central items). The fair value of the equity conversion feature of the Group’s Enhanced Capital Notes decreased by £620 million in 2010 compared to a decrease of £427 million in 2009.
Net interest income was £597 million higher at £571 million in 2010 compared to a deficit of £26 million in 2009, in part reflecting improved net interest from interest rate risk management activities compared to 2009.
Operating expenses reduced by £187 million to £107 million due to lower professional fees and other costs associated with capital transactions and projects.
Fair value unwind improved by £673 million to a charge of £1,446 million primarily due to the effect of the liability management transactions leading to a reduced amortisation rate. Gains on liability management transactions included accelerated fair value amortisations.
51
OPERATING AND FINANCIAL REVIEW AND PROSPECTS
AVERAGE BALANCE SHEET AND NET INTEREST INCOME
|
|
|
|
|
|
|
|
|
|
|
|
|
|
|
|
|
|
|
|
|
|
|
|
|
|
|
|
|
|
|
|
|
|
2011 |
|
|
2011 |
|
|
2011 |
|
|
2010 |
|
|
2010 |
|
|
2010 |
|
|
2009 |
1 |
|
2009 |
|
|
2009 |
|
|
Assets |
|
|
|
|
|
|
|
|
|
|
|
|
|
|
|
|
|
|
|
|
|
|
|
|
|
|
|
|
|
Loans and receivables: |
|
|
|
|
|
|
|
|
|
|
|
|
|
|
|
|
|
|
|
|
|
|
|
|
|
|
|
|
|
– Loans and advances to banks |
|
|
81,001 |
|
|
628 |
|
|
0.78 |
|
|
70,808 |
|
|
512 |
|
|
0.72 |
|
|
65,440 |
|
|
769 |
|
|
1.18 |
|
|
– Loans and advances to customers |
|
|
594,152 |
|
|
23,950 |
|
|
4.03 |
|
|
592,120 |
|
|
26,085 |
|
|
4.41 |
|
|
673,226 |
|
|
25,023 |
|
|
3.72 |
|
|
– Debt securities |
|
|
18,616 |
|
|
590 |
|
|
3.17 |
|
|
31,248 |
|
|
1,377 |
|
|
4.41 |
|
|
39,911 |
|
|
1,469 |
|
|
3.68 |
|
|
Available-for-sale financial assets |
|
|
34,305 |
|
|
886 |
|
|
2.58 |
|
|
45,519 |
|
|
1,311 |
|
|
2.88 |
|
|
54,926 |
|
|
977 |
|
|
1.78 |
|
|
Held-to-maturity investments |
|
|
7,958 |
|
|
262 |
|
|
3.29 |
|
|
2,188 |
|
|
55 |
|
|
2.51 |
|
|
— |
|
|
— |
|
|
— |
|
|
Total interest-earning assets of banking book |
|
|
736,032 |
|
|
26,316 |
|
|
3.58 |
|
|
741,883 |
|
|
29,340 |
|
|
3.95 |
|
|
833,503 |
|
|
28,238 |
|
|
3.39 |
|
|
Total interest-earning trading securities and other financial assets at fair value through profit or loss |
|
|
63,418 |
|
|
2,201 |
|
|
3.47 |
|
|
65,176 |
|
|
2,412 |
|
|
3.70 |
|
|
59,849 |
|
|
2,224 |
|
|
3.72 |
|
|
Total interest-earning assets |
|
|
799,450 |
|
|
28,517 |
|
|
3.57 |
|
|
807,059 |
|
|
31,752 |
|
|
3.93 |
|
|
893,352 |
|
|
30,462 |
|
|
3.41 |
|
|
Allowance for impairment losses on loans and receivables |
|
|
(19,548 |
) |
|
|
|
|
|
|
|
(17,146 |
) |
|
|
|
|
|
|
|
(9,551 |
) |
|
|
|
|
|
|
|
Non-interest earning assets |
|
|
200,939 |
|
|
|
|
|
|
|
|
220,098 |
|
|
|
|
|
|
|
|
164,056 |
|
|
|
|
|
|
|
|
Total average assets and interest income |
|
|
980,841 |
|
|
28,517 |
|
|
2.91 |
|
|
1,010,011 |
|
|
31,752 |
|
|
3.14 |
|
|
1,047,857 |
|
|
30,462 |
|
|
2.91 |
|
|
|
|
|
|
|
|
|
|
|
|
|
|
|
|
|
|
|
|
|
|
|
|
|
|
|
|
|
|
|
|
|
|
2011 |
|
2011 |
|
2011 |
|
2010 |
|
2010 |
|
2010 |
|
2009 |
|
2009 |
|
2009 |
|
|||||||||
|
Average interest-earning assets and net interest income: |
|
|
|
|
|
|
|
|
|
|
|
|
|
|
|
|
|
|
|
|
|
|
|
|
|
|
|
|
|
– Banking business |
|
|
736,032 |
|
|
12,698 |
|
|
1.73 |
|
|
741,883 |
|
|
12,546 |
|
|
1.69 |
|
|
833,503 |
|
|
9,026 |
|
|
1.08 |
|
|
– Trading securities and other financial assets at fair value through profit or loss |
|
|
63,418 |
|
|
1,722 |
|
|
2.72 |
|
|
65,176 |
|
|
2,172 |
|
|
3.33 |
|
|
59,849 |
|
|
1,706 |
|
|
2.85 |
|
|
|
|
|
799,450 |
|
|
14,420 |
|
|
1.80 |
|
|
807,059 |
|
|
14,718 |
|
|
1.82 |
|
|
893,352 |
|
|
10,732 |
|
|
1.20 |
|
|
|
|
|
1 |
During 2011 the Group has revised its treatment of offset accounts; average balances for 2010 and 2009 have been restated accordingly. |
52
OPERATING AND FINANCIAL REVIEW AND PROSPECTS
|
|
|
|
|
|
|
|
|
|
|
|
|
|
|
|
|
|
|
|
|
|
|
|
|
|
|
|
|
|
|
|
|
2011 |
|
2011 |
|
2011 |
|
2010 |
1 |
2010 |
|
2010 |
|
2009 |
1 |
2009 |
|
2009 |
|
|||||||||
|
Liabilities and shareholders’ funds |
|
|
|
|
|
|
|
|
|
|
|
|
|
|
|
|
|
|
|
|
|
|
|
|
|
|
|
|
|
Deposits by banks |
|
|
27,748 |
|
|
222 |
|
|
0.80 |
|
|
40,918 |
|
|
319 |
|
|
0.78 |
|
|
93,234 |
|
|
883 |
|
|
0.95 |
|
|
Liabilities to banks under sale and repurchase agreements |
|
|
16,536 |
|
|
267 |
|
|
1.61 |
|
|
20,658 |
|
|
513 |
|
|
2.48 |
|
|
42,794 |
|
|
1,399 |
|
|
3.27 |
|
|
Customer deposits |
|
|
365,418 |
|
|
6,080 |
|
|
1.66 |
|
|
344,138 |
|
|
5,381 |
|
|
1.56 |
|
|
341,292 |
|
|
4,410 |
|
|
1.29 |
|
|
Liabilities to customers under sale and repurchase agreements |
|
|
7,572 |
|
|
68 |
|
|
0.90 |
|
|
42,530 |
|
|
231 |
|
|
0.54 |
|
|
41,890 |
|
|
256 |
|
|
0.61 |
|
|
Debt securities in issue |
|
|
227,497 |
|
|
5,045 |
|
|
2.22 |
|
|
234,107 |
|
|
5,833 |
|
|
2.49 |
|
|
247,079 |
|
|
6,318 |
|
|
2.56 |
|
|
Other interest-bearing liabilities |
|
|
19,242 |
|
|
(219 |
) |
|
(1.14 |
) |
|
12,882 |
|
|
898 |
|
|
6.97 |
|
|
10,865 |
|
|
1,621 |
|
|
14.92 |
|
|
Subordinated liabilities |
|
|
33,918 |
|
|
2,155 |
|
|
6.35 |
|
|
32,962 |
|
|
3,619 |
|
|
10.98 |
|
|
43,033 |
|
|
4,325 |
|
|
10.05 |
|
|
Total interest-bearing liabilities of banking book |
|
|
697,931 |
|
|
13,618 |
|
|
1.95 |
|
|
728,195 |
|
|
16,794 |
|
|
2.31 |
|
|
820,187 |
|
|
19,212 |
|
|
2.34 |
|
|
Total interest-bearing liabilities of trading book |
|
|
26,407 |
|
|
479 |
|
|
1.81 |
|
|
26,115 |
|
|
240 |
|
|
0.92 |
|
|
28,639 |
|
|
518 |
|
|
1.81 |
|
|
Total interest-bearing liabilities |
|
|
724,338 |
|
|
14,097 |
|
|
1.95 |
|
|
754,310 |
|
|
17,034 |
|
|
2.26 |
|
|
848,826 |
|
|
19,730 |
|
|
2.32 |
|
|
Interest-free liabilities |
|
|
|
|
|
|
|
|
|
|
|
|
|
|
|
|
|
|
|
|
|
|
|
|
|
|
|
|
|
Non-interest bearing customer accounts |
|
|
31,519 |
|
|
|
|
|
|
|
|
19,403 |
|
|
|
|
|
|
|
|
6,902 |
|
|
|
|
|
|
|
|
Other interest-free liabilities |
|
|
179,705 |
|
|
|
|
|
|
|
|
189,274 |
|
|
|
|
|
|
|
|
158,881 |
|
|
|
|
|
|
|
|
Non-controlling interests and shareholders’ funds |
|
|
45,279 |
|
|
|
|
|
|
|
|
47,024 |
|
|
|
|
|
|
|
|
33,248 |
|
|
|
|
|
|
|
|
Total average liabilities and interest expense |
|
|
980,841 |
|
|
14,097 |
|
|
1.44 |
|
|
1,010,011 |
|
|
17,034 |
|
|
1.69 |
|
|
1,047,857 |
|
|
19,730 |
|
|
1.88 |
|
|
|
|
|
1 |
During 2011 the Group has revised its treatment of offset accounts; average balances for 2010 and 2009 have been restated accordingly. |
Loans and advances to banks and customers include impaired lending; interest on this lending has been recognised using the effective interest rate method, as required by IAS 39.
53
OPERATING AND FINANCIAL REVIEW AND PROSPECTS
The analysis of average balances and interest for 2011, 2010 and 2009 between domestic and international offices is as follows:
|
|
|
|
|
|
|
|
|
|
|
|
|
|
|
|
|
|
|
|
|
|
|
|
|
|
|
|
|
|
|
|
|
Domestic |
|
Foreign |
|
Total |
|
|||||||||||||||||||||
|
2011 |
|
Average |
|
Interest |
|
Yield |
|
Average |
|
Interest |
|
Yield |
|
Average |
|
Interest |
|
Yield |
|
|||||||||
|
Assets |
|
|
|
|
|
|
|
|
|
|
|
|
|
|
|
|
|
|
|
|
|
|
|
|
|
|
|
|
|
Loans and receivables: |
|
|
|
|
|
|
|
|
|
|
|
|
|
|
|
|
|
|
|
|
|
|
|
|
|
|
|
|
|
Loans and advances to banks |
|
|
63,572 |
|
|
488 |
|
|
0.77 |
|
|
17,429 |
|
|
140 |
|
|
0.80 |
|
|
81,001 |
|
|
628 |
|
|
0.78 |
|
|
Loans and advances to customers |
|
|
534,384 |
|
|
21,657 |
|
|
4.05 |
|
|
59,768 |
|
|
2,293 |
|
|
3.84 |
|
|
594,152 |
|
|
23,950 |
|
|
4.03 |
|
|
Debt securities |
|
|
17,683 |
|
|
578 |
|
|
3.27 |
|
|
933 |
|
|
12 |
|
|
1.29 |
|
|
18,616 |
|
|
590 |
|
|
3.17 |
|
|
Available-for-sale financial assets |
|
|
29,092 |
|
|
848 |
|
|
2.91 |
|
|
5,213 |
|
|
38 |
|
|
0.73 |
|
|
34,305 |
|
|
886 |
|
|
2.58 |
|
|
Held-to-maturity investments |
|
|
7,958 |
|
|
262 |
|
|
3.29 |
|
|
— |
|
|
— |
|
|
— |
|
|
7,958 |
|
|
262 |
|
|
3.29 |
|
|
Total interest-earning assets of banking book |
|
|
652,689 |
|
|
23,833 |
|
|
3.65 |
|
|
83,343 |
|
|
2,483 |
|
|
2.98 |
|
|
736,032 |
|
|
26,316 |
|
|
3.58 |
|
|
Total interest-earning trading securities and other financial assets at fair value through profit or loss |
|
|
59,640 |
|
|
1,998 |
|
|
3.35 |
|
|
3,778 |
|
|
203 |
|
|
5.37 |
|
|
63,418 |
|
|
2,201 |
|
|
3.47 |
|
|
Total interest-earning assets |
|
|
712,329 |
|
|
25,831 |
|
|
3.63 |
|
|
87,121 |
|
|
2,686 |
|
|
3.08 |
|
|
799,450 |
|
|
28,517 |
|
|
3.57 |
|
|
Allowance for impairment losses on loans and advances |
|
|
(7,557 |
) |
|
|
|
|
|
|
|
(11,991 |
) |
|
|
|
|
|
|
|
(19,548 |
) |
|
|
|
|
|
|
|
Non-interest earning assets |
|
|
192,714 |
|
|
|
|
|
|
|
|
8,225 |
|
|
|
|
|
|
|
|
200,939 |
|
|
|
|
|
|
|
|
Total average assets and interest income |
|
|
897,486 |
|
|
25,831 |
|
|
2.88 |
|
|
83,355 |
|
|
2,686 |
|
|
3.22 |
|
|
980,841 |
|
|
28,517 |
|
|
2.91 |
|
|
Percentage of assets applicable to foreign activities (%) |
|
|
|
|
|
|
|
|
|
|
|
|
|
|
|
|
|
|
|
|
8.50 |
|
|
|
|
|
|
|
|
|
|
|
|
|
|
|
|
|
|
|
|
|
|
|
|
|
|
|
|
|
|
|
|
|
|
|
|
|
|
|
|
Domestic |
|
Foreign |
|
Total |
|
|||||||||||||||||||||
|
|
|
Average |
|
Interest |
|
Cost |
|
Average |
|
Interest |
|
Cost |
|
Average |
|
Interest |
|
Cost |
|
|||||||||
|
Liabilities and shareholders’ funds |
|
|
|
|
|
|
|
|
|
|
|
|
|
|
|
|
|
|
|
|
|
|
|
|
|
|
|
|
|
Deposits by banks |
|
|
24,751 |
|
|
190 |
|
|
0.77 |
|
|
2,997 |
|
|
32 |
|
|
1.07 |
|
|
27,748 |
|
|
222 |
|
|
0.80 |
|
|
Liabilities to banks under sale and repurchase agreements |
|
|
16,399 |
|
|
261 |
|
|
1.59 |
|
|
137 |
|
|
6 |
|
|
4.38 |
|
|
16,536 |
|
|
267 |
|
|
1.61 |
|
|
Customer deposits |
|
|
350,762 |
|
|
5,754 |
|
|
1.64 |
|
|
14,656 |
|
|
326 |
|
|
2.22 |
|
|
365,418 |
|
|
6,080 |
|
|
1.66 |
|
|
Liabilities to customers under sale and repurchase agreements |
|
|
7,554 |
|
|
68 |
|
|
0.90 |
|
|
18 |
|
|
— |
|
|
— |
|
|
7,572 |
|
|
68 |
|
|
0.90 |
|
|
Debt securities in issue |
|
|
203,340 |
|
|
4,420 |
|
|
2.17 |
|
|
24,157 |
|
|
625 |
|
|
2.59 |
|
|
227,497 |
|
|
5,045 |
|
|
2.22 |
|
|
Other interest-bearing liabilities |
|
|
19,242 |
|
|
(219 |
) |
|
(1.14 |
) |
|
— |
|
|
— |
|
|
— |
|
|
19,242 |
|
|
(219 |
) |
|
(1.14 |
) |
|
Subordinated liabilities |
|
|
33,918 |
|
|
2,155 |
|
|
6.35 |
|
|
— |
|
|
— |
|
|
— |
|
|
33,918 |
|
|
2,155 |
|
|
6.35 |
|
|
Total interest-bearing liabilities of banking book |
|
|
655,966 |
|
|
12,629 |
|
|
1.93 |
|
|
41,965 |
|
|
989 |
|
|
2.36 |
|
|
697,931 |
|
|
13,618 |
|
|
1.95 |
|
|
Total interest-bearing liabilities of trading book |
|
|
26,407 |
|
|
479 |
|
|
1.81 |
|
|
— |
|
|
— |
|
|
— |
|
|
26,407 |
|
|
479 |
|
|
1.81 |
|
|
Total interest-bearing liabilities |
|
|
682,373 |
|
|
13,108 |
|
|
1.92 |
|
|
41,965 |
|
|
989 |
|
|
2.36 |
|
|
724,338 |
|
|
14,097 |
|
|
1.95 |
|
|
Interest-free liabilities |
|
|
|
|
|
|
|
|
|
|
|
|
|
|
|
|
|
|
|
|
|
|
|
|
|
|
|
|
|
Non-interest bearing customer accounts |
|
|
30,606 |
|
|
|
|
|
|
|
|
913 |
|
|
|
|
|
|
|
|
31,519 |
|
|
|
|
|
|
|
|
Other interest-free liabilities |
|
|
153,439 |
|
|
|
|
|
|
|
|
26,266 |
|
|
|
|
|
|
|
|
179,705 |
|
|
|
|
|
|
|
|
Minority interests and shareholders’ funds |
|
|
31,068 |
|
|
|
|
|
|
|
|
14,211 |
|
|
|
|
|
|
|
|
45,279 |
|
|
|
|
|
|
|
|
Total average liabilities and interest expense |
|
|
897,486 |
|
|
13,108 |
|
|
1.46 |
|
|
83,355 |
|
|
989 |
|
|
1.19 |
|
|
980,841 |
|
|
14,097 |
|
|
1.44 |
|
|
Percentage of liabilities applicable to foreign activities (%) |
|
|
|
|
|
|
|
|
|
|
|
|
|
|
|
|
|
|
|
|
7.39 |
|
|
|
|
|
|
|
54
OPERATING AND FINANCIAL REVIEW AND PROSPECTS
|
|
|
|
|
|
|
|
|
|
|
|
|
|
|
|
|
|
|
|
|
|
|
|
|
|
|
|
|
|
|
|
|
Domestic |
|
Foreign |
|
Total |
|
|||||||||||||||||||||
|
2010 |
|
Average |
1 |
Interest |
|
Yield |
|
Average |
|
Interest |
|
Yield |
|
Average |
1 |
Interest |
|
Yield |
|
|||||||||
|
Assets |
|
|
|
|
|
|
|
|
|
|
|
|
|
|
|
|
|
|
|
|
|
|
|
|
|
|
|
|
|
Loans and receivables: |
|
|
|
|
|
|
|
|
|
|
|
|
|
|
|
|
|
|
|
|
|
|
|
|
|
|
|
|
|
Loans and advances to banks |
|
|
55,288 |
|
|
408 |
|
|
0.74 |
|
|
15,520 |
|
|
104 |
|
|
0.67 |
|
|
70,808 |
|
|
512 |
|
|
0.72 |
|
|
Loans and advances to customers |
|
|
535,544 |
|
|
24,035 |
|
|
4.49 |
|
|
56,576 |
|
|
2,050 |
|
|
3.62 |
|
|
592,120 |
|
|
26,085 |
|
|
4.41 |
|
|
Debt securities |
|
|
29,662 |
|
|
1,359 |
|
|
4.58 |
|
|
1,586 |
|
|
18 |
|
|
1.13 |
|
|
31,248 |
|
|
1,377 |
|
|
4.41 |
|
|
Available-for-sale financial assets |
|
|
35,296 |
|
|
1,236 |
|
|
3.50 |
|
|
10,223 |
|
|
75 |
|
|
0.73 |
|
|
45,519 |
|
|
1,311 |
|
|
2.88 |
|
|
Held-to-maturity investments |
|
|
2,188 |
|
|
55 |
|
|
2.51 |
|
|
— |
|
|
— |
|
|
— |
|
|
2,188 |
|
|
55 |
|
|
2.51 |
|
|
Total interest-earning assets of banking book |
|
|
657,978 |
|
|
27,093 |
|
|
4.12 |
|
|
83,905 |
|
|
2,247 |
|
|
2.68 |
|
|
741,883 |
|
|
29,340 |
|
|
3.95 |
|
|
Total interest-earning trading securities and other financial assets at fair value through profit or loss |
|
|
59,472 |
|
|
2,208 |
|
|
3.71 |
|
|
5,704 |
|
|
204 |
|
|
3.58 |
|
|
65,176 |
|
|
2,412 |
|
|
3.70 |
|
|
Total interest-earning assets |
|
|
717,450 |
|
|
29,301 |
|
|
4.08 |
|
|
89,609 |
|
|
2,451 |
|
|
2.74 |
|
|
807,059 |
|
|
31,752 |
|
|
3.93 |
|
|
Allowance for impairment losses on loans and advances |
|
|
(10,760 |
) |
|
|
|
|
|
|
|
(6,386 |
) |
|
|
|
|
|
|
|
(17,146 |
) |
|
|
|
|
|
|
|
Non-interest earning assets |
|
|
213,195 |
|
|
|
|
|
|
|
|
6,903 |
|
|
|
|
|
|
|
|
220,098 |
|
|
|
|
|
|
|
|
Total average assets and interest income |
|
|
919,885 |
|
|
29,301 |
|
|
3.19 |
|
|
90,126 |
|
|
2,451 |
|
|
2.72 |
|
|
1,010,011 |
|
|
31,752 |
|
|
3.14 |
|
|
Percentage of assets applicable to foreign activities (%) |
|
|
|
|
|
|
|
|
|
|
|
|
|
|
|
|
|
|
|
|
8.92 |
|
|
|
|
|
|
|
|
|
|
|
|
|
|
|
|
|
|
|
|
|
|
|
|
|
|
|
|
|
|
|
|
|
|
|
|
|
|
|
|
Domestic |
|
Foreign |
|
Total |
|
|||||||||||||||||||||
|
|
|
Average |
1 |
Interest |
|
Cost |
|
Average |
|
Interest |
|
Cost |
|
Average |
1 |
Interest |
|
Cost |
|
|||||||||
|
Liabilities and shareholders’ funds |
|
|
|
|
|
|
|
|
|
|
|
|
|
|
|
|
|
|
|
|
|
|
|
|
|
|
|
|
|
Deposits by banks |
|
|
24,041 |
|
|
219 |
|
|
0.91 |
|
|
16,877 |
|
|
100 |
|
|
0.59 |
|
|
40,918 |
|
|
319 |
|
|
0.78 |
|
|
Liabilities to banks under sale and repurchase agreements |
|
|
14,933 |
|
|
419 |
|
|
2.81 |
|
|
5,725 |
|
|
94 |
|
|
1.64 |
|
|
20,658 |
|
|
513 |
|
|
2.48 |
|
|
Customer deposits |
|
|
334,395 |
|
|
5,108 |
|
|
1.53 |
|
|
9,743 |
|
|
273 |
|
|
2.80 |
|
|
344,138 |
|
|
5,381 |
|
|
1.56 |
|
|
Liabilities to customers under sale and repurchase agreements |
|
|
42,457 |
|
|
231 |
|
|
0.54 |
|
|
73 |
|
|
— |
|
|
— |
|
|
42,530 |
|
|
231 |
|
|
0.54 |
|
|
Debt securities in issue |
|
|
204,200 |
|
|
5,214 |
|
|
2.55 |
|
|
29,907 |
|
|
619 |
|
|
2.07 |
|
|
234,107 |
|
|
5,833 |
|
|
2.49 |
|
|
Other interest-bearing liabilities |
|
|
12,882 |
|
|
898 |
|
|
6.97 |
|
|
— |
|
|
— |
|
|
— |
|
|
12,882 |
|
|
898 |
|
|
6.97 |
|
|
Subordinated liabilities |
|
|
32,951 |
|
|
3,618 |
|
|
10.98 |
|
|
11 |
|
|
1 |
|
|
9.09 |
|
|
32,962 |
|
|
3,619 |
|
|
10.98 |
|
|
Total interest-bearing liabilities of banking book |
|
|
665,859 |
|
|
15,707 |
|
|
2.36 |
|
|
62,336 |
|
|
1,087 |
|
|
1.74 |
|
|
728,195 |
|
|
16,794 |
|
|
2.31 |
|
|
Total interest-bearing liabilities of trading book |
|
|
26,115 |
|
|
240 |
|
|
0.92 |
|
|
— |
|
|
— |
|
|
— |
|
|
26,115 |
|
|
240 |
|
|
0.92 |
|
|
Total interest-bearing liabilities |
|
|
691,974 |
|
|
15,947 |
|
|
2.30 |
|
|
62,336 |
|
|
1,087 |
|
|
1.74 |
|
|
754,310 |
|
|
17,034 |
|
|
2.26 |
|
|
Interest-free liabilities |
|
|
|
|
|
|
|
|
|
|
|
|
|
|
|
|
|
|
|
|
|
|
|
|
|
|
|
|
|
Non-interest bearing customer accounts |
|
|
18,463 |
|
|
|
|
|
|
|
|
940 |
|
|
|
|
|
|
|
|
19,403 |
|
|
|
|
|
|
|
|
Other interest-free liabilities |
|
|
174,928 |
|
|
|
|
|
|
|
|
14,346 |
|
|
|
|
|
|
|
|
189,274 |
|
|
|
|
|
|
|
|
Minority interests and shareholders’ funds |
|
|
34,520 |
|
|
|
|
|
|
|
|
12,504 |
|
|
|
|
|
|
|
|
47,024 |
|
|
|
|
|
|
|
|
Total average liabilities and interest expense |
|
|
919,885 |
|
|
15,947 |
|
|
1.73 |
|
|
90,126 |
|
|
1,087 |
|
|
1.21 |
|
|
1,010,011 |
|
|
17,034 |
|
|
1.69 |
|
|
Percentage of liabilities applicable to foreign activities (%) |
|
|
|
|
|
|
|
|
|
|
|
|
|
|
|
|
|
|
|
|
8.06 |
|
|
|
|
|
|
|
|
|
|
|
1 |
During 2011 the Group has revised its treatment of offset accounts; average balances for 2010 and 2009 have been restated accordingly. |
55
OPERATING AND FINANCIAL REVIEW AND PROSPECTS
|
|
|
|
|
|
|
|
|
|
|
|
|
|
|
|
|
|
|
|
|
|
|
|
|
|
|
|
|
|
|
|
|
Domestic |
|
Foreign |
|
Total |
|
|||||||||||||||||||||
|
2009 |
|
Average |
1 |
Interest |
|
Yield |
|
Average |
|
Interest |
|
Yield |
|
Average |
1 |
Interest |
|
Yield |
|
|||||||||
|
Assets |
|
|
|
|
|
|
|
|
|
|
|
|
|
|
|
|
|
|
|
|
|
|
|
|
|
|
|
|
|
Loans and receivables: |
|
|
|
|
|
|
|
|
|
|
|
|
|
|
|
|
|
|
|
|
|
|
|
|
|
|
|
|
|
Loans and advances to banks |
|
|
57,500 |
|
|
594 |
|
|
1.03 |
|
|
7,940 |
|
|
175 |
|
|
2.20 |
|
|
65,440 |
|
|
769 |
|
|
1.18 |
|
|
Loans and advances to customers |
|
|
617,498 |
|
|
22,928 |
|
|
3.71 |
|
|
55,728 |
|
|
2,095 |
|
|
3.76 |
|
|
673,226 |
|
|
25,023 |
|
|
3.72 |
|
|
Debt securities |
|
|
38,189 |
|
|
1,439 |
|
|
3.77 |
|
|
1,722 |
|
|
30 |
|
|
1.74 |
|
|
39,911 |
|
|
1,469 |
|
|
3.68 |
|
|
Available-for-sale financial assets |
|
|
46,787 |
|
|
896 |
|
|
1.92 |
|
|
8,139 |
|
|
81 |
|
|
1.00 |
|
|
54,926 |
|
|
977 |
|
|
1.78 |
|
|
Total interest-earning assets of banking book |
|
|
759,974 |
|
|
25,857 |
|
|
3.40 |
|
|
73,529 |
|
|
2,381 |
|
|
3.24 |
|
|
833,503 |
|
|
28,238 |
|
|
3.39 |
|
|
Total interest-earning trading securities and other financial assets at fair value through profit or loss |
|
|
59,571 |
|
|
2,213 |
|
|
3.71 |
|
|
278 |
|
|
11 |
|
|
3.96 |
|
|
59,849 |
|
|
2,224 |
|
|
3.72 |
|
|
Total interest-earning assets |
|
|
819,545 |
|
|
28,070 |
|
|
3.43 |
|
|
73,807 |
|
|
2,392 |
|
|
3.24 |
|
|
893,352 |
|
|
30,462 |
|
|
3.41 |
|
|
Allowance for impairment losses on loans and advances |
|
|
(5,740 |
) |
|
|
|
|
|
|
|
(3,811 |
) |
|
|
|
|
|
|
|
(9,551 |
) |
|
|
|
|
|
|
|
Non-interest earning assets |
|
|
159,516 |
|
|
|
|
|
|
|
|
4,540 |
|
|
|
|
|
|
|
|
164,056 |
|
|
|
|
|
|
|
|
Total average assets and interest income |
|
|
973,321 |
|
|
28,070 |
|
|
2.88 |
|
|
74,536 |
|
|
2,392 |
|
|
3.21 |
|
|
1,047,857 |
|
|
30,462 |
|
|
2.91 |
|
|
Percentage of assets applicable to foreign activities (%) |
|
|
|
|
|
|
|
|
|
|
|
|
|
|
|
|
|
|
|
|
7.11 |
|
|
|
|
|
|
|
|
|
|
|
|
|
|
|
|
|
|
|
|
|
|
|
|
|
|
|
|
|
|
|
|
|
|
|
|
|
|
|
|
Domestic |
|
Foreign |
|
Total |
|
|||||||||||||||||||||
|
|
|
Average |
1 |
Interest |
|
Cost |
|
Average |
|
Interest |
|
Cost |
|
Average |
1 |
Interest |
|
Cost |
|
|||||||||
|
Liabilities and shareholders’ funds |
|
|
|
|
|
|
|
|
|
|
|
|
|
|
|
|
|
|
|
|
|
|
|
|
|
|
|
|
|
Deposits by banks |
|
|
63,207 |
|
|
653 |
|
|
1.03 |
|
|
30,027 |
|
|
230 |
|
|
0.77 |
|
|
93,234 |
|
|
883 |
|
|
0.95 |
|
|
Liabilities to banks under sale and repurchase agreements |
|
|
42,794 |
|
|
1,399 |
|
|
3.27 |
|
|
— |
|
|
— |
|
|
— |
|
|
42,794 |
|
|
1,399 |
|
|
3.27 |
|
|
Customer deposits |
|
|
333,678 |
|
|
4,255 |
|
|
1.28 |
|
|
7,614 |
|
|
155 |
|
|
2.04 |
|
|
341,292 |
|
|
4,410 |
|
|
1.29 |
|
|
Liabilities to customers under sale and repurchase agreements |
|
|
41,827 |
|
|
256 |
|
|
0.61 |
|
|
63 |
|
|
— |
|
|
— |
|
|
41,890 |
|
|
256 |
|
|
0.61 |
|
|
Debt securities in issue |
|
|
222,212 |
|
|
6,099 |
|
|
2.74 |
|
|
24,867 |
|
|
219 |
|
|
0.88 |
|
|
247,079 |
|
|
6,318 |
|
|
2.56 |
|
|
Other interest-bearing liabilities |
|
|
10,865 |
|
|
1,621 |
|
|
14.92 |
|
|
— |
|
|
— |
|
|
— |
|
|
10,865 |
|
|
1,621 |
|
|
14.92 |
|
|
Subordinated liabilities |
|
|
42,183 |
|
|
4,276 |
|
|
10.14 |
|
|
850 |
|
|
49 |
|
|
5.76 |
|
|
43,033 |
|
|
4,325 |
|
|
10.05 |
|
|
Total interest-bearing liabilities of banking book |
|
|
756,766 |
|
|
18,559 |
|
|
2.45 |
|
|
63,421 |
|
|
653 |
|
|
1.03 |
|
|
820,187 |
|
|
19,212 |
|
|
2.34 |
|
|
Total interest-bearing liabilities of trading book |
|
|
28,639 |
|
|
518 |
|
|
1.81 |
|
|
— |
|
|
— |
|
|
— |
|
|
28,639 |
|
|
518 |
|
|
1.81 |
|
|
Total interest-bearing liabilities |
|
|
785,405 |
|
|
19,077 |
|
|
2.43 |
|
|
63,421 |
|
|
653 |
|
|
1.03 |
|
|
848,826 |
|
|
19,730 |
|
|
2.32 |
|
|
Interest-free liabilities |
|
|
|
|
|
|
|
|
|
|
|
|
|
|
|
|
|
|
|
|
|
|
|
|
|
|
|
|
|
Non-interest bearing customer accounts |
|
|
6,253 |
|
|
|
|
|
|
|
|
649 |
|
|
|
|
|
|
|
|
6,902 |
|
|
|
|
|
|
|
|
Other interest-free liabilities |
|
|
157,426 |
|
|
|
|
|
|
|
|
1,455 |
|
|
|
|
|
|
|
|
158,881 |
|
|
|
|
|
|
|
|
Minority interests and shareholders’ funds |
|
|
24,237 |
|
|
|
|
|
|
|
|
9,011 |
|
|
|
|
|
|
|
|
33,248 |
|
|
|
|
|
|
|
|
Total average liabilities and interest expense |
|
|
973,321 |
|
|
19,077 |
|
|
1.96 |
|
|
74,536 |
|
|
653 |
|
|
0.88 |
|
|
1,047,857 |
|
|
19,730 |
|
|
1.88 |
|
|
Percentage of liabilities applicable to foreign activities (%) |
|
|
|
|
|
|
|
|
|
|
|
|
|
|
|
|
|
|
|
|
6.46 |
|
|
|
|
|
|
|
|
|
|
|
1 |
During 2011 the Group has revised its treatment of offset accounts; average balances for 2010 and 2009 have been restated accordingly. |
56
OPERATING AND FINANCIAL REVIEW AND PROSPECTS
CHANGES IN NET INTEREST INCOME – VOLUME AND RATE ANALYSIS
The following table allocates changes in net interest income between volume and rate for 2011 compared with 2010 and for 2010 compared with 2009. Where variances have arisen from both changes in volume and rate these are allocated to volume.
|
|
|
|
|
|
|
|
|
|
|
|
|
|
|
|
|
|
|
|
|
|
|
|
2011 compared with 2010 |
|
2010 compared with 20091 |
|
||||||||||||||
|
|
|
Total change |
|
Volume |
|
Rate |
|
Total change |
|
volume |
|
Rate |
|
||||||
|
Interest receivable and similar income |
|
|
|
|
|
|
|
|
|
|
|
|
|
|
|
|
|
|
|
|
Loans and receivables: |
|
|
|
|
|
|
|
|
|
|
|
|
|
|
|
|
|
|
|
|
Loans and advances to banks |
|
|
116 |
|
|
79 |
|
|
37 |
|
|
(257 |
) |
|
39 |
|
|
(296 |
) |
|
Loans and advances to customers |
|
|
(2,135 |
) |
|
82 |
|
|
(2,217 |
) |
|
1,062 |
|
|
(3,573 |
) |
|
4,635 |
|
|
Debt securities |
|
|
(787 |
) |
|
(400 |
) |
|
(387 |
) |
|
(92 |
) |
|
(382 |
) |
|
290 |
|
|
Available-for-sale financial assets |
|
|
(425 |
) |
|
(290 |
) |
|
(135 |
) |
|
334 |
|
|
(271 |
) |
|
605 |
|
|
Held-to-maturity investments |
|
|
207 |
|
|
190 |
|
|
17 |
|
|
55 |
|
|
55 |
|
|
— |
|
|
Total banking book interest receivable and similar income |
|
|
(3,024 |
) |
|
(339 |
) |
|
(2,685 |
) |
|
1,102 |
|
|
(4,132 |
) |
|
5,234 |
|
|
Total interest receivable and similar income on trading securities and other financial assets at fair value through profit or loss |
|
|
(211 |
) |
|
(61 |
) |
|
(150 |
) |
|
188 |
|
|
197 |
|
|
(9 |
) |
|
Total interest receivable and similar income |
|
|
(3,235 |
) |
|
(400 |
) |
|
(2,835 |
) |
|
1,290 |
|
|
(3,935 |
) |
|
5,225 |
|
|
Interest payable |
|
|
|
|
|
|
|
|
|
|
|
|
|
|
|
|
|
|
|
|
Deposits by banks |
|
|
(97 |
) |
|
(105 |
) |
|
8 |
|
|
(564 |
) |
|
(408 |
) |
|
(156 |
) |
|
Liabilities to banks under sale and repurchase agreements |
|
|
(246 |
) |
|
(67 |
) |
|
(179 |
) |
|
(886 |
) |
|
(550 |
) |
|
(336 |
) |
|
Customer deposits |
|
|
699 |
|
|
354 |
|
|
345 |
|
|
971 |
|
|
45 |
|
|
926 |
|
|
Liabilities to customers under sale and repurchase agreements |
|
|
(163 |
) |
|
(314 |
) |
|
151 |
|
|
(25 |
) |
|
3 |
|
|
(28 |
) |
|
Debt securities in issue |
|
|
(788 |
) |
|
(147 |
) |
|
(641 |
) |
|
(485 |
) |
|
(323 |
) |
|
(162 |
) |
|
Other interest bearing liabilities |
|
|
(1,117 |
) |
|
(72 |
) |
|
(1,045 |
) |
|
(723 |
) |
|
141 |
|
|
(864 |
) |
|
Subordinated liabilities |
|
|
(1,464 |
) |
|
61 |
|
|
(1,525 |
) |
|
(706 |
) |
|
(1,106 |
) |
|
400 |
|
|
Total banking book interest payable |
|
|
(3,176 |
) |
|
(290 |
) |
|
(2,886 |
) |
|
(2,418 |
) |
|
(2,198 |
) |
|
(220 |
) |
|
Total interest payable on trading and other liabilities at fair value through profit or loss |
|
|
239 |
|
|
5 |
|
|
234 |
|
|
(278 |
) |
|
(23 |
) |
|
(255 |
) |
|
Total interest payable |
|
|
(2,937 |
) |
|
(285 |
) |
|
(2,652 |
) |
|
(2,696 |
) |
|
(2,221 |
) |
|
(475 |
) |
|
|
|
|
1 |
During 2011 the Group has revised its treatment of offset accounts; average balances for 2010 and 2009 have been restated accordingly. |
57
OPERATING AND FINANCIAL REVIEW AND PROSPECTS
All narrative on pages 58 to 131 is unaudited unless otherwise stated. Tables are both audited and unaudited as stated. The audited information is required to comply with the requirements of relevant International Financial Reporting Standards.
The Group’s approach to risk is founded on a robust control framework and a strong risk management culture which guides the way all employees approach their work, the way they behave and the decisions they make.
PROGRESS IN 2011
|
|
|
|
– |
The Group has a fully embedded conservative approach to, and prudent appetite for, risk and has in place disciplined controls over the risk profile for all new business, aligned to the strategic review. |
|
|
|
|
– |
The Group has made good progress in reducing assets which deliver below-hurdle returns, which are outside the Group’s risk appetite or may be distressed, are subscale or have an unclear value proposition, or have a poor fit with the Group’s customer strategy and improving the asset quality ratio. |
|
|
|
|
– |
Excellent progress in de-risking the Retail books. Solid progress in Wholesale and good progress to tackle the issues in the International books. |
|
|
|
|
– |
The continued focus on the Group’s conduct risk agenda to ensure it is achieving the best outcomes for its customers and is completely aligned with being the best bank for customers. |
PRIORITIES FOR 2012
Risk Division’s mission in 2012 is to support sustainable growth, through:
|
|
|
|
– |
Strategy: Supporting the delivery of the Group’s strategic plan, within risk appetite |
|
|
|
|
– |
Risk Infrastructure: Continue to invest in and develop risk systems |
|
|
|
|
– |
Risk Culture: Build and leverage on strong risk culture of business ownership |
|
|
|
|
– |
Regulatory Change: Be a role model |
|
|
|
|
– |
People Agenda: Continue to attract, retain and develop high quality people |
THE GROUP’S APPROACH TO RISK
GOVERNANCE
|
|
|
|
– |
The Group’s approach to risk is founded on a robust control framework and a strong risk management culture which guides the way all employees approach their work, behave and make decisions promptly. |
|
|
|
|
– |
Board-level engagement, coupled with the direct involvement of senior management in group-wide risk issues at Group Executive Committee level, ensures that issues are promptly escalated and remediation plans are initiated. |
|
|
|
|
– |
The interaction of the executive and non-executive governance structures relies upon a culture of transparency and openness that is encouraged by both the Board and senior management. |
RISK APPETITE
|
|
|
|
– |
The Board takes the lead by establishing the ‘tone at the top’ and approving group risk appetite which is then cascaded throughout the Group in terms of policies, authorities and limits. The Board ensures that senior management implements policies and procedures designed to promote professional behaviour and integrity. |
CULTURE
|
|
|
|
– |
The Board ensures that senior management implements risk policies and risk appetites that either limit or, where appropriate, prohibit activities, relationships, and situations that could be detrimental to the Group’s risk profile. |
|
|
|
|
– |
The Group has a conservative business model embodied by a risk culture founded on prudence and individual accountability, where the needs of customers are paramount. |
|
|
|
|
– |
The focus has been and remains on building and sustaining long-term relationships with customers, through good and bad economic times. |
ENTERPRISE-WIDE RISK MANAGEMENT
|
|
|
|
– |
The Group uses an Enterprise-Wide Risk Management framework for the identification, assessment, measurement and management of risk. |
|
|
|
|
– |
It seeks to maximise value for shareholders over time by aligning risk appetite with corporate strategy, assessing the impact of emerging risks and developing risk tolerances and mitigating strategies. |
|
|
|
|
– |
The framework seeks to strengthen the Group’s ability to identify and assess risks, aggregate and report group-wide risks and refine risk appetite. |
DECISION MAKING
|
|
|
|
– |
The Risk Committee, chaired by a Non-Executive Director, comprises other Non-Executive Directors and oversees the Group’s risk exposures. The Chief Risk Officer regularly informs the Risk Committee of the aggregate risk profile and has direct access to the Chairman and members of the Risk Committee. |
|
|
|
|
– |
The Group Risk Committee and the Group Asset and Liability Committee are chaired by the Group Chief Executive. The aggregate group wide risk profile and risk appetite are discussed at these monthly meetings. |
RISK AS A STRATEGIC DIFFERENTIATOR
The Group’s strategy and risk appetite were developed together to ensure one informed the other in creating a strategy that delivered on becoming the best bank for customers whilst creating sustainable growth over time.
58
OPERATING AND FINANCIAL REVIEW AND PROSPECTS
STRONG CONTROL FRAMEWORK
|
|
|
|
– |
A strong control framework remains a priority for the Group and is the foundation for the delivery of effective risk management. |
|
|
|
|
– |
The Group optimises performance by allowing business units to operate within approved parameters. |
|
|
|
|
– |
The Group’s approach to risk management ensures that business units remain accountable for risk. |
CONSERVATIVE APPROACH
|
|
|
|
– |
The Group has a fully embedded conservative approach to, and prudent appetite for risk. |
BOARD LEVEL REPORTING
|
|
|
|
– |
The Group continues to enhance its capabilities by providing to the Board both qualitative and quantitative data including stress testing analysis on risks associated with strategic objectives. |
|
|
|
|
– |
Taking risks which are well understood, consistent with strategy and appropriately remunerated, is a key driver of shareholder return. |
|
|
|
|
– |
Risk analysis and reporting supports the identification of opportunities as well as risks and provide an aggregate view of the overall risk portfolio. |
|
|
|
|
– |
The Group’s key risks, management actions and performance against risk appetite are monitored and reported at Group level. |
ACCOUNTABILITY
|
|
|
|
– |
Risk is included as one of the five principal criteria within the Group’s balanced scorecard on which business area and individual’s performance is judged. |
|
|
|
|
– |
Business executives have specified risk management objectives, and incentive schemes take account of performance against these. |
|
|
|
|
– |
The Risk function oversees the performance assessment of business areas and senior staff to ensure adherence to the Group’s risk and control frameworks and oversees that performance has been achieved within risk appetite. |
RISK DIVISION
|
|
|
|
– |
During 2011 good progress has been made in creating a more agile risk function through further delayering the management structure and simplifying the operating model. |
|
|
|
|
– |
This reinforces the model of a strong and independent risk function that keeps the Group safe, supports sustainable business growth and minimises losses within risk appetite. |
RISK TRANSFORMATION
|
|
|
|
– |
The Group’s continued investment agenda, ensures risk systems, processes and management information continue to meet the needs of the Group and external stakeholders. |
59
OPERATING AND FINANCIAL REVIEW AND PROSPECTS
STATE FUNDING AND STATE AID
HM Treasury currently holds approximately 40.1 per cent of the Group’s ordinary share capital. United Kingdom Financial Investments Limited (UKFI) as manager of HM Treasury’s shareholding continues to operate in line with the framework document between UKFI and HM Treasury managing the investment in the Group on a commercial basis without interference in day-to-day management decisions. There is a risk that a change in Government priorities could result in the framework agreement currently in place being replaced leading to interference in the operations of the Group, although there have been no indications that the Government intends to change the existing operating arrangements.
The Group made a number of undertakings to HM Treasury arising from the capital and funding support, including the provision of additional lending to certain mortgage and business sectors for the two years to 28 February 2011, and other matters relating to corporate governance and colleague remuneration. The lending commitments were subject to prudent commercial lending and pricing criteria, the availability of sufficient funding and sufficient demand from creditworthy customers. These lending commitments were delivered in full in the second year.
The subsequent agreement (known as ‘Merlin’) between five major UK banks (including the Group) and the Government in relation to gross business lending capacity in the 2011 calendar year was subject to a similar set of criteria. The Group delivered in full its share of the commitments by the five banks, both in respect of lending to SMEs and in respect of overall gross business lending. The Group has made a unilateral lending pledge for 2012 as part of its publicly announced SME charter.
In addition, the Group is subject to European state aid obligations in line with the Restructuring Plan agreed with HM Treasury and the EU College of Commissioners in November 2009, which is designed to support the long-term viability of the Group and remedy any distortion of competition and trade in the European Union (EU) arising from the state aid given to the Group. This has placed a number of requirements on the Group including an asset reduction target from a defined pool of assets by the end of 2014 and the disposal of certain portions of its retail business by the end of November 2013. In June 2011 the Group issued an Information Memorandum to potential bidders of this retail banking business, which the European Commission confirmed met the requirements to commence the formal sale process for the sale no later than 30 November 2011. On 14 December 2011 the Group announced that having reviewed the formal offers made, its preferred option was for a direct sale and that it was entering into exclusive discussions with The Co-operative Group. The Group is also continuing to progress an Initial Public Offering (IPO) in parallel. The Group continues to work closely with the EU Commission, HM Treasury and the Monitoring Trustee appointed by the EU Commission to ensure the successful implementation of the Restructuring Plan.
RISK GOVERNANCE
The embedding of integrated governance, risk and control frameworks throughout the Group has continued, through a consistent approach to risk appetite, policies, delegated authorities and governance committee structures.
The risk governance structure is intended to strengthen risk evaluation and management, whilst also positioning the Group to manage the changing regulatory environment in an efficient and effective manner. The risk governance structure for Lloyds Banking Group is shown in table 1.1.
BOARD AND BOARD COMMITTEES
The Board, assisted by Risk Committee and Audit Committee, approves the Group’s overall governance, risk and control frameworks and risk appetite. The Board also reviews the Group’s aggregate risk exposures and concentrations of risk to ensure that these are consistent with the Board’s agreed appetite for risk. The roles of the Board, Audit Committee and Risk Committee are shown in the corporate governance section on page 156 and further key risk oversight roles are described below.
The Risk Committee, which comprises Non-Executive Directors, oversees and challenges the development, implementation and maintenance of the Group’s risk management framework, ensuring that its strategy, principles, policies and resources are aligned internally to its risk appetite as well as externally to regulation, corporate governance and industry best practice. The Risk Committee regularly reviews the Group’s risk exposures across the primary risk drivers and the detailed risk types.
The Group Executive Committee supports the Group Chief Executive in ensuring the effectiveness of the Group’s risk management framework and the clear articulation of the Group’s risk policies, whilst also reviewing the Group’s aggregate risk exposures and concentrations of risk. Throughout 2011 businesses provided the Group Executive Committee with regular updates on business performance, always including a review of their key risks. The Group Executive Committee is supported by other Group committees as shown in table 1.1, and in particular by:
|
|
|
|
– |
The Group Asset and Liability Committee is responsible for the strategic management of the Group’s assets and liabilities and the profit and loss implications of balance sheet management actions. It is also responsible for the risk management framework for market risk, liquidity risk, capital risk and earnings volatility. |
|
|
|
|
– |
The Group Incident Executive sets the strategic direction for the Group’s response to significant incidents which could affect its ability to continue to operate, and instigates any tactical initiatives required. |
|
|
|
|
– |
The Group Stress Testing Committee is responsible for reviewing, challenging and recommending to the Group Executive Committee the annual stress testing of the Group’s operating plan based on internal and FSA recommended scenarios, annual European Banking Authority stress tests, and other Group-wide macroeconomic stress tests. |
|
|
|
|
– |
The Group Product Governance Committee provides strategic and senior oversight over design, launch and management of products, including new product approval, annual product reviews and management of risk in the back book. |
|
|
|
|
– |
The Group Risk Committee reviews and recommends the Group’s risk appetite and governance, risk and control frameworks, high-level group policies and the allocation of risk appetite. The Group Risk Committee regularly reviews risk exposures and risk/reward returns. |
During 2011, the Group’s risk committee framework has been reviewed in order to ensure more effective risk management, clearer accountabilities, and more efficient and simplified processes. A new risk committee framework has been implemented, whereby the Group Risk Committee is supported by the following Committees:
|
|
|
|
– |
Credit Risk Committees, which are responsible for the development and effectiveness of the relevant credit risk management framework, clear description of the Group’s credit risk appetite, setting of high-level Group credit policy, and compliance with regulatory credit requirements. Risk Committees monitor and review the Group’s aggregate credit risk exposures and concentrations of risk on behalf of the Group Risk Committee. |
60
OPERATING AND FINANCIAL REVIEW AND PROSPECTS
|
|
|
|
– |
The Group Market Risk Committee, which on behalf of the Group Asset and Liability Committee, monitors and reviews the Group’s aggregate market risk exposures and concentrations and provides a proactive and robust challenge around business activities giving rise to market risks. |
|
|
|
|
– |
The Insurance Risk Committee monitors, reviews and makes recommendations on the risk management framework, risk strategy and appetite for the Insurance business, ensuring that the policy and oversight framework for insurance risk management is appropriate. The committee reviews and challenges relevant insurance reporting and issues arising, including: the Group’s aggregate portfolio of insurance risk against approved plans and risk appetite and the need and opportunity for effecting insurance risk mitigation. |
|
|
|
|
– |
The Group Operational Risk Committee, which is responsible for identifying significant current and emerging operational risks or accumulation of risks and control deficiencies across the Group and reviewing associated oversight plans to ensure pre-emptive risk management action. The Committee also seeks to ensure that adequate business area engagement occurs to develop, implement and maintain the Group’s operational risk management framework. |
|
|
|
|
– |
The Group Compliance and Conduct Risk Committee is responsible for forming a group-wide view of the Group’s compliance and conduct risk profile, reviewing the effectiveness of compliance and conduct risk frameworks and reviewing relevant polices and engagement with regulators. |
|
|
|
|
– |
The Group Financial Crime Committee serves as the principal Group forum for reviewing and challenging the management of financial crime risk including the overall strategy and performance and engagement with financial crime authorities. The Committee is accountable for ensuring that, at Group level, financial crime risks are effectively identified and managed within risk appetite and that strategies for financial crime prevention are effectively co-ordinated and implemented across the Group. |
|
|
|
|
– |
The Group Model Governance Committee is responsible for setting the framework and standards for model governance across the Group, including establishing appropriate levels of delegated authority and principles underlying the Group’s risk modelling framework, specifically regarding consistency of approach across business units and risk types. It approves risk models other than a small number defined as highly material to the Group, which are approved by the Group Risk Committee. This also meets FSA BIPRU requirements regarding the governance and approval for Internal Ratings Based models, including Internal Assessment models, Market Risk VaR and Advanced Measurement approach models. |
Table 1.1: Risk governance structures
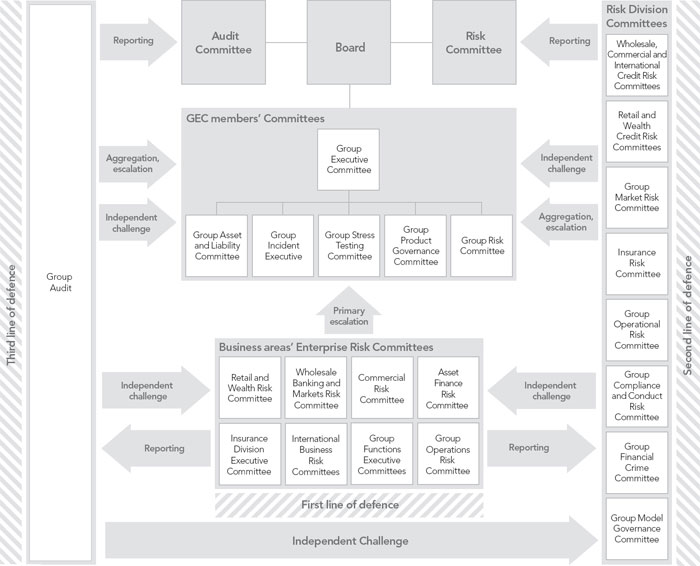
61
OPERATING AND FINANCIAL REVIEW AND PROSPECTS
Risk Division, headed by the Chief Risk Officer, consists of eleven Risk Directors and their specialist teams. These teams provide oversight and independent challenge to business management and support the senior executive and the Board with independent reporting on risks and opportunities. Risk Directors, responsible for each risk type, meet on a regular basis under the Chairmanship of the Chief Risk Officer to review and challenge the risk profile of the Group and to ensure that mitigating actions are appropriate.
Business Unit Managing Directors/Executives have primary responsibility for measuring, monitoring and controlling risks within their areas of accountability and are required to establish control frameworks for their businesses that are consistent with the Group’s policies and are within the parameters set by the Board, Group Executive Committee and Risk Division. Compliance with policies and parameters is overseen by the Risk Committee, the Group Risk Committee, the Group Asset and Liability Committee, and Risk Division, and independently challenged by Group Audit.
RISK MANAGEMENT OVERSIGHT
The Chief Risk Officer oversees and promotes the development and implementation of consistent Group-wide governance risk and control frameworks. The Chief Risk Officer, supported by the Risk Directors, provides objective challenge to the Group’s senior management. The Group Executive Committee and the Board receive regular briefings and guidance from the Chief Risk Officer to ensure awareness of the overarching risk management framework and a clear understanding of their accountabilities for risk and internal control.
Risk
Directors, who report directly to the Chief Risk Officer, are allocated
responsibility for specific risk types and are responsible for ensuring the
adequacy of the framework for their risk types as well as the oversight of the
risk profile across the Group. Risk Directors also support specific business
areas to provide an enterprise-wide risk management perspective.
The Director
of Group Audit provides independent assurance to the Audit Committee and the
Board that risks within the Group are recognised, monitored and managed within
acceptable parameters. Group Audit is fully independent of Risk, seeking to
ensure objective challenge to the effectiveness of the risk governance
framework.
Table 1.2: Risk management framework
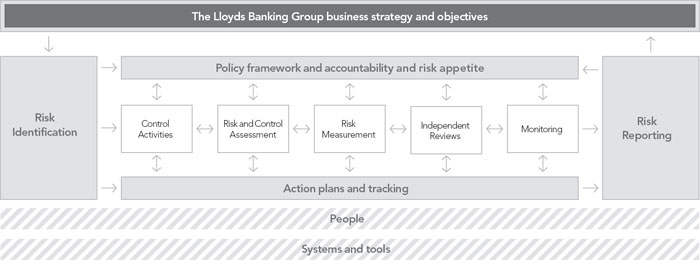
RISK MANAGEMENT IN THE BUSINESS
Line management is directly accountable for the management of risks arising in their individual businesses. A key objective is to ensure that business decisions strike an appropriate balance between risk and reward, consistent with the Group’s risk appetite.
All business areas complete a control effectiveness review annually (see page 165), reviewing the effectiveness of their internal controls and putting in place a programme of enhancements where appropriate. Executives of each business area and each Group Executive Committee member certify the accuracy of their assessment.
Risk management in the business forms part of a tiered risk management model, as shown above, with Risk Division providing oversight and challenge, and the Chief Risk Officer and Group committees establishing the Group-wide perspective.
This approach provides the Group with an effective mechanism for developing and embedding risk policies and risk management strategies which are aligned with the risks faced by its businesses. It also seeks to facilitate effective communication on these matters across the Group.
62
OPERATING AND FINANCIAL REVIEW AND PROSPECTS
RISK MANAGEMENT FRAMEWORK
The Group’s risk management principles and framework cover all the types of risk which could impact on its banking and insurance businesses.
The Group uses an enterprise-wide risk management framework to maximise shareholder value over time by aligning risk management with the corporate strategy, assessing the impact of emerging risks, and developing tolerances and mitigating strategies. The framework ensures that policies and controls can be adapted to reflect adjustments to business strategy and risk appetite in response to changing market conditions.
The principal elements of the framework are shown in table 1.2. These map to the components of the internal control framework issued by the Committee of Sponsoring Organisations of the Treadway Commission.
The Lloyds Banking Group business strategy and objectives are used to determine the Group’s high level risk appetite and measures and metrics for the primary risk drivers (see table 1.3).
The risk appetite is proposed by the Group Chief Executive following review by the Group Risk Committee and Group Asset and Liability Committee, and is approved by the Board. The approved high level appetite and limits are delegated to the Group Chief Executive and then cascaded in consultation with the Group Risk Committee and Group Asset and Liability Committee to members of the Group Executive Committee and the business.
The risk appetite is executed through Policy Framework and Accountabilities, comprising the following levels of policy:
|
|
|
|
– |
Principles: Board-level statements of principle for the six primary risk drivers |
|
|
|
|
– |
High-level Group policy: policy statements for the main risk types which align to each risk driver |
|
|
|
|
– |
Detailed Group policy: more specific and detailed policy statements of Group policy |
|
|
|
|
– |
Business Area policy: local policy which is produced by exception where a greater level of detail is needed by a business area than is appropriate for Group-level policy. |
All policies are reviewed annually to ensure they remain fit for purpose.
During 2011, the Group’s Policy Framework has been reviewed with a view to simplification, which will be implemented over the coming year. Colleagues are expected to be aware of and to comply with the policies and procedures which apply to them and their work. Line management in each business area has primary responsibility for ensuring that they do so.
Risk Division oversees the effective implementation of policy, and Group Audit provides independent assurance to the Board about the effectiveness of the Group’s internal control framework and adherence to policy.
Clear and consistent risk identification is undertaken using a common risk language to define and categorise risks (see table 1.3), also supporting risk aggregation and standardised reporting.
Proportionate control activities are in place mitigating or transferring risk where appropriate. Risk and control assessments including the annual control effectiveness review are undertaken assessing the effectiveness of mitigating actions and whether risk exposures are consistent with the Group’s risk appetite.
The impact of risks and issues is determined through effective risk measurement, including modelling, stress testing and scenario analysis to assess financial, reputational and regulatory capital implications.
The outcomes of independent reviews (including internal and external audit and regulatory reviews) are reflected in risk management activities and action plans.
Monitoring processes are in place supporting the reporting and escalation of significant issues or losses to appropriate levels of management. Business areas monitor and report on their risk levels against risk appetite and their performance against relevant limits or policies.
Risk reporting is reviewed by the business executive sitting as a risk committee, to ensure that senior management is satisfied with the overall risk profile, risk accountabilities and progress on any necessary action plans and tracking. Information is provided to Risk Division for review and aggregation to feed into regular reporting on risk exposures and material issues.
At Group level a consolidated risk report and risk appetite dashboard are produced which are reviewed and debated by the Group Risk Committee, Risk Committee and the Board to ensure that they are satisfied with the overall risk profile, risk accountabilities and mitigating actions. The report and dashboard provide a monthly assessment of the aggregate residual risk for the primary risk drivers, comparing the assessment with the previous periods and providing a forecast for the next twelve months and also provides an assessment of emerging risks, which could impact the Group over the next five years.
The overall effectiveness of the risk management framework depends on the people undertaking these activities and the quality of the supporting systems and tools. The risk transformation programme has initiated a significant investment in risk infrastructure to strengthen the Group’s risk management capability.
63
OPERATING AND FINANCIAL REVIEW AND PROSPECTS
PRINCIPAL RISKS AND UNCERTAINTIES
At present the most significant risks faced by the Group, which are derived from the primary risk drivers and detailed risk types in table 1.3, are shown below. These risks could impact on the success of delivering against the Group’s long-term strategic objectives. For further information on the economy see page 14 – Overview and Trend Information.
LIQUIDITY AND FUNDING
RISK DEFINITION
Liquidity risk is defined as the risk that the Group has insufficient financial resources to meet its commitments as they fall due, or can only secure them at excessive cost.
Funding risk is defined as the risk that the Group does not have sufficiently stable and diverse sources of funding or the funding structure is inefficient.
PRINCIPAL RISKS
Liquidity and funding continues to remain a key area of focus for the Group and the industry as a whole. Like all major banks, the Group is dependent on confidence in the short and long term wholesale funding markets. Should the Group, due to exceptional circumstances, be unable to continue to source sustainable funding, its ability to fund its financial obligations could be impacted.
The combination of right-sizing the balance sheet and continued development of the retail deposit base has seen the Group’s wholesale funding requirement reduce in the past year. The progress the Group has made to date in diversifying its funding sources has further strengthened its funding base.
During the first half of 2011 the Group accelerated term funding initiatives and the run down of certain asset portfolios allowing a further reduction in total government and central bank facilities. The Group repaid its remaining drawings under the Bank of England SLS scheme in full during 2011. Outstandings under the Credit Guarantee Scheme reduced in line with their contractual maturities, with £23.5 billion remaining at the end of December 2011. The outstanding amount matures during 2012.
The second half of 2011 has seen more difficult funding markets as investor confidence was impacted by concerns over the US debt ceiling and subsequent downgrade. This was followed by increased fears over Eurozone sovereign debt levels, downgrades and possible defaults and concerns are ongoing over the potential downside effects from financial market volatility. Despite this the Group continued to fund adequately, maintaining a broadly stable stock of primary liquid assets during the year and meeting its regulatory liquidity ratio targets at all times.
Liquidity is managed at the aggregate Group level, with active monitoring at both business unit and Group level. Monitoring and control processes are in place to address both internal and regulatory requirements. In a stress situation the level of monitoring and reporting is increased commensurate with the nature of the stress event.
The Group carries out stress testing of its liquidity position against a range of scenarios, including those prescribed by the FSA. The Group’s liquidity risk appetite is also calibrated against a number of stressed liquidity metrics.
The Group’s stress testing framework considers these factors, including the impact of a range of economic and liquidity stress scenarios over both short and longer term horizons. Internal stress testing results at 31 December 2011 show that the Group has liquidity resources representing more than 130 per cent of modelled outflows from all wholesale funding sources, corporate deposits and rating dependent contracts under the Group’s severe liquidity stress scenario. In 2011, the Group has maintained its liquidity levels in excess of the ILG regulatory minimum (FSA’s Individual Liquidity Adequacy Standards) at all times. Funding projections show the Group will achieve the proposed Basel III liquidity and funding requirements in advance of expected implementation dates.
The Group’s stress testing shows that further credit rating downgrades may reduce investor appetite for some of the Group’s liability classes and therefore funding capacity. In the fourth quarter of 2011, the Group experienced downgrades in its long-term rating of between one and two notches from three of the major rating agencies. The impact that the Group experienced following the downgrades was consistent with the Group’s modelled outcomes based on the stress testing framework. The Group has materially reduced its wholesale funding in recent years and operates a well diversified funding platform which together lessen the impact of stress events.
The Group’s borrowing costs and issuance in the capital markets are dependent on a number of factors, and increased cost or reduction of capacity could materially adversely affect the Group’s results of operations, financial condition and prospects. In particular, reduction in the credit rating of the Group or deterioration in the capital markets’ perception of the Group’s financial resilience, could significantly increase its borrowing costs and limit its issuance capacity in the capital markets. As an indicator over the last 12 months the spread between an index of A rated long term senior unsecured bank debt and an index of similar BBB rated bank debt, both of which are publicly available, has ranged between 60 and 115 basis points. The applicability to and implications for the Group’s funding cost would depend on the type of issuance, and prevailing market conditions. The impact on the Group’s funding cost is subject to a number of assumptions and uncertainties and is therefore impossible to quantify precisely.
Downgrades of the Group’s long term debt rating could lead to additional collateral posting and cash outflow. A hypothetical simultaneous two notch downgrade of the Group’s long-term debt rating from all major rating agencies, after initial actions within management’s control, could result in an outflow of £11 billion of cash, £4 billion of collateral posting related to customer financial contracts and £24 billion of collateral posting associated with secured funding. These effects do not take into account additional management and restructuring actions that the Group has identified that could materially reduce the amount of required collateral postings under derivative contracts related to its own secured funding programmes.
The downgrades that the Group experienced in the fourth quarter of 2011, did not significantly change its borrowing costs, reduce its issuance capacity or require significant collateral posting. The Group notes the recent announcements from Moody’s placing the ratings of 114 European financial institutions, including Lloyds Banking Group, on review for downgrade. Even in the case of a simultaneous two notch downgrade from all rating agencies, the Group would remain investment grade.
At 31 December 2011, the Group had £202 billion of highly liquid unencumbered assets in its liquidity portfolio which are available to meet cash and collateral outflows, as illustrated in the table below. This liquidity is available for deployment at immediate notice, subject to complying with regulatory requirements, and is a key component of the Group’s liquidity management process.
64
OPERATING AND FINANCIAL REVIEW AND PROSPECTS
MITIGATING ACTIONS
The Group takes many mitigating actions with respect to this principal risk. Key examples include:
The Group has maintained its liquidity levels in excess of the ILG regulatory minimum (FSA’s Individual Liquidity Adequacy Standards) at all times. Funding projections show the Group will achieve the proposed Basel III liquidity and funding metrics in advance of expected implementation dates. The Liquidity Coverage Ratio (LCR) is due to be implemented on 1 January 2015 and the Net Stable Funding Ratio (NSFR) has a 1 January 2018 implementation date. The European Commission released its proposal for implementing Basel III into Europe (CRD IV) in July 2011 and discussions over the final detail are ongoing.
The Group carries out monthly stress testing of its liquidity position against a range of scenarios, including those prescribed by the FSA. The Group’s liquidity risk appetite is also calibrated against a number of stressed liquidity metrics.
The key dependencies on successfully funding the Group’s balance sheet include the continued functioning of the money and capital markets; successful right-sizing of the group’s balance sheet; the repayment of the government Credit Guarantee Scheme facilities in accordance with the agreed terms; no more than limited further deterioration in the UK’s and the Group’s credit rating; and no significant or sudden withdrawal of deposits resulting in increased reliance on money markets. Additionally, the Group has entered into a number of EU state aid related obligations to achieve reductions in certain parts of its balance sheet by the end of 2014. These are assumed within the Group’s funding plan. The requirement to meet this deadline may result in the Group having to provide funding to support these asset reductions and/or disposals and may also result in a lower price being achieved.
Term wholesale funding issuance for the year totalled £35 billion, in excess of plan, representing £2 billion pre-funding of the requirement for 2012.
The Group term funding ratio (wholesale funding with a remaining life of over one year as a percentage of total wholesale funding) improved to 55 per cent (50 per cent at 31 December 2010) due to good progress in new term issuance and a reduction in short term money market funding. the wholesale funding position includes debt issued under the legacy government Credit Guarantee Scheme, for which the last maturity will occur in 2012.
Total wholesale funding reduced by £47 billion to £251 billion, with the volume with a residual maturity less than one year falling £35 billion to £113 billion.
The ratio of customer loans to deposits improved to 135 per cent compared with 154 per cent at 31 December 2010. Loans and advances reduced by £41 billion and customer deposits increased by £23 billion, representing growth of 6 per cent in 2011.
For further information on Liquidity and funding risk, see page 70.
CREDIT
RISK DEFINITION
The risk of reductions in earnings and/or value, through financial loss, as a result of the failure of the party with whom the Group has contracted to meet its obligations (both on and off balance sheet).
PRINCIPAL RISKS
Risks arising in the Retail, Wholesale, Commercial, and Wealth and International divisions, reflecting the risks inherent in the Group’s lending activities and, to a much lesser extent in the Insurance division in respect of investment of own funds. Adverse changes in the credit quality of the Group’s UK and/ or international borrowers and counterparties, or in their behaviour, would be expected to reduce the value of the Group’s assets and materially increase the Group’s write-downs and allowances for impairment losses. Credit risk can be affected by a range of factors, including, inter alia, increased unemployment, reduced asset values, lower consumer spending, increased personal or corporate insolvency levels, reduced corporate profits, increased interest rates or higher tenant defaults. Over the last four years, the global banking crisis and economic downturn has driven cyclically high bad debt charges. These have arisen from the Group’s lending to:
|
|
|
|
– |
Wholesale customers (including those in Wealth and International): where companies continue to face difficult business conditions. Impairment levels have reduced materially since the peak of the economic downturn and more aggressive risk appetite in the HBOS businesses when elevated corporate default levels and illiquid commercial property markets resulted in heightened impairment charges. The UK economy remains fragile. Consumer and business confidence is low, consumer spending has been falling over the past year, the reduction in public sector spending is deepening and exports are failing to offset domestic weakness. The possibility of further economic weakness remains. Financial market instability represents an additional downside risk. The Group has exposure in both the UK and internationally, including Europe, Ireland, USA and Australia, particularly in commercial real estate lending, where the Group had a high level of lending secured on secondary and tertiary assets. |
|
|
|
|
– |
Retail customers (including those in Wealth and International): have seen UK bad debts reduce further in 2011 as a result of risk management activity and more stable, low interest rates and UK economic conditions. These portfolios will remain strongly linked to the economic environment, with inter alia house price falls, unemployment increases, consumer over-indebtedness and rising interest rates being possible impacts to the secured and unsecured retail exposures. |
MITIGATING ACTIONS
The Group takes many mitigating actions with respect to this principal risk. Key examples include:
The Group follows a relationship based business model with risk management processes, appetites and experienced staff in place. Further details on mitigating actions are detailed on pages 88 to 90.
For further information on Credit risk, see page 87.
65
OPERATING AND FINANCIAL REVIEW AND PROSPECTS
REGULATORY
RISK DEFINITION
Regulatory risk is the risk of reductions in earnings and/ or value, through financial or reputational loss, from failing to comply with the applicable laws, regulations or codes.
PRINCIPAL RISKS
Regulatory exposure is driven by the significant volume of current legislation and regulation within the UK and overseas with which the Group has to comply, along with new or proposed legislation and regulation which needs to be reviewed, assessed and embedded into day-to-day operational and business practices across the Group. This is particularly the case in the current market environment, which continues to witness high levels of government and regulatory intervention in the banking sector.
Lloyds Banking Group faces increased political and regulatory scrutiny as a result of the Group’s perceived size and systemic importance following the acquisition of HBOS Group.
Independent Commission on Banking
The Government appointed an Independent Commission on Banking (ICB) to review possible measures to reform the banking system and promote stability and competition. The ICB published its final report on 12 September 2011 putting forward recommendations to require ring-fencing of the retail activities of banks from their investment banking activities and additional capital requirements beyond those required under current drafts of the Capital Requirements Directive IV. The Report also makes recommendations in relation to the competitiveness of the UK banking market, including enhancing the competition remit of the new Financial Conduct Authority (FCA), implementing a new industry-wide switching solution by September 2013, and improving transparency. The ICB, which following the final report was disbanded, had the authority only to make recommendations, which the Government could choose to accept or reject.
The ICB specifically recommended in relation to the Group’s EC mandated branch disposal (Project Verde), that, to create a strong challenger in the UK banking market, the entity which results from the divestment should have a share of the personal current account (PCA) market of at least 6 per cent (although this does not need to arise solely from the current accounts acquired from the Company) and a funding position at least as strong as its peers. The ICB did not specify a definitive timeframe for the divested entity to achieve a 6 per cent market share of PCAs but recommended that a market investigation should be carefully considered by competition authorities if ‘a strong and effective challenger’ has not resulted from the Company’s divestment by 2015. The ICB did not recommend explicitly that the Company should increase the size of the Project Verde disposal agreed with the European Commission but recommended that the Government prioritise the emergence of a strong new challenger over reducing market concentration through a ‘substantially enhanced’ divestment by the Group.
The Government published its response to the ICB recommendations on 19 December 2011. The Government supported the recommendation that an entity with a larger share of the PCA market than the 4.6 per cent originally proposed might produce a more effective competitor. In relation to the Group’s announcement that it was to pursue exclusive negotiations with the Co-operative Group, the Government commented that such a transaction would deliver a significant enhancement of the PCA market share, with the share divested by the Group combining with the Co-operative Group’s existing share to create a competitor with approximately 7-8 per cent. The Government also stated that the execution of the divestment is a commercial matter, and it has no intention of using its shareholding to deliver an enhancement.
New Regulatory Regime
On 27 January 2012, the Government published the Financial Services Bill. The proposed new UK regulatory architecture will see the transition of regulatory and supervisory powers from the FSA to the new Financial Conduct Authority (FCA) and Prudential Regulatory Authority (PRA). The PRA will be responsible for supervising banks, building societies and other large firms. The FCA will focus on consumer protection and market regulation. The Bill is also proposing new responsibilities and powers for the FCA. The most noteworthy are the proposed greater powers for the FCA in relation to competition and the proposal to widen its scope to include consumer credit. The Bill is expected to take effect in early 2013.
In April 2011, the FSA commenced an internal reorganisation as a first step in a process towards the formal transition of regulatory and supervisory powers from the FSA to the new FCA and PRA in 2013. Until this time the responsibility for regulating and supervising the activities of the Group and its subsidiaries will remain with the FSA. On 2 April the FSA will introduce a new ‘twin peaks’ model and the intention is to move the FSA as close as possible to the new style of regulation outlined in the Bill. There will be two independent groups of supervisors for banks, insurers and major investment firms covering prudential and conduct. (All other firms (those not dual regulated) will be solely supervised by the conduct supervisors).
In addition, the European Banking Authority, the European Insurance and Occupational Pensions Authority and the European Securities and Markets Authority as new EU Supervisory Authorities are likely to have greater influence on regulatory matters across the EU.
Capital and Liquidity
Evolving capital and liquidity requirements continue to be a priority for the Group. The Basel Committee on Banking Supervision has put forward proposals for a reform package which changes the regulatory capital and liquidity standards, the definition of ‘capital’, introduces new definitions for the calculation of counterparty credit risk and leverage ratios, additional capital buffers and development of a global liquidity standard. Implementation of these changes is expected to be phased in between 2013 and 2018.
66
OPERATING AND FINANCIAL REVIEW AND PROSPECTS
Anti Bribery
The Bribery Act 2010 came fully into force on 1 July 2011. It enhances previous laws on bribery and is supported by some detailed guidance issued by the Ministry of Justice on the steps a business needs to take to embed ‘adequate procedures’ to prevent bribery. A company convicted of failing to have ‘adequate procedures’ to prevent bribery could receive an unlimited fine. The Group operates a Group-wide Anti-Bribery Policy, applicable to all of its businesses, operations and employees, which incorporates the requirements of the UK Bribery Act 2010.
Sanctions
The Group takes very seriously its responsibilities for complying with legal and regulatory sanctions requirements in all the jurisdictions in which it operates. In order to assist adherence to relevant economic sanctions legislation, the Group has enhanced its internal compliance processes including those associated with customer and payment screening. The Group has continued the delivery of a programme of staff training regarding policies and procedures for detecting and preventing economic sanctions non-compliance.
US Regulation
Significant regulatory initiatives from the US impacting the Group include the Dodd-Frank Act which imposes specific requirements for systemic risk oversight, asset securitisation activities, securities market conduct and oversight, bank capital standards, arrangements for the liquidation of failing systemically significant financial institutions and restrictions to the ability of banking entities to engage in proprietary trading activities and make investments in certain private equity and hedge funds (known as the ‘Volcker Rule’). Furthermore, under the so-called swap ‘push-out’ provisions of the Dodd-Frank Act, the derivatives activities of US banks and US branch offices of foreign banks will be restricted, which may necessitate a restructuring of how the Group conducts its derivatives activities. Entities that are swap dealers, security-based swap dealers, major swap participants or major security-based swap participants will be required to register with the SEC or the US Commodity Futures Trading Commission, or both, and will become subject to the requirements as to capital, margin, business conduct, recordkeeping and other requirements applicable to such entities. The Dodd-Frank Act also grants the SEC discretionary rule-making authority to impose a new fiduciary standard on brokers, dealers and investment advisers, and expands the extraterritorial jurisdiction of US courts over actions brought by the SEC or the United States with respect to violations of the antifraud provisions of the Securities Act of 1933, the Securities Exchange Act of 1934 and the Investment Advisers Act of 1940.
European Regulation
At a European level, the pace of regulatory reform has increased with a number of new directives or changes to existing directives planned in the next 12 months including a revised Markets in Financial Instruments Directive, Transparency Directive, Insurance Mediation Directive and a Fifth Undertakings in Collective Investments in Transferable Securities Directive as well as a proposed Directive regulating Packaged Retail Investment Products.
MITIGATING ACTIONS
The Group takes many mitigating actions with respect to this principal risk. Key examples include:
Independent Commission on Banking
The Group continues to play a constructive role in the debate with the Government and other stakeholders on all issues under consideration in relation to the ICB’s recommendations.
New Regulatory Regime
The Group continues to work closely with the regulatory authorities and industry associations to ensure that it is able to identify and respond to regulatory changes and mitigate against risks to the Group and its stakeholders.
Capital and Liquidity
The Group is continuously assessing the impacts of regulatory developments which could have a material effect on the Group and is progressing its plans to implement regulatory changes and directives through change management programmes.
Anti Bribery
The Group
has no appetite for bribery and explicitly prohibits the payment, offer,
acceptance or request of a bribe, including ‘facilitation payments’.
The Group
has enhanced its internal compliance processes including those associated with
payment screening, colleague training and hospitality.
US and European Regulation
The Group is continuously assessing the impacts of regulatory developments which could have a material effect on the Group and is progressing its plans to implement regulatory changes and directives through change management programmes. The Group is also continuing to progress its plans to achieve Solvency II compliance.
For further information on Regulatory risk, see page 128.
67
OPERATING AND FINANCIAL REVIEW AND PROSPECTS
MARKET RISK
RISK DEFINITION
The risk of reductions in earnings and/or value, through financial or reputational loss, from unfavourable market moves, including changes in, and increased volatility of, interest rates, market-implied inflation rates, credit spreads, foreign exchange rates, and equity, property and commodity prices.
PRINCIPAL RISKS
The Group has a number of market risks, the principal ones being:
|
|
|
|
– |
There is a risk to the Group’s banking income arising from the level of interest rates and the margin of interbank rates over central bank rates. A further banking risk arises from competitive pressures on product terms in existing loans and deposits, which sometimes restrict the Group in its ability to change interest rates applying to customers in response to changes in interbank and central bank rates. |
|
|
|
|
– |
Equity market movements and changes in credit spreads impact the Group’s results. |
|
|
|
|
– |
The main equity market risks arise in the life assurance companies and staff pension schemes. |
|
|
|
|
– |
Credit spread risk arises in the life assurance companies, pension schemes and banking businesses. |
Continuing concerns about the fiscal position in Eurozone countries resulted in increased credit spreads in the areas affected, and fears of contagion affected the Euro and widened spreads between central bank and interbank rates.
MITIGATING ACTIONS
The Group takes many mitigating actions with respect to this principal risk. Key examples include:
Market risk is managed within a Board approved framework using a range of metrics to monitor the Group’s profile against its stated appetite and potential market conditions.
Market Risk is reported regularly to appropriate committees.
The Group’s trading activity is small relative to its peers and is not considered to be a principal risk. The average 95 per cent 1-day trading Value at Risk (VaR) was £6 million for the year to 31 December 2011.
For further information on Market risk, see page 125.
CUSTOMER TREATMENT
RISK DEFINITION
The risk of regulatory censure and/or a reduction in earnings/value, through financial or reputational loss, from inappropriate or poor customer treatment.
PRINCIPAL RISKS
Customer treatment and how the Group manages its customer relationships affect all aspects of the Group’s operations and are closely aligned with achievement of the Group’s strategic vision to be the best bank for customers. As a provider of a wide range of financial services products across different brands and numerous distribution channels to an extremely broad and varied customer base, the Group faces significant conduct risks, such as: products or services not meeting the needs of its customers; sales processes which could result in selling products to customers which do not meet their needs; failure to deal with a customer’s complaint effectively where the Group has got it wrong and not met customer expectations.
There remains a high level of scrutiny regarding the treatment of customers by financial institutions from regulatory bodies, the press and politicians. The FSA in particular continues to drive focus on conduct of business activities through its supervision activity.
There is a risk that certain aspects of the Group’s business may be determined by regulatory bodies or the courts as not being conducted in accordance with applicable laws or regulations, or fair and reasonable treatment in their opinion. The Group may also be liable for damages to third parties harmed by the conduct of its business.
MITIGATING ACTIONS
The Group takes many mitigating actions with respect to this principal risk. Key examples include:
The Group’s Conduct Risk Strategy and supporting framework have been designed to support its vision and strategic aim to put the customer at the heart of everything the Group does. The Group has developed and implemented a framework to enable us to deliver the right outcomes for its customers, which is supported by policies and standards in key areas, including product governance, sales, responsible lending, customers in financial difficulties, claims and complaints handling.
The Group actively engages with regulatory bodies and other stakeholders in developing its understanding of current customer treatment concerns.
For further information on Customer treatment, see page 128.
68
OPERATING AND FINANCIAL REVIEW AND PROSPECTS
PEOPLE
RISK DEFINITION
The risk of reductions in earnings or value through financial or reputational loss arising from ineffectively leading colleagues responsibly and proficiently, managing people resource, supporting and developing colleague talent, or meeting regulatory obligations related to people.
PRINCIPAL RISKS
The quality and effectiveness of the Group’s people are fundamental to its success. Consequently, the Group’s management of material people risks is critical to its capacity to deliver against its long-term strategic objectives. Over the next year the Group’s ability to manage people risks successfully may be affected by the following key drivers:
|
|
|
|
– |
The Group’s continuing structural consolidation and the sale of part of the branch network under Project Verde may result in disruption to the Group’s ability to lead and manage its people effectively. |
|
|
|
|
– |
The continually changing, more rigorous regulatory environment may impact the Group’s people strategy, remuneration practices and retention. |
|
|
|
|
– |
Macroeconomic conditions and negative media attention on the banking sector may impact retention, colleague sentiment and engagement. |
MITIGATING ACTIONS
The Group takes many mitigating actions with respect to this principal risk. Key examples include:
|
|
|
|
– |
Strong focus on leadership and colleague engagement, through delivery of strategies to attract, retain and develop high calibre staff together with implementation of rigorous succession planning |
|
|
|
|
– |
A continued focus on people risk management across the Group. |
|
|
|
|
– |
Ensuring compliance with legal and regulatory requirements related to Approved Persons and the FSA Remuneration Code, and embedding compliant and appropriate colleague behaviours in line with Group policies, values and people risk priorities. |
|
|
|
|
– |
Strengthening risk management culture and capability across the Group, together with further embedding of risk objectives in the colleague performance and reward process. |
For further information on people risk, see page 128.
INSURANCE RISK
RISK DEFINITION
The risk of reductions in earnings and/or value, through financial or reputational loss, due to fluctuations in the timing, frequency and severity of insured/underwritten events and to fluctuations in the timing and amount of claims settlements.
PRINCIPAL RISKS
The major sources of insurance risk are within the insurance businesses and the Group’s defined benefit staff pension schemes (‘pension schemes’). Insurance risk is inherent in the insurance business and can be affected by customer behaviour. Insurance risks relate primarily to mortality, longevity, morbidity, persistency, expenses, property and unemployment. The primary insurance risk of the Group’s pension schemes is related to longevity.
Insurance risk within the insurance businesses has the potential to significantly impact the earnings and capital position of the Insurance Division of the Group. For the Group’s pension schemes, insurance risk could significantly increase the cost of pension provision and impact the balance sheet of the Group.
MITIGATING ACTIONS
The Group takes many mitigating actions with respect to this principal risk. Key examples include:
Insurance risk is reported regularly to appropriate committees and boards.
Actuarial assumptions are reviewed in line with experience and in-depth reviews are conducted regularly. Longevity assumptions for the Group’s pension schemes are reviewed annually together with other IFRS assumptions. Expert judgement is required.
Insurance risk is controlled by robust processes including underwriting, pricing-to-risk, claims management, reinsurance and other risk mitigation techniques.
For further information on Insurance risk, see page 130.
69
OPERATING AND FINANCIAL REVIEW AND PROSPECTS
FULL ANALYSIS OF RISK DRIVERS
Table 1.3: Risk drivers
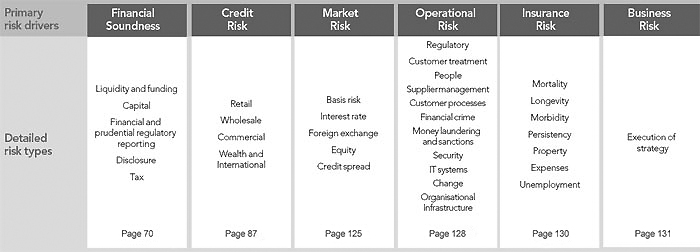
RISK DRIVERS
The Group’s risk language is designed to capture the Group’s primary risk drivers. A description of each ‘primary risk driver’, including definition, appetite, control and exposures, is included below. These are further sub-divided into 33 more granular risk types to enable more detailed review and facilitate appropriate reporting and monitoring, as set out in table 1.3.
Through the Group’s risk management processes, these risks are assessed on an ongoing basis and seek to ensure optimisation of risk and reward and that, where required, appropriate mitigation is in place. Both quantitative and qualitative factors are considered in assessing the Group’s current and potential future risks.
Financial soundness risk has three key risk components: liquidity and funding risk; capital risk; and financial and prudential regulatory reporting, disclosure and tax risk.
LIQUIDITY AND FUNDING RISK
DEFINITION
Liquidity risk is defined as the risk that the Group does not have sufficient financial resources to meet its commitments when they fall due, or can secure them only at excessive cost. Funding risk is further defined as the risk that the Group does not have sufficiently stable and diverse sources of funding or the funding structure is inefficient.
RISK APPETITE
Liquidity and funding risk appetite for the banking businesses is set by the Board and reviewed on an annual basis. This statement of the Group’s overall appetite for liquidity risk is reviewed and approved annually by the Board. With the support of the Group Asset and Liability Committee, the Group Chief Executive allocates this risk appetite across the Group. It is reported through various metrics that enable the Group to manage liquidity and funding constraints. The Group Chief Executive, assisted by the Group Asset and Liability Committee regularly reviews performance against risk appetite.
EXPOSURE
Liquidity exposure represents the amount of potential outflows in any future period less committed inflows. Liquidity is considered from both an internal and regulatory perspective.
MEASUREMENT
A series of measures are used across the Group to monitor both short and long-term liquidity including: ratios, cash outflow triggers, wholesale funding maturity profile, early warning indicators and stress test survival period triggers. The Board approved liquidity risk appetite links a number of these measures to balance sheet progression set out in the Group funding plan, with regular reporting to the Group Asset and Liability Committee and the Board. Strict criteria and limits are in place to ensure highly liquid marketable securities are available as part of the portfolio of liquid assets.
Details of contractual maturities for assets and liabilities form an important source of information for the management of liquidity risk. Note 56 to the financial statements on page F-129 sets out an analysis of assets and liabilities by relevant maturity grouping. In order to reflect more accurately the expected behaviour of the Group’s assets and liabilities, measurement and modelling of the behavioural aspects of each is constructed. This forms the foundation of the Group’s liquidity controls.
70
OPERATING AND FINANCIAL REVIEW AND PROSPECTS
MITIGATION
The Group mitigates the risk of a liquidity mismatch in excess of its risk appetite by managing the liquidity profile of the balance sheet through both short-term liquidity management and long-term funding strategy. Short-term liquidity management is considered from two perspectives: business as usual and liquidity under stressed conditions, both of which relate to funding in the less than one year time horizon. Longer term funding is used to manage the Group’s strategic liquidity profile which is determined by the Group’s balance sheet structure. Longer term is defined as having an original maturity of more than one year.
The Group’s funding and liquidity position is underpinned by its significant customer deposit base, and has been supported by stable funding from the wholesale markets with a reduced dependence on short-term funding. A substantial proportion of the retail deposit base is made up of customers’ current and savings accounts which, although repayable on demand, have traditionally in aggregate provided a stable source of funding. Additionally, the Group accesses the short-term wholesale markets to raise interbank deposits and to issue certificates of deposit and commercial paper to meet short-term obligations. The Group’s short-term money market funding is based on a qualitative analysis of the market’s capacity for the Group’s credit. The Group has developed strong relationships with certain wholesale market segments, and also has access to corporate customers to supplement its retail deposit base.
The ability to deploy assets quickly, either through the repo market or through outright sale, is also an important source of liquidity for the Group’s banking businesses. The Group holds sizeable balances of high grade marketable debt securities as set out in Table 1.9 which can be sold to provide, or used to secure, additional short term funding should the need arise from either market counterparties or central bank facilities (European Central Bank, Federal Reserve, Bank of England and Reserve Bank of Australia).
MONITORING
Liquidity
is actively monitored at business unit and Group level. Routine reporting is in
place to senior management and through the Group’s committee structure, in
particular the Group Asset and Liability Committee which meets monthly. In a
stress situation the level of monitoring and reporting is increased
commensurate with the nature of the stress event. Liquidity policies and
procedures are subject to independent oversight.
Daily monitoring and control
processes are in place to address both statutory and prudential liquidity
requirements. In addition, the framework has two other important components:
|
|
|
|
– |
Firstly, the Group stress tests its potential cash flow mismatch position under various scenarios on an ongoing basis. The cash flow mismatch position considers on-balance sheet cash flows, commitments received and granted, and material derivative cash flows. Specifically, commitments granted include the pipeline of new business awaiting completion as well as other standby or revolving credit facilities. Behavioural adjustments are developed, evaluating how the cash flow position might change under each stress scenario to derive a stressed cash flow position. Scenarios cover both Lloyds Banking Group name specific and systemic difficulties. The scenarios and the assumptions are reviewed at least annually to gain assurance they continue to be relevant to the nature of the business. |
|
|
|
|
– |
Secondly, the Group has a contingency funding plan embedded within the Group Liquidity Policy which has been designed to identify emerging liquidity concerns at an early stage, so that mitigating actions can be taken to avoid a more serious crisis developing. |
The Group has invested considerable resource to ensure that it satisfies the governance, reporting and stress testing requirements of the FSA’s new ILAS liquidity regime. The Group has noted the industry move towards strategic balance sheet measures of the funding profile and has started to monitor and forecast the Group’s Net Stable Funding Ratio (NSFR) and Liquidity Coverage Ratio (LCR). The Group is aware that the regulatory liquidity landscape is subject to potential change. Specifically, in relation to the papers issued by the Basel Committee on Banking Supervision (‘Strengthening the resilience of the banking sector’ and ‘International framework for liquidity risk measurement, standards and monitoring’) the Group has actively participated in the industry-wide consultation and calibration exercises which took place through 2010.
During the year, the individual entities within the Group, and the Group, complied with all of the externally imposed liquidity and funding requirements to which they are subject.
LIQUIDITY AND FUNDING MANAGEMENT IN 2011
Liquidity and funding continues to remain a key area of focus for the Group and the industry as a whole. Like all major banks, the Group is dependent on confidence in the short and long term wholesale funding markets. Should the Group, due to exceptional circumstances, be unable to continue to source sustainable funding, its ability to fund its financial obligations could be impacted.
The second half of 2011 has seen more difficult funding markets as investor confidence was impacted by concerns over the US debt ceiling and subsequent downgrade. This was followed by increased fears over Eurozone sovereign debt levels, downgrades and possible defaults, and concerns are ongoing over the potential downside effects from financial market volatility. Despite this, the Group continued to fund adequately, maintaining a broadly stable stock of primary liquid assets during the year and meeting its regulatory liquidity ratios at all times.
The key dependencies on successfully funding the Group’s balance sheet include the continued functioning of the money and capital markets; successful right-sizing of the Group’s balance sheet; the repayment of the Government Credit Guarantee Scheme facilities in accordance with the agreed terms; no further deterioration in the Group’s credit rating; and no significant or sudden withdrawal of deposits resulting in increased reliance on money markets. Additionally, the Group has entered into a number of EU state aid related obligations to achieve reductions in certain parts of its balance sheet by the end of 2014. These are assumed within the Group’s funding plan. The requirement to meet this deadline may result in the Group having to provide funding to support these asset reductions and/or disposals and may also result in a lower price being achieved.
The combination of right-sizing the balance sheet and continued development of the retail deposit base has seen the Group’s wholesale funding requirement reduce materially in the past two years. The progress the Group has made to date in diversifying its funding sources has further strengthened its funding base.
71
OPERATING AND FINANCIAL REVIEW AND PROSPECTS
Table 1.4: Group funding by type (audited)
|
|
|
|
|
|
|
|
|
|
|
|
|
|
|
|
|
|
|
|
|
2011 |
|
|
2011 |
|
|
2010 |
|
|
2010 |
|
||||
|
Deposits from banks1 |
|
|
25.4 |
|
|
|
3.9 |
|
|
|
26.4 |
|
|
|
3.9 |
|
|
Debt securities in issue:1 |
|
|
|
|
|
|
|
|
|
|
|
|
|
|
|
|
|
Certificates of deposit |
|
|
28.0 |
|
|
|
4.3 |
|
|
|
42.4 |
|
|
|
6.2 |
|
|
Commercial paper |
|
|
18.0 |
|
|
|
2.7 |
|
|
|
32.5 |
|
|
|
4.8 |
|
|
Medium-term notes2 |
|
|
69.8 |
|
|
|
10.6 |
|
|
|
87.7 |
|
|
|
12.9 |
|
|
Covered bonds |
|
|
36.6 |
|
|
|
5.6 |
|
|
|
32.1 |
|
|
|
4.7 |
|
|
Securitisation |
|
|
37.5 |
|
|
|
5.7 |
|
|
|
39.0 |
|
|
|
5.7 |
|
|
|
|
|
189.9 |
|
|
|
28.9 |
|
|
|
233.7 |
|
|
|
34.3 |
|
|
Subordinated liabilities1 |
|
|
35.9 |
|
|
|
5.4 |
|
|
|
37.9 |
|
|
|
5.6 |
|
|
Total wholesale funding3 |
|
|
251.2 |
|
|
|
38.2 |
|
|
|
298.0 |
|
|
|
43.8 |
|
|
Customer deposits |
|
|
405.9 |
|
|
|
61.8 |
|
|
|
382.5 |
|
|
|
56.2 |
|
|
Total Group funding4 |
|
|
657.1 |
|
|
|
100.0 |
|
|
|
680.5 |
|
|
|
100.0 |
|
|
|
|
|
1 |
A reconciliation to the Group’s balance sheet is provided on page 74. |
|
|
|
|
2 |
Medium-term notes include £23.5 billion of funding from the Credit Guarantee Scheme. |
|
|
|
|
3 |
The Group’s definition of wholesale funding aligns with that used by other international market participants; including interbank deposits, debt securities in issue and subordinated liabilities. |
|
|
|
|
4 |
Excluding repos and total equity. |
Total wholesale funding reduced by £47 billion to £251 billion, with the volume with a residual maturity less than one year falling £35 billion to £113 billion. Term wholesale funding for the year totalled £35 billion, in excess of plan, representing £2 billion pre-funding of the requirement for 2012. The Group term funding ratio (wholesale funding with a remaining life of over one year as a percentage of total wholesale funding) improved to 55 per cent (50 per cent at 31 December 2010) due to good progress in new term issuance and a reduction in short term money market funding.
Total wholesale funding is analysed by residual maturity as follows:
Table 1.5: Wholesale funding by residual maturity (audited)
|
|
|
|
|
|
|
|
|
|
|
|
|
|
|
|
|
|
2011 |
|
2011 |
|
2010 |
|
2010 |
|
||||
|
Less than one year |
|
|
113.3 |
|
|
45.1 |
|
|
148.6 |
|
|
49.9 |
|
|
One to two years |
|
|
26.0 |
|
|
10.4 |
|
|
46.8 |
|
|
15.7 |
|
|
Two to five years |
|
|
60.2 |
|
|
23.9 |
|
|
52.3 |
|
|
17.6 |
|
|
More than five years |
|
|
51.7 |
|
|
20.6 |
|
|
50.3 |
|
|
16.8 |
|
|
Total wholesale funding |
|
|
251.2 |
|
|
100.0 |
|
|
298.0 |
|
|
100.0 |
|
|
Less than one year: |
|
|
|
|
|
|
|
|
|
|
|
|
|
|
Of which secured |
|
|
24.4 |
|
|
21.5 |
|
|
38.4 |
|
|
25.8 |
|
|
Of which unsecured |
|
|
88.9 |
|
|
78.5 |
|
|
110.2 |
|
|
74.2 |
|
|
|
|
|
113.3 |
|
|
45.1 |
|
|
148.6 |
|
|
49.9 |
|
|
Greater than one year: |
|
|
|
|
|
|
|
|
|
|
|
|
|
|
Of which secured |
|
|
63.0 |
|
|
45.7 |
|
|
55.4 |
|
|
37.1 |
|
|
Of which unsecured |
|
|
74.9 |
|
|
54.3 |
|
|
94.0 |
|
|
62.9 |
|
|
|
|
|
137.9 |
|
|
54.9 |
|
|
149.4 |
|
|
50.1 |
|
The table below summarises the Group’s term issuance during 2011. The challenge of meeting the Group’s 2011 issuance plan in a very volatile market was successfully accomplished by the ability of the Group to access a diverse range of markets and currencies, both in unsecured and secured form.
Table 1.6: Analysis of 2011 term issuance (audited)
|
|
|
|
|
|
|
|
|
|
|
|
|
|
|
|
|
|
|
|
|
Sterling |
|
US Dollar |
|
Euro |
|
Other currencies |
|
Total |
|
|||||
|
Securitisation |
|
|
2.5 |
|
|
6.1 |
|
|
1.9 |
|
|
0.8 |
|
|
11.3 |
|
|
Medium-term notes |
|
|
0.2 |
|
|
4.2 |
|
|
2.6 |
|
|
2.8 |
|
|
9.8 |
|
|
Covered bonds |
|
|
1.2 |
|
|
— |
|
|
2.4 |
|
|
— |
|
|
3.6 |
|
|
Private placements1 |
|
|
3.7 |
|
|
1.6 |
|
|
4.8 |
|
|
0.5 |
|
|
10.6 |
|
|
Total issuance |
|
|
7.6 |
|
|
11.9 |
|
|
11.7 |
|
|
4.1 |
|
|
35.3 |
|
|
|
|
|
1 |
Private placements include structured bonds and term repurchase agreements (repos). |
72
OPERATING AND FINANCIAL REVIEW AND PROSPECTS
The wholesale funding position includes debt issued under the legacy Government Credit Guarantee Scheme, for which the last maturity will occur in October 2012.
Table 1.7: Analysis of government and central bank facilities (audited)
|
|
|
|
|
|
|
|
|
|
|
|
2011 |
|
2010 |
|
||
|
Credit Guarantee scheme |
|
|
23.5 |
|
|
45.4 |
|
|
Other |
|
|
— |
|
|
51.2 |
|
|
Total government and central bank facilities |
|
|
23.5 |
|
|
96.6 |
|
The ratio of customer loans to deposits improved to 135 per cent compared with 154 per cent at 31 December 2010. Loans and advances reduced by £41 billion and customer deposits increased by £23 billion, representing growth of 6 per cent in 2011.
Table 1.8: Group funding position (audited)
|
|
|
|
|
|
|
|
|
|
|
|
|
|
|
|
|
2011 |
|
|
2010 |
|
|
Change |
|
|||
|
As at 31 December |
|
|
|
|
|
|
|
|
|
|
|
|
|
Funding requirement |
|
|
|
|
|
|
|
|
|
|
|
|
|
Loans and advances to customers1 |
|
|
548.8 |
|
|
|
589.5 |
|
|
|
(7 |
) |
|
Loans and advances to banks2 |
|
|
10.3 |
|
|
|
10.5 |
|
|
|
(2 |
) |
|
Debt securities |
|
|
12.5 |
|
|
|
25.7 |
|
|
|
(51 |
) |
|
Available-for-sale financial assets – secondary3 |
|
|
12.0 |
|
|
|
25.7 |
|
|
|
(53 |
) |
|
Cash balances4 |
|
|
4.1 |
|
|
|
3.6 |
|
|
|
14 |
|
|
Funded assets |
|
|
587.7 |
|
|
|
655.0 |
|
|
|
(10 |
) |
|
Other assets5 |
|
|
286.1 |
|
|
|
269.6 |
|
|
|
6 |
|
|
|
|
|
873.8 |
|
|
|
924.6 |
|
|
|
(5 |
) |
|
On balance sheet primary liquidity assets:6 |
|
|
|
|
|
|
|
|
|
|
|
|
|
Reverse repurchase agreements |
|
|
17.3 |
|
|
|
7.3 |
|
|
|
|
|
|
Balances at central banks – primary4 |
|
|
56.6 |
|
|
|
34.5 |
|
|
|
64 |
|
|
Available-for-sale financial assets – primary |
|
|
25.4 |
|
|
|
17.3 |
|
|
|
47 |
|
|
Held to maturity |
|
|
8.1 |
|
|
|
7.9 |
|
|
|
3 |
|
|
Trading and fair value through profit or loss7 |
|
|
(3.5 |
) |
|
|
— |
|
|
|
|
|
|
Repurchase agreements |
|
|
(7.2 |
) |
|
|
— |
|
|
|
|
|
|
|
|
|
96.7 |
|
|
|
67.0 |
|
|
|
44 |
|
|
Total Group assets |
|
|
970.5 |
|
|
|
991.6 |
|
|
|
(2 |
) |
|
Less: other liabilities5 |
|
|
(251.6 |
) |
|
|
(229.1 |
) |
|
|
10 |
|
|
Funding requirement |
|
|
718.9 |
|
|
|
762.5 |
|
|
|
(6 |
) |
|
Funded by |
|
|
|
|
|
|
|
|
|
|
|
|
|
Customer deposits7 |
|
|
405.9 |
|
|
|
382.5 |
|
|
|
6 |
|
|
Wholesale funding |
|
|
251.2 |
|
|
|
298.0 |
|
|
|
(16 |
) |
|
Repurchase agreements |
|
|
15.2 |
|
|
|
35.1 |
|
|
|
(57 |
) |
|
Total equity |
|
|
46.6 |
|
|
|
46.9 |
|
|
|
(1 |
) |
|
Total funding |
|
|
718.9 |
|
|
|
762.5 |
|
|
|
(6 |
) |
|
|
|
|
1 |
Excludes £16.8 billion (31 December 2010: £3.1 billion) of reverse repurchase agreements. |
|
|
|
|
2 |
Excludes £21.8 billion (31 December 2010: £15.6 billion) of loans and advances to banks within the insurance businesses and £0.5 billion (31 December 2010: £4.2 billion) of reverse repurchase agreements. |
|
|
|
|
3 |
Secondary liquidity assets comprise a diversified pool of highly rated unencumbered collateral (including retained issuance). |
|
|
|
|
4 |
Cash balances and balances at central banks – primary are combined in the Group’s balance sheet. |
|
|
|
|
5 |
Other assets and other liabilities primarily include balances in the Group’s insurance businesses and the fair value of derivative assets and liabilities. |
|
|
|
|
6 |
Primary liquidity assets are FSA eligible liquid assets including UK Gilts, US Treasuries, Euro AAA government debt and unencumbered cash balances held at central banks. |
|
|
|
|
7 |
Excluding repurchase agreements of £8.0 billion (31 December 2010: £11.1 billion). |
73
OPERATING AND FINANCIAL REVIEW AND PROSPECTS
ENCUMBERED ASSETS
The Group remains a consistent issuer in a number of secured funding markets, in particular RMBS and covered bonds (see Table 1.6).
The Group’s level of encumbrance arising from external issuance of securitisation and covered bonds has remained broadly constant, reflecting the maturity and stability of the Group’s utilisation of this form of term funding, and the established cycle of redemptions and new issuance. Total notes issued externally from secured programmes (ABS and covered bonds) have increased from £71.1 billion at 31 December 2010 to £74.1 billion, reflecting gross issuance of £14.9 billion in 2011. A total of £118.5 billion (2010: £143.6 billion) of notes issued under securitisation and covered bond programmes have also been retained internally, the bulk of which are held to provide a pool of collateral eligible for use at central bank liquidity facilities. A small proportion of the retained collateral has been pledged in bilateral financing transactions.
Other assets pledged as collateral in special purpose entities (for example ABCP conduits) decreased from £17.1 billion at 31 December 2010 to £8.8 billion, largely as a result of a reduction in the size of the Group’s holdings of debt securities. Within the asset-backed conduits, assets are encumbered as security for short term asset-backed CP investors in the vehicles; such funding forms part of debt securities in issue disclosed in note 37.
Table 1.9: Reconciliation of Group funding figure from table 1.4 to the balance sheet (audited)
|
|
|
|
|
|
|
|
|
|
|
|
|
|
|
|
|
|
|
|
|
Included in |
|
|
Repos |
|
|
Fair value |
|
|
Balance |
|
||||
|
At 31 December 2011 |
|
|
|
|
|
|
|
|
|
|
|
|
|
|
|
|
|
Deposits from banks |
|
|
25.4 |
|
|
|
14.4 |
|
|
|
— |
|
|
|
39.8 |
|
|
Debt securities in issue |
|
|
189.9 |
|
|
|
— |
|
|
|
(4.8 |
) |
|
|
185.1 |
|
|
Subordinated liabilities |
|
|
35.9 |
|
|
|
— |
|
|
|
(0.8 |
) |
|
|
35.1 |
|
|
Total wholesale funding |
|
|
251.2 |
|
|
|
14.4 |
|
|
|
|
|
|
|
|
|
|
Customer deposits |
|
|
405.9 |
|
|
|
8.0 |
|
|
|
— |
|
|
|
413.9 |
|
|
Total |
|
|
657.1 |
|
|
|
22.4 |
|
|
|
|
|
|
|
|
|
|
|
|
|
|
|
|
|
|
|
|
|
|
|
|
|
|
|
|
At 31 December 2010 |
|
|
|
|
|
|
|
|
|
|
|
|
|
|
|
|
|
Deposits from banks |
|
|
26.4 |
|
|
|
24.0 |
|
|
|
— |
|
|
|
50.4 |
|
|
Debt securities in issue |
|
|
233.7 |
|
|
|
— |
|
|
|
(4.8 |
) |
|
|
228.9 |
|
|
Subordinated liabilities |
|
|
37.9 |
|
|
|
— |
|
|
|
(1.7 |
) |
|
|
36.2 |
|
|
Total wholesale funding |
|
|
298.0 |
|
|
|
24.0 |
|
|
|
|
|
|
|
|
|
|
Customer deposits |
|
|
382.5 |
|
|
|
11.1 |
|
|
|
— |
|
|
|
393.6 |
|
|
Total |
|
|
680.5 |
|
|
|
35.1 |
|
|
|
|
|
|
|
|
|
LIQUIDITY MANAGEMENT
Liquidity is managed at the aggregate Group level, with active monitoring at both business unit and Group level. Monitoring and control processes are in place to address both internal and regulatory requirements. In a stress situation the level of monitoring and reporting is increased commensurate with the nature of the stress event.
The Group carries out stress testing of its liquidity position against a range of scenarios, including those prescribed by the FSA. The Group’s liquidity risk appetite is also calibrated against a number of stressed liquidity metrics.
The Group’s stress testing framework considers these factors, including the impact of a range of economic and liquidity stress scenarios over both short and longer term horizons. Internal stress testing results at 31 December 2011 show that the Group has liquidity resources representing more than 130 per cent of modelled outflows from all wholesale funding sources, corporate deposits and rating dependent contracts under the Group’s severe liquidity stress scenario. In 2011, the Group has maintained its liquidity levels in excess of the ILG regulatory minimum (FSA’s Individual Liquidity Adequacy Standards) at all times. Funding projections show the Group will achieve the proposed Basel III liquidity and funding requirements in advance of expected implementation dates.
The Group’s stress testing shows that further credit rating downgrades may reduce investor appetite for some of the Group’s liability classes and therefore funding capacity. In the fourth quarter of 2011, the Group experienced downgrades in its long-term rating of between one and two notches from three of the major rating agencies. The impact that the Group experienced following the downgrades was consistent with the Group’s modelled outcomes based on the stress testing framework. The Group has materially reduced its wholesale funding in recent years and operates a well diversified funding platform which together lessen the impact of stress events.
The Group’s borrowing costs and issuance in the capital markets are dependent on a number of factors, and increased cost or reduction of capacity could materially adversely affect the Group’s results of operations, financial condition and prospects. In particular, reduction in the credit rating of the Group or deterioration in the capital markets’ perception of the Group’s financial resilience, could significantly increase its borrowing costs and limit its issuance capacity in the capital markets. As an indicator over the last 12 months the spread between an index of A rated long term senior unsecured bank debt and an index of similar BBB rated bank debt, both of which are publicly available, has ranged between 60 and 115 basis points. The applicability to and implications for the Group’s funding cost would depend on the type of issuance, and prevailing market conditions. The impact on the Group’s funding cost is subject to a number of assumptions and uncertainties and is therefore impossible to quantify precisely.
Downgrades of the Group’s long term debt rating could lead to additional collateral posting and cash outflow. A hypothetical simultaneous two notch downgrade of the Group’s long-term debt rating from all major rating agencies, after initial actions within management’s control, could result in an outflow of £11 billion of cash, £4 billion of collateral posting related to customer financial contracts and £24 billion of collateral posting associated with secured funding. These effects do not take into account additional management and restructuring actions that the Group has identified that could materially reduce the amount of required collateral postings under derivative contracts related to its own secured funding programmes.
74
OPERATING AND FINANCIAL REVIEW AND PROSPECTS
The downgrades that the Group experienced in the fourth quarter of 2011, did not significantly change its borrowing costs, reduce its issuance capacity or require significant collateral posting. The Group notes the February 2012 announcements from Moody’s placing the ratings of 114 European financial institutions, including Lloyds Banking Group, on review for downgrade. Even in the case of a simultaneous two notch downgrade from all rating agencies, the Group would remain investment grade.
At 31 December 2011, the Group had £202 billion of highly liquid unencumbered assets in its liquidity portfolio which are available to meet cash and collateral outflows, as illustrated in the table below. This liquidity is available for deployment at immediate notice, subject to complying with regulatory requirements, and is a key component of the Group’s liquidity management process.
Table 1.10: Liquidity portfolio (unaudited)
|
|
|
|
|
|
|
|
|
|
|
|
|
|
|
|
|
|
|
|
|
|
|
|
2011 |
|
2010 |
|
||
|
Primary liquidity |
|
|
|
|
|
|
|
|
94.8 |
|
|
97.5 |
|
|
Secondary liquidity |
|
|
|
|
|
|
|
|
107.4 |
|
|
62.4 |
|
|
Total |
|
|
|
|
|
|
|
|
202.2 |
|
|
159.9 |
|
|
|
|
|
|
|
|
|
|
|
|
|
|
|
|
|
Primary liquidity |
|
2011 |
|
2010 |
|
Average |
|
Average |
|
||||
|
Central bank cash deposits |
|
|
56.6 |
|
|
34.5 |
|
|
51.4 |
|
|
46.7 |
|
|
Government bonds |
|
|
38.2 |
|
|
63.0 |
|
|
48.4 |
|
|
41.3 |
|
|
Total |
|
|
94.8 |
|
|
97.5 |
|
|
99.8 |
|
|
88.0 |
|
|
Secondary liquidity |
|
2011 |
|
2010 |
|
Average |
|
Average |
|
||||
|
High-quality ABS/covered bonds |
|
|
1.4 |
|
|
15.3 |
|
|
8.0 |
|
|
16.3 |
|
|
Credit institution bonds |
|
|
2.1 |
|
|
5.4 |
|
|
3.7 |
|
|
7.2 |
|
|
Corporate bonds |
|
|
0.3 |
|
|
0.4 |
|
|
0.6 |
|
|
0.3 |
|
|
Own securities (retained issuance) |
|
|
81.6 |
|
|
34.1 |
|
|
76.8 |
|
|
27.4 |
|
|
Other securities |
|
|
8.6 |
|
|
7.2 |
|
|
9.2 |
|
|
5.9 |
|
|
Other1 |
|
|
13.4 |
|
|
— |
|
|
6.4 |
|
|
— |
|
|
Total |
|
|
107.4 |
|
|
62.4 |
|
|
104.7 |
|
|
57.1 |
|
|
|
|
|
1 |
Includes other central bank eligible assets. |
Following the introduction of the FSA’s Individual Liquidity Guidance under ILAS, the Group now manages its liquidity position as a coverage ratio (proportion of stressed outflows covered by primary liquid assets) rather than by reference to a quantum of liquid assets; the liquidity position reflects a buffer over the regulatory minimum. The Group receives no recognition under ILAS for assets held for secondary liquidity purposes.
Primary liquid assets of £94.8 billion represent approximately 133 per cent (95 per cent at 31 December 2010) of the Group’s money market funding positions and are approximately 84 per cent (66 per cent at 31 December 2010) of all wholesale funding with a maturity of less than a year, and thus provides substantial buffer in the event of continued market dislocation.
In addition to primary liquidity holdings the Group has significant secondary liquidity holdings providing access to open market operations at a number of central banks and routinely makes use of these facilities as part of its normal liquidity management practices. Future use of such facilities will be based on prudent liquidity management and economic considerations, having regard for external market conditions.
On 29 February 2012, the European Central Bank made available to the European banking sector its second Long-Term Refinancing Operation (LTRO). The Group has drawn £11.4 billion under the LTRO for an initial term of three years. Any further use of the LTRO and/or other open market operations of central banks will be based upon prudent liquidity management.
The Group notes the Basel Committee’s Principles of Sound Liquidity Risk Management and Supervision (‘Sound Principles’). The planned introduction of the Liquidity Coverage Ratio (LCR - January 2015) and Net Stable Funding Ratio (NSFR - January 2018) contained within CRD IV are intended to raise the resilience of banks to potential liquidity shocks and provide the basis for a harmonised approach to liquidity risk management. The LCR measure promotes short term resilience of the liquidity profile by ensuring that banks have sufficient high quality liquid assets to meet potential funding outflows in a stressed environment within a one month period. The NSFR promotes resilience over a longer time horizon by requiring banks to fund their activities with a more stable source of funding on a going concern basis. This has a time horizon of one year and has been developed to ensure a sustainable maturity structure of assets and liabilities.
The guidance issued by the Basel Committee is still subject to final ratification by the EU and the methodology is likely to be refined on the basis of feedback from banks and regulators during the observation period. The actions already announced to right size the balance sheet are expected to ensure compliance with the future minimum standards. These standards are expected to be 100 per cent for both ratios by their respective effective dates.
HYBRID CAPITAL SECURITIES COUPON PAYMENTS
Since 31 January 2010, the Group has been prohibited under the terms of an agreement with the European Commission, from paying discretionary coupons and dividends on certain of its hybrid capital securities. This prohibition ended on 31 January 2012. The Group recommenced payments on certain hybrid capital securities from 31 January 2012. Future coupons and dividends on these hybrid capital securities will only be paid subject to, and in accordance with, the terms of the relevant securities.
The payments on those of the hybrid capital securities that are not cash-cumulative and which are expected, subject to their terms and conditions, to be paid in 2012 are estimated to amount to approximately £170 million. In the context of recent macro prudential policy discussions, the Board of
75
OPERATING AND FINANCIAL REVIEW AND PROSPECTS
Lloyds Banking Group has decided to issue new Lloyds Banking Group ordinary shares to raise this amount. The Group has entered into an agreement with a third-party financial institution in connection with the issue of these new ordinary shares. Such ordinary shares are expected to be issued, subject to market conditions, by the end of April 2012 at a price determined by reference to the volume weighted average price of the Group’s ordinary shares in a period prior to their date of issue.
CONTRACTUAL CASH OBLIGATIONS
The following table sets out the amounts and maturities of Lloyds Banking Group’s contractual cash obligations at 31 December 2011.
|
|
|
|
|
|
|
|
|
|
|
|
|
|
|
|
|
|
|
(unaudited) |
|
Within |
|
One to three |
|
Three to |
|
Over five |
|
Total |
|
|||||
|
Enhanced capital notes |
|
|
— |
|
|
— |
|
|
— |
|
|
9,085 |
|
|
9,085 |
|
|
Long-term debt – dated |
|
|
648 |
|
|
2,076 |
|
|
1,977 |
|
|
13,245 |
|
|
17,946 |
|
|
Medium-term notes |
|
|
31,527 |
|
|
15,041 |
|
|
9,874 |
|
|
12,263 |
|
|
68,705 |
|
|
Commercial paper |
|
|
18,091 |
|
|
— |
|
|
— |
|
|
— |
|
|
18,091 |
|
|
Covered bonds |
|
|
1,268 |
|
|
14,336 |
|
|
8,163 |
|
|
14,429 |
|
|
38,196 |
|
|
Securitisation notes |
|
|
4,869 |
|
|
8,093 |
|
|
2,396 |
|
|
22,054 |
|
|
37,412 |
|
|
Finance leases |
|
|
2 |
|
|
2 |
|
|
2 |
|
|
51 |
|
|
57 |
|
|
Operating leases |
|
|
348 |
|
|
610 |
|
|
577 |
|
|
1,489 |
|
|
3,024 |
|
|
Capital commitments |
|
|
328 |
|
|
1 |
|
|
— |
|
|
— |
|
|
329 |
|
|
Other purchase obligations |
|
|
1,073 |
|
|
1,598 |
|
|
614 |
|
|
252 |
|
|
3,537 |
|
|
|
|
|
58,154 |
|
|
41,757 |
|
|
23,603 |
|
|
72,868 |
|
|
196,382 |
|
Other purchase obligations include amounts expected to be payable in respect of material contracts entered into by the Lloyds Banking Group, in the ordinary course of business, for the provision of outsourced and other services. The cost of these services will be charged to the income statement as it is incurred. The Lloyds Banking Group also has a constructive obligation to ensure that its defined post-retirement benefit schemes remain adequately funded. The amount and timing of the Lloyds Banking Group’s cash contributions to these schemes is uncertain and will be affected by factors such as future investment returns and demographic changes. Lloyds Banking Group expects to make cash contributions of at least £650 million to these schemes in 2012.
At 31 December 2011, Lloyds Banking Group also had £8,058 million of preference shares, preferred securities and undated subordinated liabilities outstanding.
At 31 December 2011, the principal sources of potential liquidity for Lloyds Banking Group plc were dividends received from its directly owned subsidiary company, Lloyds TSB Bank, and loans from this and other Lloyds Banking Group companies. The ability of Lloyds TSB Bank and HBOS to pay dividends going forward, or for Lloyds TSB Bank or other Lloyds Banking Group companies to make loans to Lloyds Banking Group plc, depends on a number of factors, including their own regulatory capital requirements, distributable reserves and financial performance.
OFF-BALANCE SHEET ARRANGEMENTS
A table
setting out the amounts and maturities of Lloyds Banking Group’s other
commercial commitments at 31 December 2011 is included in note 56 to the
consolidated financial statements. These commitments are not included in Lloyds
Banking Group’s consolidated balance sheet.
Lending commitments are agreements
to lend to customers in accordance with contractual provisions; these are either
for a specified period or, as in the case of credit cards and overdrafts,
represent a revolving credit facility which can be drawn down at any time,
provided that the agreement has not been terminated. The total amounts of
unused commitments do not necessarily represent future cash requirements, in
that commitments often expire without being drawn upon.
Lloyds Banking Group’s financial guarantee contracts are accounted for as financial instruments and measured at fair value on the balance sheet. The contractual nominal amounts of these guarantees totalled £10,831 million at 31 December 2011 (with £4,989 million expiring within one year;£2,008 million between one and three years;£2,198 between three and five years; and £1,636 million over five years).
Lloyds Banking Group’s banking businesses are also exposed to liquidity risk through the provision of securitisation facilities to certain corporate customers. At 31 December 2011, Lloyds Banking Group offered securitisation facilities to its corporate and financial institution client base through its conduit securitisation vehicles, Argento, Cancara and Grampian. These are funded in the global asset-backed commercial paper market. The assets and obligations of these conduits are included in Lloyds Banking Group’s consolidated balance sheet. Lloyds Banking Group provides short-term asset-backed commercial paper liquidity support facilities on commercial terms to the issuers of the commercial paper, for use in the event of a market disturbance should they be unable to roll over maturing commercial paper or obtain alternative sources of funding.
Details of securitisations and other special purpose entity arrangements entered into by the Group are provided in notes 22 and 23 to the consolidated financial statements. The successful development of Lloyds Banking Group’s ability to securitise its own assets has provided a mechanism to tap a well established market, thereby diversifying Lloyds Banking Group’s funding base.
As indicated on page F-49, the Group’s securitisations include a number of synthetic securitisation arrangements. Synthetic securitisations use credit default swaps to transfer the credit risk of the underlying assets to a third party without transferring the funding requirement. As the prices of the underlying assets fall, this creates a credit risk on the third party which typically is not collateralised. The total notional amount of credit default swaps used for synthetic securitisation transactions at 31 December 2011 was £756 million.
Within Lloyds Banking Group’s insurance businesses, the principal sources of liquidity are premiums received from policyholders, charges levied upon policyholders, investment income and the proceeds from the sale and maturity of investments. The investment policies followed by Lloyds Banking Group’s life assurance companies take account of anticipated cash flow requirements including by matching the cash inflows with projected liabilities where appropriate. Cash deposits and highly liquid government securities are available to provide liquidity to cover any higher than expected cash outflows.
76
OPERATING AND FINANCIAL REVIEW AND PROSPECTS
CAPITAL RISK
DEFINITION
Capital risk is defined as the risk of the Group having a sub-optimal amount or quality of capital or that capital is inefficiently deployed across the Group.
RISK APPETITE
Capital risk appetite is set by the Board and reported through various metrics that enable the Group to manage capital constraints and market expectations. The Group Chief Executive, assisted by the Group Asset and Liability Committee, regularly reviews performance against risk appetite. A key metric is the Group’s core tier 1 capital ratio which the Group currently aims to maintain prudently in excess of 10 per cent. This and other aspects of appetite will be kept under review in the light of further clarity of regulatory and accounting reforms.
EXPOSURE
A capital exposure arises where the Group has insufficient regulatory capital resources to support its strategic objectives and plans, and to meet external stakeholder requirements and expectations. The Group’s capital management approach is focused on maintaining sufficient capital resources to prevent such exposures whilst optimising value for shareholders.
MEASUREMENT
The Group’s regulatory capital is divided into tiers depending on level of subordination and ability to absorb losses. Core tier 1 capital as defined in the FSA letter to the British Bankers’ Association in May 2009, comprises mainly shareholders’ equity and non-controlling interests, after deducting goodwill, other intangible assets and 50 per cent of the net excess of expected loss over accounting provisions and certain securitisation positions. Accounting equity is adjusted in accordance with FSA requirements, particularly in respect of pensions and Available-for-Sale assets. Tier 1 capital, as defined by the European Community Banking Consolidation Directive as implemented in the UK by the FSA’s General Prudential Sourcebook (GENPRU), is core tier 1 capital plus tier 1 capital securities less 50 per cent of material holdings in financial companies. Tier 2 capital, defined by GENPRU, comprises qualifying subordinated debt and some additional provisions and reserves after deducting 50 per cent of the excess of expected loss over accounting provisions, and certain securitisation positions and material holdings in financial companies. Total capital is the sum of tier 1 and tier 2 capital after deducting investments in subsidiaries and associates that are not consolidated for regulatory purposes. In the case of Lloyds Banking Group, this means that the net assets of its life assurance and general insurance businesses and the non-financial entities that are held by the Group’s private equity (including venture capital) businesses, are excluded from its total regulatory capital.
A number of limits are imposed by the FSA on the proportion of the regulatory capital base that can be made up of subordinated debt and preferred securities; for example, the amount of qualifying tier 2 capital cannot exceed that of tier 1 capital.
The minimum total capital required under pillar 1 of the Basel II framework is the Capital Resources Requirement (CRR) calculated as 8 per cent of risk weighted assets. In addition to the minimum requirements for total capital, the FSA has made statements to explain it also operates a framework of targets and expected buffers for core tier 1 and tier 1 capital.
In order to address the requirements of pillar 2 of the Basel II framework, the FSA currently sets additional minimum requirements through the issuance of Individual Capital Guidance (ICG) for each UK bank calibrated by reference to the CRR. A key input into the FSA’s ICG setting process is each bank’s Internal Capital Adequacy Assessment Process. The Group has been given an ICG by the FSA. The FSA has made it clear, however, that ICG remains a confidential matter between each bank and the FSA.
The Group maintains its own buffer to ensure that the regulatory minimum requirements and regulatory targets and buffers are met at all times. Additionally, an extensive series of stress analyses is undertaken during the year to determine the adequacy of the Group’s capital resources against the FSA minimum requirements in severe economic conditions.
During the
course of 2011, the European Banking Authority undertook two European wide
exercises to assess the capital strength of the larger banks within the sector.
The first of these, in July 2011, sought to assess the resilience of European
banks to severe shocks and their specific solvency in hypothetical stress
events under certain restrictive conditions. The stress test was carried out
based on common methodology and key common assumptions. The assumptions and
methodology were established to assess banks’ capital adequacy against a 5 per
cent core tier 1 capital benchmark. As a result of the assumed shock, the
estimated consolidated core tier 1 ratio of the Group was 7.7 per cent at the
worst point of the stress in 2012.
The second exercise, in December 2011, required banks to strengthen their capital position by building up temporary capital buffers against sovereign debt exposures to reflect market prices. In addition, it required banks to establish a buffer such that the core tier 1 ratio reaches a minimum level of 9 per cent by the end of June 2012. The Group’s consolidated core tier 1 ratio from this exercise was 10.1 per cent.
During the course of the year there have been a number of significant regulatory reform developments:
|
|
|
|
– |
‘CRD III’ came into force on 31 December 2011 resulting in increased risk weighted assets for market and credit risk. |
|
|
|
|
– |
The European Commission published a draft of the new Capital Requirements Directive and Regulation (‘CRD IV’) which will implement within the EU the so called ‘Basel III’ reforms for an enhanced global capital accord developed by the Basel Committee on Banking Supervision. |
|
|
|
|
– |
Lloyds Banking Group was one of 29 banks identified by the Financial Stability Board as being of global systemic importance (G-SIFIs) and which will be subject to stronger capital adequacy requirements than Basel III. The list of G-SIFIs will be reviewed annually from an initial pool of around 70 institutions. |
|
|
|
|
– |
In December, the Government announced that it would implement the key recommendations of the UK’s Independent Commission on Banking covering the ring-fencing of certain banking activities, ‘bail-in’ of senior unsecured debt, higher loss absorption capability and depositor preference. |
|
|
|
|
– |
The Group is aware that there is currently a review of the endorsed ratings that may be used in Internal Ratings Based (IRB) models and the Group is working on the assumption that no material changes to its modelling approaches will result from the review. |
Many of the details of the way these reforms will be integrated within the UK are still to be finalised. In the meantime, the Group continues to monitor their development very closely and analyse their potential impact whilst ensuring that the Group continues to have a strong loss absorption capacity exceeding regulatory requirements as currently formulated.
77
OPERATING AND FINANCIAL REVIEW AND PROSPECTS
The impact of the reforms will gradually phase in as they are subject to a long transition period through to 2022. That allows time for the Group to further strengthen its capital position as necessary through business performance and mitigating actions.
MITIGATION
The Group has developed procedures to ensure that compliance with both current and potential future requirements are understood and that policies are aligned to its risk appetite.
The Group is able to accumulate additional capital through profit retention, by raising equity via, for example, a rights issue or debt exchange and by raising tier 1 and tier 2 capital by issuing subordinated liabilities. The cost and availability of additional capital is dependent upon market conditions and perceptions at the time.
The Group has in issue, as part of tier 2 capital resources, enhanced capital notes which will convert to core tier 1 capital in the event that the Group’s published core tier 1 ratio (as defined by the FSA in May 2009) falls below 5 per cent.
Additional measures which have been used to manage the Group’s capital position include seeking to strike an appropriate balance of capital held within its insurance and banking subsidiaries and through improving the quality of its capital through liability management exercises. Regulatory requirements are primarily controlled through the quality and volume of lending but are also affected through the modelling approaches used to determine risk weighted assets and expected losses.
In order to pay dividends, the Group’s UK subsidiaries need to have distributable reserves. Whilst the group’s direct subsidiary, Lloyds TSB Bank plc, has distributable reserves, one of the Group’s indirect principal subsidiaries, Bank of Scotland plc, does not and is currently unable to pay dividends. There is a risk that any profits earned by Bank of Scotland plc and its subsidiaries may be unable to be remitted to the Group holding company as dividends. This risk is mitigated by management who can elect to restructure the capital resources of a subsidiary entity.
MONITORING
Capital is actively managed and regulatory ratios are a key factor in the Group’s budgeting and planning processes. Capital raised takes account of expected growth and currency of risk assets. Capital policies and procedures are subject to independent oversight. Regular reporting of actual and projected ratios, including those that would occur under stressed scenarios, is made to the Senior Asset and Liability Committee, the Group Asset and Liability Committee, the Group Risk Committee and the Board.
78
OPERATING AND FINANCIAL REVIEW AND PROSPECTS
|
|
|
|
|
|
|
|
|
|
Table 1.11: Capital resources (audited) |
|
|
|
|
|
|
|
|
|
|
|
|
|
|
|
|
|
|
|
|
2011 |
|
|
2010 |
|
|
|
|
|
£m |
|
|
£m |
|
|
Core tier 1 |
|
|
|
|
|
|
|
|
Shareholders’ equity per balance sheet |
|
|
45,920 |
|
|
43,725 |
|
|
Non-controlling interests per balance sheet |
|
|
674 |
|
|
841 |
|
|
Regulatory adjustments to non-controlling interests |
|
|
(577 |
) |
|
(524 |
) |
|
Regulatory adjustments: |
|
|
|
|
|
|
|
|
Adjustment for own credit |
|
|
(136 |
) |
|
(8 |
) |
|
Defined benefit pension adjustment |
|
|
(1,004 |
) |
|
(1,052 |
) |
|
Unrealised reserve on AFS debt securities |
|
|
(940 |
) |
|
747 |
|
|
Unrealised reserve on AFS equity |
|
|
(386 |
) |
|
(462 |
) |
|
Cash flow hedging reserve |
|
|
(325 |
) |
|
391 |
|
|
Prudent valuation adjustments |
|
|
(32 |
) |
|
— |
|
|
Other items |
|
|
(4 |
) |
|
(3 |
) |
|
|
|
|
43,190 |
|
|
43,655 |
|
|
Less: deductions from core tier 1 |
|
|
|
|
|
|
|
|
Goodwill |
|
|
(2,016 |
) |
|
(2,016 |
) |
|
Intangible assets |
|
|
(2,310 |
) |
|
(2,390 |
) |
|
50% excess of expected losses over impairment |
|
|
(720 |
) |
|
— |
|
|
50% of securitisation positions |
|
|
(153 |
) |
|
(214 |
) |
|
Core tier 1 capital |
|
|
37,991 |
|
|
39,035 |
|
|
Non-controlling preference shares1 |
|
|
1,613 |
|
|
1,507 |
|
|
Preferred securities |
|
|
4,487 |
|
|
4,338 |
|
|
Less: deductions from tier 1 |
|
|
|
|
|
|
|
|
50% of material holdings |
|
|
(94 |
) |
|
(69 |
) |
|
Total tier 1 capital |
|
|
43,997 |
|
|
44,811 |
|
|
Tier 2 |
|
|
|
|
|
|
|
|
Undated subordinated debt |
|
|
1,859 |
|
|
1,968 |
|
|
Dated subordinated debt |
|
|
21,229 |
|
|
23,167 |
|
|
Less: restriction in amount eligible |
|
|
— |
|
|
(620 |
) |
|
Unrealised gains on available for sale equity |
|
|
386 |
|
|
462 |
|
|
Eligible provisions |
|
|
1,259 |
|
|
2,468 |
|
|
Less: deductions from tier 2 |
|
|
|
|
|
|
|
|
50% excess of expected losses over impairment |
|
|
(720 |
) |
|
— |
|
|
50% of securitisation positions |
|
|
(153 |
) |
|
(214 |
) |
|
50% of material holdings |
|
|
(94 |
) |
|
(69 |
) |
|
Total tier 2 capital |
|
|
23,766 |
|
|
27,162 |
|
|
Supervisory deductions |
|
|
|
|
|
|
|
|
Unconsolidated investments – life |
|
|
(10,107 |
) |
|
(10,042 |
) |
|
Unconsolidated investments – general insurance and other |
|
|
(2,660 |
) |
|
(3,070 |
) |
|
Total supervisory deductions |
|
|
(12,767 |
) |
|
(13,112 |
) |
|
Total capital resources |
|
|
54,996 |
|
|
58,861 |
|
|
|
|
|
|
|
|
|
|
|
1 Covered by grandfathering provisions issued by FSA. |
|
|
|
|
|
|
|
|
|
|
|
|
|
|
|
|
|
Table 1.12: Risk Weighted Assets and Capital Ratio’s (unaudited) |
|
|
|
|
|
|
|
|
|
|
|
2011 |
|
|
2010 |
|
|
|
|
|
£m |
|
|
£m |
|
|
Risk-weighted assets |
|
|
352,341 |
|
|
406,372 |
|
|
Ratios |
|
|
|
|
|
|
|
|
Core tier 1 ratio |
|
|
10.8 |
% |
|
9.6 |
% |
|
Tier 1 capital ratio |
|
|
12.5 |
% |
|
11.0 |
% |
|
Total capital ratio |
|
|
15.6 |
% |
|
14.5 |
% |
79
OPERATING AND FINANCIAL REVIEW AND PROSPECTS
Table 1.13: Analysis of risk-weighted assets (unaudited)
|
|
|
|
|
|
|
|
|
|
|
|
|
|
2011 |
|
|
|
2010 |
|
|
|
|
|
£m |
|
|
|
£m |
|
|
Divisional analysis of risk-weighted assets |
|
|
|
|
|
|
|
|
|
Retail |
|
|
103,237 |
|
|
|
109,254 |
|
|
Wholesale |
|
|
163,766 |
|
|
|
196,164 |
|
|
Commercial |
|
|
25,434 |
|
|
|
26,552 |
|
|
Wealth and International |
|
|
47,278 |
|
|
|
58,714 |
|
|
Group Operations and Central items |
|
|
12,626 |
|
|
|
15,688 |
|
|
|
|
|
352,341 |
|
|
|
406,372 |
|
|
Risk type analysis of risk-weighted assets |
|
|
|
|
|
|
|
|
|
Foundation IRB |
|
|
90,450 |
|
|
|
114,490 |
|
|
Retail IRB |
|
|
98,823 |
|
|
|
105,475 |
|
|
Other IRB |
|
|
9,433 |
|
|
|
14,483 |
|
|
Advanced Approach |
|
|
198,706 |
|
|
|
234,448 |
|
|
Standardised Approach |
|
|
103,525 |
|
|
|
124,492 |
|
|
Credit risk |
|
|
302,231 |
|
|
|
358,940 |
|
|
Operational risk |
|
|
30,589 |
|
|
|
31,650 |
|
|
Market and counterparty risk |
|
|
19,521 |
|
|
|
15,782 |
|
|
Total risk-weighted assets |
|
|
352,341 |
|
|
|
406,372 |
|
Risk-weighted assets reduced by £54,031 million to £352,341 million, a decrease of 13 per cent. This reflects risk weighted asset reductions across all banking divisions driven by balance sheet reductions, lower lending balances and stronger management of risk.
Retail risk weighted assets reduced by £6,017 million mainly due to lower lending balances and the reducing mix of unsecured lending.
The reduction of Wholesale risk weighted assets of £32,398 million primarily reflects the balance sheet reductions including treasury asset sales and the run down in other asset portfolios that are not central to the Group’s strategy. This has been partly offset by an increase in market risk weighted assets, as a result of the implementation of CRD III.
Risk weighted assets within Wealth and International have reduced by £11,436 million as a result of asset run-off and write off and foreign exchange movements.
Integration of model activity previously undertaken on a separate heritage basis was largely completed in 2010 and there have been no significant migrations to IRB methodologies during 2011. In common with other banking groups operating on an IRB basis the Group anticipates moving some activity that is currently measured on the standardised approach over to an IRB methodology. These changes will take place primarily during 2012 and 2013.
TIER 1 CAPITAL
Core tier 1 capital has decreased by £1,044 million largely reflecting losses in the period. In addition there has been an increase in excess of expected losses over impairment losses, reflecting the reduction of legacy lending that is subject to very high provision levels and replacement with new lending.
TIER 2 CAPITAL
Tier 2 capital has decreased in the period by £3,396 million reflecting the increase in excess of expected losses over impairment, as noted above, and a reduction in eligible provisions. In addition, dated subordinated debt has also reduced in the period, partly due to amortisation and partly due to a capital restructuring exercise in December 2011, which resulted in a net overall redemption of dated subordinated debt.
SUPERVISORY DEDUCTIONS
Supervisory deductions mainly consist of investments in subsidiary undertakings that are not within the banking group for regulatory purposes. These investments are primarily the Scottish Widows and Clerical Medical life and pensions businesses together with general insurance business. Also included within deductions for other unconsolidated investments are investments in non-financial entities that are held by the Group’s private equity (including venture capital) businesses. During the period there has been a decrease in supervisory deductions primarily due to reduced holdings in private equity businesses, and in some cases changes to the level and/or nature of investments resulting in a reclassification as material holdings.
80
OPERATING AND FINANCIAL REVIEW AND PROSPECTS
The
movements in core tier 1 and total capital in the period are shown below:
Table
1.14: Movements in core tier 1 and total
capital during the year (audited)
|
|
|
|
|
|
|
|
|
|
|
|
Core tier 1 |
|
Total |
|
||
|
|
|
£m |
|
£m |
|
||
|
At 1 January 2011 |
|
|
39,035 |
|
|
58,861 |
|
|
Loss attributable to ordinary shareholders |
|
|
(451 |
) |
|
(451 |
) |
|
Decrease in regulatory post-retirement benefit adjustments |
|
|
48 |
|
|
48 |
|
|
Decrease in goodwill and intangible assets deductions |
|
|
80 |
|
|
80 |
|
|
Increase in excess of expected losses over impairment allowances |
|
|
(720 |
) |
|
(1,440 |
) |
|
Increase in material holdings deduction |
|
|
— |
|
|
(50 |
) |
|
Decrease in eligible provisions |
|
|
— |
|
|
(1,209 |
) |
|
Decrease in supervisory deductions from total capital |
|
|
— |
|
|
345 |
|
|
Decrease in dated subordinated debt, net of restriction in amount eligible |
|
|
— |
|
|
(1,318 |
) |
|
Other movements |
|
|
(1 |
) |
|
130 |
|
|
At 31 December 2011 |
|
|
37,991 |
|
|
54,996 |
|
LIFE INSURANCE BUSINESSES
The business transacted by the life insurance companies within the Group comprises unit-linked business, non profit business and with-profits business. Several companies transact either unit-linked and/or non-profit business, but Scottish Widows plc (Scottish Widows) and Clerical Medical Investment Group Limited (Clerical Medical) hold the only large With Profit Funds managed by the Group.
BASIS OF DETERMINING REGULATORY CAPITAL OF THE LIFE INSURANCE BUSINESSES
AVAILABLE CAPITAL RESOURCES
Available capital resources represent the excess of assets over liabilities calculated in accordance with detailed regulatory rules issued by the FSA.
Statutory basis. Assets are generally valued on a basis consistent with that used for accounting purposes (with the exception that, in certain cases, the value attributed to assets is limited) and which follows a market value approach where possible. If the market is not active, the Group establishes a fair value by using valuation techniques. Liabilities are calculated using a projection of future cash flows after making prudent assumptions about matters such as investment return, expenses and mortality. Discount rates used to value the liabilities are set with reference to the risk adjusted yields on the underlying assets in accordance with the FSA rules. Other assumptions are based on recent actual experience, supplemented by industry information where appropriate. The assessment of liabilities does not include future bonuses for with-profits policies that are at the discretion of management, but does include a value for policyholder options likely to be exercised.
REGULATORY CAPITAL REQUIREMENTS
Each life insurance company must retain sufficient capital to meet the regulatory capital requirements mandated by the FSA; the basis of calculating the regulatory capital requirement is given below. Except for Scottish Widows and Clerical Medical, the regulatory capital requirement is a combination of amounts held in respect of actuarial reserves, sums at risk and maintenance expenses (the Long-Term Insurance Capital Requirement) and amounts required to cover various stress tests (the Resilience Capital Requirement). The regulatory capital requirement is deducted from the available capital resources to give ‘statutory excess capital’.
For Scottish Widows and Clerical Medical, no Resilience Capital Requirement is required. However, a further test is required in respect of the With Profit Funds. This involves comparing the statutory basis of assessment with a realistic basis of assessment as described below.
‘Realistic’ basis. The FSA requires each life insurance company which contains a With Profit Fund in excess of £500 million to also carry out a ‘realistic’ valuation of that fund. The Group has two such funds; one within Scottish Widows and one within Clerical Medical. The word ‘realistic’ in this context reflects the fact that assumptions are best-estimate as opposed to prudent. This realistic valuation is an assessment of the financial position of a With Profit Fund calculated under a methodology prescribed by the FSA.
The valuation of with-profits assets in a With Profit Fund on a realistic basis differs from the valuation on a statutory basis as, in respect of non-profits business written in a With Profit Fund, it includes the present value of the anticipated future release of the prudent margins for adverse deviation. In addition, the realistic valuation uses the market value of assets without the limit affecting the statutory basis noted above.
The realistic valuation of liabilities includes an allowance for future bonuses. Options and guarantees are valued using a stochastic simulation model which values these liabilities on a basis consistent with tradable market option contracts (a ‘market-consistent’ basis). The model takes account of policyholder behaviour on a best-estimate basis and includes an adjustment to reflect future uncertainties where the exercise of options by policyholders might increase liabilities. Further details regarding the stochastic simulation model are given in the section entitled ‘Options and guarantees’ on page 85.
The ‘realistic excess capital’ is calculated as the difference between realistic assets and realistic liabilities of the With Profit Fund with a further deduction to cover various stress tests (the Risk Capital Margin). In circumstances where the ‘realistic excess capital’ position is less than the ‘statutory excess capital’, the company is required to hold additional capital to cover the shortfall. Any additional capital requirement under this test is referred to as the With Profit Insurance Capital Component.
The determination of realistic liabilities of the With Profit Funds includes the value of internal transfers expected to be made from each With Profit Fund to the Non Profit Fund held within the same life insurance entity. These internal transfers may include charges on policies where the associated costs are borne by the Non Profit Fund. The With Profit Insurance Capital Component may be reduced by the value, calculated in the stress test scenario, of these internal transfers, but only to the extent that credit has not been taken for the value of these charges in deriving actuarial reserves for the relevant Non Profit Fund.
81
OPERATING AND FINANCIAL REVIEW AND PROSPECTS
CAPITAL STATEMENT
The following table provides more detail regarding the capital resources available to meet regulatory capital requirements in the life insurance businesses. The figures quoted are based on management’s current expectations pending completion of the annual financial returns to the FSA. The figures allow for an anticipated transfer of £85 million from the Non Profit Fund of Scottish Widows Annuities Ltd to its Shareholder fund. During 2011, as part of a project to rationalise the Group structure Clerical Medical was purchased by Scottish Widows for £1,846 million. Scottish Widows recovered £1,485 million of this amount as a result of capital transactions with its holding company.
Table 1.15: Capital resources (unaudited)
|
|
|
|
|
|
|
|
|
|
|
|
|
|
|
|
|
|
|
|
|
|
|
|
|
|
|
|
|
Scottish Widows |
|
|
Clerical Medical |
|
|
UK Non Profit |
|
|
UK Life |
|
|
Overseas |
|
|
Total |
|
||||||
|
At 31 December 2011 |
|
|
|
|
|
|
|
|
|
|
|
|
|
|
|
|
|
|
|
|
|
|
|
|
|
(statutory basis) |
|
|
|
|
|
|
|
|
|
|
|
|
|
|
|
|
|
|
|
|
|
|
|
|
|
Shareholders’ funds: |
|
|
|
|
|
|
|
|
|
|
|
|
|
|
|
|
|
|
|
|
|
|
|
|
|
Held outside the long-term funds |
|
|
— |
|
|
|
— |
|
|
|
— |
|
|
|
1,843 |
|
|
|
632 |
|
|
|
2,475 |
|
|
Held within the long-term funds |
|
|
— |
|
|
|
— |
|
|
|
6,592 |
|
|
|
— |
|
|
|
312 |
|
|
|
6,904 |
|
|
Total shareholders’ funds |
|
|
— |
|
|
|
— |
|
|
|
6,592 |
|
|
|
1,843 |
|
|
|
944 |
|
|
|
9,379 |
|
|
Adjustments onto a regulatory basis: |
|
|
|
|
|
|
|
|
|
|
|
|
|
|
|
|
|
|
|
|
|
|
|
|
|
Unallocated surplus within insurance business |
|
|
242 |
|
|
|
58 |
|
|
|
— |
|
|
|
— |
|
|
|
— |
|
|
|
300 |
|
|
Value of in-force business |
|
|
— |
|
|
|
— |
|
|
|
(5,491 |
) |
|
|
— |
|
|
|
(818 |
) |
|
|
(6,309 |
) |
|
Other differences between IFRS and regulatory valuation of assets and liabilities |
|
|
— |
|
|
|
— |
|
|
|
107 |
|
|
|
(163 |
) |
|
|
124 |
|
|
|
68 |
|
|
Estimated share of ‘realistic’ liabilities consistent with the FSA reporting treatment |
|
|
(341 |
) |
|
|
(58 |
) |
|
|
— |
|
|
|
— |
|
|
|
— |
|
|
|
(399 |
) |
|
Qualifying loan capital |
|
|
— |
|
|
|
— |
|
|
|
— |
|
|
|
1,997 |
|
|
|
— |
|
|
|
1,997 |
|
|
Support arrangement assets |
|
|
184 |
|
|
|
— |
|
|
|
(184 |
) |
|
|
— |
|
|
|
— |
|
|
|
— |
|
|
Available capital resources |
|
|
85 |
|
|
|
— |
|
|
|
1,024 |
|
|
|
3,677 |
|
|
|
250 |
|
|
|
5,036 |
|
|
At 31 December 2010 |
|
|
|
|
|
|
|
|
|
|
|
|
|
|
|
|
|
|
|
|
|
|
|
|
|
(statutory basis) |
|
|
|
|
|
|
|
|
|
|
|
|
|
|
|
|
|
|
|
|
|
|
|
|
|
Shareholders’ funds: |
|
|
|
|
|
|
|
|
|
|
|
|
|
|
|
|
|
|
|
|
|
|
|
|
|
Held outside the long-term funds |
|
|
— |
|
|
|
— |
|
|
|
— |
|
|
|
1,414 |
|
|
|
721 |
|
|
|
2,135 |
|
|
Held within the long-term funds |
|
|
— |
|
|
|
— |
|
|
|
8,029 |
|
|
|
— |
|
|
|
401 |
|
|
|
8,430 |
|
|
Total shareholders’ funds |
|
|
— |
|
|
|
— |
|
|
|
8,029 |
|
|
|
1,414 |
|
|
|
1,122 |
|
|
|
10,565 |
|
|
Adjustments onto a regulatory basis: |
|
|
|
|
|
|
|
|
|
|
|
|
|
|
|
|
|
|
|
|
|
|
|
|
|
Unallocated surplus within insurance business |
|
|
322 |
|
|
|
321 |
|
|
|
— |
|
|
|
— |
|
|
|
— |
|
|
|
643 |
|
|
Value of in-force business |
|
|
— |
|
|
|
— |
|
|
|
(6,172 |
) |
|
|
— |
|
|
|
(843 |
) |
|
|
(7,015 |
) |
|
Other differences between IFRS and regulatory |
|
|
|
|
|
|
|
|
|
|
|
|
|
|
|
|
|
|
|
|
|
|
|
|
|
valuation of assets and liabilities |
|
|
— |
|
|
|
— |
|
|
|
625 |
|
|
|
(919 |
) |
|
|
111 |
|
|
|
(183 |
) |
|
Estimated share of ‘realistic’ liabilities consistent with the FSA reporting treatment |
|
|
(409 |
) |
|
|
(58 |
) |
|
|
— |
|
|
|
— |
|
|
|
— |
|
|
|
(467 |
) |
|
Qualifying loan capital |
|
|
— |
|
|
|
— |
|
|
|
— |
|
|
|
1,991 |
|
|
|
— |
|
|
|
1,991 |
|
|
Support arrangement assets |
|
|
344 |
|
|
|
— |
|
|
|
(344 |
) |
|
|
— |
|
|
|
— |
|
|
|
— |
|
|
Available capital resources |
|
|
257 |
|
|
|
263 |
|
|
|
2,138 |
|
|
|
2,486 |
|
|
|
390 |
|
|
|
5,534 |
|
Available capital resources for With-Profit Funds are presented in the table on a ‘realistic’ basis as this is more onerous than on a regulatory basis.
FORMAL INTRA-GROUP CAPITAL ARRANGEMENTS
Scottish Widows has a formal arrangement with one of its subsidiary undertakings, Scottish Widows Unit Funds Limited, whereby the subsidiary company can draw down capital from Scottish Widows to finance new business which is reinsured from the parent to its subsidiary. Scottish Widows has also provided subordinated loans to its fellow group undertaking Scottish Widows Bank plc. No such arrangement exists for Clerical Medical.
CONSTRAINTS OVER AVAILABLE CAPITAL RESOURCES
SCOTTISH WIDOWS
Scottish Widows was created following the demutualisation of Scottish Widows Fund and Life Assurance Society in 2000. The terms of the demutualisation are governed by a Court-approved Scheme of Transfer (the ‘Scheme’) which, inter alia, created a With Profit Fund and a Non-Participating Fund and established protected capital support for the with-profits policyholders in existence at the date of demutualisation. Much of that capital support is held in the Non-Participating Fund and, as such, the capital held in that fund is subject to the constraints noted below.
Requirement to maintain a Support Account: The Scheme requires the maintenance of a ‘Support Account’ within the Non-Participating Fund. The quantum of the Support Account is calculated with reference to the value of assets backing current with-profits policies which also existed at the date of demutualisation. Under the Scheme assets can only be transferred from the Non-Participating Fund if the value of the remaining assets in the fund exceeds the value of the Support Account. Scottish Widows has obtained from the FSA permission to include the value of the Support Account
82
OPERATING AND FINANCIAL REVIEW AND PROSPECTS
or, if greater, the excess of realistic liabilities for business written before demutualisation over the relevant assets (subject to the Non-Participating Fund being able to cover this amount by its suplus admissible assets) in assessing the realistic value of assets available to the With Profit Fund. At 31 December 2011, the estimated value of surplus admissible assets in the Non-Participating Fund was £1,198 million (31 December 2010: £1,693 million) and the estimated value of the Support Account was zero (December 2010: £197 million). However, at 31 December 2011, the excess of realistic liabilities with-profits business written down before demutualisation over the relevant assets was £67 million (31 December 2010: £55 million) which, in accordance with the FSA’s permission, has been used to assess the estimated value of realistic assets available to the With Profit Fund (and has therefore reduced the value of the Non-Participating Fund’s surplus admissible assets by that amount).
Further Support Account: The Further Support Account is an extra tier of capital support for the with-profits policies in existence at the date of demutualisation. The Scheme requires that assets can only be transferred from the Non-Participating Fund if the economic value of the remaining assets in the fund exceeds the aggregate of the Support Account and Further Support Account. Unlike the Support Account test, the economic value used for this test includes both admissible assets and the present value of future profits of business written in the Non-Participating Fund or by any subsidiaries of that fund. The balance of the Further Support Account is expected to reduce to nil by the year 2030. At 31 December 2011, the estimated net economic value of the Non-Participating Fund and its subsidiaries for the purposes of this test was £5,494 million (31 December 2010: £4,322 million) and the estimated combined value of the Support Account and Further Support Account was £2,291 million (31 December 2010: £2,446 million).
Other restrictions in the Non-Participating Fund: In addition to the policies which existed at the date of demutualisation, the With Profit Fund includes policies which have been written since that date. As a result of statements made to policyholders that investment policy will usually be the same for both types of business, there is an implicit requirement to hold additional regulatory assets in respect of the business written after demutualisation. The estimated amount required to provide such support at 31 December 2011 is £117 million (31 December 2010: £147 million). Scottish Widows has obtained from the FSA permission to include the value of this support in assessing the realistic value of assets available to the With Profit Fund. There is a further test requiring that no amounts can be transferred from the Non-Participating Fund of Scottish Widows unless there are sufficient assets within the Long-Term Fund to meet both policyholders’ reasonable expectations in light of liabilities in force at a year end and the new business expected to be written over the following year.
CLERICAL MEDICAL
The surplus held in the Clerical Medical With Profit Fund can only be applied to meet the requirements of the fund itself or distributed according to the prescribed rules of the fund. Shareholders are entitled to an amount not exceeding one ninth of the amount distributed to policyholders in the form of bonuses on traditional with-profits business. The use of capital within the fund is also subject to the terms of the scheme of demutualisation effected in 1996 and the conditions contained in the Principles and Practices of Financial Management of the fund. Capital within the Clerical Medical Non Profit Fund is available to meet the With Profit Fund requirements.
OTHER LIFE INSURANCE BUSINESSES
Except as described above capital held in UK Non Profit Funds is potentially transferable to other parts of the Group, subject to meeting the regulatory requirements of these businesses. There are no prior arrangements in place to allow capital to move freely between life insurance entities or other parts of the Group.
Overseas life business includes several life companies outside the UK, including Germany and Ireland. In all cases the available capital resources are subject to local regulatory requirements, and transfer to other parts of the Group is subject to additional complexity surrounding the transfer of capital from one country to another.
MOVEMENTS IN REGULATORY CAPITAL
The
movements in the Group’s available capital resources in the life business can
be analysed as follows:
Table 1.16: Movements
in available capital resources (unaudited)
|
|
|
|
|
|
|
|
|
|
|
|
|
|
|
|
|
|
|
|
|
|
|
|
Scottish Widows |
|
Clerical Medical |
|
UK Non Profit |
|
UK Life |
|
Overseas |
|
Total |
|
||||||
|
At 31 December 2010 |
|
|
257 |
|
|
263 |
|
|
2,138 |
|
|
2,486 |
|
|
390 |
|
|
5,534 |
|
|
|
|||||||||||||||||||
|
Changes in estimations and in demographic assumptions used to measure life assurance liabilities |
|
|
(24 |
) |
|
41 |
|
|
289 |
|
|
91 |
|
|
(6 |
) |
|
391 |
|
|
Dividends and capital transactions |
|
|
— |
|
|
— |
|
|
(1,483 |
) |
|
1,057 |
|
|
(156 |
) |
|
(582 |
) |
|
Change in support arrangements |
|
|
(160 |
) |
|
— |
|
|
160 |
|
|
— |
|
|
— |
|
|
— |
|
|
New business and other factors |
|
|
12 |
|
|
(304 |
) |
|
(80 |
) |
|
43 |
|
|
22 |
|
|
(307 |
) |
|
At 31 December 2011 |
|
|
85 |
|
|
— |
|
|
1,024 |
|
|
3,677 |
|
|
250 |
|
|
5,036 |
|
WITH PROFITS FUNDS
Available capital in the Scottish Widows With Profit Fund has decreased from £257 million at 31 December 2010 to an estimated £85 million at 31 December 2011. This is largely as a result of a reduction in the support arrangements from the Non Profit Fund. Available capital in the Clerical medical With Profit Fund has decreased from £263 million at 31 December 2010 to an estimated zero at 31 December 2011. The fund is in the process of distributing the free estate. Ultimately all surplus will be distributed to policyholders hence the available capital at 31 December 2011 is zero.
83
OPERATING AND FINANCIAL REVIEW AND PROSPECTS
UK NON PROFIT FUNDS
Available capital in the UK Non Profit Funds has decreased from £2,138 million at 31 December 2010 to an estimated £1,024 million at 31 December 2011. The main cause of the decrease was the impact of capital transactions supporting the purchase of Clerical Medical by Scottish Widows in July 2011. This was partially offset by increases in available capital from changes in assumptions. It should be noted that the decrease in the Non Profit Fund from the purchase of Clerical Medical is largely compensated for by an increase in the available capital in the Shareholder Funds.
UK LIFE SHAREHOLDER FUNDS
Available capital in the UK Life Shareholder Funds has increased from £2,486 million at 31 December 2010 to an estimated £3,677 million at 31 December 2011. The main cause of the increase was the impact of capital transactions supporting the purchase of Clerical Medical by Scottish Widows.
OVERSEAS LIFE BUSINESS
Available capital has decreased during 2011 due to a significant dividend payment which was only partially offset by profits emerging on new and in force business.
Analysis of policyholder liabilities reported in the balance sheet in respect of the Group’s life insurance business is as follows. With Profit Fund liabilities are valued in accordance with FRS 27.
Table 1.17: Analysis of policyholder liabilities (unaudited)
|
|
|
|
|
|
|
|
|
|
|
|
|
|
|
|
|
|
|
|
|
|
|
|
|
Scottish Widows |
|
|
Clerical Medical |
|
|
UK Non Profit |
|
|
Overseas |
|
|
Total |
|
|||||
|
At 31 December 2011 |
|
|
|
|
|
|
|
|
|
|
|
|
|
|
|
|
|
|
|
|
|
With Profit Fund liabilities |
|
|
13,651 |
|
|
|
9,300 |
|
|
|
4 |
|
|
|
— |
|
|
|
22,955 |
|
|
Unit-linked business (excluding that accounted for as non-participating investment contracts) |
|
|
— |
|
|
|
— |
|
|
|
38,474 |
|
|
|
7,801 |
|
|
|
46,275 |
|
|
Other life insurance business |
|
|
— |
|
|
|
— |
|
|
|
8,745 |
|
|
|
55 |
|
|
|
8,800 |
|
|
Insurance and participating investment contract liabilities |
|
|
13,651 |
|
|
|
9,300 |
|
|
|
47,223 |
|
|
|
7,856 |
|
|
|
78,030 |
|
|
Non-participating investment contract liabilities |
|
|
— |
|
|
|
— |
|
|
|
45,469 |
|
|
|
4,167 |
|
|
|
49,636 |
|
|
Total policyholder liabilities |
|
|
13,651 |
|
|
|
9,300 |
|
|
|
92,692 |
|
|
|
12,023 |
|
|
|
127,666 |
|
|
At 31 December 2010 |
|
|
|
|
|
|
|
|
|
|
|
|
|
|
|
|
|
|
|
|
|
With Profit Fund liabilities |
|
|
13,845 |
|
|
|
10,394 |
|
|
|
5 |
|
|
|
— |
|
|
|
24,244 |
|
|
Unit-linked business (excluding that accounted for as non-participating investment contracts) |
|
|
— |
|
|
|
— |
|
|
|
38,641 |
|
|
|
8,011 |
|
|
|
46,652 |
|
|
Other life insurance business |
|
|
— |
|
|
|
— |
|
|
|
8,527 |
|
|
|
90 |
|
|
|
8,617 |
|
|
Insurance and participating investment contract liabilities |
|
|
13,845 |
|
|
|
10,394 |
|
|
|
47,173 |
|
|
|
8,101 |
|
|
|
79,513 |
|
|
Non-participating investment contract liabilities |
|
|
— |
|
|
|
— |
|
|
|
47,058 |
|
|
|
4,304 |
|
|
|
51,362 |
|
|
Total policyholder liabilities |
|
|
13,845 |
|
|
|
10,394 |
|
|
|
94,231 |
|
|
|
12,405 |
|
|
|
130,875 |
|
CAPITAL SENSITIVITIES
SHAREHOLDERS’ FUNDS
Shareholders’ funds outside the long-term business fund, other than those used to match regulatory requirements, are mainly invested in assets that are less sensitive to market conditions.
WITH PROFIT FUNDS
The with-profit realistic liabilities and the available capital for the With- Profit Funds are sensitive to both market conditions and changes to a number of non-economic assumptions that affect the valuation of the liabilities of the fund. The available capital resources (and capital requirements) are sensitive to the level of the stock market, with the position worsening at low stock market levels as a result of the guarantees to policyholders increasing in value. However, the exposure to guaranteed annuity options increases under rising stock market levels. An increase in the level of equity volatility implied by the market cost of equity put options also increases the market consistent value of the options given to policyholders and worsens the capital position. Various hedging strategies are used to manage these exposures.
The most critical non-economic assumptions are the level of take-up of options inherent in the contracts (higher take-up rates are more onerous), mortality rates (lower mortality rates are generally more onerous) and lapses prior to dates at which a guarantee would apply (lower lapse rates are generally more onerous where guarantees are in the money). The sensitivity of the capital position and capital requirements of the With Profit Funds is partly mitigated by the actions that can be taken by management.
OTHER LONG-TERM FUNDS
Outside the With Profit Funds, assets backing actuarial reserves in respect of policyholder liabilities are invested so that the values of the assets and liabilities are broadly matched. The most critical non-economic assumptions are mortality rates in respect of annuity business written (lower mortality rates are more onerous). Reinsurance arrangements are in place to reduce the Group’s exposure to deteriorating mortality rates in respect of life insurance contracts. In addition, poor cost control would gradually reduce the available capital and lead to an increase in the valuation of the liabilities (through an increased allowance for future costs).
84
OPERATING AND FINANCIAL REVIEW AND PROSPECTS
Assets held in excess of those backing reserves are invested predominantly in cash and cash like instruments. The investment strategy is determined in line with the policy of Lloyds Banking Group to minimise both the profit volatility and the working capital (defined as available capital less minimum required capital) required to ensure all capital requirements continue to be met under a range of stress tests.
OPTIONS AND GUARANTEES
The Group has sold insurance products that contain options and guarantees, both within the With Profit Funds and in other funds.
OPTIONS AND GUARANTEES WITHIN THE WITH PROFIT FUNDS
The most significant options and guarantees provided from within the With Profit Funds are in respect of guaranteed minimum cash benefits on death, maturity, retirement or certain policy anniversaries, and guaranteed annuity options on retirement for certain pension policies.
For those policies written in Scottish Widows pre-demutualisation containing potentially valuable options and guarantees, under the terms of the Scheme a separate memorandum account was set up within the With Profit Fund of Scottish Widows called the Additional Account which is available, inter alia, to meet any additional costs of providing guaranteed benefits in respect of those policies. The Additional Account had a value at 31 December 2011 of £2.0 billion (2010: £1.8 billion). The eventual cost of providing benefits on policies written both pre and post demutualisation is dependent upon a large number of variables, including future interest rates and equity values, demographic factors, such as mortality, and the proportion of policyholders who seek to exercise their options. The ultimate cost will therefore not be known for many years.
As noted above, under the realistic capital regime of the FSA, the liabilities of both the Clerical Medical and Scottish Widows With Profit Funds are valued using a market-consistent stochastic simulation model. This model is used in order to place a value on the options and guarantees which captures both their intrinsic value and their time value.
The most significant economic assumptions included in the model are:
|
|
|
|
– |
Risk-free yield. The risk-free yield is defined as spot yields derived from the UK gilt yield curve. |
|
|
|
|
– |
Investment volatility. The calibration of the stochastic simulation model uses implied volatilities of derivatives where possible, or historical observed volatility where it is not possible to observe meaningful prices. For example, as at 31 December 2011, the 10 year equity-implied at-the-money assumption was set at 27.2 per cent (31 December 2010: 26.1 per cent). The assumption for property volatility was 15 per cent (31 December 2010: 15 per cent). The volatility of interest rates has been calibrated to the implied volatility of swaptions which was broadly 19 per cent (31 December 2010: 15 per cent). |
The model includes a matrix of the correlations between each of the underlying modelled asset types. The correlations used are consistent with long-term historical returns. The most significant non-economic assumptions included in the model are management actions (in respect of investment policy and bonus rates), guaranteed annuity option take-up rates and assumptions regarding persistency (both of which are based on recent actual experience and include an adjustment to reflect future uncertainties where the exercise of options by policyholders might increase liabilities), and assumptions regarding mortality (which are based on recent actual experience and industry tables).
OPTIONS AND GUARANTEES OUTSIDE THE WITH PROFIT FUNDS
A number of typical guarantees are provided outside the With Profit Funds such as guaranteed payments on death (e.g. Term assurance) or guaranteed income for life (e.g. annuities). In addition, certain personal pension policyholders in Scottish Widows, for whom reinstatement to their occupational pension scheme was not an option, have been given a guarantee that their pension and other benefits will correspond in value to the benefits of the relevant occupational pension scheme. The key assumptions affecting the ultimate value of the guarantee are future salary growth, gilt yields at retirement, annuitant mortality at retirement, marital status at retirement and future investment returns. There is currently a provision, calculated on a deterministic basis, of £61 million (31 December 2010: £57 million) in respect of those guarantees. If future salary growth were 0.5 per cent per annum greater than assumed, the liability would increase by some £2 million. If yields were 0.5 per cent lower than assumed, the liability would increase by some £9 million.
FINANCIAL AND PRUDENTIAL REGULATORY REPORTING, DISCLOSURE AND TAX RISK
DEFINITION
The risk of reputational damage, loss of investor confidence and/or financial loss arising from the adoption of inappropriate accounting policies, ineffective controls over financial, prudential regulatory and tax reporting, failure to manage the associated risks of changes in taxation rates, law, ownership or corporate structure and the failure to disclose accurate information about the Group on a timely basis.
RISK APPETITE
The risk appetite is set by the Board and reviewed on an annual basis or more frequently. It includes complying with statutory and regulatory reporting requirements and avoiding the need for restatement of publicly disclosed information.
EXPOSURE
Exposure represents the sufficiency of the Group’s policies and procedures to maintain adequate systems, processes and controls to support statutory, prudential regulatory and tax reporting, to prevent and detect financial reporting fraud, to manage the Group’s tax position and to support market disclosures.
MITIGATION
The Group maintains a system of internal controls, which is designed to:
|
|
|
|
– |
ensure that accounting policies are consistently applied, transactions are recorded and undertaken in accordance with delegated authorities, that assets are safeguarded and liabilities are properly recorded; |
|
|
|
|
– |
enable the calculation, preparation and reporting of financial, prudential regulatory and tax outcomes in accordance with applicable International Financial Reporting Standards, statutory and regulatory requirements; |
|
|
|
|
– |
ensure that disclosures are made on a timely basis in accordance with statutory and regulatory requirements and as far as possible are consistent with best practice and in compliance with the British Bankers’ Association Code for Financial Reporting Disclosure. |
85
OPERATING AND FINANCIAL REVIEW AND PROSPECTS
MONITORING
Financial reporting risk, prudential regulatory reporting risk, tax risk and disclosure risk are all actively monitored at business unit and Group levels. There are specific programmes of work undertaken across the Group to support:
|
|
|
|
– |
annual assessments of (1) the effectiveness of internal controls over financial reporting and (2) the effectiveness of the Group’s disclosure controls and procedures, both in accordance with the requirements of the US Sarbanes Oxley Act; |
|
|
|
|
– |
annual certifications by the Senior Accounting Officer with respect to the maintenance of appropriate tax accounting arrangements, in accordance with the requirements of the 2009 Finance Act. |
The Group also has in place an assurance process to support its prudential regulatory reporting and monitoring activities designed to identify and review tax exposures on a regular basis. There is ongoing monitoring to assess the impact of emerging regulation and legislation on financial, prudential regulatory and tax reporting.
The Group has a disclosure committee which assists the Group Chief Executive and Group Finance Director in fulfilling their disclosure responsibilities under relevant listing requirements.
86
OPERATING AND FINANCIAL REVIEW AND PROSPECTS
Definition
The risk of reductions in earnings and/or value, through financial or reputational loss, as a result of the failure of the party with whom the Group has contracted to meet its obligations (both on and off balance sheet).
RISK APPETITE
Credit risk appetite is set at Board level and is described and reported through a suite of metrics derived from a combination of accounting and credit portfolio performance measures, which include the use of various credit risk rating systems as inputs. These metrics are supported by more detailed appetite metrics at Divisional and business level and by a comprehensive suite of policies, sector caps, product and country limits to manage concentration risk and exposures within the Group’s approved risk appetite.
This statement of the Group’s overall appetite for credit risk is reviewed and approved annually. With the support of the Group Risk Committee, the Group Chief Executive allocates this risk appetite across the Group.
EXPOSURES
The principal sources of credit risk within the Group arise from loans and advances to retail customers, financial institutions, sovereigns and corporate clients. The credit risk exposures of the Group are set out in note 56 to the financial statements. Credit risk exposures are categorised as ‘retail’, arising primarily in the Retail and Wealth and International Divisions, ‘commercial’ and ‘corporate’, ‘financial institutions’ or ‘Sovereigns’ arising in the Wholesale, Commercial and Wealth and International Divisions.
In terms of loans and advances, credit risk arises both from amounts lent and commitments to extend credit to a customer as required. These commitments can take the form of loans and overdrafts, or credit instruments such as guarantees and standby, documentary and commercial letters of credit. With respect to commitments to extend credit, the Group is potentially also exposed to loss in an amount equal to the total unused commitments. However, the likely amount of loss is less than the total unused commitments, as most retail term commitments to extend credit can be cancelled without notice and the creditworthiness of customers is monitored frequently. In addition, most wholesale commitments to extend credit are contingent upon customers maintaining specific credit standards, which are monitored regularly.
Credit risk can also arise from debt securities, private equity investments, derivatives and foreign exchange activities. Note 19 to the financial statements shows the total notional principal amount of interest rate, exchange rate, credit derivative and equity and other contracts outstanding at 31 December 2011. The notional principal amount does not, however, represent the Group’s credit risk exposure, which is limited to the current cost of replacing contracts with a positive value to the Group. Such amounts are reflected in note 56 to the financial statements.
Credit risk exposures in the insurance businesses arise primarily from holding investments and from exposure to reinsurers. A significant proportion of the investments are held in unit-linked and with-profits funds where the shareholder risk is limited, subject to any guarantees given.
Note 2(H) to the financial statements provides details of the Group’s approach to the impairment of financial assets.
MEASUREMENT
In measuring the credit risk of loans and advances to customers and to banks at a counterparty level, the Group reflects three components: (i) the ‘probability of default’ by the counterparty on its contractual obligations; (ii) current exposures to the counterparty and their likely future development, from which the Group derives the ‘exposure at default’; and (iii) the likely loss ratio on the defaulted obligations (the ‘loss given default’).
For regulatory capital purposes the Group’s rating systems assess probability of default and if permitted, exposure at default and loss given default, in order to derive an expected loss. If not permitted, regulatory prescribed exposure at default and loss given default values are used in order to derive an expected loss. In contrast, impairment allowances are recognised for financial reporting purposes only for loss events that have occurred at the balance sheet date, based on objective evidence of impairment. Due to the different methodologies applied, the amount of incurred credit losses provided for in the financial statements differs from the amount determined from the expected loss models that are used for internal operational management and banking regulation purposes.
The Group assesses the probability of default of individual counterparties using internal rating models tailored to the various categories of counterparty. In its principal retail portfolios exposure at default and loss given default models are also in use. They have been developed internally and use statistical analysis, combined, where appropriate, with external data and subject matter expert judgement. Each rating model is subject to a validation process, undertaken by independent risk teams, which includes benchmarking to externally available data, where possible. The most material rating models are approved by the Group Risk Committee. Responsibility for the approval of the remaining material rating models, and the governance framework in place around all Lloyds Banking Group models, is delegated to the Group Model Governance Committee.
Each probability of default model segments counterparties into a number of rating grades, each representing a defined range of default probabilities (details of these rating scales are published in Lloyds Banking Group’s Pillar III disclosure). Exposures migrate between rating grades if the assessment of the counterparty probability of default changes. Each rating system is required to map to a master scale, which supports the consolidation of credit risk information across portfolios through the adoption of a common rating scale. Given the differing risk profiles and credit rating considerations, the underlying risk reporting has been split into two distinct master scales, a retail master scale and a wholesale master scale (Note 56 to the financial statements provides an analysis of the portfolio and page 92 provides details of the Credit risk portfolio).
The quality definition of both retail and non-retail counterparties/exposures is largely based on the outcomes of credit risk (probability of default – PD) models. The Group operates a significant number of different rating models, typically developed internally using statistical analysis and may use management judgement – retail models rely more on the former; non-retail models include more of the latter, especially in the larger corporate and more specialised lending portfolios. Internal data is supplemented with external data in model development, where appropriate. The models vary, inter alia, in the extent to which they are point in time versus through the cycle. The models are subject to rigorous validation and oversight/ governance, including where appropriate, benchmarking to external information.
In non-retail portfolios the PD models segment counterparties into a number of rating grades, with each grade representing a defined range of default probabilities, and there are a number of different model rating scales. Counterparties/exposures migrate between rating grades if the assessment of the
87
OPERATING AND FINANCIAL REVIEW AND PROSPECTS
PD changes. The modelled PDs ‘map’ to a (non-retail) master scale which enables the consolidation of credit risk information, and it is this that forms the basis for the IFRS credit quality characterisation.
In retail, for reporting purposes, counterparties are also segmented into a number of rating grades, each representing a defined range of default probabilities and exposures migrate between rating grades if the assessment of the counterparty probability of default changes.
The nature, construction and calibration of retail and non-retail models are very different and so too are their respective master scales (not least in their graduality). The distribution of probabilities of default is also different, which precludes reportage on a single consolidated basis.
MITIGATION
The Group uses a range of approaches to mitigate credit risk.
Internal control
Credit principles and policy: Risk Division sets out the credit principles and policy according to which credit risk is managed. Principles and policies are reviewed at least annually, and any changes are subject to a review and approval process. Policies, where appropriate, include lending guidelines, which define the responsibilities of lending officers and provide a disciplined and focused benchmark for credit decisions. These policies and procedures define chosen target market and risk acceptance criteria. These have been and will continue to be fine-tuned as appropriate and include the use of early warning indicators to help anticipate future areas of concern and allow us to take early and proactive mitigating actions.
The Group uses a variety of lending criteria within Retail when assessing applications for mortgages and unsecured lending. The general approval process uses credit acceptance scorecards and involves a review of an applicant’s previous credit history using information held by credit reference agencies (CRA). The Group also assesses the affordability of the borrowings to the borrower under stressed scenarios including increased interest rates. In addition, the Group has in place quantitative limits such as product maximum limits, the level of borrowing to income and the ratio of borrowing to collateral. Some of these limits relate to internal approval levels and others are hard limits above which the Group will reject the application. The Group also has certain criteria that are applicable to specific products such as for applications for a mortgage on a property that is to be let by the applicant.
The Group’s lending practices within Retail have changed since 2009 in several ways: the Group has lowered its maximum loan-to-value thresholds, which have been reduced across all mortgage product types; the Group has withdrawn from ‘specialist’ secured lending since early 2009 (self-certificated and sub-prime lending) and increased credit scorecard cut-offs for both secured and unsecured lending; the Group has tightened its assessments and the maximum limit for affordability of borrowings for both secured and unsecured lending. In addition, the number of properties permitted in buy-to-let portfolios has been reduced.
For UK mortgages, the Group’s policy is to reject all standard applications with a loan-to-value (‘LTV’) greater than 90 per cent. For mainstream mortgages the Group has maximum % LTV limits which depend upon the loan size. These limits are currently:
|
|
|
|
|
(Unaudited) |
|
|
|
Loan size |
|
|
|
From |
To |
Maximum LTV |
|
£1 |
£750,000 |
90% LTV |
|
£750,001 |
£1,000,000 |
85% LTV |
|
£1,000,001 |
£2,000,000 |
80% LTV |
|
£2,000,001 |
£5,000,000 |
70% LTV |
For mainstream mortgages greater than £5,000,000 the maximum LTV is 50 per cent. Buy-to-let mortgages are limited to a maximum of £1,000,000 and 75 per cent LTV. All mortgage applications above £500,000 are subject to manual underwriting.
The Group’s approach to underwriting applications for unsecured products in Retail takes into account the total unsecured debt held by a customer and their affordability. The Group rejects any application for an unsecured product where a customer is registered as bankrupt or insolvent, or has a County Court Judgment registered at a CRA used by the Group. In addition, for credit cards the Group rejects any applicant with total unsecured debt greater than £50,000 registered at the CRA; or revolving debt-to-income ratio greater than 75 per cent; or total unsecured debt-to-income ratio greater than 100 per cent. For unsecured personal loan applications, the Group rejects any applicant with total unsecured debt greater than £50,000 registered at the CRA. Rules around refinancing of debt have also been made more stringent since 2009 as a result of the application of rules relating to the total unsecured debt held by a customer and the Group’s approach in assessing affordability. This has resulted in fewer customers being eligible to refinance unsecured debt.
Counterparty limits: Limits are set against all types of exposure in a counterparty name, in accordance with an agreed methodology for each exposure type. This includes credit risk exposure on individual derivative transactions, which incorporates potential future exposures from market movements. Aggregate facility levels by counterparty are set and limit breaches are subject to escalation procedures.
Credit scoring: In its principal retail portfolios, the
Group uses statistically based decisioning techniques (primarily credit scoring
models). The Risk Division reviews model effectiveness, while new models and
model changes are referred by them to the appropriate Model Governance
Committees for approval. The most material changes are approved in accordance
with the governance framework set by the Group Model Governance Committee.
The
Group uses credit scorecards for decision making, both at an application stage
and throughout the credit lifecycle. The scorecards are developed in-house
using a variety of data sources. These sources include the customer’s
application for credit (for example, number of dependants, address and loan
term); data held internally by the Group (for example, other account holdings
and the performance of these other accounts); public information (for example,
electoral roll data, County Court Judgments and bankruptcies); and CRA data
(for example, performance of credit lines with other lenders, applications for
credit to other lenders). The selection of data characteristics and the
weightings associated with the characteristics are determined by the Group in
accordance with industry-recognised standards for scorecard development.
Scorecards are approved and monitored in accordance with Group Model Governance
policies.
The Group has developed over 60 scorecards, which are currently in use in Retail, based on product and customer segment. The scorecard cut-offs are determined based on the inherent risk of the product/segment, the product pricing and the Group’s appetite for the risk of the product/customer
88
OPERATING AND FINANCIAL REVIEW AND PROSPECTS
segment for which the scorecard has been developed; no direct comparison can be made against scorecards developed by other lenders or external providers.
The United Kingdom has a number of credit reference agencies who, as well as providing lenders with data, have also developed commercially-available credit scores to lenders and consumers. However, unlike the US, there is no dominant provider of credit scores and significantly less consumer awareness of these scores. The Group does not base its lending decisions on these commercially-available scores and instead uses the scorecards developed in-house, as detailed above.
Individual credit assessment and sanction: Credit risk in wholesale portfolios is subject to individual credit assessments, which consider the strengths and weaknesses of individual transactions and the balance of risk and reward. Exposure to individual counterparties, groups of counterparties or customer risk segments is controlled through a tiered hierarchy of delegated sanctioning authorities. Approval requirements for each decision are based on the transaction amount, the customer’s aggregate facilities, credit risk ratings and the nature and term of the risk. The Group’s credit risk appetite criteria for counterparty underwriting is generally the same as that for assets intended to be held over the period to maturity.
Controls over rating systems: The Group has established an independent team in the Risk Division that sets common minimum standards, designed to ensure risk models and associated rating systems are developed consistently, and are of sufficient quality to support business decisions and meet regulatory requirements. Internal rating systems are developed and owned by the Risk Division. Line management takes responsibility for ensuring the validation of the rating systems, supported and challenged by independent specialist functions in their respective division.
Cross-border and cross-currency exposures: The Board sets country risk appetite. Within these, country limits are authorised by the country limits panel, taking into account economic, financial, political and social factors. Group policies stipulate that these limits must be consistent with, and support the approved business and strategic plans of the Group.
Concentration risk: Credit risk management includes portfolio controls on certain industries, sectors and product lines to reflect risk appetite. Credit policy is aligned to the Group’s risk appetite and restricts exposure to certain high risk countries and more vulnerable sectors and segments. Note 21 to the financial statements provides an analysis of loans and advances to customers by industry (for wholesale customers) and product (for retail customers). Exposures are monitored to prevent an excessive concentration of risk. These concentration risk controls are not necessarily in the form of a maximum limit on lending, but may instead require new business in concentrated sectors to fulfil additional hurdle requirements. The Group’s large exposures are reported in accordance with regulatory reporting requirements.
Stress testing and scenario analysis: The credit portfolio is also subjected to stress testing and scenario analysis, to simulate outcomes and calculate their associated impact. Events are modelled at a Group-wide level, at divisional and business unit level and by rating model and portfolio, for example, within a specific industry sector.
Specialist expertise: Credit quality is maintained by specialist units providing, for example: intensive management and control (see Intensive Care section); security perfection, maintenance and retention; expertise in documentation for lending and associated products; sector specific expertise; and legal services applicable to the particular market place and product range offered by the business.
Daily settlement limits: Settlement risk arises in any situation where a payment in cash, securities or equities is made in the expectation of a corresponding receipt in cash, securities or equities. Daily settlement limits are established for each counterparty to cover the aggregate of all settlement risk arising from the Group’s market transactions on any single day.
Credit risk assurance and review: Risk oversight teams monitor credit performance trends, review and challenge exceptions to planned outcomes, and test the adequacy of credit risk infrastructure and governance processes throughout the Group. This includes tracking portfolio performance against an agreed set of key risk indicators. Group Credit Risk Assurance, a Group level function comprising experienced credit professionals, is also in place. In conjunction with Risk senior management, this team carries out independent risk based credit reviews, providing individual business unit assessment of the effectiveness of risk management practices and adherence to risk controls across the diverse range of the Group’s wholesale businesses and activities, facilitating a wide range of audit, assurance and review work. These include cyclical (‘standard’) credit reviews, non-standard reviews, project reviews, credit risk rating model reviews and bespoke assignments, including impairment reviews as required. The work of Group Credit Risk Assurance continues to provide executive and senior management with assurance and guidance on credit quality, effectiveness of credit risk controls and accuracy of impairments.
The determination of cash flows for cases in the Business Support Units (BSU) is undertaken by a specialist risk team who gather a range of information from various sources including the customer, professional advisers and the Group’s own credit teams to fully understand and appraise the customer’s business and circumstances. A more detailed assessment is undertaken to assist in reducing risk exposure and highlighting potential strategic options. This often involves the Group, in addition to using its own internal experts, engaging professional advisers to perform Independent Business Reviews (IBRs) and, where relevant, independently value collateral held. In more complex cases, such as those involving work-out strategies, the review may also involve:
|
|
|
|
– |
critically assessing customer’s ability to successfully manage the business effectively in a distressed situation where turnaround is required; |
|
|
|
|
– |
analysis of market sector factors, i.e. products, customers, suppliers, pricing and margin issues; |
|
|
|
|
– |
performance review of operational areas that should be considered in terms of current effectiveness and efficiency and scope for improvements; |
|
|
|
|
– |
financial analysis to model plans and factor in potential sensitivities, vulnerabilities and upsides; and |
|
|
|
|
– |
determining the most appropriate corporate and capital structure suitable for the work-out strategy concerned. |
The above assessment, monitoring and control processes continue throughout the period the case is managed within the BSU.
Collateral
The principal collateral types for loans and advances are:
|
|
|
|
– |
mortgages over residential and commercial real estate; |
|
|
|
|
– |
charges over business assets such as premises, inventory and accounts receivables; |
|
|
|
|
– |
charges over financial instruments such as debt securities and equities; and |
|
|
|
|
– |
guarantees received from third parties. |
The Group maintains guidelines on the acceptability of specific classes of collateral.
89
OPERATING AND FINANCIAL REVIEW AND PROSPECTS
Collateral held as security for financial assets other than loans and advances is determined by the nature of the instrument. Debt securities, treasury and other eligible bills are generally unsecured, with the exception of asset-backed securities and similar instruments, which are secured by portfolios of financial assets. Collateral is generally not held against loans and advances to financial institutions, except where securities are held as part of reverse repurchase or securities borrowing transactions or where a collateral agreement has been entered into under a master netting agreement. Derivative transactions with wholesale counterparties are typically collateralised under a Credit Support Annex in conjunction with the ISDA Master Agreement.
It is the Group’s policy that collateral should always be realistically valued by an appropriately qualified source, independent of both the credit decision process and the customer, at the time of borrowing. Collateral is reviewed on a regular basis in accordance with business unit credit policy, which will vary according to the type of lending and collateral involved. For residential mortgages, the Group adjusts open market property values to take account of the costs of realisation and any discount associated with the realisation of the collateral. In order to minimise the credit loss, the Group may seek additional collateral from the counterparty as soon as impairment indicators are identified for the relevant individual loans and advances.
The Group considers risk concentrations by collateral providers and collateral type, as appropriate, with a view to ensuring that any potential undue concentrations of risk are identified and suitably managed by changes to strategy, policy and/or business plans.
Master netting agreements
Where it is efficient and likely to be effective (generally with counterparties with which it undertakes a significant volume of transactions), the Group enters into master netting agreements. Although master netting agreements do not generally result in an offset of balance sheet assets and liabilities, as transactions are usually settled on a gross basis, they do reduce the credit risk to the extent that, if an event of default occurs, all amounts with the counterparty are terminated and settled on a net basis. The Group’s overall exposure to credit risk on derivative instruments subject to master netting agreements can change substantially within a short period, since it is affected by each transaction subject to the agreement.
Other credit risk transfers
The Group also undertakes asset sales, securitisations and credit derivative based transactions as a means of mitigating or reducing credit risk, taking into account the nature of assets and the prevailing market conditions.
MONITORING
In conjunction with Risk, businesses identify and define portfolios of credit and related risk exposures and the key benchmarks, behaviours and characteristics by which those portfolios are managed in terms of credit risk exposure. This entails the production and analysis of regular portfolio monitoring reports for review by senior management. Risk Division in turn produces an aggregated review of credit risk throughout the Group, including reports on significant credit exposures, which are presented to the Group Risk Committee and the Board Risk Committee.
The performance of all rating models is monitored on a regular basis, in order to seek to ensure that models provide appropriate risk differentiation capability, the generated ratings remain as accurate and robust as practical, and the models assign appropriate risk estimates to grades/pools. All models are monitored against a series of agreed key performance indicators. In the event that the monitoring identifies material exceptions or deviations from expected outcomes, these will be escalated in accordance with the governance framework set by the Group Model Governance Committee.
INTENSIVE CARE OF CUSTOMERS IN DIFFICULTY
Retail Assets
The Group’s aim in offering forbearance and other assistance to retail customers in financial distress is to benefit both the customer and the Group by: discharging the Group’s regulatory and social responsibilities to support its customers and act in their best long-term interests; and bringing customer facilities back into a sustainable position which, for residential mortgages, also means keeping customers in their homes.
The Group offers a range of tools and assistance to support
retail customers who are encountering financial difficulties. Cases are managed
on an individual basis, with the circumstances of each customer considered
separately and the action taken judged as being affordable and sustainable for
the customer. Operationally, the provision and review of such assistance is
controlled through the application of an appropriate policy framework; controls
around the execution of policy; regular review of the different treatments to
confirm that they remain appropriate; monitoring of customers’ performance and
the level of payments received; and management visibility of the nature and
extent of assistance provided and the associated risk.
Assistance is provided
through trained colleagues in branches and dedicated telephony units, and via
online guidance material. For those customers requiring more intensive help,
assistance is provided through dedicated support units where tailored repayment
programmes can be agreed. Customers are actively supported and referred to free
money advice agencies when they have multiple credit facilities, including
those at other lenders, that require restructuring. Within the Collections and
Recoveries functions, the sharing of best practice and alignment of policies
across the Group has helped to drive more effective customer outcomes and
achieve operational efficiencies.
One component of the relationship management approach is to contact customers showing signs of financial difficulty, discussing with them their circumstances and offering solutions to prevent their accounts falling into arrears.
The specific tools available to assist customers vary by territory and product and the customer’s status. In defining the treatments offered to customers who have experienced financial distress, the Group distinguishes between the following three categories:
|
|
|
|
– |
Forbearance – a temporary account change to assist customers through periods of financial difficulty where arrears do not accrue at the original contractual payments such as a temporary capital payment break. |
|
|
|
|
– |
Financial distress assistance – an account change for customers in financial distress where arrears accrue at the contractual payment such as a short-term arrangement to pay. |
|
|
|
|
– |
Repair – an account change used to repair a customer’s position when they have emerged from financial difficulty, such as capitalisation of arrears when a payment track record has been re-established. |
To assist customers in financial distress, the Group also participates in, or benefits from, the following UK Government (‘Government’) sponsored programmes for households:
|
|
|
|
– |
Income Support for Mortgage Interest: This is a Government medium-term initiative that provides certain defined categories of customers, principally those who are unemployed, access to a benefit scheme, paid for by the Government, which covers all or part of the interest on the |
90
OPERATING AND FINANCIAL REVIEW AND PROSPECTS
|
|
|
|
|
mortgage. Qualifying customers are able to claim for mortgage interest on up to £200,000 of the mortgage. All decisions regarding an individual’s eligibility and any amounts payable under the scheme rest solely with the Government. Payments are made directly to the Group by the appropriate Government department. |
|
|
|
|
– |
Homeowner Mortgage Support Scheme: This is a Government medium-term initiative that enables borrowers affected by temporary reductions in income to access reduced payments for a period of up to two years. The Government provides a partial guarantee to the Group whilst a customer participates in the plan. Decisions on eligibility, principally whether the Group expects the borrower’s earnings to recover fully, initially rest with the Group and must be made on the basis of detailed information received from an independent fee-free advisor. After a year, the customer must undergo a further full assessment made by the advice agency. The customer must pay at least 30 per cent of the interest due. Any shortfall in payments made during the period covered by the scheme is collected through increased payments over the remaining term. The scheme was closed to new customer applications in April 2011 by the Department of Communities and Local Government. |
|
|
|
|
– |
Mortgage Rescue Scheme: This is a Government short-term initiative for borrowers in difficulty and facing repossession, who would have priority for re-housing by a local authority (e.g. the elderly, disabled, single parents). Eligible customers can have their property bought in full or part by the social rented sector and then remain in their home as a tenant or shared equity partner. If the property is sold outright the mortgage is redeemed in full. |
Wholesale Assets (including Commercial)
In order to support wholesale customers that encounter
difficulties during the current economic downturn, the Group increased the size
of its dedicated Business Support Unit (BSU) to cover all its UK and
International portfolios.
Wholesale credit facilities are reviewed on a regular
basis and more frequently where required. When financial stress is exhibited,
the customer would be transferred at an early stage to the Group’s specialist
BSU and Customer Support teams.
The over-arching aim of BSU is to work with
each customer to try and resolve the issues, to restore the business to a
financially viable position and facilitate a business turnaround. This could be
through a number of channels, including providing advice on how to develop and
implement turnaround strategies, and considering potential restructuring of
debt and forbearance. This may involve using turnaround professionals, for
example accountants and valuers.
BSU Relationship Managers are highly
experienced and operate in a closely controlled and monitored environment,
including regular oversight and ongoing close scrutiny by senior management.
Exposure is minimised through a combination of appropriate forbearance, asset
sales, restructuring and work-out strategies.
Customer Support provides
intensive care and support to Commercial SME customers in difficulty. Whilst
the customer relationship remains with the Relationship Manager, they are
supported by a Customer Support Manager to oversee and manage identified risk.
The main types of forbearance for wholesale customers in financial distress could include:
|
|
|
|
– |
Covenant resets and breach of covenant waivers |
|
|
|
|
– |
Extension of facilities outside of agreed terms |
|
|
|
|
– |
Capital repayment holidays |
|
|
|
|
– |
Debt for Equity swaps |
|
|
|
|
– |
Partial debt write off |
Forbearance alone is not necessarily an indicator of impairment but will always be a trigger point for the Bank to review the customer’s credit and assess whether the risk has changed.
Multiple types of forbearance concessions often occur on the more distressed cases managed in BSU or Customer Support. Each case is treated depending on its own specific circumstances and the Group’s strategy and offer of forbearance is largely dependent on the individual situation. Early identification, control and monitoring are key.
One of the components of the approach to forbearance and early identification of issues used for wholesale assets is the Group’s Credit Risk Classification Policy, which is designed to identify and highlight portfolio levels of asset quality as well as individual problem credits. This policy includes the Group’s good book/mainstream early warning process identifying “Special Mention” and “Sub Standard” cases. This process seeks to ensure that Relationship Managers act promptly to identify, and highlight to senior management, customers that have the possibility to become higher risk in the future. Customers classified as Special Mention/Sub Standard are subject to additional controls and regular monitoring routines, including oversight by BSU and the independent Credit Sanctioning function.
Concessions granted under forbearance would be classified in the Credit Risk Classification system according to the severity of the customer’s financial distress. Management information is produced which gives a high level view of asset quality, with clearly defined parameters and features. Trends and warning signs are reported and advised to senior management promptly, which include issues not yet identified by rating models. A robust review and challenge process is applied to each credit if asset quality declines, initiating an appropriate and measured response. As the financial stress of a credit deteriorates the Credit Risk Classification helps to determine the route and management of the customer. Repeat transgressions of forbearance would be reflected in the strategy to manage the customer and an objective reassessment of any impairment will be undertaken on a regular basis. This is subject to independent review and sanctioning.
In addition, the Group, through its banking businesses, participates in a number of initiatives designed to assist small and medium-sized enterprises. These include:
|
|
|
|
– |
The Lending Code: Introduced by the British Bankers’ Association in November 2009, the Lending Code is a voluntary set of commitments and standards of good practice to ensure that lenders act fairly and reasonably in all dealings with customers. This has been reviewed and updated in March 2011, not only to incorporate the key elements of the Statement of Principles, a previously issued brochure which outlined an agreed approach to working with micro-enterprise customers (entities with fewer than 10 employees and having a turnover of less than €2 million), but also to introduce key elements of the work of the Business Finance Taskforce (see below). A leaflet ‘A Guide to the Lending Code for Micro-enterprises’ provides an introduction to the standards customers should expect from the banks, building societies and credit-card providers who follow the Lending Code. |
91
OPERATING AND FINANCIAL REVIEW AND PROSPECTS
|
|
|
|
– |
Business Finance Taskforce: The Group through its banking businesses has taken a leading role in the Business Finance Taskforce, which committed to a number of key actions in three broad areas: (i) improving customer relationships; (ii) ensuring better access to finance and (iii) providing better information and promoting customer understanding. Key elements of this include: |
|
|
|
|
– |
The lending appeals process: If a lending application is declined, customers have the right to appeal that decision. The Group has committed to respond to 90 per cent of appeals with a decision within 15 working days. |
|
|
|
|
– |
The finance application checklist: Details of the type of information customers may be asked to provide in order to support their lending application. |
|
|
|
|
– |
Business mentoring: Businesses may benefit from the support of a business mentor. www.mentorsme.co.uk is a free online service that enables businesses to locate local independent mentoring organisations that suit their specific business needs. |
|
|
|
|
– |
2012 SME Charter: The Group’s 2012 SME Charter details its commitment to supporting UK business and incorporates its pledge to support any viable business through temporary difficulties and into recovery. As part of this commitment, the Group issues a Letter of Concern to customers when it has concerns about their business or the Group’s relationship with them. This aims to generate early dialogue between the customer and the Group, so that a joint approach to the situation can be agreed with them. |
The Group’s accounting policy for loan renegotiations and forbearance is set out in note 2 to the financial statements.
CREDIT RISK PORTFOLIO IN 2011
Overview
|
|
|
|
– |
The Group achieved a significant reduction in its impairment charge in 2011 to £9,787 million (from £13,181 million in 2010), due primarily to lower corporate real estate and real estate related charges in Wholesale, lower charges in the Irish portfolio together with strong Retail performance. All divisions experienced impairment charge reductions by over 20 per cent from 2010. |
|
|
|
|
– |
These lower charges were principally supported by the continued application of the prudent risk appetite and strong risk management controls resulting in improved portfolio and new business quality, continued low interest rates, and broadly stable UK property prices, partly offset by weakening UK economic growth and rising unemployment. |
|
|
|
|
– |
Prudent credit policies and procedures are in place throughout the Group, focusing on development of enduring client relationships. As a result of this approach, the credit quality of new lending remains strong. |
|
|
|
|
– |
The Group’s more difficult exposures are being managed successfully in the current challenging economic environment by the Wholesale Business Support Units and Retail Collection and Recovery Units. The Group’s exposure to Ireland has been closely managed, with a dedicated UK-based business support team in place to manage the winding down of the Irish book. |
|
|
|
|
– |
The Group continues to proactively manage down sovereign as well as banking and trading book exposure to selected Eurozone countries. |
|
|
|
|
– |
Divestment strategy is focused on balance sheet reduction and disposal of higher risk positions. |
Table 1.18: Impairments on Group loans and advances (audited)
|
|
|
|
|
|
|
|
|
|
|
|
|
|
|
2011 |
|
2010 |
|
Change |
|
|||
|
Retail |
|
|
1,970 |
|
|
2,747 |
|
|
28 |
|
|
Wholesale |
|
|
2,901 |
|
|
4,064 |
|
|
29 |
|
|
Commercial |
|
|
303 |
|
|
382 |
|
|
21 |
|
|
Wealth and International |
|
|
4,610 |
|
|
5,988 |
|
|
23 |
|
|
Central items |
|
|
3 |
|
|
— |
|
|
|
|
|
Total impairment charge |
|
|
9,787 |
|
|
13,181 |
|
|
26 |
|
92
OPERATING AND FINANCIAL REVIEW AND PROSPECTS
Table 1.19: Impairment charge by division (audited)
|
|
|
|
|
|
|
|
|
|
|
|
|
|
|
|
|
|
|
|
|
Loans and |
|
Impaired |
|
Impaired loans |
|
Impairment |
|
Impairment |
|
|||||
|
At 31 December 2011 |
|
|
|
|
|
|
|
|
|
|
|
|
|
|
|
|
|
Retail |
|
|
356,907 |
|
|
8,822 |
|
|
2.5 |
|
|
2,718 |
|
|
30.8 |
|
|
Wholesale |
|
|
135,395 |
|
|
27,756 |
|
|
20.5 |
|
|
11,537 |
|
|
41.6 |
|
|
Commercial |
|
|
29,681 |
|
|
2,915 |
|
|
9.8 |
|
|
880 |
|
|
30.2 |
|
|
Wealth and International |
|
|
56,394 |
|
|
20,776 |
|
|
36.8 |
|
|
12,583 |
|
|
60.6 |
|
|
Reverse repos and other items |
|
|
17,066 |
|
|
— |
|
|
— |
|
|
— |
|
|
— |
|
|
|
|
|
595,443 |
|
|
60,269 |
|
|
10.1 |
|
|
27,718 |
|
|
46.0 |
|
|
Impairment provisions1 |
|
|
(27,718 |
) |
|
|
|
|
|
|
|
|
|
|
|
|
|
Fair value adjustments2 |
|
|
(2,087 |
) |
|
|
|
|
|
|
|
|
|
|
|
|
|
Total Group |
|
|
565,638 |
|
|
|
|
|
|
|
|
|
|
|
|
|
|
At 31 December 2010 |
|
|
|
|
|
|
|
|
|
|
|
|
|
|
|
|
|
Retail |
|
|
368,981 |
|
|
9,750 |
|
|
2.6 |
|
|
3,096 |
|
|
31.8 |
|
|
Wholesale |
|
|
158,002 |
|
|
31,658 |
|
|
20.0 |
|
|
14,863 |
|
|
46.9 |
|
|
Commercial |
|
|
29,649 |
|
|
2,856 |
|
|
9.6 |
|
|
992 |
|
|
34.7 |
|
|
Wealth and International |
|
|
66,368 |
|
|
20,342 |
|
|
30.7 |
|
|
10,684 |
|
|
52.5 |
|
|
Reverse repos and other items |
|
|
3,378 |
|
|
— |
|
|
— |
|
|
— |
|
|
— |
|
|
|
|
|
626,378 |
|
|
64,606 |
|
|
10.3 |
|
|
29,635 |
|
|
45.9 |
|
|
Impairment provisions1 |
|
|
(29,635 |
) |
|
|
|
|
|
|
|
|
|
|
|
|
|
Fair value adjustments2 |
|
|
(4,146 |
) |
|
|
|
|
|
|
|
|
|
|
|
|
|
Total Group |
|
|
592,597 |
|
|
|
|
|
|
|
|
|
|
|
|
|
|
|
|
|
1 |
Impairment provisions include collective unimpaired provisions. |
|
|
|
|
2 |
The fair value adjustments relating to loans and advances were those required to reflect the HBOS assets in the Company’s consolidated financial records at their fair value and took into account both the expected future impairment losses and market liquidity at the date of acquisition. The unwind relating to future impairment losses requires significant management judgement to determine its timing which includes an assessment of whether the losses incurred in the current period were expected at the date of the acquisition and assessing whether the remaining losses expected at the date of the acquisition will still be incurred. The element relating to market liquidity unwinds to the income statement over the estimated useful lives of the related assets (until 2014 for wholesale loans and 2018 for retail loans) although if an asset is written off or suffers previously unexpected impairment then this element of the fair value will no longer be considered a timing difference (liquidity) but permanent (impairment). In 2011, a net credit of £1,943 million (2010: £3,118 million) relates to the unwind of HBOS acquisition fair value adjustments. Of that amount, £1,693 million (2010: £2,229 million) relates to impairment losses incurred which were expected at the date of acquisition. The fair value unwind in respect of loans and advances is expected to continue to decrease in future years as fixed-rate periods on mortgages expire, loans are repaid or written off, and will reduce to zero over time. |
Table 1.20: Total impairment charge (audited)
|
|
|
|
|
|
|
|
|
|
|
|
|
|
|
2011 |
|
2010 |
|
Change |
|
|||
|
Total impairment losses on loans and advances to customers |
|
|
9,712 |
|
|
12,958 |
|
|
25 |
|
|
Loans and advances to banks |
|
|
— |
|
|
(13 |
) |
|
|
|
|
Debt securities classified as loans and receivables |
|
|
49 |
|
|
57 |
|
|
14 |
|
|
Available-for-sale financial assets |
|
|
81 |
|
|
115 |
|
|
30 |
|
|
Other credit risk provisions |
|
|
(55 |
) |
|
64 |
|
|
|
|
|
Total impairment charge |
|
|
9,787 |
|
|
13,181 |
|
|
26 |
|
Pages 94 to 104 provide the credit risk divisional split.
93
OPERATING AND FINANCIAL REVIEW AND PROSPECTS
OUTLOOK – GROUP
The UK economy is fragile with a weak short-term economic outlook generally expected. Consumer and business confidence remains low, relatively high inflation has reduced consumer spending power and exports are falling.
In addition to the possibility of further economic
deterioration, financial market instability represents an additional downside
risk. Uncertainty over the best way forward for the highly indebted Eurozone persists
and poses a serious threat to the global economic recovery, with political
instability and contagion to other Eurozone countries increasing in the last
quarter of 2011. Financial markets are expected to remain dislocated and
volatile, with the risk of contagion unlikely to dissipate in the near term,
and this continues to place strains on funding markets at a time when many
financial institutions (in particular) have material ongoing funding needs.
The
Group’s Wholesale leveraged finance portfolios and its commercial real estate
and real estate related property lending portfolios remain particularly
vulnerable, especially in the significant secondary and tertiary asset lending
book. The impact of further economic weakness will also be felt in the traditional
lending portfolios in Corporate and Commercial. In addition, the Irish economic
outlook remains challenging and the property market depressed, and both these
factors could further adversely impact the wholesale and retail Irish
portfolios.
However, despite the downside risks, against its base case economic assumptions, the Group expects the total impairment charge in 2012 to reduce by a similar percentage amount to the reduction in 2011, reflecting the stabilisation of its portfolios and proactive risk management activities.
CREDIT RISK – RETAIL
Overview
|
|
|
|
– |
The Retail impairment charge was £1,970 million in 2011, a decrease of £777 million, or 28 per cent, from 2010. |
|
|
|
|
– |
The decrease in the Retail impairment charge was driven by the unsecured portfolio as a result of the improved quality of new business and effective portfolio management. The Retail impairment charge for loans and advances to customers, as an annualised percentage of average loans and advances to customers, decreased to 0.54 per cent in 2011 from 0.74 per cent in 2010. |
|
|
|
|
– |
The overall value of assets entering arrears in 2011 were lower in both unsecured and secured lending compared to 2010. |
Table 1.21: Retail impairment charge (audited)
|
|
|
|
|
|
|
|
|
|
|
|
|
|
|
2011 |
|
2010 |
|
Change |
|
|||
|
Secured |
|
|
463 |
|
|
292 |
|
|
(59 |
) |
|
Unsecured |
|
|
1,507 |
|
|
2,455 |
|
|
39 |
|
|
Total impairment charge |
|
|
1,970 |
|
|
2,747 |
|
|
28 |
|
Impaired loans and provisions
Retail impaired loans decreased by £0.9 billion to £8.8 billion compared with 31 December 2010 and, as a percentage of closing loans and advances to customers, decreased to 2.5 per cent from 2.6 per cent at 31 December 2010. Impairment provisions, as a percentage of impaired loans, reduced to 30.8 per cent from 31.8 per cent at 31 December 2010.
94
OPERATING AND FINANCIAL REVIEW AND PROSPECTS
The Retail division’s loans and advances to customers are analysed in the following table:
Table 1.22: Impairments on Retail loans and advances (audited)
|
|
|
|
|
|
|
|
|
|
|
|
|
|
|
|
|
|
|
|
|
|
|
|
Loans and |
|
|
Impaired |
|
|
Impaired loans |
|
Impairment |
|
|
Impairment |
|
|||||
|
As at 31 December 2011 |
|
|
|
|
|
|
|
|
|
|
|
|
|
|
|
|
|
|
|
|
Secured |
|
|
332,143 |
|
|
|
6,452 |
|
|
|
1.9 |
|
|
1,651 |
|
|
|
25.6 |
|
|
Unsecured |
|
|
|
|
|
|
|
|
|
|
|
|
|
|
|
|
|
|
|
|
Collections |
|
|
|
|
|
|
1,233 |
|
|
|
5.0 |
|
|
1,067 |
|
|
|
86.5 |
|
|
Recoveries2 |
|
|
|
|
|
|
1,137 |
|
|
|
4.6 |
|
|
— |
|
|
|
|
|
|
|
|
|
24,764 |
|
|
|
2,370 |
|
|
|
9.6 |
|
|
1,067 |
|
|
|
|
|
|
Total gross lending |
|
|
356,907 |
|
|
|
8,822 |
|
|
|
2.5 |
|
|
2,718 |
|
|
|
30.8 |
|
|
Impairment provisions1 |
|
|
(2,718 |
) |
|
|
|
|
|
|
|
|
|
|
|
|
|
|
|
|
Fair value adjustments |
|
|
(1,377 |
) |
|
|
|
|
|
|
|
|
|
|
|
|
|
|
|
|
|
|
|
352,812 |
|
|
|
|
|
|
|
|
|
|
|
|
|
|
|
|
|
As at 31 December 2010 |
|
|
|
|
|
|
|
|
|
|
|
|
|
|
|
|
|
|
|
|
Secured |
|
|
341,069 |
|
|
|
6,769 |
|
|
|
2.0 |
|
|
1,589 |
|
|
|
23.5 |
|
|
Unsecured |
|
|
|
|
|
|
|
|
|
|
|
|
|
|
|
|
|
|
|
|
Collections |
|
|
|
|
|
|
1,826 |
|
|
|
6.6 |
|
|
1,507 |
|
|
|
82.5 |
|
|
Recoveries2 |
|
|
|
|
|
|
1,155 |
|
|
|
4.1 |
|
|
— |
|
|
|
|
|
|
|
|
|
27,912 |
|
|
|
2,981 |
|
|
|
10.7 |
|
|
1,507 |
|
|
|
|
|
|
Total gross lending |
|
|
368,981 |
|
|
|
9,750 |
|
|
|
2.6 |
|
|
3,096 |
|
|
|
31.8 |
|
|
Impairment provisions1 |
|
|
(3,096 |
) |
|
|
|
|
|
|
|
|
|
|
|
|
|
|
|
|
Fair value adjustments |
|
|
(2,154 |
) |
|
|
|
|
|
|
|
|
|
|
|
|
|
|
|
|
|
|
|
363,731 |
|
|
|
|
|
|
|
|
|
|
|
|
|
|
|
|
|
|
|
|
1 |
Impairment provisions include collective unimpaired provisions. |
|
|
|
|
2 |
Recoveries assets are written down to the present value of future expected cash flows on these assets. |
The Retail division’s loans and advances to customers are analysed in the following table:
Table 1.23: Retail loans and advances to customers (audited)
|
|
|
|
|
|
|
|
|
|
|
|
|
|
2011 |
|
|
|
2010 |
|
|
Secured: |
|
|
|
|
|
|
|
|
|
Mainstream |
|
|
256,518 |
|
|
|
265,368 |
|
|
Buy to let |
|
|
48,276 |
|
|
|
46,356 |
|
|
Specialist |
|
|
27,349 |
|
|
|
29,345 |
|
|
|
|
|
332,143 |
|
|
|
341,069 |
|
|
Unsecured |
|
|
|
|
|
|
|
|
|
Credit cards |
|
|
10,192 |
|
|
|
11,207 |
|
|
Personal loans |
|
|
11,970 |
|
|
|
13,881 |
|
|
Bank accounts |
|
|
2,602 |
|
|
|
2,624 |
|
|
Others |
|
|
— |
|
|
|
200 |
|
|
|
|
|
24,764 |
|
|
|
27,912 |
|
|
Total Retail gross lending |
|
|
356,907 |
|
|
|
368,981 |
|
95
OPERATING AND FINANCIAL REVIEW AND PROSPECTS
SECURED
Secured impairment charge
The impairment charge increased by £171 million, to £463 million in 2011 compared to the previous year. The impairment charge as a percentage of average loans and advances to customers, increased to 0.14 per cent from 0.09 per cent in 2010. The provision coverage increased reflecting a less certain outlook on house prices and appropriate provisioning against existing credit risks which have longer emergence periods due to current low interest rate environment, partially offset by underlying improvements in the quality of the portfolio.
Impairment provisions held against secured assets reflect the Group’s view of appropriate allowance for incurred losses. The Group holds appropriate impairment provisions for customers who are experiencing financial difficulty, either on a forbearance arrangement or who may be able to maintain their repayments whilst interest rates remain low. At December 2011, 1.2 per cent of loan balances were on a forbearance arrangement, compared to 1.3 per cent at 31 December 2010.
Secured impaired loans
Impaired loans decreased by £0.3 billion to £6.5 billion at 31 December 2011 and, as a percentage of closing loans and advances to customers, reduced to 1.9 per cent from 2.0 per cent at 31 December 2010. The number of customers going into arrears reduced throughout 2011 in comparison with 2010. Specialist lending remains closed to new business and this book has been in run-off since 2009.
Secured arrears
The percentage of mortgage cases greater than three months in arrears (excluding repossessions) remained stable at 2.3 per cent at 31 December 2011 compared to 31 December 2010 and 30 June 2011. The percentage of Specialist mortgage cases greater than three months in arrears (excluding repossessions) increased to 7.5 per cent at 31 December 2011 from 6.4 per cent at 31 December 2010 with the majority of this growth occurring in the first half of 2011.
Table 1.24: Mortgages greater than three months in arrears (excluding repossessions) (unaudited)
|
|
|
|
|
|
|
|
|
|
|
|
|
|
|
|
|
|
Number of cases |
|
Total mortgage accounts % |
|
||||||||
|
|
|
|
31 Dec |
|
|
31 Dec |
|
|
31 Dec |
|
|
31 Dec |
|
|
Greater than three months in arrears (excluding repossessions) |
|
|
|
|
|
|
|
|
|
|
|
|
|
|
Mainstream |
|
|
53,734 |
|
|
55,675 |
|
|
2.0 |
|
|
2.1 |
|
|
Buy to let |
|
|
7,805 |
|
|
7,577 |
|
|
1.8 |
|
|
1.8 |
|
|
Specialist |
|
|
13,677 |
|
|
12,582 |
|
|
7.5 |
|
|
6.4 |
|
|
Total |
|
|
75,216 |
|
|
75,834 |
|
|
2.3 |
|
|
2.3 |
|
|
|
|
|
|
|
|
|
|
|
|
|
|
|
|
|
|
|
Value of debt1 |
|
Total mortgage balances % |
|
||||||||
|
|
|
|
31 Dec |
|
|
31 Dec |
|
|
31 Dec |
|
|
31 Dec |
|
|
Greater than three months in arrears (excluding repossessions) |
|
|
|
|
|
|
|
|
|
|
|
|
|
|
Mainstream |
|
|
5,988 |
|
|
6,247 |
|
|
2.3 |
|
|
2.4 |
|
|
Buy to let |
|
|
1,145 |
|
|
1,157 |
|
|
2.4 |
|
|
2.5 |
|
|
Specialist |
|
|
2,427 |
|
|
2,262 |
|
|
8.9 |
|
|
7.7 |
|
|
Total |
|
|
9,560 |
|
|
9,666 |
|
|
2.9 |
|
|
2.8 |
|
|
1 |
Value of debt represents total book value of mortgages in arrears. |
The stock of repossession was stable with 3,043 cases at 31 December 2010 and 3,054 at 31 December 2011, and is broadly consistent with prior years and below the Council of Mortgage Lender’s average.
Secured loan to value analysis
The average indexed loan-to-value (LTV) on the mortgage portfolio at 31 December 2011 was 55.9 per cent compared with 55.6 per cent at 31 December 2010. The average LTV for new mortgages and further advances written in 2011 was 62.1 per cent compared with 60.9 per cent for 2010. The tables below show LTVs across the principal mortgage portfolios.
The indexed LTV in excess of 100 per cent as a percentage of closing loans and advances ending 31 December 2011 reduced to 12.0 per cent (£39.7 billion), compared with 13.2 per cent (£44.9 billion) at 31 December 2010. This decrease in negative equity was driven by the regional mix of business being biased towards areas experiencing house price growth despite national house prices falling.
96
OPERATING AND FINANCIAL REVIEW AND PROSPECTS
Table 1.25: Actual and average LTVs across the Retail mortgage portfolios (audited)
|
|
|
|
|
|
|
|
|
|
|
|
|
|
|
|
|
|
Mainstream |
|
Buy to let |
|
Specialist1 |
|
Total |
|
||||
|
At 31 December 2011 |
|
|
|
|
|
|
|
|
|
|
|
|
|
|
Less than 60% |
|
|
32.5 |
|
|
12.7 |
|
|
14.6 |
|
|
28.1 |
|
|
60% to 70% |
|
|
12.7 |
|
|
13.0 |
|
|
10.1 |
|
|
12.5 |
|
|
70% to 80% |
|
|
17.2 |
|
|
24.1 |
|
|
17.2 |
|
|
18.2 |
|
|
80% to 90% |
|
|
16.0 |
|
|
17.3 |
|
|
19.3 |
|
|
16.5 |
|
|
90% to 100% |
|
|
11.2 |
|
|
17.1 |
|
|
19.0 |
|
|
12.7 |
|
|
Greater than 100% |
|
|
10.4 |
|
|
15.8 |
|
|
19.8 |
|
|
12.0 |
|
|
Total |
|
|
100.0 |
|
|
100.0 |
|
|
100.0 |
|
|
100.0 |
|
|
Average loan-to-value:2 |
|
|
|
|
|
|
|
|
|
|
|
|
|
|
Stock of residential mortgages |
|
|
52.2 |
|
|
74.0 |
|
|
72.6 |
|
|
55.9 |
|
|
New residential lending |
|
|
61.4 |
|
|
65.8 |
|
|
n/a |
|
|
62.1 |
|
|
Impaired mortgages |
|
|
72.0 |
|
|
99.8 |
|
|
88.0 |
|
|
78.4 |
|
|
At 31 December 2010 |
|
|
|
|
|
|
|
|
|
|
|
|
|
|
Less than 60% |
|
|
33.0 |
|
|
11.4 |
|
|
14.0 |
|
|
28.5 |
|
|
60% to 70% |
|
|
12.1 |
|
|
11.1 |
|
|
9.4 |
|
|
11.7 |
|
|
70% to 80% |
|
|
16.1 |
|
|
21.9 |
|
|
15.9 |
|
|
16.8 |
|
|
80% to 90% |
|
|
15.3 |
|
|
18.0 |
|
|
21.3 |
|
|
16.2 |
|
|
90% to 100% |
|
|
11.9 |
|
|
19.1 |
|
|
20.0 |
|
|
13.6 |
|
|
Greater than 100% |
|
|
11.6 |
|
|
18.5 |
|
|
19.4 |
|
|
13.2 |
|
|
Total |
|
|
100.0 |
|
|
100.0 |
|
|
100.0 |
|
|
100.0 |
|
|
Average loan-to-value:2 |
|
|
|
|
|
|
|
|
|
|
|
|
|
|
Stock of residential mortgages |
|
|
51.9 |
|
|
75.6 |
|
|
72.9 |
|
|
55.6 |
|
|
New residential lending |
|
|
60.0 |
|
|
66.5 |
|
|
n/a |
|
|
60.9 |
|
|
Impaired mortgages |
|
|
72.3 |
|
|
97.8 |
|
|
87.3 |
|
|
78.0 |
|
|
|
|
|
1 |
Specialist lending is closed to new business and is in run-off. |
|
|
|
|
2 |
Average loan-to-value is calculated as total loans and advances as a percentage of the total collateral assigned to these loans and advances. |
Unsecured
In 2011 the impairment charge on loans and advances to customers reduced by £948 million to £1,507 million compared with 2010. This reflected continued improving business quality and portfolio trends resulting from the Group’s conservative risk appetite, with a focus on lending to existing customers.
A combination of the Group’s risk appetite, reduced demand
from customers for new unsecured borrowing and existing customers continuing to
reduce their personal indebtedness contributed to loans and advances to
customers reducing by £3.1 billion to £24.8 billion at 31 December 2011.
The
impairment charge as a percentage of average loans and advances to customers
decreased to 5.66 per cent in 2011 from 8.11 per cent in 2010, with the
impairment charge reducing at a greater rate than the reduction in average
loans and advances in 2011.
Impaired loans decreased by £0.6 billion to £2.4 billion which represented 9.6 per cent of closing loans and advances to customers at 31 December 2011, compared with 10.7 per cent at 31 December 2010. The reduction in impaired loans is a result of tightening credit policy across the credit lifecycle, including stronger controls on customer affordability. Retail’s exposure to revolving credit products has been actively managed to ensure that it is appropriate to customers’ changing financial circumstances. The portfolios show a level of early arrears for accounts acquired since 2009 which are at pre-recession levels, highlighting an underlying improvement in the risk profile of the business.
Impairment provisions decreased by £0.4 billion, compared with 31 December 2010, to £1.1 billion. This reduction was primarily a result of the movement of assets from Collections to Recoveries, at which point they are written down to the present value of future expected cash flows. The proportion of impaired loans that have been written down to the present value of future expected cash flows on these assets has increased to 48.0 per cent at 31 December 2011 from 38.7 per cent at 31 December 2010. Impairment provisions as a percentage of impaired loans in collections increased to 86.5 per cent at 31 December 2011 from 82.5 per cent at 31 December 2010.
97
OPERATING AND FINANCIAL REVIEW AND PROSPECTS
CREDIT RISK – WHOLESALE
Overview
|
|
|
|
– |
Impairment losses for 2011 decreased significantly to £2,901 million, from £4,064 million for 2010. |
|
|
|
|
– |
The decrease in the underlying impairment charge during 2011 is primarily driven by lower impairment from the corporate real estate and real estate-related lending portfolios, partly offset mainly by higher impairment on leveraged acquisition finance exposures during 2011 where the dampened effect of UK economic conditions had the most impact. |
|
|
|
|
– |
Whilst subdued UK economic conditions and weaker consumer confidence is evident in a number of sectors, the reduction in the impairment charge also reflects continued strong risk management and the low interest rate environment, helping to maintain defaults at a lower level. |
|
|
|
|
– |
The Group has proactively managed down sovereign as well as banking and trading book exposures to selected European countries. Divestment strategy was focused on balance sheet reduction and disposing of higher risk positions. |
|
|
|
|
– |
A robust credit risk management and control framework is in place across the combined portfolios and a prudent risk appetite approach continues to be embedded across the division. Significant resources continue to be deployed into the Business Support Units, which focuses on key and vulnerable obligors and asset classes. |
Table 1.26: Wholesale impairment charge (unaudited)
|
|
|
|
|
|
|
|
|
|
|
|
|
|
|
|
2011 |
|
|
2010 |
|
|
Change |
|
|
Wholesale excluding Asset Finance |
|
|
2,701 |
|
|
3,800 |
|
|
29 |
|
|
Asset Finance |
|
|
200 |
|
|
264 |
|
|
24 |
|
|
Total impairment charge |
|
|
2,901 |
|
|
4,064 |
|
|
29 |
|
Wholesale’s impairment charge decreased £1,163 million, or 29 per cent, compared to £4,064 million during 2010. Despite a subdued UK economic environment in 2011, impairment charges have decreased substantially compared with 2010 due to robust proactive risk management, an appropriately impaired portfolio (against current economic assumptions) and a low interest rate environment helping to maintain defaults at a lower level. There has also been a stabilisation of commercial property prices in 2011. Impairment charges as an annualised percentage of average loans and advances to customers reduced to 1.95 per cent from 2.23 per cent in 2010.
Impaired loans and provisions
Wholesale’s impaired loans reduced by £3,902 million to
£27,756 million compared with 31 December 2010. The reduction is due to new
impaired assets mainly in the Corporate Real Estate Business Support Unit being
more than offset by write-offs on irrecoverable assets, the sale of previously
impaired assets, net repayments and transfers back to good book. Furthermore,
the flow of assets into impaired status reduced during the year compared to
2010. Impairment provisions also reduced as a result of write-offs and a lower
impairment rate on newly impaired assets especially in the corporate real
estate and real estate related portfolios. As a result of this, impairment
provisions as a percentage of impaired loans reduced to 41.6 per cent from 46.9
per cent at 31 December 2010.
As a percentage of closing loans and advances to
customers, impaired loans increased to 20.5 per cent from 20.0 per cent at 31
December 2010. This increase is a result of the reducing level of total loans
and advances to customers as at 31 December 2011 compared with 31 December
2010. The Group continues to monitor vulnerable portfolios within Wholesale
and, where appropriate, remedial risk mitigating actions are being undertaken.
98
OPERATING AND FINANCIAL REVIEW AND PROSPECTS
Table 1.27: Impairments on Wholesale loans and advances (audited)
|
|
|
|
|
|
|
|
|
|
|
|
|
|
|
|
|
|
|
|
|
Loans and |
|
Impaired |
|
Impaired loans |
|
Impairment |
|
Impairment |
|
|||||
|
As at 31 December 2011 |
|
|
|
|
|
|
|
|
|
|
|
|
|
|
|
|
|
Corporate |
|
|
68,772 |
|
|
5,631 |
|
|
8.2 |
|
|
3,051 |
|
|
54.2 |
|
|
Corporate Real Estate BSU |
|
|
21,326 |
|
|
15,211 |
|
|
71.3 |
|
|
5,631 |
|
|
37.0 |
|
|
Wholesale Equity |
|
|
113 |
|
|
113 |
|
|
100.0 |
|
|
100 |
|
|
88.5 |
|
|
Wholesale Markets |
|
|
35,802 |
|
|
5,584 |
|
|
15.6 |
|
|
2,009 |
|
|
36.0 |
|
|
Treasury and Trading |
|
|
2,220 |
|
|
— |
|
|
— |
|
|
— |
|
|
— |
|
|
Asset Finance |
|
|
7,162 |
|
|
1,217 |
|
|
17.0 |
|
|
746 |
|
|
61.3 |
|
|
Total Wholesale |
|
|
135,395 |
|
|
27,756 |
|
|
20.5 |
|
|
11,537 |
|
|
41.6 |
|
|
Reverse repos |
|
|
16,836 |
|
|
|
|
|
|
|
|
|
|
|
|
|
|
Impairment provisions |
|
|
(11,537 |
) |
|
|
|
|
|
|
|
|
|
|
|
|
|
Fair value adjustments |
|
|
(617 |
) |
|
|
|
|
|
|
|
|
|
|
|
|
|
Loans and advances to customers |
|
|
140,077 |
|
|
|
|
|
|
|
|
|
|
|
|
|
|
Loans and advances to banks |
|
|
8,443 |
|
|
|
|
|
|
|
|
|
|
|
|
|
|
Debt securities2 |
|
|
12,489 |
|
|
|
|
|
|
|
|
|
|
|
|
|
|
Available-for-sale financial assets3 |
|
|
12,554 |
|
|
|
|
|
|
|
|
|
|
|
|
|
|
|
|
|
1 |
Impairment provisions include collective unimpaired provisions. |
|
|
|
|
2 |
Of which Wholesale Markets is £12,135 million, Wholesale Equity £195 million, Treasury and Trading £150 million, Asset Finance £7 million, and Corporate £2 million. |
|
|
|
|
3 |
Of which Wholesale Markets is £7,798 million, Wholesale Equity £1,797 million, Treasury and Trading £2,922 million and Corporate £37 million. |
|
|
|
|
|
|
|
|
|
|
|
|
|
|
|
|
|
|
|
|
|
Loans and |
|
Impaired |
|
Impaired loans |
|
Impairment |
|
Impairment |
|
|||||
|
At 31 December 2010 |
|
|
|
|
|
|
|
|
|
|
|
|
|
|
|
|
|
Corporate |
|
|
80,670 |
|
|
6,635 |
|
|
8.2 |
|
|
3,629 |
|
|
54.7 |
|
|
Corporate Real Estate BSU |
|
|
26,151 |
|
|
17,518 |
|
|
67.0 |
|
|
8,092 |
|
|
46.2 |
|
|
Wholesale Equity |
|
|
140 |
|
|
108 |
|
|
77.1 |
|
|
107 |
|
|
99.1 |
|
|
Wholesale Markets |
|
|
40,042 |
|
|
5,718 |
|
|
14.3 |
|
|
1,992 |
|
|
34.8 |
|
|
Treasury and Trading |
|
|
1,050 |
|
|
— |
|
|
— |
|
|
— |
|
|
— |
|
|
Asset Finance |
|
|
9,949 |
|
|
1,679 |
|
|
16.9 |
|
|
1,043 |
|
|
62.1 |
|
|
Total Wholesale |
|
|
158,002 |
|
|
31,658 |
|
|
20.0 |
|
|
14,863 |
|
|
46.9 |
|
|
Reverse repos |
|
|
3,096 |
|
|
|
|
|
|
|
|
|
|
|
|
|
|
Impairment provisions |
|
|
(14,863 |
) |
|
|
|
|
|
|
|
|
|
|
|
|
|
Fair value adjustments |
|
|
(1,562 |
) |
|
|
|
|
|
|
|
|
|
|
|
|
|
Loans and advances to customers |
|
|
144,673 |
|
|
|
|
|
|
|
|
|
|
|
|
|
|
Loans and advances to banks |
|
|
12,401 |
|
|
|
|
|
|
|
|
|
|
|
|
|
|
Debt securities2 |
|
|
25,779 |
|
|
|
|
|
|
|
|
|
|
|
|
|
|
Available-for-sale financial assets3 |
|
|
29,458 |
|
|
|
|
|
|
|
|
|
|
|
|
|
|
|
|
|
1 |
Impairment provisions include collective unimpaired provisions. |
|
|
|
|
2 |
Of which Wholesale Markets is £25,120 million, Wholesale Equity £487 million, Treasury and Trading £163 million, Asset Finance £7 million, Corporate £2 million and Commercial £2 million. |
|
|
|
|
3 |
Of which Wholesale Markets is £21,279 million, Wholesale Equity £2,109 million, Treasury and Trading £6,011 million and Corporate £59 million. |
99
OPERATING AND FINANCIAL REVIEW AND PROSPECTS
CORPORATE
The £68,772 million of loans and advances to customers in the Corporate portfolio is structured across a number of different portfolios and sectors as detailed below:
UK Corporate – Major Corporate balance sheets remained relatively stable during the first half of 2011 with corporates continuing to reduce debt and build up liquidity reserves. Mergers and acquisition activity has been minimal and focus has been on refinancing existing facilities. In line with economic commentary, some consumer related sectors in the UK are now feeling the impact of a slowdown in spending. Commodity price volatility is a potential concern in terms of required funding and customer profitability.
Financial Institutions – Continuing concerns over sovereign fiscal deficits and public sector debt levels have necessitated increased scrutiny and risk reduction to the European banking sector, in particular banks domiciled in the weaker Eurozone countries. Trading exposures are in large part either short term and/or collateralised and inter bank lending activity is mainly very short term with strong investment grade counterparties.
Mid-Markets Corporate – Customers in this sector are predominantly UK-focused and mainly dependent on the performance of the domestic economy. Some clients’ trading has, unsurprisingly, proved challenging in a number of sectors in 2011, particularly those reliant on consumer discretionary expenditure. Retail, hotels, leisure and construction have all been vulnerable to the wider economic environment during the year, with the majority of impairments in the year arising in these sectors. The impact of public sector austerity measures has also been evident in some sectors, with these also contributing to the impairment charge in the year. The mid-markets segment of the UK Corporate market appears to have limited direct vulnerability to events in the weaker Eurozone countries, however the segment is more directly exposed to any flow-through effect on the UK economy resulting from weaker export demand.
US Corporate – The business continues to be predominately investment grade focused and the balance sheets of US Major Corporates remain relatively strong, with good levels of liquidity. The reduction in the element of the corporate portfolio that is not central to the Group’s strategy has continued through a combination of secondary sales, refinancings, and realisation of property assets. The year-end impairment position is one of modest net write backs with new impairments on existing cases more than offset by recoveries. Overall, portfolio asset quality remains strong.
Corporate Real Estate – Outside of London and the South East, activity in the Corporate Real Estate market remains weak, in part due to declining values and the focus on only prime properties and prime tenants. Rental growth, where achievable by clients in the regions, is slow. Market demand 2 for debt is low, especially for new facilities from customers within the Group’s risk appetite, despite messaging that the Group is open for business which meets its lending criteria. Customers are adopting a ‘wait and see’ approach, de-gearing where they can, and conserving cash. In addition, with a significant proportion of its assets supporting property investments, tenant default is an area of continuing vulnerability especially where the lending is underpinned by secondary or tertiary assets. With a continuing high level of loan maturities due over the next few years, refinancing risk remains a market-wide issue. However, the Group’s core portfolios are characterised by strong management teams with proven asset management skills and/or acceptable lease maturity profiles with borrowers meeting their interest cover and debt service obligations. New propositions are structured and priced in line with the Group’s prudent risk appetite.
|
|
|
Corporate Real Estate Business Support Unit |
|
|
Despite capital values improving 17.8 per cent from their trough in 2009, the Group has seen the improving trend in the real estate market in 2011 weaken for all but prime or central London based real estate.
The management of the portfolio has focussed on continuing to support its long-term customers and at the same time reduce the exposure to real estate through managed sales, which has resulted in a realisation of over £4.8 billion of cash receipts in 2011 despite the worsening transactional market. In addition there has been over £5 billion of restructurings undertaken with longer term facilities put in place to support the customer base.
Over the past two years, a total of over £8.5 billion of asset sales through managed disposals has occurred which has resulted in an overall £14.6 billion reduction of gross loan exposure in the UK. The Group has also concluded one of the largest loan portfolio sales in the market in December which provided a significant £923 million deleveraging of its real estate exposure.
During the year a number of new initiatives have been introduced including the sale of assets specifically grouped under receivership, which is the first time such a sale has been achieved; and an arrangement with a publicly quoted asset manager to facilitate certain residential portfolios through the receivers. Such arrangements demonstrate the Group’s desire to find solutions to ensure that it maximises the recovery from these loan positions or portfolios through managing for value the underlying real estate and it continues to seek innovative ways to achieve this aim.
|
|
|
Wholesale Equity |
|
|
100
OPERATING AND FINANCIAL REVIEW AND PROSPECTS
The overall size of the portfolio has shown a downward trend in the second half of 2011, in the main due to significant disposals of a number of assets from the Project Finance business. Continuing concerns around sovereign debt in the Eurozone and disappointing economic data from the major economies has resulted in ongoing volatility in equity markets.
|
|
|
Wholesale Markets |
|
|
Wholesale Markets is also responsible for the Treasury Assets portfolio which mainly encompasses a portfolio of Asset-Backed Securities and financial institution Floating Rate Note positions. Portfolio credit quality remained relatively stable over the year and the portfolio size continues to be actively reduced through asset sales and from bond maturities. Further details of Wholesale Division’s Asset-Backed Securities portfolio is provided in Note 56 to the financial statements.
|
|
|
Treasury and Trading |
|
|
The portfolio comprises £6.0 billion of loans and advances to banks, £2.9 billion of Available-for-Sale debt securities and £2.2 billion of loans and advances to customers (excluding reverse repos).
The majority of Treasury and Trading’s funding and risk management activity is transacted with investment grade counterparties including Sovereign central banks and much of it is on a secured basis, such as repos facing a Central Counterparty (“CCP”). Derivative transactions with wholesale counterparties are typically collateralised under a Credit Support Annex in conjunction with the ISDA Master Agreement. During the year Lloyds Banking Group became a member of LCH SwapClear as part of a move to reduce counterparty risk by clearing standardised derivative contracts through a CCP. Treasury and Trading has reduced the government bond portfolio in response to growing concern over market conditions in the Eurozone resulting in minimal exposure to weaker Eurozone sovereigns. The credit quality of the government bond portfolio is almost solely AAA/AA rated sovereign debt.
|
|
|
Asset Finance |
|
|
CREDIT RISK – COMMERCIAL
Overview
|
|
|
|
– |
Impairment losses for 2011 decreased significantly to £303 million, from £382 million for 2010. |
|
|
|
|
– |
The decrease reflects the continued application of the Group’s prudent credit risk appetite approach and the benefits of the low interest rate environment which has helped maintain defaults at a lower level. |
|
|
|
|
– |
Portfolio metrics including delinquencies and assets under close monitoring have generally remained steady or improved. |
|
|
|
|
– |
Due to the continuing uncertainty regarding the economic outlook, the Group remains cautious. Downward pressures on consumer spending from a weakening labour market, still-high household indebtedness and rising Government budgetary pressures continue to imply vulnerability for a number of sectors, most notably retail, motor traders and restaurants. |
|
|
|
|
– |
Commercial continues to operate rigorous processes to enhance control and monitoring activities which play a crucial role in identifying customers showing early signs of financial distress and bringing them into the Group’s support model. |
Commercial’s impairment charge decreased £79 million, or 21 per cent, compared to £382 million during 2010. This reflects the continued application of a prudent credit risk appetite for new business and a low interest rate environment helping to maintain defaults at a lower level. Impairment charges as an annualised percentage of average loans and advances to customers reduced to 1.06 per cent from 1.24 per cent in 2010. The majority of the business is based around full banking relationships. The relatively small portfolio of lending outside of the Group’s risk appetite has continued to reduce throughout 2011.
101
OPERATING AND FINANCIAL REVIEW AND PROSPECTS
|
|
|
Impaired loans and provisions |
|
|
|
|
|
|
|
|
|
|
|
|
|
|
|
|
|
|
|
|
|
Table 1.28: Impaired loans and provisions (audited) |
||||||||||||||||
|
|
|
Loans and |
|
Impaired |
|
Impaired loans |
|
Impairment |
1 |
Impairment |
|
|||||
|
At 31 December 2011 |
|
|
|
|
|
|
|
|
|
|
|
|
|
|
|
|
|
Commercial |
|
|
29,681 |
|
|
2,915 |
|
|
9.8 |
|
|
880 |
|
|
30.2 |
|
|
Impairment provisions |
|
|
(880 |
) |
|
|
|
|
|
|
|
|
|
|
|
|
|
Fair value adjustments |
|
|
(51 |
) |
|
|
|
|
|
|
|
|
|
|
|
|
|
Loans and advances to customers |
|
|
28,750 |
|
|
|
|
|
|
|
|
|
|
|
|
|
|
At 31 December 2010 |
|
|
|
|
|
|
|
|
|
|
|
|
|
|
|
|
|
Commercial2 |
|
|
29,649 |
|
|
2,856 |
|
|
9.6 |
|
|
992 |
|
|
34.7 |
|
|
Impairment provisions |
|
|
(992 |
) |
|
|
|
|
|
|
|
|
|
|
|
|
|
Fair value adjustments |
|
|
(103 |
) |
|
|
|
|
|
|
|
|
|
|
|
|
|
Loans and advances to customers |
|
|
28,554 |
|
|
|
|
|
|
|
|
|
|
|
|
|
|
|
|
|
1 |
Impairment provisions include collective unimpaired provisions. |
|
|
2010 figures have been restated for transfers from Corporate. |
CREDIT RISK – WEALTH AND INTERNATIONAL
Overview
|
|
|
|
– |
In Wealth and International, impairment charges totalled £4,610 million, a decrease of 23 per cent from £5,988 million in 2010. The reduction predominantly reflects lower impairment charges in the Group’s Irish portfolio where the rate of impaired loan migration has slowed. |
|
|
|
|
– |
Impairment coverage has increased in Ireland to 62 per cent from 54 per cent, primarily reflecting further falls in the commercial real estate market during 2011, and further vulnerability exists. |
|
|
|
|
– |
On the Irish Wholesale portfolio, 84 per cent of the portfolio is now impaired at a coverage ratio of 61 per cent. |
|
|
|
|
– |
On the Irish Retail portfolio, impairment provisions as a percentage of impaired loans has increased to 73 per cent against a backdrop of falling house prices and an increase in borrowers falling into arrears. |
|
|
|
|
– |
Further provisioning has been necessary in the Group’s Australasian portfolio primarily reflecting geographical real estate concentrations where market conditions and asset valuations have remained weak in 2011. |
|
|
|
|
– |
The Group has also significantly reduced its exposure in its Australasian business by Aus $2.1 billion including the successful disposal of a £1 billion portfolio of impaired Australasian real estate loans in the last quarter of 2011. The levels of disposals during the year represent 40 per cent of the gross impaired portfolio. |
|
|
|
|
– |
The majority of Wealth and International’s assets are not central to the Group’s strategy and in run-off. |
|
|
|
|
|
|
|
|
|
|
|
|
|
|
|
Table 1.29: Wealth and International impairment charge (audited) |
||||||||||||
|
|
|
2011 |
|
|
2010 |
|
|
Change |
|
|||
|
Wealth |
|
|
100 |
|
|
|
46 |
|
|
|
(117 |
) |
|
International: |
|
|
|
|
|
|
|
|
|
|
|
|
|
Ireland |
|
|
3,187 |
|
|
|
4,264 |
|
|
|
25 |
|
|
Australia |
|
|
1,034 |
|
|
|
1,362 |
|
|
|
24 |
|
|
Wholesale Europe |
|
|
204 |
|
|
|
210 |
|
|
|
3 |
|
|
Other International |
|
|
85 |
|
|
|
106 |
|
|
|
20 |
|
|
|
|
|
4,510 |
|
|
|
5,942 |
|
|
|
24 |
|
|
Total impairment charge |
|
|
4,610 |
|
|
|
5,988 |
|
|
|
23 |
|
Wealth and International’s impairment charge in 2011 almost entirely related to portfolios that are not central to the Group’s strategy. The impairment charge decreased by £1,378 million to £4,610 million compared with 2010. Impairment charges as an annualised percentage of average loans and advances to customers decreased to 7.37 per cent from 8.9 per cent in 2010.
102
OPERATING AND FINANCIAL REVIEW AND PROSPECTS
|
|
|
Impaired loans and provisions |
|
|
Impairment provisions as a percentage of impaired loans increased to 60.6 per cent from 52.5 per cent at 31 December 2010. The coverage ratio in the Group’s Irish Portfolio has increased further reflecting continuing weakness in real estate markets where further vulnerability exists.
|
|
|
|
|
|
|
|
|
|
|
|
|
|
|
|
|
|
|
|
|
|
|
Table 1.30: Impairments on Wealth and International loans and advances (audited) |
||||||||||||||||||||
|
|
|
Loans and |
|
|
Impaired |
|
|
Impaired loans |
|
|
Impairment |
|
|
Impairment |
|
|||||
|
At 31 December 2011 |
|
|
|
|
|
|
|
|
|
|
|
|
|
|
|
|
|
|
|
|
|
Wealth |
|
|
8,781 |
|
|
|
399 |
|
|
|
4.5 |
|
|
|
162 |
|
|
|
40.6 |
|
|
International: |
|
|
|
|
|
|
|
|
|
|
|
|
|
|
|
|
|
|
|
|
|
Ireland Retail |
|
|
7,036 |
|
|
|
1,415 |
|
|
|
20.1 |
|
|
|
1,034 |
|
|
|
73.1 |
|
|
Ireland Wholesale |
|
|
17,737 |
|
|
|
14,945 |
|
|
|
84.3 |
|
|
|
9,133 |
|
|
|
61.1 |
|
|
Australia |
|
|
9,745 |
|
|
|
2,780 |
|
|
|
28.5 |
|
|
|
1,609 |
|
|
|
57.9 |
|
|
Wholesale Europe |
|
|
6,356 |
|
|
|
978 |
|
|
|
15.4 |
|
|
|
475 |
|
|
|
48.6 |
|
|
Other |
|
|
6,739 |
|
|
|
259 |
|
|
|
3.8 |
|
|
|
170 |
|
|
|
65.6 |
|
|
|
|
|
47,613 |
|
|
|
20,377 |
|
|
|
42.8 |
|
|
|
12,421 |
|
|
|
61.0 |
|
|
Wealth and International |
|
|
56,394 |
|
|
|
20,776 |
|
|
|
36.8 |
|
|
|
12,583 |
|
|
|
60.6 |
|
|
Impairment provisions |
|
|
(12,583 |
) |
|
|
|
|
|
|
|
|
|
|
|
|
|
|
|
|
|
Fair value adjustments |
|
|
(42 |
) |
|
|
|
|
|
|
|
|
|
|
|
|
|
|
|
|
|
Total Wealth and International |
|
|
43,769 |
|
|
|
|
|
|
|
|
|
|
|
|
|
|
|
|
|
|
At 31 December 2010 |
|
|
|
|
|
|
|
|
|
|
|
|
|
|
|
|
|
|
|
|
|
Wealth |
|
|
9,472 |
|
|
|
353 |
|
|
|
3.7 |
|
|
|
116 |
|
|
|
32.9 |
|
|
International: |
|
|
|
|
|
|
|
|
|
|
|
|
|
|
|
|
|
|
|
|
|
Ireland Retail |
|
|
7,673 |
|
|
|
870 |
|
|
|
11.3 |
|
|
|
616 |
|
|
|
70.8 |
|
|
Ireland Wholesale |
|
|
19,755 |
|
|
|
13,575 |
|
|
|
68.7 |
|
|
|
7,147 |
|
|
|
52.6 |
|
|
Australia |
|
|
14,587 |
|
|
|
4,187 |
|
|
|
28.7 |
|
|
|
2,208 |
|
|
|
52.7 |
|
|
Wholesale Europe |
|
|
7,322 |
|
|
|
1,007 |
|
|
|
13.8 |
|
|
|
420 |
|
|
|
41.7 |
|
|
Other |
|
|
7,559 |
|
|
|
350 |
|
|
|
4.6 |
|
|
|
177 |
|
|
|
50.6 |
|
|
|
|
|
56,896 |
|
|
|
19,989 |
|
|
|
35.1 |
|
|
|
10,568 |
|
|
|
52.9 |
|
|
Wealth and International |
|
|
66,368 |
|
|
|
20,342 |
|
|
|
30.7 |
|
|
|
10,684 |
|
|
|
52.5 |
|
|
Impairment provisions |
|
|
(10,684 |
) |
|
|
|
|
|
|
|
|
|
|
|
|
|
|
|
|
|
Fair value adjustments |
|
|
(327 |
) |
|
|
|
|
|
|
|
|
|
|
|
|
|
|
|
|
|
Total Wealth and International |
|
|
55,357 |
|
|
|
|
|
|
|
|
|
|
|
|
|
|
|
|
|
|
|
|
|
1 |
Impairment provisions include collective unimpaired provisions. |
103
OPERATING AND FINANCIAL REVIEW AND PROSPECTS
|
|
|
Wealth |
|
|
|
|
|
Ireland |
|
|
Continuing weakness in the Irish real estate markets resulted in a further increase in impaired wholesale loans and coverage in 2011. The majority of Irish retail provisions relate to a residential mortgage portfolio where impairment charges have increased in relation to 2010 due to a continued decline in residential property prices and higher arrears levels, including customers on a forbearance arrangement.
|
|
|
|
|
|
|
|
|
|
|
|
|
|
|
|
|
|
|
|
|
|
Table 1.31: Impairments on Ireland loans and advances (audited) |
|||||||||||||||||||
|
|
|
2011 |
|
2010 |
|
||||||||||||||
|
|
|
Gross |
|
Impaired |
|
Provisions |
|
Gross |
|
Impaired |
|
Provisions |
|
||||||
|
Commercial Real Estate |
|
|
10,872 |
|
|
9,807 |
|
|
6,194 |
|
|
11,685 |
|
|
9,232 |
|
|
4,791 |
|
|
Corporate |
|
|
6,865 |
|
|
5,138 |
|
|
2,939 |
|
|
8,070 |
|
|
4,343 |
|
|
2,356 |
|
|
Retail |
|
|
7,036 |
|
|
1,415 |
|
|
1,034 |
|
|
7,673 |
|
|
870 |
|
|
616 |
|
|
Total |
|
|
24,773 |
|
|
16,360 |
|
|
10,167 |
|
|
27,428 |
|
|
14,445 |
|
|
7,763 |
|
The most significant contribution to impairment in Ireland is the Commercial Real Estate portfolio. Impairment provisions provide 63 per cent coverage on impaired commercial real estate loans. Mortgage lending at the year end comprised 99 per cent of the retail portfolio with impaired loans of £1.4 billion and impairment coverage of 70 per cent.
£2.6 billion of wholesale lending within the Commerical Real Estate and corporate portfolios relates to sterling loans secured on UK property.
Within the
Commercial Real Estate portfolio, over 90 per cent of the portfolio is now impaired.
The average impairment coverage ratio has increased in the year to 63 per cent
(52 per cent 31 December 2010) reflecting the continued deteriorating Irish
economic conditions and Irish commercial property market.
The Group has
successfully started to reduce its exposure to Ireland with disposals in excess
of €1 billion in the period broadly in line with current provisioning levels.
|
|
|
Australasia |
|
|
Impairment charges decreased by £328 million to £1,034 million compared to 2010. Impairment charges as an annualised percentage of average loans and advances to customers decreased to 8.2 per cent from 9.3 per cent in 2010.
Impairment on the Group’s Commercial Real Estate portfolio in Australasia was the main contributor to the full year charge. This portfolio is exposed to Australian non-metropolitan real estate markets where market conditions and asset valuations in 2011 have remained weak. The Group has significantly reduced its remaining exposure to these markets following the successful disposal of a £1 billion portfolio of loans during the last quarter of 2011 in the Group’s two most challenging markets (Gold Coast and New Zealand). A specific charge of £70 million was also incurred in the period as a result of losses arising from the earthquake in New Zealand.
|
|
|
Wholesale Europe |
|
|
|
|
|
Other International |
|
|
104
OPERATING AND FINANCIAL REVIEW AND PROSPECTS
EXPOSURES TO SELECTED EUROZONE COUNTRIES
The following section summarises the Group’s direct exposure to certain European countries which have been identified on the basis of a Standard & Poor’s rating of A or less, as at 31 December 2011. The exposures are shown at their balance sheet carrying values and are based on the country of domicile of the counterparty, unless otherwise indicated.
The Group manages its exposures to individual countries through authorised country limits which take into account economic, financial, political and social factors. In addition, the Group manages its direct risks to the selected countries by establishing and monitoring risk limits for individual banks, financial institutions and corporates. Indirect risk is taken into account, where it is determined that counterparties have material direct exposures to the selected countries.
The Group has established a Eurozone Instability Steering Group in order to monitor developments within the Eurozone on a daily basis, carry out stress testing through detailed scenario analysis and complete appropriate due diligence on the Group’s exposures.
The following tables summarise exposures to the selected Eurozone countries by type of counterparty:
|
|
|
|
|
|
|
|
|
|
|
|
|
|
|
|
|
|
|
|
|
|
Table 1.32: Eurozone exposure – by counterparty (unaudited) |
|||||||||||||||||||
|
|
|
Greece |
|
Ireland |
|
Italy |
|
Portugal |
|
Spain |
|
Total |
|
||||||
|
At 31 December 2011 |
|
|
|
|
|
|
|
|
|
|
|
|
|
|
|
|
|
|
|
|
Direct sovereign exposure |
|
|
— |
|
|
— |
|
|
16 |
|
|
— |
|
|
17 |
|
|
33 |
|
|
Central Bank balances |
|
|
— |
|
|
— |
|
|
— |
|
|
— |
|
|
35 |
|
|
35 |
|
|
Banks |
|
|
— |
|
|
207 |
|
|
433 |
|
|
142 |
|
|
1,692 |
|
|
2,474 |
|
|
Asset backed securities |
|
|
55 |
|
|
376 |
|
|
39 |
|
|
341 |
|
|
375 |
|
|
1,186 |
|
|
Other financial institutions |
|
|
— |
|
|
272 |
|
|
88 |
|
|
19 |
|
|
27 |
|
|
406 |
|
|
Other corporate |
|
|
431 |
|
|
8,894 |
|
|
81 |
|
|
298 |
|
|
2,935 |
|
|
12,639 |
|
|
Retail |
|
|
— |
|
|
6,027 |
|
|
— |
|
|
11 |
|
|
1,649 |
|
|
7,687 |
|
|
Insurance assets |
|
|
— |
|
|
68 |
|
|
47 |
|
|
— |
|
|
39 |
|
|
154 |
|
|
|
|
|
486 |
|
|
15,844 |
|
|
704 |
|
|
811 |
|
|
6,769 |
|
|
24,614 |
|
|
At 31 December 2010 |
|
|
|
|
|
|
|
|
|
|
|
|
|
|
|
|
|
|
|
|
Direct sovereign exposure |
|
|
— |
|
|
— |
|
|
31 |
|
|
— |
|
|
54 |
|
|
85 |
|
|
Central Bank balances |
|
|
— |
|
|
— |
|
|
— |
|
|
— |
|
|
44 |
|
|
44 |
|
|
Banks |
|
|
— |
|
|
1,818 |
|
|
596 |
|
|
362 |
|
|
2,437 |
|
|
5,213 |
|
|
Asset backed securities |
|
|
75 |
|
|
867 |
|
|
594 |
|
|
447 |
|
|
987 |
|
|
2,970 |
|
|
Other financial institutions |
|
|
— |
|
|
74 |
|
|
151 |
|
|
65 |
|
|
146 |
|
|
436 |
|
|
Other corporate |
|
|
473 |
|
|
11,632 |
|
|
228 |
|
|
267 |
|
|
2,769 |
|
|
15,369 |
|
|
Retail |
|
|
— |
|
|
7,202 |
|
|
— |
|
|
10 |
|
|
1,769 |
|
|
8,981 |
|
|
Insurance assets |
|
|
— |
|
|
107 |
|
|
294 |
|
|
— |
|
|
110 |
|
|
511 |
|
|
|
|
|
548 |
|
|
21,700 |
|
|
1,894 |
|
|
1,151 |
|
|
8,316 |
|
|
33,609 |
|
In addition to the above countries, the Group has total exposures with six other European countries which are rated A or below. No balance with one individual country exceeds £350 million. These balances primarily relate to corporate exposures.
105
OPERATING AND FINANCIAL REVIEW AND PROSPECTS
Direct sovereign exposures – The Group’s sovereign exposures are primarily to the UK and the Group continues to have minimal exposure, in aggregate, which could be considered to be direct recourse to the sovereign risk of the selected countries. Total exposures to the selected countries are £33 million (December 2010: £85 million) and are primarily in respect of loans and advances held at amortised cost, with no impairments recognised. Direct sovereign exposures include those to the Export Credit Agencies for Italy and Spain. Since 2009, the Group has proactively managed and reduced limits and exposures to these countries. Derivatives with sovereigns and sovereign referenced credit default swaps are insignificant.
In addition to direct sovereign exposures, the Group maintains deposit balances with a number of European Central banks for regulatory and liquidity management purposes. For the selected countries, the Group has a central bank balance with Spain of £35 million (2010: £44 million).
|
|
|
|
|
|
|
|
|
|
|
|
|
|
|
|
|
|
|
|
|
|
|
|
|
|
|
Table 1.33: Exposures to Banks (unaudited) |
||||||||||||||||||||||||
|
|
|
Greece |
|
|
Ireland |
|
|
Italy |
|
|
Portugal |
|
|
Spain |
|
|
Total |
|
||||||
|
At 31 December 2011 |
|
|
|
|
|
|
|
|
|
|
|
|
|
|
|
|
|
|
|
|
|
|
|
|
|
Amortised cost |
|
|
— |
|
|
|
46 |
|
|
|
41 |
|
|
|
17 |
|
|
|
33 |
|
|
|
137 |
|
|
Available for sale: |
|
|
|
|
|
|
|
|
|
|
|
|
|
|
|
|
|
|
|
|
|
|
|
|
|
Cost |
|
|
— |
|
|
|
193 |
|
|
|
194 |
|
|
|
198 |
|
|
|
1,848 |
|
|
|
2,433 |
|
|
AFS reserve |
|
|
— |
|
|
|
(57 |
) |
|
|
(14 |
) |
|
|
(74 |
) |
|
|
(300 |
) |
|
|
(445 |
) |
|
|
|
|
— |
|
|
|
136 |
|
|
|
180 |
|
|
|
124 |
|
|
|
1,548 |
|
|
|
1,988 |
|
|
Net trading assets |
|
|
— |
|
|
|
— |
|
|
|
188 |
|
|
|
— |
|
|
|
59 |
|
|
|
247 |
|
|
Derivatives – net CDS assets |
|
|
|
|
|
|
|
|
|
|
|
|
|
|
|
|
|
|
|
|
|
|
|
|
|
and liabilities |
|
|
— |
|
|
|
— |
|
|
|
— |
|
|
|
— |
|
|
|
— |
|
|
|
— |
|
|
Derivatives – other |
|
|
— |
|
|
|
25 |
|
|
|
24 |
|
|
|
1 |
|
|
|
52 |
|
|
|
102 |
|
|
Total exposure |
|
|
— |
|
|
|
207 |
|
|
|
433 |
|
|
|
142 |
|
|
|
1,692 |
|
|
|
2,474 |
|
|
At 31 December 2010 |
|
|
|
|
|
|
|
|
|
|
|
|
|
|
|
|
|
|
|
|
|
|
|
|
|
Amortised cost |
|
|
— |
|
|
|
42 |
|
|
|
59 |
|
|
|
62 |
|
|
|
52 |
|
|
|
215 |
|
|
Available for sale: |
|
|
|
|
|
|
|
|
|
|
|
|
|
|
|
|
|
|
|
|
|
|
|
|
|
Cost |
|
|
— |
|
|
|
923 |
|
|
|
512 |
|
|
|
362 |
|
|
|
2,586 |
|
|
|
4,383 |
|
|
AFS reserve |
|
|
— |
|
|
|
(82 |
) |
|
|
(9 |
) |
|
|
(62 |
) |
|
|
(265 |
) |
|
|
(418 |
) |
|
|
|
|
— |
|
|
|
841 |
|
|
|
503 |
|
|
|
300 |
|
|
|
2,321 |
|
|
|
3,965 |
|
|
Net trading assets |
|
|
— |
|
|
|
919 |
|
|
|
25 |
|
|
|
— |
|
|
|
38 |
|
|
|
982 |
|
|
Derivatives – net CDS assets |
|
|
|
|
|
|
|
|
|
|
|
|
|
|
|
|
|
|
|
|
|
|
|
|
|
and liabilities |
|
|
— |
|
|
|
— |
|
|
|
9 |
|
|
|
— |
|
|
|
— |
|
|
|
9 |
|
|
Derivatives – other |
|
|
— |
|
|
|
16 |
|
|
|
— |
|
|
|
— |
|
|
|
26 |
|
|
|
42 |
|
|
Total exposure |
|
|
— |
|
|
|
1,818 |
|
|
|
596 |
|
|
|
362 |
|
|
|
2,437 |
|
|
|
5,213 |
|
Included within exposures to banks and other financial institutions, and treated as available for sale assets, are Covered Bonds of £1.7 billion (2010: £2.0 billion). The covered bonds are ultimately secured on a pool of mortgage assets in the countries concerned and benefit from over-collaterisation, with an overall weighted maturity of approximately five years.
Remaining exposures to banks held at amortised cost are predominantly short-term and relate to general banking facilities, money market and repo facilities and fixed and floating rate notes. No impairments are held against these exposures. In addition there are unitilised and uncommitted money market lines and repo facilities of approximately £1.7 billion predominantly in respect of Spanish and Italian banks. Bank limits have been closely monitored with amounts and tenors reduced where appropriate.
Net trading assets relate to exposures within the credit trading market-making business. There has been a large reduction in trading assets in the year in line with the overall Group balance sheet.
Derivative balances are shown at fair value adjusted where master netting agreements exist and net of cash collateral of £155 million. There are credit default swap positions referenced to banking groups domiciled in Italy (net long of £1 million and net short of £4 million) and Spain (net short of £10 million).
106
OPERATING AND FINANCIAL REVIEW AND PROSPECTS
|
|
|
|
|
|
|
|
|
|
|
|
|
|
|
|
|
|
|
|
|
|
|
|
|
|
|||||||||||||||||||||
|
Table 1.34: Asset Backed Securities (unaudited) |
|||||||||||||||||||||||||||||||||||||||||||||
|
|
|
Greece |
|
|
Ireland |
|
|
Italy |
|
|
Portugal |
|
|
Spain |
|
|
Total |
|
|||||||||||||||||||||||||||
|
At 31 December 2011 |
|
|
|
|
|
|
|
|
|
|
|
|
|
|
|
|
|
|
|
|
|
|
|
|
|||||||||||||||||||||
|
Amortised cost |
|
|
32 |
|
|
|
221 |
|
|
|
26 |
|
|
|
208 |
|
|
|
211 |
|
|
|
698 |
|
|||||||||||||||||||||
|
Available for sale: |
|
|
|
|
|
|
|
|
|
|
|
|
|
|
|
|
|
|
|
|
|
|
|
|
|||||||||||||||||||||
|
Cost |
|
|
44 |
|
|
|
268 |
|
|
|
14 |
|
|
|
219 |
|
|
|
213 |
|
|
|
758 |
|
|||||||||||||||||||||
|
AFS reserve |
|
|
(21 |
) |
|
|
(113 |
) |
|
|
(1 |
) |
|
|
(86 |
) |
|
|
(49 |
) |
|
|
(270 |
) |
|||||||||||||||||||||
|
|
|
|
23 |
|
|
|
155 |
|
|
|
13 |
|
|
|
133 |
|
|
|
164 |
|
|
|
488 |
|
|||||||||||||||||||||
|
Total exposure |
|
|
55 |
|
|
|
376 |
|
|
|
39 |
|
|
|
341 |
|
|
|
375 |
|
|
|
1,186 |
|
|||||||||||||||||||||
|
At 31 December 2010 |
|
|
|
|
|
|
|
|
|
|
|
|
|
|
|
|
|
|
|
|
|
|
|
|
|||||||||||||||||||||
|
Amortised cost |
|
|
37 |
|
|
|
558 |
|
|
|
467 |
|
|
|
241 |
|
|
|
600 |
|
|
|
1,903 |
|
|||||||||||||||||||||
|
Available for sale: |
|
|
|
|
|
|
|
|
|
|
|
|
|
|
|
|
|
|
|
|
|
|
|
|
|||||||||||||||||||||
|
Cost |
|
|
51 |
|
|
|
417 |
|
|
|
149 |
|
|
|
261 |
|
|
|
471 |
|
|
|
1,349 |
|
|||||||||||||||||||||
|
AFS reserve |
|
|
(13 |
) |
|
|
(108 |
) |
|
|
(22 |
) |
|
|
(55 |
) |
|
|
(84 |
) |
|
|
(282 |
) |
|||||||||||||||||||||
|
|
|
|
38 |
|
|
|
309 |
|
|
|
127 |
|
|
|
206 |
|
|
|
387 |
|
|
|
1,067 |
|
|||||||||||||||||||||
|
Total exposure |
|
|
75 |
|
|
|
867 |
|
|
|
594 |
|
|
|
447 |
|
|
|
987 |
|
|
|
2,970 |
|
|||||||||||||||||||||
Country of exposure for asset backed securities are based on the location of the underlying assets.
Within the asset backed securities exposures, the underlying assets are primarily residential mortgages. No impairments are held against these exposures. Significant exposure reductions were achieved during 2011, primarily through asset sales.
|
|
|
|
|
|
|
|
|
|
|
|
|
|
|
|
|
|
|
|
|
|
|
|
|
|
|
Table 1.35: Other financial institutions (unaudited) |
||||||||||||||||||||||||
|
|
|
Greece |
|
|
Ireland |
|
|
Italy |
|
|
Portugal |
|
|
Spain |
|
|
Total |
|
||||||
|
At 31 December 2011 |
|
|
|
|
|
|
|
|
|
|
|
|
|
|
|
|
|
|
|
|
|
|
|
|
|
Amortised cost |
|
|
— |
|
|
|
255 |
|
|
|
18 |
|
|
|
— |
|
|
|
— |
|
|
|
273 |
|
|
Available for sale: |
|
|
|
|
|
|
|
|
|
|
|
|
|
|
|
|
|
|
|
|
|
|
|
|
|
Cost |
|
|
— |
|
|
|
— |
|
|
|
— |
|
|
|
— |
|
|
|
— |
|
|
|
— |
|
|
AFS reserve |
|
|
— |
|
|
|
— |
|
|
|
— |
|
|
|
— |
|
|
|
— |
|
|
|
— |
|
|
|
|
|
— |
|
|
|
— |
|
|
|
— |
|
|
|
— |
|
|
|
— |
|
|
|
— |
|
|
Net trading assets |
|
|
— |
|
|
|
5 |
|
|
|
34 |
|
|
|
8 |
|
|
|
27 |
|
|
|
74 |
|
|
Derivatives – other |
|
|
— |
|
|
|
12 |
|
|
|
36 |
|
|
|
11 |
|
|
|
— |
|
|
|
59 |
|
|
Total exposure |
|
|
— |
|
|
|
272 |
|
|
|
88 |
|
|
|
19 |
|
|
|
27 |
|
|
|
406 |
|
|
At 31 December 2010 |
|
|
|
|
|
|
|
|
|
|
|
|
|
|
|
|
|
|
|
|
|
|
|
|
|
Amortised cost |
|
|
— |
|
|
|
33 |
|
|
|
43 |
|
|
|
58 |
|
|
|
77 |
|
|
|
211 |
|
|
Available for sale: |
|
|
|
|
|
|
|
|
|
|
|
|
|
|
|
|
|
|
|
|
|
|
|
|
|
Cost |
|
|
— |
|
|
|
23 |
|
|
|
4 |
|
|
|
— |
|
|
|
— |
|
|
|
27 |
|
|
AFS reserve |
|
|
— |
|
|
|
— |
|
|
|
— |
|
|
|
— |
|
|
|
— |
|
|
|
— |
|
|
|
|
|
— |
|
|
|
23 |
|
|
|
4 |
|
|
|
— |
|
|
|
— |
|
|
|
27 |
|
|
Net trading assets |
|
|
— |
|
|
|
17 |
|
|
|
99 |
|
|
|
5 |
|
|
|
68 |
|
|
|
189 |
|
|
Derivatives – other |
|
|
— |
|
|
|
1 |
|
|
|
5 |
|
|
|
2 |
|
|
|
1 |
|
|
|
9 |
|
|
Total exposure |
|
|
— |
|
|
|
74 |
|
|
|
151 |
|
|
|
65 |
|
|
|
146 |
|
|
|
436 |
|
Exposures to other financial institutions primarily relate to balances held within insurance companies and funds. No impairments are held against these exposures.
107
OPERATING AND FINANCIAL REVIEW AND PROSPECTS
|
|
|
|
|
|
|
|
|
|
|
|
|
|
|
|
|
|
|
|
|
|
|
|
|
|
|
Table 1.36: Other Corporate Exposures (unaudited) |
||||||||||||||||||||||||
|
|
|
Greece |
|
|
Ireland |
|
|
Italy |
|
|
Portugal |
|
|
Spain |
|
|
Total |
|
||||||
|
At 31 December 2011 |
|
|
|
|
|
|
|
|
|
|
|
|
|
|
|
|
|
|
|
|
|
|
|
|
|
Amortised cost: |
|
|
|
|
|
|
|
|
|
|
|
|
|
|
|
|
|
|
|
|
|
|
|
|
|
Gross exposure |
|
|
407 |
|
|
|
15,910 |
|
|
|
69 |
|
|
|
125 |
|
|
|
2,192 |
|
|
|
18,703 |
|
|
Impairment allowances |
|
|
(43 |
) |
|
|
(7,961 |
) |
|
|
(1 |
) |
|
|
(25 |
) |
|
|
(149 |
) |
|
|
(8,179 |
) |
|
|
|
|
364 |
|
|
|
7,949 |
|
|
|
68 |
|
|
|
100 |
|
|
|
2,043 |
|
|
|
10,524 |
|
|
Net trading assets |
|
|
— |
|
|
|
— |
|
|
|
— |
|
|
|
— |
|
|
|
— |
|
|
|
— |
|
|
Derivatives – other |
|
|
19 |
|
|
|
31 |
|
|
|
— |
|
|
|
2 |
|
|
|
167 |
|
|
|
219 |
|
|
On balance sheet exposures |
|
|
383 |
|
|
|
7,980 |
|
|
|
68 |
|
|
|
102 |
|
|
|
2,210 |
|
|
|
10,743 |
|
|
Off balance sheet exposures |
|
|
48 |
|
|
|
914 |
|
|
|
13 |
|
|
|
196 |
|
|
|
725 |
|
|
|
1,896 |
|
|
Total exposure |
|
|
431 |
|
|
|
8,894 |
|
|
|
81 |
|
|
|
298 |
|
|
|
2,935 |
|
|
|
12,639 |
|
|
At 31 December 2010 |
|
|
|
|
|
|
|
|
|
|
|
|
|
|
|
|
|
|
|
|
|
|
|
|
|
Amortised cost: |
|
|
|
|
|
|
|
|
|
|
|
|
|
|
|
|
|
|
|
|
|
|
|
|
|
Gross exposure |
|
|
384 |
|
|
|
17,512 |
|
|
|
135 |
|
|
|
130 |
|
|
|
1,849 |
|
|
|
20,010 |
|
|
Impairment allowances |
|
|
(19 |
) |
|
|
(6,561 |
) |
|
|
(7 |
) |
|
|
(2 |
) |
|
|
(111 |
) |
|
|
(6,700 |
) |
|
|
|
|
365 |
|
|
|
10,951 |
|
|
|
128 |
|
|
|
128 |
|
|
|
1,738 |
|
|
|
13,310 |
|
|
Net trading assets |
|
|
— |
|
|
|
47 |
|
|
|
— |
|
|
|
— |
|
|
|
— |
|
|
|
47 |
|
|
Derivatives – other |
|
|
6 |
|
|
|
36 |
|
|
|
2 |
|
|
|
— |
|
|
|
38 |
|
|
|
82 |
|
|
On balance sheet exposures |
|
|
371 |
|
|
|
11,034 |
|
|
|
130 |
|
|
|
128 |
|
|
|
1,776 |
|
|
|
13,439 |
|
|
Off balance sheet exposures |
|
|
102 |
|
|
|
598 |
|
|
|
98 |
|
|
|
139 |
|
|
|
993 |
|
|
|
1,930 |
|
|
Total exposure |
|
|
473 |
|
|
|
11,632 |
|
|
|
228 |
|
|
|
267 |
|
|
|
2,769 |
|
|
|
15,369 |
|
Other Corporate balances within individual countries comprise:
Greece – The exposures in Greece principally relate to shipping loans to Greek shipping companies where the assets are generally secured and the vessels operate in international waters; repayment is mainly dependent on international trade and the industry is less sensitive to the Greek economy.
Ireland – see page 104 for further details on Irish exposures.
Italy and Portugal – exposures comprise lending to corporates, including a small amount of commercial real estate exposure.
Spain – The corporate exposure in Spain is mainly local lending (90 per cent of the total Spanish exposures) comprising corporate loans and project finance facilities (81 per cent) and commercial real estate portfolio (19 per cent).
108
OPERATING AND FINANCIAL REVIEW AND PROSPECTS
|
|
|
|
|
|
|
|
|
|
|
|
|
|
|
|
|
|
|
|
|
|
Table 1.37: Retail Exposures (unaudited) |
|
|
|
|
|
|
|
|
|
|
|
|
|
||||||
|
|
|
Greece |
|
Ireland |
|
Italy |
|
Portugal |
|
Spain |
|
Total |
|
||||||
|
At 31 December 2011 |
|
|
|
|
|
|
|
|
|
|
|
|
|
|
|
|
|
|
|
|
Amortised cost: |
|
|
|
|
|
|
|
|
|
|
|
|
|
|
|
|
|
|
|
|
Gross exposure |
|
|
— |
|
|
7,061 |
|
|
— |
|
|
11 |
|
|
1,685 |
|
|
8,757 |
|
|
Impairment allowances |
|
|
— |
|
|
(1,034 |
) |
|
— |
|
|
— |
|
|
(70 |
) |
|
(1,104 |
) |
|
On balance sheet exposures |
|
|
— |
|
|
6,027 |
|
|
— |
|
|
11 |
|
|
1,615 |
|
|
7,653 |
|
|
Off balance sheet exposures |
|
|
— |
|
|
— |
|
|
— |
|
|
— |
|
|
34 |
|
|
34 |
|
|
Total exposure |
|
|
— |
|
|
6,027 |
|
|
— |
|
|
11 |
|
|
1,649 |
|
|
7,687 |
|
|
At 31 December 2010 |
|
|
|
|
|
|
|
|
|
|
|
|
|
|
|
|
|
|
|
|
Amortised cost: |
|
|
|
|
|
|
|
|
|
|
|
|
|
|
|
|
|
|
|
|
Gross exposure |
|
|
— |
|
|
7,818 |
|
|
— |
|
|
10 |
|
|
1,712 |
|
|
9,540 |
|
|
Impairment allowances |
|
|
— |
|
|
(616 |
) |
|
— |
|
|
— |
|
|
(35 |
) |
|
(651 |
) |
|
On balance sheet exposures |
|
|
— |
|
|
7,202 |
|
|
— |
|
|
10 |
|
|
1,677 |
|
|
8,889 |
|
|
Off balance sheet exposures |
|
|
— |
|
|
— |
|
|
— |
|
|
— |
|
|
92 |
|
|
92 |
|
|
Total exposure |
|
|
— |
|
|
7,202 |
|
|
— |
|
|
10 |
|
|
1,769 |
|
|
8,981 |
|
Retail exposures within Spain are predominantly secured residential mortgages, where about half of the borrowers are expatriates. Impaired lending represents 6 per cent (December 2010: 6 per cent) of the portfolio, with a coverage ratio of 49 per cent (December 2010: 31 per cent). See page 104 for further details on Irish exposures.
|
|
|
|
|
|
|
|
|
|
|
|
|
|
|
|
|
|
|
|
|
|
Table 1.38: Insurance Assets (unaudited) |
|
|
|
|
|
|
|
|
|
|
|||||||||
|
|
|
Greece |
|
Ireland |
|
Italy |
|
Portugal |
|
Spain |
|
Total |
|
||||||
|
At 31 December 2011 |
|
|
— |
|
|
68 |
|
|
47 |
|
|
— |
|
|
39 |
|
|
154 |
|
|
At 31 December 2010 |
|
|
— |
|
|
107 |
|
|
294 |
|
|
— |
|
|
110 |
|
|
511 |
|
Assets held by the Insurance Business are held outside the with profits and unit linked funds. Approximately £127 million of these exposures relate to direct investments where the issuer is resident in Spain, Italy or Ireland and the credit rating is consistent with the tight credit criteria defined under the appropriate investment mandate. The remaining exposures relate to interests in two funds administered by SWIP (the Global Liquidity Fund and the Short Term Fund) where in line with the investment mandates, cash is invested in the money markets. For these funds, which are domiciled in Ireland, the exposure is analysed on a look through basis to the underlying assets held and the Insurance business’s pro rata share of these assets rather than treating all the holding in the fund as exposure to Ireland. Within the above exposures there are no sovereign exposures.
Table 1.39: Other European Exposures (unaudited)
The Group has the following exposures to sovereigns, banks, asset backed securities and other financial institutions in the following European countries:
|
|
|
|
|
|
|
|
|
|
|
|
|
|
|
|
|
|
|
|
|
|
|
|
|
|
|
Austria |
|
Belgium |
|
France |
|
Germany |
|
Luxembourg |
|
Netherlands |
|
Switzerland |
|
|||||||
|
At 31 December 2011 |
|
|
|
|
|
|
|
|
|
|
|
|
|
|
|
|
|
|
|
|
|
|
|
Direct sovereign exposure |
|
|
2 |
|
|
74 |
|
|
217 |
|
|
656 |
|
|
2 |
|
|
— |
|
|
— |
|
|
Central Bank balances |
|
|
— |
|
|
4 |
|
|
— |
|
|
203 |
|
|
3 |
|
|
9,594 |
|
|
125 |
|
|
Banks |
|
|
202 |
|
|
404 |
|
|
1,517 |
|
|
1,291 |
|
|
4 |
|
|
712 |
|
|
937 |
|
|
Asset backed securities |
|
|
— |
|
|
— |
|
|
525 |
|
|
703 |
|
|
— |
|
|
176 |
|
|
— |
|
|
Other financial institutions |
|
|
5 |
|
|
11 |
|
|
143 |
|
|
100 |
|
|
14 |
|
|
173 |
|
|
77 |
|
|
At 31 December 2010 |
|
|
|
|
|
|
|
|
|
|
|
|
|
|
|
|
|
|
|
|
|
|
|
Direct sovereign exposure |
|
|
— |
|
|
78 |
|
|
842 |
|
|
1,837 |
|
|
153 |
|
|
2 |
|
|
— |
|
|
Central Bank balances |
|
|
— |
|
|
3 |
|
|
4 |
|
|
70 |
|
|
4 |
|
|
10,846 |
|
|
297 |
|
|
Banks |
|
|
762 |
|
|
1,009 |
|
|
1,675 |
|
|
3,007 |
|
|
35 |
|
|
1,342 |
|
|
1,072 |
|
|
Asset backed securities |
|
|
–- |
|
|
75 |
|
|
806 |
|
|
1,678 |
|
|
7 |
|
|
1,319 |
|
|
— |
|
|
Other financial institutions |
|
|
289 |
|
|
21 |
|
|
308 |
|
|
313 |
|
|
34 |
|
|
788 |
|
|
74 |
|
Banks and Financial Institutions in the above countries may have exposures to other European countries that have Standard and Poor’s rating of A or lower.
109
OPERATING AND FINANCIAL REVIEW AND PROSPECTS
In the following tables, where lending and the related impairment allowances are analysed between domestic and international, the classification as domestic or international is based on the location of the office recording the transaction, except for certain lending of the international business booked in London including the Group’s lending in Ireland which, following the merger of Bank of Scotland (Ireland) Limited into Bank of Scotland plc, is now held on the balance sheet of Bank of Scotland plc in the UK but is reported as international.
ANALYSIS OF LOANS AND ADVANCES TO BANKS AND CUSTOMERS
The following table analyses loans and advances to banks and customers by category of loan at 31 December for each of the five years listed.
|
|
|
|
|
|
|
|
|
|
|
|
|
|
|
|
|
|
|
(unaudited) |
|
2011 |
|
2010 |
|
2009 |
|
2008 |
|
2007 |
|
|||||
|
Loans and advances to banks |
|
|
32,620 |
|
|
30,292 |
|
|
35,510 |
|
|
38,868 |
|
|
34,845 |
|
|
Loans and advances to customers: |
|
|
|
|
|
|
|
|
|
|
|
|
|
|
|
|
|
– Mortgages |
|
|
348,210 |
|
|
356,261 |
|
|
362,667 |
|
|
114,643 |
|
|
102,739 |
|
|
– Other personal lending |
|
|
30,014 |
|
|
36,967 |
|
|
42,958 |
|
|
25,318 |
|
|
22,988 |
|
|
– Agriculture, forestry and fishing |
|
|
5,198 |
|
|
5,558 |
|
|
5,130 |
|
|
3,969 |
|
|
3,226 |
|
|
– Energy and water supply |
|
|
4,013 |
|
|
3,576 |
|
|
3,031 |
|
|
2,598 |
|
|
2,102 |
|
|
– Manufacturing |
|
|
10,061 |
|
|
11,495 |
|
|
14,912 |
|
|
12,057 |
|
|
8,385 |
|
|
– Construction |
|
|
9,722 |
|
|
7,904 |
|
|
10,830 |
|
|
3,016 |
|
|
2,871 |
|
|
– Transport, distribution and hotels |
|
|
32,882 |
|
|
34,176 |
|
|
31,820 |
|
|
14,664 |
|
|
11,573 |
|
|
– Postal and telecommunications |
|
|
1,896 |
|
|
1,908 |
|
|
1,662 |
|
|
1,060 |
|
|
946 |
|
|
– Financial, business and other services |
|
|
64,046 |
|
|
59,363 |
|
|
66,923 |
|
|
33,319 |
|
|
29,707 |
|
|
– Property companies |
|
|
64,752 |
|
|
78,263 |
|
|
83,820 |
|
|
23,318 |
|
|
17,576 |
|
|
– Lease financing |
|
|
7,800 |
|
|
8,291 |
|
|
9,307 |
|
|
4,546 |
|
|
4,686 |
|
|
– Hire purchase |
|
|
5,776 |
|
|
7,208 |
|
|
8,710 |
|
|
5,295 |
|
|
5,423 |
|
|
Total loans |
|
|
616,990 |
|
|
641,262 |
|
|
677,280 |
|
|
282,671 |
|
|
247,067 |
|
|
Allowance for impairment losses |
|
|
(18,746 |
) |
|
(18,393 |
) |
|
(14,950 |
) |
|
(3,594 |
) |
|
(2,408 |
) |
|
Total loans and advances net of allowance for impairment losses |
|
|
598,244 |
|
|
622,869 |
|
|
662,330 |
|
|
279,077 |
|
|
244,659 |
|
The analysis of loans and advances as at 31 December 2011, 2010 and 2009 between domestic and international offices is as follows:
|
|
|
|
|
|
|
|
|
|
|
|
|
(unaudited) |
|
2011 |
|
2010 |
|
2009 |
|
|||
|
Domestic |
|
|
|
|
|
|
|
|
|
|
|
Loans and advances to banks |
|
|
31,852 |
|
|
28,544 |
|
|
29,475 |
|
|
Loans and advances to customers: |
|
|
|
|
|
|
|
|
|
|
|
– Mortgages |
|
|
331,715 |
|
|
334,531 |
|
|
344,151 |
|
|
– Other personal lending |
|
|
28,244 |
|
|
34,610 |
|
|
40,790 |
|
|
– Agriculture, forestry and fishing |
|
|
5,010 |
|
|
5,429 |
|
|
4,829 |
|
|
– Energy and water supply |
|
|
1,689 |
|
|
1,583 |
|
|
1,141 |
|
|
– Manufacturing |
|
|
8,055 |
|
|
9,599 |
|
|
11,480 |
|
|
– Construction |
|
|
7,885 |
|
|
6,814 |
|
|
6,554 |
|
|
– Transport, distribution and hotels |
|
|
27,232 |
|
|
26,156 |
|
|
22,713 |
|
|
– Postal and telecommunications |
|
|
1,491 |
|
|
1,391 |
|
|
973 |
|
|
– Financial, business and other services |
|
|
56,721 |
|
|
49,931 |
|
|
58,132 |
|
|
– Property companies |
|
|
49,561 |
|
|
59,163 |
|
|
64,069 |
|
|
– Lease financing |
|
|
6,792 |
|
|
7,351 |
|
|
8,426 |
|
|
– Hire purchase |
|
|
5,237 |
|
|
6,319 |
|
|
7,671 |
|
|
Total loans |
|
|
561,484 |
|
|
571,421 |
|
|
600,404 |
|
|
Allowance for impairment losses |
|
|
(8,025 |
) |
|
(9,786 |
) |
|
(9,995 |
) |
|
Total loans and advances net of allowance for impairment losses |
|
|
553,459 |
|
|
561,635 |
|
|
590,409 |
|
110
OPERATING AND FINANCIAL REVIEW AND PROSPECTS
|
|
|
|
|
|
|
|
|
|
|
|
||||||
|
(unaudited) |
|
2011 |
|
2010 |
|
2009 |
|
|||||||||
|
International |
|
|
|
|
|
|
|
|
|
|
||||||
|
Loans and advances to banks |
|
|
768 |
|
|
1,748 |
|
|
6,035 |
|
||||||
|
Loans and advances to customers: |
|
|
|
|
|
|
|
|
|
|
||||||
|
– Mortgages |
|
|
16,495 |
|
|
21,730 |
|
|
18,516 |
|
||||||
|
– Other personal lending |
|
|
1,770 |
|
|
2,357 |
|
|
2,168 |
|
||||||
|
– Agriculture, forestry and fishing |
|
|
188 |
|
|
129 |
|
|
301 |
|
||||||
|
– Energy and water supply |
|
|
2,324 |
|
|
1,993 |
|
|
1,890 |
|
||||||
|
– Manufacturing |
|
|
2,006 |
|
|
1,896 |
|
|
3,432 |
|
||||||
|
– Construction |
|
|
1,837 |
|
|
1,090 |
|
|
4,276 |
|
||||||
|
– Transport, distribution and hotels |
|
|
5,650 |
|
|
8,020 |
|
|
9,107 |
|
||||||
|
– Postal and telecommunications |
|
|
405 |
|
|
517 |
|
|
689 |
|
||||||
|
– Financial, business and other services |
|
|
7,325 |
|
|
9,432 |
|
|
8,791 |
|
||||||
|
– Property companies |
|
|
15,191 |
|
|
19,100 |
|
|
19,751 |
|
||||||
|
– Lease financing |
|
|
1,008 |
|
|
940 |
|
|
881 |
|
||||||
|
– Hire purchase |
|
|
539 |
|
|
889 |
|
|
1,039 |
|
||||||
|
Total loans |
|
|
55,506 |
|
|
69,841 |
|
|
76,876 |
|
||||||
|
Allowance for impairment losses |
|
|
(10,721 |
) |
|
(8,607 |
) |
|
(4,955 |
) |
||||||
|
Total loans and advances net of allowance for impairment losses |
|
|
44,785 |
|
|
61,234 |
|
|
71,921 |
|
||||||
|
|
|
|
|
|
|
|
|
|
|
|
||||||
|
|
|
|
2011 |
|
|
2010 |
|
|
2009 |
|
||||||
|
(unaudited) |
|
|
£m |
|
|
£m |
|
|
£m |
|
||||||
|
Total |
|
|
|
|
|
|
|
|
|
|
||||||
|
Loans and advances to banks |
|
|
32,620 |
|
|
30,292 |
|
|
35,510 |
|
||||||
|
Loans and advances to customers: |
|
|
|
|
|
|
|
|
|
|
||||||
|
– Mortgages |
|
|
348,210 |
|
|
356,261 |
|
|
362,667 |
|
||||||
|
– Other personal lending |
|
|
30,014 |
|
|
36,967 |
|
|
42,958 |
|
||||||
|
– Agriculture, forestry and fishing |
|
|
5,198 |
|
|
5,558 |
|
|
5,130 |
|
||||||
|
– Energy and water supply |
|
|
4,013 |
|
|
3,576 |
|
|
3,031 |
|
||||||
|
– Manufacturing |
|
|
10,061 |
|
|
11,495 |
|
|
14,912 |
|
||||||
|
– Construction |
|
|
9,722 |
|
|
7,904 |
|
|
10,830 |
|
||||||
|
– Transport, distribution and hotels |
|
|
32,882 |
|
|
34,176 |
|
|
31,820 |
|
||||||
|
– Postal and telecommunications |
|
|
1,896 |
|
|
1,908 |
|
|
1,662 |
|
||||||
|
– Financial, business and other services |
|
|
64,046 |
|
|
59,363 |
|
|
66,923 |
|
||||||
|
– Property companies |
|
|
64,752 |
|
|
78,263 |
|
|
83,820 |
|
||||||
|
– Lease financing |
|
|
7,800 |
|
|
8,291 |
|
|
9,307 |
|
||||||
|
– Hire purchase |
|
|
5,776 |
|
|
7,208 |
|
|
8,710 |
|
||||||
|
Total loans |
|
|
616,990 |
|
|
641,262 |
|
|
677,280 |
|
||||||
|
Allowance for impairment losses |
|
|
(18,746 |
) |
|
(18,393 |
) |
|
(14,950 |
) |
||||||
|
Total loans and advances net of allowance for impairment losses |
|
|
598,244 |
|
|
622,869 |
|
|
662,330 |
|
||||||
111
OPERATING AND FINANCIAL REVIEW AND PROSPECTS
SUMMARY OF LOAN LOSS EXPERIENCE
The following table analyses the movements in the allowance for impairment losses on loans and advances to banks and customers for each of the five years listed.
|
|
|
|
|
|
|
|
|
|
|
|
|
|
|
|
|
|
|
(unaudited) |
|
2011 |
|
2010 |
|
2009 |
|
2008 |
|
2007 |
|
|||||
|
Balance at beginning of year |
|
|
18,393 |
|
|
14,950 |
|
|
3,594 |
|
|
2,408 |
|
|
2,194 |
|
|
Exchange and other adjustments |
|
|
(369 |
) |
|
(7 |
) |
|
112 |
|
|
43 |
|
|
2 |
|
|
Advances written off: |
|
|
|
|
|
|
|
|
|
|
|
|
|
|
|
|
|
Loans and advances to customers: |
|
|
|
|
|
|
|
|
|
|
|
|
|
|
|
|
|
– Mortgages |
|
|
(86 |
) |
|
(145 |
) |
|
(77 |
) |
|
(23 |
) |
|
(25 |
) |
|
– Other personal lending |
|
|
(2,617 |
) |
|
(3,344 |
) |
|
(3,063 |
) |
|
(1,206 |
) |
|
(1,256 |
) |
|
– Agriculture, forestry and fishing |
|
|
(11 |
) |
|
(47 |
) |
|
(5 |
) |
|
(2 |
) |
|
(1 |
) |
|
– Energy and water supply |
|
|
(48 |
) |
|
(36 |
) |
|
(28 |
) |
|
(24 |
) |
|
(11 |
) |
|
– Manufacturing |
|
|
(137 |
) |
|
(385 |
) |
|
(148 |
) |
|
(34 |
) |
|
(13 |
) |
|
– Construction |
|
|
(92 |
) |
|
(365 |
) |
|
(336 |
) |
|
(11 |
) |
|
(4 |
) |
|
– Transport, distribution and hotels |
|
|
(329 |
) |
|
(742 |
) |
|
(80 |
) |
|
(50 |
) |
|
(24 |
) |
|
– Postal and telecommunications |
|
|
(1 |
) |
|
— |
|
|
(9 |
) |
|
— |
|
|
— |
|
|
– Financial, business and other services |
|
|
(1,120 |
) |
|
(881 |
) |
|
(308 |
) |
|
(169 |
) |
|
(95 |
) |
|
– Property companies |
|
|
(2,630 |
) |
|
(846 |
) |
|
(51 |
) |
|
(6 |
) |
|
— |
|
|
– Lease financing |
|
|
(224 |
) |
|
(15 |
) |
|
(26 |
) |
|
(2 |
) |
|
(26 |
) |
|
– Hire purchase |
|
|
(192 |
) |
|
(160 |
) |
|
(69 |
) |
|
(59 |
) |
|
(87 |
) |
|
Loans and advances to banks |
|
|
(6 |
) |
|
(111 |
) |
|
— |
|
|
— |
|
|
— |
|
|
Total advances written off |
|
|
(7,493 |
) |
|
(7,077 |
) |
|
(4,200 |
) |
|
(1,586 |
) |
|
(1,542 |
) |
|
Recoveries of advances written off: |
|
|
|
|
|
|
|
|
|
|
|
|
|
|
|
|
|
Loans and advances to customers: |
|
|
|
|
|
|
|
|
|
|
|
|
|
|
|
|
|
– Mortgages |
|
|
26 |
|
|
12 |
|
|
1 |
|
|
1 |
|
|
2 |
|
|
– Other personal lending |
|
|
326 |
|
|
176 |
|
|
107 |
|
|
102 |
|
|
121 |
|
|
– Energy and water supply |
|
|
— |
|
|
4 |
|
|
— |
|
|
— |
|
|
— |
|
|
– Manufacturing |
|
|
— |
|
|
2 |
|
|
— |
|
|
— |
|
|
1 |
|
|
– Construction |
|
|
— |
|
|
1 |
|
|
— |
|
|
— |
|
|
— |
|
|
– Transport, distribution and hotels |
|
|
1 |
|
|
4 |
|
|
— |
|
|
1 |
|
|
1 |
|
|
– Financial, business and other services |
|
|
— |
|
|
1 |
|
|
2 |
|
|
3 |
|
|
3 |
|
|
– Property companies |
|
|
— |
|
|
16 |
|
|
— |
|
|
— |
|
|
— |
|
|
– Hire purchase |
|
|
68 |
|
|
— |
|
|
— |
|
|
5 |
|
|
9 |
|
|
Total recoveries of advances written off |
|
|
421 |
|
|
216 |
|
|
110 |
|
|
112 |
|
|
137 |
|
|
Total net advances written off |
|
|
(7,072 |
) |
|
(6,861 |
) |
|
(4,090 |
) |
|
(1,474 |
) |
|
(1,405 |
) |
112
OPERATING AND FINANCIAL REVIEW AND PROSPECTS
|
|
|
|
|
|
|
|
|
|
|
|
|
|
|
|
|
|
|
(unaudited) |
|
2011 |
|
2010 |
|
2009 |
|
2008 |
|
2007 |
|
|||||
|
Effect of unwinding of discount recognised through interest income |
|
|
(226 |
) |
|
(403 |
) |
|
(446 |
) |
|
(102 |
) |
|
(104 |
) |
|
Allowances for impairment losses charged against income for the year: |
|
|
|
|
|
|
|
|
|
|
|
|
|
|
|
|
|
Loans and advances to customers: |
|
|
|
|
|
|
|
|
|
|
|
|
|
|
|
|
|
– Mortgages |
|
|
444 |
|
|
196 |
|
|
343 |
|
|
171 |
|
|
18 |
|
|
– Other personal lending |
|
|
1,669 |
|
|
3,431 |
|
|
4,314 |
|
|
1,455 |
|
|
1,313 |
|
|
– Agriculture, forestry and fishing |
|
|
27 |
|
|
20 |
|
|
29 |
|
|
2 |
|
|
4 |
|
|
– Energy and water supply |
|
|
105 |
|
|
17 |
|
|
105 |
|
|
35 |
|
|
18 |
|
|
– Manufacturing |
|
|
206 |
|
|
203 |
|
|
747 |
|
|
122 |
|
|
19 |
|
|
– Construction |
|
|
350 |
|
|
463 |
|
|
842 |
|
|
61 |
|
|
8 |
|
|
– Transport, distribution and hotels |
|
|
884 |
|
|
800 |
|
|
1,553 |
|
|
66 |
|
|
39 |
|
|
– Postal and telecommunications |
|
|
15 |
|
|
32 |
|
|
24 |
|
|
— |
|
|
— |
|
|
– Financial, business and other services |
|
|
1,464 |
|
|
1,293 |
|
|
1,913 |
|
|
491 |
|
|
151 |
|
|
– Property companies |
|
|
2,776 |
|
|
4,114 |
|
|
5,418 |
|
|
73 |
|
|
1 |
|
|
– Lease financing |
|
|
60 |
|
|
57 |
|
|
261 |
|
|
1 |
|
|
35 |
|
|
– Hire purchase |
|
|
20 |
|
|
101 |
|
|
234 |
|
|
107 |
|
|
116 |
|
|
Loans and advances to banks |
|
|
— |
|
|
(13 |
) |
|
(3 |
) |
|
135 |
|
|
(1 |
) |
|
Total allowances for impairment losses charged against income for the year |
|
|
8,020 |
|
|
10,714 |
|
|
15,780 |
|
|
2,719 |
|
|
1,721 |
|
|
Total balance at end of year |
|
|
18,746 |
|
|
18,393 |
|
|
14,950 |
|
|
3,594 |
|
|
2,408 |
|
|
Ratio of net write-offs during the year to average loans outstanding during the year |
|
|
1.2 |
% |
|
1.1 |
% |
|
0.6 |
% |
|
0.6 |
% |
|
0.7 |
% |
The Group’s impairment allowances in respect of loans and advances to banks and customers increased by £353 million, or 2 per cent, from £18,393 million at 31 December 2010 to £18,746 million at 31 December 2011. This increase resulted from a charge to the income statement of £8,020 million partly offset by net advances written off of £7,072 million (advances written off of £7,493 million less recoveries of £421 million). Of the total charge to the income statement of £8,020 million, £3,935 million arose in the UK and £4,085 million related to the Group’s international businesses, dominated by continuing credit losses suffered in Ireland and Australia following the particular deterioration in economic conditions in those countries in recent years; although in both cases there was some reduction in the level of charges compared to 2010. By category of lending, the most significant elements of the charge to the income statement were £2,776 million in respect of property companies and £1,669 million in respect of other personal lending. The largest element of the domestic charge was £1,670 million in respect of other personal lending which arose mainly in the Retail division and was lower than in 2010 following improved arrears experience as a result of the Group’s approach to credit risk, its focus on lending to existing customers, lower interest rates and lower overall balances. The charge in respect of property lending arose mainly overseas and again reflects losses in Ireland and Australia where much of the Group’s credit exposure is in the commercial property sectors. Of the net advances written off of £7,072 million, £5,358 million arose in the UK and £1,714 million overseas; by category of lending £2,291 million related to other personal lending, £1,120 million related to financial, business and other services and £2,630 million to property companies. The continuing high level of write-offs reflects the progress of the impaired lending against which the Group has made significant allowances in recent years.
113
OPERATING AND FINANCIAL REVIEW AND PROSPECTS
The analysis of movements in the allowance for impairment losses on loans and advances to banks and customers for the years ended 31 December 2011, 2010 and 2009 between domestic and international offices is as follows:
|
|
|
|
|
|
|
|
|
|
|
|
|
|
|
|
|
|
|
|
|
|
|
|
|
|
|
|
|
|
|
|
|
2011 |
|
2010 |
|
2009 |
|
|||||||||||||||||||||
|
|
|
|
|
|||||||||||||||||||||||||
|
(unaudited) |
|
Domestic |
|
Foreign |
|
Total |
|
Domestic |
|
Foreign |
|
Total |
|
Domestic |
|
Foreign |
|
Total |
|
|||||||||
|
Balance at beginning of year |
|
|
9,786 |
|
|
8,607 |
|
|
18,393 |
|
|
10,785 |
|
|
4,165 |
|
|
14,950 |
|
|
3,575 |
|
|
19 |
|
|
3,594 |
|
|
Exchange and other adjustments |
|
|
68 |
|
|
(437 |
) |
|
(369 |
) |
|
42 |
|
|
(49 |
) |
|
(7 |
) |
|
171 |
|
|
(59 |
) |
|
112 |
|
|
Advances written off: |
|
|
|
|
|
|
|
|
|
|
|
|
|
|
|
|
|
|
|
|
|
|
|
|
|
|
|
|
|
Loans and advances to customers: |
|
|
|
|
|
|
|
|
|
|
|
|
|
|
|
|
|
|
|
|
|
|
|
|
|
|
|
|
|
– Mortgages |
|
|
(56 |
) |
|
(30 |
) |
|
(86 |
) |
|
(130 |
) |
|
(15 |
) |
|
(145 |
) |
|
(77 |
) |
|
— |
|
|
(77 |
) |
|
– Other personal lending |
|
|
(2,605 |
) |
|
(12 |
) |
|
(2,617 |
) |
|
(3,322 |
) |
|
(22 |
) |
|
(3,344 |
) |
|
(3,062 |
) |
|
(1 |
) |
|
(3,063 |
) |
|
– Agriculture, forestry and fishing |
|
|
(8 |
) |
|
(3 |
) |
|
(11 |
) |
|
(8 |
) |
|
(39 |
) |
|
(47 |
) |
|
(5 |
) |
|
— |
|
|
(5 |
) |
|
– Energy and water supply |
|
|
(48 |
) |
|
— |
|
|
(48 |
) |
|
(16 |
) |
|
(20 |
) |
|
(36 |
) |
|
(28 |
) |
|
— |
|
|
(28 |
) |
|
– Manufacturing |
|
|
(105 |
) |
|
(32 |
) |
|
(137 |
) |
|
(196 |
) |
|
(189 |
) |
|
(385 |
) |
|
(147 |
) |
|
(1 |
) |
|
(148 |
) |
|
– Construction |
|
|
(38 |
) |
|
(54 |
) |
|
(92 |
) |
|
(192 |
) |
|
(173 |
) |
|
(365 |
) |
|
(336 |
) |
|
— |
|
|
(336 |
) |
|
– Transport, distribution and hotels |
|
|
(247 |
) |
|
(82 |
) |
|
(329 |
) |
|
(234 |
) |
|
(508 |
) |
|
(742 |
) |
|
(80 |
) |
|
— |
|
|
(80 |
) |
|
– Postal and telecommunications |
|
|
(1 |
) |
|
— |
|
|
(1 |
) |
|
— |
|
|
— |
|
|
— |
|
|
(9 |
) |
|
— |
|
|
(9 |
) |
|
– Financial, business and other services |
|
|
(894 |
) |
|
(226 |
) |
|
(1,120 |
) |
|
(827 |
) |
|
(54 |
) |
|
(881 |
) |
|
(308 |
) |
|
— |
|
|
(308 |
) |
|
– Property companies |
|
|
(1,594 |
) |
|
(1,036 |
) |
|
(2,630 |
) |
|
(740 |
) |
|
(106 |
) |
|
(846 |
) |
|
(51 |
) |
|
— |
|
|
(51 |
) |
|
– Lease financing |
|
|
(120 |
) |
|
(104 |
) |
|
(224 |
) |
|
(15 |
) |
|
— |
|
|
(15 |
) |
|
(25 |
) |
|
(1 |
) |
|
(26 |
) |
|
– Hire purchase |
|
|
(57 |
) |
|
(135 |
) |
|
(192 |
) |
|
(160 |
) |
|
— |
|
|
(160 |
) |
|
(69 |
) |
|
— |
|
|
(69 |
) |
|
Loans and advances to banks |
|
|
(6 |
) |
|
— |
|
|
(6 |
) |
|
(111 |
) |
|
— |
|
|
(111 |
) |
|
— |
|
|
— |
|
|
— |
|
|
Total advances written off |
|
|
(5,779 |
) |
|
(1,714 |
) |
|
(7,493 |
) |
|
(5,951 |
) |
|
(1,126 |
) |
|
(7,077 |
) |
|
(4,197 |
) |
|
(3 |
) |
|
(4,200 |
) |
|
Recoveries of advances written off: |
|
|
|
|
|
|
|
|
|
|
|
|
|
|
|
|
|
|
|
|
|
|
|
|
|
|
|
|
|
Loans and advances to customers: |
|
|
|
|
|
|
|
|
|
|
|
|
|
|
|
|
|
|
|
|
|
|
|
|
|
|
|
|
|
– Mortgages |
|
|
26 |
|
|
— |
|
|
26 |
|
|
12 |
|
|
— |
|
|
12 |
|
|
1 |
|
|
— |
|
|
1 |
|
|
– Other personal lending |
|
|
326 |
|
|
— |
|
|
326 |
|
|
176 |
|
|
— |
|
|
176 |
|
|
107 |
|
|
— |
|
|
107 |
|
|
– Agriculture, forestry and fishing |
|
|
— |
|
|
— |
|
|
— |
|
|
— |
|
|
— |
|
|
— |
|
|
— |
|
|
— |
|
|
— |
|
|
– Energy and water supply |
|
|
— |
|
|
— |
|
|
— |
|
|
— |
|
|
4 |
|
|
4 |
|
|
— |
|
|
— |
|
|
— |
|
|
– Manufacturing |
|
|
— |
|
|
— |
|
|
— |
|
|
— |
|
|
2 |
|
|
2 |
|
|
— |
|
|
— |
|
|
— |
|
|
– Construction |
|
|
— |
|
|
— |
|
|
— |
|
|
— |
|
|
1 |
|
|
1 |
|
|
— |
|
|
— |
|
|
— |
|
|
– Transport, distribution and hotels |
|
|
1 |
|
|
— |
|
|
1 |
|
|
— |
|
|
4 |
|
|
4 |
|
|
— |
|
|
— |
|
|
— |
|
|
– Postal and telecommunications |
|
|
— |
|
|
— |
|
|
— |
|
|
— |
|
|
— |
|
|
— |
|
|
— |
|
|
— |
|
|
— |
|
|
– Financial, business and other services |
|
|
— |
|
|
— |
|
|
— |
|
|
— |
|
|
1 |
|
|
1 |
|
|
1 |
|
|
1 |
|
|
2 |
|
|
– Property companies |
|
|
— |
|
|
— |
|
|
— |
|
|
12 |
|
|
4 |
|
|
16 |
|
|
— |
|
|
— |
|
|
— |
|
|
– Hire purchase |
|
|
68 |
|
|
— |
|
|
68 |
|
|
— |
|
|
— |
|
|
— |
|
|
— |
|
|
— |
|
|
— |
|
|
Total recoveries of advances written off |
|
|
421 |
|
|
— |
|
|
421 |
|
|
200 |
|
|
16 |
|
|
216 |
|
|
109 |
|
|
1 |
|
|
110 |
|
|
Total net advances written off |
|
|
(5,358 |
) |
|
(1,714 |
) |
|
(7,072 |
) |
|
(5,751 |
) |
|
(1,110 |
) |
|
(6,861 |
) |
|
(4,088 |
) |
|
(2 |
) |
|
(4,090 |
) |
114
OPERATING AND FINANCIAL REVIEW AND PROSPECTS
|
|
|
|
|
|
|
|
|
|
|
|
|
|
|
|
|
|
|
|
|
|
|
|
|
|
|
|
|
|
|
|
|
2011 |
|
2010 |
|
2009 |
|
|||||||||||||||||||||
|
|
|
|
|
|||||||||||||||||||||||||
|
(unaudited) |
|
Domestic |
|
Foreign |
|
Total |
|
Domestic |
|
Foreign |
|
Total |
|
Domestic |
|
Foreign |
|
Total |
|
|||||||||
|
Effect of unwinding of discount recognised through interest income |
|
|
(406 |
) |
|
180 |
|
|
(226 |
) |
|
(474 |
) |
|
71 |
|
|
(403 |
) |
|
(446 |
) |
|
— |
|
|
(446 |
) |
|
Allowances for impairment losses charged against income for the year: |
|
|
|
|
|
|
|
|
|
|
|
|
|
|
|
|
|
|
|
|
|
|
|
|
|
|
|
|
|
Loans and advances to customers: |
|
|
|
|
|
|
|
|
|
|
|
|
|
|
|
|
|
|
|
|
|
|
|
|
|
|
|
|
|
– Mortgages |
|
|
24 |
|
|
420 |
|
|
444 |
|
|
(27 |
) |
|
223 |
|
|
196 |
|
|
275 |
|
|
68 |
|
|
343 |
|
|
– Other personal lending |
|
|
1,670 |
|
|
(1 |
) |
|
1,669 |
|
|
2,690 |
|
|
741 |
|
|
3,431 |
|
|
3,714 |
|
|
600 |
|
|
4,314 |
|
|
– Agriculture, forestry and fishing |
|
|
19 |
|
|
8 |
|
|
27 |
|
|
5 |
|
|
15 |
|
|
20 |
|
|
2 |
|
|
27 |
|
|
29 |
|
|
– Energy and water supply |
|
|
130 |
|
|
(25 |
) |
|
105 |
|
|
30 |
|
|
(13 |
) |
|
17 |
|
|
24 |
|
|
81 |
|
|
105 |
|
|
– Manufacturing |
|
|
110 |
|
|
96 |
|
|
206 |
|
|
78 |
|
|
125 |
|
|
203 |
|
|
544 |
|
|
203 |
|
|
747 |
|
|
– Construction |
|
|
168 |
|
|
182 |
|
|
350 |
|
|
318 |
|
|
145 |
|
|
463 |
|
|
593 |
|
|
249 |
|
|
842 |
|
|
– Transport, distribution and hotels |
|
|
298 |
|
|
586 |
|
|
884 |
|
|
217 |
|
|
583 |
|
|
800 |
|
|
717 |
|
|
836 |
|
|
1,553 |
|
|
– Postal and telecommunications |
|
|
(8 |
) |
|
23 |
|
|
15 |
|
|
31 |
|
|
1 |
|
|
32 |
|
|
19 |
|
|
5 |
|
|
24 |
|
|
– Financial, business and other services |
|
|
1,188 |
|
|
276 |
|
|
1,464 |
|
|
696 |
|
|
597 |
|
|
1,293 |
|
|
1,670 |
|
|
243 |
|
|
1,913 |
|
|
– Property companies |
|
|
287 |
|
|
2,489 |
|
|
2,776 |
|
|
1,059 |
|
|
3,055 |
|
|
4,114 |
|
|
3,685 |
|
|
1,733 |
|
|
5,418 |
|
|
– Lease financing |
|
|
48 |
|
|
12 |
|
|
60 |
|
|
26 |
|
|
31 |
|
|
57 |
|
|
198 |
|
|
63 |
|
|
261 |
|
|
– Hire purchase |
|
|
1 |
|
|
19 |
|
|
20 |
|
|
74 |
|
|
27 |
|
|
101 |
|
|
135 |
|
|
99 |
|
|
234 |
|
|
Loans and advances to banks |
|
|
— |
|
|
— |
|
|
— |
|
|
(13 |
) |
|
— |
|
|
(13 |
) |
|
(3 |
) |
|
— |
|
|
(3 |
) |
|
Total allowances for impairment losses charged against income for the year |
|
|
3,935 |
|
|
4,085 |
|
|
8,020 |
|
|
5,184 |
|
|
5,530 |
|
|
10,714 |
|
|
11,573 |
|
|
4,207 |
|
|
15,780 |
|
|
Total balance at end of year |
|
|
8,025 |
|
|
10,721 |
|
|
18,746 |
|
|
9,786 |
|
|
8,607 |
|
|
18,393 |
|
|
10,785 |
|
|
4,165 |
|
|
14,950 |
|
The following table analyses the coverage of the allowance for loan losses by category of loans.
|
|
|
|
|
|
|
|
|
|
|
|
|
|
|
|
|
|
|
|
|
|
|
|
|
|
|
|
|
|
|
|
|
|
(unaudited) |
|
2011 |
|
2011 |
|
2010 |
|
2010 |
|
2009 |
|
2009 |
|
2008 |
|
2008 |
|
2007 |
|
2007 |
|
||||||||||
|
Balance at year end applicable to: |
|
|
|
|
|
|
|
|
|
|
|
|
|
|
|
|
|
|
|
|
|
|
|
|
|
|
|
|
|
|
|
|
Loans and advances to banks |
|
|
14 |
|
|
5.3 |
|
|
20 |
|
|
4.7 |
|
|
149 |
|
|
5.2 |
|
|
135 |
|
|
13.8 |
|
|
— |
|
|
14.1 |
|
|
Loans and advances to customers: |
|
|
|
|
|
|
|
|
|
|
|
|
|
|
|
|
|
|
|
|
|
|
|
|
|
|
|
|
|
|
|
|
– Mortgages |
|
|
948 |
|
|
56.4 |
|
|
526 |
|
|
55.5 |
|
|
464 |
|
|
53.6 |
|
|
186 |
|
|
40.5 |
|
|
37 |
|
|
41.5 |
|
|
– Other personal lending |
|
|
1,895 |
|
|
4.9 |
|
|
3,541 |
|
|
5.8 |
|
|
3,419 |
|
|
6.3 |
|
|
2,047 |
|
|
9.0 |
|
|
1,795 |
|
|
9.3 |
|
|
– Agriculture, forestry and fishing |
|
|
51 |
|
|
0.8 |
|
|
16 |
|
|
0.9 |
|
|
33 |
|
|
0.8 |
|
|
5 |
|
|
1.4 |
|
|
5 |
|
|
1.3 |
|
|
– Energy and water supply |
|
|
165 |
|
|
0.7 |
|
|
108 |
|
|
0.6 |
|
|
120 |
|
|
0.4 |
|
|
33 |
|
|
0.9 |
|
|
22 |
|
|
0.9 |
|
|
– Manufacturing |
|
|
475 |
|
|
1.6 |
|
|
540 |
|
|
1.8 |
|
|
709 |
|
|
2.2 |
|
|
119 |
|
|
4.3 |
|
|
29 |
|
|
3.4 |
|
|
– Construction |
|
|
898 |
|
|
1.6 |
|
|
588 |
|
|
1.2 |
|
|
527 |
|
|
1.6 |
|
|
60 |
|
|
1.1 |
|
|
10 |
|
|
1.2 |
|
|
– Transport, distribution and hotels |
|
|
2,117 |
|
|
5.3 |
|
|
1,400 |
|
|
5.3 |
|
|
1,391 |
|
|
4.7 |
|
|
75 |
|
|
5.2 |
|
|
58 |
|
|
4.7 |
|
|
– Postal and telecommunications |
|
|
62 |
|
|
0.3 |
|
|
50 |
|
|
0.3 |
|
|
15 |
|
|
0.2 |
|
|
— |
|
|
0.4 |
|
|
— |
|
|
0.4 |
|
|
– Financial, business and other services |
|
|
3,075 |
|
|
10.4 |
|
|
2,451 |
|
|
9.3 |
|
|
2,108 |
|
|
9.9 |
|
|
596 |
|
|
11.7 |
|
|
232 |
|
|
12.0 |
|
|
– Property companies |
|
|
8,710 |
|
|
10.5 |
|
|
8,546 |
|
|
12.2 |
|
|
5,394 |
|
|
12.4 |
|
|
70 |
|
|
8.2 |
|
|
4 |
|
|
7.1 |
|
|
– Lease financing |
|
|
92 |
|
|
1.3 |
|
|
287 |
|
|
1.3 |
|
|
244 |
|
|
1.4 |
|
|
15 |
|
|
1.6 |
|
|
16 |
|
|
1.9 |
|
|
– Hire purchase |
|
|
244 |
|
|
0.9 |
|
|
320 |
|
|
1.1 |
|
|
377 |
|
|
1.3 |
|
|
253 |
|
|
1.9 |
|
|
200 |
|
|
2.2 |
|
|
Total balance at year end |
|
|
18,746 |
|
|
100.0 |
|
|
18,393 |
|
|
100.0 |
|
|
14,950 |
|
|
100.0 |
|
|
3,594 |
|
|
100.0 |
|
|
2,408 |
|
|
100.0 |
|
115
OPERATING AND FINANCIAL REVIEW AND PROSPECTS
The analysis of the coverage of the allowance for loan losses at 31 December 2011, 2010 and 2009 between domestic and international offices is as follows:
|
|
|
|
|
|
|
|
|
|
|
|
|
|
|
|
|
|
|
|
|
|
|
|
Domestic |
|
Foreign |
|
Total |
|
||||||||||||
|
|
|
|
|
|
|||||||||||||||
|
(unaudited) |
|
Allowance |
|
Percentage of |
|
Allowance |
|
Percentage of |
|
Allowance |
|
Percentage of |
|
||||||
|
Balance at year end applicable to: |
|
|
|
|
|
|
|
|
|
|
|
|
|
|
|
|
|
|
|
|
Loans and advances to banks |
|
|
14 |
|
|
5.7 |
|
|
— |
|
|
1.4 |
|
|
14 |
|
|
5.3 |
|
|
Loans and advances to customers: |
|
|
|
|
|
|
|
|
|
|
|
|
|
|
|
|
|
|
|
|
– Mortgages |
|
|
123 |
|
|
59.1 |
|
|
825 |
|
|
29.7 |
|
|
948 |
|
|
56.4 |
|
|
– Other personal lending |
|
|
1,555 |
|
|
5.0 |
|
|
340 |
|
|
3.2 |
|
|
1,895 |
|
|
4.9 |
|
|
– Agriculture, forestry and fishing |
|
|
39 |
|
|
0.9 |
|
|
12 |
|
|
0.3 |
|
|
51 |
|
|
0.8 |
|
|
– Energy and water supply |
|
|
137 |
|
|
0.3 |
|
|
28 |
|
|
4.2 |
|
|
165 |
|
|
0.7 |
|
|
– Manufacturing |
|
|
318 |
|
|
1.4 |
|
|
157 |
|
|
3.6 |
|
|
475 |
|
|
1.6 |
|
|
– Construction |
|
|
531 |
|
|
1.4 |
|
|
367 |
|
|
3.3 |
|
|
898 |
|
|
1.6 |
|
|
– Transport, distribution and hotels |
|
|
668 |
|
|
4.9 |
|
|
1,449 |
|
|
10.2 |
|
|
2,117 |
|
|
5.3 |
|
|
– Postal and telecommunications |
|
|
35 |
|
|
0.3 |
|
|
27 |
|
|
0.7 |
|
|
62 |
|
|
0.3 |
|
|
– Financial, business and other services |
|
|
2,172 |
|
|
10.1 |
|
|
903 |
|
|
13.2 |
|
|
3,075 |
|
|
10.4 |
|
|
– Property companies |
|
|
2,153 |
|
|
8.8 |
|
|
6,557 |
|
|
27.4 |
|
|
8,710 |
|
|
10.5 |
|
|
– Lease financing |
|
|
63 |
|
|
1.2 |
|
|
29 |
|
|
1.8 |
|
|
92 |
|
|
1.3 |
|
|
– Hire purchase |
|
|
217 |
|
|
0.9 |
|
|
27 |
|
|
1.0 |
|
|
244 |
|
|
0.9 |
|
|
Total |
|
|
8,025 |
|
|
100.0 |
|
|
10,721 |
|
|
100.0 |
|
|
18,746 |
|
|
100.0 |
|
|
|
|
|
|
|
|
|
|
|
|
|
|
|
|
|
|
|
|
|
|
|
|
|
Domestic |
|
Foreign |
|
Total |
|
||||||||||||
|
|
|
|
|
|
|||||||||||||||
|
(unaudited) |
|
Allowance |
|
Percentage of |
|
Allowance |
|
Percentage of |
|
Allowance |
|
Percentage of |
|
||||||
|
Balance at year end applicable to: |
|
|
|
|
|
|
|
|
|
|
|
|
|
|
|
|
|
|
|
|
Loans and advances to banks |
|
|
20 |
|
|
5.0 |
|
|
— |
|
|
2.5 |
|
|
20 |
|
|
4.7 |
|
|
Loans and advances to customers: |
|
|
|
|
|
|
|
|
|
|
|
|
|
|
|
|
|
|
|
|
– Mortgages |
|
|
269 |
|
|
58.4 |
|
|
257 |
|
|
31.1 |
|
|
526 |
|
|
55.5 |
|
|
– Other personal lending |
|
|
2,212 |
|
|
6.1 |
|
|
1,329 |
|
|
3.4 |
|
|
3,541 |
|
|
5.8 |
|
|
– Agriculture, forestry and fishing |
|
|
16 |
|
|
1.0 |
|
|
— |
|
|
0.2 |
|
|
16 |
|
|
0.9 |
|
|
– Energy and water supply |
|
|
55 |
|
|
0.3 |
|
|
53 |
|
|
2.9 |
|
|
108 |
|
|
0.6 |
|
|
– Manufacturing |
|
|
385 |
|
|
1.7 |
|
|
155 |
|
|
2.7 |
|
|
540 |
|
|
1.8 |
|
|
– Construction |
|
|
364 |
|
|
1.2 |
|
|
224 |
|
|
1.6 |
|
|
588 |
|
|
1.2 |
|
|
– Transport, distribution and hotels |
|
|
546 |
|
|
4.6 |
|
|
854 |
|
|
11.5 |
|
|
1,400 |
|
|
5.3 |
|
|
– Postal and telecommunications |
|
|
50 |
|
|
0.2 |
|
|
— |
|
|
0.7 |
|
|
50 |
|
|
0.3 |
|
|
– Financial, business and other services |
|
|
1,630 |
|
|
8.7 |
|
|
821 |
|
|
13.5 |
|
|
2,451 |
|
|
9.3 |
|
|
– Property companies |
|
|
3,844 |
|
|
10.4 |
|
|
4,702 |
|
|
27.3 |
|
|
8,546 |
|
|
12.2 |
|
|
– Lease financing |
|
|
189 |
|
|
1.3 |
|
|
98 |
|
|
1.3 |
|
|
287 |
|
|
1.3 |
|
|
– Hire purchase |
|
|
206 |
|
|
1.1 |
|
|
114 |
|
|
1.3 |
|
|
320 |
|
|
1.1 |
|
|
Total |
|
|
9,786 |
|
|
100.0 |
|
|
8,607 |
|
|
100.0 |
|
|
18,393 |
|
|
100.0 |
|
116
OPERATING AND FINANCIAL REVIEW AND PROSPECTS
|
|
|
|
|
|
|
|
|
|
|
|
|
|
|
|
|
|
|
|
|
|
|
|
Domestic |
|
Foreign |
|
Total |
|
||||||||||||
|
|
|
|
|
|
|||||||||||||||
|
(unaudited) |
|
Allowance |
|
Percentage of |
|
Allowance |
|
Percentage of |
|
Allowance |
|
Percentage of |
|
||||||
|
Balance at year end applicable to: |
|
|
|
|
|
|
|
|
|
|
|
|
|
|
|
|
|
|
|
|
Loans and advances to banks |
|
|
149 |
|
|
4.9 |
|
|
— |
|
|
7.9 |
|
|
149 |
|
|
5.2 |
|
|
Loans and advances to customers: |
|
|
|
|
|
|
|
|
|
|
|
|
|
|
|
|
|
|
|
|
– Mortgages |
|
|
398 |
|
|
57.2 |
|
|
66 |
|
|
24.0 |
|
|
464 |
|
|
53.6 |
|
|
– Other personal lending |
|
|
2,822 |
|
|
6.8 |
|
|
597 |
|
|
2.8 |
|
|
3,419 |
|
|
6.3 |
|
|
– Agriculture, forestry and fishing |
|
|
6 |
|
|
0.8 |
|
|
27 |
|
|
0.4 |
|
|
33 |
|
|
0.8 |
|
|
– Energy and water supply |
|
|
42 |
|
|
0.2 |
|
|
78 |
|
|
2.5 |
|
|
120 |
|
|
0.4 |
|
|
– Manufacturing |
|
|
504 |
|
|
1.9 |
|
|
205 |
|
|
4.5 |
|
|
709 |
|
|
2.2 |
|
|
– Construction |
|
|
277 |
|
|
1.1 |
|
|
250 |
|
|
5.6 |
|
|
527 |
|
|
1.6 |
|
|
– Transport, distribution and hotels |
|
|
606 |
|
|
3.8 |
|
|
785 |
|
|
11.8 |
|
|
1,391 |
|
|
4.7 |
|
|
– Postal and telecommunications |
|
|
10 |
|
|
0.2 |
|
|
5 |
|
|
0.9 |
|
|
15 |
|
|
0.2 |
|
|
– Financial, business and other services |
|
|
1,842 |
|
|
9.7 |
|
|
266 |
|
|
11.4 |
|
|
2,108 |
|
|
9.9 |
|
|
– Property companies |
|
|
3,666 |
|
|
10.7 |
|
|
1,728 |
|
|
25.7 |
|
|
5,394 |
|
|
12.4 |
|
|
– Lease financing |
|
|
182 |
|
|
1.4 |
|
|
62 |
|
|
1.1 |
|
|
244 |
|
|
1.4 |
|
|
– Hire purchase |
|
|
281 |
|
|
1.3 |
|
|
96 |
|
|
1.4 |
|
|
377 |
|
|
1.3 |
|
|
Total |
|
|
10,785 |
|
|
100.0 |
|
|
4,165 |
|
|
100.0 |
|
|
14,950 |
|
|
100.0 |
|
117
OPERATING AND FINANCIAL REVIEW AND PROSPECTS
RISK ELEMENTS IN THE LOAN PORTFOLIO
The Group’s credit risk elements analysed by categories reflecting US lending and accounting practices, which differ from those employed in the UK, are detailed below:
NON-PERFORMING LENDING
In the US, it is the normal practice to stop accruing interest when payments are 90 days or more past due or when recovery of both principal and interest is doubtful. When the loans are transferred to non-accrual status, accrued interest is reversed from income and no further interest is recognised until it becomes probable that the principal will be repaid in full. Loans on which interest has been accrued but suspended would be included in risk elements as loans accounted for on a non-accrual basis.
In the US non-performing loans and advances are typically written off more quickly than in the UK. Consequently a UK bank may appear to have a higher level of non-performing loans and advances than a comparable US bank although the reported income may be similar in both the US and the UK.
The Group complies with IFRS 7, which requires more detailed qualitative and quantitative disclosures about its loan portfolios. Accordingly, the table below shows separately those loans that are (i) neither past due nor impaired, (ii) past due but not impaired, (iii) impaired, not requiring a provision and (iv) impaired with a provision.
|
|
|
|
|
|
|
|
|
|
|
|
|
|
|
|
|
|
|
|
|
|
|
|
|
|
|
|
|
Loans and |
|
|||||||||||||
|
|
|
|
|
|
|
|
||||||||||||||
|
|
|
|
|
|
|
|
||||||||||||||
|
|
|
Loans and |
|
Loans and advances to customers |
|
|
||||||||||||||
|
|
|
|
|
|
||||||||||||||||
|
(audited) |
|
|
Retail – |
|
Retail – |
|
Wholesale |
|
Total |
|
|
|||||||||
|
31 December 2011 |
|
|
|
|
|
|
|
|
|
|
|
|
|
|
|
|
|
|
|
|
|
Neither past due nor impaired |
|
|
32,494 |
|
|
330,727 |
|
|
41,448 |
|
|
146,655 |
|
|
518,830 |
|
|
11,121 |
|
|
|
Past due but not impaired |
|
|
15 |
|
|
12,742 |
|
|
1,093 |
|
|
2,509 |
|
|
16,344 |
|
|
— |
|
|
|
Impaired |
– no provision required |
|
|
6 |
|
|
1,364 |
|
|
1,604 |
|
|
3,544 |
|
|
6,512 |
|
|
— |
|
|
|
– provision held |
|
|
105 |
|
|
6,701 |
|
|
2,940 |
|
|
44,116 |
|
|
53,757 |
|
|
— |
|
|
Gross |
|
|
32,620 |
|
|
351,534 |
|
|
47,085 |
|
|
196,824 |
|
|
595,443 |
|
|
11,121 |
|
|
|
31 December 2010 |
|
|
|
|
|
|
|
|
|
|
|
|
|
|
|
|
|
|
|
|
|
Neither past due nor impaired |
|
|
30,259 |
|
|
339,509 |
|
|
45,058 |
|
|
159,274 |
|
|
543,841 |
|
|
12,545 |
|
|
|
Past due but not impaired |
|
|
— |
|
|
13,215 |
|
|
1,289 |
|
|
3,427 |
|
|
17,931 |
|
|
— |
|
|
|
Impaired |
– no provision required |
|
|
— |
|
|
2,189 |
|
|
433 |
|
|
5,313 |
|
|
7,935 |
|
|
— |
|
|
|
– provision held |
|
|
20 |
|
|
5,591 |
|
|
5,149 |
|
|
45,931 |
|
|
56,671 |
|
|
— |
|
|
Gross |
|
|
30,279 |
|
|
360,504 |
|
|
51,929 |
|
|
213,945 |
|
|
626,378 |
|
|
12,545 |
|
|
|
31 December 2009 |
|
|
|
|
|
|
|
|
|
|
|
|
|
|
|
|
|
|
|
|
|
Neither past due nor impaired |
|
|
35,333 |
|
|
347,292 |
|
|
48,429 |
|
|
185,872 |
|
|
581,593 |
|
|
19,082 |
|
|
|
Past due but not impaired |
|
|
— |
|
|
12,587 |
|
|
1,873 |
|
|
5,118 |
|
|
19,578 |
|
|
— |
|
|
|
Impaired |
– no provision required |
|
|
— |
|
|
2,034 |
|
|
449 |
|
|
6,603 |
|
|
9,086 |
|
|
— |
|
|
|
– provision held |
|
|
153 |
|
|
5,918 |
|
|
5,902 |
|
|
37,927 |
|
|
49,747 |
|
|
— |
|
|
Gross |
|
|
35,486 |
|
|
367,831 |
|
|
56,653 |
|
|
235,520 |
|
|
660,004 |
|
|
19,082 |
|
|
|
31 December 2008 |
|
|
|
|
|
|
|
|
|
|
|
|
|
|
|
|
|
|
|
|
|
Neither past due nor impaired |
|
|
38,716 |
|
|
110,148 |
|
|
33,571 |
|
|
86,707 |
|
|
230,426 |
|
|
608 |
|
|
|
Past due but not impaired |
|
|
17 |
|
|
3,134 |
|
|
1,146 |
|
|
555 |
|
|
4,835 |
|
|
— |
|
|
|
Impaired |
– no provision required |
|
|
— |
|
|
479 |
|
|
150 |
|
|
1,253 |
|
|
1,882 |
|
|
— |
|
|
|
– provision held |
|
|
135 |
|
|
882 |
|
|
4,327 |
|
|
1,451 |
|
|
6,660 |
|
|
— |
|
|
Gross |
|
|
38,868 |
|
|
114,643 |
|
|
39,194 |
|
|
89,966 |
|
|
243,803 |
|
|
608 |
|
|
|
31 December 2007 |
|
|
|
|
|
|
|
|
|
|
|
|
|
|
|
|
|
|
|
|
|
Neither past due nor impaired |
|
|
34,845 |
|
|
99,828 |
|
|
29,850 |
|
|
73,475 |
|
|
203,153 |
|
|
1,189 |
|
|
|
Past due but not impaired |
|
|
— |
|
|
2,153 |
|
|
966 |
|
|
639 |
|
|
3,758 |
|
|
— |
|
|
|
Impaired |
– no provision required |
|
|
— |
|
|
415 |
|
|
100 |
|
|
293 |
|
|
808 |
|
|
— |
|
|
|
– provision held |
|
|
— |
|
|
343 |
|
|
3,600 |
|
|
560 |
|
|
4,503 |
|
|
— |
|
|
Gross |
|
|
34,845 |
|
|
102,739 |
|
|
34,516 |
|
|
74,967 |
|
|
212,222 |
|
|
1,189 |
|
|
The analysis of lending between retail and wholesale has been prepared based upon the type of exposure and not the business segment in which the exposure is recorded. Included within retail are exposures to personal customers and small businesses, whilst included within wholesale are exposures to corporate customers and other large institutions.
118
OPERATING AND FINANCIAL REVIEW AND PROSPECTS
The loans that are past due but not impaired are further analysed in the table below according to the number of days that have elapsed since the last payment was due from the borrower.
|
|
|
|
|
|
|
|
|
|
|
|
|
|
|
|
|
|
|
|
|
|
|
|
|
|
|
|
Loans and |
|
||||||||||||
|
|
|
|
|
|
|
|
|||||||||||||
|
|
|
|
|
|
|
|
|||||||||||||
|
|
|
Loans and |
|
Loans and advances to customers |
|
|
|||||||||||||
|
|
|
|
|
|
|||||||||||||||
|
(audited) |
|
|
Retail – |
|
Retail – |
|
Wholesale |
|
Total |
|
|
||||||||
|
31 December 2011 |
|
|
|
|
|
|
|
|
|
|
|
|
|
|
|
|
|
|
|
|
0-30 days |
|
|
1 |
|
|
5,989 |
|
|
868 |
|
|
1,163 |
|
|
8,020 |
|
|
— |
|
|
30-60 days |
|
|
9 |
|
|
2,618 |
|
|
195 |
|
|
481 |
|
|
3,294 |
|
|
— |
|
|
60-90 days |
|
|
4 |
|
|
1,833 |
|
|
25 |
|
|
260 |
|
|
2,118 |
|
|
— |
|
|
90-180 days |
|
|
— |
|
|
2,302 |
|
|
4 |
|
|
159 |
|
|
2,465 |
|
|
— |
|
|
Over 180 days |
|
|
1 |
|
|
— |
|
|
1 |
|
|
446 |
|
|
447 |
|
|
— |
|
|
Total |
|
|
15 |
|
|
12,742 |
|
|
1,093 |
|
|
2,509 |
|
|
16,344 |
|
|
— |
|
|
31 December 2010 |
|
|
|
|
|
|
|
|
|
|
|
|
|
|
|
|
|
|
|
|
0-30 days |
|
|
— |
|
|
6,498 |
|
|
1,004 |
|
|
1,331 |
|
|
8,833 |
|
|
— |
|
|
30-60 days |
|
|
— |
|
|
2,674 |
|
|
246 |
|
|
498 |
|
|
3,418 |
|
|
— |
|
|
60-90 days |
|
|
— |
|
|
1,811 |
|
|
29 |
|
|
394 |
|
|
2,234 |
|
|
— |
|
|
90-180 days |
|
|
— |
|
|
2,223 |
|
|
10 |
|
|
337 |
|
|
2,570 |
|
|
— |
|
|
Over 180 days |
|
|
— |
|
|
9 |
|
|
— |
|
|
867 |
|
|
876 |
|
|
— |
|
|
Total |
|
|
— |
|
|
13,215 |
|
|
1,289 |
|
|
3,427 |
|
|
17,931 |
|
|
— |
|
|
31 December 2009 |
|
|
|
|
|
|
|
|
|
|
|
|
|
|
|
|
|
|
|
|
0-30 days |
|
|
— |
|
|
6,018 |
|
|
1,316 |
|
|
2,347 |
|
|
9,681 |
|
|
— |
|
|
30-60 days |
|
|
— |
|
|
2,649 |
|
|
376 |
|
|
825 |
|
|
3,850 |
|
|
— |
|
|
60-90 days |
|
|
— |
|
|
1,702 |
|
|
74 |
|
|
825 |
|
|
2,601 |
|
|
— |
|
|
90-180 days |
|
|
— |
|
|
2,216 |
|
|
48 |
|
|
560 |
|
|
2,824 |
|
|
— |
|
|
Over 180 days |
|
|
— |
|
|
2 |
|
|
59 |
|
|
561 |
|
|
622 |
|
|
— |
|
|
Total |
|
|
— |
|
|
12,587 |
|
|
1,873 |
|
|
5,118 |
|
|
19,578 |
|
|
— |
|
|
31 December 2008 |
|
|
|
|
|
|
|
|
|
|
|
|
|
|
|
|
|
|
|
|
0-30 days |
|
|
— |
|
|
1,527 |
|
|
853 |
|
|
289 |
|
|
2,669 |
|
|
— |
|
|
30-60 days |
|
|
— |
|
|
633 |
|
|
259 |
|
|
90 |
|
|
982 |
|
|
— |
|
|
60-90 days |
|
|
17 |
|
|
424 |
|
|
32 |
|
|
70 |
|
|
526 |
|
|
— |
|
|
90-180 days |
|
|
— |
|
|
549 |
|
|
2 |
|
|
77 |
|
|
628 |
|
|
— |
|
|
Over 180 days |
|
|
— |
|
|
1 |
|
|
— |
|
|
29 |
|
|
30 |
|
|
— |
|
|
Total |
|
|
17 |
|
|
3,134 |
|
|
1,146 |
|
|
555 |
|
|
4,835 |
|
|
— |
|
|
31 December 2007 |
|
|
|
|
|
|
|
|
|
|
|
|
|
|
|
|
|
|
|
|
0-30 days |
|
|
— |
|
|
1,123 |
|
|
781 |
|
|
266 |
|
|
2,170 |
|
|
— |
|
|
30-60 days |
|
|
— |
|
|
445 |
|
|
155 |
|
|
107 |
|
|
707 |
|
|
— |
|
|
60-90 days |
|
|
— |
|
|
260 |
|
|
29 |
|
|
129 |
|
|
418 |
|
|
— |
|
|
90-180 days |
|
|
— |
|
|
325 |
|
|
1 |
|
|
67 |
|
|
393 |
|
|
— |
|
|
Over 180 days |
|
|
— |
|
|
— |
|
|
— |
|
|
70 |
|
|
70 |
|
|
— |
|
|
Total |
|
|
— |
|
|
2,153 |
|
|
966 |
|
|
639 |
|
|
3,758 |
|
|
— |
|
A financial asset is ‘past due’ if a counterparty has failed to make a payment when contractually due.
119
OPERATING AND FINANCIAL REVIEW AND PROSPECTS
POTENTIAL PROBLEM LOANS
Potential problem loans are loans where known information about possible credit problems causes management to have concern as to the borrower’s ability to comply with the present loan repayment terms.
IFRS 7 requires the disclosure of information about the credit quality of loans and advances that are neither past due nor impaired. The Group’s disclosures analyse these loans between those that the Group believes are of good quality, satisfactory quality, and lower quality and those that are below standard but not impaired. The below standard but not impaired balances represent potential problem loans.
|
|
|
|
|
|
|
|
|
|
|
|
|
|
|
|
|
|
|
|
|
|
|
|
|
|
|
|
|
|
Loans and |
|||||||||||||
|
|
|
|
|
|
|
|
|
|||||||||||||
|
|
|
|
|
|
|
|
|
|||||||||||||
|
|
|
Loans and |
|
Loans and advances to customers |
|
|
|
|||||||||||||
|
|
|
|
|
|
|
|||||||||||||||
|
(audited) |
|
|
Retail – |
|
Retail – |
|
Wholesale |
|
Total |
|
|
|
||||||||
|
31 December 2011 |
|
|
|
|
|
|
|
|
|
|
|
|
|
|
|
|
|
|
|
|
|
Good quality |
|
|
32,141 |
|
|
323,060 |
|
|
29,123 |
|
|
71,907 |
|
|
|
|
|
|
11,065 |
|
|
Satisfactory quality |
|
|
171 |
|
|
5,432 |
|
|
9,747 |
|
|
42,311 |
|
|
|
|
|
|
45 |
|
|
Lower quality |
|
|
9 |
|
|
970 |
|
|
1,127 |
|
|
24,676 |
|
|
|
|
|
|
11 |
|
|
Below standard, but not impaired |
|
|
173 |
|
|
1,265 |
|
|
1,451 |
|
|
7,761 |
|
|
|
|
|
|
— |
|
|
Total |
|
|
32,494 |
|
|
330,727 |
|
|
41,448 |
|
|
146,655 |
|
|
518,830 |
|
|
|
11,121 |
|
|
31 December 2010 |
|
|
|
|
|
|
|
|
|
|
|
|
|
|
|
|
|
|
|
|
|
Good quality |
|
|
29,835 |
|
|
332,614 |
|
|
30,076 |
|
|
57,552 |
|
|
|
|
|
|
12,220 |
|
|
Satisfactory quality |
|
|
265 |
|
|
5,259 |
|
|
11,084 |
|
|
42,906 |
|
|
|
|
|
|
163 |
|
|
Lower quality |
|
|
16 |
|
|
834 |
|
|
1,170 |
|
|
45,750 |
|
|
|
|
|
|
83 |
|
|
Below standard, but not impaired |
|
|
143 |
|
|
802 |
|
|
2,728 |
|
|
13,066 |
|
|
|
|
|
|
79 |
|
|
Total |
|
|
30,259 |
|
|
339,509 |
|
|
45,058 |
|
|
159,274 |
|
|
543,841 |
|
|
|
12,545 |
|
|
31 December 2009 |
|
|
|
|
|
|
|
|
|
|
|
|
|
|
|
|
|
|
|
|
|
Good quality |
|
|
34,434 |
|
|
335,482 |
|
|
30,743 |
|
|
61,810 |
|
|
|
|
|
|
18,702 |
|
|
Satisfactory quality |
|
|
135 |
|
|
9,614 |
|
|
12,654 |
|
|
59,752 |
|
|
|
|
|
|
267 |
|
|
Lower quality |
|
|
15 |
|
|
746 |
|
|
1,480 |
|
|
45,986 |
|
|
|
|
|
|
90 |
|
|
Below standard, but not impaired |
|
|
749 |
|
|
1,450 |
|
|
3,552 |
|
|
18,324 |
|
|
|
|
|
|
23 |
|
|
Total |
|
|
35,333 |
|
|
347,292 |
|
|
48,429 |
|
|
185,872 |
|
|
581,593 |
|
|
|
19,082 |
|
|
31 December 2008 |
|
|
|
|
|
|
|
|
|
|
|
|
|
|
|
|
|
|
|
|
|
Good quality |
|
|
38,283 |
|
|
109,815 |
|
|
21,373 |
|
|
49,349 |
|
|
|
|
|
|
129 |
|
|
Satisfactory quality |
|
|
215 |
|
|
264 |
|
|
9,192 |
|
|
31,042 |
|
|
|
|
|
|
411 |
|
|
Lower quality |
|
|
204 |
|
|
— |
|
|
900 |
|
|
5,831 |
|
|
|
|
|
|
56 |
|
|
Below standard, but not impaired |
|
|
14 |
|
|
69 |
|
|
2,106 |
|
|
485 |
|
|
|
|
|
|
12 |
|
|
Total |
|
|
38,716 |
|
|
110,148 |
|
|
33,571 |
|
|
86,707 |
|
|
230,426 |
|
|
|
608 |
|
|
31 December 2007 |
|
|
|
|
|
|
|
|
|
|
|
|
|
|
|
|
|
|
|
|
|
Good quality |
|
|
34,647 |
|
|
99,407 |
|
|
18,157 |
|
|
46,240 |
|
|
|
|
|
|
191 |
|
|
Satisfactory quality |
|
|
190 |
|
|
378 |
|
|
8,964 |
|
|
25,013 |
|
|
|
|
|
|
670 |
|
|
Lower quality |
|
|
7 |
|
|
1 |
|
|
665 |
|
|
2,034 |
|
|
|
|
|
|
327 |
|
|
Below standard, but not impaired |
|
|
1 |
|
|
42 |
|
|
2,064 |
|
|
188 |
|
|
|
|
|
|
1 |
|
|
Total |
|
|
34,845 |
|
|
99,828 |
|
|
29,850 |
|
|
73,475 |
|
|
203,153 |
|
|
|
1,189 |
|
For further details see pages F-120 to F-126.
INTEREST FOREGONE ON NON-PERFORMING LENDING
The table below summarises the interest foregone on impaired lending.
|
|
|
|
|
|
|
(unaudited) |
|
|
2011 |
|
|
Interest income that would have been recognised under original contract terms |
|
|
2,819 |
|
|
Interest income included in profit |
|
|
(1,405 |
) |
|
Interest foregone |
|
|
1,414 |
|
120
OPERATING AND FINANCIAL REVIEW AND PROSPECTS
TROUBLED DEBT RESTRUCTURINGS
In the US, loans whose terms have been modified due to problems with the borrower are required to be separately disclosed. If the new terms were in line with market conditions at the time of the restructuring and the restructured loan remains current as to repayment of principal and interest then the disclosure is discontinued at the end of the first year.
The Group assesses whether a loan benefitting from a UK Government-sponsored programme is impaired or a troubled debt restructuring using the same accounting policies and practices as it does for loans not benefitting from such a programme.
As disclosed in note 56 to the financial statements loans
that were renegotiated during the year and that would otherwise have been past
due or impaired at the year end (2011: £2,505 million; 2010: £5,475 million;
2009: £3,919 million; 2008: £144 million; 2007: £579 million); see also page
F-126.
The lending renegotiated in 2010 and 2011 is analysed as follows:
|
|
|
|
|
|
|
|
|
|
(audited) |
|
|
2011 |
|
|
2010 |
|
|
Capitalisation of arrears |
|
|
1,677 |
|
|
2,804 |
|
|
Interest rate adjustment |
|
|
28 |
|
|
337 |
|
|
Payment holidays |
|
|
172 |
|
|
221 |
|
|
Interest capitalisation |
|
|
269 |
|
|
10 |
|
|
Forbearance of principal |
|
|
359 |
|
|
2,103 |
|
|
Total |
|
|
2,505 |
|
|
5,475 |
|
FORBEARANCE
Forbearance or repayment arrangements allow a mortgage customer to repay a monthly amount which is lower than their contractual monthly payment for a short period. This period is usually for no more than 12 months and is negotiated with the customer by the mortgage collectors. During the period of forbearance, there is no clearing down of arrears such that unless the customer is paying more than their contractual minimum payment, arrears balances will remain. When customers come to the end of their arrangement period they will continue to be managed as a mainstream collections case and if unable to recover then will move toward possession.
Customers can have their arrears balance capitalised once they have demonstrated they can pay the original contractual minimum payment, but are unable to clear their arrears. This is usually demonstrated by the customer making six consecutive contractual monthly payments. Customers are not however able to capitalise more than twice in a five year period. Capitalised mortgages will return to the non-impaired book and will be managed in accordance with the recapitalised terms of the mortgage.
ASSETS ACQUIRED IN EXCHANGE FOR ADVANCES
In most circumstances in the US, title to property securing residential real estate transfers to the lender upon foreclosure. The loan is written off and the property acquired in this way is reported in a separate balance sheet category with any recoveries recorded as an offset to the provision for loan losses recorded in the year. Upon sale of the acquired property, gains or losses are recorded in the income statement as a gain or loss on acquired property.
In the UK, although a bank is entitled to enforce a first charge on a property held as security, it typically does so only to the extent of enforcing its power of sale. In accordance with IFRS and industry practice, Lloyds Banking Group usually takes control of a property held as collateral on a loan at repossession without transfer of title. Loans subject to repossession continue to be reported as loans in the balance sheet. Any gains or losses on sale of the acquired property are recorded within the provision for loan losses during the reporting period.
The difference in practices has no effect on net income reported in the UK compared to that reported in the US but it does result in a difference in classification of losses and recoveries in the income statement. It also has the effect of causing UK banks to report an increased level of non-performing loans compared with US banks.
In certain circumstances the Group takes physical possession of assets held as collateral against wholesale lending. In such cases, the assets are carried on the Group’s balance sheet and are classified according to the Group’s accounting policies.
121
OPERATING AND FINANCIAL REVIEW AND PROSPECTS
CROSS BORDER OUTSTANDINGS
The business of Lloyds Banking Group involves significant exposures in non-local currencies. These cross border outstandings comprise loans (including accrued interest), acceptances, interest-bearing deposits with other banks, other interest-bearing investments and any other monetary assets which are denominated in non-local currency. The following table analyses, by type of borrower, foreign outstandings which individually represent in excess of 1 per cent of Lloyds Banking Group’s total assets.
|
|
|
|
|
|
|
|
|
|
|
|
|
|
|
|
|
|
|
(unaudited) |
|
% of assets |
|
Total |
|
Governments |
|
Banks and
other |
|
Commercial, |
|
|||||
|
As at 31 December 2011: |
|
|
|
|
|
|
|
|
|
|
|
|
|
|
|
|
|
United States of America |
|
|
4.3 |
|
|
42,215 |
|
|
7,686 |
|
|
20,509 |
|
|
14,020 |
|
|
Republic of Ireland1 |
|
|
1.6 |
|
|
15,966 |
|
|
80 |
|
|
738 |
|
|
15,148 |
|
|
As at 31 December 2010: |
|
|
|
|
|
|
|
|
|
|
|
|
|
|
|
|
|
United States of America |
|
|
4.1 |
|
|
40,246 |
|
|
8,304 |
|
|
12,022 |
|
|
19,920 |
|
|
Republic of Ireland1 |
|
|
2.5 |
|
|
24,459 |
|
|
10 |
|
|
1,744 |
|
|
22,705 |
|
|
Germany |
|
|
1.4 |
|
|
14,156 |
|
|
2,488 |
|
|
6,715 |
|
|
4,953 |
|
|
France |
|
|
1.1 |
|
|
10,708 |
|
|
1,409 |
|
|
4,368 |
|
|
4,931 |
|
|
As at 31 December 2009: |
|
|
|
|
|
|
|
|
|
|
|
|
|
|
|
|
|
United States of America |
|
|
1.9 |
|
|
19,033 |
|
|
3,266 |
|
|
2,548 |
|
|
13,219 |
|
|
France |
|
|
1.4 |
|
|
14,126 |
|
|
768 |
|
|
2,932 |
|
|
10,426 |
|
|
|
|
|
1 |
Following the merger of Bank of Scotland (Ireland) Limited into Bank of Scotland plc, the Group’s lending in Ireland is now held on the balance sheet of Bank of Scotland plc in the UK and constitutes a cross-border outstanding. |
As at 31 December 2011, United States of America had commitments of £15,624 million and Republic of Ireland had commitments of £1,216 million.
As at 31 December 2011, the countries with cross border outstandings of between 0.75 per cent and 1 per cent of assets, amounting to £17,133 million in total were France and Germany.
As at 31 December 2010 the countries with cross border outstandings of between 0.75 per cent and 1 per cent of assets, amounting to £15,714 million in total were Australia and the Netherlands. As at 31 December 2009, there were no countries with cross border outstandings of between 0.75 per cent and 1 per cent of assets.
122
OPERATING AND FINANCIAL REVIEW AND PROSPECTS
Environmental risk management
The Group’s businesses work in line with Group policies and procedures to manage the environmental impact of their lending activities. The Group wide Credit Risk Policy requires all business loans to be assessed for material environmental risks as part of the credit sanctioning process.
In 2011, the Group launched an electronic environmental risk screening system, which is the primary mechanism for assessing environmental risk in Wholesale. This provides real time screening of location specific and sector based risks that may be present in a transaction. Where a risk is identified, the transaction is referred to the Group’s expert in-house Environmental Risk team for further review and assessment, as outlined below. Additional support is provided by the Group’s panel of environmental consultants as required.
Table 1.40: Environmental risk management approach
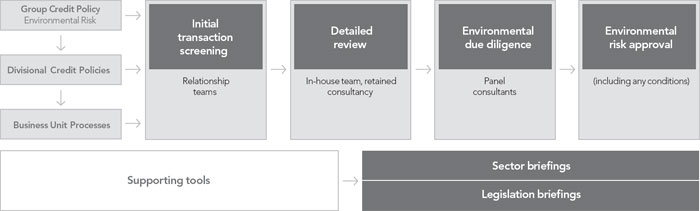
Colleagues are trained in environmental risk management as part of the standard credit risk training course, and the team provides bespoke training to teams upon request. Supporting this training, a range of documents are provided to all colleagues online including environmental risk theory, procedural guidance, and information on environmental legislation and sector-specific environmental impacts.
Project Finance: Equator Principles
Lloyds Banking Group is a signatory to the Equator Principles. These support the approach to assessing and managing environmental and social issues in project finance. Project finance is often used to fund the development and construction of major infrastructure and industrial projects. The Equator Principles are applicable to project finance transactions above USD 10 million and provide a framework to support responsible decision-making.
The Group has a robust, groupwide approach to assess, monitor and report Equator Principle transactions. The Group also provides ongoing training for lending officers; information on the Equator Principles is included in all training and the Group offers more in-depth training for staff working in project finance.
Projects are categorised depending on the level of perceived risk and magnitude of impact they pose, in relation to a set of criteria issued by the International Finance Corporation (IFC).
The categories are as follows:
Category A – Projects with potential significant adverse social or environmental impacts that are diverse, irreversible or unprecedented;
Category B – Projects with potential limited adverse social or environmental impacts that are few in number, generally site-specific, largely reversible and readily addressed through mitigation measures; and
Category C – Projects with minimal or no social or environmental impacts.
Lending officers are responsible for undertaking initial classification of transactions that qualify under the Equator Principles. Their assessments are subject to further review by the Group’s in-house Environmental Risk team, and for higher risk transactions by the Equator Principles Review Group, comprising experts from both the Risk and Project Finance teams. This ensures that each transaction is compliant and is consistent with the environmental risk policy. The Group provides a range of training and support materials to its risk and transactional staff to ensure that they are familiar with the requirements of the Principles.
In 2011, the Group participated in the Equator Principles Strategic Review process which examined the scope of application, transparency, implementation and governance of the Principles. It is the first step of a longer term process to determine the future direction of the Principles and ensure they are fit for purpose. The Group believes that the collective effort of financial institutions will ensure that the Equator Principles continue to play an industry leading role and will continue to engage in the update process.
123
OPERATING AND FINANCIAL REVIEW AND PROSPECTS
Table 1.41: Status of Categorised Projects (unaudited)
|
|
|
|
|
|
|
|
|
|
|
|
|
|
|
|
|
|
|
A |
|
|
B |
|
|
C |
|
|
Total |
|
|
Completed |
|
|
— |
|
|
15 |
|
|
10 |
|
|
25 |
|
|
In Progress |
|
|
1 |
|
|
4 |
|
|
4 |
|
|
9 |
|
|
Not Completed |
|
|
— |
|
|
2 |
|
|
4 |
|
|
6 |
|
|
|
|
|
1 |
|
|
21 |
|
|
18 |
|
|
40 |
|
Table 1.58: Status of Projects by Industry (unaudited)
|
|
|
|
|
|
|
|
|
|
|
|
|
|
|
|
|
|
Renewables |
|
Infrastructure |
|
Energy and |
|
Total |
|
||||
|
Completed |
|
|
16 |
|
|
4 |
|
|
5 |
|
|
25 |
|
|
In Progress |
|
|
5 |
|
|
3 |
|
|
1 |
|
|
9 |
|
|
Not Completed |
|
|
2 |
|
|
4 |
|
|
— |
|
|
6 |
|
|
|
|
|
23 |
|
|
11 |
|
|
6 |
|
|
40 |
|
Throughout 2011, the Group continued to provide finance for a wide range of projects within the renewables, energy & utilities and infrastructure sectors that have the capability to deliver positive social and environmental outcomes. This year saw a 56 per cent increase in the value of renewables projects that the Group provided finance for compared to 2010. When completed, renewable projects within the UK funded during 2011 will provide over 540,000 homes with renewable energy, avoiding tens of thousands of tonnes of CO2 emissions each year.
|
|
|
|
|
|
|
|
|
|
Table 1.42: Industry of Completed Transactions (unaudited) |
|
|
|
|
|
|
|
|
|
|
|
No. |
|
|
£m |
|
|
Renewables |
|
|
16 |
|
|
611 |
|
|
Infrastructure |
|
|
5 |
|
|
316 |
|
|
Energy & Utilities |
|
|
4 |
|
|
123 |
|
|
|
|
|
25 |
|
|
1,050 |
|
|
|
|
|
|
|
|
|
|
|
|
|
|
|
|
|
Table 1.43: Geography of Completed Transactions (unaudited) |
|||||||||||||
|
|
|
|
A |
|
|
B |
|
|
C |
|
|
Total |
|
|
UK |
|
|
— |
|
|
5 |
|
|
4 |
|
|
9 |
|
|
Americas |
|
|
— |
|
|
7 |
|
|
5 |
|
|
12 |
|
|
Europe |
|
|
— |
|
|
1 |
|
|
— |
|
|
1 |
|
|
Australasia |
|
|
— |
|
|
2 |
|
|
1 |
|
|
3 |
|
|
|
|
|
— |
|
|
15 |
|
|
10 |
|
|
25 |
|
124
OPERATING AND FINANCIAL REVIEW AND PROSPECTS
DEFINITION
The risk of reductions in earnings, value, capital and/or reserves, through financial or reputational loss, arising from unexpected changes in financial prices, including interest rates, inflation rates, exchange rates, credit spreads and prices for bonds, commodities, equities, property and other instruments. It arises in all areas of the Group’s activities and is managed by a variety of different techniques.
RISK APPETITE
Market risk appetite is defined with regard to the quantum and composition of market risk that currently exists in the Group and the Group’s risk preferences.
This statement of the Group’s overall appetite for market risk is reviewed and approved annually by the Board. With the support of the Group Asset and Liability Committee, the Group Chief Executive allocates this risk appetite across the Group. Individual members of the Group Executive Committee ensure that market risk appetite is further delegated to an appropriate level within their areas of responsibility.
EXPOSURES
The Group’s banking activities expose it to the risk of adverse movements in interest rates, credit spreads, exchange rates and equity prices, with little or no exposure to commodity risk. The volatility of market values can be affected by both the transparency of prices and the amount of liquidity in the market for the relevant asset.
Most of the Group’s trading activity is undertaken to meet the requirements of wholesale and retail customers for foreign exchange and interest rate products. However, some interest rate, exchange rate and credit spread positions are taken using derivatives and other on-balance sheet instruments with the objective of earning a profit from favourable movements in market rates.
Market risk in the Group’s retail portfolios and in the Group’s capital and funding activities arises from the different repricing characteristics of the Group’s non-trading assets and liabilities. Interest rate risk arises predominantly from the mismatch between interest rate insensitive liabilities and interest rate sensitive assets.
Risk also arises from the margin of interbank rates over central bank rates. A further banking risk arises from competitive pressures on product terms in existing loans and deposits, which sometimes restricts the Group in its ability to change interest rates applying to customers in response to changes in interbank and central bank rates.
Foreign currency risk also arises from the Group’s investment in its overseas operations.
The Group’s insurance activities also expose it to market risk, encompassing interest rate, exchange rate, property, credit spreads and equity risk:
|
|
|
|
– |
With Profit Funds are managed with the aim of generating rates of return consistent with policyholders’ expectations and this involves the mismatch of assets and liabilities. |
|
|
|
|
– |
Unit-linked liabilities are matched with the same assets that are used to define the liability but future fee income is dependent upon the performance of those assets. (This forms part of the Value of in Force, see note 30 to the financial statements.) |
|
|
|
|
– |
For other insurance liabilities the aim is to invest in assets such that the cash flows on investments will match those on the projected future liabilities. It is not possible to eliminate risk completely as the timing of insured events is uncertain and bonds are not available at all of the required maturities. As a result, the cash flows cannot be precisely matched and so sensitivity tests are used to test the extent of the mismatch. |
|
|
|
|
– |
Surplus assets are held primarily in four portfolios: (a) in the long-term funds of Scottish Widows plc and its subsidiaries; (b) in the shareholder funds of life assurance companies; (c) investment portfolios within the general insurance business and (d) within the main fund of Heidelberger Lebensversicherung AG. |
The Group’s defined benefit staff pension schemes are exposed to significant risks from the constituent parts of their assets and from the present value of their liabilities, primarily equity and real interest rate risk. For further information on pension scheme assets and liabilities please refer to note 43 to the financial statements.
MEASUREMENT
The following market risk measures are used for risk reporting and setting risk appetite limits and triggers:
|
|
|
|
– |
Value at Risk (VaR): for short term liquid positions a 1-day 95 per cent VaR is used; for structural positions a 1-year 95 per cent VaR is used |
|
|
|
|
– |
Standard Stresses: Interest Rates 25bp; Equities 10 per cent; Credit Spreads relative 30 per cent widening |
|
|
|
|
– |
Bespoke Extreme Stress Scenarios: e.g. stock market crash |
Both VaR and standard stress measures are also used in setting divisional market risk appetite limits and triggers.
Although an important market standard measure of risk, VaR has limitations. These arise from the use of limited historical data, an assumed distribution, defined holding periods, set confidence intervals and frequency of calculation. The exposure level at the confidence interval does not convey any information about potential losses which may arise if this level is exceeded. A 95 per cent confidence interval with a 1 day holding period is equivalent to an expected 1 in 20 day loss. Where VaR models are less well suited to the nature of positions, the Group recognises these limitations and supplements its use with a variety of other techniques. These reflect the nature of the business activity, and include interest rate repricing gaps, open exchange positions and sensitivity analysis. Stress testing and scenario analysis are also used in certain portfolios and at group level, to simulate extreme conditions to supplement these core measures. Trading book VaR (1-day 99 per cent) is compared daily against both forecast and actual profit and loss.
125
OPERATING AND FINANCIAL REVIEW AND PROSPECTS
TRADING ASSETS AND OTHER TREASURY POSITIONS
Based on the 95 per cent confidence level, assuming positions are held overnight and using observation periods of the preceding 300 business days, the VaR for the years ended 31 December 2011 and 2010 based on the Group’s global trading positions as detailed in table 1.44.
The risk of loss measured by the VaR model is the potential loss in earnings given the confidence level and assumptions noted above. The total and average trading VaR does not assume any diversification benefit across the five risk types, which now includes inflation. The maximum and minimum VaR reported for each risk category did not necessarily occur on the same day as the maximum and minimum VaR reported as a whole. The Group internally uses VaR as the primary measure for all trading book positions arising from short term market facing activity.
Table 1.44: VaR trading assets and other treasury positions (see ‘Measurement’ page 125) (audited)
|
|
|
|
|
|
|
|
|
|
|
|
|
|
|
|
|
|
|
|
|
2011 |
|
2010 |
|
|||||||||||
|
|
|
|
||||||||||||||
|
|
|
Close |
|
Average |
|
Maximum |
|
Minimum |
|
Close |
|
|||||
|
Interest rate risk |
|
|
2.6 |
|
|
3.0 |
|
|
5.9 |
|
|
1.8 |
|
|
3.9 |
|
|
Foreign exchange risk |
|
|
0.4 |
|
|
0.5 |
|
|
1.6 |
|
|
0.2 |
|
|
0.4 |
|
|
Equity risk |
|
|
— |
|
|
— |
|
|
— |
|
|
— |
|
|
— |
|
|
Credit spread risk |
|
|
3.1 |
|
|
2.3 |
|
|
4.5 |
|
|
1.0 |
|
|
1.6 |
|
|
Inflation risk |
|
|
0.2 |
|
|
0.2 |
|
|
0.5 |
|
|
0.1 |
|
|
0.3 |
|
|
Total VaR |
|
|
6.3 |
|
|
6.0 |
|
|
9.7 |
|
|
4.1 |
|
|
6.2 |
|
NON-TRADING
Market risk in non-trading books consists almost entirely of exposure to changes in interest rates including the margin between interbank and central bank rates. This is the potential impact on earnings and value that could occur when, if rates fall, liabilities cannot be re-priced as quickly or by as much as assets; or when, if rates rise, assets cannot be re-priced as quickly or by as much as liabilities.
Risk exposure is monitored monthly using, primarily, market value sensitivity. This methodology considers all re-pricing mismatches in the current balance sheet and calculates the change in market value that would result from a set of defined interest rate shocks. Where re-pricing maturity is based on assumptions about customer behaviour these assumptions are also reviewed monthly.
A limit structure exists to ensure that risks stemming from residual and temporary positions or from changes in assumptions about customer behaviour remain within the Group’s risk appetite.
The following table shows, split by material currency, Lloyds Banking Group sensitivities as at 31 December 2011 to an immediate up and down 25 basis points change to all interest rates.
Table 1.45: Non-trading (audited)
|
|
|
|
|
|
|
|
|
|
|
|
|
|
|
|
|
|
2011 |
|
2010 |
|
||||||||
|
|
|
|
|||||||||||
|
|
|
Up 25bps |
|
Down 25bps |
|
Up 25bps |
|
Down 25bps |
|
||||
|
Sterling |
|
|
(53.1 |
) |
|
54.7 |
|
|
(86.9 |
) |
|
88.4 |
|
|
US Dollar |
|
|
(0.4 |
) |
|
0.3 |
|
|
11.1 |
|
|
(11.4 |
) |
|
Euro |
|
|
(15.7 |
) |
|
15.9 |
|
|
8.9 |
|
|
(9.0 |
) |
|
Australian Dollar |
|
|
(1.8 |
) |
|
1.8 |
|
|
(1.2 |
) |
|
1.2 |
|
|
Other |
|
|
(1.4 |
) |
|
1.3 |
|
|
(3.0 |
) |
|
3.1 |
|
|
|
|
|
(72.4 |
) |
|
74.0 |
|
|
(71.1 |
) |
|
72.3 |
|
Base case market value is calculated on the basis of the Lloyds Banking Group current balance sheet with re-pricing dates adjusted according to behavioural assumptions. The above sensitivities show how this projected market value would change in response to an immediate parallel shift to all relevant interest rates – market and administered.
This is a
risk based disclosure and the amounts shown would be amortised in the income
statement over the duration of the portfolio.
The measure, however, is
simplified in that it assumes all interest rates, for all currencies and
maturities, move at the same time and by the same amount.
PENSION SCHEMES
Management of the assets of the Group’s defined benefit pension schemes is the responsibility of the Scheme Trustees, who also appoint the Scheme Actuaries to perform the triennial valuations. The Group monitors its pensions exposure holistically using a variety of metrics including accounting and economic deficits and contribution rates. These and other measures are regularly reviewed by the Group Asset and Liability Committee and the Group Market Risk Committee and used in discussions with the Trustees, through whom any risk management and mitigation activity must be conducted.
The schemes’ main exposures are to equity risk, real rate risk and credit spread risk. Accounting for the pension schemes under International Accounting Standard (IAS) 19 spreads any adverse impacts of these risks over time.
126
OPERATING AND FINANCIAL REVIEW AND PROSPECTS
INSURANCE PORTFOLIOS
The Group’s market risk exposure in respect of insurance activities described above is measured using EEV as a proxy for economic value. The pre-tax sensitivity of EEV to standardised stresses is shown below for the years ended 31 December 2011 and 2010. Impacts have only been shown in one direction but can be assumed to be reasonably symmetrical. Opening and closing numbers only have been provided as this data is not volatile and consequently is not tracked on a daily basis.
Table 1.46: Insurance portfolios (audited)
|
|
|
|
|
|
|
|
|
|
|
|
2011 |
|
2010 |
|
||
|
Equity risk (impact of 10% fall pre-tax) |
|
|
(339.4 |
) |
|
(367.4 |
) |
|
Interest rate risk (impact of 25 basis point reduction pre-tax) |
|
|
59.2 |
|
|
82.1 |
|
|
Credit spread risk (impact of relative 30% widening) |
|
|
(237.3 |
) |
|
(163.0 |
) |
MITIGATION
Various
mitigation activities are undertaken across the Group to manage portfolios and
seek to ensure they remain within approved limits.
BANKING – NON-TRADING
ACTIVITIES
Interest rate risk arising from the different repricing characteristics of the Group’s non-trading assets and liabilities, and from the mismatch between interest rate insensitive assets and interest rate sensitive liabilities, is managed centrally. Matching assets and liabilities are offset against each other and interest rate swaps are also used to manage the residual exposure to within the Non-Traded Market Risk Appetite.
The corporate and retail businesses incur foreign exchange risk in the course of providing services to their customers. All non-structural foreign exchange exposures in the non-trading book are transferred to the trading area where they are monitored and controlled within the Trading Risk Appetite and any residual risk is hedged in the market.
INSURANCE ACTIVITIES
Investment holdings are diversified across markets and, within markets, across sectors. Holdings are diversified to minimise specific risk and the relative size of large individual exposures is monitored closely. For assets held outside unit-linked funds, investments are only permitted in countries and markets which are sufficiently regulated and liquid.
MONITORING
The Group Asset and Liability Committee and the Group Market Risk Committee regularly review high level market risk exposure including, but not limited to, the data described above. They also make recommendations to the Group Chief Executive concerning overall market risk appetite and market risk policy. Exposures at lower levels of delegation are monitored at various intervals according to their volatility, from daily in the case of trading portfolios to monthly or quarterly in the case of less volatile portfolios. Levels of exposures compared to approved limits are monitored by Risk Division and where appropriate, escalation procedures are in place.
BANKING ACTIVITIES
Trading is restricted to a number of specialist centres, the most important centre being the treasury and trading business in London. These centres also manage market risk in the wholesale non-trading portfolios, both in the UK and internationally. The level of exposure is strictly controlled and monitored within approved limits. Active management of the wholesale portfolios is necessary to meet customer requirements and changing market circumstances.
Market risk in the Group’s retail portfolios and in the Group’s capital and funding activities is managed centrally within limits defined in the detailed Group policy for interest rate risk in the banking book, which is reviewed and approved annually.
INSURANCE ACTIVITIES
Market risk exposures from the insurance businesses are controlled via approved investment policies and triggers set with reference to the Group’s overall risk appetite and regularly reviewed by the Group Market Risk Committee:
|
|
|
|
– |
The With Profit Funds are managed in accordance with the relevant fund’s principles and practices of financial management and legal requirements. |
|
|
|
|
– |
The investment strategy for other insurance liabilities is determined by the term and nature of the underlying liabilities and asset/liability matching positions are actively monitored. Actuarial tools are used to project and match the cash flows. |
|
|
|
|
– |
Investment strategy for surplus assets held in excess of liabilities takes account of the legal, regulatory and internal business requirements for capital to be held to support the business now and in the future. |
The Group also agrees strategies for the overall mix of pension assets with the pension scheme trustees.
127
OPERATING AND FINANCIAL REVIEW AND PROSPECTS
DEFINITION
The risk of reductions in earnings and/or value, through financial or reputational loss, from inadequate or failed internal processes and systems, or from people related or external events.
There are a number of categories of operational risk:
REGULATORY
Regulatory risk is the risk of reductions in earnings and/or value, through financial or reputational loss, from failing to comply with the applicable laws, regulations or codes.
CUSTOMER TREATMENT
The risk of regulatory censure and/or a reduction in earnings/value through financial or reputational loss, from inappropriate or poor customer treatment.
PEOPLE
The risk of reductions in earnings or value through financial or reputational loss arising from ineffectively leading colleagues responsibly and proficiently, managing people resource, supporting and developing colleague talent, or meeting regulatory obligations related to people.
SUPPLIER MANAGEMENT
The risk of reductions in earnings and/or value through financial or reputational loss from services with outsourced partners or third-party suppliers.
CUSTOMER PROCESSES
The risk of reductions in earnings and/or value, through financial or reputational loss, resulting from poor externally facing business processes. Customer process risk includes customer transaction and processing errors due to incorrect capturing of customer information and/or system failure.
FINANCIAL CRIME
The risk of reductions in earnings and/or value, through financial or reputational loss, associated with financial crime and failure to comply with related regulatory obligations, these losses may include censure, fines or the cost of litigation. This includes risks associated with fraud and bribery.
MONEY LAUNDERING AND SANCTIONS
The risk of reductions in earnings and/or value, through financial or reputational loss, associated with failure to comply with prevailing regulatory obligations on activities related to money laundering, sanctions and counter terrorism, these losses may include censure, fines or the cost of litigation.
SECURITY
The risk of reductions in earnings and/or value, through financial or reputational loss, resulting from theft of or damage to the Group’s assets, the loss, corruption, misuse or theft of the Group’s information assets or threats or actual harm to the Group’s people. This also includes risks relating to terrorist acts, other acts of war, geopolitical, pandemic or other such events.
IT SYSTEMS
The risk of reductions in earnings and/or value through financial or reputational loss resulting from the failure to develop, deliver or maintain effective IT solutions.
CHANGE
The risk of reductions in earnings and/or value, through financial or reputational loss, from change initiatives failing to deliver to requirements, budget or timescale, failing to implement change effectively or failing to realise desired benefits.
ORGANISATIONAL INFRASTRUCTURE
The risk of reductions in earnings and/or value, through financial or reputational loss, resulting from poor internally facing business processes at group, divisional or business unit level. Organisational infrastructure in this context embraces the structures, systems and processes that provide direction, control and accountability for the enterprise.
RISK APPETITE
The Group has developed an impact on earnings approach to operational risk appetite. This involves looking at how much the Group could lose due to operational risk losses at various levels of certainty.
In setting operational risk appetite, the Group looks at both impact on solvency and the Group’s reputation.
The Group has zero risk appetite for regulatory breaches or systemic unfair outcomes for customers. To achieve this, the Group encourages and maintains an appropriately balanced regulatory compliance culture and promotes policies and procedures to enable businesses and their staff to operate in accordance with the laws, regulations and voluntary codes which impact on the Group and its activities.
EXPOSURES
By its very nature, operational risks can arise from a wide range of the Group’s activities that involve people, processes and systems. The Group’s principal operational risks relate to the Group’s ability to attract, retain and motivate its people, the rate and scale of change arising from the Group’s strategic review programme, the way in which the Group treats its customers and the regulatory environment in which it operates.
128
OPERATING AND FINANCIAL REVIEW AND PROSPECTS
The Group continues to face risks relating to its ability to attract, retain, and develop high calibre talent, as a result of challenges arising from ongoing regulatory and public interest in remuneration practices. In addition there is uncertainty from EU state aid requirements and Independent Commission on Banking proposals on banking reform.
The breadth of the strategic review programme is such that all parts of the Group are impacted to a degree. The risks associated with the programme, including implementation and delivery, are the subject of rigorous oversight by business areas and Risk Division, with challenges by Internal Audit, commensurate to the scale of the change. Customer treatment and how the Group manages its customer relationships affect all aspects of the Group’s operations and are closely aligned with achievement of the Group’s strategic aim – to be the best bank for customers. There is currently a high level of scrutiny regarding the treatment of customers by financial institutions from the press, politicians and regulatory bodies (see note 54 to the financial statements ‘Contingent Liabilities and Commitments’).
Regulatory exposure is driven by the significant volume of current legislation and regulation within the UK and overseas with which the Group has to comply, along with new or proposed legislation and regulation which needs to be reviewed, assessed and embedded into day-to-day operational and business practices across the Group as a whole. This is particularly the case in the current market environment, which is witnessing increased levels of government and regulatory intervention in the banking sector.
MEASUREMENT
Operational risks are measured against a set of risk appetite metrics, with appropriate limits and triggers, which have been approved by the Board.
MITIGATION
The Group’s operational risk management framework consists of the following key components:
|
|
|
|
– |
Identification and categorisation of the key operational risks facing a business area, including defining risk appetite. |
|
|
|
|
– |
Risk assessment, including impact assessment of financial and non-financial impacts (e.g. reputational risk) for each of the key risks to which the business area is exposed. |
|
|
|
|
– |
Control assessment, evaluating the effectiveness of the control framework covering each of the key risks to which the business area is exposed. |
|
|
|
|
– |
Loss and incident management, capturing actions to manage any losses facing a business area. |
|
|
|
|
– |
The development of Key Risk Indicators for management reporting, including the monitoring of risk appetite. |
|
|
|
|
– |
Oversight and assurance of the risk management framework in businesses. |
|
|
|
|
– |
Scenarios for estimation of potential loss exposures for material risks. |
|
|
|
|
– |
The Group purchases insurance to mitigate certain operational risk events. |
MONITORING
Business unit risk exposure is reported to Risk Division where it is aggregated at Group level and a report prepared. The report is discussed at the monthly Group Operational Risk Committee and Compliance & Conduct Committee. These committees can escalate matters to the Chief Risk Officer, or higher committees, if appropriate.
The insurance programme is monitored and reviewed regularly, with recommendations being made to the Group’s senior management annually prior to each renewal. Insurers are monitored on an ongoing basis, to ensure counterparty risk is minimised. A process is in place to manage any insurer rating changes or insolvencies.
The Group has adopted a formal approach to operational risk event escalation. This involves the identification of an event, an assessment of the materiality of the event in accordance with a risk event impact matrix and appropriate escalation.
129
OPERATING AND FINANCIAL REVIEW AND PROSPECTS
DEFINITION
The risk of reductions in earnings capital and/or value, through financial or reputational loss, due to fluctuations in the timing, frequency and severity of insured/underwritten events and to fluctuations in the timing and amount of claim settlements. This includes fluctuations in profits due to customer behaviour.
RISK APPETITE
Insurance risk appetite is defined with regard to the quantum and composition of insurance risk that exists currently in the Group and the Group’s risk preferences. It takes account of the need for each entity in the Group to maintain solvency in excess of the minimum level required by the entity’s jurisdictional legal or regulatory requirements.
The Group’s appetite for solvency and earnings in insurance entities is reviewed and approved annually by the Board.
EXPOSURES
The major sources of insurance risk within the Group are the insurance businesses and the Group’s defined benefit staff pension schemes. The nature of insurance business involves the accepting of insurance risks which relate primarily to mortality, longevity, morbidity, persistency, expenses, property damage and unemployment. The prime insurance risk of the Group’s staff pension schemes is related to longevity.
MEASUREMENT
Insurance risks are measured using a variety of techniques including stress and scenario testing; and, where appropriate, stochastic modelling. Current and potential future insurance risk exposures are assessed and aggregated using risk measures based on 1-in-2001 year stresses and other supporting measures where appropriate, including those set out in notes 38 and 39 to the financial statements.
MITIGATION
A key element of the control framework is the consideration of insurance risk by a suitable combination of high level Committees/Boards. For the life assurance businesses the key control bodies are the Board of Scottish Widows Group Limited (SWG) with the more significant risks also being subject to review by the Group Executive Committee and/or Board. For the general insurance businesses the key control bodies which are subsidiary entity Boards of SWG are the Boards of the legal entities including Lloyds TSB General Insurance Limited, St. Andrew’s Insurance plc and the Irish subsidiaries. All Group staff pension schemes issues are covered by the Group Asset and Liability Committee and the Group Risk Committee.
The overall insurance risk is mitigated through pooling and through diversification across large numbers of individuals, geographical areas, and different types of risk exposure.
Insurance risk is primarily controlled via the following processes:
|
|
|
|
– |
Underwriting (the process to ensure that new insurance proposals are properly assessed) |
|
|
|
|
– |
Pricing-to-risk (new insurance proposals are priced to cover the underlying risks inherent within the products) |
|
|
|
|
– |
Claims management |
|
|
|
|
– |
Product design |
|
|
|
|
– |
Policy wording |
|
|
|
|
– |
Product management |
|
|
|
|
– |
The use of reinsurance or other risk mitigation techniques. |
In
addition, exposure limits by risk type are derived from the business planning
process and used as a control mechanism to ensure risks are taken within
solvency risk appetite.
At all times, close attention is paid to the adequacy
of reserves, solvency management and regulatory requirements.
The most significant insurance risks in the life assurance companies are longevity risk and persistency risk. The merits of longevity risk transfer and hedging solutions are regularly reviewed.
General insurance exposure to accumulations of risk and possible catastrophes is mitigated by reinsurance arrangements which are broadly spread over different reinsurers. Detailed modelling, including that of the potential losses under various catastrophe scenarios, supports the choice of reinsurance arrangements. Appropriate reinsurance arrangements also apply within the life and pensions businesses with significant mortality risk and morbidity risk being transferred to chosen reinsurers.
Options and
guarantees are incorporated in new insurance products only after careful
consideration of the risk management issues that they present.
In respect of
insurance risks in the staff pension schemes, the Group ensures that effective
communication mechanisms are in place for consultation with the trustees to
assist with the management of risk in line with the Group’s risk appetite.
MONITORING
Ongoing monitoring is in place to track the progression of insurance risks. This normally involves monitoring relevant experiences against expectations (for example claims experience, option take up rates, persistency experience, expenses, non-disclosure at the point of sale), as well as evaluating the effectiveness of controls put in place to manage insurance risk. Reasons for any significant divergence from experience are investigated and remedial action is taken.
|
|
|
|
|
|
||
|
1 |
Group pension schemes utilise 1 in 20 year stresses |
|
130
OPERATING AND FINANCIAL REVIEW AND PROSPECTS
DEFINITION
Business risk is defined as the risk that the Group’s earnings are adversely impacted by a sub optimal business strategy or the sub optimal implementation of the strategy. In assessing business risk, consideration is given to internal and external factors.
RISK APPETITE
Business risk appetite is encapsulated in the Group’s budget and medium-term plan, which are sanctioned by the Board on an annual basis. Divisions’ and business units’ plans are aligned to the Group’s overall business risk appetite.
EXPOSURES
The Group’s portfolio of businesses exposes it to a number of internal and external factors:
|
|
|
|
– |
internal factors: resource capability and availability, customer treatment, service level agreements, products and funding and the risk appetite of other risk categories; and |
|
|
|
|
– |
external factors: economic, technological, political, social and ethical, environmental, regulatory, market expectations, reputation and competitive behaviour. |
MEASUREMENT
An annual business planning process is conducted at roup, divisional and business unit level which includes a quantitative and qualitative assessment of the risks that could impact the Group’s plans. Within the planning round, the Group conducts both scenario analysis and stress tests to assess risks to future earning streams. Stress testing and scenario analysis are fully embedded in the Group’s risk management practice. The Group assesses a wide array of scenarios including economic recessions, regulatory action scenarios, scenarios specific to the operations of each part of the business, as well as reverse stress tests.
MITIGATION
As part of the annual business planning process, the Group develops a set of management actions to prevent or mitigate the impact on earnings in the event that business risks materialise. Additionally, business risk monitoring, through regular reports and oversight, results in corrective actions to plans and reductions in exposures where necessary.
Revenue and capital investment decisions require additional formal assessment and approval. Formal risk assessment is conducted as part of the financial approval process. Significant mergers and acquisitions by business units require specific approval by the Board. In addition to the standard due diligence conducted during a merger or acquisition, Risk Division conducts, where appropriate, an independent risk assessment of the target company.
MONITORING
The Group’s strategy is reviewed and approved by the Board, which includes the Group Executive Committee and the Group Risk Committee. Regular reports are provided to the Group Executive Committee and the Board on the progress of the Group’s key strategies and plans, including assessment of performance against Risk Appetite.
131
OPERATING AND FINANCIAL REVIEW AND PROSPECTS
INVESTMENT PORTFOLIO, MATURITIES, DEPOSITS, SHORT-TERM BORROWINGS
Trading securities and other financial assets at fair value through profit or loss; available-for-sale financial assets; held-to-maturity investments; and debt securities classified as loans and receivables
The following table sets out the book values and valuations of the Group’s debt securities, treasury and other bills and equity shares at 31 December for each of the three years indicated.
|
|
|
|
|
|
|
|
|
|
|
|
|
|
|
|
|
|
|
|
|
|
(unaudited) |
|
2011 |
|
2011 |
|
2010 |
|
2010 |
|
2009 |
|
2009 |
|
||||||
|
Trading securities and other financial assets at fair value through profit or loss |
|
|
|
|
|
|
|
|
|
|
|
|
|
|
|
|
|
|
|
|
US treasury and US government agencies |
|
|
1,506 |
|
|
1,506 |
|
|
977 |
|
|
977 |
|
|
482 |
|
|
482 |
|
|
Other government securities |
|
|
21,861 |
|
|
21,861 |
|
|
22,863 |
|
|
22,863 |
|
|
19,479 |
|
|
19,479 |
|
|
Other public sector securities |
|
|
1,183 |
|
|
1,183 |
|
|
919 |
|
|
919 |
|
|
706 |
|
|
706 |
|
|
Bank and building society certificates of deposit |
|
|
3,248 |
|
|
3,248 |
|
|
4,298 |
|
|
4,298 |
|
|
2,034 |
|
|
2,034 |
|
|
Mortgage-backed securities |
|
|
711 |
|
|
711 |
|
|
422 |
|
|
422 |
|
|
520 |
|
|
520 |
|
|
Other asset-backed securities |
|
|
1,986 |
|
|
1,986 |
|
|
2,612 |
|
|
2,612 |
|
|
2,890 |
|
|
2,890 |
|
|
Corporate and other debt securities |
|
|
21,858 |
|
|
21,858 |
|
|
21,109 |
|
|
21,109 |
|
|
20,668 |
|
|
20,668 |
|
|
Treasury bills and other bills |
|
|
299 |
|
|
299 |
|
|
227 |
|
|
227 |
|
|
— |
|
|
— |
|
|
Equity shares |
|
|
75,737 |
|
|
75,737 |
|
|
90,219 |
|
|
90,219 |
|
|
84,150 |
|
|
84,150 |
|
|
|
|
|
128,389 |
|
|
128,389 |
|
|
143,646 |
|
|
143,646 |
|
|
130,929 |
|
|
130,929 |
|
|
Available-for-sale financial assets |
|
|
|
|
|
|
|
|
|
|
|
|
|
|
|
|
|
|
|
|
US treasury and US government agencies |
|
|
6,206 |
|
|
6,206 |
|
|
5,518 |
|
|
5,518 |
|
|
2,898 |
|
|
2,898 |
|
|
Other government securities |
|
|
19,030 |
|
|
19,030 |
|
|
7,034 |
|
|
7,034 |
|
|
5,771 |
|
|
5,771 |
|
|
Other public sector securities |
|
|
27 |
|
|
27 |
|
|
29 |
|
|
29 |
|
|
31 |
|
|
31 |
|
|
Bank and building society certificates of deposit |
|
|
366 |
|
|
366 |
|
|
407 |
|
|
407 |
|
|
1,014 |
|
|
1,014 |
|
|
Mortgage-backed securities |
|
|
1,803 |
|
|
1,803 |
|
|
4,293 |
|
|
4,293 |
|
|
4,781 |
|
|
4,781 |
|
|
Other asset-backed securities |
|
|
1,064 |
|
|
1,064 |
|
|
5,219 |
|
|
5,219 |
|
|
7,640 |
|
|
7,640 |
|
|
Corporate and other debt securities |
|
|
5,245 |
|
|
5,245 |
|
|
12,132 |
|
|
12,132 |
|
|
19,904 |
|
|
19,904 |
|
|
Treasury bills and other bills |
|
|
1,727 |
|
|
1,727 |
|
|
6,068 |
|
|
6,068 |
|
|
2,532 |
|
|
2,532 |
|
|
Equity shares |
|
|
1,938 |
|
|
1,938 |
|
|
2,255 |
|
|
2,255 |
|
|
2,031 |
|
|
2,031 |
|
|
|
|
|
37,406 |
|
|
37,406 |
|
|
42,955 |
|
|
42,955 |
|
|
46,602 |
|
|
46,602 |
|
|
Held-to-maturity investments |
|
|
|
|
|
|
|
|
|
|
|
|
|
|
|
|
|
|
|
|
US treasury and US government agencies |
|
|
1,562 |
|
|
1,562 |
|
|
1,579 |
|
|
1,489 |
|
|
— |
|
|
— |
|
|
Other government securities |
|
|
6,536 |
|
|
6,582 |
|
|
6,326 |
|
|
6,227 |
|
|
— |
|
|
— |
|
|
|
|
|
8,098 |
|
|
8,144 |
|
|
7,905 |
|
|
7,716 |
|
|
— |
|
|
— |
|
|
Debt securities classified as loans and receivables |
|
|
|
|
|
|
|
|
|
|
|
|
|
|
|
|
|
|
|
|
Mortgage-backed securities |
|
|
7,179 |
|
|
5,739 |
|
|
11,650 |
|
|
12,293 |
|
|
13,322 |
|
|
12,799 |
|
|
Other asset-backed securities |
|
|
5,030 |
|
|
4,781 |
|
|
12,827 |
|
|
13,092 |
|
|
17,137 |
|
|
15,998 |
|
|
Corporate and other debt securities |
|
|
537 |
|
|
433 |
|
|
1,816 |
|
|
1,552 |
|
|
2,623 |
|
|
3,110 |
|
|
|
|
|
12,746 |
|
|
10,953 |
|
|
26,293 |
|
|
26,937 |
|
|
33,082 |
|
|
31,907 |
|
|
Allowance for impairment losses |
|
|
(276 |
) |
|
— |
|
|
(558 |
) |
|
— |
|
|
(430 |
) |
|
— |
|
|
|
|
|
12,470 |
|
|
10,953 |
|
|
25,735 |
|
|
26,937 |
|
|
32,652 |
|
|
31,907 |
|
132
OPERATING AND FINANCIAL REVIEW AND PROSPECTS
MATURITIES AND WEIGHTED AVERAGE YIELDS OF INTEREST-BEARING SECURITIES
The weighted average yield for each range of maturities is calculated by dividing the annualised interest income prevailing at 31 December 2011 by the book value of securities held at that date.
|
|
|
|
|
|
|
|
|
|
|
|
|
|
|
|
|
|
|
|
|
|
|
|
|
|
|
|
|
|
Maturing within |
|
Maturing after one but |
|
Maturing after five but |
|
Maturing after |
|
||||||||||||||||
|
|
|
|
|
|
|||||||||||||||||||||
|
(unaudited) |
|
Amount |
|
Yield |
|
Amount |
|
Yield |
|
Amount |
|
Yield |
|
Amount |
|
Yield |
|
||||||||
|
Trading securities and other financial assets at fair value through profit or loss |
|
|
|
|
|
|
|
|
|
|
|
|
|
|
|
|
|
|
|
|
|
|
|
|
|
|
US treasury and US government agencies |
|
|
105 |
|
|
2.4 |
|
|
888 |
|
|
1.3 |
|
|
235 |
|
|
2.6 |
|
|
278 |
|
|
3.1 |
|
|
Other government securities |
|
|
2,862 |
|
|
3.9 |
|
|
3,462 |
|
|
2.5 |
|
|
3,490 |
|
|
2.9 |
|
|
12,047 |
|
|
3.1 |
|
|
Other public sector securities |
|
|
133 |
|
|
4.6 |
|
|
276 |
|
|
3.7 |
|
|
225 |
|
|
4.5 |
|
|
549 |
|
|
4.3 |
|
|
Bank and building society certificates of deposit |
|
|
3,248 |
|
|
2.8 |
|
|
— |
|
|
— |
|
|
— |
|
|
— |
|
|
— |
|
|
— |
|
|
Mortgage-backed securities |
|
|
1 |
|
|
2.5 |
|
|
4 |
|
|
2.3 |
|
|
39 |
|
|
4.7 |
|
|
667 |
|
|
3.9 |
|
|
Other asset-backed securities |
|
|
6 |
|
|
5.6 |
|
|
162 |
|
|
5.7 |
|
|
163 |
|
|
6.4 |
|
|
1,655 |
|
|
4.6 |
|
|
Corporate and other debt securities |
|
|
2,989 |
|
|
1.9 |
|
|
2,857 |
|
|
4.7 |
|
|
4,813 |
|
|
6.0 |
|
|
11,199 |
|
|
4.6 |
|
|
Treasury bills and other bills |
|
|
299 |
|
|
1.1 |
|
|
— |
|
|
— |
|
|
— |
|
|
— |
|
|
— |
|
|
— |
|
|
|
|
|
9,643 |
|
|
|
|
|
7,649 |
|
|
|
|
|
8,965 |
|
|
|
|
|
26,395 |
|
|
|
|
|
Available-for-sale financial assets |
|
|
|
|
|
|
|
|
|
|
|
|
|
|
|
|
|
|
|
|
|
|
|
|
|
|
US treasury and US government agencies |
|
|
6 |
|
|
2.5 |
|
|
1,210 |
|
|
2.2 |
|
|
3,494 |
|
|
3.0 |
|
|
1,496 |
|
|
4.4 |
|
|
Other government securities |
|
|
75 |
|
|
5.0 |
|
|
733 |
|
|
3.2 |
|
|
11,033 |
|
|
3.8 |
|
|
7,189 |
|
|
3.5 |
|
|
Other public sector securities |
|
|
27 |
|
|
8.9 |
|
|
— |
|
|
— |
|
|
— |
|
|
— |
|
|
— |
|
|
— |
|
|
Bank and building society certificates of deposit |
|
|
366 |
|
|
16.0 |
|
|
— |
|
|
— |
|
|
— |
|
|
— |
|
|
— |
|
|
— |
|
|
Mortgage-backed securities |
|
|
77 |
|
|
1.1 |
|
|
344 |
|
|
2.3 |
|
|
603 |
|
|
2.5 |
|
|
779 |
|
|
2.2 |
|
|
Other asset-backed securities |
|
|
99 |
|
|
0.7 |
|
|
836 |
|
|
1.2 |
|
|
74 |
|
|
1.8 |
|
|
55 |
|
|
0.5 |
|
|
Corporate and other debt securities |
|
|
971 |
|
|
1.6 |
|
|
3,225 |
|
|
3.0 |
|
|
917 |
|
|
4.3 |
|
|
132 |
|
|
2.6 |
|
|
Treasury bills and other bills |
|
|
1,727 |
|
|
0.4 |
|
|
— |
|
|
— |
|
|
— |
|
|
— |
|
|
— |
|
|
— |
|
|
|
|
|
3,348 |
|
|
|
|
|
6,348 |
|
|
|
|
|
16,121 |
|
|
|
|
|
9,651 |
|
|
|
|
|
Held-to-maturity investments |
|
|
|
|
|
|
|
|
|
|
|
|
|
|
|
|
|
|
|
|
|
|
|
|
|
|
US treasury and US government agencies |
|
|
19 |
|
|
— |
|
|
340 |
|
|
2.4 |
|
|
527 |
|
|
3.3 |
|
|
676 |
|
|
3.6 |
|
|
Other government securities |
|
|
77 |
|
|
— |
|
|
— |
|
|
— |
|
|
5,460 |
|
|
6.5 |
|
|
999 |
|
|
3.9 |
|
|
|
|
|
96 |
|
|
— |
|
|
340 |
|
|
|
|
|
5,987 |
|
|
|
|
|
1,675 |
|
|
|
|
|
Debt securities classified as loans and receivables |
|
|
|
|
|
|
|
|
|
|
|
|
|
|
|
|
|
|
|
|
|
|
|
|
|
|
Mortgage-backed securities |
|
|
1 |
|
|
— |
|
|
505 |
|
|
2.7 |
|
|
700 |
|
|
2.3 |
|
|
5,973 |
|
|
0.9 |
|
|
Other asset-backed securities |
|
|
7 |
|
|
— |
|
|
26 |
|
|
2.7 |
|
|
631 |
|
|
3.3 |
|
|
4,366 |
|
|
1.0 |
|
|
Corporate and other debt securities |
|
|
98 |
|
|
— |
|
|
193 |
|
|
1.2 |
|
|
67 |
|
|
6.0 |
|
|
179 |
|
|
3.2 |
|
|
|
|
|
106 |
|
|
|
|
|
724 |
|
|
|
|
|
1,398 |
|
|
|
|
|
10,518 |
|
|
|
|
The Group’s investment holdings at 31 December 2011 include £43,356 million due from the UK government and its agencies and £9,274 million due from the US government and its agencies.
133
OPERATING AND FINANCIAL REVIEW AND PROSPECTS
MATURITY ANALYSIS AND INTEREST RATE SENSITIVITY OF LOANS AND ADVANCES TO CUSTOMERS AND BANKS AS AT 31 DECEMBER 2011
The
following table analyses the maturity profile and interest rate sensitivity of
loans by type on a contractual repayment basis as at 31 December 2011.
All
amounts are before deduction of impairment allowances. Demand loans are
included in the ‘maturing in one year or less’ category.
|
|
|
|
|
|
|
|
|
|
|
|
|
|
|
|
(unaudited) |
|
Maturing in one |
|
Maturing after |
|
Maturing after |
|
Total |
|
||||
|
Domestic |
|
|
|
|
|
|
|
|
|
|
|
|
|
|
Loans and advances to banks |
|
|
27,755 |
|
|
3,640 |
|
|
457 |
|
|
31,852 |
|
|
Loans and advances to customers: |
|
|
|
|
|
|
|
|
|
|
|
|
|
|
– Mortgages |
|
|
5,657 |
|
|
27,097 |
|
|
298,961 |
|
|
331,715 |
|
|
– Other personal lending |
|
|
18,536 |
|
|
8,586 |
|
|
1,122 |
|
|
28,244 |
|
|
– Property companies |
|
|
13,222 |
|
|
17,647 |
|
|
18,692 |
|
|
49,561 |
|
|
– Financial, business and other services |
|
|
32,398 |
|
|
14,700 |
|
|
9,623 |
|
|
56,721 |
|
|
– Transport, distribution and hotels |
|
|
8,974 |
|
|
11,469 |
|
|
6,789 |
|
|
27,232 |
|
|
– Manufacturing |
|
|
3,977 |
|
|
3,000 |
|
|
1,078 |
|
|
8,055 |
|
|
– Other |
|
|
7,632 |
|
|
9,905 |
|
|
10,567 |
|
|
28,104 |
|
|
Total domestic |
|
|
118,151 |
|
|
96,044 |
|
|
347,289 |
|
|
561,484 |
|
|
Foreign |
|
|
19,490 |
|
|
17,025 |
|
|
18,991 |
|
|
55,506 |
|
|
Total loans |
|
|
137,641 |
|
|
113,069 |
|
|
366,280 |
|
|
616,990 |
|
|
Of which: |
|
|
|
|
|
|
|
|
|
|
|
|
|
|
– Fixed interest rate |
|
|
42,128 |
|
|
29,984 |
|
|
85,411 |
|
|
157,523 |
|
|
– Variable interest rate |
|
|
95,513 |
|
|
83,085 |
|
|
280,869 |
|
|
459,467 |
|
134
OPERATING AND FINANCIAL REVIEW AND PROSPECTS
DEPOSITS
The following tables show the details of the Group’s average customer deposits in each of the past three years.
|
|
|
|
|
|
|
|
|
|
|
|
|
|
|
|
|
|
|
|
|
|
(unaudited) |
|
2011 |
|
2011 |
|
2010 |
1 |
2010 |
|
2009 |
1 |
2009 |
|
||||||
|
Non-interest bearing demand deposits |
|
|
31,519 |
|
|
— |
|
|
19,403 |
|
|
— |
|
|
6,902 |
|
|
— |
|
|
Interest-bearing demand deposits |
|
|
71,527 |
|
|
0.50 |
|
|
67,994 |
|
|
0.58 |
|
|
78,571 |
|
|
0.50 |
|
|
Savings deposits |
|
|
247,062 |
|
|
2.03 |
|
|
241,145 |
|
|
1.67 |
|
|
234,273 |
|
|
1.19 |
|
|
Time deposits |
|
|
46,829 |
|
|
1.50 |
|
|
34,999 |
|
|
2.73 |
|
|
28,448 |
|
|
4.30 |
|
|
Total average deposits |
|
|
396,937 |
|
|
1.53 |
|
|
363,541 |
|
|
1.48 |
|
|
348,194 |
|
|
1.27 |
|
|
|
|
|
|
|
|
|
|
|
|
|
|
|
|
|
|
|
|
|
|
|
|
1 |
During 2011 the Group has revised its treatment of offset accounts; average balances for 2010 and 2009 have been restated accordingly. |
|
|
|
|
|
|
|
|
|
|
|
|
|
|
|
|
|
|
|
|
|
|
The analysis of the Group’s average customer deposits between domestic and foreign offices is as follows: |
|||||||||||||||||||
|
|
|
|
|
|
|
|
|
|
|
|
|
|
|
|
|
|
|
|
|
|
|
|
Domestic |
|
Foreign |
|
Total |
|
||||||||||||
|
|
|
|
|
||||||||||||||||
|
(unaudited) |
|
Average |
|
Average |
|
Average |
|
Average |
|
Average |
|
Average |
|
||||||
|
Non-interest bearing demand deposits |
|
|
30,606 |
|
|
— |
|
|
913 |
|
|
— |
|
|
31,519 |
|
|
— |
|
|
Interest-bearing demand deposits |
|
|
70,579 |
|
|
0.50 |
|
|
948 |
|
|
0.11 |
|
|
71,527 |
|
|
0.50 |
|
|
Savings deposits |
|
|
236,518 |
|
|
2.01 |
|
|
10,544 |
|
|
2.54 |
|
|
247,062 |
|
|
2.03 |
|
|
Time deposits |
|
|
43,665 |
|
|
1.48 |
|
|
3,164 |
|
|
1.80 |
|
|
46,829 |
|
|
1.50 |
|
|
Total deposits |
|
|
381,368 |
|
|
1.51 |
|
|
15,569 |
|
|
2.09 |
|
|
396,937 |
|
|
1.53 |
|
|
|
|
|
|
|
|
|
|
|
|
|
|
|
|
|
|
|
|
|
|
|
|
|
Domestic |
|
Foreign |
|
Total |
|
||||||||||||
|
|
|
|
|
||||||||||||||||
|
2010 |
|
Average |
|
Average |
|
Average |
|
Average |
|
Average |
|
Average |
|
||||||
|
Non-interest bearing demand deposits |
|
|
18,463 |
|
|
— |
|
|
940 |
|
|
— |
|
|
19,403 |
|
|
— |
|
|
Interest-bearing demand deposits |
|
|
67,004 |
|
|
0.59 |
|
|
990 |
|
|
0.10 |
|
|
67,994 |
|
|
0.58 |
|
|
Savings deposits |
|
|
237,629 |
|
|
1.67 |
|
|
3,516 |
|
|
1.71 |
|
|
241,145 |
|
|
1.67 |
|
|
Time deposits |
|
|
29,762 |
|
|
2.50 |
|
|
5,237 |
|
|
4.05 |
|
|
34,999 |
|
|
2.73 |
|
|
Total deposits |
|
|
352,858 |
|
|
1.45 |
|
|
10,683 |
|
|
2.56 |
|
|
363,541 |
|
|
1.48 |
|
|
|
|
|
|
|
|
|
|
|
|
|
|
|
|
|
|
|
|
|
|
|
|
|
Domestic |
|
Foreign |
|
Total |
|
||||||||||||
|
|
|
|
|
||||||||||||||||
|
2009 |
|
Average |
|
Average |
|
Average |
|
Average |
|
Average |
|
Average |
|
||||||
|
Non-interest bearing demand deposits |
|
|
6,253 |
|
|
— |
|
|
649 |
|
|
— |
|
|
6,902 |
|
|
— |
|
|
Interest-bearing demand deposits |
|
|
77,535 |
|
|
0.50 |
|
|
1,036 |
|
|
0.19 |
|
|
78,571 |
|
|
0.50 |
|
|
Savings deposits |
|
|
229,234 |
|
|
1.19 |
|
|
5,039 |
|
|
1.33 |
|
|
234,273 |
|
|
1.19 |
|
|
Time deposits |
|
|
26,909 |
|
|
4.22 |
|
|
1,539 |
|
|
5.59 |
|
|
28,448 |
|
|
4.30 |
|
|
Total deposits |
|
|
339,931 |
|
|
1.25 |
|
|
8,263 |
|
|
1.88 |
|
|
348,194 |
|
|
1.27 |
|
CERTIFICATES OF DEPOSIT AND OTHER TIME DEPOSITS
The following table gives details of the Group’s certificates of deposit issued and other time deposits as at 31 December 2011 individually in excess of US $100,000 (or equivalent in another currency) by time remaining to maturity.
|
|
|
|
|
|
|
|
|
|
|
|
|
|
|
|
|
|
|
(unaudited) |
|
3 months |
|
Over 3 months but |
|
Over 6 months |
|
Over |
|
Total |
|
|||||
|
Domestic |
|
|
|
|
|
|
|
|
|
|
|
|
|
|
|
|
|
Certificates of deposit |
|
|
9,318 |
|
|
1,740 |
|
|
1,499 |
|
|
112 |
|
|
12,669 |
|
|
Time deposits |
|
|
38,174 |
|
|
5,591 |
|
|
5,060 |
|
|
14,203 |
|
|
63,028 |
|
|
|
|
|
47,492 |
|
|
7,331 |
|
|
6,559 |
|
|
14,315 |
|
|
75,697 |
|
|
Foreign |
|
|
|
|
|
|
|
|
|
|
|
|
|
|
|
|
|
Certificates of deposit and other time deposits |
|
|
18,775 |
|
|
1,040 |
|
|
396 |
|
|
819 |
|
|
21,030 |
|
|
Total |
|
|
66,267 |
|
|
8,371 |
|
|
6,955 |
|
|
15,134 |
|
|
96,727 |
|
135
OPERATING AND FINANCIAL REVIEW AND PROSPECTS
SHORT-TERM BORROWINGS
Short-term
borrowings are included within the balance sheet captions ‘Deposits by banks’,
‘Customer accounts’ and ‘Debt securities in issue’ and are not identified
separately on the balance sheet. The short-term borrowings of the Group consist
of overdrafts from banks, securities sold under agreements to repurchase, notes
issued as part of lending securitisations, certificates of deposit issued,
commercial paper and promissory notes issued and other marketable paper.
Securities sold under agreements to repurchase, certificates of deposit issued,
commercial paper, securitisation notes and covered bonds are the only
significant short-term borrowings of the Group.
The following tables give
details of these significant short-term borrowings of the Group for each of the
past three years.
|
|
|
|
|
|
|
|
|
|
|
|
|
(unaudited) |
|
2011 |
|
2010 |
|
2009 |
|
|||
|
Liabilities in respect of securities sold under repurchase agreements |
|
|
|
|
|
|
|
|
|
|
|
Balance at the year end |
|
|
22,385 |
|
|
35,162 |
|
|
63,112 |
|
|
Average balance for the year |
|
|
24,108 |
|
|
63,188 |
|
|
84,684 |
|
|
Maximum balance during the year |
|
|
35,162 |
|
|
71,343 |
|
|
110,505 |
|
|
Average interest rate during the year |
|
|
1.4 |
% |
|
1.2 |
% |
|
2.0 |
% |
|
Interest rate at the year end |
|
|
0.9 |
% |
|
0.6 |
% |
|
0.5 |
% |
|
Certificates of deposit issued |
|
|
|
|
|
|
|
|
|
|
|
Balance at the year end |
|
|
27,994 |
|
|
42,276 |
|
|
50,858 |
|
|
Average balance for the year |
|
|
46,203 |
|
|
45,774 |
|
|
68,318 |
|
|
Maximum balance during the year |
|
|
52,966 |
|
|
77,734 |
|
|
111,761 |
|
|
Average interest rate during the year |
|
|
1.1 |
% |
|
1.0 |
% |
|
1.9 |
% |
|
Interest rate at the year end |
|
|
1.2 |
% |
|
0.9 |
% |
|
0.8 |
% |
|
Commercial paper |
|
|
|
|
|
|
|
|
|
|
|
Balance at the year end |
|
|
18,091 |
|
|
32,723 |
|
|
34,900 |
|
|
Average balance for the year |
|
|
29,182 |
|
|
34,769 |
|
|
36,137 |
|
|
Maximum balance during the year |
|
|
35,209 |
|
|
43,839 |
|
|
49,451 |
|
|
Average interest rate during the year |
|
|
0.6 |
% |
|
0.6 |
% |
|
0.8 |
% |
|
Interest rate at the year end |
|
|
0.6 |
% |
|
0.5 |
% |
|
0.8 |
% |
|
Securitisation notes |
|
|
|
|
|
|
|
|
|
|
|
Balance at the year end |
|
|
37,412 |
|
|
40,742 |
|
|
37,557 |
|
|
Average balance for the year |
|
|
35,378 |
|
|
42,387 |
|
|
43,869 |
|
|
Maximum balance during the year |
|
|
40,742 |
|
|
40,742 |
|
|
49,766 |
|
|
Average interest rate during the year |
|
|
2.9 |
% |
|
1.1 |
% |
|
1.7 |
% |
|
Interest rate at the year end |
|
|
2.3 |
% |
|
1.5 |
% |
|
1.4 |
% |
|
Covered bonds |
|
|
|
|
|
|
|
|
|
|
|
Balance at the year end |
|
|
38,196 |
|
|
32,150 |
|
|
27,311 |
|
|
Average balance for the year |
|
|
37,283 |
|
|
27,526 |
|
|
27,601 |
|
|
Maximum balance during the year |
|
|
40,033 |
|
|
32,150 |
|
|
29,408 |
|
|
Average interest rate during the year |
|
|
4.7 |
% |
|
5.5 |
% |
|
4.4 |
% |
|
Interest rate at the year end |
|
|
3.6 |
% |
|
3.8 |
% |
|
4.2 |
% |
136
DIRECTORS AND SENIOR MANAGEMENT
The Group is led by the Board comprising executive and non-executive directors with wide experience. The appointment of directors is considered by the Nomination and Governance Committee and approved by the Board and, following the provisions in the articles of association, they must stand for election by the shareholders at the first annual general meeting following their appointment and must retire, and may stand for re-election by the shareholders, at least every three years. Independent non-executive directors are appointed for three-year renewable terms, which may, in accordance with the articles of association, be terminated without notice or payment of compensation. However, in the interests of good corporate governance and in accordance with the provisions of the UK Corporate Governance Code, effective from 2012, the Board has decided that all of the directors will retire voluntarily and submit themselves for re-election at each annual general meeting, which took effect from 2011 onwards.
The Board meets regularly. In 2011 the Board had sixteen meetings, nine of which were scheduled at the start of the year. The much larger number of meetings than anticipated reflected the challenging environment, and the need to keep the Board informed of developments in a timely manner. It has a programme designed to enable the Directors regularly to review corporate strategy and the operations and results of the businesses and discharge their duties within a framework of prudent and effective controls relating to the assessing and managing of risk.
The roles of the Chairman, the Group Chief Executive and the Board and its governance arrangements, including the schedule of matters specifically reserved to the Board for decision, are reviewed annually. The matters reserved to the Board for decision include the approval of the annual report and accounts and any other financial statements; the payment of dividends; the long-term objectives of the Group; the strategies necessary to achieve these objectives; the Group’s budgets and plans; significant capital expenditure items; significant investments and disposals; the basis of allocation of capital within the Group; the organisation structure of the Group; the arrangements for ensuring that the Group manages risks effectively; any significant change in accounting policies or practices; the appointment of the Company’s main professional advisers and their fees; and the appointment of senior executives within the organisation and related succession planning.
According to the articles of association, the business and affairs of the Company are managed by the Directors, who have delegated to management the power to make decisions on operational matters, including those relating to credit, liquidity and market risk, within an agreed framework.
All Directors have access to the services of the Company Secretary, and independent professional advice is available to the Directors at the Group’s expense, where they judge it necessary to discharge their duties as directors.
The Chairman has a private discussion at least once a year with each Director on a wide range of issues affecting the Group, including any matters which the Directors, individually, wish to raise.
There is an induction programme for all new directors, which is tailored to their specific requirements and includes visits to individual businesses and meetings with senior management. Major shareholders are also offered the opportunity to meet new non-executive directors. Additional regular refresher training and information sessions to address current business or emerging issues are arranged by the Board.
The directors and senior management of Lloyds Banking Group plc are:
NON-EXECUTIVE DIRECTORS
Sir Winfried Bischoff¨¨†+
Chairman
Joined the Board and was appointed Chairman in September 2009. Previously Chairman of Citigroup Inc. from December 2007 to February 2009. He joined J Henry Schroder & Co in January 1966 and became Managing Director of Schroders Asia in 1971. Group Chief Executive of Schroders in 1984 and Chairman in 1995. Following the acquisition of Schroders’ investment banking business by Citigroup in 2000, became Chairman of Citigroup Europe before being appointed acting Chief Executive Officer of Citigroup in 2007 and subsequently as Chairman in the same year. A Non-Executive Director of Eli Lilly and Company, and The McGraw Hill Companies Inc. in the United States. He is a member of Akbank International Advisory Board and Chairman of the Advisory Council of TheCityUK. Aged 70.
Anita M Frew*+
Independent Director
Joined the Board in December 2010. Chairman of Victrex, the FTSE 250 global manufacturer of high performance polymers, having previously been the Senior Independent Director. Since 2000, she has held a portfolio of Non-Executive Directorships, currently holding positions as Senior Non-Executive Director of Aberdeen Asset Management and as Non-Executive Director of IMI. Prior to this she was Executive Director of Abbott Mead Vickers, Director of Corporate Development at WPP Group and a Non-Executive Director of Northumbrian Water and has held various investment and marketing roles at Scottish Provident and the Royal Bank of Scotland. Aged 54.
Sir Julian Horn-Smith¨†+
Independent Director (Until 17 May 2012)
Joined the Board in January 2005. Held a number of senior and general management appointments in Vodafone from 1984 to 2006 including a directorship of that company from 1996, Group Chief Operating Officer from 2001 and Deputy Chief Executive Officer from 2005. Previously held positions in Philips from 1978 to 1982 and Mars GB from 1982 to 1984. A Non-Executive Director of Acer Incorporated (Taiwan), De La Rue, Digicel Group and Emobile (Japan), a Director of Sky Malta, a member of the Altimo International Advisory Board and a senior adviser to UBS and CVC Capital Partners in relation to the global telecommunications sector. Deputy Chairman of BUMI. Pro Chancellor of University of Bath. A former Chairman of The Sage Group. Aged 63.
137
MANAGEMENT AND EMPLOYEES
Glen R Moreno¨
Deputy Chairman and Senior Independent Director (Until 17 May 2012)
Joined the Board in March 2010. Chairman of Pearson, the media group, since October 2005. Director of Fidelity International, one of the world’s largest fund management companies, and Chairman of its Audit Committee. Deputy Chairman of The Financial Reporting Council. From 1987 to 1991 was Chief Executive of Fidelity International. Until mid 2009, was a Non-Executive Director and Senior Independent Director of Man Group, a FTSE 100 financial services group, and acting Chairman of UKFI. Former Group Executive of Citigroup; from 1969 to 1987 he held a number of senior positions at the bank in Europe and Asia. Aged 68.
David L Roberts++*¨†
Independent Director (Deputy Chairman from 17 May 2012)
Joined the Board in March 2010. Executive Director, member of the Group Executive Committee and Chief Executive, International Retail and Commercial Banking at Barclays until December 2006. Joined Barclays in 1983 and held various senior management positions, including Chief Executive, Personal Financial Services, and Chief Executive, Business Banking. Was also a Non-Executive Director of BAA until June 2006 and a Non-Executive Director of Absa Group Limited, one of South Africa’s largest financial services groups, until October 2006. From 2007 to 2009 he was also the Chairman and Chief Executive of BAWAG P.S.K. AG, the second largest retail bank in Austria. Non-Executive Chairman of The Mind Gym. Aged 49.
T Timothy Ryan, Jr*†+
Independent Director
Joined the Board in March 2009. President and Chief Executive of the Securities Industry and Financial Markets Association. Held a number of senior appointments in JP Morgan Chase from 1993 to 2008 including Vice Chairman, financial institutions and governments, from 2005. A Director of the US-Japan Foundation, Great-West Life Insurance Co., Power Corporation of Canada and Power Financial Corporation and a member of the Global Markets Advisory Committee for the National Intelligence Council. A former Director in the Office of Thrift Supervision, US Department of the Treasury and Koram Bank and the International Foundation of Election Systems. Aged 66.
Martin A Scicluna**¨+
Independent Director
Joined the Board in September 2008. Chairman of Deloitte UK from 1995 to 2007 and a member of the Board from 1991 to 2007. Joined the firm in 1973 and was a partner from 1982 until he retired in 2008. A member of the Board of directors of Deloitte Touche Tohmatsu from 1999 to 2007. Chairman of Great Portland Estates. A Governor of Berkhamsted School. Aged 61.
Anthony Watson CBE††*¨
Independent Director (Senior Independent Director from 17 May 2012)
Joined the Board in April 2009. Previously Chief Executive of Hermes Pensions Management. Held a number of senior appointments in AMP Asset Management from 1991 to 1998. A Non-Executive Director of Hammerson, Vodafone and Witan Investment Trust, a member of the Norges Bank Investment Management Advisory Board and Chairman of Lincoln’s Inn Investment Committee. A former Chairman of MEPC, the Asian Infrastructure Fund and of the Strategic Investment Board (Northern Ireland) and a former member of the Financial Reporting Council. Aged 66.
Sara V Weller†+
Independent Director
Joined the Board on 1 February 2012. Between 2004 and 2011, Managing Director of Argos, the second biggest internet retailer in the UK. From January 2000 to April 2004, Marketing Director for Sainsbury’s Supermarkets, before being promoted to the position of Deputy Managing Director and serving on the Board of J Sainsbury from January 2003 to the end of March 2004. Retail Marketing Director for Abbey National from December 1996 to December 1999 and worked for Mars Confectionery from September 1983 to December 1996, rising to European Franchise Manager. Non-Executive Director of Mitchells & Butlers from April 2003 to January 2010. Non-Executive Director of United Utilities Group plc. Aged 50.
EXECUTIVE DIRECTORS
António Horta-Osório
Group Chief Executive
Joined the Board in January 2011 as an Executive Director and became Group Chief Executive in March 2011. Started his career at Citibank Portugal where he was head of capital markets. At the same time, was an assistant professor at Universidade Catolica Portuguesa. Then worked for Goldman Sachs in New York and London. In 1993, joined Grupo Santander as Chief Executive of Banco Santander de Negocios Portugal and then became Chief Executive Officer of Banco Santander Brazil. In 2000, became Chief Executive Officer of Santander Totta, and Chairman from 2006 until 2011, as well as Executive Vice President of Grupo Santander and a member of its Management Committee. Joined Santander UK, as a Non-Executive Director in November 2004 and from August 2006 until November 2010, was its Chief Executive. Formerly a Non-Executive Director of the Court of the Bank of England. A Non-Executive Director of Fundação Champalimaud in Portugal. Aged 48.
* Member of
the Audit Committee ** Chairman of the Audit Committee
¨ Member of the Nomination &
Governance Committee ¨¨ Chairman of the Nomination &
Governance Committee
† Member of the Remuneration Committee †† Chairman of
the Remuneration Committee
+ Member of the Risk Committee ++ Chairman of the Risk
Committee
138
MANAGEMENT AND EMPLOYEES
EMPLOYEES
As at 31
December 2011, the Group employed 98,538 people (on a full-time equivalent
basis), compared with 104,230 at 31 December 2010 and 107,144 at 31 December
2009. At 31 December 2011 95,421 employees were located in
the UK, 1,648 in
continental Europe, 426 in the
Americas, and 1,043 in the
rest of the world. At the same date, 46,702 people were employed in Retail,
7,689 in Wholesale, 5,075 in Commercial, 6,945 in Wealth and International,
6,896 in Insurance, 15,446 in Group Operations, and 9,785 in other functions.
The Group is committed to providing employment practices and policies which
recognise the diversity of its workforce and ensure equality for employees
regardless of sex, race, disability, age, sexual orientation or religious
belief.
In the UK, the Group belongs to the major employer groups campaigning
for equality for the above groups of staff, including Employers’ Forum on
Disability, Employers’ Forum on Age, Stonewall and the Race for Opportunity.
The Group’s involvement with these organisations enables it to identify and
implement best practice for its staff.
Employees are kept closely involved in
major changes affecting them through such measures as team meetings, briefings,
internal communications and opinion surveys. There are well established
procedures, including regular meetings with recognised unions, to ensure that
the views of employees are taken into account in reaching decisions.
Schemes
offering share options or the acquisition of shares are available for most
staff, to encourage their financial involvement in the Group. Further details
are given in Compensation.
The Group is committed to providing employees with comprehensive coverage of the economic and financial issues affecting the Group. The Group has established a full suite of communication channels, including an extensive face-to-face briefing programme which allows it to update its employees on its performance and any financial issues throughout the year.
The Group has a code of business conduct which applies to all employees. The code as amended from time to time is available to the public on the Company’s website at www.lloydsbankinggroup.com in About Us/Corporate Governance.
MEETINGS WITH SHAREHOLDERS
In order to develop an understanding of the views of major shareholders, the Board receives regular reports from the Group Finance Director, or the person acting in that capacity, and the Director of Investor Relations.
The Chairman, the Group Chief Executive and the Group Finance Director, or the person acting in that capacity, also have meetings with representatives of major shareholders and the senior independent director also attends some of these meetings. In addition, all directors are invited to attend investment analysts’ and stockbrokers’ briefings on the financial results.
All shareholders are encouraged to attend and participate in the Group’s annual general meeting.
139
GOVERNANCE AND RISK MANAGEMENT
An essential component of the approach to remuneration is the governance process that underpins it. This ensures that the policy is robustly applied and risk is managed appropriately.
The overarching purpose of the Remuneration Committee is to consider, agree and recommend to the board an overall remuneration policy and philosophy for the Group that is defined by, supports and is closely aligned to its long-term business strategy, business objectives, risk appetite and values and recognises the interests of relevant stakeholders. The Group has a conservative business model characterised by a risk culture founded on prudence and accountability. The remuneration policy and philosophy covers the whole Group, but the Committee pays particular attention to the top management population, including the highest paid employees in each division, those colleagues who perform significant influence functions for the Group and those who could have a material impact on the Group’s risk profile. The Committee’s role is to ensure that these colleagues are provided with appropriate incentives and reward to encourage them to enhance the performance of the Group and that they are recognised for their individual contribution to the success of the organisation, whilst ensuring that there is no reward for excessive risk taking. The Committee works closely with the Risk Committee in ensuring the bonus pool is moderated. The two Committees meet every year to determine whether the proposed bonus pool and performance assessments adequately reflected the risk appetite and framework of the Group; whether it took account of current and future risks; and whether any further adjustment is required or merited. The Group is also determined to ensure that the aggregate of the variable remuneration for all its colleagues is appropriate and balanced with the interests of shareholders and all other stakeholders.
The Committee determines the pensions policy for the Group and advises on other major changes to employee benefits schemes. It also agrees the policy for authorising claims for expenses from the Group Chief Executive and the Chairman. It has delegated power for settling remuneration for the Chairman, the Group Executive Directors, the Company Secretary and any group employee whose salary and annual bonus exceeds a specified amount, currently £750,000. To ensure compliance with the FSA Code of Practice, the Committee approves remuneration for Code Staff and that of senior risk and compliance officers.
The Committee monitors the application of the authority delegated to the Group Chief Executive who in turn delegates to the Group Executive Committee, the Executive Compensation Committee and the divisional Remuneration Committees, to ensure that policies and principles are being fairly and consistently applied. The Committee liaises closely with the Risk Committee and the risk function in relation to risk-adjusted performance measures, including consideration of both current and future risk. Together the management of remuneration and risk form an integral part of the Board’s determination of Group corporate strategy.
All the independent Non-Executive Directors are invited to attend meetings and have the opportunity to comment on proposals and have their views taken into account before the Committee’s decisions are implemented.
The Committee’s terms of reference are available from the Company Secretary and are displayed on the Group’s website, www.lloydsbankinggroup. com. These terms were last updated in March 2011 to ensure continued compliance with the FSA Code.
The members of the Committee during 2011 were as follows:
|
|
|
|
– |
Anthony Watson (chairman) |
|
|
|
|
– |
Sir Winfried Bischoff |
|
|
|
|
– |
Sir Julian Horn-Smith |
|
|
|
|
– |
Lord Leitch |
|
|
|
|
– |
David Roberts (also chairman of the Risk Committee) |
|
|
|
|
– |
Tim Ryan |
During 2011, the Committee met 12 times and considered the following principal matters:
|
|
|
|
– |
Review of remuneration arrangements for senior executives |
|
|
|
|
– |
Determination of the appropriate remuneration packages for a number of senior new hires |
|
|
|
|
– |
Determination of bonus pools based on Group performance and adjustment for risk |
|
|
|
|
– |
Performance conditions for the Long Term Incentive Plan |
|
|
|
|
– |
Bonus and salary awards for Executive Directors and key senior managers |
|
|
|
|
– |
Approval of remuneration and terms of service that fall within the Committee’s terms of reference, including new appointments |
|
|
|
|
– |
Feedback from the Remuneration Committee Chairman on his meetings with the FSA and shareholders |
The Group thanks all committee members for their commitment during the last year and attendance at meetings.
The Committee appoints independent consultants to provide advice on specific matters according to their particular expertise. During the year, Deloitte LLP advised the Committee. Deloitte has voluntarily signed up to the Remuneration Consultants’ Code of Conduct and are judged by the Committee to be independent. Deloitte’s fees for 2011 amounted to £350,000.
During
2011, Deloitte provided information on behalf of the Committee for the testing
of TSR performance conditions for the Group’s long-term incentive plans
(calculated by reference to both dividends and growth in share price).
Eric
Daniels (until 28 February 2011), António Horta-Osório (from 1 March 2011),
Angie Risley (Group HR Director) and Liz Jackson (HR Director, Reward) provided
guidance to the Committee (other than for their own remuneration). Juan
Colombás (Chief Risk Officer) and Tim Tookey (Group Finance Director) also
attended the Committee to advise as and when necessary on risk and financial
matters.
140
COMPENSATION
DIRECTORS’ REMUNERATION POLICY
The Group’s remuneration policy continues to support its business values and strategy, based on building long-term relationships with its customers and employees and managing the financial consequences of its business decisions across the entire economic cycle.
The Group’s
policy is intended to ensure that its remuneration offer is both cost effective
and enables us to attract and retain Executive Directors and senior management
of the highest calibre, motivating them to perform to the highest standards.
The Group’s objective is to align individual reward with the Group’s
performance, the interests of its shareholders, and a prudent approach to risk
management. In this way the Group balances the requirements of its various
stakeholders: its customers, shareholders, employees, and regulators. This
approach is in line with the Association of British Insurers best practice code
on remuneration and the FSA Remuneration Code of Practice, as the policy seeks
to reward long-term value creation whilst not encouraging excessive risk
taking.
The Group’s overall policy objective is met by a focus on the particular aspects detailed below.
|
|
|
|
|
Policy objective |
|
How achieved |
|
Building long-term relationships |
|
The Group builds relationships with its customers and people. Working for Lloyds Banking Group is about more than pay. The Group’s relationship with its people means that it wants to pay them fairly and competitively, but its pay is positioned conservatively against the market and it does not seek to align with the highest payers in the sector. In setting pay for Executive Directors and senior managers, it takes account of relative pay positioning and target levels of variable remuneration opportunity for all levels of employees in the Group. The Group’s incentive measures are not just financial. The Group’s Balanced Scorecards, which all of its senior executives have as part of their objectives for the year, include objectives that cover effective risk management, lending to Corporates including SMEs and retail customers, performance against targets that measure how satisfied its customers are and the extent to which its employees feel engaged with and committed to working for Lloyds Banking Group. |
|
Managing the financial consequences of the Group’s business through the economic cycle |
|
Economic profit is a key measure by which the Group manages its business. This measure takes into account the level of capital required to generate profits as well as the risks taken. The same level of profit generated at lower risk results in higher economic profit. Economic profit also measures risk based on an assessment of how the business will perform through the economic cycle and is a key measure for short term incentives. For example, in good times, when default rates on loans are low, the Group adjusts the economic profit measure downwards based on a higher average expected default experience over the economic cycle. This encourages us to avoid business and funding strategies that are only profitable during boom times but turn bad in a recession. Economic profit plays a prominent role in its incentive plans for executives, with its inclusion in both the annual and LTIP performance measures. |
|
Aligning individual rewards with Group performance and shareholders |
|
The Group’s executives’ annual incentives are based on stretching performance objectives and targets in the Group Balanced Scorecard. This Balanced Scorecard is derived from the Medium Term Plan which defines the financial and non-financial targets within its agreed risk appetite over a three year period. Any annual bonus for Executive Directors is deferred into shares and released over time, helping to increase alignment with shareholders. These deferrals are subject to malus in the event of unsustainable performance. Executives are also aligned with shareholders through the LTIP, which pays out in shares based on performance against Group financial targets over a three year period. In addition to purely financial metrics of Economic Profit and Total Shareholder Return, the performance conditions for the 2012 LTIP will comprise measures linked to the Strategic Review that reflect the wider Group objectives. These measures are short-term funding as a percentage of total funding, non-core assets at the end of 2014, run-rate simplification benefits achieved at the end of 2014 and customer satisfaction. The Group operates tough contract provisions relative to market practice, whereby no executive has an entitlement to more than 12 months’ notice (not taking into account recruitment provisions), pay in lieu of notice is limited to basic salary, is paid monthly over 12 months and is mitigated if the executive gets another job. This approach avoids the risk of payment for failure. |
|
A prudent approach to risk management |
|
The Group also has non-financial measures of performance against risk objectives in both the annual and long-term plans for executives. For the 2011 annual incentive plan the Group continues to align the award to long-term prudent risk management by deferring 100 per cent of the award for Executive Directors, which is subject to malus. Executive Directors are also required to retain any shares vesting from LTIP awards for a further 2 years, after allowing for tax and national insurance requirements. For other employees, the immediate cash bonus award is limited to £2,000 with a percentage of larger bonuses being subject to deferral and malus. If the performance is unsustainable during the deferral period some or all of the award may be forfeited. The Group has a robust governance framework with an independent Remuneration Committee reviewing all compensation decisions for senior executives. This approach to governance and review is cascaded through the organisation. The Group also ensures that all control function employees are assessed and their remuneration determined jointly by the relevant business Director and the control function Director. Senior risk and compliance officers are also reviewed by the Remuneration Committee. |
|
Cost effective packages to attract and retain executives |
|
The Group aims to ensure that the totality of remuneration for Executive Directors is competitive against its benchmark groups. These groups are other major UK banks and the top 20 companies in the FTSE 100, reflecting practices in large UK companies across all sectors. The Group aims to be competitively but conservatively positioned against the market. The Group selects incentive plan targets that are directly linked to the business strategy and priorities, ensuring alignment with company performance, targets that are meaningful to executives and incentive packages that are valued by executives and cost effective. |
141
COMPENSATION
SUMMARY
Following extensive consultation with shareholders, the Remuneration Committee is proposing a package for Executive Directors for 2012 that is closely based on the structure and principles applied in previous years as follows:
|
|
|
|
|
|
|
Element |
|
Level/design for 2012 |
|
Key purpose |
|
Base salary |
|
Base
pay should be set relative to FTSE 20 and banking sector competitors |
|
To provide the basis for a competitive package |
|
Pension |
|
Defined contribution pension provision for new entrants |
|
Enable executives to build long-term retirement savings Retention |
|
Annual incentive |
|
200
per cent of salary maximum (225 per cent for the Group Chief Executive) |
|
Alignment with Group performance Motivation of executives Pay for performance Alignment with sound risk management |
|
Long-term incentive plan |
|
Annual awards of 275 per cent of salary for the Group Chief Executive and 225 per cent for other Executive Directors. Vesting based on financial measures comprising Absolute Total Shareholder Return, Economic Profit and strategic financial objectives. Details of the performance conditions are as follows: |
|
Motivation and retention of executives Alignment with sound risk management Alignment with long-term shareholder interests |
|
|
|
|
|
|
|
|
|
Measure |
|
Basis |
|
Metric |
|
Weighting |
|
Economic Profit |
|
Payout range set relative to 2014 targets |
|
Threshold:
£160 million |
|
30% |
|
|
||||||
|
Absolute TSR |
|
Growth in share price including dividends |
|
Threshold:
12% per annum |
|
30% |
|
|
||||||
|
Short term funding as % of total funding |
|
Payout range set relative to 2014 targets |
|
Threshold:
20% |
|
10% |
|
|
||||||
|
Non-core assets at end of 2014 |
|
|
|
Threshold:
<= £95 billion |
|
10% |
|
|
||||||
|
Net simplification benefits (run rate achieved at 2014 year-end) |
|
|
|
Threshold:
£1.5 billion |
|
10% |
|
|
||||||
|
Customer satisfaction (FSA reportable complaints per 1,000 customers over 3 years) |
|
|
|
Threshold:
1.5 |
|
10% |
142
COMPENSATION
BASE SALARY
Base salaries are reviewed annually, taking into account individual performance and market information (which is provided by Towers Watson and supplemented with information from Deloitte LLP) and normally adjusted from 1 January of the relevant year. The remuneration committee confirmed during the 2011 review that the FTSE remains the most appropriate comparator group to use to benchmark overall competitiveness of the remuneration package whilst taking particular account of the remuneration practice of direct competitors, namely the major UK banks.
No increase to salaries will be made in 2012.
|
|
|
|
|
|
|
|
|
|
|
|
|
Name |
|
|
A Horta-Osório |
|
|
G T Tate |
|
|
T J W Tookey |
|
|
At 1 January 2012 |
|
|
£1,061,000 |
|
|
£656,000 |
|
|
£615,000 |
|
|
At 1 January 2011 |
|
|
£1,061,000 |
1 |
|
£656,000 |
|
|
£615,000 |
|
|
|
|
|
1 |
With effect from 17 January 2011. |
ANNUAL INCENTIVE PLAN
The annual incentive scheme for Executive Directors is designed to reflect specific goals linked to the performance of the business.
Incentive awards for Executive Directors are based upon individual contribution and overall corporate results. Incentive opportunity is driven by corporate performance based on profit before tax and economic profit, together with divisional achievement and individual performance. Individual targets relevant to improving overall business performance are contained in a Balanced Scorecard and are grouped under the following headings:
|
|
|
|
– |
Financial |
|
|
|
|
– |
Building the Business |
|
|
|
|
– |
Customer Service |
|
|
|
|
– |
Risk |
|
|
|
|
– |
People Development |
These targets apply differently for the Executive Directors, reflecting differing strategic priorities. The non-financial measures include key performance indicators relating to risk management, SME lending, process efficiency, service quality and employee engagement.
The remuneration committee believes that the structure of the incentive – in particular the use of risk-adjusted and non-financial measures – has been highly successful in promoting a long-term focus within the senior management team.
The maximum annual incentive opportunity is 200 per cent (225 per cent for the Group Chief Executive) of base salary for the achievement of exceptional performance targets.
Consistent with the aim of ensuring that short-term financial results are only rewarded if they promote sustainable growth, the 2011 annual incentive is subject to deferral in shares until at least 2014. This deferred amount is subject to malus if the performance that generated the incentive is found to be unsustainable.
The committee reserves the right to exercise its discretion in reducing any payment that otherwise would have been earned, if they deem this appropriate.
The calculation of the annual incentive plan outcomes for Executive Directors, based on the achievement of performance against targets in respect of performance in 2011, has been vigorously discussed by the Remuneration Committee. Mr Horta-Osório advised the Board that he did not wish to be considered for a bonus in respect of the 2011 performance year. The bonuses awarded to directors are shown in the table below:
|
|
|
|
|
|
|
|
|
|
|
|
|
Name |
|
|
A Horta-Osório |
|
|
G T Tate |
|
|
T J W Tookey |
|
|
Maximum Opportunity |
|
|
225 |
% |
|
200 |
% |
|
200 |
% |
|
% awarded for 2011 |
|
|
Declined bonus |
|
|
53 |
% |
|
20 |
% |
|
Bonus awarded for 2011 |
|
|
— |
|
|
£345,000 |
|
|
£120,000 |
|
143
COMPENSATION
LONG-TERM INCENTIVE AWARD
The current LTIP rules allow for awards to be made of up to 400 per cent of base salary. Under normal circumstances, awards can be made of up to 300 per cent of salary with the additional 100 per cent available for circumstances that the Remuneration Committee deems to be exceptional. In 2011, awards were made of up to 300 per cent of base salary to the Executive Directors and 420 per cent for the Group Chief Executive. The award for Mr Horta-Osório was made in order to facilitate his appointment as Group Chief Executive. In 2012, the committee intends to make an award of 275 per cent of salary to Mr Horta-Osório. Mr Tookey and Mr Tate are not eligible to receive an award following Mr Tookey’s resignation and Mr Tate’s retirement from the Group.
LONG-TERM INCENTIVE PERFORMANCE MEASURES
During 2011, the Committee has consulted widely with shareholders on the topic of performance measures and sharing the growth in the Company appropriately between shareholders and management. The Committee believes that the performance measures for the 2012 LTIP award for the Executive Committee should be Economic Profit, Absolute Total Shareholder Return and strategic financial measures. These measures capture risk measurement, profit growth and shareholder experience and align shareholder experience and management reward.
Details of current LTIP awards are provided on page 152.
PENSION
Executive directors may participate in the Group’s defined
contribution scheme (under which their pension entitlement will be based upon
both employer and employee contributions). Company contributions are 25 per
cent of salary, with the exception of António Horta-Osório who is eligible for
50 per cent of reference salary, including his flexible benefit allowance.
These can be taken as cash or pension contributions, or a mixture of each.
Details of pension contributions and accruals are shown on page 148.
OTHER SHARE PLANS
The Executive Directors are also eligible to participate in the Group’s ‘sharesave’ and ‘share incentive’ plans. These are ‘all-employee’ share plans.
SHAREHOLDING GUIDELINES
Directors are required to build up a holding in Lloyds Banking Group shares of value equal to 1.5 times gross salary (2 times gross salary for the Group Chief Executive) and expected to achieve these targets within 5 years of joining the Board. They are required to retain any shares vesting from the share price performance element of the 2010 LTIP and 2011 LTIP for a further two years post vesting. The Group Chief Executive is making significant progress in reaching this target.
CHAIRMAN’S REMUNERATION
The Chairman’s remuneration comprises salary and benefits. He does not participate in the annual bonus and long-term incentive arrangements, nor is he entitled to pension benefits.
The Chairman’s salary remained unchanged in 2011, at £700,000 per annum.
144
COMPENSATION
INDEPENDENT NON-EXECUTIVE DIRECTORS’ FEES
The fees of the Independent Non-Executive Directors are agreed by the Board within a total amount determined by the shareholders. Non-Executive Directors may also receive fees, agreed by the Board, for membership of Board Committees. The fees are designed to recognise the various responsibilities of a Non-Executive Director’s role and to attract individuals with relevant skills, knowledge and experience. The fees are neither performance related nor pensionable and are comparable with those paid by other companies. The annual fees were reviewed in 2011 and remain unchanged as listed below.
|
|
|
|
|
|
|
Non-Executive Director – base fee |
|
|
£65,000 |
|
|
Deputy Chairman |
|
|
£100,000 |
|
|
Senior Independent Director |
|
|
£60,000 |
|
|
Audit Committee Chairmanship |
|
|
£50,000 |
|
|
Audit Committee Membership |
|
|
£20,000 |
|
|
Remuneration Committee Chairmanship |
|
|
£30,000 |
|
|
Remuneration Committee Membership |
|
|
£15,000 |
|
|
Risk Committee Chairmanship |
|
|
£40,000 |
|
|
Risk Committee Membership |
|
|
£15,000 |
|
|
Nomination & Governance Committee Membership |
|
|
£5,000 |
|
In the case of the Nomination & Governance Committee, membership currently comprises the Deputy Chairman, Senior Independent Director and chairs of the Board Committees (the fees for which include membership of the Nomination & Governance Committee) and one other Independent Non-Executive Director. Only this director receives an attendance fee, which is £5,000.
Independent Non-Executive Directors who serve on the Boards of subsidiary companies may also receive fees from the subsidiaries.
2011 NON-EXECUTIVE DIRECTORS’ FEES (£)
|
|
|
|
|
|
|
|
|
|
|
|
|
|
|
|
|
|
|
|
|
|
|
|
Board |
|
Deputy |
|
Senior |
|
Audit |
|
Remuneration |
|
Nomination & |
|
Risk |
|
SW Board |
1 |
2011 |
|
|
A M Frew |
|
65 |
|
|
|
|
|
20 |
|
|
|
|
|
15 |
|
|
|
100 |
|
|
Sir Julian Horn-Smith |
|
65 |
|
|
|
|
|
|
|
15 |
|
5 |
|
15 |
|
|
|
100 |
|
|
Lord Leitch |
|
65 |
|
100 |
|
|
|
20 |
|
15 |
|
|
|
|
|
120 |
|
320 |
|
|
G R Moreno |
|
65 |
|
|
|
60 |
|
|
|
|
|
|
|
|
|
|
|
125 |
|
|
D L Roberts |
|
65 |
|
|
|
|
|
20 |
|
15 |
|
|
|
40 |
|
|
|
140 |
|
|
T T Ryan |
|
65 |
|
|
|
|
|
20 |
|
15 |
|
|
|
15 |
|
|
|
115 |
|
|
M A Scicluna |
|
65 |
|
|
|
|
|
50 |
|
|
|
|
|
15 |
|
|
|
130 |
|
|
Anthony Watson |
|
65 |
|
|
|
|
|
20 |
|
30 |
|
|
|
|
|
|
|
115 |
|
|
|
|
|
1 |
Scottish Widows Services Limited |
DILUTION LIMITS
The following charts illustrate the shares available for the Group’s share plans.
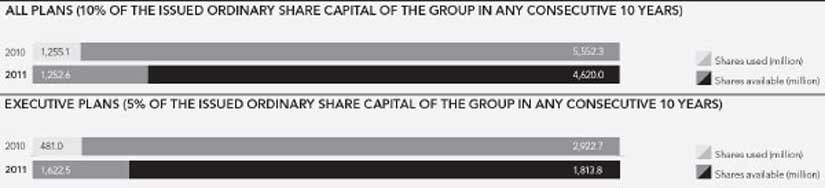
145
COMPENSATION
SERVICE AGREEMENTS
The Group’s policy is for Executive Directors to have service agreements with notice periods of no more than one year. All current Executive Directors are entitled to receive 12 months’ notice from the Group, but would be required to give at least six months’ notice.
It is the Group’s policy that where compensation on early termination is due, it should be paid on a phased basis, mitigated in the event that alternative employment is secured, and that bonus payments should relate to the period of actual service, rather than the full notice period, and will be determined on the basis of performance.
Any entitlements under the pension scheme or equity plans will be in accordance with the scheme rules on leaving.
|
|
|
|
|
|
|
|
|
|
Notice to be given by the Company |
|
Date of service agreement/letter of appointment |
|
|
Sir Winfried Bischoff |
|
6 months |
|
27 July 2009 |
|
|
António Horta-Osório |
|
12 months |
|
3 November 2010 |
|
|
G T Tate |
|
12 months |
|
9 February 2009 |
|
|
T J W Tookey |
|
12 months |
|
26 January 2009 |
|
Independent Non-Executive Directors do not have service agreements and their appointment may be terminated, in accordance with the articles of association, at any time without compensation.
EXTERNAL APPOINTMENTS
The Group recognises that Executive Directors may be invited to become Non-Executive Directors of other companies and that these appointments may broaden their knowledge and experience, to the benefit of the Group. Fees are normally retained by the individual directors as the post entails personal responsibility.
Executive Directors are generally allowed to accept one Non-Executive Directorship.
During 2011, Eric Daniels received fees of £76,000 which was retained by him, for serving as Non-Executive Director of BT plc. Truett Tate received fees of £30,000 as chairman of Arora Holdings Ltd and £20,000 as a Director of Towergate Partnership Ltd. These fees were retained by him.
PERFORMANCE GRAPH
The graph below illustrates the performance of the Group measured by TSR against a ‘broad equity market index’ over the past five years. The Group has been a constituent of the FTSE 100 index throughout this five year period.
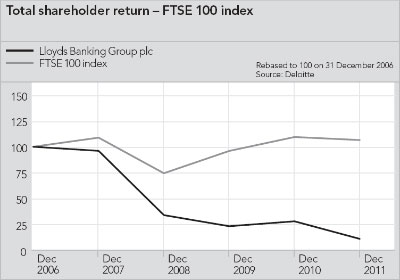
146
COMPENSATION
DIRECTORS’ EMOLUMENTS FOR 2011 (AUDITED)
|
|
|
|
|
|
|
|
|
|
|
|
|
|
|
|
|
|
|
|
|
|
|
|
|
|
|
|
|
|
|
|
Other benefits |
|
Performance- |
|
|
|
|
|
||||||||||||||
|
|
|
Salaries/ |
|
Pension |
|
One-off |
|
Other cash |
|
Non-cash |
|
|
2011 |
|
20106 |
|
|||||||||
|
Current Directors who served during 2011 |
|
|
|
|
|
|
|
|
|
|
|
|
|
|
|
|
|
|
|
|
|
|
|
|
|
|
Executive Directors |
|
|
|
|
|
|
|
|
|
|
|
|
|
|
|
|
|
|
|
|
|
|
|
|
|
|
António Horta-Osório (from 17 January 2011) |
|
|
1,019 |
|
|
514 |
|
|
172 |
|
|
50 |
|
|
10 |
|
|
|
|
|
1,765 |
|
|
|
|
|
Non-Executive Directors |
|
|
|
|
|
|
|
|
|
|
|
|
|
|
|
|
|
|
|
|
|
|
|
|
|
|
Sir Winfried Bischoff |
|
|
700 |
|
|
|
|
|
|
|
|
12 |
|
|
1 |
|
|
|
|
|
713 |
|
|
712 |
|
|
A M Frew |
|
|
100 |
|
|
|
|
|
|
|
|
|
|
|
|
|
|
|
|
|
100 |
|
|
8 |
|
|
Sir Julian Horn-Smith |
|
|
100 |
|
|
|
|
|
|
|
|
|
|
|
|
|
|
|
|
|
100 |
|
|
100 |
|
|
G R Moreno |
|
|
125 |
|
|
|
|
|
|
|
|
|
|
|
|
|
|
|
|
|
125 |
|
|
134 |
|
|
D L Roberts |
|
|
140 |
|
|
|
|
|
|
|
|
|
|
|
|
|
|
|
|
|
140 |
|
|
104 |
|
|
T T Ryan |
|
|
115 |
|
|
|
|
|
|
|
|
|
|
|
|
|
|
|
|
|
115 |
|
|
113 |
|
|
M A Scicluna |
|
|
130 |
|
|
|
|
|
|
|
|
|
|
|
|
|
|
|
|
|
130 |
|
|
130 |
|
|
Anthony Watson |
|
|
115 |
|
|
|
|
|
|
|
|
|
|
|
|
|
|
|
|
|
115 |
|
|
115 |
|
|
Former directors who served during 2011 |
|
|
|
|
|
|
|
|
|
|
|
|
|
|
|
|
|
|
|
|
|
|
|
|
|
|
J E Daniels (until 28 February 2011) |
|
|
776 |
|
|
|
|
|
25 |
|
|
40 |
|
|
14 |
|
|
|
|
|
855 |
|
|
2,572 |
|
|
A G Kane (until 18 May 2011) |
|
|
590 |
|
|
80 |
|
|
|
|
|
24 |
|
|
27 |
|
|
|
|
|
721 |
|
|
1,408 |
|
|
Lord Leitch |
|
|
320 |
|
|
|
|
|
|
|
|
|
|
|
|
|
|
|
|
|
320 |
|
|
308 |
|
|
G T Tate (until 6 February 2012) |
|
|
656 |
|
|
164 |
|
|
|
|
|
27 |
|
|
26 |
|
|
345 |
|
|
1,218 |
|
|
1,745 |
|
|
T J W Tookey (until 24 February 2012) |
|
|
615 |
|
|
90 |
|
|
73 |
|
|
36 |
|
|
5 |
|
|
120 |
|
|
939 |
|
|
1,579 |
|
|
H A Weir (until 18 May 2011) |
|
|
625 |
|
|
125 |
|
|
|
|
|
35 |
|
|
6 |
|
|
|
|
|
791 |
|
|
1,578 |
|
|
Others (for 2010 only) |
|
|
|
|
|
|
|
|
|
|
|
|
|
|
|
|
|
|
|
|
|
|
|
35 |
|
|
|
|
|
6,126 |
|
|
973 |
|
|
270 |
|
|
224 |
|
|
89 |
|
|
465 |
|
|
8,147 |
|
|
10,641 |
|
|
|
|
|
1 |
Following changes to the amount of tax relief available on pension contributions in each year, Directors may elect to receive some or all of their allowances as cash. Contributions into the pensions scheme shown on page 148 are commensurately reduced. |
|
|
|
|
2 |
One-off payments comprise a contractual cash payment to António Horta-Osório as part of the buyout of his benefits from his previous employer, an allowance to Tim Tookey to reflect his additional responsibilities as Interim Group Chief Executive and a tax planning allowance for Eric Daniels. |
|
|
|
|
3 |
Other cash benefits includes flexible benefits payments (4 per cent of basic salary), payments to certain directors who elect to take cash rather than a company car under the car scheme. |
|
|
|
|
4 |
The non-cash benefits column includes amounts relating to the use of a company car, use of a company driver and private medical insurance. It also includes a spouse’s travel allowance for Truett Tate, Sir Winfried Bischoff and Eric Daniels and the value of any matching shares which are received under the terms of Sharematch, through which employees have the opportunity to purchase shares up to a maximum of £125 per month and receive matching shares on a one for one basis up to a maximum value of £30 per month, rounded down to the nearest whole share. |
|
|
|
|
5 |
Bonuses awarded in respect of 2011 performance will be subject to 100 per cent deferral into shares until at least 2014. |
|
|
|
|
6 |
Bonus awards made to Executive Directors in respect of 2010 were amended in February 2012 by reducing the amounts awarded in Deferred Shares. The reduction amounted to 40 per cent of the award in respect of Mr Daniels and 25 per cent of the awards in respect of Mr Kane, Mr Tate, Mr Tookey and Mrs Weir. The Board’s decision is based on the fact that had the outcome of the Judicial Review into Payment Protection Insurance (PPI) in April 2011 been known, and had the consequential provision made been effected at the time of the award of the 2010 bonus in February 2011, the bonus pool would have been lower and individual bonus awards would also have been lower. |
147
COMPENSATION
DIRECTORS’ PENSIONS (AUDITED)
The Executive Directors are members of one of the pension schemes provided by Lloyds Banking Group with benefits either on a defined benefit or defined contribution basis. There are now no Directors accruing further pensionable service on a defined benefit basis.
DEFINED BENEFIT SCHEME MEMBERS
|
|
|
|
|
|
|
|
|
|
|
|
|
|
|
|
|
|
|
|
|
|
|
|
|
|
|
|
|
|
Accrued |
|
Accrued |
|
Change in |
|
Transfer |
|
Transfer |
|
Change in |
|
Additional |
|
Transfer |
|
||||||||
|
J E Daniels |
|
|
223 |
|
|
210 |
|
|
13 |
|
|
5,081 |
|
|
5,030 |
|
|
51 |
|
|
13 |
|
|
294 |
|
|
A G Kane |
|
|
379 |
|
|
372 |
|
|
7 |
|
|
8,734 |
|
|
8,657 |
|
|
77 |
|
|
7 |
|
|
154 |
|
Columns (a) and (b) represent the deferred pension to which the directors would have been entitled had they left the Group on 31 December 2011 and 2010, respectively. For Mr Daniels the 2011 figure is the pension put into payment upon retirement on 30 September 2011. For Mr Kane, the 2011 figure is the deferred pension entitlement as at the date of opting-out of the pension scheme on 15 June 2011.
Column (c) is the transfer value of the deferred pension in column (a) calculated as at 31 December 2011 based on factors supplied by the actuary of the pension scheme.
Column (d) is the equivalent transfer value, but calculated as at 31 December 2010 on the assumption that the Director left service at that date.
Column (e) is the increase in pension built up during the year, recognising (i) the accrual rate for the additional service based on the pensionable salary in force at the year end, and (ii) where appropriate the effect of pay changes in ‘real’ (inflation adjusted) terms on the pension already earned at the start of the year.
Column (f) is the capital value of the pension in column (e).
The disclosures in columns (e) and (f) are as required by the UK Listing Authority listing rules. The requirements of the listing rules differ from those of the Companies Act. The listing rules require the additional pension earned over the year to be calculated as the difference between the pension accrued at the end of the financial year and the pension accrued at the start of the financial year less the increase in the pension earned over the year solely due to inflation. The transfer value in column (f) can differ significantly from the change in transfer value as required by the Companies Act because the additional pension accrued over the year calculated in accordance with the listing rules makes allowance for inflation, and the change in the transfer value required by the Companies Act will be significantly influenced by changes in the assumptions underlying the transfer value calculation at the beginning and end of the financial year.
Benefits from a registered pension scheme are subject to the Lifetime Allowance, currently £1.8 million, which is equivalent to an annual pension of £90,000. Any benefit in excess of this amount will incur a tax charge for the individual. The Lifetime Allowance will decrease to £1.5 million from April 2012. The Group has agreed that if an Executive Director has benefits in excess of the Lifetime Allowance he may cease to accrue benefits in the Scheme and receive a salary supplement as an alternative. This will not cost the Group more than the current arrangements. The Group will not compensate any individual in respect of any tax liability arising from the provision of pension.
DEFINED CONTRIBUTION SCHEME MEMBERS
During the year to 31 December 2011 the Group has made the following contributions to the defined contribution scheme:
|
|
|
|
|
|
|
|
|
|
Pension |
|
|
António Horta-Osório |
|
|
31 |
|
|
G T Tate |
|
|
41 |
|
|
T J W Tookey |
|
|
64 |
|
|
H A Weir |
|
|
31 |
|
148
COMPENSATION
DIRECTORS’ INTERESTS (AUDITED)
The beneficial interests, of those who were directors at 31 December 2011 in ordinary shares of Lloyds Banking Group were:
NUMBER OF SHARES
|
|
|
|
|
|
|
|
|
|
|
|
|
|
|
At 1 January 2011 |
|
At 31 December |
|
At 27 February |
|
|||
|
Executive Directors |
|
|
|
|
|
|
|
|
|
|
|
António Horta-Osório1 |
|
|
100,000 |
|
|
1,067,099 |
|
|
|
|
|
G T Tate1 |
|
|
529,015 |
|
|
789,181 |
|
|
789,745 |
2 |
|
T J W Tookey |
|
|
123,891 |
|
|
315,957 |
|
|
316,943 |
3 |
|
Non-Executive Directors |
|
|
|
|
|
|
|
|
|
|
|
Sir Winfried Bischoff |
|
|
800,000 |
|
|
1,100,000 |
|
|
|
|
|
A M Frew |
|
|
— |
|
|
300,000 |
|
|
|
|
|
Sir Julian Horn-Smith |
|
|
227,890 |
|
|
227,890 |
|
|
|
|
|
Lord Leitch |
|
|
55,787 |
|
|
55,787 |
|
|
|
|
|
G R Moreno1 |
|
|
500,000 |
|
|
1,200,000 |
|
|
|
|
|
D L Roberts |
|
|
378,670 |
|
|
968,641 |
|
|
|
|
|
T T Ryan1 |
|
|
100,877 |
|
|
400,877 |
|
|
|
|
|
M A Scicluna |
|
|
56,226 |
|
|
92,572 |
|
|
|
|
|
Anthony Watson |
|
|
226,357 |
|
|
376,357 |
|
|
|
|
|
|
|
|
1 |
Shareholdings held by Mr A Horta-Osório, Mr G T Tate, Mr G R Moreno and Mr T T Ryan are either wholly or partially in the form of ADRs. |
|
|
|
|
2 |
The beneficial interests for Mr G T Tate relate to changes to ‘partnership’ and ‘matching’ shares acquired under the Lloyds Banking Group Share Incentive Plan between 31 December 2011 and 6 February 2012, the date of his resignation from the Board of Lloyds Banking Group. |
|
|
|
|
3 |
The beneficial interests for Mr T J W Tookey relate to changes to ‘partnership’ and ‘matching’ shares acquired under the Lloyds Banking Group Share Incentive Plan between 31 December 2011 and 24 February 2012, the date of his resignation from the Board of Lloyds Banking Group. |
A summary of the awards vested, purchases and sales made by directors is shown on page 155.
149
COMPENSATION
INTERESTS IN SHARE OPTIONS (AUDITED)
|
|
|
|
|
|
|
|
|
|
|
|
|
|
|
|
|
|
|
|
|
|
|
|
|
|
|
|
|
|
|
|
|
At |
|
Granted |
|
Exercised |
|
Lapsed |
|
At |
|
|
|
|
|
|
|
|
|
|||||||||
|
|
|
|
|
|
|
|
Exercise |
|
Exercise periods |
|
|
|
||||||||||||||||
|
|
|
|
|
|
|
|
|
From |
|
To |
|
Notes |
|
|||||||||||||||
|
António Horta-Osório |
|
|
— |
|
|
342,265 |
|
|
342,265 |
|
|
— |
|
|
— |
|
|
— |
|
|
— |
|
|
— |
|
|
j, k |
|
|
|
|
|
— |
|
|
1,452,401 |
|
|
— |
|
|
— |
|
|
1,452,401 |
|
|
— |
|
|
15/6/2011 |
|
|
30/3/2021 |
|
|
j |
|
|
|
|
|
— |
|
|
662,116 |
|
|
— |
|
|
— |
|
|
662,116 |
|
|
— |
|
|
31/1/2012 |
|
|
30/3/2021 |
|
|
j |
|
|
|
|
|
— |
|
|
1,452,401 |
|
|
— |
|
|
— |
|
|
1,452,401 |
|
|
— |
|
|
15/6/2012 |
|
|
30/3/2021 |
|
|
g, j |
|
|
|
|
|
— |
|
|
438,846 |
|
|
— |
|
|
— |
|
|
438,846 |
|
|
— |
|
|
31/1/2013 |
|
|
30/3/2021 |
|
|
g, j |
|
|
|
|
|
— |
|
|
1,707,763 |
|
|
— |
|
|
— |
|
|
1,707,763 |
|
|
— |
|
|
15/6/2013 |
|
|
30/3/2021 |
|
|
g, j, l |
|
|
Former directors who served during 2011 |
|
|
|
|
|
|
|
|
|
|
|
|
|
|
|
|
|
|
|
|
|
|
||||||
|
J E Daniels |
|
|
265,051 |
|
|
— |
|
|
— |
|
|
— |
|
|
265,051 |
|
|
207.97p |
|
|
18/3/2007 |
|
|
30/9/2012 |
|
|
c, e, h |
|
|
|
|
|
867,914 |
|
|
— |
|
|
— |
|
|
— |
|
|
867,914 |
|
|
235.26p |
|
|
17/3/2008 |
|
|
30/9/2012 |
|
|
d, e, h |
|
|
|
|
|
19,399 |
|
|
— |
|
|
— |
|
|
— |
|
|
19,399 |
|
|
46.78p |
|
|
1/10/2011 |
|
|
31/3/2012 |
|
|
a, i |
|
|
A G Kane |
|
|
70,068 |
|
|
— |
|
|
— |
|
|
70,068 |
|
|
— |
|
|
324.92p |
|
|
6/3/2004 |
|
|
5/3/2011 |
|
|
b, f |
|
|
|
|
|
147,669 |
|
|
— |
|
|
— |
|
|
— |
|
|
147,669 |
|
|
207.97p |
|
|
18/3/2007 |
|
|
17/3/2014 |
|
|
c, e |
|
|
|
|
|
499,709 |
|
|
— |
|
|
— |
|
|
— |
|
|
499,709 |
|
|
235.26p |
|
|
17/3/2008 |
|
|
16/3/2015 |
|
|
d, e |
|
|
|
|
|
19,399 |
|
|
— |
|
|
— |
|
|
— |
|
|
19,399 |
|
|
46.78p |
|
|
1/06/2013 |
|
|
30/11/2013 |
|
|
a, g |
|
|
G T Tate |
|
|
129,820 |
|
|
— |
|
|
— |
|
|
— |
|
|
129,820 |
|
|
207.97p |
|
|
18/3/2007 |
|
|
17/3/2014 |
|
|
c, e |
|
|
|
|
|
55,147 |
|
|
— |
|
|
— |
|
|
— |
|
|
55,147 |
|
|
199.91p |
|
|
12/8/2007 |
|
|
11/8/2014 |
|
|
c, e |
|
|
|
|
|
499,709 |
|
|
— |
|
|
— |
|
|
— |
|
|
499,709 |
|
|
235.26p |
|
|
17/3/2008 |
|
|
16/3/2015 |
|
|
d, e |
|
|
|
|
|
19,399 |
|
|
— |
|
|
— |
|
|
— |
|
|
19,399 |
|
|
46.78p |
|
|
1/6/2013 |
|
|
30/11/2013 |
|
|
a, g |
|
|
T J W Tookey |
|
|
19,399 |
|
|
— |
|
|
— |
|
|
— |
|
|
19,399 |
|
|
46.78p |
|
|
1/6/2013 |
|
|
30/11/2013 |
|
|
a, g |
|
|
H A Weir |
|
|
156,968 |
|
|
— |
|
|
— |
|
|
— |
|
|
156,968 |
|
|
210.70p |
|
|
29/4/2007 |
|
|
28/4/2014 |
|
|
c, e |
|
|
|
|
|
499,709 |
|
|
— |
|
|
— |
|
|
— |
|
|
499,709 |
|
|
235.26p |
|
|
17/3/2008 |
|
|
16/3/2015 |
|
|
d, e |
|
|
|
|
|
19,399 |
|
|
— |
|
|
— |
|
|
19,399 |
|
|
— |
|
|
46.78p |
|
|
— |
|
|
— |
|
|
a |
|
|
|
|
|
a |
Sharesave. Mrs Weir’s Sharesave award lapsed during 2011 at her request. |
|
|
|
|
b |
Executive option granted in March 2001. |
|
|
|
|
c |
Executive option granted between March 2004 and August 2004. |
|
|
|
|
d |
Executive option granted between March 2005 and August 2005. |
|
|
|
|
e |
Exercisable to the extent that the performance condition was satisfied. |
|
|
|
|
f |
Lapsed on 10th anniversary of date of grant as the performance conditions had not been met. |
|
|
|
|
g |
Not exercisable as the option has not been held for the period required by the relevant scheme. |
|
|
|
|
h |
Exercisable for period of one year from date of leaving. |
|
|
|
|
i |
Exercisable for period of six months from date of leaving. |
|
|
|
|
j |
Share buy out award granted on 30 March 2011 for the loss of deferred share awards forfeited on leaving the Santander Group. Awards are consistent with those forfeited and have a nil option price. |
|
|
|
|
k |
Award exercised on 30 March 2011 at a price of 58.75p. |
|
|
|
|
l |
The extent that the award will become exercisable is subject to performance. The performance condition has not changed since the award was made. |
None of the other directors at 31 December 2011 had options to acquire shares in Lloyds Banking Group plc or its subsidiaries.
The market price for a share in the Company at 1 January 2011 and 31 December 2011 was 65.70p and 25.91p, respectively. The range of prices between 1 January 2011 and 31 December 2011 was 21.84p to 69.61p.
The following table contains information on the performance conditions for executive options granted since 2001.
The Remuneration Committee chose the relevant performance conditions because they were felt to be challenging, aligned to shareholders’ interests and appropriate at the time.
150
COMPENSATION
|
|
|
|
|
Options granted |
|
Performance conditions |
|
March 2001 |
|
Growth in earnings per share which is equal to the aggregate percentage change in the retail price index plus three percentage points for each complete year of the relevant period plus a further condition that the Company’s ranking based on TSR over the relevant period should be in the top 50 companies of the FTSE 100. |
|
|
|
|
|
|
|
As the performance conditions for those options granted in March 2001 were not met, the options lapsed in March 2011. |
|
March 2004 – August 2004 |
|
That the Company’s ranking based on TSR over the relevant period against a comparator group (17 UK and international financial services companies including Lloyds Banking Group) must be at least ninth, when 14 per cent of the option will be exercisable. If the Company is ranked first in the group, then 100 per cent of the option will be exercisable and if ranked tenth or below the performance condition is not met. |
|
|
|
|
|
|
|
Options granted in 2004 became exercisable as the performance condition was met on the re-test. The performance condition vested at 24 per cent for Truett Tate’s March option and at 14 per cent for all other options granted to Executive Directors during 2004. |
|
March 2005 – August 2005 |
|
That the Company’s ranking based on TSR over the relevant period against a comparator group (15 companies including Lloyds Banking Group) must be at least eighth, when 30 per cent of the option will be exercisable. If the Company is ranked first to fourth position in the group, then 100 per cent of the option will be exercisable and if ranked ninth or below, the performance condition is not met. |
|
|
|
|
|
|
|
Options granted in 2005 became exercisable as the performance condition was met when tested. Grants vested at 82.5 per cent for all options granted to Executive Directors. |
|
March
2011 |
|
That the Company’s ranking based on TSR over the relevant period against a comparator group (18 companies including Lloyds Banking Group) must be at least ninth, when 30 per cent of the option will be exercisable. If the Company is ranked first to fifth position in the group, then 100 per cent of the option will be exercisable and if ranked tenth or below, the performance condition is not met. |
LLOYDS TSB EXECUTIVE RETENTION PLAN 2006
On 26 March 2008 (prior to his appointment as an Executive Director), Tim Tookey was granted an award under the Lloyds TSB Executive Retention Plan 2006. The award is satisfied in cash only and, subject to continued employment, gave him the right to receive an amount equal to the total value of 218,400 Lloyds Banking Group shares on the dates of vesting. On 26 March 2011 50 per cent of his award vested at 60.48p. Mr Tookey had agreed to reinvest the cash proceeds and he acquired 52,896 Lloyds Banking Group shares. Following notification of Mr Tookey’s resignation from Lloyds Banking Group, the remaining 50 per cent of the award lapsed.
151
COMPENSATION
LLOYDS TSB LONG-TERM INCENTIVE PLAN (AUDITED)
The following table shows conditional shares awarded under the plan. Further information regarding this plan can be found on pages 153 and 154.
|
|
|
|
|
|
|
|
|
|
|
|
|
|
|
|
|
|
|
|
|
|
|
|
|
|
|
At |
|
Awarded |
|
Vested |
|
Lapsed |
|
At |
|
End of |
|
Notes |
|
|||||||
|
António Horta-Osório |
|
|
— |
|
|
7,154,187 |
|
|
— |
|
|
— |
|
|
7,154,187 |
|
|
31/12/2013 |
|
|
b |
|
|
Former Directors who served during 2011 |
|
|||||||||||||||||||||
|
J E Daniels |
|
|
1,690,757 |
|
|
— |
|
|
— |
|
|
1,690,757 |
|
|
— |
|
|
31/12/2010 |
|
|
|
|
|
|
|
|
2,304,135 |
|
|
— |
|
|
— |
|
|
— |
|
|
2,304,135 |
|
|
31/12/2011 |
|
|
e |
|
|
|
|
|
3,456,204 |
|
|
— |
|
|
— |
|
|
— |
|
|
3,456,204 |
|
|
31/12/2011 |
|
|
f |
|
|
|
|
|
5,135,781 |
|
|
— |
|
|
— |
|
|
— |
|
|
5,135,781 |
|
|
31/12/2012 |
|
|
c,g |
|
|
A G Kane |
|
|
833,165 |
|
|
— |
|
|
— |
|
|
833,165 |
|
|
— |
|
|
31/12/2010 |
|
|
|
|
|
|
|
|
1,313,469 |
|
|
— |
|
|
— |
|
|
— |
|
|
1,313,469 |
|
|
31/12/2011 |
|
|
e |
|
|
|
|
|
1,970,202 |
|
|
— |
|
|
— |
|
|
— |
|
|
1,970,202 |
|
|
31/12/2011 |
|
|
f |
|
|
|
|
|
2,927,643 |
|
|
— |
|
|
— |
|
|
— |
|
|
2,927,643 |
|
|
31/12/2012 |
|
|
c |
|
|
G T Tate |
|
|
1,045,491 |
|
|
— |
|
|
— |
|
|
1,045,491 |
|
|
— |
|
|
31/12/2010 |
|
|
|
|
|
|
|
|
1,424,778 |
|
|
— |
|
|
— |
|
|
— |
|
|
1,424,778 |
|
|
31/12/2011 |
|
|
e |
|
|
|
|
|
2,137,169 |
|
|
— |
|
|
— |
|
|
— |
|
|
2,137,169 |
|
|
31/12/2011 |
|
|
f |
|
|
|
|
|
3,175,748 |
|
|
— |
|
|
— |
|
|
— |
|
|
3,175,748 |
|
|
31/12/2012 |
|
|
c |
|
|
|
|
|
— |
|
|
3,159,517 |
|
|
— |
|
|
— |
|
|
3,159,517 |
|
|
31/12/2013 |
|
|
b |
|
|
T J W Tookey |
|
|
143,567 |
|
|
— |
|
|
46,430 |
|
|
101,933 |
|
|
— |
|
|
31/12/2010 |
|
|
a |
|
|
|
|
|
1,335,730 |
|
|
— |
|
|
— |
|
|
— |
|
|
1,335,730 |
|
|
31/12/2011 |
|
|
d |
|
|
|
|
|
2,003,597 |
|
|
— |
|
|
— |
|
|
— |
|
|
2,003,597 |
|
|
31/12/2011 |
|
|
d |
|
|
|
|
|
2,977,264 |
|
|
— |
|
|
— |
|
|
— |
|
|
2,977,264 |
|
|
31/12/2012 |
|
|
c,d |
|
|
|
|
|
— |
|
|
2,962,047 |
|
|
— |
|
|
— |
|
|
2,962,047 |
|
|
31/12/2013 |
|
|
b,d |
|
|
H A Weir |
|
|
1,020,987 |
|
|
— |
|
|
— |
|
|
1,020,987 |
|
|
— |
|
|
31/12/2010 |
|
|
|
|
|
|
|
|
1,391,386 |
|
|
— |
|
|
— |
|
|
— |
|
|
1,391,386 |
|
|
31/12/2011 |
|
|
e |
|
|
|
|
|
2,087,079 |
|
|
— |
|
|
— |
|
|
— |
|
|
2,087,079 |
|
|
31/12/2011 |
|
|
f |
|
|
|
|
|
3,101,317 |
|
|
— |
|
|
— |
|
|
— |
|
|
3,101,317 |
|
|
31/12/2012 |
|
|
c |
|
|
|
a |
Award vested at 29 per cent for Tim Tookey as he was not a director at the time the award was made. The ‘vested during the year’ figure includes 4,796 dividend shares accumulated prior to the stopping of dividend payments. The closing market price of the Group’s ordinary shares on the date of release was 58.54p. |
|
|
b |
Award price 62.288p. |
|
|
c |
The Absolute Share Price element of this award has an end of performance period date of 26 March 2013. |
|
|
d |
Mr Tookey’s unvested awards all lapsed upon his departure from the Group on 24 February 2012. |
|
|
e |
On 14 March 2012 it was determined that the Award would not be transferred or issued to the individual. |
|
|
f |
On 14 March 2012 it was determined that the performance conditions for this Award had not been met and the Award has lapsed. |
|
|
g |
Mr Daniels’ 2010 LTIP Award will continue, but will be pro-rated to reflect the number of months employed during each performance period, this will be 21 months. |
152
COMPENSATION
The following table contains information on the performance conditions for awards made under the long-term incentive plan. The Remuneration Committee chose the relevant performance conditions because they were felt to be challenging, aligned to shareholders’ interests and appropriate at the time.
|
|
|
|
|
|
|
|
LTIP awarded |
Performance conditions |
||||
|
March and April 2008 |
For 50 per cent of the award (the ‘EPS Award’) – the percentage increase in earnings per share of the Group (on a compound annualised basis) over the relevant period needed to be at least an average of 6 percentage points per annum greater than the percentage increase (if any) in the Retail Prices Index over the same period. If it was less than 3 per cent per annum, the EPS Award would lapse. If the increase was more than 3 per cent but less than 6 per cent per annum, then the proportion of shares released would be on a straight line basis between 17.5 per cent and 100 per cent. The relevant period commenced on 1 January 2008 and ended on 31 December 2010. |
||||
|
|
|
||||
|
|
For the other 50 per cent of the award (the ‘TSR Award’) – the Group’s TSR needed to exceed the median of a comparator group (13 companies) over the relevant period by an average of 7.5 per cent per annum for the TSR Award to vest in full. 17.5 per cent of the TSR Award would vest where the Group’s TSR was equal to median and vesting would occur on a straight line basis in between these points. Where the Group’s TSR was below the median of the comparator group, the TSR Award would lapse. The relevant period commenced on 6 March 2008 (the date of award) and ended on 5 March 2011. |
||||
|
|
|
||||
|
|
At the end of the relevant period, neither of the performance conditions had been met and the Awards lapsed. |
||||
|
|
|
||||
|
|
Tim Tookey was not an Executive Director when his award was made in 2008, and as such his award vested at 29 per cent on the same basis as other award recipients below the Group Executive Committee level. |
||||
|
April 2009 |
EPS: The release of 50 per cent of the shares was dependent on the extent to which growth in EPS achieved cumulative EPS targets over the three year period from January 2009 to December 2011. |
||||
|
|
|
||||
|
|
Economic profit: The release of the remaining 50 per cent of shares was dependent on the extent to which the Group achieved cumulative Economic Profit targets over the three year period from January 2009 to December 2011. |
||||
|
|
|
||||
|
|
|||||
|
|
EPS |
|
Vesting % |
|
Growth in EPS |
|
|
|||||
|
|
Threshold |
|
25% |
|
26% |
|
|
Maximum |
|
100% |
|
36% |
|
|
|||||
|
|
|
|
|
|
|
|
|
|||||
|
|
ECONOMIC PROFIT |
|
Vesting % |
|
Absolute improvement in adjusted EP |
|
|
|||||
|
|
Threshold |
|
25% |
|
100% |
|
|
Maximum |
|
100% |
|
202% |
|
|
|||||
|
|
|
|
|
|
|
|
At the end of the relevant period, neither of the performance conditions had been met and the Awards lapsed. |
||||
|
April 2009 |
Synergy Savings: The release of 50 per cent of the shares was dependent on the achievement of target run-rate synergy savings in 2009 and 2010 as well as the achievement of sustainable synergy savings of at least £1.5 billion by the end of 2011. The award was broken down into three equally weighted annual tranches. Performance was assessed at the end of each year against annual performance targets based on a trajectory to meet the 2011 target. The extent to which targets were achieved determined the proportion of shares to be banked each year. Any release of shares was subject to the Remuneration Committee judging the overall success of the delivery of the integration programme. |
||||
|
|
|
||||
|
|
Integration Balanced Scorecard: The release of the remaining 50 per cent of the shares was dependent on the outcome of a Balanced Scorecard of non-financial measures of the success of the integration in each of 2009, 2010 and 2011. The Balanced Scorecard element was broken down into three equally weighted tranches. The tranches were crystallised and banked for each year of the performance cycle subject to separate annual performance targets across the four measurement categories of Building the Business, Customer, Risk and People and Organisation Development. |
||||
|
|
|
|
|
|
|
At the end of the relevant period the Remuneration Committee determined that the performance conditions had been met and the Awards were released (a). |
||||
|
|
(a) |
See footnote e on page 152 |
153
COMPENSATION
|
|
|
|
|
|
|
|
March 2010 |
EPS: Relevant to 36 per cent of the award. Performance will be measured based on absolute improvement in adjusted EPS over the three financial years starting on 1 January 2010 relative to an adjusted fully diluted 2009 EPS base. |
||||
|
|
|
||||
|
|
Economic Profit: Relevant to 36 per cent of the award. Performance will be measured based on the compound annual growth rate of adjusted Economic Profit over the three financial years starting on 1 January 2010 relative to 2009 adjusted Economic Profit base. |
||||
|
|
|
||||
|
|
Absolute Share Price: Relevant to 28 per cent of the award. Performance will be measured based on the Absolute Share Price on 26 March 2013, being the third anniversary of the award date. |
||||
|
|
|
||||
|
|
The targets are: |
||||
|
|
|||||
|
|
EPS |
|
Vesting % |
|
Absolute improvement in adjusted EPS |
|
|
|||||
|
|
Threshold |
|
25% |
|
158% |
|
|
Maximum |
|
100% |
|
180% |
|
|
|
||||
|
|
Vesting between threshold and maximum will be on a straight line basis. |
||||
|
|
|||||
|
|
ECONOMIC PROFIT |
|
Vesting % |
|
Compound annual growth rate of adjusted EP |
|
|
|||||
|
|
Threshold |
|
25% |
|
57% per annum |
|
|
Maximum |
|
100% |
|
77% per annum |
|
|
|
||||
|
|
Vesting between threshold and maximum will be on a straight line basis. |
||||
|
|
|||||
|
|
ABSOLUTE SHARE PRICE |
|
Vesting % |
|
Absolute Share Price |
|
|
|||||
|
|
Threshold |
|
0% |
|
75p |
|
|
Maximum |
|
100% |
|
114p |
|
|
|
||||
|
|
Vesting between threshold and maximum will be on a straight line basis, provided that shares comprised in the Absolute Share Price element of the award may only be released if both the EPS and Economic Profit performance measures have been satisfied at the threshold level or above. |
||||
|
March 2011 |
EPS: Relevant to 33⅓ per cent of the award. Performance will be based on 2013 EPS outcome. |
||||
|
|
|
||||
|
|
Economic Profit: Relevant to 33⅓ per cent of the award. The performance target is based on 2013 adjusted Economic Profit. |
||||
|
|
|
||||
|
|
Absolute Total Shareholder Return: Relevant to 33⅓ per cent of the award. Performance will be measured against the annualised return over the three year period ending 31 December 2013. |
||||
|
|
|
|
|
|
|
|
|
The targets are: |
|
|
|
|
|
|
|||||
|
|
EPS |
|
Vesting % |
|
Target |
|
|
|||||
|
|
Threshold |
|
25% |
|
6.4p |
|
|
Maximum |
|
100% |
|
7.4p |
|
|
|
||||
|
|
Vesting between threshold and maximum will be on a straight line basis. |
||||
|
|
|||||
|
|
ECONOMIC PROFIT |
|
Vesting % |
|
Target |
|
|
|||||
|
|
Threshold |
|
25% |
|
£567m |
|
|
Maximum |
|
100% |
|
£1,234m |
|
|
|
||||
|
|
Vesting between threshold and maximum will be on a straight line basis. |
||||
|
|
|||||
|
|
ABSOLUTE TOTAL SHAREHOLDER RETURN |
|
Vesting % |
|
Annualised Absolute Shareholder Return |
|
|
|||||
|
|
Threshold |
|
25% |
|
8% |
|
|
Maximum |
|
100% |
|
14% |
|
|
|
||||
|
|
Vesting between threshold and maximum will be on a straight line basis, provided that shares comprised in the Absolute Share Price element of the award may only be released if both the EPS and Economic Profit performance measures have been satisfied at the threshold level or above. |
||||
|
|
|
|
|
|
|
|
Deloitte provided information for the testing of the TSR performance conditions for the Company’s long-term incentive plan. EPS is the Group’s normalised earnings per share as shown in the Group’s report and accounts, subject to such adjustments as the Remuneration Committee regards as necessary for consistency. |
|||||
|
|
|||||
|
None of those who were Directors at the end of the year had any other interest in the capital of Lloyds Banking Group plc or its subsidiaries. |
|||||
|
|
|||||
|
The register of Directors’ interests, which is open to inspection, contains full particulars of Directors’ shareholdings and options to acquire shares in Lloyds Banking Group. |
|||||
154
COMPENSATION
DIRECTORS’ INTERESTS – SUMMARY OF AWARDS VESTED, PURCHASES AND SALES MADE BY DIRECTORS IN 2011 (UNAUDITED)
|
|
|
|
|
|
|
|
|
|
|
|
|
At 1 January 2011 |
|
Transactions during year |
|
|
|
|
||
|
|
|
|
|
|
|
||||
|
|
|
|
|
Shares |
|
Notes |
|
31 December 2011 |
|
|
Executive Directors |
|
|
|
|
|
|
|
|
|
|
António Horta-Osório |
100,000 |
|
1/3/11 |
|
|
|
Purchase on appointment |
|
|
|
|
|
|
30/3/11 |
|
167,099 |
|
March 2011 Share Buy Out award |
|
|
|
|
|
|
5/8/11 |
|
200,000 |
|
Purchase |
|
|
|
|
|
|
15/12/11 |
|
600,000 |
|
Purchase (150,000 ADRs) |
|
1,067,099 |
|
G T Tate |
529,015 |
|
|
|
|
|
|
|
|
|
|
|
|
Monthly |
|
4,420 |
|
2011 Share Incentive Plan purchase and matching shares |
|
|
|
|
|
|
23/8/11 |
|
175,746 |
|
Purchase |
|
|
|
|
|
|
24/8/11 |
|
80,000 |
|
Purchase (20,000 ADRs) |
|
789,181 |
|
T J W Tookey |
123,891 |
|
|
|
|
|
|
|
|
|
|
|
|
Monthly |
|
4,420 |
|
2011 Share Incentive Plan purchase and matching shares |
|
|
|
|
|
|
30/3/11 |
|
22,750 |
|
2008 Long Term Incentive Plan release |
|
|
|
|
|
|
30/3/11 |
|
52,896 |
|
2006 Executive Retention Plan release |
|
|
|
|
|
|
8/6/11 |
|
57,810 |
|
2008 Deferred Bonus Plan release |
|
|
|
|
|
|
8/6/11 |
|
-57,810 |
|
Sale |
|
|
|
|
|
|
24/11/11 |
|
112,000 |
|
Purchase |
|
315,957 |
|
Non-Executive Directors |
|
|
|
|
|
|
|||
|
Sir Winfried Bischoff |
800,000 |
|
|
|
|
|
|
|
|
|
|
|
|
5/8/11 |
|
200,000 |
|
Purchase |
|
|
|
|
|
|
24/11/11 |
|
100,000 |
|
Purchase |
|
1,100,000 |
|
A M Frew |
— |
|
|
|
|
|
|
|
|
|
|
|
|
28/2/11 |
|
50,000 |
|
Purchase |
|
|
|
|
|
|
28/2/11 |
|
50,000 |
|
Purchase |
|
|
|
|
|
|
19/8/11 |
|
100,000 |
|
Purchase |
|
|
|
|
|
|
19/8/11 |
|
100,000 |
|
Purchase |
|
300,000 |
|
Sir Julian Horn-Smith |
227,890 |
|
|
|
— |
|
|
|
227,890 |
|
Lord Leitch |
55,787 |
|
|
|
— |
|
|
|
55,787 |
|
G R Moreno |
500,000 |
|
|
|
|
|
|
|
|
|
|
|
|
25/2/11 |
|
200,000 |
|
Purchase (50,000 ADRs) |
|
|
|
|
|
|
5/8/11 |
|
300,000 |
|
Purchase (75,000 ADRs) |
|
|
|
|
|
|
23/11/11 |
|
200,000 |
|
Purchase (50,000 ADRs) |
|
1,200,000 |
|
D L Roberts |
378,670 |
|
|
|
|
|
|
|
|
|
|
|
|
5/8/11 |
|
479,102 |
|
Purchase |
|
|
|
|
|
|
24/11/11 |
|
110,869 |
|
Purchase |
|
968,641 |
|
T T Ryan |
100,877 |
|
|
|
|
|
|
|
|
|
|
|
|
28/2/11 |
|
100,000 |
|
Purchase |
|
|
|
|
|
|
5/8/11 |
|
200,000 |
|
Purchase |
|
400,877 |
|
M A Scicluna |
56,226 |
|
|
|
|
|
|
|
|
|
|
|
|
6/5/11 |
|
36,346 |
|
Purchase |
|
92,572 |
|
Anthony Watson |
226,357 |
|
|
|
|
|
|
|
|
|
|
|
|
5/8/11 |
|
50,000 |
|
Purchase |
|
|
|
|
|
|
15/8/11 |
|
50,000 |
|
Purchase |
|
|
|
|
|
|
19/8/11 |
|
50,000 |
|
Purchase |
|
376,357 |
155
STATEMENT ON US CORPORATE GOVERNANCE STANDARDS
As a non-US company listed on the New York Stock Exchange (NYSE) Lloyds Banking Group plc is required to disclose any significant ways in which its corporate governance practices differ from those followed by domestic US companies listed on the NYSE. As Lloyds Banking Group plc’s main listing is on the London Stock Exchange, it follows the principles contained in the combined code on corporate governance issued by the UK Financial Reporting Council (the UK Code). The Group has complied with the provisions of the UK Code and has done so throughout 2011 regarding the provisions where the requirements are of a continuing nature. Key differences are set out below.
The NYSE corporate governance listing standards require domestic US companies to adopt and disclose corporate governance policies. For Lloyds Banking Group plc, consistent with the principles of the UK Code, the nomination and governance committee sets the corporate governance principles applicable to the Company and oversees the annual evaluation of the performance of the board, its committees and its individual members.
Under the NYSE corporate governance listing standards, the remuneration, nomination and governance committees of domestic US companies must be comprised of entirely independent directors. However for Lloyds Banking Group plc, again consistent with the principles of the UK Code, the remuneration committee and the nomination & governance committee include the Chairman, with all other members being independent non-executive directors.
DIRECTORS’ CONFLICTS OF INTEREST
The Board,
as permitted by the Company’s articles of association, has authorised all
potential conflicts of interest that have been declared by individual
directors. Decisions regarding these conflicts of interest could be and were
only taken by directors who had no interest in the matter. In taking the
decision, the directors acted in a way they considered, in good faith, would be
most likely to promote the Company’s success. The directors have the ability to
impose conditions, if thought appropriate, when granting authorisation. Any
authorities given are reviewed at least every 15 months. No director is
permitted to vote on any resolution or matter where he or she has an actual or
potential conflict of interest. The Board confirms that no material conflicts
were reported to it during the year.
The Board is committed to achieving long
term success for the Company by being the best bank for customers and
generating strong, stable and sustainable returns for shareholders. The Board’s
strategy is underpinned by high standards of corporate governance designed to
ensure consistency and rigour in its decision making. This report explains how
those standards, in particular, those laid down in the Financial Reporting
Council’s UK Corporate Governance Code (the UK Code), apply in practice to
ensure that the Board and management work together for the long term benefit of
the Company and its shareholders. The UK Code can be accessed at www.frc.org.uk.
LEADERSHIP AND ACCOUNTABILITY
The Chairman has overall responsibility for the leadership of the Board. His role is separate from that of the Group Chief Executive who manages and leads the business. A sound relationship between the Chairman and Group Chief Executive, based on a mutual understanding of their respective roles, is essential to maintaining an open culture with the Board. Establishing an effective working relationship with António Horta-Osório, the new Group Chief Executive, has therefore been a key area of focus for the Chairman this year.
The Board is collectively responsible for the long term success of the Company including setting the strategy and establishing the values and standards of the Group. The Group Strategic Review, initiated by António Horta-Osório in March 2011, has been a key area of focus for the Board during 2011 and all Directors participated fully in its formulation. An internal project team supported by McKinsey & Co, was established under the direction of the Group Chief Executive. Detailed plans and proposals were developed by the executive between March and June 2011. During that period, the Board met a number of times to consider, evaluate and challenge the proposals. Additional meetings took place with the Non-Executive Directors individually. The final challenge process took place during a two day Board Strategy session in June 2011. This meeting was held offsite to allow Directors to fully consider and evaluate the strategic options before they were put to the Board for approval. The offsite meeting also provided an opportunity to foster closer working relationships between Board members and the new senior team.
The Chairman has overall responsibility for leadership of the Board and for ensuring that the Board devotes its attention to the right matters. He oversees the content of the agendas which are finalised at Board Agenda Review meetings involving the Chairman, Group Chief Executive and Company Secretary. The Deputy Chairman and Senior Independent Director also attend. Details of the matters reserved to the Board are set out in the Board Governance Framework which is explained further below.
The Chairman, with the support of the Company Secretary, ensures that Directors receive timely and relevant information and are kept advised of key developments, both during and between formal meetings. During 2011, the timeliness of Board communications has been enhanced by the introduction of a secure board portal which enables Directors to access papers electronically as they become available. A weekly Board dashboard ensures that Directors are kept informed of key developments and emerging issues.
It is expected that all directors, but particularly the Non-Executive Directors, constructively challenge proposals that come to the Board for decision. Facilitating an open culture is key to achieving this. During 2011, the Board, led by the Deputy Chairman, developed a charter of values aimed at encouraging strong individual and independent views to broaden the Board’s outlook and strengthen its collective judgement.
Open dialogue is encouraged between Directors. To this end, the Chairman meets regularly with the Non-Executive Directors in the absence of Executive Directors either in private sessions held following regular Board or Committee meetings or in separately arranged meetings. The Executive Directors are aware of such meetings through the Board calendar. Non-Executive Directors meet at least once a year without the Chairman being present to discuss his performance. Such meetings are led by the Senior Independent Director. All Non-Executive Directors have ready access to the Group Chief Executive and other senior executives.
All Directors, including Non-Executive Directors, have access to the services of the Company Secretary in relation to discharging their duties as a director, or as a member of any Board Committee. The appointment, and removal, of the Company Secretary is a matter reserved for the Board as a whole. In addition, the Group provides access, at its expense, to the services of external advisers in order to assist directors in their role, wherever this is deemed necessary.
In 2011, a total of sixteen Board meetings were held of which nine were scheduled at the start of the year. The number of meetings held reflects the continuing challenging environment in which the Group operates and the emphasis placed on keeping the Board informed of developments on a timely basis. Details of attendance at meetings are set out on page 161.
156
CORPORATE GOVERNANCE
To assist the Board in carrying out its functions and to provide independent oversight of internal control and risk management, certain responsibilities are delegated to the Board’s Committees. The Board is kept up to date on the activities of the Committees through reports from each of the Committee Chairmen. Terms of reference for each of the Committees are available on the website at www.lloydsbankinggroup.com. Information on the membership, role and activities of each of the Committees can be found on pages 162 to 164.
GOVERNANCE FRAMEWORK
The Board operates through a Governance Framework which is reviewed at least annually to ensure that it remains fit for purpose. During 2011, the Governance Framework was reviewed and updated to reflect the Group Strategic Review and organisational changes. The revised Governance Framework was approved by the Board in December 2011 and comprises:
|
|
|
|
|
– |
The Board Governance Framework. This is, in effect, the Board’s operating manual and sets out: |
|
|
|
|
|
|
|
• |
the matters that the Board has reserved to itself including the development and setting of strategy and long term objectives; approval of the medium term plan and financial budgets; capital and structure of capital; significant contracts; and various statutory and regulatory approvals; |
|
|
|
|
|
|
• |
terms of reference of, and delegations to, the Board Committees to ensure an appropriate level of independent oversight by the Non-Executive Directors; |
|
|
|
|
|
|
• |
delegation of the responsibility for day to day management of the business to the Group Chief Executive; and |
|
|
|
|
|
|
• |
the respective roles and responsibilities of each of the Chairman, Group Chief Executive, Senior Independent Director and Non-Executive Directors. |
|
|
|
|
|
– |
The Executive Governance Framework. This is the means by which the Group Chief Executive delegates responsibilities at executive level to assist him in carrying out his duties. The Group Chief Executive reserves certain matters to himself and, subject to financial limits, delegates responsibilities to the Executive Directors, his direct reports and other senior executives who collectively make up the Group Executive Committee. |
|
|
|
|
|
|
– |
The Group Subsidiaries Manual. Lloyds Banking Group conducts its business through a large number of subsidiary entities. To help manage the legal, regulatory and reputational risks associated with these entities, the Group requires its subsidiaries to adopt consistent, proportionate and appropriate standards. The Group Subsidiaries Manual provides guidance on the required governance structures and controls having regard to the nature and risk profile of the entity. The Group Subsidiaries Manual was introduced in April 2011 and was updated in the second half of the year to reflect changes made to the overall Governance Framework in response to the Group Strategic Review. |
|
BOARD EFFECTIVENESS
As Chairman, Sir Winfried Bischoff leads the ongoing review of the Board’s effectiveness. The Nomination & Governance Committee, which he also chairs, oversees the process and makes recommendations to the Board as appropriate. To ensure a broad representation of independent views including perspectives from each of the Committees, membership of the Nomination & Governance Committee comprises the Deputy Chairman, the Senior Independent Director, the Chairmen of the Audit, Remuneration and Risk Committees and one other independent Non-Executive Director. The Group Chief Executive also attends meetings as appropriate.
Key activities of the Nomination & Governance Committee are summarised in the Committees’ section on page 163. Given the importance of its role in ensuring effective governance of the Board, a more detailed review of the work of the Nomination & Governance Committee is provided here.
BOARD COMPOSITION
The Nomination & Governance Committee is responsible for reviewing the composition of the Board, including size and structure. During 2011, it oversaw the search and selection process for new directors, including Sara Weller, who was appointed as a Non-Executive Director on 1 February 2012, and the new Group Finance Director, George Culmer, who is expected to join the Board on 16 May 2012. In reviewing Board composition, the Committee has regard to a range of factors, including:
Skills and experience
In reviewing composition, the Board aims to ensure that its membership represents a mix of backgrounds and experience that will enhance the quality of its deliberations and decisions. As part of the ongoing review of composition, specific skills required by the Board are identified with reference to the overall skills of the Board at the time, the need to address longer term succession and current business priorities. All Directors are required to have good – and in most cases deep – experience and understanding of the banking and financial services sector. The complexity of the Group means that broader skills are also required. Maintaining the right balance is an ongoing priority.
The annual Board evaluation is instrumental in identifying any new skills requirements, as well as possible shortcomings, gaps and inefficiencies. As part of its longer term succession plans, the Board has identified a need for at least two new Non-Executive Directors: one with substantial insurance experience and another with in-depth accounting and financial expertise to continue to meet the FRC and SEC’s ‘financial expert’ criteria.
Diversity
The Board continues to place emphasis on ensuring that its membership reflects diversity in the broadest sense including diversity of gender, ethnicity and background. The Group welcomes and publicly supports the Davies Review. The Board has committed to show demonstrable progress towards the goal of achieving at least 25 per cent (and ultimately 30 per cent) female representation on the Board by 2013 and expects to meet this by 2015. As a founder member of the 30% Club, which encourages UK companies to aim for at least 30 per cent female representation on their boards by 2015, Sir Winfried Bischoff takes an active interest in promoting diversity within the Group and in business more generally. The Nomination & Governance Committee currently utilises the services of an Executive search firm which has signed up to the 30% Club’s voluntary Code of Conduct for Executive Search firms.
The Group aims over time to be a leader in its approach to gender diversity. It will continue to focus on diversity and inclusion in order to build a diverse talent pipeline so that there is an appropriate number of talented women ready to make the next move in their careers.
Board size
The Group’s aim is to ensure that the size of the Board is sufficient to reflect a broad range of views and perspectives whilst allowing all Directors to participate effectively in meetings. At year end, the Board comprised twelve directors which is within the range agreed by the Nomination & Governance Committee.
157
CORPORATE GOVERNANCE
Independence
The Board’s preference is to ensure a strong majority of independent directors. At year end, the Board comprised three Executive Directors, eight independent Non-Executive Directors and the Chairman. The UK Code requirement that at least half the Board should be independent Non-Executive Directors has been met throughout the year.
The Nomination & Governance Committee is responsible for assessing the independence of Non-Executive Directors on appointment and annually thereafter. Based on its 2011 assessment, it is satisfied that throughout the year, all Non-Executive Directors were independent as to both character and judgement.
In assessing independence, the Committee does not rely solely on the UK Code criteria but considers whether, in fact, the Non-Executive Director is demonstrably independent and free of relationships and other circumstances that could affect their judgement. It does this with reference to the individual performance and conduct in reaching decisions. It also takes account of any relationships that have been disclosed and authorised by the Board. In the view of the Nomination & Governance Committee, Glen Moreno, who between January and August 2009, was acting Chairman of United Kingdom Financial Investments (UKFI), the body which manages the Government’s shareholding in the Group, continues to exercise his own, and robustly independent judgement, at all times.
Board changes
Non-Executive Directors
The Nomination & Governance Committee is responsible for leading and overseeing appointments to the Board. The process of identification of potential new Non-Executive Directors, is undertaken on a rolling basis alongside the continuous review of the composition of the Board. Where appropriate, this is conducted with the support of an executive search firm.
On 1 February 2012 the Group announced the appointment of Sara Weller as a Non-Executive Director and as a member of each of the Remuneration and Risk Committees. Sara’s career, characterised by strong advocacy of customers and of the application of new technology, directly supports the Group’s strategy. In addition, her background in a range of retail and associated sectors enhances the diversity of perspectives on the Board.
On 27 February 2012, the Group announced that with effect from 17 May 2012, the Board had appointed David Roberts as Deputy Chairman and Tony Watson as Senior Independent Director.
Group Chief
Executive succession and interim arrangements
On 1 March 2011, António Horta-Osório was appointed Group Chief Executive
replacing Eric Daniels who retired on 28 February 2011. Consistent with his
contractual entitlement to notice, Eric Daniels remained employed by the Group
until the end of September 2011.
The detailed process leading to the appointment of António Horta-Osório was explained in the 2010 Corporate Governance Report. He joined the Board as an Executive Director on 17 January 2011. This allowed him time to get to know the business and to complete an orderly handover before assuming the role of Group Chief Executive on 1 March 2011.
On 2 November 2011, the Board announced that, acting on medical advice, António Horta-Osório would be taking a short leave of absence due to exhaustion. He returned to work in full health on 9 January 2012. In the period from 2 November 2011 to 8 January 2012, Tim Tookey was appointed Interim Group Chief Executive in addition to his role as Group Finance Director. Interim governance arrangements were implemented to ensure that:
|
|
|
|
– |
all authorities vested in the Group Chief Executive were automatically deemed to vest in the Interim Group Chief Executive for as long as that office was required; and |
|
|
|
|
– |
where internal governance arrangements required a ‘four eyes’ approval, these could not be achieved by one person acting in the capacity of both the Group Chief Executive and Group Finance Director. Arrangements were put in place to ensure that either the Chief Risk Officer or Company Secretary provided the necessary second pair of eyes. |
Throughout António’s absence, the Board kept its contingency arrangements under review. On 21 November 2011, the Board announced that one of its Non-Executive Directors, David Roberts, would be appointed to the role of Interim Group Chief Executive in the event that António Horta-Osório was unable to return by the end of the year. In the event, this contingency was not required.
The Board kept in close contact with António during his absence. Prior to his return to work, the Board followed a rigorous process to ensure that it was in the best interests of the Group and its shareholders for António to return as Group Chief Executive. This process involved independent medical assessment as well as individual meetings between António and each Board member. As a result of this process, the Board concluded that António was fit to return to work on 9 January 2012. To avoid a recurrence and to assist him in adjusting to the role, the Board agreed to an initiative from António to restructure and reduce his direct reporting lines in order to strengthen the accountabilities of his senior management team. The new structure was announced on 1 February 2012.
Retirements
The following retirements took place in the course of the year:
|
|
|
|
– |
Eric Daniels: see Group Chief Executive succession above; |
|
|
|
|
– |
Archie Kane: Group Executive Director, Insurance who retired at the Company’s general meeting on 18 May 2011; and |
|
|
|
|
– |
Helen Weir: Group Executive Director, Retail who stepped down at the Company’s general meeting on 18 May 2011. |
On 19 September 2011, the Group announced the retirement of Lord Leitch as Deputy Chairman of the Group and Chairman of Scottish Widows. Lord Leitch remained on the Board until 29 February 2012.
On 19 September, the Group also announced that Tim Tookey would stand down as Group Finance Director with effect from the end of February 2012 to pursue interests outside the Group. On 24 February 2012, the Group announced that Tim Tookey would stand down as Group Finance Director with effect from that date.
Since the year end the following announcements have been made:
|
|
|
|
– |
On 1 February 2012, the Group announced that Sir Julian Horn-Smith would retire from the Board at the annual general meeting and would not stand for re-election as a Director; |
158
CORPORATE GOVERNANCE
|
|
|
|
– |
On 6 February 2012, the Group announced that Truett Tate would resign from the Board with immediate effect; and |
|
|
|
|
– |
On 27 February 2012, the Group announced that Glen Moreno would retire from the Board at the annual general meeting and would not stand for re-election as a Director. |
Time commitments
In 2011, as in 2009 and 2010, the time commitment demanded of all Non-Executive Directors was considerable and substantially in excess of the time envisaged in their terms of appointment. The detail set out on page 161 shows the Board meetings that the directors have attended including those called at short notice. There has been no increase to fees since January 2008 to reflect the increased workload and additional time spent on Lloyds Banking Group business.
Election and re-election
As indicated in 2010, in the interests of good corporate governance and in accordance with provisions of the UK Code now in force, Directors will retire voluntarily and submit themselves for re-election at the annual general meeting. Biographies of the career experience of the current directors are set out on pages 137 to 138. To assist in the voting process, details of the Directors seeking re-election at the annual general meeting are set out in the notice of meeting sent to all shareholders.
Succession planning
The Nomination & Governance Committee oversees the Board’s arrangements for the longer term succession of Board and Committee members.
Non-Executive
succession planning
Non-executive director succession planning is addressed as part of the ongoing
review of Board composition. The policy takes account of the need regularly to
refresh the intake of Non-Executives to bring new perspectives, to ensure
appropriate representation on each of the Board’s Committees and to plan for
longer term succession. The average tenure of the Non-Executive Directors is
just over two years. Following the move to annual re-election of directors,
non-executive directors are appointed on a rolling 12 months basis.
Executive
Directors and senior executives
The Nomination & Governance Committee and the Board are responsible for
oversight of the process for succession and management development of the most
senior executives both at and below Board level, including Executive Directors
and members of the Group Executive Committee. The primary responsibility rests
with the Group Chief Executive who is responsible for developing and
maintaining a succession plan for key leadership positions in the senior
executive team. Arrangements are reviewed with the Nomination & Governance
Committee at least annually with the latest review taking place in September
2011.
The Chairman is responsible for developing and maintaining a succession plan in relation to the Group Chief Executive and for reviewing the plan with the Nomination & Governance Committee at least annually. During 2011, emphasis was also placed on contingency arrangements during the Group Chief Executive’s leave of absence.
Board training
Directors’ induction
All Directors are expected to make an informed contribution based on an understanding of the Group’s business model and the key challenges facing the Group and its businesses. To ensure that they can contribute from an early stage, all Directors undergo an extensive three stage induction on appointment comprising:
|
|
|
|
– |
a corporate induction, which provides an overview of the Group, its strategy, operational structures and main business activities; |
|
|
|
|
– |
governance and directors’ responsibilities, which explains the role and statutory duties of a Non-Executive Director including the roles and responsibilities owed by banks and other financial services firms to the FSA and other regulatory bodies; and |
|
|
|
|
– |
a bespoke induction plan prepared in consultation with the Chairman, tailored to the individual needs of the director, to the specific role that they will carry out, and their skills/experience to date. |
Board
training
The Board receives regular refresher training and information sessions to
address current business or emerging issues. In the course of 2011,
Non-Executives Directors undertook approximately two days of training,
including nine hours of structured training during Board meetings. This is
delivered through a variety of means, including sessions on matters such as
capital and liquidity (including stress testing requirements); regulatory
updates for approved persons; accounting development updates and updates on
credit rating agency developments. In addition, the Audit Committee arranged a
series of ‘deep dives’ to which all Board members were invited, and which
provided an in-depth review of the operations of each of the business divisions
and of the latest accounting standards and operating methodologies. Sessions
were delivered for several business areas amounting to three and a half days in
total.
Board evaluation and performance
Having conducted thorough and rigorous externally facilitated evaluations in 2009 and 2010 (as well as in earlier years), the Board accepted the recommendation of the Nomination & Governance Committee that the 2011 evaluation should be facilitated internally, reverting to an external review for 2012.
The 2011 Board evaluation process was overseen by the Nomination & Governance Committee and took the form of:
|
|
|
|
– |
a detailed questionnaire, drafted by Group Secretariat in conjunction with the Chairman, to assess the effectiveness of the Board, its Committees and individual Directors; |
|
|
|
|
– |
individual follow up interviews with the Chairman; and |
|
|
|
|
– |
formulation of an action plan for adoption by the Board. |
159
CORPORATE GOVERNANCE
REMUNERATION
The Remuneration Committee, chaired by Anthony Watson, is responsible for overseeing the Group’s remuneration arrangements and compliance with the FSA’s Remuneration Code. The Remuneration Committee’s terms of reference are available on the website at www.lloydsbankinggroup.com.
An overview of the Remuneration Committee is set out on page 163. The work of the Remuneration Committee is explained in Compensation on page 140.
SHAREHOLDER ENGAGEMENT
The Board recognises the importance of promoting mutual understanding between the Company and its shareholders through greater engagement. In 2011, there was regular dialogue with institutional shareholders with more than 400 equity investor meetings undertaken in the year. Many of these meetings were undertaken by senior management (primarily the Group Chief Executive and Group Finance Director) or Board members. The Chairman has also attended a number of meetings with shareholders to discuss governance and strategic direction. Anthony Watson, as Chairman of the Remuneration Committee, regularly meets the larger shareholders to discuss executive remuneration issues while the Senior Independent Director separately meets with a range of major shareholders.
The Board is kept advised of the views of major shareholders by means of regular updates at Board and Committee meetings. It also receives monthly reports on market and investor sentiment and shareholder analysis.
Investor Relations has primary responsibility for managing day-to-day communications with institutional shareholders. Supported by the Group Chief Executive and Group Finance Director, they achieve this through a combination of briefings to analysts and institutional shareholders (both at results briefings and throughout the year), as well as site visits and individual discussions with institutional shareholders.
The Company Secretary oversees communications with private shareholders. The Group’s annual general meeting provides an opportunity to meet the Group’s Directors and to hear more about the strategy of the Group. Shareholders are encouraged to attend the annual general meeting and to raise any questions at the meeting or in advance, using the email address shown in the pack which will be sent to shareholders in March 2012.
Scottish Widows Investment Partnership, one of Europe’s largest asset managers and a Group company, complies with the principles of the Financial Reporting Council’s Stewardship Code, as published in July 2010. Details of Scottish Widows Investment Partnership’s approach to stewardship and corporate governance can be found on its website, www.swip.com.
CONCLUSION
In conclusion, the Group confirms its compliance with all relevant provisions of the UK Code throughout the year ending 31 December 2011.
160
CORPORATE GOVERNANCE
ATTENDANCE AT MEETINGS
The attendance of Directors at Board meetings and at meetings of the Audit, Nomination & Governance, Remuneration and Risk Committees of which they were members during 2011 is shown in the table.
Numbers in brackets show the maximum number of meetings that each Director could have attended in 2011 including ad hoc meetings or those called at short notice.
|
|
|
|
|
|
|
|
|
|
|
|
|
|
|
|
|
|
|
|
|
|
|
|
|
|
|
|
Board meetings |
|
Audit Committee |
|
Nomination & |
|
Remuneration |
|
Risk Committee |
|
||||||||||||
|
|
|
|
|
|
|
||||||||||||||||||
|
|
|
Regular |
|
Ad hoc |
|
Total |
|
Regular |
|
Ad hoc 1 |
|
Regular |
|
|
|
Regular |
|
|
|
Regular |
|
Ad hoc |
|
|
Number of meetings during the year |
|
9 |
|
7 |
|
16 |
|
8 |
|
7 |
|
4 |
|
|
|
12 |
|
|
|
6 |
|
1 |
|
|
Current directors who served during 2011 |
|
|
|
|
|
|
|
|
|
|
|
|
|
|
|
|
|
|
|
|
|
|
|
|
Sir Winfried Bischoff |
|
9 |
|
7 |
|
|
|
|
|
6 |
|
4 |
|
|
|
12 |
|
|
|
5 |
|
1 |
|
|
António Horta-Osório2 |
|
7(7 |
) |
4(5 |
) |
|
|
|
|
|
|
|
|
|
|
|
|
|
|
|
|
|
|
|
A M Frew |
|
9 |
|
5 |
|
|
|
7 |
|
6 |
|
|
|
|
|
|
|
|
|
5 |
|
1 |
|
|
Sir Julian Horn-Smith3 |
|
7 |
|
4 |
|
|
|
|
|
2 |
|
3 |
|
|
|
8 |
|
|
|
2 |
|
|
|
|
G R Moreno3 |
|
9 |
|
5 |
|
|
|
|
|
3 |
|
4 |
|
|
|
|
|
|
|
|
|
|
|
|
D L Roberts |
|
9 |
|
6 |
|
|
|
8 |
|
7 |
|
4 |
|
|
|
12 |
|
|
|
6 |
|
1 |
|
|
T T Ryan |
|
8 |
|
3 |
|
|
|
8 |
|
5 |
|
|
|
|
|
10 |
|
|
|
6 |
|
1 |
|
|
M A Scicluna |
|
9 |
|
7 |
|
|
|
8 |
|
7 |
|
4 |
|
|
|
|
|
|
|
6 |
|
1 |
|
|
Anthony Watson |
|
9 |
|
5 |
|
|
|
8 |
|
7 |
|
4 |
|
|
|
12 |
|
|
|
|
|
|
|
|
Former directors who served during 2011 |
|
|
|
|
|
|
|
|
|
|
|
|
|
|
|
|
|
|
|
|
|
|
|
|
J E Daniels4 |
|
2(2 |
) |
2(3 |
) |
|
|
|
|
|
|
|
|
|
|
|
|
|
|
|
|
|
|
|
A G Kane5 |
|
3(4 |
) |
3(4 |
) |
|
|
|
|
|
|
|
|
|
|
|
|
|
|
|
|
|
|
|
Lord Leitch6 |
|
9 |
|
5 |
|
|
|
8 |
|
4 |
|
4 |
|
|
|
11 |
|
|
|
|
|
|
|
|
G T Tate7 |
|
9 |
|
6 |
|
|
|
|
|
|
|
|
|
|
|
|
|
|
|
|
|
|
|
|
T J W Tookey8 |
|
9 |
|
7 |
|
|
|
|
|
|
|
|
|
|
|
|
|
|
|
|
|
|
|
|
H A Weir9 |
|
2(4 |
) |
3(4 |
) |
|
|
|
|
|
|
|
|
|
|
|
|
|
|
|
|
|
|
|
|
|
|
1 |
One formal ad hoc Audit Committee meeting was held during 2011 and attended by all members of the Audit Committee. In addition, the Audit Committee arranged five half day and one full day “deep dive” sessions during 2011 which were open to, and attended by, other members of the Board. The “deep dives” formed part of the Board training programme described on page 159. |
|
|
|
|
2 |
Appointed to the Board on 17 January 2011. On leave of absence from 2 November 2011 to 8 January 2012 and was therefore absent from meetings between these dates. See page 158 for details. |
|
|
|
|
3 |
Director until 17 May 2012. |
|
|
|
|
4 |
Director until 28 February 2011. |
|
|
|
|
5 |
Director until 18 May 2011. Archie Kane attended all Board meetings prior to the announcement that he would be retiring from the Board. |
|
|
6 |
Director until 29 February 2012. |
|
|
|
|
7 |
Director until 6 February 2012. |
|
|
|
|
8 |
Director until 24 February 2012. |
|
|
|
|
9 |
Director until 18 May 2011. Helen Weir attended all Board meetings prior to the announcement that she would be stepping down from the Board. |
Some Directors attended Committee meetings as attendees periodically throughout the year. This attendance is not shown in the table.
161
CORPORATE GOVERNANCE
BOARD COMMITTEES
The tables below set out a summary of the membership and role of each of the Board Committees, along with the activities they performed during 2011. There is a standing invitation for all Non-Executive Directors to attend Committee meetings of which they are not members. All Committee terms of reference are displayed on the website, www.lloydsbankinggroup.com or are available from the Company Secretary.
|
|
|
|
|
|
COMMITTEE |
|
PURPOSE |
|
|
AUDIT |
|
To monitor and review the formal arrangements established by the Board in respect of: |
|
|
|
|
||
|
|
(a) the financial statements and reporting of the Group; |
||
|
|
|
||
|
|
(b) internal controls and the risk management framework; |
||
|
|
|
||
|
|
(c) internal audit; and |
||
|
|
|
||
|
|
(d) the Group’s relationship with its external auditors. |
||
|
|
|
||
|
|
RESPONSIBILITIES |
||
|
|
|
||
|
|
– |
reviews the financial statements published in the name of the Board and the quality and acceptability of the related accounting policies, practices and financial reporting disclosures; |
|
|
|
|
|
|
|
|
– |
reviews the scope of the work of the Group Audit Department, reports from that department and the adequacy of its resources; |
|
|
|
|
|
|
|
|
– |
reviews the effectiveness of the systems for internal control, risk management and compliance with financial services legislation and regulations; |
|
|
|
|
|
|
|
|
|
– |
approves the external auditors’ terms of engagement and remuneration; |
|
|
|
|
|
|
|
|
– |
assesses the external auditors’ independence and objectivity; |
|
|
|
|
|
|
|
|
– |
recommends the external auditors’ appointment, re-appointment and removal; |
|
|
|
|
|
|
|
|
– |
reviews the results of the external audit and its cost effectiveness; |
|
|
|
|
|
|
|
|
– |
reviews reports from the auditors on audit planning and their findings on accounting and internal control systems; and |
|
|
|
|
|
|
|
|
– |
reviews procedures for handling complaints regarding accounting, internal accounting controls or auditing matters and for staff to raise concerns in confidence. |
|
|
|
|
|
|
|
|
2011 ACTIVITIES |
|
|
|
|
|
|
|
|
|
– |
reviewed and recommended to the Board the Group annual and interim reports and accounts; |
|
|
|
|
|
|
|
|
– |
reviewed significant accounting matters as discussed with the auditors; |
|
|
|
|
|
|
|
|
– |
reviewed the Group’s position as a going concern; |
|
|
|
|
|
|
|
|
– |
reviewed the appointment of the auditors and approved their remuneration; |
|
|
|
|
|
|
|
|
– |
attended one full day and five half day ‘deep dive’ sessions with each of the divisions; |
|
|
|
|
|
|
|
|
– |
reviewed litigation and regulatory risks; |
|
|
|
|
|
|
|
|
– |
received reports from the Divisional Financial Control Committees and the Group Risk Committee; |
|
|
|
|
|
|
|
|
– |
received reports from the internal audit department on internal controls, including SOX reports; |
|
|
|
|
|
|
|
|
– |
reviewed the Group’s key finance programmes; |
|
|
|
|
|
|
|
|
– |
reviewed details of the Group’s whistle blowing procedures and incidents; and |
|
|
|
|
|
|
|
|
– |
discussed the level of impairments. |
|
|
|
|
|
162
CORPORATE GOVERNANCE
|
|
|
|
|
|
COMMITTEE |
|
PURPOSE |
|
|
NOMINATION & |
|
To keep the Board’s governance arrangements under review and make appropriate recommendations to the Board to ensure that the Company’s arrangements are consistent with best practice corporate governance standards. |
|
|
|
|
||
|
|
|
||
|
|
|
|
|
|
|
– |
reviews the structure, size and composition of the Board; |
|
|
|
|
|
|
|
|
– |
oversees the selection process for prospective directors; |
|
|
|
|
|
|
|
|
– |
makes recommendations to the Board on potential appointments and reappointments of Directors at the end of their specified term; |
|
|
|
|
|
|
|
|
– |
considers Board succession; |
|
|
|
|
|
|
|
|
– |
oversees the annual evaluation of the performance of the Board; |
|
|
|
|
|
|
|
|
– |
reviews the Board’s governance arrangements; |
|
|
|
|
|
|
|
|
– |
oversees the Group’s implementation of governance requirements; and |
|
|
|
|
|
|
|
|
– |
oversees the process for appointments of new Non-Executive Directors and makes recommendations to the Board. |
|
|
|
|
|
|
|
|
|
2011 ACTIVITIES |
|
|
|
|
|
|
|
|
|
– |
reviewed Board composition including the Group’s response to the Davies Review and diversity targets; |
|
|
|
|
|
|
|
|
– |
oversaw the search and selection process for new non executive directors and the Group Finance Director; |
|
|
|
|
|
|
|
|
– |
oversaw the Board Evaluation process including formulation of the action plan; |
|
|
|
|
|
|
|
|
– |
reviewed the Governance Framework to ensure consistency with the Group Strategic Review, organisational changes and emerging developments; and |
|
|
|
|
|
|
|
|
– |
reviewed the adequacy of the Group’s succession plan, including contingency arrangements during the Group Chief Executive’s leave of absence. |
|
|
|
|
|
|
COMMITTEE |
|
PURPOSE |
|
|
REMUNERATION |
|
To set the principles and parameters of remuneration policy for the Group, and to oversee remuneration policy and outcomes for those colleagues specified in the terms of reference |
|
|
|
|
||
|
|
RESPONSIBILITIES |
||
|
|
|
||
|
|
Information about the Remuneration Committee’s responsibilities is given in Compensation on page 140. |
||
|
|
|
||
|
|
2011 ACTIVITIES |
||
|
|
|
||
|
|
Information about the Remuneration Committee’s activities during 2011 is given in Compensation on page 140. |
||
|
|
|
||
|
|
|
||
163
CORPORATE GOVERNANCE
|
|
|
|
|
|
COMMITTEE |
|
PURPOSE |
|
|
RISK |
|
To review and report its conclusions to the Board on: |
|
|
|
|
||
|
|
(a) the Group’s risk appetite; and |
||
|
|
|
||
|
|
(b) the Group’s risk management framework, taking a forward looking perspective and anticipating changes in business conditions. |
||
|
|
|
||
|
|
RESPONSIBILITIES |
||
|
|
|
||
|
|
– |
facilitates the involvement of Non-Executive Directors in risk issues and aids their understanding of these issues; |
|
|
|
|
|
|
|
|
– |
oversees adherence to Group risk policies and standards and considers any material amendments to them; and |
|
|
|
|
|
|
|
|
– |
reviews the work of the Group Risk Division |
|
|
|
|
|
|
|
|
2011 ACTIVITIES |
||
|
|
|
|
|
|
|
|
– |
reviewed the Group consolidated risk report and received an update from the Chief Risk Officer at each meeting; |
|
|
|
|
|
|
|
|
– |
reviewed the risk and control frameworks; |
|
|
|
|
|
|
|
|
– |
reviewed the Internal Capital Adequacy Assessment Process report; |
|
|
|
|
|
|
|
|
– |
reviewed the Group’s funding plan and stress testing process; |
|
|
|
|
|
|
|
|
– |
participated in deep dives in conjunction with each division and with members of the group risk team; |
|
|
|
|
|
|
|
|
– |
reviewed the Group’s risk appetite framework; and |
|
|
|
|
|
|
|
|
– |
reviewed the Group’s report on financial crime |
|
|
|
|
|
COMPLIANCE WITH THE BRITISH BANKERS’ ASSOCIATION CODE FOR FINANCIAL REPORTING DISCLOSURE
In September 2010, the British Bankers’ Association published a Code for Financial Reporting Disclosure (the ‘Disclosure Code’). The Disclosure Code sets out five disclosure principles together with supporting guidance. The principles are that UK banks: commit to providing high quality, meaningful and decision-useful disclosures; commit to ongoing review of, and enhancement to, their financial instrument disclosures for key areas of interest; will assess the applicability and relevance of good practice recommendations to their disclosures acknowledging the importance of such guidance; will seek to enhance the comparability of financial statement disclosures across the UK banking sector; and will clearly differentiate in their annual reports between information that is audited and information that is unaudited.
The Group and other major UK banks have voluntarily adopted the Disclosure Code in their 2011 financial statements. The Group’s 2011 financial statements have therefore been prepared in compliance with the Disclosure Code’s principles.
164
CORPORATE GOVERNANCE
INTERNAL CONTROL
The Board of Directors is responsible for the establishment and review of the Group’s system of internal control, which is designed to ensure effective and efficient operations, quality of internal and external reporting, internal control, and compliance with laws and regulations. It should be noted, however, that such a system is designed to manage, rather than eliminate, the risk of failure to achieve business objectives. In establishing and reviewing the system of internal control, the Directors have regard to the nature and extent of relevant risks, the likelihood of a loss being incurred and the costs of control. It follows, therefore, that the system of internal control can only provide reasonable but not absolute assurance against the risk of material loss.
The Directors and senior management are committed to maintaining a control-conscious culture across all areas of operation. This is communicated to all employees by way of published policies and procedures and regular management briefings. A requirement to comply with internal control risk policies is a key component of individual staff objectives expressed in the balanced scorecard. Key business risks are identified, and these are controlled by means of procedures such as physical controls, credit, trading and other authorisation limits and segregation of duties. In addition, there is an annual control self assessment exercise whereby the key businesses and head office functions review specific controls and attest to the accuracy of their assessments. The assessment covers all enterprise-wide risk management categories and is in accordance with the principles of the UK Code. As in previous years, this exercise was completed for the year ended 31 December 2011. All returns have been satisfactorily completed and appropriately certified.
The effectiveness of the internal control system is reviewed regularly by the Board and the Audit Committee, which also receives reports of reviews undertaken around the Group by group risk and group audit. The Audit Committee receives reports from the Company’s auditors, PricewaterhouseCoopers LLP (which include details of significant internal control matters that they have identified), and has a discussion with the auditors at least once a year without executives present, to ensure that there are no unresolved issues of concern.
There is an ongoing process for identifying, evaluating and managing the significant risks faced by the Company. This process has been in place for the year under review and up to the date of the approval of the annual report and is regularly reviewed by the Board. Information regarding the main features of the internal control and risk management systems in relation to the financial reporting process is given within the Risk Management Report on pages 58 to 131.
AUDITOR INDEPENDENCE AND REMUNERATION
Both the Board and the external auditors have safeguards in place to protect the independence and objectivity of the external auditors. The Audit Committee has a comprehensive policy to regulate the use of auditors for non-audit services. This policy sets out the nature of work the external auditors may not undertake, which includes work which will ultimately be subject to external audit, internal audit services and secondments to senior management positions in the Group that involve decision-making. It also includes the Group’s policy on hiring former external audit staff. For those services that are deemed appropriate for the auditors to carry out, the policy sets out the approval process that must be followed for each type of assignment. The Chairman of the Audit Committee must be consulted regarding potential instructions in respect of allowable non-audit services with a value above defined fee limits.
Each year the Audit Committee establishes a limit on the fees that can be paid to the external auditors in respect of non-audit services and monitors quarterly the amounts paid to the auditors in this regard. The external auditors also report regularly to the Audit Committee on the actions that they have taken to comply with professional and regulatory requirements and current best practice in order to maintain their independence. This includes the rotation of key members of the audit team. Total auditor remuneration analysed between audit and other services is shown in note 11 to the financial statements.
The Audit Committee evaluated the performance of the external auditors during the year and will periodically continue to do so. The Audit Committee has not considered it necessary to require an independent tender process.
DISCLOSURE CONTROLS AND PROCEDURES
As of 31 December 2011, Lloyds Banking Group, under the supervision and with the participation of the Group’s management, including the Group Chief Executive and the Finance Director, Group Finance, performed an evaluation of the effectiveness of the Group’s disclosure controls and procedures. Based on this evaluation, the Group Chief Executive and Finance Director, Group Finance concluded that the Company’s disclosure controls and procedures, as at 31 December 2011, were effective for gathering, analysing and disclosing with reasonable assurance the information that Lloyds Banking Group is required to disclose in the reports it files under the Securities Exchange Act of 1934, within the time periods specified in the SEC’s rules and forms. The Lloyds Banking Group’s management necessarily applied its judgement in assessing the costs and benefits of such controls and procedures, which by their nature can provide only reasonable assurance regarding management’s control objectives.
CHANGES IN INTERNAL CONTROL OVER FINANCIAL REPORTING
There have been no changes in the Lloyds Banking Group’s internal control over financial reporting during the year ended 31 December 2011 that have materially affected, or are reasonably likely to materially affect, the Lloyds Banking Group’s internal control over financial reporting.
MANAGEMENT REPORT ON INTERNAL CONTROL OVER FINANCIAL REPORTING
The management of Lloyds Banking Group plc is responsible for establishing and maintaining adequate internal control over financial reporting. Lloyds Banking Group plc’s internal control over financial reporting is a process designed to provide reasonable assurance regarding the reliability of financial reporting and the preparation of financial statements for external purposes in accordance with IFRS.
The Company’s internal control over financial reporting includes those policies and procedures that (i) pertain to the maintenance of records that, in reasonable detail, accurately and fairly reflect transactions and dispositions of assets; (ii) provide reasonable assurance that transactions are recorded as necessary to permit preparation of financial statements in accordance with IFRS and that receipts and expenditures are being made only in accordance with authorisations of management and directors of Lloyds Banking Group plc; and (iii) provide reasonable assurance regarding prevention or timely detection of unauthorised acquisition, use, or disposition of the Company’s assets that could have a material effect on the financial statements.
165
CORPORATE GOVERNANCE
Internal control systems, no matter how well designed, have inherent limitations and may not prevent or detect misstatements. Also, projections of any evaluation of effectiveness to future periods are subject to the risk that controls may become inadequate because of changes in conditions, or that the degree of compliance with the policies and procedures may deteriorate.
The management of Lloyds Banking Group plc assessed the effectiveness of the Company’s internal control over financial reporting as at 31 December 2011 based on the criteria set forth by the Committee of Sponsoring Organisations of the Treadway Commission (COSO) in its report ‘Internal Control – Integrated Framework’. Based on this assessment, management concluded that, as at 31 December 2011, the Company’s internal control over financial reporting was effective.
PricewaterhouseCoopers LLP, an independent registered public accounting firm, has issued an audit report on the Company’s internal control over financial reporting as of 31 December 2011. This report appears on page F-2.
GOING CONCERN
The going concern of the Company and the Group is dependent on successfully funding their respective balance sheets and maintaining adequate levels of capital. In order to satisfy themselves that the Company and the Group have adequate resources to continue to operate for the foreseeable future, the directors have considered a number of key dependencies which are set out in the risk management section under principal risks and uncertainties: liquidity and funding on pages 64 and 65 and financial soundness on pages 70 to 86 and additionally have considered projections for the Group’s capital and funding position. Having considered these, the directors consider that it is appropriate to continue to adopt the going concern basis in preparing the accounts.
166
MAJOR SHAREHOLDERS AND RELATED PARTY TRANSACTIONS
MAJOR SHAREHOLDERS
At 9 March 2012, The Solicitor for the Affairs of Her Majesty’s Treasury had a direct interest of 40.1 per cent (27,608,563,642 ordinary shares) in the Company’s issued share capital with rights to vote in all circumstances at general meetings. No other notification has been received that anyone has an interest of 3 per cent or more in the Company’s issued ordinary share capital. Further information on The Solicitor for the Affairs of Her Majesty’s Treasury’s shareholding in the Company is provided in – Information about the Lloyds Banking Group’s relationship with the UK Government and Business – History and development of Lloyds Banking Group.
All shareholders within a class of the Company’s shares have the same voting rights.
RELATED PARTY TRANSACTIONS
The Group, as at 31 December 2011, had related party transactions with 24 key management personnel and certain of its pension funds, OEICs and joint ventures and associates. See note 53 to the consolidated financial statements. In addition, material contracts with HM Treasury are described in the Information about the Lloyds Banking Group’s relationship with the UK Government section below.
From 1 January 2011, in accordance with IAS 24 (Revised), UK Government-controlled entities became related parties of the Group. The Group regards the Bank of England and entities controlled by the UK Government, including The Royal Bank of Scotland Group plc, Northern Rock (Asset Management) plc and Bradford & Bingley plc, as related parties.
Except as described below under Information about the Lloyds Banking Group’s relationship with the UK Government, there are no transactions to which the Group is a party involving the UK Government or any body controlled by the UK Government which are material to the Group or, to the Group’s knowledge, to the UK Government or any UK Government controlled body, that were not made in the ordinary course of business, or that are unusual in their nature or conditions. However, considering the nature and scope of the bodies controlled by the UK Government, it may be difficult for the Group to know whether a transaction is material for such a body.
To the best of the Group’s knowledge, any outstanding loans made by the Group to or for the benefit of the UK Government, any body controlled by the UK Government or other related parties, were made (1) in the ordinary course of business, (2) on substantially the same terms, including interest rate and collateral, as those prevailing at the time for comparable transactions with other persons, (3) did not involve more than the normal risk of collectability or present other unfavourable features, and (4) were made on arm’s length basis.
The Group also engages in numerous transactions on arm’s length commercial terms in the ordinary course of its business with the Government and its various departments and agencies, as well as with other companies in which the Government has invested. This includes financings, lending, banking, asset management and other transactions with UK financial institutions in which the Government has invested. During 2010 and 2011 the Group made use of these measures in order to maintain and improve a stable funding position.
INFORMATION ABOUT THE LLOYDS BANKING GROUP’S RELATIONSHIP WITH THE UK GOVERNMENT
HM TREASURY SHAREHOLDING
As at 9 March 2012, the Solicitor for the Affairs of Her Majesty’s Treasury (as nominee for HM Treasury) had a direct interest of 40.1 per cent in the Company’s issued share capital with rights to vote in all circumstances at general meetings.
HM Treasury’s shareholding in the Company is currently managed by UKFI on behalf of HM Treasury. This relationship falls within the scope of the revised framework document between HM Treasury and UKFI published on 1 October 2010 – for more information see Risk Factors – Government Related Risks – The Commissioners of Her Majesty’s Treasury is the largest shareholder of the Company. Through its shareholding in, and other relationships with, the Company, HM Treasury is in a position to exert significant influence over the Group and its business.
The goals of the framework document are consistent with the stated public policy aims of HM Treasury, as articulated in a variety of public announcements (as at 6 May 2011). In the publication ‘An Introduction: Who We Are, What We Do and the Framework Document Which Governs the Relationship Between UKFI and HM Treasury’, it is stated that UKFI is to ‘develop and execute an investment strategy for disposing of the investments in the banks in an orderly and active way through sale, redemption, buy-back or other means within the context of an overarching objective of protecting and creating value for the taxpayer as shareholder, paying due regard to the maintenance of financial stability and to acting in a way that promotes competition’. It further states that UKFI will manage the shareholdings of UK financial institutions in which HM Treasury holds an interest ‘on a commercial basis and will not intervene in day-to-day management decisions of the Investee Companies (as defined therein) (including with respect to individual lending or remuneration decisions)’.
HM Treasury’s shareholding in the Company is a consequence of its subscription for equity securities of the Company and of HBOS (prior to the acquisition of HBOS by the Company) in the 2008 placing and open offer and preference share subscription, the concomitant placing and open offer by HBOS, the 2009 Placing and Open Offer and the Company’s 2009 Rights Issue.
The Company and HM Treasury in January 2009 entered into a registration rights agreement granting customary demand and ‘piggyback’ registration rights in the United States under the United States Securities Act 1933, as amended, to HM Treasury with respect to any ordinary shares of the Group held by HM Treasury. The agreement was amended in June 2009 to include as registrable securities the new shares subscribed for by HM Treasury in the 2009 placing and open offer, any other securities in the Company called by HM Treasury to be issued by any person and any securities issued by HM Treasury which are exchangeable for, convertible into, give rights over or are referable to any such securities. The Company also in June 2009 entered into a resale rights agreement with HM Treasury in which it agreed to provide its assistance to HM Treasury in connection with any proposed sale by HM Treasury of ordinary shares, other securities held by HM Treasury in the Company or any securities of any description caused by HM Treasury to be issued by any person which are exchangeable for, convertible into, give rights over or are referable to such ordinary shares or other securities issued by the Group, to be sold in such jurisdictions (other than the United States) and in such manner as HM Treasury may determine.
OTHER RELATED PARTY TRANSACTIONS WITH THE UK GOVERNMENT
GOVERNMENT AND CENTRAL BANK FACILITIES
During the year ended 31 December 2011, the Group participated in a number of schemes operated by the UK Government and central banks made available to eligible banks and building societies.
167
MAJOR SHAREHOLDERS AND RELATED PARTY TRANSACTIONS
SPECIAL LIQUIDITY SCHEME AND CREDIT GUARANTEE SCHEME
The Bank of England’s UK Special Liquidity Scheme was launched in April 2008 to allow financial institutions to swap temporarily illiquid assets for treasury bills, with fees charged based on the spread between 3-month LIBOR and the 3-month gilt repo rate. The scheme will operate for up to three years after the end of the drawdown period (30 January 2009) at the Bank of England’s discretion. At 31 December 2011, the Group did not utilise the Special Liquidity Scheme.
HM Treasury launched the Credit Guarantee Scheme in October 2008 as part of a range of measures announced by the UK Government intended to ease the turbulence in the UK banking system. It charged a commercial fee for the guarantee of new short and medium term debt issuance. The fee payable to HM Treasury on guaranteed issues was based on a per annum rate of 50 basis points plus the median five-year credit default swap spread. The drawdown window for the Credit Guarantee Scheme closed for new issuance at the end of February 2010. At 31 December 2011, the Group had £23.5 billion of debt in issue under the Credit Guarantee Scheme (31 December 2010: £45.4 billion). During the year, fees of £28 million paid to HM Treasury in respect of guaranteed funding were included in the Group’s income statement.
LENDING COMMITMENTS
In February 2011, the Company (together with Barclays, RBS, HSBC and Santander) announced, as a part of the ‘Project Merlin’ agreement with HM Treasury, its capacity and willingness to increase gross business lending (including to small and medium-sized enterprises) during 2011. The Company fully delivered its share of this agreed lending. The Company has made a unilateral lending pledge for 2012 as part of its publicly announced SME Charter. For more information on ‘Project Merlin’ see Risk Factors – Government Related Risks.
BIG SOCIETY CAPITAL
In January 2012 the Group agreed to commit up to £50 million of equity investment into the Big Society Capital Fund. The Fund, which was created as part of the Project Merlin arrangements, will be a UK social investment fund.
BUSINESS GROWTH FUND
In May 2011 the Group agreed, together with the Royal Bank of Scotland plc (and three other non-related parties), to subscribe for shares in the Business Growth Fund plc, the company created to fulfil the role of the Business Growth Fund as set out in the British Bankers’ Association’s Business Taskforce Report of October 2010. During 2011, the Group has incurred sunk costs of £4 million which have been written off. As at 31 December 2011, the Group’s investment in the Business Growth Fund was £20 million.
GAPS WITHDRAWAL DEED
In November 2009, following its withdrawal from its proposed participation in GAPS, the Company entered into the GAPS withdrawal deed with HM Treasury pursuant to which, among other matters, the Company paid HM Treasury £2,500 million in recognition of the benefits to the Group’s trading operations arising as a result of HM Treasury proposing to make GAPS available to the Group and, in addition, reimbursed HM Treasury various costs.
The GAPS withdrawal deed contained certain undertakings given by the Group to HM Treasury in connection with the state aid approval obtained from the European Commission (on which see the sub-section entitled ‘State Aid’ below) and its withdrawal from its proposed participation in GAPS.
In particular, the Group is required to do all acts and things necessary to ensure the UK Government’s compliance with its obligations under the European Commission decision approving state aid to the Group. This undertaking includes an obligation to: (i) comply with the restructuring measures that the Group agreed to undertake; (ii) comply with the terms of the Restructuring Plan; and (iii) provide certain information to HM Treasury and do such acts as are necessary to enable compliance with the state aid approval to be monitored. The GAPS withdrawal deed also provides for the Group’s restructuring obligations to be modified in certain limited circumstances (without prejudice to any challenge to such state modifications). However, HM Treasury has undertaken that it will not, without the consent of the Company, agree modifications to the Group’s undertakings with respect to state aid which are significantly more onerous to the Company than those granted in order to obtain the state aid approval.
It was also agreed that if the European Commission adopted a decision that the United Kingdom must recover any state aid, the Group would repay all such state aid (subject to the Group’s right to challenge any such decision in the European courts).
The GAPS withdrawal deed included a number of other commitments given by the Company to HM Treasury. The Company, among other things:
|
|
|
|
|
(i) |
acknowledged its commitment to the principle that it should be at the leading edge of implementing the G20 principles, the FSA Code on remuneration and any remuneration provisions accepted by the Government from the Walker Review, provided that this principle shall always be applied in such a way as to allow the Company to operate on a level playing field with its competitors. |
|
|
|
|
|
|
(ii) |
reaffirmed its lending commitments; |
|
|
|
|
|
|
(iii) |
agreed to implement a (now published) customer charter for lending to businesses; |
|
|
|
|
|
|
(iv) |
committed: |
|
|
|
|
|
|
|
a. |
to ensure that its public financial statements comply with best industry practice; and |
|
|
|
|
|
|
b. |
to enter into discussions with HM Treasury with a view to ensuring that such public financial statements: (A) enable investors to assess the quality of the assets and liabilities of banking institutions, the financial position and performance of banking institutions and the nature and extent of risks arising from financial instruments to which banking institutions are exposed; and (B) are comparable as between similar banking institutions; |
|
|
|
|
|
(v) |
agreed to develop with the FSA, and implement, a medium term funding plan aimed at reducing dependence on short term funding to be regularly reviewed by the FSA, the Bank of England and HM Treasury (together, the ‘Tripartite Authorities’); and |
|
|
|
|
|
|
(vi) |
agreed to implement any measures relating to personal current accounts agreed between the OFT and the UK banking industry: (i) as detailed in the OFT’s report ‘Personal current accounts in the UK – a follow up report, October 2009’ and (ii) relating to fees and charges, and the terms and conditions of personal current accounts where any such measures are within the scope of current negotiations with respect thereto. |
|
STATE AID
As part of the European Commission’s decision approving state aid to the Group, the Group was required to submit the Restructuring Plan to the European Commission in the context of a state aid review. The plan was required to support the long-term viability of the Group, and remedy any distortion of competition and trade in the European Union arising from the state aid received by the Group. The College of Commissioners
168
MAJOR SHAREHOLDERS AND RELATED PARTY TRANSACTIONS
announced its formal approval of the state aid on 18 November 2009 and concluded that the Restructuring Plan was appropriate to achieve the aforementioned aims.
The Restructuring Plan consists of the following principal elements: (i) the disposal of a retail banking business with at least 600 branches, a 4.6 per cent. share of the personal current accounts market in the UK and up to 19.2 per cent. of Lloyds Banking Group’s mortgage assets; (ii) an asset reduction programme to achieve £181 billion reduction in certain parts of its balance sheet by the end of 2014; and (iii) behavioural commitments, including commitments which restrict the Group’s ability to make certain acquisitions for approximately three to four years and not to make discretionary payments of coupons or to exercise voluntary call options on hybrid securities from 31 January 2010 until 31 January 2012, which prevented Lloyds Banking Group from paying dividends on its ordinary shares for the same duration.
The retail banking business referred to in (i) above is to be disposed of before the end of November 2013 and consists of the TSB brand, the branches, savings accounts and branch-based mortgages of Cheltenham & Gloucester, the branches and branch-based customers of Lloyds TSB Scotland and a related banking licence, additional Lloyds TSB branches in England and Wales, with branch-based customers and Intelligent Finance.
The Group continues to work closely with the European Commission, HM Treasury and the Monitoring Trustee appointed by the European Commission to ensure the implementation of the Restructuring Plan. In June 2011 the Group issued an Information Memorandum to potential bidders for the retail banking business, which the European Commission confirmed met the requirements to commence the formal sale process for the sale no later than 30 November 2011. In December 2011 the Group announced that, having reviewed the formal offers made, its preferred option was for a direct sale and that it was entering exclusive discussions with The Co-operative Group. The Group continues to expect to be in a position to update shareholders on progress towards the end of March 2012 at which time, if appropriate, it will provide further details on the proposed transaction. The Group is also continuing to progress an alternative disposal option of an Initial Public Offering (IPO) in parallel.
OTHER RELATIONSHIPS WITH THE UK GOVERNMENT
The Group, in common with other financial institutions, is also working closely with a number of Government departments and agencies on various industry-wide initiatives that are intended to support the Government’s objective of economic recovery and greater stability in the wider financial system.
For more detail on industry-wide initiatives see Business Growth Fund and Big Society Capital above.
169
OVERVIEW OF UK REGULATION
The FSA has responsibility under the FSMA for the regulation and oversight of a wide range of financial services activities in the UK and is responsible for the authorisation and supervision of institutions that perform regulated activities as defined in the FSMA.
REGULATORY APPROACH OF THE FSA
The FSA’s regulatory approach requires senior management of a financial institution to ensure that it takes reasonable care to organise and control its affairs responsibly and effectively and that it develops and maintains adequate risk management systems.
The FSA Handbook sets out rules and guidance across a range of issues with which financial institutions are required to comply including prudential rules relating to capital adequacy and liquidity, high level principles of business and detailed conduct of business standards and reporting standards.
In April 2011, the FSA commenced an internal reorganisation as a first step in a process towards the formal transition of regulatory and supervisory powers from the FSA to the new FCA and PRA in 2013. Until this time the responsibility for regulating and supervising the activities of the Group and its subsidiaries will remain with the FSA. On 2 April the FSA will introduce a new ‘twin peaks’ model and the intention is to move the FSA as close as possible to the new style of regulation outlined in the Financial Services Bill. There will be two independent groups of supervisors for banks, insurers and major investment firms covering prudential and conduct. All other firms (those not dual regulated) will be solely supervised by the conduct supervisors.
OTHER BODIES IMPACTING THE REGULATORY REGIME
THE BANK OF ENGLAND AND HM TREASURY
The agreed framework for co-operation in the field of financial stability in the financial markets is detailed in the Memorandum of Understanding published jointly by the Tripartite Authorities. The Bank of England has specific responsibilities in relation to financial stability, including: (i) ensuring the stability of the monetary system; (ii) oversight of the financial system infrastructure, in particular payments systems in the UK and abroad; and (iii) maintaining a broad overview of the financial system through its monetary stability role and the deputy governor’s membership of the FSA’s Board. The Tripartite Authorities work together to achieve stability in the financial markets.
UK FINANCIAL OMBUDSMAN SERVICE (FOS)
The FOS provides customers with a free and independent service designed to resolve disputes where the customer is not satisfied with the response received from the regulated firm. The FOS resolves disputes for eligible persons that cover most financial products and services provided in (or from) the UK. The jurisdiction of the FOS extends to include firms conducting activities under the Consumer Credit Act. Although the FOS takes account of relevant regulation and legislation, its guiding principle is to resolve cases on the basis of what is fair and reasonable; in this regard, the FOS is not bound by law or even its own precedent. The decisions made by the FOS are binding on regulated firms.
THE FINANCIAL SERVICES COMPENSATION SCHEME (FSCS)
The FSCS was established under the FSMA and is the UK’s statutory fund of last resort for customers of authorised financial services firms. Companies within the Group are responsible for contributing to compensation schemes in respect of banks and other authorised financial services firms that are unable to meet their obligations to customers. The FSCS can pay compensation to customers if a firm is unable, or likely to be unable, to pay claims against it. The FSCS is funded by levies on firms authorised by the FSA, including companies within the Group.
LENDING STANDARDS BOARD
The Lending Standards Board (formerly the Banking Code Standards Board) is responsible for monitoring and enforcing compliance with the Lending Code introduced on 1 November 2009, which relates to lending to private customers and small businesses.
UK OFFICE OF FAIR TRADING (OFT)
The OFT is the UK’s consumer and competition authority. Its regulatory and enforcement powers impact the banking sector in a number of ways, including powers to investigate and prosecute a number of criminal offences under competition and consumer law.
UK INFORMATION COMMISSIONER’S OFFICE
The UK Information Commissioner’s Office is responsible for overseeing implementation of the Data Protection Act 1998. This Act regulates, among other things, the retention and use of data relating to individual customers. The Freedom of Information Act 2000 (the FOIA) sets out a scheme under which any person can obtain information held by, or on behalf of, a ‘public authority’ without needing to justify the request. A public authority will not be required to disclose information if certain exemptions set out in the FOIA apply.
INDEPENDENT COMMISSION ON BANKING
The Government appointed an Independent Commission on Banking (ICB) to review possible measures to reform the UK banking system and promote stability and competition. The ICB published its final report on 12 September 2011, putting forward recommendations to require ring-fencing of the retail activities of banks from their investment banking activities and additional capital requirements beyond those required by the guidelines of the Basel Committee on Banking Supervision. The Report also makes recommendations in relation to the competitiveness of the UK banking market, including enhancing the competition remit of the new Financial Conduct Authority (FCA), implementing a new industry-wide current account switching process by September 2013, and improving transparency. The ICB, which following the final report was disbanded, had the authority only to make recommendations, which the Government could choose to accept or reject.
The ICB specifically recommended in relation to the Group’s EU mandated branch disposal (Project Verde), that, to create a strong challenger in the UK banking market, the entity which results from the divestiture should have a share of the Personal Current Account (PCA) market of at least 6 per cent (although this does not need to arise solely from the current accounts acquired from the Company) and a funding position at least as strong as its peers. The ICB did not specify a definitive timeframe for the divested entity to achieve a 6 per cent market share of PCAs but recommended that a market investigation should be carefully considered by competition authorities if ‘a strong and effective challenger’ has not resulted from the Company’s divestiture by 2015. The ICB did not recommend that the Company should increase the size of the Project Verde disposal from that agreed with the European Commission but recommended that the Government prioritise the emergence of a strong new challenger over reducing market concentration through a ‘substantially enhanced’ divestiture by the Group. As at December 2011, Project Verde incorporated 632 branches and 5.2 million customers with a personal current account market share in the UK of approximately 4.6 per cent. A negotiation process is ongoing in relation to the sale of the business. Total customer assets made available for sale amounted to £68.4 billion and total customer liabilities made available for transfer amounted to £31.6 billion. However, subject to certain conditions, buyers can reduce the amount of mortgage lending that they acquire from the Company.
170
REGULATION
The Government published its response to the ICB recommendations on 19 December 2011. The Government supported the recommendation that an entity with a larger share of the PCA market than the 4.6 per cent originally proposed might produce a more effective competitor. In relation to the Group’s announcement that it was to pursue exclusive negotiations with the Co-Operative group, the government commented that such a transaction would deliver a significant enhancement of the PCA market share, with the share divested by the Group combining with the Co-Operative Group’s existing share to create a competitor with approximately 7-8 per cent share of the PCA market. The Government also stated that the execution of the divestment is a commercial matter, and it has no intention of using its shareholding to deliver an enhancement.
The Group continues to play a constructive role in the debate with the Government and other stakeholders on all issues under consideration in relation to the ICB’s recommendations.
EU REGULATION
The UK has implemented all of the directives introduced under the Financial Services Action Plan. However, these directives are regularly reviewed at EU level and could be subject to change. The Group will continue to monitor the progress of these initiatives, provide specialist input on their drafting and assess the likely impact on its business.
US OPERATIONS AND REGULATION
In the United States, Lloyds TSB Bank plc maintains a branch in New York and an agency in Miami, licensed by the States of New York and Florida, respectively. Bank of Scotland plc maintains a federally licensed branch in New York and Lloyds Banking Group maintains representative offices in several US cities. The existence of branch and agency offices in the US subjects Lloyds Banking Group plc and its subsidiaries doing business or conducting activities in the US to oversight by the Federal Reserve Board and limits the nature of the activities in which Lloyds Banking Group plc and its subsidiaries can engage in the US. Lloyds TSB Bank’s branch and agency offices are subject to extensive federal and state supervision and regulation relating to their operations.
The Group’s US broker dealer, Lloyds Securities Inc., is subject to regulation and supervision by the US Securities and Exchange Commission (the SEC) and the Financial Industry Regulatory Authority with respect to its securities activities, including sales methods, trade practices, use and safekeeping of customers’ funds and securities, capital structure, recordkeeping, the financing of customers’ purchases and the conduct of directors, officers and employees.
On 21 July 2010, the United States enacted the Dodd-Frank Wall Street Reform and Consumer Protection Act (the Dodd-Frank Act), which provides a broad framework for significant regulatory changes that will extend to almost every area of US financial regulation. Many of the provisions of the Dodd-Frank Act require further detailed rulemaking by various US regulators, including the Department of the Treasury, the Federal Reserve Board, the SEC, the Commodity Futures Trading Commission and the newly created Financial Stability Oversight Council, a substantial portion of which remains to be completed. The impact of the Dodd-Frank Act and its implementing regulations on the Group’s US operations will depend on the final regulations ultimately adopted by various US regulatory authorities. See also Risk Factors – Regulatory Risks – The Group’s businesses are subject to substantial regulation, and regulatory and governmental oversight. Adverse regulatory developments or changes in government policy could have a significant material adverse effect on the Group’s results of operations, financial condition and prospects for further details on the Dodd-Frank Act.
A major focus of US governmental policy relating to financial institutions in recent years has been combating money laundering and terrorist financing and enforcing compliance with US economic sanctions, with serious legal and reputational consequences for any failures arising in these areas. The Group engages, or has engaged, in a limited amount of business with counterparties in certain countries which the US State Department currently designates as state sponsors of terrorism, including Iran, Syria, Cuba, and Sudan. The Group continues to reduce its outstanding exposures to such states which have arisen through historical business activity. In accordance with this, the Group intends to engage only in new business in such jurisdictions only in very limited circumstances where the Group is satisfied concerning legal, compliance and reputational issues.
At 31 December 2011, the Group does not believe the Group’s business activities relating to countries designated as state sponsors of terrorism were material to its overall business.
The Group estimates that the value of the Group’s business in respect of such states represented less than 0.01 per cent of the Group’s total assets and, for the year ended 31 December 2011, the Group believes that the Group’s revenues from all activities relating to such states were less than 0.004 per cent of its total income, net of insurance claims. This information has been compiled from various sources within the Group, including information manually collected from relevant business units, and this has necessarily involved some degree of estimate and judgement.
Other legal and regulatory matters in which the Group is currently involved are discussed on page 6 under Legal Actions and Regulatory Matters.
171
The ordinary shares of Lloyds Banking Group plc are listed and traded on the London Stock Exchange under the symbol ‘LLOY.L’. The prices for shares as quoted in the official list of the London Stock Exchange are in pounds sterling. The following table shows the reported high and low closing prices for the ordinary shares on the London Stock Exchange. This information has been extracted from publicly available documents from various sources, including officially prepared materials from the London Stock Exchange, and has not been prepared or independently verified by the Lloyds Banking Group.
|
|
|
|
|
|
|
|
|
|
|
|
Price per share |
|
Price per share |
|
||
|
Annual prices: |
|
|
|
|
|
|
|
|
2011 |
|
|
69.61 |
|
|
21.84 |
|
|
2010 |
|
|
77.61 |
|
|
46.59 |
|
|
2009 |
|
|
140.70 |
|
|
40.30 |
|
|
2008 |
|
|
483.25 |
|
|
118.50 |
|
|
2007 |
|
|
614.00 |
|
|
451.25 |
|
|
2006 |
|
|
581.00 |
|
|
489.75 |
|
|
2005 |
|
|
509.00 |
|
|
439.50 |
|
|
2004 |
|
|
476.25 |
|
|
391.75 |
|
|
2003 |
|
|
483.00 |
|
|
295.75 |
|
|
2002 |
|
|
817.00 |
|
|
427.50 |
|
|
2001 |
|
|
772.00 |
|
|
590.00 |
|
|
2000 |
|
|
774.50 |
|
|
517.00 |
|
|
Quarterly prices: |
|
|
|
|
|
|
|
|
2011 |
|
|
|
|
|
|
|
|
Fourth quarter |
|
|
37.07 |
|
|
21.84 |
|
|
Third quarter |
|
|
50.81 |
|
|
27.56 |
|
|
Second quarter |
|
|
62.36 |
|
|
43.395 |
|
|
First quarter |
|
|
69.61 |
|
|
58.09 |
|
|
2010 |
|
|
|
|
|
|
|
|
Fourth quarter |
|
|
76.39 |
|
|
60.41 |
|
|
Third quarter |
|
|
77.61 |
|
|
52.21 |
|
|
Second quarter |
|
|
70.24 |
|
|
50.52 |
|
|
First quarter |
|
|
64.91 |
|
|
46.59 |
|
|
2009 |
|
|
|
|
|
|
|
|
Fourth quarter |
|
|
99.23 |
|
|
48.70 |
|
|
Third quarter |
|
|
111.34 |
|
|
63.30 |
|
|
Second quarter |
|
|
121.10 |
|
|
61.10 |
|
|
First quarter |
|
|
140.70 |
|
|
40.30 |
|
|
Monthly prices: |
|
|
|
|
|
|
|
|
February 2012 |
|
|
36.58 |
|
|
32.20 |
|
|
January 2012 |
|
|
32.83 |
|
|
26.19 |
|
|
December 2011 |
|
|
27.09 |
|
|
23.47 |
|
|
November 2011 |
|
|
30.56 |
|
|
21.84 |
|
|
October 2011 |
|
|
37.07 |
|
|
31.65 |
|
|
September 2011 |
|
|
37.02 |
|
|
30.56 |
|
On 9 March 2012, the closing price of shares on the London Stock Exchange was 34.35 pence, equivalent to $0.54 per share translated at the Noon Buying Rate of $1.5677 per £1.00 on 9 March 2012.
Lloyds Banking Group plc’s American Depositary Receipts (ADRs) have been traded on the over-the-counter market in the US under the symbol ‘LLDTY’ since March 2000. Since 27 November 2001 Lloyds Banking Group plc American Depositary Shares (ADSs) have been listed on The New York Stock Exchange under the symbol ‘LYG’. The prices for Lloyds Banking Group plc’s ADRs and ADSs, as quoted below, are in US dollars. Each ADS represents four ordinary shares.
172
LISTING INFORMATION
The following table shows the reported high and low closing prices for the ADRs in the over-the-counter market in the US.
|
|
|
|
|
|
|
|
|
|
|
|
Price per ADR |
|
Price per ADR |
|
||
|
Annual prices: |
|
|
|
|
|
|
|
|
2001 (to 26 November 2001) |
|
|
46.00 |
|
|
34.75 |
|
|
2000 |
|
|
45.27 |
|
|
33.50 |
|
|
Quarterly prices: |
|
|
|
|
|
|
|
|
2001 |
|
|
|
|
|
|
|
|
Fourth quarter (to 26 November 2001) |
|
|
43.88 |
|
|
38.25 |
|
|
Third quarter |
|
|
44.00 |
|
|
35.50 |
|
|
Second quarter |
|
|
43.94 |
|
|
38.94 |
|
|
First quarter |
|
|
46.00 |
|
|
34.75 |
|
The following table shows the reported high and low closing prices for ADSs on the New York Stock Exchange.
|
|
|
|
|
|
|
|
|
|
|
|
Price per ADS |
|
Price per ADS |
|
||
|
Annual prices: |
|
|
|
|
|
|
|
|
2011 |
|
|
4.44 |
|
|
1.34 |
|
|
2010 |
|
|
4.85 |
|
|
2.92 |
|
|
2009 |
|
|
8.40 |
|
|
2.22 |
|
|
2008 |
|
|
38.56 |
|
|
7.15 |
|
|
2007 |
|
|
48.44 |
|
|
36.70 |
|
|
2006 |
|
|
45.41 |
|
|
34.72 |
|
|
2005 |
|
|
39.06 |
|
|
31.12 |
|
|
2004 |
|
|
36.88 |
|
|
29.47 |
|
|
2003 |
|
|
32.55 |
|
|
19.65 |
|
|
2002 |
|
|
48.55 |
|
|
27.85 |
|
|
Quarterly prices: |
|
|
|
|
|
|
|
|
2011 |
|
|
|
|
|
|
|
|
Fourth quarter |
|
|
2.39 |
|
|
1.34 |
|
|
Third quarter |
|
|
3.25 |
|
|
1.76 |
|
|
Second quarter |
|
|
4.03 |
|
|
2.73 |
|
|
First quarter |
|
|
4.44 |
|
|
3.70 |
|
|
2010 |
|
|
|
|
|
|
|
|
Fourth quarter |
|
|
4.83 |
|
|
3.78 |
|
|
Third quarter |
|
|
4.85 |
|
|
3.23 |
|
|
Second quarter |
|
|
4.37 |
|
|
3.05 |
|
|
First quarter |
|
|
3.88 |
|
|
2.92 |
|
|
2009 |
|
|
|
|
|
|
|
|
Fourth quarter |
|
|
6.44 |
|
|
3.21 |
|
|
Third quarter |
|
|
7.37 |
|
|
4.17 |
|
|
Second quarter |
|
|
7.36 |
|
|
4.10 |
|
|
First quarter |
|
|
8.40 |
|
|
2.22 |
|
|
2008 |
|
|
|
|
|
|
|
|
Fourth quarter |
|
|
18.80 |
|
|
7.15 |
|
|
Third quarter |
|
|
27.92 |
|
|
15.75 |
|
|
Second quarter |
|
|
38.56 |
|
|
24.46 |
|
|
First quarter |
|
|
38.52 |
|
|
31.12 |
|
|
2007 |
|
|
|
|
|
|
|
|
Fourth quarter |
|
|
46.95 |
|
|
36.70 |
|
|
Third quarter |
|
|
47.22 |
|
|
41.25 |
|
|
Second quarter |
|
|
47.20 |
|
|
44.72 |
|
|
First quarter |
|
|
48.44 |
|
|
41.64 |
|
|
Monthly prices: |
|
|
|
|
|
|
|
|
February 2012 |
|
|
2.27 |
|
|
2.00 |
|
|
January 2012 |
|
|
2.02 |
|
|
1.58 |
|
|
December 2011 |
|
|
1.68 |
|
|
1.38 |
|
|
November 2011 |
|
|
1.94 |
|
|
1.34 |
|
|
October 2011 |
|
|
2.39 |
|
|
1.96 |
|
|
September 2011 |
|
|
2.27 |
|
|
1.94 |
|
On 9 March 2012, the closing price of ADSs on the New York Stock Exchange was $2.12.
173
LISTING INFORMATION
ADR FEES
The Group’s depositary, Bank of New York Mellon, collects its fees for delivery and surrender of ADSs directly from investors depositing shares or surrendering ADSs for the purpose of withdrawal or from intermediaries acting for them. The depositary collects fees for making distributions to investors by deducting those fees from the amounts distributed or by selling a portion of distributable property to pay the fees. The depositary may collect its annual fee for depositary services by deductions from cash distributions or by directly billing investors or by charging the book-entry system accounts of participants acting for them. The depositary may generally refuse to provide fee-attracting services until its fees for those services are paid.
|
|
|
|
|
|
Persons depositing or withdrawing shares must pay: |
|
For: |
|
|
|
|
|
|
|
$5.00 (or less) per 100 ADSs (or portion of 100 ADSs) |
|
• |
Issuance of ADSs, including issuances resulting from a distribution of shares or rights or other property |
|
|
|
|
|
|
|
|
• |
Cancellation of ADSs for the purpose of withdrawal, including if the deposit agreement terminates |
|
$.02 (or less) per ADS |
|
• |
Any cash distribution to ADS registered holders |
|
A fee equivalent to the fee that would be payable if securities distributed to you had been shares and the shares had been deposited for issuance of ADSs |
|
• |
Distribution of securities distributed to holders of deposited securities which are distributed by the depositary to ADS registered holders |
|
$.02 (or less) per ADSs per calendar year |
|
• |
Depositary services |
|
Registration or transfer fees |
|
• |
Transfer and registration of shares on the share register to or from the name of the depositary or its agent when you deposit or withdraw shares |
|
Expenses of the depositary |
|
• |
Cable, telex and facsimile transmissions (when expressly provided in the deposit agreement) |
|
|
|
• |
Converting foreign currency to US dollars |
|
Taxes and other governmental charges the depositary or the custodian have to pay on any ADS or share underlying an ADS, for example, stock transfer taxes, stamp duty or withholding taxes |
|
• |
As necessary |
|
Any charges incurred by the depositary or its agents for servicing the deposited securities |
|
• |
As necessary |
FEES RECEIVED TO DATE
In 2011, the Company received from the depositary $1,381,674 for continuing annual stock exchange listing fees, standard out-of-pocket maintenance costs for the ADRs (consisting of the expenses of postage and envelopes for mailing annual and interim financial reports, printing and distributing dividend checks, electronic filing of US Federal tax information, mailing required tax forms, stationery, postage, facsimile, and telephone calls), any applicable performance indicators relating to the ADR facility, underwriting fees and legal fees.
FEES TO BE PAID IN THE FUTURE
The Bank of New York Mellon, as depositary, has agreed to reimburse the Company for expenses they incur that are related to establishment and maintenance expenses of the ADS program. The depositary has agreed to reimburse the Company for its continuing annual stock exchange listing fees. The depositary has also agreed to pay the standard out-of-pocket maintenance costs for the ADRs, which consist of the expenses of postage and envelopes for mailing annual and interim financial reports, printing and distributing dividend checks, electronic filing of US Federal tax information, mailing required tax forms, stationery, postage, facsimile, and telephone calls. It has also agreed to reimburse the Company annually for certain investor relationship programs or special investor relations promotional activities. In certain instances, the depositary has agreed to provide additional payments to the Company based on any applicable performance indicators relating to the ADR facility. There are limits on the amount of expenses for which the depositary will reimburse the Company, but the amount of reimbursement available to the Company is not necessarily tied to the amount of fees the depositary collects from investors.
The depositary collects its fees for delivery and surrender of ADSs directly from investors depositing shares or surrendering ADSs for the purpose of withdrawal or from intermediaries acting for them. The depositary collects fees for making distributions to investors by deducting those fees from the amounts distributed or by selling a portion of distributable property to pay the fees. The depositary may collect its annual fee for depositary services by deduction from cash distributions or by directly billing investors or by charging the book-entry system accounts of participants acting for them. The depositary may generally refuse to provide fee-attracting services until its fees for those services are paid.
174
As a result of the UK Government’s investment in the Group as part of the initial recapitalisation by the Company in November 2008, the rights issue announced in November 2009 and participation in the Credit Guarantee Scheme, the Group has been deemed to have accepted state aid and subsequently the European Commission required the Group to undertake a restructuring plan. This, amongst other things, includes a behavioural commitment not to make discretionary payments of coupons or to exercise voluntary call options on hybrid securities from 31 January 2010 until 31 January 2012. This also prevents the Group from paying dividends on its ordinary shares for the same duration.
Lloyds Banking Group plc’s ability to pay dividends is restricted under UK company law. Dividends may only be paid if distributable profits are available for that purpose. In the case of a public limited company, a dividend may only be paid if the amount of net assets is not less than the aggregate of the called-up share capital and undistributable reserves and if the payment of the dividend will not reduce the amount of the net assets to less than that aggregate. In addition, a company cannot pay a dividend if any of its UK insurance subsidiaries is insolvent on a regulatory valuation basis or, in the case of regulated entities, if the payment of a dividend results in regulatory capital requirements not being met. Similar restrictions exist over the ability of Lloyds Banking Group plc’s subsidiary companies to pay dividends to their immediate parent companies. Furthermore, in the case of Lloyds Banking Group plc, dividends may only be paid if sufficient distributable profits are available for distributions due in the financial year on certain preferred securities. The board has the discretion to decide whether to pay a dividend and the amount of any dividend. In making this decision, the board is mindful of the level of dividend cover and, consequently, profit growth may not necessarily result in increases in the dividend. In the case of American Depositary Shares, dividends are paid through The Bank of New York Mellon which acts as paying and transfer agent.
The board recognises the importance attached to the Company’s dividend and although the European Commission’s restriction on dividend payments, initially placed on the Group as part of the State Aid restructuring plan, has now expired no dividend was payable in 2011. It has always been the Group’s intention to recommence dividend payments after this date, as soon as the financial position of the Group and market conditions permit, and after regulatory capital requirements are defined and prudently met. At this time those requirements remain unclear and although the Group has made good progress against its strategic priorities during the year it is not yet able to forecast when it will be able to resume dividend payments.
The table below sets out the interim and final dividends which were declared in respect of the ordinary shares for fiscal years 2003 through 2011. The sterling amounts have been converted into US dollars at the Noon Buying Rate in effect on each payment date.
|
|
|
|
|
|
|
|
|
|
|
|
|
|
|
|
|
|
Interim dividend |
) |
Interim dividend |
) |
Final dividend |
) |
Final dividend |
) |
||||
|
2003 |
|
|
0.107 |
|
|
0.178 |
|
|
0.235 |
|
|
0.421 |
|
|
2004 |
|
|
0.107 |
|
|
0.190 |
|
|
0.235 |
|
|
0.447 |
|
|
2005 |
|
|
0.107 |
|
|
0.189 |
|
|
0.235 |
|
|
0.433 |
|
|
2006 |
|
|
0.107 |
|
|
0.202 |
|
|
0.235 |
|
|
0.468 |
|
|
2007 |
|
|
0.112 |
|
|
0.228 |
|
|
0.247 |
|
|
0.482 |
|
|
2008 |
|
|
0.114 |
|
|
0.203 |
|
|
— |
|
|
— |
|
|
2009 |
|
|
— |
|
|
— |
|
|
— |
|
|
— |
|
|
2010 |
|
|
— |
|
|
— |
|
|
— |
|
|
— |
|
|
2011 |
|
|
— |
|
|
— |
|
|
— |
|
|
— |
|
175
MEMORANDUM AND ARTICLES OF ASSOCIATION OF LLOYDS BANKING GROUP PLC
For information regarding the Memorandum and Articles of Association, please refer to the discussion under the corresponding section of the Annual Report on Form 20-F for the year ended 31 December 2010, filed with the SEC on 13 May 2011, which discussion is hereby incorporated by reference into this document.
There are no UK laws, decrees or regulations that restrict Lloyds Banking Group plc’s export or import of capital, including the availability of cash and cash equivalents for use by Lloyds Banking Group, or that affect the remittance of dividends or other shareholders’ payments to non-UK holders of Lloyds Banking Group plc shares, except as set out in Taxation.
176
UK TAXATION
The following discussion is intended only as a general guide to current UK tax legislation, what is understood to be current UK HM Revenue & Customs practice and the terms of the current UK/US income tax treaty (the Treaty), all of which are subject to change at any time, possibly with retroactive effect.
The Treaty for the avoidance of double taxation with respect to taxes on income entered into force following the exchange of instruments of ratification by the UK Parliament and the US Senate on 31 March 2003.
The UK HM Revenue & Customs is the UK government department responsible for assessing and collecting UK tax revenues. The discussion is intended as a general guide and only applies to persons who are the beneficial owners of their ordinary shares or ADSs. References below to a US holder are to that term as defined, and subject to the exclusions described in the introduction, below under US federal income tax considerations. It may not apply to certain shareholders or ADS holders, such as dealers in securities.
Tax can be complicated and individual circumstances may need to be considered in more detail. Any person who is in any doubt as to his tax position should consult his own professional adviser.
TAXATION OF CHARGEABLE GAINS
UK RESIDENTS
A disposal (or deemed disposal) of ordinary shares or ADSs by a shareholder or holder of ADSs resident or (in the case of an individual) ordinarily resident for tax purposes in the UK may, depending on the shareholder’s or ADS holder’s particular circumstances, and subject to any available exemption or relief, give rise to a chargeable gain or an allowable loss for the purposes of UK taxation on chargeable gains.
INDIVIDUALS, OTHER THAN US HOLDERS, TEMPORARILY NON-RESIDENT IN THE UK
A shareholder or ADS holder who is an individual and who has, on or after 17 March 1998, ceased to be resident and ordinarily resident for tax purposes in the UK for a period of less than five years of assessment and who disposes of ordinary shares or ADSs during that period may be liable, on return to the UK, to UK taxation on chargeable gains arising during the period of absence, subject to any available exemption, relief and/or foreign tax credit.
US HOLDERS
Subject to the provisions set out in the next paragraph in relation to temporary non-residents, US holders generally will not be liable for UK tax on chargeable gains unless they carry on a trade, profession or vocation in the UK through a branch or agency and the ordinary shares or ADSs are or have been used or held by or for the purposes of the branch or agency, in which case such US holder might, depending on individual circumstances, be liable to UK tax on chargeable gains on any disposition of ordinary shares or ADSs. An individual US holder who is only temporarily not resident in the UK may, under anti-avoidance legislation, still be liable for UK tax on chargeable gains realised, subject to any available exemption, relief and/or foreign tax credit.
A US holder who is an individual and who has, on or after 17 March 1998, ceased to be resident or ordinarily resident for tax purposes in the UK for a period of less than five years of assessment and who disposes of ordinary shares or ADSs during that period may be liable, on return to the UK, to UK taxation on chargeable gains arising during the period of absence, subject to any available exemption, relief and/or foreign tax credit.
OTHER NON-UK RESIDENT PERSONS
Subject to the provisions set out above under Individuals, other than US holders, temporarily non-resident in the UK, shareholders or ADS holders who are neither resident nor ordinarily resident in the UK generally will not be liable for UK tax on chargeable gains unless they carry on a trade, profession or vocation in the UK through a branch or agency and the ordinary shares or ADSs are or have been used or held by or for the purposes of the branch or agency, in which case such shareholders or ADS holders might, depending on individual circumstances, be liable to UK tax on chargeable gains on any disposition of ordinary shares or ADSs. An individual holder of ordinary shares or ADSs who is only temporarily not resident in the UK may, under anti-avoidance legislation, still be liable for UK tax on chargeable gains realised, subject to any available exemption, relief and/ or foreign tax credit.
TAXATION OF DIVIDENDS
UK RESIDENTS
Lloyds Banking Group plc will not be required to withhold tax at source when paying a dividend on the ordinary shares or ADSs.
An individual shareholder or ADS holder who is resident in the UK for tax purposes will be entitled to a tax credit in respect of any dividend received from Lloyds Banking Group plc and will be taxable on the gross dividend, which is the aggregate of the dividend received and related tax credit. The value of the tax credit will be equal to one-ninth of the dividend received (and, therefore, 10 per cent of the gross dividend). The gross dividend will be treated as an individual’s marginal taxable income. The tax credit will, however, be treated as discharging the individual’s liability to income tax in respect of the gross dividend, unless and except to the extent that the gross dividend falls above the threshold for the higher rate of income tax. A UK resident individual shareholder or ADS holder who is liable to income tax at the higher rate or additional rate (higher rate is 40 per cent for the 2011-12 tax year, additional rate is 50 per cent for the 2011-12 tax year) will be subject to tax at the rate applicable to dividends for such shareholders or ADS holders (32.5 per cent for higher rate taxpayers for the 2011-12 tax year and 42.5 per cent for additional rate taxpayers for the 2011-12 tax year) on the gross dividend. The tax credit will be set against but will not fully discharge such shareholders’ or ADS holders’ tax liability on the gross dividend and they will have to pay additional tax. The additional tax is 22.5 per cent of the gross dividend for higher rate taxpayers and 32.5 per cent for additional rate taxpayers.
There will be no payment of the tax credit or any part of it to an individual whose liability to income tax on the dividend and the related tax credit is less than the tax credit.
UK resident shareholders or ADS holders who are not liable to UK tax on dividends, including pension funds and charities, will not be entitled to the payment of any tax credits in respect of dividends.
177
TAXATION
Subject to certain exceptions, such as for dealers in securities and for some insurance companies with overseas business, UK resident corporate shareholders or ADS holders will generally not be subject to corporation tax in respect of dividends received from Lloyds Banking Group plc, but will not be entitled to the payment of any tax credit with respect to the dividends.
Shareholders who are within the charge to corporation tax will be subject to corporation tax on dividends paid by the Company, unless (subject to special rules for such shareholders that are small companies) the dividends fall within an exempt class and certain other conditions are met. It is expected that the dividends paid by the Company would generally be exempt. Such shareholders will not be able to claim repayment of tax credits attaching to dividends.
US HOLDERS
Lloyds Banking Group plc will not be required to withhold tax at source when paying a dividend on the ordinary shares or ADSs to a US holder. US holders of ADSs or ordinary shares who receive a dividend from Lloyds Banking Group plc will not have any UK tax to pay in respect of the dividend.
OTHER NON-UK RESIDENT PERSONS
Lloyds Banking Group plc will not be required to withhold tax at source when paying a dividend on the ordinary shares or ADSs to a holder, other than a US holder, who is not resident for tax purposes in the UK.
Holders of ordinary shares or ADSs, other than US holders, who are not resident for tax purposes in the UK and who receive a dividend from Lloyds Banking Group plc will not have any UK tax to pay in respect of the dividend, but will not normally be able to claim any additional payment in respect of the dividend from the UK HM Revenue & Customs under any applicable Double Tax Treaty.
STAMP DUTY AND STAMP DUTY RESERVE TAX
UK RESIDENTS, US HOLDERS AND OTHER NON-UK RESIDENT PERSONS
Any conveyance or transfer on sale of ordinary shares (whether effected using the CREST settlement system or not) will be subject to UK stamp duty or stamp duty reserve tax (SDRT). The transfer on sale of ordinary shares will be liable to ad valorem UK stamp duty or SDRT, generally at the rate of 0.5 per cent of the consideration paid (rounded up to the next multiple of £5 in the case of stamp duty). Stamp duty is usually the liability of the purchaser or transferee of the ordinary shares. An unconditional agreement to transfer such ordinary shares will be liable to SDRT, generally at the rate of 0.5 per cent of the consideration paid, but such liability will be cancelled, or, if already paid, refunded, if the agreement is completed by a duly stamped transfer within six years of the agreement having become unconditional. SDRT is normally the liability of the purchaser or transferee of the ordinary shares.
Where Lloyds Banking Group plc issues ordinary shares or a holder of ordinary shares transfers such shares to the custodian or nominee for the depositary to facilitate the issue of ADSs to him representing the ordinary shares or to a person providing clearance services (or their nominee or agent), a liability to UK stamp duty or SDRT at the rate of 1.5 per cent (rounded up to the next multiple of £5 in the case of the stamp duty) of either the issue price or, in the case of transfer, the listed price of the ordinary shares, calculated in sterling, will arise. Where a holder of ordinary shares transfers such shares to the custodian or nominee for the depositary or clearance services this charge will generally be payable by the person receiving the ADSs or transferring the ordinary shares into the clearance service.
On 1 October 2009, the European Court of Justice (ECJ) ruled that such a charge, when levied in respect of an issue of shares into a clearance service, was prohibited by Article 11(a) of Council Directive 69/335/EEC. On 9 December 2009, the UK HM Revenue & Customs announced that, with immediate effect, the 1.5 per cent charge to SDRT on the issue of shares into a clearance service or depository receipt system within the European Union would no longer be applied. However, the limitation of their announcement to issues of shares into clearance or depository receipt systems within the European Union is disputed. There may be further implications of this decision, and in particular for the issue of shares into systems outside the European Union and for the treatment of transfers of shares after they have been placed into clearance services or depositary receipt schemes.
No liability to stamp duty or SDRT will arise as a result of the cancellation of any ADSs with the ordinary shares that they represent being transferred to the ADS holder.
No liability to UK stamp duty or SDRT will arise on a transfer of ADSs provided that any document that effects such transfer is not executed in the UK and that it remains at all subsequent times outside the UK. An agreement to transfer ADSs will not give rise to a liability to SDRT.
US FEDERAL INCOME TAX CONSIDERATIONS
The following summary describes material US federal income tax consequences of the ownership and disposition of ADSs or ordinary shares to the US holders described below, but it does not purport to be a comprehensive description of all of the tax considerations that may be relevant to a decision to hold such securities. The summary applies only to US holders that hold ADSs or ordinary shares as capital assets for US federal income tax purposes and does not address special classes of holders, such as:
|
|
|
|
– |
certain financial institutions; |
|
|
|
|
– |
dealers or traders in securities who use a mark-to-market method of tax accounting; |
|
|
|
|
– |
holders holding ADSs or ordinary shares as part of a hedge, straddle, conversion or other integrated transaction or holders entering into a constructive sale with respect to ADSs or ordinary shares; |
|
|
|
|
– |
holders whose functional currency for US federal income tax purposes is not the US dollar; |
|
|
|
|
– |
holders liable for alternative minimum tax; |
|
|
|
|
– |
holders who acquired ADSs or ordinary shares pursuant to the exercise of any employee stock option or otherwise as compensation; |
|
|
|
|
– |
tax-exempt entities, including ‘individual retirement accounts’ or ‘Roth IRAs’; |
|
|
|
|
– |
persons holding ADSs or ordinary shares in connection with a trade or business conducted outside of the United States; |
|
|
|
|
– |
partnerships or other entities classified as partnerships for US federal income tax purposes; or |
|
|
|
|
– |
holders that own or are deemed to own 10 per cent or more of the voting shares of Lloyds Banking Group plc. |
178
TAXATION
If an entity that is classified as a partnership for US federal income tax purposes holds ADSs or ordinary shares, the US federal income tax treatment of a partner will generally depend on the status of the partner and the activities of the partnership. Partnerships holding ADSs or ordinary shares and partners in such partnerships should consult their tax advisers as to the particular US federal income tax consequences of holding and disposing of the ADSs or ordinary shares.
The summary is based in part on representations of the depositary and assumes that each obligation provided for in or otherwise contemplated by the Deposit Agreement or any other related document will be performed in accordance with its terms. The US Treasury has expressed concerns that parties to whom American depositary shares are released before shares are delivered to the depositary (‘pre-release’), or intermediaries in the chain of ownership between holders and the issuer of the security underlying the American depositary shares, may be taking actions that are inconsistent with the claiming of foreign tax credits by US holders of American depositary shares. Such actions would also be inconsistent with the claiming of the reduced rate of tax applicable to dividends received by certain non-corporate US holders. Accordingly, the availability of the reduced tax rate for dividends received by certain non-corporate US holders, described below, could be affected by actions taken by such parties or intermediaries.
This summary is based upon tax laws of the US including the Internal Revenue Code of 1986, as amended (the Code), administrative pronouncements, judicial decisions and final, temporary and proposed Treasury Regulations, as well as the Treaty, all as of the date hereof, changes to any of which may affect the tax consequences described herein, possibly with retroactive effect. Prospective purchasers of the ADSs or ordinary shares should consult their tax advisers as to the US, UK or other tax consequences of the ownership and disposition of such securities in their particular circumstances, including the effect of any US state or local tax laws.
As used herein, a ‘US holder’ is a beneficial owner of ADSs or ordinary shares that is, for US federal income tax purposes:
|
|
|
|
– |
a citizen or resident of the United States; |
|
|
|
|
– |
a corporation, or other entity taxable as a corporation, created or organised in or under the laws of the United States, any state therein or the District of Columbia; or |
|
|
|
|
– |
an estate or trust the income of which is subject to US federal income taxation regardless of its source. |
In general, a US holder who owns ADSs should be treated as the owner of the underlying shares represented by those ADSs for US federal income tax purposes. Accordingly, no gain or loss should be recognised if a US holder exchanges ADSs for the underlying shares represented by those ADSs.
TAXATION OF DISTRIBUTIONS
Distributions paid on ADSs or ordinary shares, other than certain pro rata distributions of ordinary shares, will generally be treated as dividends to the extent paid out of Lloyds Banking Group plc’s current or accumulated earnings and profits (as determined in accordance with US federal income tax principles). Because Lloyds Banking Group plc does not maintain calculations of its earnings and profits under US federal income tax principles, it is expected that distributions generally will be reported to US holders as dividends. The dividends will generally be foreign-source dividend income to US holders and will not be eligible for the dividends-received deduction generally allowed to US corporations under the Code.
Subject to applicable limitations and the discussion above regarding concerns expressed by the US Treasury, certain dividends paid by qualified foreign corporations to certain non-corporate US holders in taxable years beginning before 1 January 2013 are taxable at a maximum tax rate of 15 per cent. A foreign corporation is treated as a qualified foreign corporation with respect to dividends paid on stock that is readily tradable on a securities market in the United States, such as the New York Stock Exchange where the Company’s ADSs are traded. US holders should consult their tax advisers to determine whether the favourable rate will apply to dividends they receive and whether they are subject to any special rules that limit their ability to be taxed at this favourable rate.
Dividends will be included in a US Holder’s income on the date of the US Holder’s or, in the case of ADSs, the depositary’s receipt of the dividend. The amount of a dividend will equal the US dollar value of the pounds sterling received, calculated by reference to the exchange rate in effect on the date of receipt regardless of whether the payment is converted into US dollars on the date of receipt. If the pounds sterling received as a dividend are not converted into US dollars on the date of receipt, then the US holder’s tax basis in the pounds sterling received will equal such dollar amount and the US holder may realise a foreign exchange gain or loss on the subsequent conversion into US dollars. Generally, any gains or losses resulting from the conversion of pounds sterling into US dollars will be treated as US source ordinary income or loss.
TAXATION OF CAPITAL GAINS
Gain or loss realised by a US holder on a sale or other disposition of ADSs or ordinary shares will be subject to US federal income tax as capital gain or loss in an amount equal to the difference between the US holder’s tax basis in the ADSs or ordinary shares disposed of and the amount realised on the disposition, in each case as determined in US dollars. Gains or losses, if any, will generally be US source and will be long-term if the US Holder held the ADSs or ordinary shares for more than one year.
INFORMATION REPORTING AND BACKUP WITHHOLDING
Dividends paid on, and the sale proceeds from, ADSs or ordinary shares that are made within the US or through certain US-related financial intermediaries generally are subject to information reporting requirements, and may be subject to backup withholding, unless the US holder:
|
|
|
|
– |
is an exempt recipient, or |
|
|
|
|
– |
in the case of backup withholding, the US holder provides a correct taxpayer identification number and certifies that it is not subject to backup withholding. |
The amount of any backup withholding from a payment to a US holder will be allowed as a credit against the holder’s US federal income tax liability and may entitle it to a refund, provided that the required information is timely furnished to the Internal Revenue Service.
179
WHERE YOU CAN FIND MORE INFORMATION
The documents concerning the Lloyds Banking Group which are referred to herein may be inspected at the Securities and Exchange Commission (SEC). you may read and copy any document filed or furnished by the Group at the SEC’s public reference rooms in Washington D.C., New york, New york and Chicago, Illinois. Please call the SEC at 1-800-SEC-0330 for further information on the reference rooms. The SEC also maintains a website at www.sec.gov which contains, in electronic form, each of the reports and other information that the Group has filed electronically with the SEC.
ENFORCEABILITY OF CIVIL LIABILITIES
Lloyds Banking Group plc is a public limited company incorporated under the laws of Scotland. Most of Lloyds Banking Group plc’s directors and executive officers and certain of the experts named herein are residents of the United Kingdom. A substantial portion of the assets of Lloyds Banking Group plc, its subsidiaries and such persons, are located outside the United States. As a result, it may not be possible for investors to effect service of process within the United States upon all such persons or to enforce against them in US courts judgments obtained in such courts, including those predicated upon the civil liability provisions of the federal securities laws of the United States. Furthermore, Lloyds Banking Group plc has been advised by its solicitors that there is doubt as to the enforceability in the United Kingdom, in original actions or in actions for enforcement of judgments of US courts, of certain civil liabilities, including those predicated solely upon the federal securities laws of the United States.
180
Set out below are certain risk factors which could affect Lloyds Banking Group’s future results and cause them to be materially different from expected results. The factors discussed below should not be regarded as a complete and comprehensive statement of all potential risks and uncertainties Lloyds Banking Group’s businesses face. For information on Lloyds Banking Group’s risk management policies and procedures, see Operating and financial review and prospects – Risk Management.
GOVERNMENT RELATED RISKS
The Commissioners of HM Treasury is the largest shareholder of the Company. Through its shareholding in, and other relationships with, the Company, HM Treasury is in a position to exert significant influence over the Group and its business.
HM Treasury holds approximately 40.1 per cent of the ordinary share capital of the Company. In the longer term, it is possible that the shareholding of HM Treasury may be diluted upon any further equity capital raising or potential conversion of the Company’s enhanced capital notes (the Enhanced Capital Notes or ECNs) into ordinary shares pursuant to their terms, although, in such case, it is expected that HM Treasury would remain a significant shareholder in the Company. It is also possible that the Group may seek to raise further capital or to obtain other support from the UK Government, which could result in an increase in HM Treasury’s shareholding in the Company.
No formal relationship agreement has been concluded between the Group and the UK Government in respect of its shareholding in the Company and no express measures are in place to limit the level of influence which may be exercised by HM Treasury. However, the relationship falls within the scope of the revised framework document between HM Treasury and UK Financial Investments Limited (UKFI) published on 1 October 2010, which states that UKFI will manage its investment in the UK financial institutions in which HM Treasury holds an interest ‘on a commercial basis and will not intervene in day-to-day management decisions of the Investee Companies (as defined herein) (including with respect to individual lending or remuneration decisions)’. The framework document also makes it clear that such UK financial institutions will continue to be separate economic units with independent powers of decision. Nevertheless, there is a risk that HM Treasury might seek to exert influence over the Group in relation to matters including, for example, commercial and consumer lending policies and management of the Group’s assets and/or business. There is also a risk of the existing framework document between HM Treasury and UKFI being replaced or amended, leading to interference in the operations of the Group, although there has been no indication that the UK Government intends to change the existing operating arrangements.
There is also a risk that, through the interest of HM Treasury in the Company, the UK Government and HM Treasury may attempt to influence the Group in other ways that would have a material adverse effect on the Group’s business, including, for example, through the election of directors, the appointment of senior management at the Company, staff remuneration policies, lending policies and commitments and management of the Group’s business (in particular, the management of the Group’s assets such as its existing retail and corporate loan portfolios, significant corporate transactions and the issue of new ordinary shares). Moreover, HM Treasury also has interests in other UK financial institutions, as well as an interest in the general health of the UK banking industry and the wider UK economy. The pursuit of those interests may not always be aligned with the commercial interests of the Group.
For more information see Risk Factors – Regulatory Risks – The Group’s businesses are subject to substantial regulation, and regulatory and governmental oversight. Adverse regulatory developments or changes in government policy could have a significant material adverse effect on the Group’s results of operations, financial condition and prospects.
The Group is subject to European state aid obligations following the approval of its restructuring plan. The implementation of this restructuring plan may have consequences that are materially adverse to the interests of the Group. Moreover, should the Group require additional state aid in the future, further restructuring measures could be required and these may be materially adverse to the interests of the Group.
On 18 November 2009 the European Commission approved a Restructuring Plan that the Group was required to submit as a result of HM Treasury’s investment in the Company in the context of the placing and open offer in November 2008. The principal elements of the Restructuring Plan seek to support the long-term viability of the Group and to remedy any distortions to competition and trade in the EU arising from the state aid that the Group has received, including HM Treasury’s subsequent participation in the Company’s placing and compensatory open offer in June 2009 and the Rights Issue in November 2009. It also seeks to address any commercial benefit received by the Group following its announcement in March 2009 of its then intention to participate in GAPS. The approval also covered the Group’s participation in HM Treasury’s Credit Guarantee Scheme from October 2008 up to June 2010. In the deed of withdrawal from GAPS in November 2009 (the GAPS Withdrawal Deed) the Company agreed with HM Treasury to comply with the terms of the European Commission’s decision.
The Group is subject to a variety of risks as a result of implementing the Restructuring Plan. There can be no assurance that the price that the Group receives for any assets disposed of in accordance with the Restructuring Plan will be at a level which the Group considers adequate or which it could obtain if the Group was not disposing of such assets in accordance with the Restructuring Plan. In particular, should the Group fail to complete the disposal of the retail banking business that it is required to divest by the end of November 2013, then in the absence of any time extension being granted by the European Commission, a divestiture trustee would be appointed to conduct the sale, with a mandate to complete the disposal with no minimum price (including at a negative price). As a direct consequence of implementing the Restructuring Plan, the Group will lose existing customers, deposits and other assets (and may also lose additional customers, deposits and other assets indirectly through damage to the rest of the Group’s business as a result of implementing the Restructuring Plan). It may also lose the potential for realising additional associated revenues and margins that it otherwise might have achieved in the absence of such disposals. Moreover implementation may result in disruption to the retained businesses, impacting customers and necessitating potentially significant separation costs. Implementation may also have a negative impact on the Group’s competitive position, including through the emergence of new competitors particularly in the creation of a viable competitor through the retail banking business disposal.
Should the Group require further state aid that was not covered in the European Commission’s approval decision of 18 November 2009, the Group may have to commit to further restructuring measures, which could be materially adverse to the interests of the Group.
For more detail on the principal elements of the Restructuring Plan and associated timescales see Operating and financial review and prospects – Risk Management – State funding and state aid.
181
RISK FACTORS
The Group has agreed to undertakings with HM Treasury in relation to the operation of its business. The Group has also agreed to certain other commitments in the GAPS Withdrawal Deed, and subsequently. These undertakings and commitments could have a material adverse effect on the Group’s results of operations, financial condition and prospects and limit operational flexibilities.
In connection with HM Treasury’s participation in the placing and open offers in November 2008 and June 2009, the Group’s participation in the Credit Guarantee Scheme and its then proposed participation in GAPS, the Group provided undertakings aimed at ensuring that the acquisition by HM Treasury of the Group’s shares and the participation of the Group in the UK Government funding scheme was consistent with the then current European state aid clearance. These undertakings included (i) supporting UK Government policy in relation to mortgage lending and lending to businesses through to the end of February 2011; (ii) regulating the remuneration of management and other employees; and (iii) regulating the rate of growth of the Group’s balance sheet.
For more information see Major Shareholders and Related party Transactions – Other Related Party Transactions with the UK Government.
The formal lending commitments period described above has now expired. In February 2011, the Group (together with Barclays, HSBC, RBS and Santander) announced, as a part of the ‘Project Merlin’ agreement with HM Treasury, its capacity and willingness to increase its gross business lending (including to small and medium-sized enterprises) during the 2011 calendar year. At the same time, the Group (together with Barclays, HSBC and RBS) announced its intentions in relation to a number of other areas, including its continuing support for the recommendations of the BBA Business Finance Taskforce, certain aspects of remuneration policy and its support for the proposed Business Growth Fund and Big Society Capital.
The ‘Project Merlin’ agreement was not a formal contract between the Group and HM Treasury. The Company has made a unilateral lending pledge for 2012 as part of its publicly announced SME Charter. However, there remains a risk that current or future requirements introduced by HM Treasury could have a materially adverse effect on the operations of the Group.
BUSINESS AND ECONOMIC RISKS
The Group’s businesses are subject to inherent risks arising from general and sector-specific economic conditions in the UK and other markets in which it operates. Adverse developments, particularly in the UK and the Eurozone, could cause the Group’s earnings and profitability to decline.
The Group’s businesses are subject to inherent risks arising from general and sector-specific economic conditions in the markets in which it operates, particularly the United Kingdom, in which the Group’s earnings are predominantly generated. Any significant deterioration in the UK and/or other economies in which the Group operates could have a material adverse impact on the future results of operations of the Group. Additionally, the profitability of the Group’s businesses could be affected by increased insurance and other claims arising from market factors such as increased unemployment, which may continue even following the return to economic growth in certain parts of the markets in which the Group operates. Lack of, or reduced economic growth in the UK, higher unemployment in the UK or elsewhere or, the lack of economic growth in the UK, reduced corporate profitability, reduced personal income levels, reduced Government and/or consumer expenditure, increased personal or corporate insolvency rates, increased tenant defaults or increased interest rates may reduce borrowers’ ability to repay loans and may cause prices of residential or commercial real estate or other asset prices to fall further, thereby reducing the collateral value on many of the Group’s assets. These, in turn, could cause increased impairments and/or fair value adjustments.
In addition to the possibility of further economic deterioration, financial market instability represents another downside risk. The Group has significant exposures, particularly by way of loans, in a number of overseas jurisdictions, notably the Republic of Ireland, Spain, Australia and the United States, and is therefore subject to a variety of risks relating to the performance of those economies as well. The global financial system has suffered considerable turbulence and uncertainty in recent years and the outlook for the global economy over the near to medium term remains challenging. In Europe, the ongoing economic deterioration of several countries, including Greece, Italy, the Republic of Ireland, Spain and Portugal, together with the risk of contagion to other, more stable countries, has exacerbated further the global economic crisis. In particular, the risk of default on the sovereign debt of those countries and the impact this would have on the Eurozone countries, including the potential that some countries (albeit those with a relatively small GDP) could leave the Eurozone (either voluntarily or involuntarily) has raised concerns about the ongoing viability of the euro currency and the European Monetary Union (EMU). Despite the various rescue packages and other stabilising measures adopted throughout Europe to deal with the worsening Eurozone sovereign debt crisis, global markets continue to record high levels of volatility and uncertainty. Uncertainty over the best way forward for the highly indebted Eurozone persists and poses a serious threat to the global economic recovery, with the spread of political instability and contagion to other Eurozone countries increasing in the last quarter of 2011. Financial markets are expected to remain dislocated and volatile, with the risk of contagion unlikely to dissipate in the near term, and this continues to place strains on funding markets at a time when many financial institutions (in particular) have material ongoing funding needs. In 2011, continuing concerns about the fiscal position in Eurozone countries resulted in increased credit spreads in the areas affected, and fears of contagion affected the Euro and widened spreads between central bank and interbank rates. The Group has exposure to Corporates, Financial Institutions and securities which may have material direct and indirect exposures in these countries. With the exception of the Group’s lending exposures in the Republic of Ireland and Spain, its direct exposure to the Eurozone through sovereign and private sector exposure is relatively small and has been managed steadily downward since 2008. However, a wide-scale break-up of the Eurozone would most likely be associated with a significant deterioration in the economic and financial environment in the UK and Eurozone that would materially affect the capital and the funding position of participants in the banking industry, including the Group. This could also give rise to operational disruptions to the business.
The effects
on the European and global economy of the potential dissolution of the EMU,
exit of one or more European Union member states from the EMU and the
redenomination of financial instruments from the euro to a different currency,
are impossible to predict and protect fully against in view of (i) economic and
financial instability in the Eurozone, (ii) the severity of the recent global
financial crisis, (iii) difficulties in predicting whether any recovery will be
sustained and at what rate, and (iv) the fact that many of the risks related to
the business are totally, or in part, outside the control of the Group.
However, if any such events were to occur they would likely: (a) result in
significant market dislocation; (b) heighten counterparty risk; (c) adversely
affect the management of market risk and in particular asset and liability
management due, in part, to redenomination of financial assets and liabilities;
and (d) have a material adverse effect on the financial condition, results of
operations and prospects of the Group. Any adverse changes affecting the
economies of the countries in which the Group has significant exposures,
including those discussed above and any further deterioration in global
economic conditions, could have a material adverse impact on the Group’s
operating results, financial conditions and prospects.
In 2011 and early 2012,
a number of UK and other European financial institutions, including Lloyds
Banking Group, Lloyds TSB Bank and other Group members and the sovereign debt
of several European countries experienced downgrades by one or more of the
major rating agencies in connection with the macroeconomic conditions,
prospects for growth, progression of structural reforms and austerity measures,
and in the case of the Group members, a review of the systemic support
assumptions incorporated into bank ratings and a reduction of implied UK
government support for the banking sector. The Group notes the February 2012
announcements from a leading rating agency placing the rating of 114 European
financial institutions, including Lloyds Banking Group, on review for
downgrade. Any downgrade of the UK sovereign credit rating or the credit rating
of any
182
RISK FACTORS
other country in which the Group has significant direct and/or indirect exposures, or the perception that such a downgrade may occur, may (i) destabilise the markets and the UK economy, (ii) have a material adverse effect on the Group’s operating results, financial condition and prospects, and (iii) adversely affect the Group’s counterparties, customers, suppliers or creditors, directly or indirectly, in ways which it is difficult to predict. These risks are exacerbated by the Eurozone sovereign debt crisis.
The Group’s businesses are inherently subject to the risk of market fluctuations, which could materially adversely affect its results of operations, financial condition and prospects.
The Group’s businesses are inherently subject to risks in financial markets and in the wider economy, including changes in, and increased volatility of, interest rates, inflation rates, credit spreads, foreign exchange rates, commodity, equity, bond and property prices and the risk that its customers act in a manner which is inconsistent with business, pricing and hedging assumptions.
Market movements will continue to have a significant impact on the Group in a number of key areas. For example, adverse market movements have had and would have an adverse effect, which could be material, upon the financial condition of the pension schemes of the Group. Banking and trading activities that are undertaken by the Group are subject to interest rate risk, foreign exchange risk, inflation risk and credit spread risk. For example, changes in interest rate levels, interbank margins over official rates, yield curves and spreads affect the interest rate margin realised between lending and borrowing costs. The potential for future volatility and margin changes remains. Competitive pressures on fixed rates or product terms in existing loans and deposits sometimes restrict the Group in its ability to change interest rates applying to customers in response to changes in official and wholesale market rates.
The insurance businesses of the Group face market risk arising, for example, from equity, bond and property markets in a number of ways depending upon the product and associated contract; for example, the annual management charges received in respect of investment and insurance contracts fluctuate, as do the values of the contracts, in line with the markets. Some of these risks are borne directly by the customer and some are borne by the insurance businesses. Some insurance contracts involve guarantees and options that increase in value in adverse investment markets. There is a risk that the insurance businesses will bear some of the cost of such guarantees and options. The insurance businesses also have capital directly invested in the markets that are exposed to market risk. The performance of the investment markets will thus have a direct impact upon the embedded value of insurance and investment contracts and the Group’s operating results, financial condition and prospects. Adverse market conditions affect investor confidence, which in turn can result in lower sales and/or reduced persistency.
For further information see Risk Factors – Business and Economic Risks – The Group’s businesses are subject to inherent risks arising from general and sector–specific economic conditions in the UK and other markets in which it operates. Adverse developments, particularly in the UK and the Eurozone, could cause the Group’s earnings and profitability to decline.
Changes in foreign exchange rates including US dollars, Euros and Australian dollars affect the value of assets and liabilities denominated in foreign currencies. Such changes and the degree of volatility with respect thereto may affect earnings reported by the Group. In the Group’s international businesses, earnings and net assets are denominated in local currencies, which will fluctuate with exchange rates in pounds sterling terms. In 2011 and the first quarter of 2012 it has been difficult to predict with any accuracy changes in market conditions, and such changes may have a material adverse effect on the Group’s operating results, financial condition and prospects.
Market conditions have resulted, and are expected to result in the future, in material changes to the estimated fair values of financial assets of the Group. Negative fair value adjustments have had, and may continue to have in the future, a further material adverse effect on the Group’s results of operations, financial condition and prospects. The accuracy of valuations may be affected by market disruptions, illiquidity and the potential ineffectiveness of hedging and other risk management strategies.
The Group has material exposures to securities and other investments, including asset-backed securities, structured investments and private equity investments that are recorded by the Group at fair value. These have been and may be subject to further negative fair value adjustments, particularly in view of unsettled market conditions and the fragility of economic recovery. In addition, in dislocated markets, hedging and other risk management strategies may not be as effective as they are in normal market conditions, due in part to the decreasing credit quality of hedge counterparties. Although the Board of Directors of the Company (the Board) believes that overall impairment charges for the Group have peaked against its base economic assumptions, asset valuations in future periods, reflecting prevailing market conditions, may result in further negative changes in the fair values of the Group’s financial assets and these may also translate into increased impairment charges. In addition, the value ultimately realised by the Group for its securities and other investments may be lower than their current fair value. Any of these factors could require the Group to record further negative fair value adjustments, which may have a material adverse effect on its operating results, financial condition or prospects. Material losses from the fair value of financial assets will also have an adverse impact on the Group’s capital ratios.
The Group has made asset redesignations as permitted by amendments to IAS 39 (Financial Instruments: Recognition and Measurement). The effect of such redesignations has been, and would be, that any effect on the income statement of movements in the fair value of such redesignated assets that have occurred since 1 July 2008, in the case of assets redesignated prior to 1 November 2008, or which may occur in the future, may not be recognised until such time as the assets become impaired or are disposed of.
In addition, in circumstances where fair values are determined using financial valuation models, the Group’s valuation methodologies may require it to make assumptions, judgements and estimates in order to establish fair value. These valuation models are complex and the assumptions used are difficult to make and are inherently uncertain, particularly in light of the uncertainty as to the strength of any global economic recovery and continuing downside risks (including continuously high indicators of deteriorating credit quality) and during periods of market volatility and illiquidity, and any consequential impairments or write-downs could have a material adverse effect on the Group’s operating results, capital ratios, financial condition and prospects.
The Group’s businesses are conducted in highly competitive environments and the Group’s financial performance depends upon management’s ability to respond effectively to competitive pressures.
The markets for UK financial services, and the other markets within which the Group operates, are highly competitive, and management expects such competition to intensify in response to competitor behaviour, consumer demand, technological changes, and the impact of consolidation, regulatory actions and other factors. The Group’s financial performance and its ability to capture additional market share depends significantly upon the competitive environment and management’s response thereto. Intervention by the UK Government and/or European bodies and/or governments of other countries in which the Group operates may impact the competitive position of the Group relative to its international competitors, which may be subject to different forms of government intervention, thus potentially putting the Group at a competitive disadvantage. Additionally, one effect of implementing the Restructuring Plan may be the emergence of one or more new viable competitors in the UK banking market or a material strengthening of one or more of the Group’s existing competitors in that market. Any of these factors or a combination thereof could result in a significant reduction in the profit of the Group.
For more information see Risk Factors – Competition Related Risks.
183
RISK FACTORS
CREDIT-RELATED RISKS
The Group’s businesses are subject to inherent risks concerning borrower and counterparty credit quality which have affected and are expected to continue to affect the recoverability and value of assets on the Group’s balance sheet.
The Group has exposures to many different products and counterparties, and the credit quality of its exposures can have a significant impact on its earnings. Credit risk arises in the Retail, Wholesale, Commercial and Wealth & International divisions, reflecting the risks inherent in the Group’s lending activities, and, to a lesser extent, in the Insurance division in respect of own funds. Adverse changes in the credit quality of the Group’s UK and/or international borrowers and counterparties, or in their behaviour or businesses, may reduce the value of the Group’s assets, and materially increase the Group’s write-downs and allowances for impairment losses. Credit risk can be affected by a range of factors, including global economic slowdown, changes in the rating of individual counterparties, the debt levels of individual contractual counterparties, reduced UK consumer and/or government spending (in light of the Group’s concentration in the UK), increased unemployment, reduced asset values, increased personal or corporate insolvency levels, reduced corporate profits, changes in interest rates, higher tenant defaults and any external factors of a legislative or regulatory nature. In recent years, the global banking crisis and economic downturn has driven cyclically high bad debt charges. The UK economy remains fragile. Consumer and business confidence is low, consumer spending has been falling over the past year, the reduction in public sector spending is deepening and exports are failing to offset domestic weakness. The possibility of further economic weakness remains. Financial market instability represents an additional downside risk. The Group has exposure in both the UK and internationally, including Europe, Republic of Ireland, United States and Australia, particularly in commercial real estate lending, where it has a high level of lending secured on secondary and tertiary assets. In particular the Group has significant exposure to certain individual counterparties in cyclically weak sectors and weakened geographic markets (such as the Republic of Ireland and Spain). In addition, the Group has concentrated country exposure in the United Kingdom and within certain industry sectors, namely real estate and real estate -related sectors. Retail customer portfolios (including those in Wealth & International) will remain strongly linked to the economic environment, with house price falls, unemployment increases, consumer over-indebtedness and rising interest rates among the factors that may impact on secured and unsecured retail exposures.
All new lending is dependent on the Group’s assessment of the customers’ ability to pay and there is an inherent risk that the Group has incorrectly assessed the credit quality or willingness of borrowers to pay, possibly as a result of incomplete or inaccurate disclosure by those borrowers, or as a result of the inherent uncertainty that is involved in the exercise of constructing models to estimate the true risk of lending to counterparties.
The Group estimates and establishes reserves for credit risks and potential credit losses inherent in its credit exposure. This process, which is critical to its results and financial condition, requires difficult, subjective and complex judgements, including forecasts of how these economic conditions might impair the ability of its borrowers to pay their loans. As is the case with any such assessments, there is always a risk that the Group will fail to identify the proper factors or that it will fail to estimate accurately the impact of factors that it identifies.
The ongoing Eurozone instability, the deterioration of capital market conditions, the global economic slowdown and measures adopted by the governments of individual countries have reduced and could further reduce households’ disposable income and businesses’ profitability and /or have a negative impact on customers’ ability to honour their obligations, which in turn would result in deterioration of the Group’s credit quality. If the continued uncertainty over the Eurozone, or the UK government and Eurozone austerity measures and public spending cuts result in the UK or Eurozone economic recovery slowing or faltering, it may lead to further weakening of counterparty credit quality and subsequent higher impairment charges or fair value statements in the Group’s lending and derivative portfolios. This could have a material adverse effect on the Group’s operations, financial condition and prospects. At present, default rates are cushioned by low rates of interest which have improved customer affordability, but the risk remains of increased default rates as interest rates start to rise.
Although the Board believes that overall impairments for the Group have peaked, against its base case economic assumptions, the risk remains that further material impairments in the Group’s portfolios could emerge, particularly in the event of any further deterioration in the economic environment. The performance of some of the Group’s exposures might deteriorate further even in the absence of further economic decline, particularly in the Republic of Ireland, where impairment charges recorded by the Group have been substantial. Any unforeseen material further impairments could have a significant adverse effect on the Group’s operations, financial condition and prospects.
Concentration of credit and market risk could increase the potential for significant losses.
The Group has exposure to concentration risk where its business activities focus particularly on a similar type of customer, product, industrial sector or geographic location, including the UK market.
As a result of the acquisition of HBOS, the composition of the Group’s wholesale portfolio materially changed, with much larger sectoral concentrations (for example in real estate and real estate related lending, leveraged lending, certain asset based lending products (for example, shipping), asset-backed securities and floating rate notes issued by financial institutions) and substantially greater overseas exposures, particularly in the Republic of Ireland, Australia and the US.
The acquisition of HBOS has increased the Group’s exposure to concentration risk, since the combination of the two portfolios inevitably gave rise to some greater concentrations than would otherwise have been permitted. Market conditions at present mean that it is difficult to achieve the required level of sales to ameliorate these concentrations.
The Group has significant real estate and real-estate related exposure, meaning that further decreases in residential or commercial property values and/or further tenant defaults are likely to lead to higher impairment charges, which could materially affect its operations, financial condition and prospects. HBOS had material exposure to the secondary and tertiary commercial real estate sector, including hotels and residential property developers, which has been particularly adversely affected by the recessionary environment. These concentrations in cyclically weak sectors, as well as exposure at various levels of the capital structure, mean that the heritage HBOS wholesale business is particularly exposed to high and volatile levels of impairments and may be subject to greater risk if conditions deteriorate beyond the Board’s base case assumptions.
The Group’s corporate lending portfolio also contains substantial exposure to large, mid-sized and private companies, as well as leveraged finance. These concentrations in cyclically weak sectors, coupled with a heritage HBOS strategy of supporting UK entrepreneurs and taking exposure at various levels of the capital structure, continue to give rise to significant single name and risk capital exposure. Whilst these exposures are adequately provided for within the Board’s base case assumptions, they remain vulnerable to downside risks.
The heritage HBOS portfolio in the Republic of Ireland is heavily exposed to the commercial (including hotel) and residential real estate sectors, which have been negatively impacted by the economic recession, whilst the portfolio in Australia has material exposure to real estate and leveraged lending. In the United States there are notable exposures to a number of sectors, which are cyclically weak and have been negatively impacted by the economic recession. As in the UK, the heritage HBOS portfolio overseas is also particularly exposed to a small number of long-term customer relationships and these single name concentrations place the Group at risk of loss should default occur.
184
RISK FACTORS
The Group’s efforts to divest, diversify or hedge its credit portfolio against concentration risks may not be successful and any concentration of credit risk could increase the potential for significant losses in its credit portfolio. In addition, any disruption in the liquidity or transparency of the financial markets may result in the Group’s inability to sell or syndicate securities, loans or other instruments or positions held, thereby leading to increased concentrations of such positions. These concentrations could expose the Group to losses if the mark-to-market value of the securities, loans or other instruments or positions declines causing the Group to take write-downs. Moreover, the inability to reduce the Group’s positions not only increases the market and credit risks associated with such positions, but also increases the level of risk-weighted assets on the Group’s balance sheet, thereby increasing its capital requirements and funding costs, all of which could adversely affect the Group’s operating results, financial condition and prospects.
The Group may be forced to record further credit valuation adjustments on securities insured or guaranteed by market-counterparties/insurers and credit counterparties, which could have a material adverse effect on the Group’s results of operations, financial condition and prospects.
The Group has credit exposure to market counterparties through securities insured or guaranteed by such parties and credit protection bought from such parties with respect to certain over-the-counter derivative contracts, mainly credit default swaps (CDS) which are recorded at fair value. The fair value of these CDS and other securities, and the Group’s exposure to the risk of default by the underlying counterparties, depend on the valuation and the perceived credit risk of the instrument insured or guaranteed or against which protection has been bought and the credit quality of the protection provider (e.g. the CDS counterparty). Market counterparties have been adversely affected by their exposure to residential mortgage-linked products, and their perceived creditworthiness has deteriorated significantly since 2007. Although the Group seeks to limit and manage direct exposure to market counterparties, indirect exposure may exist through other financial arrangements and counterparties. If the financial condition of market counterparties or their perceived creditworthiness deteriorates further, the Group may record further credit valuation adjustments on the underlying instruments insured by such parties. Any primary or indirect exposure to the financial condition or creditworthiness of these counterparties could have a material adverse impact on the results of operations, financial condition and prospects of the Group.
FINANCIAL SOUNDNESS RELATED RISKS
The Group’s businesses are subject to inherent risks concerning liquidity and funding, particularly if the availability of traditional sources of funding such as retail deposits or the access to wholesale funding markets continues to be limited or becomes more limited. The Group continues to be reliant on various legacy government facilities and will face refinancing risk as transactions under these facilities mature. Future use of generally available Open Market Operation facilities from central banks will be considered as part of normal liquidity management processes.
Liquidity and funding continues to remain a key area of focus for the Group and the industry as a whole. Like all major banks, the Group is dependent on confidence in the short and long term wholesale funding markets. Should the Group, due to exceptional circumstances, be unable to continue to source sustainable funding, its ability to fund its financial obligations could be impacted.
The Group’s profitability or solvency could be adversely affected if access to liquidity and funding is constrained or made more expensive for a prolonged period of time. Whilst the Group expects to have sufficient access to liquidity to meet its funding requirements even in a stressed scenario, a reduction in the Group’s short-term credit rating could result in outflows in excess of the Group’s liquidity resources, meaning that the Group might be unable to meet its liabilities. In addition, under extreme and unforeseen circumstances a prolonged and severe restriction on the Group’s access to liquidity (including government and central bank facilities) could affect the Group’s ability to meet its financial obligations as they fall due or to fulfil its commitments to lend, and in such extreme circumstances the Group may not be in a position to continue to operate without additional funding support, which it may be unable to access. These factors may have a material impact on the Group’s solvency, including its ability to meet its regulatory minimum liquidity requirements. These risks can be exacerbated by many enterprise-specific factors, including an over-reliance on a particular source of funding, or changes in credit ratings as well as market-wide phenomena such as market dislocation, regulatory change and major disasters.
There is also a risk that corporate and institutional counterparties may look to reduce aggregate credit exposures to the Group (or to all banks) which could increase the Group’s cost of funding and limit its access to liquidity. In addition, the funding structure employed by the Group may prove to be inefficient giving rise to a level of funding cost that is not sustainable longer term. The funding needs of the Group may increase and such increases may be material. The Group relies on customer savings and transmission balances, as well as ongoing access to the global wholesale funding markets and the legacy Credit Guarantee Scheme to meet its funding needs. The ability of the Group to gain access to wholesale and retail funding sources on satisfactory economic terms is subject to a number of factors outside its control, such as liquidity constraints, general market conditions, regulatory requirements, the encouraged or mandated repatriation of deposits by foreign wholesale or central bank depositors and loss of confidence in the UK banking system, any of which could affect the Group’s profitability or, in the longer term under extreme circumstances, its ability to meet its financial obligations as they fall due.
Medium-term growth in the Group’s lending activities will depend, in part, on the availability of retail deposit funding on appropriate terms, for which there is increasing competition. See Risk factors – Business and Economic Risks – The Group’s businesses are conducted in highly competitive environments and the Group’s financial performance depends upon management’s ability to respond effectively to competitive pressures. This reliance has increased in the recent past given the difficulties in accessing wholesale funding. The ongoing availability of retail deposit funding on appropriate terms is dependent on a variety of factors outside the Group’s control, such as general economic conditions and market volatility, the confidence of retail depositors in the economy, the financial services industry and in the Group, as well as the availability and extent of deposit guarantees. Increases in the cost of retail deposit funding will impact on the Group’s margins and affect profit, and a lack of availability of retail deposit funding could impact on the Group’s future growth.
Any loss in consumer confidence in the Group could significantly increase the amount of retail deposit withdrawals in a short space of time. Should the Group experience an unusually high and unforeseen level of withdrawals, in such extreme circumstances the Group may not be in a position to continue to operate without additional funding support, which it may be unable to access, which could have a material impact on the Group’s solvency.
The Group has relied substantially on the legacy Bank of England liquidity facilities as well as the legacy Credit Guarantee Scheme. The Group will continue to face a refinancing concentration during 2012 largely associated with the maturity of the Credit Guarantee Scheme issuance undertaken by the Group prior to the closure of that scheme. While the quantum is significantly reduced compared to 2011 and the Group expects that the impact of this refinancing concentration can be mitigated by a combination of alternative funding and reductions in the Group’s net wholesale funding requirement, there can be no assurance that these mitigation efforts will be successful, which could lead to liquidity constraints.
185
RISK FACTORS
The second half of 2011 saw more difficult funding markets as investor confidence was impacted by concerns over the US debt ceiling and subsequent downgrade. This was followed by increased fears over Eurozone sovereign debt levels, downgrades and possible defaults, and concerns are ongoing over the potential downside effects from financial market volatility.
If the continuing difficulties in the wholesale funding markets are not resolved or central bank provision of liquidity to the financial markets is abruptly curtailed, or the Group’s credit ratings are downgraded (See Risk factors – Financial Soundness Related Risks – The Group’s borrowing costs and access to the capital markets is dependent on a number of factors, and increased costs or reduction in access could materially adversely affect the Group’s results of operations, financial condition and prospects) it is likely that wholesale funding will prove even more difficult to obtain. Such increased refinancing risk, in isolation or in concert with the related liquidity risks noted above, could have a material adverse effect on the Group’s profitability and, in the longer term under extreme and unforeseen circumstances, its ability to meet its financial obligations as they fall due.
The Group’s borrowing costs and access to the capital markets is dependent on a number of factors, and increased costs or reduction in access could materially adversely affect the Group’s results of operations, financial condition and prospects.
In the fourth quarter of 2011, the Group experienced downgrades in its long-term rating of between one and two notches from three of the major rating agencies. The impact that the Group experienced following the downgrades was consistent with the Group’s modelled outcomes based on the stress testing framework. The Group’s stress testing shows that further credit rating downgrades may reduce investor appetite for some of the Group’s liability classes and, therefore, its funding capacity. The Group’s borrowing costs and issuance in the capital markets are dependent on a number of factors, and increased cost or reduction of capacity could materially adversely affect the Group’s results of operations, financial condition and prospects.
In particular, reduction in the credit rating of the Group or deterioration in the capital markets’ perception of the Group’s financial resilience could significantly increase its borrowing costs and limit its issuance capacity in the capital markets. As an indicator, during 2011 the spread between an index of ‘A’ rated long term senior unsecured bank debt and an index of similar ‘BBB’ rated Bank debt, both of which are publicly available, has ranged between 60 and 115 basis points. The applicability to and implications for the Group’s funding cost would depend on the type of issuance, and prevailing market conditions. The impact on the Group’s funding cost is subject to a number of assumptions and uncertainties and is therefore impossible to quantify precisely.
Downgrades of the Group’s long term debt rating could lead to additional collateral posting and cash outflow. A hypothetical simultaneous two notch downgrade of the Group’s long-term debt rating from all major rating agencies, after initial actions within management’s control, could result in an outflow of £11 billion of cash, £4 billion of collateral posting related to customer financial contracts and £24 billion of collateral posting associated with secured funding. These effects do not take into account additional management and restructuring actions that the Group has identified that could materially reduce the amount of required collateral postings under derivative contracts related to its own secured funding programmes.
The downgrades that the Group experienced in the fourth quarter of 2011, did not significantly change its borrowing costs, reduce its issuance capacity or require significant collateral posting. The Group notes the February 2012 announcements from a leading rating agency placing the ratings of 114 European financial institutions, including Lloyds Banking Group, on review for downgrade.
For further information see Risk Factors – Business and Economic Risks – The Group’s businesses are subject to interest risks arising from general and for sector-specific economic conditions in the UK and other markets in which it operates. Adverse developments, particularly in the UK and the Eurozone, could cause the Group’s earnings and profitability to decline.
The Group’s borrowing costs and access to capital markets could also be affected by regulatory developments such as the Independent Commission on Banking, Basel III, the Capital Requirements Directive, for example the removal of effective state guarantee behind investment banking, restrictions on the treatment of contingent convertible bonds or the imposition of capital surcharges. The return required by bondholders may also rise if the prospects of bail-in scenarios become more likely which would increase the Group’s funding costs. Unfavourable developments could materially adversely affect the Group’s access to liquidity, increase its funding costs and, hence, have a material adverse effect on the Group’s business, financial position and results of operations.
The Group is subject to the risk of having insufficient capital resources to meet the minimum required by regulators.
A perceived or actual shortage of capital could result in actions or sanctions, which may have a material adverse effect on the Group’s business, including its operating results, financial condition and prospects. This, in turn, may affect the Group’s capacity to continue its business operations, pay future dividends or pursue acquisitions or other strategic opportunities, impacting future growth potential. In response, if the Group raises additional capital through the issuance of share capital or capital instruments, existing shareholders or holders of debt of a capital nature may experience a dilution of their holdings.
The circumstances which could give rise to shortages of capital and force the Group to raise additional capital include the following:
|
|
|
|
|
|
• |
The Group may experience a depletion of its capital resources through increased costs or liabilities incurred as a result of the crystallisation of any of the other risk factors described elsewhere in this section. |
||
|
|
|
|
|
|
• |
The Group may experience an increased demand for capital. For example: |
||
|
|
|
|
|
|
|
– |
The Group is subject to extensive regulation and regulatory supervision in relation to the levels of capital in its business. The Group currently meets, and expects to continue to meet, all regulatory capital requirements. However, the FSA could, for example, impose new or revised minimum and buffer capital requirements, apply increasingly stringent stress case scenarios and/or change the manner in which it applies existing regulatory requirements to the Group. |
|
|
|
|
|
|
|
|
– |
Extensive regulatory reforms are being implemented within the EU and the UK relating to the proposals of the Basel Committee on Banking Supervision, known as ‘Basel III’, and the proposals of the UK’s Independent Commission on Banking. These reforms include: |
|
|
|
|
|
|
|
|
|
• |
increased minimum levels of capital and additional minimum capital buffers; |
|
|
|
|
|
|
|
|
• |
enhanced quality standards for capital including new requirements for capital instruments to be capable of write-down or conversion to equity in the event of the bank being deemed to be non-viable, which could apply to new and existing instruments; |
|
|
|
|
|
|
|
|
• |
increased risk weighting of assets, particularly in relation to market risk and counterparty credit risk; |
|
|
|
|
|
|
|
|
• |
the introduction of a minimum leverage ratio; |
186
RISK FACTORS
|
|
|
|
|
|
|
|
• |
additional capital buffers and reporting requirements for systemically important banks; and |
|
|
|
|
|
|
|
|
• |
the ring-fencing of the retail activities of banks from their investment banking activities. |
There still remains uncertainty about the detailed implementation of these reforms within the EU and the UK including the timing and any transitional arrangements. There is a risk that the reforms may give rise to higher regulatory capital expectations than the Group had anticipated within its strategic plans.
|
|
|
|
|
|
– |
The Group’s reported regulatory capital requirements depend upon the level of risk weighted assets calculated from the Group’s approved models. These are subject to regular review on a rolling basis to ensure that they remain appropriate in prevailing economic and business conditions. Additionally the Group is currently effecting a programme of new model roll-out and is in the process of some model replacement as a part of the integration of the HBOS and Lloyds TSB businesses. These reviews and new models may lead to increased levels of risk weighted assets, and so to lower reported capital ratios. |
|
|
|
|
|
|
– |
The Group’s life assurance and general insurance businesses in the UK are subject to capital requirements prescribed by the FSA, and the Group’s life and general insurance companies outside the UK are subject to local regulatory capital requirements. Solvency II, a fundamental review of the capital adequacy regime for the European insurance industry, aims to establish a revised set of EU-wide capital requirements where the required regulatory capital will be dependent upon the risk profile of the entities, together with risk management standards, that will replace the current Solvency I requirements. Solvency II is still in the later stages of development, but there is a risk that the final regime could increase the planned amount of regulatory capital which the Group’s life assurance and general insurance businesses are required to hold, thus decreasing the amount of capital available for other uses. |
|
|
|
|
|
• |
The Group holds an additional ‘management’ capital buffer over the regulatory minimum and buffer requirements. To an extent the Group determines the amount of the management buffer by reference to market expectations driven by the capital levels or targets amongst its peer banks or through the views of rating agencies or investors. However, the market’s view of the desirable optimum level of capital is evolving partly as a result of the changing regulatory environment and the changes made by rating agencies to their rating methodologies. Consequently the Group may experience pressure to increase its capital ratios as a result of increased market and rating agency expectations. |
|
The Group has been and could continue to be negatively affected by the soundness and/or the perceived soundness of other financial institutions, which could result in significant systemic liquidity problems, losses or defaults by other financial institutions and counterparties, and which could materially adversely affect the Group’s results of operations, financial condition and prospects.
The Group is subject to the risk of deterioration of the commercial soundness and/or perceived soundness of other financial services institutions within and outside the United Kingdom. Financial services institutions that deal with each other are interrelated as a result of trading, investment, clearing, counterparty and other relationships. This presents systemic risk and may adversely affect financial intermediaries, such as clearing agencies, clearing houses, banks, securities firms and exchanges with which the Group interacts on a daily basis, all of which could have an adverse effect on the Group’s ability to raise new funding. One potential source of increased systemic risk is presented by the market’s perception of Eurozone sovereign and bank borrowers in Italy, the Republic of Ireland, Greece, Portugal and Spain, as reflected in the quoted prices of bonds and credit default swaps for these borrowers.
The Group routinely executes a high volume of transactions with counterparties in the financial services industry, resulting in a significant credit concentration. A default by, or even concerns about the financial resilience of, one or more financial services institutions could lead to further significant systemic liquidity problems, or losses or defaults by other financial institutions, which could have a material and adverse effect on the Group’s results of operations, financial condition and prospects.
INSURANCE AND PENSION SCHEME RELATED RISKS
The Group’s insurance businesses and employee pension schemes are subject to risks relating to insurance claim rates, pension scheme benefit payment levels and changes in insurance customer and employee pension scheme member behaviour.
The life and pensions insurance businesses of the Group and its employee pension schemes are exposed to short-term and longer-term variability arising from uncertain longevity, mortality, morbidity and expense levels. Adverse developments in any of these factors will increase the size of the Group’s insurance and/or employee pension scheme liabilities and may adversely affect the Group’s financial condition and results of operations.
Customer behaviour in the life and pensions insurance business may result in increased propensity to cease contributing to or cancel insurance policies at a rate in excess of applicable business assumptions. Consequent reduction in policy persistency and fee income would have an adverse impact upon the profitability of the life and pensions business of the Group. The rate at which employee pension scheme members cease employment affects the aggregate amount of benefits payable by the schemes. This rate may differ from applicable business assumptions. Variances may increase the size of the Group’s aggregate pension liabilities and may adversely affect the Group’s financial condition and results of operations.
The general insurance businesses of the Group are exposed to the risk of uncertain insurance claim rates. For example, extreme weather conditions can result in high property damage claims, higher levels of theft can increase claims on home insurance and changes to unemployment levels can increase claims on loan protection insurance. These claims rates may differ from business assumptions and negative developments may adversely affect the Group’s financial condition and results of operations.
UK banks recognise an insurance asset in their balance sheets representing the Value of In-Force business (VIF) in respect of long-term life assurance contracts, being insurance contracts and investment contracts with discretionary participation features. This asset represents the present value of future profits expected to arise from the portfolio of in-force life assurance contracts. Adoption of this accounting treatment results in the earlier recognition of profit on new business, but subsequently a lower contribution from existing business, when compared to the recognition of profits on investment contracts under IAS 39 (Financial Instruments: Recognition and Measurement). Differences between actual and expected experience may have a significant impact on the value of the VIF asset, as changes in experience can result in significant changes to modelled future cash flows. The VIF asset is calculated based on best-estimate assumptions made by management, including mortality experience and persistency. If these assumptions prove incorrect, the VIF asset could be materially reduced, which in turn could have a material adverse effect on the Group’s financial condition and results of operations.
187
RISK FACTORS
REGULATORY RISKS (including risks arising from failing to comply with the applicable laws, regulations and codes)
The Group’s businesses are subject to substantial regulation, and regulatory and governmental oversight. Adverse regulatory developments or changes in government policy could have a significant material adverse effect on the Group’s results of operations, financial condition and prospects.
The Group’s businesses are subject to ongoing regulation and associated regulatory risks, including the effects of changes in the laws, regulations, policies, voluntary codes of practice and interpretations in the UK, the European Union and the other markets where it operates. This is particularly the case in the current market environment, which is witnessing increased levels of government and regulatory intervention in the banking sector, which the Group expects to continue for the foreseeable future. The UK Government, the FSA and other regulators in the UK, the European Union or overseas may intervene further in relation to areas of industry risk already identified, or in new areas, which could adversely affect the Group. Future changes are difficult to predict and could materially adversely affect the Group’s business.
Areas where changes could have an adverse impact include, but are not limited to:
|
|
|
|
(i) |
general changes in government, central bank or regulatory policy, or changes in regulatory regimes that may influence investor decisions in particular markets in which the Group operates, which may change the structure of those markets and the products offered or may increase the costs of doing business in those markets; |
|
|
|
|
(ii) |
external bodies applying or interpreting standards or laws differently to those applied by the Group; |
|
|
|
|
(iii) |
changes in competitive and pricing environments; |
|
|
|
|
(iv) |
further requirements relating to financial reporting, corporate governance, conduct of business and employee compensation; |
|
|
|
|
(v) |
expropriation, nationalisation, confiscation of assets and changes in legislation relating to foreign ownership; and |
|
|
|
|
(vi) |
changes to regulation and legislation relating to economic and trading sanctions, money laundering and terrorist financing. |
The Group continues to face political and regulatory scrutiny as a result of the Group’s perceived systemic importance following the acquisition of HBOS.
Evolving capital and liquidity requirements continue to be a priority for the Group (see Financial Soundness Related Risks – The Group is subject to the risk of having insufficient capital resources to meet the minimum required by regulators). The Basel Committee on Banking Supervision has put forward proposals for a reform package which changes the regulatory capital requirements and liquidity standards, introduces new definitions for the calculation of counterparty credit risk and leverage ratios, requires additional capital buffers and development of a global liquidity standard. Implementation of these changes is expected to be phased in between 2013 and 2018.
The publication of the ICB’s final report in September 2011 and the Government’s response to the report in December are significant steps in providing greater clarity on changes to the regulatory framework for the UK banking industry to secure greater financial stability.
The Government appointed an Independent Commission on Banking (ICB) to review possible measures to reform the banking system and promote stability and competition. The ICB published its final report on 12 September 2011 putting forward recommendations to require ring-fencing of the retail activities of banks from their investment banking activities and additional capital requirements beyond those required under current drafts of the Capital Requirements Directive IV. The Report also makes recommendations in relation to the competitiveness of the UK banking market, including enhancing the competition remit of the new Financial Conduct Authority (FCA), implementing a new industry-wide switching process by September 2013, and improving transparency. The ICB, which following the final report was disbanded, had the authority only to make recommendations, which the Government could choose to accept or reject.
The Government has endorsed the ICB’s proposals to ring-fence retail banking operations as part of a wider regulatory framework including capital and liquidity and effective macro- and micro-prudential supervision, which should remove any implicit tax-payers’ guarantee for the ring-fenced entities. Given that the Group is predominantly a retail and commercial bank, it would expect to be less affected by the implementation of a retail ring-fence, but believes it will be important for any transition period to be flexible in order to minimise any impact on economic growth, and for banks to implement the required structural changes.
The ICB also recommended that ring-fenced banks should hold a common equity capital base of at least 10 per cent to absorb the impact of potential losses or financial crises. The Government’s proposals on capital are of consistent with the capital targets the Group set in its strategic review in 2011 and, although much work remains to be done on the detail of the implementation of capital requirements, the Group is on track to achieve the capital levels the ICB recommends.
The Group expects the Government to provide further details of its plans in the spring of 2012 and to outline which of the proposals it intends to progress to legislation. The Group will continue to work with HM Treasury and its regulators in the coming months ahead of the publication of the final white paper.
On 27 January 2012, the Government published the Financial Services Bill. The proposed new UK regulatory architecture will see the transition of regulatory and supervisory powers from the FSA to the new Financial Conduct Authority (FCA) and Prudential Regulatory Authority (PRA). The PRA will be responsible for supervising banks, building societies and other large firms. The FCA will focus on consumer protection and market regulation. The Bill is also proposing new responsibilities and powers for the FCA. The most noteworthy are the proposed greater powers for the FCA in relation to competition and the proposal to widen its scope to include consumer credit. The Bill is expected to take effect in early 2013.
In April
2011, the FSA commenced an internal reorganisation as a first step in a process
towards the formal transition of regulatory and supervisory powers from the FSA
to the new FCA and PRA in 2013. Until this time the responsibility for
regulating and supervising the activities of the Group will remain with the
FSA. On 2 April the FSA will introduce a new ‘twin peaks’ model and the intention
is to move the FSA as close as possible to the new style of regulation outlined
in the Bill. There will be two independent groups of supervisors for banks,
insurers and major investment firms covering prudential and conduct. (All other
firms (those not dual regulated) will be solely supervised by the conduct
supervisors.)
In addition, the European Banking Authority, the European
Insurance and Occupational Pensions Authority and the European Securities and
Markets Authority, as new EU Supervisory Authorities, are likely to have
greater influence on regulatory matters across the EU.
The Bribery Act 2010 came fully into force on 1 July 2011. It enhances previous laws on bribery and is supported by some detailed guidance issued by the Ministry of Justice on the steps a business needs to take to embed ‘adequate procedures’ to prevent bribery. A company convicted of failing to have ‘adequate procedures’ to prevent bribery could receive an unlimited fine.
188
RISK FACTORS
The Group takes very seriously its responsibilities for complying with legal and regulatory sanctions requirements in all the jurisdictions in which it operates. In order to assist adherence to relevant economic sanctions legislation, the Group has enhanced its internal compliance processes including those associated with customer and payment screening. The Group has continued the delivery of a programme of staff training regarding policies and procedures for detecting and preventing economic sanctions non-compliance.
Significant regulatory initiatives from the US impacting the Group include the Dodd-Frank Act which imposes specific requirements for systemic risk oversight, asset securitisation activities, securities market conduct and oversight, bank capital standards, arrangements for the liquidation of failing systemically significant financial institutions and restrictions to the ability of banking entities to engage in proprietary trading activities and make investments in certain private equity and hedge funds (known as the ‘Volcker Rule’). Furthermore, under the so-called swap ‘push-out’ provisions of the Dodd-Frank Act, the derivatives activities of US banks and US branch offices of foreign banks will be restricted, which may necessitate a restructuring of how the Group conducts its derivatives activities. Entities that are swap dealers, security-based swap dealers, major swap participants or major security-based swap participants will be required to register with the SEC or the US Commodity Futures Trading Commission, or both, and will become subject to the requirements as to capital, margin, business conduct, recordkeeping and other requirements applicable to such entities. The Dodd-Frank Act also grants the SEC discretionary rule-making authority to impose a new fiduciary standard on brokers, dealers and investment advisers, and expands the extraterritorial jurisdiction of US courts over actions brought by the SEC or the United States with respect to violations of the antifraud provisions of the Securities Act of 1933, the Securities Exchange Act of 1934 and the Investment Advisers Act of 1940. The details of these regulations will depend on the final regulations ultimately adopted by various US regulatory authorities. In addition, the Foreign Account Tax Compliance Act (FATCA) requires non-US financial institutions to enter into disclosure agreements with the US Treasury and all non-financial non-US entities to report and/or certify their ownership of US assets in foreign accounts or be subject to 30 per cent withholding tax.
At a European level, the pace of regulatory reform has increased with a number of new directives or changes to existing directives planned in the next 12 months including a revised Markets in Financial Instruments Directive, Transparency Directive, Insurance Mediation Directive, Alternative Investment Fund Managers Directive, Prospectus Directive and a Fifth Undertakings In Collective Investments in Transferable Securities Directive as well as a proposed Directive regulating Packaged Retail Investment Products. The Insurance division is also continuing to progress its plans to achieve Solvency II compliance.
The Group is continually assessing the impacts of legal and regulatory developments which could have a material effect on the Group and will participate in relevant consultation and calibration processes to be undertaken by the various regulatory and other bodies. Implementation of the foregoing regulatory developments could result in additional costs or limit or restrict the way that the Group conducts business, although uncertainty remains about the details, impact and timing of these reforms. The Group continues to work closely with regulatory authorities and industry associations to ensure that it is able to identify and respond to proposed regulatory changes and mitigate against risks to the Group and its stakeholders.
The Group is exposed to various forms of regulatory risk in its operations, including the risk of mis-selling financial products, acting in breach of legal or regulatory principles or requirements and giving negligent advice, any of which could have a material adverse effect on its results or its relations with its customers.
The Group is exposed to various forms of regulatory risk in its operations including:
|
|
|
|
(i) |
certain aspects of the Group’s business may be determined by the relevant authorities, the Financial Ombudsman Service (the FOS) or the courts not to have been conducted in accordance with applicable laws or regulations, or, in the case of the FOS, with what is fair and reasonable in the Ombudsman’s opinion; |
|
|
|
|
(ii) |
the possibility of alleged mis-selling of financial products or the mishandling of complaints related to the sale of such products by or attributed to a member of the Group, resulting in disciplinary action or requirements to amend sales processes, withdraw products, or provide restitution to affected customers, all of which may require additional provisions; |
|
|
|
|
(iii) |
the high level of scrutiny of the treatment of customers by financial institutions from regulatory bodies, the press and politicians; the FSA in particular continues to drive focus on conduct of business activities through its supervision activity. |
|
|
|
|
(iv) |
contractual obligations may either not be enforceable as intended or may be enforced against the Group in an adverse way; |
|
|
|
|
(v) |
the Group holds accounts for a number of customers that might be or are subject to interest from various regulators and authorities including the Serious Fraud Office or similar regulators in the United States or other jurisdictions. The Group is not aware of any current investigation into the Group as a result of any such interest but cannot exclude the possibility of its conduct being reviewed as part of any such investigations; |
|
|
|
|
(vi) |
the intellectual property of the Group (such as trade names) may not be adequately protected; |
|
|
|
|
(vii) |
the Group may be liable for damages to third parties harmed by the conduct of its business; and |
|
|
|
|
(viii) |
the risk of regulatory proceedings and private litigation, arising out of regulatory investigations or otherwise (brought by individuals or groups of plaintiffs) in the UK and other jurisdictions. |
The Group may settle litigation or regulatory proceedings prior to a final judgment or determination of liability. The Group may do so to avoid the cost, management efforts or negative business, regulatory or reputational consequences of continuing to contest liability, even when the Group believes that it has no liability. The Group may also do so when the potential consequences of failing to prevail would be disproportionate to the costs of settlement. Furthermore, the Group may, for similar reasons, reimburse counterparties for their losses even in situations where the Group does not believe that it is legally compelled to do so.
Such matters are subject to many uncertainties, and the outcome of individual matters is not predictable.
Failure to manage these risks adequately could impact the Group adversely and materially, both financially and reputationally.
The financial impact of regulatory risks might be considerable but are difficult to quantify. Amounts eventually paid may exceed the amount of provisions set aside to cover such risks.
Companies within the Group are responsible for contributing to compensation schemes such as the UK Financial Services Compensation Scheme (FSCS) in respect of banks and other authorised financial services firms that are unable to meet their obligations to customers. Going forward, further provisions in respect of these costs are likely to be necessary. The ultimate cost to the industry, which will also include the cost of any compensation payments made by the FSCS and, if necessary, the cost of meeting any shortfall after recoveries on the borrowings entered into by the FSCS, remains uncertain but may be significant and may have a material adverse effect on the results of operations and financial condition of the Group.
189
RISK FACTORS
BANKING ACT 2009 RELATED RISKS
The Group and its UK subsidiaries may be subject to the provisions of the Banking Act 2009 in the future. The potential impact on the Group is inherently uncertain
Under the Banking Act 2009 (the Banking Act), substantial powers have been granted to HM Treasury, the Bank of England and the FSA (together the Authorities) as part of the special resolution regime (the SRR). These powers enable the Authorities to deal with and stabilise UK-incorporated institutions with permission to accept deposits pursuant to Part IV of the FSMA that are failing or are likely to fail to satisfy the threshold conditions (within the meaning of section 41 of the FSMA). The SRR consists of three stabilisation options: (i) transfer of all or part of the business of the relevant entity or the shares of the relevant entity to a private sector purchaser; (ii) transfer of all or part of the business of the relevant entity to a ‘bridge bank’ wholly-owned by the Bank of England; and (iii) temporary public ownership of the relevant entity. HM Treasury may also take a parent company of a relevant entity into temporary public ownership where certain conditions are met. The Banking Act also provides for two new insolvency and administration procedures for relevant entities. Certain ancillary powers include the power to modify certain contractual arrangements in certain circumstances.
In general, the Banking Act requires the Authorities to have regard to specified objectives in exercising the powers provided for by the Banking Act. One of the objectives (which is required to be balanced as appropriate with the other specified objectives) refers to the protection and enhancement of the stability of the financial system of the United Kingdom. The Banking Act includes provisions related to compensation in respect of transfer instruments and orders made under it. The Authorities are also empowered by order to amend the law for the purpose of enabling the powers under the SRR to be used effectively. An order may make provision which has retrospective effect. In general, there is considerable uncertainty about the scope of the powers afforded to Authorities under the Banking Act and how the Authorities may choose to exercise them.
COMPETITION RELATED RISKS
The Independent Commission on Banking and the UK Treasury Select Committee have reviewed competition in the UK retail banking industry. The potential impact of the recommendations is inherently uncertain and could have a material adverse effect on the interests of the Group.
The UK Government appointed an Independent Commission on Banking (ICB) to review competition and financial stability in the UK banking sector. The ICB published its final report on 12 September 2011, and is now disbanded. The Government gave its initial response to the report on 19 December 2011, supporting the ICB and Treasury Select Committee recommendations to implement a new industry-wide 7 day current account switching process by September 2013, and to amend the Financial Services Bill to enhance the competition remit of the Financial Conduct Authority with implementation likely in 2013. The Government also confirmed it will continue to consider the best ways to promote transparency, and that it has no intention to use its shareholding to deliver an enhancement of the Verde divestment. The Group continues to work with HM Treasury and other stakeholders to progress the recommendations.
For more information see Risk factors – Regulatory Risks – The Group’s businesses are subject to substantial regulation, and regulatory and governmental oversight. Adverse regulatory developments or changes in government policy could have a significant material adverse effect on the Group’s results of operations, financial condition and prospects and Regulation – other bodies impacting the regulatory regime.
OPERATIONAL RISKS AND RELATED ISSUES
The Group could fail to attract or retain senior management or other key employees.
The Group’s success depends on its ability to attract, retain and develop high calibre talent. Achievement of this aim cannot be guaranteed, particularly in light of ongoing regulatory and public interest in remuneration practices (the Group is subject to the FSA’s Remuneration Code). The Group also made a number of other commitments regarding its pay policy, including those set out within the statement agreed with the Government as part of ‘Project Merlin’, encompassing pay governance, transparency and engagement with its shareholders on pay policy.
The Group’s continuing structural consolidation and the sale of part of the branch network under Project Verde may result in disruption to its ability to lead and manage its people effectively and macroeconomic conditions and negative media attention on the banking sector may impact retention, colleague sentiment and engagement.
Failure to attract and retain senior management and key employees could have a material adverse impact on the Group’s financial results, operational effectiveness, and presents a significant risk to the delivery of the Group’s overall strategy.
Weaknesses or failures in the Group’s internal processes and procedures and other operational risks could materially adversely affect the Group’s results of operations, financial condition and prospects and could result in reputational damage.
Operational risks, through inadequate or failed internal processes and/or systems (including financial reporting and risk monitoring processes) or from people-related or external events, including the risk of fraud and other criminal acts (such as cyber attack) carried out against the Group, are present in the Group’s businesses. The Group’s businesses are dependent on processing and reporting accurately and efficiently a high volume of complex transactions across numerous and diverse products and services, in different currencies and subject to a number of different legal and regulatory regimes. Any weakness in these internal controls and processes could have a negative impact on the Group’s results, reporting such results, and on the ability to deliver appropriate customer outcomes, during the affected period. Furthermore, damage to the Group’s reputation (including to customer confidence) arising from actual or perceived inadequacies, weaknesses or failures in Group systems or processes could have a significant adverse impact on the Group’s businesses.
Notwithstanding anything in this risk factor, this risk factor should not be taken as implying that either the Company or any relevant company within the Group will be unable to comply with its obligations as a company with securities admitted to the Official List or as a supervised firm regulated by the FSA.
Terrorist acts, other acts of war, geopolitical, pandemic or other such events could have a material adverse impact on the Group’s results of operations, financial condition and prospects.
Terrorist acts, other acts of war or hostility, geopolitical, pandemic or other such events and responses to those acts/events may create economic and political uncertainties, which could have a material adverse impact on UK and international economic conditions generally, and more specifically on the business and results of the Group in ways that cannot necessarily be predicted.
190
RISK FACTORS
OTHER RISKS
The Group’s financial statements are based in part on assumptions and estimates which, if wrong, could cause losses in the future.
The preparation of financial statements requires management to make judgements, estimates and assumptions that affect the reported amounts of assets, liabilities, income and expenses. Due to the inherent uncertainty in making estimates, actual results reported in future periods may be based upon amounts which differ from those estimates. Estimates, judgements and assumptions are continually evaluated and are based on historical experience and other factors, including expectations of future events that are believed to be reasonable under the circumstances. Revisions to accounting estimates are recognised in the period in which the estimate is revised and in any future periods affected. The accounting policies deemed critical to the Group’s results and financial position, based upon materiality and significant judgements and estimates, include impairment of financial assets; valuation of financial instruments; pensions; insurance and taxation; are discussed in detail in ‘Critical accounting estimates and judgements’ set out on pages F-21 to F-24 of this document.
If the judgement, estimates and assumptions used by the Group in preparing its consolidated financial statements are subsequently found to be incorrect, there could be a material impact on the Group’s results of operations and a corresponding impact on its funding requirements and capital ratios.
The Company is a holding company and as a result, is dependent on dividends from its subsidiaries to meet its obligations including its obligations with respect to its debt securities, and to provide profits for payment of future dividends to shareholders.
The Company is a non-operating holding company and as such the principal sources of its income are from operating subsidiaries which also hold the principal assets of the Group. As a separate legal entity, the Company relies on remittance of their profits and other funds in order to be able to pay obligations to shareholders and debt holders as they fall due, which remittance is subject to certain restrictions. Further information on these restrictions is set out under Dividends.
In order to pay dividends, UK subsidiaries need to have distributable reserves. Whilst the Company’s direct subsidiary, Lloyds TSB Bank plc, has distributable reserves, one of the Company’s indirect principal subsidiaries, Bank of Scotland plc, does not and is currently unable to pay dividends. There is a risk that any profits earned by Bank of Scotland plc and its subsidiaries cannot be remitted to the holding company as dividends. This risk is mitigated if management elect to restructure the capital resources of a subsidiary entity.
The restrictions imposed upon the Company’s ability to pay dividends as part of the European Commission’s restructuring plan following the Company’s receipt of state aid expired on 31 January 2012.
Possible volatility in the price of Lloyds Banking Group plc ordinary shares.
The market price of Lloyds Banking Group plc ordinary shares could be volatile and subject to significant fluctuations due to a variety of factors, including changes in market sentiment regarding Lloyds Banking Group plc ordinary shares (or securities similar to them), economic or political disruption in the main jurisdictions in which the Group operates any regulatory changes affecting the Group’s operations, variations in its operating results, developments in the industry or its competitors, the operating and share price performance of other companies in the industries and markets in which the Group operates, or speculation about the Group’s business in the press, media or investment communities. Stock markets have from time to time, including recently and particularly with respect to certain financial institution shares, experienced significant price and volume fluctuations. Such fluctuations have affected market prices for securities, including Lloyds Banking Group plc ordinary shares, and may be unrelated to the Group’s operating performance or prospects. Furthermore, the Group’s operating results and prospects from time to time may be below the expectations of rating agencies, market analysts and investors. Any of these events could result in a decline in the market prices of Lloyds Banking Group plc ordinary shares. In general, prospective investors should be aware that the value of an investment in Lloyds Banking Group plc ordinary shares may go down as well as up.
Failure to manage the risks associated with changes in taxation rates or law, or misinterpretation of the law, could materially and adversely affect the Group’s results of operations, financial condition and prospects.
Tax risk is the risk associated with changes in taxation rates or law, or misinterpretation of the law. This could result in increased charges, financial loss including penalties, and reputational damage. Failure to manage these risks adequately could impact the Group materially and adversely and could have a material negative impact on the Group’s performance or reputation.
Following the acquisition of HBOS, any further increase in HM Treasury’s shareholding percentage in the Company, or the aggregation of HM Treasury’s interests with that of other shareholders holding 5 per cent or more, could lead to the Group suffering adverse tax consequences.
Certain companies in the Group have material tax losses and reliefs which they anticipate carrying forward to reduce tax payable in the future and restrictions on the ability to utilise these losses and reliefs could affect the post-tax profitability and capital position of the Group.
Following the acquisition of HBOS, actions which could possibly cause the loss of these reliefs to occur would include any further increase in HM Treasury’s shareholding in the Company, or the aggregation of HM Treasury’s interests with that of other shareholders holding 5 per cent or more. These actions, if coupled with the occurrence of certain specified events in relation to the Group companies (including a major change in the nature or conduct of a trade carried on by such a Group company or an increase in capital of such a Group company with an investment business) would, in the case of legacy HBOS Group companies, and could, in the case of legacy Lloyds TSB Group companies, cause restrictions on the ability to utilise these losses and reliefs.
The Company considers that it will be able to conduct its business, and the business of the Group, in a manner which avoids the occurrence of these specified events. However, the ability to do so cannot be predicted with any certainty at the date of this document.
191
This annual report includes certain forward looking statements within the meaning of the US Private Securities Litigation Reform Act of 1995 with respect to the business, strategy and plans of Lloyds Banking Group and its current goals and expectations relating to its future financial condition and performance. Statements that are not historical facts, including statements about Lloyds Banking Group’s or its directors’ and/or management’s beliefs and expectations, are forward looking statements. Words such as ‘believes’, ‘anticipates’, ‘estimates’, ‘expects’, ‘intends’, ‘aims’, ‘potential’, ‘will’, ‘would’, ‘could’, ‘considered’, ‘likely’, ‘estimate’ and variations of these words and similar future or conditional expressions are intended to identify forward looking statements but are not the exclusive means of identifying such statements. By their nature, forward looking statements involve risk and uncertainty because they relate to events and depend upon circumstances that will occur in the future.
Examples of such forward looking statements include, but are not limited to, projections or expectations of the Group’s future financial position including profit attributable to shareholders, provisions, economic profit, dividends, capital structure, expenditures or any other financial items or ratios; statements of plans, objectives or goals of Lloyds Banking Group or its management including in respect of certain synergy targets; statements about the future business and economic environments in the United Kingdom (UK) and elsewhere including future trends in interest rates, foreign exchange rates, credit and equity market levels and demographic developments; statements about competition, regulation, disposals and consolidation or technological developments in the financial services industry; and statements of assumptions underlying such statements.
Factors that could cause actual business, strategy, plans and/or results to differ materially from the plans, objectives, expectations, estimates and intentions expressed in such forward looking statements made by the Group or on its behalf include, but are not limited to the risks identified above under Risk factors as well as: general economic and business conditions in the UK and internationally; inflation, deflation, interest rates and policies of the Bank of England, the European Central Bank and other G8 central banks; fluctuations in exchange rates, stock markets and currencies; the ability to access sufficient funding to meet the Group’s liquidity needs; changes to the Group’s credit ratings; the ability to derive cost savings and other benefits including, without limitation, as a result of the integration of HBOS and the Group’s Simplification Programme; changing demographic developments including mortality and changing customer behaviour including consumer spending, saving and borrowing habits; changes to borrower or counterparty credit quality; instability in the global financial markets including Eurozone instability; technological changes; natural and other disasters, adverse weather and similar contingencies outside the Group’s control; inadequate or failed internal or external processes, people and systems; terrorist acts and other acts of war or hostility and responses to those acts, geopolitical, pandemic or other such events; changes in laws, regulations, taxation, accounting standards or practices; regulatory capital or liquidity requirements and similar contingencies outside the Group’s control; the policies and actions of governmental or regulatory authorities in the UK, the European Union (EU), the US or elsewhere; the ability to attract and retain senior management and other employees; requirements or limitations imposed on the Group as a result of HM Treasury’s investment in the Group; the ability to complete satisfactorily the disposal of certain assets as part of the Group’s EU State Aid obligations; the extent of any future impairment charges or write-downs caused by depressed asset valuations; market related trends and developments; exposure to regulatory scrutiny, legal proceedings or complaints; changes in competition and pricing environments; the inability to hedge certain risks economically; the adequacy of loss reserves; the actions of competitors; and the success of the Group in managing the risks of the foregoing.
Lloyds Banking Group may also make or disclose written and/or oral forward looking statements in reports filed with or furnished to the US Securities and Exchange Commission, Lloyds Banking Group annual reviews, half-year announcements, proxy statements, offering circulars, prospectuses, press releases and other written materials and in oral statements made by the directors, officers or employees of Lloyds Banking Group to third parties, including financial analysts. Except as required by any applicable law or regulation, the forward looking statements contained in this annual report are made as of the date hereof, and Lloyds Banking Group expressly disclaims any obligation or undertaking to release publicly any updates or revisions to any forward looking statements contained in this annual report to reflect any change in Lloyds Banking Group’s expectations with regard thereto or any change in events, conditions or circumstances on which any such statement is based.
192
LLOYDS BANKING GROUP STRUCTURE
The following is a list of the significant subsidiaries of Lloyds Banking Group plc at 31 December 2011.
|
|
|
|
|
|
|
|
|
|
|
Name of subsidiary undertaking |
|
Country of |
|
Percentage of equity share |
|
Nature of business |
|
Registered office |
|
Lloyds TSB Bank plc |
|
England |
|
100% |
|
Banking and financial services |
|
25 Gresham Street |
|
|
|
|
|
|
|
|
|
|
|
Scottish Widows plc |
|
Scotland |
|
100%* |
|
Life assurance |
|
69 Morrison Street |
|
|
|
|
|
|
|
|
|
|
|
HBOS plc |
|
Scotland |
|
100%* |
|
Holding company |
|
The Mound |
|
|
|
|
|
|
|
|
|
|
|
Bank of Scotland plc |
|
Scotland |
|
100%* |
|
Banking and financial services |
|
The Mound |
|
* Indirect interest |
|
|
|
|
|
|
|
|
193
INDEX TO THE CONSOLIDATED FINANCIAL STATEMENTS
|
|
|
|
|
|
F-2 |
|
|
|
F-3 |
|
|
|
F-4 |
|
|
Consolidated balance sheet at 31 December 2011 and 31 December 2010 |
|
F-5 |
|
|
F-7 |
|
|
|
F-10 |
|
|
|
F-11 |
F-1
REPORT OF INDEPENDENT REGISTERED PUBLIC ACCOUNTING FIRM
TO THE SHAREHOLDERS OF LLOYDS BANKING GROUP PLC
In our opinion, the accompanying consolidated balance sheets and the related consolidated income statement, consolidated statement of comprehensive income, consolidated statement of changes in equity and consolidated cash flow statement present fairly, in all material respects, the financial position of Lloyds Banking Group plc and its subsidiaries (the Company) at 31 December 2011 and 2010 and the results of their operations and their cash flows for each of the three years in the period ended 31 December 2011, in conformity with International Financial Reporting Standards (IFRSs) as issued by the International Accounting Standards Board (IASB). Also, in our opinion the Company maintained, in all material respects, effective internal control over financial reporting as of 31 December 2011, based on criteria established in Internal Control - Integrated Framework issued by the Committee of Sponsoring Organisations of the Treadway Commission (COSO). The Company’s management is responsible for these financial statements, for maintaining effective internal control over financial reporting and for its assessment of the effectiveness of internal control over financial reporting, included in the accompanying Management Report on Internal Control over Financial Reporting. Our responsibility is to express opinions on these financial statements and on the Company’s internal control over financial reporting based on our integrated audits. We conducted our audits in accordance with the standards of the Public Company Accounting Oversight Board (United States). Those standards require that we plan and perform the audits to obtain reasonable assurance about whether the financial statements are free of material misstatement and whether effective internal control over financial reporting was maintained in all material respects. Our audits of the financial statements included examining, on a test basis, evidence supporting the amounts and disclosures in the financial statements, assessing the accounting principles used and significant estimates made by management, and evaluating the overall financial statement presentation. Our audit of internal control over financial reporting included obtaining an understanding of internal control over financial reporting, assessing the risk that a material weakness exists, and testing and evaluating the design and operating effectiveness of internal control based on the assessed risk. Our audits also included performing such other procedures as we considered necessary in the circumstances. We believe that our audits provide a reasonable basis for our opinions.
A company’s internal control over financial reporting is a process designed to provide reasonable assurance regarding the reliability of financial reporting and the preparation of financial statements for external purposes in accordance with generally accepted accounting principles. A company’s internal control over financial reporting includes those policies and procedures that (i) pertain to the maintenance of records that, in reasonable detail, accurately and fairly reflect the transactions and dispositions of the assets of the company; (ii) provide reasonable assurance that transactions are recorded as necessary to permit preparation of financial statements in accordance with generally accepted accounting principles, and that receipts and expenditures of the company are being made only in accordance with authorizations of management and directors of the company; and (iii) provide reasonable assurance regarding prevention or timely detection of unauthorized acquisition, use, or disposition of the company’s assets that could have a material effect on the financial statements.
Because of its inherent limitations, internal control over financial reporting may not prevent or detect misstatements. Also, projections of any evaluation of effectiveness to future periods are subject to the risk that controls may become inadequate because of changes in conditions, or that the degree of compliance with the policies or procedures may deteriorate.
/s/
PricewaterhouseCoopers LLP
London, United Kingdom
16 March 2012
F-2
|
|
|
for the year ended 31 December 2011 |
|
|
|
|
|
|
|
|
|
|
|
|
|
|
|
|
|
|
|
|
|
|
|
|
|
|
Note |
|
|
2011 |
|
|
|
|
2010 |
|
|
|
|
2009 |
|
|
||||
|
Interest and similar income |
|
|
|
|
|
|
26,316 |
|
|
|
|
|
29,340 |
|
|
|
|
|
28,238 |
|
|
|
Interest and similar expense |
|
|
|
|
|
|
(13,618 |
) |
|
|
|
|
(16,794 |
) |
|
|
|
|
(19,212 |
) |
|
|
Net interest income |
|
|
5 |
|
|
|
12,698 |
|
|
|
|
|
12,546 |
|
|
|
|
|
9,026 |
|
|
|
Fee and commission income |
|
|
|
|
|
|
4,935 |
|
|
|
|
|
4,992 |
|
|
|
|
|
4,728 |
|
|
|
Fee and commission expense |
|
|
|
|
|
|
(1,391 |
) |
|
|
|
|
(1,682 |
) |
|
|
|
|
(1,517 |
) |
|
|
Net fee and commission income1 |
|
|
6 |
|
|
|
3,544 |
|
|
|
|
|
3,310 |
|
|
|
|
|
3,211 |
|
|
|
Net trading income |
|
|
7 |
|
|
|
(368 |
) |
|
|
|
|
15,724 |
|
|
|
|
|
19,098 |
|
|
|
Insurance premium income |
|
|
8 |
|
|
|
8,170 |
|
|
|
|
|
8,148 |
|
|
|
|
|
8,946 |
|
|
|
Other operating income |
|
|
9 |
|
|
|
2,768 |
|
|
|
|
|
4,316 |
|
|
|
|
|
5,490 |
|
|
|
Other income |
|
|
|
|
|
|
14,114 |
|
|
|
|
|
31,498 |
|
|
|
|
|
36,745 |
|
|
|
Total income |
|
|
|
|
|
|
26,812 |
|
|
|
|
|
44,044 |
|
|
|
|
|
45,771 |
|
|
|
Insurance claims1 |
|
|
10 |
|
|
|
(6,041 |
) |
|
|
|
|
(19,088 |
) |
|
|
|
|
(22,493 |
) |
|
|
Total income, net of insurance claims |
|
|
|
|
|
|
20,771 |
|
|
|
|
|
24,956 |
|
|
|
|
|
23,278 |
|
|
|
Government Asset Protection Scheme fee |
|
|
|
|
|
|
— |
|
|
|
|
|
— |
|
|
|
|
|
(2,500 |
) |
|
|
Payment protection insurance provision |
|
|
|
|
|
|
— |
|
|
|
|
|
(3,200 |
) |
|
|
|
|
— |
|
|
|
Other operating expenses |
|
|
|
|
|
|
(13,050 |
) |
|
|
|
|
(13,270 |
) |
|
|
|
|
(13,484 |
) |
|
|
Total operating expenses |
|
|
11 |
|
|
|
(13,050 |
) |
|
|
|
|
(16,470 |
) |
|
|
|
|
(15,984 |
) |
|
|
Trading surplus |
|
|
|
|
|
|
7,721 |
|
|
|
|
|
8,486 |
|
|
|
|
|
7,294 |
|
|
|
Impairment |
|
|
12 |
|
|
|
(8,094 |
) |
|
|
|
|
(10,952 |
) |
|
|
|
|
(16,673 |
) |
|
|
Share of results of joint ventures and associates |
|
|
13 |
|
|
|
31 |
|
|
|
|
|
(88 |
) |
|
|
|
|
(752 |
) |
|
|
Gain on acquisition |
|
|
14 |
|
|
|
— |
|
|
|
|
|
— |
|
|
|
|
|
11,173 |
|
|
|
Loss on disposal of businesses |
|
|
15 |
|
|
|
— |
|
|
|
|
|
(365 |
) |
|
|
|
|
— |
|
|
|
(Loss) profit before tax |
|
|
|
|
|
|
(342 |
) |
|
|
|
|
(2,919 |
) |
|
|
|
|
1,042 |
|
|
|
Taxation |
|
|
16 |
|
|
|
(36 |
) |
|
|
|
|
325 |
|
|
|
|
|
1,911 |
|
|
|
(Loss) profit for the year |
|
|
|
|
|
|
(378 |
) |
|
|
|
|
(2,594 |
) |
|
|
|
|
2,953 |
|
|
|
|
|
|
|
|
|
|
|
|
|
|
|
|
|
|
|
|
|
|
|
|
|
|
Profit attributable to non-controlling interests |
|
|
|
|
|
|
73 |
|
|
|
|
|
62 |
|
|
|
|
|
126 |
|
|
|
(Loss) profit attributable to equity shareholders |
|
|
|
|
|
|
(451 |
) |
|
|
|
|
(2,656 |
) |
|
|
|
|
2,827 |
|
|
|
(Loss) profit for the year |
|
|
|
|
|
|
(378 |
) |
|
|
|
|
(2,594 |
) |
|
|
|
|
2,953 |
|
|
|
|
|
|
|
|
|
|
|
|
|
|
|
|
|
|
|
|
|
|
|
|
|
|
Basic earnings per share |
|
|
17 |
|
|
|
(0.7 |
)p |
|
|
|
|
(4.0 |
)p |
|
|
|
|
7.5 |
p |
|
|
Diluted earnings per share |
|
|
17 |
|
|
|
(0.7 |
)p |
|
|
|
|
(4.0 |
)p |
|
|
|
|
7.5 |
p |
|
1 See notes 6 and 10.
The accompanying notes are an integral part of the consolidated financial statements.
F-3
|
|
|
for the year ended 31 December 2011 |
|
|
|
|
|
|
|
|
|
|
|
|
|
|
|
|
|
2011 |
|
|
2010 |
|
|
2009 |
|
|||
|
(Loss) profit for the year |
|
|
(378 |
) |
|
|
(2,594 |
) |
|
|
2,953 |
|
|
Other comprehensive income |
|
|
|
|
|
|
|
|
|
|
|
|
|
Movements in revaluation reserve in respect of available-for-sale financial assets: |
|
|
|
|
|
|
|
|
|
|
|
|
|
Change in fair value |
|
|
2,603 |
|
|
|
1,231 |
|
|
|
2,035 |
|
|
Income statement transfers in respect of disposals |
|
|
(343 |
) |
|
|
(399 |
) |
|
|
(97 |
) |
|
Income statement transfers in respect of impairment |
|
|
80 |
|
|
|
114 |
|
|
|
621 |
|
|
Other income statement transfers |
|
|
(155 |
) |
|
|
(110 |
) |
|
|
(93 |
) |
|
Taxation |
|
|
(575 |
) |
|
|
(343 |
) |
|
|
(417 |
) |
|
|
|
|
1,610 |
|
|
|
493 |
|
|
|
2,049 |
|
|
Movement in cash flow hedging reserve: |
|
|
|
|
|
|
|
|
|
|
|
|
|
Effective portion of changes in fair value taken to other comprehensive income |
|
|
916 |
|
|
|
(1,048 |
) |
|
|
(530 |
) |
|
Net income statement transfers |
|
|
70 |
|
|
|
932 |
|
|
|
121 |
|
|
Taxation |
|
|
(270 |
) |
|
|
30 |
|
|
|
119 |
|
|
|
|
|
716 |
|
|
|
(86 |
) |
|
|
(290 |
) |
|
Currency translation differences: |
|
|
|
|
|
|
|
|
|
|
|
|
|
Currency translation differences, before tax |
|
|
(84 |
) |
|
|
(129 |
) |
|
|
162 |
|
|
Taxation |
|
|
— |
|
|
|
— |
|
|
|
(182 |
) |
|
|
|
|
(84 |
) |
|
|
(129 |
) |
|
|
(20 |
) |
|
Other comprehensive income for the year, net of tax |
|
|
2,242 |
|
|
|
278 |
|
|
|
1,739 |
|
|
Total comprehensive income for the year |
|
|
1,864 |
|
|
|
(2,316 |
) |
|
|
4,692 |
|
|
|
|
|
|
|
|
|
|
|
|
|
|
|
|
Total comprehensive income attributable to non-controlling interests |
|
|
72 |
|
|
|
57 |
|
|
|
107 |
|
|
Total comprehensive income attributable to equity shareholders |
|
|
1,792 |
|
|
|
(2,373 |
) |
|
|
4,585 |
|
|
Total comprehensive income for the year |
|
|
1,864 |
|
|
|
(2,316 |
) |
|
|
4,692 |
|
F-4
|
|
|
at 31 December 2011 |
|
|
|
|
|
|
|
|
|
|
|
|
|
|
|
|
Note |
|
2011 |
|
|
2010 |
|
|||
|
Assets |
|
|
|
|
|
|
|
|
|
|
|
|
Cash and balances at central banks |
|
|
|
|
|
60,722 |
|
|
|
38,115 |
|
|
Items in the course of collection from banks |
|
|
|
|
|
1,408 |
|
|
|
1,368 |
|
|
Trading and other financial assets at fair value through profit or loss |
|
|
18 |
|
|
139,510 |
|
|
|
156,191 |
|
|
Derivative financial instruments |
|
|
19 |
|
|
66,013 |
|
|
|
50,777 |
|
|
Loans and receivables: |
|
|
|
|
|
|
|
|
|
|
|
|
Loans and advances to banks |
|
|
20 |
|
|
32,606 |
|
|
|
30,272 |
|
|
Loans and advances to customers |
|
|
21 |
|
|
565,638 |
|
|
|
592,597 |
|
|
Debt securities |
|
|
24 |
|
|
12,470 |
|
|
|
25,735 |
|
|
|
|
|
|
|
|
610,714 |
|
|
|
648,604 |
|
|
Available-for-sale financial assets |
|
|
26 |
|
|
37,406 |
|
|
|
42,955 |
|
|
Held-to-maturity investments |
|
|
27 |
|
|
8,098 |
|
|
|
7,905 |
|
|
Investment properties |
|
|
28 |
|
|
6,122 |
|
|
|
5,997 |
|
|
Investments in joint ventures and associates |
|
|
13 |
|
|
334 |
|
|
|
429 |
|
|
Goodwill |
|
|
29 |
|
|
2,016 |
|
|
|
2,016 |
|
|
Value of in-force business |
|
|
30 |
|
|
6,638 |
|
|
|
7,367 |
|
|
Other intangible assets |
|
|
31 |
|
|
3,196 |
|
|
|
3,496 |
|
|
Tangible fixed assets |
|
|
32 |
|
|
7,673 |
|
|
|
8,190 |
|
|
Current tax recoverable |
|
|
|
|
|
434 |
|
|
|
621 |
|
|
Deferred tax assets |
|
|
44 |
|
|
4,496 |
|
|
|
5,028 |
|
|
Retirement benefit assets |
|
|
43 |
|
|
1,338 |
|
|
|
736 |
|
|
Other assets |
|
|
33 |
|
|
14,428 |
|
|
|
12,643 |
|
|
Total assets |
|
|
|
|
|
970,546 |
|
|
|
992,438 |
|
The accompanying notes are an integral part of the consolidated financial statements.
F-5
CONSOLIDATED BALANCE SHEET
|
|
|
|
|
|
|
|
|
|
|
|
|
|
Equity and liabilities |
|
Note |
|
2011 |
|
|
2010 |
|
|||
|
Liabilities |
|
|
|
|
|
|
|
|
|
|
|
|
Deposits from banks |
|
|
34 |
|
|
39,810 |
|
|
|
50,363 |
|
|
Customer deposits |
|
|
35 |
|
|
413,906 |
|
|
|
393,633 |
|
|
Items in course of transmission to banks |
|
|
|
|
|
844 |
|
|
|
802 |
|
|
Trading and other financial liabilities at fair value through profit or loss |
|
|
36 |
|
|
24,955 |
|
|
|
26,762 |
|
|
Derivative financial instruments |
|
|
19 |
|
|
58,212 |
|
|
|
42,158 |
|
|
Notes in circulation |
|
|
|
|
|
1,145 |
|
|
|
1,074 |
|
|
Debt securities in issue |
|
|
37 |
|
|
185,059 |
|
|
|
228,866 |
|
|
Liabilities arising from insurance contracts and participating investment contracts |
|
|
38 |
|
|
78,991 |
|
|
|
80,729 |
|
|
Liabilities arising from non-participating investment contracts |
|
|
40 |
|
|
49,636 |
|
|
|
51,363 |
|
|
Unallocated surplus within insurance businesses |
|
|
41 |
|
|
300 |
|
|
|
643 |
|
|
Other liabilities |
|
|
42 |
|
|
32,041 |
|
|
|
29,696 |
|
|
Retirement benefit obligations |
|
|
43 |
|
|
381 |
|
|
|
423 |
|
|
Current tax liabilities |
|
|
|
|
|
103 |
|
|
|
149 |
|
|
Deferred tax liabilities |
|
|
44 |
|
|
314 |
|
|
|
247 |
|
|
Other provisions |
|
|
45 |
|
|
3,166 |
|
|
|
4,732 |
|
|
Subordinated liabilities |
|
|
46 |
|
|
35,089 |
|
|
|
36,232 |
|
|
Total liabilities |
|
|
|
|
|
923,952 |
|
|
|
947,872 |
|
|
Equity |
|
|
|
|
|
|
|
|
|
|
|
|
Share capital |
|
|
47 |
|
|
6,881 |
|
|
|
6,815 |
|
|
Share premium account |
|
|
48 |
|
|
16,541 |
|
|
|
16,291 |
|
|
Other reserves |
|
|
49 |
|
|
13,818 |
|
|
|
11,575 |
|
|
Retained profits |
|
|
50 |
|
|
8,680 |
|
|
|
9,044 |
|
|
Shareholders’ equity |
|
|
|
|
|
45,920 |
|
|
|
43,725 |
|
|
Non-controlling interests |
|
|
|
|
|
674 |
|
|
|
841 |
|
|
Total equity |
|
|
|
|
|
46,594 |
|
|
|
44,566 |
|
|
Total equity and liabilities |
|
|
|
|
|
970,546 |
|
|
|
992,438 |
|
The accompanying notes are an integral part of the consolidated financial statements.
F-6
CONSOLIDATED STATEMENT OF CHANGES IN EQUITY
|
|
|
|
|
|
|
|
|
|
|
|
|
|
|
|
|
|
|
|
|
|
|
|
|
|
|
|
|
Attributable to equity shareholders |
|
|
|
|
|
|
|
|||||||||||||||
|
|
|
Share capital |
|
|
Other |
|
|
Retained |
|
|
Total |
|
|
Non-controlling |
|
|
Total |
|
||||||
|
Balance at 1 January 2011 |
|
|
23,106 |
|
|
|
11,575 |
|
|
|
9,044 |
|
|
|
43,725 |
|
|
|
841 |
|
|
|
44,566 |
|
|
Comprehensive income |
|
|
|
|
|
|
|
|
|
|
|
|
|
|
|
|
|
|
|
|
|
|
|
|
|
(Loss) profit for the year |
|
|
— |
|
|
|
— |
|
|
|
(451 |
) |
|
|
(451 |
) |
|
|
73 |
|
|
|
(378 |
) |
|
Other comprehensive income |
|
|
|
|
|
|
|
|
|
|
|
|
|
|
|
|
|
|
|
|
|
|
|
|
|
Movements in revaluation reserve in respect of available-for-sale financial assets, net of tax |
|
|
— |
|
|
|
1,611 |
|
|
|
— |
|
|
|
1,611 |
|
|
|
(1 |
) |
|
|
1,610 |
|
|
Movements in cash flow hedging reserve, |
|
|
|
|
|
|
|
|
|
|
|
|
|
|
|
|
|
|
|
|
|
|
|
|
|
net of tax |
|
|
— |
|
|
|
716 |
|
|
|
— |
|
|
|
716 |
|
|
|
— |
|
|
|
716 |
|
|
Currency translation differences, net of tax |
|
|
— |
|
|
|
(84 |
) |
|
|
— |
|
|
|
(84 |
) |
|
|
— |
|
|
|
(84 |
) |
|
Total other comprehensive income |
|
|
— |
|
|
|
2,243 |
|
|
|
— |
|
|
|
2,243 |
|
|
|
(1 |
) |
|
|
2,242 |
|
|
Total comprehensive income |
|
|
— |
|
|
|
2,243 |
|
|
|
(451 |
) |
|
|
1,792 |
|
|
|
72 |
|
|
|
1,864 |
|
|
Transactions with owners |
|
|
|
|
|
|
|
|
|
|
|
|
|
|
|
|
|
|
|
|
|
|
|
|
|
Dividends |
|
|
— |
|
|
|
— |
|
|
|
— |
|
|
|
— |
|
|
|
(50 |
) |
|
|
(50 |
) |
|
Issue of ordinary shares |
|
|
316 |
|
|
|
— |
|
|
|
— |
|
|
|
316 |
|
|
|
— |
|
|
|
316 |
|
|
Movement in treasury shares |
|
|
— |
|
|
|
— |
|
|
|
(276 |
) |
|
|
(276 |
) |
|
|
— |
|
|
|
(276 |
) |
|
Value of employee services: |
|
|
|
|
|
|
|
|
|
|
|
|
|
|
|
|
|
|
|
|
|
|
|
|
|
Share option schemes |
|
|
— |
|
|
|
— |
|
|
|
125 |
|
|
|
125 |
|
|
|
— |
|
|
|
125 |
|
|
Other employee award schemes |
|
|
— |
|
|
|
— |
|
|
|
238 |
|
|
|
238 |
|
|
|
— |
|
|
|
238 |
|
|
Change in non-controlling interests |
|
|
— |
|
|
|
— |
|
|
|
— |
|
|
|
— |
|
|
|
(189 |
) |
|
|
(189 |
) |
|
Total transactions with owners |
|
|
316 |
|
|
|
— |
|
|
|
87 |
|
|
|
403 |
|
|
|
(239 |
) |
|
|
164 |
|
|
Balance at 31 December 2011 |
|
|
23,422 |
|
|
|
13,818 |
|
|
|
8,680 |
|
|
|
45,920 |
|
|
|
674 |
|
|
|
46,594 |
|
Further details of movements in the Group’s share capital and reserves are provided in notes 47, 48, 49 and 50.
F-7
CONSOLIDATED STATEMENT OF CHANGES IN EQUITY
|
|
|
|
|
|
|
|
|
|
|
|
|
|
|
|
|
|
|
|
|
|
|
|
|
|
|
|
|
Attributable to equity shareholders |
|
|
|
|
|
|
|
|||||||||||||||
|
|
|
Share capital |
|
|
Other |
|
|
Retained |
|
|
Total |
|
|
Non-controlling |
|
|
Total |
|
||||||
|
Balance at 1 January 2010 |
|
|
24,944 |
|
|
|
7,217 |
|
|
|
11,117 |
|
|
|
43,278 |
|
|
|
829 |
|
|
|
44,107 |
|
|
Comprehensive income |
|
|
|
|
|
|
|
|
|
|
|
|
|
|
|
|
|
|
|
|
|
|
|
|
|
(Loss) profit for the year |
|
|
— |
|
|
|
— |
|
|
|
(2,656 |
) |
|
|
(2,656 |
) |
|
|
62 |
|
|
|
(2,594 |
) |
|
Other comprehensive income |
|
|
|
|
|
|
|
|
|
|
|
|
|
|
|
|
|
|
|
|
|
|
|
|
|
Movements in revaluation reserve in respect |
|
|
|
|
|
|
|
|
|
|
|
|
|
|
|
|
|
|
|
|
|
|
|
|
|
of available-for-sale financial assets, net of tax |
|
|
— |
|
|
|
498 |
|
|
|
— |
|
|
|
498 |
|
|
|
(5 |
) |
|
|
493 |
|
|
Movements in cash flow hedging reserve, |
|
|
|
|
|
|
|
|
|
|
|
|
|
|
|
|
|
|
|
|
|
|
|
|
|
net of tax |
|
|
— |
|
|
|
(86 |
) |
|
|
— |
|
|
|
(86 |
) |
|
|
— |
|
|
|
(86 |
) |
|
Currency translation differences, net of tax |
|
|
— |
|
|
|
(129 |
) |
|
|
— |
|
|
|
(129 |
) |
|
|
— |
|
|
|
(129 |
) |
|
Total other comprehensive income |
|
|
— |
|
|
|
283 |
|
|
|
— |
|
|
|
283 |
|
|
|
(5 |
) |
|
|
278 |
|
|
Total comprehensive income |
|
|
— |
|
|
|
283 |
|
|
|
(2,656 |
) |
|
|
(2,373 |
) |
|
|
57 |
|
|
|
(2,316 |
) |
|
Transactions with owners |
|
|
|
|
|
|
|
|
|
|
|
|
|
|
|
|
|
|
|
|
|
|
|
|
|
Dividends |
|
|
— |
|
|
|
— |
|
|
|
— |
|
|
|
— |
|
|
|
(47 |
) |
|
|
(47 |
) |
|
Issue of ordinary shares |
|
|
2,237 |
|
|
|
— |
|
|
|
— |
|
|
|
2,237 |
|
|
|
— |
|
|
|
2,237 |
|
|
Redemption of preference shares |
|
|
11 |
|
|
|
(11 |
) |
|
|
— |
|
|
|
— |
|
|
|
— |
|
|
|
— |
|
|
Cancellation of deferred shares |
|
|
(4,086 |
) |
|
|
4,086 |
|
|
|
— |
|
|
|
— |
|
|
|
— |
|
|
|
— |
|
|
Movement in treasury shares |
|
|
— |
|
|
|
— |
|
|
|
20 |
|
|
|
20 |
|
|
|
— |
|
|
|
20 |
|
|
Value of employee services: |
|
|
|
|
|
|
|
|
|
|
|
|
|
|
|
|
|
|
|
|
|
|
|
|
|
Share option schemes |
|
|
— |
|
|
|
— |
|
|
|
154 |
|
|
|
154 |
|
|
|
— |
|
|
|
154 |
|
|
Other employee award schemes |
|
|
— |
|
|
|
— |
|
|
|
409 |
|
|
|
409 |
|
|
|
— |
|
|
|
409 |
|
|
Change in non-controlling interests |
|
|
— |
|
|
|
— |
|
|
|
— |
|
|
|
— |
|
|
|
2 |
|
|
|
2 |
|
|
Total transactions with owners |
|
|
(1,838 |
) |
|
|
4,075 |
|
|
|
583 |
|
|
|
2,820 |
|
|
|
(45 |
) |
|
|
2,775 |
|
|
Balance at 31 December 2010 |
|
|
23,106 |
|
|
|
11,575 |
|
|
|
9,044 |
|
|
|
43,725 |
|
|
|
841 |
|
|
|
44,566 |
|
F-8
CONSOLIDATED STATEMENT OF CHANGES IN EQUITY
|
|
|
|
|
|
|
|
|
|
|
|
|
|
|
|
|
|
|
|
|
|
|
|
|
|
|
|
|
Attributable to equity shareholders |
|
|
|
|
|
|
|
|||||||||||||||
|
|
|
Share capital |
|
|
Other |
|
|
Retained |
|
|
Total |
|
|
Non-controlling |
|
|
Total |
|
||||||
|
Balance at 1 January 2009 |
|
|
3,609 |
|
|
|
(2,345 |
) |
|
|
8,129 |
|
|
|
9,393 |
|
|
|
306 |
|
|
|
9,699 |
|
|
Comprehensive income |
|
|
|
|
|
|
|
|
|
|
|
|
|
|
|
|
|
|
|
|
|
|
|
|
|
Profit for the year |
|
|
— |
|
|
|
— |
|
|
|
2,827 |
|
|
|
2,827 |
|
|
|
126 |
|
|
|
2,953 |
|
|
Other comprehensive income |
|
|
|
|
|
|
|
|
|
|
|
|
|
|
|
|
|
|
|
|
|
|
|
|
|
Movements in revaluation reserve in respect |
|
|
|
|
|
|
|
|
|
|
|
|
|
|
|
|
|
|
|
|
|
|
|
|
|
of available-for-sale financial assets, net of tax |
|
|
— |
|
|
|
2,248 |
|
|
|
— |
|
|
|
2,248 |
|
|
|
— |
|
|
|
2,248 |
|
|
Movements in cash flow hedging reserve, |
|
|
|
|
|
|
|
|
|
|
|
|
|
|
|
|
|
|
|
|
|
|
|
|
|
net of tax |
|
|
— |
|
|
|
(290 |
) |
|
|
— |
|
|
|
(290 |
) |
|
|
— |
|
|
|
(290 |
) |
|
Currency translation differences, net of tax |
|
|
— |
|
|
|
(200 |
) |
|
|
— |
|
|
|
(200 |
) |
|
|
(19 |
) |
|
|
(219 |
) |
|
Total other comprehensive income |
|
|
— |
|
|
|
1,758 |
|
|
|
— |
|
|
|
1,758 |
|
|
|
(19 |
) |
|
|
1,739 |
|
|
Total comprehensive income |
|
|
— |
|
|
|
1,758 |
|
|
|
2,827 |
|
|
|
4,585 |
|
|
|
107 |
|
|
|
4,692 |
|
|
Transactions with owners |
|
|
|
|
|
|
|
|
|
|
|
|
|
|
|
|
|
|
|
|
|
|
|
|
|
Dividends |
|
|
— |
|
|
|
— |
|
|
|
— |
|
|
|
— |
|
|
|
(116 |
) |
|
|
(116 |
) |
|
Issue of ordinary shares: |
|
|
|
|
|
|
|
|
|
|
|
|
|
|
|
|
|
|
|
|
|
|
|
|
|
Placing and open offer |
|
|
649 |
|
|
|
3,781 |
|
|
|
— |
|
|
|
4,430 |
|
|
|
— |
|
|
|
4,430 |
|
|
Issued on acquisition of HBOS |
|
|
1,944 |
|
|
|
5,707 |
|
|
|
— |
|
|
|
7,651 |
|
|
|
— |
|
|
|
7,651 |
|
|
Placing and compensatory open offer |
|
|
3,905 |
|
|
|
— |
|
|
|
— |
|
|
|
3,905 |
|
|
|
— |
|
|
|
3,905 |
|
|
Rights issue |
|
|
13,112 |
|
|
|
— |
|
|
|
— |
|
|
|
13,112 |
|
|
|
— |
|
|
|
13,112 |
|
|
Issued to Lloyds TSB Foundations |
|
|
41 |
|
|
|
— |
|
|
|
— |
|
|
|
41 |
|
|
|
— |
|
|
|
41 |
|
|
Adjustment on acquisition |
|
|
— |
|
|
|
— |
|
|
|
— |
|
|
|
— |
|
|
|
5,567 |
|
|
|
5,567 |
|
|
Transfer to merger reserve |
|
|
(1,000 |
) |
|
|
1,000 |
|
|
|
— |
|
|
|
— |
|
|
|
— |
|
|
|
— |
|
|
Redemption of preference shares |
|
|
2,684 |
|
|
|
(2,684 |
) |
|
|
— |
|
|
|
— |
|
|
|
— |
|
|
|
— |
|
|
Movement in treasury shares |
|
|
— |
|
|
|
— |
|
|
|
10 |
|
|
|
10 |
|
|
|
— |
|
|
|
10 |
|
|
Value of employee services: |
|
|
|
|
|
|
|
|
|
|
|
|
|
|
|
|
|
|
|
|
|
|
|
|
|
Share option schemes |
|
|
— |
|
|
|
— |
|
|
|
116 |
|
|
|
116 |
|
|
|
— |
|
|
|
116 |
|
|
Other employee award schemes |
|
|
— |
|
|
|
— |
|
|
|
35 |
|
|
|
35 |
|
|
|
— |
|
|
|
35 |
|
|
Extinguishment of non-controlling interests |
|
|
— |
|
|
|
— |
|
|
|
— |
|
|
|
— |
|
|
|
(5,035 |
) |
|
|
(5,035 |
) |
|
Total transactions with owners |
|
|
21,335 |
|
|
|
7,804 |
|
|
|
161 |
|
|
|
29,300 |
|
|
|
416 |
|
|
|
29,716 |
|
|
Balance at 31 December 2009 |
|
|
24,944 |
|
|
|
7,217 |
|
|
|
11,117 |
|
|
|
43,278 |
|
|
|
829 |
|
|
|
44,107 |
|
F-9
|
|
|
for the year ended 31 December 2011 |
|
|
|
|
|
|
|
|
|
|
|
|
|
|
|
|
|
|
Note |
|
2011 |
|
2010 |
|
2009 |
|
||||
|
(Loss) profit before tax |
|
|
|
|
|
(342 |
) |
|
(2,919 |
) |
|
1,042 |
|
|
Adjustments for: |
|
|
|
|
|
|
|
|
|
|
|
|
|
|
Change in operating assets |
|
|
57 |
(A) |
|
44,097 |
|
|
31,860 |
|
|
61,942 |
|
|
Change in operating liabilities |
|
|
57 |
(B) |
|
(19,187 |
) |
|
(45,683 |
) |
|
(105,927 |
) |
|
Non-cash and other items |
|
|
57 |
(C) |
|
(4,539 |
) |
|
14,373 |
|
|
8,907 |
|
|
Tax (paid) received |
|
|
|
|
|
(136 |
) |
|
332 |
|
|
301 |
|
|
Net cash provided by (used in) operating activities |
|
|
|
|
|
19,893 |
|
|
(2,037 |
) |
|
(33,735 |
) |
|
Cash flows from investing activities |
|
|
|
|
|
|
|
|
|
|
|
|
|
|
Purchase of financial assets |
|
|
|
|
|
(28,995 |
) |
|
(46,890 |
) |
|
(455,816 |
) |
|
Proceeds from sale and maturity of financial assets |
|
|
|
|
|
36,523 |
|
|
45,999 |
|
|
490,561 |
|
|
Purchase of fixed assets |
|
|
|
|
|
(3,095 |
) |
|
(3,216 |
) |
|
(2,689 |
) |
|
Proceeds from sale of fixed assets |
|
|
|
|
|
2,214 |
|
|
1,354 |
|
|
2,129 |
|
|
Acquisition of businesses, net of cash acquired |
|
|
57 |
(E) |
|
(13 |
) |
|
(73 |
) |
|
16,227 |
|
|
Disposal of businesses, net of cash disposed |
|
|
57 |
(F) |
|
298 |
|
|
428 |
|
|
411 |
|
|
Net cash provided by (used in) investing activities |
|
|
|
|
|
6,932 |
|
|
(2,398 |
) |
|
50,823 |
|
|
Cash flows from financing activities |
|
|
|
|
|
|
|
|
|
|
|
|
|
|
Dividends paid to non-controlling interests |
|
|
|
|
|
(50 |
) |
|
(47 |
) |
|
(116 |
) |
|
Interest paid on subordinated liabilities |
|
|
|
|
|
(2,126 |
) |
|
(1,942 |
) |
|
(2,622 |
) |
|
Proceeds from issue of subordinated liabilities |
|
|
|
|
|
— |
|
|
3,237 |
|
|
4,187 |
|
|
Proceeds from issue of ordinary shares |
|
|
|
|
|
— |
|
|
— |
|
|
21,533 |
|
|
Repayment of subordinated liabilities |
|
|
|
|
|
(1,074 |
) |
|
(684 |
) |
|
(6,897 |
) |
|
Change in non-controlling interests |
|
|
|
|
|
8 |
|
|
2 |
|
|
(33 |
) |
|
Net cash (used in) provided by financing activities |
|
|
|
|
|
(3,242 |
) |
|
566 |
|
|
16,052 |
|
|
Effects of exchange rate changes on cash and cash equivalents |
|
|
|
|
|
6 |
|
|
479 |
|
|
(210 |
) |
|
Change in cash and cash equivalents |
|
|
|
|
|
23,589 |
|
|
(3,390 |
) |
|
32,930 |
|
|
Cash and cash equivalents at beginning of year |
|
|
|
|
|
62,300 |
|
|
65,690 |
|
|
32,760 |
|
|
Cash and cash equivalents at end of year |
|
|
57 |
(D) |
|
85,889 |
|
|
62,300 |
|
|
65,690 |
|
The accompanying notes are an integral part of the consolidated financial statements.
F-10
NOTES TO THE CONSOLIDATED FINANCIAL STATEMENTS
NOTE 1: BASIS OF PREPARATION
The consolidated financial statements of Lloyds Banking Group plc have been prepared in accordance with International Financial Reporting Standards (IFRS) as adopted by the European Union (EU). IFRS comprises accounting standards prefixed IFRS issued by the International Accounting Standards Board (IASB) and those prefixed IAS issued by the IASB’s predecessor body as well as interpretations issued by the International Financial Reporting Interpretations Committee (IFRIC) and its predecessor body. The EU endorsed version of IAS 39 Financial Instruments: Recognition and Measurement relaxes some of the hedge accounting requirements; the Group has not taken advantage of this relaxation, and therefore there is no difference in application to the Group between IFRS as adopted by the EU and IFRS as issued by the IASB.
The financial information has been prepared under the historical cost convention, as modified by the revaluation of investment properties, available-for-sale financial assets, trading securities and certain other financial assets and liabilities at fair value through profit or loss and all derivative contracts. As stated on page 166, the directors consider that it is appropriate to continue to adopt the going concern basis in preparing the accounts.
Certain disclosures required under IFRS in relation to financial instruments have been included within the Risk Management section of this annual report on Form 20-F on pages 58 through 131, and identified therein as ‘audited’.
In previous years the Group has included annual management charges on non-participating investment contracts within insurance claims. In light of developing industry practice, these amounts (2011: £606 million; 2010: £577 million; 2009: £474 million) are now included within net fee and commission income.
The Group has adopted the following new standards and amendments to standards which became effective for financial years beginning on or after 1 January 2011. None of these standards or amendments have had a material impact on these financial statements.
|
|
|
|
(i) |
Amendment to IAS 32 Financial Instruments: Presentation – ‘Classification of Rights Issues’. Requires rights issues denominated in a currency other than the functional currency of the issuer to be classified as equity regardless of the currency in which the exercise price is denominated. |
|
|
|
|
(ii) |
IFRIC 19 Extinguishing Financial Liabilities with Equity Instruments. Clarifies that when an entity renegotiates the terms of its debt with the result that the liability is extinguished by the debtor issuing its own equity instruments to the creditor, a gain or loss is recognised in the income statement representing the difference between the carrying value of the financial liability and the fair value of the equity instruments issued; the fair value of the financial liability is used to measure the gain or loss where the fair value of the equity instruments cannot be reliably measured. |
|
|
|
|
(iii) |
Improvements to IFRSs (issued May 2010). Amends IFRS 7 Financial Instruments: Disclosure to require further disclosures in respect of collateral held by the Group as security for financial assets and sets out minor amendments to other standards as part of the annual improvements process. |
|
|
|
|
(iv) |
Amendment to IFRIC 14 Prepayments of a Minimum Funding Requirement. Applies when an entity is subject to minimum funding requirements and makes an early payment of contributions to cover those requirements and permits such an entity to treat the benefit of such an early payment as an asset. |
|
|
|
|
(v) |
IAS 24 Related Party Disclosures (Revised). Simplifies the definition of a related party and provides a partial exemption from the requirement to disclose transactions and outstanding balances with the government and government-related entities. The Group has taken advantage of an exemption in respect of government and government-related transactions that permits an entity to disclose only transactions that are individually or collectively significant. Details of related party transactions are disclosed in note 53. |
Details of those IFRS pronouncements which will be relevant to the Group but which were not effective at 31 December 2011 and which have not been applied in preparing these financial statements are given in note 58.
F-11
NOTES TO THE CONSOLIDATED FINANCIAL STATEMENTS
NOTE 2: ACCOUNTING POLICIES
The Group’s accounting policies are set out below.
(A) CONSOLIDATION
The assets, liabilities and results of Group undertakings (including special purpose entities) are included in the financial statements on the basis of accounts made up to the reporting date. Group undertakings include subsidiaries, associates and joint ventures.
(1) SUBSIDIARIES
Subsidiaries include entities over which the Group has the power to govern the financial and operating policies which generally accompanies a shareholding of more than one half of the voting rights. The existence and effect of potential voting rights that are currently exercisable or convertible are considered when assessing whether the Group controls another entity. Subsidiaries are fully consolidated from the date on which control is transferred to the Group; they are de-consolidated from the date that control ceases. Details of the principal subsidiaries are given in note 59 to the financial statements.
Investment vehicles, such as Open Ended Investment Companies (OEICs), where the Group has control are consolidated. Control arises when the Group manages the funds and also has a majority beneficial interest. In circumstances where the Group holds a majority beneficial interest, but is not the fund manager, the Group does not consolidate the entity as it does not have the fund manager’s decision-making powers over the investment activities of the OEIC necessary to establish control. The interests of parties other than the Group are reported in other liabilities.
Special purpose entities (SPEs) are consolidated if, in substance, the Group controls the entity. A key indicator of such control, amongst others, is where the Group is exposed to the risks and benefits of the SPE.
The treatment of transactions with non-controlling interests depends on whether, as a result of the transaction, the Group loses control of the subsidiary. Changes in the parent’s ownership interest in a subsidiary that do not result in a loss of control are accounted for as equity transactions; any difference between the amount by which the non-controlling interests are adjusted and the fair value of the consideration paid or received is recognised directly in equity and attributed to the owners of the parent entity. Where the group loses control of the subsidiary, at the date when control is lost the amount of any non-controlling interest in that former subsidiary is derecognised and any investment retained in the former subsidiary is remeasured to its fair value; the gain or loss that is recognised in profit or loss on the partial disposal of the subsidiary includes the gain or loss on the remeasurement of the retained interest.
Intercompany transactions, balances and unrealised gains and losses on transactions between Group companies are eliminated.
The acquisition method of accounting is used to account for business combinations by the Group. The consideration for the acquisition of a subsidiary is the fair value of the assets transferred, the liabilities incurred and the equity interests issued by the Group. The consideration includes the fair value of any asset or liability resulting from a contingent consideration arrangement. Acquisition related costs are expensed as incurred except those relating to the issuance of debt instruments (see (E)(5) below) or share capital (see (R)(1) below). Identifiable assets acquired and liabilities assumed in a business combination are measured initially at their fair value at the acquisition date.
(2) JOINT VENTURES AND ASSOCIATES
Joint ventures are entities over which the Group has joint control under a contractual arrangement with other parties. Associates are entities over which the Group has significant influence, but not control or joint control, over the financial and operating policies. Significant influence is the power to participate in the financial and operating policy decisions of the entity and is normally achieved through holding between 20 per cent and 50 per cent of the voting share capital of the entity.
The Group utilises the venture capital exemption for investments where significant influence or joint control is present and the business unit operates as a venture capital business. These investments are designated at initial recognition at fair value through profit or loss. Otherwise, the Group’s investments in joint ventures and associates are accounted for by the equity method of accounting and are initially recorded at cost and adjusted each year to reflect the Group’s share of the post-acquisition results of the joint venture or associate based on audited accounts which are coterminous with the Group or made up to a date which is not more than three months before the Group’s reporting date. The share of any losses is restricted to a level that reflects an obligation to fund such losses.
(B) GOODWILL
Goodwill arises on business combinations, including the acquisition of subsidiaries, and on the acquisition of interests in joint ventures and associates; goodwill represents the excess of the cost of an acquisition over the fair value of the Group’s share of the identifiable assets, liabilities and contingent liabilities acquired. Where the fair value of the Group’s share of the identifiable assets, liabilities and contingent liabilities of the acquired entity is greater than the cost of acquisition, the excess is recognised immediately in the income statement.
Goodwill is recognised as an asset at cost and is tested at least annually for impairment. If an impairment is identified the carrying value of the goodwill is written down immediately through the income statement and is not subsequently reversed. Goodwill arising on acquisitions of associates and joint ventures is included in the Group’s investment in joint ventures and associates. At the date of disposal of a subsidiary, the carrying value of attributable goodwill is included in the calculation of the profit or loss on disposal except where it has been written off directly to reserves in the past.
(C) OTHER INTANGIBLE ASSETS
Other intangible assets include brands, core deposit intangibles, purchased credit card relationships, customer-related intangibles and both internally and externally generated capitalised software enhancements. Intangible assets which have been determined to have a finite useful life are amortised on a straight line basis over their estimated useful life as follows:
|
|
|
|
Capitalised software enhancements |
up to 5 years |
|
Brands (which have been assessed as having finite lives) |
10-15 years |
|
Customer-related intangibles |
up to 10 years |
|
Core deposit intangibles |
up to 8 years |
|
Purchased credit card relationships |
5 years |
F-12
NOTES TO THE CONSOLIDATED FINANCIAL STATEMENTS
NOTE 2: ACCOUNTING POLICIES continued
Intangible assets with finite useful lives are reviewed at each reporting date to assess whether there is any indication that they are impaired. If any such indication exists the recoverable amount of the asset is determined and in the event that the asset’s carrying amount is greater than its recoverable amount, it is written down immediately. Certain brands have been determined to have an indefinite useful life and are not amortised. Such intangible assets are reassessed annually to reconfirm that an indefinite useful life remains appropriate. In the event that an indefinite life is inappropriate a finite life is determined and an impairment review is performed on the asset.
(D) REVENUE RECOGNITION
Interest income and expense are recognised in the income statement for all interest-bearing financial instruments using the effective interest method, except for those classified at fair value through profit or loss. The effective interest method is a method of calculating the amortised cost of a financial asset or liability and of allocating the interest income or interest expense over the expected life of the financial instrument. The effective interest rate is the rate that exactly discounts the estimated future cash payments or receipts over the expected life of the financial instrument or, when appropriate, a shorter period, to the net carrying amount of the financial asset or financial liability.
The effective interest rate is calculated on initial recognition of the financial asset or liability by estimating the future cash flows after considering all the contractual terms of the instrument but not future credit losses. The calculation includes all amounts expected to be paid or received by the Group including expected early redemption fees and related penalties and premiums and discounts that are an integral part of the overall return. Direct incremental transaction costs related to the acquisition, issue or disposal of a financial instrument are also taken into account in the calculation. Once a financial asset or a group of similar financial assets has been written down as a result of an impairment loss, interest income is recognised using the rate of interest used to discount the future cash flows for the purpose of measuring the impairment loss (see (H) below).
Fees and commissions which are not an integral part of the effective interest rate are generally recognised when the service has been provided. Loan commitment fees for loans that are likely to be drawn down are deferred (together with related direct costs) and recognised as an adjustment to the effective interest rate on the loan once drawn. Where it is unlikely that loan commitments will be drawn, loan commitment fees are recognised over the life of the facility. Loan syndication fees are recognised as revenue when the syndication has been completed and the Group retains no part of the loan package for itself or retains a part at the same effective interest rate for all interest-bearing financial instruments, including loans and advances, as for the other participants.
Dividend income is recognised when the right to receive payment is established.
Revenue recognition policies specific to life insurance and general insurance business are detailed below (see (O) below).
(E) FINANCIAL ASSETS AND LIABILITIES
On initial recognition, financial assets are classified into fair value through profit or loss, available-for-sale financial assets, held-to-maturity investments or loans and receivables. Financial liabilities are measured at amortised cost, except for trading liabilities and other financial liabilities designated at fair value through profit or loss on initial recognition which are held at fair value. Purchases and sales of securities and other financial assets and trading liabilities are recognised on trade date, being the date that the Group is committed to purchase or sell an asset.
Financial assets are derecognised when the contractual right to receive cash flows from those assets has expired or when the Group has transferred its contractual right to receive the cash flows from the assets and either:
|
|
|
|
– |
substantially all of the risks and rewards of ownership have been transferred; or |
|
|
|
|
– |
the Group has neither retained nor transferred substantially all of the risks and rewards, but has transferred control. |
Financial liabilities are derecognised when they are extinguished (ie when the obligation is discharged), cancelled or expire.
(1) FINANCIAL INSTRUMENTS AT FAIR VALUE THROUGH PROFIT OR LOSS
Financial instruments are classified at fair value through profit or loss where they are trading securities or where they are designated at fair value through profit or loss by management. Derivatives are carried at fair value (see (F) below).
Trading securities are debt securities and equity shares acquired principally for the purpose of selling in the short term or which are part of a portfolio which is managed for short-term gains. Such securities are classified as trading securities and recognised in the balance sheet at their fair value. Gains and losses arising from changes in their fair value together with interest coupons and dividend income are recognised in the income statement within net trading income in the period in which they occur.
Other financial assets and liabilities at fair value through profit or loss are designated as such by management upon initial recognition. Such assets and liabilities are carried in the balance sheet at their fair value and gains and losses arising from changes in fair value together with interest coupons and dividend income are recognised in the income statement within net trading income in the period in which they occur. Financial assets and liabilities are designated at fair value through profit or loss on acquisition in the following circumstances:
|
|
|
|
– |
it eliminates or significantly reduces the inconsistent treatment that would otherwise arise from measuring the assets and liabilities or recognising gains or losses on different bases. The main type of financial assets designated by the Group at fair value through profit or loss are assets backing insurance contracts and investment contracts issued by the Group’s life insurance businesses. Fair value designation allows changes in the fair value of these assets to be recorded in the income statement along with the changes in the value of the associated liabilities, thereby significantly reducing the measurement inconsistency had the assets been classified as available-for-sale financial assets. |
|
|
|
|
– |
the assets and liabilities are part of a group which is managed, and its performance evaluated, on a fair value basis in accordance with a documented risk management or investment strategy, with management information also prepared on this basis. As noted in (A)(2) above certain of the Group’s investments are managed as venture capital investments and evaluated on the basis of their fair value and these assets are designated at fair value through profit or loss. |
|
|
|
|
– |
where the assets and liabilities contain one or more embedded derivatives that significantly modify the cash flows arising under the contract and would otherwise need to be separately accounted for. |
The fair values of assets and liabilities traded in active markets are based on current bid and offer prices respectively. If the market is not active the Group establishes a fair value by using valuation techniques. These include the use of recent arm’s length transactions, reference to other instruments
F-13
NOTES TO THE CONSOLIDATED FINANCIAL STATEMENTS
NOTE 2: ACCOUNTING POLICIES continued
that are substantially the same, discounted cash flow analysis, option pricing models and other valuation techniques commonly used by market participants. Refer to note 3 (Critical accounting estimates and judgements: Fair value of financial instruments) and note 55(3) (Financial instruments: Fair values of financial assets and liabilities) for details of valuation techniques and significant inputs to valuation models.
The Group is permitted to reclassify, at fair value at the date of transfer, non-derivative financial assets (other than those designated at fair value through profit or loss by the entity upon initial recognition) out of the trading category if they are no longer held for the purpose of being sold or repurchased in the near term, as follows:
|
|
|
|
– |
if the financial assets would have met the definition of loans and receivables (but for the fact that they had to be classified as held for trading at initial recognition), they may be reclassified into loans and receivables where the Group has the intention and ability to hold the assets for the foreseeable future or until maturity; |
|
|
|
|
– |
if the financial assets would not have met the definition of loans and receivables, they may be reclassified out of the held for trading category into available-for-sale financial assets in ‘rare circumstances’. |
(2) AVAILABLE-FOR-SALE FINANCIAL ASSETS
Debt securities and equity shares that are not classified as trading securities, at fair value through profit or loss, held-to-maturity investments or as loans and receivables are classified as available-for-sale financial assets and are recognised in the balance sheet at their fair value, inclusive of transaction costs. Available-for-sale financial assets are those intended to be held for an indeterminate period of time and may be sold in response to needs for liquidity or changes in interest rates, exchange rates or equity prices. Gains and losses arising from changes in the fair value of investments classified as available-for-sale are recognised directly in other comprehensive income, until the financial asset is either sold, becomes impaired or matures, at which time the cumulative gain or loss previously recognised in other comprehensive income is recognised in the income statement. Interest calculated using the effective interest method and foreign exchange gains and losses on debt securities denominated in foreign currencies are recognised in the income statement.
The Group is permitted to transfer a financial asset from the available-for-sale category to the loans and receivables category where that asset would have met the definition of loans and receivables at the time of reclassification (if the financial asset had not been designated as available-for-sale) and where there is both the intention and ability to hold that financial asset for the foreseeable future. Reclassification of a financial asset from the available-for-sale category to the held-to-maturity category is permitted when the Group has the ability and intent to hold that financial asset to maturity.
Reclassifications are made at fair value as of the reclassification date. Fair value becomes the new cost or amortised cost as applicable. Effective interest rates for financial assets reclassified to the loans and receivables and held-to-maturity categories are determined at the reclassification date. Any previous gain or loss on a transferred asset that has been recognised in equity is amortised to profit or loss over the remaining life of the investment using the effective interest method or until the asset becomes impaired. Any difference between the new amortised cost and the expected cash flows is also amortised over the remaining life of the asset using the effective interest method.
When an impairment loss is recognised in respect of available-for-sale assets transferred, the unamortised balance of any available-for-sale reserve that remains in equity is transferred to the income statement and recorded as part of the impairment loss.
(3) LOANS AND RECEIVABLES
Loans and receivables include loans and advances to banks and customers and eligible assets including those transferred into this category out of the fair value through profit or loss or available-for-sale financial assets categories. Loans and receivables are initially recognised when cash is advanced to the borrowers at fair value inclusive of transaction costs or, for eligible assets transferred into this category, their fair value at the date of transfer. Financial assets classified as loans and receivables are accounted for at amortised cost using the effective interest method (see (D) above) less provision for impairment (see (H) below).
The Group has entered into securitisation and similar transactions to finance certain loans and advances to customers. In cases where the securitisation vehicles are funded by the issue of debt, on terms whereby the majority of the risks and rewards of the portfolio of securitised lending are retained by the Group, these loans and advances continue to be recognised by the Group, together with a corresponding liability for the funding.
(4) HELD-TO-MATURITY INVESTMENTS
Held-to-maturity investments are non-derivative financial assets with fixed or determinable payments and fixed maturities that the Group’s management has the positive intention and ability to hold to maturity other than:
|
|
|
|
– |
those that the Group designates upon initial recognition as at fair value through profit or loss; |
|
|
|
|
– |
those that the Group designates as available-for-sale; and |
|
|
|
|
– |
those that meet the definition of loans and receivables. |
These are initially recognised at fair value including direct and incremental transaction costs and measured subsequently at amortised cost, using the effective interest method, less any provision for impairment.
(5) BORROWINGS
Borrowings (which include deposits from banks, customer deposits, debt securities in issue and subordinated liabilities) are recognised initially at fair value, being their issue proceeds net of transaction costs incurred. These instruments are subsequently stated at amortised cost using the effective interest method.
Preference shares and other instruments which carry a mandatory coupon or are redeemable on a specific date are classified as financial liabilities. The coupon on these instruments is recognised in the income statement as interest expense.
An exchange of financial liabilities on substantially different terms is accounted for as an extinguishment of the original financial liability and the recognition of a new financial liability. The difference between the carrying amount of a financial liability extinguished and the new financial liability is recognised in profit or loss together with any related costs or fees incurred.
F-14
NOTES TO THE CONSOLIDATED FINANCIAL STATEMENTS
NOTE 2: ACCOUNTING POLICIES continued
When a financial liability is exchanged for an equity instrument, the new equity instrument is recognised at fair value and any difference between the original carrying value of the liability and the fair value of the new equity is recognised in the profit or loss together with any related costs or fees incurred.
(6) SALE AND REPURCHASE AGREEMENTS
Securities sold subject to repurchase agreements (repos) continue to be recognised on the balance sheet where substantially all of the risks and rewards are retained. Funds received under these arrangements are included in deposits from banks, customer deposits, or trading liabilities. Conversely, securities purchased under agreements to resell (reverse repos), where the Group does not acquire substantially all of the risks and rewards of ownership, are recorded as loans and receivables or trading securities. The difference between sale and repurchase price is treated as interest and accrued over the life of the agreements using the effective interest method.
Securities lent to counterparties are retained in the financial statements. Securities borrowed are not recognised in the financial statements, unless these are sold to third parties, in which case the obligation to return them is recorded at fair value as a trading liability.
(F) DERIVATIVE FINANCIAL INSTRUMENTS AND HEDGE ACCOUNTING
All derivatives are recognised at their fair value. Fair values are obtained from quoted market prices in active markets, including recent market transactions, and using valuation techniques, including discounted cash flow and option pricing models, as appropriate. Derivatives are carried in the balance sheet as assets when their fair value is positive and as liabilities when their fair value is negative. Refer to note 3 (Critical accounting estimates and judgements: Fair value of financial instruments) and note 55(3) (Financial instruments: Fair values of financial assets and liabilities) for details of valuation techniques and significant inputs to valuation models.
Changes in the fair value of any derivative instrument that is not part of a hedging relationship are recognised immediately in the income statement.
Derivatives embedded in financial instruments and insurance contracts (unless the embedded derivative is itself an insurance contract) are treated as separate derivatives when their economic characteristics and risks are not closely related to those of the host contract and the host contract is not carried at fair value through profit or loss. These embedded derivatives are measured at fair value with changes in fair value recognised in the income statement. In accordance with IFRS 4 Insurance Contracts, a policyholder’s option to surrender an insurance contract for a fixed amount is not treated as an embedded derivative.
The method of recognising the movements in the fair value of derivatives depends on whether they are designated as hedging instruments and, if so, the nature of the item being hedged. Hedge accounting allows one financial instrument, generally a derivative such as a swap, to be designated as a hedge of another financial instrument such as a loan or deposit or a portfolio of such instruments. At the inception of the hedge relationship, formal documentation is drawn up specifying the hedging strategy, the hedged item and the hedging instrument and the methodology that will be used to measure the effectiveness of the hedge relationship in offsetting changes in the fair value or cash flow of the hedged risk. The effectiveness of the hedging relationship is tested both at inception and throughout its life and if at any point it is concluded that it is no longer highly effective in achieving its documented objective, hedge accounting is discontinued.
The Group designates certain derivatives as either: (1) hedges of the fair value of the particular risks inherent in recognised assets or liabilities (fair value hedges); (2) hedges of highly probable future cash flows attributable to recognised assets or liabilities (cash flow hedges); or (3) hedges of net investments in foreign operations (net investment hedges). These are accounted for as follows:
(1) FAIR VALUE HEDGES
Changes in the fair value of derivatives that are designated and qualify as fair value hedges are recorded in the income statement, together with the changes in the fair value of the hedged asset or liability that are attributable to the hedged risk; this also applies if the hedged asset is classified as an available-for-sale financial asset. If the hedge no longer meets the criteria for hedge accounting, changes in the fair value of the hedged item attributable to the hedged risk are no longer recognised in the income statement. The cumulative adjustment that has been made to the carrying amount of the hedged item is amortised to the income statement using the effective interest method over the period to maturity.
(2) CASH FLOW HEDGES
The effective portion of changes in the fair value of derivatives that are designated and qualify as cash flow hedges is recognised in other comprehensive income in the cash flow hedge reserve. The gain or loss relating to the ineffective portion is recognised immediately in the income statement. Amounts accumulated in equity are reclassified to the income statement in the periods in which the hedged item affects profit or loss. When a hedging instrument expires or is sold, or when a hedge no longer meets the criteria for hedge accounting, any cumulative gain or loss existing in equity at that time remains in equity and is recognised in the income statement when the forecast transaction is ultimately recognised in the income statement. When a forecast transaction is no longer expected to occur, the cumulative gain or loss that was reported in equity is immediately transferred to the income statement.
(3) NET INVESTMENT HEDGES
Hedges of net investments in foreign operations are accounted for similarly to cash flow hedges. Any gain or loss on the hedging instrument relating to the effective portion of the hedge is recognised in other comprehensive income, the gain or loss relating to the ineffective portion is recognised immediately in the income statement. Gains and losses accumulated in equity are included in the income statement when the foreign operation is disposed of. The hedging instrument used in net investment hedges may include non-derivative liabilities as well as derivative financial instruments.
(G) OFFSET
Financial assets and liabilities are offset and the net amount reported in the balance sheet when there is a legally enforceable right of set-off and there is an intention to settle on a net basis, or realise the asset and settle the liability simultaneously. In certain situations, even though master netting agreements exist, the lack of management intention to settle on a net basis results in the financial assets and liabilities being reported gross on the balance sheet.
F-15
NOTES TO THE CONSOLIDATED FINANCIAL STATEMENTS
NOTE 2: ACCOUNTING POLICIES continued
(H) IMPAIRMENT OF FINANCIAL ASSETS
(1) ASSETS ACCOUNTED FOR AT AMORTISED COST
At each balance sheet date the Group assesses whether, as a result of one or more events occurring after initial recognition of the financial asset and prior to the balance sheet date, there is objective evidence that a financial asset or group of financial assets has become impaired.
Where such an event has had an impact on the estimated future cash flows of the financial asset or group of financial assets, an impairment allowance is recognised. The amount of impairment allowance is the difference between the asset’s carrying amount and the present value of estimated future cash flows discounted at the asset’s original effective interest rate. If the asset has a variable rate of interest, the discount rate used for measuring the impairment allowance is the current effective interest rate.
Subsequent to the recognition of an impairment loss on a financial asset or a group of financial assets, interest income continues to be recognised on an effective interest rate basis, on the asset’s carrying value net of impairment provisions. If, in a subsequent period, the amount of the impairment loss decreases and the decrease can be related objectively to an event occurring after the impairment was recognised, such as an improvement in the borrower’s credit rating, the allowance is adjusted and the amount of the reversal is recognised in the income statement.
Impairment allowances are assessed individually for financial assets that are individually significant. Such individual assessment is used primarily for the Group’s wholesale lending portfolios in the Wholesale, Commercial and Wealth and International divisions. Impairment allowances for portfolios of smaller balance homogenous loans such as most residential mortgages, personal loans and credit card balances in the Group’s retail portfolios in both the Retail and Wealth and International divisions that are below the individual assessment thresholds, and for loan losses that have been incurred but not separately identified at the balance sheet date, are determined on a collective basis.
INDIVIDUAL ASSESSMENT
In respect of individually significant financial assets in the Group’s wholesale lending portfolios, assets are reviewed on a regular basis and those showing potential or actual vulnerability are placed on a watch list where greater monitoring is undertaken and any adverse or potentially adverse impact on ability to repay is used in assessing whether an asset should be transferred to a dedicated Business Support Unit. Specific examples of trigger events that would lead to the initial recognition of impairment allowances against lending to corporate borrowers (or the recognition of additional impairment allowances) include (i) trading losses, loss of business or major customer of a borrower, (ii) material breaches of the terms and conditions of a loan facility, including non-payment of interest or principal, or a fall in the value of security such that it is no longer considered adequate, (iii) disappearance of an active market because of financial difficulties, or (iv) restructuring a facility with preferential terms to aid recovery of the lending (such as a debt for equity swap).
For such individually identified financial assets, a review is undertaken of the expected future cash flows which requires significant management judgement as to the amount and timing of such cash flows. Where the debt is secured, the assessment reflects the expected cash flows from the realisation of the security, net of costs to realise, whether or not foreclosure or realisation of the collateral is probable.
For impaired debt instruments which are held at amortised cost, impairment losses are recognised in subsequent periods when it is determined that there has been a further negative impact on expected future cash flows. A reduction in fair value caused by general widening of credit spreads would not, of itself, result in additional impairment.
COLLECTIVE ASSESSMENT
Impairment is assessed on a collective basis for (1) homogenous groups of loans that are not considered individually impaired, and (2) to cover losses which have been incurred but have not yet been identified on loans subject to individual impairment.
HOMOGENOUS GROUPS OF LOANS
In respect of portfolios of smaller balance, homogenous loans, the asset is included in a group of financial assets with similar risk characteristics and collectively assessed for impairment. Segmentation takes into account factors such as the type of asset, industry sector, geographical location, collateral type, past-due status and other relevant factors. These characteristics are relevant to the estimation of future cash flows for groups of such assets as they are indicative of the borrower’s ability to pay all amounts due according to the contractual terms of the assets being evaluated.
Generally, the impairment trigger used within the impairment calculation for a loan, or group of loans, is when they reach a pre-defined level of delinquency or where the customer is bankrupt. Loans where the Group provides arrangements that forgive a portion of interest or principal are also deemed to be impaired and loans that are originated to refinance currently impaired assets are also defined as impaired.
In respect of the Group’s secured mortgage portfolios, the impairment allowance is calculated based on a definition of impaired loans which are those six months or more in arrears (or certain cases where the borrower is bankrupt or is in possession). The estimated cash flows are calculated based on historical experience and are dependent on estimates of the expected value of collateral which takes into account expected future movements in house prices, less costs to sell.
For unsecured personal lending portfolios, the impairment trigger is generally when the balance is two or more instalments in arrears or where the customer has exhibited one or more of the impairment characteristics set out above. While the trigger is based on the payment performance or circumstances of each individual asset, the assessment of future cash flows uses historical experience of cohorts of similar portfolios such that the assessment is considered to be collective. Future cash flows are estimated on the basis of the contractual cash flows of the assets in the cohort and historical loss experience for similar assets. Historical loss experience is adjusted on the basis of current observable data about economic and credit conditions (including unemployment rates and borrowers’ behaviour) to reflect the effects of current conditions that did not affect the period on which the historical loss experience is based and to remove the effects of conditions in the historical period that do not exist currently. The methodology and assumptions used for estimating future cash flows are reviewed regularly by the Group to reduce any differences between loss estimates and actual loss experience.
INCURRED BUT NOT YET IDENTIFIED IMPAIRMENT
The collective provision also includes provision for inherent losses, that is losses that have been incurred but have not been separately identified at the balance sheet date. The loans that are not currently recognised as impaired are grouped into homogenous portfolios by key risk drivers. Risk drivers for secured retail lending include the current indexed loan-to-value, previous mortgage arrears, internal cross-product delinquency data and external credit bureau data; for unsecured retail lending they include whether the account is up-to-date and, if not, the number of payments that
F-16
NOTES TO THE CONSOLIDATED FINANCIAL STATEMENTS
NOTE 2: ACCOUNTING POLICIES continued
have been missed; and for wholesale lending they include factors such as observed default rates and loss given default. An assessment is made of the likelihood of each account becoming recognised as impaired within the loss emergence period, with the economic loss that each portfolio is likely to generate were it to become impaired. The loss emergence period is determined by local management for each portfolio and the Group has a range of loss emergence periods which are dependent upon the characteristics of the portfolios. Loss emergence periods are reviewed regularly and updated when appropriate. In general the periods used across the Group vary between one month and twelve months based on historical experience. Unsecured portfolios tend to have shorter loss emergence periods than secured portfolios.
LOAN RENEGOTIATIONS AND FORBEARANCE
In certain circumstances, the Group will renegotiate the original terms of a customer’s loan, either as part of an ongoing customer relationship or in response to adverse changes in the circumstances of the borrower. There are a number of different types of loan renegotiation, including the capitalisation of arrears, payment holidays, interest rate adjustments and extensions of the due date of payment (see note 56 Credit risk sections F and G). Where the renegotiated payments of interest and principal will not recover the original carrying value of the asset, the asset continues to be reported as past due and is considered impaired. Where the renegotiated payments of interest and principal will recover the original carrying value of the asset, the loan is no longer reported as past due or impaired provided that payments are made in accordance with the revised terms. Renegotiation may lead to the loan and associated provision being derecognised and a new loan being recognised initially at fair value.
WRITE OFFS
A loan or advance is normally written off, either partially or in full, against the related allowance when the proceeds from realising any available security have been received or there is no realistic prospect of recovery and the amount of the loss has been determined. Subsequent recoveries of amounts previously written off decrease the amount of impairment losses recorded in the income statement. For both secured and unsecured retail balances, the write-off takes place only once an extensive set of collections processes has been completed, or the status of the account reaches a point where policy dictates that forbearance is no longer appropriate. For wholesale lending, a write-off occurs if the loan facility with the customer is restructured, the asset is under administration and the only monies that can be received are the amounts estimated by the administrator, the underlying assets are disposed and a decision is made that no further settlement monies will be received, or external evidence (for example, third party valuations) is available that there has been an irreversible decline in expected cash flows.
DEBT FOR EQUITY EXCHANGES
Equity securities acquired in exchange for loans in order to achieve an orderly realisation are accounted for as a disposal of the loan and an acquisition of equity securities, held as available-for-sale. Where control is obtained over an entity as a result of the transaction, the entity is consolidated; where the Group has significant influence over an entity as a result of the transaction, the investment is accounted for by the equity method of accounting (see (A) above). Any subsequent impairment of the assets or business acquired is treated as an impairment of the relevant asset or business and not as an impairment of the original instrument.
(2) AVAILABLE-FOR-SALE FINANCIAL ASSETS
The Group assesses, at each balance sheet date, whether there is objective evidence that an available-for-sale financial asset is impaired. In addition to the criteria for financial assets accounted for at amortised cost set out above, this assessment involves reviewing the current financial circumstances (including creditworthiness) and future prospects of the issuer, assessing the future cash flows expected to be realised and, in the case of equity shares, considering whether there has been a significant or prolonged decline in the fair value of the asset below its cost. If an impairment loss has been incurred, the cumulative loss measured as the difference between the acquisition cost (net of any principal repayment and amortisation) and the current fair value, less any impairment loss on that asset previously recognised, is reclassified from equity to the income statement. For impaired debt instruments, impairment losses are recognised in subsequent periods when it is determined that there has been a further negative impact on expected future cash flows; a reduction in fair value caused by general widening of credit spreads would not, of itself, result in additional impairment. If, in a subsequent period, the fair value of a debt instrument classified as available-for-sale increases and the increase can be objectively related to an event occurring after the impairment loss was recognised, an amount not greater than the original impairment loss is credited to the income statement; any excess is taken to other comprehensive income. Impairment losses recognised in the income statement on equity instruments are not reversed through the income statement.
(I) INVESTMENT PROPERTY
Investment property comprises freehold and long leasehold land and buildings that are held either to earn rental income or for capital appreciation or both. The Group’s investment property primarily relates to property held for long-term rental yields and capital appreciation within the life insurance funds. Investment property is carried in the balance sheet at fair value, being the open market value as determined in accordance with the guidance published by the Royal Institution of Chartered Surveyors. If this information is not available, the Group uses alternative valuation methods such as discounted cash flow projections or recent prices. These valuations are reviewed at least annually by an independent valuation expert. Investment property being redeveloped for continuing use as investment property, or for which the market has become less active, continues to be measured at fair value. Changes in fair value are recognised in the income statement as net trading income.
(J) TANGIBLE FIXED ASSETS
Tangible fixed assets are included at cost less accumulated depreciation. The value of land (included in premises) is not depreciated. Depreciation on other assets is calculated using the straight-line method to allocate the difference between the cost and the residual value over their estimated useful lives, as follows:
Premises (excluding land):
|
|
|
|
– |
Freehold/long and short leasehold premises: shorter of 50 years and the remaining period of the lease |
|
|
|
|
– |
Leasehold improvements: shorter of 10 years and, if lease renewal is not likely, the remaining period of the lease |
|
|
|
|
Equipment: |
|
|
|
|
|
– |
Fixtures and furnishings: 10-20 years |
|
|
|
|
– |
Other equipment and motor vehicles: 2-8 years |
F-17
NOTES TO THE CONSOLIDATED FINANCIAL STATEMENTS
NOTE 2: ACCOUNTING POLICIES continued
The assets’ residual values and useful lives are reviewed, and adjusted if appropriate, at each balance sheet date.
Assets are reviewed for impairment whenever events or changes in circumstances indicate that the carrying amount may not be recoverable. In the event that an asset’s carrying amount is determined to be greater than its recoverable amount it is written down immediately. The recoverable amount is the higher of the asset’s fair value less costs to sell and its value in use.
(K) LEASES
(1) AS
LESSEE
The leases entered into by the Group are primarily operating leases. Operating lease rentals payable are charged to the income statement on a straight-line basis over the period of the lease.
When an operating lease is terminated before the end of the lease period, any payment made to the lessor by way of penalty is recognised as an expense in the period of termination.
(2) AS LESSOR
Assets leased to customers are classified as finance leases if the lease agreements transfer substantially all the risks and rewards of ownership to the lessee but not necessarily legal title. All other leases are classified as operating leases. When assets are subject to finance leases, the present value of the lease payments, together with any unguaranteed residual value, is recognised as a receivable, net of provisions, within loans and advances to banks and customers. The difference between the gross receivable and the present value of the receivable is recognised as unearned finance lease income. Finance lease income is recognised in interest income over the term of the lease using the net investment method (before tax) so as to give a constant rate of return on the net investment in the leases. Unguaranteed residual values are reviewed regularly to identify any impairment.
Operating lease assets are included within tangible fixed assets at cost and depreciated over their estimated useful lives, which equates to the lives of the leases, after taking into account anticipated residual values. Operating lease rental income is recognised on a straight-line basis over the life of the lease.
The Group evaluates non-lease arrangements such as outsourcing and similar contracts to determine if they contain a lease which is then accounted for separately.
(L) PENSIONS AND OTHER POST-RETIREMENT BENEFITS
The Group operates a number of post-retirement benefit schemes for its employees including both defined benefit and defined contribution pension plans. A defined benefit scheme is a pension plan that defines an amount of pension benefit that an employee will receive on retirement, dependent on one or more factors such as age, years of service and salary. A defined contribution plan is a pension plan into which the Group pays fixed contributions; there is no legal or constructive obligation to pay further contributions.
Full actuarial valuations of the Group’s principal defined benefit schemes are carried out every three years with interim reviews in the intervening years; these valuations are updated to 31 December each year by qualified independent actuaries, or in the case of the Scottish Widows Retirement Benefits Scheme, by a qualified actuary employed by Scottish Widows. For the purposes of these annual updates scheme assets are included at their fair value and scheme liabilities are measured on an actuarial basis using the projected unit credit method adjusted for unrecognised actuarial gains and losses. The defined benefit scheme liabilities are discounted using rates equivalent to the market yields at the balance sheet date on high-quality corporate bonds that are denominated in the currency in which the benefits will be paid, and that have terms to maturity approximating to the terms of the related pension liability.
The Group’s income statement charge includes the current service cost of providing pension benefits, the expected return on the schemes’ assets, net of expected administration costs, and the interest cost on the schemes’ liabilities. Actuarial gains and losses arising from experience adjustments and changes in actuarial assumptions are not recognised unless the cumulative unrecognised gain or loss at the end of the previous reporting period exceeds the greater of 10 per cent of the scheme assets or liabilities (‘the corridor approach’). In these circumstances the excess is charged or credited to the income statement over the employees’ expected average remaining working lives. Past service costs are charged immediately to the income statement, unless the charges are conditional on the employees remaining in service for a specified period of time (the vesting period). In this case, the past service costs are amortised on a straight-line basis over the vesting period.
The Group’s balance sheet includes the net surplus or deficit, being the difference between the fair value of scheme assets and the discounted value of scheme liabilities at the balance sheet date adjusted for any cumulative unrecognised actuarial gains or losses. Surpluses are only recognised to the extent that they are recoverable through reduced contributions in the future or through refunds from the schemes.
The Group recognises the effect of material changes to the terms of its defined benefit pension plans which reduce future benefits as curtailments; gains and losses are recognised in the income statement when the curtailments occur.
The costs of the Group’s defined contribution plans are charged to the income statement in the period in which they fall due.
(M) SHARE-BASED COMPENSATION
The Group operates a number of equity-settled, share-based compensation plans in respect of services received from certain of its employees. The value of the employee services received in exchange for equity instruments granted under these plans is recognised as an expense over the vesting period of the instruments, with a corresponding increase in equity. This expense is determined by reference to the fair value of the number of equity instruments that are expected to vest. The fair value of equity instruments granted is based on market prices, if available, at the date of grant. In the absence of market prices, the fair value of the instruments at the date of grant is estimated using an appropriate valuation technique, such as a Black-Scholes option pricing model. The determination of fair values excludes the impact of any non-market vesting conditions, which are included in the assumptions used to estimate the number of options that are expected to vest. At each balance sheet date, this estimate is reassessed and if necessary revised. Any revision of the original estimate is recognised in the income statement over the remaining vesting period, together with a corresponding adjustment to equity. Cancellations by employees of contributions to the Group’s Save As You Earn plans are treated as non-vesting conditions and in accordance with IFRS 2 (Revised) the Group recognises, in the year of cancellation, the amount of the expense that would have otherwise been recognised over the remainder of the vesting period. Modifications are assessed at the date of modification and any incremental charges are charged to the income statement over any remaining vesting period.
F-18
NOTES TO THE CONSOLIDATED FINANCIAL STATEMENTS
NOTE 2: ACCOUNTING POLICIES continued
(N) TAXATION
Current income tax which is payable on taxable profits is recognised as an expense in the period in which the profits arise.
For the Group’s long-term insurance businesses, the tax charge is analysed between tax that is payable in respect of policyholders’ returns and tax that is payable on equity holders’ returns. This allocation is based on an assessment of the rates of tax which will be applied to the returns under current UK tax rules.
Deferred tax is provided in full, using the liability method, on temporary differences arising between the tax bases of assets and liabilities and their carrying amounts in the consolidated financial statements. However, deferred tax is not accounted for if it arises from initial recognition of an asset or liability in a transaction other than a business combination that at the time of the transaction affects neither accounting nor taxable profit or loss. Deferred tax is determined using tax rates that have been enacted or substantially enacted by the balance sheet date which are expected to apply when the related deferred tax asset is realised or the deferred tax liability is settled.
Deferred tax assets are recognised where it is probable that future taxable profit will be available against which the temporary differences can be utilised. Income tax payable on profits is recognised as an expense in the period in which those profits arise. The tax effects of losses available for carry forward are recognised as an asset when it is probable that future taxable profits will be available against which these losses can be utilised. Deferred and current tax related to gains and losses on the fair value re-measurement of available-for-sale investments and cash flow hedges, where these gains and losses are recognised in other comprehensive income, is also recognised in other comprehensive income. Such tax is subsequently transferred to the income statement together with the gain or loss.
Deferred and current tax assets and liabilities are offset when they arise in the same tax reporting group and where there is both a legal right of offset and the intention to settle on a net basis or to realise the asset and settle the liability simultaneously.
(O) INSURANCE
The Group undertakes both life insurance and general insurance business. Insurance and participating investment contracts are accounted for under IFRS 4 Insurance Contracts, which permits (with certain exceptions) the continuation of accounting practices for measuring insurance and participating investment contracts that applied prior to the adoption of IFRS. The Group, therefore, continues to account for these products using UK GAAP, including FRS 27 Life Assurance, and UK established practice.
Products sold by the life insurance business are classified into three categories:
Insurance contracts – these contracts transfer significant insurance risk and may also transfer financial risk. The Group defines significant insurance risk as the possibility of having to pay benefits on the occurrence of an insured event which are significantly more than the benefits payable if the insured event were not to occur. These contracts may or may not include discretionary participation features.
Investment contracts containing a discretionary participation feature (participating investment contracts) – these contracts do not transfer significant insurance risk, but contain a contractual right which gives the holder the right to receive, in addition to the guaranteed benefits, further additional discretionary benefits or bonuses that are likely to be a significant proportion of the total contractual benefits and the amount and timing of which is at the discretion of the Group, within the constraints of the terms and conditions of the instrument and based upon the performance of specified assets.
Non-participating investment contracts – these contracts do not transfer significant insurance risk or contain a discretionary participation feature.
The general insurance business issues only insurance contracts.
(1) LIFE INSURANCE BUSINESS
(I) ACCOUNTING FOR INSURANCE AND PARTICIPATING INVESTMENT CONTRACTS
PREMIUMS AND CLAIMS
Premiums received in respect of insurance and participating investment contracts are recognised as revenue when due except for unit-linked contracts on which premiums are recognised as revenue when received. Claims are recorded as an expense on the earlier of the maturity date or the date on which the claim is notified.
LIABILITIES
|
|
|
|
– |
Insurance and participating investment contracts in the Group’s with-profit funds |
Liabilities of the Group’s with-profit funds, including guarantees and options embedded within products written by these funds, are stated at their realistic values in accordance with the Financial Services Authority’s realistic capital regime, except that projected transfers out of the funds into other Group funds are recorded in the unallocated surplus (see below). Further details on the realistic capital regime are given on page 81. Changes in the value of these liabilities are recognised through insurance claims.
|
|
|
|
– |
Insurance and participating investment contracts which are not unit-linked or in the Group’s with-profit funds |
A liability for contractual benefits that are expected to be incurred in the future is recorded when the premiums are recognised. The liability is calculated by estimating the future cash flows over the duration of in-force policies and discounting them back to the valuation date allowing for probabilities of occurrence. The liability will vary with movements in interest rates and with the cost of life insurance and annuity benefits where future mortality is uncertain.
Assumptions are made in respect of all material factors affecting future cash flows, including future interest rates, mortality and costs.
Changes in the value of these liabilities are recognised in the income statement through insurance claims.
|
|
|
|
– |
Insurance and participating investment contracts which are unit-linked |
Liabilities for unit-linked insurance contracts and participating investment contracts are stated at the bid value of units plus an additional allowance where appropriate (such as for any excess of future expenses over charges). The liability is increased or reduced by the change in the unit prices and is reduced by policy administration fees, mortality and surrender charges and any withdrawals. Changes in the value of the liability are recognised
F-19
NOTES TO THE CONSOLIDATED FINANCIAL STATEMENTS
NOTE 2: ACCOUNTING POLICIES continued
in the income statement through insurance claims. Benefit claims in excess of the account balances incurred in the period are also charged through insurance claims. Revenue consists of fees deducted for mortality, policy administration and surrender charges.
UNALLOCATED SURPLUS
Any amounts in the with-profit funds not yet determined as being due to policyholders or shareholders are recognised as an unallocated surplus which is shown separately from liabilities arising from insurance contracts and participating investment contracts.
(II) ACCOUNTING FOR NON-PARTICIPATING INVESTMENT CONTRACTS
The Group’s non-participating investment contracts are primarily unit-linked. These contracts are accounted for as financial liabilities whose value is contractually linked to the fair values of financial assets within the Group’s unitised investment funds. The value of the unit-linked financial liabilities is determined using current unit prices multiplied by the number of units attributed to the contract holders at the balance sheet date. Their value is never less than the amount payable on surrender, discounted for the required notice period where applicable. Investment returns (including movements in fair value and investment income) allocated to those contracts are recognised in insurance claims.
Deposits and withdrawals are not accounted for through the income statement but are accounted for directly in the balance sheet as adjustments to the non-participating investment contract liability.
The Group receives investment management fees in the form of an initial adjustment or charge to the amount invested. These fees are in respect of services rendered in conjunction with the issue and management of investment contracts where the Group actively manages the consideration received from its customers to fund a return that is based on the investment profile that the customer selected on origination of the contract. These services comprise an indeterminate number of acts over the lives of the individual contracts and, therefore, the Group defers these fees and recognises them over the estimated lives of the contracts, in line with the provision of investment management services.
Costs which are directly attributable and incremental to securing new non-participating investment contracts are deferred. This asset is subsequently amortised over the period of the provision of investment management services and is reviewed for impairment in circumstances where its carrying amount may not be recoverable. If the asset is greater than its recoverable amount it is written down immediately through fee and commission expense in the income statement. All other costs are recognised as expenses when incurred.
(III) VALUE OF IN-FORCE BUSINESS
The Group recognises as an asset the value of in-force business in respect of insurance contracts and participating investment contracts. The asset represents the present value of the shareholders’ interest in the profits expected to emerge from those contracts written at the balance sheet date. This is determined after making appropriate assumptions about future economic and operating conditions such as future mortality and persistency rates and includes allowances for both non-market risk and for the realistic value of financial options and guarantees. Each cash flow is valued using the discount rate consistent with that applied to such a cash flow in the capital markets. The asset in the consolidated balance sheet is presented gross of attributable tax and movements in the asset are reflected within other operating income in the income statement.
The Group’s contractual rights to benefits from providing investment management services in relation to non-participating investment contracts acquired in business combinations and portfolio transfers are measured at fair value at the date of acquisition. The resulting asset is amortised over the estimated lives of the contracts. At each reporting date an assessment is made to determine if there is any indication of impairment. Where impairment exists, the carrying value of the asset is reduced to its recoverable amount and the impairment loss recognised in the income statement.
(2) GENERAL INSURANCE BUSINESS
The Group both underwrites and acts as intermediary in the sale of general insurance products. Underwriting premiums are included in insurance premium income, net of refunds, in the period in which insurance cover is provided to the customer; premiums received relating to future periods are deferred in the balance sheet within liabilities arising from insurance contracts and participating investment contracts and only credited to the income statement when earned. Broking commission are recognised when the underwriter accepts the risk of providing insurance cover to the customer. Where appropriate, provision is made for the effect of future policy terminations based upon past experience.
The underwriting business makes provision for the estimated cost of claims notified but not settled and claims incurred but not reported at the balance sheet date. The provision for the cost of claims notified but not settled is based upon a best estimate of the cost of settling the outstanding claims after taking into account all known facts. In those cases where there is insufficient information to determine the required provision, statistical techniques are used which take into account the cost of claims that have recently been settled and make assumptions about the future development of the outstanding cases. Similar statistical techniques are used to determine the provision for claims incurred but not reported at the balance sheet date. Claims liabilities are not discounted.
(3) LIABILITY ADEQUACY TEST
At each balance sheet date liability adequacy tests are performed to ensure the adequacy of insurance and participating investment contract liabilities net of related deferred cost assets and value of in-force business. In performing these tests current best estimates of discounted future contractual cash flows and claims handling and policy administration expenses, as well as investment income from the assets backing such liabilities, are used. Any deficiency is immediately charged to the income statement, initially by writing off the relevant assets and subsequently by establishing a provision for losses arising from liability adequacy tests.
(4) REINSURANCE
Contracts entered into by the Group with reinsurers under which the Group is compensated for losses on one or more contracts issued by the Group and that meet the classification requirements for insurance contracts are classified as reinsurance contracts held.
The benefits to which the Group is entitled under its reinsurance contracts held are recognised as reinsurance assets. These assets consist of short-term balances due from reinsurers as well as longer term receivables that are dependent on the expected claims and benefits arising under the related reinsured contracts. Amounts recoverable from or due to reinsurers are measured consistently with the amounts associated with the reinsured contracts and in accordance with the terms of each reinsurance contract and are regularly reviewed for impairment. Premiums payable for reinsurance contracts are recognised as an expense when due within insurance premium income. Changes in the reinsurance recoverable assets are recognised in the income statement through insurance claims.
F-20
NOTES TO THE CONSOLIDATED FINANCIAL STATEMENTS
NOTE 2: ACCOUNTING POLICIES continued
(P) FOREIGN CURRENCY TRANSLATION
Items included in the financial statements of each of the Group’s entities are measured using the currency of the primary economic environment in which the entity operates (the functional currency). The consolidated financial statements are presented in sterling, which is the Company’s functional and presentation currency.
Foreign currency transactions are translated into the appropriate functional currency using the exchange rates prevailing at the dates of the transactions. Foreign exchange gains and losses resulting from the settlement of such transactions and from the translation at year end exchange rates of monetary assets and liabilities denominated in foreign currencies are recognised in the income statement, except when recognised in other comprehensive income as qualifying cash flow or net investment hedges. Non-monetary assets that are measured at fair value are translated using the exchange rate at the date that the fair value was determined. Translation differences on equities and similar non-monetary items held at fair value through profit and loss are recognised in profit or loss as part of the fair value gain or loss. Translation differences on available-for-sale non-monetary financial assets, such as equity shares, are included in the fair value reserve in equity unless the asset is a hedged item in a fair value hedge.
The results and financial position of all group entities that have a functional currency different from the presentation currency are translated into the presentation currency as follows:
|
|
|
|
– |
The assets and liabilities of foreign operations, including goodwill and fair value adjustments arising on the acquisition of a foreign entity, are translated into sterling at foreign exchange rates ruling at the balance sheet date. |
|
|
|
|
– |
The income and expenses of foreign operations are translated into sterling at average exchange rates unless these do not approximate to the foreign exchange rates ruling at the dates of the transactions in which case income and expenses are translated at the dates of the transactions. |
Foreign exchange differences arising on the translation of a foreign operation are recognised in other comprehensive income and accumulated in a separate component of equity together with exchange differences arising from the translation of borrowings and other currency instruments designated as hedges of such investments (see (F)(3) above). On disposal of a foreign operation, the cumulative amount of exchange differences relating to that foreign operation are reclassified from equity and included in determining the profit or loss arising on disposal.
(Q) PROVISIONS AND CONTINGENT LIABILITIES
Provisions are recognised in respect of present obligations arising from past events where it is probable that outflows of resources will be required to settle the obligations and they can be reliably estimated.
The Group recognises provisions in respect of vacant leasehold property where the unavoidable costs of the present obligations exceed anticipated rental income.
Contingent liabilities are possible obligations whose existence depends on the outcome of uncertain future events or those present obligations where the outflows of resources are uncertain or cannot be measured reliably. Contingent liabilities are not recognised in the financial statements but are disclosed unless they are remote.
(R) SHARE CAPITAL
(1) SHARE ISSUE COSTS
Incremental costs directly attributable to the issue of new shares or options or to the acquisition of a business are shown in equity as a deduction, net of tax, from the proceeds.
(2) DIVIDENDS
Dividends paid on the Group’s ordinary shares are recognised as a reduction in equity in the period in which they are paid.
(3) TREASURY SHARES
Where the Company or any member of the Group purchases the Company’s share capital, the consideration paid is deducted from shareholders’ equity as treasury shares until they are cancelled. Where such shares are subsequently sold or reissued, any consideration received is included in shareholders’ equity.
(S) CASH AND CASH EQUIVALENTS
For the purposes of the cash flow statement, cash and cash equivalents comprise cash and non-mandatory balances with central banks and amounts due from banks with a maturity of less than three months.
NOTE 3: CRITICAL ACCOUNTING ESTIMATES AND JUDGEMENTS
The preparation of the Group’s financial statements in accordance with IFRS requires management to make judgements, estimates and assumptions in applying the accounting policies that affect the reported amounts of assets, liabilities, income and expenses. Due to the inherent uncertainty in making estimates, actual results reported in future periods may be based upon amounts which differ from those estimates. Estimates, judgements and assumptions are continually evaluated and are based on historical experience and other factors, including expectations of future events that are believed to be reasonable under the circumstances.
The significant judgements made by management in applying the Group’s accounting policies and the key sources of estimation uncertainty in these financial statements, which together are deemed critical to the Group’s results and financial position, are as follows.
ALLOWANCE FOR IMPAIRMENT LOSSES ON LOANS AND RECEIVABLES
At 31 December 2011 gross loans and receivables totalled £629,736 million (2010: £667,555 million) against which impairment allowances of
£19,022 million (2010: £18,951 million) had been made (see note 25). The Group’s accounting policy for losses arising on financial assets classified as loans and receivables is described in note 2(H)(1); this note also provides an overview of the methodologies applied.
The allowance for impairment losses on loans and receivables is management’s best estimate of losses incurred in the portfolio at the balance sheet date. Impairment allowances are made up of two components, those determined individually and those determined collectively.
F-21
NOTES TO THE CONSOLIDATED FINANCIAL STATEMENTS
NOTE 3: CRITICAL ACCOUNTING ESTIMATES AND JUDGEMENTS continued
Individual impairment allowances are generally established against the Group’s wholesale lending portfolios. The determination of individual impairment allowances requires the exercise of considerable judgement by management involving matters such as local economic conditions and the resulting trading performance of the customer, and the value of the security held, for which there may not be a readily accessible market. In particular, significant judgement is required by management in the current economic environment in assessing the borrower’s cash flows and debt servicing capability together with the realisable value of collateral. The actual amount of the future cash flows and their timing may differ significantly from the assumptions made for the purposes of determining the impairment allowances and consequently these allowances can be subject to variation as time progresses and the circumstances of the customer become clearer.
Collective impairment allowances are generally established for smaller balance homogenous portfolios. The collective impairment allowance is also subject to estimation uncertainty and in particular is sensitive to changes in economic and credit conditions, including the interdependency of house prices, unemployment rates, interest rates, borrowers’ behaviour, and consumer bankruptcy trends. It is, however, inherently difficult to estimate how changes in one or more of these factors might impact the collective impairment allowance.
Given the relative size of the mortgage portfolio, a key variable is house prices which determine the collateral value supporting loans in such portfolios. The value of this collateral is estimated by applying changes in house price indices to the original assessed value of the property. If average house prices were ten per cent lower than those estimated at 31 December 2011, the impairment charge would increase by approximately £285 million in respect of UK mortgages and a further £75 million in respect of Irish mortgages.
In addition, a collective unimpaired provision is made for loan losses that have been incurred but have not been separately identified at the balance sheet date. This provision is sensitive to changes in the time between the loss event and the date the impairment is specifically identified. This period is known as the loss emergence period. In the Wholesale division, an increase of one month in the loss emergence period in respect of the loan portfolio assessed for collective unimpaired provisions would result in an increase in the collective unimpaired provision of approximately £181 million (at 31 December 2010, a one month increase in the loss emergence period would have increased the collective unimpaired provision by an estimated £333 million).
UNWIND OF HBOS ACQUISITION FAIR VALUE ADJUSTMENTS
The acquisition of HBOS in January 2009 required the Group to recognise the identifiable assets acquired and liabilities assumed at their acquisition-date fair values. The overall effect was to increase the book value of HBOS’s net assets by £1,241 million primarily reflecting a reduction in the value of HBOS’s debt securities and subordinated liabilities of £15,439 million, partially offset by a reduction in the carrying value of HBOS’s loans and receivables of £14,880 million, including loans and advances to customers of £13,512 million (see note 14).
In the periods subsequent to the acquisition, all of the fair value adjustments unwind. The fair value adjustments made to debt securities and subordinated liabilities unwind over the expected remaining life of the related securities except in the event that the liability is extinguished, in which case the remaining unamortised fair value adjustment is recognised in the income statement immediately. The timing of the unwind of the fair value adjustment relating to loans and receivables requires significant management judgement. This includes the identification of losses which were expected at the date of acquisition and assessing whether anticipated losses will still be incurred. In 2011, there was a benefit of £1,943 million (2010: £3,118 million) to the income statement either from the reversal of a fair value adjustment being credited to the income statement or through a lower impairment charge as a result of the initial HBOS acquisition fair value adjustments.
FAIR VALUE OF FINANCIAL INSTRUMENTS
In accordance with IFRS 7, the Group categorises financial instruments carried on the balance sheet at fair value using a three level hierarchy. Financial instruments categorised as level 1 are valued using quoted market prices and therefore there is minimal judgement applied in determining fair value. However, the fair value of financial instruments categorised as level 2 and, in particular, level 3 is determined using valuation techniques including discounted cash flow analysis and valuation models. These valuation techniques involve management judgement and estimates the extent of which depends on the complexity of the instrument and the availability of market observable information.
Valuation techniques for level 2 financial instruments use inputs that are largely based on observable market data. Level 3 financial instruments are those where at least one input which could have a significant effect on the instrument’s valuation is not based on observable market data. Determining the appropriate assumptions to be used for level 3 financial instruments requires significant management judgement.
At 31 December 2011, the Group classified £7,646 million of financial assets and £790 million of financial liabilities as level 3. Further details of the Group’s level 3 financial instruments and the sensitivity of their valuation including the effect of applying reasonably possible alternative assumptions in determining their fair value are set out in note 55. Details about sensitivities to market risk arising from trading assets and other treasury positions can be found in the Risk Management section on page 125.
RECOVERABILITY OF DEFERRED TAX ASSETS
At 31 December 2011 the Group carried deferred tax assets on its balance sheet of £4,496 million (2010: £5,028 million) and deferred tax liabilities of £314 million (2010: £247 million) (note 44). This presentation takes into account the ability of the Group to net deferred tax assets and liabilities only where there is a legally enforceable right of offset. Note 44 presents the Group’s deferred tax assets and liabilities by type. The largest category of deferred tax asset relates to tax losses carried forward.
The recoverability of the Group’s deferred tax assets in respect of carry forward losses is based on an assessment of future levels of taxable profit expected to arise that can be offset against these losses. The Group’s expectations as to the level of future taxable profits take into account the Group’s long-term financial and strategic plans, and anticipated future tax adjusting items.
In making this assessment account is taken of business plans, the five year board approved operating plan and the following future risk factors:
|
|
|
|
– |
The expected future economic outlook as set out in the Group Chief Executive’s Statement; |
|
|
|
|
– |
The retail banking business disposal as required by the European Commission; and |
|
|
|
|
– |
Future regulatory change. |
F-22
NOTES TO THE CONSOLIDATED FINANCIAL STATEMENTS
NOTE 3: CRITICAL ACCOUNTING ESTIMATES AND JUDGEMENTS continued
The Group’s total deferred tax asset includes £5,862 million (2010: £7,436 million) in respect of trading losses carried forward. The tax losses have arisen in individual legal entities and will be used as future taxable profits arise in those legal entities, though substantially all of the unused tax losses for which a deferred tax asset has been recognised arise in Bank of Scotland plc and Lloyds TSB Bank plc. The deferred tax asset will be utilised over different time periods in each of the entities in which the tax losses arise. The Group’s assessment is that these tax losses will be fully used within eight years.
Under current UK tax law there is no expiry date for unused tax losses.
As disclosed in note 44, deferred tax assets totalling £1,288 million (2010: £685 million) have not been recognised in respect of certain capital losses carried forward, trading losses carried forward (mainly in certain overseas companies) and unrelieved foreign tax credits as there are no predicted future capital or taxable profits against which these losses can be recognised.
RETIREMENT BENEFIT OBLIGATIONS
The net asset recognised in the balance sheet at 31 December 2011 in respect of the Group’s retirement benefit obligations was £957 million (comprising an asset of £1,338 million and a liability of £381 million) (2010: a net asset of £313 million) of which an asset of £1,131 million (2010: £479 million) related to defined benefit pension schemes. As explained in note 2(L), the Group adopts the corridor approach to the recognition of actuarial gains and losses in respect of its pension schemes and as a consequence has not recognised actuarial losses of £539 million (2010: £959 million). After allowing for this, the defined benefit pension schemes’ net accounting surplus totalled £592 million (2010: deficit of £480 million) representing the difference between the schemes’ liabilities and the fair value of the related assets at the balance sheet date.
The value of the Group’s defined benefit pension schemes’ liabilities requires management to make a number of assumptions. The key areas of estimation uncertainty are the discount rate applied to future cash flows and the expected lifetime of the schemes’ members. The accounting surplus or deficit is sensitive to changes in the discount rate, which is affected by market conditions and therefore potentially subject to significant variation. The cost of the benefits payable by the schemes will also depend upon the longevity of the members. Assumptions are made regarding the expected lifetime of scheme members based upon recent experience and extrapolate the trend, however given the rate of advance in medical science and increasing levels of obesity, it is uncertain whether they will ultimately reflect actual experience.
The effect on the net accounting surplus or deficit and on the pension charge in the Group’s income statement of changes to the principal actuarial assumptions is set out in note 43.
VALUATION OF ASSETS AND LIABILITIES ARISING FROM LIFE INSURANCE BUSINESS
At 31 December 2011, the Group recognised a value in-force business asset of £5,247 million (2010: £5,898 million) and an acquired value in-force business asset of £1,391 million (2010: £1,469 million). The value in-force business asset represents the present value of future profits expected to arise from the portfolio of in-force life insurance and participating investment contracts. The acquired value in-force business asset represents the contractual rights to benefits from providing investment management services in relation to non-participating investment contracts acquired in business combinations and portfolio transfers. The methodology used to value these assets is set out in note 2(O)(1). The valuation or recoverability of these assets requires assumptions to be made about future economic and operating conditions which are inherently uncertain and changes could significantly affect the value attributed to these assets. The key assumptions that have been made in determining the carrying value of the value in-force business assets at 31 December 2011 are set out in note 30.
At 31 December 2011, the Group carried liabilities arising from insurance contracts and participating investment contracts of £78,991 million (2010: £80,729 million). The methodology used to value these liabilities is described in note 2(O)(1). Elements of the liability valuations require assumptions to be made about future investment returns, future mortality rates and future policyholder behaviour and are subject to significant management judgement and estimation uncertainty. The key assumptions that have been made in determining the carrying value of these liabilities are set out in note 38.
The effect on the Group’s profit before tax and shareholders’ equity of changes in key assumptions used in determining the life insurance assets and liabilities is set out in note 39.
PAYMENT PROTECTION INSURANCE
The Group charged a provision of £3,200 million in the year ended 31 December 2010 in respect of payment protection insurance (PPI) policies as a result of discussions with the FSA and a judgment handed down by the UK High Court (see note 45 for more information).
The provision represents management’s best estimate of the anticipated costs of related customer contact and/or redress, including administration expenses. However, there are still a number of uncertainties as to the eventual costs from any such contact and/or redress given the inherent difficulties of assessing the impact of detailed implementation of the FSA Policy Statement of 10 August 2010 for all PPI complaints, uncertainties around the ultimate emergence period for complaints, the availability of supporting evidence and the activities of claims management companies, all of which will significantly affect complaints volumes, uphold rates and redress costs.
The provision requires significant judgement by management in determining appropriate assumptions, which include the level of complaints, uphold rates, proactive contact and response rates, Financial Ombudsman Service referral and uphold rates as well as redress costs for each of the many different populations of customers identified by the Group in its analyses used to determine the best estimate of the anticipated costs of redress. If the level of complaints had been one percentage point higher (lower) than estimated for all policies open within the last six years then the provision made in 2010 would have increased (decreased) by approximately £70 million. There are a large number of inter-dependent assumptions underpinning the provision; the above sensitivity assumes that all assumptions, other than the level of complaints, remain constant. The sensitivity is, therefore, hypothetical and should be used with caution.
The Group will re-evaluate the assumptions underlying its analysis at each reporting date as more information becomes available. As noted above, there is inherent uncertainty in making estimates; actual results in future periods may differ from the amount provided.
F-23
NOTES TO THE CONSOLIDATED FINANCIAL STATEMENTS
NOTE 3: CRITICAL ACCOUNTING ESTIMATES AND JUDGEMENTS continued
PROVISION IN RELATION TO GERMAN INSURANCE BUSINESS LITIGATION
Clerical Medical Investment Group Limited (CMIG) has received a number of claims in the German courts relating to policies issued by CMIG but sold by independent intermediaries in Germany, principally during the late 1990s and early 2000s. CMIG’s strategy includes defending claims robustly and appealing against adverse judgements. The ultimate financial effect, which could be significant, will only be known once all relevant claims have been resolved. The Group has charged a provision of £175 million (see note 54 for more information). Management believes this represents the most appropriate estimate of the financial impact, based upon a series of assumptions, including the number of claims received, the proportion upheld, and resulting legal and administration costs.
This provision requires significant judgement by management in determining appropriate assumptions, including the number of claims received, the proportion upheld, and resulting legal and administration costs. Assuming that all other assumptions remain unchanged, if in the longer term the level of claims was ten percentage points higher (lower) than estimated then the cost would increase (decrease) by approximately £3 million; and if uphold rates were ten percentage points higher (lower) than estimated then the cost would increase (decrease) by approximately £13 million.
The Group will re-evaluate the assumptions underlying its analysis at each reporting date as more information becomes available. As noted above, there is inherent uncertainty in making estimates; actual results in future periods may differ from the amount provided.
NOTE 4: SEGMENTAL ANALYSIS
Lloyds Banking Group provides a wide range of banking and financial services in the UK and in certain locations overseas.
The Group Executive Committee has been determined to be the chief operating decision maker for the Group. The Group’s operating segments reflect its organisational and management structures. The Group Executive Committee reviews the Group’s internal reporting based around these segments in order to assess performance and allocate resources. This assessment includes a consideration of each segment’s net interest revenue and consequently the total interest income and expense for all reportable segments is presented on a net basis. The segments are differentiated by the type of products provided, by whether the customers are individuals or corporate entities and by the geographical location of the customer.
During 2011 the chief operating decision maker has commenced reviewing the results of the Group’s Commercial business separately to the Wholesale segment. As a consequence, the Group’s activities are now organised into five financial reporting segments: Retail, Wholesale, Commercial, Wealth and International, and Insurance. The comparatives for 2009 include the pre-acquisition results of HBOS for the period from 1 January 2009 to 16 January 2009.
During the third quarter of 2011, the Group implemented a new approach to its allocation methodologies for funding costs and capital that ensures that the cost of funding is more fully reflected in each segment’s results. The new methodology is designed to ensure that funding costs are allocated to the segments and that the allocation is more directly related to the size and behavioural duration of asset portfolios, with a similar approach applied to recognise the value to the business from the Group’s growing deposit base. Comparative figures have been restated. The impact of this restatement on the year ended 31 December 2010 was to reduce net interest income and profit before tax in Retail by £730 million, in Wholesale by £404 million, in Commercial by £48 million and in Wealth and International by £126 million; and to increase net interest income and profit before tax in Insurance by £224 million, in Group Operations by £11 million and in Central items by £1,073 million.
Retail offers a broad range of retail financial service products in the UK, including current accounts, savings, personal loans, credit cards and mortgages. It is also a major general insurance and bancassurance distributor, selling a wide range of long-term savings, investment and general insurance products.
The Wholesale division serves businesses with turnover above £15 million with a range of propositions segmented according to customer need. The division comprises Wholesale Banking and Markets, Wholesale Business Support Unit and Asset Finance.
Commercial serves in excess of a million small and medium-sized enterprises and community organisations with a turnover of up to £15 million. Customers extend from start-up enterprises to established corporations, and are supported with a range of propositions aligned to customer needs. Commercial comprises Commercial Banking and Commercial Finance, the invoice discounting and factoring business.
Wealth and International was created to give increased focus and momentum to the Group’s private banking and asset management activities and to closely co-ordinate the management of its international businesses. Wealth comprises the Group’s private banking, wealth and asset management businesses in the UK and overseas. International comprises corporate, commercial, asset finance and retail businesses, principally in Australia and Continental Europe.
Insurance provides long-term savings, investment and protection products distributed through the bancassurance, intermediary and direct channels in the UK. It is also a distributor of home insurance in the UK with products sold through the retail branch network, direct channels and strategic corporate partners. The business consists of Life, Pensions and Investments UK; Life, Pensions and Investments Europe; and General Insurance.
Other includes the costs of managing the Group’s technology platforms, branch and head office property estate, operations (including payments, banking operations and collections) and procurement services, the costs of which are predominantly recharged to the other divisions. It also reflects other items not recharged to the divisions, including hedge ineffectiveness, UK bank levy, Financial Services Compensation Scheme costs, gains on liability management, volatile items such as hedge accounting volatility managed centrally, and other gains from the structural hedging of interest rate risk.
Inter-segment services are generally recharged at cost, with the exception of the internal commission arrangements between the UK branch and other distribution networks and the insurance product manufacturing businesses within the Group, where a profit margin is also charged. Inter-segment lending and deposits are generally entered into at market rates, except that non-interest bearing balances are priced at a rate that reflects the external yield that could be earned on such funds.
For the majority of those derivative contracts entered into by business units for risk management purposes, the business unit recognises the net interest income or expense on an accrual accounting basis (an amount equal to the interest element of the next payment on the swap) and transfers the remainder of the fair value of the swap to the central group segment where the resulting accounting volatility is managed where possible through the establishment of hedge accounting relationships. Any change in fair value of the hedged instrument attributable to the hedged risk is also recorded within the central group segment. This allocation of the fair value of the swap and change in fair value of the hedged instrument attributable to the hedged risk avoids accounting asymmetry in segmental results and records volatility in the central group segment where it is managed.
F-24
NOTES TO THE CONSOLIDATED FINANCIAL STATEMENTS
NOTE 4: SEGMENTAL ANALYSIS continued
|
|
|
|
|
|
|
|
|
|
|
|
|
|
|
|
|
|
|
|
|
|
|
|
|
|
|
Retail |
|
Wholesale |
|
Commercial |
|
Wealth and |
|
Insurance |
|
Other |
|
Reported |
|
|||||||
|
Year ended 31 December 2011 |
|
|
|
|
|
|
|
|
|
|
|
|
|
|
|
|
|
|
|
|
|
|
|
Net interest income |
|
|
7,497 |
|
|
2,139 |
|
|
1,251 |
|
|
828 |
|
|
(67 |
) |
|
585 |
|
|
12,233 |
|
|
Other income (net of fee and commission expense) |
|
|
1,649 |
|
|
3,335 |
|
|
446 |
|
|
1,197 |
|
|
2,687 |
|
|
(7 |
) |
|
9,307 |
|
|
Effects of liability management, volatile items and asset sales |
|
|
48 |
|
|
(1,415 |
) |
|
— |
|
|
— |
|
|
— |
|
|
1,293 |
|
|
(74 |
) |
|
Total income |
|
|
9,194 |
|
|
4,059 |
|
|
1,697 |
|
|
2,025 |
|
|
2,620 |
|
|
1,871 |
|
|
21,466 |
|
|
Insurance claims |
|
|
— |
|
|
— |
|
|
— |
|
|
— |
|
|
(343 |
) |
|
— |
|
|
(343 |
) |
|
Total income, net of insurance claims |
|
|
9,194 |
|
|
4,059 |
|
|
1,697 |
|
|
2,025 |
|
|
2,277 |
|
|
1,871 |
|
|
21,123 |
|
|
Operating expenses |
|
|
(4,438 |
) |
|
(2,518 |
) |
|
(948 |
) |
|
(1,548 |
) |
|
(812 |
) |
|
(357 |
) |
|
(10,621 |
) |
|
Trading surplus |
|
|
4,756 |
|
|
1,541 |
|
|
749 |
|
|
477 |
|
|
1,465 |
|
|
1,514 |
|
|
10,502 |
|
|
Impairment |
|
|
(1,970 |
) |
|
(2,901 |
) |
|
(303 |
) |
|
(4,610 |
) |
|
— |
|
|
(3 |
) |
|
(9,787 |
) |
|
Share of results of joint ventures and associates |
|
|
11 |
|
|
14 |
|
|
— |
|
|
3 |
|
|
— |
|
|
(1 |
) |
|
27 |
|
|
Profit (loss) before tax and fair value unwind |
|
|
2,797 |
|
|
(1,346 |
) |
|
446 |
|
|
(4,130 |
) |
|
1,465 |
|
|
1,510 |
|
|
742 |
|
|
Fair value unwind |
|
|
839 |
|
|
2,174 |
|
|
53 |
|
|
194 |
|
|
(43 |
) |
|
(1,274 |
) |
|
1,943 |
|
|
Profit (loss) before tax |
|
|
3,636 |
|
|
828 |
|
|
499 |
|
|
(3,936 |
) |
|
1,422 |
|
|
236 |
|
|
2,685 |
|
|
External revenue |
|
|
12,267 |
|
|
2,895 |
|
|
1,263 |
|
|
2,144 |
|
|
3,253 |
|
|
(356 |
) |
|
21,466 |
|
|
Inter-segment revenue |
|
|
(3,073 |
) |
|
1,164 |
|
|
434 |
|
|
(119 |
) |
|
(633 |
) |
|
2,227 |
|
|
— |
|
|
Segment revenue |
|
|
9,194 |
|
|
4,059 |
|
|
1,697 |
|
|
2,025 |
|
|
2,620 |
|
|
1,871 |
|
|
21,466 |
|
|
Segment external assets |
|
|
356,295 |
|
|
320,435 |
|
|
28,998 |
|
|
74,623 |
|
|
140,754 |
|
|
49,441 |
|
|
970,546 |
|
|
Segment customer deposits |
|
|
247,088 |
|
|
91,357 |
|
|
32,107 |
|
|
42,019 |
|
|
— |
|
|
1,335 |
|
|
413,906 |
|
|
Segment external liabilities |
|
|
279,162 |
|
|
259,209 |
|
|
32,723 |
|
|
75,791 |
|
|
129,350 |
|
|
147,717 |
|
|
923,952 |
|
|
Other segment items reflected in income statement above: |
|
|
|
|
|
|
|
|
|
|
|
|
|
|
|
|
|
|
|
|
|
|
|
Depreciation and amortisation |
|
|
364 |
|
|
967 |
|
|
53 |
|
|
60 |
|
|
91 |
|
|
67 |
|
|
1,602 |
|
|
Increase (decrease) in value of in-force business |
|
|
— |
|
|
— |
|
|
— |
|
|
3 |
|
|
(625 |
) |
|
— |
|
|
(622 |
) |
|
Defined benefit scheme charges |
|
|
121 |
|
|
33 |
|
|
33 |
|
|
25 |
|
|
23 |
|
|
(36 |
) |
|
199 |
|
|
Other segment items: |
|
|
|
|
|
|
|
|
|
|
|
|
|
|
|
|
|
|
|
|
|
|
|
Additions to tangible fixed assets |
|
|
189 |
|
|
1,435 |
|
|
2 |
|
|
212 |
|
|
451 |
|
|
806 |
|
|
3,095 |
|
|
Investments in joint ventures and associates at end of year |
|
|
147 |
|
|
80 |
|
|
— |
|
|
104 |
|
|
— |
|
|
3 |
|
|
334 |
|
F-25
NOTES TO THE CONSOLIDATED FINANCIAL STATEMENTS
NOTE 4: SEGMENTAL ANALYSIS continued
|
|
|
|
|
|
|
|
|
|
|
|
|
|
|
|
|
|
|
|
|
|
|
|
|
|
|
|
|
|
|
|
|
Retail |
|
|
Wholesale |
|
|
Commercial |
|
|
Wealth and |
|
|
Insurance |
|
|
Other |
|
|
Reported |
|
|||||||
|
Year ended 31 December 2010 |
|
|
|
|
|
|
|
|
|
|
|
|
|
|
|
|
|
|
|
|
|
|
|
|
|
|
|
|
|
Net interest income |
|
|
8,648 |
|
|
|
2,847 |
|
|
|
1,127 |
|
|
|
1,050 |
|
|
|
(39 |
) |
|
|
510 |
|
|
|
14,143 |
|
|
Other income (net of fee and commission expense) |
|
|
1,607 |
|
|
|
3,974 |
|
|
|
457 |
|
|
|
1,123 |
|
|
|
2,799 |
|
|
|
(24 |
) |
|
|
9,936 |
|
|
Effects of liability management, volatile items and asset sales |
|
|
— |
|
|
|
(295 |
) |
|
|
— |
|
|
|
37 |
|
|
|
15 |
|
|
|
150 |
|
|
|
(93 |
) |
|
Total income |
|
|
10,255 |
|
|
|
6,526 |
|
|
|
1,584 |
|
|
|
2,210 |
|
|
|
2,775 |
|
|
|
636 |
|
|
|
23,986 |
|
|
Insurance claims |
|
|
— |
|
|
|
— |
|
|
|
— |
|
|
|
— |
|
|
|
(542 |
) |
|
|
— |
|
|
|
(542 |
) |
|
Total income, net of insurance claims |
|
|
10,255 |
|
|
|
6,526 |
|
|
|
1,584 |
|
|
|
2,210 |
|
|
|
2,233 |
|
|
|
636 |
|
|
|
23,444 |
|
|
Costs: |
|
|
|
|
|
|
|
|
|
|
|
|
|
|
|
|
|
|
|
|
|
|
|
|
|
|
|
|
|
Operating expenses |
|
|
(4,644 |
) |
|
|
(2,752 |
) |
|
|
(992 |
) |
|
|
(1,536 |
) |
|
|
(854 |
) |
|
|
(150 |
) |
|
|
(10,928 |
) |
|
Impairment of tangible fixed assets |
|
|
— |
|
|
|
(150 |
) |
|
|
— |
|
|
|
— |
|
|
|
— |
|
|
|
— |
|
|
|
(150 |
) |
|
|
|
|
(4,644 |
) |
|
|
(2,902 |
) |
|
|
(992 |
) |
|
|
(1,536 |
) |
|
|
(854 |
) |
|
|
(150 |
) |
|
|
(11,078 |
) |
|
Trading surplus |
|
|
5,611 |
|
|
|
3,624 |
|
|
|
592 |
|
|
|
674 |
|
|
|
1,379 |
|
|
|
486 |
|
|
|
12,366 |
|
|
Impairment |
|
|
(2,747 |
) |
|
|
(4,064 |
) |
|
|
(382 |
) |
|
|
(5,988 |
) |
|
|
— |
|
|
|
— |
|
|
|
(13,181 |
) |
|
Share of results of joint ventures and associates |
|
|
17 |
|
|
|
(95 |
) |
|
|
— |
|
|
|
(8 |
) |
|
|
(10 |
) |
|
|
5 |
|
|
|
(91 |
) |
|
Profit (loss) before tax and fair value unwind |
|
|
2,881 |
|
|
|
(535 |
) |
|
|
210 |
|
|
|
(5,322 |
) |
|
|
1,369 |
|
|
|
491 |
|
|
|
(906 |
) |
|
Fair value unwind |
|
|
1,105 |
|
|
|
3,049 |
|
|
|
81 |
|
|
|
372 |
|
|
|
(43 |
) |
|
|
(1,446 |
) |
|
|
3,118 |
|
|
Profit (loss) before tax |
|
|
3,986 |
|
|
|
2,514 |
|
|
|
291 |
|
|
|
(4,950 |
) |
|
|
1,326 |
|
|
|
(955 |
) |
|
|
2,212 |
|
|
External revenue |
|
|
13,603 |
|
|
|
3,911 |
|
|
|
1,378 |
|
|
|
3,000 |
|
|
|
3,180 |
|
|
|
(1,086 |
) |
|
|
23,986 |
|
|
Inter-segment revenue |
|
|
(3,348 |
) |
|
|
2,615 |
|
|
|
206 |
|
|
|
(790 |
) |
|
|
(405 |
) |
|
|
1,722 |
|
|
|
— |
|
|
Segment revenue |
|
|
10,255 |
|
|
|
6,526 |
|
|
|
1,584 |
|
|
|
2,210 |
|
|
|
2,775 |
|
|
|
636 |
|
|
|
23,986 |
|
|
Segment external assets1 |
|
|
369,170 |
|
|
|
327,055 |
|
|
|
28,938 |
|
|
|
85,508 |
|
|
|
143,300 |
|
|
|
38,467 |
|
|
|
992,438 |
|
|
Segment customer deposits |
|
|
235,591 |
|
|
|
92,951 |
|
|
|
31,311 |
|
|
|
32,784 |
|
|
|
— |
|
|
|
996 |
|
|
|
393,633 |
|
|
Segment external liabilities |
|
|
275,945 |
|
|
|
289,257 |
|
|
|
31,952 |
|
|
|
65,658 |
|
|
|
132,133 |
|
|
|
152,927 |
|
|
|
947,872 |
|
|
Other segment items reflected in income statement above: |
|
|
|
|
|
|
|
|
|
|
|
|
|
|
|
|
|
|
|
|
|
|
|
|
|
|
|
|
|
Depreciation and amortisation |
|
|
384 |
|
|
|
1,071 |
|
|
|
62 |
|
|
|
87 |
|
|
|
135 |
|
|
|
64 |
|
|
|
1,803 |
|
|
Increase in value of in-force business |
|
|
— |
|
|
|
— |
|
|
|
— |
|
|
|
2 |
|
|
|
787 |
|
|
|
— |
|
|
|
789 |
|
|
Defined benefit scheme charges |
|
|
176 |
|
|
|
52 |
|
|
|
37 |
|
|
|
36 |
|
|
|
28 |
|
|
|
126 |
|
|
|
455 |
|
|
Other segment items: |
|
|
|
|
|
|
|
|
|
|
|
|
|
|
|
|
|
|
|
|
|
|
|
|
|
|
|
|
|
Additions to tangible fixed assets |
|
|
126 |
|
|
|
1,703 |
|
|
|
5 |
|
|
|
20 |
|
|
|
585 |
|
|
|
777 |
|
|
|
3,216 |
|
|
Investments in joint ventures and associates at end of year |
|
|
139 |
|
|
|
127 |
|
|
|
— |
|
|
|
158 |
|
|
|
— |
|
|
|
5 |
|
|
|
429 |
|
|
|
|
|
1 |
Segment external assets as at 31 December 2010 have been restated to reflect the reclassification of certain central adjustments. |
F-26
NOTES TO THE CONSOLIDATED FINANCIAL STATEMENTS
NOTE 4: SEGMENTAL ANALYSIS continued
|
|
|
|
|
|
|
|
|
|
|
|
|
|
|
|
|
|
|
|
|
|
|
|
|
|
|
Retail |
|
Wholesale |
|
Commercial |
|
Wealth and |
|
Insurance |
|
Other |
|
Reported |
|
|||||||
|
Year ended 31 December 2009 |
|
|
|
|
|
|
|
|
|
|
|
|
|
|
|
|
|
|
|
|
|
|
|
Net interest income |
|
|
7,543 |
|
|
3,447 |
|
|
1,084 |
|
|
1,140 |
|
|
(59 |
) |
|
(89 |
) |
|
13,066 |
|
|
Other income (net of fee and commission expense) |
|
|
1,804 |
|
|
3,787 |
|
|
489 |
|
|
1,128 |
|
|
2,944 |
|
|
(69 |
) |
|
10,083 |
|
|
Effects of liability management, volatile items and asset sales |
|
|
— |
|
|
(77 |
) |
|
— |
|
|
— |
|
|
— |
|
|
1,529 |
|
|
1,452 |
|
|
Total income |
|
|
9,347 |
|
|
7,157 |
|
|
1,573 |
|
|
2,268 |
|
|
2,885 |
|
|
1,371 |
|
|
24,601 |
|
|
Insurance claims |
|
|
— |
|
|
— |
|
|
— |
|
|
— |
|
|
(637 |
) |
|
— |
|
|
(637 |
) |
|
Total income, net of insurance claims |
|
|
9,347 |
|
|
7,157 |
|
|
1,573 |
|
|
2,268 |
|
|
2,248 |
|
|
1,371 |
|
|
23,964 |
|
|
Operating expenses |
|
|
(4,566 |
) |
|
(3,018 |
) |
|
(1,088 |
) |
|
(1,544 |
) |
|
(974 |
) |
|
(419 |
) |
|
(11,609 |
) |
|
Trading surplus |
|
|
4,781 |
|
|
4,139 |
|
|
485 |
|
|
724 |
|
|
1,274 |
|
|
952 |
|
|
12,355 |
|
|
Impairment |
|
|
(4,227 |
) |
|
(14,861 |
) |
|
(822 |
) |
|
(4,078 |
) |
|
— |
|
|
— |
|
|
(23,988 |
) |
|
Share of results of joint ventures and associates |
|
|
(6 |
) |
|
(720 |
) |
|
— |
|
|
(21 |
) |
|
(22 |
) |
|
2 |
|
|
(767 |
) |
|
Profit (loss) before tax and fair value unwind |
|
|
548 |
|
|
(11,442 |
) |
|
(337 |
) |
|
(3,375 |
) |
|
1,252 |
|
|
954 |
|
|
(12,400 |
) |
|
Fair value unwind |
|
|
407 |
|
|
6,760 |
|
|
137 |
|
|
942 |
|
|
(49 |
) |
|
(2,097 |
) |
|
6,100 |
|
|
Profit (loss) before tax |
|
|
955 |
|
|
(4,682 |
) |
|
(200 |
) |
|
(2,433 |
) |
|
1,203 |
|
|
(1,143 |
) |
|
(6,300 |
) |
|
External revenue |
|
|
14,221 |
|
|
2,719 |
|
|
1,446 |
|
|
2,859 |
|
|
3,780 |
|
|
(424 |
) |
|
24,601 |
|
|
Inter-segment revenue |
|
|
(4,874 |
) |
|
4,438 |
|
|
127 |
|
|
(591 |
) |
|
(895 |
) |
|
1,795 |
|
|
— |
|
|
Segment revenue |
|
|
9,347 |
|
|
7,157 |
|
|
1,573 |
|
|
2,268 |
|
|
2,885 |
|
|
1,371 |
|
|
24,601 |
|
|
Other segment items reflected in income statement above: |
|
|
|
|
|
|
|
|
|
|
|
|
|
|
|
|
|
|
|
|
|
|
|
Depreciation and amortisation |
|
|
196 |
|
|
1,214 |
|
|
70 |
|
|
84 |
|
|
152 |
|
|
147 |
|
|
1,863 |
|
|
(Decrease) increase in value of in-force business |
|
|
— |
|
|
— |
|
|
— |
|
|
(5 |
) |
|
1,097 |
|
|
— |
|
|
1,092 |
|
|
Defined benefit scheme charges |
|
|
190 |
|
|
65 |
|
|
47 |
|
|
40 |
|
|
39 |
|
|
156 |
|
|
537 |
|
|
Other segment items: |
|
|
|
|
|
|
|
|
|
|
|
|
|
|
|
|
|
|
|
|
|
|
|
Additions to tangible fixed assets |
|
|
65 |
|
|
2,960 |
|
|
9 |
|
|
53 |
|
|
255 |
|
|
487 |
|
|
3,829 |
|
|
Investments in joint ventures and associates at end of year |
|
|
30 |
|
|
189 |
|
|
— |
|
|
123 |
|
|
(14 |
) |
|
151 |
|
|
479 |
|
F-27
NOTES TO THE CONSOLIDATED FINANCIAL STATEMENTS
NOTE 4: SEGMENTAL ANALYSIS continued
RECONCILIATION OF REPORTED BASIS TO STATUTORY RESULTS
The reported basis is the basis on which financial information is presented to the chief operating decision maker which excludes certain items included in the statutory results. The table below reconciles the statutory results to the reported basis.
|
|
|
|
|
|
|
|
|
|
|
|
|
|
|
|
|
|
|
|
|
|
|
|
|
|
|
|
|
|
|
Removal of: |
|
|
|
|||||||||||||||
|
|
|
|
|
|
|
|
|
||||||||||||||||
|
|
|
Lloyds |
|
|
Acquisition |
|
Volatility arising |
|
Insurance |
|
Legal and |
|
Fair value |
|
Reported |
|
|||||||
|
Year ended 31 December 2011 |
|
|
|
|
|
|
|
|
|
|
|
|
|
|
|
|
|
|
|
|
|
|
|
|
Net interest income |
|
|
12,698 |
|
|
|
(820 |
) |
|
(19 |
) |
|
(336 |
) |
|
— |
|
|
710 |
|
|
12,233 |
|
|
Other income |
|
|
14,114 |
|
|
|
894 |
|
|
857 |
|
|
(5,530 |
) |
|
— |
|
|
(1,028 |
) |
|
9,307 |
|
|
Effects of liability management, volatile |
|
|
|
|
|
|
|
|
|
|
|
|
|
|
|
|
|
|
|
|
|
|
|
|
items and asset sales |
|
|
|
|
|
|
(74 |
) |
|
— |
|
|
— |
|
|
— |
|
|
— |
|
|
(74 |
) |
|
Total income |
|
|
26,812 |
|
|
|
— |
|
|
838 |
|
|
(5,866 |
) |
|
— |
|
|
(318 |
) |
|
21,466 |
|
|
Insurance claims |
|
|
(6,041 |
) |
|
|
— |
|
|
— |
|
|
5,698 |
|
|
— |
|
|
— |
|
|
(343 |
) |
|
Total income, net of insurance claims |
|
|
20,771 |
|
|
|
— |
|
|
838 |
|
|
(168 |
) |
|
— |
|
|
(318 |
) |
|
21,123 |
|
|
Operating expenses |
|
|
(13,050 |
) |
|
|
2,014 |
|
|
— |
|
|
168 |
|
|
175 |
|
|
72 |
|
|
(10,621 |
) |
|
Trading surplus (deficit) |
|
|
7,721 |
|
|
|
2,014 |
|
|
838 |
|
|
— |
|
|
175 |
|
|
(246 |
) |
|
10,502 |
|
|
Impairment |
|
|
(8,094 |
) |
|
|
— |
|
|
— |
|
|
— |
|
|
— |
|
|
(1,693 |
) |
|
(9,787 |
) |
|
Share of results of joint ventures and |
|
|
|
|
|
|
|
|
|
|
|
|
|
|
|
|
|
|
|
|
|
|
|
|
associates |
|
|
31 |
|
|
|
— |
|
|
— |
|
|
— |
|
|
— |
|
|
(4 |
) |
|
27 |
|
|
Fair value unwind |
|
|
|
|
|
|
— |
|
|
— |
|
|
— |
|
|
— |
|
|
1,943 |
|
|
1,943 |
|
|
(Loss) profit before tax |
|
|
(342 |
) |
|
|
2,014 |
|
|
838 |
|
|
— |
|
|
175 |
|
|
— |
|
|
2,685 |
|
|
|
|
|
1 |
Comprises
integration and simplification costs related to severance, IT and business
costs of implementation (£1,282 million), EC mandated retail business
disposal costs (£170 million), amortisation of purchased intangibles (£562
million) and the effects of liability management, volatile items and asset
sales (£74 million). |
|
2 |
Comprises the provision in relation to German insurance business litigation. |
|
|
|
|
|
|
|
|
|
|
|
|
|
|
|
|
|
|
|
|
|
|
|
|
|
|
|
|
|
|
|
|
|
|
|
|
Removal of: |
|
|
|
|
|||||||||||||||||||
|
|
|
Lloyds |
|
|
Acquisition |
|
|
Volatility arising |
|
|
Insurance |
|
|
Legal and |
|
|
Fair value |
|
|
Reported |
|
|||||||
|
Year ended 31 December 2010 |
|
|
|
|
|
|
|
|
|
|
|
|
|
|
|
|
|
|
|
|
|
|
|
|
|
|
|
|
|
Net interest income |
|
|
12,546 |
|
|
|
321 |
|
|
|
26 |
|
|
|
949 |
|
|
|
— |
|
|
|
301 |
|
|
|
14,143 |
|
|
Other income |
|
|
31,498 |
|
|
|
(228 |
) |
|
|
(332 |
) |
|
|
(19,739 |
) |
|
|
— |
|
|
|
(1,263 |
) |
|
|
9,936 |
|
|
Effects of liability management, volatile |
|
|
|
|
|
|
|
|
|
|
|
|
|
|
|
|
|
|
|
|
|
|
|
|
|
|
|
|
|
items and asset sales |
|
|
|
|
|
|
(93 |
) |
|
|
— |
|
|
|
— |
|
|
|
— |
|
|
|
— |
|
|
|
(93 |
) |
|
Total income |
|
|
44,044 |
|
|
|
— |
|
|
|
(306 |
) |
|
|
(18,790 |
) |
|
|
— |
|
|
|
(962 |
) |
|
|
23,986 |
|
|
Insurance claims |
|
|
(19,088 |
) |
|
|
— |
|
|
|
— |
|
|
|
18,544 |
|
|
|
— |
|
|
|
2 |
|
|
|
(542 |
) |
|
Total income, net of insurance claims |
|
|
24,956 |
|
|
|
— |
|
|
|
(306 |
) |
|
|
(246 |
) |
|
|
— |
|
|
|
(960 |
) |
|
|
23,444 |
|
|
Costs: |
|
|
|
|
|
|
|
|
|
|
|
|
|
|
|
|
|
|
|
|
|
|
|
|
|
|
|
|
|
Operating expenses |
|
|
(16,268 |
) |
|
|
1,320 |
|
|
|
— |
|
|
|
246 |
|
|
|
3,700 |
|
|
|
74 |
|
|
|
(10,928 |
) |
|
Impairment of tangible fixed assets |
|
|
(202 |
) |
|
|
52 |
|
|
|
— |
|
|
|
— |
|
|
|
— |
|
|
|
— |
|
|
|
(150 |
) |
|
|
|
|
(16,470 |
) |
|
|
1,372 |
|
|
|
— |
|
|
|
246 |
|
|
|
3,700 |
|
|
|
74 |
|
|
|
(11,078 |
) |
|
Trading surplus (deficit) |
|
|
8,486 |
|
|
|
1,372 |
|
|
|
(306 |
) |
|
|
— |
|
|
|
3,700 |
|
|
|
(886 |
) |
|
|
12,366 |
|
|
Impairment |
|
|
(10,952 |
) |
|
|
— |
|
|
|
— |
|
|
|
— |
|
|
|
— |
|
|
|
(2,229 |
) |
|
|
(13,181 |
) |
|
Share of results of joint ventures and |
|
|
|
|
|
|
|
|
|
|
|
|
|
|
|
|
|
|
|
|
|
|
|
|
|
|
|
|
|
associates |
|
|
(88 |
) |
|
|
— |
|
|
|
— |
|
|
|
— |
|
|
|
— |
|
|
|
(3 |
) |
|
|
(91 |
) |
|
Loss on disposal of businesses |
|
|
(365 |
) |
|
|
— |
|
|
|
— |
|
|
|
— |
|
|
|
365 |
|
|
|
— |
|
|
|
— |
|
|
Fair value unwind |
|
|
|
|
|
|
— |
|
|
|
— |
|
|
|
— |
|
|
|
— |
|
|
|
3,118 |
|
|
|
3,118 |
|
|
Profit (loss) before tax |
|
|
(2,919 |
) |
|
|
1,372 |
|
|
|
(306 |
) |
|
|
— |
|
|
|
4,065 |
|
|
|
— |
|
|
|
2,212 |
|
|
|
|
|
1 |
Comprises
the pension curtailment gain (£910 million, see note 43), integration costs
(£1,653 million), amortisation of purchased intangibles (£629 million) and
the effects of liability management, volatile items and asset sales (£93
million). |
|
2 |
Comprises the payment protection insurance provision (£3,200 million), the customer goodwill payments provision (£500 million) and the loss on disposal of businesses (£365 million). |
F-28
NOTES TO THE CONSOLIDATED FINANCIAL STATEMENTS
NOTE 4: SEGMENTAL ANALYSIS continued
|
|
|
|
|
|
|
|
|
|
|
|
|
|
|
|
|
|
|
|
|
|
|
|
|
|
|
|
|
|
|
Removal of: |
|
|
|
|||||||||||||||
|
|
|
|
|
|
|
|
|
||||||||||||||||
|
|
|
Lloyds |
|
|
Pre-acquisition |
|
Government |
|
Volatility arising |
|
Insurance |
|
Fair value |
|
Reported |
|
|||||||
|
Year ended 31 December 2009 |
|
|
|
|
|
|
|
|
|
|
|
|
|
|
|
|
|
|
|
|
|
|
|
|
Net interest income |
|
|
9,026 |
|
|
|
243 |
|
|
340 |
|
|
11 |
|
|
1,280 |
|
|
2,166 |
|
|
13,066 |
|
|
Other income |
|
|
36,745 |
|
|
|
(1,123 |
) |
|
(1,792 |
) |
|
(479 |
) |
|
(22,133 |
) |
|
(1,135 |
) |
|
10,083 |
|
|
Effects of liability management, volatile |
|
|
|
|
|
|
|
|
|
|
|
|
|
|
|
|
|
|
|
|
|
|
|
|
items and asset sales |
|
|
|
|
|
|
— |
|
|
1,452 |
|
|
— |
|
|
— |
|
|
— |
|
|
1,452 |
|
|
Total income |
|
|
45,771 |
|
|
|
(880 |
) |
|
— |
|
|
(468 |
) |
|
(20,853 |
) |
|
1,031 |
|
|
24,601 |
|
|
Insurance claims |
|
|
(22,493 |
) |
|
|
1,349 |
|
|
— |
|
|
— |
|
|
20,792 |
|
|
(285 |
) |
|
(637 |
) |
|
Total income, net of insurance claims |
|
|
23,278 |
|
|
|
469 |
|
|
— |
|
|
(468 |
) |
|
(61 |
) |
|
746 |
|
|
23,964 |
|
|
Operating expenses |
|
|
(15,984 |
) |
|
|
(293 |
) |
|
4,589 |
|
|
— |
|
|
61 |
|
|
18 |
|
|
(11,609 |
) |
|
Trading surplus (deficit) |
|
|
7,294 |
|
|
|
176 |
|
|
4,589 |
|
|
(468 |
) |
|
— |
|
|
764 |
|
|
12,355 |
|
|
Impairment |
|
|
(16,673 |
) |
|
|
(456 |
) |
|
— |
|
|
— |
|
|
— |
|
|
(6,859 |
) |
|
(23,988 |
) |
|
Share of results of joint ventures and |
|
|
|
|
|
|
|
|
|
|
|
|
|
|
|
|
|
|
|
|
|
|
|
|
associates |
|
|
(752 |
) |
|
|
— |
|
|
— |
|
|
(10 |
) |
|
— |
|
|
(5 |
) |
|
(767 |
) |
|
Gain on acquisition |
|
|
11,173 |
|
|
|
— |
|
|
(11,173 |
) |
|
— |
|
|
— |
|
|
— |
|
|
— |
|
|
Fair value unwind |
|
|
— |
|
|
|
— |
|
|
— |
|
|
— |
|
|
— |
|
|
6,100 |
|
|
6,100 |
|
|
Profit (loss) before tax |
|
|
1,042 |
|
|
|
(280 |
) |
|
(6,584 |
) |
|
(478 |
) |
|
— |
|
|
— |
|
|
(6,300 |
) |
|
|
|
|
1 |
Comprises the gain on acquisition (£11,173 million), the Government Asset Protection Scheme fee (£2,500 million), integration costs (£1,096 million), amortisation of purchased intangibles (£753 million), goodwill impairment (£240 million) and the effects of liability management, volatile items and asset sales (£1,452 million). |
GEOGRAPHICAL AREAS
The Group’s activities are focused in the UK and the analyses of income and assets below are based on the location of the branch or entity recording the income or assets.
|
|
|
|
|
|
|
|
|
|
|
|
|
|
|
|
|
|
|
|
|
|
|
|
|
|
|
|
|
|
|
|
|
2011 |
|
2010 |
|
2009 |
|
|||||||||||||||||||||
|
|
|
|
|
|
||||||||||||||||||||||||
|
|
|
UK |
|
Non-UK |
|
Total |
|
UK |
|
Non-UK |
|
Total |
|
UK |
|
Non-UK |
|
Total |
|
|||||||||
|
Total income |
|
|
24,392 |
|
|
2,420 |
|
|
26,812 |
|
|
39,840 |
|
|
4,204 |
|
|
44,044 |
|
|
43,046 |
|
|
2,725 |
|
|
45,771 |
|
|
Total assets |
|
|
875,918 |
|
|
94,628 |
|
|
970,546 |
|
|
874,002 |
|
|
118,436 |
|
|
992,438 |
|
|
916,734 |
|
|
110,521 |
|
|
1,027,255 |
|
There was no individual non-UK country contributing more than 5 per cent of total income or total assets.
F-29
NOTES TO THE CONSOLIDATED FINANCIAL STATEMENTS
NOTE 5: NET INTEREST INCOME
|
|
|
|
|
|
|
|
|
|
|
|
|
|
|
|
|
|
|
|
|
|
|
|
Weighted
average |
|
|
|
|
|
|
|
||||||||||
|
|
|
|
|
|
|
|
|
|
|||||||||||
|
|
|
2011 |
|
20101 |
|
20091 |
|
2011 |
|
2010 |
|
2009 |
|
||||||
|
Interest and similar income: |
|
|
|
|
|
|
|
|
|
|
|
|
|
|
|
|
|
|
|
|
Loans and advances to customers, excluding lease and hire purchase receivables |
|
|
4.00 |
|
|
4.37 |
|
|
3.67 |
|
|
23,208 |
|
|
25,459 |
|
|
24,171 |
|
|
Loans and advances to banks |
|
|
0.78 |
|
|
0.72 |
|
|
1.18 |
|
|
628 |
|
|
512 |
|
|
769 |
|
|
Debt securities held as loans and receivables |
|
|
3.17 |
|
|
4.41 |
|
|
3.68 |
|
|
590 |
|
|
1,377 |
|
|
1,469 |
|
|
Lease and hire purchase receivables |
|
|
5.13 |
|
|
6.74 |
|
|
6.01 |
|
|
742 |
|
|
626 |
|
|
852 |
|
|
Interest receivable on loans and receivables |
|
|
3.63 |
|
|
4.03 |
|
|
3.50 |
|
|
25,168 |
|
|
27,974 |
|
|
27,261 |
|
|
Available-for-sale financial assets |
|
|
2.58 |
|
|
2.88 |
|
|
1.78 |
|
|
886 |
|
|
1,311 |
|
|
977 |
|
|
Held-to-maturity investments |
|
|
3.29 |
|
|
2.51 |
|
|
— |
|
|
262 |
|
|
55 |
|
|
— |
|
|
Total interest and similar income |
|
|
3.58 |
|
|
3.95 |
|
|
3.39 |
|
|
26,316 |
|
|
29,340 |
|
|
28,238 |
|
|
Interest and similar expense: |
|
|
|
|
|
|
|
|
|
|
|
|
|
|
|
|
|
|
|
|
Deposits from banks, excluding liabilities under sale and repurchase transactions |
|
|
0.80 |
|
|
0.78 |
|
|
0.95 |
|
|
(222 |
) |
|
(319 |
) |
|
(883 |
) |
|
Customer deposits, excluding liabilities under |
|
|
|
|
|
|
|
|
|
|
|
|
|
|
|
|
|
|
|
|
sale and repurchase transactions |
|
|
1.66 |
|
|
1.56 |
|
|
1.29 |
|
|
(6,080 |
) |
|
(5,381 |
) |
|
(4,410 |
) |
|
Debt securities in issue |
|
|
2.22 |
|
|
2.49 |
|
|
2.56 |
|
|
(5,045 |
) |
|
(5,833 |
) |
|
(6,318 |
) |
|
Subordinated liabilities |
|
|
6.35 |
|
|
10.98 |
|
|
10.05 |
|
|
(2,155 |
) |
|
(3,619 |
) |
|
(4,325 |
) |
|
Liabilities under sale and repurchase agreements |
|
|
1.39 |
|
|
1.18 |
|
|
1.95 |
|
|
(335 |
) |
|
(744 |
) |
|
(1,655 |
) |
|
Interest payable on liabilities held at amortised cost |
|
|
2.04 |
|
|
2.22 |
|
|
2.17 |
|
|
(13,837 |
) |
|
(15,896 |
) |
|
(17,591 |
) |
|
Other |
|
|
(1.14 |
) |
|
6.97 |
|
|
14.92 |
|
|
219 |
|
|
(898 |
) |
|
(1,621 |
) |
|
Total interest and similar expense |
|
|
1.95 |
|
|
2.31 |
|
|
2.34 |
|
|
(13,618 |
) |
|
(16,794 |
) |
|
(19,212 |
) |
|
Net interest income |
|
|
|
|
|
|
|
|
|
|
|
12,698 |
|
|
12,546 |
|
|
9,026 |
|
|
|
|
|
1 |
During 2011 the Group has revised its treatment of offset accounts; average balances for 2009 and 2010 have been restated accordingly. |
Included within interest and similar income is £1,405 million (2010: £1,288 million; 2009: £971 million) in respect of impaired financial assets. Net interest income also includes a charge of £70 million (2010: charge of £932 million; 2009: charge of £121 million) transferred from the cash flow hedging reserve (see note 49).
During December 2011, the Group completed the exchange of certain subordinated debt securities issued by Lloyds TSB Bank plc and HBOS plc for new subordinated debt securities issued by Lloyds TSB Bank plc. As part of the exchange, the Group announced that all decisions to exercise calls on those original securities that remained outstanding following the exchange offer would be made with reference to the prevailing regulatory, economic and market conditions at the time. These securities will not, therefore, be called at their first available call date which will lead to coupons continuing to be being paid until possibly the final redemption date of the securities. Consequently, the Group is required to adjust the carrying amount of these securities to reflect the revised estimated cash flows over their revised life and to recognise this change in carrying value in interest expense. Included within net interest income is a credit of £570 million in respect of the securities that remained outstanding following the exchange offer.
In December 2011, the Group decided to defer payment of non-mandatory coupons on certain securities and, instead, settle them using an Alternative Coupon Satisfaction Mechanism on their contractual terms. This change in expected cashflows resulted in a gain of £126 million in net interest income from the recalculation of the carrying value of these securities.
F-30
NOTES TO THE CONSOLIDATED FINANCIAL STATEMENTS
NOTE 6: NET FEE AND COMMISSION INCOME
|
|
|
|
|
|
|
|
|
|
|
|
|
|
|
|
2011 |
|
|
2010 |
|
|
2009 |
|
|
Fee and commission income: |
|
|
|
|
|
|
|
|
|
|
|
Current accounts |
|
|
1,053 |
|
|
1,086 |
|
|
1,088 |
|
|
Credit and debit card fees |
|
|
877 |
|
|
812 |
|
|
765 |
|
|
Other1 |
|
|
3,005 |
|
|
3,094 |
|
|
2,875 |
|
|
Total fee and commission income |
|
|
4,935 |
|
|
4,992 |
|
|
4,728 |
|
|
Fee and commission expense |
|
|
(1,391 |
) |
|
(1,682 |
) |
|
(1,517 |
) |
|
Net fee and commission income |
|
|
3,544 |
|
|
3,310 |
|
|
3,211 |
|
|
|
|
|
1 |
In previous years the Group has included annual management charges on non-participating investment contracts within insurance claims. In light of developing industry practice, these amounts (2011: £606 million; 2010: £577 million; 2009: £474 million) are now included within net fee and commission income. |
As discussed in note 2, fees and commissions which are an integral part of the effective interest rate form part of net interest income shown in note 5. Fees and commissions relating to instruments that are held at fair value through profit or loss are included within net trading income shown in note 7.
NOTE 7: NET TRADING INCOME
|
|
|
|
|
|
|
|
|
|
|
|
|
|
|
|
2011 |
|
|
2010 |
|
|
2009 |
|
|
Foreign exchange translation gains |
|
|
317 |
|
|
70 |
|
|
283 |
|
|
Gains on foreign exchange trading transactions |
|
|
341 |
|
|
377 |
|
|
488 |
|
|
Total foreign exchange |
|
|
658 |
|
|
447 |
|
|
771 |
|
|
Investment property (losses) gains (note 28) |
|
|
(107 |
) |
|
434 |
|
|
(214 |
) |
|
Securities and other (losses) gains (see below) |
|
|
(919 |
) |
|
14,843 |
|
|
18,541 |
|
|
Net trading income |
|
|
(368 |
) |
|
15,724 |
|
|
19,098 |
|
Securities and other gains comprise net gains arising on assets and liabilities held at fair value through profit or loss and for trading as follows:
|
|
|
|
|
|
|
|
|
|
|
|
|
|
|
|
|
|
2011 |
|
|
|
2010 |
|
|
|
2009 |
|
|
Net income arising on assets held at fair value through profit or loss: |
|
|
|
|
|
|
|
|
|
|
|
|
|
Debt securities, loans and advances |
|
|
5,293 |
|
|
|
2,292 |
|
|
|
4,297 |
|
|
Equity shares |
|
|
(4,917 |
) |
|
|
10,333 |
|
|
|
11,475 |
|
|
Total net income arising on assets held at fair value through profit or loss |
|
|
376 |
|
|
|
12,625 |
|
|
|
15,772 |
|
|
Net expense arising on liabilities held at fair value through profit or loss – debt securities in issue |
|
|
(230 |
) |
|
|
(231 |
) |
|
|
(125 |
) |
|
Total net gains arising on assets and liabilities held at fair value through profit or loss |
|
|
146 |
|
|
|
12,394 |
|
|
|
15,647 |
|
|
Net (losses) gains on financial instruments held for trading |
|
|
(1,065 |
) |
|
|
2,449 |
|
|
|
2,894 |
|
|
Securities and other (losses) gains |
|
|
(919 |
) |
|
|
14,843 |
|
|
|
18,541 |
|
F-31
NOTES TO THE CONSOLIDATED FINANCIAL STATEMENTS
NOTE 8: INSURANCE PREMIUM INCOME
|
|
|
|
|
|
|
|
|
|
|
|
|
|
|
|
|
|
|
|
|
2011 |
|
|
|
|
2010 |
|
|
|
|
2009 |
|
|
|
Life insurance |
|
|
|
|
|
|
|
|
|
|
|
|
|
|
|
|
Gross premiums |
|
|
7,276 |
|
|
|
|
7,026 |
|
|
|
|
7,768 |
|
|
|
Ceded reinsurance premiums |
|
|
(322 |
) |
|
|
|
(253 |
) |
|
|
|
(308 |
) |
|
|
Net earned premiums |
|
|
6,954 |
|
|
|
|
6,773 |
|
|
|
|
7,460 |
|
|
|
Non-life insurance |
|
|
|
|
|
|
|
|
|
|
|
|
|
|
|
|
|
|
|
|
|
|
|
|
|
|
|
|
|
|
|
|
|
Gross written premiums |
|
|
1,198 |
|
|
|
|
1,332 |
|
|
|
|
1,390 |
|
|
|
Ceded reinsurance premiums |
|
|
(52 |
) |
|
|
|
(104 |
) |
|
|
|
(101 |
) |
|
|
Net written premiums |
|
|
1,146 |
|
|
|
|
1,228 |
|
|
|
|
1,289 |
|
|
|
Change in provision for unearned premiums (note 38(2)) |
|
|
70 |
|
|
|
|
156 |
|
|
|
|
171 |
|
|
|
Change in provision for ceded unearned premiums (note 38(2)) |
|
|
— |
|
|
|
|
(9 |
) |
|
|
|
26 |
|
|
|
Net earned premiums |
|
|
1,216 |
|
|
|
|
1,375 |
|
|
|
|
1,486 |
|
|
|
Total net earned premiums |
|
|
8,170 |
|
|
|
|
8,148 |
|
|
|
|
8,946 |
|
|
|
|
|
|
|
|
|
|
|
|
|
|
|
|
|
|
|
|
Life insurance gross premiums can be further analysed as follows: |
|
|
|
|
|
|
|
|
|
|
|
|
|
|
|
|
|
|
|
|
|
|
|
|
|
|
|
|
|
|
|
|
|
|
|
|
2011 |
|
|
|
|
2010 |
|
|
|
|
2009 |
|
|
|
Life and pensions |
|
|
6,737 |
|
|
|
|
6,428 |
|
|
|
|
7,070 |
|
|
|
Annuities |
|
|
529 |
|
|
|
|
583 |
|
|
|
|
685 |
|
|
|
Other |
|
|
10 |
|
|
|
|
15 |
|
|
|
|
13 |
|
|
|
Gross premiums |
|
|
7,276 |
|
|
|
|
7,026 |
|
|
|
|
7,768 |
|
|
|
|
|
|
|
|
|
|
|
|
|
|
|
|
|
|
|
|
Non-life insurance gross written premiums can be further analysed as follows: |
|
|
|
|
|
|
|
|
|
|
|
|
|
|
|
|
|
|
|
|
|
|
|
|
|
|
|
|
|
|
|
|
|
|
|
|
2011 |
|
|
|
|
2010 |
|
|
|
|
2009 |
|
|
|
Credit protection |
|
|
231 |
|
|
|
|
363 |
|
|
|
|
417 |
|
|
|
Home |
|
|
963 |
|
|
|
|
964 |
|
|
|
|
968 |
|
|
|
Health |
|
|
4 |
|
|
|
|
5 |
|
|
|
|
5 |
|
|
|
Gross written premiums |
|
|
1,198 |
|
|
|
|
1,332 |
|
|
|
|
1,390 |
|
|
F-32
NOTES TO THE CONSOLIDATED FINANCIAL STATEMENTS
NOTE 9: OTHER OPERATING INCOME
|
|
|
|
|
|
|
|
|
|
|
|
|
|
|
|
2011 |
|
|
2010 |
|
|
2009 |
|
|
Operating lease rental income |
|
|
1,268 |
|
|
1,410 |
|
|
1,509 |
|
|
Rental income from investment properties (note 28) |
|
|
388 |
|
|
337 |
|
|
358 |
|
|
Other rents receivable |
|
|
34 |
|
|
41 |
|
|
51 |
|
|
Gains less losses on disposal of available-for-sale financial assets (note 49) |
|
|
343 |
|
|
399 |
|
|
97 |
|
|
Movement in value of in-force business (note 30) |
|
|
(622 |
) |
|
789 |
|
|
1,169 |
|
|
Liability management gains |
|
|
599 |
|
|
423 |
|
|
1,498 |
|
|
Other income |
|
|
758 |
|
|
917 |
|
|
808 |
|
|
Total other operating income |
|
|
2,768 |
|
|
4,316 |
|
|
5,490 |
|
LIABILITY MANAGEMENT GAINS
During December 2011, the Group completed the exchange of certain subordinated debt securities issued by Lloyds TSB Bank plc and HBOS plc for new subordinated debt securities issued by Lloyds TSB Bank plc by undertaking an exchange offer on certain securities which were eligible for call before 31 December 2012. This exchange resulted in a gain on extinguishment of the existing securities of £599 million being the difference between the carrying amount of the securities extinguished and the fair value of the new securities issued together with related fees and costs.
On 18 February 2010, as part of the Group’s recapitalisation and exit from its proposed participation in the Government Asset Protection Scheme, Lloyds Banking Group plc issued 3,141 million ordinary shares in exchange for certain existing preference shares and preferred securities. This exchange resulted in a gain of £85 million. During March 2010 the Group entered into a bilateral exchange, under which certain Enhanced Capital Notes denominated in Japanese yen were exchanged for an issue of new Enhanced Capital Notes denominated in US dollars; the securities subject to the exchange were cancelled and a profit of £20 million arose. In addition, during May and June 2010 the Group completed the exchange of a number of outstanding capital securities issued by Lloyds Banking Group plc and certain of its subsidiaries for ordinary shares in Lloyds Banking Group plc. The securities subject to exchange were cancelled, generating a total profit of £318 million for the Group.
In the first half of 2009, undated subordinated securities issued by a number of Group companies were exchanged for innovative tier 1 securities and senior unsecured securities issued by Lloyds TSB Bank plc. These exchanges resulted in a gain of £745 million. In July 2009, dated and undated subordinated securities issued by Clerical Medical Finance plc were exchanged for senior unsecured securities issued by Lloyds TSB Bank plc resulting in a gain of £30 million. In November 2009, as part of the restructuring plan that was a requirement for European Commission approval of state aid received by the Group, the Group agreed to suspend the payment of coupons and dividends on certain of the Group’s preference shares and preferred securities for the two year period from 31 January 2010 to 31 January 2012. This suspension gave rise to a partial extinguishment of the original liability, equivalent to the present value of the suspended cash flows. During December 2009, as part of the Group’s recapitalisation and exit from GAPS, preference shares, preferred securities and undated subordinated securities were exchanged for Enhanced Capital Notes. These exchanges, together with the partial extinguishment of liabilities arising from the suspension of payments of coupons, resulted in a gain of £723 million.
F-33
NOTES TO THE CONSOLIDATED FINANCIAL STATEMENTS
NOTE 10: INSURANCE CLAIMS
Insurance claims comprise:
|
|
|
|
|
|
|
|
|
|
|
|
|
|
|
|
|
|
2011 |
|
|
|
2010 |
|
|
|
2009 |
|
|
Life insurance and participating investment contracts |
|
|
|
|
|
|
|
|
|
|
|
|
|
Claims and surrenders: |
|
|
|
|
|
|
|
|
|
|
|
|
|
Gross |
|
|
(8,622 |
) |
|
|
(9,397 |
) |
|
|
(8,010 |
) |
|
Reinsurers’ share |
|
|
230 |
|
|
|
159 |
|
|
|
146 |
|
|
|
|
|
(8,392 |
) |
|
|
(9,238 |
) |
|
|
(7,864 |
) |
|
Change in insurance and participating investment contract liabilities (note 38(1)): |
|
|
|
|
|
|
|
|
|
|
|
|
|
Change in gross liabilities |
|
|
1,383 |
|
|
|
(4,622 |
) |
|
|
(5,922 |
) |
|
Change in reinsurers’ share of liabilities |
|
|
451 |
|
|
|
256 |
|
|
|
177 |
|
|
|
|
|
1,834 |
|
|
|
(4,366 |
) |
|
|
(5,745 |
) |
|
Change in non-participating investment contract liabilities: |
|
|
|
|
|
|
|
|
|
|
|
|
|
Change in gross liabilities1 |
|
|
520 |
|
|
|
(5,449 |
) |
|
|
(7,932 |
) |
|
Change in reinsurers’ share of liabilities |
|
|
— |
|
|
|
65 |
|
|
|
— |
|
|
|
|
|
520 |
|
|
|
(5,384 |
) |
|
|
(7,932 |
) |
|
Change in unallocated surplus (note 41) |
|
|
340 |
|
|
|
439 |
|
|
|
(318 |
) |
|
Total life insurance and participating investment contracts |
|
|
(5,698 |
) |
|
|
(18,549 |
) |
|
|
(21,859 |
) |
|
Non-life insurance |
|
|
|
|
|
|
|
|
|
|
|
|
|
Claims and claims paid: |
|
|
|
|
|
|
|
|
|
|
|
|
|
Gross |
|
|
(521 |
) |
|
|
(470 |
) |
|
|
(542 |
) |
|
Reinsurers’ share |
|
|
4 |
|
|
|
11 |
|
|
|
16 |
|
|
|
|
|
(517 |
) |
|
|
(459 |
) |
|
|
(526 |
) |
|
Change in liabilities (note 38(2)): |
|
|
|
|
|
|
|
|
|
|
|
|
|
Gross |
|
|
186 |
|
|
|
(82 |
) |
|
|
(111 |
) |
|
Reinsurers’ share |
|
|
(12 |
) |
|
|
2 |
|
|
|
3 |
|
|
|
|
|
174 |
|
|
|
(80 |
) |
|
|
(108 |
) |
|
Total non-life insurance |
|
|
(343 |
) |
|
|
(539 |
) |
|
|
(634 |
) |
|
Total insurance claims |
|
|
(6,041 |
) |
|
|
(19,088 |
) |
|
|
(22,493 |
) |
|
Life insurance and participating investment contracts gross claims can also be analysed as follows: |
|
|
|
|
|
|
|
|
|
|
|
|
|
Deaths |
|
|
(625 |
) |
|
|
(662 |
) |
|
|
(637 |
) |
|
Maturities |
|
|
(1,861 |
) |
|
|
(1,763 |
) |
|
|
(2,107 |
) |
|
Surrenders |
|
|
(5,041 |
) |
|
|
(5,904 |
) |
|
|
(4,225 |
) |
|
Annuities |
|
|
(764 |
) |
|
|
(741 |
) |
|
|
(710 |
) |
|
Other |
|
|
(331 |
) |
|
|
(327 |
) |
|
|
(331 |
) |
|
Total life insurance gross claims |
|
|
(8,622 |
) |
|
|
(9,397 |
) |
|
|
(8,010 |
) |
|
|
|
|
1 |
In previous years the Group has included annual management charges on non-participating investment contracts within insurance claims. In light of developing industry practice, these amounts (2011: £606 million; 2010: £577 million; 2009: £474 million) are now included within net fee and commission income. |
A non-life insurance claims development table is included in note 38.
F-34
NOTES TO THE CONSOLIDATED FINANCIAL STATEMENTS
NOTE 11: OPERATING EXPENSES
|
|
|
|
|
|
|
|
|
|
|
|
|
|
|
|
|
|
|
|
|
2011 |
|
|
|
|
2010 |
|
|
|
|
2009 |
|
|
|
Staff costs: |
|
|
|
|
|
|
|
|
|
|
|
|
|
|
|
|
Salaries |
|
|
3,784 |
|
|
|
|
3,787 |
|
|
|
|
3,902 |
|
|
|
Performance-based compensation |
|
|
361 |
|
|
|
|
533 |
|
|
|
|
491 |
|
|
|
Social security costs |
|
|
432 |
|
|
|
|
396 |
|
|
|
|
383 |
|
|
|
Pensions and other post-retirement benefit schemes (note 43): |
|
|
|
|
|
|
|
|
|
|
|
|
|
|
|
|
Curtailment gain2 |
|
|
— |
|
|
|
|
(910 |
) |
|
|
|
— |
|
|
|
Other |
|
|
401 |
|
|
|
|
628 |
|
|
|
|
744 |
|
|
|
|
|
|
401 |
|
|
|
|
(282 |
) |
|
|
|
744 |
|
|
|
Restructuring costs |
|
|
124 |
|
|
|
|
119 |
|
|
|
|
412 |
|
|
|
Other staff costs |
|
|
1,064 |
|
|
|
|
1,069 |
|
|
|
|
743 |
|
|
|
|
|
|
6,166 |
|
|
|
|
5,622 |
|
|
|
|
6,675 |
|
|
|
Premises and equipment: |
|
|
|
|
|
|
|
|
|
|
|
|
|
|
|
|
Rent and rates |
|
|
547 |
|
|
|
|
602 |
|
|
|
|
569 |
|
|
|
Hire of equipment |
|
|
22 |
|
|
|
|
18 |
|
|
|
|
20 |
|
|
|
Repairs and maintenance |
|
|
188 |
|
|
|
|
199 |
|
|
|
|
226 |
|
|
|
Other |
|
|
294 |
|
|
|
|
358 |
|
|
|
|
341 |
|
|
|
|
|
|
1,051 |
|
|
|
|
1,177 |
|
|
|
|
1,156 |
|
|
|
Other expenses: |
|
|
|
|
|
|
|
|
|
|
|
|
|
|
|
|
Communications and data processing |
|
|
954 |
|
|
|
|
1,126 |
|
|
|
|
668 |
|
|
|
Advertising and promotion |
|
|
398 |
|
|
|
|
362 |
|
|
|
|
335 |
|
|
|
Professional fees |
|
|
576 |
|
|
|
|
742 |
|
|
|
|
540 |
|
|
|
Customer goodwill payments provision (note 45) |
|
|
— |
|
|
|
|
500 |
|
|
|
|
— |
|
|
|
UK bank levy |
|
|
189 |
|
|
|
|
— |
|
|
|
|
— |
|
|
|
Financial services compensation scheme management expenses levy |
|
|
179 |
|
|
|
|
46 |
|
|
|
|
73 |
|
|
|
Provision in relation to German insurance business litigation (note 45) |
|
|
175 |
|
|
|
|
— |
|
|
|
|
— |
|
|
|
Other |
|
|
1,122 |
|
|
|
|
1,061 |
|
|
|
|
1,237 |
|
|
|
|
|
|
3,593 |
|
|
|
|
3,837 |
|
|
|
|
2,853 |
|
|
|
Depreciation and amortisation: |
|
|
|
|
|
|
|
|
|
|
|
|
|
|
|
|
Depreciation of tangible fixed assets (note 32) |
|
|
1,434 |
|
|
|
|
1,635 |
|
|
|
|
1,716 |
|
|
|
Amortisation of acquired value of in-force non-participating investment contracts (note 30) |
|
|
78 |
|
|
|
|
76 |
|
|
|
|
75 |
|
|
|
Amortisation of other intangible assets (note 31) |
|
|
663 |
|
|
|
|
721 |
|
|
|
|
769 |
|
|
|
|
|
|
2,175 |
|
|
|
|
2,432 |
|
|
|
|
2,560 |
|
|
|
Impairment of tangible fixed assets3 (note 32) |
|
|
65 |
|
|
|
|
202 |
|
|
|
|
— |
|
|
|
Goodwill impairment (note 29) |
|
|
— |
|
|
|
|
— |
|
|
|
|
240 |
|
|
|
Total operating expenses, excluding payment protection insurance provision and Government Asset Protection Scheme fee |
|
|
13,050 |
|
|
|
|
13,270 |
|
|
|
|
13,484 |
|
|
|
Payment protection insurance provision (note 45) |
|
|
— |
|
|
|
|
3,200 |
|
|
|
|
— |
|
|
|
Government Asset Protection Scheme fee |
|
|
— |
|
|
|
|
— |
|
|
|
|
2,500 |
|
|
|
Total operating expenses |
|
|
13,050 |
|
|
|
|
16,470 |
|
|
|
|
15,984 |
|
|
|
|
|
|
1 |
During 2011, the Group has reviewed the analysis of certain cost items and as a result has reclassified some items of expenditure; comparatives for 2010 have been restated accordingly. |
|
|
|
|
2 |
Following changes by the Group to the terms of its defined benefit pension schemes in 2010, all future increases to pensionable salary will be capped each year at the lower of: Retail Prices Index inflation; each employee’s actual percentage increase in pay; and 2 per cent of pensionable pay. In addition to this, during the second half of 2010 there was a change in commutation factors in certain defined benefit schemes. The combined effect of these changes was a reduction in the Group’s defined benefit obligation of £1,081 million and a reduction in the Group’s unrecognised actuarial losses of £171 million, resulting in a net curtailment gain of £910 million recognised in the income statement and a reduction in the balance sheet liability. |
|
|
|
|
3 |
£65 million (2010: £52 million; 2009: £nil) of the impairment of tangible fixed assets relates to integration activities. |
F-35
NOTES TO THE CONSOLIDATED FINANCIAL STATEMENTS
NOTE 11: OPERATING EXPENSES continued
PERFORMANCE-BASED COMPENSATION
The table below analyses the Group’s performance-based compensation costs (excluding branch-based sales incentives) between those relating to the current performance year and those relating to earlier years.
|
|
|
|
|
|
|
|
|
|
|
|
|
|
|
|
2011 |
|
|
2010 |
|
|
2009 |
|
|
Performance-based compensation expense comprises: |
|
|
|
|
|
|
|
|
|
|
|
Awards made in respect of the year ended 31 December |
|
|
363 |
|
|
505 |
|
|
480 |
|
|
Awards made in respect of earlier years |
|
|
(2 |
) |
|
28 |
|
|
11 |
|
|
|
|
|
361 |
|
|
533 |
|
|
491 |
|
|
|
|
|
|
|
|
|
|
|
|
|
|
Performance-based compensation expense deferred until later years comprises: |
|
|
|
|
|
|
|
|
|
|
|
Awards made in respect of the year ended 31 December |
|
|
43 |
|
|
39 |
|
|
60 |
|
|
Awards made in respect of earlier years |
|
|
29 |
|
|
39 |
|
|
11 |
|
|
|
|
|
72 |
|
|
78 |
|
|
71 |
|
Performance-based awards expensed in 2011 include cash awards amounting to £160 million (2010: £163 million; 2009: £180 million).
AVERAGE HEADCOUNT
The average number of persons on a headcount basis employed by the Group during the year was as follows:
|
|
|
|
|
|
|
|
|
|
|
|
|
|
|
|
2011 |
|
|
2010 |
|
|
2009 |
|
|
UK |
|
|
116,371 |
|
|
118,149 |
|
|
125,109 |
|
|
Overseas |
|
|
4,078 |
|
|
4,830 |
|
|
6,891 |
|
|
Total |
|
|
120,449 |
|
|
122,979 |
|
|
132,000 |
|
FEES PAYABLE TO THE AUDITORS
Fees payable to the Company’s auditors by the Group are as follows:
|
|
|
|
|
|
|
|
|
|
|
|
|
|
|
|
|
|
2011 |
|
|
|
2010 |
|
|
|
2009 |
|
|
Fees payable for the audit of the Company’s current year annual report |
|
|
1.7 |
|
|
|
1.9 |
|
|
|
2.2 |
|
|
Fees payable for other services: |
|
|
|
|
|
|
|
|
|
|
|
|
|
Audit of the Company’s subsidiaries pursuant to legislation |
|
|
16.9 |
|
|
|
17.9 |
|
|
|
18.8 |
|
|
Other services supplied pursuant to legislation |
|
|
4.8 |
|
|
|
6.2 |
|
|
|
4.2 |
|
|
Total audit fees |
|
|
23.4 |
|
|
|
26.0 |
|
|
|
25.2 |
|
|
Other services – audit related fees |
|
|
2.9 |
|
|
|
1.8 |
|
|
|
5.3 |
|
|
Total audit and audit related fees |
|
|
26.3 |
|
|
|
27.8 |
|
|
|
30.5 |
|
|
Services relating to taxation |
|
|
1.1 |
|
|
|
1.0 |
|
|
|
1.0 |
|
|
Other non-audit fees: |
|
|
|
|
|
|
|
|
|
|
|
|
|
Services relating to corporate finance transactions |
|
|
6.3 |
|
|
|
1.9 |
|
|
|
0.3 |
|
|
Other services |
|
|
2.6 |
|
|
|
9.7 |
|
|
|
8.9 |
|
|
Total other non-audit fees |
|
|
8.9 |
|
|
|
11.6 |
|
|
|
9.2 |
|
|
Total fees payable to the Company’s auditors by the Group |
|
|
36.3 |
|
|
|
40.4 |
|
|
|
40.7 |
|
Other non-audit fees cover a variety of services and in 2009 and 2010 included the costs associated with the Group’s preparations for ensuring that the heritage HBOS businesses complied fully with the requirements of the Sarbanes-Oxley Act by 31 December 2010.
The following types of services are included in the categories listed above:
Audit fees: This category includes fees in respect of the audit of the Group’s annual financial statements and other services in connection with regulatory filings. Other services supplied pursuant to legislation relate primarily to the costs associated with the Sarbanes-Oxley Act audit requirements together with the cost of the audit of the Group’s Form 20-F filing.
Audit related fees: This category includes fees in respect of services for assurance and related services that are reasonably related to the performance of the audit or review of the financial statements, for example acting as reporting accountants in respect of prospectuses and circulars required by the UKLA listing rules.
Services relating to taxation: This category includes tax compliance and tax advisory services.
Other non-audit fees: This category includes due diligence relating to corporate finance, including venture capital transactions and other assurance and advisory services.
F-36
NOTES TO THE CONSOLIDATED FINANCIAL STATEMENTS
NOTE 11: OPERATING EXPENSES continued
It is the Group’s policy to use the auditors on assignments in cases where their knowledge of the Group means that it is neither efficient nor cost effective to employ another firm of accountants. Such assignments typically relate to the provision of advice on tax issues, assistance in transactions involving the acquisition and disposal of businesses and accounting advice.
The Group has procedures that are designed to ensure auditor independence, including that fees for audit and non-audit services are approved in advance. This approval can be obtained either on an individual engagement basis or, for certain types of non-audit services, particularly those of a recurring nature, through the approval of a fee cap covering all engagements of that type provided the fee is below that cap. All statutory audit work as well as non-audit assignments where the fee is expected to exceed the relevant fee cap must be pre-approved by the Audit Committee on an individual engagement basis. On a quarterly basis, the Audit Committee receives a report detailing all pre-approved services and amounts paid to the auditors for such pre-approved services.
During the year, the auditors also earned fees payable by entities outside the consolidated Lloyds Banking Group in respect of the following:
|
|
|
|
|
|
|
|
|
|
|
|
|
|
|
|
2011 |
|
|
2010 |
|
|
2009 |
|
|
Audits of Group pension schemes |
|
|
0.4 |
|
|
0.3 |
|
|
0.3 |
|
|
Audits of the unconsolidated Open Ended Investment Companies managed by the Group |
|
|
0.6 |
|
|
0.8 |
|
|
0.6 |
|
|
Reviews of the financial position of corporate and other borrowers |
|
|
11.0 |
|
|
17.2 |
|
|
19.3 |
|
|
Acquisition due diligence and other work performed in respect of potential venture capital investments |
|
|
1.0 |
|
|
1.2 |
|
|
1.4 |
|
NOTE 12: IMPAIRMENT
|
|
|
|
|
|
|
|
|
|
|
|
|
|
|
|
|
|
2011 |
|
|
|
2010 |
|
|
|
2009 |
|
|
Impairment losses on loans and receivables: |
|
|
|
|
|
|
|
|
|
|
|
|
|
Loans and advances to banks |
|
|
— |
|
|
|
(13 |
) |
|
|
(3 |
) |
|
Loans and advances to customers |
|
|
8,020 |
|
|
|
10,727 |
|
|
|
15,783 |
|
|
Debt securities classified as loans and receivables |
|
|
49 |
|
|
|
57 |
|
|
|
248 |
|
|
Total impairment losses on loans and receivables (note 25) |
|
|
8,069 |
|
|
|
10,771 |
|
|
|
16,028 |
|
|
Impairment of available-for-sale financial assets |
|
|
80 |
|
|
|
106 |
|
|
|
602 |
|
|
Other credit risk provisions (note 45) |
|
|
(55 |
) |
|
|
75 |
|
|
|
43 |
|
|
Total impairment charged to the income statement |
|
|
8,094 |
|
|
|
10,952 |
|
|
|
16,673 |
|
F-37
NOTES TO THE CONSOLIDATED FINANCIAL STATEMENTS
NOTE 13: INVESTMENTS IN JOINT VENTURES AND ASSOCIATES
The Group’s share of results of and investments in joint ventures and associates comprises:
|
|
|
|
|
|
|
|
|
|
|
|
|
|
|
|
|
|
|
|
|
|
|
|
|
|
|
|
|
|
|
|
|
Joint ventures |
|
Associates |
|
Total |
|
|||||||||||||||||||||
|
|
|
2011 |
|
2010 |
|
2009 |
|
2011 |
|
2010 |
|
2009 |
|
2011 |
|
2010 |
|
2009 |
|
|||||||||
|
Share of income statement amounts: |
|
|
|
|
|
|
|
|
|
|
|
|
|
|
|
|
|
|
|
|
|
|
|
|
|
|
|
|
|
Income |
|
|
316 |
|
|
318 |
|
|
708 |
|
|
160 |
|
|
135 |
|
|
5 |
|
|
476 |
|
|
453 |
|
|
713 |
|
|
Expenses |
|
|
(261 |
) |
|
(209 |
) |
|
(544 |
) |
|
(161 |
) |
|
(91 |
) |
|
(96 |
) |
|
(422 |
) |
|
(300 |
) |
|
(640 |
) |
|
Impairment |
|
|
(20 |
) |
|
(126 |
) |
|
(272 |
) |
|
1 |
|
|
(92 |
) |
|
(114 |
) |
|
(19 |
) |
|
(218 |
) |
|
(386 |
) |
|
Insurance claims |
|
|
— |
|
|
— |
|
|
(465 |
) |
|
— |
|
|
— |
|
|
— |
|
|
— |
|
|
— |
|
|
(465 |
) |
|
Profit (loss) before tax |
|
|
35 |
|
|
(17 |
) |
|
(573 |
) |
|
— |
|
|
(48 |
) |
|
(205 |
) |
|
35 |
|
|
(65 |
) |
|
(778 |
) |
|
Tax |
|
|
(4 |
) |
|
(22 |
) |
|
24 |
|
|
— |
|
|
(1 |
) |
|
2 |
|
|
(4 |
) |
|
(23 |
) |
|
26 |
|
|
Share of post-tax results |
|
|
31 |
|
|
(39 |
) |
|
(549 |
) |
|
— |
|
|
(49 |
) |
|
(203 |
) |
|
31 |
|
|
(88 |
) |
|
(752 |
) |
|
Share of balance sheet amounts: |
|
|
|
|
|
|
|
|
|
|
|
|
|
|
|
|
|
|
|
|
|
|
|
|
|
|
|
|
|
Current assets |
|
|
3,346 |
|
|
3,370 |
|
|
2,754 |
|
|
246 |
|
|
378 |
|
|
605 |
|
|
3,592 |
|
|
3,748 |
|
|
3,359 |
|
|
Non-current assets |
|
|
2,148 |
|
|
2,868 |
|
|
4,662 |
|
|
976 |
|
|
1,184 |
|
|
1,611 |
|
|
3,124 |
|
|
4,052 |
|
|
6,273 |
|
|
Current liabilities |
|
|
(714 |
) |
|
(588 |
) |
|
(2,175 |
) |
|
(293 |
) |
|
(433 |
) |
|
(494 |
) |
|
(1,007 |
) |
|
(1,021 |
) |
|
(2,669 |
) |
|
Non-current liabilities |
|
|
(4,471 |
) |
|
(5,324 |
) |
|
(4,871 |
) |
|
(904 |
) |
|
(1,026 |
) |
|
(1,613 |
) |
|
(5,375 |
) |
|
(6,350 |
) |
|
(6,484 |
) |
|
Share of net assets at 31 December |
|
|
309 |
|
|
326 |
|
|
370 |
|
|
25 |
|
|
103 |
|
|
109 |
|
|
334 |
|
|
429 |
|
|
479 |
|
|
Movement in investments over the year: |
|
|
|
|
|
|
|
|
|
|
|
|
|
|
|
|
|
|
|
|
|
|
|
|
|
|
||
|
At 1 January |
|
|
326 |
|
|
370 |
|
|
55 |
|
|
103 |
|
|
109 |
|
|
— |
|
|
429 |
|
|
479 |
|
|
55 |
|
|
Exchange and other adjustments |
|
|
(3 |
) |
|
(8 |
) |
|
(15 |
) |
|
(1 |
) |
|
40 |
|
|
60 |
|
|
(4 |
) |
|
32 |
|
|
45 |
|
|
Adjustment on acquisition |
|
|
— |
|
|
— |
|
|
956 |
|
|
— |
|
|
— |
|
|
219 |
|
|
— |
|
|
— |
|
|
1,175 |
|
|
Additional investments |
|
|
7 |
|
|
71 |
|
|
140 |
|
|
3 |
|
|
6 |
|
|
12 |
|
|
10 |
|
|
77 |
|
|
152 |
|
|
Acquisitions |
|
|
— |
|
|
— |
|
|
3 |
|
|
— |
|
|
— |
|
|
60 |
|
|
— |
|
|
— |
|
|
63 |
|
|
Disposals |
|
|
(47 |
) |
|
(68 |
) |
|
(199 |
) |
|
(79 |
) |
|
(2 |
) |
|
(39 |
) |
|
(126 |
) |
|
(70 |
) |
|
(238 |
) |
|
Share of post-tax results |
|
|
31 |
|
|
(39 |
) |
|
(549 |
) |
|
— |
|
|
(49 |
) |
|
(203 |
) |
|
31 |
|
|
(88 |
) |
|
(752 |
) |
|
Dividends paid |
|
|
(5 |
) |
|
— |
|
|
(21 |
) |
|
(1 |
) |
|
(1 |
) |
|
— |
|
|
(6 |
) |
|
(1 |
) |
|
(21 |
) |
|
Share of net assets at 31 December |
|
|
309 |
|
|
326 |
|
|
370 |
|
|
25 |
|
|
103 |
|
|
109 |
|
|
334 |
|
|
429 |
|
|
479 |
|
During 2011, the Group recognised a net £8 million of losses of associates not previously recognised. The Group’s unrecognised share of losses of associates during 2010 was £8 million (2009: £64 million) and of joint ventures is £85 million in 2011 (2010: £180 million; 2009: £424 million). For entities making losses, subsequent profits earned are not recognised until previously unrecognised losses are extinguished. The Group’s unrecognised share of losses net of unrecognised profits on a cumulative basis of associates is £56 million (2010: £104 million; 2009: £64 million) and of joint ventures is £299 million (2010: £339 million; 2009: £424 million).
The Group’s principal joint venture investment at 31 December 2011 was in Sainsbury’s Bank plc; the Group owns 50 per cent of the ordinary share capital of Sainsbury’s Bank plc, whose business is banking and principal area of operation is the UK. Sainsbury’s Bank plc is incorporated in the UK and the Group’s interest is held by a subsidiary.
Where entities have statutory accounts drawn up to a date other than 31 December management accounts are used when accounting for them by the Group.
F-38
NOTES TO THE CONSOLIDATED FINANCIAL STATEMENTS
NOTE 14: GAIN ON ACQUISITION IN 2009
On 16 January 2009, the Group acquired 100 per cent of the ordinary share capital of HBOS plc, which together with its subsidiaries undertakes banking, insurance and other financial services related activities in the UK and in certain overseas locations.
The table below sets out the fair value of the identifiable net assets acquired.
At the time of the recommended offer for HBOS in September 2008, it had become increasingly difficult for HBOS to raise funds in wholesale markets and their Board sought to restore confidence and stability through an agreement to be acquired by Lloyds TSB Group plc announced on 18 September 2008 at the original terms of 0.833 Lloyds TSB Group plc shares for each HBOS share. However turbulence in the markets continued and the UK Government decided in October 2008 that it would be appropriate for the UK banking sector to increase its level of capitalisation. As a consequence of the recapitalisation of HBOS and the impact of the deteriorating market conditions the terms of the final agreed offer were revised down to a ratio of 0.605 per HBOS share.
As the fair value of the identifiable net assets acquired was greater than the total consideration paid, negative goodwill arose on the acquisition. The negative goodwill was recognised as a ‘Gain on acquisition’ in the income statement for the year ended 31 December 2009. In accordance with accounting requirements, the measurement period for the fair values of the acquired assets and liabilities ended on 15 January 2010 (one year from the date of acquisition); no further fair value adjustments were made beyond those reflected in the Group’s 31 December 2009 financial statements.
|
|
|
|
|
|
|
|
|
|
|
|
|
|
|
Book value |
|
Fair value |
|
Fair value |
|
|||
|
Assets |
|
|
|
|
|
|
|
|
|
|
|
Cash and balances at central banks |
|
|
2,123 |
|
|
— |
|
|
2,123 |
|
|
Items in the course of collection from banks |
|
|
523 |
|
|
— |
|
|
523 |
|
|
Trading and other financial assets at fair value through profit or loss |
|
|
83,857 |
|
|
— |
|
|
83,857 |
|
|
Derivative financial instruments |
|
|
54,840 |
|
|
(808 |
) |
|
54,032 |
|
|
Loans and receivables: |
|
|
|
|
|
|
|
|
|
|
|
Loans and advances to banks |
|
|
15,751 |
|
|
43 |
|
|
15,794 |
|
|
Loans and advances to customers |
|
|
450,351 |
|
|
(13,512 |
) |
|
436,839 |
|
|
Debt securities |
|
|
39,819 |
|
|
(1,411 |
) |
|
38,408 |
|
|
Available-for-sale financial assets |
|
|
27,151 |
|
|
— |
|
|
27,151 |
|
|
Investment properties |
|
|
3,002 |
|
|
— |
|
|
3,002 |
|
|
Investments in joint ventures and associates |
|
|
1,152 |
|
|
23 |
|
|
1,175 |
|
|
Value of in-force business |
|
|
3,152 |
|
|
561 |
|
|
3,713 |
|
|
Other intangible assets |
|
|
104 |
|
|
4,650 |
|
|
4,754 |
|
|
Tangible fixed assets |
|
|
5,721 |
|
|
(14 |
) |
|
5,707 |
|
|
Current tax recoverable |
|
|
1,050 |
|
|
— |
|
|
1,050 |
|
|
Deferred tax assets |
|
|
2,556 |
|
|
(602 |
) |
|
1,954 |
|
|
Other assets |
|
|
7,601 |
|
|
(905 |
) |
|
6,696 |
|
|
Total assets |
|
|
698,753 |
|
|
(11,975 |
) |
|
686,778 |
|
F-39
NOTES TO THE CONSOLIDATED FINANCIAL STATEMENTS
NOTE 14: GAIN ON ACQUISITION IN 2009 continued
|
|
|
|
|
|
|
|
|
|
|
|
|
|
|
|
Book value |
|
Fair value |
|
|
Fair value |
|
|||
|
Liabilities |
|
|
|
|
|
|
|
|
|
|
|
|
Deposits from banks |
|
|
87,731 |
|
|
109 |
|
|
|
87,840 |
|
|
Customer deposits |
|
|
223,859 |
|
|
835 |
|
|
|
224,694 |
|
|
Items in course of transmission to banks |
|
|
521 |
|
|
— |
|
|
|
521 |
|
|
Trading and other financial liabilities at fair value through profit or loss |
|
|
16,360 |
|
|
— |
|
|
|
16,360 |
|
|
Derivative financial instruments |
|
|
45,798 |
|
|
— |
|
|
|
45,798 |
|
|
Notes in circulation |
|
|
936 |
|
|
— |
|
|
|
936 |
|
|
Debt securities in issue |
|
|
191,566 |
|
|
(6,247 |
) |
|
|
185,319 |
|
|
Liabilities arising from insurance contracts and participating investment contracts |
|
|
36,405 |
|
|
282 |
|
|
|
36,687 |
|
|
Liabilities arising from non-participating investment contracts |
|
|
28,168 |
|
|
13 |
|
|
|
28,181 |
|
|
Unallocated surplus within insurance businesses |
|
|
526 |
|
|
— |
|
|
|
526 |
|
|
Other liabilities |
|
|
14,732 |
|
|
(312 |
) |
|
|
14,420 |
|
|
Retirement benefit obligations |
|
|
(474 |
) |
|
832 |
|
|
|
358 |
|
|
Current tax liabilities |
|
|
58 |
|
|
— |
|
|
|
58 |
|
|
Deferred tax liabilities |
|
|
245 |
|
|
(142 |
) |
|
|
103 |
|
|
Other provisions |
|
|
146 |
|
|
606 |
|
|
|
752 |
|
|
Subordinated liabilities |
|
|
29,240 |
|
|
(9,192 |
) |
|
|
20,048 |
|
|
Total liabilities |
|
|
675,817 |
|
|
(13,216 |
) |
|
|
662,601 |
|
|
Net assets acquired |
|
|
22,936 |
|
|
1,241 |
|
|
|
24,177 |
|
|
|
|
|
|
|
|
|
|
|
|
|
|
|
Fair value of net assets acquired |
|
|
|
|
|
|
|
|
|
24,177 |
|
|
Adjust for: |
|
|
|
|
|
|
|
|
|
|
|
|
Preference shares1 |
|
|
|
|
|
|
|
|
|
(3,917 |
) |
|
Non-controlling interests |
|
|
|
|
|
|
|
|
|
(1,300 |
) |
|
Adjusted net assets of HBOS acquired |
|
|
|
|
|
|
|
|
|
18,960 |
|
|
Consideration inclusive of acquisition costs: |
|
|
|
|
|
|
|
|
|
|
|
|
Issue of 7,776 million ordinary shares of 25p in Lloyds Banking Group plc2 |
|
|
|
|
|
|
|
|
|
(7,651 |
) |
|
Fees and expenses related to the transaction |
|
|
|
|
|
|
|
|
|
(136 |
) |
|
Total consideration |
|
|
|
|
|
|
|
|
|
(7,787 |
) |
|
Gain on acquisition in 2009 |
|
|
|
|
|
|
|
|
|
11,173 |
|
|
|
|
|
1 |
On 16 January 2009, the Group cancelled the following HBOS preference share issuances in exchange for preference shares issued by Lloyds Banking Group plc: 6.475 per cent non-cumulative preference shares of £1 each, 6.3673 per cent non-cumulative fixed to floating preference shares of £1 each and 6.0884 per cent non-cumulative preference shares of £1 each. The fair value of the Lloyds Banking Group preference shares issued was deducted from the net assets acquired for the purposes of calculating the gain arising on acquisition. |
|
|
|
|
2 |
The calculation of consideration was based on the closing price of Lloyds TSB ordinary shares of 98.4p on 16 January 2009; 12,852 million HBOS shares were exchanged for Lloyds Banking Group shares at a ratio of 0.605 shares per HBOS share. |
F-40
NOTES TO THE CONSOLIDATED FINANCIAL STATEMENTS
NOTE 15: LOSS ON DISPOSAL OF BUSINESSES IN 2010
During 2009, the Group acquired an oil drilling rig construction business through a previous lending relationship and consolidated the results and net assets of the business from the date it exercised control.
In the first half of 2010, as a result of a deteriorating market, the Group impaired the oil drilling rigs under construction held by the business by £150 million to reflect their reduced value in use. This impairment was recognised in the Wholesale segment.
In the second half of 2010, the Group reached agreement to dispose of its interests in the two wholly-owned subsidiary companies through which this business operates; the sale was completed in January 2011. These companies, which had gross assets of £860 million, were sold to Seadrill Limited; a loss of £365 million arose on disposal.
The Group extended vendor financing, on normal commercial terms and negotiated on an arms length basis, to Seadrill to facilitate the acquisition of the rig holding companies. The loan is not contingent on the performance of the oil rigs under construction. Accordingly, as at 31 December 2010, the subsidiaries were derecognised.
NOTE 16: TAXATION
(A) ANALYSIS OF TAX (CHARGE) CREDIT FOR THE YEAR
|
|
|
|
|
|
|
|
|
|
|
|
|
|
|
|
|
2011 |
|
|
2010 |
|
|
2009 |
|
|||
|
UK corporation tax: |
|
|
|
|
|
|
|
|
|
|
|
|
|
Current tax on profit for the year |
|
|
(93 |
) |
|
|
(146 |
) |
|
|
(227 |
) |
|
Adjustments in respect of prior years |
|
|
(146 |
) |
|
|
310 |
|
|
|
(310 |
) |
|
|
|
|
(239 |
) |
|
|
164 |
|
|
|
(537 |
) |
|
Double taxation relief |
|
|
— |
|
|
|
1 |
|
|
|
10 |
|
|
|
|
|
(239 |
) |
|
|
165 |
|
|
|
(527 |
) |
|
Foreign tax: |
|
|
|
|
|
|
|
|
|
|
|
|
|
Current tax on profit for the year |
|
|
(90 |
) |
|
|
(82 |
) |
|
|
(221 |
) |
|
Adjustments in respect of prior years |
|
|
36 |
|
|
|
49 |
|
|
|
40 |
|
|
|
|
|
(54 |
) |
|
|
(33 |
) |
|
|
(181 |
) |
|
Current tax (charge) credit |
|
|
(293 |
) |
|
|
132 |
|
|
|
(708 |
) |
|
Deferred tax (note 44): |
|
|
|
|
|
|
|
|
|
|
|
|
|
Origination and reversal of temporary differences |
|
|
773 |
|
|
|
503 |
|
|
|
2,429 |
|
|
Reduction in UK corporation tax rate |
|
|
(420 |
) |
|
|
(169 |
) |
|
|
— |
|
|
Adjustments in respect of prior years |
|
|
(96 |
) |
|
|
(141 |
) |
|
|
190 |
|
|
|
|
|
257 |
|
|
|
193 |
|
|
|
2,619 |
|
|
Tax (charge) credit |
|
|
(36 |
) |
|
|
325 |
|
|
|
1,911 |
|
The (charge) credit for tax on the profit for 2011 is based on a UK corporation tax rate of 26.5 per cent (2010 and 2009: 28.0 per cent).
The above income tax (charge) credit is made up as follows:
|
|
|
|
|
|
|
|
|
|
|
|
|
|
|
2011 |
|
2010 |
|
2009 |
|
|||
|
Tax credit (charge) attributable to policyholders |
|
|
72 |
|
|
(315 |
) |
|
(410 |
) |
|
Shareholder tax (charge) credit |
|
|
(108 |
) |
|
640 |
|
|
2,321 |
|
|
Tax (charge) credit |
|
|
(36 |
) |
|
325 |
|
|
1,911 |
|
F-41
NOTES TO THE CONSOLIDATED FINANCIAL STATEMENTS
NOTE 16: TAXATION continued
(B) FACTORS AFFECTING THE TAX CREDIT (CHARGE) FOR THE YEAR
A reconciliation of the credit (charge) that would result from applying the standard UK corporation tax rate to (loss) profit before tax to the actual tax credit (charge) for the year is given below:
|
|
|
|
|
|
|
|
|
|
|
|
|
|
|
|
2011 |
|
|
2010 |
|
|
2009 |
|
|
|
|
|
£m |
|
|
£m |
|
|
£m |
|
|
(Loss) profit before tax |
|
|
(342 |
) |
|
(2,919 |
) |
|
1,042 |
|
|
Tax credit (charge) thereon at UK corporation tax rate of 26.5 per cent (2010 and 2009: 28.0 per cent) |
|
|
91 |
|
|
817 |
|
|
(292 |
) |
|
Factors affecting credit (charge): |
|
|
|
|
|
|
|
|
|
|
|
UK corporation tax rate change |
|
|
(420 |
) |
|
(169 |
) |
|
— |
|
|
Goodwill |
|
|
— |
|
|
— |
|
|
3,061 |
|
|
Disallowed and non-taxable items |
|
|
238 |
|
|
5 |
|
|
408 |
|
|
Overseas tax rate differences |
|
|
17 |
|
|
134 |
|
|
(352 |
) |
|
Gains exempted or covered by capital losses |
|
|
106 |
|
|
65 |
|
|
(14 |
) |
|
Policyholder interests |
|
|
53 |
|
|
(227 |
) |
|
(295 |
) |
|
Tax losses where no deferred tax recognised |
|
|
(261 |
) |
|
(487 |
) |
|
(332 |
) |
|
Deferred tax on tax losses not previously recognised |
|
|
332 |
|
|
— |
|
|
— |
|
|
Adjustments in respect of previous years |
|
|
(206 |
) |
|
218 |
|
|
(66 |
) |
|
Effect of results of joint ventures and associates |
|
|
8 |
|
|
(25 |
) |
|
(211 |
) |
|
Other items |
|
|
6 |
|
|
(6 |
) |
|
4 |
|
|
Tax credit (charge) on (loss) profit on ordinary activities |
|
|
(36 |
) |
|
325 |
|
|
1,911 |
|
NOTE 17: EARNINGS PER SHARE
|
|
|
|
|
|
|
|
|
|
|
|
|
|
|
|
2011 |
|
|
2010 |
|
|
2009 |
|
|
|
|
|
£m |
|
|
£m |
|
|
£m |
|
|
(Loss) profit attributable to equity shareholders – basic and diluted |
|
|
(451 |
) |
|
(2,656 |
) |
|
2,827 |
|
|
|
||||||||||
|
|
|
|
2011 |
|
|
2010 |
|
|
2009 |
|
|
|
|
|
million |
|
|
million |
|
|
million |
|
|
Weighted average number of ordinary shares in issue – basic |
|
|
68,470 |
|
|
67,117 |
|
|
37,674 |
|
|
Adjustment for share options and awards |
|
|
— |
|
|
— |
|
|
255 |
|
|
Weighted average number of ordinary shares in issue – diluted |
|
|
68,470 |
|
|
67,117 |
|
|
37,929 |
|
|
Basic (loss) earnings per share |
|
|
(0.7 |
)p |
|
(4.0 |
)p |
|
7.5 |
p |
|
Diluted (loss) earnings per share |
|
|
(0.7 |
)p |
|
(4.0 |
)p |
|
7.5 |
p |
Basic earnings per share are calculated by dividing the net profit attributable to equity shareholders by the weighted average number of ordinary shares in issue during the year, which has been calculated after deducting 10 million (2010: 8 million; 2009: 10 million) ordinary shares representing the Group’s holdings of own shares in respect of employee share schemes.
For the calculation of diluted earnings per share the weighted average number of ordinary shares in issue is adjusted to assume conversion of all dilutive potential ordinary shares, if any, that arise in respect of share options and awards granted to employees. The number of shares that could have been acquired at the average annual share price of the Company’s shares based on the monetary value of the subscription rights attached to outstanding share options and awards is determined. This is deducted from the number of shares issuable under such options and awards to leave a residual bonus amount of shares which are added to the weighted-average number of ordinary shares in issue, but no adjustment is made to the profit attributable to equity shareholders.
In December 2009, as part of the Group’s recapitalisation and exit from the Government Asset Protection Scheme, the Group entered into an agreement with holders of certain existing liabilities to exchange these for ordinary shares or for cash on 18 February 2010. The weighted average number of anti-dilutive shares arising from this transaction that have been excluded from the calculation of diluted earnings per share was 294 million at 31 December 2009. On 18 February 2010, the above exchange completed and 3,141 million new ordinary shares in Lloyds Banking Group plc were issued.
The weighted-average number of anti-dilutive share options and awards excluded from the calculation of diluted earnings per share was 619 million at 31 December 2011 (2010: 92 million; 2009: 393 million).
F-42
NOTES TO THE CONSOLIDATED FINANCIAL STATEMENTS
NOTE 18: TRADING AND OTHER FINANCIAL ASSETS AT FAIR VALUE THROUGH PROFIT OR LOSS
These assets are comprised as follows:
|
|
|
|
|
|
|
|
|
|
|
|
|
|
|
|
|
|
|
|
|
|
|
|
|
|
|
|
|
2011 |
|
|
2010 |
|
||||||||||||||||||
|
|
|
Trading |
|
|
Other financial |
|
|
Total |
|
|
Trading |
|
|
Other financial |
|
|
Total |
|
||||||
|
Loans and advances to customers |
|
|
9,642 |
|
|
|
124 |
|
|
|
9,766 |
|
|
|
9,486 |
|
|
|
325 |
|
|
|
9,811 |
|
|
Loans and advances to banks |
|
|
1,355 |
|
|
|
— |
|
|
|
1,355 |
|
|
|
2,734 |
|
|
|
— |
|
|
|
2,734 |
|
|
Debt securities: |
|
|
|
|
|
|
|
|
|
|
|
|
|
|
|
|
|
|
|
|
|
|
|
|
|
Government securities |
|
|
2,000 |
|
|
|
21,367 |
|
|
|
23,367 |
|
|
|
1,623 |
|
|
|
22,217 |
|
|
|
23,840 |
|
|
Other public sector securities |
|
|
— |
|
|
|
1,183 |
|
|
|
1,183 |
|
|
|
— |
|
|
|
919 |
|
|
|
919 |
|
|
Bank and building society certificates of deposit |
|
|
2,863 |
|
|
|
385 |
|
|
|
3,248 |
|
|
|
3,692 |
|
|
|
606 |
|
|
|
4,298 |
|
|
Asset-backed securities: |
|
|
|
|
|
|
|
|
|
|
|
|
|
|
|
|
|
|
|
|
|
|
|
|
|
Mortgage-backed securities |
|
|
99 |
|
|
|
612 |
|
|
|
711 |
|
|
|
— |
|
|
|
422 |
|
|
|
422 |
|
|
Other asset-backed securities |
|
|
222 |
|
|
|
1,764 |
|
|
|
1,986 |
|
|
|
1,020 |
|
|
|
1,592 |
|
|
|
2,612 |
|
|
Corporate and other debt securities |
|
|
1,576 |
|
|
|
20,282 |
|
|
|
21,858 |
|
|
|
4,919 |
|
|
|
16,190 |
|
|
|
21,109 |
|
|
|
|
|
6,760 |
|
|
|
45,593 |
|
|
|
52,353 |
|
|
|
11,254 |
|
|
|
41,946 |
|
|
|
53,200 |
|
|
Equity shares |
|
|
— |
|
|
|
75,737 |
|
|
|
75,737 |
|
|
|
6 |
|
|
|
90,213 |
|
|
|
90,219 |
|
|
Treasury and other bills |
|
|
299 |
|
|
|
— |
|
|
|
299 |
|
|
|
227 |
|
|
|
— |
|
|
|
227 |
|
|
Total |
|
|
18,056 |
|
|
|
121,454 |
|
|
|
139,510 |
|
|
|
23,707 |
|
|
|
132,484 |
|
|
|
156,191 |
|
Other financial assets at fair value through profit or loss include the following assets designated into that category:
|
|
|
|
(i) |
financial assets backing insurance contracts and investment contracts of £118,890 million (2010: £129,702 million) which are so designated because the related liabilities either have cash flows that are contractually based on the performance of the assets or are contracts whose measurement takes account of current market conditions and where significant measurement inconsistencies would otherwise arise; |
|
|
|
|
(ii) |
loans and advances to customers of £124 million (2010: £109 million) which are economically hedged by interest rate derivatives which are not in hedge accounting relationships and where significant measurement inconsistencies would otherwise arise if the related derivatives were treated as trading liabilities and the loans and advances were carried at amortised cost; and |
|
|
|
|
(iii) |
private equity investments of £1,850 million (2010: £1,733 million) that are managed, and evaluated, on a fair value basis in accordance with a documented risk management or investment strategy and reported to key management personnel on that basis. |
The maximum exposure to credit risk at 31 December 2011 of the loans and advances to banks and customers designated at fair value through profit or loss was £124 million (2010: £325 million); the Group does not hold any credit derivatives or other instruments in mitigation of this risk. There was no significant movement in the fair value of these loans attributable to changes in credit risk which is determined by reference to the publicly available credit ratings of the instruments involved.
The Group’s Wholesale division had exposure to negative basis asset-backed securities of £150 million (2010: £1,067 million) which were protected by monoline financial guarantors (note 56).
Included in the amounts reported above are reverse repurchase agreements treated as collateralised loans with a carrying value of £10,990 million (2010: £12,211 million). Collateral is held with a fair value of £15,765 million (2010: £14,299 million), all of which the Group is able to repledge. At 31 December 2011, £3,740 million had been repledged (2010: £3,161 million).
For amounts included above which are subject to repurchase agreements see note 55.
F-43
NOTES TO THE CONSOLIDATED FINANCIAL STATEMENTS
NOTE 19: DERIVATIVE FINANCIAL INSTRUMENTS
The Group holds derivatives as part of the following strategies:
|
|
|
|
– |
Customer driven, where derivatives are held as part of the provision of risk management products to Group customers; |
|
|
|
|
– |
To manage and hedge the Group’s interest rate and foreign exchange risk arising from normal banking business. The hedge accounting strategy adopted by the Group is to utilise a combination of fair value, cash flow and net investment hedge approaches as described in note 56; and |
|
|
|
|
– |
Derivatives held in policyholder funds as permitted by the investment strategies of those funds. |
|
|
|
|
Derivatives are classified as trading except those designated as effective hedging instruments which meet the criteria under IAS 39. Derivatives are held at fair value on the Group’s balance sheet. A description of the methodology used to determine the fair value of derivative financial instruments and the effect of using reasonably possible alternative assumptions for those derivatives valued using unobservable inputs is set out in note 55. |
|
|
|
|
|
The principal derivatives used by the Group are as follows: |
|
|
|
|
|
– |
Interest rate related contracts include interest rate swaps, forward rate agreements and options. An interest rate swap is an agreement between two parties to exchange fixed and floating interest payments, based upon interest rates defined in the contract, without the exchange of the underlying principal amounts. Forward rate agreements are contracts for the payment of the difference between a specified rate of interest and a reference rate, applied to a notional principal amount at a specific date in the future. An interest rate option gives the buyer, on payment of a premium, the right, but not the obligation, to fix the rate of interest on a future loan or deposit, for a specified period and commencing on a specified future date. |
|
|
|
|
– |
Exchange rate related contracts include forward foreign exchange contracts, currency swaps and options. A forward foreign exchange contract is an agreement to buy or sell a specified amount of foreign currency on a specified future date at an agreed rate. Currency swaps generally involve the exchange of interest payment obligations denominated in different currencies; the exchange of principal can be notional or actual. A currency option gives the buyer, on payment of a premium, the right, but not the obligation, to sell specified amounts of currency at agreed rates of exchange on or before a specified future date. |
|
|
|
|
– |
Credit derivatives, principally credit default swaps, are used by the Group as part of its trading activity and to manage its own exposure to credit risk. A credit default swap is a swap in which one counterparty receives a premium at pre-set intervals in consideration for guaranteeing to make a specific payment should a negative credit event take place. The Group also uses credit default swaps to securitise, in combination with external funding, £3,436 million (2010: £4,149 million) of corporate and commercial banking loans. |
|
|
|
|
– |
Equity derivatives are also used by the Group as part of its equity based retail product activity to eliminate the Group’s exposure to fluctuations in various international stock exchange indices. Index-linked equity options are purchased which give the Group the right, but not the obligation, to buy or sell a specified amount of equities, or basket of equities, in the form of published indices on or before a specified future date. |
F-44
NOTES TO THE CONSOLIDATED FINANCIAL STATEMENTS
NOTE 19: DERIVATIVE FINANCIAL INSTRUMENTS continued
The fair values and notional amounts of derivative instruments are set out in the following table:
|
|
|
|
|
|
|
|
|
|
|
|
|
|
|
|
|
Contract/notional |
|
|
Fair value |
|
|
Fair value |
|
|||
|
At 31 December 2011 |
|
|
|
|
|
|
|
|
|
|
|
|
|
Trading and other |
|
|
|
|
|
|
|
|
|
|
|
|
|
Exchange rate contracts: |
|
|
|
|
|
|
|
|
|
|
|
|
|
Spot, forwards and futures |
|
|
204,629 |
|
|
|
2,542 |
|
|
|
2,780 |
|
|
Currency swaps |
|
|
138,120 |
|
|
|
3,498 |
|
|
|
2,027 |
|
|
Options purchased |
|
|
17,992 |
|
|
|
610 |
|
|
|
— |
|
|
Options written |
|
|
18,924 |
|
|
|
— |
|
|
|
616 |
|
|
|
|
|
379,665 |
|
|
|
6,650 |
|
|
|
5,423 |
|
|
Interest rate contracts: |
|
|
|
|
|
|
|
|
|
|
|
|
|
Interest rate swaps |
|
|
1,627,013 |
|
|
|
38,806 |
|
|
|
39,899 |
|
|
Forward rate agreements |
|
|
261,125 |
|
|
|
586 |
|
|
|
606 |
|
|
Options purchased |
|
|
69,554 |
|
|
|
3,693 |
|
|
|
— |
|
|
Options written |
|
|
67,858 |
|
|
|
— |
|
|
|
3,524 |
|
|
Futures |
|
|
118,921 |
|
|
|
1 |
|
|
|
2 |
|
|
|
|
|
2,144,471 |
|
|
|
43,086 |
|
|
|
44,031 |
|
|
Credit derivatives |
|
|
9,980 |
|
|
|
238 |
|
|
|
328 |
|
|
Embedded equity conversion feature |
|
|
— |
|
|
|
1,172 |
|
|
|
— |
|
|
Equity and other contracts |
|
|
23,032 |
|
|
|
2,017 |
|
|
|
1,184 |
|
|
Total derivative assets/liabilities – trading and other |
|
|
2,557,148 |
|
|
|
53,163 |
|
|
|
50,966 |
|
|
Hedging |
|
|
|
|
|
|
|
|
|
|
|
|
|
Derivatives designated as fair value hedges: |
|
|
|
|
|
|
|
|
|
|
|
|
|
Currency swaps |
|
|
19,130 |
|
|
|
708 |
|
|
|
302 |
|
|
Interest rate swaps |
|
|
93,215 |
|
|
|
6,720 |
|
|
|
1,236 |
|
|
Options written |
|
|
657 |
|
|
|
— |
|
|
|
9 |
|
|
|
|
|
113,002 |
|
|
|
7,428 |
|
|
|
1,547 |
|
|
Derivatives designated as cash flow hedges: |
|
|
|
|
|
|
|
|
|
|
|
|
|
Interest rate swaps |
|
|
152,314 |
|
|
|
5,250 |
|
|
|
5,608 |
|
|
Futures |
|
|
103,467 |
|
|
|
— |
|
|
|
— |
|
|
Currency swaps |
|
|
16,582 |
|
|
|
172 |
|
|
|
90 |
|
|
|
|
|
272,363 |
|
|
|
5,422 |
|
|
|
5,698 |
|
|
Derivatives designated as net investment hedges: |
|
|
|
|
|
|
|
|
|
|
|
|
|
Cross currency swaps |
|
|
49 |
|
|
|
— |
|
|
|
1 |
|
|
Total derivative assets/liabilities – hedging |
|
|
385,414 |
|
|
|
12,850 |
|
|
|
7,246 |
|
|
Total recognised derivative assets/liabilities |
|
|
2,942,562 |
|
|
|
66,013 |
|
|
|
58,212 |
|
The principal amount of the contract does not represent the Group’s real exposure to credit risk which is limited to the current cost of replacing contracts with a positive value to the Group should the counterparty default. To reduce credit risk the Group uses a variety of credit enhancement techniques such as netting and collateralisation, where security is provided against the exposure. Further details are provided in note 56 Credit risk.
The embedded equity conversion feature of £1,172 million (31 December 2010: £1,177 million) reflects the value of the equity conversion feature contained in the Enhanced Capital Notes issued by the Group in 2009; the loss of £5 million arising from the change in fair value over 2011 (2010: loss of £620 million; 2009: loss of £427 million) is included within net gains on financial instruments held for trading within net trading income (note 7).
F-45
NOTES TO THE CONSOLIDATED FINANCIAL STATEMENTS
NOTE 19: DERIVATIVE FINANCIAL INSTRUMENTS continued
|
|
|
|
|
|
|
|
|
|
|
|
|
|
|
|
|
Contract/notional |
|
|
Fair value |
|
|
Fair value |
|
|||
|
At 31 December 2010 |
|
|
|
|
|
|
|
|
|
|
|
|
|
Trading and other |
|
|
|
|
|
|
|
|
|
|
|
|
|
Exchange rate contracts: |
|
|
|
|
|
|
|
|
|
|
|
|
|
Spot, forwards and futures |
|
|
212,832 |
|
|
|
2,513 |
|
|
|
2,242 |
|
|
Currency swaps |
|
|
108,216 |
|
|
|
5,696 |
|
|
|
1,773 |
|
|
Options purchased |
|
|
18,096 |
|
|
|
602 |
|
|
|
— |
|
|
Options written |
|
|
19,387 |
|
|
|
— |
|
|
|
536 |
|
|
|
|
|
358,531 |
|
|
|
8,811 |
|
|
|
4,551 |
|
|
Interest rate contracts: |
|
|
|
|
|
|
|
|
|
|
|
|
|
Interest rate swaps |
|
|
1,397,157 |
|
|
|
28,448 |
|
|
|
29,202 |
|
|
Forward rate agreements |
|
|
718,227 |
|
|
|
309 |
|
|
|
287 |
|
|
Options purchased |
|
|
59,578 |
|
|
|
2,371 |
|
|
|
— |
|
|
Options written |
|
|
60,828 |
|
|
|
— |
|
|
|
2,180 |
|
|
Futures |
|
|
23,361 |
|
|
|
3 |
|
|
|
1 |
|
|
|
|
|
2,259,151 |
|
|
|
31,131 |
|
|
|
31,670 |
|
|
Credit derivatives |
|
|
7,108 |
|
|
|
256 |
|
|
|
207 |
|
|
Embedded equity conversion feature |
|
|
— |
|
|
|
1,177 |
|
|
|
— |
|
|
Equity and other contracts |
|
|
22,597 |
|
|
|
1,996 |
|
|
|
1,332 |
|
|
Total derivative assets/liabilities – trading and other |
|
|
2,647,387 |
|
|
|
43,371 |
|
|
|
37,760 |
|
|
Hedging |
|
|
|
|
|
|
|
|
|
|
|
|
|
Derivatives designated as fair value hedges: |
|
|
|
|
|
|
|
|
|
|
|
|
|
Currency swaps |
|
|
9,418 |
|
|
|
606 |
|
|
|
35 |
|
|
Interest rate swaps |
|
|
75,831 |
|
|
|
4,366 |
|
|
|
1,200 |
|
|
|
|
|
85,249 |
|
|
|
4,972 |
|
|
|
1,235 |
|
|
Derivatives designated as cash flow hedges: |
|
|
|
|
|
|
|
|
|
|
|
|
|
Interest rate swaps |
|
|
112,507 |
|
|
|
2,199 |
|
|
|
3,042 |
|
|
Futures |
|
|
1,299 |
|
|
|
1 |
|
|
|
— |
|
|
Currency swaps |
|
|
17,745 |
|
|
|
232 |
|
|
|
121 |
|
|
|
|
|
131,551 |
|
|
|
2,432 |
|
|
|
3,163 |
|
|
Derivatives designated as net investment hedges: |
|
|
|
|
|
|
|
|
|
|
|
|
|
Cross currency swaps |
|
|
86 |
|
|
|
2 |
|
|
|
— |
|
|
Total derivative assets/liabilities – hedging |
|
|
216,886 |
|
|
|
7,406 |
|
|
|
4,398 |
|
|
Total recognised derivative assets/liabilities |
|
|
2,864,273 |
|
|
|
50,777 |
|
|
|
42,158 |
|
F-46
NOTES TO THE CONSOLIDATED FINANCIAL STATEMENTS
NOTE 19: DERIVATIVE FINANCIAL INSTRUMENTS continued
HEDGED CASH FLOWS
For designated cash flow hedges the following table shows when the Group’s hedged cash flows are expected to occur and when they will affect income.
|
|
|
|
|
|
|
|
|
|
|
|
|
|
|
|
|
|
|
|
|
|
|
|
|
|
|
|
|
|
|
2011 |
|
0-1 years |
|
1-2 years |
|
2-3 years |
|
3-4 years |
|
4-5 years |
|
5-10 years |
|
10-20 years |
|
Over 20 |
|
Total |
|
|||||||||
|
Hedged forecast cash flows expected to occur: |
|
|
|
|
|
|
|
|
|
|
|
|
|
|
|
|
|
|
|
|
|
|
|
|
|
|
|
|
|
Forecast receivable cash flows |
|
|
140 |
|
|
239 |
|
|
475 |
|
|
208 |
|
|
35 |
|
|
355 |
|
|
191 |
|
|
66 |
|
|
1,709 |
|
|
Forecast payable cash flows |
|
|
(178 |
) |
|
(181 |
) |
|
(63 |
) |
|
(81 |
) |
|
(78 |
) |
|
(1,394 |
) |
|
(1,163 |
) |
|
(354 |
) |
|
(3,492 |
) |
|
Hedged forecast cash flows affect profit or loss: |
|
|
|
|
|
|
|
|
|
|
|
|
|
|
|
|
|
|
|
|
|
|
|
|
|
|
|
|
|
Forecast receivable cash flows |
|
|
234 |
|
|
232 |
|
|
388 |
|
|
208 |
|
|
47 |
|
|
383 |
|
|
163 |
|
|
54 |
|
|
1,709 |
|
|
Forecast payable cash flows |
|
|
(224 |
) |
|
(154 |
) |
|
(53 |
) |
|
(81 |
) |
|
(145 |
) |
|
(1,475 |
) |
|
(1,110 |
) |
|
(250 |
) |
|
(3,492 |
) |
|
2010 |
|
0-1 years |
|
1-2 years |
|
2-3 years |
|
3-4 years |
|
4-5 years |
|
5-10 years |
|
10-20 years |
|
Over 20 |
|
Total |
|
|||||||||
|
Hedged forecast cash flows expected to occur: |
|
|
|
|
|
|
|
|
|
|
|
|
|
|
|
|
|
|
|
|
|
|
|
|
|
|
|
|
|
Forecast receivable cash flows |
|
|
223 |
|
|
328 |
|
|
560 |
|
|
434 |
|
|
310 |
|
|
451 |
|
|
445 |
|
|
160 |
|
|
2,911 |
|
|
Forecast payable cash flows |
|
|
(70 |
) |
|
(44 |
) |
|
(165 |
) |
|
(93 |
) |
|
(67 |
) |
|
(616 |
) |
|
(916 |
) |
|
(200 |
) |
|
(2,171 |
) |
|
Hedged forecast cash flows affect profit or loss: |
|
|
|
|
|
|
|
|
|
|
|
|
|
|
|
|
|
|
|
|
|
|
|
|
|
|
|
|
|
Forecast receivable cash flows |
|
|
223 |
|
|
445 |
|
|
443 |
|
|
434 |
|
|
310 |
|
|
466 |
|
|
435 |
|
|
155 |
|
|
2,911 |
|
|
Forecast payable cash flows |
|
|
(70 |
) |
|
(97 |
) |
|
(113 |
) |
|
(93 |
) |
|
(67 |
) |
|
(675 |
) |
|
(884 |
) |
|
(172 |
) |
|
(2,171 |
) |
There were no transactions for which cash flow hedge accounting had to be ceased in 2011 or 2010 as a result of the highly probable cash flows no longer being expected to occur.
|
|
|
|
|
|
|
|
|
|
NOTE 20: LOANS AND ADVANCES TO BANKS |
|
|
|
|
|
|
|
|
|
|||||||
|
|
|
|
2011 |
|
|
2010 |
|
|
|
|
|
£m |
|
|
£m |
|
|
Lending to banks |
|
|
1,810 |
|
|
1,042 |
|
|
Money market placements with banks |
|
|
30,810 |
|
|
29,250 |
|
|
Total loans and advances to banks before allowance for impairment losses |
|
|
32,620 |
|
|
30,292 |
|
|
Allowance for impairment losses (note 25) |
|
|
(14 |
) |
|
(20 |
) |
|
Total loans and advances to banks |
|
|
32,606 |
|
|
30,272 |
|
Included in the amounts reported above are reverse repurchase agreements treated as collateralised loans with a carrying value of £508 million (2010: £4,185 million). Collateral is held with a fair value of £511 million (2010: £3,909 million), all of which the Group is able to repledge.
Included in the amounts reported above in 2010 are collateral balances in the form of cash provided in respect of reverse repurchase agreements amounting to £4 million.
F-47
NOTES TO THE CONSOLIDATED FINANCIAL STATEMENTS
|
|
|
|
|
|
|
|
|
|
NOTE 21: LOANS AND ADVANCES TO CUSTOMERS |
|
|
|
|
|
|
|
|
|
|
|
2011 |
|
|
2010 |
|
|
|
|
|
£m |
|
|
£m |
|
|
Agriculture, forestry and fishing |
|
|
5,198 |
|
|
5,558 |
|
|
Energy and water supply |
|
|
4,013 |
|
|
3,576 |
|
|
Manufacturing |
|
|
10,061 |
|
|
11,495 |
|
|
Construction |
|
|
9,722 |
|
|
7,904 |
|
|
Transport, distribution and hotels |
|
|
32,882 |
|
|
34,176 |
|
|
Postal and telecommunications |
|
|
1,896 |
|
|
1,908 |
|
|
Property companies |
|
|
64,752 |
|
|
78,263 |
|
|
Financial, business and other services |
|
|
64,046 |
|
|
59,363 |
|
|
Personal: |
|
|
|
|
|
|
|
|
Mortgages |
|
|
348,210 |
|
|
356,261 |
|
|
Other |
|
|
30,014 |
|
|
36,967 |
|
|
Lease financing |
|
|
7,800 |
|
|
8,291 |
|
|
Hire purchase |
|
|
5,776 |
|
|
7,208 |
|
|
Total loans and advances to customers before allowance for impairment losses |
|
|
584,370 |
|
|
610,970 |
|
|
Allowance for impairment losses (note 25) |
|
|
(18,732 |
) |
|
(18,373 |
) |
|
Total loans and advances to customers |
|
|
565,638 |
|
|
592,597 |
|
Included in the amounts reported above are reverse repurchase agreements treated as collateralised loans with a carrying value of £16,835 million (2010: £3,096 million). Collateral is held with a fair value of £16,936 million (2010: £2,987 million), all of which the Group is able to repledge. Included within this are collateral balances in the form of cash provided in respect of reverse repurchase agreements amounting to £34 million (2010: £42 million).
Loans and advances to customers include finance lease receivables, which may be analysed as follows:
|
|
|
|
|
|
|
|
|
|
|
|
|
2011 |
|
|
2010 |
|
|
|
|
|
£m |
|
|
£m |
|
|
Gross investment in finance leases, receivable: |
|
|
|
|
|
|
|
|
Not later than 1 year |
|
|
1,168 |
|
|
1,358 |
|
|
Later than 1 year and not later than 5 years |
|
|
2,754 |
|
|
2,522 |
|
|
Later than 5 years |
|
|
6,355 |
|
|
7,218 |
|
|
|
|
|
10,277 |
|
|
11,098 |
|
|
Unearned future finance income on finance leases |
|
|
(2,391 |
) |
|
(2,603 |
) |
|
Rentals received in advance |
|
|
(56 |
) |
|
(183 |
) |
|
Commitments for expenditure in respect of equipment to be leased |
|
|
(30 |
) |
|
(21 |
) |
|
Net investment in finance leases |
|
|
7,800 |
|
|
8,291 |
|
|
|
|
|
|
|
|
|
|
|
The net investment in finance leases represents amounts recoverable as follows: |
|||||||
|
|
|
|
|
|
|
|
|
|
|
|
|
2011 |
|
|
2010 |
|
|
|
|
|
£m |
|
|
£m |
|
|
Not later than 1 year |
|
|
724 |
|
|
986 |
|
|
Later than 1 year and not later than 5 years |
|
|
2,307 |
|
|
1,965 |
|
|
Later than 5 years |
|
|
4,769 |
|
|
5,340 |
|
|
Net investment in finance leases |
|
|
7,800 |
|
|
8,291 |
|
Equipment leased to customers under finance leases primarily relates to structured financing transactions to fund the purchase of aircraft, ships and other large individual value items. During 2011 and 2010 no contingent rentals in respect of finance leases were recognised in the income statement. The allowance for uncollectable finance lease receivables included in the allowance for impairment losses is £92 million (2010: £287 million).
The unguaranteed residual values included in finance lease receivables were as follows:
|
|
|
|
|
|
|
|
|
|
|
|
|
2011 |
|
|
2010 |
|
|
|
|
|
£m |
|
|
£m |
|
|
Not later than 1 year |
|
|
56 |
|
|
45 |
|
|
Later than 1 year and not later than 5 years |
|
|
137 |
|
|
101 |
|
|
Later than 5 years |
|
|
20 |
|
|
20 |
|
|
Total unguaranteed residual values |
|
|
213 |
|
|
166 |
|
F-48
NOTES TO THE CONSOLIDATED FINANCIAL STATEMENTS
NOTE 22: SECURITISATIONS AND COVERED BONDS
SECURITISATION PROGRAMMES
Loans and advances to customers and debt securities classified as loans and receivables include loans securitised under the Group’s securitisation programmes, the majority of which have been sold by subsidiary companies to bankruptcy remote special purpose entities (SPEs). As the SPEs are funded by the issue of debt on terms whereby the majority of the risks and rewards of the portfolio are retained by the subsidiary, the SPEs are consolidated fully and all of these loans are retained on the Group’s balance sheet, with the related notes in issue included within debt securities in issue. In addition to the SPEs described below, the Group sponsors three conduit programmes, Argento, Cancara and Grampian.
COVERED BOND PROGRAMMES
Certain loans and advances to customers have been assigned to bankruptcy remote limited liability partnerships to provide security for issues of covered bonds by the Group. The Group retains all of the risks and rewards associated with these loans and the partnerships are consolidated fully with the loans retained on the Group’s balance sheet and the related covered bonds in issue included within debt securities in issue.
The Group’s principal securitisation and covered bond programmes, together with the balances of the advances subject to these arrangements and the carrying value of the notes in issue at 31 December, are listed below. The notes in issue are reported in note 37.
|
|
|
|
|
|
|
|
|
|
|
|
|
|
|
|
|
|
|
|
|
2011 |
|
2010 |
|
|||||||||||
|
|
|
Loans and |
|
|
Notes |
|
Loans and |
|
|
Notes |
|
|||||
|
Securitisation programmes1 |
|
|
|
|
|
|
|
|
|
|
|
|
|
|
|
|
|
UK residential mortgages |
|
|
129,764 |
|
|
|
94,080 |
|
|
|
146,200 |
|
|
|
114,428 |
|
|
US residential mortgage-backed securities |
|
|
398 |
|
|
|
398 |
|
|
|
— |
|
|
|
— |
|
|
Commercial loans |
|
|
13,313 |
|
|
|
11,342 |
|
|
|
11,860 |
|
|
|
8,936 |
|
|
Irish residential mortgages |
|
|
5,497 |
|
|
|
5,661 |
|
|
|
6,007 |
|
|
|
6,191 |
|
|
Credit card receivables |
|
|
6,763 |
|
|
|
4,810 |
|
|
|
7,327 |
|
|
|
3,856 |
|
|
Dutch residential mortgages |
|
|
4,933 |
|
|
|
4,777 |
|
|
|
4,526 |
|
|
|
4,316 |
|
|
Personal loans |
|
|
— |
|
|
|
— |
|
|
|
3,012 |
|
|
|
2,011 |
|
|
PFI/PPP and project finance loans |
|
|
767 |
|
|
|
110 |
|
|
|
776 |
|
|
|
110 |
|
|
Motor vehicle loans |
|
|
3,124 |
|
|
|
2,871 |
|
|
|
926 |
|
|
|
975 |
|
|
|
|
|
164,559 |
|
|
|
124,049 |
|
|
|
180,634 |
|
|
|
140,823 |
|
|
Less held by the Group |
|
|
|
|
|
|
(86,637 |
) |
|
|
|
|
|
|
(100,081 |
) |
|
Total securitisation programmes (note 37) |
|
|
|
|
|
|
37,412 |
|
|
|
|
|
|
|
40,742 |
|
|
Covered bond programmes |
|
|
|
|
|
|
|
|
|
|
|
|
|
|
|
|
|
Residential mortgage-backed |
|
|
91,023 |
|
|
|
67,456 |
|
|
|
93,651 |
|
|
|
73,458 |
|
|
Social housing loan-backed |
|
|
3,363 |
|
|
|
2,605 |
|
|
|
3,317 |
|
|
|
2,181 |
|
|
|
|
|
94,386 |
|
|
|
70,061 |
|
|
|
96,968 |
|
|
|
75,639 |
|
|
Less held by the Group |
|
|
|
|
|
|
(31,865 |
) |
|
|
|
|
|
|
(43,489 |
) |
|
Total covered bond programmes (note 37) |
|
|
|
|
|
|
38,196 |
|
|
|
|
|
|
|
32,150 |
|
|
Total securitisation and covered bond programmes |
|
|
|
|
|
|
75,608 |
|
|
|
|
|
|
|
72,892 |
|
|
|
|
|
1 |
Includes securitisations utilising a combination of external funding and credit default swaps. |
Cash deposits of £20,435 million (2010: £36,579 million) held by the Group are restricted in use to repayment of the debt securities issued by the SPEs, the term advances relating to covered bonds and other legal obligations.
F-49
NOTES TO THE CONSOLIDATED FINANCIAL STATEMENTS
NOTE 23: SPECIAL PURPOSE ENTITIES
In addition to the special purpose entities discussed in note 22, which are used for securitisation and covered bond programmes, the Group sponsors three asset-backed conduits, Argento, Cancara and Grampian, which invest in debt securities and client receivables. All the external assets in these conduits are consolidated in the Group’s financial statements and are included in the credit market exposures set out in note 56. The total consolidated exposures in these conduits are set out in the table below:
|
|
|
|
|
|
|
|
|
|
|
|
|
|
|
|
|
|
|
|
|
|
Argento |
|
|
|
Cancara |
|
|
|
Grampian |
|
|
|
Total |
|
|
|
|
|
£m |
|
|
|
£m |
|
|
|
£m |
|
|
|
£m |
|
|
At 31 December 2011 |
|
|
|
|
|
|
|
|
|
|
|
|
|
|
|
|
|
Loans and advances |
|
|
130 |
|
|
|
3,962 |
|
|
|
73 |
|
|
|
4,165 |
|
|
Debt securities classified as loans and receivables (note 24): |
|
|
|
|
|
|
|
|
|
|
|
|
|
|
|
|
|
Asset-backed securities |
|
|
1,022 |
|
|
|
— |
|
|
|
2,004 |
|
|
|
3,026 |
|
|
Corporate and other debt securities |
|
|
— |
|
|
|
— |
|
|
|
— |
|
|
|
— |
|
|
|
|
|
1,022 |
|
|
|
— |
|
|
|
2,004 |
|
|
|
3,026 |
|
|
Debt securities classified as available-for-sale financial assets (note 26): |
|
|
|
|
|
|
|
|
|
|
|
|
|
|
|
|
|
Asset-backed securities |
|
|
733 |
|
|
|
21 |
|
|
|
796 |
|
|
|
1,550 |
|
|
Corporate and other debt securities |
|
|
73 |
|
|
|
— |
|
|
|
— |
|
|
|
73 |
|
|
|
|
|
806 |
|
|
|
21 |
|
|
|
796 |
|
|
|
1,623 |
|
|
Total assets |
|
|
1,958 |
|
|
|
3,983 |
|
|
|
2,873 |
|
|
|
8,814 |
|
|
At 31 December 2010 |
|
|
|
|
|
|
|
|
|
|
|
|
|
|
|
|
|
Loans and advances |
|
|
— |
|
|
|
3,957 |
|
|
|
— |
|
|
|
3,957 |
|
|
Debt securities classified as loans and receivables (note 24): |
|
|
|
|
|
|
|
|
|
|
|
|
|
|
|
|
|
Asset-backed securities |
|
|
1,448 |
|
|
|
— |
|
|
|
6,957 |
|
|
|
8,405 |
|
|
Corporate and other debt securities |
|
|
202 |
|
|
|
— |
|
|
|
— |
|
|
|
202 |
|
|
|
|
|
1,650 |
|
|
|
— |
|
|
|
6,957 |
|
|
|
8,607 |
|
|
Debt securities classified as available-for-sale financial assets (note 26): |
|
|
|
|
|
|
|
|
|
|
|
|
|
|
|
|
|
Asset-backed securities |
|
|
1,436 |
|
|
|
2,587 |
|
|
|
— |
|
|
|
4,023 |
|
|
Corporate and other debt securities |
|
|
463 |
|
|
|
— |
|
|
|
— |
|
|
|
463 |
|
|
|
|
|
1,899 |
|
|
|
2,587 |
|
|
|
— |
|
|
|
4,486 |
|
|
Total assets |
|
|
3,549 |
|
|
|
6,544 |
|
|
|
6,957 |
|
|
|
17,050 |
|
OTHER SPECIAL PURPOSE ENTITIES
During 2009, the Group established Lloyds TSB Pension ABCS (No 1) LLP and Lloyds TSB Pension ABCS (No 2) LLP and transferred approximately £5 billion of assets, primarily comprising notes in certain of the Group’s securitisation programmes, in aggregate to these entities. Further details are provided in note 43.
NOTE 24: DEBT SECURITIES CLASSIFIED AS LOANS AND RECEIVABLES
Debt securities accounted for as loans and receivables comprise:
|
|
|
|
|
|
|
|
|
|
|
|
|
2011 |
|
|
2010 |
|
|
|
|
|
£m |
|
|
£m |
|
|
Asset-backed securities: |
|
|
|
|
|
|
|
|
Mortgage-backed securities |
|
|
7,179 |
|
|
11,650 |
|
|
Other asset-backed securities |
|
|
5,030 |
|
|
12,827 |
|
|
Corporate and other debt securities |
|
|
537 |
|
|
1,816 |
|
|
Total debt securities classified as loans and receivables before allowance for impairment losses |
|
|
12,746 |
|
|
26,293 |
|
|
Allowance for impairment losses (note 25) |
|
|
(276 |
) |
|
(558 |
) |
|
Total debt securities classified as loans and receivables |
|
|
12,470 |
|
|
25,735 |
|
For amounts included above which are subject to repurchase agreements see note 56.
F-50
NOTES TO THE CONSOLIDATED FINANCIAL STATEMENTS
|
|
|
|
|
|
|
|
|
|
|
|
|
|
|
|