WESTERN NEW ENGLAND BANCORP, INC. 8-K
Exhibit 99.1
| |
For further information contact:
James C. Hagan, President and CEO
Guida R. Sajdak, Executive Vice President and
CFO
Meghan Hibner, Vice President
and Investor Relations Officer
413-568-1911
|
WESTERN NEW ENGLAND
BANCORP, INC. REPORTS RESULTS FOR THE THREE MONTHS AND
YEAR ENDED DECEMBER 31, 2022 AND ANNOUNCES
17% INCREASE IN QUARTERLY CASH DIVIDEND
Westfield, Massachusetts, January 24,
2023: Western New England Bancorp, Inc. (the “Company” or “WNEB”) (NasdaqGS: WNEB), the holding company
for Westfield Bank (the “Bank”), announced today the unaudited results of operations for the three and twelve months
ended December 31, 2022. For the three months ended December 31, 2022, the Company reported net income of $9.0 million, or $0.42
per diluted share, compared to net income of $6.2 million, or $0.28 per diluted share, for the three months ended December 31,
2021. On a linked quarter basis, net income was $9.0 million, or $0.42 per diluted share, as compared to net income of $6.0 million,
or $0.28 per diluted share, for the three months ended September 30, 2022. For the twelve months ended December 31, 2022, net income
was $25.9 million, or $1.18 per diluted share, compared to net income of $23.7 million, or $1.02 per diluted share, for the twelve
months ended December 31, 2021.
The Company also announced today that the
Board of Directors declared a quarterly cash dividend of $0.07 per share on its common stock, representing an increase of $0.01
per share, or 17%, as compared to the prior quarter. The dividend will be payable on or about February 22, 2023 to shareholders
of record on February 8, 2023.
James Hagan, President and Chief Executive
Officer, commented, “We are very pleased to report that the Company delivered record earnings for the fourth quarter along
with concrete earnings for 2022, with an increasing net interest margin, strong revenue and a lower efficiency ratio derived from
solid loan growth across all loan segments. As a Company, we have continued to focus on expanding and attracting new loan and core
deposit relationships in our existing and expanded markets, which resulted in loan growth coming in ahead of internal targets on
a quarterly and annual basis. As a result of these continuing efforts, for the year-ended December 31, 2022, average non-interest
bearing demand deposits represented 28.6% of total average deposits. With our strong balance sheet, combined with rising interest
rates, and with the deployment of excess liquidity to fund our loan growth, we are pleased to report a higher net interest margin
of 3.44% for the fourth quarter 2022 as compared to September 30, 2022. As the Paycheck Protection Program (“PPP”)
comes to an end, the Company generated year-over-year net interest income growth of 8.3%, overcoming a $6.0 million, or 89.2%,
decrease in PPP interest and fee income, by increasing total loans, excluding PPP loans, by $149.7 million, or 8.1%, from December
31, 2021.”
Hagan concluded, “We continue
to see opportunities to add to our earnings and remain committed to continued growth while managing the risks associated with inflationary
pressures and potential disruption in financial markets. We will continue to remain focused on increasing efficiencies, maintaining
our strong asset quality, prudently growing our loan portfolio and managing funding costs in a competitive environment.
This was a remarkable year for our Company
as we once again continued to achieve solid annual earnings, net interest income expansion and increasing loan growth. We could
not be more proud of our team who executed and delivered to achieve these excellent 2022 results. We remain optimistic about the
Company’s future as we enter 2023.”
Key Highlights:
Loans and Deposits. At December
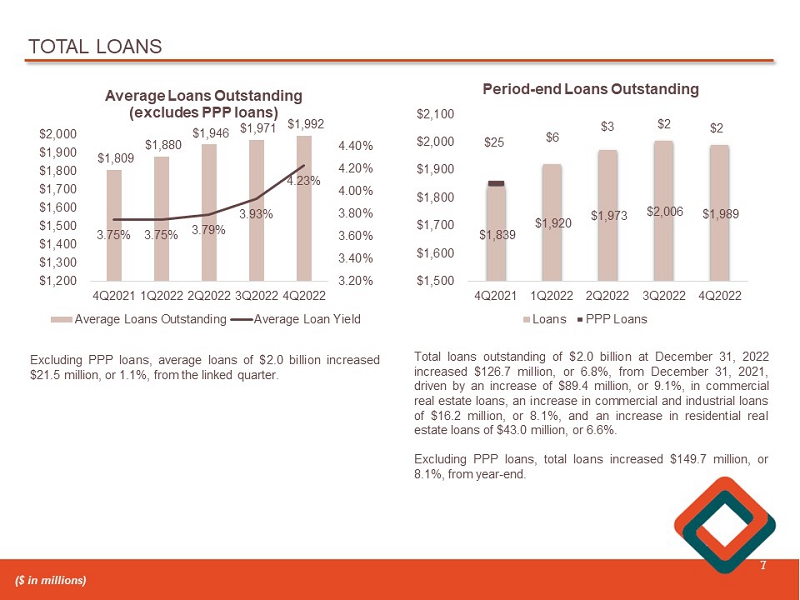
31, 2022, total loans of $2.0 billion increased $126.7 million, or 6.8%, from December 31, 2021. During the same period, excluding
PPP loans, total loans increased $149.7 million, or 8.1%, from $1.9 billion at December 31, 2021. The increase in total loans was
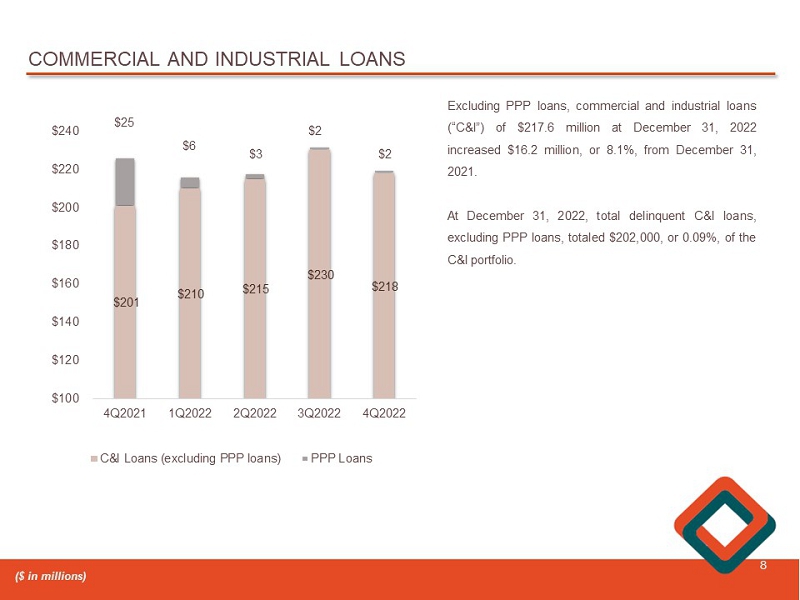
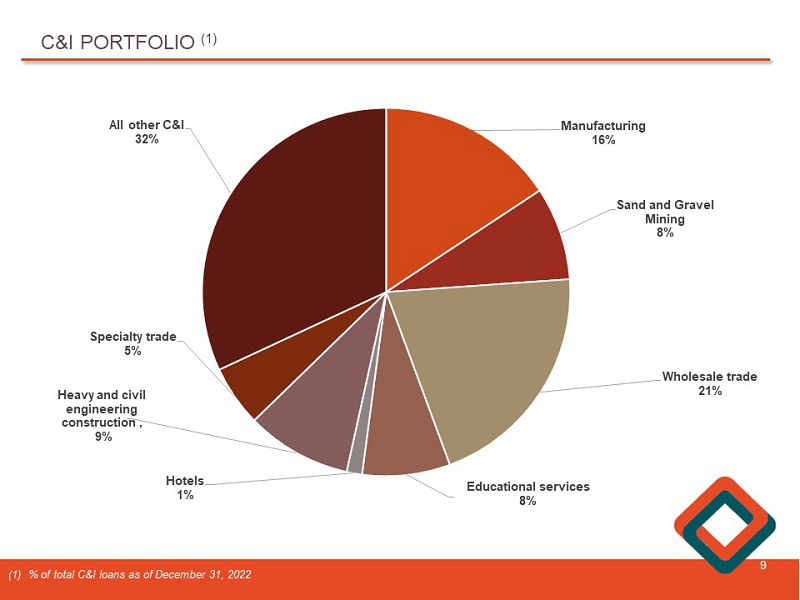
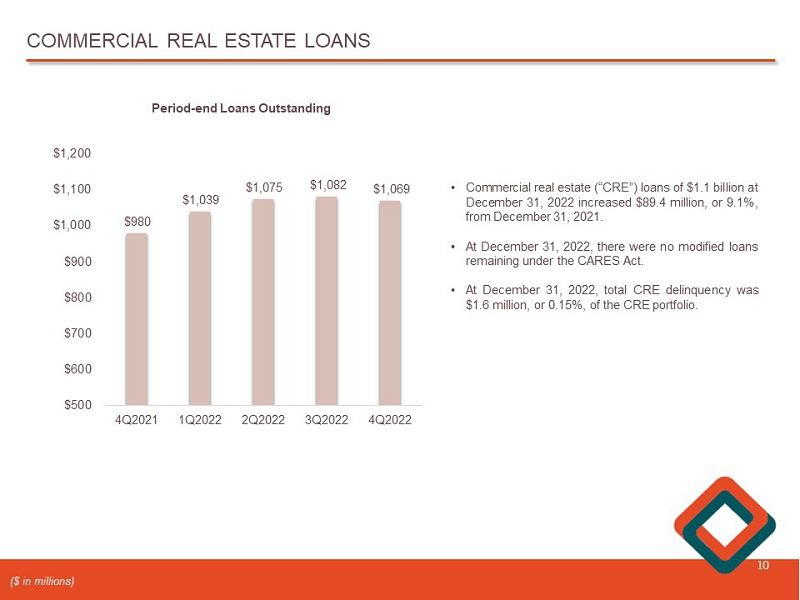
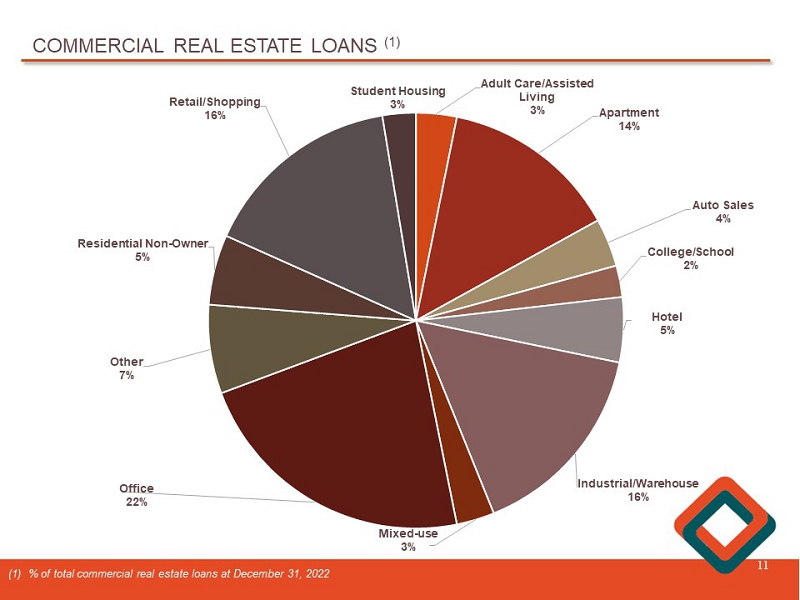
due to an increase in commercial real estate loans of $89.4 million, or 9.1%, an increase in commercial and industrial loans of
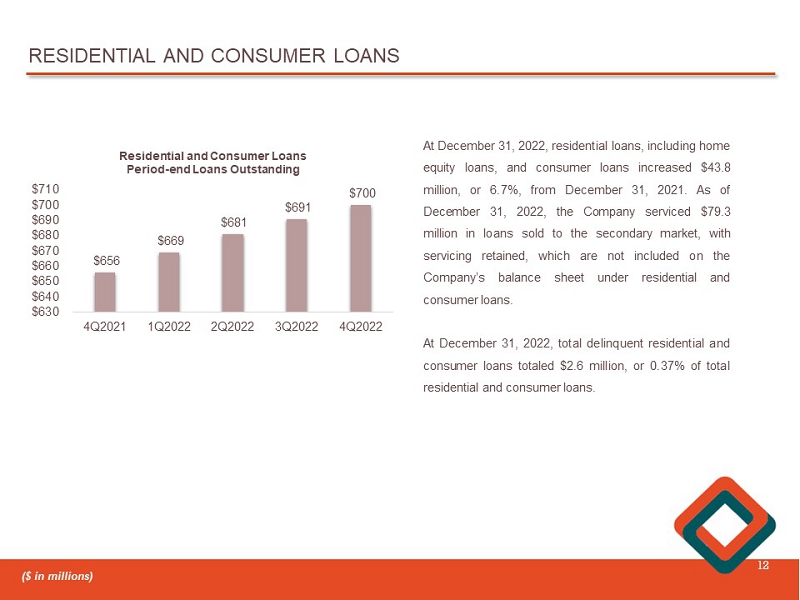
$16.2 million, or 8.1%, and an increase in residential real estate loans, including home equity loans, of $43.0 million, or 6.6%.
At December 31, 2022, total deposits were
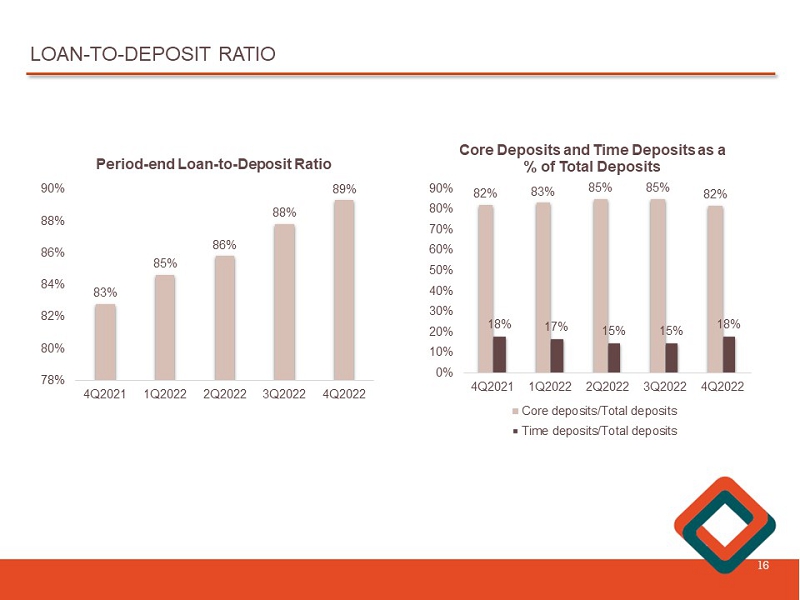
$2.2 billion, a decrease of $27.5 million, or 1.2%, from December 31, 2021. Core deposits, which the Company defines as all deposits
except time deposits, decreased $37.1 million, or 2.0%, from $1.9 billion, or 82.2% of total deposits, at December 31, 2021, to
$1.8 billion, or 81.5% of total deposits at December 31, 2022. The loan to deposit ratio increased from 82.6% at December 31, 2021
to 89.3% at December 31, 2022.
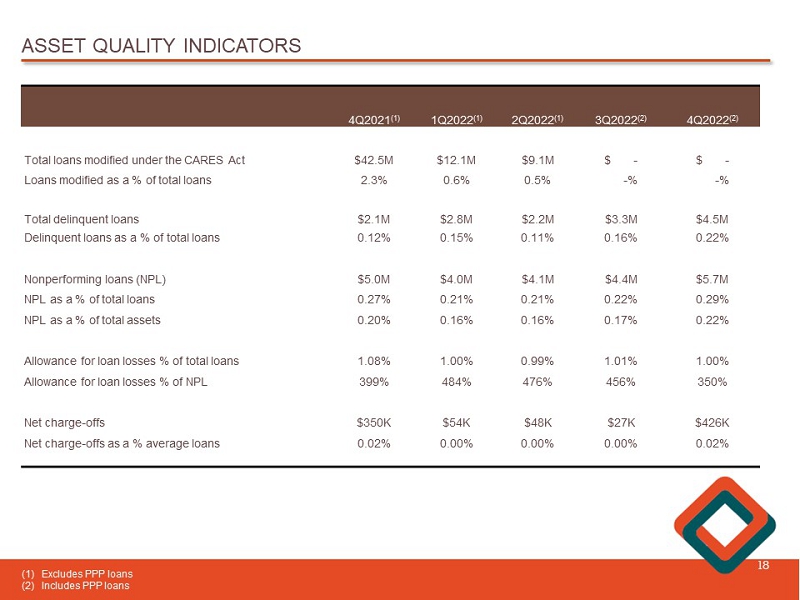
Allowance for Loan Losses and Credit
Quality. At December 31, 2022, the allowance for loan losses as a percentage of total loans and as a percentage of nonperforming
loans was 1.00% and 350.0%, respectively. At December 31, 2022, nonperforming loans totaled $5.7 million, or 0.29% of total loans,
compared to $5.0 million, or 0.27% of total loans, at December 31, 2021. Total delinquency increased $2.3 million, or 108.8%, from
$2.1 million, or 0.11% of total loans, at December 31, 2021 to $4.5 million, or 0.22% of total loans, at December 31, 2022.
Net Interest Margin. The net interest
margin was 3.44% for the three months ended December 31, 2022 compared to 3.08% for the three months ended December 31, 2021 and
3.35% for the three months ended September 30, 2022. The net interest margin, on a tax-equivalent basis, was 3.47% for the three
months ended December 31, 2022, compared to 3.10% for the three months ended December 31, 2021 and 3.37% for the three months ended
September 30, 2022.
Repurchases. On October 13, 2022,
the Company announced the completion of its previously authorized stock repurchase plan (the “2021 Plan”) pursuant
to which the Company was authorized to repurchase up to 2.4 million shares, or 10% of its outstanding common stock, as of the date
the 2021 Plan was adopted. On July 26, 2022, the Board of Directors authorized a new stock repurchase plan (the “2022 Plan”),
pursuant to which the Company is authorized to repurchase up to 1.1 million shares, which is approximately 5.0% of the Company’s
outstanding common stock as of the date the 2022 Plan was adopted. During the three months ended December 31, 2022, the Company
repurchased 78,826 shares of common stock under the 2022 Plan and during the twelve months ended December 31, 2022, the Company
repurchased 720,975 shares of common stock under both the 2021 and 2022 Plans. As of December 31, 2022, there were 1,056,344 shares
of common stock available for repurchase under the 2022 Plan.
The shares of common stock repurchased
under the 2022 Plan will be purchased from time to time at prevailing market prices, through open market or privately negotiated
transactions, or otherwise, depending upon market conditions. There is no guarantee as to the exact number, or value, of shares
that will be repurchased by the Company, and the Company may discontinue repurchases at any time that management determines additional
repurchases are not warranted. The timing and amount of additional share repurchases under the 2022 Plan will depend on a number
of factors, including the Company’s stock price performance, ongoing capital planning considerations, general market conditions,
and applicable legal requirements.
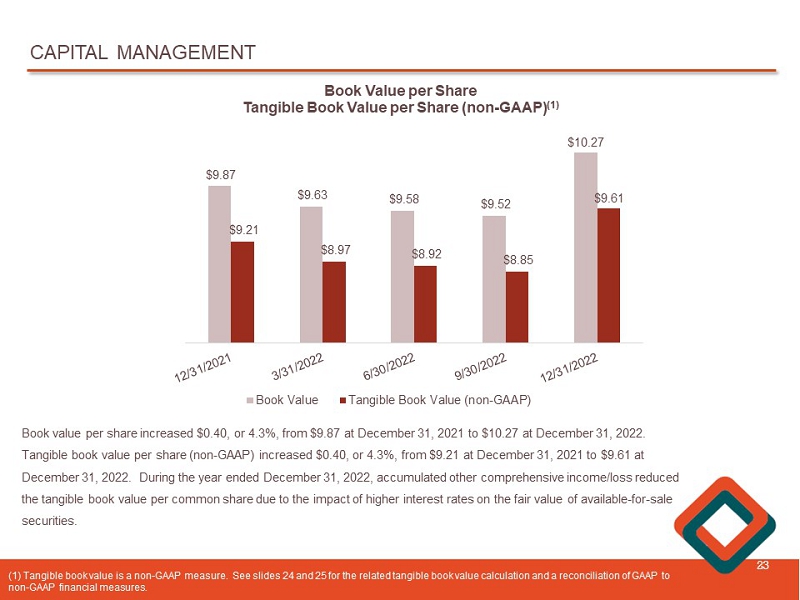
Capital Management. The Company’s
book value per share was $10.27 at December 31, 2022 compared to $9.87 at December 31, 2021, while tangible book value per share,
a non-GAAP financial measure, increased $0.40, or 4.3%, from $9.21 at December 31, 2021 to $9.61 at December 31, 2022. Reflected
in the book value and tangible book value changes during the year ended December 31, 2022 are the Federal Reserve’s 425 basis
points interest rate increases, which resulted in significant changes in unrealized gains and losses on investment securities.
Such unrealized gains and losses are generally due to changes in interest rates and represent the difference, net of applicable
income tax effect, between the estimated fair value and amortized cost of investment securities classified as available-for-sale.
The Company had no other-than-temporary impairment charges in its investment portfolio in 2022 or 2021. Tangible book value is
a non-GAAP measure. See pages 17-20 for the related tangible book value calculation and a reconciliation of GAAP to non-GAAP financial
measures.
Pension Plan. On October 31, 2022,
the Board of Director’s previously approved termination of the Westfield Bank Defined Benefit Pension Plan (“DB Plan”)
became effective, subject to regulatory approvals. Once the Company has received regulatory approval to terminate the DB Plan,
which is expected in the first quarter of 2023, the Company will make an additional cash contribution during the second quarter
of 2023, if necessary, in order to fully fund the DB Plan on a plan termination basis, followed by the purchase of annuity contracts
to transfer its remaining liabilities under the DB Plan, for those participants who do not opt for a one-time lump sum payment.
The actual amount of this cash contribution, if any, will depend upon the nature and timing of participant settlements, as well
as prevailing market conditions. At December 31, 2022, the Company reversed $7.3 million in net unrealized losses recorded in accumulated
other comprehensive income attributed to both the DB plan curtailment resulting from the termination of the DB Plan as well as
changes in discount rates. In addition, the Company recorded a gain on curtailment of $2.8 million through non-interest income.
The improvement in book value and tangible book value for the three months ended December 31, 2022 were primarily related to the
termination of the DB Plan.
Net Income for the Three Months Ended
December 31, 2022 Compared to the Three Months Ended September 30, 2022.
The Company reported net income of $9.0
million, or $0.42 per diluted share, for the three months ended December 31, 2022, compared to net income of $6.0 million, or $0.28
per diluted share, for the three months ended September 30, 2022. Net interest income increased $566,000, or 2.8%, non-interest
income increased $3.1 million, or 118.3%, and non-interest expense decreased $340,000, or 2.4%, while the provision for loan losses
decreased $525,000, or 77.8%, during the same period. Return on average assets and return on average equity were 1.40% and 16.67%,
respectively, for the three months ended December 31, 2022, compared to 0.93% and 10.90%, respectively, for the three months ended
September 30, 2022.
Net Interest Income and Net Interest
Margin
On a sequential quarter basis, net interest
income increased $566,000, or 2.8%, to $20.9 million for the three months ended December 31, 2022, from $20.3 million for the three
months ended September 30, 2022. The increase in net interest income was primarily due to an increase in interest and dividend
income of $1.8 million, or 8.4%, partially offset by an increase in interest expense of $1.3 million, or 86.3%. During the three
months ended December 31, 2022 and the three months ended September 30, 2022, interest and dividend income included PPP interest
and fee income (“PPP income”) of $18,000 and $19,000, respectively. During the three months ended December 31, 2022
and the three months ended September 30, 2022, the Company recognized prepayment penalties of $134,000 and $99,000, respectively.
During the three months ended December 31, 2022, the Company also recorded $87,000 in positive purchase accounting adjustments,
compared to $16,000 in negative purchase accounting adjustments during the three months ended September 30, 2022.
The net interest margin was 3.44% for the
three months ended December 31, 2022 compared to 3.35% for the three months ended September 30, 2022. The net interest margin,
on a tax-equivalent basis, was 3.47% for the three months ended December 31, 2022, compared to 3.37% for the three months ended
September 30, 2022. The average yield on interest-earning assets was 3.90% for the three months ended December 31, 2022, compared
to 3.59% for the three months ended September 30, 2022. The average loan yield was 4.23% for the three months ended December 31,
2022, compared to 3.93% for the three months ended September 30, 2022.
During the three months ended December
31, 2022, average interest-earning assets increased $143,000 to $2.4 billion, primarily due to an increase in average loans of
$21.3 million, or 1.1%, partially offset by a decrease in short-term investments of $6.3 million, or 45.3%, and a decrease in average
securities of $15.5 million, or 3.8%.
The average cost of total funds, including
non-interest bearing accounts and borrowings, increased 22 basis points from 0.25% for the three months ended September 30, 2022
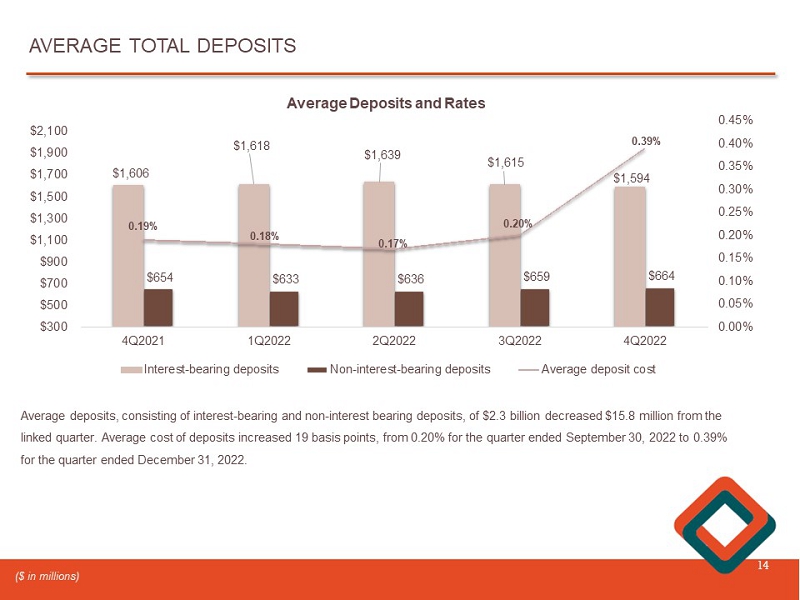
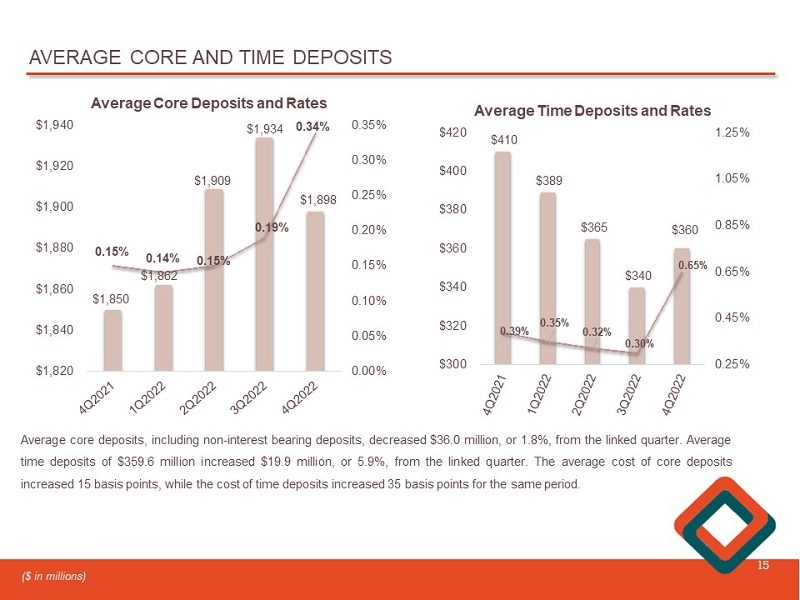
to 0.47% for the three months ended December 31, 2022. The average cost of core deposits, including non-interest bearing demand
deposits, increased 15 basis point to 0.34% for the three months ended December 31, 2022, from 0.19% for the three months ended
September 30, 2022. The average cost of time deposits increased 35 basis points from 0.30% for the three months ended September
30, 2022 to 0.65% for the three months ended December 31, 2022. The rising interest rate environment has affected costs for both
money market accounts and time deposits.
The average cost of borrowings, including
subordinated debt, increased 17 basis points from 4.12% for the three months ended September 30, 2022 to 4.29% for the three months
ended December 31, 2022. Average demand deposits, an interest-free source of funds, increased $5.0 million, or 0.8%, from $658.9
million, or 29.0% of total average deposits, for the three months ended September 30, 2022, to $663.8 million, or 29.4% of total
average deposits, for the three months ended December 31, 2022.
Provision for Loan Losses
During the three months ended December
31, 2022, the provision for loan losses decreased $525,000, or 77.8%, from the three months ended September 30, 2022. Management
continues to assess the exposure of the Company’s loan portfolio to the COVID-19 pandemic, economic trends and their potential
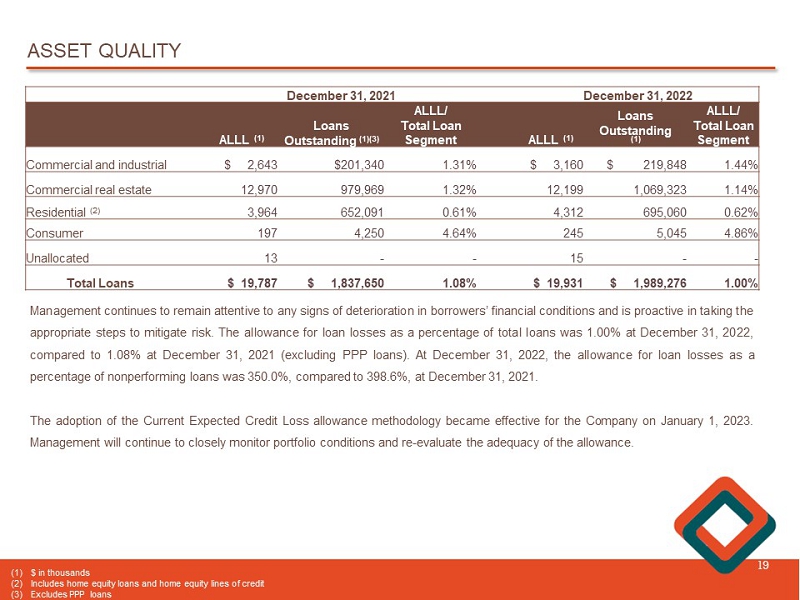
effect on asset quality. The adoption of the Current Expected Credit Loss allowance methodology became effective for the Company
on January 1, 2023. Management will continue to closely monitor portfolio conditions and re-evaluate the adequacy of the allowance.
The Company recorded net charge-offs of
$426,000 for the three months ended December 31, 2022, as compared to net charge-offs of $27,000 for the three months ended September
30, 2022. At December 31, 2022, nonperforming loans totaled $5.7 million, or 0.29% of total loans, and total delinquency as a percentage
of total loans was 0.22%.
Non-Interest Income
On a sequential quarter basis, non-interest
income increased $3.1 million, or 118.3%, to $5.7 million for the three months ended December 31, 2022, from $2.6 million for the
three months ended September 30, 2022. Service charges and fees increased $106,000, or 4.8%, from the three months ended September
30, 2022 to $2.3 million for the three months ended December 31, 2022. Income from bank-owned life insurance increased $37,000,
or 9.5%, from the three months ended September 30, 2022 to $428,000 for the three months ended December 31, 2022.
The termination of the DB Plan became effective
October 31, 2022, subject to regulatory approvals, with final settlement occurring in the second quarter of 2023. During the three
months ended December 31, 2022, the Company recorded a curtailment gain related to the DB Plan termination of $2.8 million through
non-interest income. During the three months ended December 31, 2022, the Company reported unrealized gains on marketable equity
securities of $19,000, compared to unrealized losses of $235,000 for the three months ended September 30, 2022. During the three
months ended December 31, 2022, the Company also reported a gain of $70,000 on non-marketable equity investments, compared to a
gain of $211,000 during the three months ended September 30, 2022. Gains and losses from the investment portfolio vary from quarter
to quarter based on market conditions, as well as the related yield curve and valuation changes.
Non-Interest Expense
For the three months ended December 31,
2022, non-interest expense decreased $340,000, or 2.4%, to $14.0 million from the three months ended September 30, 2022. Salaries
and employee benefits increased $172,000, or 2.1%, to $8.2 million, primarily related to higher incentive compensation accruals,
data processing expense increased $17,000, or 2.4%, and furniture and equipment expense increased $14,000, or 3.0%. These increases
were partially offset by a decrease in advertising expense of $241,000, or 57.5%, a decrease in professional fees of $186,000,
or 23.2%, a decrease in FDIC insurance expense of $18,000, or 6.6%, a decrease in occupancy expense of $8,000, or 0.7%, and a decrease
in other non-interest expense of $90,000, or 3.7%. For the three months ended December 31, 2022, the efficiency ratio was 52.8%,
compared to 62.7% for September 30, 2022. For the three months ended December 31, 2022, the adjusted efficiency ratio, a non-GAAP
financial measure, was 59.3%, compared to 62.6% for the three months ended September 30, 2022. See pages 17-20 for the related
ratio calculation and a reconciliation of GAAP to non-GAAP financial measures.
Income Tax Provision
Income tax expense for the three months
ended December 31, 2022 was $3.3 million, or an effective tax rate of 26.9%, compared to $1.9 million, or an effective tax rate
of 23.7%, for the three months ended September 30, 2022.
Net Income for the Three Months Ended
December 31, 2022 Compared to the Three Months Ended December 31, 2021.
The Company reported net income of $9.0
million, or $0.42 per diluted share, for the three months ended December 31, 2022, compared to net income of $6.2 million, or $0.28
per diluted share, for the three months ended December 31, 2021. Return on average assets and return on average equity were 1.40%
and 16.67%, respectively, for the three months ended December 31, 2022, as compared to 0.97% and 11.22%, respectively, for the
three months ended December 31, 2021.
Net Interest Income and Net Interest
Margin
Net interest income increased $2.3 million,
or 12.2%, to $20.9 million, for the three months ended December 31, 2022, from $18.6 million for the three months ended December
31, 2021. The increase in net interest income was due to an increase in interest and dividend income of $3.7 million, or 18.4%,
partially offset by an increase in interest expense of $1.4 million, or 103.2%. Interest expense on deposits increased $1.1 million,
or 102.2%, and interest expense on borrowings increased $272,000. Net interest income for the three months ended December 31, 2022
includes PPP income of $18,000, compared to $973,000 during the three months ended December 31, 2021. During the same period, excluding
PPP income, net interest income increased $3.2 million, or 18.3%. During the three months ended December 31, 2022 and the three
months ended December 31, 2021, the Company recognized prepayment penalties of $134,000 and $21,000, respectively. In addition,
interest income for the three months ended December 31, 2022 includes $87,000 in positive purchase accounting adjustments, compared
to $31,000 in negative accounting adjustments for the three months ended December 31, 2021.
The net interest margin was 3.44% for the
three months ended December 31, 2022, compared to 3.08%, for the three months ended December 31, 2021. The net interest margin,
on a tax-equivalent basis, was 3.47% for the three months ended December 31, 2022, compared to 3.10% for the three months ended
December 31, 2021. The increase in the net interest margin was due to an increase in average loans outstanding of $144.7 million,
or 7.8%, a decrease in average securities of $13.3 million, or 3.3%, and a decrease in average short-term investments, consisting
of cash and cash equivalents, of $124.1 million, or 94.2%, from the three months ended December 31, 2021, compared to the three
months ended December 31, 2022.
The average yield on interest-earning assets
increased 60 basis points from 3.30% for the three months ended December 31, 2021 to 3.90% for the three months ended December
31, 2022. During the three months ended December 31, 2022, the average cost of funds, including non-interest-bearing demand accounts
and borrowings, increased 24 basis points, from 0.23% for the three months ended December 31, 2021 to 0.47% for the three months
ended December 31, 2022. The average cost of core deposits, which include non-interest-bearing demand accounts, increased 19 basis
points, from 0.15% for the three months ended December 31, 2021 to 0.34% for the three months ended December 31, 2022. The average
cost of time deposits increased 26 basis points from 0.39% for the three months ended December 31, 2021 to 0.65% for the three
months ended December 31, 2022. The average cost of borrowings, including subordinated debt, decreased 15 basis points from 4.44%
for the three months ended December 31, 2021 to 4.29% for the three months ended December 31, 2022. For the three months ended
December 31, 2022, average demand deposits, an interest-free source of funds, increased $9.5 million, or 1.4%, to $663.8 million,
or 29.4% of total average deposits, from $654.3 million, or 29.0% of total average deposits for the three months ended December
31, 2021.
During the three months ended December
31, 2022, average interest-earning assets increased $7.3 million, or 0.3%, to $2.4 billion compared to the three months ended December
31, 2021, primarily due to an increase in average loans of $144.7 million, or 7.8%, offset by a decrease in average short-term
investments, consisting of cash and cash equivalents, of $124.1 million, or 94.2%, and a decrease in average securities of $13.3
million, or 3.3%. Excluding average PPP loans, average interest-earning assets increased $48.8 million, or 2.1%, and average loans
increased $183.9 million, or 10.2%, from the three months ended December 31, 2021 to the three months ended December 31, 2022.
Provision for Loan Losses
The Company recorded a provision for loan
losses of $150,000 for three months ended December 31, 2022, compared to a provision for loan losses of $300,000 for the three
months ended December 31, 2021. The decrease in the provision for loan losses was primarily due to a reduction of qualitative adjustment
factors that had previously been increased in the allowance for credit losses related to the COVID-19 pandemic and the uncertainty
in the economic environment. The Company recorded net charge-offs of $426,000 for the three months ended December 31, 2022, as
compared to net charge-offs of $350,000 for the three months ended December 31, 2021. Management continues to assess the exposure
of the Company’s loan portfolio to the COVID-19 pandemic related factors, economic trends and their potential effect on asset
quality.
Non-Interest Income
Non-interest income increased $1.8 million,
or 46.6%, to $5.7 million for the three months ended December 31, 2022, from $3.9 million for the three months ended December 31,
2021. During the three months ended December 31, 2021, non-interest income included the recognition of $555,000 in bank-owned life
insurance (“BOLI”) death benefits. During the three months ended December 31, 2022, service charges and fees on deposits
increased $59,000, or 2.6%, and income from BOLI decreased $58,000, or 11.9%, from $486,000 for the three months ended December
31, 2021 to $428,000 for the three months ended December 31, 2022. During the three months ended December 31, 2021, the Company
reported $289,000 in mortgage banking income from the sale of fixed rate residential real estate loans. The Company did not sell
any loans to the secondary market during the three months ended December 31, 2022.
On October 31, 2022, the termination of
the DB Plan became effective, subject to regulatory approvals, with final settlement occurring in the second quarter of 2023. During
the three months ended December 31, 2022, the Company recorded a curtailment gain related to the DB Plan termination of $2.8 million
through non-interest income. Excluding the DB Plan termination curtailment gain and BOLI death benefits, non-interest income decreased
$455,000, or 13.8%. During the three months ended December 31, 2022, the Company reported a gain on non-marketable equity investments
of $70,000, compared to a gain of $352,000 during the three months ended December 31, 2021. In addition, the Company reported an
unrealized gain on marketable equity securities of $19,000 during the three months ended December 31, 2022, compared to an unrealized
loss on marketable equity securities of $96,000 during the three months ended December 31, 2021. Gains and losses from the investment
portfolio vary from quarter to quarter based on market conditions, as well as the related yield curve and valuation changes.
Non-Interest Expense
For the three months ended December 31,
2022, non-interest expense increased $80,000, or 0.6%, to $14.0 million, from $13.9 million for the three months ended December
31, 2021. The increase in non-interest expense was due to an increase in salaries and benefits expense of $4,000, an increase in
professional fees of $140,000, or 29.4%, an increase in occupancy expense of $74,000, or 6.5%, and an increase in FDIC insurance
expense of $53,000, or 26.2%. These increases were partially offset by a decrease in advertising expense of $84,000, or 32.1%,
a decrease in furniture and equipment expense of $69,000, or 12.6%, a decrease in data processing expense of $2,000, or 0.3%, and
a decrease in other non-interest expense of $36,000, or 1.5%.
For the three months ended December 31,
2022, the efficiency ratio was 52.8%, compared to 62.1% for the three months ended December 31, 2021. For the three months ended
December 31, 2022, the adjusted efficiency ratio, a non-GAAP financial measure, was 59.3%, compared to 64.4% for the three months
ended December 31, 2021. See pages 17-20 for the related efficiency ratio calculation and a reconciliation of GAAP to non-GAAP
financial measures.
Income Tax Provision
Income tax expense for the three months
ended December 31, 2022 was $3.3 million, representing an effective tax rate of 26.9%, compared to $2.0 million, representing an
effective tax rate of 24.3%, for three months ended December 31, 2021.
Net Income for the Twelve Months Ended
December 31, 2022 Compared to the Twelve Months Ended December 31, 2021
For the twelve months ended December 31,
2022, the Company reported net income of $25.9 million, or $1.18 per diluted share, compared to $23.7 million, or $1.02 per diluted
share, for the twelve months ended December 31, 2021. Return on average assets and return on average equity were 1.02% and 11.85%
for the twelve months ended December 31, 2022, respectively, compared to 0.96% and 10.64% for the twelve months ended December
31, 2021, respectively. Excluding PPP income and the gain on defined benefit curtailment as a result of the termination of the
DB Plan, income before provision and taxes increased $7.8 million, or 32.5%, from $24.0 million for the twelve months ended December
31, 2021 to $31.8 million for the twelve months ended December 31, 2022.
Net Interest Income and Net Interest
Margin
During the twelve months ended December
31, 2022, net interest income increased $6.0 million, or 8.3%, to $79.2 million, compared to $73.2 million for the twelve months
ended December 31, 2021. The increase in net interest income was due to an increase in interest and dividend income of $6.1 million,
or 7.6%, partially offset by an increase in interest expense of $24,000, or 0.4%. For the twelve months ended December 31, 2022,
the Company generated net interest income growth of 8.3%, overcoming a $6.0 million, or 89.2%, decrease in PPP income as the PPP
program comes to a close. Excluding PPP income of $728,000 and $6.8 million for the twelve months ended December 31, 2022 and the
twelve months ended December 31, 2021, respectively, net interest income increased $12.1 million, or 18.2% for the same period.
The net interest margin for the twelve
months ended December 31, 2022 was 3.31%, compared to 3.14% during the twelve months ended December 31, 2021. The net interest
margin, on a tax-equivalent basis, was 3.33% for the twelve months ended December 31, 2022, compared to 3.16% for the twelve months
ended December 31, 2021. Excluding the PPP income, the net interest margin increased 29 basis points from 2.99% for the twelve
months ended December 31, 2021 to 3.28% for the twelve months ended December 31, 2022.
The average yield on interest-earning assets
increased 15 basis point from 3.43% for the twelve months ended December 31, 2021 to 3.58% for the twelve months ended December
31, 2022. During the twelve months ended December 31, 2022, the average cost of funds, including non-interest-bearing demand accounts
and borrowings, decreased one basis point from 0.30% for the twelve months ended December 31, 2021 to 0.29% for the twelve months
ended December 31, 2022. For the twelve months ended December 31, 2022, the average cost of core deposits, including non-interest-bearing
demand deposits, increased three basis points from 0.17% for the twelve months ended December 31, 2021 to 0.20% for the twelve
months ended December 31, 2022. The average cost of time deposits decreased 12 basis points from 0.53% for the twelve months ended
December 31, 2021 to 0.41% during the same period in 2022. The average cost of borrowings, which include FHLB advances and subordinated
debt, increased 122 basis points from 3.04% for the twelve months ended December 31, 2021 to 4.26% for the twelve months ended
December 31, 2022, due to the issuance of $20.0 million in subordinated debt in April 2021.
For the twelve months ended December 31,
2022, average demand deposits, an interest-free source of funds, increased $39.0 million, or 6.4%, from $609.0 million, or 28.0%
of total average deposits, for the twelve months ended December 31, 2021, to $648.0 million, or 28.6% of total average deposits,
for the twelve months ended December 31, 2022.
During the twelve months ended December
31, 2022, average interest-earning assets increased $67.1 million, or 2.9%, to $2.4 billion. The increase in average interest-earning
assets was due to an increase in average loans of $65.6 million, or 3.5%, as well as an increase in average securities of $87.7
million, or 27.4%, partially offset by a decrease of $86.2 million, or 77.0%, in short-term investments, which consists of cash
and cash equivalents. Excluding average PPP loans, average loans increased $170.5 million, or 9.6%, and average interest-earnings
assets increased $172.0 million, or 7.7%.
Provision for Loan Losses
For the twelve months ended December 31,
2022, the provision for loan losses was $700,000, compared to a credit for loan losses of $925,000 for the twelve months ended
December 31, 2021. The Company recorded net charge-offs of $556,000 for the twelve months ended December 31, 2022, as compared
to net charge-offs of $445,000 for the twelve months ended December 31, 2021.
Non-Interest Income
For the twelve months ended December 31,
2022, non-interest income increased $768,000, or 6.1%, from $12.6 million for the twelve months ended December 31, 2021 to $13.3
million for the twelve months ended December 31, 2022. During the twelve months ended December 31, 2021, non-interest income included
the recognition of $555,000 in BOLI death benefits. During the twelve months ended December 31, 2022, service charges and fees
increased $712,000, or 8.5%, and mortgage banking income decreased $1.4 million from the twelve months ended December 31, 2021
to the twelve months ended December 31, 2022. In 2021, the Company sold $59.7 million in fixed rate residential real estate loans
to the secondary market, compared to $277,000 in sales during the twelve months ended December 31, 2022. Other income from loan-level
swap fees on commercial loans decreased $33,000, or 56.9%, and income from BOLI decreased $187,000, or 9.8%.
On October 31, 2022, the termination of
the DB Plan became effective, subject to regulatory approvals, with final settlement occurring in the second quarter of 2023. During
the twelve months ended December 31, 2022, the Company recorded a curtailment gain related to the DB Plan termination of $2.8 million
through non-interest income. Excluding the defined benefit curtailment gain as a result of the termination of the DB Plan and BOLI
death benefits, non-interest income decreased $1.5 million, or 12.5%. During the twelve months ended December 31, 2022, the Company
reported unrealized losses on marketable equity securities of $717,000, compared to unrealized losses of $168,000 during the twelve
months ended December 31, 2021. During the twelve months ended December 31, 2022, the Company also reported realized losses on
the sale of securities of $4,000, compared to realized losses on the sale of securities of $72,000 during the twelve months ended
December 31, 2021. In addition, the Company reported a gain of $422,000 on non-marketable equity investments during the twelve
months ended December 31, 2022, compared to $898,000 during the twelve months ended December 31, 2021. Gains and losses from the
investment portfolio vary from quarter to quarter based on market conditions, as well as the related yield curve and valuation
changes. During the twelve months ended December 31, 2021, the Company also recognized a loss on interest rate swap termination
of $402,000 representing the unamortized portion of a $3.4 million loss associated with the previous termination of a $32.5 million
interest rate swap on March 16, 2016.
Non-Interest Expense
For the twelve months ended December 31,
2022, non-interest expense increased $2.3 million, or 4.2%, to $57.2 million, compared to $54.9 million for the twelve months ended
December 31, 2021. The increase in non-interest expense was primarily due to an increase in salaries and employee benefits expense
of $511,000, or 1.6%, due to normal annual salary increases as well as higher incentive compensation costs. Other non-interest
expense increased $878,000, or 10.2%, professional fees increased $531,000, or 24.3%, which is comprised of legal fees, audit and
compliance fees, as well as other professional fees. Occupancy expense increased $328,000, or 7.0%, advertising expense increased
$116,000, or 9.0%, and FDIC insurance expense increased $50,000, or 5.0%. These increases were partially offset by a decrease in
furniture and equipment expense of $58,000, or 2.8%, and a decrease in data processing expense of $18,000, or 0.6%. During the
twelve months ended December 31, 2021, the Company prepaid $32.5 million of FHLB borrowings resulting in a loss of $45,000. For
the twelve months ended December 31, 2022, the efficiency ratio was 61.8%, compared to 64.1% for the twelve months ended December
31, 2021. For the twelve months ended December 31, 2022, the adjusted efficiency ratio, a non-GAAP financial measure, was 63.6%,
compared to 64.6% for the twelve months ended December 31, 2021. See pages 17-20 for the related efficiency ratio calculation and
a reconciliation of GAAP to non-GAAP financial measures.
Income Tax Provision
Income tax expense for the twelve months
ended December 31, 2022 was $8.7 million, representing an effective tax rate of 25.2%, compared to $8.0 million, representing an
effective tax rate of 25.3%, for twelve months ended December 31, 2021.
Balance Sheet
At December 31, 2022, total assets were
$2.6 billion, an increase of $14.7 million, or 0.6%, from December 31, 2021. During the twelve months ended December 31, 2022,
cash and cash equivalents decreased $73.1 million, or 70.7%, to $30.3 million, investment securities decreased $45.1 million, or
10.5%, to $383.4 million and total loans increased $126.7 million, or 6.8%, to $2.0 billion.
Investments
At December 31, 2022, the Company’s
available-for-sale securities portfolio decreased $47.4 million, or 24.4%, from $194.4 million at December 31, 2021 to $147.0 million
at December 31, 2022. The held-to-maturity securities portfolio, recorded at amortized cost, increased $7.9 million, or 3.6%, from
$222.3 million at December 31, 2021 to $230.2 million at December 31, 2022. The marketable equity securities portfolio decreased
$5.7 million, or 47.6%, from $11.9 million at December 31, 2021 to $6.2 million at December 31, 2022. The decreases were due to
principal pay downs and redemptions, as well as an increase in unrealized loss on securities available-for-sale. The primary objective
of the investment portfolio is to provide liquidity and maximize income while preserving the safety of principal.
Total Loans
At December 31, 2022, total loans were
$2.0 billion, an increase of $126.7 million, or 6.8%, from December 31, 2021. Excluding PPP loans, total loans increased $149.7
million, or 8.1%, driven by an increase in commercial real estate loans of $89.4 million, or 9.1%, an increase in total commercial
and industrial loans of $16.2 million, or 8.1%, an increase in residential real estate loans, which include home equity loans,
of $43.0 million, or 6.6%, and a decrease in PPP loans of $23.1 million, or 91.0%, from December 31, 2021.
The following table is a summary of our
outstanding loan balances for the periods indicated:
| | |
December 31, 2022 | | |
December 31, 2021 | |
| | |
(Dollars in thousands) | |
| | |
| |
| Commercial real estate loans | |
$ | 1,069,323 | | |
$ | 979,969 | |
| | |
| | | |
| | |
| Residential real estate loans: | |
| | | |
| | |
| Residential | |
| 589,503 | | |
| 552,332 | |
| Home equity | |
| 105,557 | | |
| 99,759 | |
| Total residential real estate loans | |
| 695,060 | | |
| 652,091 | |
| | |
| | | |
| | |
| Commercial and industrial loans: | |
| | | |
| | |
| PPP loans | |
| 2,274 | | |
| 25,329 | |
| Commercial and industrial loans | |
| 217,574 | | |
| 201,340 | |
| Total commercial and industrial loans | |
| 219,848 | | |
| 226,669 | |
| | |
| | | |
| | |
| Consumer loans | |
| 5,045 | | |
| 4,250 | |
| Total gross loans | |
| 1,989,276 | | |
| 1,862,979 | |
| Unamortized PPP loan fees | |
| (109 | ) | |
| (781 | ) |
| Unamortized premiums and net deferred loans fees and costs | |
| 2,233 | | |
| 2,518 | |
| Total loans | |
$ | 1,991,400 | | |
$ | 1,864,716 | |
| | |
| | | |
| | |
Credit Quality
Management continues to remain attentive
to any signs of deterioration in borrowers’ financial conditions and is proactive in taking the appropriate steps to mitigate
risk. At December 31, 2022, nonperforming loans totaled $5.7 million, or 0.29% of total loans, compared to $5.0 million, or 0.27%
of total loans, at December 31, 2021. At December 31, 2022, there were no loans 90 or more days past due and still accruing interest.
Nonperforming assets to total assets, was 0.22% at December 31, 2022, compared to 0.20% at December 31, 2021. The allowance for
loan losses as a percentage of total loans was 1.00% at December 31, 2022, compared to 1.06% at December 31, 2021. At December
31, 2022, the allowance for loan losses as a percentage of nonperforming loans was 350.0%, compared to 398.6%, at December 31,
2021.
Deposits
At December 31, 2022, total deposits were
$2.2 billion, a decrease of $27.5 million, or 1.2%, from December 31, 2021, primarily due to a decrease in core deposits of $37.1
million, or 2.0%. Core deposits, which the Company defines as all deposits except time deposits, decreased from $1.9 billion, or
82.2% of total deposits, at December 31, 2021, to $1.8 billion, or 81.5% of total deposits, at December 31, 2022. Non-interest-bearing
deposits increased $4.2 million, or 0.7%, to $645.5 million, interest-bearing checking accounts increased $3.0 million, or 2.1%,
to $148.7 million, savings accounts increased $4.8 million, or 2.2%, to $222.4 million, and money market accounts decreased $49.3
million, or 5.8%, to $801.1 million. Time deposits increased $9.7 million, or 2.4%, from $402.0 million at December 31, 2021 to
$411.7 million at December 31, 2022.
Borrowings and Subordinated Debt
At December 31, 2022, total borrowings
increased $39.9 million, or 178.9%, from $22.3 million at December 31, 2021, to $62.2 million. Short-term borrowings and long-term
debt increased $39.9 million to $42.5 million and subordinated debt outstanding totaled $19.7 million at December 31, 2022 and
$19.6 million at December 31, 2021.
Capital
At December 31, 2022, shareholders’
equity was $228.1 million, or 8.9% of total assets, compared to $223.7 million, or 8.8% of total assets, at December 31, 2021.
The increase in shareholders’ equity reflects net income of $25.9 million, partially offset by $6.4 million for the repurchase
of the Company’s common stock, the payment of regular cash dividends of $5.3 million and an increase in accumulated other
comprehensive loss of $12.7 million. Total shares outstanding as of December 31, 2022 were 22,216,789.
Capital Management
The Company’s book value per share
was $10.27 at December 31, 2022 compared to $9.87 at December 31, 2021, while tangible book value per share, a non-GAAP financial
measure, increased $0.40, or 4.3%, from $9.21 at December 31, 2021 to $9.61 at December 31, 2022. Reflected in the book value and
tangible book value changes during the year ended December 31, 2022 are the Federal Reserve’s 425 basis points interest rate
increases, which resulted in significant changes in unrealized gains and losses on investment securities. Such unrealized gains
and losses are generally due to changes in interest rates and represent the difference, net of applicable income tax effect, between
the estimated fair value and amortized cost of investment securities classified as available-for-sale. The Company had no other-than-temporary
impairment charges in its investment portfolio in 2022 or 2021. Tangible book value is a non-GAAP measure. See pages 17-20 for
the related tangible book value calculation and a reconciliation of GAAP to non-GAAP financial measures.
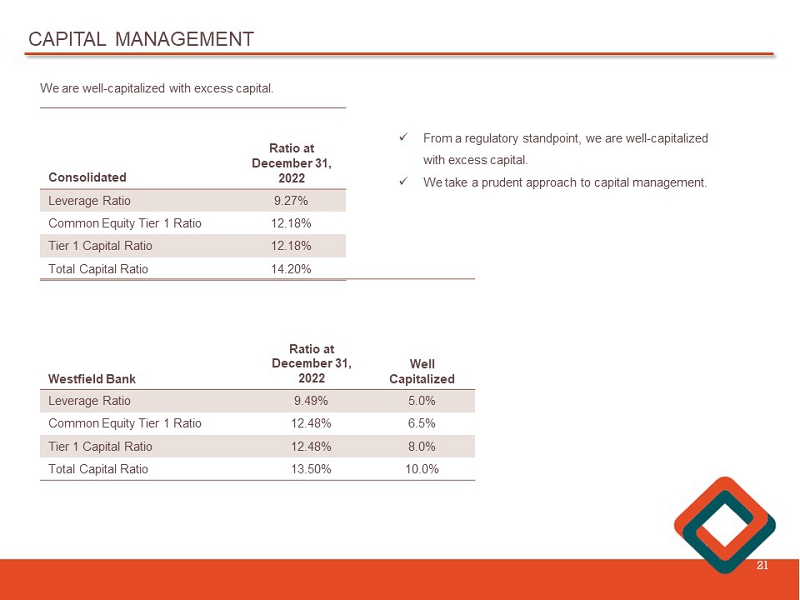
The Company’s regulatory capital
ratios remain in compliance with regulatory “well capitalized” requirements and internal target minimal levels. At
December 31, 2022, the Company’s Tier 1 leverage, common equity tier 1 capital, and total risk-based capital ratios were
9.3%, 12.2%, and 14.2%, respectively, and the Bank’s Tier 1 leverage, common equity tier 1 capital, and total risk-based
capital ratios were 9.5%, 12.5%, and 13.5%, respectively, compared with regulatory “well capitalized” minimums of 5.00%,
6.50%, and 10.00%, respectively.
Dividends
Although the Company has historically paid
quarterly dividends on its common stock and currently intends to continue to pay such dividends, the Company’s ability to
pay such dividends depends on a number of factors, including restrictions under federal laws and regulations on the Company’s
ability to pay dividends, and as a result, there can be no assurance that dividends will continue to be paid in the future.
About Western New England Bancorp,
Inc.
Western New England Bancorp, Inc. is a
Massachusetts-chartered stock holding company and the parent company of Westfield Bank, CSB Colts, Inc., Elm Street Securities
Corporation, WFD Securities, Inc. and WB Real Estate Holdings, LLC. Western New England Bancorp, Inc. and its subsidiaries are
headquartered in Westfield, Massachusetts and operate 25 banking offices throughout western Massachusetts and northern Connecticut.
To learn more, visit our website at www.westfieldbank.com.
Forward-Looking Statements
This press release contains “forward-looking
statements” within the meaning of Section 27A of the Securities Act of 1933, as amended, and Section 21E of the Securities
Exchange Act of 1934, as amended, with respect to the Company’s financial condition, liquidity, results of operations, future
performance, business, measures being taken in response to the COVID-19 pandemic and the impact of the COVID-19 impact on the Company’s
business. Forward-looking statements may be identified by the use of such words as “believe,” “expect,”
“anticipate,” “should,” “planned,” “estimated,” and “potential.”
Examples of forward-looking statements include, but are not limited to, estimates with respect to our financial condition, results
of operations and business that are subject to various factors which could cause actual results to differ materially from these
estimates. These factors include, but are not limited to:
| • | the
duration and scope of the COVID-19 pandemic and the local, national and global impact of COVID-19; |
| | | |
| • | the
emergence of new COVID-19 variants and the response thereto; |
| • | changes
in the interest rate environment that reduce margins; |
| • | the
effect on our operations of governmental legislation and regulation, including changes in accounting regulation or standards,
the nature and timing of the adoption and effectiveness of new requirements under the Dodd-Frank Act Wall Street Reform and Consumer
Protection Act of 2010, Basel guidelines, capital requirements and other applicable laws and regulations; |
| • | the
highly competitive industry and market area in which we operate; |
| • | general
economic conditions, either nationally or regionally, resulting in, among other things, a deterioration in credit quality; |
| • | changes
in business conditions and inflation; |
| • | changes
in credit market conditions; |
| • | the
inability to realize expected cost savings or achieve other anticipated benefits in connection with business combinations and
other acquisitions; |
| • | changes
in the securities markets which affect investment management revenues; |
| • | increases
in Federal Deposit Insurance Corporation deposit insurance premiums and assessments; |
| • | changes
in technology used in the banking business; |
| • | the
soundness of other financial services institutions which may adversely affect our credit risk; |
| • | certain
of our intangible assets may become impaired in the future; |
| • | our
controls and procedures may fail or be circumvented; |
| • | new
lines of business or new products and services, which may subject us to additional risks; |
| • | changes
in key management personnel which may adversely impact our operations; |
| • | severe
weather, natural disasters, acts of war or terrorism and other external events which could significantly impact our business;
and |
| • | other
factors detailed from time to time in our SEC filings. |
| | | |
Although we believe that the expectations
reflected in such forward-looking statements are reasonable, actual results may differ materially from the results discussed in
these forward-looking statements. You are cautioned not to place undue reliance on these forward-looking statements, which speak
only as of the date hereof. We do not undertake any obligation to republish revised forward-looking statements to reflect events
or circumstances after the date hereof or to reflect the occurrence of unanticipated events, except to the extent required by law.
WESTERN NEW ENGLAND BANCORP, INC. AND
SUBSIDIARIES
Consolidated Statements of Net Income
and Other Data
(Dollars in thousands, except per share
data)
(Unaudited)
| | |
Three Months Ended | | |
Twelve Months Ended | |
| | |
December 31, | | |
September 30, | | |
June 30, | | |
March 31, | | |
December 31, | | |
December 31, | |
| | |
2022 | | |
2022 | | |
2022 | | |
2022 | | |
2021 | | |
2022 | | |
2021 | |
| INTEREST AND DIVIDEND INCOME: | |
| | | |
| | | |
| | | |
| | | |
| | | |
| | | |
| | |
| Loans | |
$ | 21,274 | | |
$ | 19,543 | | |
$ | 18,500 | | |
$ | 17,947 | | |
$ | 18,089 | | |
$ | 77,264 | | |
$ | 74,200 | |
| Securities | |
| 2,174 | | |
| 2,104 | | |
| 2,068 | | |
| 1,950 | | |
| 1,763 | | |
| 8,296 | | |
| 5,394 | |
| Other investments | |
| 75 | | |
| 47 | | |
| 30 | | |
| 25 | | |
| 25 | | |
| 177 | | |
| 116 | |
| Short-term investments | |
| 62 | | |
| 60 | | |
| 48 | | |
| 21 | | |
| 49 | | |
| 191 | | |
| 139 | |
| Total interest and dividend income | |
| 23,585 | | |
| 21,754 | | |
| 20,646 | | |
| 19,943 | | |
| 19,926 | | |
| 85,928 | | |
| 79,849 | |
| | |
| | | |
| | | |
| | | |
| | | |
| | | |
| | | |
| | |
| INTEREST EXPENSE: | |
| | | |
| | | |
| | | |
| | | |
| | | |
| | | |
| | |
| Deposits | |
| 2,206 | | |
| 1,164 | | |
| 990 | | |
| 992 | | |
| 1,091 | | |
| 5,352 | | |
| 5,508 | |
| Short-term borrowings | |
| 272 | | |
| 48 | | |
| 10 | | |
| — | | |
| — | | |
| 330 | | |
| — | |
| Long-term debt | |
| — | | |
| — | | |
| — | | |
| — | | |
| — | | |
| — | | |
| 458 | |
| Subordinated debt | |
| 253 | | |
| 254 | | |
| 254 | | |
| 253 | | |
| 253 | | |
| 1,014 | | |
| 706 | |
| Total interest expense | |
| 2,731 | | |
| 1,466 | | |
| 1,254 | | |
| 1,245 | | |
| 1,344 | | |
| 6,696 | | |
| 6,672 | |
| | |
| | | |
| | | |
| | | |
| | | |
| | | |
| | | |
| | |
| Net interest and dividend income | |
| 20,854 | | |
| 20,288 | | |
| 19,392 | | |
| 18,698 | | |
| 18,582 | | |
| 79,232 | | |
| 73,177 | |
| | |
| | | |
| | | |
| | | |
| | | |
| | | |
| | | |
| | |
| PROVISION (CREDIT) FOR LOAN LOSSES | |
| 150 | | |
| 675 | | |
| 300 | | |
| (425 | ) | |
| 300 | | |
| 700 | | |
| (925 | ) |
| | |
| | | |
| | | |
| | | |
| | | |
| | | |
| | | |
| | |
| Net interest and dividend income after provision (credit) for loan losses | |
| 20,704 | | |
| 19,613 | | |
| 19,092 | | |
| 19,123 | | |
| 18,282 | | |
| 78,532 | | |
| 74,102 | |
| | |
| | | |
| | | |
| | | |
| | | |
| | | |
| | | |
| | |
| NON-INTEREST INCOME: | |
| | | |
| | | |
| | | |
| | | |
| | | |
| | | |
| | |
| Service charges and fees | |
| 2,329 | | |
| 2,223 | | |
| 2,346 | | |
| 2,174 | | |
| 2,270 | | |
| 9,072 | | |
| 8,360 | |
| Income from bank-owned life insurance | |
| 428 | | |
| 391 | | |
| 458 | | |
| 448 | | |
| 486 | | |
| 1,725 | | |
| 1,912 | |
| Bank-owned life insurance death benefits | |
| — | | |
| — | | |
| — | | |
| — | | |
| 555 | | |
| — | | |
| 555 | |
| Loss on sales of securities, net | |
| — | | |
| — | | |
| — | | |
| (4 | ) | |
| — | | |
| (4 | ) | |
| (72 | ) |
| Unrealized gain (loss) on marketable equity securities | |
| 19 | | |
| (235 | ) | |
| (225 | ) | |
| (276 | ) | |
| (96 | ) | |
| (717 | ) | |
| (168 | ) |
| Gain on sale of mortgages | |
| — | | |
| — | | |
| — | | |
| 2 | | |
| 289 | | |
| 2 | | |
| 1,423 | |
| Gain on non-marketable equity investments | |
| 70 | | |
| 211 | | |
| 141 | | |
| — | | |
| 352 | | |
| 422 | | |
| 898 | |
| Loss on interest rate swap terminations | |
| — | | |
| — | | |
| — | | |
| — | | |
| — | | |
| — | | |
| (402 | ) |
| Gain on defined benefit plan curtailment | |
| 2,807 | | |
| — | | |
| — | | |
| — | | |
| — | | |
| 2,807 | | |
| — | |
| Other income | |
| — | | |
| — | | |
| 21 | | |
| 4 | | |
| — | | |
| 25 | | |
| 58 | |
| Total non-interest income | |
| 5,653 | | |
| 2,590 | | |
| 2,741 | | |
| 2,348 | | |
| 3,856 | | |
| 13,332 | | |
| 12,564 | |
| | |
| | | |
| | | |
| | | |
| | | |
| | | |
| | | |
| | |
| NON-INTEREST EXPENSE: | |
| | | |
| | | |
| | | |
| | | |
| | | |
| | | |
| | |
| Salaries and employees benefits | |
| 8,197 | | |
| 8,025 | | |
| 8,236 | | |
| 8,239 | | |
| 8,193 | | |
| 32,697 | | |
| 32,186 | |
| Occupancy | |
| 1,218 | | |
| 1,226 | | |
| 1,177 | | |
| 1,363 | | |
| 1,144 | | |
| 4,984 | | |
| 4,656 | |
| Furniture and equipment | |
| 479 | | |
| 465 | | |
| 539 | | |
| 543 | | |
| 548 | | |
| 2,026 | | |
| 2,084 | |
| Data processing | |
| 724 | | |
| 707 | | |
| 731 | | |
| 723 | | |
| 726 | | |
| 2,885 | | |
| 2,903 | |
| Professional fees | |
| 617 | | |
| 803 | | |
| 719 | | |
| 577 | | |
| 477 | | |
| 2,716 | | |
| 2,185 | |
| FDIC insurance | |
| 255 | | |
| 273 | | |
| 234 | | |
| 286 | | |
| 202 | | |
| 1,048 | | |
| 998 | |
| Advertising | |
| 178 | | |
| 419 | | |
| 412 | | |
| 399 | | |
| 262 | | |
| 1,408 | | |
| 1,292 | |
| Loss on prepayment of borrowings | |
| — | | |
| — | | |
| — | | |
| — | | |
| — | | |
| — | | |
| 45 | |
| Other | |
| 2,335 | | |
| 2,425 | | |
| 2,385 | | |
| 2,326 | | |
| 2,371 | | |
| 9,471 | | |
| 8,593 | |
| Total non-interest expense | |
| 14,003 | | |
| 14,343 | | |
| 14,433 | | |
| 14,456 | | |
| 13,923 | | |
| 57,235 | | |
| 54,942 | |
| | |
| | | |
| | | |
| | | |
| | | |
| | | |
| | | |
| | |
| INCOME BEFORE INCOME TAXES | |
| 12,354 | | |
| 7,860 | | |
| 7,400 | | |
| 7,015 | | |
| 8,215 | | |
| 34,629 | | |
| 31,724 | |
| | |
| | | |
| | | |
| | | |
| | | |
| | | |
| | | |
| | |
| INCOME TAX PROVISION | |
| 3,320 | | |
| 1,861 | | |
| 1,865 | | |
| 1,696 | | |
| 1,995 | | |
| 8,742 | | |
| 8,025 | |
| NET INCOME | |
$ | 9,034 | | |
$ | 5,999 | | |
$ | 5,535 | | |
$ | 5,319 | | |
$ | 6,220 | | |
$ | 25,887 | | |
$ | 23,699 | |
| | |
| | | |
| | | |
| | | |
| | | |
| | | |
| | | |
| | |
| Basic earnings per share | |
$ | 0.42 | | |
$ | 0.28 | | |
$ | 0.25 | | |
$ | 0.24 | | |
$ | 0.28 | | |
$ | 1.18 | | |
$ | 1.02 | |
| Weighted average shares outstanding | |
| 21,676,892 | | |
| 21,757,027 | | |
| 21,991,383 | | |
| 22,100,076 | | |
| 22,097,968 | | |
| 21,879,657 | | |
| 23,223,633 | |
| Diluted earnings per share | |
$ | 0.42 | | |
$ | 0.28 | | |
$ | 0.25 | | |
$ | 0.24 | | |
$ | 0.28 | | |
$ | 1.18 | | |
$ | 1.02 | |
| Weighted average diluted shares outstanding | |
| 21,751,409 | | |
| 21,810,036 | | |
| 22,025,687 | | |
| 22,172,909 | | |
| 22,203,876 | | |
| 21,938,323 | | |
| 23,300,637 | |
| | |
| | | |
| | | |
| | | |
| | | |
| | | |
| | | |
| | |
| Other Data: | |
| | | |
| | | |
| | | |
| | | |
| | | |
| | | |
| | |
| Return on average assets (1) | |
| 1.40 | % | |
| 0.93 | % | |
| 0.87 | % | |
| 0.85 | % | |
| 0.97 | % | |
| 1.02 | % | |
| 0.96 | % |
| Return on average equity (1) | |
| 16.67 | % | |
| 10.90 | % | |
| 10.22 | % | |
| 9.65 | % | |
| 11.22 | % | |
| 11.85 | % | |
| 10.64 | % |
| Efficiency ratio | |
| 52.83 | % | |
| 62.69 | % | |
| 65.21 | % | |
| 68.69 | % | |
| 62.05 | % | |
| 61.83 | % | |
| 64.08 | % |
| Adjusted efficiency ratio (2) | |
| 59.31 | % | |
| 62.63 | % | |
| 64.96 | % | |
| 67.79 | % | |
| 64.38 | % | |
| 63.55 | % | |
| 64.64 | % |
| Net interest margin | |
| 3.44 | % | |
| 3.35 | % | |
| 3.24 | % | |
| 3.18 | % | |
| 3.08 | % | |
| 3.31 | % | |
| 3.14 | % |
| Net interest margin, on a fully tax-equivalent basis | |
| 3.47 | % | |
| 3.37 | % | |
| 3.26 | % | |
| 3.20 | % | |
| 3.10 | % | |
| 3.33 | % | |
| 3.16 | % |
| (2) | The adjusted efficiency ratio (non-GAAP) represents the
ratio of operating expenses, excluding loss on prepayment of borrowings, divided by the sum of net interest and dividend income
and non-interest income, excluding bank-owned life insurance death benefits, realized and unrealized gains and losses on securities,
gain on non-marketable equity investments, loss on interest rate swap termination, and gain on defined benefit plan curtailment. |
WESTERN NEW ENGLAND BANCORP, INC. AND
SUBSIDIARIES
Consolidated Balance Sheets
(Dollars in thousands)
(Unaudited)
| | |
December 31, | | |
September 30, | | |
June 30, | | |
March 31, | | |
December 31, | |
| | |
2022 | | |
2022 | | |
2022 | | |
2022 | | |
2021 | |
| Cash and cash equivalents | |
$ | 30,342 | | |
$ | 27,113 | | |
$ | 47,513 | | |
$ | 62,898 | | |
$ | 103,456 | |
| Available-for-sale securities, at fair value | |
| 146,997 | | |
| 148,716 | | |
| 160,925 | | |
| 173,910 | | |
| 194,352 | |
| Held to maturity securities, at amortized cost | |
| 230,168 | | |
| 234,387 | | |
| 233,803 | | |
| 237,575 | | |
| 222,272 | |
| Marketable equity securities, at fair value | |
| 6,237 | | |
| 11,280 | | |
| 11,453 | | |
| 11,643 | | |
| 11,896 | |
| Federal Home Loan Bank of Boston and other restricted stock - at cost | |
| 3,352 | | |
| 2,234 | | |
| 1,882 | | |
| 2,594 | | |
| 2,594 | |
| | |
| | | |
| | | |
| | | |
| | | |
| | |
| Loans | |
| 1,991,400 | | |
| 2,007,672 | | |
| 1,975,700 | | |
| 1,926,285 | | |
| 1,864,716 | |
| Allowance for loan losses | |
| (19,931 | ) | |
| (20,208 | ) | |
| (19,560 | ) | |
| (19,308 | ) | |
| (19,787 | ) |
| Net loans | |
| 1,971,469 | | |
| 1,987,464 | | |
| 1,956,140 | | |
| 1,906,977 | | |
| 1,844,929 | |
| | |
| | | |
| | | |
| | | |
| | | |
| | |
| Bank-owned life insurance | |
| 74,620 | | |
| 74,192 | | |
| 73,801 | | |
| 73,343 | | |
| 72,895 | |
| Goodwill | |
| 12,487 | | |
| 12,487 | | |
| 12,487 | | |
| 12,487 | | |
| 12,487 | |
| Core deposit intangible | |
| 2,188 | | |
| 2,281 | | |
| 2,375 | | |
| 2,469 | | |
| 2,563 | |
| Other assets | |
| 75,290 | | |
| 78,671 | | |
| 76,978 | | |
| 71,542 | | |
| 70,981 | |
| TOTAL ASSETS | |
$ | 2,553,150 | | |
$ | 2,578,825 | | |
$ | 2,577,357 | | |
$ | 2,555,438 | | |
$ | 2,538,425 | |
| | |
| | | |
| | | |
| | | |
| | | |
| | |
| Total deposits | |
$ | 2,229,443 | | |
$ | 2,287,754 | | |
$ | 2,301,972 | | |
$ | 2,278,164 | | |
$ | 2,256,898 | |
| Short-term borrowings | |
| 41,350 | | |
| 21,500 | | |
| 4,790 | | |
| — | | |
| — | |
| Long-term debt | |
| 1,178 | | |
| 1,178 | | |
| 1,360 | | |
| 1,686 | | |
| 2,653 | |
| Subordinated debt | |
| 19,673 | | |
| 19,663 | | |
| 19,653 | | |
| 19,643 | | |
| 19,633 | |
| Securities pending settlement | |
| 133 | | |
| 9 | | |
| — | | |
| 146 | | |
| — | |
| Other liabilities | |
| 33,230 | | |
| 37,021 | | |
| 34,252 | | |
| 36,736 | | |
| 35,553 | |
| TOTAL LIABILITIES | |
| 2,325,007 | | |
| 2,367,125 | | |
| 2,362,027 | | |
| 2,336,375 | | |
| 2,314,737 | |
| | |
| | | |
| | | |
| | | |
| | | |
| | |
| TOTAL SHAREHOLDERS’ EQUITY | |
| 228,143 | | |
| 211,700 | | |
| 215,330 | | |
| 219,063 | | |
| 223,688 | |
| TOTAL LIABILITIES AND SHAREHOLDERS' EQUITY | |
$ | 2,553,150 | | |
$ | 2,578,825 | | |
$ | 2,577,357 | | |
$ | 2,555,438 | | |
$ | 2,538,425 | |
WESTERN NEW ENGLAND BANCORP, INC. AND
SUBSIDIARIES
Other Data
(Dollars in thousands, except per share
data)
(Unaudited)
| | |
Three Months Ended | |
| | |
December 31, | | |
September 30, | | |
June 30, | | |
March 31, | | |
December 31, | |
| | |
2022 | | |
2022 | | |
2022 | | |
2022 | | |
2021 | |
| Shares outstanding at end of period | |
| 22,216,789 | | |
| 22,246,545 | | |
| 22,465,991 | | |
| 22,742,189 | | |
| 22,656,515 | |
| | |
| | | |
| | | |
| | | |
| | | |
| | |
| Operating results: | |
| | | |
| | | |
| | | |
| | | |
| | |
| Net interest income | |
$ | 20,854 | | |
$ | 20,288 | | |
$ | 19,392 | | |
$ | 18,698 | | |
$ | 18,582 | |
| Provision (credit) for loan losses | |
| 150 | | |
| 675 | | |
| 300 | | |
| (425 | ) | |
| 300 | |
| Non-interest income | |
| 5,653 | | |
| 2,590 | | |
| 2,741 | | |
| 2,348 | | |
| 3,856 | |
| Non-interest expense | |
| 14,003 | | |
| 14,343 | | |
| 14,433 | | |
| 14,456 | | |
| 13,923 | |
| Income before income provision for income taxes | |
| 12,354 | | |
| 7,860 | | |
| 7,400 | | |
| 7,015 | | |
| 8,215 | |
| Income tax provision | |
| 3,320 | | |
| 1,861 | | |
| 1,865 | | |
| 1,696 | | |
| 1,995 | |
| Net income | |
| 9,034 | | |
| 5,999 | | |
| 5,535 | | |
| 5,319 | | |
| 6,220 | |
| | |
| | | |
| | | |
| | | |
| | | |
| | |
| Performance Ratios: | |
| | | |
| | | |
| | | |
| | | |
| | |
| Net interest margin, on a fully tax-equivalent basis | |
| 3.47 | % | |
| 3.37 | % | |
| 3.26 | % | |
| 3.20 | % | |
| 3.10 | % |
| Interest rate spread, on a fully tax-equivalent basis | |
| 3.26 | % | |
| 3.26 | % | |
| 3.17 | % | |
| 3.10 | % | |
| 2.99 | % |
| Return on average assets | |
| 1.40 | % | |
| 0.93 | % | |
| 0.87 | % | |
| 0.85 | % | |
| 0.97 | % |
| Return on average equity | |
| 16.67 | % | |
| 10.90 | % | |
| 10.22 | % | |
| 9.65 | % | |
| 11.22 | % |
| Adjusted efficiency ratio (non-GAAP) (1) | |
| 59.31 | % | |
| 62.63 | % | |
| 64.96 | % | |
| 67.79 | % | |
| 64.38 | % |
| | |
| | | |
| | | |
| | | |
| | | |
| | |
| Per Common Share Data: | |
| | | |
| | | |
| | | |
| | | |
| | |
| Basic earnings per share | |
$ | 0.42 | | |
$ | 0.28 | | |
$ | 0.25 | | |
$ | 0.24 | | |
$ | 0.28 | |
| Per diluted share | |
| 0.42 | | |
| 0.28 | | |
| 0.25 | | |
| 0.24 | | |
| 0.28 | |
| Cash dividend declared | |
| 0.06 | | |
| 0.06 | | |
| 0.06 | | |
| 0.06 | | |
| 0.05 | |
| Book value per share | |
| 10.27 | | |
| 9.52 | | |
| 9.58 | | |
| 9.63 | | |
| 9.87 | |
| Tangible book value per share (non-GAAP) | |
| 9.61 | | |
| 8.85 | | |
| 8.92 | | |
| 8.97 | | |
| 9.21 | |
| | |
| | | |
| | | |
| | | |
| | | |
| | |
| Asset Quality: | |
| | | |
| | | |
| | | |
| | | |
| | |
| 30-89 day delinquent loans | |
$ | 2,578 | | |
$ | 2,630 | | |
$ | 1,063 | | |
$ | 1,407 | | |
$ | 1,102 | |
| 90 days or more delinquent loans | |
| 1,891 | | |
| 669 | | |
| 1,149 | | |
| 1,401 | | |
| 1,039 | |
| Total delinquent loans | |
| 4,469 | | |
| 3,299 | | |
| 2,212 | | |
| 2,808 | | |
| 2,141 | |
| Total delinquent loans as a percentage of total loans | |
| 0.22 | % | |
| 0.16 | % | |
| 0.11 | % | |
| 0.15 | % | |
| 0.11 | % |
| Total delinquent loans as a percentage of total loans, excluding PPP | |
| 0.22 | % | |
| 0.16 | % | |
| 0.11 | % | |
| 0.15 | % | |
| 0.12 | % |
| Nonperforming loans | |
$ | 5,694 | | |
$ | 4,432 | | |
$ | 4,105 | | |
$ | 3,988 | | |
$ | 4,964 | |
| Nonperforming loans as a percentage of total loans | |
| 0.29 | % | |
| 0.22 | % | |
| 0.21 | % | |
| 0.21 | % | |
| 0.27 | % |
| Nonperforming loans as a percentage of total loans, excluding PPP | |
| 0.29 | % | |
| 0.22 | % | |
| 0.21 | % | |
| 0.21 | % | |
| 0.27 | % |
| Nonperforming assets as a percentage of total assets | |
| 0.22 | % | |
| 0.17 | % | |
| 0.16 | % | |
| 0.16 | % | |
| 0.20 | % |
| Nonperforming assets as a percentage of total assets, excluding PPP | |
| 0.22 | % | |
| 0.17 | % | |
| 0.16 | % | |
| 0.16 | % | |
| 0.20 | % |
| Allowance for loan losses as a percentage of nonperforming loans | |
| 350.04 | % | |
| 455.96 | % | |
| 476.49 | % | |
| 484.15 | % | |
| 398.61 | % |
| Allowance for loan losses as a percentage of total loans | |
| 1.00 | % | |
| 1.01 | % | |
| 0.99 | % | |
| 1.00 | % | |
| 1.06 | % |
| Allowance for loan losses as a percentage of total loans, excluding PPP | |
| 1.00 | % | |
| 1.01 | % | |
| 0.99 | % | |
| 1.01 | % | |
| 1.08 | % |
| Net loan charge-offs | |
$ | 426 | | |
$ | 27 | | |
$ | 48 | | |
$ | 54 | | |
$ | 350 | |
| Net loan charge-offs as a percentage of average loans | |
| 0.02 | % | |
| 0.00 | % | |
| 0.00 | % | |
| 0.00 | % | |
| 0.02 | % |
| (1) | The adjusted efficiency ratio (non-GAAP) represents the
ratio of operating expenses, excluding loss on prepayment of borrowings, divided by the sum of net interest and dividend income
and non-interest income, excluding bank-owned life insurance death benefits, realized and unrealized gains and losses on securities,
gain on non-marketable equity investments, loss on interest rate swap termination, and gain on defined benefit plan curtailment. |
The
following tables set forth the information relating to our average balances and net interest income for the three months ended
December 31, 2022, September 30, 2022, and December 31, 2021 and reflect the average yield on interest-earning assets and average
cost of interest-bearing liabilities for the periods indicated.
| | |
Three
Months Ended | |
| | |
December
31, 2022 | | |
September
30, 2022 | | |
December
31, 2021 | |
| | |
Average
Balance | | |
Interest | | |
Average Yield/
Cost(8) | | |
Average
Balance | | |
Interest | | |
Average Yield/
Cost(8) | | |
Average
Balance | | |
Interest | | |
Average
Yield/
Cost(8) | |
| | |
(Dollars in thousands) | |
| ASSETS: | |
| | |
| | |
| | |
| | |
| | |
| | |
| | |
| | |
| |
| Interest-earning assets | |
| | | |
| | | |
| | | |
| | | |
| | | |
| | | |
| | | |
| | | |
| | |
| Loans(1)(2) | |
$ | 1,994,874 | | |
$ | 21,403 | | |
| 4.26 | % | |
$ | 1,973,580 | | |
$ | 19,665 | | |
| 3.95 | % | |
$ | 1,850,162 | | |
$ | 18,197 | | |
| 3.90 | % |
| Securities(2) | |
| 388,529 | | |
| 2,175 | | |
| 2.22 | | |
| 404,005 | | |
| 2,105 | | |
| 2.07 | % | |
| 401,811 | | |
| 1,764 | | |
| 1.74 | |
| Other investments | |
| 10,638 | | |
| 75 | | |
| 2.80 | | |
| 10,037 | | |
| 47 | | |
| 1.86 | % | |
| 10,654 | | |
| 25 | | |
| 0.93 | |
| Short-term investments(3) | |
| 7,635 | | |
| 62 | | |
| 3.22 | | |
| 13,911 | | |
| 60 | | |
| 1.71 | % | |
| 131,770 | | |
| 49 | | |
| 0.15 | |
| Total
interest-earning assets | |
| 2,401,676 | | |
| 23,715 | | |
| 3.92 | | |
| 2,401,533 | | |
| 21,877 | | |
| 3.61 | % | |
| 2,394,397 | | |
| 20,035 | | |
| 3.32 | |
| Total
non-interest-earning assets | |
| 159,042 | | |
| | | |
| | | |
| 154,955 | | |
| | | |
| | | |
| 149,151 | | |
| | | |
| | |
| Total
assets | |
$ | 2,560,718 | | |
| | | |
| | | |
$ | 2,556,488 | | |
| | | |
| | | |
$ | 2,543,548 | | |
| | | |
| | |
| | |
| | | |
| | | |
| | | |
| | | |
| | | |
| | | |
| | | |
| | | |
| | |
| LIABILITIES AND EQUITY: | |
| | | |
| | | |
| | | |
| | | |
| | | |
| | | |
| | | |
| | | |
| | |
| Interest-bearing liabilities | |
| | | |
| | | |
| | | |
| | | |
| | | |
| | | |
| | | |
| | | |
| | |
| Interest-bearing checking accounts | |
$ | 149,928 | | |
| 206 | | |
| 0.55 | % | |
$ | 139,678 | | |
| 123 | | |
| 0.35 | % | |
$ | 132,028 | | |
| 106 | | |
| 0.32 | % |
| Savings accounts | |
| 221,964 | | |
| 39 | | |
| 0.07 | | |
| 224,112 | | |
| 38 | | |
| 0.07 | % | |
| 214,961 | | |
| 36 | | |
| 0.07 | |
| Money market accounts | |
| 862,523 | | |
| 1,375 | | |
| 0.63 | | |
| 911,282 | | |
| 743 | | |
| 0.32 | % | |
| 849,023 | | |
| 546 | | |
| 0.26 | |
| Time deposit accounts | |
| 359,555 | | |
| 586 | | |
| 0.65 | | |
| 339,614 | | |
| 260 | | |
| 0.30 | % | |
| 410,149 | | |
| 403 | | |
| 0.39 | |
| Total interest-bearing deposits | |
| 1,593,970 | | |
| 2,206 | | |
| 0.55 | | |
| 1,614,686 | | |
| 1,164 | | |
| 0.29 | % | |
| 1,606,161 | | |
| 1,091 | | |
| 0.27 | |
| Short-term borrowings
and long-term debt | |
| 48,579 | | |
| 525 | | |
| 4.29 | | |
| 29,076 | | |
| 302 | | |
| 4.12 | % | |
| 22,614 | | |
| 253 | | |
| 4.44 | |
| Total
interest-bearing liabilities | |
| 1,642,549 | | |
| 2,731 | | |
| 0.66 | | |
| 1,643,762 | | |
| 1,466 | | |
| 0.35 | % | |
| 1,628,775 | | |
| 1,344 | | |
| 0.33 | |
| Non-interest-bearing deposits | |
| 663,814 | | |
| | | |
| | | |
| 658,853 | | |
| | | |
| | | |
| 654,334 | | |
| | | |
| | |
| Other non-interest-bearing
liabilities | |
| 39,399 | | |
| | | |
| | | |
| 35,558 | | |
| | | |
| | | |
| 40,428 | | |
| | | |
| | |
| Total
non-interest-bearing liabilities | |
| 703,213 | | |
| | | |
| | | |
| 694,411 | | |
| | | |
| | | |
| 694,762 | | |
| | | |
| | |
| Total liabilities | |
| 2,345,762 | | |
| | | |
| | | |
| 2,338,173 | | |
| | | |
| | | |
| 2,323,537 | | |
| | | |
| | |
| Total
equity | |
| 214,956 | | |
| | | |
| | | |
| 218,315 | | |
| | | |
| | | |
| 220,011 | | |
| | | |
| | |
| Total
liabilities and equity | |
$ | 2,560,718 | | |
| | | |
| | | |
$ | 2,556,488 | | |
| | | |
| | | |
$ | 2,543,548 | | |
| | | |
| | |
| Less: Tax-equivalent adjustment
(2) | |
| | | |
| (130 | ) | |
| | | |
| | | |
| (123 | ) | |
| | | |
| | | |
| (109 | ) | |
| | |
| Net interest and dividend
income | |
| | | |
$ | 20,854 | | |
| | | |
| | | |
$ | 20,288 | | |
| | | |
| | | |
$ | 18,582 | | |
| | |
| Net interest rate spread (4) | |
| | | |
| | | |
| 3.24 | % | |
| | | |
| | | |
| 3.24 | % | |
| | | |
| | | |
| 2.97 | % |
| Net interest rate spread, on a tax-equivalent
basis (5) | |
| | | |
| | | |
| 3.26 | % | |
| | | |
| | | |
| 3.26 | % | |
| | | |
| | | |
| 2.99 | % |
| Net interest margin (6) | |
| | | |
| | | |
| 3.44 | % | |
| | | |
| | | |
| 3.35 | % | |
| | | |
| | | |
| 3.08 | % |
| Net interest margin, on a tax-equivalent basis
(7) | |
| | | |
| | | |
| 3.47 | % | |
| | | |
| | | |
| 3.37 | % | |
| | | |
| | | |
| 3.10 | % |
| Ratio of average interest-earning assets to average
interest-bearing liabilities | |
| | | |
| | | |
| 146.22 | % | |
| | | |
| | | |
| 146.10 | % | |
| | | |
| | | |
| 147.01 | % |
The
following tables set forth the information relating to our average balances and net interest income for the twelve months ended
December 31, 2022 and 2021 and reflect the average yield on interest-earning assets and average cost of interest-bearing liabilities
for the periods indicated.
| | |
Twelve Months Ended December 31, |
| | |
2022 | |
2021 | |
| | |
Average Balance | | |
Interest | | |
Average Yield/ Cost | | |
Average Balance | | |
Interest | | |
Average Yield/ Cost | |
| | |
(Dollars in thousands) | |
| ASSETS: | |
| | | |
| | | |
| | | |
| | | |
| | | |
| | |
| Interest-earning assets | |
| | | |
| | | |
| | | |
| | | |
| | | |
| | |
| Loans(1)(2) | |
$ | 1,953,527 | | |
$ | 77,758 | | |
| 3.98 | % | |
$ | 1,887,926 | | |
$ | 74,620 | | |
| 3.95 | % |
| Securities(2) | |
| 407,444 | | |
| 8,299 | | |
| 2.04 | | |
| 319,778 | | |
| 5,398 | | |
| 1.69 | |
| Other investments | |
| 10,289 | | |
| 177 | | |
| 1.72 | | |
| 10,242 | | |
| 115 | | |
| 1.12 | |
| Short-term investments(3) | |
| 25,712 | | |
| 191 | | |
| 0.74 | | |
| 111,931 | | |
| 139 | | |
| 0.12 | |
| Total interest-earning assets | |
| 2,396,972 | | |
| 86,425 | | |
| 3.61 | | |
| 2,329,877 | | |
| 80,272 | | |
| 3.45 | |
| Total non-interest-earning assets | |
| 152,941 | | |
| | | |
| | | |
| 147,980 | | |
| | | |
| | |
| Total assets | |
$ | 2,549,913 | | |
| | | |
| | | |
$ | 2,477,857 | | |
| | | |
| | |
| | |
| | | |
| | | |
| | | |
| | | |
| | | |
| | |
| LIABILITIES AND EQUITY: | |
| | | |
| | | |
| | | |
| | | |
| | | |
| | |
| Interest-bearing liabilities | |
| | | |
| | | |
| | | |
| | | |
| | | |
| | |
| Interest-bearing checking accounts | |
$ | 139,993 | | |
| 530 | | |
| 0.38 | % | |
$ | 109,648 | | |
| 399 | | |
| 0.36 | % |
| Savings accounts | |
| 222,267 | | |
| 161 | | |
| 0.07 | | |
| 205,394 | | |
| 154 | | |
| 0.07 | |
| Money market accounts | |
| 890,763 | | |
| 3,187 | | |
| 0.36 | | |
| 776,725 | | |
| 2,412 | | |
| 0.31 | |
| Time deposit accounts | |
| 363,258 | | |
| 1,474 | | |
| 0.41 | | |
| 477,067 | | |
| 2,543 | | |
| 0.53 | |
| Total interest-bearing deposits | |
| 1,616,281 | | |
| 5,352 | | |
| 0.33 | | |
| 1,568,834 | | |
| 5,508 | | |
| 0.35 | |
| Short-term borrowings and long-term debt | |
| 31,556 | | |
| 1,344 | | |
| 4.26 | | |
| 38,294 | | |
| 1,164 | | |
| 3.04 | |
| Total interest-bearing liabilities | |
| 1,647,837 | | |
| 6,696 | | |
| 0.41 | | |
| 1,607,128 | | |
| 6,672 | | |
| 0.42 | |
| Non-interest-bearing deposits | |
| 647,971 | | |
| | | |
| | | |
| 608,936 | | |
| | | |
| | |
| Other non-interest-bearing liabilities | |
| 35,615 | | |
| | | |
| | | |
| 39,108 | | |
| | | |
| | |
| Total non-interest-bearing liabilities | |
| 683,586 | | |
| | | |
| | | |
| 648,044 | | |
| | | |
| | |
| | |
| | | |
| | | |
| | | |
| | | |
| | | |
| | |
| Total liabilities | |
| 2,331,423 | | |
| | | |
| | | |
| 2,255,172 | | |
| | | |
| | |
| Total equity | |
| 218,490 | | |
| | | |
| | | |
| 222,685 | | |
| | | |
| | |
| Total liabilities and equity | |
$ | 2,549,913 | | |
| | | |
| | | |
$ | 2,477,857 | | |
| | | |
| | |
| Less: Tax-equivalent adjustment (2) | |
| | | |
| (497 | ) | |
| | | |
| | | |
| (423 | ) | |
| | |
| Net interest and dividend income | |
| | | |
$ | 79,232 | | |
| | | |
| | | |
$ | 73,177 | | |
| | |
| Net interest rate spread (4) | |
| | | |
| | | |
| 3.18 | % | |
| | | |
| | | |
| 3.01 | % |
| Net interest rate spread, on a tax-equivalent basis (5) | |
| | | |
| | | |
| 3.20 | % | |
| | | |
| | | |
| 3.03 | % |
| Net interest margin (6) | |
| | | |
| | | |
| 3.31 | % | |
| | | |
| | | |
| 3.14 | % |
| Net interest margin, on a tax-equivalent basis (7) | |
| | | |
| | | |
| 3.33 | % | |
| | | |
| | | |
| 3.16 | % |
| Ratio of average interest-earning assets to average interest-bearing
liabilities | |
| | | |
| | | |
| 145.46 | % | |
| | | |
| | | |
| 144.97 | % |
| (1) | Loans,
including nonaccrual loans, are net of deferred loan origination costs and unadvanced
funds. |
| (2) | Loan
and securities income are presented on a tax-equivalent basis using a tax rate of 21%.
The tax-equivalent adjustment is deducted from tax-equivalent net interest and dividend
income to agree to the amount reported on the consolidated statements of net income. |
| (3) | Short-term
investments include federal funds sold. |
| (4) | Net
interest rate spread represents the difference between the weighted average yield on
interest-earning assets and the weighted average cost of interest-bearing liabilities. |
| (5) | Net
interest rate spread, on a tax-equivalent basis, represents the difference between the
tax-equivalent weighted average yield on interest-earning assets and the tax-equivalent
weighted average cost of interest-bearing liabilities. |
| (6) | Net
interest margin represents net interest and dividend income as a percentage of average
interest-earning assets. |
| (7) | Net
interest margin, on a tax-equivalent basis, represents tax-equivalent net interest and
dividend income as a percentage of average interest-earning assets. |
Reconciliation
of Non-GAAP to GAAP Financial Measures
The
Company believes that certain non-GAAP financial measures provide information to investors that is useful in understanding its
financial condition. Because not all companies use the same calculation, this presentation may not be comparable to other
similarly titled measures calculated by other companies. A reconciliation of these non-GAAP financial measures is provided
below.
| | |
For
the quarter ended | |
| | |
12/31/2022 | | |
9/30/2022 | | |
6/30/2022 | | |
3/31/2022 | | |
12/31/2021 | |
| | |
(In
thousands) | |
| Loans (no
tax adjustment) | |
$ | 21,274 | | |
$ | 19,543 | | |
$ | 18,500 | | |
$ | 17,947 | | |
$ | 18,089 | |
| Tax-equivalent
adjustment | |
| 129 | | |
| 122 | | |
| 124 | | |
| 120 | | |
| 108 | |
| Loans
(tax-equivalent basis) | |
$ | 21,403 | | |
$ | 19,665 | | |
$ | 18,624 | | |
$ | 18,067 | | |
$ | 18,197 | |
| | |
| | | |
| | | |
| | | |
| | | |
| | |
| Securities (no tax
adjustment) | |
$ | 2,174 | | |
$ | 2,104 | | |
$ | 2,068 | | |
$ | 1,950 | | |
$ | 1,763 | |
| Tax-equivalent
adjustment | |
| 1 | | |
| 1 | | |
| — | | |
| — | | |
| 1 | |
| Securities
(tax-equivalent basis) | |
$ | 2,175 | | |
$ | 2,105 | | |
$ | 2,068 | | |
$ | 1,950 | | |
$ | 1,764 | |
| | |
| | | |
| | | |
| | | |
| | | |
| | |
| Net interest income
(no tax adjustment) | |
$ | 20,854 | | |
$ | 20,288 | | |
$ | 19,392 | | |
$ | 18,698 | | |
$ | 18,582 | |
| Tax
equivalent adjustment | |
| 130 | | |
| 123 | | |
| 124 | | |
| 120 | | |
| 109 | |
| Net
interest income (tax-equivalent basis) | |
$ | 20,984 | | |
$ | 20,411 | | |
$ | 19,516 | | |
$ | 18,818 | | |
$ | 18,691 | |
| | |
| | | |
| | | |
| | | |
| | | |
| | |
| Net interest income
(no tax adjustment) | |
$ | 20,854 | | |
$ | 20,288 | | |
$ | 19,392 | | |
$ | 18,698 | | |
$ | 18,582 | |
| Less: | |
| | | |
| | | |
| | | |
| | | |
| | |
| Purchase
accounting adjustments | |
| 87 | | |
| (16 | ) | |
| 64 | | |
| 39 | | |
| (31 | ) |
| Prepayment
penalties and fees | |
| 134 | | |
| 99 | | |
| 26 | | |
| 21 | | |
| 21 | |
| PPP
fee income | |
| 18 | | |
| 19 | | |
| 129 | | |
| 562 | | |
| 973 | |
| Adjusted
net interest income (non-GAAP) | |
$ | 20,615 | | |
$ | 20,186 | | |
$ | 19,173 | | |
$ | 18,076 | | |
$ | 17,619 | |
| | |
| | | |
| | | |
| | | |
| | | |
| | |
| Average interest-earning assets | |
$ | 2,401,676 | | |
$ | 2,401,533 | | |
$ | 2,398,526 | | |
$ | 2,385,932 | | |
$ | 2,394,397 | |
| Average interest-earning
assets, excluding average PPP loans | |
$ | 2,399,297 | | |
$ | 2,398,998 | | |
$ | 2,395,463 | | |
$ | 2,370,852 | | |
$ | 2,352,858 | |
| Net interest margin
(no tax adjustment) | |
| 3.44 | % | |
| 3.35 | % | |
| 3.24 | % | |
| 3.18 | % | |
| 3.08 | % |
| Net interest margin,
tax-equivalent | |
| 3.47 | % | |
| 3.37 | % | |
| 3.26 | % | |
| 3.20 | % | |
| 3.10 | % |
| Adjusted net interest
margin, excluding purchase accounting adjustments, PPP fee income and prepayment penalties (non-GAAP) | |
| 3.41 | % | |
| 3.34 | % | |
| 3.21 | % | |
| 3.10 | % | |
| 2.97 | % |
| | |
For
the quarter ended | |
| | |
12/31/2022 | | |
9/30/2022 | | |
6/30/2022 | | |
3/31/2022 | | |
12/31/2021 | |
| | |
(In
thousands) | |
| | |
| | |
| | |
| | |
| | |
| |
| Book
Value per Share (GAAP) | |
$ | 10.27 | | |
$ | 9.52 | | |
$ | 9.58 | | |
$ | 9.63 | | |
$ | 9.87 | |
| Non-GAAP adjustments: | |
| | | |
| | | |
| | | |
| | | |
| | |
| Goodwill | |
| (0.56 | ) | |
| (0.56 | ) | |
| (0.55 | ) | |
| (0.55 | ) | |
| (0.55 | ) |
| Core
deposit intangible | |
| (0.10 | ) | |
| (0.11 | ) | |
| (0.11 | ) | |
| (0.11 | ) | |
| (0.11 | ) |
| Tangible Book
Value per Share (non-GAAP) | |
$ | 9.61 | | |
$ | 8.85 | | |
$ | 8.92 | | |
$ | 8.97 | | |
$ | 9.21 | |
| | |
| | | |
| | | |
| | | |
| | | |
| | |
| Income
Before Income Taxes (GAAP) | |
$ | 12,354 | | |
$ | 7,860 | | |
$ | 7,400 | | |
$ | 7,015 | | |
$ | 8,215 | |
| Provision (credit)
for loan losses | |
| 150 | | |
| 675 | | |
| 300 | | |
| (425 | ) | |
| 300 | |
| PPP income | |
| (18 | ) | |
| (19 | ) | |
| (129 | ) | |
| (562 | ) | |
| (973 | ) |
| Gain
on defined benefit plan curtailment | |
| (2,807 | ) | |
| — | | |
| — | | |
| — | | |
| — | |
| Income
Before Taxes, Provision, PPP Income and Defined Benefit Curtailment (non-GAAP) | |
$ | 9,679 | | |
$ | 8,516 | | |
$ | 7,571 | | |
$ | 6,028 | | |
$ | 7,542 | |
| | |
| | | |
| | | |
| | | |
| | | |
| | |
| Efficiency
Ratio: | |
| | | |
| | | |
| | | |
| | | |
| | |
| Non-interest
Expense (GAAP) | |
$ | 14,003 | | |
$ | 14,343 | | |
$ | 14,433 | | |
$ | 14,456 | | |
$ | 13,923 | |
| Non-interest
Expense for Adjusted Efficiency Ratio | |
$ | 14,003 | | |
$ | 14,343 | | |
$ | 14,433 | | |
$ | 14,456 | | |
$ | 13,923 | |
| | |
| | | |
| | | |
| | | |
| | | |
| | |
| Net Interest Income
(GAAP) | |
$ | 20,854 | | |
$ | 20,288 | | |
$ | 19,392 | | |
$ | 18,698 | | |
$ | 18,582 | |
| | |
| | | |
| | | |
| | | |
| | | |
| | |
| Non-interest Income
(GAAP) | |
$ | 5,653 | | |
$ | 2,590 | | |
$ | 2,741 | | |
$ | 2,348 | | |
$ | 3,856 | |
| Non-GAAP adjustments: | |
| | | |
| | | |
| | | |
| | | |
| | |
| Bank-owned
life insurance death benefit | |
| — | | |
| — | | |
| — | | |
| — | | |
| (555 | ) |
| Loss
(gain) on securities, net | |
| — | | |
| — | | |
| — | | |
| 4 | | |
| — | |
| Unrealized
(gains) losses on marketable equity securities | |
| (19 | ) | |
| 235 | | |
| 225 | | |
| 276 | | |
| 96 | |
| Gain
on non-marketable equity investments | |
| (70 | ) | |
| (211 | ) | |
| (141 | ) | |
| — | | |
| (352 | ) |
| Gain
on defined benefit plan curtailment | |
| (2,807 | ) | |
| — | | |
| — | | |
| — | | |
| — | |
| Non-interest
Income for Adjusted Efficiency Ratio (non-GAAP) | |
$ | 2,757 | | |
$ | 2,614 | | |
$ | 2,825 | | |
$ | 2,628 | | |
$ | 3,045 | |
| Total
Revenue for Adjusted Efficiency Ratio (non-GAAP) | |
$ | 23,611 | | |
$ | 22,902 | | |
$ | 22,217 | | |
$ | 21,326 | | |
$ | 21,627 | |
| | |
| | | |
| | | |
| | | |
| | | |
| | |
| Efficiency Ratio (GAAP) | |
| 52.83 | % | |
| 62.69 | % | |
| 65.21 | % | |
| 68.69 | % | |
| 62.05 | % |
| | |
| | | |
| | | |
| | | |
| | | |
| | |
| Adjusted Efficiency
Ratio (Non-interest Expense for Efficiency Ratio (non-GAAP)/Total Revenue for Efficiency Ratio (non-GAAP)) | |
| 59.31 | % | |
| 62.63 | % | |
| 64.96 | % | |
| 67.79 | % | |
| 64.38 | % |
| | |
For
the twelve months ended | |
| | |
12/31/2022 | | |
12/31/2021 | |
| | |
(In thousands) | |
| Loans (no
tax adjustment) | |
$ | 77,264 | | |
$ | 74,200 | |
| Tax-equivalent
adjustment | |
| 494 | | |
| 420 | |
| Loans
(tax-equivalent basis) | |
$ | 77,758 | | |
$ | 74,620 | |
| | |
| | | |
| | |
| Securities (no tax
adjustment) | |
$ | 8,296 | | |
$ | 5,394 | |
| Tax-equivalent
adjustment | |
| 3 | | |
| 4 | |
| Securities
(tax-equivalent basis) | |
$ | 8,299 | | |
$ | 5,398 | |
| | |
| | | |
| | |
| Net interest income
(no tax adjustment) | |
$ | 79,232 | | |
$ | 73,177 | |
| Tax
equivalent adjustment | |
| 497 | | |
| 424 | |
| Net
interest income (tax-equivalent basis) | |
$ | 79,729 | | |
$ | 73,601 | |
| | |
| | | |
| | |
| Net interest income
(no tax adjustment) | |
$ | 79,232 | | |
$ | 73,177 | |
| Less: | |
| | | |
| | |
| Purchase
accounting adjustments | |
| 175 | | |
| (55 | ) |
| Prepayment
penalties and fees | |
| 281 | | |
| 181 | |
| PPP
fee income | |
| 728 | | |
| 6,769 | |
| Adjusted
net interest income (non-GAAP) | |
$ | 78,048 | | |
$ | 66,282 | |
| | |
| | | |
| | |
| Average interest-earning assets | |
$ | 2,396,972 | | |
$ | 2,329,877 | |
| Average interest-earnings
asset, excluding average PPP loans | |
$ | 2,391,252 | | |
$ | 2,219,286 | |
| Net interest margin
(no tax adjustment) | |
| 3.31 | % | |
| 3.14 | % |
| Net interest margin,
tax-equivalent | |
| 3.33 | % | |
| 3.16 | % |
| Adjusted net interest
margin, excluding purchase accounting adjustments, PPP fee income and prepayment penalties (non-GAAP) | |
| 3.26 | % | |
| 2.99 | % |
| | |
For
the twelve months ended | |
| | |
12/31/2022 | | |
12/31/2021 | |
| | |
(In thousands) | |
| Income
Before Income Taxes (GAAP) | |
$ | 34,629 | | |
$ | 31,724 | |
| Provision (credit)
for loan losses | |
| 700 | | |
| (925 | ) |
| PPP income | |
| (728 | ) | |
| (6,769 | ) |
| Gain
on defined benefit plan curtailment | |
| (2,807 | ) | |
| — | |
| Income
Before Taxes, Provision, PPP Income and Defined Benefit Curtailment (non-GAAP) | |
$ | 31,794 | | |
$ | 24,030 | |
| | |
| | | |
| | |
| Adjusted
Efficiency Ratio: | |
| | | |
| | |
| Non-interest Expense
(GAAP) | |
$ | 57,235 | | |
$ | 54,942 | |
| Non-GAAP adjustments: | |
| | | |
| | |
| Loss
on prepayment of borrowings | |
| — | | |
| (45 | ) |
| Non-interest
Expense for Adjusted Efficiency Ratio (non-GAAP) | |
$ | 57,235 | | |
$ | 54,897 | |
| | |
| | | |
| | |
| Net Interest Income
(GAAP) | |
$ | 79,232 | | |
$ | 73,177 | |
| | |
| | | |
| | |
| Non-interest Income
(GAAP) | |
$ | 13,332 | | |
$ | 12,564 | |
| Non-GAAP adjustments: | |
| | | |
| | |
| Loss
on securities, net | |
| 4 | | |
| 72 | |
| Unrealized
losses on marketable equity securities | |
| 717 | | |
| 168 | |
| Loss
on interest rate swap termination | |
| — | | |
| 402 | |
| Gain
on non-marketable equity investments | |
| (422 | ) | |
| (898 | ) |
| Gain
on defined benefit plan curtailment | |
| (2,807 | ) | |
| — | |
| Non-interest
Income for Adjusted Efficiency Ratio (non-GAAP) | |
$ | 10,824 | | |
$ | 12,308 | |
| Total
Revenue for Adjusted Efficiency Ratio (non-GAAP) | |
$ | 90,056 | | |
$ | 85,485 | |
| | |
| | | |
| | |
| Efficiency Ratio (GAAP) | |
| 61.83 | % | |
| 64.08 | % |
| | |
| | | |
| | |
| Adjusted Efficiency
Ratio (Non-interest Expense for Efficiency Ratio (non-GAAP)/Total Revenue for Efficiency Ratio (non-GAAP)) | |
| 63.55 | % | |
| 64.64 | % |