United States
Securities and exchange
commission
washington, d.c. 20549
FORM 6-K
report of foreign private
issuer
pursuant to rule 13a-16 or 15d-16 of
the securities exchange act of 1934
For the month of May 2025
Commission File Number 1-15224
Energy Company of Minas Gerais
(Translation of Registrant’s Name into English)
Avenida Barbacena, 1200
30190-131 Belo Horizonte, Minas Gerais, Brazil
(Address of Principal Executive Offices)
Indicate by check mark whether the registrant files or will file annual reports under cover of Form 20-F or Form 40-F.
Form 20-F a Form 40-F ___
Index
| Item | Description of Items |
| 1. | Earnings Release – 4Q2024 |
| 2. | Call Notice to Annual and Extraordinary Shareholders' Meetings |
| 3. | Board of Directors Proposal for the Annual and Extraordinary Shareholders' Meetings |
| 4. | Notice to the Market dated March 27, 2025 – Resignation of Board Member |
| 5. | Notice to the Market dated April 30, 2025 – Filing of Form 20-F |
| 6. | Notice to Shareholders dated April 30, 2025 - Resolutions passed at the AESM – Dividends/IoE |
| 7. | Notice to the Market dated May 5, 2025 – Change in Relevant Shareholding |
| 8. | Earnings Release – 1Q2025 |
Forward-Looking Statements
This report contains statements about expected future events and financial results that are forward-looking and subject to risks and uncertainties. Actual results could differ materially from those predicted in such forward-looking statements. Factors which may cause actual results to differ materially from those discussed herein include those risk factors set forth in our most recent Annual Report on Form 20-F filed with the Securities and Exchange Commission. CEMIG undertakes no obligation to revise these forward-looking statements to reflect events or circumstances after the date hereof, and claims the protection of the safe harbor for forward-looking statements contained in the Private Securities Litigation Reform Act of 1995.
SIGNATURES
Pursuant to the requirements of the Securities Exchange Act of 1934, the registrant has duly caused this report to be signed on its behalf by the undersigned, thereunto duly authorized.
COMPANHIA ENERGÉTICA DE MINAS GERAIS – CEMIG
By: /s/ Andrea Marques de Almeida .
Name: Andrea Marques de Almeida
Title: Vice President of Finance and Investor Relations
Date: May 16, 2025
| 1. | Earnings Release – 4Q2024 |

 |
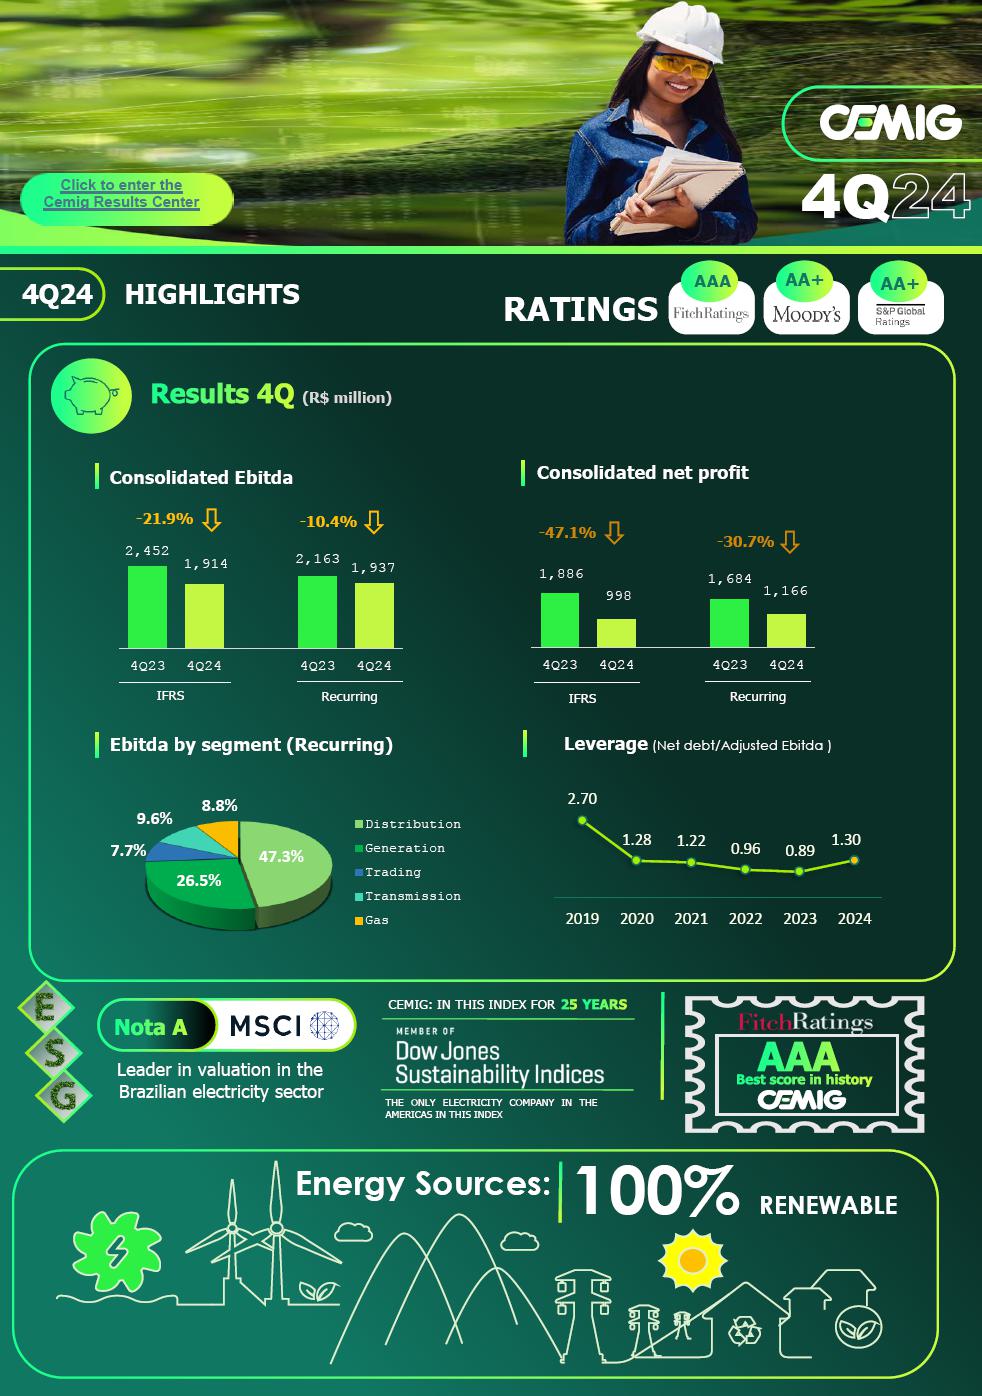
| HIGHLIGHTS – 4Q24 | |
| 4Q24 Ebitda and profit, by company | 6 |
| 4Q24 INCOME STATEMENTS | 7 |
| Results by business segment | 8 |
| CONSOLIDATED ELECTRICITY MARKET | 9 |
| Cemig D | 10 |
| Billed electricity market* | 10 |
| Sources and uses of electricity – MWh | 11 |
| Client base | 11 |
| Performances by sector | 12 |
| The 2024 Annual Tariff Adjustment | 12 |
| Five-year Tariff Reviews compared | 13 |
| Indicators of supply quality: DEC and FEC | 14 |
| Combating default | 14 |
| Energy losses | 15 |
| Cemig GT and the Cemig holding company | 16 |
| Electricity market | 16 |
| Sources and uses of electricity | 16 |
| Gasmig | 17 |
| CONSOLIDATED RESULTS | 18 |
| Net profit | 18 |
| Operational revenue | 19 |
| Operational costs and expenses | 21 |
| Finance income and expenses | 24 |
| Equity income (Gain / loss in non-consolidated investees) | 25 |
| CONSOLIDATED EBITDA (IFRS, and Adjusted) | 26 |
| Ebitda of Cemig D | 28 |
| Cemig GT – Ebitda | 29 |
| Investments | 30 |
| Debt | 31 |
| Cemig’s long-term ratings | 33 |
| ESG – Report on performance | 34 |
| Performance of Cemig’s shares | 37 |
| RAP: July 2024–June 2025 cycle | 40 |
| Regulatory transmission revenue | 41 |
| Complementary information | 41 |
| Cemig D | 41 |
| Cemig GT | 43 |
| Cemig, Consolidated | 44 |
| Disclaimer |
COMPANHIA ENERGÉTICA DE MINAS GERAIS S.A. | 5  |
| |
4Q24 Ebitda and profit, by company
| 4Q24 | 4Q23 |
Change % |
4Q24 | 4Q23 |
Change % | |
|
Ebitda by company (IFRS) |
Net profit by company (IFRS) | |||||
| (R$ mn) | ||||||
| Cemig D (IFRS) | 958 | 804 | 19.2% | 452 | 400 | 13.0% |
| Cemig GT (IFRS) | 527 | 1,173 | –55.1% | 241 | 844 | –71.4% |
| Gasmig (IFRS) | 179 | 204 | –12.1% | 112 | 139 | –19.2% |
| Consolidated (IFRS) | 1,914 | 2,452 | –21.9% | 998 | 1,886 | –47.1% |
| New replacement value (VNR) | 35 | 22 | 57.4% | |||
|
Equity income (Gain (loss) in non-consolidated investees) |
33 | 139 | –76.4% | |||
|
Consolidated (IFRS) less VNR and equity income |
1,847 | 2,291 | –19.4% | |||
| 4Q24 | 4Q23 |
Change % |
4Q24 | 4Q23 |
Change % | |
|
Adjusted Ebitda, by company |
Adjusted net profit, by company | |||||
| (R$ mn) | ||||||
| Cemig D | 958 | 804 | 19.2% | 452 | 400 | 13.0% |
| Cemig GT | 527 | 884 | –40.4% | 394 | 653 | –39.7% |
| Consolidated – Adjusted | 1,937 | 2,163 | –10.4% | 1,166 | 1,684 | –30.7% |
| New replacement value (NRV) | 35 | 22 | 57.4% | |||
| Gain (loss) in non-consolidated investees | 33 | 139 | –76.4% | |||
|
Adjusted consolidated net profit less VNR and equity income |
1,870 | 2,002 | –6.6% | |||

COMPANHIA ENERGÉTICA DE MINAS GERAIS S.A. | 6 |
| |
4Q24 INCOME STATEMENTS
| 4Q24 | 4Q23 | Change, % | |
| IN (R$ ’000) | |||
| NET REVENUE | 11,177 | 9,957 | 12.3% |
| COSTS | |||
| Cost of electricity and gas | –6,178 | –5,242 | 17.9% |
| Infrastructure construction costs | –1,518 | –1,211 | 25.4% |
| Cost of operation | –1,444 | –1,268 | 13.9% |
| Total cost | –9,140 | –7,720 | 18.4% |
| GROSS PROFIT | 2,037 | 2,236 | –8.9% |
| EXPENSES: | |||
| Client default provision | –72 | –102 | –29.4% |
| General and administrative expenses | –214 | –223 | –4.1% |
| Other expenses, net | –234 | –247 | –5.4% |
| Other revenues | 0 | 297 | –100.0% |
| Total expenses | –519 | –275 | 88.8% |
| Share of gain (loss) in non-consolidated investees | 33 | 139 | –76.4% |
| Profit before Finance income (expenses) and taxes on profit | 1,550 | 2,101 | –26.2% |
| Finance income | 284 | 368 | –23.0% |
| Finance expenses | –680 | –466 | 45.8% |
| Net finance income (expense) | –396 | –98 | 304.4% |
| Profit before income and Social Contribution taxes | 1,154 | 2,003 | –42.4% |
| Income tax and Social Contribution tax | –309 | –199 | 55.5% |
| Deferred income tax and Social Contribution tax | 153 | 82 | 86.2% |
| Deferred income tax and Social Contribution tax | –156 | –117 | 33.9% |
| NET PROFIT FOR THE PERIOD | 998 | 1,886 | –47.1% |
COMPANHIA ENERGÉTICA DE MINAS GERAIS S.A. | 7 |
| |
4Q24 Results by business segment

COMPANHIA ENERGÉTICA DE MINAS GERAIS S.A. | 8 |
| |
CONSOLIDATED ELECTRICITY MARKET
Cemig’s consolidated electricity market
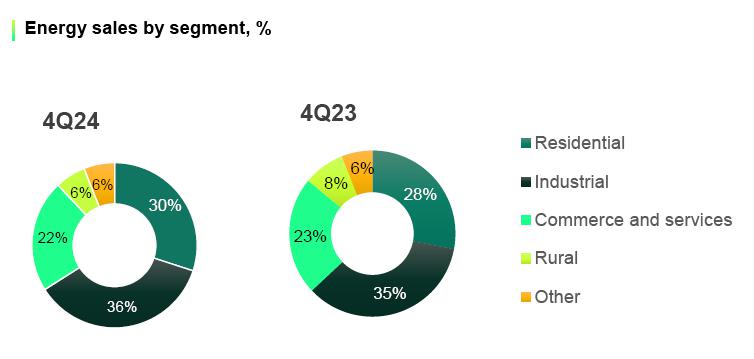
In December 2024 the Cemig Group invoiced 9.41 million clients – an addition of 191,000 clients, or a 2.1% increase in its consumer base, from December 2023. Of this total number of consumers, 9,407,944 were final consumers (including Cemig’s own consumption); and 447 were other agents in the Brazilian power sector.
The chart below itemizes the Cemig Group’s sales to final consumers:
COMPANHIA ENERGÉTICA DE MINAS GERAIS S.A. | 9 |
| |
Cemig D
Billed electricity market*
| 4Q24 | 4Q23 | Change, % | |
| Captive clients + Transmission for clients (MWh) | |||
| Residential | 3,269,139 | 3,289,232 | –0.6% |
| Industrial | 5,777,187 | 5,571,405 | 3.7% |
| Captive market | 230,020 | 302,018 | –23.8% |
| Transport of energy | 5,547,167 | 5,269,387 | 5.3% |
| Commercial, services and Others | 1,634,659 | 1,736,739 | –5.9% |
| Captive market | 967,083 | 1,156,259 | –16.4% |
| Transport | 667,576 | 580,480 | 15.0% |
| Rural | 705,045 | 836,885 | –15.8% |
| Captive market | 678,416 | 822,905 | –17.6% |
| Transport | 26,629 | 13,980 | 90.5% |
| Public services | 835,511 | 915,843 | –8.8% |
| Captive market | 659,449 | 797,873 | –17.3% |
| Transport | 176,062 | 117,970 | 49.2% |
| Concession holders | 87,742 | 86,502 | 1.4% |
| Transport | 87,742 | 86,502 | 1.4% |
| Own consumption | 7,678 | 8,005 | –4.1% |
| Total | 12,316,961 | 12,444,612 | –1.0% |
| Total, captive market | 5,811,785 | 6,376,292 | –8.9% |
| Total, energy transported for Free Clients | 6,505,176 | 6,068,320 | 7.2% |
* Excludes supply offset in distributed generation.
Electricity billed to captive clients plus transport of energy for Free Clients and distributors, excluding supply offset in distributed generation, totaled 12,317 GWh in 4Q24. This was 1.0% lower than in 4Q23. The lower total was mainly due to lower consumption in three client categories: consumption by rural consumers was down 15.8% (131.8 GWh) YoY; commercial consumption was down 5.9%, or 102.1 GWh; and public services consumed 8.8% (80.3 GWh) less than in 4Q23. These differences reflect: (i) migration to distributed generation; (ii) milder temperatures; and (iii) higher rainfall – less need for irrigation. On the other hand, consumption by industrial clients was 205.7 GWh (3.7%) higher, reflecting higher industrial production.
The lower total of energy distributed (down 1.0% YoY) reflected: Total consumption by the captive market 8.9% (564.5 GWh) lower, and use of the network by Free Clients 7.2% (436.9 GWh) higher.
COMPANHIA ENERGÉTICA DE MINAS GERAIS S.A. | 10 |
| |
Sources and uses of electricity – MWh
| 4Q24 | 4Q23 | Change, % | |
| Metered market – MWh | |||
| Transported for distributors | 87,742 | 85,586 | 2.5% |
| Transported for Free Clients | 6,457,709 | 6,000,168 | 7.6% |
| Own load + Distributed generation | 8,773,661 | 9,428,348 | –6.9% |
| Consumption by captive market | 5,924,306 | 6,472,529 | –8.5% |
| Distributed generation market | 1,466,740 | 1,231,100 | 19.1% |
| Losses in distribution network | 1,382,615 | 1,724,719 | –19.8% |
| Total volume carried | 15,319,112 | 15,514,102 | –1.3% |
Client base
In December 2024 Cemig D billed 9.40 million consumers, or 2.1% more than in December 2024.
Of this total, 4,414 were Free Clients using the distribution network of Cemig D.
| Dec. 2024 | Dec. 2023 | Change, % | |
| NUMBER OF CAPTIVE CLIENTS | |||
| Residential | 7,960,300 | 7,725,836 | 3.0% |
| Industrial | 23,807 | 28,437 | –16.3% |
| Commercial, services and Others | 916,307 | 943,831 | –2.9% |
| Rural | 405,953 | 422,829 | –4.0% |
| Public authorities | 72,681 | 69,670 | 4.3% |
| Public lighting | 7,209 | 6,659 | 8.3% |
| Public services | 13,688 | 13,703 | –0.1% |
| Own consumption | 789 | 758 | 4.1% |
| Total, captive clients | 9,400,734 | 9,211,723 | 2.1% |
| NUMBER OF FREE CLIENTS | |||
| Industrial | 1,865 | 1,221 | 52.7% |
| Commercial | 2,377 | 1,714 | 38.7% |
| Rural | 84 | 22 | 281.8% |
| Concession holders | 8 | 8 | 0.0% |
| Others | 80 | 22 | 263.6% |
| Total, Free Clients | 4,414 | 2,987 | 47.8% |
| Total, Captive market + Free Clients | 9,405,148 | 9,214,710 | 2.1% |
COMPANHIA ENERGÉTICA DE MINAS GERAIS S.A. | 11 |
| |
Performances by sector
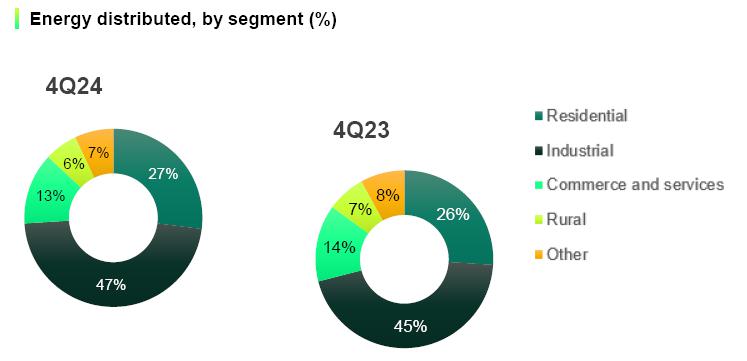
Industrial: Energy distributed to industrial clients was 3.7% higher YoY in 4Q24, on higher physical production by industry, and was 46.9% of Cemig D’s total distribution. The greater part was energy transported for industrial Free Clients (45.0%), which was 5.3% higher by volume than in 4Q23. Energy billed to captive industrial clients was 1.9% of the total distributed, and 23.8% less by volume than in 4Q23 – mainly due to migration of clients to the Free Market. Highlights in industry by sector were: Increased consumption in Ferroalloys (up 13.1% YoY), Cement (up 10.3%), Chemicals (up 8.5%), Food and beverages (up 5.3%), and Extractive industries (up 3.3%) – while consumption by the Non-ferrous metals sector was down 12.6%, YoY.
Residential: Residential consumption was 26.5% of total energy distributed by Cemig D, and 0.6% higher than in 4Q23. Average monthly consumption per consumer in the quarter, at 136.9 kWh/month, was 3.5% lower than in 4Q23, reflecting milder temperatures than in 4Q23. On the other hand, the total number of residential clients was increased by 2.1% year-on-year (234,500 new clients).
Commercial and services: Energy distributed to these consumers was 13.3% of the total distributed by Cemig D in 4Q24, and by volume 5.9% less than in 4Q23. The change is the result of a 16.4% reduction in the volume of energy billed to captive clients, and a 15.0% increase in the volume of energy transported for Free Clients. The lower consumption reflects: (i) milder temperatures, and (ii) migration of clients to distributed generation.
Rural: Consumption by rural clients was 6.8% of the total energy distributed, and was 15.8% lower by volume than in 4Q23. This mainly reflected lower consumption for irrigation, and a reduction of 4.0% in the number of consumer units in this category.
Public services: consumed 6.8% of the energy distributed in 4Q24, and was 8.8% less by volume than in 4Q23.
The 2024 Annual Tariff Adjustment
The tariffs of Cemig D undergo and Annual Tariff Adjustment are adjusted in May each year; and every five years are subjected to a Periodic Tariff Review, also in May. The aim of the Annual Tariff Adjustment is to pass on changes in the costs defined as “non-manageable” in full to the client, and provide inflation adjustment for the costs defined as “manageable”, as specified in the Tariff Review. Manageable costs are adjusted by the IPCA inflation index, less a factor known as the ‘X Factor’, designed to capture productivity, under a system using the price-cap regulatory model.
On May 14, 2024 Aneel ratified Cemig D’s Tariff Adjustment to be effective from May 28, 2024 to May 27, 2025, with an average increase, for consumers, of 7.32%. The average effect for low-voltage clients was an increase of 6.72%, and for residential consumers an increase of 6.70%. The component percentage corresponding to manageable costs (referred to as ‘Portion B’) was 1.27%. The increase relating to non-manageable costs (‘Portion A’ – comprising purchase of energy, transmission, sector charges and non-recoverable revenues) was 0.81%. The increase in the financial components of the tariff contributed 5.23%. The financial-components effect in 2024 comes mainly from absence of the item included in the 2023 adjustment process relating to the repayment to consumers of PIS, Pasep and Cofins taxes totaling R$ 1.27 billion.
| Average effects of the Tariff Adjustment | |
| High voltage – average | 8.63% |
| Low voltage – average | 6.72% |
| Average effect | 7.32% |
See more details at this link:
https://www2.aneel.gov.br/aplicacoes/tarifa/arquivo/Nota%20T%C3%A9cnica%20RTA%202024_CEMIG.pdf
COMPANHIA ENERGÉTICA DE MINAS GERAIS S.A. | 12 |
| |
Five-year Tariff Reviews compared
Comparison of the Tariff Reviews made in 2023 and in the previous cycle (2018):
| Five-year Tariff Reviews | 2018 | 2023 |
| Gross Remuneration Base R$ million | 20,490 | 25,587 |
| Net Remuneration Base R$ million | 8,906 | 15,200 |
| Average depreciation rate: | 3.84% | 3.95% |
| WACC (after taxes) | 8.09% | 7.43% |
| Remuneration of ‘Special Obligations’ R$ mn | 149 | 272 |
| CAIMI * R$ mn | 333 | 484 |
| QRR ** (Depreciation calculation) R$ mn | 787 | 1,007 |
* CAIMI: (Cobertura Anual de Instalações Móveis e Imóveis) – Annual support for facilities.
** QRR: ‘Regulatory Reintegration Quota’ – Gross base x annual depreciation rate.
See more details at this link:
https://www2.aneel.gov.br/aplicacoes/tarifa/arquivo/NT%2012%202023%20RTP%20Cemig.pdf
COMPANHIA ENERGÉTICA DE MINAS GERAIS S.A. | 13 |
| |
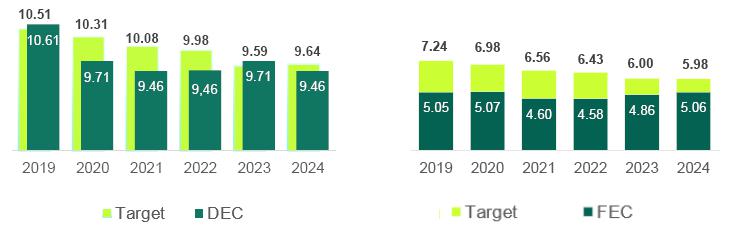
Indicators of supply quality: DEC and FEC
In 2023 the State of Minas Gerais experienced an increase in extreme atmospheric events, which caused a slight increase in electricity outages. In this challenging context Cemig has taken extra steps to reduce outage duration and frequency, and is making major investments in its distribution operation to maximize service quality.
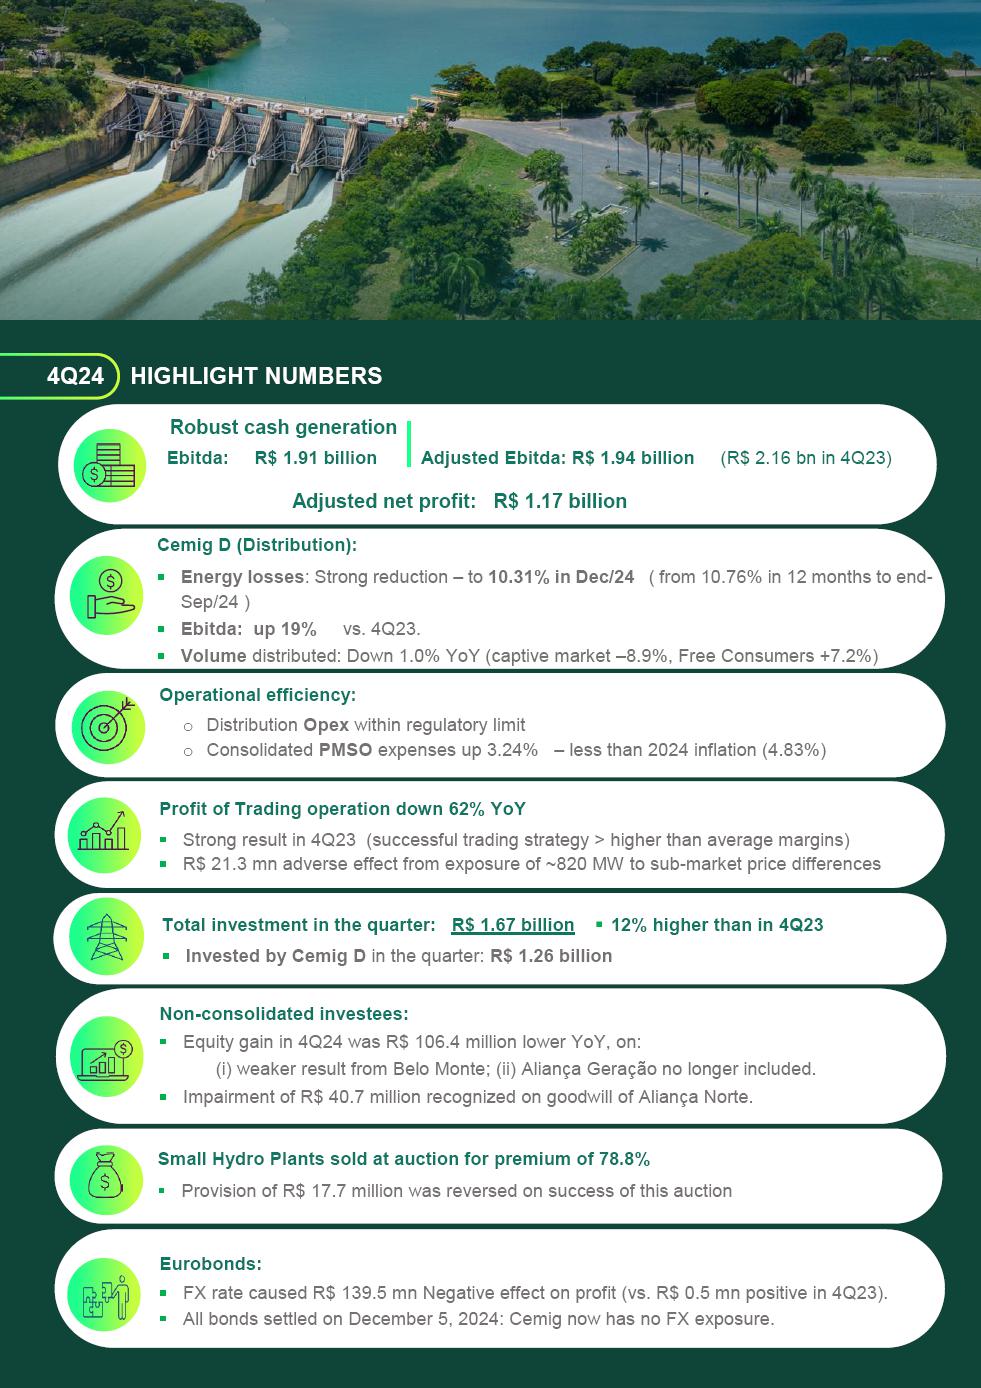
These actions have produced positive results. Cemig’s DEC (average outage Duration per Consumer) is now within the regulatory limit of 9.64 hours: in the 12 months to end-December it was 9.46 hours.
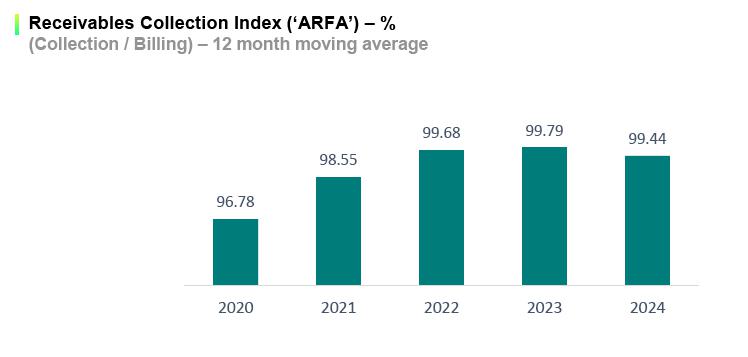
Combating default
The Company has kept collection actions at a high level, helping to keep its Receivables Recovery Index (collection / billing) also high – in December 2024 this index was 99.44%.
New payment channels, and online negotiation, have helped to increase the proportion of collection via digital channels (the PIX instant payment system, automatic debits, payments by card and app, etc.) – which at the end of 2024 reached 67.0% of the total collected, compared to 61.3% in 2023. Of all these, the PIX system stands out – it was used for 31.3% of all collections in December 2024 – and has saved R$ 30.6 million in payment charges/costs since it was implemented. The change in the payments mix has reduced Cemig’s costs of collection/receipt by 15% compared to 2023.
COMPANHIA ENERGÉTICA DE MINAS GERAIS S.A. | 14 |
| |
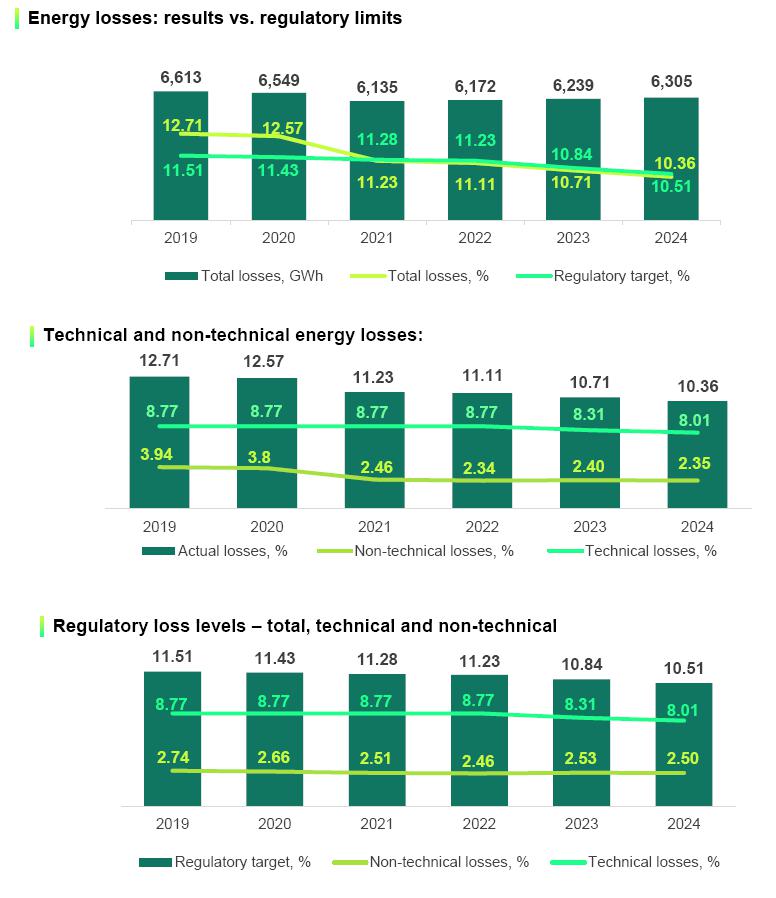
Energy losses
In the 12 months to Dec. 31, 2024, Cemig’s energy losses were 10.36%, below the regulatory target of 10.51%.
Cemig’s success in combating energy losses in 2024 has several components that deserve highlighting: approximately 385,000 inspections; replacement of more than 550,000 obsolete meters; replacement of 57,000 conventional meters by smart meters (bringing the total of smart meters installed since the project began in September 2021 to 370,000); and regularization of 12,200 clandestine connections made by families living in ‘invaded’ and low–income areas, through our Energia Legal program, which uses ‘bulletproofed’ networks (bringing the total of connections regularized since the start of the project in February 2023 to 22,800). Planned for 2025 are: 340,000 inspections; installation of more than 400,000 smart meters; and regularization of 54,000 families in low-income communities (using BT Zero and ‘Bulletproofed Meter Panel’ technologies).
COMPANHIA ENERGÉTICA DE MINAS GERAIS S.A. | 15 |
| |
Cemig GT and the Cemig holding company
Electricity market
The total volume of electricity sold by Cemig GT and by the holding company (‘Cemig H’), excluding sales on the wholesale power exchange (CCEE), was 2.5% higher than in 4Q23. Cemig GT billed 5,526 GWh (including quota sales) in 4Q24, 5.8% less than in 4Q23. The lower figure is the result of transfer of sales contracts to Cemig H (the holding company) – which reported sales of 5,108 GWh in 4Q24, 12.7% more than in 4Q23. The migration of purchase contracts from Cemig GT to the holding company began in 3Q21, and has continued gradually since then. It is now around 60%.
| 4Q24 | 4Q23 | Change % | |
| Cemig GT – MWh | |||
| Free Clients | 3,218,766 | 3,204,224 | 0.5% |
| Industrial | 2,128,481 | 2,266,144 | –6.1% |
| Commercial | 874,426 | 932,015 | –6.2% |
| Rural | 5,793 | 6,065 | –4.5% |
| Public authorities | – | – | – |
| ‘Energy retailer’ Free Clients | 210,065 | – | – |
| Free Market – Traders and cooperatives | 1,140,822 | 1,502,666 | –24.1% |
| Quota supply | 574,432 | 574,322 | 0.0% |
| Regulated Market | 559,016 | 551,032 | 1.4% |
| Regulated Market – Cemig D | 33,253 | 33,715 | –1.4% |
| Total, Cemig GT | 5,526,289 | 5,865,959 | –5.8% |
| Cemig H – MWh | |||
| Free Clients | 2,564,269 | 2,370,840 | 8.2% |
| Industrial | 2,067,268 | 1,999,957 | 3.4% |
| Commercial | 458,409 | 352,946 | 29.9% |
| Rural | 38,592 | 17,937 | 115.2% |
| Free Market – Traders and cooperatives | 2,543,342 | 2,161,692 | 17.7% |
| Total Cemig H | 5,107,611 | 4,532,532 | 12.7% |
| Cemig GT + H | 10,633,900 | 10,398,491 | 2.3% |
Sources and uses of electricity
COMPANHIA ENERGÉTICA DE MINAS GERAIS S.A. | 16 |
| |
Gasmig
Gasmig is the exclusive distributor of piped natural gas for the whole of the state of Minas Gerais. It supplies industrial, commercial and residential users, compressed natural gas and vehicle natural gas, and gas as fuel for thermoelectric generation plants. Its concession expires in January 2053. Cemig owns 99.57% of Gasmig.
Gasmig’s last Tariff Review was completed in April 2022. Highlights of that Review:
| § | The WACC used (real, after taxes) was reduced from 10.02% p.a. to 8.71% p.a. |
| § | The Net Remuneration Base was increased significantly, to R$ 3.48 billion. |
| § | The regulator recognized the PMSO cost (Personnel, Materials, outsourced Services, Other expenses) in full. |
| Market (Volume in ’000m3) | 2022 | 2023 | 2024 | Change, 2023–24 |
| Automotive | 40,950 | 31,907 | 22,511 | –29.4% |
| Compressed vehicle natural gas | 364 | 541 | 630 | 16.5% |
| Industrial | 870,667 | 830,943 | 786,363 | –5.4% |
| Industrial compressed natural gas | 13,616 | 12,473 | 10,275 | –17.6% |
| Residential | 11,392 | 11,912 | 12,095 | 1.5% |
| Co-generation | 13,137 | 12,075 | 12,164 | 0.7% |
| Commercial | 23,114 | 21,964 | 23,203 | 5.6% |
| Subtotal – conventional gas | 973,240 | 921,815 | 867,241 | –5.9% |
| Thermal plants | 37,991 | – | – | – |
| Subtotal – gas sold | 1,011,231 | 921,815 | 867,241 | –5.9% |
| Industrial – Free Market | 87,133 | 92,362 | 97,302 | 5.3% |
| Industrial compressed natural gas – Free Market | – | – | 10,421 | – |
| Thermal – Free Market | 7,119 | 19,050 | 58,046 | 205% |
| Total (sales + Free Clients) | 1,105,483 | 1,033,227 | 1,033,010 | 0.0% |
| Ebitda (R$ ’000) | 4Q24 | 4Q23 |
| Profit (loss) for the period | 112,101 | 138,803 |
| Net finance income (expenses) | 15,189 | 2,649 |
| Income tax and Social Contribution tax | 28,569 | 40,011 |
| Depreciation and amortization | 23,361 | 22,257 |
| Ebitda per CVM Resolution 156 | 179,150 | 203,720 |
The volume of gas sold in 2024 was 5.9% lower than in 2023, while the volume distributed to industrial Free Clients was 48.8% higher. In 4Q24, total volume sold was 259,900 m3, 1.5% lower than in 4Q23; the captive market diminished by 3.9%, and the free market grew 11.9%.
Gasmig’s Ebitda was 11.3% lower in 4Q24 than 4Q23, reflecting lower volume of gas sold to the captive market.
The number of Gasmig’s clients increased by 8.3% from 4Q23, to a total of 103,885 consumers in December 2024. This reflects expansion of both the commercial and the residential client bases (addition of 8,000 clients).

COMPANHIA ENERGÉTICA DE MINAS GERAIS S.A. | 17 |
| |
CONSOLIDATED RESULTS
Net profit
Cemig reports 4Q24 net profit of R$ 998 million, which compares with net profit of R$ 1,886 million in 4Q23. 4Q24 Adjusted net profit is R$ 1,166 million, vs. R$ 1,684 million in 4Q23. Main factors in this result were:
| § | Profit in electricity trading was 61% lower YoY: the 4Q23 comparison base was high, due to a successful strategy in that quarter which achieved a margin significantly above the historical average. |
| § | Equity income (the gain/loss in non-consolidated investees) was R$ 106.4 million lower, due to (i) a weaker result in Belo Monte, and (ii) the absence of Aliança Energia, after Cemig sold its stake in Aliança in 3Q24. |
| § | Cemig D distributed 1.0% less energy in 4Q24 than in 4Q23. |
| § | Net profit of Gasmig was R$ 26.7 million lower, YoY, on lower volume of gas distributed, and worst net financial result. |
| § | Net profit of Cemig D was R$ 52 million higher YoY, mainly reflecting the reduction in energy losses. |
| § | 4Q23 comp: Sales of Baguari and Retiro Baixo provided a gain of R$ 201.9 million in the profit of 4Q23. |
Main non-recurring effects:
| § | Negative: R$ 40.7 million impairment of the entire goodwill carried for the investment in Norte Energia. |
| § | Positive: Reversal, after the successful auction in December of four Small Hydro Plants, of the R$ 11.7 million provision that had been made in 1Q24 for potential impairment of their value. |
| § | Negative: FX variation in 4Q on the US dollar debt, net of the hedge, was R$ 139.5 million negative, compared to R$ 0.5 million positive in 4Q23. The debt was settled in full on December 5. Cemig now has no FX exposure. |
More details of these variations are given below.
COMPANHIA ENERGÉTICA DE MINAS GERAIS S.A. | 18 |
| |
Operational revenue
| 4Q24 | 4Q23 | Change % | |
| R$ ’000 | |||
| Revenue from supply of electricity | 9,621,909 | 8,917,462 | 7.9% |
| Revenue from use of distribution systems (TUSD charge) | 1,375,131 | 1,192,593 | 15.3% |
| CVA and Other financial components in tariff adjustments | 46,797 | –149,466 | –131.3% |
| Reimbursement to consumers of PIS, Pasep and Cofins tax credits | 0 | 339,403 | –100.0% |
| Transmission – Operation and Maintenance revenue | –20,355 | 93,755 | –121.7% |
| Transmission – Construction revenue | 144,472 | 92,883 | 55.5% |
| Financial remuneration of transmission contractual assets | 219,467 | 123,340 | 77.9% |
| Generation capital reimbursement | 23,232 | 22,783 | 2.0% |
| Distribution construction revenue | 1,402,318 | 1,141,888 | 22.8% |
|
Adjustment to expectation of cash flow from indemnifiable financial assets of the distribution concession |
34,754 | 22,086 | 57.4% |
| Gain on financial updating of Concession Grant Fee | 117,770 | 97,046 | 21.4% |
| Settlements on CCEE | 10,078 | 65,949 | –84.7% |
| Retail supply of gas | 988,396 | 952,998 | 3.7% |
| Fine for continuity indicator shortfall | –45,311 | –46,066 | –1.6% |
| Other revenues | 843,978 | 634,041 | 33.1% |
| Taxes and charges reported as deductions from revenue | –3,585,759 | –3,544,009 | 1.2% |
| Net revenue | 11,176,877 | 9,956,686 | 12.3% |
Revenue from supply of electricity
| 4Q24 | 4Q23 | Change, % | |||||||
| MWh | R$ ’000 |
Average price billed R$/MWh (1) |
MWh | R$ ’000 |
Average price billed R$/MWh (1) |
MWh | R$ ’000 | ||
| Residential | 3,759,818 | 3,654,240 | 971.92 | 3,695,589 | 3,169,467 | 857.64 | 1.7% | 15.3% | |
| Industrial | 4,596,957 | 1,372,739 | 298.62 | 4,642,626 | 1,470,323 | 316.7 | –1.0% | –6.6% | |
| Commercial, services and others | 2,808,877 | 1,752,088 | 623.77 | 3,045,990 | 1,706,210 | 560.15 | –7.8% | 2.7% | |
| Rural | 783,160 | 659,721 | 842.38 | 981,836 | 641,985 | 653.86 | –20.2% | 2.8% | |
| Public authorities | 263,884 | 261,667 | 991.6 | 284,337 | 243,756 | 857.28 | –7.2% | 7.3% | |
| Public lighting | 237,575 | 141,545 | 595.79 | 255,135 | 133,719 | 524.11 | –6.9% | 5.9% | |
| Public services | 203,044 | 184,125 | 906.82 | 268,988 | 208,204 | 774.03 | –24.5% | –11.6% | |
| Subtotal | 12,653,315 | 8,026,125 | 634.31 | 13,174,501 | 7,573,664 | 574.87 | –4.0% | 6.0% | |
| Own consumption | 7,678 | – | – | 8,005 | – | – | –4.1% | – | |
| Retail supply not yet invoiced, net | – | 224,546 | – | – | 108,855 | – | – | – | |
| 12,660,993 | 8,250,671 | 634.31 | 13,182,506 | 7,682,519 | 574.87 | –4.0% | 7.4% | ||
|
Wholesale supply to other concession holders (2) |
4,762,961 | 1,338,863 | 281.1 | 4,742,073 | 1,206,718 | 254.47 | 0.4% | 11.0% | |
|
Wholesale supply not yet invoiced, net |
– | 32,375 | – | – | 28,225 | – | – | 14.7% | |
| Total | 17,423,954 | 9,621,909 | 537.71 | 17,924,579 | 8,917,462 | 490.07 | –2.8% | 7.9% | |
| (1) | The calculation of average price does not include revenue from supply not yet billed. |
| (2) | Includes Regulated Market Electricity Sale Contracts (CCEARs) and ‘bilateral’ contracts with other agents. |
COMPANHIA ENERGÉTICA DE MINAS GERAIS S.A. | 19 |
| |
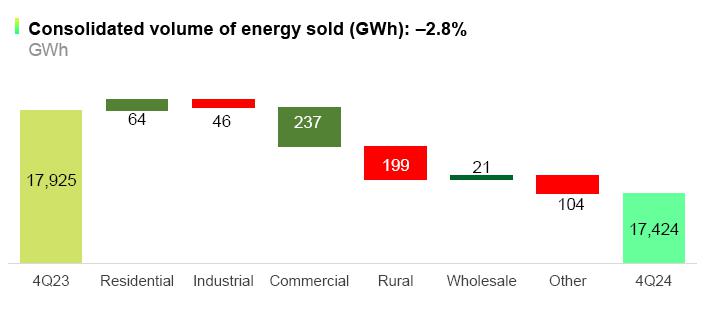
Energy sold to final consumers
Gross revenue from energy sold to final consumers in 4Q24 was R$ 8,250.7 million, which compares with R$ 7,682.50 million in 4Q23, a year-on-year increase of 7.4%, in spite of the total volume of energy sold to final consumers being 4.0% lower. The variation in revenue is mainly explained by the tariff increase for Distribution which came into effect on May 28, 2024, with average effect of 7.32%.
Transmission
| 4Q24 | 4Q23 | Change % | |
| TRANSMISSION REVENUE (R$ ’000) | |||
| Operation and maintenance | –20,355 | 93,755 | –121.7% |
| Infrastructure construction, updating and enhancement | 144,472 | 92,883 | 55.5% |
| Financial remuneration of transmission contractual assets | 219,467 | 123,340 | 77.9% |
| Total | 343,584 | 309,978 | 10.8% |
Transmission revenues amounted to R$343.6 million in 4Q24, an increase of R$33.6 million over 4Q23. This growth was influenced by the 55.5% increase (+R$51.6 million) in construction revenue, mainly due to the greater volume invested in reinforcements and improvements and the implementation of lot 1 of the 02/2022 auction. Revenue from operation and maintenance plus the remuneration of contract assets totaled R$199.1 million, representing a reduction of 8.3%. (Note that the revenues shown take into account eliminations of transactions between the companies consolidated in the group).
Gas
Gross revenue from supply of gas in 4Q24 totaled R$ 988.4 million, compared to R$ 953.0 million in 4Q23. This higher figure reflects the higher prices charged to consumers than in the prior year – the increase in prices for acquisition of gas were passed through to the consumer.
Revenue from Use of Distribution Systems – the TUSD charge
| 4Q24 | 4Q23 | Change % | |
| TUSD (R$ ’000) | |||
| Use of the Electricity Distribution System | 1,375,131 | 1,192,593 | 15.3% |
COMPANHIA ENERGÉTICA DE MINAS GERAIS S.A. | 20 |
| |
In 4Q24 revenue from the TUSD – charged to Free Consumers for distribution of their energy – was R$ 182.5 million higher than in 4Q23. This mainly reflects: (i) volume of energy transported for Free Clients 7.2% higher; and (ii) the distribution company’s annual tariff adjustment.
| 4Q24 | 4Q23 | Change % | |
| POWER TRANSPORTED – MWh | |||
| Industrial | 5,547,167 | 5,269,387 | 5.3% |
| Commercial | 667,576 | 580,480 | 15.0% |
| Rural | 26,629 | 13,980 | 90.5% |
| Public services | 176,062 | 117,970 | 49.2% |
| Concession holders | 87,742 | 86,502 | 1.4% |
| Total energy transported | 6,505,176 | 6,068,320 | 7.2% |
Operational costs and expenses
| 4Q24 | 4Q23 | Change % | |
| CONSOLIDATED (R$ ’000) | |||
| Electricity bought for resale | 4,922,913 | 3,957,150 | 24.4% |
| Charges for use of national grid | 691,644 | 762,268 | –9.3% |
| Gas purchased for resale | 563,716 | 522,622 | 7.9% |
| Construction cost | 1,518,396 | 1,210,562 | 25.4% |
| People | 332,460 | 348,543 | –4.6% |
| Employees’ and managers’ profit shares | 48,902 | 38,746 | 26.2% |
| Post-employment liabilities | 121,809 | 161,347 | –24.5% |
| Materials | 36,933 | 51,276 | –28.0% |
| Outsourced services | 618,024 | 511,225 | 20.9% |
| Depreciation and amortization | 363,995 | 351,452 | 3.6% |
| Provisions (reversals) | 169,850 | 88,390 | 92.2% |
| Impairment | 17,087 | 0 | – |
| Provisions for client default | 72,204 | 102,311 | –29.4% |
| Provision for loss with related party | 0 | 1,250 | – |
| Other operating costs and expenses | 181,519 | 185,091 | –1.9% |
| Other costs and expenses | 9,659,452 | 8,292,233 | 16.5% |
| Gain on disposal of investments | 0 | –288,308 | – |
| Adjustment to fair value of prior holding | 0 | –8,638 | – |
| Total, other revenues (reducing expenses) | 0 | –296,946 | – |
| Total | 9,659,452 | 7,995,287 | 20.8% |
Operational costs and expenses in 4Q24 totaled R$ 9.66 billion, compared to R$ 7.99 billion in 4Q23. The main factors in the higher total were: Cost of energy bought for resale was R$ 965.8 million higher; cost of construction was R$ 307.8 million higher; and outsourced services, R$ 106.8 million higher. Also, in 4Q23, the account Other revenues reducing expenses posted a total of R$ 296.9 million. See more details on costs and expenses in the following pages.
COMPANHIA ENERGÉTICA DE MINAS GERAIS S.A. | 21 |
| |
Electricity purchased for resale
| 4Q24 | 4Q23 | Change % | |
| CONSOLIDATED (R$ ’000) | |||
| Electricity acquired in Free Market | 1,573,303 | 1,551,187 | 1.4% |
| Electricity acquired in Regulated Market auctions | 1,302,137 | 1,043,326 | 24.8% |
| Distributed generation | 1,038,791 | 669,582 | 55.1% |
| Spot market | 523,810 | 119,014 | 340.1% |
| Supply from Itaipu Binacional | 312,780 | 310,765 | 0.6% |
| Physical guarantee quota contracts | 215,798 | 243,828 | –11.5% |
| Individual (‘bilateral’) contracts | 124,309 | 128,695 | –3.4% |
| Proinfa | 122,333 | 126,923 | –3.6% |
| Quotas for Angra I and II nuclear plants | 92,453 | 91,736 | 0.8% |
| Credits of PIS, Pasep and Cofins taxes | –382,799 | –327,906 | 16.7% |
| 4,922,915 | 3,957,150 | 24.4% |
The consolidated expense on electricity bought for resale in 4Q24 was R$ 4.92 billion, an increase of 24.4% (R$ 965.8 million) from 4Q23. This reflects, mainly:
| § | Regulated Market: Expenses on energy acquired in the Regulated Market were R$ 258.8 million (+24.8%) higher than in 4Q23, reflecting (i) the annual adjustments to contracts, by the IPCA inflation index, and (ii) entry of new contracts. |
| § | Distributed generation: The expense on distributed generation was R$ 369.2 million (+55.1%) higher, reflecting the 20% growth in the number of generation units (from 250,000 in December 2024, to 302,000 in December 2024). The volume of energy injected from distributed generation in 4Q24, at 1,656 GWh, was 15.1% higher than in 4Q23. |
| § | Free Market: The costs of energy acquired in the Free Market (Cemig’s highest cost of purchased energy) totaled R$ 1,573 million, an increase of R$ 22.1 million (+1.4%) in relation to 4Q23. |
| § | Spot market: There was a net increase of R$ 404.8 million in the cost of purchases in the spot market, caused mainly by the impact of the hourly modulation in the spot price, especially in Cemig D, and also by a higher cost of hydrological risk, due to the weaker hydrology in 2024. |
(Note:) For Cemig D, purchased energy is a non-manageable cost: the difference between the amounts used as a reference for calculation of tariffs and the costs actually incurred is compensated for in the next tariff adjustment.
| Energy purchased – Cemig D | 4Q24 | 4Q23 | Change % |
| Cemig D (R$ ’000) | |||
| Supply acquired in auctions on the Regulated Market | 1,313,284 | 1,087,449 | 20.8% |
| Distributed generation | 1,038,791 | 669,582 | 55.1% |
| Spot market – CCEE | 355,623 | 121,212 | 193.4% |
| Supply from Itaipu Binacional | 312,780 | 310,765 | 0.6% |
| Physical guarantee quota contracts | 220,087 | 247,007 | –10.9% |
| Individual (‘bilateral’) contracts | 124,309 | 128,695 | –3.4% |
| Proinfa | 122,333 | 126,923 | –3.6% |
| Quotas for Angra I and II nuclear plants | 92,453 | 91,736 | 0.8% |
| Credits of PIS, Pasep and Cofins taxes | –223,600 | –184,972 | 20.9% |
| 3,356,060 | 2,598,397 | 29.2% |
COMPANHIA ENERGÉTICA DE MINAS GERAIS S.A. | 22 |
| |
Charges for use of the transmission network and other system charges
Charges for use of the transmission network in 4Q24 were R$ 691.6 million, 9.3% lower than in 4Q23.
(This is a non-manageable cost in the distribution business: the difference between the amounts used as a reference for calculation of tariffs and the costs actually incurred is compensated for in the next tariff adjustment.)
Gas purchased for resale
The expense on acquisition of gas in 4Q24 was R$ 563.7 million, or 7.9% higher than in 4Q23. This variation reflects a higher price of gas purchased for resale, but with volume of gas distributed 1.5% lower.
Outsourced services
Expenditure on outsourced services was 20.9% (R$ 106.8 million) higher than in 4Q23, the main factors being: (i) maintenance of electrical facilities and equipment, R$ 22.1 million (10.6%) higher; (ii) the expense on tree pruning, R$ 9.3 million (54.9%) higher; (iii) expense on IT R$ 7.4 million (15.6%) higher; and (iv) cleaning of power line pathways, R$ 7.3 million (21.4%) higher.
Provisions for client default
The expense on provisions for losses due to client default in 4Q24 was R$ 72.2 million, or R$ 30.1 million lower than in 4Q23, reflecting both (i) the Company’s efforts in combating default, and (ii) the revision, in 3Q24 (with positive effect in the subsequent 12 months), of the criteria for accounting overdue client receivables (increasing the threshold for posting a 100% write-off from 12 to 36 months, to provide a more faithful reflection of the actual behavior of Cemig clients in practice).
Provisions
Provisions in 4Q24 totaled R$ 186.9 million, compared to R$ 88.4 million in 4Q23. This included a provision of R$ 40.7 million for impairment of goodwill in Aliança Norte, and higher contingency provisions for employment-law and third-party-liability legal actions.
Post-employment liabilities
The impact of the post-retirement obligations on operational profit in 4Q24 was an expense of R$ 121.8 million, compared to an expense of R$ 161.3 million in 4Q23.
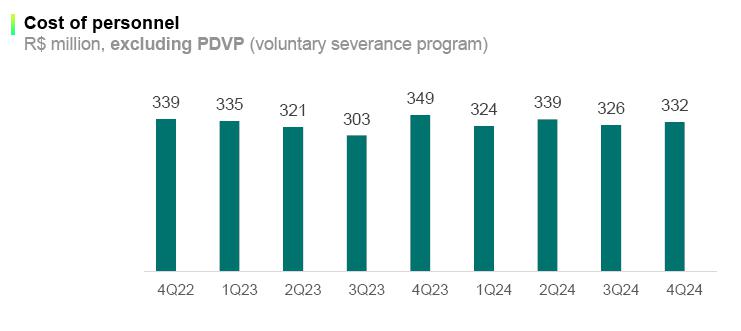
People
The expense on personnel in 4Q24 was R$ 332.5 million, compared to R$ 348.5 million in 4Q23. The figure was 4.6% lower in spite of the 4.6% increase in salaries from November 2024, under the Collective Work Agreement.
COMPANHIA ENERGÉTICA DE MINAS GERAIS S.A. | 23 |
| |

Finance income and expenses
| 4Q24 | 4Q23 | Change % | |
| (R$ ’000) | |||
| Finance income | 283,578 | 368,351 | –23.0% |
| Finance expenses | –679,958 | –466,361 | 45.8% |
| Net finance income (expenses) | –396,380 | –98,010 | 304.4% |
For 4Q24 the Company posted consolidated net financial expenses of R$ 396.4 million, compared to net financial expenses of R$ 98 million in 4Q23. Main factors:
| § | FX variation: Net negative effect, of R$ 211.4 million, in 4Q24, from foreign exchange variation on the debt in US dollars and the related hedge. This effect in 4Q24 reflects 11.2% appreciation in the US dollar exchange rate up to December 5 (the date when the debt was settled) – whereas in 4Q23, this effect had been positive, at R$ 0.8 million, as the dollar depreciated (3.3%) against the Real in that quarter. |
| § | Monetary updating of loans: The financial expense posted for monetary updating of loans was R$ 71.4 million higher, and borrowing costs were R$ 35.4 million higher – reflecting (i) gross debt R$ 2.4 billion higher, and (ii) higher IPCA inflation in the quarter (1.47%) than in 4Q23 (1.08%). |
| § | Revenue from cash investments, on the other hand, at R$ 148.9 million, was R$ 20.9 million higher than in 4Q23 – mainly on a higher volume of cash available for investment in 4Q24. |
Eurobonds: Effects in fourth quarter R$ ’000
| 4Q24 | 4Q23 | |
| Effect of FX variation on the debt | –232,629 | 117,828 |
| Effect on the hedge | 21,242 | –117,019 |
| Net effect in Finance income (expenses) | –211,387 | 809 |
COMPANHIA ENERGÉTICA DE MINAS GERAIS S.A. | 24 |
| |
Equity income (Gain / loss in non-consolidated investees)
| R$ ’000 | 4Q24 | 4Q23 | Change R$ ’000 |
| Gain/loss in non-consolidated investees | |||
| Taesa | 110,989 | 97,880 | 13,109 |
| Aliança Geração | – | 37,780 | –37,780 |
| Paracambi | 7,877 | 4,177 | 3,700 |
| Hidrelétrica Pipoca | 2,957 | 2,668 | 289 |
| Hidrelétrica Cachoeirão | 1,448 | 1,851 | –403 |
| Guanhães Energia | 5,595 | 17,977 | –12,382 |
| Cemig Sim (Equity holdings) | 5,488 | 8,037 | –2,549 |
| Baguari Energia | – | – | 0 |
| Retiro Baixo | – | – | 0 |
| Belo Monte (Aliança Norte and Amazônia Energia) | –101,509 | –31,115 | –70,394 |
| Itaocara | – | – | 0 |
| Total | 32,845 | 139,255 | –106,410 |
The gain in equity value of the Company’s holdings in non-consolidated investees in 4Q24 was R$ 106.4 million lower than in 4Q23. The main factors were:
(i) a weaker result in Belo Monte, on higher finance expenses, due to the higher TJLP (long-term interest rate) in 4Q24 and higher cost of purchasing energy to cover exposure to the MRE (Surpluses Reallocation Mechanism); and
(ii) the fact that Cemig no longer has an interest in Aliança Geração, after that asset was sold in 3Q24.
| (iii) | On the other hand the contribution of Taesa in 4Q24, was R$ 13.1 million higher YoY, at R$ 111.0 million. |
COMPANHIA ENERGÉTICA DE MINAS GERAIS S.A. | 25 |
| |
CONSOLIDATED EBITDA (IFRS, and Adjusted)
Ebitda is a non-accounting metric, prepared by the Company, reconciled with its consolidated financial statements in accordance with the specifications in CVM Circular SNC/SEP 01/2007 and CVM Resolution 156 of June 23, 2022. It comprises: Net profit adjusted for the effects of: (i) Net finance income (expenses); (ii) Depreciation and amortization; and (iii) Income tax and the Social Contribution tax. Ebitda is not a metric recognized by Brazilian GAAP nor by IFRS; it does not have a standard meaning; and it may be non-comparable with metrics with similar titles provided by other companies. Cemig publishes Ebitda because it uses it to measure its own performance. Ebitda should not be considered in isolation or as a substitute for net profit or operational profit, nor as an indicator of operational performance or cash flow, nor to measure liquidity, nor capacity for payment of debt. In accordance with CVM Instruction 156/2022, the Company adjusts Ebitda to exclude extraordinary items which, by their nature, do not contribute to information on the potential for gross cash flow generation.
| Consolidated Ebitda 2024 | |||||||
| Ebitda - 2024 - R$ mn | Generation | Transmission | Trading | Distribution | Gas | Holding co. and equity interests | Total |
| Profit (loss) for the period | 1,281 | 1,560 | 517 | 2,206 | 498 | 1,057 | 7,119 |
| Income tax and Social Contribution tax | 334 | 557 | 136 | 662 | 213 | 336 | 2,238 |
| Net finance income (expenses) | 180 | 108 | -24 | 17 | 52 | 188 | 521 |
| Depreciation and amortization | 325 | 9 | - | 922 | 98 | 22 | 1,376 |
| Ebitda per CVM Resolution 156 | 2,120 | 2,234 | 629 | 3,807 | 861 | 1,603 | 11,254 |
| Non-recurring and non-cash effects | |||||||
| Net profit attributed to non–controlling stockholders | - | - | - | - | -2 | - | -2 |
| Gain on disposal of investments (SHPs) | -43 | - | - | - | - | - | -43 |
| Asset impairment | - | - | 5 | - | - | 41 | 46 |
| Provision for civil action on an energy sale | - | - | 53 | - | - | - | 53 |
| Reversal of tax provision – Social security contributions on profit sharing |
-31 | -33 | -5 | -513 | - | -3 | -585 |
| Voluntary retirement program | 9 | 10 | 2 | 56 | - | 1 | 78 |
| Gain on disposal of investments (Aliança) | - | - | - | - | - | -1,617 | -1,617 |
| Result of the Transmission Periodic Tariff Review |
- | -1,521 | - | - | - | - | -1,521 |
| Reversal of provision with related party (Aliança) | - | - | - | - | - | -58 | -58 |
| Adjusted Ebitda | 2,055 | 690 | 684 | 3,350 | 859 | -33 | 7,605 |
| Consolidated 4Q24 Ebitda | |||||||
| R$ mn | Generation | Transmission | Trading | Distribution | Gas | Holding co. and equity interests | Total |
| Profit (loss) for the period | 327 | 118 | 129 | 452 | 112 | –141 | 998 |
|
Income tax and Social Contribution tax |
50 | 7 | 32 | 117 | 27 | –76 | 156 |
| Net finance income (expenses) | 79 | 68 | –7 | 138 | 15 | 103 | 397 |
| Depreciation and amortization | 79 | 3 | 0 | 252 | 25 | 5 | 364 |
| Ebitda per CVM Resolution 156 | 536 | 196 | 155 | 958 | 179 | –110 | 1,914 |
|
Reversal of impairment (Small Hydro Plants) |
–18 | – | – | – | – | – | –18 |
| Impairment (goodwill) | – | – | – | – | – | 41 | 41 |
| Adjusted Ebitda: | 518 | 196 | 155 | 958 | 179 | –69 | 1,937 |
COMPANHIA ENERGÉTICA DE MINAS GERAIS S.A. | 26 |
| |
| Consolidated Ebitda 2023 | |||||||
| Ebitda - 2023 - R$ mn | Generation | Transmission | Trading | Distribution | Gas | Holding co. and equity interests | Total |
| Profit (loss) for the period | 1,387 | 465 | 959 | 1,611 | 596 | 749 | 5,767 |
| Income tax and Social Contribution tax | 326 | 114 | 428 | 405 | 248 | -437 | 1,084 |
| Net finance income (expenses) | 12 | 47 | -82 | 253 | 9 | 140 | 379 |
| Depreciation and amortization | 327 | 1 | - | 834 | 94 | 18 | 1,274 |
| Ebitda per CVM Resolution 156 | 2,052 | 627 | 1,305 | 3,103 | 947 | 470 | 8,504 |
| Non-recurring and non-cash effects | |||||||
| Net profit attributed to non–controlling stockholders | - | - | - | - | -3 | - | -3 |
| Gain on disposal of investments | - | - | - | - | - | -344 | -344 |
| Remeasurement of post-employment liabilities | -11 | -7 | -1 | -34 | - | -4 | -57 |
| Others | - | - | -22 | - | - | - | -22 |
| Adjusted Ebitda | 2,041 | 620 | 1,282 | 3,069 | 944 | 122 | 8,078 |
| Consolidated 4Q23 Ebitda | |||||||
| R$ mn | Generation | Transmission | Trading | Distribution | Gas | Holding co. and equity interests | Total |
| Profit (loss) for the period | 337 | 123 | 335 | 401 | 139 | 552 | 1,886 |
|
Income tax and Social Contribution tax |
51 | 27 | 121 | 94 | 38 | –214 | 117 |
| Net finance income (expenses) | 5 | 9 | –28 | 73 | 3 | 36 | 98 |
| Depreciation and amortization | 85 | 1 | 0 | 237 | 24 | 3 | 351 |
| Ebitda per CVM Resolution 156 | 478 | 160 | 428 | 805 | 204 | 378 | 2,452 |
| Gain on sale of investment | – | – | – | – | – | –289 | –289 |
| Adjusted Ebitda | 478 | 160 | 428 | 805 | 203 | 89 | 2,163 |
COMPANHIA ENERGÉTICA DE MINAS GERAIS S.A. | 27 |
| |
Ebitda of Cemig D
| R$ ’000 | 4Q24 | 4Q23 | Change % |
| Cemig D Ebitda – R$ mn | |||
| Net profit for the period | 452 | 400 | 13.0% |
| Income tax and Social Contribution tax | 117 | 93 | 24.8% |
| Net finance income (expense) | 138 | 73 | 89.7% |
| Amortization | 252 | 238 | 5.9% |
| Ebitda per CVM Resolution 156 | 958 | 804 | 19.2% |
| New replacement value (VNR) | 35 | 22 | 57.4% |
| Ebitda less VNR | 924 | 782 | 18.1% |
Cemig D posted Ebitda of R$ 958 million, 19.2% more than the Ebitda of 4Q23.
Main effects in Ebitda in the quarter:
| § | Lower energy losses: Positive impact of the significant reduction in energy losses to 10.31% in the 12 months to December 2024 (from 10.76% in the 12 months to September 2024) – once again within the required regulatory limit. |
| § | New Replacement Value (VNR) of R$34.7 in 4Q24 and R$ 22.1 million in 4Q23. |
| § | Allowance for client default losses R$ 12.4 million lower than in 4Q23. |
| § | Total energy volume distributed was 1.0% lower than in 4Q23 (8.9% lower in the captive market, and 7.2% higher in the Free Market). This reflected milder temperatures and higher rainfall than in 4Q23 – resulting in lower consumption by the rural, commercial and residential categories (respectively down 15.8%, 5.9%, and 0.6%) – though consumption by the industrial segment, on the other hand, was up 3.7% YoY. |
| § | PMSO (Personnel, Materials, outsourced Services, Other) expenses were up 3.1% YoY – less than the inflation of 2024, which was 4.83%. |
COMPANHIA ENERGÉTICA DE MINAS GERAIS S.A. | 28 |
| |
Cemig GT – Ebitda
| Cemig GT: 4Q24 Ebitda | |||||
| R$ mn | Generation | Transmission | Trading | Equity interests | Total |
| Profit (loss) for the period | 333 | 111 | –20 | –183 | 241 |
| Income tax and Social Contribution tax | 50 | 6 | –33 | –40 | –17 |
| Net finance income (expenses) | 79 | 69 | –7 | 80 | 221 |
| Depreciation and amortization | 73 | 9 | 0 | 0 | 82 |
| Ebitda per CVM Resolution 156 | 536 | 194 | –60 | –143 | 527 |
| Impairments (reversals) | –18 | 0 | 0 | 41 | 23 |
| Adjusted Ebitda | 518 | 194 | –60 | –102 | 550 |
| Cemig GT 4Q23 Ebitda | |||||
| R$ mn | Generation | Transmission | Trading | Equity interests | Total |
| Profit (loss) for the period | 344 | 120 | 201 | 180 | 844 |
| Income tax and Social Contribution tax | 50 | 25 | 52 | 106 | 233 |
| Net finance income (expenses) | 5 | 9 | –27 | 23 | 9 |
| Depreciation and amortization | 86 | 1 | 0 | 0 | 87 |
| Ebitda per CVM Resolution 156 | 484 | 155 | 225 | 309 | 1,173 |
| Gain on sale of investment | 0 | 0 | 0 | –289 | –289 |
| Adjusted Ebitda | 484 | 155 | 225 | 20 | 884 |
4Q24 Ebitda of Cemig GT was R$ 550 million, 37.8% lower than in 4Q23.
Effects on Ebitda, in this YoY comparison:
| § | Volume of energy sold, excluding settlements on the CCEE, was 5.8% lower, reflecting transfer of contracts to the Holding company. |
| § | Trading in the fourth quarter of 2023 had returned a robust performance, due to a successful strategy that produced a margin higher than the prior average, and higher than that achieved in 4Q24. |
| § | Spot market: There was a negative effect in 4Q24, due to higher exposure to the spot market, and in particular to differences in the spot price by sub-market (many purchases are made in the Northeast, and a major part of this energy is sold in other sub-markets). |
| § | Equity income: A weaker result – negative by R$ 83 million in 4Q24, compared to positive by R$ 34 million in 4Q23. The main factors were: (i) the weaker result of Belo Monte, on higher finance expenses, due to the higher TJLP (long-term interest rate) in 4Q24; (ii) higher cost of purchasing energy to cover exposure to the MRE (Surpluses Reallocation Mechanism); and (iii) the fact that we no longer have a stake in Aliança Geração, after the sale of that asset in 3Q24. |
| § | Reversal of an impairment – of R$ 17.7 million – that had been posted for potential loss on the sale of 4 Small Hydro Plants, after the 4 plants were successfully sold for a significant premium. |
| § | Recognition of impairment – of R$ 40.7 million – to the goodwill of Aliança Norte. |
| § | Comparison base: In 4Q23 there was a gain of R$ 289 million on the sales of Baguari and Retiro Baixo. |
COMPANHIA ENERGÉTICA DE MINAS GERAIS S.A. | 29 |
| |
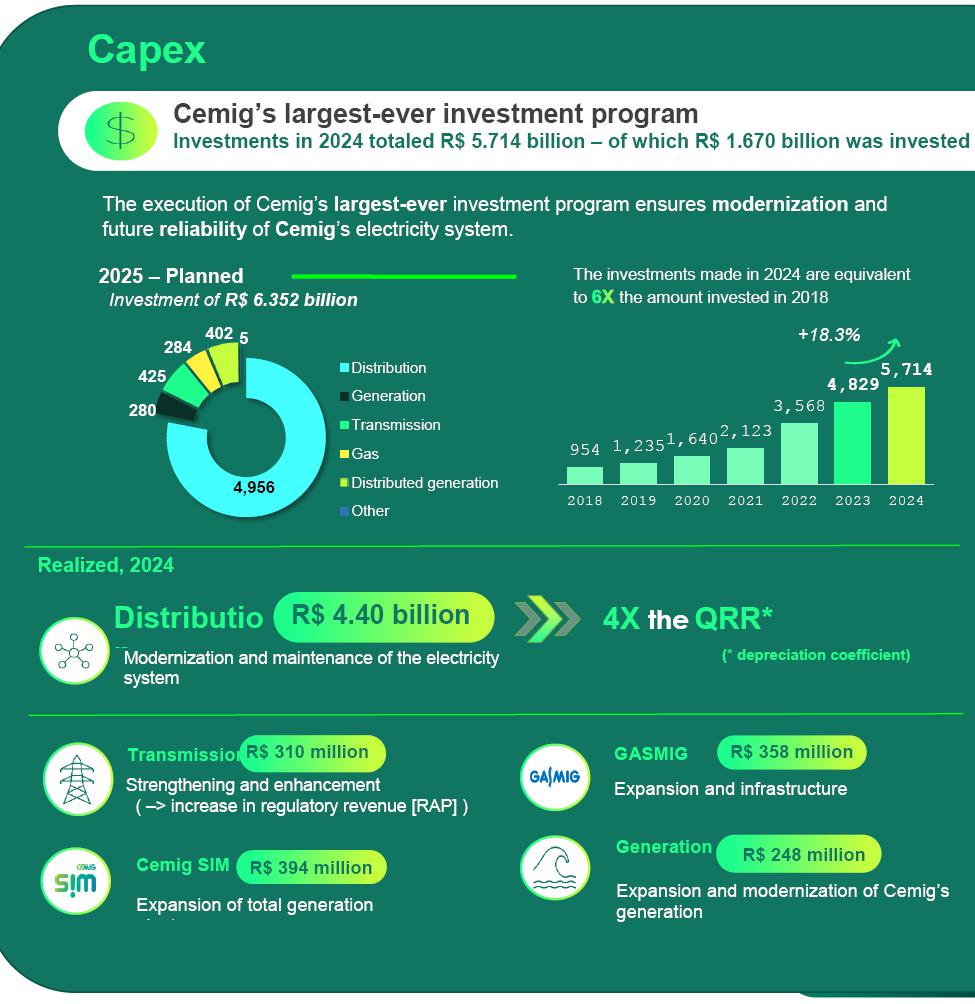
Investments
The total invested in 2024 was R$ 5.71 billion, 18.3% more than in 2023 – led by the R$ 4.40 billion investment made by Cemig D (distribution) in the year.
As well as further highlights in the year were: connection of more than 190,000 new customers; addition of 5,000 km of network; expansion of 155 MW in centralized solar generation capacity; and construction of 211 km of gas pipelines.
Execution of the largest investment program in Cemig’s history will modernize Cemig’s electricity system, ensuring reliability, in line with its strategic plan of focusing on Minas Gerais and its core businesses, providing ever-better service to the client. Investment totaling R$ 39.20 billion is planned for 2025–2029, of which R$ 6.35 billion is being invested in 2025.
COMPANHIA ENERGÉTICA DE MINAS GERAIS S.A. | 30 |
| |
Debt
| CONSOLIDATED (R$ ’000) | 2024 | 2023 | Change, % |
| Gross debt | 12,279,300 | 9,831,139 | 24.9% |
| Cash and equivalents + Securities | 2,390,743 | 2,311,464 | 3.4% |
| Net debt | 9,888,557 | 7,519,675 | 31.5% |
| Debt in foreign currency | – | 1,854,093 | – |
| CEMIG GT (R$ ’000) | 2024 | 2023 | Change, % |
| Gross debt | 1,031,924 | 2,868,093 | –64.0% |
| Cash and equivalents + Securities | 542,566 | 937,518 | –42.1% |
| Net debt | 489,358 | 1,930,575 | –74.7% |
| Debt in foreign currency | – | 1,854,093 | – |
| CEMIG D (R$ ’000) | 2024 | 2023 | Change, % |
| Gross debt | 10,037,621 | 5,887,622 | 70.5% |
| Cash and equivalents + Securities | 1,114,866 | 450,748 | 147.3% |
| Net debt | 8,922,755 | 5,436,874 | 64.1% |
| Debt in foreign currency | – | – | – |
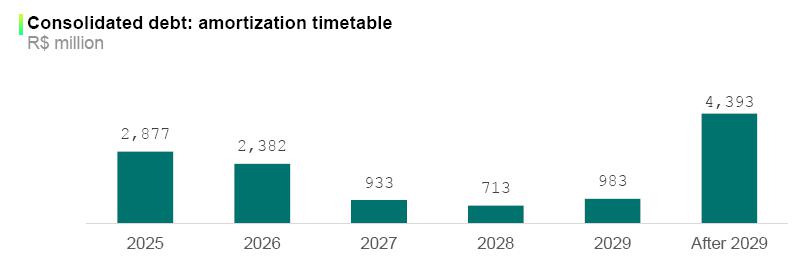
Cemig GT settled its Eurobonds in full in 4Q24 – an amortization totaling R$ 2,309 million. The net effect on the Company’s cash position was R$ 1,866 million (US$381 million, at the exchange rate of US$1=R$ 6.0585, less an effect of R$ 443 million under the hedge transaction). Following this settlement, Cemig now has no debt in non-Brazilian currency.
Gasmig debentures – In December 2024, Gasmig completed its 9th issue of non-convertible debentures: for a total of R$ 200 million, remunerated at the CDI rate plus 0.47% p.a., with maturity at five years and partial amortization in the third and fourth years.
Cemig D made two debenture issues in 2024, raising R$ 2.0 billion in March and R$ 2.5 billion in September.
COMPANHIA ENERGÉTICA DE MINAS GERAIS S.A. | 31 |
| |
| 4Q24 | 2024 | |
| DEBT AMORTIZED – R$ ’000 | ||
| Cemig GT | 2,308,955 | 2,308,955 |
| Cemig D | 0 | 575,916 |
| Others | 2 | 90,000 |
| Total | 2,308,957 | 2,974,871 |


COMPANHIA ENERGÉTICA DE MINAS GERAIS S.A. | 32 |
| |
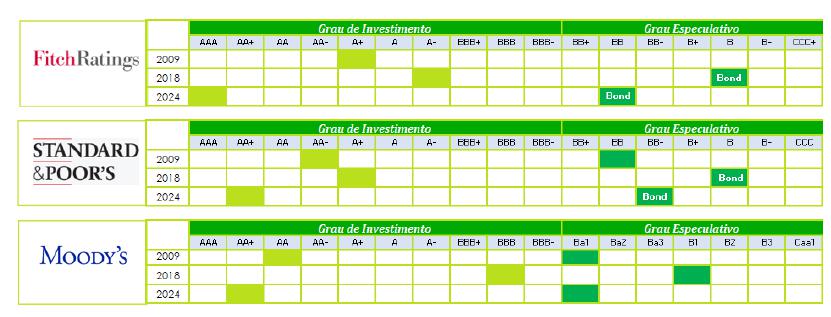
Cemig’s long-term ratings
Cemig’s ratings have improved significantly in recent years, and are currently at their highest ever.
In 2021 the three principal rating agencies upgraded their ratings for Cemig.
In April 2022, Moody’s again upgraded its rating for Cemig, this time by one notch.
In May 2024, Moody’s raised its rating to AA+.
In October 2024 Fitch raised its rating to AAA, the highest of all ratings on the Brazilian scale.
According to their note, this recognized:
(i) consistent results and cash generation,
(ii) a diversified asset base, and
(iii) discipline in capital allocation.
This table illustrates these changes:

COMPANHIA ENERGÉTICA DE MINAS GERAIS S.A. | 33 |
| |
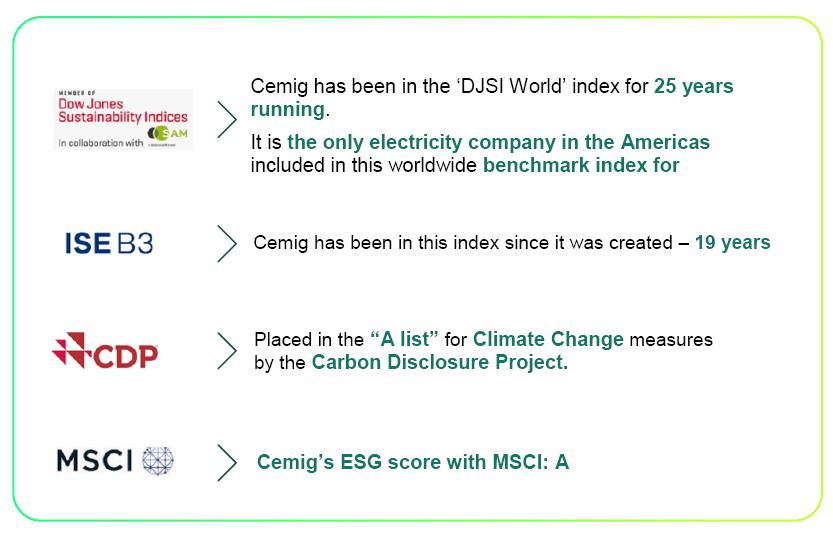
ESG – Report on performance
Cemig Highlights
| § | The Company received the highest credit risk rating in its history: Fitch Ratings increased its corporate rating from “AA+” to “AAA”, with outlook stable. |
| § | Thus, Cemig now has the highest credit risk rating on the Brazilian scale. |
| § | In 2024 Cemig was included in the Dow Jones Sustainability Index (the ‘DJSI World’) for the 25th year running. Cemig’s overall score increased by 6 points from the previous year, with leadership positions in three segments: Transparency and Reporting, Renewable Generation, and Human Rights – consolidating its position as a benchmark for sustainability in the electricity sector worldwide. |
| § | An unprecedented partnership between the Government of Minas Gerais State and Cemig attracted investments totaling R$ 265 million, expected to generate 215 jobs for the state. The SupriMinas Project resulted in attraction of a new Nansen plant, which will provide low- and medium-voltage transformers for execution of the Company’s investment program. |
| § | A work of major impact for the energy sector and the Jequitinhonha Valley region was completed: Construction of a 34.5 kV feeder serving Companhia Brasileira de Lítio (Brazilian Lithium Company). This 50-km network connects the Pedra Azul Substation to the town of Divisa Alegre, on the border with Bahia, with benefits ranging from improvement in power supply quality to economic development for the region. |
| § | Client outage time was reduced by 13% in 2024: On Cemig’s part, this reduction was made possible by its investment of more than R$ 4.4 billion in energy distribution in the year to increase resilience of the distribution system. In 2024, the total annual outage duration experienced by the Company’s consumers was reduced by approximately 2.5 hours: the average number of outages per consumer was down by 14%, and the time taken to re-establish supply was reduced by 13%. |
| § | Cemig is the first Brazilian electricity utility to have 4 GW of distributed generation connected to its concession – the equivalent of four large hydroelectric plants – enough to serve approximately 4 million people. This rapid growth reflects Cemig’s dedicated work in a robust and efficient process, which it developed to meet requests for distributed generation connections. |
Environment
| § | Net Zero Alliance – UNEZA: Cemig is the first Brazilian electricity company to join UNEZA – the Utilities for Net Zero Alliance, a global association bringing utilities together to drive the energy transition and decarbonization. Cemig’s president Reynaldo Passanezi Filho made this announcement at COP 29 in Azerbaijan. With 100% of its generation from renewable sources, Cemig has reduced its emissions by more than 50% since formally accepting the challenge of Net Zero in 2022. The decision underlines its commitment to sustainable practices aligned with the global targets for reduction of emissions by 2040. |
Social
| § | Wheelchair basketball athletes from the city of Uberaba, Minas Gerais, received a gift of 10 wheelchairs especially constructed for practice of this sport. This project is run by the Minas Gerais Wheelchair Basketball League (LMBC), which works in a partnership with the Uberaba Handicapped People's Association (ADEFU). Cemig sponsors the project, under the federal Sports Incentive Law, together with Vale. |
| § | Cemig’s Energy Efficiency Program has been awarded the CIER Energy Efficiency Certificate. This is given by the Regional Energy Integration Committee (Comisión de Integración Energética Regional – CIER). The company was recognized as a leader in the “Government, Trade and Services” category. Initiatives that helped Cemig win this award include Minas LED, Cemig in Schools (Cemig nas Escolas) and Cemig in Hospitals (Cemig nos Hospitais). |
Governance
| § | We have received ISO 37001 Anti-bribery Management System certification, under the NBR ABNT seal for this international standard, which has about 6,000 valid certificates issued worldwide. ISO 37001 specifies measures that an organization should take to prevent, detect and address bribery: Adoption of an Anti-bribery Policy; appointment of a person responsible for overseeing compliance with the policy; training of all employees; due diligence risk assessments in relation to both individuals and transaction partners; and implementation of financial and non-financial controls, and/or strengthening of existing controls. |
COMPANHIA ENERGÉTICA DE MINAS GERAIS S.A. | 34 |
| |
Cemig in the main sustainability indices
COMPANHIA ENERGÉTICA DE MINAS GERAIS S.A. | 35 |
| |
Indicators

COMPANHIA ENERGÉTICA DE MINAS GERAIS S.A. | 36 |
| |
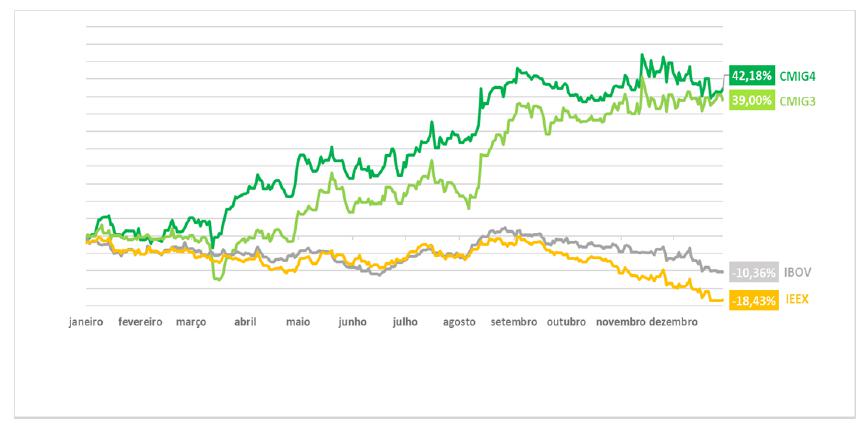
Performance of Cemig’s shares
| Security | 2024 | 2023 | Change, % |
| Prices (2) | |||
| CMIG4 (PN) at the close (R$/share) | 11.11 | 7.81 | 42.18% |
| CMIG3 (ON) at the close (R$/share) | 14.63 | 10.52 | 39.00% |
| CIG (ADR for PN shares), at close (US$/share) | 1.79 | 1.57 | 14.05% |
| CIG.C (ADR for ON shares) at close (US$/share) | 2.32 | 3.12 | –25.62% |
| XCMIG (Cemig PN shares on Latibex), close (€/share) | 1.71 | 1.88 | –9.04% |
| Average daily trading | |||
| CMIG4 (PN) (R$ mn) | 143.11 | 131.35 | 8.95% |
| CMIG3 (ON) (R$ mn) | 3.75 | 7.82 | –52.05% |
| CIG (ADR for PN shares) (US$ mn) | 4.3 | 8.98 | –52.12% |
| CIG.C (ADR for ON shares) (US$ mn) | 0.33 | 0.17 | 94.12% |
| Indices | |||
| IEE | 77,455 | 94,957 | –18.43% |
| IBOV | 120,283 | 134,185 | –10.36% |
| DJIA | 8,978 | 8,097 | 10.88% |
| Indicators | |||
| Market valuation at end of period, R$ mn | 35,149 | 27,948 | 25.77% |
| Enterprise value (EV), R$ mn (1) | 42,668 | 35,892 | 18.88% |
| Dividend yield of CMIG4 (PN) (%) (3) | 11.96 | 11.24 | 0.72 pp |
| Dividend yield of CMIG3 (ON) (%) (3) | 9.08 | 8.53 | 0.55 pp |
| (1) EV = { Market valuation [= R$/share x number of shares]} + { consolidated Net debt }. | |
| (2) Share prices adjusted for corporate action payments, including dividends. | |
| (3) (Dividends distributed in last 4 quarters) / (Share price at end of the period). | |
Cemig’s shares, by volume (aggregate of common (ON) and preferred (PN) shares), were the fourth most liquid in Brazil’s electricity sector, and among the most traded in the Brazilian equity market, in the quarter. On the NYSE, Cemig’s preferred ADRs (CIG) traded US$1.086 billion in 2024 – reflecting investors’ continued recognition of Cemig as a global investment option. In São Paulo, the benchmark Ibovespa index of the B3 Stock Exchange fell 10.36% in 2024, while Cemig’s PN (preferred) shares rose 42.18% and its ON shares rose 39.00%. These were the highest rises of any Brazilian power sector stock in the period. In New York the ADRs for Cemig’s preferred shares rose 14.05% in 2024, and the ADRs for the common shares fell 25.62%.
COMPANHIA ENERGÉTICA DE MINAS GERAIS S.A. | 37 |
| |
COMPANHIA ENERGÉTICA DE MINAS GERAIS S.A. | 38 |
| |
Cemig generation plants
| Plant | Company | Cemig power (MW) | Cemig physical guarantee (MW) | Concession ends: | Type |
Cemig interest |
||
| Emborcação | Cemig GT | 1,192 | 475 | May 2027 | Hydro | 100.0% | ||
| Nova Ponte | Cemig GT | 510 | 257 | Aug. 2027 | Hydro | 100.0% | ||
| Irapé | Cemig GT | 399 | 198 | Sep. 2037 | Hydro | 100.0% | ||
| Três Marias | Cemig GT | 396 | 227 | Jan. 2053 | Hydro | 100.0% | ||
| Salto Grande | Cemig GT | 102 | 74 | Jan. 2053 | Hydro | 100.0% | ||
| Boa Esperança | Cemig GT | 85 | 25 | Aug. 2057 | Solar | 100.0% | ||
| Sá Carvalho | Sá Carvalho S.A. | 78 | 54 | Aug. 2026 | Hydro | 100.0% | ||
| Três Marias Jusante | Cemig GT | 70 | 20 | Feb. 2058 | Solar | 100.0% | ||
| Rosal | Rosal Energia S.A. | 55 | 28 | Dec. 2035 | Hydro | 100.0% | ||
| Itutinga | Cemig Ger. Itutinga | 52 | 27 | Jan. 2053 | Hydro | 100.0% | ||
| Camargos | Cemig Ger. Camargos | 46 | 22 | Jan. 2053 | Hydro | 100.0% | ||
| Volta do Rio | Cemig GT | 42 | 18 | Dec. 2031 | Wind | 100.0% | ||
| Poço Fundo | Cemig GT | 30 | 17 | May 2052 | Small Hydro | 100.0% | ||
| Praias do Parajuru | Cemig GT | 29 | 8 | Sep. 2032 | Wind | 100.0% | ||
| Pai Joaquim | Cemig PCH S.A. | 23 | 14 | Oct. 2033 | Small Hydro | 100.0% | ||
| Piau | Cemig Ger. Sul | 18 | 14 | Jan. 2053 | Hydro | 100.0% | ||
| Gafanhoto | Cemig Ger. Oeste | 14 | 7 | Jan. 2053 | Hydro | 100.0% | ||
| Peti | Cemig Ger. Leste | 9 | 6 | Jan. 2053 | Hydro | 100.0% | ||
| Tronqueiras | Cemig Ger. Leste | 9 | 3 | Dec. 2046 | Hydro | 100.0% | ||
| Joasal | Cemig Ger. Sul | 8 | 5 | Jan. 2053 | Hydro | 100.0% | ||
| Queimado | Cemig GT | 87 | 65 | July 2034 | Hydro | 82.5% | ||
| Belo Monte | Norte Energia | 1,313 | 534 | Jul. 2046 | Hydro | 11.7% | ||
| Cachoeirão | Cachoeirão | 13 | 8 | Sep. 2033 | Small Hydro | 49.0% | ||
| Paracambi | LightGer | 12 | 10 | Jan. 2034 | Hydro | 49.0% | ||
| Pipoca | Hidrelétrica Pipoca | 10 | 6 | Dec. 2034 | Small Hydro | 49.0% | ||
| Others | 76 | 37 | ||||||
| Subtotal | 4,678 | 2,158 | ||||||
| Cemig Sim (MWp) | Via equity interests | 29 | 5.5 | Solar | 49.00% | |||
| Cemig Sim (MWp) | Owned | 36 | 7.1 | Solar | 100.00% | |||
| Total | 4,743 | 2,170 |
Note: The physical guarantee of Boa Esperança and Jusante is the value certified by a certifying company. It has not been approved by Aneel. For the plants of Cemig Sim, the estimated generation was considered to be the physical guarantee.
There are more details of Cemig Sim's expansion projects on the following page.
COMPANHIA ENERGÉTICA DE MINAS GERAIS S.A. | 39 |
| |
Expansion of solar generation
| Project | Company | Installed capacity (MWac) | Capacity (MWp) | Expected generation (MWaverage) |
Planned operational start date |
| Ouro Solar Project | Cemig Sim | 40.5 | 57.5 | 11.4 | Aug. 2025 – Apr. 2026 |
| Bloco Azul project | Cemig Sim | 23.0 | 32.6 | 12.0 | Apr 26 |
| Solar do Cerrado Project | Cemig Sim | 50.0 | 70.0 | 13.1 | Dec. 2025 – May 2026 |
| Total | 113.5 | 160.1 | 36.5 |
RAP: July 2024–June 2025 cycle
The RAP (Permitted Annual Revenue – Receita Annual Permitida) of Cemig GT, including the Adjustment Component, received an increase of 18.8% as from July, reflecting: (i) inflation in the period; (ii) strengthening and enhancements of the network; and (iii) flow from reprofiling of the ‘RBSE’ National Grid component.
| ANEEL RATIFYING RESOLUTION (ReH) 3348/2024 (2024–2025 cycle) | ||||
| R$ ’000 | RAP | Adjustment component | Total | Expiration |
| Cemig | 1,243,011 | 115,284 | 1,358,295 | |
| Cemig GT | 1,161,990 | 117,855 | 1,279,845 | Dec. 2042 |
| Cemig Itajubá | 43,096 | –1,524 | 41,572 | Oct. 2030 |
| Centroeste | 26,008 | –1,284 | 24,724 | Mar. 2035 |
| Sete Lagoas | 11,917 | 237 | 12,154 | Jun. 2041 |
| Taesa (Cemig stake: 21.68%) | 625,278 | –32,793 | 592,485 | |
| TOTAL RAP | 1,950,780 | |||
| REIMBURSEMENT FOR NATIONAL GRID ASSETS** | |||||||
|
R$ ’000 – by cycle |
2020–2021 | 2021–2022 | 2022–2023 | 2023–2024 |
2024–2025 (1) |
From 2025–2026, to 2027–2028 |
From 2028–2029, to 2032–2033 |
| Economic | 144,547 | 144,547 | 144,547 | 144,375 | 21,662 | 83,019 | 26,039 |
| Financial | 332,489 | 88,662 | 129,953 | 275,556 | 275,556 | 275,556 | – |
| TOTAL | 477,036 | 233,209 | 274,500 | 419,931 | 297,218 | 358,575 | 26,039 |
* The figures for indemnity of RBSE National Grid components are included in the RAP of Cemig (first table).
1) 2024–2025 includes the Adjustment Component for postponement of the 2023 Review.
Cemig currently has state environmental (REA) approval for additional large-scale works of strengthening and enhancement, for total capex of R$ 1,238 million, and investments of R$ 220 million related to Lot 1 of Auction 02/2022 (with completion planned for 2028). Note: The amounts stated for 2024 include investments that were made, but not in Ratifying Resolution 3348/2024, which approved the RAP for July 2024–June 2025.
| Planned operational startup date | Capex (R$ ’000) | RAP (R$ ’000) |
| 2024 | 232,197 | 35,176 |
| 2025 | 307,845 | 49,239 |
| 2026 | 259,678 | 41,480 |
| 2027 | 414,707 | 68,840 |
| 2028 | 243,910 | 22,396 |
| Total | 1,458,337 | 217,131 |
COMPANHIA ENERGÉTICA DE MINAS GERAIS S.A. | 40 |
| |
Regulatory transmission revenue
| Regulatory Transmission revenue – 4Q24 | |||
| R$ ’000 | GT | Centroeste | Sete Lagoas |
| REVENUE | 433.482 | 6.219 | 2.777 |
| Transmission operations revenue | 433.482 | 6.219 | 2.777 |
| Taxes on revenue | -39.663 | -228 | -257 |
| PIS and Pasep taxes | -7.075 | -41 | -46 |
| Cofins tax | -32.588 | -187 | -211 |
| ISS tax | - | - | - |
| Sector charges | -74.541 | -235 | -120 |
| Research and Development (R&D) | -3.120 | -57 | -24 |
| Global Reversion Reserve (RGR) | - | -155 | -84 |
| Energy Development Account (CDE) | -56.706 | - | - |
| Electricity Services Inspection Charge (TFSEE) | -1.321 | -23 | -12 |
| Other charges | -13.394 | - | - |
| Net revenue | 319.278 | 5.756 | 2.400 |
Complementary information
Cemig D
| MARKET OF CEMIG D (GWh) | ||||
| QUARTER | CAPTIVE | TUSD – ENERGY (1) | E.T.D (2) | TUSD – DEMAND (3) |
| 1Q22 | 5,738 | 5,397 | 11,136 | 36.2 |
| 2Q22 | 6,050 | 5,853 | 11,904 | 36.7 |
| 3Q22 | 5,942 | 5,790 | 11,733 | 34.7 |
| 4Q22 | 6,047 | 5,755 | 11,802 | 40.5 |
| 1Q23 | 5,723 | 5,566 | 11,289 | 38.0 |
| 2Q23 | 5,949 | 6,058 | 12,007 | 38.5 |
| 3Q23 | 5,812 | 6,028 | 11,840 | 39.2 |
| 4Q23 | 6,376 | 6,068 | 12,445 | 39.9 |
| 1Q24 | 5,930 | 6,097 | 12,027 | 40.4 |
| 2Q24 | 5,924 | 6,301 | 12,225 | 42.4 |
| 3Q24 | 5,821 | 6,557 | 12,378 | 43.6 |
| 4Q24 | 5,812 | 6,505 | 12,317 | 42.5 |
(1) This refers to the ‘energy’ portion for calculation of the regulatory charges to Free Clients (‘Portion A’).
(2) Total energy distributed
(3) Sum of TUSD billed, according to demand contracted (‘Portion B’).
COMPANHIA ENERGÉTICA DE MINAS GERAIS S.A. | 41 |
| |
| Cemig D | 4Q24 | 3Q24 | 4Q23 | chg. % | chg. % |
| Operating Revenues (R$ million) | 4Q/3Q | 4Q/4Q | |||
| Revenue from supply of energy | 6,964 | 6,021 | 6,241 | 15.7% | 11.6% |
| Reimbursement of PIS/Pasep and Cofins credits to customers | 0 | 0 | 339 | - | - |
| Revenue from Use of Distribution Systems (the TUSD charge) | 1,386 | 1,344 | 1,200 | 3.1% | 15.4% |
| CVA and Other financial components in tariff adjustment | 47 | 357 | -149 | - | - |
| Construction revenue | 1,290 | 1,151 | 1,053 | 12.1% | 22.5% |
| Adjustment to expectation of cash flow from indemnifiable financial assets of distribution concession (VNR) | 35 | 16 | 22 | 117.2% | 57.4% |
| Others | 667 | 609 | 505 | 9.6% | 32.1% |
| Subtotal | 10,389 | 9,498 | 9,212 | 9.38% | 12.8% |
| Deductions | -2,827 | -2,740 | -2,784 | 3.2% | 1.5% |
| Net Revenues | 7,562 | 6,758 | 6,427 | 11.9% | 17.6% |
| 4Q24 | 3Q24 | 4Q23 | chg. % | chg. % | |
| Cemig D - Expenses | 4Q/3Q | 4Q/4Q | |||
| Personnel | 256 | 223 | 229 | 14.7% | 11.8% |
| Employees' and managers' profit sharing | 21 | 24 | 24 | -11.2% | -10.8% |
| Forluz – Post-retirement obligations | 81 | 81 | 109 | 0.2% | -25.2% |
| Materials | 28 | 26 | 43 | 6.5% | -35.4% |
| Outsourced services | 508 | 409 | 446 | 24.1% | 13.9% |
| Amortization | 252 | 231 | 237 | 8.9% | 5.9% |
| Operating provisions | 162 | 22 | 173 | 636.1% | -6.4% |
| Charges for Use of Basic Transmission Network | 762 | 869 | 796 | -12.3% | -4.3% |
| Energy purchased for resale | 3,356 | 3,078 | 2,598 | 9.0% | 29.2% |
| Construction Cost | 1,290 | 1,151 | 1,053 | 12.1% | 22.5% |
| Other Expenses | 141 | 101 | 153 | 39.3% | -8.3% |
| Total | 6,855 | 6,215 | 5,860 | 10.3% | 17.0% |
| Cemig D | 4Q24 | 3Q24 | 4Q23 | chg. % | chg. % |
| Statement of Results (R$ mn) | 4Q/3Q | 4Q/4Q | |||
| Net Revenue | 7,562 | 6,758 | 6,427 | 11.9% | 17.6% |
| Operating Expenses | 6,855 | 6,215 | 5,860 | 10.3% | 17.0% |
| Operational profit | 706 | 543 | 567 | 30.1% | 24.5% |
| EBITDA | 958 | 774 | 805 | 23.7% | 19.0% |
| Financial Result | -138 | -75 | -73 | 83.9% | 89.1% |
| Provision for Income Taxes, Social Cont & Deferred Income Tax | -117 | -96 | -94 | 21.5% | 24.5% |
| Net Income | 452 | 372 | 401 | 21.4% | 12.8% |
COMPANHIA ENERGÉTICA DE MINAS GERAIS S.A. | 42 |
| |
Cemig GT
| Cemig GT - Operating Revenues | 4Q24 | 3Q24 | 4Q23 | chg. % | chg. % |
| (R$ million) | 4Q/3Q | 4Q/4Q | |||
| Sales to end consumers | 848 | 899 | 912 | -5.7% | -7.1% |
| Supply | 542 | 501 | 641 | 8.3% | -15.4% |
| Revenues from Trans. Network | 129 | 198 | 186 | -34.8% | -30.5% |
| Construction revenue | 144 | 118 | 84 | 22.4% | 72.1% |
| Financial remuneration of transmission contractual assets | 198 | 111 | 121 | 78.7% | 64.4% |
| Gain on monetary updating of Concession Grant Fee | 118 | 94 | 97 | 25.3% | 21.4% |
| Transactions in the CCEE | 10 | -2 | 37 | -599.3% | -73.0% |
| Generation indemnity revenue | 23 | 21 | 23 | 10.6% | 2.0% |
| Others | 62 | 31 | 45 | 101.1% | 38.5% |
| Subtotal | 2,075 | 1,971 | 2,146 | 5.3% | -3.3% |
| Deductions | -380 | -378 | -394 | 0.4% | -3.7% |
| Net Revenues | 1,696 | 1,593 | 1,752 | 6.5% | -3.2% |
| Cemig GT - Operating Expenses | 4Q24 | 3Q24 | 4Q23 | chg. % | chg. % |
| (R$ million) | 4Q/3Q | 4Q/4Q | |||
| Personnel | 73 | 78 | 87 | -6.5% | -16.0% |
| Employees' and managers' profit sharing | 9 | 9 | 9 | -0.1% | 1.5% |
| Forluz – Post-retirement obligations | 25 | 25 | 34 | 0.9% | -24.9% |
| Materials | 8 | 7 | 7 | 9.7% | 4.1% |
| Outsourced services | 72 | 63 | 47 | 14.5% | 52.1% |
| Depreciation and Amortization | 82 | 84 | 87 | -2.0% | -5.0% |
| Operating provisions | 35 | 9 | 18 | 288.9% | 94.4% |
| Charges for Use of Basic Transmission Network | 71 | 73 | 67 | -2.4% | 5.7% |
| Energy purchased for resale | 642 | 587 | 549 | 9.3% | 16.8% |
| Construction Cost | 116 | 74 | 63 | 56.8% | 84.6% |
| Impairment | 17 | 2 | 0 | 754.4% | - |
| Reversal of provision with related party | 0 | -58 | 0 | - | - |
| Other Expenses | 17 | 33 | 20 | -48.0% | -13.6% |
| Total | 1,167 | 986 | 988 | 18.4% | 18.1% |
COMPANHIA ENERGÉTICA DE MINAS GERAIS S.A. | 43 |
| |
| Cemig GT - Statement of Results | 4Q24 | 3Q24 | 4Q23 | chg. % | chg. % |
| (R$ million) | 4Q/3Q | 4Q/4Q | |||
| Net Revenue | 1,696 | 1,593 | 1,752 | 6.5% | -3.2% |
| Operating Expenses | 1,167 | -2,152 | 700 | -154.2% | 66.7% |
| Operational profit | 529 | 3,745 | 1,052 | -85.9% | -49.8% |
| Equity gain in subsidiaries | -83 | -30 | 34 | 176.7% | -344.4% |
| EBITDA | 528 | 3,798 | 1,173 | -86.1% | -55.0% |
| Financial Result | -222 | 37 | -9 | - | - |
| Provision for Income Taxes, Social Cont & Deferred Income Tax | 18 | -1,121 | -233 | - | -107.6% |
| Net Income | 242 | 2,630 | 844 | -90.8% | -71.4% |
Cemig, Consolidated
| Energy Sales | 4Q24 | 3Q24 | 4Q23 | chg. % | chg. % |
| (in GWh) | 4Q/3Q | 4Q/4Q | |||
| Residential | 3,760 | 3,450 | 3,696 | 9.0% | 1.7% |
| Industrial | 4,597 | 4,581 | 4,643 | 0.3% | -1.0% |
| Commercial | 2,809 | 2,848 | 3,046 | -1.4% | -7.8% |
| Rural | 783 | 1,117 | 982 | -29.9% | -20.2% |
| Others | 705 | 709 | 808 | -0.6% | -12.7% |
| Subtotal | 12,654 | 12,705 | 13,174 | -0.4% | -3.9% |
| Own Consumption | 8 | 7 | 8 | 14.3% | 0.0% |
| Supply | 4,763 | 4,200 | 4,742 | 13.4% | 0.4% |
| TOTAL | 17,425 | 16,912 | 17,924 | 3.0% | -2.8% |
| Revenue from supply of electricity | 4Q24 | 3Q24 | 4Q23 | chg. % | chg. % |
| (R$ million) | 4Q/3Q | 4Q/4Q | |||
| Residential | 3,654 | 3,124 | 3,169 | 17.0% | 15.3% |
| Industrial | 1,373 | 1,379 | 1,470 | -0.5% | -6.6% |
| Commercial | 1,752 | 1,577 | 1,706 | 11.1% | 2.7% |
| Rural | 660 | 735 | 642 | -10.2% | 2.8% |
| Others | 587 | 544 | 586 | 7.9% | 0.2% |
| Subtotal | 8,026 | 7,359 | 7,574 | 9.1% | 6.0% |
| Unbilled supply | 225 | -46 | 109 | -588.1% | 106.3% |
| Supply | 1,371 | 1,243 | 1,235 | 10.3% | 11.0% |
| TOTAL | 9,621 | 8,556 | 8,918 | 12.5% | 7.9% |
COMPANHIA ENERGÉTICA DE MINAS GERAIS S.A. | 44 |
| |
| Operating Revenues - consolidated | 4Q24 | 3Q24 | 4Q23 | chg. % | chg. % |
| (R$ million) | 4Q/3Q | 4Q/4Q | |||
| Sales to end consumers | 8,250 | 7,313 | 7,683 | 12.8% | 7.4% |
| Supply | 1,371 | 1,243 | 1,235 | 10.3% | 11.0% |
| TUSD | 1,375 | 1,338 | 1,193 | 2.8% | 15.3% |
| CVA and Other financial components in tariff adjustment | 47 | 357 | -149 | -86.9% | - |
| Reimbursement of PIS/Pasep and Cofins over ICMS credits to customers | 0 | 0 | 339 | - | - |
| Transmission revenue plus RTP | -20 | 145 | 93 | -113.8% | -121.5% |
| Financial remuneration of transmission contractual assets | 219 | 40 | 123 | 448.7% | 77.9% |
| Transactions in the CCEE | 10 | 27 | 66 | -62.7% | -84.7% |
| Gas supply | 988 | 1,038 | 953 | -4.8% | 3.7% |
| Construction revenue | 1,547 | 1,375 | 1,235 | 12.5% | 25.3% |
| Others | 974 | 764 | 730 | 27.5% | 33.5% |
| Subtotal | 14,763 | 13,640 | 13,501 | 8.2% | 9.3% |
| Deductions | -3,586 | -3,491 | -3,544 | 2.7% | 1.2% |
| Net Revenues | 11,177 | 10,149 | 9,957 | 10.1% | 12.3% |
| Operating Expenses - consolidated | 4Q24 | 3Q24 | 4Q23 | chg. % | chg. % |
| (R$ million) | 4Q/3Q | 4Q/4Q | |||
| Personnel | 332 | 326 | 349 | 2.0% | -4.6% |
| Employees’ and managers’ profit sharing | 49 | 41 | 39 | 19.3% | 26.2% |
| Forluz – Post-Retirement Employee Benefits | 122 | 122 | 161 | - | -24.5% |
| Materials | 37 | 35 | 51 | 5.5% | -28.0% |
| Outsourced services | 618 | 497 | 511 | 24.4% | 20.9% |
| Energy purchased for resale | 4,923 | 4,567 | 3,957 | 7.8% | 24.4% |
| Charges for use of the national grid | 692 | 805 | 762 | -14.1% | -9.3% |
| Gas bought for resale | 564 | 544 | 523 | 3.6% | 7.9% |
| Depreciation and Amortization | 364 | 346 | 351 | 5.2% | 3.6% |
| Operating Provisions | 187 | 94 | 88 | 98.9% | 112.5% |
| Construction costs | 1,518 | 1,336 | 1,211 | 13.7% | 25.4% |
| Expected credit losses of accounts receivable | 72 | -51 | 102 | - | -29.4% |
| Other Expenses | 182 | 88 | 186 | 106.3% | -2.4% |
| Total | 9,660 | 8,750 | 8,292 | 10.39% | 16.50% |
COMPANHIA ENERGÉTICA DE MINAS GERAIS S.A. | 45 |
| |
| Financial Result Breakdown | 4Q24 | 3Q24 | 4Q23 | chg. % | chg. % |
| (R$ million) | 4Q/3Q | 4Q/4Q | |||
| FINANCE INCOME | |||||
| Income from cash investments | 148 | 105 | 128 | 41.4% | 16.4% |
| Arrears fees on sale of energy | 78 | 72 | 71 | 8.6% | 10.9% |
| Monetary variations | |||||
| Monetary variations – CVA | 12 | 5 | -5 | 138.4% | -336.7% |
| Monetary updating on Court escrow deposits | 18 | 18 | 21 | -1.6% | -13.8% |
| Pasep and Cofins charged on finance income | -65 | -49 | -56 | 33.3% | 17.2% |
| Gains on financial instruments - Swap | 21 | 13 | 0 | 63.4% | - |
| Exchange variation - Loans and debentures | 0 | 42 | 118 | - | - |
| Others | 37 | 57 | 29 | -35.1% | 27.6% |
| 284 | 263 | 368 | 7.9% | -22.9% | |
| FINANCE EXPENSES | |||||
| Costs of loans and financings | -293 | -237 | -258 | 23.6% | 13.7% |
| Foreign exchange variations | -233 | 0 | 0 | - | - |
| Monetary updating – loans and financings | -99 | -40 | -28 | 148.5% | 42.6% |
| Foreign exchange variations - Itaipu Binacional | -18 | 0 | 0 | - | - |
| Negative effect on financial instruments - Hedge | 0 | 0 | -117 | - | - |
| Monetary updating on PIS/Pasep and Cofins taxes credits | 0 | 0 | -23 | - | -100.0% |
| Others | -37 | -48 | -40 | -22.9% | - |
| -680 | -325 | -466 | - | 45.8% | |
| NET FINANCE INCOME (EXPENSES) | -396 | -62 | -98 | 538.4% | -503.3% |
| Consolidated profit and loss account | 4Q24 | 3Q24 | 4Q23 | chg. % | chg. % |
| (R$ million) | 4Q/3Q | 4Q/4Q | |||
| Net Revenue | 11,177 | 10,149 | 9,957 | 10.1% | 12.3% |
| Operating Expenses | 9,660 | 5,598 | 7,995 | 72.6% | 20.8% |
| Operational profit | 1,517 | 4,551 | 1,962 | -66.7% | -22.7% |
| Equity gain (loss) in subsidiaries | 33 | 62 | 138 | -46.8% | -76.1% |
| EBITDA | 1,914 | 4,958 | 2,452 | -61.4% | -21.9% |
| Financial Result | -396 | -62 | -98 | 538.4% | 303.3% |
| Provision for Income Taxes, Social Cont & Deferred Income Tax | -156 | -1,270 | -117 | -87.7% | 33.9% |
| Net profit for the period | 998 | 3,280 | 1,886 | -69.6% | -47.1% |
COMPANHIA ENERGÉTICA DE MINAS GERAIS S.A. | 46 |
| |
| Recurring profit: reconciliation | ||
| R$ mn | 4Q24 | 4Q23 |
| Net profit - IFRS | 998 | 1,886 |
| Reversal of an impairment | -12 | - |
| Impairment (goodwill) Norte Energia | 41 | - |
| FX exposure – Eurobond hedge | 139 | - |
| Gain on sale of investment | - | -202 |
| Recurring net profit | 1,166 | 1,684 |
| Cash Flow Statement | 2024 | 2023 |
| (R$ million) | ||
| Cash at beginning of period | 1,537 | 1,441 |
| Cash generated by operations | 5,497 | 6,644 |
| Net income for the period from going concern operations | 7,119 | 5,767 |
| Interest and monetary variations | 428 | 676 |
| Depreciation and amortization | 1,376 | 1,274 |
| CVA and other financial components | -423 | 213 |
| Equity gain (loss) in subsidiaries | -224 | -432 |
| Provisions (reversals) for operational losses | -90 | 360 |
| Deferred income and social contribution taxes | 2,238 | 1,084 |
| Refund of PIS/Pasep and Cofins credits to consumers | -513 | -1,909 |
| Dividends receivable | 350 | 592 |
| Interest paid on loans and financings | -956 | -1,026 |
| Net gain on derivative instruments at fair value through profit or loss | -147 | 177 |
| Interest and monetary variation | 464 | -277 |
| Effects of the Periodic Tariff Review - RTP | -1,676 | 0 |
| Gain on disposal of investments | -1,617 | -319 |
| Escrow deposits | 116 | 45 |
| Others | -948 | 418 |
| Investment activity | -2,377 | -3,967 |
| Securities - Financial Investment | 293 | 1,122 |
| Financial assets | 2,737 | 669 |
| Fixed and Intangible assets/distribution and gas infrastructure | -5,359 | -4,942 |
| Others | -48 | -817 |
| Financing activities | -2,759 | -2,580 |
| Lease payments | -72 | -67 |
| Payments of loans and financings | -2,975 | -2,679 |
| Interest on Equity, and dividends | -4,294 | -1,823 |
| Proceeds from Loans, financings and debentures | 4,582 | 1,988 |
| Cash at end of period | 1,898 | 1,537 |
COMPANHIA ENERGÉTICA DE MINAS GERAIS S.A. | 47 |
| |
| 2024 | 2023 | |
| BALANCE SHEETS - ASSETS | ||
| (R$ million) | ||
| CURRENT | ||
| Cash and cash equivalents | 1,898 | 1,537 |
| Marketable securities | 358 | 774 |
| Customers, traders, concession holders and Transport of energy | 5,596 | 5,434 |
| Concession financial assets | 1,190 | 814 |
| Concession contract assets | 1,140 | 850 |
| Tax offsetable | 511 | 635 |
| Income tax and Social Contribution tax recoverable | 7 | 411 |
| Dividends receivable | 111 | 50 |
| Public lighting contribution | 296 | 261 |
| Other credits | 1,068 | 1,044 |
| 57 | 58 | |
| TOTAL CURRENT | 12,233 | 11,869 |
| NON-CURRENT | ||
| Securities | 135 | 0 |
| Consumers and traders | 254 | 43 |
| Tax offsetable | 1,455 | 1,319 |
| Income tax and Social Contribution tax recoverable | 582 | 445 |
| Deferred income tax and Social Contribution tax | 2,334 | 3,045 |
| Escrow deposits in legal actions | 1,196 | 1,243 |
| Accounts receivable from the State of Minas Gerais | 40 | 13 |
| Financial assets of the concession | 6,881 | 5,726 |
| Contractual assets | 10,327 | 7,676 |
| Investments | 3,221 | 4,632 |
| Property, plant and equipment | 3,715 | 3,256 |
| Intangible assets | 16,806 | 15,249 |
| Leasing – rights of use | 387 | 398 |
| Other credits | 161 | 86 |
| TOTAL NON-CURRENT | 47,494 | 43,131 |
| TOTAL ASSETS | 59,727 | 55,000 |
COMPANHIA ENERGÉTICA DE MINAS GERAIS S.A. | 48 |
| |
| BALANCE SHEETS LIABILITIES AND SHAREHOLDERS' EQUITY | 2024 | 2023 |
| (R$ million) | ||
| CURRENT | ||
| Suppliers | 2,952 | 3,017 |
| Regulatory charges | 344 | 487 |
| Profit sharing | 111 | 165 |
| Taxes | 725 | 644 |
| Income tax and Social Contribution tax | 163 | 111 |
| Interest on Equity, and dividends, payable | 3,611 | 2,924 |
| Loans and financings | 2,877 | 2,630 |
| Payroll and related charges | 217 | 239 |
| Public Lighting Contribution | 475 | 425 |
| Post-retirement liabilities | 233 | 329 |
| Accounts payable related to energy generated by consumers | 1,251 | 705 |
| PIS/Pasep and Cofins taxes to be reimbursed to customers | 526 | 854 |
| Leasing operations | 79 | 79 |
| Other obligations | 582 | 486 |
| TOTAL CURRENT | 14,146 | 13,093 |
| NON-CURRENT | ||
| Regulatory charges | 172 | 90 |
| Loans and financings | 9,403 | 7,201 |
| Income tax and Social Contribution tax | 496 | 362 |
| Deferred Income tax and Social Contribution tax | 1,543 | 1,112 |
| Provisions | 1,853 | 2,200 |
| Post-retirement liabilities | 4,073 | 5,088 |
| PASEP / COFINS to be returned to consumers | 166 | 664 |
| Leasing operations | 350 | 354 |
| Others | 142 | 180 |
| TOTAL NON-CURRENT | 18,198 | 17,252 |
| TOTAL LIABILITIES | 32,344 | 30,345 |
| TOTAL EQUITY | ||
| Share capital | 14,309 | 11,007 |
| Capital reserves | 393 | 2,250 |
| Profit reserves | 13,576 | 13,041 |
| Equity valuation adjustments | -900 | -1,648 |
| NON-CONTROLLING INTERESTS | 27,378 | 24,649 |
| Non-Controlling Interests | 5 | 6 |
| TOTAL EQUITY | 27,383 | 24,655 |
| TOTAL LIABILITIES AND EQUITY | 59,727 | 55,000 |
COMPANHIA ENERGÉTICA DE MINAS GERAIS S.A. | 49 |
| |
Disclaimer
Certain statements and estimates in this material may represent expectations about future events or results which are subject to risks and uncertainties that may be known or unknown. There is no guarantee that events or results will occur as referred to in these expectations.
These expectations are based on present assumptions and analyses from the point of view of our management, in accordance with their experience and other factors such as the macroeconomic environment, market conditions in the electricity sector, and expected future results, many of which are not under our control.
Important factors that could lead to significant differences between actual results and the projections about future events or results include: Cemig’s business strategy, Brazilian and international economic conditions, technology, our financial strategy, changes in the electricity sector, hydrological conditions, conditions in the financial and energy markets, uncertainty on our results from future operations, plans and objectives; and other factors. Due to these and other factors, our results may differ significantly from those indicated in or implied by such statements.
The information and opinions herein should not be understood as a recommendation to potential investors, and no investment decision should be based on the veracity, currentness or completeness of this information or these opinions. None of our staff nor any party related to any of them or their representatives shall have any responsibility for any losses that may arise as a result of use of the content of this material.
To evaluate the risks and uncertainties as they relate to Cemig, and to obtain additional information about factors that could give rise to different results from those estimated by Cemig, please consult the section on Risk Factors included in the Reference Form filed with the Brazilian Securities Commission (CVM) – and in the 20-F form filed with the US Securities and Exchange Commission (SEC).
Financial amounts are in R$ million (R$ mn) unless otherwise stated. Financial data reflect the adoption of IFRS.
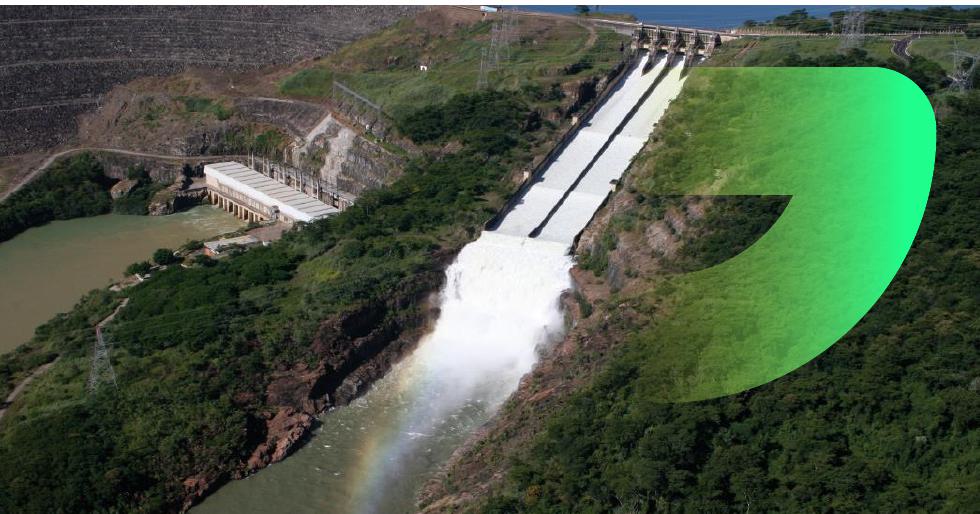
COMPANHIA ENERGÉTICA DE MINAS GERAIS S.A. | 50 |

| 2. | Call Notice to Annual and Extraordinary Shareholders' Meetings |

COMPANHIA ENERGÉTICA DE MINAS GERAIS - CEMIG
PUBLICLY-HELD COMPANY
Corporate Taxpayer’s ID (CNPJ): 17.155.730/0001-64
Company Registry (NIRE): 31300040127
CALL NOTICE
ANNUAL AND EXTRAORDINARY SHAREHOLDERS’ MEETINGS
The shareholders of Companhia Energética de Minas Gerais-Cemig are hereby invited to attend the Company’s Annual and Extraordinary Shareholders’ Meetings (”Company” and “AESM”), to be held fully remotely on April 30, 2025, at 2:00 pm, through a platform that will be provided by the Company. The platform will allow shareholders to participate in the AESM and cast their votes, without prejudice to the submission of their remote voting forms, in order to resolve on the following matters:
At the Annual Shareholders’ Meeting:
(i) approval of the Management Report and the Financial Statements for the fiscal year ended December 31, 2024, accompanied by their respective supplementary documents;
(ii) approval of the allocation of the net income for 2024 and the Company’s capital budget; and
(iii) setting of the overall compensation of Management and the members of the Fiscal Council and the Audit Committee.
At the Extraordinary Shareholders' Meeting:
(iv) approval of the revision of the Company's Bylaws so as to improve wording, by rearranging the topics of the items, grouping and removing unnecessary provisions; and clearly defining the duties of each Executive Board Member, among others, in accordance with the information detailed in the Management Proposal;
(v) approval of the consolidation of the Company’s Bylaws so as to reflect the indicated changes; and
(vi) authorization for management to take all the necessary measures to formalize the resolutions above.
General Information:
Shareholders may opt to exercise their right to vote through the remote voting system, pursuant to CVM Instruction 81/2022, by sending the corresponding remote voting form through their respective custodian, B3’s central depository, the bookkeeping bank, or even by emailing it, by April 25, 2025, directly to the Company at ri@cemig.com.br.
Shareholders willing to be represented at said Shareholders’ Meetings must comply with the provisions of Article 126 of Law 6,404/1976 and Paragraph 2 of Article 10 of the Company’s Bylaws, sending the proxy appointment with special powers by email to ri@cemig.com.br, by April 26, 2025.
Participation Documents
Documents required to authorize the participation of shareholders and representatives in the Shareholders’ Meetings:
| 1. | Individual Shareholders: |

| · | Identification document with photo;* |
| 2. | Representative: |
| · | Identification document with a photo of the representative; |
2.A. Individual Principals:
| · | Identification document with photo* |
| · | Valid document proving the granting of powers, including representation, if applicable** |
2.B. Legal Entity Principals:
| · | Consolidated and updated Articles of Association or Bylaws; |
| · | Valid document proving the granting
of powers, including representation, if applicable; ** |
| · | Fund regulations (for investment funds) |
| · | Minutes of election of the legal representative(s) attending the meeting (for investment funds). |
* Accepted identification documents: RG, RNE, CNH, Passport, and officially recognized professional registration card;
** Proxy appointments must have been granted less than 1 (one) year ago.
The Company underlines that shareholders and their representatives are responsible for the veracity and integrity of the presented documents, subject to liability under Article 299 of the Brazilian Penal Code.
The AESM will be held fully remotely in order to facilitate participation of shareholders, through the Ten Meetings digital platform (“Digital Platform”), to be accessed on the date and time of the AESM. Shareholders willing to participate in the meetings must register on the Digital Platform, in up to two days before the date of holding of the AESM, i.e., by the end of April 28, 2025, at https://assembleia.ten.com.br/483022949/auth, where they can get the “Platform Manual for Participants,” containing detailed guidelines on the use of the Digital Platform.
The guidelines and procedures for participating in the Shareholders’ Meetings will be available on the websites of the Company (www.ri.cemig.com.br) and the Brazilian Securities and Exchange Commission (www.cvm.gov.br).
Belo Horizonte, March 31, 2025.
Márcio Luiz Simões Utsch
Chair of the Board of Directors
| 3. | Board of Directors Proposal for the Annual and Extraordinary Shareholders' Meetings |
COMPANHIA ENERGÉTICA DE MINAS GERAIS - CEMIG
PUBLICLY-HELD COMPANY
Corporate Taxpayer’s ID (CNPJ): 17.155.730/0001-64
Company Registry (NIRE): 31300040127
BOARD OF DIRECTORS’ PROPOSAL FOR THE ANNUAL AND EXTRAORDINARY SHAREHOLDERS’ MEETINGS TO BE HELD ON APRIL 30, 2025, AT 2:00 PM, FULLY REMOTELY.
Dear Shareholders,
In compliance with CVM Resolution 81, the Company’s Management hereby submits for your analysis the following proposals relative to the matters included in the agenda of the Shareholders’ Meetings.
At the Annual Shareholders’ Meeting:
(i) approve the Management Report and the Financial Statements for the year ended December 31, 2024, accompanied by their respective supplementary documents
The Management Report, the Financial Statements, accompanied by the Independent Auditor’s Report and the Fiscal Council’s Opinion, relative to the 2024 fiscal year, are available in Annex 6 hereto.
(ii) approve the allocation of the net income for 2024 and the Company’s capital budget
Based on the Company’s financial statements ended December 31, 2024, we hereby propose to the Annual Shareholders’ Meeting, with the favorable opinion by the Fiscal Council, that the Net Income for 2024, totaling R$7,117,146 thousand, the balance of realization of the cost attributed to PP&E, totaling R$16,472 thousand, and the realization of the unrealized profit reserve, totaling R$834,603 thousand, be allocated as follows:
| • | R$350,151 thousand to Shareholders’ Equity, in the Legal Reserve account, pursuant to Law 6,404/1976; |
| • | R$3,733,431 thousand to the payment of mandatory dividends to the Company’s shareholders, in two equal installments, the first of which by June 30, 2025, and the second by December 30, 2025, as shown below: |
| (i) | R$1,848,780 thousand declared as Interest on Equity (IOE) and applied to the mandatory dividends, as resolved by the Executive Board upon the declaration of IOE in 2024; and |
| (ii) | R$1,884,651 thousand declared as mandatory dividends, payable to shareholders registered in the Book of Registry of Registered Shares on the date of the holding of the ASM. |
| • | R$2,935,900 thousand to Shareholders’ Equity, in the Retained Profits Reserve account, to guarantee the Company’s consolidated investments planned for 2025, as per the capital budget; and |
| • | R$114,136 thousand to Shareholders’ Equity, in the Tax Incentive Reserve account, referring to tax incentives linked to investments in the Sudene region. |
The Unrealized Profit Reserve will remain with the balance of R$834,603 thousand, considering the reversal of reserve created in 2023 and the new reserve of the same value created in 2024.
Mandatory dividends will be paid in two equal (2) installments, with the first installment paid by June 30 and the second by December 30, 2025. The Executive Board will be responsible for determining the places and processes of payment.
(iii) set the overall compensation of Management and the members of the Fiscal Council and the Audit Committee
Approval of the setting of the overall compensation of Management and the members of the Fiscal Council and the Audit Committee, in the amount of R$37,750,000.00 (thirty-seven million, seven hundred and fifty thousand reais) for the cycle between May 2025 and April 2026, Annex 3;
At the Extraordinary Shareholders' Meeting:
(iv) approve the Revision of the Company's Bylaws so as to improve wording, by rearranging the topics of the items, grouping them and removing unnecessary provisions; and clearly defining the duties of each Executive Board Member, among others.
The changes are available in Annex 8 hereto in the form of a table (“Then” “Now”), with the appropriate justifications, as well as the track changes version in the same annex.
(v) approve the consolidation of the Company’s Bylaws so as to reflect the above-mentioned changes.
The consolidated version of the Company's Bylaws containing the changes are available in Annex 8 hereto.
(vi) authorize management to take all the necessary measures to formalize the resolutions above.
Authorize the implementation of all acts so as to formalize the passed resolutions.
As it can be verified, this proposal aims to serve the legitimate interests of the Company and its shareholders, the reason why the Board of Directors expects it will be approved.
Belo Horizonte, March 31, 2025.
Márcio Luiz Simões Utsch
Chair of the Board of Directors
| 4. | Notice to the Market dated March 27, 2025 – Resignation of Board Member |
COMPANHIA ENERGÉTICA DE MINAS GERAIS - CEMIG
PUBLICLY-HELD COMPANY
CORPORATE TAXPAYER’S ID (CNPJ): 17.155.730/0001-64
COMPANY REGISTRY (NIRE): 31300040127
NOTICE TO THE MARKET
Resignation of Board member
COMPANHIA ENERGÉTICA DE MINAS GERAIS –
CEMIG (“Company” or “CEMIG”),
a publicly-held company, with shares traded on the stock exchanges of São Paulo, New York and Madrid, hereby communicates that
it has received, on this date, the resignation letter from José João Abdalla Filho as a Board member, effective from April
02, 2025.
CEMIG appreciates and would like to thank José João Abdalla Filho for his relevant contribution during his office.
The Company states that it will adopt the necessary measures to elect his replacement, pursuant to its Bylaws and applicable regulations.
Belo Horizonte, March 27, 2025.
Andrea Marques de Almeida
Vice President of Finance and Investor Relations
| 5. | Notice to the Market dated April 30, 2025 – Filing of Form 20-F |
COMPANHIA ENERGÉTICA DE MINAS GERAIS - CEMIG
PUBLICLY HELD COMPANY
Corporate Taxpayer’s ID (CNPJ): 17.155.730/0001-64
Company Registry (NIRE): 31300040127
NOTICE TO THE MARKET
Form 20-F
A COMPANHIA ENERGÉTICA DE MINAS GERAIS – CEMIG (“CEMIG”), a publicly held company with shares traded on the stock exchanges of São Paulo, New York and Madrid, hereby informs the Brazilian Securities and Exchange Commission (CVM), B3 S.A. – Brasil, Bolsa, Balcão (“B3”) and the market in general that it has registered on April 30, 2025, Form 20-F for the 2024 fiscal year (“2024 Form 20-F”) with the U.S. Securities and Exchange Commission (“SEC”).
2024 Form 20-F will be filed and available starting tomorrow, May 1st, and can be accessed on SEC’s website, at www.sec.gov, or the Company’s Investor Relations website, at http://ri.cemig.com.br.
Belo Horizonte, April 30, 2025.
Andrea Marques de Almeida
Vice-Presidente de Finanças e de Relações com Investidores
| 6. | Notice to Shareholders dated April 30, 2025 - Resolutions passed at the AESM – Dividends/IoE |
COMPANHIA ENERGÉTICA DE MINAS GERAIS - CEMIG
PUBLICLY-HELD COMPANY
CORPORATE TAXPAYER’S ID (CNPJ): 17.155.730/0001-64
COMPANY REGISTRY (NIRE): 31300040127
NOTICE TO SHAREHOLDERS
Resolutions passed at the AESM – Dividends/IoE
We hereby inform our shareholders that the Annual and Extraordinary Shareholders’ Meetings (AESM) held today, resolved, among other matters, on:
DIVIDENDS/IoE:
| a) | from the net income for the 2024 FY, in the amount of R$$7,117,146 thousand, R$$3,733,431 thousand shall be allocated as mandatory dividends to the Company’s shareholders, to be paid in two equal installments, the first of which by 06/30/2025, and the second by 12/30/2025, as follows: |
✓ To ratify R$$1,848,780 thousand as Interest on Equity (“IoE”), already declared, according to the table below;
| Approval Date | Date “with rights” | Date “ex-rights” | Per common/preferred share (R$) | Total Amount (R$ thousand) |
| 03/21/2024 | 03/26/2024 | 03/27/2024 | 0.17556586886 | 386,337 |
| 06/18/2024 | 06/21/2024 | 06/24/2024 | 0.15021208844 | 429,709 |
| 09/17/2024 | 09/23/2024 | 09/24/2024 | 0.16520222078 | 472,591 |
| 12/17/2024 | 12/23/2024 | 12/26/2024 | 0.19580751126 | 560,143 |
| TOTAL | 0.68678768934 | 1,848,780 | ||
✓ To declare R$$1,884,651 thousand as dividends, corresponding to R$$0.65881180680 per common/preferred share, payable to shareholders registered in the Book of Registry of Registered Shares on the date of the holding of the AESM, that is, 04/30/2025. The shares will be traded “ex-rights” from 05/02/2025.
Shareholders whose shares are not held in custody at CBLC (Companhia Brasileira de Liquidação e Custódia) and whose registration data is outdated are advised to go to a branch of Banco Itaú Unibanco S.A. (the institution administering CEMIG’s Registered Shares System) bearing their personal documents for the due update of their registration data.
Belo Horizonte, April 30, 2025.
Andrea Marques de Almeida
Vice President of Finance and Investor Relations
| 7. | Notice to the Market dated May 5, 2025 – Change in Relevant Shareholding |
COMPANHIA ENERGÉTICA DE MINAS GERAIS - CEMIG
PUBLICLY-HELD COMPANY
CORPORATE TAXPAYER’S ID (CNPJ): 17.155.730/0001-64
COMPANY REGISTRY (NIRE): 31300040127
NOTICE TO THE MARKET
Change in relevant shareholding
COMPANHIA ENERGÉTICA DE MINAS GERAIS – CEMIG (“Cemig or Companhia”), pursuant to article 12 of CVM Resolution 44/2021, of August 23, 2021, hereby announces that it received a letter from BlackRock, Inc (“BlackRock”), headquartered at 55 East 52nd Street, in the City and State of New York, 10022-0002, USA, stating that:
a) On April 24, 2025, it sold preferred shares issued by Companhia Energética de Minas Gerais – CEMIG (“Company”), being that, on said date, its aggregate equity interests in the Company’s total share capital changed to 172,232,069 preferred shares and 17,574,405 American Depositary Receipts (“ADRs”) representing 17,574,405 preferred shares, totaling 189,806,474 preferred shares corresponding to approximately 9.962% of the total preferred shares issued by the Company and 660,184 derivative financial instruments referenced to preferred shares with financial settlement, corresponding to approximately 0.034% of the total preferred shares issued by the Company.
b) On April 24, 2025, it acquired preferred shares issued by Companhia Energética de Minas Gerais – CEMIG (“Company”), being that, on said date, its aggregate equity interests in the Company’s total share capital changed to 173,039,815 preferred shares and 17,585,144 American Depositary Receipts (“ADRs”) representing 17,585,144 preferred shares, totaling 190,624,959 preferred shares corresponding to approximately 10.006% of the total preferred shares issued by the Company and 660,184 derivative financial instruments referenced to preferred shares with financial settlement, corresponding to approximately 0.034% of the total preferred shares issued by the Company.
BlackRock, in the aforementioned letter, further stated that:
“The purpose of the above-mentioned equity interests is strictly related to investing, not aiming at changing the Company’s controlling interest or the management structure; and
BlackRock did not enter into any agreements or contracts regulating voting rights or the purchase and sale of securities issued by the Company.”
Belo Horizonte, May 05, 2025
Andrea Marques de Almeida
Vice President of Finance and Investor Relations
| 8. | Earnings Release – 1Q2025 |
CONTENTS
| Ebitda and profit by company, 1Q25 | 2 |
| Profit and loss accounts | 3 |
| Results by business segment | 4 |
| CONSOLIDATED ELECTRICITY MARKET | 5 |
| PERFORMANCE, BY COMPANY | 6 |
| Cemig D | 6 |
| Billed electricity market | 6 |
| Sources and uses of electricity – MWh | 7 |
| Client base | 7 |
| Performance by sector | 7 |
| The 2024 Annual Tariff Adjustment | 8 |
| Five-year Tariff Reviews compared | 9 |
| OPEX and EBITDA Realized vs. Regulatory | 9 |
| Indicators of supply quality – DEC and FEC | 10 |
| Combating default | 10 |
| Energy losses | 11 |
| Cemig GT and Cemig Holding Company | 12 |
| Electricity market | 12 |
| Sources and uses of electricity | 12 |
| Gasmig | 13 |
| Consolidated results | 14 |
| Net profit | 14 |
| Operational revenue | 15 |
| Operational costs and expenses | 17 |
| Finance income and expenses | 20 |
| Gain/loss in non-consolidated investees (Equity income) | 21 |
| CONSOLIDATED EBITDA (IFRS, and Adjusted) | 22 |
| Ebitda of Cemig D | 23 |
| Cemig GT – Ebitda | 24 |
| Investment | 25 |
| Debt | 26 |
| Cemig’s long-term ratings | 28 |
| ESG – Report on performance | 29 |
| Performance of Cemig’s securities | 32 |
| Generation plants | 33 |
| RAP: July 2024 – June 2025 cycle | 34 |
| Regulatory Transmission revenue | 35 |
| Complementary information | 35 |
| Cemig D | 35 |
| Cemig GT | 37 |
| Cemig, Consolidated | 38 |
| Disclaimer | 44 |
| 1 |
Ebitda and profit by company, 1Q25
Consolidated P&L – 1Q25
| 1Q25 | 1Q24 | Change % | 1Q25 | 1Q24 | Change % | ||
| (R$ mn) | EBITDA (IFRS) | Adjusted EBITDA, by company | |||||
| Cemig D | 819 | 746 | 9.8% | 798 | 746 | 7.0% | |
| Cemig GT | 749 | 801 | -6.5% | 744 | 781 | -4.7% | |
| Gasmig | 213 | 218 | -2.3% | 213 | 218 | -2.3% | |
| Consolidated | 1,827 | 2,011 | -9.1% | 1,799 | 1,991 | -9.6% | |
| New replacement value (VNR) | 53 | 31 | 71.0% | 53 | 31 | 71.0% | |
| Equity income (Gain (loss) in non-consolidated investees) | 42 | 91 | -53.8% | 42 | 91 | -53.8% | |
| Consolidated, less {VNR + equity income} | 1,732 | 1,889 | -8.3% | 1,704 | 1,869 | -8.8% | |
| 1Q25 | 1Q24 | Change % | 1Q25 | 1Q24 | Change % | ||
| (R$ mn) | Net profit by company (IFRS) | Adjusted net profit, by company | |||||
| Cemig D | 311 | 322 | -3.4% | 297 | 322 | -7.8% | |
| Cemig GT | 541 | 494 | 9.5% | 537 | 495 | 8.5% | |
| Gasmig | 114 | 117 | -2.6% | 114 | 117 | -2.6% | |
| Consolidated | 1,039 | 1,153 | -9.9% | 1,021 | 1,154 | -11.5% | |

| 2 |
Profit and loss accounts
| 1Q25 | 1Q24 | Change, % | |
| PROFIT AND LOSS ACCOUNTS (R$ ’000) | |||
| NET REVENUE | 9,844,231 | 9,057,867 | 8.7% |
| COSTS | |||
| Cost of electricity and gas | -5,522,744 | -4,864,031 | 13.5% |
| Infrastructure construction costs | -1,201,864 | -920,981 | 30.5% |
| Cost of operation | -1,278,957 | -1,247,395 | 2.5% |
| Total cost | -8,003,565 | -7,032,407 | 13.8% |
| GROSS PROFIT | 1,840,666 | 2,025,460 | -9.1% |
| EXPENSES | |||
| Client default provision | -50,628 | -75,853 | -33.3% |
| General and administrative expenses | -193,967 | -169,746 | 14.3% |
| Other expenses, net | -174,793 | -230,659 | -24.2% |
| Other revenues | - | 42,989 | - |
| Total expenses | -419,388 | -433,269 | -3.2% |
| Share of gain (loss) in non-consolidated investees | 42,119 | 90,501 | -53.5% |
| Profit before Finance income (expenses) and Taxes on profit | 1,463,397 | 1,682,692 | -13.0% |
| Finance income | 193,537 | 218,245 | -11.3% |
| Finance expenses | -443,168 | -399,231 | 11.0% |
| Net finance income (expense) | -249,631 | -180,986 | 37.9% |
| Profit before income tax and Social Contribution tax | 1,213,766 | 1,501,706 | -19.2% |
| Income tax and Social Contribution tax | -258,686 | -259,932 | -0.5% |
| Deferred income tax and Social Contribution tax | 83,660 | -88,883 | -194.1% |
| Total Income tax and Social Contribution tax / deferred | -175,026 | -348,815 | -49.8% |
| NET PROFIT FOR THE PERIOD | 1,038,740 | 1,152,891 | -9.9% |
| 3 |
Results by business segment
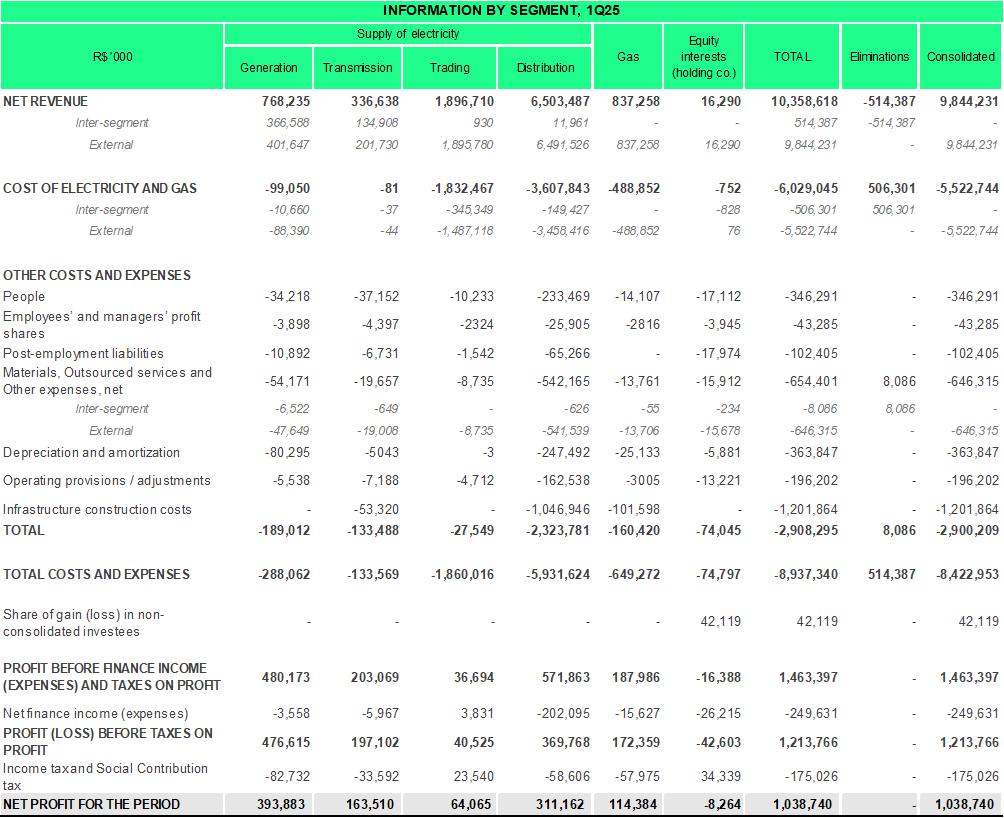
| 4 |
CONSOLIDATED ELECTRICITY MARKET
Cemig’s consolidated electricity market:
In March 2025 the Cemig Group invoiced approximately 9.46 million clients – an addition of approximately 205,000 clients, or a 2.2% increase in its consumer base from March 2024.
Of this total, 9,462,384 are final consumers, and/or represent Cemig’s own consumption; and 2,372 are other agents in the Brazilian electricity sector.
This chart shows the percentages of the Cemig Group’s sales to final consumers:
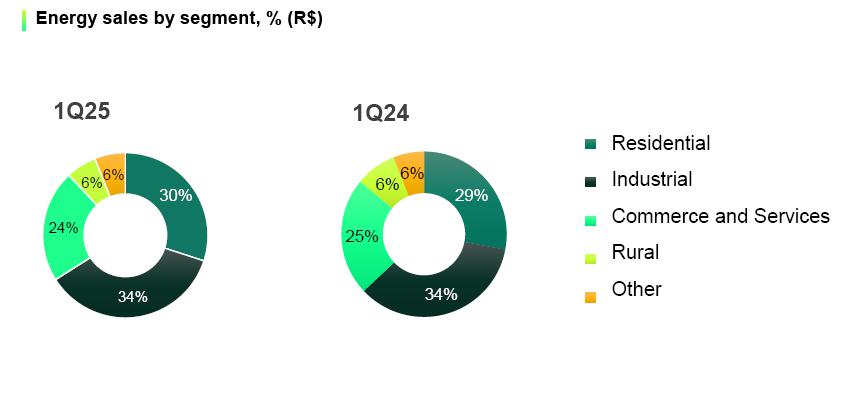
| 5 |
PERFORMANCE, BY COMPANY
Cemig D
Billed electricity market
| MWh | 1Q25 | 1Q24 | Change % |
| Captive clients + Power transport for clients* | |||
| Residential | 3,322,630 | 3,250,170 | 2.2% |
| Industrial | 5,633,542 | 5,574,606 | 1.1% |
| Captive market | 191,693 | 275,264 | –30.4% |
| Transport | 5,441,849 | 5,299,342 | 2.7% |
| Commercial, services and Others | 1,603,880 | 1,657,340 | –3.2% |
| Captive market | 895,466 | 1,076,142 | –16.8% |
| Transport | 708,414 | 581,198 | 21.9% |
| Rural | 555,100 | 614,792 | –9.7% |
| Captive market | 524,314 | 600,086 | –12.6% |
| Transport | 30,786 | 14,706 | 109.3% |
| Public services | 800,687 | 845,626 | –5.3% |
| Captive market | 605,273 | 719,985 | –15.9% |
| Transport | 195,414 | 125,641 | 55.5% |
| Concession holders | 71,871 | 76,189 | –5.7% |
| Transport | 71,871 | 76,189 | –5.7% |
| Own consumption | 7,925 | 8,188 | –3.2% |
| Total | 11,995,635 | 12,026,911 | –0.3% |
| Total, captive market | 5,547,301 | 5,929,835 | –6.5% |
| Total, energy transported for Free Clients | 6,448,334 | 6,097,076 | 5.8% |
* Excludes supply offset in distributed generation.
Electricity billed to captive clients, plus transport of energy for Free Clients and distributors, excluding supply offset in distributed generation, totaled 11,995 GWh in 1Q25 – 0.3% less than in 1Q24. This was mainly due to lower consumption in 3 client categories: consumption by rural consumers was 9.7% (59.7 GWh) lower; commercial consumption was down 3.2%, or 53.5 GWh; and public services consumed 5.3% (44.9 GWh) less than in 1Q24. These changes mainly reflected: (i) migration to Distributed Generation; and (ii) higher rainfall, resulting in less need for irrigation. At the same time, consumption by residential clients was 72.5 GWh (2.2%) higher, and industrial consumption was 58.9 GWh (1.1%) higher, reflecting higher industrial production.
The total of energy distributed 0.3% lower reflected: (i) consumption by the captive market 6.5% (382.5 GWh) lower; partially offset by (ii) Free Clients’ use of the network 5.8% (+351.3 GWh) higher. If offset Distributed generation is included, the total of energy distributed increased by 1.8%.
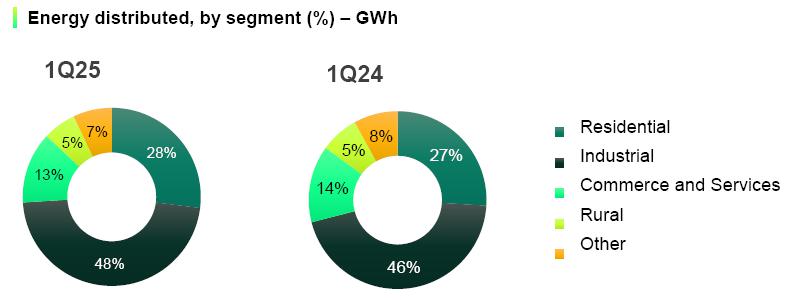
| 6 |
Sources and uses of electricity – MWh
| 1Q25 | 1Q24 | Change % | |
| Metered market – MWh | |||
| Transported for distributors | 71,871 | 75,697 | –5.1% |
| Transported for Free Clients | 6,375,406 | 6,033,163 | 5.7% |
| Own load + Distributed generation | 8,716,549 | 8,743,130 | –0.3% |
| Consumption by captive market | 5,597,673 | 5,889,366 | –5.0% |
| Distributed Generation market | 1,507,395 | 1,242,770 | 21.3% |
| Losses in distribution network | 1,611,481 | 1,610,994 | 0.0% |
| Total volume carried | 15,163,826 | 14,851,991 | 2.1% |
Client base
In March 2025 Cemig billed 9.45 million consumers – an increase of 2.2% from March 2024. Of this total, 5,058 were Free Clients using the distribution network of Cemig D.
| Mar. 2025 | Mar. 2024 | Change % | |
| NUMBER OF CAPTIVE CLIENTS | |||
| Residential | 8,017,329 | 7,780,429 | 3.0% |
| Industrial | 23,926 | 27,869 | –14.1% |
| Commercial, services and Others | 910,920 | 925,561 | –1.6% |
| Rural | 393,234 | 416,378 | –5.6% |
| Public authorities | 73,991 | 69,960 | 5.8% |
| Public lighting | 7,220 | 6,728 | 7.3% |
| Public services | 13,519 | 13,691 | –1.3% |
| Own consumption | 818 | 762 | 7.3% |
| Total, captive clients | 9,440,957 | 9,241,378 | 2.2% |
| NUMBER OF FREE CLIENTS | |||
| Industrial | 2,091 | 1,302 | 60.6% |
| Commercial | 2,692 | 1,819 | 48.0% |
| Rural | 115 | 29 | 296.6% |
| Public authorities | 43 | 1 | 4.200.0% |
| Public services | 109 | 27 | 303.7% |
| Concession holders | 8 | 8 | 0.0% |
| Total, Free Clients | 5,058 | 3,186 | 58.8% |
| Total, Captive market + Free Clients | 9,446,015 | 9,244,564 | 2.2% |
Performance by sector
Industrial: Energy distributed to industrial clients was 1.1% higher YoY in 1Q25, on higher physical production by industry, and was 47.0% of Cemig D’s total distribution. The greater part (45.4%) was energy transported for industrial Free Clients, which was 2.7% higher by volume than in 1Q24. Energy billed to captive industrial clients, though (comprising 1.6% of the total distributed), was 30.4% less by volume than in 1Q24, mainly due to migration of clients to the Free Market. Highlights of consumption patterns in industry by sector were: Increased consumption in Cement (+5.0%), Ferroalloys (+4.6%), and Extractive industries (+3.6%); and lower consumption in Non-ferrous metals (-12.6%), and Steel (-3.7%).
Residential consumption was 27.7% of the total energy distributed by Cemig D, and 2.2% higher in total volume than in 1Q24. Average monthly consumption per consumer in the quarter, at 138.1 kWh/month, was 0.8% lower than in 1Q24, reflecting milder temperatures than in that quarter. On the other hand, the total number of residential clients was increased by 3.0% year-on-year (236,900 new clients).
| 7 |
Commerce and Services: Energy distributed to and for these consumers was 13.4% of the total distributed by Cemig D in 1Q25, and by volume 3.2% less than in 1Q24. The change is the result of a 16.8% reduction in the volume of energy billed to captive clients, and a 16.1% increase in the volume of energy transported for Free Clients. The lower consumption reflects migration of clients to Distributed Generation.
Rural: Consumption by rural clients was 4.6% of the total energy distributed, and was 9.7% lower by volume than in 1Q24. This mainly reflected (i) lower consumption for irrigation, and (ii) a reduction of 5.5% in the number of consumer units in this category.
Public services: consumed 6.7% of the energy distributed in 1Q25, and totaled 5.3% less by volume than in 1Q24.
The 2024 Annual Tariff Adjustment
The tariffs of Cemig D are adjusted in May each year; and every five years are subjected to a Periodic Tariff Review, also in May. The aim of the Annual Tariff Adjustment is to pass on changes in the costs defined as ‘non-manageable’ in full, to the client, and provide inflation adjustment for the costs defined as ‘manageable’, which are those specified in the Tariff Review. Manageable costs are adjusted by the IPCA inflation index, less a factor known as the ‘X Factor’, designed to capture productivity, under a system using the price-cap regulatory model.
On May 14, 2024 Aneel ratified Cemig D’s Tariff Adjustment, effective May 28, 2024 to May 27, 2025, with an average increase, for consumers, of 7.32%. The average effect for low-voltage clients was an increase of 6.72%, and for residential consumers, an increase of 6.70%. The component percentage of the increase corresponding to manageable costs (referred to as ‘Portion B’) was 1.27%. The increase relating to non-manageable costs (‘Portion A’ – comprising purchase of energy, transmission, sector charges and non-recoverable revenues) was 0.81%. The increase in the financial components of the tariff contributed 5.23%. The financial components effect in 2024 comes mainly from removal of the component included in the 2023 adjustment process relating to the repayment to consumers of PIS, Pasep and Cofins taxes totaling R$ 1.27 billion.
| Average effects of the Tariff Adjustment | |
| High voltage – average | 8.63% |
| Low voltage – average | 6.72% |
| Average effect | 7.32% |
See more details at this link:
https://www2.aneel.gov.br/aplicacoes/tarifa/arquivo/Nota%20T%C3%A9cnica%20RTA%202024_CEMIG.pdf
| 8 |
Five-year Tariff Reviews compared
This table compares the Tariff Reviews made in 2023 and in the previous cycle (2018):
| Five-year Tariff Reviews | 2018 | 2023 |
| Gross Remuneration Base – R$ million | 20,490 | 25,587 |
| Net Remuneration Base – R$ million | 8,906 | 15,200 |
| Average depreciation rate: | 3.84% | 3.95% |
| WACC (after taxes) | 8.09% | 7.43% |
| Remuneration of ‘Special Obligations’ – R$ mn | 149 | 272 |
| CAIMI * R$ mn | 333 | 484 |
| QRR ** (Depreciation calculation) R$ mn | 787 | 1,007 |
* CAIMI: (Cobertura Anual de Instalações Móveis e Imóveis) – Annual support for facilities.
** QRR: ‘Regulatory Reintegration Quota’ – Gross base x annual depreciation rate.
See more details at this link:
https://www2.aneel.gov.br/aplicacoes/tarifa/arquivo/NT%2012%202023%20RTP%20Cemig.pdf
OPEX and EBITDA Realized vs. Regulatory
(R$ million)
OPEX and EBITDA better than regulatory in 1Q25.

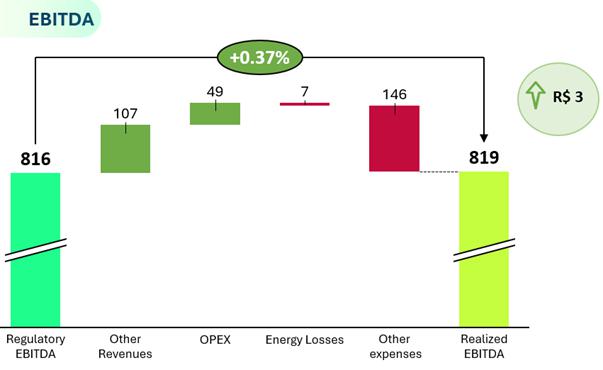
Note: Regulatory EBITDA is made up of capital remuneration,
regulatory reintegration quota and a percentage of the Annual support for facilities, published in ANEEL's Technical Notes in the events
of the Tariff Review or Adjustment.
| 9 |
Indicators of supply quality – DEC and FEC
In 2023 the State of Minas Gerais experienced an increase in extreme atmospheric events, which caused a slight increase in electricity outages. In this challenging context Cemig has taken extra steps to reduce outage duration and frequency, while also making major investments in its distribution operations to maximize service quality.
These actions have produced positive results. Cemig's DEC (average outage Duration per Consumer) was within the regulatory limit of 9.48 hours: in the 12 months to end-March 2025 it was 9.42 hours. The perceived DEC, meanwhile, was 15.40 hours, a reduction of more than 3 hours compared to the moving window that ended in March 2024.
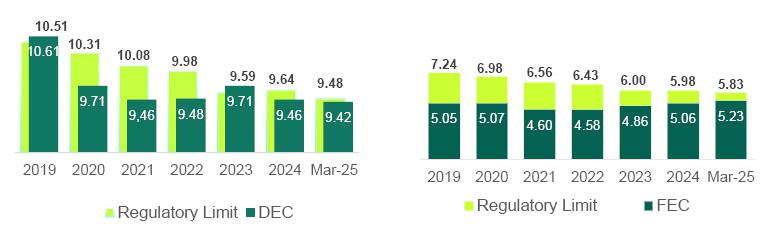
Combating default
The Company has maintained active and significant efforts in collection, which has helped keep its Receivables Recovery Index at a high level – in March 2025 this index was 98.94%.
New payment channels, and online negotiation, have helped to increase the proportion of client payments being made via digital channels (PIX instant payments, automatic debits, payments by card and app, etc.) – which have reached 67.3% of the total collected, 0.88 p.p. higher than the same period last year. A highlight is the PIX system – which was used for 32.3% of all bill payments by clients in March 2025. It has saved R$ 32.6 million in payment charges/costs since it was implemented in 2021.

| 10 |
Energy losses
Energy losses in the 12 months to the end of March 2025, at 10.49%, were within the regulatory target level of 10.50%.
Highlights of our combat of energy losses in 1Q25 include: approximately 84,000 inspections; replacement of more than 71,000 obsolete meters; replacement of 14,000 conventional meters by smart meters (bringing the total of smart meters installed since the project began in September 2021 to 384,000); and regularization of 2,600 clandestine connections made by families living in ‘invaded’ and low-income areas, through our Energia Legal program, which uses ‘bulletproofed’ networks (bringing the total of connections regularized since the start of the project in February 2023 to 25,400). Planned for 2025 are: 340,000 inspections; installation of more than 400,000 smart meters; and regularization of 54,000 families in low-income communities (using BT Zero and ‘Bulletproofed Meter Panel’ technologies).

| 11 |
Cemig GT and Cemig Holding Company
Electricity market
The total volume of electricity sold by Cemig GT and by the holding company (‘Cemig H’), excluding sales on the wholesale power exchange (CCEE), was 9.3% higher than in 1Q24. Cemig GT billed 5,839 GWh (including quota sales) in 1Q25, 12.7% more than in 1Q24.
The holding company reported sales of 4,763 GWh in 1Q25, 5.4% more than in 1Q24. Migration of purchase and sale contracts from Cemig GT to the holding company began in 3Q21, and has gradually increased since then. Approximately 60% of all purchase contracts have now migrated.
| 1Q25 | 1Q24 | Change % | |
| Cemig GT – MWh | |||
| Free Clients | 3,390,177 | 2,953,278 | 14.8% |
| Industrial | 2,100,685 | 1,916,629 | 9.6% |
| Commercial | 908,825 | 1,007,960 | –9.8% |
| Rural | 9,446 | 5,033 | 87.7% |
| Public authorities | 102,285 | 717 | 14,165.7% |
| ‘Energy retailer’ Free Clients | 268,937 | 22,939 | 1,072.4% |
| Free Market – Traders and Cooperatives | 1,266,006 | 1,065,136 | 18.9% |
| Quota supply | 580,100 | 571,019 | 1.6% |
| Regulated Market | 570,369 | 561,529 | 1.6% |
| Regulated Market – Cemig D | 32,323 | 31,792 | 1.7% |
| Total, Cemig GT | 5,838,975 | 5,182,754 | 12.7% |
| Cemig H – MWh | |||
| Free Clients | 2,308,556 | 2,397,577 | –3.7% |
| Industrial | 1,805,744 | 1,926,233 | –6.3% |
| Commercial | 443,174 | 455,186 | –2.6% |
| Rural | 35,868 | 16,158 | 122.0% |
| Public services | 23,770 | 0 | - |
| Free Market – Traders and Cooperatives | 2,454,390 | 2,122,441 | 15.6% |
| Total Cemig H | 4,762,946 | 4,520,018 | 5.4% |
| Cemig GT + H | 10,601,922 | 9,702,772 | 9.3% |
Sources and uses of electricity
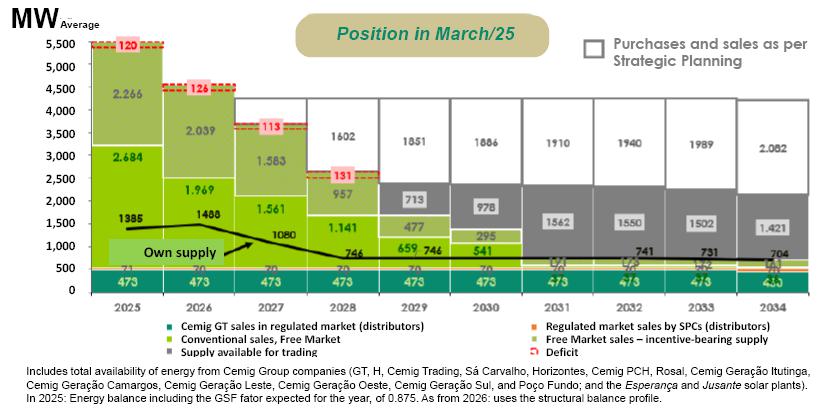
| 12 |
Gasmig
Gasmig is the exclusive distributor of piped natural gas for the whole of the state of Minas Gerais. It supplies gas to industrial, commercial and residential users, compressed natural gas and vehicle natural gas, and gas as fuel for thermoelectric generation plants. Its concession expires in January 2053. Cemig owns 99.57% of Gasmig.
Gasmig’s last Tariff Review was completed in April 2022. Highlights:
| § | The WACC used (real, after taxes) was reduced from 10.02% p.a. to 8.71% p.a. |
| § | The Net Remuneration Base was increased significantly, to R$ 3.48 billion. |
| § | The regulator recognized the cost of PMSO (Personnel, Materials, outsourced Services and Other expenses) in full. |
| Market (volume in ’000 m3) | 2022 | 2023 | 2024 | 1Q24 | 1Q25 | Change, 1Q24-1Q25 |
| Automotive | 40,950 | 31,907 | 22,511 | 5,371 | 5,473 | 1.9% |
| Compressed vehicle natural gas | 364 | 541 | 630 | 124 | 148 | 19.4% |
| Industrial | 870,667 | 830,943 | 786,363 | 191,349 | 177,025 | -7.5% |
| Industrial compressed natural gas | 13,616 | 12,473 | 10,275 | 2,099 | 2,254 | 7.4% |
| Residential | 11,392 | 11,912 | 12,095 | 2,602 | 2,747 | 5.6% |
| Co-generation | 13,137 | 12,075 | 12,164 | 3,549 | 2,826 | -20.4% |
| Commercial | 23,114 | 21,964 | 23,203 | 4,973 | 5,477 | 10.1% |
| Subtotal – conventional gas | 973,240 | 921,815 | 867,241 | 210,067 | 195,950 | -6.7% |
| Thermal plants | 37,991 | - | - | - | - | - |
| Subtotal – gas sold | 1,011,231 | 921,815 | 867,241 | 210,067 | 195,950 | -6.7% |
| Industrial – Free Market | 87,133 | 92,362 | 97,302 | 22,767 | 41,065 | 80.4% |
| Industrial compressed natural gas – Free Market | 0 | 0 | 10,421 | 2,359 | 2,150 | -8.9% |
| Thermal – Free Market | 7,119 | 19,050 | 58,046 | 116 | 13,955 | 11930.2% |
| Total sales (including Free Clients) | 1,105,483 | 1,033,227 | 1,033,010 | 235,309 | 253,120 | 7.6% |
| Ebitda (R$ ’000) | 1Q25 | 1Q24 |
| Profit (loss) for the period | 114,383 | 117,007 |
| Income tax and Social Contribution tax | 59,678 | 61,452 |
| Net finance income (expenses) | 15,627 | 17,159 |
| Depreciation and amortization | 23,430 | 22,024 |
| Ebitda per CVM Resolution 156 | 213,118 | 217,642 |
The volume of gas sold to standard users in 1Q25 was 6.7% lower than in 1Q24, while the volume distributed to industrial Free Clients and for thermoelectric power generation was 126.5% higher, resulting in total volume 7.6% higher.
Gasmig’s Ebitda was 2.1% lower in 1Q25 than in 1Q24, reflecting: (i) lower volume of gas sold in the captive market; and (ii) higher selling and administrative expenses.
The number of Gasmig’s clients increased by 7.5% from 1Q24, to a total of 105,412 consumers in March 2025. This reflects expansion of both the commercial and the residential client bases (addition of 7,400 clients).

| 13 |
Consolidated results
Net profit
For 1Q25, Cemig reports net profit of R$ 1,038.7 million in 1Q25, which compares to net profit of R$ 1,152.9 million in 1Q24. Adjusted net profit for 1Q25 is R$ 1,020,5 million, compared to R$ 1,154.0 million in 1Q24. Main factors in this result were:
| § | Negative impact of R$ 87.9 million on profit in Trading, due to the exposure of approximately 570 MW average to differences in spot prices between sub-markets: a significant part of the energy purchased is in the Northeast, and a part of that energy is sold in other sub-markets, generating a surplus of energy in the first and a deficit in the others The effect was more significant in March, in which there were differences of around R$ 270/MW in spot prices between (a) the Southeast and Center-West regions and (b) the Northeast. Differences in spot prices between sub-markets are caused by limitations on transmission – and became more intense in 1Q25 due to adoption of the Hybrid Newave system, with more stringent risk aversion criteria in the model. |
| § | Equity income (gain/loss in non-consolidated investees) was R$ 48.4 million lower YoY, due to (i) a weaker result in Belo Monte, and (ii) the absence of Aliança Energia from the calculation, following Cemig’s sale of its stake in Aliança in 3Q24. The equity income from Aliança in 1Q24 was R$ 30.8 million. |
| § | Cemig D distributed 0.3% less energy in 1Q25 than in 1Q24. |
| § | Profit in the generation activity was R$ 21.8 million higher, benefiting from the better GSF. In 1Q25 there was secondary energy in January and February, while in 1Q24 no month had a GSF greater than 1. |
| § | Net finance income (expenses) was R$ 68.6 million weaker, due to: (i) the higher volume of debt, especially in Cemig D; (b) the higher Selic basic interest rate; and (iii) higher IPCA inflation than in 1Q24. |
Main non-recurring effects:
| § | Post-employment liabilities were remeasured in 1Q25, with a positive effect of R$ 18.3 million on profit, due to the migration of 1,032 employees to the Premium Health Plan (which has no post-employment obligation for the company) during the window reopened in January 2025. |
| § | In 1Q24, sales were concluded of 15 Small Hydro Plants (PCHs) and Local Hydro Plants (CGHs), with positive effect of R$ 25.0 million on profit of 1Q24. |
| § | In 1Q24 there was also a negative effect of impairments totaling R$ 11.7 million to the value of plants being allocated for sale; and an impairment of R$ 3.5 million posted for dispute of a receivable by a client. |
More details of these variations are given below.
| 14 |
Operational revenue
| 1Q25 | 1Q24 | Change % | |
| R$ ’000 | |||
| Revenue from supply of electricity | 8,374,412 | 8,019,144 | 4.4% |
| Revenue from use of distribution systems (TUSD charge) | 1,429,008 | 1,169,299 | 22.2% |
| CVA and Other financial components in tariff adjustments | 126,322 | 75,675 | 66.9% |
| Reimbursement to consumers of PIS, Pasep and Cofins tax credits | – | 322,666 | – |
| Transmission – operation and maintenance revenue | 60,439 | 66,562 | -9.2% |
| Transmission – construction revenue | 66,344 | 63,394 | 4.7% |
| Financial remuneration of transmission contractual assets | 173,432 | 151,392 | 14.6% |
| Generation – capital reimbursement | 26,928 | 21,434 | 25.6% |
| Distribution – construction revenue | 1,148,545 | 893,427 | 28.6% |
|
Adjustment to expectation of cash flow from indemnifiable financial assets of the distribution concession |
53,203 | 30,951 | 71.9% |
| Gain on financial updating of Concession Grant Fee | 138,457 | 128,625 | 7.6% |
| Settlements on CCEE | 21,923 | 40,757 | -46.2% |
| Retail supply of gas | 920,783 | 919,648 | 0.1% |
| Fine for continuity indicator shortfall | -46,812 | -45,927 | 1.9% |
| Other revenues | 722,019 | 636,954 | 13.4% |
| Taxes and charges reported as deductions from revenue | -3,370,772 | -3,436,134 | -1.9% |
| Net revenue | 9,844,231 | 9,057,867 | 8.7% |
Revenue from supply of electricity
| 1Q25 | 1Q24 | Change, % | ||||||
| MWh | R$ ’000 | Average price billed – R$/MWh (1) | MWh | R$ ’000 | Average price billed – R$/MWh (1) | MWh | R$ ’000 | |
| Residential | 3,837,945 | 3,422,558 | 891.77 | 3,667,800 | 3,126,496 | 852.42 | 4.6% | 9.5% |
| Industrial | 4,311,273 | 1,204,333 | 279.35 | 4,201,687 | 1,298,596 | 309.07 | 2.6% | –7.3% |
|
Commercial, services and others |
3,038,828 | 1,646,848 | 541.94 | 3,135,922 | 1,674,462 | 533.96 | –3.1% | –1.6% |
| Rural | 738,830 | 516,804 | 699.49 | 750,135 | 533,356 | 711.01 | –1.5% | –3.1% |
| Public authorities | 262,961 | 227,803 | 866.3 | 260,608 | 223,285 | 856.78 | 0.9% | 2.0% |
| Public lighting | 233,904 | 128,335 | 548.67 | 248,370 | 130,982 | 527.37 | –5.8% | –2.0% |
| Public services | 321,763 | 150,285 | 467.07 | 250,784 | 185,343 | 739.05 | 28.3% | –18.9% |
| Subtotal | 12,745,504 | 7,296,966 | 572.51 | 12,515,306 | 7,172,520 | 573.1 | 1.8% | 1.7% |
| Own consumption | 7,925 | – | – | 8,188 | – | – | –3.2% | – |
|
Retail supply not yet invoiced, net |
– | –32,457 | – | – | –155,322 | – | – | – |
| 12,753,429 | 7,264,509 | 572.51 | 12,523,494 | 7,017,198 | 573.1 | 1.8% | 3.5% | |
| Wholesale supply to other concession holders (2) | 4,825,648 | 1,191,775 | 246.97 | 4,275,663 | 1,051,019 | 245.81 | 12.9% | 13.4% |
|
Wholesale supply not yet invoiced |
– | –81,872 | – | – | –49,073 | – | – | 66.8% |
| Total | 17,579,077 | 8,374,412 | 483.11 | 16,799,157 | 8,019,144 | 489.76 | 4.6% | 4.4% |
| (1) | The calculation of average price does not include revenue from supply not yet billed. |
| (2) | Includes Regulated Market Electricity Sale Contracts (CCEARs) and ‘bilateral’ contracts with other agents. |
| 15 |
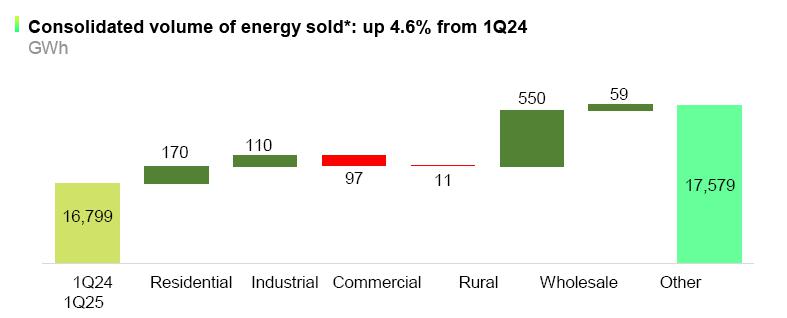
* Includes supply offset in Distributed Generation.
Energy sold to final consumers
Gross revenue from energy sold to final consumers in 1Q25 was R$ 7,264.5 million, or 3.5% more than in 1Q24 (R$ 7,017.2 million) – reflecting (i) volume sold 1.8% higher, and (ii) the tariff adjustment for Distribution, in effect from May 28, 2024, which provided an average increase of 7.32%.
Wholesale supply
Revenue from wholesale supply in 1Q25 was R$ 1,109.9 million, an increase of 10.8% in relation to 1Q24 (R$ 1,001.9 million). This primarily reflects a YoY increase of 13.4% in the volume of energy invoiced.
Transmission
| 1Q25 | 1Q24 | Change % | |
| TRANSMISSION REVENUE (R$ ’000) | |||
| Operation and maintenance | 60,439 | 66,562 | -9.2% |
| Infrastructure construction, updating and enhancement | 66,344 | 63,394 | 4.7% |
| Financial remuneration of transmission contractual assets | 173,432 | 151,392 | 14.6% |
| Total | 300,215 | 281,348 | 6.7% |
Transmission revenue was R$ 18.9 million higher than in 1Q24, mainly reflecting financial revenue on contractual assets 14.6% (R$ 22.0 million) higher, due to the IPCA inflation index posting inflation of 2.04% in 1Q25, higher than in 1Q24 when it posted inflation of 1.42%.
Gas
Gross revenue from supply of gas in 1Q25 totaled R$ 920.8 million, compared to R$ 919.5 million in 1Q24. This variation is mainly due to the higher volume of gas distributed to free customers.
| 16 |
Revenue from Use of Distribution Systems – The TUSD charge
| 1Q25 | 1Q24 | Change % | |
| TUSD (R$ ’000) | |||
| Use of the Electricity Distribution System | 1,429,008 | 1,169,299 | 22.2% |
In 1Q25 revenue from the TUSD – charged to Free Consumers for distribution of their energy – was R$ 259.7 million higher than in 1Q24. This mainly reflects (i) volume of energy transported for Free Clients 5.8% higher, as well as (ii) the distribution company’s annual tariff adjustment, which came into effect in May 2024.
| 1Q25 | 1Q24 | Change % | |
| POWER TRANSPORTED – MWh | |||
| Industrial | 5,441,849 | 5,299,342 | 2.7% |
| Commercial | 708,414 | 581,198 | 21.9% |
| Rural | 30,786 | 14,706 | 109.3% |
| Public services | 195,414 | 125,641 | 55.5% |
| Concession holders | 71,871 | 76,189 | –5.7% |
| Total energy transported | 6,448,334 | 6,097,076 | 5.8% |
Operational costs and expenses
| 1Q25 | 1Q24 | Change % | |
| CONSOLIDATED (R$ ’000) | |||
| Electricity bought for resale | 4,266,626 | 3,510,632 | 21.5% |
| Charges for use of national grid | 767,266 | 843,222 | –9.0% |
| Gas purchased for resale | 488,852 | 510,177 | –4.2% |
| Construction cost | 1,201,864 | 920,981 | 30.5% |
| People | 346,291 | 324,058 | 6.9% |
| Employees’ and managers’ profit shares | 43,285 | 39,232 | 10.3% |
| Post–employment liabilities | 102,405 | 142,285 | –28.0% |
| Materials | 38,693 | 28,970 | 33.6% |
| Outsourced services | 514,714 | 518,907 | –0.8% |
| Depreciation and amortization | 363,847 | 328,542 | 10.7% |
| Provisions (reversals) | 145,574 | 139,585 | – |
| Impairment | – | 22,958 | – |
| Client default provision | 50,628 | 75,853 | –33.3% |
| Other operating costs and expenses, net | 92,908 | 103,263 | –10.0% |
| Other costs and expenses | 8,422,952 | 7,508,665 | 12.2% |
| Gain on disposal of investments | 0 | –42,989 | – |
| Total, other revenues (reducing expenses) | 0 | –42,989 | – |
| Total | 8,422,953 | 7,465,676 | 12.8% |
| 17 |
Operating costs and expenses in 1Q25 totaled R$ 8.42 billion, or R$ 954.7 million more than in 1Q24.
The main factors in the higher total were: Cost of energy bought for resale was R$ 756.0 million higher than in 1Q24; construction cost was R$ 280.9 million higher; depreciation and amortization was R$ 35.3 million higher; and in 1Q24 there was R$ 43.0 million in the line Other revenues (reducing expenses). See more details on costs and expenses in the following pages.
Electricity purchased for resale
| 1Q25 | 1Q24 | Change % | |
| CONSOLIDATED (R$ ’000) | |||
| Electricity acquired in Free Market | 1,511,636 | 1,239,531 | 22.0% |
| Electricity acquired in Regulated Market auctions | 963,255 | 1,001,518 | –3.8% |
| Distributed generation | 950,867 | 663,764 | 43.3% |
| Spot market | 319,240 | 63,761 | 400.7% |
| Supply from Itaipu Binacional | 306,415 | 268,696 | 14.0% |
| Physical guarantee quota contracts | 202,949 | 220,391 | –7.9% |
| Individual (‘bilateral’) contracts | 121,982 | 127,290 | –4.2% |
| Proinfa | 134,839 | 113,113 | 19.2% |
| Quotas for Angra I and II nuclear plants | 83,446 | 94,399 | –11.6% |
| Credits of PIS, Pasep and Cofins taxes | -328,003 | -281,831 | 16.4% |
| 4,266,626 | 3,510,632 | 21.5% |
The consolidated expense on electricity bought for resale in 1Q25 was R$ 4.27 billion, an increase of R$ 756.0 million (+21.5%) from 1Q24. This mainly reflects the following factors:
| § | The expense on distributed generation being R$ 287.1 million (+43.3%) higher, reflecting 3 factors: (i) an increase in the tariff for purchasing electricity from distributed generation; (ii) an increase in the number of generation facilities installed (from 261,000 in March 2024 to 318,000 in March 2025); and (iii) a total increase of 30.5%, year-on-year, in the volume of energy injected which totaled 1,876 GWh in 1Q25. |
| § | The cost of energy acquired in the Free Market (the Company’s highest cost of purchased energy) totaled R$ 1,511.7 million, an increase of R$ 272.1 million (+22.0%) in relation to 1Q24 due to the need to purchase to meet the higher volume sold in the commercialization activity and to cover energy deficits in relation to the commitments made. |
| § | The cost of energy acquired in the spot market was R$ 255.5 million, an increase of 400.7% over its total in 1Q24. This increase was mainly caused by the increase in spot prices in the sub-markets of the Southeast and Center-West regions not being offset by spot prices in the sub-markets of the Northeast and North, which were at their minimum for the greater part of the time. The Company buys energy in the Northeast and North and its sales are mostly concentrated in the Southeast and Center-West, generating an exposure to the differences between spot prices between these sub-markets – with negative effect on profit of the trading activity. In the distribution activity, the negative effect of this exposure is mitigated by the CVA account – which provides compensation in the subsequent Annual Tariff Adjustment. |
| § | These increases were partially offset by a reduction of R$48.3 million (-3.8%) in expenses with energy purchased in the regulated market compared to 1Q24. |
Note that for Cemig D, purchased energy is a non-manageable cost: the difference between the amounts used as a reference for calculation of tariffs and the costs actually incurred is compensated for in the next tariff adjustment.
| 18 |
| 1Q25 | 1Q24 | Change % | |
| Cemig D (R$ ’000) | |||
| Supply acquired in auctions on the Regulated Market | 975,020 | 1,026,912 | –5.1% |
| Distributed generation | 950,867 | 663,764 | 43.3% |
| Spot market – CCEE (power exchange) | 164,403 | 47,226 | 248.1% |
| Supply from Itaipu Binacional | 306,415 | 268,696 | 14.0% |
| Physical guarantee quota contracts | 207,353 | 224,569 | –7.7% |
| Individual (‘bilateral’) contracts | 121,982 | 127,290 | –4.2% |
| Proinfa | 134,839 | 113,113 | 19.2% |
| Quotas for Angra I and II nuclear plants | 83,446 | 94,399 | –11.6% |
| Credits of PIS, Pasep and Cofins taxes | -174,270 | -166,596 | 4.6% |
| 2,770,055 | 2,399,373 | 15.4% |
Charges for use of the transmission network and other system charges
Charges for use of the transmission network in 1Q25 were R$ 767.3 million, 9.0% lower than in 1Q24.
This is a non-manageable cost in the distribution business: the difference between the amounts used as a reference for calculation of tariffs and the costs actually incurred is compensated for in the next tariff adjustment.
Gas purchased for resale
The expense on acquisition of gas in 1Q25 was R$ 488.9 million, or 4.2% less than in 1Q24. This mainly reflected a lower volume of gas acquired to meet the demand of the regulated market.
Outsourced services
Expenditure on outsourced services was 0.8% (R$ 4.2 million) lower than in 1Q24, the main factors being: (i) expenses on maintenance of electrical installations and equipment 16.6% (R$ 35.0 million) lower; (ii) expense on tree pruning 38.9% (R$ 6.3 million) higher; and (ii) expense on information technology 16.9% (R$ 9.9 million) higher.
Client default provision
The expense on provisions for losses due to client default in 1Q25 was R$ 50.6 million, or R$ 25.5 million lower than in 1Q24, reflecting (i) the Company’s actions in combating default, and (ii) the revision, in 3Q24 (with positive effect in the subsequent 12 months), of the criteria for accounting overdue client receivables (increasing the threshold for posting a 100% loss from 24 to 36 months, so as to provide a more faithful estimate of expectations of losses on past due receivables).
Provisions
Provisions in 1Q25 totaled R$ 145.6 million, a reduction of 10.4%. This variation was influenced by the recognition of R$ 23.0 million in 1Q24, for (i) impairment of the valuation of the Small Hydro Plants (PCHs) held for sale of R$17.7 million, and (ii) a legal action by a client of R$ 5.3 million.
Post-employment liabilities
The remeasurement of post-employment obligations represented a reduction in expenditure of R$ 39.9 million compared to 1Q24. In 1Q25 there was a remeasurement of post-employment obligations, due to the migration of employees to the Premium Health Plan, which reduced the expense by R$ 27.7 million.
People
The expense on personnel in 1Q25 was R$ 346.3 million, or 6.9% higher than in 1Q24. The main factor in the higher figure was the increase of 4.6% in salaries as from November 2024, under the Collective Work Agreement.
| 19 |
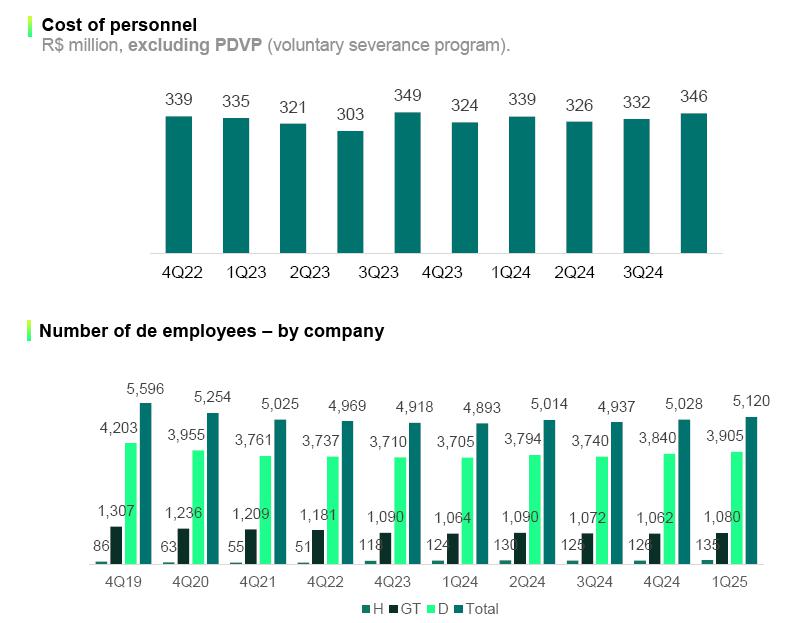
| 1Q25 | 1Q24 | Change % | |
| (R$ ’000) | |||
| Finance income | 193,537 | 218,245 | -11.3% |
| Finance expenses | -443,168 | -399,231 | 11.0% |
| Net finance income (expenses) | -249,631 | -180,986 | 37.9% |
For 1Q25 the Company posted consolidated net financial expenses of R$ 249.6 million – R$ 68.6 million higher than in 1Q24. Main factors:
| § | The financial expense posted for monetary updating of loans was R$ 70.2 million higher, and borrowing costs were R$ 41.4 million higher – reflecting (i) higher gross debt, and (ii) higher IPCA inflation in 1Q25 (2.04%) than in 1Q24 (1.48%). |
| § | In 1Q24 there was a net negative effect of R$ 17.0 million, of exchange rate variation on the debt in US dollars and the related hedge. This debt was settled in December 2024, so there was no comparable effect in 1Q25. |
| 20 |
Gain/loss in non-consolidated investees (Equity income)
| (R$ ’000) | 1Q25 | 1Q24 | Change R$ ’000 |
|
EQUITY INCOME (Gain/loss in non-consolidated investees) |
|||
| Taesa | 76,084 | 80,112 | -4,028 |
| Guanhães Energia | 8,390 | 2,318 | 6,072 |
| Cemig Sim (Equity holdings) | 4,894 | 3,373 | 1,521 |
| Hidrelétrica Pipoca | 3,760 | 3,769 | -9 |
| Paracambi | 3,571 | 3,169 | 402 |
| Hidrelétrica Cachoeirão | 1,750 | 1,114 | 636 |
| Aliança Geração | - | 30,861 | -30,861 |
| Belo Monte (Aliança Norte and Amazônia Energia) | -56,330 | -34,215 | -22,115 |
| Total | 42,119 | 90,501 | -48,382 |
Total equity income in 1Q25 was R$ 48.4 million lower than in 1Q24. The main factors were: (i) the weaker result of Belo Monte, on higher finance expenses (due to the higher TJLP (long-term interest rate) in 1Q25); and (ii) the fact that we no longer have a holding in Aliança Geração, after completion of the sale of that interest in 3Q24.
| 21 |
CONSOLIDATED EBITDA (IFRS, and Adjusted)
Ebitda is a non-accounting metric, prepared by the Company, reconciled with its consolidated financial statements in accordance with the specifications in CVM Circular SNC/SEP 01/2007 and CVM Resolution 156 of June 23, 2022. It comprises: Net profit adjusted for the effects of: (i) Net finance income (expenses), (ii) Depreciation and amortization, and (iii) Income tax and the Social Contribution tax. Ebitda is not a metric recognized by Brazilian GAAP nor by IFRS; it does not have a standard meaning; and it may be non-comparable with metrics with similar titles provided by other companies. Cemig publishes Ebitda because it uses it to measure its own performance. Ebitda should not be considered in isolation or as a substitute for net profit or operational profit, nor as an indicator of operational performance or cash flow, nor to measure liquidity, nor the capacity for payment of debt. In accordance with CVM Instruction 156/2022, the Company adjusts Ebitda to exclude extraordinary items which, by their nature, do not contribute to information on the potential for gross cash flow generation.
| Consolidated 1Q25 Ebitda | ||||||||
| R$ ’000 | Generation | Transmission | Trading | Distribution | Gas | Holding co. and equity interests | Total | |
| Profit (loss) for the period | 393,883 | 163,510 | 64,065 | 311,162 | 114,384 | -8,264 | 1,038,740 | |
| Income tax and Social Contribution tax | 82,732 | 33,592 | -23,540 | 58,606 | 57,975 | -34,339 | 175,026 | |
| Net finance income (expenses) | 3,558 | 5,967 | -3,831 | 202,095 | 15,627 | 26,215 | 249,631 | |
| Depreciation and amortization | 80,295 | 5,043 | 3 | 247,492 | 25,133 | 5,881 | 363,847 | |
| Ebitda per CVM Resolution 156 | 560,468 | 208,112 | 36,697 | 819,355 | 213,119 | -10,507 | 1,827,244 | |
| Net profit attributed to non-controlling stockholders | - | - | - | - | -492 | - | -492 | |
| Remeasurement of post-employment liabilities | -2,829 | -1,747 | -400 | -21,599 | - | -1,122 | -27,697 | |
| Adjusted Ebitda | 557,639 | 206,365 | 36,297 | 797,756 | 212,627 | -11,629 | 1,799,055 | |
| Consolidated 1Q24 Ebitda | |||||||
| R$ ’000 | Generation | Transmission | Trading | Distribution | Gas | Holding co. and equity interests | Total |
| Profit (loss) for the period | 371,794 | 132,306 | 192,004 | 322,338 | 117,008 | 17,441 | 1,152,891 |
| Income tax and Social Contribution tax | 73,033 | 35,576 | 95,210 | 99,173 | 59,750 | –13,927 | 348,815 |
| Net finance income (expenses) | 27,802 | 16,587 | –7,449 | 108,781 | 17,159 | 18,106 | 180,986 |
| Depreciation and amortization | 83,583 | –59 | 6 | 216,199 | 23,727 | 5,086 | 328,542 |
|
Ebitda per CVM Resolution 156 |
556,212 | 184,410 | 279,771 | 746,491 | 217,644 | 26,706 | 2,011,234 |
| Net profit attributed to non-controlling stockholders | – | – | – | – | –503 | – | –503 |
| Gain on sale of generation plants | –42,989 | – | – | – | – | – | –42,989 |
| Impairment | 22,958 | – | – | – | – | – | 22,958 |
| Adjusted Ebitda | 536,181 | 184,410 | 279,771 | 746,491 | 217,141 | 26,706 | 1,990,700 |
| 22 |
Ebitda of Cemig D
| 1Q25 | 1Q24 | Change % | |
| Cemig D Ebitda – R$ ’000 | |||
| Net profit for the period | 311,158 | 322,338 | –3.5% |
| Income tax and Social Contribution tax | 58,607 | 99,173 | –40.9% |
| Net finance income (expense) | 202,096 | 108,780 | 85.8% |
| Amortization | 247,491 | 216,199 | 14.5% |
| Ebitda per CVM Resolution 156 | 819,352 | 746,490 | 9.8% |
| Remeasurement of post-employment liabilities | –21,599 | – | – |
| Adjusted Ebitda | 797,753 | 746,490 | 6.9% |
| New replacement value (VNR) | 53,203 | 30,951 | 71.9% |
| Adjusted Ebitda less VNR | 744,550 | 715,539 | 4.1% |
Cemig D posted 1Q25 Ebitda of R$ 819.4 million, 9.8% more than its Ebitda of 1Q24.
Adjusted Ebitda, at R$ 797.8 million, was 6.9% higher than in 1Q24.
The main effects in Ebitda in the quarter were:
| § | Allowance for client default losses R$ 27.6 million lower than in 1Q24. |
| § | Restatement of post-employment liabilities, with a positive effect of R$ 21.6 million on Ebitda, due to the migration of 807 employees to the Premium Health Plan (which has no post-employment obligation for the Company) during the window reopened in January 2025. |
| § | The expense on outsourced services was 2.7% lower (R$ 12.2 million lower) than in 1Q24. |
| § | New Replacement Value (VNR) totaled R$ 53.2 million in 1Q25, vs. R$ 31.0 million in 1Q24. |
| § | A negative effect from higher energy losses: 10.49% in the 12 months to March 2025 (though still within the 10.50% regulatory threshold), compared to 10.36% in the 12 months to December 2024. |
| § | Total energy volume distributed (excluding Distributed Generation) was 0.3% lower than in 1Q24 (comprising 6.5% lower in the captive market, and 5.8% higher in the Free Market), mainly due to (i) migration to DG, and (ii) volume used by rural consumers 9.7% lower, due to higher rainfall. |
| 23 |
Cemig GT – Ebitda
| Cemig GT: 1Q25 Ebitda | |||||
| R$ ’000 | Generation | Transmission | Trading | Equity interests | Total |
| Profit (loss) for the period | 393,597 | 163,169 | 27,543 | –43,032 | 541,277 |
| Income tax and Social Contribution tax | 82,433 | 33,102 | 2,271 | –9,541 | 108,265 |
| Net finance income (expenses) | 3,639 | 6,196 | –3,871 | 9,590 | 15,554 |
| Depreciation and amortization | 81,922 | 2299 | 3 | – | 84,224 |
| Ebitda per CVM Resolution 156 | 561,591 | 204,766 | 25,946 | –42,983 | 749,320 |
|
Remeasurement of post–employment liabilities |
–2,829 | –1,747 | –400 | –538 | –5,514 |
| Adjusted Ebitda | 558,762 | 203,019 | 25,546 | –43,521 | 743,806 |
| Cemig GT: 1Q24 Ebitda | |||||
| R$ ’000 | Generation | Transmission | Trading | Equity interests | Total |
| Profit (loss) for the period | 372,261 | 129,598 | 50,145 | –58,198 | 493,806 |
| Income tax and Social Contribution tax | 73,033 | 34,221 | 22,130 | 25,359 | 154,743 |
| Net finance income (expenses) | 27,802 | 16,693 | –7,449 | 31,706 | 68,752 |
| Depreciation and amortization | 83,584 | 2 | 6 | – | 83,592 |
| Ebitda per CVM Resolution 156 | 556,680 | 180,514 | 64,832 | –1,133 | 800,893 |
| Gain on sale of assets | –42,989 | – | – | – | –42,989 |
| Impairment | 22,958 | – | – | – | 22,958 |
| Adjusted Ebitda | 536,649 | 180,514 | 64,832 | –1,133 | 780,862 |
The 1Q25 Ebitda of Cemig GT was R$ 749.3 million, 6.4% lower than in 1Q24. Adjusted Ebitda was 4.7% lower than in 1Q24.
Effects on Ebitda in this YoY comparison:
| § | There was a negative impact in Trading, due to exposure to price differences between sub-markets – much of the energy purchased is in the Northeast, and a large part of it is traded in other sub-markets. |
| § | Weaker result in equity income: negative R$ 38.2 million in 1Q25, vs. R$ 7.6 million positive in 1Q24 – the main factors being: (i) the weaker result of Belo Monte, on higher finance expenses, due to the higher TJLP (long-term interest rate), in 1Q25, and (ii) the fact that we no longer have a holding in Aliança Geração, following completion of sale of that interest in 3Q24. |
| § | Transmission revenue was R$ 60 million higher than in 1Q24, on higher financial revenue from contractual assets, due to the higher IPCA inflation in the period: 2.04% over the period of 1Q25, vs. 1.42% in 1Q24. |
| § | The GSF was better in 1Q25, benefiting the generation activity: there was secondary supply in January and February, while in 1Q24 the GSF was not higher than 1 in any month. |
| § | A restatement of post-employment liabilities had a positive effect on Ebitda of R$ 5.5 million, due to the migration of employees to the Premium Health Plan (which has no post-employment obligation for the Company) during the window reopened in January. |
| § | Sale of 15 Small Hydro Plants (PCHs) and Local Hydro Plants (CGHs) was completed in 1Q24, with a gain of R$ 43.0 million. |
| § | Also in 1Q24 impairment of R$ 23.0 million were posted: R$ 17 million for plants held for sale, and R$ 5.3 million for a client challenging amounts receivable. |
| 24 |
Investment
The Cemig group invested a total of R$ 1.21 billion in 1Q25 – 18.6% more than in 1Q24.
Highlights of 1Q25 were: (i) realization by Cemig D of investments totaling R$ 979 million; (ii) connection of more than 200,000 new clients; (iii) energizing of 172 new equipment items in 12 transmission substations; (ii) connection of distributed generation capacity totaling 11 MWac (15.6 MWp); and (v) construction of 40 km of gas pipelines by Gasmig.
Execution of the largest investment program in Cemig’s history will modernize the Company’s electricity system, ensuring reliability, in line with its strategic plan of focusing on Minas Gerais and on its core businesses, and providing ever-improving service to the client. Investment totaling R$ 39.20 billion is planned for the period 2025–29, of which R$ 6.35 billion is being invested in 2025.

| 25 |
Debt
| CONSOLIDATED (R$ ’000) | Mar. 2025 | 2024 | Change, % |
| Gross debt | 15,242,574 | 12,279,300 | 24.1% |
| Cash and equivalents + Securities | 4,755,087 | 2,390,743 | 98.9% |
| Net debt | 10,487,487 | 9,888,557 | 6.1% |
| CEMIG GT (R$ ’000) | |||
| Gross debt | 1,692,935 | 1,031,924 | 64.1% |
| Cash and equivalents + Securities | 1,378,941 | 542,566 | 154.2% |
| Net debt | 313,994 | 489,358 | -35.8% |
| CEMIG D (R$ ’000) | |||
| Gross debt | 12,327,207 | 10,037,621 | 22.8% |
| Cash and equivalents + Securities | 2,216,441 | 1,114,866 | 98.8% |
| Net debt | 10,110,766 | 8,922,755 | 13.3% |
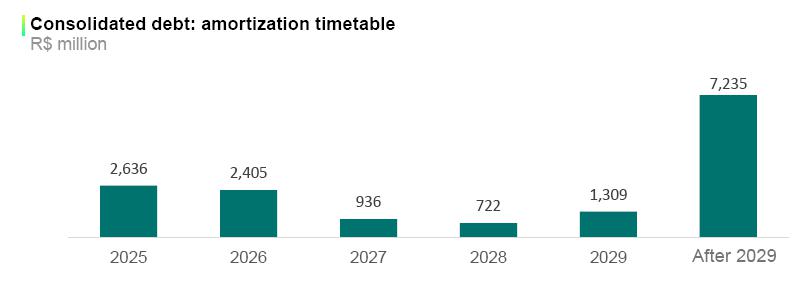
Both Cemig GT and Cemig D issued debentures in 1Q25, for a total of R$ 3,125 million.
Cemig D amortized debt totaling R$ 320 million in the quarter.
In March 2025 Cemig D concluded its 12th debenture issue, categorized as ‘ESG debentures for sustainable use of proceeds’. The issue raised R$ 2.5 billion, in two series, as follows:
| Series | Quantity | Value in R$ ’000 | Rate | Maturity | Amortization |
| Series 1 | 1,640,000 | R$1,640,000 | CDI + 0.86% p.a. | 2,557 days | 72nd to 84th months |
| Series 2 | 860,000 | R$860,000 | IPCA + 7.5467% p.a. | 5,479 days | 156th , 168th and 180th months |
Cemig GT completed its 10th debenture issue in March: categorized as ‘Green Debentures’, with total value of R$ 625 million, maturing 2030, and paying the CDI rate +0.34%.
| 26 |
| 1Q25 | |
| DEBT AMORTIZED – R$ ’000 | |
| Cemig GT | – |
| Cemig D | 319,865 |
| Other | - |
| Total | 319,865 |
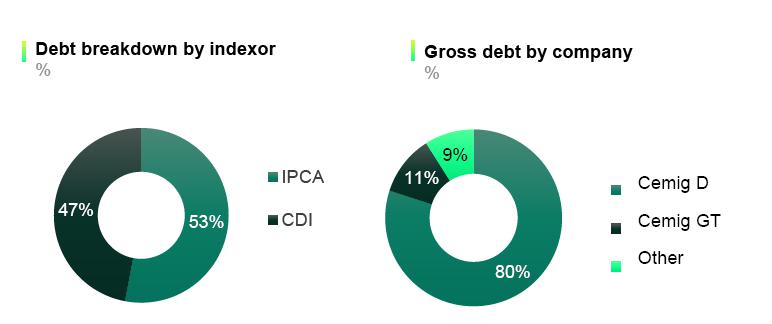

| 27 |
Cemig’s long-term ratings
Cemig’s ratings have improved significantly in recent years, and are currently at their highest ever.
In 2021 the three principal rating agencies upgraded their ratings for Cemig.
In April 2022, Moody’s again upgraded its rating for Cemig, by one notch.
In May 2024, Moody’s raised its rating to AA+.
In October 2024, Fitch raised its rating to AAA, the highest of all ratings on the Brazilian scale, recognizing:
| (i) | consistent results and cash generation, |
| (ii) | a diversified asset base, and |
| (iii) | discipline in capital allocation. More details in this table: |


| 28 |
ESG – Report on performance
Cemig Highlights
| § | In 2024, the average annual outage duration experienced by Cemig’s clients was reduced by approximately 2.5 hours: the time taken to re-establish supply was reduced by 13%; and the average number of outages per consumer was down by 14%. DEC is the acronym for Average Outage Time per Consumer (Duração Equivalente de Interrupção por Unidade Consumidora), one of the main indicators of performance in Brazil’s power sector. In March/25, the perceived DEC was more than 3 hours lower than in the 12-month window ending in Mar/24. |
| § | Leadership in the Retail Free Energy Market |
| o | Cemig’s volume of transactions in power supply in the retail segment of the Energy Free Market exceeded 170 MWavg (megawatts average) in 1Q25. The February 2025 figures from the Brazilian Power Exchange (CCEE) show Cemig as leader in the segment with 173.6 MWavg sold to more than 2,000 clients. |
Environment
| § | Cemig is building 5,000 meters of protection fencing in the Pau Furado State Park, in the municipalities of Uberlândia and Araguari, as part of the project to revitalize this State Park after a fire, in September 2024, affected approximately one-third of its area. The Company is also working on reforestation of approximately 200 hectares (some 9% of the park), planting 440,000 native seedlings.§ |
| § | The work on recovery of the Pau Furado Park is part of Cemig’s initiatives to preserve areas of native vegetation in Minas Gerais, where there are investments in recovery of six state parks. Conservation units are planned or established throughout the state, such as the Lapa Grande state park in Montes Claros, and the Cerca Grande state park in Matozinhos. |
Social
Emergency Action Plans (PAEs)
| § | To empower local populations in areas close to its plants and to support and comply with the National Dam Safety Law, Cemig carried out nine simulations of emergencies in 2024, providing emergency situation training for 1,526 people. The Company plans four more events in 2025, for the Theodomiro Carneiro Santiago (known as Emborcação) hydroelectric plant (in May), the Irapé plant (in July), Peti (in August) and finally the Três Marias plant (in September). |
| § | Although the dams of Cemig’s hydroelectric plants are completely safe and carefully monitored, the simulations follow the guidelines of the Emergency Action Plan (EAP) created and established for each dam, aiming to empower people to follow the escape routes of the region to the nearest meeting point, as well as to identify warning signs. The activities always involve the local residents and workers – those who live or work in the vicinity of the hydroelectric generation plants. |
The Low-income Tariff
| § | At the beginning of 2025 Cemig had more than 1.4 million clients registered for the Social Electricity Tariff (Tarifa Social de Energia Elétrica – TSEE), which provides a discount of up to 65% on energy bills of low-income families. To be eligible, candidates must be enrolled in the Federal Social Programs Register (Cadastro Único para Programas Sociais do Governo Federal – ‘CadÚnico’), or be recipients of Permanent Social Assistance Benefit (Benefício de Prestação Continuada da Assistência Social – BPC). The TSEE discount applies for monthly consumption of up to 220 kWh – for consumption above this level, the standard rate applies. |
| 29 |
Governance
Regionalization of distribution
| § | Cemig will be even closer to its clients in all regions of Minas Gerais. Concomitant with the largest phase of major structural investment in its history, in 2025 Cemig is undertaking an organizational restructuring to improve the quality of provision of services throughout its concession area. Among the main changes is the creation of six senior management units and 16 regional management units, expanding Cemig’s presence in the regions of the state outside the capital, and bringing the Company ever closer to its clients. |
Cemig in the main sustainability indices
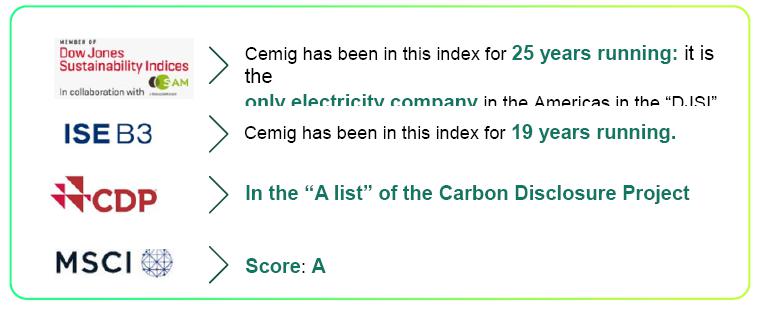
| 30 |
Indicators

| 31 |
Performance of Cemig’s securities
| Mar. 2025 | 2024 | Change, % | |
| Prices (2) | |||
| CMIG4 (PN) at the close (R$/share) | 10.26 | 10.91 | –5.98% |
| CMIG3 (ON) at the close (R$/share) | 14.79 | 14.44 | 2.40% |
| CIG (ADR for PN shares), at close (US$/share) | 1.76 | 1.79 | –1.68% |
| CIG.C (ADR for ON shares) at close (US$/share) | 2.55 | 2.32 | 9.89% |
| XCMIG (Cemig PN shares on Latibex), close (€/share) | 1.68 | 1.71 | –1.75% |
| Average daily trading | |||
| CMIG4 (PN) (R$ mn) | 142.09 | 143.11 | –0.71% |
| CMIG3 (ON) (R$ mn) | 3.82 | 3.75 | 1.87% |
| CIG (ADR for PN shares) (US$ mn) | 5.42 | 4.3 | 26.05% |
| CIG.C (ADR for ON shares) (US$ mn) | 0.11 | 0.33 | –66.67% |
| Indices | |||
| IEE | 85,280 | 77,455 | 10.10% |
| IBOV | 130,260 | 120,283 | 8.29% |
| DJIA | 9,246 | 8,978 | 2.99% |
| Indicators | |||
| Market valuation at end of period, R$ mn | 33,679 | 35,149 | –4.18% |
| Enterprise value (EV), R$ mn (1) | 43,707 | 42,668 | 2.44% |
| Dividend yield of CMIG4 (PN) (%) (3) | 13.48 | 11.96 | 1.52 pp |
| Dividend yield of CMIG3 (ON) (%) (3) | 9.35 | 9.08 | 0.27 pp |
| (1) EV = (Market valuation [calculated as R$/share x number of shares]) + (consolidated Net debt). | |
| (2) Share prices adjusted for corporate action payments, including dividends. | |
| (3) (Dividends distributed in last 4 quarters) / (Share price at end of the period). | |
In 1Q25 Cemig’s shares, by volume (aggregate of common (ON) and preferred (PN) shares), were the fourth most liquid in Brazil’s electricity sector, and among the most traded in the Brazilian equity market.
On the New York Stock Exchange:
| – | the volume traded in ADRs for Cemig’s preferred shares (CIG) in 1Q25 was US$325.6 million |
– reflecting investors’ continued recognition of Cemig as a global investment option.
| – | the ADRs for Cemig’s preferred shares were down 1.68% in the quarter, |
| – | and the ADRs for the common shares rose 9.89%. |
In the same period, in São Paulo:
– the Ibovespa index of the São Paulo stock exchange rose 8.29%.
– Cemig’s preferred shares fell 5.98%; and its common shares rose 2.4%.

| 32 |
Generation plants
| Plant | Company | Cemig power (MW) | Cemig physical guarantee (MW) | End of concession | Type | Cemig stake | |
| Emborcação | Cemig GT | 1,192 | 475 | May 2027 | Hydro plant | 100.0% | |
| Nova Ponte | Cemig GT | 510 | 257 | Aug. 2027 | Hydro plant | 100.0% | |
| Irapé | Cemig GT | 399 | 198 | Sep. 2037 | Hydro plant | 100.0% | |
| Três Marias | Cemig GT | 396 | 227 | Jan. 2053 | Hydro plant | 100.0% | |
| Salto Grande | Cemig GT | 102 | 74 | Jan. 2053 | Hydro plant | 100.0% | |
| Boa Esperança | Cemig GT | 85 | 25 | Aug. 2057 | Solar plant | 100.0% | |
| Sá Carvalho | Sá Carvalho S.A. | 78 | 54 | Aug. 2026 | Hydro plant | 100.0% | |
| Três Marias Jusante | Cemig GT | 70 | 20 | Feb. 2058 | Solar plant | 100.0% | |
| Rosal | Rosal Energia S.A. | 55 | 28 | Dec. 2035 | Hydro plant | 100.0% | |
| Itutinga | Cemig Ger. Itutinga | 52 | 27 | Jan. 2053 | Hydro plant | 100.0% | |
| Camargos | Cemig Ger. Camargos | 46 | 22 | Jan. 2053 | Hydro plant | 100.0% | |
| Volta do Rio | Cemig GT | 42 | 18 | Dec. 2031 | Wind plant | 100.0% | |
| Poço Fundo | Cemig GT | 30 | 17 | May 2052 | Small Hydro | 100.0% | |
| Praias do Parajuru | Cemig GT | 29 | 8 | Sep. 2032 | Wind plant | 100.0% | |
| Pai Joaquim | Cemig PCH S.A. | 23 | 14 | Oct. 2033 | Small Hydro | 100.0% | |
| Piau | Cemig Ger. Sul | 18 | 14 | Jan. 2053 | Hydro plant | 100.0% | |
| Gafanhoto | Cemig Ger. Oeste | 14 | 7 | Jan. 2053 | Hydro plant | 100.0% | |
| Peti | Cemig Ger. Leste | 9 | 6 | Jan. 2053 | Hydro plant | 100.0% | |
| Tronqueiras | Cemig Ger. Leste | 9 | 3 | Dec. 2046 | Hydro plant | 100.0% | |
| Joasal | Cemig Ger. Sul | 8 | 5 | Jan. 2053 | Hydro plant | 100.0% | |
| Queimado | Cemig GT | 87 | 53 | July 2034 | Hydro plant | 82.5% | |
| Hydro plant | Norte Energia | 1,313 | 534 | Jul. 2046 | Hydro plant | 11.7% | |
| Cachoeirão | Hidrelétrica Cachoeirão | 13 | 8 | Sep. 2033 | Small Hydro | 49.0% | |
| Paracambi | LightGer | 12 | 10 | Jan. 2034 | Hydro plant | 49.0% | |
| Pipoca | Hidrelétrica Pipoca | 10 | 6 | Dec. 2034 | Small Hydro | 49.0% | |
| Others | 74 | 36 | |||||
| Subtotal | 4,676 | 2,146 | |||||
| Cemig Sim | Equity interests | 23 | 5.5 | Solar | 49.00% | ||
| Cemig Sim | Owned | 27 | 7.1 | Solar | 100.00% | ||
| Total | 4,726 | 2,159 |
Notes:
The physical guarantee of Boa Esperança and Jusante is the value certified by a certifying company, but it has not been approved by Aneel.
For the plants of Cemig Sim, the installed capacity is in MWac and the physical guarantee has been estimated in the table as being equal to the estimated generation.
There are more details of Cemig Sim's expansion projects on the next page.
| 33 |
Expansion of solar generation
| Project | Company | Installed capacity (MWac) | Capacity (MWp) | Expected Generation (MWaverage) |
Planned operational start date |
| Ouro Solar Project | Cemig Sim | 40.5 | 57.5 | 11.4 | Jun. 2025 to Apr. 2026 |
| Bloco Azul project | Cemig Sim | 23.0 | 32.6 | 12.0 | Jun. 2025 to Apr. 2026 |
| Solar do Cerrado Project | Cemig Sim | 50.0 | 70.0 | 13.1 | Dec. 2025 to May 2026 |
| Total | 113.5 | 160.1 | 36.5 |
RAP: July 2024 – June 2025 cycle
The RAP of Cemig, including the Adjustment Component, received an increase of 18.8% as from July, reflecting: (i) inflation in the period; (ii) strengthening and enhancements; and (iii) flow from reprofiling of the ‘RBSE’ National Grid component.
| ANEEL RATIFYING RESOLUTION (ReH) 3348/2024 (2024–2025 cycle) | ||||
| R$ ’000 | RAP | Adjustment component | Total | Expiration |
| Cemig | 1,243,011 | 115,284 | 1,358,295 | |
| Cemig GT | 1,161,990 | 117,855 | 1,279,845 | Dec. 2042 |
| Cemig Itajubá | 43,096 | –1,524 | 41,572 | Oct. 2030 |
| Centroeste | 26,008 | –1,284 | 24,724 | Mar. 2035 |
| Sete Lagoas | 11,917 | 237 | 12,154 | Jun. 2041 |
| Taesa (Cemig stake: 21.68%) | 804,260 | –40,672 | 763.588 | |
| TOTAL RAP | 2,121,883 | |||
| REIMBURSEMENT FOR NATIONAL GRID ASSETS** | |||||
| R$ ’000 – by cycle | 2022-2023 | 2023-2024 | 2024-2025 ¹ | From 2025-2026, to 2027-2028 | From 2028-2029, to 2032-2033 |
| Economic | 144,547 | 144,375 | 21,662 | 83,019 | 26,039 |
| Financial | 129,953 | 275,556 | 275,556 | 275,556 | - |
| TOTAL | 274,500 | 419,931 | 297,218 | 358,575 | 26,039 |
* The amounts of the reimbursement of National Grid (‘RBSE’) components are included in the RAP of Cemig (first table).
1) 2024-2025 includes the Adjustment Component for postponement of the 2023 Review.
Cemig currently has state environmental (REA) approval for large-scale strengthening and enhancement works, with total capex of R$ 1,242 million, and for investments of R$ 220 million related to Lot 1 of Auction 02/2022 (completion of works planned for 2028).
Note: The amounts stated for 2024 include investments that were made, but were not in Ratifying Resolution 3348/2024, which approved the RAP for July 2024–June 2025.
| Planned operational start date | Capex (R$ ’000) | RAP (R$ ’000) |
| 2024 | 232,197 | 35,176 |
| 2025 | 307,845 | 49,239 |
| 2026 | 259,678 | 41,480 |
| 2027 | 418,872 | 69,588 |
| 2028 | 243,910 | 22,396 |
| Total | 1,462,502 | 217,880 |
| 34 |
Regulatory Transmission revenue
| Regulatory Transmission revenue – 1Q25 | |||
| R$ ’000 | GT | Centroeste | Sete Lagoas |
| REVENUE | 454,337 | 6,482 | 2,620 |
| Revenue from Transmission operations | 454,337 | 6,482 | 2,620 |
| Taxes on revenue | -39,808 | -236 | -242 |
| PIS and Pasep taxes | -7,098 | -42 | -43 |
| Cofins tax | -32,696 | -194 | -199 |
| ISS tax | -14 | - | - |
| Sector charges | -84,719 | -214 | -114 |
| Research and Development (R&D) | -3,325 | -59 | -22 |
| Global Reversion Reserve (RGR) | - | -132 | -80 |
| Energy Development Account (CDE) | -61,488 | - | - |
| Electricity Services Inspection Charge (TFSEE) | -1,321 | -23 | -12 |
| Program of Incentives for Alternative Electricity Sources – PROINFA | -18,585 | - | - |
| Net revenue | 329,810 | 6,032 | 2,264 |
Complementary information
Cemig D
| CEMIG D Market | ||||
| Quarter | Captive Consumers |
TUSD ENERGY1 | T.E.D2 | TUSD PICK3 |
| 1Q22 | 5,738 | 5,397 | 11,136 | 36.2 |
| 2Q22 | 6,050 | 5,853 | 11,904 | 36.7 |
| 3Q22 | 5,942 | 5,790 | 11,733 | 34.7 |
| 4Q22 | 6,047 | 5,755 | 11,802 | 40.5 |
| 1Q23 | 5,723 | 5,566 | 11,289 | 38.0 |
| 2Q23 | 5,949 | 6,058 | 12,007 | 38.5 |
| 3Q23 | 5,812 | 6,028 | 11,840 | 39.2 |
| 4Q23 | 6,376 | 6,068 | 12,445 | 39.9 |
| 1Q24 | 5,930 | 6,097 | 12,027 | 40.4 |
| 2Q24 | 5,924 | 6,301 | 12,225 | 42.4 |
| 3Q24 | 5,821 | 6,557 | 12,378 | 43.6 |
| 4Q24 | 5,812 | 6,505 | 12,317 | 42.5 |
| 1Q25 | 5,547 | 6,448 | 11,996 | 45.3 |
| 1. Refers to the quantity of electricity for calculation of the regulatory charges charged to free consumer clients ("Portion A") | ||||
| 2. Total electricity distributed | ||||
| 3. Sum of the demand on which the TUSD is invoiced, according to demand contracted ("Portion B"). | ||||
| 35 |
| Cemig D | 1Q25 | 4Q24 | 1Q24 | chg. % | chg. % |
| Operating Revenues (R$ million) | 1Q/4Q | 1Q/1Q | |||
| Revenue from supply of energy | 5,886 | 6,964 | 5,727 | -15.5% | 2.8% |
| Reimbursement of PIS/Pasep and Cofins credits to customers | 0 | 0 | 323 | 0.0% | -100.0% |
| Revenue from Use of Distribution Systems (the TUSD charge) | 1,440 | 1,386 | 1,178 | 3.9% | 22.2% |
| CVA and Other financial components in tariff adjustment | 126 | 47 | 76 | 168.1% | 65.8% |
| Construction revenue | 1,047 | 1,290 | 859 | -18.8% | 21.9% |
| Adjustment to expectation of cash flow from indemnifiable financial assets of distribution concession (VNR) | 53 | 35 | 31 | 51.4% | 71.0% |
| Others | 594 | 667 | 513 | -10.9% | 15.8% |
| Subtotal | 9,146 | 10,389 | 8,707 | -11.96% | 5.0% |
| Deductions | -2,643 | -2,827 | -2,737 | -6.5% | -3.4% |
| Net Revenues | 6,503 | 7,562 | 5,970 | -14.0% | 8.9% |
| 1Q25 | 4Q24 | 1Q24 | chg. % | chg. % | |
| Cemig D - Expenses (R$ million) | 1Q/4Q | 1Q/1Q | |||
| Personnel | 233 | 256 | 210 | -9.0% | 11.0% |
| Employees' and managers' profit sharing | 26 | 21 | 25 | 23.8% | 4.0% |
| Forluz – Post-retirement obligations | 65 | 81 | 96 | -19.8% | -32.3% |
| Materials | 32 | 28 | 23 | 14.3% | 39.1% |
| Outsourced services | 433 | 508 | 446 | -14.8% | -2.9% |
| Amortization | 248 | 252 | 217 | -1.6% | 14.3% |
| Operating provisions | 163 | 162 | 191 | 0.6% | -14.7% |
| Charges for Use of Basic Transmission Network | 838 | 762 | 875 | 10.0% | -4.2% |
| Energy purchased for resale | 2,770 | 3,356 | 2,399 | -17.5% | 15.5% |
| Construction Cost | 1,047 | 1,290 | 859 | -18.8% | 21.9% |
| Other Expenses | 77 | 139 | 99 | -44.6% | -22.2% |
| Total | 5,932 | 6,855 | 5,440 | -13.5% | 9.0% |
| Cemig D | 1Q25 | 4Q24 | 1Q24 | chg. % | chg. % |
| Statement of Results (R$ mn) | 1Q/4Q | 1Q/1Q | |||
| Net Revenue | 6,503 | 7,562 | 5,970 | -14.0% | 8.9% |
| Operating Expenses | 5,932 | 6,855 | 5,440 | -13.5% | 9.0% |
| Operational profit | 571 | 707 | 530 | -19.2% | 7.7% |
| EBITDA | 819 | 958 | 746 | -14.5% | 9.8% |
| Financial Result | -202 | -138 | -109 | 46.4% | 85.3% |
| Provision for Income Taxes, Social Cont & Deferred Income Tax | -58 | -117 | -99 | -50.4% | -41.4% |
| Net Income | 311 | 452 | 322 | -31.2% | -3.4% |
| 36 |
Cemig GT
| Cemig GT - Operating Revenues | 1Q25 | 4Q24 | 1Q24 | chg. % | chg. % |
| (R$ million) | 1Q/4Q | 1Q/1Q | |||
| Sales to end consumers | 870 | 848 | 737 | 2.6% | 18.0% |
| Supply | 537 | 542 | 429 | -0.9% | 25.2% |
| Revenues from Trans. Network | 146 | 129 | 162 | 13.2% | -9.9% |
| Construction revenue | 66 | 144 | 60 | -54.2% | 10.0% |
| Financial remuneration of transmission contractual assets | 219 | 198 | 149 | 10.6% | 47.0% |
| Gain on monetary updating of Concession Grant Fee | 138 | 118 | 129 | 16.9% | 7.0% |
| Transactions in the CCEE | 21 | 10 | 28 | 110.0% | -25.0% |
| Generation indemnity revenue | 27 | 23 | 21 | 17.4% | 28.6% |
| Others | 60 | 63 | 34 | -4.8% | 76.5% |
| Subtotal | 2,084 | 2,075 | 1,749 | 0.4% | 19.2% |
| Deductions | -381 | -379 | -346 | 0.5% | 10.1% |
| Net Revenues | 1,703 | 1,696 | 1,403 | 0.4% | 21.4% |
| Cemig GT - Operating Expenses | 1Q25 | 4Q24 | 1Q24 | chg. % | chg. % |
| (R$ million) | 1Q/4Q | 1Q/1Q | |||
| Personnel | 80 | 73 | 83 | 9.6% | -3.6% |
| Employees' and managers' profit sharing | 9 | 9 | 9 | 0.0% | 0.0% |
| Forluz – Post-retirement obligations | 21 | 25 | 29 | -16.0% | -27.6% |
| Materials | 6 | 8 | 6 | -25.0% | 0.0% |
| Outsourced services | 58 | 72 | 56 | -19.4% | 3.6% |
| Depreciation and Amortization | 84 | 82 | 84 | 2.4% | 0.0% |
| Operating provisions | 18 | 35 | 9 | -48.6% | 100.0% |
| Charges for Use of Basic Transmission Network | 74 | 71 | 73 | 4.2% | 1.4% |
| Energy purchased for resale | 586 | 642 | 341 | -8.7% | 71.8% |
| Construction Cost | 53 | 116 | 26 | -54.3% | 103.8% |
| Impairment | 0 | 17 | 23 | -100.0% | - |
| Other Expenses | 11 | 17 | -3 | -35.3% | -466.7% |
| Total | 1,000 | 1,167 | 736 | -14.3% | 35.9% |
| Gain on disposal of investments | - | - | 43 | - | -100.0% |
| Total - other revenues | - | - | 43 | - | - |
| Total | 1,000 | 1,167 | 693 | -14.3% | 44.3% |
| 37 |
| Cemig GT - Statement of Results | 1Q25 | 4Q24 | 1Q24 | chg. % | chg. % |
| (R$ million) | 1Q/4Q | 1Q/1Q | |||
| Net Revenue | 1,703 | 1,696 | 1,403 | 0.4% | 21.4% |
| Operating Expenses | 1,000 | 1,167 | 693 | -14.3% | 44.3% |
| Operational profit | 703 | 529 | 710 | 32.9% | -1.0% |
| Equity gain in subsidiaries | -38 | -83 | 8 | -54.2% | -575.0% |
| EBITDA | 749 | 528 | 801 | 41.9% | -6.5% |
| Financial Result | -16 | -222 | -69 | -92.8% | -76.8% |
| Provision for Income Taxes, Social Cont & Deferred Income Tax | -108 | 18 | -155 | - | -30.3% |
| Net Income | 541 | 242 | 494 | 123.6% | 9.5% |
Cemig, Consolidated
| Energy Sales | 1Q25 | 4Q24 | 1Q24 | chg. % | chg. % |
| (in GWh) | 1Q/4Q | 1Q/1Q | |||
| Residential | 3,838 | 3,760 | 3,668 | 2.1% | 4.6% |
| Industrial | 4,311 | 4,597 | 4,202 | -6.2% | 2.6% |
| Commercial | 3,063 | 2,809 | 3,136 | 9.0% | -2.3% |
| Rural | 739 | 783 | 750 | -5.6% | -1.5% |
| Others | 795 | 705 | 759 | 12.8% | 4.7% |
| Subtotal | 12,746 | 12,654 | 12,515 | 0.7% | 1.8% |
| Own Consumption | 7 | 8 | 8 | -12.5% | -12.5% |
| Wholesale supply | 4,826 | 4,763 | 4,276 | 1.3% | 12.9% |
| TOTAL | 17,579 | 17,425 | 16,799 | 0.9% | 4.6% |
| Revenue from supply of electricity | 1Q25 | 4Q24 | 1Q24 | chg. % | chg. % |
| (R$ million) | 1Q/4Q | 1Q/1Q | |||
| Residential | 3,423 | 3,654 | 3,126 | -6.3% | 9.5% |
| Industrial | 1,204 | 1,373 | 1,299 | -12.3% | -7.3% |
| Commercial | 1,647 | 1,752 | 1,674 | -6.0% | -1.6% |
| Rural | 517 | 660 | 533 | -21.7% | -3.0% |
| Others | 506 | 587 | 541 | -13.8% | -6.5% |
| Subtotal | 7,297 | 8,026 | 7,173 | -9.1% | 1.7% |
| Retail supply not yet invoiced | -32 | 225 | -155 | -114.2% | - |
| Wholesale supply | 1,109 | 1,371 | 1,001 | -19.1% | 10.8% |
| TOTAL | 8,374 | 9,622 | 8,019 | -13.0% | 4.4% |
| 38 |
| Operating Revenues - consolidated | 1Q25 | 4Q24 | 1Q24 | chg. % | chg. % |
| (R$ million) | 1Q/4Q | 1Q/1Q | |||
| Sales to end consumers | 7,265 | 8,250 | 7,017 | -11.9% | 3.5% |
| Wholesale supply | 1,110 | 1,371 | 1,002 | -19.0% | 10.8% |
| TUSD | 1,429 | 1,375 | 1,169 | 3.9% | 22.2% |
| CVA and Other financial components in tariff adjustment | 126 | 47 | 76 | 168.1% | - |
| Reimbursement of PIS/Pasep and Cofins over ICMS credits to customers | 0 | 0 | 323 | - | - |
| Transmission revenue | 60 | -20 | 67 | -400.0% | -10.4% |
| Financial remuneration of transmission contract | 173 | 219 | 151 | -21.0% | 14.6% |
| Transactions in the CCEE | 22 | 10 | 41 | 120.0% | -46.3% |
| Gas supply | 921 | 988 | 920 | -6.8% | 0.1% |
| Construction revenue | 1,215 | 1,547 | 956 | -21.5% | 27.1% |
| Others | 894 | 976 | 772 | -8.4% | 15.8% |
| Subtotal | 13,215 | 14,763 | 12,494 | -10.5% | 5.8% |
| Taxes and charges deductions from revenue | -3,371 | -3,586 | -3,436 | -6.0% | -1.9% |
| Net Revenues | 9,844 | 11,177 | 9,058 | -11.9% | 8.7% |
| Operating Expenses - consolidated | 1Q25 | 4Q24 | 1Q24 | chg. % | chg. % |
| (R$ million) | 1Q/4Q | 1Q/1Q | |||
| Personnel | 346 | 332 | 324 | 4.2% | 6.8% |
| Employees’ and managers’ profit sharing | 43 | 49 | 39 | -12.2% | 10.3% |
| Forluz – Post-Retirement Employee Benefits | 102 | 122 | 142 | - | -28.2% |
| Materials | 39 | 37 | 29 | 5.4% | 34.5% |
| Outsourced services | 515 | 618 | 519 | -16.7% | -0.8% |
| Energy purchased for resale | 4,267 | 4,923 | 3,511 | -13.3% | 21.5% |
| Charges for use of the national grid | 767 | 692 | 843 | 10.8% | -9.0% |
| Gas bought for resale | 489 | 564 | 510 | -13.3% | -4.1% |
| Depreciation and Amortization | 364 | 364 | 329 | 0.0% | 10.6% |
| Operating Provisions | 197 | 259 | 216 | -23.9% | -8.8% |
| Construction costs | 1,202 | 1,518 | 921 | -20.8% | 30.5% |
| Impairment loss | 0 | 0 | 23 | - | - |
| Other Expenses | 92 | 182 | 103 | -49.5% | -10.7% |
| Total | 8,423 | 9,660 | 7,509 | -12.81% | 12.17% |
| Gain on disposal of investments | - | - | 43 | - | - |
| Total - other revenues | - | - | 43 | - | - |
| Total | 8,423 | 9,660 | 7,466 | -12.8% | 12.8% |
| 39 |
| Financial Result Breakdown | 1Q25 | 4Q24 | 1Q24 | chg. % | chg. % |
| (R$ million) | 1Q/4Q | 1Q/1Q | |||
| FINANCE INCOME | |||||
| Income from cash investments | 84 | 148 | 65 | -43.2% | 29.2% |
| Arrears fees on sale of energy | 74 | 78 | 75 | -5.1% | -1.3% |
| Monetary variations | 12 | 35 | 39 | -65.7% | -69.2% |
| Monetary variations – CVA | 18 | 12 | 2 | 50.0% | 800.0% |
| Monetary updating on Court escrow deposits | 21 | 18 | 18 | 16.7% | 16.7% |
| Pasep and Cofins charged on finance income | -53 | -65 | -41 | -18.5% | 29.3% |
| Gains on financial instruments - Swap | 0 | 21 | 42 | - | - |
| Others | 38 | 37 | 18 | 2.7% | 111.1% |
| 194 | 284 | 218 | -31.7% | -11.0% | |
| FINANCE EXPENSES | |||||
| Costs of loans and financings | 260 | 293 | 219 | -11.3% | 18.7% |
| Foreign exchange variations | 0 | 233 | 59 | - | - |
| Monetary updating – loans and financings | 125 | 99 | 55 | 26.3% | 80.0% |
| Foreign exchange variations - Itaipu Binacional | 0 | 18 | 2 | - | - |
| Monetary updating on PIS/Pasep and Cofins taxes credits | 13 | 0 | 15 | - | -13.3% |
| Others | 46 | 37 | 49 | 24.3% | - |
| 444 | 680 | 399 | - | 11.3% | |
| NET FINANCE INCOME (EXPENSES) | -250 | -396 | -181 | -36.9% | -238.1% |
| Consolidated profit and loss account | 1Q25 | 4Q24 | 1Q24 | chg. % | chg. % |
| (R$ million) | 1Q/4Q | 1Q/1Q | |||
| Net Revenue | 9,844 | 11,177 | 9,058 | -11.9% | 8.7% |
| Operating Expenses | 8,423 | 9,660 | 7,466 | -12.8% | 12.8% |
| Operational profit | 1,421 | 1,517 | 1,592 | -6.3% | -10.7% |
| Equity gain (loss) in subsidiaries | 42 | 33 | 91 | 27.3% | -53.8% |
| EBITDA | 1,827 | 1,914 | 2,011 | -4.5% | -9.1% |
| Financial Result | -250 | -396 | -181 | -36.9% | 38.1% |
| Provision for Income Taxes, Social Cont & Deferred Income Tax | -175 | -156 | -349 | 12.2% | -49.9% |
| Net profit for the period | 1,039 | 998 | 1,153 | 4.1% | -9.9% |
| Recurring profit: reconciliation | ||
| R$ mn | 1Q25 | 1Q24 |
| Net profit – IFRS | 1,039 | 1,153 |
| Remeasurement of post-employment liabilities | -18 | - |
| FX exposure – Eurobond hedge | - | 11 |
| Gain on sale of investment | - | -25 |
| Impairment | - | 15 |
| Recurring net profit | 1,021 | 1,154 |
| 40 |
| Cash Flow Statement | mar/25 | mar/24 |
| (R$ million) | ||
| Cash at beginning of period | 1,898 | 1,537 |
| Cash generated by operations | 1,372 | 1,639 |
| Net income for the period from going concern operations | 1,039 | 1,153 |
| Interest and monetary variations | 314 | 212 |
| Depreciation and amortization | 364 | 329 |
| CVA and other financial components | -126 | -76 |
| Equity gain (loss) in subsidiaries | -42 | -91 |
| Provisions (reversals) for operational losses | 187 | 210 |
| Deferred income and social contribution taxes | 175 | 349 |
| Refund of PIS/Pasep and Cofins credits to consumers | -91 | -323 |
| Dividends receivable | 45 | 56 |
| Interest paid on loans and financings | -219 | -64 |
| Net gain on derivative instruments at fair value through profit or loss | 0 | -42 |
| Interest and monetary variation | 0 | 59 |
| Gain on disposal of investments | 0 | -43 |
| Post-employment obligations | 102 | 145 |
| Remeasuring of concession financial and concession contract assets | -405 | -368 |
| Others | 29 | 133 |
| Investment activity | -2,763 | -2,486 |
| Securities - Financial Investment | -1,001 | -1,598 |
| Financial assets | 0 | 101 |
| Fixed and Intangible assets/distribution and gas infrastructure | -1,762 | -1,035 |
| Others | 0 | 46 |
| Financing activities | 2,737 | 1,487 |
| Lease payments | -19 | -18 |
| Payments of loans and financings | -320 | -441 |
| Interest on Equity, and dividends | - | - |
| Proceeds from Loans, financings and debentures | 3,076 | 1,946 |
| Cash at end of period | 3,244 | 2,177 |
| 41 |
| Mar. 2025 | 2024 | |
| BALANCE SHEETS - ASSETS | ||
| (R$ million) | ||
| CURRENT | ||
| Cash and cash equivalents | 3,244 | 1,898 |
| Marketable securities | 1,456 | 358 |
| Customers, traders, concession holders and Transport of energy | 5,518 | 5,596 |
| Concession financial assets | 1,332 | 1,190 |
| Concession contract assets | 1,179 | 1,140 |
| Tax offsetable | 533 | 511 |
| Income tax and Social Contribution tax recoverable | 33 | 7 |
| Dividends receivable | 75 | 111 |
| Public lighting contribution | 309 | 296 |
| Escrow deposits | 784 | 235 |
| Other credits | 951 | 834 |
| Assets classified as held for sale | 58 | 57 |
| TOTAL CURRENT | 15,472 | 12,233 |
| NON-CURRENT | ||
| Securities | 55 | 135 |
| Consumers and traders | 275 | 254 |
| Tax offsetable | 1,476 | 1,455 |
| Income tax and Social Contribution tax recoverable | 564 | 582 |
| Deferred income tax and Social Contribution tax | 2,367 | 2,334 |
| Escrow deposits in legal actions | 1,204 | 1,196 |
| Accounts receivable from the State of Minas Gerais | 38 | 40 |
| Financial assets of the concession | 7,184 | 6,881 |
| Contractual assets | 10,670 | 10,327 |
| Investments | 3,254 | 3,221 |
| Property, plant and equipment | 3,749 | 3,715 |
| Intangible assets | 17,087 | 16,806 |
| Leasing – rights of use | 374 | 387 |
| Other credits | 133 | 161 |
| TOTAL NON-CURRENT | 48,430 | 47,494 |
| TOTAL ASSETS | 63,902 | 59,727 |
| 42 |
| BALANCE SHEETS LIABILITIES AND SHAREHOLDERS' EQUITY | Mar. 2025 | 2024 |
| (R$ million) | ||
| CURRENT | ||
| Suppliers | 2,981 | 2,952 |
| Regulatory charges | 417 | 344 |
| Profit sharing | 154 | 111 |
| Taxes | 674 | 725 |
| Income tax and Social Contribution tax | 128 | 163 |
| Interest on Equity, and dividends, payable | 4,100 | 3,611 |
| Loans and financings | 2,636 | 2,877 |
| Payroll and related charges | 210 | 217 |
| Public Lighting Contribution | 481 | 475 |
| Post-retirement liabilities | 191 | 233 |
| Accounts payable related to energy generated by consumers | 1,435 | 1,251 |
| PIS/Pasep and Cofins taxes to be reimbursed to customers | 457 | 526 |
| Leasing operations | 80 | 79 |
| Other obligations | 659 | 582 |
| TOTAL CURRENT | 14,603 | 14,146 |
| NON-CURRENT | ||
| Regulatory charges | 114 | 172 |
| Loans and financings | 12,607 | 9,403 |
| Income tax and Social Contribution tax | 499 | 496 |
| Deferred Income tax and Social Contribution tax | 1,512 | 1,543 |
| Provisions | 1,920 | 1,853 |
| Post-retirement liabilities | 4,082 | 4,073 |
| PASEP / COFINS to be returned to consumers | 163 | 166 |
| Leasing operations | 337 | 350 |
| Others | 144 | 142 |
| TOTAL NON-CURRENT | 21,378 | 18,198 |
| TOTAL LIABILITIES | 35,981 | 32,344 |
| TOTAL EQUITY | ||
| Share capital | 14,309 | 14,309 |
| Capital reserves | 393 | 393 |
| Profit reserves | 13,576 | 13,576 |
| Equity valuation adjustments | -863 | -900 |
| Retained earnings | 500 | 0 |
| NON-CONTROLLING INTERESTS | 27,915 | 27,378 |
| Non-Controlling Interests | 6 | 5 |
| TOTAL EQUITY | 27,921 | 54,761 |
| TOTAL LIABILITIES AND EQUITY | 63,902 | 87,105 |
| 43 |
Disclaimer
Certain statements and estimates in this material may represent expectations about future events or results which are subject to risks and uncertainties that may be known or unknown. There is no guarantee that events or results will occur as referred to in these expectations.
These expectations are based on present assumptions and analyses from the point of view of our management, in accordance with their experience and other factors such as the macroeconomic environment, market conditions in the electricity sector, and expected future results, many of which are not under our control.
Important factors that could lead to significant differences between actual results and the projections about future events or results include: Cemig’s business strategy, Brazilian and international economic conditions, technology, our financial strategy, changes in the electricity sector, hydrological conditions, conditions in the financial and energy markets, uncertainty on our results from future operations, plans and objectives; and other factors. Due to these and other factors, our results may differ significantly from those indicated in or implied by such statements.
The information and opinions herein should not be understood as a recommendation to potential investors, and no investment decision should be based on the veracity, currentness or completeness of this information or these opinions. None of our staff nor any party related to any of them or their representatives shall have any responsibility for any losses that may arise as a result of use of the content of this material.
To evaluate the risks and uncertainties as they relate to Cemig, and to obtain additional information about factors that could give rise to different results from those estimated by Cemig, please consult the section on Risk Factors included in the Reference Form filed with the Brazilian Securities Commission (CVM), and in the 20-F Form filed with the US Securities and Exchange Commission (SEC).
Financial amounts are in R$ million (R$ mn) unless otherwise stated.
Financial data reflect the adoption of IFRS.