| Label |
Element |
Value |
| Risk/Return: |
rr_RiskReturnAbstract |
|
|
| Risk/Return [Heading] |
rr_RiskReturnHeading |
Hotchkis & Wiley Large Cap Value Fund |
|
| Objective [Heading] |
rr_ObjectiveHeading |
Investment Objectives. |
|
| Objective, Primary [Text Block] |
rr_ObjectivePrimaryTextBlock |
The Fund seeks current income and long-term growth of income, as well as capital appreciation. |
|
| Expense [Heading] |
rr_ExpenseHeading |
Fees and Expenses of the Fund. |
|
| Expense Narrative [Text Block] |
rr_ExpenseNarrativeTextBlock |
This table describes the fees and expenses that you may pay if you buy and hold shares of the Fund. You may qualify for sales charge discounts for Class A shares if you and your family invest, or agree to invest in the future, at least $25,000 in certain Hotchkis & Wiley Funds. More information about these and other discounts is available from your financial professional and in the sections titled “About Class I, Class A, Class C and Class R Shares” beginning on page 35 of this Prospectus and “Purchase of Shares” beginning on page 39 of the Funds’ Statement of Additional Information. |
|
| Shareholder Fees Caption [Text] |
rr_ShareholderFeesCaption |
SHAREHOLDER FEES (fees paid directly from your investment) |
|
| Operating Expenses Caption [Text] |
rr_OperatingExpensesCaption |
ANNUAL FUND OPERATING EXPENSES (expenses that you pay each year as a percentage of the value of your investment) |
|
| Portfolio Turnover [Heading] |
rr_PortfolioTurnoverHeading |
Portfolio Turnover. |
|
| Portfolio Turnover [Text Block] |
rr_PortfolioTurnoverTextBlock |
The Fund pays transaction costs, such as commissions, when it buys and sells securities (or “turns over” its portfolio). A higher portfolio turnover rate may indicate higher transaction costs and may result in higher taxes when Fund shares are held in a taxable account. These costs, which are not reflected in annual fund operating expenses or in the example, affect the Fund’s performance. During the most recent fiscal year, the Fund’s portfolio turnover rate was 41% of the average value of its portfolio. |
|
| Portfolio Turnover, Rate |
rr_PortfolioTurnoverRate |
41.00% |
|
| Expense Example [Heading] |
rr_ExpenseExampleHeading |
Example. |
|
| Expense Example Narrative [Text Block] |
rr_ExpenseExampleNarrativeTextBlock |
This example is intended to help you compare the cost of investing in the Fund with the cost of investing in other mutual funds. The example assumes that you invest $10,000 in the Fund for the time periods indicated and then redeem all of your shares at the end of those periods. The example also assumes that your investment has a 5% return each year and that the Fund’s operating expenses remain the same. |
|
| Expense Example by, Year, Caption [Text] |
rr_ExpenseExampleByYearCaption |
Although your actual costs may be higher or lower, based on these assumptions, your costs would be: |
|
| Expense Example, No Redemption, By Year, Caption [Text] |
rr_ExpenseExampleNoRedemptionByYearCaption |
You would pay the following expenses if you did not redeem your shares: |
|
| Strategy [Heading] |
rr_StrategyHeading |
Principal Investment Strategy. |
|
| Strategy Narrative [Text Block] |
rr_StrategyNarrativeTextBlock |
The Fund normally invests at least 80% of its net assets plus borrowings for investment purposes in common stocks of large capitalization U.S. companies. Effective October 28, 2013, the Fund normally invests at least 80% of its net assets plus borrowings for investment purposes in equity securities of large capitalization companies. Hotchkis & Wiley Capital Management, LLC (the “Advisor”) does not believe that this policy change will result in any material change in the way it manages the Fund’s portfolio. The Advisor currently considers large cap companies to be those with market capitalizations like those found in the Russell 1000® Index. The market capitalization range of the Index changes constantly, but as of June 30, 2013, the range was from $0.5 billion to $422.5 billion, although the Advisor will generally not purchase stock in a company with a market capitalization of less than $3 billion. Market capitalization is measured at the time of initial purchase. The Fund also invests in stocks with high cash dividends or payout yields relative to the market. The Fund may invest in foreign (non-U.S.) securities.
The Fund seeks to invest in stocks whose future prospects are misunderstood or not fully recognized by the market. The Fund employs a fundamental value investing approach which seeks to exploit market inefficiencies created by irrational investor behavior. To identify these investment opportunities, the Fund employs a disciplined, bottom-up investment process highlighted by rigorous, internally-generated fundamental research. With the exception of diversification guidelines, the Fund does not employ predetermined rules for sales; rather, the Fund evaluates each sell candidate based on the candidate’s specific risk and return characteristics which include: 1) relative valuation; 2) fundamental operating trends; 3) deterioration of fundamentals; and 4) diversification guidelines. |
|
| Risk [Heading] |
rr_RiskHeading |
Principal Investment Risks. |
|
| Risk Narrative [Text Block] |
rr_RiskNarrativeTextBlock |
As with any mutual fund, the value of the Fund’s investments, and therefore the value of its shares, may go down and you could lose all or a portion of your investment in the Fund. Many factors can affect those values. The factors that are most likely to have a material effect on the Fund’s portfolio as a whole are called “principal risks.” The principal risks of investing in the Fund are described in this section.
Market Risk. Market risk is the risk that the market price of securities owned by the Fund may go down, sometimes rapidly or unpredictably. Securities may decline in value due to factors affecting securities markets generally or particular industries represented in the securities markets.
Equity Securities Risk. Equity securities, both common and preferred stocks, have greater price volatility than fixed income securities. The market price of equity securities owned by the Fund may go down, sometimes rapidly or unpredictably. Equity securities may decline in value due to factors affecting equity securities markets generally or particular industries represented by those markets.
Capitalization Risk. Large cap companies as a group could fall out of favor with the market, causing the Fund to underperform investments that focus on small or mid cap companies.
The Fund may also invest in the securities of mid cap companies. Investment in mid cap companies may involve more risk than investing in larger, more established companies. Mid cap companies may have limited product lines or markets. They may be less financially secure than larger, more established companies. They may depend on a small number of key personnel. Should a product fail, or if management changes, or if there are other adverse developments, the Fund’s investment in a mid cap company may lose substantial value.
Management Risk. The Fund is subject to management risk because it is an actively managed investment portfolio. The Advisor invests in securities that may not necessarily be included in the Fund’s benchmark. To the extent that the Advisor invests the Fund’s assets in securities that are not in the Fund’s applicable benchmark index, there is a greater risk that the Fund’s performance will deviate from that of the benchmark. The Advisor does not seek to replicate the performance of any index.
Style Risk. The Advisor follows an investing style that favors value investments. Historically, value investments have performed best during periods of economic recovery. Therefore, the value investing style may over time go in and out of favor. At times when the value investing style is out of favor, the Fund may underperform other funds that use different investing styles. Investors should be prepared to tolerate volatility in Fund returns.
Income Risk. The Fund is subject to income risk, which is the risk that the Fund’s income will decline during periods of falling interest rates. If the income is reduced, distributions by the Fund to shareholders may be less.
Security Selection Risk. The Advisor may misjudge the risk and/or return potential of a security. This misjudgment can result in a loss or a significant deviation relative to its benchmarks.
Issuer Risk. The value of a security may decline for a number of reasons which directly relate to the issuer, such as management performance, financial leverage and reduced demand for the issuer’s goods or services.
Foreign (Non-U.S.) Investment Risk. The Fund may invest in foreign (non-U.S.) securities and may experience more rapid and extreme changes in value than a fund that invests exclusively in securities of U.S. companies. The securities markets of many foreign countries are relatively small, with a limited number of companies representing a small number of industries. Additionally, issuers of foreign securities are usually not subject to the same degree of regulation as U.S. issuers. To the extent that the Fund invests a significant portion of its assets in a specific geographic region, the Fund will generally have more exposure to regional economic risks associated with foreign investments.
ADR and GDR Risk. American Depository Receipts (“ADRs”) and Global Depository Receipts (“GDRs”) may be subject to some of the same risks as direct investment in foreign companies, which includes international trade, currency, political, regulatory and diplomatic risks. In a sponsored ADR arrangement, the foreign issuer assumes the obligation to pay some or all of the depositary's transaction fees. Under an unsponsored ADR arrangement, the foreign issuer assumes no obligations and the depositary's transaction fees are paid directly by the ADR holders. Because unsponsored ADR arrangements are organized independently and without the cooperation of the issuer of the underlying securities, available information concerning the foreign issuer may not be as current as for sponsored ADRs and voting rights with respect to the deposited securities are not passed through. GDRs can involve currency risk since, unlike ADRs, they may not be U.S. dollar-denominated. |
|
| Risk Lose Money [Text] |
rr_RiskLoseMoney |
As with any mutual fund, the value of the Fund's investments, and therefore the value of its shares, may go down and you could lose all or a portion of your investment in the Fund. |
|
| Bar Chart and Performance Table [Heading] |
rr_BarChartAndPerformanceTableHeading |
Performance |
|
| Performance Narrative [Text Block] |
rr_PerformanceNarrativeTextBlock |
The following performance information provides some indication of the risks of investing in the Fund by illustrating the variability of the Fund’s returns. The bar chart shows changes in the Fund’s performance from year to year for Class I shares (the class with the longest period of annual returns). However, the Fund’s Class A and Class C shares are subject to sales loads. Sales loads are not reflected in the bar chart and if these amounts were reflected, returns would be less than those shown. The table, which includes all applicable fees and sales charges, shows how the Fund’s average annual returns for 1, 5, and 10 years compare with those of a broad measure of market performance and indices that reflect the market sectors in which the Fund invests. The Fund’s past performance, before and after taxes, is not necessarily an indication of how the Fund will perform in the future. Updated performance is available on the Fund’s website at http://www.hwcm.com/literature or by calling the Fund toll-free at 1-866-HW-FUNDS (1-866-493-8637).
The inception dates for the Fund’s Class I, Class A, Class C and Class R shares are June 24, 1987, October 26, 2001, February 4, 2002, and August 28, 2003, respectively. Performance figures prior to the inception date of Class R shares are based on the historical performance of the original share class (Class I) of the Fund’s predecessor, the Mercury HW Large Cap Value Fund, adjusted to reflect the higher operating expenses of Class R shares. |
|
| Performance Information Illustrates Variability of Returns [Text] |
rr_PerformanceInformationIllustratesVariabilityOfReturns |
The following performance information provides some indication of the risks of investing in the Fund by illustrating the variability of the Fund's returns. |
|
| Performance Availability Phone [Text] |
rr_PerformanceAvailabilityPhone |
1-866-493-8637 |
|
| Performance Availability Website Address [Text] |
rr_PerformanceAvailabilityWebSiteAddress |
http://www.hwcm.com/literature |
|
| Performance Past Does Not Indicate Future [Text] |
rr_PerformancePastDoesNotIndicateFuture |
The Fund's past performance, before and after taxes, is not necessarily an indication of how the Fund will perform in the future. |
|
| Bar Chart [Heading] |
rr_BarChartHeading |
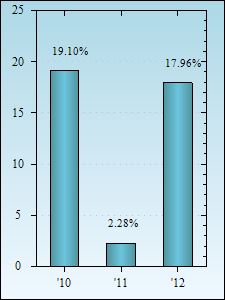
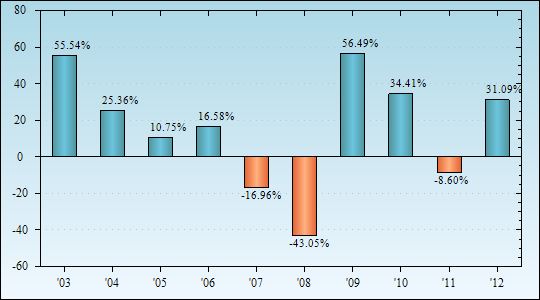
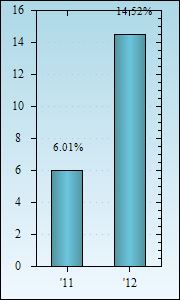
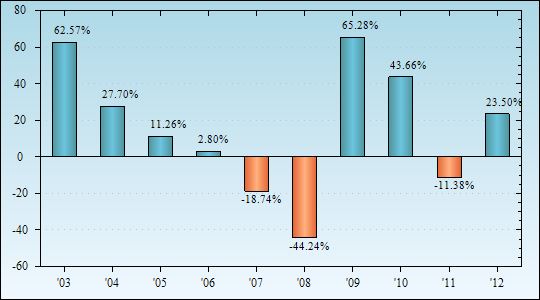
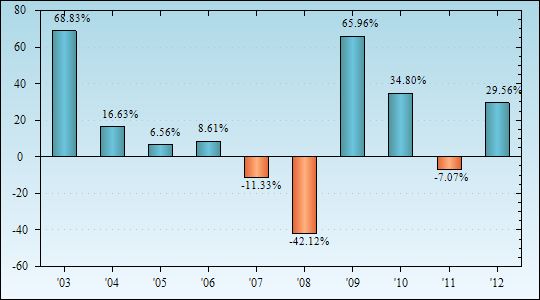
Calendar Year Total Returns as of December 31 |
|
| Bar Chart Does Not Reflect Sales Loads [Text] |
rr_BarChartDoesNotReflectSalesLoads |
Sales loads are not reflected in the bar chart and if these amounts were reflected, returns would be less than those shown. |
|
| Bar Chart Closing [Text Block] |
rr_BarChartClosingTextBlock |
During the period of time shown in the bar chart, the highest return for a calendar quarter was 25.16% (quarter ended June 30, 2009) and the lowest return for a calendar quarter was -24.62% (quarter ended December 31, 2008). The year-to-date return as of June 30, 2013 was 20.42%. |
|
| Year to Date Return, Label |
rr_YearToDateReturnLabel |
year-to-date return |
|
| Bar Chart, Year to Date Return, Date |
rr_BarChartYearToDateReturnDate |
Jun. 30,
2013 |
|
| Bar Chart, Year to Date Return |
rr_BarChartYearToDateReturn |
20.42% |
|
| Highest Quarterly Return, Label |
rr_HighestQuarterlyReturnLabel |
highest return |
|
| Highest Quarterly Return, Date |
rr_BarChartHighestQuarterlyReturnDate |
Jun. 30,
2009 |
|
| Highest Quarterly Return |
rr_BarChartHighestQuarterlyReturn |
25.16% |
|
| Lowest Quarterly Return, Label |
rr_LowestQuarterlyReturnLabel |
lowest return |
|
| Lowest Quarterly Return, Date |
rr_BarChartLowestQuarterlyReturnDate |
Dec. 31,
2008 |
|
| Lowest Quarterly Return |
rr_BarChartLowestQuarterlyReturn |
(24.62%) |
|
| Performance Table Does Reflect Sales Loads |
rr_PerformanceTableDoesReflectSalesLoads |
The table, which includes all applicable fees and sales charges, shows how the Fund's average annual returns for 1, 5, and 10 years compare with those of a broad measure of market performance and indices that reflect the market sectors in which the Fund invests. |
|
| Index No Deduction for Fees, Expenses, Taxes [Text] |
rr_IndexNoDeductionForFeesExpensesTaxes |
(reflects no deduction for fees, expenses or taxes) |
|
| Performance Table Uses Highest Federal Rate |
rr_PerformanceTableUsesHighestFederalRate |
After-tax returns are calculated using the historical highest individual federal marginal income tax rates and do not reflect the impact of state and local taxes. |
|
| Performance Table Not Relevant to Tax Deferred |
rr_PerformanceTableNotRelevantToTaxDeferred |
Actual after-tax returns depend on an investor's tax situation and may differ from those shown, and after-tax returns shown are not relevant to investors who hold their Fund shares through tax-deferred arrangements, such as 401(k) plans or individual retirement accounts ("IRAs"). |
|
| Performance Table One Class of after Tax Shown [Text] |
rr_PerformanceTableOneClassOfAfterTaxShown |
After-tax returns are shown for only Class I. After-tax returns for other classes will vary. |
|
| Performance Table Explanation after Tax Higher |
rr_PerformanceTableExplanationAfterTaxHigher |
Return After Taxes on Distributions and Sale of Fund Shares may be higher than other returns for the same period due to a tax benefit of realizing a capital loss upon the sale of Fund shares. |
|
| Performance Table Closing [Text Block] |
rr_PerformanceTableClosingTextBlock |
After-tax returns are calculated using the historical highest individual federal marginal income tax rates and do not reflect the impact of state and local taxes. Return After Taxes on Distributions and Sale of Fund Shares may be higher than other returns for the same period due to a tax benefit of realizing a capital loss upon the sale of Fund shares. Actual after-tax returns depend on an investor’s tax situation and may differ from those shown, and after-tax returns shown are not relevant to investors who hold their Fund shares through tax-deferred arrangements, such as 401(k) plans or individual retirement accounts (“IRAs”). After-tax returns are shown for only Class I. After-tax returns for other classes will vary. |
|
| Caption |
rr_AverageAnnualReturnCaption |
Average Annual Total Returns (for the periods ended December 31, 2012) |
|
|
S&P 500® Index (reflects no deduction for fees, expenses or taxes)
|
|
|
|
| Risk/Return: |
rr_RiskReturnAbstract |
|
|
| Label |
rr_AverageAnnualReturnLabel |
S&P 500® Index (reflects no deduction for fees, expenses or taxes) |
|
| Average Annual Returns, 1 Year |
rr_AverageAnnualReturnYear01 |
16.00% |
|
| Average Annual Returns, 5 Years |
rr_AverageAnnualReturnYear05 |
1.66% |
|
| Average Annual Returns, 10 Years |
rr_AverageAnnualReturnYear10 |
7.10% |
|
|
Russell 1000® Index (reflects no deduction for fees, expenses or taxes)
|
|
|
|
| Risk/Return: |
rr_RiskReturnAbstract |
|
|
| Label |
rr_AverageAnnualReturnLabel |
Russell 1000® Index (reflects no deduction for fees, expenses or taxes) |
|
| Average Annual Returns, 1 Year |
rr_AverageAnnualReturnYear01 |
16.42% |
|
| Average Annual Returns, 5 Years |
rr_AverageAnnualReturnYear05 |
1.92% |
|
| Average Annual Returns, 10 Years |
rr_AverageAnnualReturnYear10 |
7.52% |
|
|
Russell 1000® Value Index (reflects no deduction for fees, expenses or taxes)
|
|
|
|
| Risk/Return: |
rr_RiskReturnAbstract |
|
|
| Label |
rr_AverageAnnualReturnLabel |
Russell 1000® Value Index (reflects no deduction for fees, expenses or taxes) |
|
| Average Annual Returns, 1 Year |
rr_AverageAnnualReturnYear01 |
17.51% |
|
| Average Annual Returns, 5 Years |
rr_AverageAnnualReturnYear05 |
0.59% |
|
| Average Annual Returns, 10 Years |
rr_AverageAnnualReturnYear10 |
7.38% |
|
|
Class I
|
|
|
|
| Risk/Return: |
rr_RiskReturnAbstract |
|
|
| Maximum Sales Charge (Load) Imposed on Purchases (as a percentage of offering price) |
rr_MaximumSalesChargeImposedOnPurchasesOverOfferingPrice |
none
|
|
| Maximum Deferred Sales Charge (Load) (as a percentage of original purchase price) |
rr_MaximumDeferredSalesChargeOverOther |
none
|
|
| Management Fees |
rr_ManagementFeesOverAssets |
0.75% |
|
| Distribution and/or Service (12b-1) Fees |
rr_DistributionAndService12b1FeesOverAssets |
none
|
|
| Other Expenses |
rr_OtherExpensesOverAssets |
0.30% |
|
| Total Annual Fund Operating Expenses |
rr_ExpensesOverAssets |
1.05% |
|
| Expense Example, with Redemption, 1 Year |
rr_ExpenseExampleYear01 |
$ 107 |
|
| Expense Example, with Redemption, 3 Years |
rr_ExpenseExampleYear03 |
334 |
|
| Expense Example, with Redemption, 5 Years |
rr_ExpenseExampleYear05 |
579 |
|
| Expense Example, with Redemption, 10 Years |
rr_ExpenseExampleYear10 |
1,283 |
|
| Expense Example, No Redemption, 1 Year |
rr_ExpenseExampleNoRedemptionYear01 |
107 |
|
| Expense Example, No Redemption, 3 Years |
rr_ExpenseExampleNoRedemptionYear03 |
334 |
|
| Expense Example, No Redemption, 5 Years |
rr_ExpenseExampleNoRedemptionYear05 |
579 |
|
| Expense Example, No Redemption, 10 Years |
rr_ExpenseExampleNoRedemptionYear10 |
1,283 |
|
| Annual Return 2003 |
rr_AnnualReturn2003 |
42.77% |
|
| Annual Return 2004 |
rr_AnnualReturn2004 |
22.01% |
|
| Annual Return 2005 |
rr_AnnualReturn2005 |
6.41% |
|
| Annual Return 2006 |
rr_AnnualReturn2006 |
13.70% |
|
| Annual Return 2007 |
rr_AnnualReturn2007 |
(10.55%) |
|
| Annual Return 2008 |
rr_AnnualReturn2008 |
(46.84%) |
|
| Annual Return 2009 |
rr_AnnualReturn2009 |
34.32% |
|
| Annual Return 2010 |
rr_AnnualReturn2010 |
19.85% |
|
| Annual Return 2011 |
rr_AnnualReturn2011 |
(4.25%) |
|
| Annual Return 2012 |
rr_AnnualReturn2012 |
18.74% |
|
| Label |
rr_AverageAnnualReturnLabel |
Return Before Taxes - Class I |
|
| Average Annual Returns, 1 Year |
rr_AverageAnnualReturnYear01 |
18.74% |
|
| Average Annual Returns, 5 Years |
rr_AverageAnnualReturnYear05 |
(0.54%) |
|
| Average Annual Returns, 10 Years |
rr_AverageAnnualReturnYear10 |
6.26% |
|
|
Class I | After Taxes on Distributions
|
|
|
|
| Risk/Return: |
rr_RiskReturnAbstract |
|
|
| Label |
rr_AverageAnnualReturnLabel |
Return After Taxes on Distributions - Class I |
|
| Average Annual Returns, 1 Year |
rr_AverageAnnualReturnYear01 |
18.28% |
|
| Average Annual Returns, 5 Years |
rr_AverageAnnualReturnYear05 |
(0.87%) |
|
| Average Annual Returns, 10 Years |
rr_AverageAnnualReturnYear10 |
5.75% |
|
|
Class I | After Taxes on Distributions and Sale of Fund Shares
|
|
|
|
| Risk/Return: |
rr_RiskReturnAbstract |
|
|
| Label |
rr_AverageAnnualReturnLabel |
Return After Taxes on Distributions and Sale of Fund Shares - Class I |
|
| Average Annual Returns, 1 Year |
rr_AverageAnnualReturnYear01 |
12.76% |
|
| Average Annual Returns, 5 Years |
rr_AverageAnnualReturnYear05 |
(0.53%) |
|
| Average Annual Returns, 10 Years |
rr_AverageAnnualReturnYear10 |
5.47% |
|
|
Class A
|
|
|
|
| Risk/Return: |
rr_RiskReturnAbstract |
|
|
| Maximum Sales Charge (Load) Imposed on Purchases (as a percentage of offering price) |
rr_MaximumSalesChargeImposedOnPurchasesOverOfferingPrice |
5.25% |
|
| Maximum Deferred Sales Charge (Load) (as a percentage of original purchase price) |
rr_MaximumDeferredSalesChargeOverOther |
none
|
[1] |
| Management Fees |
rr_ManagementFeesOverAssets |
0.75% |
|
| Distribution and/or Service (12b-1) Fees |
rr_DistributionAndService12b1FeesOverAssets |
0.25% |
|
| Other Expenses |
rr_OtherExpensesOverAssets |
0.30% |
|
| Total Annual Fund Operating Expenses |
rr_ExpensesOverAssets |
1.30% |
|
| Expenses Deferred Charges [Text Block] |
rr_ExpensesDeferredChargesTextBlock |
You may be charged a deferred sales charge of up to 0.75% if you invest $1 million or more in Class A shares and you redeem your shares within one year after purchase. |
|
| Expense Breakpoint Discounts [Text] |
rr_ExpenseBreakpointDiscounts |
You may qualify for sales charge discounts for Class A shares if you and your family invest, or agree to invest in the future, at least $25,000 in certain Hotchkis & Wiley Funds. |
|
| Expense Breakpoint, Minimum Investment Required [Amount] |
rr_ExpenseBreakpointMinimumInvestmentRequiredAmount |
25,000 |
|
| Expense Example, with Redemption, 1 Year |
rr_ExpenseExampleYear01 |
650 |
|
| Expense Example, with Redemption, 3 Years |
rr_ExpenseExampleYear03 |
915 |
|
| Expense Example, with Redemption, 5 Years |
rr_ExpenseExampleYear05 |
1,200 |
|
| Expense Example, with Redemption, 10 Years |
rr_ExpenseExampleYear10 |
2,010 |
|
| Expense Example, No Redemption, 1 Year |
rr_ExpenseExampleNoRedemptionYear01 |
650 |
|
| Expense Example, No Redemption, 3 Years |
rr_ExpenseExampleNoRedemptionYear03 |
915 |
|
| Expense Example, No Redemption, 5 Years |
rr_ExpenseExampleNoRedemptionYear05 |
1,200 |
|
| Expense Example, No Redemption, 10 Years |
rr_ExpenseExampleNoRedemptionYear10 |
2,010 |
|
| Label |
rr_AverageAnnualReturnLabel |
Return Before Taxes - Class A |
|
| Average Annual Returns, 1 Year |
rr_AverageAnnualReturnYear01 |
12.29% |
|
| Average Annual Returns, 5 Years |
rr_AverageAnnualReturnYear05 |
(1.87%) |
|
| Average Annual Returns, 10 Years |
rr_AverageAnnualReturnYear10 |
5.40% |
|
|
Class C
|
|
|
|
| Risk/Return: |
rr_RiskReturnAbstract |
|
|
| Maximum Sales Charge (Load) Imposed on Purchases (as a percentage of offering price) |
rr_MaximumSalesChargeImposedOnPurchasesOverOfferingPrice |
none
|
|
| Maximum Deferred Sales Charge (Load) (as a percentage of original purchase price) |
rr_MaximumDeferredSalesChargeOverOther |
1.00% |
|
| Management Fees |
rr_ManagementFeesOverAssets |
0.75% |
|
| Distribution and/or Service (12b-1) Fees |
rr_DistributionAndService12b1FeesOverAssets |
1.00% |
|
| Other Expenses |
rr_OtherExpensesOverAssets |
0.30% |
|
| Total Annual Fund Operating Expenses |
rr_ExpensesOverAssets |
2.05% |
|
| Expense Example, with Redemption, 1 Year |
rr_ExpenseExampleYear01 |
308 |
|
| Expense Example, with Redemption, 3 Years |
rr_ExpenseExampleYear03 |
643 |
|
| Expense Example, with Redemption, 5 Years |
rr_ExpenseExampleYear05 |
1,103 |
|
| Expense Example, with Redemption, 10 Years |
rr_ExpenseExampleYear10 |
2,187 |
|
| Expense Example, No Redemption, 1 Year |
rr_ExpenseExampleNoRedemptionYear01 |
208 |
|
| Expense Example, No Redemption, 3 Years |
rr_ExpenseExampleNoRedemptionYear03 |
643 |
|
| Expense Example, No Redemption, 5 Years |
rr_ExpenseExampleNoRedemptionYear05 |
1,103 |
|
| Expense Example, No Redemption, 10 Years |
rr_ExpenseExampleNoRedemptionYear10 |
2,187 |
|
| Label |
rr_AverageAnnualReturnLabel |
Return Before Taxes - Class C |
|
| Average Annual Returns, 1 Year |
rr_AverageAnnualReturnYear01 |
16.65% |
|
| Average Annual Returns, 5 Years |
rr_AverageAnnualReturnYear05 |
(1.47%) |
|
| Average Annual Returns, 10 Years |
rr_AverageAnnualReturnYear10 |
5.25% |
|
|
Class R
|
|
|
|
| Risk/Return: |
rr_RiskReturnAbstract |
|
|
| Maximum Sales Charge (Load) Imposed on Purchases (as a percentage of offering price) |
rr_MaximumSalesChargeImposedOnPurchasesOverOfferingPrice |
none
|
|
| Maximum Deferred Sales Charge (Load) (as a percentage of original purchase price) |
rr_MaximumDeferredSalesChargeOverOther |
none
|
|
| Management Fees |
rr_ManagementFeesOverAssets |
0.75% |
|
| Distribution and/or Service (12b-1) Fees |
rr_DistributionAndService12b1FeesOverAssets |
0.50% |
|
| Other Expenses |
rr_OtherExpensesOverAssets |
0.30% |
|
| Total Annual Fund Operating Expenses |
rr_ExpensesOverAssets |
1.55% |
|
| Expense Example, with Redemption, 1 Year |
rr_ExpenseExampleYear01 |
158 |
|
| Expense Example, with Redemption, 3 Years |
rr_ExpenseExampleYear03 |
490 |
|
| Expense Example, with Redemption, 5 Years |
rr_ExpenseExampleYear05 |
845 |
|
| Expense Example, with Redemption, 10 Years |
rr_ExpenseExampleYear10 |
1,845 |
|
| Expense Example, No Redemption, 1 Year |
rr_ExpenseExampleNoRedemptionYear01 |
158 |
|
| Expense Example, No Redemption, 3 Years |
rr_ExpenseExampleNoRedemptionYear03 |
490 |
|
| Expense Example, No Redemption, 5 Years |
rr_ExpenseExampleNoRedemptionYear05 |
845 |
|
| Expense Example, No Redemption, 10 Years |
rr_ExpenseExampleNoRedemptionYear10 |
$ 1,845 |
|
| Label |
rr_AverageAnnualReturnLabel |
Return Before Taxes - Class R |
|
| Average Annual Returns, 1 Year |
rr_AverageAnnualReturnYear01 |
18.21% |
|
| Average Annual Returns, 5 Years |
rr_AverageAnnualReturnYear05 |
(1.06%) |
|
| Average Annual Returns, 10 Years |
rr_AverageAnnualReturnYear10 |
5.77% |
|
|
|
|